UNITED STATES
SECURITIES AND EXCHANGE COMMISSION
Washington, DC 20549
FORM N-CSRS
CERTIFIED SHAREHOLDER REPORT OF REGISTERED MANAGEMENT INVESTMENT
COMPANIES
Investment Company Act file number 811-05583
Franklin Templeton Variable Insurance Products Trust
(Exact name of registrant as specified in charter)
One Franklin Parkway, San Mateo, CA 94403-1906
(Address of principal executive offices) (Zip code)
Craig S. Tyle, One Franklin Parkway, San Mateo, CA 94403-1906
(Name and address of agent for service)
Registrant’s telephone number, including area code: (650) 312-2000
Date of fiscal year end: 12/31
Date of reporting period: 06/30/18
| Item 1. | Reports to Stockholders. |
Franklin Templeton Variable Insurance
Products Trust Semiannual Report
| Important Notes to Performance Information | i | |
| *Supplement to the Prospectus for all Funds | PS-1 | |
| Fund Summaries | ||
| FFC-1 | ||
| FFA-1 | ||
| FGR-1 | ||
| FGI-1 | ||
| FI-1 | ||
| FLG-1 | ||
| MGD-1 | ||
| MS-1 | ||
| FRD-1 | ||
| FSV-1 | ||
| FSC-1 | ||
| FSI-1 | ||
| FUS-1 | ||
| FVA-1 | ||
| TD-1 | ||
| TF-1 | ||
| TGB-1 | ||
| TG-1 | ||
| Index Descriptions | I-1 | |
| Shareholder Information | SI-1 | |
*Not part of the semiannual report. Retain for your records.
Not FDIC Insured | May Lose Value | No Bank Guarantee |
MASTER CLASS – 2
FRANKLIN TEMPLETON VARIABLE INSURANCE PRODUCTS TRUST
Performance Information
Performance data is historical and cannot predict or guarantee future results. Principal value and investment return will fluctuate with market conditions, and you may have a gain or loss when you withdraw your money. Inception dates of the funds may have preceded the effective dates of the subaccounts, contracts or their availability in all states.
When reviewing the index comparisons, please keep in mind that indexes have a number of inherent performance differentials over the funds. First, unlike the funds, which must hold a minimum amount of cash to maintain liquidity, indexes do not
have a cash component. Second, the funds are actively managed and, thus, are subject to management fees to cover salaries of securities analysts or portfolio managers in addition to other expenses. Indexes are unmanaged and do not include any commissions or other expenses typically associated with investing in securities. Third, indexes often contain a different mix of securities than the fund to which they are compared. Additionally, please remember that indexes are simply a measure of performance and cannot be invested in directly.
| i | Semiannual Report | |||
VIP P1 07/18

SUPPLEMENT DATED JULY 10, 2018
TOTHE PROSPECTUS DATED MAY 1, 2018
OF
FRANKLIN FLEX CAP GROWTH VIP FUND
FRANKLIN FOUNDING FUNDS ALLOCATION VIP FUND
FRANKLIN GLOBAL REAL ESTATE VIP FUND
FRANKLIN GROWTHAND INCOME VIP FUND
FRANKLIN INCOME VIP FUND
FRANKLIN LARGE CAP GROWTH VIP FUND
FRANKLIN MUTUAL GLOBAL DISCOVERY VIP FUND
FRANKLIN MUTUAL SHARES VIP FUND
FRANKLIN RISING DIVIDENDS VIP FUND
FRANKLIN SMALL CAP VALUE VIP FUND
FRANKLIN SMALL-MID CAP GROWTH VIP FUND
FRANKLIN STRATEGIC INCOME VIP FUND
FRANKLIN U.S. GOVERNMENT SECURITIES VIP FUND
FRANKLIN VOLSMART ALLOCATION VIP FUND
TEMPLETON DEVELOPING MARKETS VIP FUND
TEMPLETON FOREIGN VIP FUND
TEMPLETON GLOBAL BOND VIP FUND
TEMPLETON GROWTH VIP FUND
(each a series of Franklin Templeton Variable Insurance Products Trust)
I. The following replaces the third paragraph in the prospectus under “Additional Information, All Funds – Fund Account Information – Fund Account Policies – Calculating Share Price:”
The Fund calculates the NAV per share each business day as of 1 p.m. Pacific time or the regularly scheduled close of the New York Stock Exchange (NYSE), whichever is earlier. The Fund does not calculate the NAV on days the NYSE is closed for trading, which include New Year’s Day, Martin Luther King Jr. Day, President’s Day, Good Friday, Memorial Day, Independence Day, Labor Day, Thanksgiving Day and Christmas Day. If the NYSE has a scheduled early close, the Fund’s share price would be determined as of the time of the close of the NYSE. If, due to weather or other special or unexpected circumstances, the NYSE has an unscheduled early close on a day that it has opened for business, the Fund reserves the right to consider that day as a regular business day and accept purchase and redemption orders and calculate its share price as of the normally scheduled close of regular trading on the NYSE.
Please keep this supplement with your prospectus for future reference.
| PS-1 | ||||||
This page intentionally left blank.
Franklin Flex Cap Growth VIP Fund
We are pleased to bring you Franklin Flex Cap Growth VIP Fund’s semiannual report for the period ended June 30, 2018.
Class 2 Performance Summary as of June 30, 2018
The Fund’s Class 2 Shares posted a +14.15% total return* for the six-month period ended June 30, 2018.
*The Fund has an expense reduction and a fee waiver associated with any investments it makes in a Franklin Templeton money fund and/or other Franklin Templeton fund, contractually guaranteed through 4/30/19. Fund investment results reflect the expense reduction and fee waiver; without these reductions, the results would have been lower.
Performance reflects the Fund’s Class 2 operating expenses, but does not include any contract fees, expenses or sales charges. If they had been included, performance would be lower. These charges and deductions, particularly for variable life policies, can have a significant effect on contract values and insurance benefits. See the contract prospectus for a complete description of these expenses, including sales charges.
Performance data represent past performance, which does not guarantee future results. Investment return and principal value will fluctuate, and you may have a gain or loss when you sell your shares. Current performance may differ from figures shown.
| Semiannual Report | FFC-1 | |||||
FRANKLIN FLEX CAP GROWTH VIP FUND
Fund Goal and Main Investments
The Fund seeks capital appreciation. Under normal market conditions, the Fund invests predominantly in equity securities of companies that the investment manager believes have the potential for capital appreciation.
Fund Risks
All investments involve risks, including possible loss of principal. Growth stock prices reflect projections of future earnings or revenues, and can, therefore, fall dramatically if the company fails to meet those projections. To the extent the Fund focuses on particular countries, regions, industries, sectors or types of investment from time to time, it may be subject to greater risk of adverse developments in such areas of focus than a fund that invests in a wider variety of countries, regions, industries, sectors or investments. Smaller, midsized and relatively new or unseasoned companies can be particularly sensitive to changing economic conditions, and their prospects for growth are less certain than those of larger, more established companies. Historically, these securities have experienced more price volatility than larger company stocks, especially over the short term. Foreign securities involve special risks, including currency fluctuations and economic and political uncertainties. The Fund is actively managed but there is no guarantee that the manager’s investment decisions will produce the desired results. The Fund’s prospectus also includes a description of the main investment risks.
Performance Overview
You can find the Fund’s six-month total return in the Performance Summary. In comparison, the Russell 3000® Growth Index generated a +7.44% total return, the Russell 1000® Growth Index produced a +7.25% total return, and the Standard & Poor’s® 500 Index (S&P 500®) posted a +2.65% total return for the same period.1
Economic and Market Overview
The US economy continued to grow during the six months under review. After moderating for three consecutive quarters, the economy grew faster in 2018’s second quarter, driven by consumer spending, exports, business investment and government spending. The manufacturing and services sectors expanded during the period. The unemployment rate declined
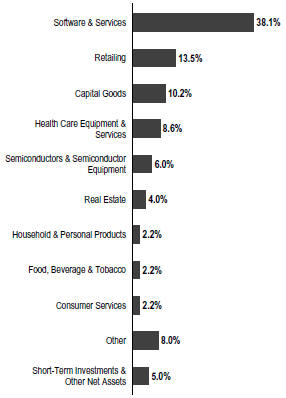
Portfolio Composition
Based on Total Net Assets as of 6/30/18
slightly from 4.1% in December 2017, as reported at the beginning of the six-month period, to 4.0% at period-end.2 Annual inflation, as measured by the Consumer Price Index, increased from 2.1% in December 2017, as reported at the beginning of the period, to 2.9% at period-end.2
In February 2018, the new US Federal Reserve (Fed) Chair Jerome Powell spoke before Congress for the first time and indicated the Fed saw signs of a continued strong labor market and economic growth. He reiterated the Fed’s intention to gradually raise interest rates in an effort to keep the economy from overheating and as inflation increases toward the Fed’s target. However, he noted there was no evidence of the economy overheating and he had yet to see a clear upward move in wages. The Fed raised its target range for the federal funds rate 0.25% each at its March and June 2018 meetings to 1.75%–2.00% and continued reducing its balance sheet as part
1. Source: Morningstar. One cannot invest directly in an index, and an index is not representative of the Fund’s portfolio. Please see Index Descriptions following the Fund Summaries.
2. Source: US Bureau of Labor Statistics.
The dollar value, number of shares or principal amount, and names of all portfolio holdings are listed in the Fund’s Statement of Investments (SOI).
| FFC-2 | Semiannual Report | |||
FRANKLIN FLEX CAP GROWTH VIP FUND
of its ongoing plan to normalize monetary policy. In June, the Fed upgraded its economic forecast for 2018 and its inflation forecasts for 2018 and 2019. Furthermore, the Fed forecasted an additional rate hike for 2018 and 2019 than previously anticipated.
US equity markets rose overall during the period, benefiting from mostly upbeat economic data and better US corporate earnings. At certain points during the period, markets were also supported by the expectations of gradual rate increases. After reaching new all-time highs in January 2018, US stocks declined in February amid concerns that strong economic growth and rising inflation would lead the Fed to increase its target rate faster than expected. In March, markets were pressured further by a broad sell-off in information technology stocks due to a potential for tighter regulation in the sector arising from concerns about consumer data privacy. Other factors that curbed investor sentiment included tensions between the US and North Korea, political uncertainties in the US, the Trump administration’s protectionist policies and escalating trade tensions between the US and China. An overall easing of tensions in the Korean peninsula and intermittent US-China trade negotiations partially offset some of these concerns. However, US trade disputes with its allies and China near period-end dampened investor sentiment. In this environment, the broad US stock market, as measured by the S&P 500, generated a +2.65% total return for the period.1
Investment Strategy
We use fundamental, bottom-up research to seek companies meeting our criteria of growth potential, quality and valuation. In seeking sustainable growth characteristics, we look for companies we believe can produce sustainable earnings and cash flow growth, evaluating the long-term market opportunity and competitive structure of an industry to target leaders and emerging leaders. We define quality companies as those with strong and improving competitive positions in attractive markets. We also believe important attributes of quality are experienced and talented management teams as well as financial strength reflected in the capital structure, gross and operating margins, free cash flow generation and returns on capital employed. Our valuation analysis includes a range of potential outcomes based on an assessment of multiple scenarios. In assessing value, we consider whether security prices fully reflect the balance of the sustainable growth opportunities relative to business and financial risks.
| Top 10 Holdings | ||
| 6/30/18 | ||
| Company Sector/Industry | % of Total Net Assets | |
| Amazon.com Inc. Retailing | 9.4% | |
| Microsoft Corp. Software & Services | 5.5% | |
| Mastercard Inc. Software & Services | 5.4% | |
| Alphabet Inc. Software & Services | 5.3% | |
| ServiceNow Inc. Software & Services | 4.1% | |
| Salesforce.com Inc. Software & Services | 4.0% | |
| Netflix Inc. Retailing | 3.1% | |
| Raytheon Co. Capital Goods | 3.1% | |
| Visa Inc. Software & Services | 2.8% | |
| Facebook Inc. Software & Services | 2.8% | |
Manager’s Discussion
During the six months ended June 30, 2018, most sectors represented in the Fund’s portfolio delivered positive returns and contributed to absolute performance. Relative to the Russell 3000® Growth Index, the consumer discretionary sector contributed to relative results due to stock selection.3 Stock selection and an overweighted position in information technology (IT) also benefited relative performance, as did stock selection and an underweighted position in industrials.4
Within consumer discretionary, Amazon.com and Netflix were the largest contributors to relative performance in the sector and the Fund as a whole. Online retail shopping and cloud services provider Amazon.com reported better-than-expected first-quarter 2018 revenue and operating profits. Highlights included accelerating growth at its market-leading cloud business Amazon Web Services (AWS), as well as retail strength driven by advertising and its Prime service. Improved utilization in its fulfillment and data centers drove margins higher for the period, while the mix shift toward higher margin businesses continued to drive higher profitability over time. With e-commerce in its early days, we do not underestimate the growth and sustainability of Amazon.com, which continues to
3. The consumer discretionary sector comprises automobiles and components, consumer durables and apparel, consumer services, media and retailing in the SOI.
4. The IT sector comprises semiconductors and semiconductor equipment and software and services in the SOI. The industrials sector comprises capital goods in the SOI.
| Semiannual Report | FFC-3 | |||||
FRANKLIN FLEX CAP GROWTH VIP FUND
add new categories and countries to its footprint. The company also continues to see accelerated growth in AWS, which we consider a leader in Infrastructure-as-a-Service cloud computing. Internet streaming service Netflix recently reported solid quarterly results, with international subscriber trends particularly positive. Subscriber additions came in ahead of estimates in the US and internationally, driven by a stronger-than-expected slate of content. Other contributors in consumer discretionary included ski resort operator Vail Resorts.
In IT, shares of cloud-based solutions provider ServiceNow rose amid better-than-expected earnings, revenue, operating margin, cash flow and billings, and higher revenue guidance. We believe ServiceNow is a high-quality Software-as-a-Service company proving itself as a key partner in enterprise initiatives to drive productivity through digital transformation, while also delivering excellent unit economics. Other IT contributors included payments technology company Mastercard and cloud-based customer relationship management company Salesforce.com.
Elsewhere, veterinary products and services provider IDEXX Laboratories benefited relative performance.
In contrast, an overweighted position in the real estate sector detracted from the Fund’s relative performance. Stock selection in the energy and financials sectors also hindered relative results.5 In real estate, data center operator Equinix detracted from performance, while oil and natural gas provider Concho Resources6 hindered results in the energy sector.
In financials, shares of options exchange operator CBOE Global Markets fell amid disappointing quarterly results and investor concerns about potential pressure on trading volumes due to greater scrutiny by regulators on volatility-related products, CBOE’s fastest growing and most profitable segment.7
In other sectors, cable company Charter Communications hindered relative results. Despite solid first-quarter revenues, the company’s shares fell, largely due to deteriorating subscriber trends following better results in the prior quarter, a lack of free cash flow generation, and a delay in material improvements amid ongoing competition and industry challenges. Food and beverage company Constellation Brands also detracted from relative performance. The shares declined
following worse-than-expected results, as earnings per share missed consensus estimates. Lastly, specialty chemical manufacturer Albermarle hurt relative results.7
Thank you for your participation in Franklin Flex Cap Growth VIP Fund. We look forward to serving your future investment needs.
The foregoing information reflects our analysis, opinions and portfolio holdings as of June 30, 2018, the end of the reporting period. The way we implement our main investment strategies and the resulting portfolio holdings may change depending on factors such as market and economic conditions. These opinions may not be relied upon as investment advice or an offer for a particular security. The information is not a complete analysis of every aspect of any market, state, industry, security or the Fund. Statements of fact are from sources considered reliable, but the investment manager makes no representation or warranty as to their completeness or accuracy. Although historical performance is no guarantee of future results, these insights may help you understand our investment management philosophy.
5. The financials sector comprises diversified financials in the SOI.
6. Not part of the index.
7. Not held by period-end.
| FFC-4 | Semiannual Report | |||
FRANKLIN FLEX CAP GROWTH VIP FUND
Class 2 Fund Expenses
As an investor in a variable insurance contract (Contract) that indirectly provides for investment in an underlying mutual fund, you can incur transaction and/or ongoing expenses at both the Fund level and the Contract Level: (1) transaction expenses can include sales charges (loads) on purchases, surrender fees, transfer fees and premium taxes; and (2) ongoing expenses can include management fees, distribution and service (12b-1) fees, contract fees, annual maintenance fees, mortality and expense risk fees and other fees and expenses. All mutual funds and Contracts have some types of ongoing expenses. The table below shows Fund-level ongoing expenses and can help you understand these costs and compare them with those of other mutual funds offered through the Contract. The table assumes a $1,000 investment held for the six months indicated. Please refer to the Fund prospectus for additional information on operating expenses.
Actual Fund Expenses
The table below provides information about the actual account values and actual expenses in the columns under the heading “Actual.” In these columns the Fund’s actual return, which includes the effect of ongoing Fund expenses but does not include the effect of ongoing Contract expenses, is used to calculate the “Ending Account Value.” You can estimate the Fund-level expenses you paid during the period by following these steps (of course, your account value and expenses will differ from those in this illustration): Divide your account value by $1,000 (if your account had an $8,600 value, then $8,600 ÷ $1,000 = 8.6). Then multiply the result by the number under the headings “Actual” and “Fund-Level Expenses Paid During Period” (if Fund-Level Expenses Paid During Period were $ 7.50, then 8.6 x $ 7.50 = $64.50). In this illustration, the estimated expenses paid this period at the Fund level are $64.50.
Hypothetical Example for Comparison with Other Mutual Funds
Under the heading “Hypothetical” in the table, information is provided about hypothetical account values and hypothetical expenses based on the Fund’s actual expense ratio and an assumed rate of return of 5% per year before expenses, which is not the Fund’s actual return. This information may not be used to estimate the actual ending account balance or expenses you paid for the period, but it can help you compare ongoing costs of investing in the Fund with those of other mutual funds offered through the Contract. To do so, compare this 5% hypothetical example with the 5% hypothetical examples that appear in the shareholder reports of other funds offered through the Contract.
Please note that expenses shown in the table are meant to highlight ongoing costs at the Fund level only and do not reflect any ongoing expenses at the Contract level, or transaction expenses at either the Fund or Contract levels. In addition, while the Fund does not have transaction expenses, if the transaction and ongoing expenses at the Contract level were included, the expenses shown below would be higher. You should consult your Contract prospectus or disclosure document for more information.
| Actual (actual return after expenses) | Hypothetical (5% annual return before expenses) | |||||||||||
Share Class | Beginning Account Value 1/1/18 | Ending Account Value 6/30/18 | Fund-Level Expenses Paid During Period 1/1/18–6/30/181,2 | Ending Account Value 6/30/18 | Fund-Level Paid During Period 1/1/18–6/30/181,2 | Net Annualized Expense Ratio2 | ||||||
|
|
|
| |||||||||
Class 2 | $1,000 | $1,141.50 | $5.10 | $1,020.03 | $4.81 | 0.96% | ||||||
1. Expenses are equal to the annualized expense ratio for the six-month period as indicated above—in the far right column—multiplied by the simple average account value over the period indicated, and then multiplied by 181/365 to reflect the one-half year period.
2. Reflects expenses after fee waivers and expense reimbursements. Does not include any ongoing expenses of the Contract for which the Fund is an investment option or acquired fund fees and expenses.
| Semiannual Report | FFC-5 | |||||
FRANKLIN TEMPLETON VARIABLE INSURANCE PRODUCTS TRUST
Financial Highlights
Franklin Flex Cap Growth VIP Fund
Six Months Ended June 30, 2018 (unaudited) | Year Ended December 31, | |||||||||||||||||||||||
| 2017 | 2016 | 2015 | 2014 | 2013 | ||||||||||||||||||||
| ||||||||||||||||||||||||
| Class 2 | ||||||||||||||||||||||||
| Per share operating performance (for a share outstanding throughout the period) | ||||||||||||||||||||||||
Net asset value, beginning of period | $7.46 | $5.89 | $7.09 | $16.61 | $18.11 | $13.21 | ||||||||||||||||||
|
| |||||||||||||||||||||||
| Income from investment operationsa: | ||||||||||||||||||||||||
Net investment income (loss)b | (0.01 | ) | (0.01 | ) | (0.03 | ) | (0.06 | ) | (0.08 | ) | (0.01) | |||||||||||||
Net realized and unrealized gains (losses) | 1.10 | 1.60 | (0.20 | ) | 1.00 | 1.09 | 4.95 | |||||||||||||||||
|
| |||||||||||||||||||||||
Total from investment operations | 1.09 | 1.59 | (0.23 | ) | 0.94 | 1.01 | 4.94 | |||||||||||||||||
|
| |||||||||||||||||||||||
Less distributions from: | ||||||||||||||||||||||||
Net investment income | — | — | — | — | — | (—) | c | |||||||||||||||||
Net realized gains | (1.40 | ) | (0.02 | ) | (0.97 | ) | (10.46 | ) | (2.51 | ) | (0.04) | |||||||||||||
|
| |||||||||||||||||||||||
Total distributions | (1.40 | ) | (0.02 | ) | (0.97 | ) | (10.46 | ) | (2.51 | ) | (0.04) | |||||||||||||
|
| |||||||||||||||||||||||
Net asset value, end of period | $7.15 | $7.46 | $5.89 | $7.09 | $16.61 | $18.11 | ||||||||||||||||||
|
| |||||||||||||||||||||||
Total returnd | 14.15% | 26.94% | (2.89)% | 4.37% | 6.11% | 37.48% | ||||||||||||||||||
| Ratios to average net assetse | ||||||||||||||||||||||||
Expenses before waiver and payments by affiliates | 1.33% | 1.35% | 1.36% | 1.33% | 1.20% | 1.18% | ||||||||||||||||||
Expenses net of waiver and payments by affiliates | 0.96% | 0.96% | 0.96% | 0.96% | 0.95% | 0.93% | ||||||||||||||||||
Net investment income (loss) | (0.19)% | (0.20)% | (0.44)% | (0.62)% | (0.46)% | (0.09)% | ||||||||||||||||||
| Supplemental data | ||||||||||||||||||||||||
Net assets, end of period (000’s) | $92,373 | $81,084 | $73,337 | $82,901 | $93,354 | $169,123 | ||||||||||||||||||
Portfolio turnover rate | 9.73% | 52.12% | 17.76% | 88.15% | 52.83% | 52.15% | ||||||||||||||||||
aThe amount shown for a share outstanding throughout the period may not correlate with the Statement of Operations for the period due to the timing of sales and repurchases of the Fund’s shares in relation to income earned and/or fluctuating fair value of the investments of the Fund.
bBased on average daily shares outstanding.
cAmount rounds to less than $0.01 per share.
dTotal return does not include fees, charges or expenses imposed by the variable annuity and life insurance contracts for which Franklin Templeton Variable Insurance Products Trust serves as an underlying investment vehicle. Total return is not annualized for periods less than one year.
eRatios are annualized for periods less than one year.
| FFC-6 | Semiannual Report | The accompanying notes are an integral part of these financial statements. | |||
FRANKLIN TEMPLETON VARIABLE INSURANCE PRODUCTS TRUST
FINANCIAL HIGHLIGHTS
Franklin Flex Cap Growth VIP Fund (continued)
Six Months Ended June 30, 2018 (unaudited) | Year Ended December 31, | |||||||||||||||||||||||
| 2017 | 2016 | 2015 | 2014 | 2013 | ||||||||||||||||||||
| ||||||||||||||||||||||||
| Class 4 | ||||||||||||||||||||||||
| Per share operating performance (for a share outstanding throughout the period) | ||||||||||||||||||||||||
Net asset value, beginning of period | $7.21 | $5.70 | $6.90 | $16.44 | $17.96 | $13.12 | ||||||||||||||||||
|
| |||||||||||||||||||||||
| Income from investment operationsa: | ||||||||||||||||||||||||
Net investment income (loss)b | (0.01 | ) | (0.02 | ) | (0.03 | ) | (0.07 | ) | (0.10 | ) | (0.03) | |||||||||||||
Net realized and unrealized gains (losses) | 1.07 | 1.55 | (0.20 | ) | 0.99 | 1.09 | 4.91 | |||||||||||||||||
|
| |||||||||||||||||||||||
Total from investment operations | 1.06 | 1.53 | (0.23 | ) | 0.92 | 0.99 | 4.88 | |||||||||||||||||
|
| |||||||||||||||||||||||
Less distributions from net realized gains | (1.40 | ) | (0.02 | ) | (0.97 | ) | (10.46 | ) | (2.51 | ) | (0.04) | |||||||||||||
|
| |||||||||||||||||||||||
Net asset value, end of period | $6.87 | $7.21 | $5.70 | $6.90 | $16.44 | $17.96 | ||||||||||||||||||
|
| |||||||||||||||||||||||
Total returnc | 14.24% | 26.78% | (2.98)% | 4.32% | 5.98% | 37.28% | ||||||||||||||||||
| Ratios to average net assetsd | ||||||||||||||||||||||||
Expenses before waiver and payments by affiliates | 1.43% | 1.45% | 1.46% | 1.43% | 1.30% | 1.28% | ||||||||||||||||||
Expenses net of waiver and payments by affiliates | 1.06% | 1.06% | 1.06% | 1.06% | 1.05% | 1.03% | ||||||||||||||||||
Net investment income (loss) | (0.29)% | (0.30)% | (0.54)% | (0.72)% | (0.56)% | (0.19)% | ||||||||||||||||||
| Supplemental data | ||||||||||||||||||||||||
Net assets, end of period (000’s) | $33,895 | $30,112 | $27,163 | $34,479 | $31,355 | $251,339 | ||||||||||||||||||
Portfolio turnover rate | 9.73% | 52.12% | 17.76% | 88.15% | 52.83% | 52.15% | ||||||||||||||||||
aThe amount shown for a share outstanding throughout the period may not correlate with the Statement of Operations for the period due to the timing of sales and repurchases of the Fund’s shares in relation to income earned and/or fluctuating fair value of the investments of the Fund.
bBased on average daily shares outstanding.
cTotal return does not include fees, charges or expenses imposed by the variable annuity and life insurance contracts for which Franklin Templeton Variable Insurance Products Trust serves as an underlying investment vehicle. Total return is not annualized for periods less than one year.
dRatios are annualized for periods less than one year.
| The accompanying notes are an integral part of these financial statements. | Semiannual Report | FFC-7 | |||||
FRANKLIN TEMPLETON VARIABLE INSURANCE PRODUCTS TRUST
Statement of Investments, June 30, 2018 (unaudited)
Franklin Flex Cap Growth VIP Fund
| Shares | Value | |||||||
Common Stocks 95.0% | ||||||||
Automobiles & Components 0.5% | ||||||||
a Tesla Inc. | 2,000 | $ | 685,900 | |||||
|
| |||||||
Capital Goods 10.2% | ||||||||
3M Co. | 10,000 | 1,967,200 | ||||||
The Boeing Co. | 10,000 | 3,355,100 | ||||||
Fortive Corp. | 35,000 | 2,698,850 | ||||||
Raytheon Co. | 20,000 | 3,863,600 | ||||||
Rockwell Automation Inc. | 6,000 | 997,380 | ||||||
|
| |||||||
| 12,882,130 | ||||||||
|
| |||||||
Consumer Durables & Apparel 1.3% | ||||||||
NIKE Inc., B | 20,000 | 1,593,600 | ||||||
|
| |||||||
Consumer Services 2.2% | ||||||||
Vail Resorts Inc. | 10,000 | 2,741,900 | ||||||
|
| |||||||
Diversified Financials 1.2% | ||||||||
Intercontinental Exchange Inc. | 20,000 | 1,471,000 | ||||||
|
| |||||||
Energy 1.1% | ||||||||
a Concho Resources Inc. | 10,000 | 1,383,500 | ||||||
|
| |||||||
Food & Staples Retailing 1.6% | ||||||||
Costco Wholesale Corp. | 10,000 | 2,089,800 | ||||||
|
| |||||||
Food, Beverage & Tobacco 2.2% | ||||||||
Constellation Brands Inc., A | 13,000 | 2,845,310 | ||||||
|
| |||||||
Health Care Equipment & Services 8.6% | ||||||||
Becton, Dickinson and Co. | 12,000 | 2,874,720 | ||||||
Danaher Corp. | 18,000 | 1,776,240 | ||||||
a IDEXX Laboratories Inc. | 9,990 | 2,177,220 | ||||||
a Intuitive Surgical Inc. | 3,000 | 1,435,440 | ||||||
a Neuronetics Inc. | 3,600 | 95,796 | ||||||
UnitedHealth Group Inc. | 10,000 | 2,453,400 | ||||||
|
| |||||||
| 10,812,816 | ||||||||
|
| |||||||
Household & Personal Products 2.2% | ||||||||
Estee Lauder Cos. Inc., A | 20,000 | 2,853,800 | ||||||
|
| |||||||
Media 1.2% | ||||||||
a Charter Communications Inc., A | 5,006 | 1,467,809 | ||||||
|
| |||||||
Pharmaceuticals, Biotechnology & Life Sciences 1.1% | ||||||||
a Mettler-Toledo International Inc. | 2,500 | 1,446,575 | ||||||
|
| |||||||
Real Estate 4.0% | ||||||||
American Tower Corp. | 20,000 | 2,883,400 | ||||||
Equinix Inc. | 5,000 | 2,149,450 | ||||||
|
| |||||||
| 5,032,850 | ||||||||
|
| |||||||
Retailing 13.5% | ||||||||
a Amazon.com Inc. | 7,000 | 11,898,600 | ||||||
a Booking Holdings Inc. | 600 | 1,216,254 | ||||||
a Netflix Inc. | 9,990 | 3,910,386 | ||||||
|
| |||||||
| 17,025,240 | ||||||||
|
| |||||||
| FFC-8 | Semiannual Report | |||
FRANKLIN TEMPLETON VARIABLE INSURANCE PRODUCTS TRUST
STATEMENT OF INVESTMENTS (UNAUDITED)
Franklin Flex Cap Growth VIP Fund (continued)
| Shares | Value | |||||||
Common Stocks (continued) | ||||||||
Semiconductors & Semiconductor Equipment 6.0% | ||||||||
Analog Devices Inc. | 30,000 | $ | 2,877,600 | |||||
NVIDIA Corp. | 10,000 | 2,369,000 | ||||||
Xilinx Inc. | 35,000 | 2,284,100 | ||||||
|
| |||||||
| 7,530,700 | ||||||||
|
| |||||||
Software & Services 38.1% | ||||||||
Activision Blizzard Inc. | 40,000 | 3,052,800 | ||||||
a Adobe Systems Inc. | 10,000 | 2,438,100 | ||||||
a Alibaba Group Holding Ltd., ADR (China) | 12,000 | 2,226,360 | ||||||
a Alphabet Inc., C | 6,000 | 6,693,900 | ||||||
a Avalara Inc. | 1,800 | 96,066 | ||||||
a DocuSign Inc. | 5,000 | 264,750 | ||||||
a Electronic Arts Inc. | 16,000 | 2,256,320 | ||||||
a Facebook Inc., A | 18,000 | 3,497,760 | ||||||
a I3 Verticals Inc., A | 6,000 | 91,320 | ||||||
Mastercard Inc., A | 34,960 | 6,870,339 | ||||||
Microsoft Corp. | 70,000 | 6,902,700 | ||||||
a Salesforce.com Inc. | 37,000 | 5,046,800 | ||||||
a ServiceNow Inc. | 30,000 | 5,174,100 | ||||||
Visa Inc., A | 26,470 | 3,505,952 | ||||||
|
| |||||||
| 48,117,267 | ||||||||
|
| |||||||
Total Common Stocks (Cost $66,872,039) | 119,980,197 | |||||||
|
| |||||||
Short Term Investments (Cost $6,557,053) 5.2% | ||||||||
Money Market Funds 5.2% | ||||||||
b,c Institutional Fiduciary Trust Money Market Portfolio, 1.51% | 6,557,053 | 6,557,053 | ||||||
|
| |||||||
Total Investments (Cost $73,429,092) 100.2% | 126,537,250 | |||||||
Other Assets, less Liabilities (0.2)% | (268,658 | ) | ||||||
|
| |||||||
Net Assets 100.0% | $ | 126,268,592 | ||||||
|
| |||||||
See Abbreviations on page FFC-18.
aNon-income producing.
bSee Note 3(e) regarding investments in affiliated management investment companies.
cThe rate shown is the annualized seven-day effective yield at period end.
| The accompanying notes are an integral part of these financial statements. | Semiannual Report | FFC-9 | |||||
FRANKLIN TEMPLETON VARIABLE INSURANCE PRODUCTS TRUST
Financial Statements
Statement of Assets and Liabilities
June 30, 2018 (unaudited)
| Franklin Flex Cap Growth VIP Fund | ||||
Assets: | ||||
Investments in securities: | ||||
Cost - Unaffiliated issuers | $ 66,872,039 | |||
Cost - Non-controlled affiliates (Note 3e) | 6,557,053 | |||
|
| |||
Value - Unaffiliated issuers | $119,980,197 | |||
Value - Non-controlled affiliates (Note 3e) | 6,557,053 | |||
Receivables: | ||||
Capital shares sold | 62,199 | |||
Dividends and interest | 30,348 | |||
Other assets | 77 | |||
|
| |||
Total assets | 126,629,874 | |||
|
| |||
Liabilities: | ||||
Payables: | ||||
Investment securities purchased | 61,200 | |||
Capital shares redeemed | 108,623 | |||
Management fees | 63,718 | |||
Distribution fees | 57,076 | |||
Reports to shareholders | 50,734 | |||
Professional fees | 18,407 | |||
Accrued expenses and other liabilities | 1,524 | |||
|
| |||
Total liabilities | 361,282 | |||
|
| |||
Net assets, at value | $126,268,592 | |||
|
| |||
Net assets consist of: | ||||
Paid-in capital | $ 70,708,495 | |||
Undistributed net investment income (loss) | (149,115 | ) | ||
Net unrealized appreciation (depreciation) | 53,108,158 | |||
Accumulated net realized gain (loss) | 2,601,054 | |||
|
| |||
Net assets, at value | $126,268,592 | |||
|
| |||
| Class 2: | ||||
Net assets, at value | $ 92,373,371 | |||
|
| |||
Shares outstanding | 12,914,311 | |||
|
| |||
Net asset value and maximum offering price per share | $7.15 | |||
|
| |||
| Class 4: | ||||
Net assets, at value | $ 33,895,221 | |||
|
| |||
Shares outstanding | 4,937,157 | |||
|
| |||
Net asset value and maximum offering price per share | $6.87 | |||
|
| |||
| FFC-10 | Semiannual Report | The accompanying notes are an integral part of these financial statements. | |||
FRANKLIN TEMPLETON VARIABLE INSURANCE PRODUCTS TRUST
FINANCIAL STATEMENTS
Statement of Operations
for the six months ended June 30, 2018 (unaudited)
| Franklin Flex Cap Growth VIP Fund | ||||
Investment income: | ||||
Dividends: | ||||
Unaffiliated issuers | $ 418,593 | |||
Non-controlled affiliates (Note 3e) | 34,152 | |||
Income from securities loaned (net of fees and rebates) | 3,268 | |||
|
| |||
Total investment income | 456,013 | |||
|
| |||
Expenses: | ||||
Management fees (Note 3a) | 580,005 | |||
Distribution fees: (Note 3c) | ||||
Class 2 | 108,258 | |||
Class 4 | 54,912 | |||
Custodian fees (Note 4) | 467 | |||
Reports to shareholders | 36,243 | |||
Professional fees | 17,732 | |||
Trustees’ fees and expenses | 272 | |||
Other | 3,350 | |||
|
| |||
Total expenses | 801,239 | |||
Expense reductions (Note 4) | (91 | ) | ||
Expenses waived/paid by affiliates (Note 3e and 3f) | (219,540 | ) | ||
|
| |||
Net expenses | 581,608 | |||
|
| |||
Net investment income (loss) | (125,595 | ) | ||
|
| |||
Realized and unrealized gains (losses): | ||||
Net realized gain (loss) from: | ||||
Investments: | ||||
Unaffiliated issuers. | 2,643,120 | |||
|
| |||
Net change in unrealized appreciation (depreciation) on: | ||||
Investments: | ||||
Unaffiliated issuers | 12,949,499 | |||
|
| |||
Net realized and unrealized gain (loss) | 15,592,619 | |||
|
| |||
Net increase (decrease) in net assets resulting from operations | $15,467,024 | |||
|
| |||
| The accompanying notes are an integral part of these financial statements. | Semiannual Report | FFC-11 | |||||
FRANKLIN TEMPLETON VARIABLE INSURANCE PRODUCTS TRUST
FINANCIAL STATEMENTS
Statements of Changes in Net Assets
| Franklin Flex Cap Growth VIP Fund | ||||||||
Six Months Ended June 30, 2018 (unaudited) | Year Ended December 31, 2017 | |||||||
Increase (decrease) in net assets: | ||||||||
Operations: | ||||||||
Net investment income (loss) | $ (125,595 | ) | $ (250,205 | ) | ||||
Net realized gain (loss) | 2,643,120 | 21,313,192 | ||||||
Net change in unrealized appreciation (depreciation) | 12,949,499 | 4,655,097 | ||||||
|
| |||||||
Net increase (decrease) in net assets resulting from operations | 15,467,024 | 25,718,084 | ||||||
|
| |||||||
Distributions to shareholders from: | ||||||||
Net realized gains: | ||||||||
Class 2 | (15,220,091 | ) | (181,740 | ) | ||||
Class 4 | (5,742,189 | ) | (67,426 | ) | ||||
|
| |||||||
Total distributions to shareholders | (20,962,280 | ) | (249,166 | ) | ||||
|
| |||||||
Capital share transactions: (Note 2) | ||||||||
Class 2 | 15,176,481 | (10,989,226 | ) | |||||
Class 4 | 5,391,811 | (3,783,730 | ) | |||||
|
| |||||||
Total capital share transactions | 20,568,292 | (14,772,956 | ) | |||||
|
| |||||||
Net increase (decrease) in net assets | 15,073,036 | 10,695,962 | ||||||
Net assets: | ||||||||
Beginning of period | 111,195,556 | 100,499,594 | ||||||
|
| |||||||
End of period | $126,268,592 | $111,195,556 | ||||||
|
| |||||||
Undistributed net investment income (loss) included in net assets: | ||||||||
End of period | $ (149,115 | ) | $ (23,520 | ) | ||||
|
| |||||||
| FFC-12 | Semiannual Report | The accompanying notes are an integral part of these financial statements. | |||
FRANKLIN TEMPLETON VARIABLE INSURANCE PRODUCTS TRUST
Notes to Financial Statements (unaudited)
Franklin Flex Cap Growth VIP Fund
1. Organization and Significant Accounting Policies
Franklin Templeton Variable Insurance Products Trust (Trust) is registered under the Investment Company Act of 1940 (1940 Act) as an open-end management investment company, consisting of eighteen separate funds and applies the specialized accounting and reporting guidance in U.S. Generally Accepted Accounting Principles (U.S. GAAP). Franklin Flex Cap Growth VIP Fund (Fund) is included in this report. Shares of the Fund are generally sold only to insurance company separate accounts to fund the benefits of variable life insurance policies or variable annuity contracts. The Fund offers two classes of shares: Class 2 and Class 4. Each class of shares may differ by its distribution fees, voting rights on matters affecting a single class and its exchange privilege.
The following summarizes the Fund’s significant accounting policies.
a. Financial Instrument Valuation
The Fund’s investments in financial instruments are carried at fair value daily. Fair value is the price that would be received to sell an asset or paid to transfer a liability in an orderly transaction between market participants on the measurement date. The Fund calculates the net asset value (NAV) per share each business day as of 4 p.m. Eastern time or the regularly scheduled close of the New York Stock Exchange (NYSE), whichever is earlier. Under compliance policies and procedures approved by the Trust’s Board of Trustees (the Board), the Fund’s administrator has responsibility for oversight of valuation, including leading the cross-functional Valuation Committee (VC). The VC provides administration and oversight of the Fund’s valuation policies and procedures, which are approved annually by the Board. Among other things, these procedures allow the Fund to utilize independent pricing services, quotations from securities and financial instrument dealers, and other market sources to determine fair value.
Equity securities listed on an exchange or on the NASDAQ National Market System are valued at the last quoted sale price or the official closing price of the day, respectively. Foreign equity securities are valued as of the close of trading on the foreign stock exchange on which the security is primarily traded, or as of 4 p.m. Eastern time. The value is then converted into its U.S. dollar equivalent at the foreign exchange rate in effect at 4 p.m. Eastern time on the day that the value of the security is determined. Over-the-counter (OTC) securities are
valued within the range of the most recent quoted bid and ask prices. Securities that trade in multiple markets or on multiple exchanges are valued according to the broadest and most representative market. Certain equity securities are valued based upon fundamental characteristics or relationships to similar securities.
Investments in open-end mutual funds are valued at the closing NAV.
The Fund has procedures to determine the fair value of financial instruments for which market prices are not reliable or readily available. Under these procedures, the VC convenes on a regular basis to review such financial instruments and considers a number of factors, including significant unobservable valuation inputs, when arriving at fair value. The VC primarily employs a market-based approach which may use related or comparable assets or liabilities, recent transactions, market multiples, book values, and other relevant information for the investment to determine the fair value of the investment. An income-based valuation approach may also be used in which the anticipated future cash flows of the investment are discounted to calculate fair value. Discounts may also be applied due to the nature or duration of any restrictions on the disposition of the investments. Due to the inherent uncertainty of valuations of such investments, the fair values may differ significantly from the values that would have been used had an active market existed. The VC employs various methods for calibrating these valuation approaches including a regular review of key inputs and assumptions, transactional back-testing or disposition analysis, and reviews of any related market activity.
Trading in securities on foreign securities stock exchanges and OTC markets may be completed before 4 p.m. Eastern time. In addition, trading in certain foreign markets may not take place on every Fund’s business day. Occasionally, events occur between the time at which trading in a foreign security is completed and 4 p.m. Eastern time that might call into question the reliability of the value of a portfolio security held by the Fund. As a result, differences may arise between the value of the Fund’s portfolio securities as determined at the foreign market close and the latest indications of value at 4 p.m. Eastern time. In order to minimize the potential for these differences, the VC monitors price movements following the close of trading in foreign stock markets through a series of country specific market proxies (such as baskets of American Depositary Receipts, futures contracts and exchange traded funds). These price movements are measured against
| Semiannual Report | FFC-13 | |||||
FRANKLIN TEMPLETON VARIABLE INSURANCE PRODUCTS TRUST
NOTES TO FINANCIAL STATEMENTS (UNAUDITED)
Franklin Flex Cap Growth VIP Fund (continued)
1. Organization and Significant Accounting
Policies (continued)
a. Financial Instrument Valuation (continued)
established trigger thresholds for each specific market proxy to assist in determining if an event has occurred that may call into question the reliability of the values of the foreign securities held by the Fund. If such an event occurs, the securities may be valued using fair value procedures, which may include the use of independent pricing services.
When the last day of the reporting period is a non-business day, certain foreign markets may be open on those days that the Fund’s NAV is not calculated, which could result in differences between the value of the Fund’s portfolio securities on the last business day and the last calendar day of the reporting period. Any significant security valuation changes due to an open foreign market are adjusted and reflected by the Fund for financial reporting purposes.
b. Securities Lending
The Fund participates in an agency based securities lending program to earn additional income. The Fund receives cash collateral against the loaned securities in an amount equal to at least 102% of the fair value of the loaned securities. Collateral is maintained over the life of the loan in an amount not less than 100% of the fair value of loaned securities, as determined at the close of Fund business each day; any additional collateral required due to changes in security values is delivered to the Fund on the next business day. The collateral is deposited into a joint cash account with other funds and is used to invest in a money market fund managed by Franklin Advisers, Inc., an affiliate of the Fund. The Fund may receive income from the investment of cash collateral, in addition to lending fees and rebates paid by the borrower. Income from securities loaned, net of fees paid to the securities lending agent and/or third-party vendor, is reported separately in the Statement of Operations. The Fund bears the market risk with respect to the collateral investment, securities loaned, and the risk that the agent may default on its obligations to the Fund. If the borrower defaults on its obligation to return the securities loaned, the Fund has the right to repurchase the securities in the open market using the collateral received. The securities lending agent has agreed to indemnify the Fund in the event of default by a third party borrower. At June 30, 2018, the Fund had no securities on loan.
c. Income and Deferred Taxes
It is the Fund’s policy to qualify as a regulated investment company under the Internal Revenue Code. The Fund intends to distribute to shareholders substantially all of its taxable income and net realized gains to relieve it from federal income and if applicable, excise taxes. As a result, no provision for U.S. federal income taxes is required.
The Fund may be subject to foreign taxation related to income received, capital gains on the sale of securities and certain foreign currency transactions in the foreign jurisdictions in which it invests. Foreign taxes, if any, are recorded based on the tax regulations and rates that exist in the foreign markets in which the Fund invests. When a capital gain tax is determined to apply, the Fund records an estimated deferred tax liability in an amount that would be payable if the securities were disposed of on the valuation date.
The Fund may recognize an income tax liability related to its uncertain tax positions under U.S. GAAP when the uncertain tax position has a less than 50% probability that it will be sustained upon examination by the tax authorities based on its technical merits. As of June 30, 2018, the Fund has determined that no tax liability is required in its financial statements related to uncertain tax positions for any open tax years (or expected to be taken in future tax years). Open tax years are those that remain subject to examination and are based on the statute of limitations in each jurisdiction in which the Fund invests.
d. Security Transactions, Investment Income, Expenses and Distributions
Security transactions are accounted for on trade date. Realized gains and losses on security transactions are determined on a specific identification basis. Estimated expenses are accrued daily. Dividend income is recorded on the ex-dividend date except for certain dividends from securities where the dividend rate is not available. In such cases, the dividend is recorded as soon as the information is received by the Fund. Distributions to shareholders are recorded on the ex-dividend date. Distributable earnings are determined according to income tax regulations (tax basis) and may differ from earnings recorded in accordance with U.S. GAAP. These differences may be permanent or temporary. Permanent differences are reclassified among capital accounts to reflect their tax character. These reclassifications have no impact on net assets or the results of operations. Temporary differences are not reclassified, as they may reverse in subsequent periods.
| FFC-14 | Semiannual Report | |||
FRANKLIN TEMPLETON VARIABLE INSURANCE PRODUCTS TRUST
NOTES TO FINANCIAL STATEMENTS (UNAUDITED)
Franklin Flex Cap Growth VIP Fund (continued)
Common expenses incurred by the Trust are allocated among the Funds based on the ratio of net assets of each Fund to the combined net assets of the Trust or based on the ratio of number of shareholders of each Fund to the combined number of shareholders of the Trust. Fund specific expenses are charged directly to the Fund that incurred the expense.
Realized and unrealized gains and losses and net investment income, excluding class specific expenses, are allocated daily to each class of shares based upon the relative proportion of net assets of each class. Differences in per share distributions by class are generally due to differences in class specific expenses.
e. Accounting Estimates
The preparation of financial statements in accordance with U.S. GAAP requires management to make estimates and assumptions that affect the reported amounts of assets and
liabilities at the date of the financial statements and the amounts of income and expenses during the reporting period. Actual results could differ from those estimates.
f. Guarantees and Indemnifications
Under the Trust’s organizational documents, its officers and trustees are indemnified by the Trust against certain liabilities arising out of the performance of their duties to the Trust. Additionally, in the normal course of business, the Trust, on behalf of the Fund, enters into contracts with service providers that contain general indemnification clauses. The Trust’s maximum exposure under these arrangements is unknown as this would involve future claims that may be made against the Trust that have not yet occurred. Currently, the Trust expects the risk of loss to be remote.
2. Shares of Beneficial Interest
At June 30, 2018, there were an unlimited number of shares authorized (without par value). Transactions in the Fund’s shares were as follows:
| Six Months Ended June 30, 2018 | Year Ended December 31, 2017 | |||||||||||||||||||
| Shares | Amount | Shares | Amount | |||||||||||||||||
| Class 2 Shares: | ||||||||||||||||||||
Shares sold | 1,088,396 | $ | 8,859,541 | 554,774 | $ | 3,650,922 | ||||||||||||||
Shares issued in reinvestment of distributions | 2,079,248 | 15,220,091 | 26,648 | 181,740 | ||||||||||||||||
Shares redeemed | (1,117,038 | ) | (8,903,151 | ) | (2,166,834 | ) | (14,821,888 | ) | ||||||||||||
|
| |||||||||||||||||||
Net increase (decrease) | 2,050,606 | $ | 15,176,481 | (1,585,412 | ) | $ | (10,989,226 | ) | ||||||||||||
|
| |||||||||||||||||||
| Class 4 Shares: | ||||||||||||||||||||
Shares sold | 707,767 | $ | 5,535,267 | 508,100 | $ | 3,340,274 | ||||||||||||||
Shares issued in reinvestment of distributions | 816,812 | 5,742,189 | 10,232 | 67,426 | ||||||||||||||||
Shares redeemed | (761,187 | ) | (5,885,645 | ) | (1,109,757 | ) | (7,191,430 | ) | ||||||||||||
|
| |||||||||||||||||||
Net increase (decrease) | 763,392 | $ | 5,391,811 | (591,425 | ) | $ | (3,783,730 | ) | ||||||||||||
|
| |||||||||||||||||||
3. Transactions with Affiliates
Franklin Resources, Inc. is the holding company for various subsidiaries that together are referred to as Franklin Templeton Investments. Certain officers and trustees of the Fund are also officers and/or directors of the following subsidiaries:
| Subsidiary | Affiliation | |
Franklin Advisers, Inc. (Advisers) | Investment manager | |
Franklin Templeton Services, LLC (FT Services) | Administrative manager | |
Franklin Templeton Distributors, Inc. (Distributors) | Principal underwriter | |
Franklin Templeton Investor Services, LLC (Investor Services) | Transfer agent |
| Semiannual Report | FFC-15 | |||||
FRANKLIN TEMPLETON VARIABLE INSURANCE PRODUCTS TRUST
NOTES TO FINANCIAL STATEMENTS (UNAUDITED)
Franklin Flex Cap Growth VIP Fund (continued)
3. Transactions with Affiliates (continued)
a. Management Fees
The Fund pays an investment management fee to Advisers based on the average daily net assets of the Fund as follows:
| Annualized Fee Rate | Net Assets | |
1.000% | Up to and including $100 million | |
0.900% | Over $100 million, up to and including $250 million | |
0.850% | Over $250 million, up to and including $10 billion | |
0.800% | Over $10 billion, up to and including $12.5 billion | |
0.775% | Over $12.5 billion, up to and including $15 billion | |
0.750% | In excess of $15 billion |
For the period ended June 30, 2018, the annualized gross effective investment management fee rate was 0.983% of the Fund’s average daily net assets.
b. Administrative Fees
Under an agreement with Advisers, FT Services provides administrative services to the Fund. The fee is paid by Advisers based on the Fund’s average daily net assets, and is not an additional expense of the Fund.
c. Distribution Fees
The Board has adopted distribution plans for Class 2 and Class 4 shares pursuant to Rule 12b-1 under the 1940 Act. Under the Fund’s compensation distribution plans, the Fund pays Distributors for costs incurred in connection with the servicing, sale and distribution of the Fund’s shares up to 0.35% per year of its average daily net assets of each class. The Board has agreed to limit the current rate to 0.25% per year for Class 2. The plan year, for purposes of monitoring compliance with the maximum annual plan rates, is February 1 through January 31.
d. Transfer Agent Fees
Investor Services, under terms of an agreement, performs shareholder servicing for the Fund and is not paid by the Fund for the services.
e. Investments in Affiliated Management Investment Companies
The Fund invests in one or more affiliated management investment companies for purposes other than exercising a controlling influence over the management or policies. Management fees paid by the Fund are waived on assets invested in the affiliated management investment companies, as noted in the Statement of Operations, in an amount not to exceed the management and administrative fees paid directly or indirectly by each affiliate. Prior to January 1, 2014, the waiver was accounted for as a reduction to management fees. During the period ended June 30, 2018, the Fund held investments in affiliated management investment companies as follows:
| Number of Shares Held at Beginning of Period | Gross Additions | Gross Reductions | Number of Shares Held at End of Period | Value at End of Period | Dividend Income | Realized Gain (Loss) | Net Change in Unrealized Appreciation (Depreciation) | |||||||||||||||||||||||||
| Non-Controlled Affiliates | ||||||||||||||||||||||||||||||||
Institutional Fiduciary Trust Money Market Portfolio, 1.51% | 5,166,088 | 17,870,561 | (16,479,596 | ) | 6,557,053 | $6,557,053 | $34,152 | $ — | $ — | |||||||||||||||||||||||
|
| |||||||||||||||||||||||||||||||
| FFC-16 | Semiannual Report | |||
FRANKLIN TEMPLETON VARIABLE INSURANCE PRODUCTS TRUST
NOTES TO FINANCIAL STATEMENTS (UNAUDITED)
Franklin Flex Cap Growth VIP Fund (continued)
f. Waiver and Expense Reimbursements
Advisers have contractually agreed in advance to waive or limit its fees and to assume as its own expense certain expenses otherwise payable by the Fund so that the expenses (excluding distribution fees and acquired fund fees and expenses) for each class of the Fund does not exceed 0.71% based on the average net assets of each class (other than certain non-routine expenses or costs, including those relating to litigation, indemnification, reorganizations, and liquidations) until April 30, 2019. Total expenses waived or paid are not subject to recapture subsequent to the Fund’s fiscal year end.
4. Expense Offset Arrangement
The Fund has entered into an arrangement with its custodian whereby credits realized as a result of uninvested cash balances are used to reduce a portion of the Fund’s custodian expenses. During the period ended June 30, 2018, the custodian fees were reduced as noted in the Statement of Operations.
5. Income Taxes
At June 30, 2018, the cost of investments and net unrealized appreciation (depreciation) for income tax purposes were as follows:
Cost of investments | $73,494,153 | |||
|
| |||
Unrealized appreciation | $53,232,773 | |||
Unrealized depreciation | (189,676) | |||
|
| |||
Net unrealized appreciation (depreciation) | $53,043,097 | |||
|
| |||
Differences between income and/or capital gains as determined on a book basis and a tax basis are primarily due to differing treatment of passive foreign investment company shares.
6. Investment Transactions
Purchases and sales of investments (excluding short term securities) for the period ended June 30, 2018, aggregated $11,010,015 and $12,788,995, respectively.
7. Credit Facility
The Fund, together with other U.S. registered and foreign investment funds (collectively, Borrowers), managed by Franklin Templeton Investments, are borrowers in a joint syndicated senior unsecured credit facility totaling $2 billion (Global Credit Facility) which matures on February 8, 2019. This Global Credit Facility provides a source of funds to the Borrowers for temporary and emergency purposes, including the ability to meet future unanticipated or unusually large redemption requests.
Under the terms of the Global Credit Facility, the Fund shall, in addition to interest charged on any borrowings made by the Fund and other costs incurred by the Fund, pay its share of fees and expenses incurred in connection with the implementation and maintenance of the Global Credit Facility, based upon its relative share of the aggregate net assets of all of the Borrowers, including an annual commitment fee of 0.15% based upon the unused portion of the Global Credit Facility. These fees are reflected in other expenses in the Statement of Operations. During the period ended June 30, 2018, the Fund did not use the Global Credit Facility.
| Semiannual Report | FFC-17 | |||||
FRANKLIN TEMPLETON VARIABLE INSURANCE PRODUCTS TRUST
NOTES TO FINANCIAL STATEMENTS (UNAUDITED)
Franklin Flex Cap Growth VIP Fund (continued)
8. Fair Value Measurements
The Fund follows a fair value hierarchy that distinguishes between market data obtained from independent sources (observable inputs) and the Fund’s own market assumptions (unobservable inputs). These inputs are used in determining the value of the Fund’s financial instruments and are summarized in the following fair value hierarchy:
| • | Level 1 – quoted prices in active markets for identical financial instruments |
| • | Level 2 – other significant observable inputs (including quoted prices for similar financial instruments, interest rates, prepayment speed, credit risk, etc.) |
| • | Level 3 – significant unobservable inputs (including the Fund’s own assumptions in determining the fair value of financial instruments) |
The input levels are not necessarily an indication of the risk or liquidity associated with financial instruments at that level.
For movements between the levels within the fair value hierarchy, the Fund has adopted a policy of recognizing the transfers as of the date of the underlying event which caused the movement.
At June 30, 2018, all of the Fund’s investments in financial instruments carried at fair value were valued using Level 1 inputs. For detailed categories, see the accompanying Statement of Investments.
9. Subsequent Events
The Fund has evaluated subsequent events through the issuance of the financial statements and determined that no events have occurred that require disclosure.
Abbreviations
Selected Portfolio |
| ADR American Depositary Receipt |
| FFC-18 | Semiannual Report | |||
Franklin Founding Funds Allocation VIP Fund
This semiannual report for Franklin Founding Funds Allocation VIP Fund covers the period ended June 30, 2018.
Class 2 Performance Summary as of June 30, 2018
The Fund’s Class 2 Shares had a -0.93% total return* for the six-month period ended June 30, 2018.
*The Fund has an expense reduction contractually guaranteed through 4/30/19. Fund investment results reflect the expense reduction; without this reduction, the results would have been lower.
Performance reflects the Fund’s Class 2 operating expenses, but does not include any contract fees, expenses or sales charges. If they had been included, performance would be lower. These charges and deductions, particularly for variable life policies, can have a significant effect on contract values and insurance benefits. See the contract prospectus for a complete description of these expenses, including sales charges.
Performance data represent past performance, which does not guarantee future results. Investment return and principal value will fluctuate, and you may have a gain or loss when you sell your shares. Current performance may differ from figures shown.
| Semiannual Report | FFA-1 | |||||
FRANKLIN FOUNDING FUNDS ALLOCATION VIP FUND
Fund Goal and Main Investments
The Fund seeks capital appreciation, with income as a secondary goal. Under normal market conditions, the Fund invests equal portions in Class 1 shares of Franklin Income VIP Fund, Franklin Mutual Shares VIP Fund and Templeton Growth VIP Fund.
Fund Risks
All investments involve risks, including possible loss of principal. Because the Fund invests in underlying funds, and the Fund’s performance is directly related to the performance of the underlying funds held by it, the ability of the Fund to achieve its investment goals is directly related to the ability of the underlying funds to meet their investment goals. Additionally, because these underlying funds may engage in a variety of investment strategies involving certain risks, the Fund may be subject to these same risks. Stock prices fluctuate, sometimes rapidly and dramatically, due to factors affecting individual companies, particular industries or sectors, or general market conditions. Bonds are affected by changes in interest rates and the creditworthiness of their issuers. Bond prices generally move in the opposite direction of interest rates. Thus, as prices of bonds adjust to a rise in interest rates, the Fund’s share price may decline. Higher yielding, lower rated corporate bonds entail a greater degree of credit risk compared to investment-grade securities. Foreign investing carries additional risks such as currency and market volatility and political or social instability, risks that are heightened in developing countries. Value securities may not increase in price as anticipated or may decline further in value. The Fund’s prospectus also includes a description of the main investment risks.
Performance Overview
You can find the Fund’s six-month total return in the Performance Summary. In comparison, the Standard & Poor’s® 500 Index (S&P 500®) generated a +2.65% total return and the MSCI World Index produced a +0.76% total return for the same period.1
Economic and Market Overview
The global economy expanded during the six-month period under review amid generally upbeat economic data across
Asset Allocation*
Based on Total Net Assets as of 6/30/18
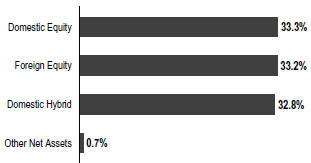
*The asset allocation is based on the Statement of Investments (SOI), which classifies each underlying fund into a broad asset class.
regions. In this environment, global developed and emerging market stocks reached a new all-time high in January 2018, as measured by the MSCI All Country World Index (ACWI). During the period, global markets were aided by price gains in oil and other commodities, encouraging corporate earnings reports and investor optimism about global economic growth. However, global stocks had a -0.13% total return for the six-month period, as measured by the MSCI ACWI, largely due to an overall decline in emerging market stocks.1
Global markets reflected investor concerns about tensions in the Korean peninsula and political uncertainties in the US and the European Union, as well as worries that strong economic growth and rising inflation in some parts of the world, particularly in the US, would lead central banks to increase interest rates sooner than expected. Markets were further pressured by the Trump administration’s protectionist trade policies, uncertainty surrounding the US-China trade relationship, and a broad sell-off in information technology stocks in March due to a potential for tighter regulation in the sector arising from concerns about consumer data privacy. An overall easing of tensions in the Korean peninsula and intermittent US-China trade negotiations partially offset some of these concerns. However, US trade disputes with its allies and China near period-end dampened investor sentiment.
The US economy continued to grow during the six months under review. After moderating for three consecutive quarters, the economy grew faster in 2018’s second quarter, driven by consumer spending, exports, business investment and government spending. The unemployment rate declined from
1. Source: Morningstar. One cannot invest directly in an index, and an index is not representative of the Fund’s portfolio. Please see Index Descriptions following the Fund Summaries.
The dollar value, number of shares or principal amount, and names of all portfolio holdings are listed in the Fund’s Statement of Investments (SOI).
| FFA-2 | Semiannual Report | |||
FRANKLIN FOUNDING FUNDS ALLOCATION VIP FUND
4.1% in December 2017, as reported at the beginning of the six-month period, to 4.0% at period-end.2 Annual inflation, as measured by the Consumer Price Index, increased from 2.1% in December 2017, as reported at the beginning of the period, to 2.9% at period-end.2 The US Federal Reserve raised its target range for the federal funds rate in March and June 2018 and continued reducing its balance sheet as part of its ongoing plan to normalize monetary policy.
In Europe, the UK’s quarterly economic growth moderated in 2018’s first quarter amid a decline in construction output. The Bank of England kept its key policy rate unchanged during the period. The eurozone’s quarterly growth moderated in 2018’s first quarter due to a decline in external demand. The bloc’s annual inflation rate ended the period higher than in December 2017. The European Central Bank (ECB) kept its benchmark interest rate unchanged during the period. However, at its June meeting, the ECB announced it would further reduce its monthly bond purchases beginning in October 2018 and indicated it would conclude the program at the end of 2018 while continuing to keep interest rates unchanged through at least the summer of 2019.
In Asia, Japan’s quarterly gross domestic product (GDP) growth in 2018’s first quarter declined, the country’s first contraction since 2015’s fourth quarter, mainly due to a decline in private residential investment and household consumption. The Bank of Japan left its benchmark interest rate unchanged during the period and continued its monetary stimulus measures.
In emerging markets, Brazil’s quarterly GDP accelerated in 2018’s first quarter compared to the previous quarter. The country’s central bank cut its benchmark interest rate twice during the period to spur economic growth. Russia’s annual GDP grew in 2018’s first quarter compared to the prior-year period, amid the Bank of Russia’s continued policy support. China’s annual GDP moderated in 2018’s first quarter compared to the prior-year period. The People’s Bank of China left its benchmark interest rate unchanged during the period. Overall, emerging market stocks, as measured by the MSCI Emerging Markets Index, declined during the period.3
Investment Strategy
The Fund normally invests its assets in an equally weighted combination of Class 1 shares of Franklin Income VIP Fund, Franklin Mutual Shares VIP Fund and Templeton Growth VIP
Fund. These underlying funds, in turn, invest in a variety of US and foreign equity securities and, to a lesser extent, fixed income and money market securities, each following a value-oriented approach. As market conditions affect the underlying funds, we rebalance the Fund’s allocations seeking to maintain equal weightings of approximately 33 1⁄3% of total net assets in each underlying fund whenever the actual allocations exceed plus or minus 3% of the fixed allocation percentages.
Manager’s Discussion
The Fund’s performance can be attributed largely to its allocation among the underlying funds and their investments in domestic and foreign equities, fixed income securities, and short-term investments and other net assets.
During the six months under review, Franklin Income VIP Fund – Class 1 and Franklin Mutual Shares VIP Fund – Class 1 underperformed the S&P 500. Templeton Growth VIP Fund – Class 1 underperformed the MSCI World Index.
Thank you for your participation in Franklin Founding Funds Allocation VIP Fund. We look forward to serving your future investment needs.
The foregoing information reflects our analysis, opinions and portfolio holdings as of June 30, 2018, the end of the reporting period. The way we implement our main investment strategies and the resulting portfolio holdings may change depending on factors such as market and economic conditions. These opinions may not be relied upon as investment advice or an offer for a particular security. The information is not a complete analysis of every aspect of any market, country, industry, security or the Fund. Statements of fact are from sources considered reliable, but the investment manager makes no representation or warranty as to their completeness or accuracy. Although historical performance is no guarantee of future results, these insights may help you understand our investment management philosophy.
2. Source: US Bureau of Labor Statistics.
3. Please see Index Descriptions following the Fund Summaries.
| Semiannual Report | FFA-3 | |||||
FRANKLIN FOUNDING FUNDS ALLOCATION VIP FUND
Class 2 Fund Expenses
As an investor in a variable insurance contract (Contract) that indirectly provides for investment in an underlying mutual fund, you can incur transaction and/or ongoing expenses at both the Fund level and the Contract Level: (1) transaction expenses can include sales charges (loads) on purchases, surrender fees, transfer fees and premium taxes; and (2) ongoing expenses can include management fees, distribution and service (12b-1) fees, contract fees, annual maintenance fees, mortality and expense risk fees and other fees and expenses. All mutual funds and Contracts have some types of ongoing expenses. The table below shows Fund-level ongoing expenses and can help you understand these costs and compare them with those of other mutual funds offered through the Contract. The table assumes a $1,000 investment held for the six months indicated. Please refer to the Fund prospectus for additional information on operating expenses.
Actual Fund Expenses
The table below provides information about the actual account values and actual expenses in the columns under the heading “Actual.” In these columns the Fund’s actual return, which includes the effect of ongoing Fund expenses but does not include the effect of ongoing Contract expenses, is used to calculate the “Ending Account Value.” You can estimate the Fund-level expenses you paid during the period by following these steps (of course, your account value and expenses will differ from those in this illustration): Divide your account value by $1,000 (if your account had an $8,600 value, then $8,600 ÷ $1,000 = 8.6). Then multiply the result by the number under the headings “Actual” and “Fund-Level Expenses Paid During Period” (if Fund-Level Expenses Paid During Period were $ 7.50, then 8.6 x $ 7.50 = $64.50). In this illustration, the estimated expenses paid this period at the Fund level are $64.50.
Hypothetical Example for Comparison with Other Mutual Funds
Under the heading “Hypothetical” in the table, information is provided about hypothetical account values and hypothetical expenses based on the Fund’s actual expense ratio and an assumed rate of return of 5% per year before expenses, which is not the Fund’s actual return. This information may not be used to estimate the actual ending account balance or expenses you paid for the period, but it can help you compare ongoing costs of investing in the Fund with those of other mutual funds offered through the Contract. To do so, compare this 5% hypothetical example with the 5% hypothetical examples that appear in the shareholder reports of other funds offered through the Contract.
Please note that expenses shown in the table are meant to highlight ongoing costs at the Fund level only and do not reflect any ongoing expenses at the Contract level, or transaction expenses at either the Fund or Contract levels. In addition, while the Fund does not have transaction expenses, if the transaction and ongoing expenses at the Contract level were included, the expenses shown below would be higher. You should consult your Contract prospectus or disclosure document for more information.
| Actual (actual return after expenses) | Hypothetical (5% annual return before expenses) | |||||||||||
Share Class | Beginning Account Value 1/1/18 | Ending Account Value 6/30/18 | Fund-Level Paid During Period | Ending Account Value 6/30/18 | Fund-Level Paid During Period | Net Annualized Expense Ratio2 | ||||||
|
|
|
| |||||||||
Class 2 | $1,000 | $990.70 | $1.73 | $1,023.06 | $1.76 | 0.35% | ||||||
1. Expenses are equal to the annualized expense ratio for the six-month period as indicated above—in the far right column—multiplied by the simple average account value over the period indicated, and then multiplied by 181/365 to reflect the one-half year period.
2. Reflects expenses after fee waivers and expense reimbursements. Does not include any ongoing expenses of the Contract for which the Fund is an investment option or acquired fund fees and expenses.
| FFA-4 | Semiannual Report | |||
FRANKLIN TEMPLETON VARIABLE INSURANCE PRODUCTS TRUST
Financial Highlights
Franklin Founding Funds Allocation VIP Fund
Six Months Ended June 30, 2018 (unaudited) | Year Ended December 31, | |||||||||||||||||||||||
| 2017 | 2016 | 2015 | 2014 | 2013 | ||||||||||||||||||||
| ||||||||||||||||||||||||
| Class 1 | ||||||||||||||||||||||||
| Per share operating performance (for a share outstanding throughout the period) | ||||||||||||||||||||||||
Net asset value, beginning of period | $ 7.44 | $ 7.13 | $ 6.80 | $ 7.47 | $ 7.47 | $ 8.55 | ||||||||||||||||||
|
| |||||||||||||||||||||||
| Income from investment operationsa: | ||||||||||||||||||||||||
Net investment incomeb,c | 0.17 | 0.21 | 0.21 | 0.26 | 0.22 | 0.30 | ||||||||||||||||||
Net realized and unrealized gains (losses) | (0.23 | ) | 0.63 | 0.64 | (0.68 | ) | 0.02 | 1.42 | ||||||||||||||||
|
| |||||||||||||||||||||||
Total from investment operations | (0.06 | ) | 0.84 | 0.85 | (0.42 | ) | 0.24 | 1.72 | ||||||||||||||||
|
| |||||||||||||||||||||||
Less distributions from: | ||||||||||||||||||||||||
Net investment income | (0.24 | ) | (0.22 | ) | (0.29 | ) | (0.24 | ) | (0.23 | ) | (1.15) | |||||||||||||
Net realized gains | (0.17 | ) | (0.31 | ) | (0.23 | ) | (0.01 | ) | (0.01 | ) | (1.65) | |||||||||||||
|
| |||||||||||||||||||||||
Total distributions | (0.41 | ) | (0.53 | ) | (0.52 | ) | (0.25 | ) | (0.24 | ) | (2.80) | |||||||||||||
|
| |||||||||||||||||||||||
Net asset value, end of period | $ 6.97 | $ 7.44 | $ 7.13 | $ 6.80 | $ 7.47 | $ 7.47 | ||||||||||||||||||
|
| |||||||||||||||||||||||
Total returnd | (0.80)% | 12.17% | 13.43% | (5.93)% | 3.05% | 24.14% | ||||||||||||||||||
| Ratios to average net assetse | ||||||||||||||||||||||||
Expenses before waiver and payments by affiliatesf | 0.12% | 0.12% | 0.11% | 0.11% | 0.11% | 0.11% | ||||||||||||||||||
Expenses net of waiver and payments by affiliatesf | 0.10% | 0.10% | 0.10% | 0.10% | 0.10% | 0.10% | ||||||||||||||||||
Net investment incomec | 4.49% | 2.75% | 3.09% | 3.51% | 2.88% | 3.67% | ||||||||||||||||||
| Supplemental data | ||||||||||||||||||||||||
Net assets, end of period (000’s) | $1,070 | $1,047 | $1,025 | $1,083 | $1,114 | $952 | ||||||||||||||||||
Portfolio turnover rate | 0.06% | 1.28% | 0.10% | 0.26% | 4.80% | 3.91% | ||||||||||||||||||
aThe amount shown for a share outstanding throughout the period may not correlate with the Statement of Operations for the period due to the timing of sales and repurchases of the Fund’s shares in relation to income earned and/or fluctuating fair value of the investments of the Fund.
bBased on average daily shares outstanding.
cRecognition of net investment income by the Fund is affected by the timing of declaration of dividends by the Underlying Funds in which the Fund invests.
dTotal return does not include fees, charges or expenses imposed by the variable annuity and life insurance contracts for which Franklin Templeton Variable Insurance Products Trust serves as an underlying investment vehicle. Total return is not annualized for periods less than one year.
eRatios are annualized for periods less than one year.
fDoes not include expenses of the Underlying Funds in which the Fund invests. The weighted average indirect expenses of the Underlying Funds was 0.66% for the period ended June 30, 2018.
| The accompanying notes are an integral part of these financial statements. | Semiannual Report | FFA-5 | |||||
FRANKLIN TEMPLETON VARIABLE INSURANCE PRODUCTS TRUST
FINANCIAL HIGHLIGHTS
Franklin Founding Funds Allocation VIP Fund (continued)
Six Months Ended (unaudited) | Year Ended December 31, | |||||||||||||||||||||||
| 2017 | 2016 | 2015 | 2014 | 2013 | ||||||||||||||||||||
| ||||||||||||||||||||||||
| Class 2 | ||||||||||||||||||||||||
| Per share operating performance (for a share outstanding throughout the period) | ||||||||||||||||||||||||
Net asset value, beginning of period | $ 7.39 | $ 7.08 | $ 6.75 | $ 7.42 | $ 7.42 | $ 8.51 | ||||||||||||||||||
|
| |||||||||||||||||||||||
| Income from investment operationsa: | ||||||||||||||||||||||||
Net investment incomeb,c | 0.16 | 0.18 | 0.19 | 0.24 | 0.20 | 0.27 | ||||||||||||||||||
Net realized and unrealized gains (losses) | (0.23 | ) | 0.64 | 0.64 | (0.68 | ) | 0.02 | 1.42 | ||||||||||||||||
|
| |||||||||||||||||||||||
Total from investment operations | (0.07 | ) | 0.82 | 0.83 | (0.44 | ) | 0.22 | 1.69 | ||||||||||||||||
|
| |||||||||||||||||||||||
Less distributions from: | ||||||||||||||||||||||||
Net investment income | (0.22 | ) | (0.20 | ) | (0.27 | ) | (0.22 | ) | (0.21 | ) | (1.13) | |||||||||||||
Net realized gains | (0.17 | ) | (0.31 | ) | (0.23 | ) | (0.01 | ) | (0.01 | ) | (1.65) | |||||||||||||
|
| |||||||||||||||||||||||
Total distributions | (0.39 | ) | (0.51 | ) | (0.50 | ) | (0.23 | ) | (0.22 | ) | (2.78) | |||||||||||||
|
| |||||||||||||||||||||||
Net asset value, end of period | $ 6.93 | $ 7.39 | $ 7.08 | $ 6.75 | $ 7.42 | $ 7.42 | ||||||||||||||||||
|
| |||||||||||||||||||||||
Total returnd | (0.93)% | 11.98% | 13.18% | (6.21)% | 2.85% | 23.77% | ||||||||||||||||||
| Ratios to average net assetse | ||||||||||||||||||||||||
Expenses before waiver and payments by affiliatesf | 0.37% | 0.37% | 0.36% | 0.36% | 0.36% | 0.36% | ||||||||||||||||||
Expenses net of waiver and payments by affiliatesf | 0.35% | 0.35% | 0.35% | 0.35% | 0.35% | 0.35% | ||||||||||||||||||
Net investment incomec | 4.24% | 2.50% | 2.84% | 3.26% | 2.63% | 3.42% | ||||||||||||||||||
| Supplemental data | ||||||||||||||||||||||||
Net assets, end of period (000’s) | $448,172 | $480,402 | $474,669 | $480,715 | $557,704 | $547,506 | ||||||||||||||||||
Portfolio turnover rate | 0.06% | 1.28% | 0.10% | 0.26% | 4.80% | 3.91% | ||||||||||||||||||
aThe amount shown for a share outstanding throughout the period may not correlate with the Statement of Operations for the period due to the timing of sales and repurchases of the Fund’s shares in relation to income earned and/or fluctuating fair value of the investments of the Fund.
bBased on average daily shares outstanding.
cRecognition of net investment income by the Fund is affected by the timing of declaration of dividends by the Underlying Funds in which the Fund invests.
dTotal return does not include fees, charges or expenses imposed by the variable annuity and life insurance contracts for which Franklin Templeton Variable Insurance Products Trust serves as an underlying investment vehicle. Total return is not annualized for periods less than one year.
eRatios are annualized for periods less than one year.
fDoes not include expenses of the Underlying Funds in which the Fund invests. The weighted average indirect expenses of the Underlying Funds was 0.66% for the period ended June 30, 2018.
| FFA-6 | Semiannual Report | The accompanying notes are an integral part of these financial statements. | |||
FRANKLIN TEMPLETON VARIABLE INSURANCE PRODUCTS TRUST
FINANCIAL HIGHLIGHTS
Franklin Founding Funds Allocation VIP Fund (continued)
Six Months Ended (unaudited) | Year Ended December 31, | |||||||||||||||||||||||
| 2017 | 2016 | 2015 | 2014 | 2013 | ||||||||||||||||||||
| ||||||||||||||||||||||||
| Class 4 | ||||||||||||||||||||||||
| Per share operating performance (for a share outstanding throughout the period) | ||||||||||||||||||||||||
Net asset value, beginning of period | $ 7.53 | $ 7.21 | $ 6.87 | $ 7.54 | $ 7.54 | $ 8.49 | ||||||||||||||||||
|
| |||||||||||||||||||||||
| Income from investment operationsa: | ||||||||||||||||||||||||
Net investment incomeb,c | 0.15 | 0.18 | 0.19 | 0.23 | 0.20 | 0.26 | ||||||||||||||||||
Net realized and unrealized gains (losses) | (0.22 | ) | 0.64 | 0.64 | (0.68 | ) | 0.02 | 1.43 | ||||||||||||||||
|
| |||||||||||||||||||||||
Total from investment operations | (0.07 | ) | 0.82 | 0.83 | (0.45 | ) | 0.22 | 1.69 | ||||||||||||||||
|
| |||||||||||||||||||||||
Less distributions from: | ||||||||||||||||||||||||
Net investment income | (0.21 | ) | (0.19 | ) | (0.26 | ) | (0.21 | ) | (0.21 | ) | (0.99) | |||||||||||||
Net realized gains | (0.17 | ) | (0.31 | ) | (0.23 | ) | (0.01 | ) | (0.01 | ) | (1.65) | |||||||||||||
|
| |||||||||||||||||||||||
Total distributions | (0.38 | ) | (0.50 | ) | (0.49 | ) | (0.22 | ) | (0.22 | ) | (2.64) | |||||||||||||
|
| |||||||||||||||||||||||
Net asset value, end of period | $ 7.08 | $ 7.53 | $ 7.21 | $ 6.87 | $ 7.54 | $ 7.54 | ||||||||||||||||||
|
| |||||||||||||||||||||||
Total returnd | (0.90)% | 11.78% | 12.92% | (6.24)% | 2.75% | 23.68% | ||||||||||||||||||
| Ratios to average net assetse | ||||||||||||||||||||||||
Expenses before waiver and payments by affiliatesf | 0.47% | 0.47% | 0.46% | 0.46% | 0.46% | 0.46% | ||||||||||||||||||
Expenses net of waiver and payments by affiliatesf | 0.45% | 0.45% | 0.45% | 0.45% | 0.45% | 0.45% | ||||||||||||||||||
Net investment incomec | 4.14% | 2.40% | 2.74% | 3.16% | 2.53% | 3.32% | ||||||||||||||||||
| Supplemental data | ||||||||||||||||||||||||
Net assets, end of period (000’s) | $475,787 | $528,862 | $530,403 | $550,825 | $702,324 | $676,781 | ||||||||||||||||||
Portfolio turnover rate | 0.06% | 1.28% | 0.10% | 0.26% | 4.80% | 3.91% | ||||||||||||||||||
aThe amount shown for a share outstanding throughout the period may not correlate with the Statement of Operations for the period due to the timing of sales and repurchases of the Fund’s shares in relation to income earned and/or fluctuating fair value of the investments of the Fund.
bBased on average daily shares outstanding.
cRecognition of net investment income by the Fund is affected by the timing of declaration of dividends by the Underlying Funds in which the Fund invests.
dTotal return does not include fees, charges or expenses imposed by the variable annuity and life insurance contracts for which Franklin Templeton Variable Insurance Products Trust serves as an underlying investment vehicle. Total return is not annualized for periods less than one year.
eRatios are annualized for periods less than one year.
fDoes not include expenses of the Underlying Funds in which the Fund invests. The weighted average indirect expenses of the Underlying Funds was 0.66% for the period ended June 30, 2018.
| The accompanying notes are an integral part of these financial statements. | Semiannual Report | FFA-7 | |||||
FRANKLIN TEMPLETON VARIABLE INSURANCE PRODUCTS TRUST
Statement of Investments, June 30, 2018 (unaudited)
Franklin Founding Funds Allocation VIP Fund
| Shares | Value | |||||||
Investments in Underlying Funds 99.3% | ||||||||
Domestic Equity 33.3% | ||||||||
a Franklin Mutual Shares VIP Fund, Class 1 | 14,964,311 | $ | 307,965,526 | |||||
|
| |||||||
Domestic Hybrid 32.8% | ||||||||
a Franklin Income VIP Fund, Class 1 | 18,901,940 | 303,376,138 | ||||||
|
| |||||||
Foreign Equity 33.2% | ||||||||
a Templeton Growth VIP Fund, Class 1 | 21,633,444 | 307,627,570 | ||||||
|
| |||||||
Total Investments in Underlying Funds (Cost $677,075,110) | 918,969,234 | |||||||
Other Assets, less Liabilities 0.7% | 6,060,468 | |||||||
|
| |||||||
Net Assets 100.0% | $ | 925,029,702 | ||||||
|
| |||||||
aSee Note 3(d) regarding investments in Underlying Funds.
FFA-8 | Semiannual Report | The accompanying notes are an integral part of these financial statements. |
FRANKLIN TEMPLETON VARIABLE INSURANCE PRODUCTS TRUST
Financial Statements
Statement of Assets and Liabilities
June 30, 2018 (unaudited)
| Franklin Founding Funds Allocation VIP Fund | ||||
Assets: | ||||
Investments in securities: | ||||
Cost - Non-controlled affiliates (Note 3d) | $677,075,110 | |||
|
| |||
Value - Non-controlled affiliates (Note 3d) | $918,969,234 | |||
Cash | 6,694,409 | |||
Receivables: | ||||
Capital shares sold | 347,821 | |||
Other assets | 664 | |||
|
| |||
Total assets | 926,012,128 | |||
|
| |||
Liabilities: | ||||
Payables: | ||||
Capital shares redeemed | 361,015 | |||
Administrative fees | 64,166 | |||
Distribution fees | 474,679 | |||
Reports to shareholders | 56,454 | |||
Accrued expenses and other liabilities | 26,112 | |||
|
| |||
Total liabilities | 982,426 | |||
|
| |||
Net assets, at value | $925,029,702 | |||
|
| |||
Net assets consist of: | ||||
Paid-in capital | $664,825,699 | |||
Undistributed net investment income | 20,175,599 | |||
Net unrealized appreciation (depreciation) | 241,894,124 | |||
Accumulated net realized gain (loss) | (1,865,720 | ) | ||
|
| |||
Net assets, at value | $925,029,702 | |||
|
| |||
| Class 1: | ||||
Net assets, at value | $ 1,070,060 | |||
|
| |||
Shares outstanding | 153,428 | |||
|
| |||
Net asset value and maximum offering price per share | $6.97 | |||
|
| |||
| Class 2: | ||||
Net assets, at value | $448,172,286 | |||
|
| |||
Shares outstanding | 64,677,013 | |||
|
| |||
Net asset value and maximum offering price per share | $6.93 | |||
|
| |||
| Class 4: | ||||
Net assets, at value | $475,787,356 | |||
|
| |||
Shares outstanding | 67,200,580 | |||
|
| |||
Net asset value and maximum offering price per share | $7.08 | |||
|
| |||
| The accompanying notes are an integral part of these financial statements. | Semiannual Report | FFA-9 | |||||
FRANKLIN TEMPLETON VARIABLE INSURANCE PRODUCTS TRUST
FINANCIAL STATEMENTS
Statement of Operations
for the six months ended June 30, 2018 (unaudited)
| Franklin Founding Funds Allocation VIP Fund | ||||
Investment income: | ||||
Dividends: | ||||
Non-controlled affiliates (Note 3d) | $ 22,112,059 | |||
|
| |||
Expenses: | ||||
Administrative fees (Note 3a) | 480,936 | |||
Distribution fees: (Note 3b) | ||||
Class 2 | 578,990 | |||
Class 4 | 875,256 | |||
Reports to shareholders | 42,777 | |||
Professional fees | 23,433 | |||
Trustees’ fees and expenses | 2,531 | |||
Other | 6,830 | |||
|
| |||
Total expenses | 2,010,753 | |||
Expenses waived/paid by affiliates (Note 3e) | (74,254 | ) | ||
|
| |||
Net expenses | 1,936,499 | |||
|
| |||
Net investment income | 20,175,560 | |||
|
| |||
Realized and unrealized gains (losses): | ||||
Net realized gain (loss) from: | ||||
Investments: | ||||
Non-controlled affiliates (Note 3d) | 14,381,086 | |||
Capital gain distributions from Underlying Funds: | ||||
Non-controlled affiliates (Note 3d) | 25,478,331 | |||
|
| |||
Net realized gain (loss) | 39,859,417 | |||
|
| |||
Net change in unrealized appreciation (depreciation) on: | ||||
Investments: | ||||
Non-controlled affiliates (Note 3d) | (68,409,754 | ) | ||
|
| |||
Net realized and unrealized gain (loss) | (28,550,337 | ) | ||
|
| |||
Net increase (decrease) in net assets resulting from operations | $ (8,374,777 | ) | ||
|
| |||
| FFA-10 | Semiannual Report | The accompanying notes are an integral part of these financial statements. | |||
FRANKLIN TEMPLETON VARIABLE INSURANCE PRODUCTS TRUST
FINANCIAL STATEMENTS
Statements of Changes in Net Assets
| Franklin Founding Funds Allocation VIP Fund | ||||||||
Six Months Ended June 30, 2018 (unaudited) | Year Ended December 31, 2017 | |||||||
Increase (decrease) in net assets: | ||||||||
Operations: | ||||||||
Net investment income | $ 20,175,560 | $ 25,006,932 | ||||||
Net realized gain (loss) | 39,859,417 | 32,208,741 | ||||||
Net change in unrealized appreciation (depreciation) | (68,409,754 | ) | 57,408,783 | |||||
|
| |||||||
Net increase (decrease) in net assets resulting from operations | (8,374,777 | ) | 114,624,456 | |||||
|
| |||||||
Distributions to shareholders from: | ||||||||
Net investment income: | ||||||||
Class 1 | (35,091 | ) | (32,261 | ) | ||||
Class 2 | (13,707,945 | ) | (12,990,591 | ) | ||||
Class 4 | (13,721,977 | ) | (13,655,260 | ) | ||||
Net realized gains: | ||||||||
Class 1 | (25,257 | ) | (45,646 | ) | ||||
Class 2 | (10,734,915 | ) | (20,025,278 | ) | ||||
Class 4 | (11,229,999 | ) | (21,899,278 | ) | ||||
|
| |||||||
Total distributions to shareholders | (49,455,184 | ) | (68,648,314 | ) | ||||
|
| |||||||
Capital share transactions: (Note 2) | ||||||||
Class 1 | 91,308 | (23,477 | ) | |||||
Class 2 | (3,849,436 | ) | (15,665,134 | ) | ||||
Class 4 | (23,693,023 | ) | (26,073,212 | ) | ||||
|
| |||||||
Total capital share transactions | (27,451,151 | ) | (41,761,823 | ) | ||||
|
| |||||||
Net increase (decrease) in net assets | (85,281,112 | ) | 4,214,319 | |||||
Net assets: | ||||||||
Beginning of period | 1,010,310,814 | 1,006,096,495 | ||||||
|
| |||||||
End of period | $ 925,029,702 | $1,010,310,814 | ||||||
|
| |||||||
Undistributed net investment income included in net assets: | ||||||||
End of period | $ 20,175,599 | $ 27,465,052 | ||||||
|
| |||||||
| The accompanying notes are an integral part of these financial statements. | Semiannual Report | FFA-11 | |||||
FRANKLIN TEMPLETON VARIABLE INSURANCE PRODUCTS TRUST
Notes to Financial Statements (unaudited)
Franklin Founding Funds Allocation VIP Fund
1. Organization and Significant Accounting Policies
Franklin Templeton Variable Insurance Products Trust (Trust) is registered under the Investment Company Act of 1940 (1940 Act) as an open-end management investment company, consisting of eighteen separate funds and applies the specialized accounting and reporting guidance in U.S. Generally Accepted Accounting Principles (U.S. GAAP). Franklin Founding Funds Allocation VIP Fund (Fund) is included in this report. The Fund invests primarily in other funds of the Trust (Underlying Funds). Shares of the Fund are generally sold only to insurance company separate accounts to fund the benefits of variable life insurance policies or variable annuity contracts. The Fund offers three classes of shares: Class 1, Class 2 and Class 4. Each class of shares may differ by its distribution fees, voting rights on matters affecting a single class and its exchange privilege.
The accounting policies of the Underlying Funds are outlined in their respective shareholder reports. A copy of the Underlying Funds’ shareholder reports is available on the U.S. Securities and Exchange Commission (SEC) website at sec.gov or at the SEC’s Public Reference Room in Washington, D.C. The Underlying Funds’ shareholder reports are not covered by this report.
The following summarizes the Fund’s significant accounting policies.
a. Financial Instrument Valuation
The Fund’s investments in financial instruments are carried at fair value daily. Fair value is the price that would be received to sell an asset or paid to transfer a liability in an orderly transaction between market participants on the measurement date. The Fund calculates the net asset value (NAV) per share each business day as of 4 p.m. Eastern time or the regularly scheduled close of the New York Stock Exchange (NYSE), whichever is earlier. Under compliance policies and procedures approved by the Trust’s Board of Trustees (the Board), the Fund’s administrator has responsibility for oversight of valuation, including leading the cross-functional Valuation Committee (VC). The VC provides administration and oversight of the Fund’s valuation policies and procedures, which are approved annually by the Board. Investments in the Underlying Funds are valued at their closing NAV each trading day.
b. Income Taxes
It is the Fund’s policy to qualify as a regulated investment company under the Internal Revenue Code. The Fund intends to distribute to shareholders substantially all of its taxable income and net realized gains to relieve it from federal income and if applicable, excise taxes. As a result, no provision for U.S. federal income taxes is required.
The Fund may recognize an income tax liability related to its uncertain tax positions under U.S. GAAP when the uncertain tax position has a less than 50% probability that it will be sustained upon examination by the tax authorities based on its technical merits. As of June 30, 2018, the Fund has determined that no tax liability is required in its financial statements related to uncertain tax positions for any open tax years (or expected to be taken in future tax years). Open tax years are those that remain subject to examination and are based on the statute of limitations in each jurisdiction in which the Fund invests.
c. Security Transactions, Investment Income, Expenses and Distributions
Security transactions are accounted for on trade date. Realized gains and losses on security transactions are determined on a specific identification basis. Estimated expenses are accrued daily. Dividend income and realized gain distributions by Underlying Funds are recorded on the ex-dividend date. Distributions to shareholders are recorded on the ex-dividend date. Distributable earnings are determined according to income tax regulations (tax basis) and may differ from earnings recorded in accordance with U.S. GAAP. These differences may be permanent or temporary. Permanent differences are reclassified among capital accounts to reflect their tax character. These reclassifications have no impact on net assets or the results of operations. Temporary differences are not reclassified, as they may reverse in subsequent periods.
Common expenses incurred by the Trust are allocated among the Funds based on the ratio of net assets of each Fund to the combined net assets of the Trust or based on the ratio of number of shareholders of each Fund to the combined number of shareholders of the Trust. Fund specific expenses are charged directly to the Fund that incurred the expense.
| FFA-12 | Semiannual Report | |||
FRANKLIN TEMPLETON VARIABLE INSURANCE PRODUCTS TRUST
NOTES TO FINANCIAL STATEMENTS (UNAUDITED)
Franklin Founding Funds Allocation VIP Fund (continued)
The Fund indirectly bears its proportionate share of expenses from the Underlying Funds. Since the Underlying Funds have varied expense levels and the Fund may own different proportions of the Underlying Funds at different times, the amount of expenses incurred indirectly by the Fund will vary.
Realized and unrealized gains and losses and net investment income, excluding class specific expenses, are allocated daily to each class of shares based upon the relative proportion of net assets of each class. Differences in per share distributions by class are generally due to differences in class specific expenses.
d. Accounting Estimates
The preparation of financial statements in accordance with U.S. GAAP requires management to make estimates and assumptions that affect the reported amounts of assets and
liabilities at the date of the financial statements and the amounts of income and expenses during the reporting period. Actual results could differ from those estimates.
e. Guarantees and Indemnifications
Under the Trust’s organizational documents, its officers and trustees are indemnified by the Trust against certain liabilities arising out of the performance of their duties to the Trust. Additionally, in the normal course of business, the Trust, on behalf of the Fund, enters into contracts with service providers that contain general indemnification clauses. The Trust’s maximum exposure under these arrangements is unknown as this would involve future claims that may be made against the Trust that have not yet occurred. Currently, the Trust expects the risk of loss to be remote.
2. Shares of Beneficial Interest
At June 30, 2018, there were an unlimited number of shares authorized (without par value). Transactions in the Fund’s shares were as follows:
Six Months Ended June 30, 2018 | Year Ended December 31, 2017 | |||||||||||||||
|
| |||||||||||||||
| Shares | Amount | Shares | Amount | |||||||||||||
| ||||||||||||||||
| Class 1 Shares: | ||||||||||||||||
Shares sold | 7,295 | $ 53,518 | 15,386 | $ 112,506 | ||||||||||||
Shares issued in reinvestment of distributions | 8,536 | 60,348 | 11,035 | 77,907 | ||||||||||||
Shares redeemed | (3,056 | ) | (22,558 | ) | (29,626 | ) | (213,890) | |||||||||
|
| |||||||||||||||
Net increase (decrease) | 12,775 | $ 91,308 | (3,205 | ) | $ (23,477) | |||||||||||
|
| |||||||||||||||
| Class 2 Shares: | ||||||||||||||||
Shares sold | 1,440,666 | $ 10,613,656 | 3,596,772 | $ 26,184,474 | ||||||||||||
Shares issued in reinvestment of distributions | 3,476,936 | 24,442,860 | 4,703,115 | 33,015,869 | ||||||||||||
Shares redeemed | (5,284,836 | ) | (38,905,952 | ) | (10,329,852 | ) | (74,865,477) | |||||||||
|
| |||||||||||||||
Net increase (decrease) | (367,234 | ) | $ (3,849,436 | ) | (2,029,965 | ) | $(15,665,134) | |||||||||
|
| |||||||||||||||
| Class 4 Shares: | ||||||||||||||||
Shares sold | 557,693 | $ 4,186,677 | 2,459,253 | $ 18,233,389 | ||||||||||||
Shares issued in reinvestment of distributions | 3,475,206 | 24,951,976 | 4,965,718 | 35,554,538 | ||||||||||||
Shares redeemed | (7,045,961 | ) | (52,831,676 | ) | (10,802,755 | ) | (79,861,139) | |||||||||
|
| |||||||||||||||
Net increase (decrease) | (3,013,062 | ) | $(23,693,023 | ) | (3,377,784 | ) | $(26,073,212) | |||||||||
|
| |||||||||||||||
| Semiannual Report | FFA-13 | |||||
FRANKLIN TEMPLETON VARIABLE INSURANCE PRODUCTS TRUST
NOTES TO FINANCIAL STATEMENTS (UNAUDITED)
Franklin Founding Funds Allocation VIP Fund (continued)
3. Transactions with Affiliates
Franklin Resources, Inc. is the holding company for various subsidiaries that together are referred to as Franklin Templeton Investments. Certain officers and trustees of the Fund are also officers, directors and/or trustees of the Underlying Funds and of the following subsidiaries:
| Subsidiary | Affiliation | |
Franklin Templeton Services, LLC (FT Services) | Administrative manager | |
Franklin Templeton Distributors, Inc. (Distributors) | Principal underwriter | |
Franklin Templeton Investor Services, LLC (Investor Services) | Transfer agent |
a. Administrative Fees
The Fund pays an administrative fee to FT Services of 0.10% per year of the average daily net assets of the Fund for administrative services including monitoring and rebalancing the percentage of the Fund’s investments in the Underlying Funds.
b. Distribution Fees
The Board has adopted distribution plans for Class 2 and Class 4 shares pursuant to Rule 12b-1 under the 1940 Act. Under the Fund’s compensation distribution plans, the Fund pays Distributors for costs incurred in connection with the servicing, sale and distribution of the Fund’s shares up to 0.35% per year of its average daily net assets of each class. The Board has agreed to limit the current rate to 0.25% per year for Class 2. The plan year, for purposes of monitoring compliance with the maximum annual plan rates, is February 1 through January 31.
c. Transfer Agent Fees
Investor Services, under terms of an agreement, performs shareholder servicing for the Fund and is not paid by the Fund for the services.
d. Investments in Underlying Funds
The Fund invests in Underlying Funds which are managed by affiliates of the Fund’s administrative manager, FT Services. The Fund does not invest in Underlying Funds for the purpose of exercising a controlling influence over the management or policies.
Investments in Underlying Funds for the period ended June 30, 2018, were as follows:
| Underlying Funds | Number of Shares Held at Beginning of Period | Gross Additions | Gross Reductions | Number of Shares Held at End of Period | Value at End of Period | Dividend Income | Realized Gain (Loss) | Net Change in Unrealized Appreciation (Depreciation) | ||||||||||||||||||||||||
| ||||||||||||||||||||||||||||||||
| Non-Controlled Affiliates | ||||||||||||||||||||||||||||||||
Franklin Income VIP Fund, Class 1 | 20,134,973 | 979,260 | (2,212,293 | ) | 18,901,940 | $303,376,138 | $15,250,045 | $2,899,147 | $(15,678,425 | ) | ||||||||||||||||||||||
Franklin Mutual Shares VIP Fund, Class 1 | 16,254,912 | — | (1,290,601 | ) | 14,964,311 | 307,965,526 | — | 3,199,658 | (5,004,257 | ) | ||||||||||||||||||||||
Templeton Growth VIP Fund, Class 1 | 20,714,775 | 2,227,296 | (1,308,627 | ) | 21,633,444 | 307,627,570 | 6,862,014 | 33,760,612 | a | (47,727,072 | ) | |||||||||||||||||||||
|
| |||||||||||||||||||||||||||||||
Total Affiliated Securities | $918,969,234 | $22,112,059 | $39,859,417 | $(68,409,754 | ) | |||||||||||||||||||||||||||
|
| |||||||||||||||||||||||||||||||
aIncludes realized gain distributions received.
| FFA-14 | Semiannual Report | |||
FRANKLIN TEMPLETON VARIABLE INSURANCE PRODUCTS TRUST
NOTES TO FINANCIAL STATEMENTS (UNAUDITED)
Franklin Founding Funds Allocation VIP Fund (continued)
e. Waiver and Expense Reimbursements
FT Services has contractually agreed in advance to waive or limit its fees and to assume as its own expense certain expenses otherwise payable by the Fund so that the expenses (excluding distribution fees, and acquired fund fees and expenses) for each class of the Fund do not exceed 0.10%, based on the average net assets of each class (other than certain non-routine expenses or costs, including those relating to litigation, indemnification, reorganizations, and liquidations) until April 30, 2019. Total expenses waived or paid are not subject to recapture subsequent to the Fund’s fiscal year end.
4. Income Taxes
At June 30, 2018, the cost of investments and net unrealized appreciation (depreciation) for income tax purposes were as follows:
Cost of investments | $718,790,945 | |||
|
| |||
Unrealized appreciation | $241,894,124 | |||
Unrealized depreciation | (41,715,835) | |||
|
| |||
Net unrealized appreciation (depreciation) | $200,178,289 | |||
|
| |||
Differences between income and/or capital gains as determined on a book basis and a tax basis are primarily due to differing treatment of wash sales.
5. Investment Transactions
Purchases and sales of Underlying Funds (excluding short term securities) for the period ended June 30, 2018, aggregated $600,000 and $84,896,411, respectively.
6. Credit Facility
The Fund, together with other U.S. registered and foreign investment funds (collectively, Borrowers), managed by Franklin Templeton Investments, are borrowers in a joint syndicated senior unsecured credit facility totaling $2 billion (Global Credit Facility) which matures on February 8, 2019. This Global Credit Facility provides a source of funds to the Borrowers for temporary and emergency purposes, including the ability to meet future unanticipated or unusually large redemption requests.
Under the terms of the Global Credit Facility, the Fund shall, in addition to interest charged on any borrowings made by the Fund and other costs incurred by the Fund, pay its share of fees and expenses incurred in connection with the implementation and maintenance of the Global Credit Facility, based upon its relative share of the aggregate net assets of all of the Borrowers, including an annual commitment fee of 0.15% based upon the unused portion of the Global Credit Facility. These fees are reflected in other expenses in the Statement of Operations. During the period ended June 30, 2018, the Fund did not use the Global Credit Facility.
7. Fair Value Measurements
The Fund follows a fair value hierarchy that distinguishes between market data obtained from independent sources (observable inputs) and the Fund’s own market assumptions (unobservable inputs). These inputs are used in determining the value of the Fund’s financial instruments and are summarized in the following fair value hierarchy:
| • | Level 1 – quoted prices in active markets for identical financial instruments |
| • | Level 2 – other significant observable inputs (including quoted prices for similar financial instruments, interest rates, prepayment speed, credit risk, etc.) |
| Semiannual Report | FFA-15 | |||||
FRANKLIN TEMPLETON VARIABLE INSURANCE PRODUCTS TRUST
NOTES TO FINANCIAL STATEMENTS (UNAUDITED)
Franklin Founding Funds Allocation VIP Fund (continued)
7. Fair Value Measurements (continued)
| • | Level 3 – significant unobservable inputs (including the Fund’s own assumptions in determining the fair value of financial instruments) |
The input levels are not necessarily an indication of the risk or liquidity associated with financial instruments at that level.
For movements between the levels within the fair value hierarchy, the Fund has adopted a policy of recognizing the transfers as of the date of the underlying event which caused the movement.
At June 30, 2018, all of the Fund’s investments in financial instruments carried at fair value were valued using Level 1 inputs. For detailed categories, see the accompanying Statement of Investments.
8. Subsequent Events
The Fund has evaluated subsequent events through the issuance of the financial statements and determined that no events have occurred that require disclosure.
| FFA-16 | Semiannual Report | |||
FRANKLIN TEMPLETON VARIABLE INSURANCE PRODUCTS TRUST
Tax Information (unaudited)
Franklin Founding Funds Allocation VIP Fund
During the fiscal year ended December 31, 2017, the Fund, a qualified fund of funds under Section 852(g)(2) of Internal Revenue Code (Code), received an allocation of foreign taxes paid from one or more of its underlying funds. As shown in the table below, the Fund hereby reports to shareholders the foreign source income and foreign taxes paid by underlying funds, pursuant to Section 853 of the Code. This written statement will allow shareholders of record on June 14, 2018, to treat their proportionate share of foreign taxes paid by the underlying funds as having been paid directly by them. The shareholder shall consider these amounts as foreign taxes paid in the tax year in which they receive the Fund distribution.
The following table provides a detailed analysis of foreign tax paid, and foreign source income as reported by the Fund, to Class 1, Class 2, and Class 4 shareholders of record.
| Class | Foreign Tax Paid Per Share | Foreign Source Income Per Share | ||||||
| ||||||||
| Class 1 | $0.0039 | $0.0409 | ||||||
| Class 2 | $0.0039 | $0.0409 | ||||||
| Class 4 | $0.0039 | $0.0409 | ||||||
Foreign Tax Paid Per Share (Column 1) is the amount per share available to you, as a tax credit (assuming you held your shares in the Fund for a minimum of 16 days during the 31-day period beginning 15 days before the ex-dividend date of the Fund’s distribution to which the foreign taxes relate), or, as a tax deduction.
Foreign Source Income Per Share (Column 2) is the amount per share of income dividends attributable to foreign securities held by the Fund, plus any foreign taxes withheld on these dividends.
| Semiannual Report | FFA-17 | |||||
This page intentionally left blank.
Franklin Global Real Estate VIP Fund
This semiannual report for Franklin Global Real Estate VIP Fund covers the period ended June 30, 2018.
Class 2 Performance Summary as of June 30, 2018
The Fund’s Class 2 Shares had a -0.19% total return for the six-month period ended June 30, 2018.
Performance reflects the Fund’s Class 2 operating expenses, but does not include any contract fees, expenses or sales charges. If they had been included, performance would be lower. These charges and deductions, particularly for variable life policies, can have a significant effect on contract values and insurance benefits. See the contract prospectus for a complete description of these expenses, including sales charges.
Performance data represent past performance, which does not guarantee future results. Investment return and principal value will fluctuate, and you may have a gain or loss when you sell your shares. Current performance may differ from figures shown.
| Semiannual Report | FGR-1 | |||||
FRANKLIN GLOBAL REAL ESTATE VIP FUND
Fund Goal and Main Investments
The Fund seeks high total return. Under normal market conditions, the Fund invests at least 80% of its net assets in investments of companies located anywhere in the world that operate in the real estate sector, including: real estate investment trusts (REITs) and similar REIT-like entities domiciled outside the US; companies qualifying under US federal tax law as REITs; and companies that derive at least half of their assets or revenues from the ownership, management, development or sale of residential or commercial real estate (such as real estate operating or service companies).
What is a REIT?
A REIT is a type of real estate company that is dedicated to owning and usually operating income-producing real estate properties such as apartments, hotels, industrial properties, office buildings or shopping centers. Equity REITs generally receive income from rents received, are generally operated by experienced property management teams and typically concentrate on a specific geographic region or property type.
|
Fund Risks
All investments involve risks, including possible loss of principal. The Fund concentrates in real estate securities, which involve special risks, such as declines in the value of real estate and increased susceptibility to adverse economic or regulatory developments affecting the sector. The Fund’s investments in REITs involve additional risks; since REITs typically are invested in a limited number of projects or in a particular market segment, they are more susceptible to adverse developments affecting a single project or market segment than more broadly diversified investments. Foreign investing, especially in emerging markets, involves additional risks such as currency and market volatility, as well as political and social instability. The Fund is actively managed but there is no guarantee that the manager’s investment decisions will produce the desired results. The Fund’s prospectus also includes a description of the main investment risks.
Performance Overview
You can find the Fund’s six-month total return in the Performance Summary. In comparison, the FTSE EPRA/NAREIT Developed Index posted a +0.91% total return for the same period.1
Portfolio Composition
Based on Total Net Assets as of 6/30/18
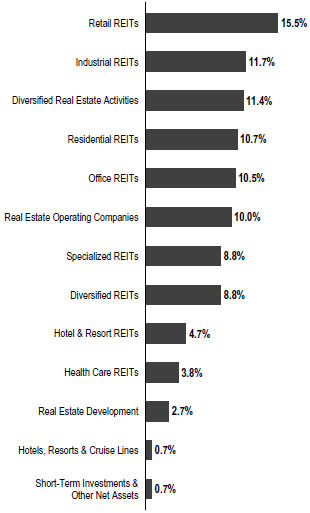
Economic and Market Overview
The global economy expanded during the six-month period under review amid generally upbeat economic data across regions. In this environment, global developed and emerging market stocks reached a new all-time high in January 2018, as measured by the MSCI All Country World Index (ACWI). During the period, global markets were aided by price gains in oil and other commodities, encouraging corporate earnings reports and investor optimism about global economic growth. However, global stocks had a -0.13% total return for the six-month period, as measured by the MSCI ACWI, largely due to an overall decline in emerging market stocks.1
1. Source: Morningstar. One cannot invest directly in an index, and an index is not representative of the Fund’s portfolio. Please see Index Descriptions following the Fund Summaries.
The dollar value, number of shares or principal amount, and names of all portfolio holdings are listed in the Fund’s Statement of Investments (SOI).
| FGR-2 | Semiannual Report | |||
FRANKLIN GLOBAL REAL ESTATE VIP FUND
Global markets reflected investor concerns about tensions in the Korean peninsula and political uncertainties in the US and the European Union, as well as worries that strong economic growth and rising inflation in some parts of the world, particularly in the US, would lead central banks to increase interest rates sooner than expected. Markets were further pressured by the Trump administration’s protectionist trade policies, uncertainty surrounding the US-China trade relationship, and a broad sell-off in information technology stocks in March due to a potential for tighter regulation in the sector arising from concerns about consumer data privacy. An overall easing of tensions in the Korean peninsula and intermittent US-China trade negotiations partially offset some of these concerns. However, US trade disputes with its allies and China near period-end dampened investor sentiment.
The US economy continued to grow during the six months under review. After moderating for three consecutive quarters, the economy grew faster in 2018’s second quarter, driven by consumer spending, exports, business investment and government spending. The unemployment rate declined from 4.1% in December 2017, as reported at the beginning of the six-month period, to 4.0% at period-end.2 Annual inflation, as measured by the Consumer Price Index, increased from 2.1% in December 2017, as reported at the beginning of the period, to 2.9% at period-end.2 The US Federal Reserve raised its target range for the federal funds rate in March and June 2018 and continued reducing its balance sheet as part of its ongoing plan to normalize monetary policy.
In Europe, the UK’s quarterly economic growth moderated in 2018’s first quarter amid a decline in construction output. The Bank of England kept its key policy rate unchanged during the period. The eurozone’s quarterly growth moderated in 2018’s first quarter due to a decline in external demand. The bloc’s annual inflation rate ended the period higher than in December 2017. The European Central Bank (ECB) kept its benchmark interest rate unchanged during the period. However, at its June meeting, the ECB announced it would further reduce its monthly bond purchases beginning in October 2018 and indicated it would conclude the program at the end of 2018 while continuing to keep interest rates unchanged through at least the summer of 2019.
In Asia, Japan’s quarterly gross domestic product (GDP) growth in 2018’s first quarter declined, the country’s first contraction since 2015’s fourth quarter, mainly due to a decline
Top 10 Countries
6/30/18
% of Total Net Assets | ||
U.S. | 51.8% | |
Japan | 10.7% | |
Hong Kong | 7.7% | |
Germany | 5.8% | |
U.K. | 5.4% | |
Australia | 5.0% | |
Singapore | 3.3% | |
Sweden | 2.2% | |
Canada | 2.1% | |
Netherlands | 2.0% |
in private residential investment and household consumption. The Bank of Japan left its benchmark interest rate unchanged during the period and continued its monetary stimulus measures.
In emerging markets, Brazil’s quarterly GDP accelerated in 2018’s first quarter compared to the previous quarter. The country’s central bank cut its benchmark interest rate twice during the period to spur economic growth. Russia’s annual GDP grew in 2018’s first quarter compared to the prior-year period, amid the Bank of Russia’s continued policy support. China’s annual GDP moderated in 2018’s first quarter compared to the prior-year period. The People’s Bank of China left its benchmark interest rate unchanged during the period. Overall, emerging market stocks, as measured by the MSCI Emerging Markets Index, declined during the period.3
According to the FTSE EPRA/NAREIT Developed Index, in US dollar terms, most countries outpaced the index. Among the leaders were Hong Kong, the US, Germany and the UK. Singapore, Australia and France also performed well. In contrast, Japan lost value and New Zealand underperformed the index. At period-end, the US was the index’s largest country weighting.
Investment Strategy
We seek to limit price volatility by investing across markets and property types. When selecting investments for the Fund’s portfolio, we apply a “bottom-up” stock selection process that incorporates macro-level views in the evaluation process. Our portfolio construction process combines bottom-up analysis of individual stock and real estate market fundamentals and
2. Source: US Bureau of Labor Statistics.
3. Please see Index Descriptions following the Fund Summaries.
| Semiannual Report | FGR-3 | |||||
FRANKLIN GLOBAL REAL ESTATE VIP FUND
top-down macro overlays to provide country/regional, property type, and company size perspectives in identifying international/local cyclical and thematic trends that highlight investment opportunities.
Manager’s Discussion
During the six months under review, key detractors from the Fund’s performance relative to the FTSE EPRA/NAREIT Developed Index included an underweighting and security selection in the health care property sector.4 Shares of CareTrust REIT underperformed along with other health care REITs, largely due to prevailing negative investor sentiment about the industry in a rising interest-rate environment. CareTrust is a small-capitalization REIT, which originally spun off from Ensign Group, a major publicly traded health care operator, in 2014. CareTrust focuses on ownership of skilled nursing and senior housing health care real estate, and its stock was pressured following the company’s announcement of tenant-related issues. Our initial investment thesis was based on our view that CareTrust would successfully grow with acquisitions in the skilled nursing and senior housing segments. Our thesis played out nicely last year as the company executed on its external growth strategy, reflected in the stock’s strong performance as it generated higher returns than its peers for our portfolios. After learning about CareTrust’s tenant issues, we grew increasingly concerned about the company’s ability to continue to make acquisitions and finance its external growth after the stock’s sell-off. As a result, we recently liquidated our position in the company.
The Fund’s underweighted position and stock selection in the diversified sector also weighed on results.5 Shares of City Developments was a major detractor during the period. As the biggest private developer in Singapore, the company benefited from strong private home price increases earlier in the year, while its share price started to decline over the past three months. As private home prices increased in the first quarter of 2018 and momentum of land and home prices remained on an uptrend in the second quarter, City Developments started to weaken due to concerns over the sustainability of the residential cycle, the possibility of policy interventions, and a rising interest rate environment. We believe Singapore has strong residential fundamentals underpinned by economic growth, tight near-term supply, and favorable affordability, and City Developments is well positioned with a strong launch
Top 10 Holdings
6/30/18
Company Sector/Industry, Country | % of Total Net Assets | |
Simon Property Group Inc. Retail REITs, U.S. | 4.2% | |
Prologis Inc. Industrial REITs, U.S. | 3.4% | |
Mitsui Fudosan Co. Ltd. Diversified Real Estate Activities, Japan | 2.7% | |
Deutsche Wohnen SE Real Estate Operating Companies, Germany | 2.5% | |
Equity Residential Residential REITs, U.S. | 2.5% | |
AvalonBay Communities Inc. Residential REITs, U.S. | 2.2% | |
CK Asset Holdings Ltd. Real Estate Development, Hong Kong | 2.2% | |
Digital Realty Trust Inc. Specialized REITs, U.S. | 2.2% | |
Unibail-Rodamco-Westfield Retail REITs, Netherlands | 2.0% | |
Mitsubishi Estate Co. Ltd. Diversified Real Estate Activities, Japan | 2.0% |
pipeline. However, policy tightening remains the biggest risk to City Developments’ share performance.
Relative returns were further pressured by stock selection in the hotel and resort industry and by an unfavorable underweighting in storage property.6 Shares of Public Storage, a leading public storage REIT, performed particularly well during the period, and as a result our existing underweighted position in the stock detracted from results. Despite the strong performance of storage REITs in the first half of this year, we remain cautious on fundamentals over the next 12 to 18 months as supply pressures have yet to be reflected in operating trends. Following several years of very strong fundamentals, storage revenue growth, albeit stable, started to slow in recent quarters. Nevertheless, recent results came in better than reduced expectations. We think storage stock valuations remain relatively less attractive given their current premium levels. We remain selective in the industry and believe our two overweightings in CubeSmart and Extra Space Storage should perform well.
4. The health care property holdings are in health care REITs in the SOI.
5. Diversified holdings are in diversified real estate activities, diversified REITs, real estate development and real estate operating companies in the SOI.
6. Hotel and resort holdings are in hotel and resort REITs and hotels, resorts and cruise lines in the SOI. Storage property holdings are in specialized REITs in the SOI.
| FGR-4 | Semiannual Report | |||
FRANKLIN GLOBAL REAL ESTATE VIP FUND
Conversely, stock selection in the residential sector supported relative returns over the period.7 Shares of Deutsche Wohnen, which owns residential properties in Germany, mostly in Berlin, outperformed the benchmark. In our view, the Berlin residential market seems attractive with its supply and demand mismatch, which continues to put upward pressure on rents as vacancy in the market has decreased sharply. Management has continued to see further significant reversionary potential in the existing portfolio. We believe new supply for lower- to middle-income housing is limited as portfolio valuations remain much below replacement costs. Berlin still offers low average rent levels compared to other larger western German cities and major cities in Europe. Germany overall features a supportive economic environment with unemployment at close to 20-year lows and steady gross domestic product growth in recent years. In our analysis, Deutsche Wohnen continues to be attractive based on our internal momentum model and on valuation metrics.
The Fund’s underweighted position in the retail property sector and overweighted position in the industrial property sector also boosted results.8 Shares of Segro, which owns and operates industrial properties in the UK and Continental Europe, outperformed the benchmark. The UK market is benefiting from strong growth in ecommerce, and the lack of good quality available product is driving rental growth, with limited new supply and scarcity of industrial zoned land. The rental growth prospects in Continental Europe are improving and key urban hubs are expected to see accelerating rental growth. In our analysis, Segro continues to be at the top of our UK list based on our internal momentum model and seems attractive to us versus its industrial peers on valuation. The company’s balance sheet remains conservative and it has a strong development pipeline, with what we view as an attractive yield.
Other individual contributors to relative performance included diversified Japanese REIT Mitsui Fudosan. The firm is the largest property developer in Japan with a well-diversified business model in property leasing, sales and asset management. Over the past few years, Mitsui Fudosan has demonstrated steady profit and net-asset-value growth and achieved record high profits. In May 2018, the company announced its long-term business plan as well as its first share buyback. The company’s announcement that it would increase its target shareholder return, which suggests continuous share buybacks going forward, was well-received by market participants. Given Mitsui Fudosan is the biggest office
supplier of new grade-A office buildings from 2018–2020, we believe earnings should strengthen beyond 2020 against the backdrop of tight vacancy in Central Tokyo.
It is important to recognize the effect of currency movements on the Fund’s performance. In general, if the value of the US dollar goes up compared with a foreign currency, an investment traded in that foreign currency will go down in value because it will be worth fewer US dollars. This can have a negative effect on Fund performance. Conversely, when the US dollar weakens in relation to a foreign currency, an investment traded in that foreign currency will increase in value, which can contribute to Fund performance. For the six months ended June 30, 2018, the US dollar rose in value relative to most currencies. As a result, the Fund’s performance was negatively affected by the portfolio’s significant investment in securities with non-US currency exposure.
Thank you for your participation in Franklin Global Real Estate VIP Fund. We look forward to serving your future investment needs.
The foregoing information reflects our analysis, opinions and portfolio holdings as of June 30, 2018, the end of the reporting period. The way we implement our main investment strategies and the resulting portfolio holdings may change depending on factors such as market and economic conditions. These opinions may not be relied upon as investment advice or an offer for a particular security. The information is not a complete analysis of every aspect of any market, country, industry, security or the Fund. Statements of fact are from sources considered reliable, but the investment manager makes no representation or warranty as to their completeness or accuracy. Although historical performance is no guarantee of future results, these insights may help you understand our investment management philosophy.
7. Residential holdings are in real estate operating companies and residential REITs in the SOI.
8. Retail property holdings are in retail REITs in the SOI. Industrial property holdings are in industrial REITs in the SOI.
| Semiannual Report | FGR-5 | |||||
FRANKLIN GLOBAL REAL ESTATE VIP FUND
Class 2 Fund Expenses
As an investor in a variable insurance contract (Contract) that indirectly provides for investment in an underlying mutual fund, you can incur transaction and/or ongoing expenses at both the Fund level and the Contract Level: (1) transaction expenses can include sales charges (loads) on purchases, surrender fees, transfer fees and premium taxes; and (2) ongoing expenses can include management fees, distribution and service (12b-1) fees, contract fees, annual maintenance fees, mortality and expense risk fees and other fees and expenses. All mutual funds and Contracts have some types of ongoing expenses. The table below shows Fund-level ongoing expenses and can help you understand these costs and compare them with those of other mutual funds offered through the Contract. The table assumes a $1,000 investment held for the six months indicated. Please refer to the Fund prospectus for additional information on operating expenses.
Actual Fund Expenses
The table below provides information about the actual account values and actual expenses in the columns under the heading “Actual.” In these columns the Fund’s actual return, which includes the effect of ongoing Fund expenses but does not include the effect of ongoing Contract expenses, is used to calculate the “Ending Account Value.” You can estimate the Fund-level expenses you paid during the period by following these steps (of course, your account value and expenses will differ from those in this illustration): Divide your account value by $1,000 (if your account had an $8,600 value, then $8,600 ÷ $1,000 = 8.6). Then multiply the result by the number under the headings “Actual” and “Fund-Level Expenses Paid During Period” (if Fund-Level Expenses Paid During Period were $ 7.50, then 8.6 x $7.50 = $64.50). In this illustration, the estimated expenses paid this period at the Fund level are $64.50.
Hypothetical Example for Comparison with Other Mutual Funds
Under the heading “Hypothetical” in the table, information is provided about hypothetical account values and hypothetical expenses based on the Fund’s actual expense ratio and an assumed rate of return of 5% per year before expenses, which is not the Fund’s actual return. This information may not be used to estimate the actual ending account balance or expenses you paid for the period, but it can help you compare ongoing costs of investing in the Fund with those of other mutual funds offered through the Contract. To do so, compare this 5% hypothetical example with the 5% hypothetical examples that appear in the shareholder reports of other funds offered through the Contract.
Please note that expenses shown in the table are meant to highlight ongoing costs at the Fund level only and do not reflect any ongoing expenses at the Contract level, or transaction expenses at either the Fund or Contract levels. In addition, while the Fund does not have transaction expenses, if the transaction and ongoing expenses at the Contract level were included, the expenses shown below would be higher. You should consult your Contract prospectus or disclosure document for more information.
| Actual | Hypothetical | |||||||||||
| (actual return after expenses) | (5% annual return before expenses) | |||||||||||
Share Class | Beginning Account Value 1/1/18 | Ending Account Value 6/30/18 | Fund-Level Expenses Paid During Period 1/1/18–6/30/181,2 | Ending Account Value 6/30/18 | Fund-Level Expenses Paid During Period 1/1/18–6/30/181,2 | Annualized Expense Ratio2 | ||||||
|
|
|
| |||||||||
Class 2 | $1,000 | $998.10 | $6.89 | $1,017.90 | $6.95 | 1.39% | ||||||
1. Expenses are equal to the annualized expense ratio for the six-month period as indicated above—in the far right column—multiplied by the simple average account value over the period indicated, and then multiplied by 181/365 to reflect the one-half year period.
2. Does not include any ongoing expenses of the Contract for which the Fund is an investment option or acquired fund fees and expenses.
| FGR-6 | Semiannual Report | |||
FRANKLIN TEMPLETON VARIABLE INSURANCE PRODUCTS TRUST
Financial Highlights
Franklin Global Real Estate VIP Fund
Six Months Ended (unaudited) | Year Ended December 31, | |||||||||||||||||||||||
| 2017 | 2016 | 2015 | 2014 | 2013 | ||||||||||||||||||||
| ||||||||||||||||||||||||
Class 1 | ||||||||||||||||||||||||
| Per share operating performance (for a share outstanding throughout the period) | ||||||||||||||||||||||||
Net asset value, beginning of period | $16.96 | $15.83 | $15.93 | $16.36 | $14.29 | $14.66 | ||||||||||||||||||
|
| |||||||||||||||||||||||
| Income from investment operationsa: | ||||||||||||||||||||||||
Net investment incomeb | 0.18 | 0.17 | 0.30c | 0.24 | 0.26 | 0.24 | ||||||||||||||||||
Net realized and unrealized gains (losses) | (0.20 | ) | 1.52 | (0.16 | ) | (0.12 | ) | 1.92 | 0.13 | |||||||||||||||
|
| |||||||||||||||||||||||
Total from investment operations | (0.02 | ) | 1.69 | 0.14 | 0.12 | 2.18 | 0.37 | |||||||||||||||||
|
| |||||||||||||||||||||||
| Less distributions from net investment income | (0.47 | ) | (0.56 | ) | (0.24 | ) | (0.55 | ) | (0.11 | ) | (0.74) | |||||||||||||
|
| |||||||||||||||||||||||
Net asset value, end of period | $16.47 | $16.96 | $15.83 | $15.93 | $16.36 | $14.29 | ||||||||||||||||||
|
| |||||||||||||||||||||||
Total returnd | (0.09)% | 10.76% | 0.81% | 0.83% | 15.27% | 2.61% | ||||||||||||||||||
| Ratios to average net assetse | ||||||||||||||||||||||||
Expenses | 1.14%f | 1.14% | g | 1.11% | g | 1.11% | 1.10% | f | 1.10% | |||||||||||||||
Net investment income | 2.02% | 1.04% | 1.99% | c | 1.49% | 1.66% | 1.62% | |||||||||||||||||
| Supplemental data | ||||||||||||||||||||||||
Net assets, end of period (000’s) | $945 | $819 | $821 | $32,161 | $35,686 | $34,276 | ||||||||||||||||||
Portfolio turnover rate | 11.56% | 22.18% | 28.53% | h | 23.35% | 16.67% | 21.29% | |||||||||||||||||
aThe amount shown for a share outstanding throughout the period may not correlate with the Statement of Operations for the period due to the timing of sales and repurchases of the Fund’s shares in relation to income earned and/or fluctuating fair value of the investments of the Fund.
bBased on average daily shares outstanding.
cNet investment income per share includes approximately $0.06 per share related to income received in the form of special dividends in connection with certain Fund holdings. Excluding this amount, the ratio of net investment income to average net assets would have been 1.59%.
dTotal return does not include fees, charges or expenses imposed by the variable annuity and life insurance contracts for which Franklin Templeton Variable Insurance Products Trust serves as an underlying investment vehicle. Total return is not annualized for periods less than one year.
eRatios are annualized for periods less than one year.
fBenefit of expense reduction rounds to less than 0.01%.
gBenefit of waiver and payments by affiliates rounds to less than 0.01%.
hExcludes the value of portfolio securities delivered as a result of a redemption in-kind.
| The accompanying notes are an integral part of these financial statements. | Semiannual Report | FGR-7 | |||||
FRANKLIN TEMPLETON VARIABLE INSURANCE PRODUCTS TRUST
FINANCIAL HIGHLIGHTS
Franklin Global Real Estate VIP Fund (continued)
Six Months Ended (unaudited) | Year Ended December 31, | |||||||||||||||||||||||
| 2017 | 2016 | 2015 | 2014 | 2013 | ||||||||||||||||||||
| ||||||||||||||||||||||||
Class 2 | ||||||||||||||||||||||||
| Per share operating performance (for a share outstanding throughout the period) | ||||||||||||||||||||||||
Net asset value, beginning of period | $16.52 | $15.42 | $15.52 | $15.95 | $13.93 | $14.27 | ||||||||||||||||||
|
| |||||||||||||||||||||||
| Income from investment operationsa: | ||||||||||||||||||||||||
Net investment incomeb | 0.14 | 0.13 | 0.28 | c | 0.20 | 0.21 | 0.20 | |||||||||||||||||
Net realized and unrealized gains (losses) | (0.17 | ) | 1.47 | (0.19 | ) | (0.12 | ) | 1.88 | 0.13 | |||||||||||||||
|
| |||||||||||||||||||||||
Total from investment operations | (0.03 | ) | 1.60 | 0.09 | 0.08 | 2.09 | 0.33 | |||||||||||||||||
|
| |||||||||||||||||||||||
| Less distributions from net investment income | (0.43 | ) | (0.50 | ) | (0.19 | ) | (0.51 | ) | (0.07 | ) | (0.67) | |||||||||||||
|
| |||||||||||||||||||||||
Net asset value, end of period | $16.06 | $16.52 | $15.42 | $15.52 | $15.95 | $13.93 | ||||||||||||||||||
|
| |||||||||||||||||||||||
Total returnd | (0.19)% | 10.47% | 0.54% | 0.57% | 15.01% | 2.32% | ||||||||||||||||||
| Ratios to average net assetse | ||||||||||||||||||||||||
Expenses | 1.39% | f | 1.39% | g | 1.36% | g | 1.36% | 1.35% | f | 1.35% | ||||||||||||||
Net investment income | 1.77% | 0.79% | 1.74% | c | 1.24% | 1.41% | 1.37% | |||||||||||||||||
| Supplemental data | ||||||||||||||||||||||||
Net assets, end of period (000’s) | $168,511 | $183,532 | $193,707 | $287,473 | $333,554 | $328,825 | ||||||||||||||||||
Portfolio turnover rate | 11.56% | 22.18% | 28.53% | h | 23.35% | 16.67% | 21.29% | |||||||||||||||||
aThe amount shown for a share outstanding throughout the period may not correlate with the Statement of Operations for the period due to the timing of sales and repurchases of the Fund’s shares in relation to income earned and/or fluctuating fair value of the investments of the Fund.
bBased on average daily shares outstanding.
cNet investment income per share includes approximately $0.06 per share related to income received in the form of special dividends in connection with certain Fund holdings. Excluding this amount, the ratio of net investment income to average net assets would have been 1.34%.
dTotal return does not include fees, charges or expenses imposed by the variable annuity and life insurance contracts for which Franklin Templeton Variable Insurance Products Trust serves as an underlying investment vehicle. Total return is not annualized for periods less than one year.
eRatios are annualized for periods less than one year.
fBenefit of expense reduction rounds to less than 0.01%.
gBenefit of waiver and payments by affiliates rounds to less than 0.01%.
hExcludes the value of portfolio securities delivered as a result of a redemption in-kind.
| FGR-8 | Semiannual Report | The accompanying notes are an integral part of these financial statements. | |||
FRANKLIN TEMPLETON VARIABLE INSURANCE PRODUCTS TRUST
Statement of Investments, June 30, 2018 (unaudited)
Franklin Global Real Estate VIP Fund
| Country | Shares | Value | ||||||||
| ||||||||||
Common Stocks 99.3% | ||||||||||
Diversified Real Estate Activities 11.4% | ||||||||||
CapitaLand Ltd. | Singapore | 698,695 | $ | 1,620,519 | ||||||
City Developments Ltd. | Singapore | 209,947 | 1,684,261 | |||||||
Mitsubishi Estate Co. Ltd. | Japan | 194,656 | 3,406,194 | |||||||
Mitsui Fudosan Co. Ltd. | Japan | 186,978 | 4,516,728 | |||||||
New World Development Co. Ltd. | Hong Kong | 1,528,585 | 2,150,837 | |||||||
Nomura Real Estate Holdings Inc. | Japan | 58,200 | 1,292,340 | |||||||
Sun Hung Kai Properties Ltd. | Hong Kong | 199,171 | 3,005,569 | |||||||
Tokyo Tatemono Co. Ltd. | Japan | 117,732 | 1,617,692 | |||||||
|
| |||||||||
| 19,294,140 | ||||||||||
|
| |||||||||
Diversified REITs 8.8% | ||||||||||
Activia Properties Inc. | Japan | 323 | 1,482,307 | |||||||
Gecina SA | France | 14,139 | 2,367,216 | |||||||
GPT Group | Australia | 386,146 | 1,446,178 | |||||||
Hispania Activos Inmobiliarios SOCIMI SA | Spain | 98,547 | 2,098,955 | |||||||
Hulic REIT Inc. | Japan | 738 | 1,144,052 | |||||||
Kenedix Office Investment Corp. | Japan | 258 | 1,603,541 | |||||||
Land Securities Group PLC | United Kingdom | 147,276 | 1,861,100 | |||||||
PLA Administradora Industrial S de RL de CV | Mexico | 519,307 | 708,798 | |||||||
Stockland | Australia | 428,648 | 1,259,537 | |||||||
Washington REIT | United States | 27,800 | 843,174 | |||||||
|
| |||||||||
| 14,814,858 | ||||||||||
|
| |||||||||
Health Care REITs 3.8% | ||||||||||
HCP Inc. | United States | 42,489 | 1,097,066 | |||||||
Ventas Inc. | United States | 46,317 | 2,637,753 | |||||||
Welltower Inc. | United States | 42,276 | 2,650,283 | |||||||
|
| |||||||||
| 6,385,102 | ||||||||||
|
| |||||||||
Hotel & Resort REITs 4.7% | ||||||||||
Hoshino Resorts REIT Inc. | Japan | 105 | 545,418 | |||||||
Host Hotels & Resorts Inc. | United States | 140,806 | 2,966,782 | |||||||
LaSalle Hotel Properties | United States | 14,100 | 482,643 | |||||||
MGM Growth Properties LLC, A | United States | 40,200 | 1,224,492 | |||||||
Ryman Hospitality Properties Inc. | United States | 16,700 | 1,388,605 | |||||||
Sunstone Hotel Investors Inc. | United States | 81,409 | 1,353,018 | |||||||
|
| |||||||||
| 7,960,958 | ||||||||||
|
| |||||||||
Hotels, Resorts & Cruise Lines 0.7% | ||||||||||
Hilton Worldwide Holdings Inc. | United States | 15,214 | 1,204,340 | |||||||
|
| |||||||||
Industrial REITs 11.7% | ||||||||||
First Industrial Realty Trust Inc. | United States | 71,453 | 2,382,243 | |||||||
Frasers Logistics & Industrial Trust | Singapore | 646,696 | 498,389 | |||||||
GLP J-REIT | Japan | 1,140 | 1,211,112 | |||||||
Goodman Group | Australia | 366,890 | 2,612,346 | |||||||
Mapletree Logistics Trust | Singapore | 1,064,771 | 961,260 | |||||||
Nippon Prologis REIT Inc. | Japan | 581 | 1,206,141 | |||||||
Prologis Inc. | United States | 88,369 | 5,804,960 | |||||||
Rexford Industrial Realty Inc. | United States | 58,874 | 1,848,055 | |||||||
Segro PLC | United Kingdom | 379,087 | 3,351,165 | |||||||
|
| |||||||||
| 19,875,671 | ||||||||||
|
| |||||||||
Internet Software & Services 0.0%† | ||||||||||
a OneMarket Ltd. | Australia | 6,682 | 6,330 | |||||||
|
| |||||||||
| Semiannual Report | FGR-9 | |||||
FRANKLIN TEMPLETON VARIABLE INSURANCE PRODUCTS TRUST
STATEMENT OF INVESTMENTS (UNAUDITED)
Franklin Global Real Estate VIP Fund (continued)
| Country | Shares | Value | ||||||||
| ||||||||||
Common Stocks (continued) | ||||||||||
Office REITs 10.5% | ||||||||||
Alexandria Real Estate Equities Inc. | United States | 22,421 | $ | 2,828,857 | ||||||
Boston Properties Inc. | United States | 22,685 | 2,845,153 | |||||||
Brandywine Realty Trust | United States | 80,695 | 1,362,132 | |||||||
Cousins Properties Inc. | United States | 133,400 | 1,292,646 | |||||||
Derwent London PLC | United Kingdom | 43,632 | 1,789,690 | |||||||
Dexus | Australia | 269,428 | 1,936,340 | |||||||
Highwoods Properties Inc. | United States | 24,710 | 1,253,538 | |||||||
Kilroy Realty Corp. | United States | 28,044 | 2,121,248 | |||||||
SL Green Realty Corp. | United States | 18,722 | 1,882,123 | |||||||
Vornado Realty Trust | United States | 6,927 | 512,044 | |||||||
|
| |||||||||
| 17,823,771 | ||||||||||
|
| |||||||||
Real Estate Development 2.7% | ||||||||||
CK Asset Holdings Ltd. | Hong Kong | 467,127 | 3,709,129 | |||||||
a Howard Hughes Corp. | United States | 6,940 | 919,550 | |||||||
|
| |||||||||
| 4,628,679 | ||||||||||
|
| |||||||||
Real Estate Operating Companies 10.0% | ||||||||||
ADO Properties SA | Germany | 12,284 | 668,230 | |||||||
b ADO Properties SA, 144A | Germany | 28,207 | 1,534,415 | |||||||
Aroundtown SA | Germany | 189,509 | 1,557,639 | |||||||
Deutsche Wohnen SE | Germany | 86,847 | 4,200,763 | |||||||
Fabege AB | Sweden | 132,326 | 1,579,853 | |||||||
First Capital Realty Inc. | Canada | 51,064 | 802,756 | |||||||
Hemfosa Fastigheter AB | Sweden | 108,525 | 1,270,475 | |||||||
Hufvudstaden AB, A | Sweden | 71,187 | 1,020,240 | |||||||
Hysan Development Co. Ltd. | Hong Kong | 234,065 | 1,306,651 | |||||||
Swire Properties Ltd. | Hong Kong | 313,400 | 1,158,366 | |||||||
Vonovia SE | Germany | 37,903 | 1,805,015 | |||||||
|
| |||||||||
| 16,904,403 | ||||||||||
|
| |||||||||
Residential REITs 10.7% | ||||||||||
AvalonBay Communities Inc. | United States | 22,089 | 3,796,878 | |||||||
Camden Property Trust | United States | 28,300 | 2,578,979 | |||||||
Canadian Apartment Properties REIT | Canada | 59,175 | 1,919,518 | |||||||
Equity Lifestyle Properties Inc. | United States | 24,458 | 2,247,690 | |||||||
Equity Residential | United States | 65,233 | 4,154,690 | |||||||
Essex Property Trust Inc. | United States | 6,052 | 1,446,852 | |||||||
Unite Group PLC | United Kingdom | 173,675 | 1,974,748 | |||||||
|
| |||||||||
| 18,119,355 | ||||||||||
|
| |||||||||
Retail REITs 15.5% | ||||||||||
Agree Realty Corp. | United States | 22,421 | 1,183,156 | |||||||
CapitaLand Mall Trust | Singapore | 601,200 | 913,416 | |||||||
GGP Inc. | United States | 46,174 | 943,335 | |||||||
Link REIT | Hong Kong | 163,837 | 1,496,157 | |||||||
The Macerich Co. | United States | 11,900 | 676,277 | |||||||
Realty Income Corp. | United States | 45,617 | 2,453,738 | |||||||
Regency Centers Corp. | United States | 35,139 | 2,181,429 | |||||||
Retail Properties of America Inc., A | United States | 111,300 | 1,422,414 | |||||||
Scentre Group | Australia | 438,780 | 1,425,710 | |||||||
Simon Property Group Inc. | United States | 41,826 | 7,118,367 | |||||||
SmartCentres REIT | Canada | 36,530 | 848,623 | |||||||
Taubman Centers Inc. | United States | 9,300 | 546,468 | |||||||
| FGR-10 | Semiannual Report | |||
FRANKLIN TEMPLETON VARIABLE INSURANCE PRODUCTS TRUST
STATEMENT OF INVESTMENTS (UNAUDITED)
Franklin Global Real Estate VIP Fund (continued)
| Country | Shares | Value | ||||||||
| ||||||||||
Common Stocks (continued) | ||||||||||
Retail REITs (continued) | ||||||||||
a Unibail-Rodamco-Westfield | Netherlands | 15,515 | $ | 3,417,837 | ||||||
a Unibail-Rodamco-Westfield, IDR | France | 49,174 | 533,931 | |||||||
Weingarten Realty Investors | United States | 37,029 | 1,140,864 | |||||||
|
| |||||||||
| 26,301,722 | ||||||||||
|
| |||||||||
Specialized REITs 8.8% | ||||||||||
American Tower Corp. | United States | 12,200 | 1,758,874 | |||||||
Coresite Realty Corp. | United States | 14,669 | 1,625,619 | |||||||
CubeSmart | United States | 47,393 | 1,527,002 | |||||||
Digital Realty Trust Inc. | United States | 33,068 | 3,689,727 | |||||||
Extra Space Storage Inc. | United States | 22,700 | 2,265,687 | |||||||
Iron Mountain Inc. | United States | 22,600 | 791,226 | |||||||
Public Storage | United States | 9,544 | 2,165,152 | |||||||
Weyerhaeuser Co. | United States | 28,800 | 1,050,048 | |||||||
|
| |||||||||
| 14,873,335 | ||||||||||
|
| |||||||||
Total Common Stocks (Cost $111,896,089) | 168,192,664 | |||||||||
|
| |||||||||
| Principal Amount | ||||||||||
Short Term Investments (Cost $740,517) 0.4% | ||||||||||
Repurchase Agreements 0.4% | ||||||||||
c Joint Repurchase Agreement, 2.10%, 7/02/18 (Maturity Value $740,646) | ||||||||||
BNP Paribas Securities Corp. (Maturity Value $265,788) Deutsche Bank Securities Inc. (Maturity Value $9,725) HSBC Securities (USA) Inc. (Maturity Value $465,133) | ||||||||||
Collateralized by U.S. Government Agency Securities, 0.00% - 3.625%, 9/18/18 -6/19/23; d U.S. Treasury Bill, 10/04/18 - 10/18/18; and U.S. Treasury Note, 2.00% -3.50%, 5/15/20 - 8/31/21 (valued at $755,748) | United States | $ | 740,517 | 740,517 | ||||||
|
| |||||||||
Total Investments (Cost $112,636,606) 99.7% | 168,933,181 | |||||||||
Other Assets, less Liabilities 0.3% | 523,552 | |||||||||
|
| |||||||||
Net Assets 100.0% | $ | 169,456,733 | ||||||||
|
| |||||||||
See Abbreviations on page FGR-21.
†Rounds to less than 0.1% of net assets.
aNon-income producing.
bSecurity was purchased pursuant to Rule 144A under the Securities Act of 1933 and may be sold in transactions exempt from registration only to qualified institutional buyers or in a public offering registered under the Securities Act of 1933. This security has been deemed liquid under guidelines approved by the Trust’s Board of Trustees. At June 30, 2018, the value of this security was $1,534,415, representing 0.9% of net assets.
cSee Note 1(c) regarding joint repurchase agreement.
dThe security was issued on a discount basis with no stated coupon rate.
| The accompanying notes are an integral part of these financial statements. | Semiannual Report | FGR-11 | |||
FRANKLIN TEMPLETON VARIABLE INSURANCE PRODUCTS TRUST
Financial Statements
Statement of Assets and Liabilities
June 30, 2018 (unaudited)
Franklin Global Real Estate VIP Fund | ||||
Assets: | ||||
Investments in securities: | ||||
Cost - Unaffiliated issuers | $111,896,089 | |||
Cost - Unaffiliated repurchase agreements | 740,517 | |||
|
| |||
Value - Unaffiliated issuers | $168,192,664 | |||
Value - Unaffiliated repurchase agreements | 740,517 | |||
Receivables: | ||||
Investment securities sold | 592,008 | |||
Capital shares sold | 2,402 | |||
Dividends | 902,447 | |||
European Union tax reclaims | 112,807 | |||
Other assets | 117 | |||
|
| |||
Total assets | 170,542,962 | |||
|
| |||
Liabilities: | ||||
Payables: | ||||
Investment securities purchased | 579,118 | |||
Capital shares redeemed | 214,488 | |||
Management fees | 146,497 | |||
Distribution fees | 70,638 | |||
Accrued expenses and other liabilities | 75,488 | |||
|
| |||
Total liabilities | 1,086,229 | |||
|
| |||
Net assets, at value | $169,456,733 | |||
|
| |||
Net assets consist of: | ||||
Paid-in capital | $117,258,687 | |||
Distributions in excess of net investment income | (3,152,694 | ) | ||
Net unrealized appreciation (depreciation) | 56,288,725 | |||
Accumulated net realized gain (loss) | (937,985 | ) | ||
|
| |||
Net assets, at value | $169,456,733 | |||
|
| |||
Class 1: | ||||
Net assets, at value | $ 945,281 | |||
|
| |||
Shares outstanding | 57,379 | |||
|
| |||
Net asset value and maximum offering price per share | $16.47 | |||
|
| |||
Class 2: | ||||
Net assets, at value | $168,511,452 | |||
|
| |||
Shares outstanding | 10,491,155 | |||
|
| |||
Net asset value and maximum offering price per share | $16.06 | |||
|
| |||
| FGR-12 | Semiannual Report | The accompanying notes are an integral part of these financial statements. | |||
FRANKLIN TEMPLETON VARIABLE INSURANCE PRODUCTS TRUST
FINANCIAL STATEMENTS
Statement of Operations
for the six months ended June 30, 2018 (unaudited)
Franklin Global Real Estate VIP Fund | ||||
| ||||
Investment income: | ||||
Dividends: (net of foreign taxes)* | ||||
Unaffiliated issuers | $ 2,699,513 | |||
Interest: | ||||
Unaffiliated issuers | 3,693 | |||
|
| |||
Total investment income | 2,703,206 | |||
|
| |||
Expenses: | ||||
Management fees (Note 3a) | 899,082 | |||
Distribution fees: (Note 3c) | ||||
Class 2 | 212,891 | |||
Custodian fees (Note 4) | 6,682 | |||
Reports to shareholders | 26,583 | |||
Professional fees | 37,844 | |||
Trustees’ fees and expenses | 469 | |||
Other | 5,873 | |||
|
| |||
Total expenses | 1,189,424 | |||
Expense reductions (Note 4) | (11 | ) | ||
|
| |||
Net expenses | 1,189,413 | |||
|
| |||
Net investment income | 1,513,793 | |||
|
| |||
Realized and unrealized gains (losses): | ||||
Net realized gain (loss) from: | ||||
Investments: | ||||
Unaffiliated issuers | 4,763,654 | |||
Realized gain distributions from REITs | 544,298 | |||
Foreign currency transactions | (2,716 | ) | ||
|
| |||
Net realized gain (loss) | 5,305,236 | |||
|
| |||
Net change in unrealized appreciation (depreciation) on: | ||||
Investments: | ||||
Unaffiliated issuers | (7,438,717 | ) | ||
Translation of other assets and liabilities denominated in foreign currencies | (11,805 | ) | ||
|
| |||
Net change in unrealized appreciation (depreciation) | (7,450,522 | ) | ||
|
| |||
Net realized and unrealized gain (loss) | (2,145,286 | ) | ||
|
| |||
Net increase (decrease) in net assets resulting from operations | $ (631,493 | ) | ||
|
| |||
*Foreign taxes withheld on dividends | $ 164,521 | |||
| The accompanying notes are an integral part of these financial statements. | Semiannual Report | FGR-13 | |||||
FRANKLIN TEMPLETON VARIABLE INSURANCE PRODUCTS TRUST
FINANCIAL STATEMENTS
Statements of Changes in Net Assets
| Franklin Global Real Estate VIP Fund | ||||||||
Six Months Ended June 30, 2018 (unaudited) | Year Ended December 31, 2017 | |||||||
| ||||||||
Increase (decrease) in net assets: | ||||||||
Operations: | ||||||||
Net investment income | $ 1,513,793 | $ 1,509,596 | ||||||
Net realized gain (loss) | 5,305,236 | 11,105,782 | ||||||
Net change in unrealized appreciation (depreciation) | (7,450,522 | ) | 6,230,763 | |||||
|
| |||||||
Net increase (decrease) in net assets resulting from operations | (631,493 | ) | 18,846,141 | |||||
|
| |||||||
Distributions to shareholders from: | ||||||||
Net investment income: | ||||||||
Class 1 | (26,319 | ) | (26,726 | ) | ||||
Class 2 | (4,381,023 | ) | (5,862,949 | ) | ||||
|
| |||||||
Total distributions to shareholders | (4,407,342 | ) | (5,889,675 | ) | ||||
|
| |||||||
Capital share transactions: (Note 2) | ||||||||
Class 1 | 152,841 | (57,079 | ) | |||||
Class 2 | (10,008,706 | ) | (23,075,937 | ) | ||||
|
| |||||||
Total capital share transactions | (9,855,865 | ) | (23,133,016 | ) | ||||
|
| |||||||
Net increase (decrease) in net assets | (14,894,700 | ) | (10,176,550 | ) | ||||
Net assets: | ||||||||
Beginning of period | 184,351,433 | 194,527,983 | ||||||
|
| |||||||
End of period | $169,456,733 | $184,351,433 | ||||||
|
| |||||||
Distributions in excess of net investment income included in net assets: | ||||||||
End of period | $ (3,152,694 | ) | $ (259,145 | ) | ||||
|
| |||||||
| FGR-14 | Semiannual Report | The accompanying notes are an integral part of these financial statements. | |||
FRANKLIN TEMPLETON VARIABLE INSURANCE PRODUCTS TRUST
Notes to Financial Statements (unaudited)
Franklin Global Real Estate VIP Fund
1. Organization and Significant Accounting Policies
Franklin Templeton Variable Insurance Products Trust (Trust) is registered under the Investment Company Act of 1940 (1940 Act) as an open-end management investment company, consisting of eighteen separate funds and applies the specialized accounting and reporting guidance in U.S. Generally Accepted Accounting Principles (U.S. GAAP). Franklin Global Real Estate VIP Fund (Fund) is included in this report. Shares of the Fund are generally sold only to insurance company separate accounts to fund the benefits of variable life insurance policies or variable annuity contracts. At June 30, 2018, 84.4% of the Fund’s shares were held through one insurance company. Investment activities of these insurance company separate accounts could have a material impact on the Fund. The Fund offers two classes of shares: Class 1 and Class 2. Each class of shares may differ by its distribution fees, voting rights on matters affecting a single class and its exchange privilege.
The following summarizes the Fund’s significant accounting policies.
a. Financial Instrument Valuation
The Fund’s investments in financial instruments are carried at fair value daily. Fair value is the price that would be received to sell an asset or paid to transfer a liability in an orderly transaction between market participants on the measurement date. The Fund calculates the net asset value (NAV) per share each business day as of 4 p.m. Eastern time or the regularly scheduled close of the New York Stock Exchange (NYSE), whichever is earlier. Under compliance policies and procedures approved by the Trust’s Board of Trustees (the Board), the Fund’s administrator has responsibility for oversight of valuation, including leading the cross-functional Valuation Committee (VC). The VC provides administration and oversight of the Fund’s valuation policies and procedures, which are approved annually by the Board. Among other things, these procedures allow the Fund to utilize independent pricing services, quotations from securities and financial instrument dealers, and other market sources to determine fair value.
Equity securities listed on an exchange or on the NASDAQ National Market System are valued at the last quoted sale price or the official closing price of the day, respectively. Foreign equity securities are valued as of the close of trading on the foreign stock exchange on which the security is primarily traded, or as of 4 p.m. Eastern time. The value is then converted
into its U.S. dollar equivalent at the foreign exchange rate in effect at 4 p.m. Eastern time on the day that the value of the security is determined. Over-the-counter (OTC) securities are valued within the range of the most recent quoted bid and ask prices. Securities that trade in multiple markets or on multiple exchanges are valued according to the broadest and most representative market. Certain equity securities are valued based upon fundamental characteristics or relationships to similar securities.
Investments in repurchase agreements are valued at cost, which approximates fair value.
The Fund has procedures to determine the fair value of financial instruments for which market prices are not reliable or readily available. Under these procedures, the VC convenes on a regular basis to review such financial instruments and considers a number of factors, including significant unobservable valuation inputs, when arriving at fair value. The VC primarily employs a market-based approach which may use related or comparable assets or liabilities, recent transactions, market multiples, book values, and other relevant information for the investment to determine the fair value of the investment. An income-based valuation approach may also be used in which the anticipated future cash flows of the investment are discounted to calculate fair value. Discounts may also be applied due to the nature or duration of any restrictions on the disposition of the investments. Due to the inherent uncertainty of valuations of such investments, the fair values may differ significantly from the values that would have been used had an active market existed. The VC employs various methods for calibrating these valuation approaches including a regular review of key inputs and assumptions, transactional back-testing or disposition analysis, and reviews of any related market activity.
Trading in securities on foreign securities stock exchanges and OTC markets may be completed before 4 p.m. Eastern time. In addition, trading in certain foreign markets may not take place on every Fund’s business day. Occasionally, events occur between the time at which trading in a foreign security is completed and 4 p.m. Eastern time that might call into question the reliability of the value of a portfolio security held by the Fund. As a result, differences may arise between the value of the Fund’s portfolio securities as determined at the foreign market close and the latest indications of value at 4 p.m. Eastern time. In order to minimize the potential for these differences, the VC monitors price movements following the close of trading in foreign stock markets through a series of country
| Semiannual Report | FGR-15 | |||
FRANKLIN TEMPLETON VARIABLE INSURANCE PRODUCTS TRUST
NOTES TO FINANCIAL STATEMENTS (UNAUDITED)
Franklin Global Real Estate VIP Fund (continued)
1. Organization and Significant Accounting
Policies (continued)
a. Financial Instrument Valuation (continued)
specific market proxies (such as baskets of American Depositary Receipts, futures contracts and exchange traded funds). These price movements are measured against established trigger thresholds for each specific market proxy to assist in determining if an event has occurred that may call into question the reliability of the values of the foreign securities held by the Fund. If such an event occurs, the securities may be valued using fair value procedures, which may include the use of independent pricing services.
When the last day of the reporting period is a non-business day, certain foreign markets may be open on those days that the Fund’s NAV is not calculated, which could result in differences between the value of the Fund’s portfolio securities on the last business day and the last calendar day of the reporting period. Any significant security valuation changes due to an open foreign market are adjusted and reflected by the Fund for financial reporting purposes.
b. Foreign Currency Translation
Portfolio securities and other assets and liabilities denominated in foreign currencies are translated into U.S. dollars based on the exchange rate of such currencies against U.S. dollars on the date of valuation. The Fund may enter into foreign currency exchange contracts to facilitate transactions denominated in a foreign currency. Purchases and sales of securities, income and expense items denominated in foreign currencies are translated into U.S. dollars at the exchange rate in effect on the transaction date. Portfolio securities and assets and liabilities denominated in foreign currencies contain risks that those currencies will decline in value relative to the U.S. dollar. Occasionally, events may impact the availability or reliability of foreign exchange rates used to convert the U.S. dollar equivalent value. If such an event occurs, the foreign exchange rate will be valued at fair value using procedures established and approved by the Board.
The Fund does not separately report the effect of changes in foreign exchange rates from changes in market prices on securities held. Such changes are included in net realized and unrealized gain or loss from investments in the Statement of Operations.
Realized foreign exchange gains or losses arise from sales of foreign currencies, currency gains or losses realized between the trade and settlement dates on securities transactions and the difference between the recorded amounts of dividends, interest, and foreign withholding taxes and the U.S. dollar equivalent of the amounts actually received or paid. Net unrealized foreign exchange gains and losses arise from changes in foreign exchange rates on foreign denominated assets and liabilities other than investments in securities held at the end of the reporting period.
c. Joint Repurchase Agreement
The Fund enters into a joint repurchase agreement whereby its uninvested cash balance is deposited into a joint cash account with other funds managed by the investment manager or an affiliate of the investment manager and is used to invest in one or more repurchase agreements. The value and face amount of the joint repurchase agreement are allocated to the funds based on their pro-rata interest. A repurchase agreement is accounted for as a loan by the Fund to the seller, collateralized by securities which are delivered to the Fund’s custodian. The fair value, including accrued interest, of the initial collateralization is required to be at least 102% of the dollar amount invested by the funds, with the value of the underlying securities marked to market daily to maintain coverage of at least 100%. Repurchase agreements are subject to the terms of Master Repurchase Agreements (MRAs) with approved counterparties (sellers). The MRAs contain various provisions, including but not limited to events of default and maintenance of collateral for repurchase agreements. In the event of default by either the seller or the Fund, certain MRAs may permit the non-defaulting party to net and close-out all transactions, if any, traded under such agreements. The Fund may sell securities it holds as collateral and apply the proceeds towards the repurchase price and any other amounts owed by the seller to the Fund in the event of default by the seller. This could involve costs or delays in addition to a loss on the securities if their value falls below the repurchase price owed by the seller. The joint repurchase agreement held by the Fund at period end, as indicated in the Statement of Investments, had been entered into on June 29, 2018.
d. Securities Lending
The Fund participates in an agency based securities lending program to earn additional income. The Fund receives cash collateral against the loaned securities in an amount equal to at
| FGR-16 | Semiannual Report | |||
FRANKLIN TEMPLETON VARIABLE INSURANCE PRODUCTS TRUST
NOTES TO FINANCIAL STATEMENTS (UNAUDITED)
Franklin Global Real Estate VIP Fund (continued)
least 102% of the fair value of the loaned securities. Collateral is maintained over the life of the loan in an amount not less than 100% of the fair value of loaned securities, as determined at the close of Fund business each day; any additional collateral required due to changes in security values is delivered to the Fund on the next business day. The collateral is deposited into a joint cash account with other funds and is used to invest in a money market fund managed by Franklin Advisers, Inc., an affiliate of the Fund. The Fund may receive income from the investment of cash collateral, in addition to lending fees and rebates paid by the borrower. Income from securities loaned, net of fees paid to the securities lending agent and/or third-party vendor, is reported separately in the Statement of Operations. The Fund bears the market risk with respect to the collateral investment, securities loaned, and the risk that the agent may default on its obligations to the Fund. If the borrower defaults on its obligation to return the securities loaned, the Fund has the right to repurchase the securities in the open market using the collateral received. The securities lending agent has agreed to indemnify the Fund in the event of default by a third party borrower. At June 30, 2018, the Fund had no securities on loan.
e. Income and Deferred Taxes
It is the Fund’s policy to qualify as a regulated investment company under the Internal Revenue Code. The Fund intends to distribute to shareholders substantially all of its taxable income and net realized gains to relieve it from federal income and if applicable, excise taxes. As a result, no provision for U.S. federal income taxes is required.
The Fund may be subject to foreign taxation related to income received, capital gains on the sale of securities and certain foreign currency transactions in the foreign jurisdictions in which it invests. Foreign taxes, if any, are recorded based on the tax regulations and rates that exist in the foreign markets in which the Fund invests. When a capital gain tax is determined to apply, the Fund records an estimated deferred tax liability in an amount that would be payable if the securities were disposed of on the valuation date.
As a result of several court cases, in certain countries across the European Union, the Fund filed additional tax reclaims for previously withheld taxes on dividends earned in those countries (EU reclaims). These additional filings are subject to various administrative proceedings by the local jurisdictions’ tax authorities within the European Union, as well as a number of related judicial proceedings. Income recognized, if any, for
EU reclaims is reflected as other income in the Statement of Operations and any related receivable, if any, is reflected as European Union tax reclaims in the Statement of Assets and Liabilities. When uncertainty exists as to the ultimate resolution of these proceedings, the likelihood of receipt of these EU reclaims, and the potential timing of payment, no amounts are reflected in the financial statements. For U.S. income tax purposes, when EU reclaims are received by the Fund and the Fund previously passed foreign tax credit on to its shareholders, the Fund must either amend historic tax reporting to shareholders or enter into a closing agreement with the Internal Revenue Service (IRS) in order to pay the associated tax liability on behalf of the Fund’s shareholders.
The Fund may recognize an income tax liability related to its uncertain tax positions under U.S. GAAP when the uncertain tax position has a less than 50% probability that it will be sustained upon examination by the tax authorities based on its technical merits. As of June 30, 2018, the Fund has determined that no tax liability is required in its financial statements related to uncertain tax positions for any open tax years (or expected to be taken in future tax years). Open tax years are those that remain subject to examination and are based on the statute of limitations in each jurisdiction in which the Fund invests.
f. Security Transactions, Investment Income, Expenses and Distributions
Security transactions are accounted for on trade date. Realized gains and losses on security transactions are determined on a specific identification basis. Interest income and estimated expenses are accrued daily. Dividend income and realized gain distributions are recorded on the ex-dividend date except for certain dividends from securities where the dividend rate is not available. In such cases, the dividend is recorded as soon as the information is received by the Fund. Distributions to shareholders are recorded on the ex-dividend date. Distributable earnings are determined according to income tax regulations (tax basis) and may differ from earnings recorded in accordance with U.S. GAAP. These differences may be permanent or temporary. Permanent differences are reclassified among capital accounts to reflect their tax character. These reclassifications have no impact on net assets or the results of operations. Temporary differences are not reclassified, as they may reverse in subsequent periods.
| Semiannual Report | FGR-17 | |||
FRANKLIN TEMPLETON VARIABLE INSURANCE PRODUCTS TRUST
NOTES TO FINANCIAL STATEMENTS (UNAUDITED)
Franklin Global Real Estate VIP Fund (continued)
1. Organization and Significant Accounting
Policies (continued)
f. Security Transactions, Investment Income, Expenses and Distributions (continued)
Common expenses incurred by the Trust are allocated among the Funds based on the ratio of net assets of each Fund to the combined net assets of the Trust or based on the ratio of number of shareholders of each Fund to the combined number of shareholders of the Trust. Fund specific expenses are charged directly to the Fund that incurred the expense.
Realized and unrealized gains and losses and net investment income, excluding class specific expenses, are allocated daily to each class of shares based upon the relative proportion of net assets of each class. Differences in per share distributions by class are generally due to differences in class specific expenses.
Distributions received by the Fund from certain securities may be a return of capital (ROC). Such distributions reduce the cost basis of the securities, and any distributions in excess of the cost basis are recognized as capital gains. For U.S. Real Estate Investment Trust (REIT) securities, the Fund records ROC estimates, if any, on the ex-dividend date and are adjusted once actual tax designations are known.
g. Accounting Estimates
The preparation of financial statements in accordance with U.S. GAAP requires management to make estimates and assumptions that affect the reported amounts of assets and liabilities at the date of the financial statements and the amounts of income and expenses during the reporting period. Actual results could differ from those estimates.
h. Guarantees and Indemnifications
Under the Trust’s organizational documents, its officers and trustees are indemnified by the Trust against certain liabilities arising out of the performance of their duties to the Trust. Additionally, in the normal course of business, the Trust, on behalf of the Fund, enters into contracts with service providers that contain general indemnification clauses. The Trust’s maximum exposure under these arrangements is unknown as this would involve future claims that may be made against the Trust that have not yet occurred. Currently, the Trust expects the risk of loss to be remote.
2. Shares of Beneficial Interest
At June 30, 2018, there were an unlimited number of shares authorized (without par value). Transactions in the Fund’s shares were as follows:
Six Months Ended June 30, 2018 | Year Ended December 31, 2017 | |||||||||||||||||||
|
| |||||||||||||||||||
| Shares | Amount | Shares | Amount | |||||||||||||||||
| ||||||||||||||||||||
| Class 1 Shares: | ||||||||||||||||||||
Shares sold. | 8,928 | $ | 150,452 | 1,644 | $ | 26,478 | ||||||||||||||
Shares issued in reinvestment of distributions | 1,610 | 26,319 | 1,626 | 26,726 | ||||||||||||||||
Shares redeemed | (1,473 | ) | (23,930 | ) | (6,836 | ) | (110,283) | |||||||||||||
|
| |||||||||||||||||||
Net increase (decrease) | 9,065 | $ | 152,841 | (3,566 | ) | $ | (57,079) | |||||||||||||
|
| |||||||||||||||||||
| Class 2 Shares: | ||||||||||||||||||||
Shares sold. | 86,384 | $ | 1,370,829 | 147,438 | $ | 2,348,274 | ||||||||||||||
Shares issued in reinvestment of distributions | 274,844 | 4,381,023 | 365,520 | 5,862,949 | ||||||||||||||||
Shares redeemed | (981,742 | ) | (15,760,558 | ) | (1,961,819 | ) | (31,287,160) | |||||||||||||
|
| |||||||||||||||||||
Net increase (decrease) | (620,514 | ) | $ | (10,008,706 | ) | (1,448,861 | ) | $ | (23,075,937) | |||||||||||
|
| |||||||||||||||||||
| FGR-18 | Semiannual Report | |||
FRANKLIN TEMPLETON VARIABLE INSURANCE PRODUCTS TRUST
NOTES TO FINANCIAL STATEMENTS (UNAUDITED)
Franklin Global Real Estate VIP Fund (continued)
3. Transactions with Affiliates
Franklin Resources, Inc. is the holding company for various subsidiaries that together are referred to as Franklin Templeton Investments. Certain officers and trustees of the Fund are also officers and/or directors of the following subsidiaries:
| Subsidiary | Affiliation | |
Franklin Templeton Institutional, LLC (FT Institutional) | Investment manager | |
Franklin Templeton Services, LLC (FT Services) | Administrative manager | |
Franklin Templeton Distributors, Inc. (Distributors) | Principal underwriter | |
Franklin Templeton Investor Services, LLC (Investor Services) | Transfer agent |
a. Management Fees
The Fund pays an investment management fee to FT Institutional based on the average daily net assets of the Fund as follows:
| Annualized Fee Rate | Net Assets | |
1.050% | Up to and including $500 million | |
0.950% | Over $500 million, up to and including $1 billion | |
0.900% | Over $1 billion, up to and including $1.5 billion | |
0.850% | Over $1.5 billion, up to and including $6.5 billion | |
0.830% | Over $6.5 billion, up to and including $11.5 billion | |
0.810% | Over $11.5 billion, up to and including $16.5 billion | |
0.790% | Over $16.5 billion, up to and including $19 billion | |
0.780% | Over $19 billion, up to and including $21.5 billion | |
0.770% | In excess of $21.5 billion |
For the period ended June 30, 2018, the annualized gross effective investment management fee rate was 1.050% of the Fund’s average daily net assets.
b. Administrative Fees
Under an agreement with FT Institutional, FT Services provides administrative services to the Fund. The fee is paid by FT Institutional based on the Fund’s average daily net assets, and is not an additional expense of the Fund.
c. Distribution Fees
The Board has adopted a distribution plan for Class 2 shares pursuant to Rule 12b-1 under the 1940 Act. Under the Fund’s compensation distribution plan, the Fund pays Distributors for costs incurred in connection with the servicing, sale and distribution of the Fund’s shares up to 0.35% per year of its average daily net assets. The Board has agreed to limit the current rate to 0.25% per year for Class 2. The plan year, for purposes of monitoring compliance with the maximum annual plan rates, is February 1 through January 31.
d. Transfer Agent Fees
Investor Services, under terms of an agreement, performs shareholder servicing for the Fund and is not paid by the Fund for the services.
| Semiannual Report | FGR-19 | |||||
FRANKLIN TEMPLETON VARIABLE INSURANCE PRODUCTS TRUST
NOTES TO FINANCIAL STATEMENTS (UNAUDITED)
Franklin Global Real Estate VIP Fund (continued)
4. Expense Offset Arrangement
The Fund has entered into an arrangement with its custodian whereby credits realized as a result of uninvested cash balances are used to reduce a portion of the Fund’s custodian expenses. During the period ended June 30, 2018, the custodian fees were reduced as noted in the Statement of Operations.
5. Income Taxes
For tax purposes, capital losses may be carried over to offset future capital gains. Capital loss carryforwards with no expiration, if any, must be fully utilized before those losses with expiration dates.
At December 31, 2017, the Fund had capital loss carryforwards of $2,192,369 expiring in 2018.
At June 30, 2018, the cost of investments and net unrealized appreciation (depreciation) for income tax purposes were as follows:
Cost of investments | $ | 121,992,229 | ||
|
| |||
Unrealized appreciation | $ | 58,276,252 | ||
Unrealized depreciation | (11,335,300 | ) | ||
|
| |||
Net unrealized appreciation (depreciation) | $ | 46,940,952 | ||
|
| |||
Differences between income and/or capital gains as determined on a book basis and a tax basis are primarily due to differing treatment of passive foreign investment company shares.
6. Investment Transactions
Purchases and sales of investments (excluding short term securities) for the period ended June 30, 2018, aggregated $20,009,698 and $31,864,313, respectively.
7. Concentration of Risk
Investing in foreign securities may include certain risks and considerations not typically associated with investing in U.S. securities, such as fluctuating currency values and changing local and regional economic, political and social conditions, which may result in greater market volatility. In addition, certain foreign securities may not be as liquid as U.S. securities.
The Fund invests a large percentage of its total assets in REIT securities. Such concentration may subject the Fund to special risks associated with real estate securities. These securities may be more sensitive to economic or regulatory developments due to a variety of factors such as local, regional, national and global economic conditions, interest rates and tax considerations.
8. Credit Facility
The Fund, together with other U.S. registered and foreign investment funds (collectively, Borrowers), managed by Franklin Templeton Investments, are borrowers in a joint syndicated senior unsecured credit facility totaling $2 billion (Global Credit Facility) which matures on February 8, 2019. This Global Credit Facility provides a source of funds to the Borrowers for temporary and emergency purposes, including the ability to meet future unanticipated or unusually large redemption requests.
| FGR-20 | Semiannual Report | |||
FRANKLIN TEMPLETON VARIABLE INSURANCE PRODUCTS TRUST
NOTES TO FINANCIAL STATEMENTS (UNAUDITED)
Franklin Global Real Estate VIP Fund (continued)
Under the terms of the Global Credit Facility, the Fund shall, in addition to interest charged on any borrowings made by the Fund and other costs incurred by the Fund, pay its share of fees and expenses incurred in connection with the implementation and maintenance of the Global Credit Facility, based upon its relative share of the aggregate net assets of all of the Borrowers, including an annual commitment fee of 0.15% based upon the unused portion of the Global Credit Facility. These fees are reflected in other expenses in the Statement of Operations. During the period ended June 30, 2018, the Fund did not use the Global Credit Facility.
9. Fair Value Measurements
The Fund follows a fair value hierarchy that distinguishes between market data obtained from independent sources (observable inputs) and the Fund’s own market assumptions (unobservable inputs). These inputs are used in determining the value of the Fund’s financial instruments and are summarized in the following fair value hierarchy:
| • | Level 1 – quoted prices in active markets for identical financial instruments |
| • | Level 2 – other significant observable inputs (including quoted prices for similar financial instruments, interest rates, prepayment speed, credit risk, etc.) |
| • | Level 3 – significant unobservable inputs (including the Fund’s own assumptions in determining the fair value of financial instruments) |
The input levels are not necessarily an indication of the risk or liquidity associated with financial instruments at that level.
For movements between the levels within the fair value hierarchy, the Fund has adopted a policy of recognizing the transfers as of the date of the underlying event which caused the movement.
A summary of inputs used as of June 30, 2018, in valuing the Fund’s assets carried at fair value, is as follows:
| Level 1 | Level 2 | Level 3 | Total | |||||||||||||
| ||||||||||||||||
| Assets: | ||||||||||||||||
Investments in Securities:a | ||||||||||||||||
Equity Investments | $ | 168,192,664 | $ | — | $ | — | $ | 168,192,664 | ||||||||
Short Term Investments | — | 740,517 | — | 740,517 | ||||||||||||
|
| |||||||||||||||
Total Investments in Securities | $ | 168,192,664 | $ | 740,517 | $ | — | $ | 168,933,181 | ||||||||
|
| |||||||||||||||
aFor detailed categories, see the accompanying Statement of Investments.
10. Subsequent Events
The Fund has evaluated subsequent events through the issuance of the financial statements and determined that no events have occurred that require disclosure.
Abbreviations
| Selected Portfolio | ||
| IDR | International Depositary Receipt | |
| REIT | Real Estate Investment Trust | |
| Semiannual Report | FGR-21 | |||||
This page intentionally left blank.
Franklin Growth and Income VIP Fund
This semiannual report for Franklin Growth and Income VIP Fund covers the period ended June 30, 2018.
Class 2 Performance Summary as of June 30, 2018
The Fund’s Class 2 Shares had a -0.44% total return* for the six-month period ended June 30, 2018.
*The Fund has an expense reduction contractually guaranteed through 4/30/19. Fund investment results reflect the expense reduction; without this reduction, the results would have been lower.
Performance reflects the Fund’s Class 2 operating expenses, but does not include any contract fees, expenses or sales charges. If they had been included, performance would be lower. These charges and deductions, particularly for variable life policies, can have a significant effect on contract values and insurance benefits. See the contract prospectus for a complete description of these expenses, including sales charges.
Performance data represent past performance, which does not guarantee future results. Investment return and principal value will fluctuate, and you may have a gain or loss when you sell your shares. Current performance may differ from figures shown.
| Semiannual Report | FGI-1 | |||||
FRANKLIN GROWTH AND INCOME VIP FUND
Fund Goal and Main Investments
The Fund seeks capital appreciation with current income as a secondary goal. Under normal market conditions, the Fund invests predominantly in equity securities, including common stock, preferred stock and securities convertible into common stock.
Fund Risks
All investments involve risks, including possible loss of principal. Stock prices fluctuate, sometimes rapidly and dramatically, due to factors affecting individual companies, particular industries or sectors, or general market conditions. Growth stock prices reflect projections of future earnings or revenues, and can, therefore, fall dramatically if the company fails to meet those projections. Value securities may not increase in price as anticipated or may decline further if other investors fail to recognize the company’s value or favor investing in faster growing companies. Because the Fund can only distribute what it earns, the Fund’s distributions to shareholders may decline when prevailing interest rates fall, when dividend income from investments in stocks decline, or when the Fund experiences defaults on debt securities it holds. To the extent the Fund focuses on particular countries, regions, industries, sectors or types of investment from time to time, it may be subject to greater risks of adverse developments in such areas of focus than a fund that invests in a wider variety of countries, regions, industries, sectors or investments. Special risks are associated with foreign investing, including currency fluctuations, economic instability and political developments; investments in emerging markets involve heightened risks related to the same factors. The Fund is actively managed but there is no guarantee that the manager’s investment decisions will produce the desired results. The Fund’s prospectus also includes a description of the main investment risks.
Performance Overview
You can find the Fund’s six-month total return in the Performance Summary. In comparison, the Fund’s benchmark, the Standard & Poor’s® 500 Index (S&P 500®), produced a +2.65% total return.1 The Fund’s peers, as measured by the Lipper VIP Equity Income Funds Classification Average, had a -1.26% total return for the same period.2
Portfolio Composition
Based on Total Net Assets as of 6/30/18
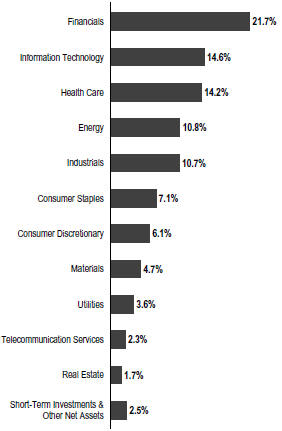
Economic and Market Overview
The US economy continued to grow during the six months under review. After moderating for three consecutive quarters, the economy grew faster in 2018’s second quarter, driven by consumer spending, exports, business investment and government spending. The manufacturing and services sectors expanded during the period. The unemployment rate declined slightly from 4.1% in December 2017, as reported at the beginning of the six-month period, to 4.0% at period-end.3 Annual inflation, as measured by the Consumer Price Index, increased from 2.1% in December 2017, as reported at the beginning of the period, to 2.9% at period-end.3
1. Source: Morningstar.
2. Source: Lipper, a Thomson Reuters Company.
One cannot invest directly in an index, and an index is not representative of the Fund’s portfolio. Please see Index Descriptions following the Fund Summaries.
3. Source: Bureau of Labor Statistics.
The dollar value, number of shares or principal amount, and names of all portfolio holdings are listed in the Fund’s Statement of Investments (SOI).
| FGI-2 | Semiannual Report | |||
FRANKLIN GROWTH AND INCOME VIP FUND
In February 2018, the new US Federal Reserve (Fed) Chair Jerome Powell spoke before Congress for the first time and indicated the Fed saw signs of a continued strong labor market and economic growth. He reiterated the Fed’s intention to gradually raise interest rates in an effort to keep the economy from overheating and as inflation increases toward the Fed’s target. However, he noted there was no evidence of the economy overheating and he had yet to see a clear upward move in wages. The Fed raised its target range for the federal funds rate 0.25% each at its March and June 2018 meetings to 1.75%–2.00% and continued reducing its balance sheet as part of its ongoing plan to normalize monetary policy. In June, the Fed upgraded its economic forecast for 2018 and its inflation forecasts for 2018 and 2019. Furthermore, the Fed forecasted an additional rate hike for 2018 and 2019 than previously anticipated.
US equity markets rose overall during the period, benefiting from mostly upbeat economic data and better US corporate earnings. At certain points during the period, markets were also supported by the expectations of gradual rate increases. After reaching new all-time highs in January 2018, US stocks declined in February amid concerns that strong economic growth and rising inflation would lead the Fed to increase its target rate faster than expected. In March, markets were pressured further by a broad sell-off in information technology (IT) stocks due to a potential for tighter regulation in the sector arising from concerns about consumer data privacy. Other factors that curbed investor sentiment included tensions between the US and North Korea, political uncertainties in the US, the Trump administration’s protectionist policies and escalating trade tensions between the US and China. An overall easing of tensions in the Korean peninsula and intermittent US-China trade negotiations partially offset some of these concerns. However, US trade disputes with its allies and China near period-end dampened investor sentiment. In this environment, the broad US stock market, as measured by the S&P 500, generated a +2.65% total return for the period.1
Investment Strategy
We seek to invest in a broadly diversified portfolio of equity securities that we consider to be financially strong, with a focus on “blue chip” companies. We apply a bottom-up approach to investing in individual securities. We will assess the market price of a company’s securities relative to our evaluation of the company’s long-term earnings, asset value and cash flow potential. We also consider a company’s price/earnings ratio, profit margins, balance sheet and liquidation value. We consider dividend yield and the opportunity for dividend growth in selecting stocks for the Fund because we believe that,
| Top 10 Holdings | ||||
| 6/30/18 | ||||
Company Sector/Industry | % of Total Net Assets | |||
| JPMorgan Chase & Co. Financials | 4.3% | |||
| Microsoft Corp. Information Technology | 3.9% | |||
| Wells Fargo & Co. Financials | 3.0% | |||
| Chevron Corp. Energy | 2.7% | |||
| PepsiCo Inc. Consumer Staples | 2.4% | |||
| BlackRock Inc. Financials | 2.2% | |||
| Morgan Stanley Financials | 2.1% | |||
| Medtronic PLC Health Care | 2.1% | |||
| Pfizer Inc. Health Care | 2.1% | |||
| U.S. Bancorp Financials | 2.1% | |||
over time, dividend income can contribute significantly to total return and can be a more consistent source of investment return than capital appreciation. We seek to take advantage of price dislocations that result from the market’s short-term focus and choose to invest in those companies that, in our opinion, offer the best trade-off between growth opportunity, business and financial risk, and valuation.
Manager’s Discussion
During the period under review, sectors that rose in value among the Fund’s investments included IT, energy and health care. In contrast, the industrials, consumer staples and financials sectors declined.
In the IT sector, software and services firm Microsoft benefited absolute performance due to demand for its suite of office and cloud-based products, as well as its cloud services. The company is a beneficiary of healthy levels of corporate spending for the IT services industry. Software and equipment company Apple also benefited results. The company reported a solid fiscal second quarter, supported by strong growth in services, and it issued guidance for its fiscal third quarter that was above consensus expectations. Other contributors in the sector included networking firm Cisco Systems.
In energy, oil and gas exploration and production company Anadarko Petroleum contributed to performance, as it reported
| Semiannual Report | FGI-3 | |||||
FRANKLIN GROWTH AND INCOME VIP FUND
solid quarterly results and raised its full-year 2018 guidance. In addition, the company has shifted its focus from production growth to delivering free cash flow back to shareholders. Oil and gas producer Occidental Petroleum also benefited results in the sector.
In the health care sector, diversified managed care company UnitedHealth Group and pharmaceutical firm Merck contributed to performance. Merck’s Keytruda product has seen promising early results in addressing lung cancer.
Other notable contributors included online retailer and cloud services provider Amazon.com.
In contrast, the industrials, consumer staples and financials sectors detracted from the Fund’s absolute performance. Within industrials, engine manufacturer Cummins hindered results amid concerns the North American truck market may be peaking. Industrial conglomerate General Electric (GE) also hindered performance in the sector. GE’s shares declined due to lower-than-expected cash flow generation and a dividend reduction. Near period-end, the company announced its intention to spin off its health care business, a move we view as positive. In addition, GE has been focused on cutting costs and reducing its debt load. Machinery firm Stanley Black & Decker also detracted from results in the industrials sector due to fears around trade tariffs.
In the consumer staples sector, consumer products manufacturer Procter & Gamble detracted from results. Despite reporting earnings that slightly exceeded consensus expectations, the company’s shares declined, largely due to a soft pricing environment amid increased competition. In addition, the company’s organic growth rate came in below consensus expectations. Other detractors in the sector included food and beverage companies Kraft Heinz and PepsiCo.
In financials, large bank Wells Fargo and financial services firm Morgan Stanley detracted from absolute performance. In general, financials stocks underperformed during the period as changes in interest rates and the yield curve seemed to indicate a less robust period for profits in the sector.
What is the yield curve?
A yield curve is a line that plots the yield to maturity of bonds having equal credit quality against their maturity dates.
|
It is important to recognize the effect of currency movements on the Fund’s performance. In general, if the value of the US dollar goes up compared with a foreign currency, an investment traded in that foreign currency will go down in value because it
will be worth fewer US dollars. This can have a negative effect on Fund performance. Conversely, when the US dollar weakens in relation to a foreign currency, an investment traded in that foreign currency will increase in value, which can contribute to Fund performance. For the six months ended June 30, 2018, the US dollar rose in value relative to most currencies. As a result, the Fund’s performance was negatively affected by the portfolio’s small portion of investment in securities with non-US currency exposure.
Thank you for your participation in Franklin Growth and Income VIP Fund. We look forward to serving your future investment needs.
The foregoing information reflects our analysis, opinions and portfolio holdings as of June 30, 2018, the end of the reporting period. The way we implement our main investment strategies and the resulting portfolio holdings may change depending on factors such as market and economic conditions. These opinions may not be relied upon as investment advice or an offer for a particular security. The information is not a complete analysis of every aspect of any market, country, industry, security or the Fund. Statements of fact are from sources considered reliable, but the investment manager makes no representation or warranty as to their completeness or accuracy. Although historical performance is no guarantee of future results, these insights may help you understand our investment management philosophy.
| FGI-4 | Semiannual Report | |||
FRANKLIN GROWTH AND INCOME VIP FUND
Class 2 Fund Expenses
As an investor in a variable insurance contract (Contract) that indirectly provides for investment in an underlying mutual fund, you can incur transaction and/or ongoing expenses at both the Fund level and the Contract Level: (1) transaction expenses can include sales charges (loads) on purchases, surrender fees, transfer fees and premium taxes; and (2) ongoing expenses can include management fees, distribution and service (12b-1) fees, contract fees, annual maintenance fees, mortality and expense risk fees and other fees and expenses. All mutual funds and Contracts have some types of ongoing expenses. The table below shows Fund-level ongoing expenses and can help you understand these costs and compare them with those of other mutual funds offered through the Contract. The table assumes a $1,000 investment held for the six months indicated. Please refer to the Fund prospectus for additional information on operating expenses.
Actual Fund Expenses
The table below provides information about the actual account values and actual expenses in the columns under the heading “Actual.” In these columns the Fund’s actual return, which includes the effect of ongoing Fund expenses but does not include the effect of ongoing Contract expenses, is used to calculate the “Ending Account Value.” You can estimate the Fund-level expenses you paid during the period by following these steps (of course, your account value and expenses will differ from those in this illustration): Divide your account value by $1,000 (if your account had an $8,600 value, then $8,600 ÷ $1,000 = 8.6). Then multiply the result by the number under the headings “Actual” and “Fund-Level Expenses Paid During Period” (if Fund-Level Expenses Paid During Period were $ 7.50, then 8.6 x $7.50 = $64.50). In this illustration, the estimated expenses paid this period at the Fund level are $64.50.
Hypothetical Example for Comparison with Other Mutual Funds
Under the heading “Hypothetical” in the table, information is provided about hypothetical account values and hypothetical expenses based on the Fund’s actual expense ratio and an assumed rate of return of 5% per year before expenses, which is not the Fund’s actual return. This information may not be used to estimate the actual ending account balance or expenses you paid for the period, but it can help you compare ongoing costs of investing in the Fund with those of other mutual funds offered through the Contract. To do so, compare this 5% hypothetical example with the 5% hypothetical examples that appear in the shareholder reports of other funds offered through the Contract.
Please note that expenses shown in the table are meant to highlight ongoing costs at the Fund level only and do not reflect any ongoing expenses at the Contract level, or transaction expenses at either the Fund or Contract levels. In addition, while the Fund does not have transaction expenses, if the transaction and ongoing expenses at the Contract level were included, the expenses shown below would be higher. You should consult your Contract prospectus or disclosure document for more information.
| Actual (actual return after expenses) | Hypothetical (5% annual return before expenses) | |||||||||||
Share Class | Beginning Account Value 1/1/18 | Ending Account Value 6/30/18 | Fund-Level Expenses Paid During Period 1/1/18–6/30/181,2 | Ending Account Value 6/30/18 | Fund-Level Expenses Paid During Period 1/1/18–6/30/181,2 | Net Annualized Expense Ratio2 | ||||||
|
|
|
| |||||||||
Class 2 | $1,000 | $995.60 | $4.16 | $1,020.63 | $4.21 | 0.84% | ||||||
1. Expenses are equal to the annualized expense ratio for the six-month period as indicated above—in the far right column—multiplied by the simple average account value over the period indicated, and then multiplied by 181/365 to reflect the one-half year period.
2. Reflects expenses after fee waivers and expense reimbursements. Does not include any ongoing expenses of the Contract for which the Fund is an investment option or acquired fund fees and expenses.
| Semiannual Report | FGI-5 | |||||
FRANKLIN TEMPLETON VARIABLE INSURANCE PRODUCTS TRUST
Financial Highlights
Franklin Growth and Income VIP Fund
Six Months Ended (unaudited) | Year Ended December 31, | |||||||||||||||||||||||
| 2017 | 2016 | 2015 | 2014 | 2013 | ||||||||||||||||||||
| ||||||||||||||||||||||||
Class 1 | ||||||||||||||||||||||||
| Per share operating performance | ||||||||||||||||||||||||
(for a share outstanding throughout the period) | ||||||||||||||||||||||||
Net asset value, beginning of period | $16.32 | $15.97 | $15.94 | $17.02 | $15.97 | $12.64 | ||||||||||||||||||
|
| |||||||||||||||||||||||
Income from investment operationsa: | ||||||||||||||||||||||||
Net investment incomeb | 0.15 | 0.35 | 0.40 | 0.45 | 0.53 | c | 0.33 | |||||||||||||||||
Net realized and unrealized gains (losses) | (0.19 | ) | 2.04 | 1.33 | (0.54 | ) | 0.95 | 3.40 | ||||||||||||||||
|
| |||||||||||||||||||||||
Total from investment operations | (0.04 | ) | 2.39 | 1.73 | (0.09 | ) | 1.48 | 3.73 | ||||||||||||||||
|
| |||||||||||||||||||||||
Less distributions from: | ||||||||||||||||||||||||
Net investment income | (0.43 | ) | (1.03 | ) | (0.46 | ) | (0.61 | ) | (0.43 | ) | (0.40) | |||||||||||||
Net realized gains | (0.43 | ) | (1.01 | ) | (1.24 | ) | (0.38 | ) | — | — | ||||||||||||||
|
| |||||||||||||||||||||||
Total distributions | (0.86 | ) | (2.04 | ) | (1.70 | ) | (0.99 | ) | (0.43 | ) | (0.40) | |||||||||||||
|
| |||||||||||||||||||||||
Net asset value, end of period | $15.42 | $16.32 | $15.97 | $15.94 | $17.02 | $15.97 | ||||||||||||||||||
|
| |||||||||||||||||||||||
Total returnd | (0.30 | )% | 16.15% | 11.86% | (0.62 | )% | 9.40% | 29.96% | ||||||||||||||||
| Ratios to average net assetse | ||||||||||||||||||||||||
Expenses before waiver and payments by affiliates | 0.71% | 0.72% | 0.59% | 0.58% | 0.57% | 0.58% | ||||||||||||||||||
Expenses net of waiver and payments by affiliates | 0.59% | f | 0.59%f | 0.59% | f,g | 0.58% | 0.57%f | 0.58%f | ||||||||||||||||
Net investment income | 1.89% | 2.21% | 2.38% | 2.74% | 3.26% | c | 2.29% | |||||||||||||||||
| Supplemental data | ||||||||||||||||||||||||
Net assets, end of period (000’s) | $34,518 | $35,865 | $29,829 | $144,663 | $168,961 | $175,860 | ||||||||||||||||||
Portfolio turnover rate | 11.54% | 33.91% | 40.59% | h | 48.81% | 20.54% | 35.16% | |||||||||||||||||
aThe amount shown for a share outstanding throughout the period may not correlate with the Statement of Operations for the period due to the timing of sales and repurchases of the Fund’s shares in relation to income earned and/or fluctuating fair value of the investments of the Fund.
bBased on average daily shares outstanding.
cNet investment income per share includes approximately $0.12 per share related to income received in the form of special dividends in connection with certain Fund holdings. Excluding this amount, the ratio of net investment income to average net assets would have been 2.53%.
dTotal return does not include fees, charges or expenses imposed by the variable annuity and life insurance contracts for which Franklin Templeton Variable Insurance Products Trust serves as an underlying investment vehicle. Total return is not annualized for periods less than one year.
eRatios are annualized for periods less than one year.
fBenefit of expense reduction rounds to less than 0.01%.
gBenefit of waiver and payments by affiliates rounds to less than 0.01%.
hExcludes the value of portfolio securities delivered as a result of a redemption in-kind.
| FGI-6 | Semiannual Report | The accompanying notes are an integral part of these financial statements. | |||
FRANKLIN TEMPLETON VARIABLE INSURANCE PRODUCTS TRUST
FINANCIAL HIGHLIGHTS
Franklin Growth and Income VIP Fund (continued)
Six Months Ended (unaudited) | Year Ended December 31, | |||||||||||||||||||||||
| 2017 | 2016 | 2015 | 2014 | 2013 | ||||||||||||||||||||
| ||||||||||||||||||||||||
Class 2 | ||||||||||||||||||||||||
| Per share operating performance | ||||||||||||||||||||||||
(for a share outstanding throughout the period) | ||||||||||||||||||||||||
Net asset value, beginning of period | $16.02 | $15.69 | $15.68 | $16.76 | $15.73 | $12.46 | ||||||||||||||||||
|
| |||||||||||||||||||||||
Income from investment operationsa: | ||||||||||||||||||||||||
Net investment incomeb | 0.13 | 0.31 | 0.30 | 0.40 | 0.48c | 0.29 | ||||||||||||||||||
Net realized and unrealized gains (losses) | (0.19 | ) | 2.00 | 1.37 | (0.54 | ) | 0.94 | 3.35 | ||||||||||||||||
|
| |||||||||||||||||||||||
Total from investment operations | (0.06 | ) | 2.31 | 1.67 | (0.14 | ) | 1.42 | 3.64 | ||||||||||||||||
|
| |||||||||||||||||||||||
Less distributions from: | ||||||||||||||||||||||||
Net investment income | (0.39 | ) | (0.97 | ) | (0.42 | ) | (0.56 | ) | (0.39 | ) | (0.37 | ) | ||||||||||||
Net realized gains | (0.43 | ) | (1.01 | ) | (1.24 | ) | (0.38 | ) | — | — | ||||||||||||||
|
| |||||||||||||||||||||||
Total distributions | (0.82 | ) | (1.98 | ) | (1.66 | ) | (0.94 | ) | (0.39 | ) | (0.37) | |||||||||||||
|
| |||||||||||||||||||||||
Net asset value, end of period | $15.14 | $16.02 | $15.69 | $15.68 | $16.76 | $15.73 | ||||||||||||||||||
|
| |||||||||||||||||||||||
Total returnd | (0.44)% | 15.85% | 11.62% | (0.91 | )% | 9.14% | 29.60% | |||||||||||||||||
Ratios to average net assetse | ||||||||||||||||||||||||
Expenses before waiver and payments by affiliates | 0.96% | 0.97% | 0.84% | 0.83% | 0.82% | 0.83% | ||||||||||||||||||
Expenses net of waiver and payments by affiliates | 0.84% | f | 0.84% | f | 0.84%f,g | 0.83% | 0.82% | f | 0.83%f | |||||||||||||||
Net investment income | 1.64% | 1.96% | 2.13% | 2.49% | 3.01%c | 2.04% | ||||||||||||||||||
Supplemental data | ||||||||||||||||||||||||
Net assets, end of period (000’s) | $70,076 | $74,105 | $69,474 | $124,691 | $138,19 | 1 | $150,966 | |||||||||||||||||
Portfolio turnover rate | 11.54% | 33.91% | 40.59% | h | 48.81% | 20.54% | 35.16% | |||||||||||||||||
aThe amount shown for a share outstanding throughout the period may not correlate with the Statement of Operations for the period due to the timing of sales and repurchases of the Fund’s shares in relation to income earned and/or fluctuating fair value of the investments of the Fund.
bBased on average daily shares outstanding.
cNet investment income per share includes approximately $0.12 per share related to income received in the form of special dividends in connection with certain Fund holdings. Excluding this amount, the ratio of net investment income to average net assets would have been 2.28%.
dTotal return does not include fees, charges or expenses imposed by the variable annuity and life insurance contracts for which Franklin Templeton Variable Insurance Products Trust serves as an underlying investment vehicle. Total return is not annualized for periods less than one year.
eRatios are annualized for periods less than one year.
fBenefit of expense reduction rounds to less than 0.01%.
gBenefit of waiver and payments by affiliates rounds to less than 0.01%.
hExcludes the value of portfolio securities delivered as a result of a redemption in-kind.
| The accompanying notes are an integral part of these financial statements. | Semiannual Report | FGI-7 | |||||
FRANKLIN TEMPLETON VARIABLE INSURANCE PRODUCTS TRUST
Statement of Investments, June 30, 2018 (unaudited)
Franklin Growth and Income VIP Fund
| ||||||||||
| Country | Shares | Value | ||||||||
Common Stocks 85.3% | ||||||||||
Consumer Discretionary 4.8% | ||||||||||
Comcast Corp., A | United States | 29,500 | $ | 967,895 | ||||||
Las Vegas Sands Corp. | United States | 14,700 | 1,122,492 | |||||||
Lowe’s Cos. Inc. | United States | 8,348 | 797,818 | |||||||
McDonald’s Corp. | United States | 7,000 | 1,096,830 | |||||||
Target Corp. | United States | 13,380 | 1,018,486 | |||||||
|
| |||||||||
| 5,003,521 | ||||||||||
|
| |||||||||
Consumer Staples 7.1% | ||||||||||
Anheuser-Busch InBev SA/NV, ADR | Belgium | 5,937 | 598,212 | |||||||
The Kraft Heinz Co. | United States | 10,981 | 689,827 | |||||||
PepsiCo Inc. | United States | 22,598 | 2,460,244 | |||||||
The Procter & Gamble Co. | United States | 27,600 | 2,154,456 | |||||||
Walmart Inc. | United States | 18,100 | 1,550,265 | |||||||
|
| |||||||||
| 7,453,004 | ||||||||||
|
| |||||||||
Energy 9.2% | ||||||||||
Anadarko Petroleum Corp. | United States | 3,518 | 257,694 | |||||||
Chevron Corp. | United States | 22,368 | 2,827,986 | |||||||
Exxon Mobil Corp. | United States | 22,277 | 1,842,976 | |||||||
Occidental Petroleum Corp. | United States | 16,300 | 1,363,984 | |||||||
ONEOK Inc. | United States | 12,900 | 900,807 | |||||||
Royal Dutch Shell PLC, A, ADR | United Kingdom | 20,213 | 1,399,346 | |||||||
Suncor Energy Inc. | Canada | 25,382 | 1,032,540 | |||||||
|
| |||||||||
| 9,625,333 | ||||||||||
|
| |||||||||
Financials 19.6% | ||||||||||
Arthur J. Gallagher & Co. | United States | 14,566 | 950,869 | |||||||
Bank of America Corp. | United States | 66,300 | 1,868,997 | |||||||
BB&T Corp. | United States | 35,276 | 1,779,321 | |||||||
BlackRock Inc. | United States | 4,561 | 2,276,121 | |||||||
The Charles Schwab Corp. | United States | 4,703 | 240,323 | |||||||
JPMorgan Chase & Co. | United States | 43,000 | 4,480,600 | |||||||
MetLife Inc. | United States | 32,500 | 1,417,000 | |||||||
Morgan Stanley | United States | 47,337 | 2,243,774 | |||||||
U.S. Bancorp | United States | 43,355 | 2,168,617 | |||||||
Wells Fargo & Co. | United States | 56,350 | 3,124,044 | |||||||
|
| |||||||||
| 20,549,666 | ||||||||||
|
| |||||||||
Health Care 11.8% | ||||||||||
Baxter International Inc. | United States | 8,500 | 627,640 | |||||||
Eli Lilly & Co. | United States | 16,137 | 1,376,970 | |||||||
Johnson & Johnson | United States | 15,865 | 1,925,059 | |||||||
Medtronic PLC | United States | 26,181 | 2,241,355 | |||||||
Merck & Co. Inc. | United States | 32,500 | 1,972,750 | |||||||
Pfizer Inc. | United States | 60,963 | 2,211,738 | |||||||
UnitedHealth Group Inc. | United States | 8,100 | 1,987,254 | |||||||
|
| |||||||||
| 12,342,766 | ||||||||||
|
| |||||||||
Industrials 10.4% | ||||||||||
Cummins Inc. | United States | 10,669 | 1,418,977 | |||||||
General Electric Co. | United States | 26,232 | 357,017 | |||||||
Illinois Tool Works Inc. | United States | 5,111 | 708,078 | |||||||
Lockheed Martin Corp. | United States | 4,869 | 1,438,449 | |||||||
Norfolk Southern Corp. | United States | 8,800 | 1,327,656 | |||||||
Raytheon Co. | United States | 10,516 | 2,031,481 | |||||||
| FGI-8 | Semiannual Report | |||
FRANKLIN TEMPLETON VARIABLE INSURANCE PRODUCTS TRUST
STATEMENT OF INVESTMENTS (UNAUDITED)
Franklin Growth and Income VIP Fund (continued)
| Country | Shares | Value | ||||||||
Common Stocks (continued) | ||||||||||
Industrials (continued) | ||||||||||
Republic Services Inc. | United States | 27,180 | $ | 1,858,025 | ||||||
Stanley Black & Decker Inc. | United States | 5,432 | 721,424 | |||||||
United Technologies Corp. | United States | 7,834 | 979,485 | |||||||
|
| |||||||||
| 10,840,592 | ||||||||||
|
| |||||||||
Information Technology 12.1% | ||||||||||
Apple Inc. | United States | 11,032 | 2,042,134 | |||||||
Broadcom Inc. | United States | 4,433 | 1,075,623 | |||||||
Cisco Systems Inc. | United States | 41,789 | 1,798,181 | |||||||
Intel Corp. | United States | 18,657 | 927,439 | |||||||
Microsoft Corp. | United States | 41,876 | 4,129,392 | |||||||
Oracle Corp. | United States | 18,829 | 829,606 | |||||||
Texas Instruments Inc. | United States | 16,996 | 1,873,809 | |||||||
|
| |||||||||
| 12,676,184 | ||||||||||
|
| |||||||||
Materials 4.7% | ||||||||||
BASF SE | Germany | 12,737 | 1,218,925 | |||||||
DowDuPont Inc. | United States | 25,573 | 1,685,772 | |||||||
International Paper Co. | United States | 22,220 | 1,157,218 | |||||||
Praxair Inc. | United States | 5,300 | 838,195 | |||||||
|
| |||||||||
| 4,900,110 | ||||||||||
|
| |||||||||
Real Estate 1.7% | ||||||||||
Equity Residential | United States | 7,000 | 445,830 | |||||||
Host Hotels & Resorts Inc. | United States | 65,641 | 1,383,056 | |||||||
|
| |||||||||
| 1,828,886 | ||||||||||
|
| |||||||||
Telecommunication Services 2.3% | ||||||||||
Rogers Communications Inc., B | Canada | 6,044 | 286,848 | |||||||
TELUS Corp. | Canada | 23,000 | 817,304 | |||||||
Verizon Communications Inc. | United States | 25,110 | 1,263,284 | |||||||
|
| |||||||||
| 2,367,436 | ||||||||||
|
| |||||||||
Utilities 1.6% | ||||||||||
Xcel Energy Inc. | United States | 35,496 | 1,621,457 | |||||||
|
| |||||||||
Total Common Stocks (Cost $61,010,406) | 89,208,955 | |||||||||
|
| |||||||||
a Equity-Linked Securities 8.1% | ||||||||||
Consumer Discretionary 1.3% | ||||||||||
b Well Fargo Bank NA into Amazon.com Inc., 6.00%, 144A | United States | 800 | 1,334,921 | |||||||
|
| |||||||||
Energy 1.6% | ||||||||||
b Citigroup Global Markets Holdings Inc. into Anadarko Petroleum Corp., 6.00%, 144A | United States | 17,000 | 998,557 | |||||||
b Credit Suisse AG London into Schlumberger Ltd., 6.50%, 144A | United States | 10,300 | 715,353 | |||||||
|
| |||||||||
| 1,713,910 | ||||||||||
|
| |||||||||
Financials 2.1% | ||||||||||
b Deutsche Bank AG London into Bank of America Corp., 6.50%, 144A | United States | 44,000 | 1,187,313 | |||||||
b UBS AG London into The Charles Schwab Corp., 6.50%, 144A. | United States | 20,000 | 1,024,012 | |||||||
|
| |||||||||
| 2,211,325 | ||||||||||
|
| |||||||||
Health Care 0.6% | ||||||||||
b Deutsche Bank AG London into Baxter International Inc., 4.50%, 144A | United States | 8,000 | 578,331 | |||||||
|
| |||||||||
| Semiannual Report | FGI-9 | |||||
FRANKLIN TEMPLETON VARIABLE INSURANCE PRODUCTS TRUST
STATEMENT OF INVESTMENTS (UNAUDITED)
Franklin Growth and Income VIP Fund (continued)
| Country | Shares | Value | ||||||||
a Equity-Linked Securities (continued) | ||||||||||
Information Technology 2.5% | ||||||||||
b Credit Suisse AG London into Broadcom Inc., 8.50%, 144A | United States | 3,500 | $ | 867,466 | ||||||
b UBS AG London into Intel Corp., 7.00%, 144A | United States | 40,000 | 1,731,251 | |||||||
|
| |||||||||
| 2,598,717 | ||||||||||
|
| |||||||||
Total Equity-Linked Securities (Cost $8,034,610) | 8,437,204 | |||||||||
|
| |||||||||
Convertible Preferred Stocks 4.1% | ||||||||||
Health Care 1.8% | ||||||||||
Becton Dickinson and Co., 6.125%, cvt. pfd., A | United States | 30,200 | 1,867,870 | |||||||
|
| |||||||||
Industrials 0.3% | ||||||||||
c Fortive Corp., 5.00%, cvt. pfd | United States | 350 | 358,958 | |||||||
|
| |||||||||
Utilities 2.0% | ||||||||||
NextEra Energy Inc., 6.371%, cvt. pfd | United States | 28,277 | 2,101,688 | |||||||
|
| |||||||||
Total Convertible Preferred Stocks (Cost $3,425,449) | 4,328,516 | |||||||||
|
| |||||||||
Total Investments before Short Term Investments | ||||||||||
(Cost $72,470,465) | 101,974,675 | |||||||||
|
| |||||||||
Principal | ||||||||||
Short Term Investments (Cost $2,763,489) 2.6% | ||||||||||
Repurchase Agreements 2.6% | ||||||||||
d Joint Repurchase Agreement, 2.10%, 7/02/18 (Maturity Value $2,763,973) | ||||||||||
BNP Paribas Securities Corp. (Maturity Value $991,879) | ||||||||||
Deutsche Bank Securities Inc. (Maturity Value $36,291) | ||||||||||
HSBC Securities (USA) Inc. (Maturity Value $1,735,803) | ||||||||||
Collateralized by U.S. Government Agency Securities, 0.00% - 3.625%, 9/18/18 - 6/19/23; eU.S. Treasury Bill, 10/04/18 - 10/18/18; and U.S. Treasury Note, 2.00% - 3.50%, 5/15/20 - 8/31/21 (valued at $2,820,330) | United States | $ | 2,763,489 | 2,763,489 | ||||||
|
| |||||||||
Total Investments (Cost $75,233,954) 100.1% | 104,738,164 | |||||||||
Other Assets, less Liabilities (0.1)% | (144,332 | ) | ||||||||
|
| |||||||||
Net Assets 100.0% | $ | 104,593,832 | ||||||||
|
| |||||||||
See Abbreviations on page FGI-20.
aSee Note 1(d) regarding equity-linked securities.
bSecurity was purchased pursuant to Rule 144A under the Securities Act of 1933 and may be sold in transactions exempt from registration only to qualified institutional buyers or in a public offering registered under the Securities Act of 1933. These securities have been deemed liquid under guidelines approved by the Trust’s Board of Trustees. At June 30, 2018, the aggregate value of these securities was $8,437,204 representing 8.1% of net assets.
cNon-income producing.
dSee Note 1(c) regarding joint repurchase agreement.
eThe security was issued on a discount basis with no stated coupon rate.
| FGI-10 | Semiannual Report | The accompanying notes are an integral part of these financial statements. | |||
FRANKLIN TEMPLETON VARIABLE INSURANCE PRODUCTS TRUST
Financial Statements
Statement of Assets and Liabilities
June 30, 2018 (unaudited)
Franklin Growth and Income VIP Fund | ||||
Assets: | ||||
Investments in securities: | ||||
Cost - Unaffiliated issuers | $ 72,470,465 | |||
Cost - Unaffiliated repurchase agreements | 2,763,489 | |||
|
| |||
Value - Unaffiliated issuers | $101,974,675 | |||
Value - Unaffiliated repurchase agreements. | 2,763,489 | |||
Receivables: | ||||
Dividends | 129,775 | |||
Other assets | 73 | |||
|
| |||
Total assets | 104,868,012 | |||
|
| |||
Liabilities: | ||||
Payables: | ||||
Investment securities purchased. | 125,537 | |||
Capital shares redeemed. | 26,389 | |||
Management fees | 43,574 | |||
Distribution fees | 29,777 | |||
Reports to shareholders | 27,115 | |||
Professional fees | 18,976 | |||
Accrued expenses and other liabilities | 2,812 | |||
|
| |||
Total liabilities. | 274,180 | |||
|
| |||
Net assets, at value | $104,593,832 | |||
|
| |||
Net assets consist of: | ||||
Paid-in capital | $ 72,314,075 | |||
Undistributed net investment income. | 839,077 | |||
Net unrealized appreciation (depreciation) | 29,503,104 | |||
Accumulated net realized gain (loss) | 1,937,576 | |||
|
| |||
Net assets, at value | $104,593,832 | |||
|
| |||
| Class 1: | ||||
Net assets, at value | $ 34,518,204 | |||
|
| |||
Shares outstanding | 2,238,309 | |||
|
| |||
Net asset value and maximum offering price per share | $15.42 | |||
|
| |||
| Class 2: | ||||
Net assets, at value | $ 70,075,628 | |||
|
| |||
Shares outstanding | 4,627,949 | |||
|
| |||
Net asset value and maximum offering price per share | $15.14 | |||
|
| |||
| The accompanying notes are an integral part of these financial statements. | Semiannual Report | FGI-11 | |||||
FRANKLIN TEMPLETON VARIABLE INSURANCE PRODUCTS TRUST
FINANCIAL STATEMENTS
Statement of Operations
for the six months ended June 30, 2018 (unaudited)
Franklin Growth and Income VIP Fund | ||||
| ||||
Investment income: | ||||
Dividends: (net of foreign taxes)* | ||||
Unaffiliated issuers | $ 1,307,939 | |||
Interest: | ||||
Unaffiliated issuers | 15,065 | |||
|
| |||
Total investment income | 1,323,004 | |||
|
| |||
Expenses: | ||||
Management fees (Note 3a) | 329,284 | |||
Distribution fees: (Note 3c) | ||||
Class 2 | 89,713 | |||
Custodian fees (Note 4) | 633 | |||
Reports to shareholders | 24,515 | |||
Professional fees | 19,563 | |||
Trustees’ fees and expenses | 267 | |||
Other | 4,542 | |||
|
| |||
Total expenses | 468,517 | |||
Expense reductions (Note 4) | (36 | ) | ||
Expenses waived/paid by affiliates (Note 3e) | (63,380 | ) | ||
|
| |||
Net expenses | 405,101 | |||
|
| |||
Net investment income | 917,903 | |||
|
| |||
Realized and unrealized gains (losses): | ||||
Net realized gain (loss) from: | ||||
Investments: | ||||
Unaffiliated issuers | 2,016,462 | |||
Realized gain distributions from REITs | 6,663 | |||
Foreign currency transactions | 3,550 | |||
|
| |||
Net realized gain (loss) | 2,026,675 | |||
|
| |||
Net change in unrealized appreciation (depreciation) on: | ||||
Investments: | ||||
Unaffiliated issuers | (3,310,601 | ) | ||
Translation of other assets and liabilities denominated in foreign currencies | (1,230 | ) | ||
|
| |||
Net change in unrealized appreciation (depreciation) | (3,311,831 | ) | ||
|
| |||
Net realized and unrealized gain (loss) | (1,285,156 | ) | ||
|
| |||
Net increase (decrease) in net assets resulting from operations | $ (367,253 | ) | ||
|
| |||
*Foreign taxes withheld on dividends | $ 23,741 | |||
| FGI-12 | Semiannual Report | The accompanying notes are an integral part of these financial statements. | |||
FRANKLIN TEMPLETON VARIABLE INSURANCE PRODUCTS TRUST
FINANCIAL STATEMENTS
Statements of Changes in Net Assets
| Franklin Growth and Income VIP Fund | ||||||||
Six Months Ended June 30, 2018 (unaudited) | Year Ended December 31, 2017 | |||||||
| ||||||||
Increase (decrease) in net assets: | ||||||||
Operations: | ||||||||
Net investment income | $ 917,903 | $ 2,171,299 | ||||||
Net realized gain (loss) | 2,026,675 | 3,278,575 | ||||||
Net change in unrealized appreciation (depreciation) | (3,311,831 | ) | 10,412,049 | |||||
|
| |||||||
Net increase (decrease) in net assets resulting from operations | (367,253 | ) | 15,861,923 | |||||
|
| |||||||
Distributions to shareholders from: | ||||||||
Net investment income: | ||||||||
Class 1 | (923,422 | ) | (2,052,142 | ) | ||||
Class 2 | (1,730,668 | ) | (4,282,950 | ) | ||||
Net realized gains: | ||||||||
Class 1 | (921,717 | ) | (2,005,313 | ) | ||||
Class 2 | (1,908,988 | ) | (4,458,397 | ) | ||||
|
| |||||||
Total distributions to shareholders | (5,484,795 | ) | (12,798,802 | ) | ||||
|
| |||||||
Capital share transactions: (Note 2) | ||||||||
Class 1 | 584,833 | 5,020,919 | ||||||
Class 2 | (108,151 | ) | 2,582,809 | |||||
|
| |||||||
Total capital share transactions | 476,682 | 7,603,728 | ||||||
|
| |||||||
Net increase (decrease) in net assets | (5,375,366 | ) | 10,666,849 | |||||
Net assets: | ||||||||
Beginning of period | 109,969,198 | 99,302,349 | ||||||
|
| |||||||
End of period | $104,593,832 | $109,969,198 | ||||||
|
| |||||||
Undistributed net investment income included in net assets: | ||||||||
End of period | $ 839,077 | $ 2,575,264 | ||||||
|
| |||||||
| The accompanying notes are an integral part of these financial statements. | Semiannual Report | FGI-13 | |||||
FRANKLIN TEMPLETON VARIABLE INSURANCE PRODUCTS TRUST
Notes to Financial Statements (unaudited)
Franklin Growth and Income VIP Fund
1. Organization and Significant Accounting Policies
Franklin Templeton Variable Insurance Products Trust (Trust) is registered under the Investment Company Act of 1940 (1940 Act) as an open-end management investment company, consisting of eighteen separate funds and applies the specialized accounting and reporting guidance in U.S. Generally Accepted Accounting Principles (U.S. GAAP). Franklin Growth and Income VIP Fund (Fund) is included in this report. Shares of the Fund are generally sold only to insurance company separate accounts to fund the benefits of variable life insurance policies or variable annuity contracts. The Fund offers two classes of shares: Class 1 and Class 2. Each class of shares may differ by its distribution fees, voting rights on matters affecting a single class and its exchange privilege.
The following summarizes the Fund’s significant accounting policies.
a. Financial Instrument Valuation
The Fund’s investments in financial instruments are carried at fair value daily. Fair value is the price that would be received to sell an asset or paid to transfer a liability in an orderly transaction between market participants on the measurement date. The Fund calculates the net asset value (NAV) per share each business day as of 4 p.m. Eastern time or the regularly scheduled close of the New York Stock Exchange (NYSE), whichever is earlier. Under compliance policies and procedures approved by the Trust’s Board of Trustees (the Board), the Fund’s administrator has responsibility for oversight of valuation, including leading the cross-functional Valuation Committee (VC). The VC provides administration and oversight of the Fund’s valuation policies and procedures, which are approved annually by the Board. Among other things, these procedures allow the Fund to utilize independent pricing services, quotations from securities and financial instrument dealers, and other market sources to determine fair value.
Equity securities listed on an exchange or on the NASDAQ National Market System are valued at the last quoted sale price or the official closing price of the day, respectively. Foreign equity securities are valued as of the close of trading on the foreign stock exchange on which the security is primarily traded, or as of 4 p.m. Eastern time. The value is then converted into its U.S. dollar equivalent at the foreign exchange rate in effect at 4 p.m. Eastern time on the day that the value of the security is determined. Over-the-counter (OTC) securities are
valued within the range of the most recent quoted bid and ask prices. Securities that trade in multiple markets or on multiple exchanges are valued according to the broadest and most representative market. Certain equity securities are valued based upon fundamental characteristics or relationships to similar securities.
Investments in repurchase agreements are valued at cost, which approximates fair value.
The Fund has procedures to determine the fair value of financial instruments for which market prices are not reliable or readily available. Under these procedures, the VC convenes on a regular basis to review such financial instruments and considers a number of factors, including significant unobservable valuation inputs, when arriving at fair value. The VC primarily employs a market-based approach which may use related or comparable assets or liabilities, recent transactions, market multiples, book values, and other relevant information for the investment to determine the fair value of the investment. An income-based valuation approach may also be used in which the anticipated future cash flows of the investment are discounted to calculate fair value. Discounts may also be applied due to the nature or duration of any restrictions on the disposition of the investments. Due to the inherent uncertainty of valuations of such investments, the fair values may differ significantly from the values that would have been used had an active market existed. The VC employs various methods for calibrating these valuation approaches including a regular review of key inputs and assumptions, transactional back-testing or disposition analysis, and reviews of any related market activity.
Trading in securities on foreign securities stock exchanges and OTC markets may be completed before 4 p.m. Eastern time. In addition, trading in certain foreign markets may not take place on every Fund’s business day. Occasionally, events occur between the time at which trading in a foreign security is completed and 4 p.m. Eastern time that might call into question the reliability of the value of a portfolio security held by the Fund. As a result, differences may arise between the value of the Fund’s portfolio securities as determined at the foreign market close and the latest indications of value at 4 p.m. Eastern time. In order to minimize the potential for these differences, the VC monitors price movements following the close of trading in foreign stock markets through a series of country specific market proxies (such as baskets of American Depositary Receipts, futures contracts and exchange traded funds). These price movements are measured against
| FGI-14 | Semiannual Report | |||
FRANKLIN TEMPLETON VARIABLE INSURANCE PRODUCTS TRUST
NOTES TO FINANCIAL STATEMENTS (UNAUDITED)
Franklin Growth and Income VIP Fund (continued)
established trigger thresholds for each specific market proxy to assist in determining if an event has occurred that may call into question the reliability of the values of the foreign securities held by the Fund. If such an event occurs, the securities may be valued using fair value procedures, which may include the use of independent pricing services.
When the last day of the reporting period is a non-business day, certain foreign markets may be open on those days that the Fund’s NAV is not calculated, which could result in differences between the value of the Fund’s portfolio securities on the last business day and the last calendar day of the reporting period. Any significant security valuation changes due to an open foreign market are adjusted and reflected by the Fund for financial reporting purposes.
b. Foreign Currency Translation
Portfolio securities and other assets and liabilities denominated in foreign currencies are translated into U.S. dollars based on the exchange rate of such currencies against U.S. dollars on the date of valuation. The Fund may enter into foreign currency exchange contracts to facilitate transactions denominated in a foreign currency. Purchases and sales of securities, income and expense items denominated in foreign currencies are translated into U.S. dollars at the exchange rate in effect on the transaction date. Portfolio securities and assets and liabilities denominated in foreign currencies contain risks that those currencies will decline in value relative to the U.S. dollar. Occasionally, events may impact the availability or reliability of foreign exchange rates used to convert the U.S. dollar equivalent value. If such an event occurs, the foreign exchange rate will be valued at fair value using procedures established and approved by the Board.
The Fund does not separately report the effect of changes in foreign exchange rates from changes in market prices on securities held. Such changes are included in net realized and unrealized gain or loss from investments in the Statement of Operations.
Realized foreign exchange gains or losses arise from sales of foreign currencies, currency gains or losses realized between the trade and settlement dates on securities transactions and the difference between the recorded amounts of dividends, interest, and foreign withholding taxes and the U.S. dollar equivalent of the amounts actually received or paid. Net unrealized foreign exchange gains and losses arise from changes in foreign
exchange rates on foreign denominated assets and liabilities other than investments in securities held at the end of the reporting period.
c. Joint Repurchase Agreement
The Fund enters into a joint repurchase agreement whereby its uninvested cash balance is deposited into a joint cash account with other funds managed by the investment manager or an affiliate of the investment manager and is used to invest in one or more repurchase agreements. The value and face amount of the joint repurchase agreement are allocated to the funds based on their pro-rata interest. A repurchase agreement is accounted for as a loan by the Fund to the seller, collateralized by securities which are delivered to the Fund’s custodian. The fair value, including accrued interest, of the initial collateralization is required to be at least 102% of the dollar amount invested by the funds, with the value of the underlying securities marked to market daily to maintain coverage of at least 100%. Repurchase agreements are subject to the terms of Master Repurchase Agreements (MRAs) with approved counterparties (sellers). The MRAs contain various provisions, including but not limited to events of default and maintenance of collateral for repurchase agreements. In the event of default by either the seller or the Fund, certain MRAs may permit the non-defaulting party to net and close-out all transactions, if any, traded under such agreements. The Fund may sell securities it holds as collateral and apply the proceeds towards the repurchase price and any other amounts owed by the seller to the Fund in the event of default by the seller. This could involve costs or delays in addition to a loss on the securities if their value falls below the repurchase price owed by the seller. The joint repurchase agreement held by the Fund at period end, as indicated in the Statement of Investments, had been entered into on June 30, 2018.
d. Equity-Linked Securities
The Fund invests in equity-linked securities. Equity-linked securities are hybrid financial instruments that generally combine both debt and equity characteristics into a single note form. Income received from equity-linked securities is recorded as realized gains in the Statement of Operations and may be based on the performance of an underlying equity security, an equity index, or an option position. The risks of investing in equity-linked securities include unfavorable price movements in the underlying security and the credit risk of the issuing financial institution. There may be no guarantee of a return of
| Semiannual Report | FGI-15 | |||
FRANKLIN TEMPLETON VARIABLE INSURANCE PRODUCTS TRUST
NOTES TO FINANCIAL STATEMENTS (UNAUDITED)
Franklin Growth and Income VIP Fund (continued)
1. Organization and Significant Accounting
Policies (continued)
d. Equity-Linked Securities (continued)
principal with equity-linked securities and the appreciation potential may be limited. Equity-linked securities may be more volatile and less liquid than other investments held by the Fund.
e. Income and Deferred Taxes
It is the Fund’s policy to qualify as a regulated investment company under the Internal Revenue Code. The Fund intends to distribute to shareholders substantially all of its taxable income and net realized gains to relieve it from federal income and if applicable, excise taxes. As a result, no provision for U.S. federal income taxes is required.
The Fund may be subject to foreign taxation related to income received, capital gains on the sale of securities and certain foreign currency transactions in the foreign jurisdictions in which it invests. Foreign taxes, if any, are recorded based on the tax regulations and rates that exist in the foreign markets in which the Fund invests. When a capital gain tax is determined to apply, the Fund records an estimated deferred tax liability in an amount that would be payable if the securities were disposed of on the valuation date.
The Fund may recognize an income tax liability related to its uncertain tax positions under U.S. GAAP when the uncertain tax position has a less than 50% probability that it will be sustained upon examination by the tax authorities based on its technical merits. As of June 30, 2018, the Fund has determined that no tax liability is required in its financial statements related to uncertain tax positions for any open tax years (or expected to be taken in future tax years). Open tax years are those that remain subject to examination and are based on the statute of limitations in each jurisdiction in which the Fund invests.
f. Security Transactions, Investment Income, Expenses and Distributions
Security transactions are accounted for on trade date. Realized gains and losses on security transactions are determined on a specific identification basis. Interest income and estimated expenses are accrued daily. Dividend income and realized gain distributions are recorded on the ex-dividend date except for certain dividends from securities where the dividend rate is not
available. In such cases, the dividend is recorded as soon as the information is received by the Fund. Distributions to shareholders are recorded on the ex-dividend date. Distributable earnings are determined according to income tax regulations (tax basis) and may differ from earnings recorded in accordance with U.S. GAAP. These differences may be permanent or temporary. Permanent differences are reclassified among capital accounts to reflect their tax character. These reclassifications have no impact on net assets or the results of operations. Temporary differences are not reclassified, as they may reverse in subsequent periods.
Common expenses incurred by the Trust are allocated among the Funds based on the ratio of net assets of each Fund to the combined net assets of the Trust or based on the ratio of number of shareholders of each Fund to the combined number of shareholders of the Trust. Fund specific expenses are charged directly to the Fund that incurred the expense.
Realized and unrealized gains and losses and net investment income, excluding class specific expenses, are allocated daily to each class of shares based upon the relative proportion of net assets of each class. Differences in per share distributions by class are generally due to differences in class specific expenses.
g. Accounting Estimates
The preparation of financial statements in accordance with U.S. GAAP requires management to make estimates and assumptions that affect the reported amounts of assets and liabilities at the date of the financial statements and the amounts of income and expenses during the reporting period. Actual results could differ from those estimates.
h. Guarantees and Indemnifications
Under the Trust’s organizational documents, its officers and trustees are indemnified by the Trust against certain liabilities arising out of the performance of their duties to the Trust. Additionally, in the normal course of business, the Trust, on behalf of the Fund, enters into contracts with service providers that contain general indemnification clauses. The Trust’s maximum exposure under these arrangements is unknown as this would involve future claims that may be made against the Trust that have not yet occurred. Currently, the Trust expects the risk of loss to be remote.
| FGI-16 | Semiannual Report | |||
FRANKLIN TEMPLETON VARIABLE INSURANCE PRODUCTS TRUST
NOTES TO FINANCIAL STATEMENTS (UNAUDITED)
Franklin Growth and Income VIP Fund (continued)
2. Shares of Beneficial Interest
At June 30, 2018, there were an unlimited number of shares authorized (without par value). Transactions in the Fund’s shares were as follows:
Six Months Ended June 30, 2018 | Year Ended December 31, 2017 | |||||||||||||||
|
| |||||||||||||||
| Shares | Amount | Shares | Amount | |||||||||||||
| ||||||||||||||||
| Class 1 Shares: | ||||||||||||||||
Shares sold | 46,225 | $ | 754,375 | 273,799 | $ | 4,396,906 | ||||||||||
Shares issued in reinvestment of distributions | 117,600 | 1,845,139 | 272,130 | 4,057,455 | ||||||||||||
Shares redeemed | (122,892 | ) | (2,014,681 | ) | (216,463 | ) | (3,433,442) | |||||||||
|
| |||||||||||||||
Net increase (decrease) | 40,933 | $ | 584,833 | 329,466 | $ | 5,020,919 | ||||||||||
|
| |||||||||||||||
| Class 2 Shares: | ||||||||||||||||
Shares sold | 56,298 | $ | 899,267 | 304,558 | $ | 4,865,372 | ||||||||||
Shares issued in reinvestment of distributions | 236,188 | 3,639,656 | 596,679 | 8,741,347 | ||||||||||||
Shares redeemed | (290,278 | ) | (4,647,074 | ) | (704,129 | ) | (11,023,910) | |||||||||
|
| |||||||||||||||
Net increase (decrease) | 2,208 | $ | (108,151 | ) | 197,108 | $ | 2,582,809 | |||||||||
|
| |||||||||||||||
3. Transactions with Affiliates
Franklin Resources, Inc. is the holding company for various subsidiaries that together are referred to as Franklin Templeton Investments. Certain officers and trustees of the Fund are also officers and/or directors of the following subsidiaries:
| Subsidiary | Affiliation | |
Franklin Advisers, Inc. (Advisers) | Investment manager | |
Franklin Templeton Services, LLC (FT Services) | Administrative manager | |
Franklin Templeton Distributors, Inc. (Distributors) | Principal underwriter | |
Franklin Templeton Investor Services, LLC (Investor Services) | Transfer agent |
a. Management Fees
The Fund pays an investment management fee to Advisers based on the average daily net assets of the Fund as follows:
| Annualized Fee Rate | Net Assets | |
0.625% | Up to and including $100 million | |
0.500% | Over $100 million, up to and including $250 million | |
0.450% | Over $250 million, up to and including $7.5 billion | |
0.440% | Over $7.5 billion, up to and including $10 billion | |
0.430% | Over $10 billion, up to and including $12.5 billion | |
0.420% | Over $12.5 billion, up to and including $15 billion | |
0.400% | In excess of $15 billion |
For the period ended June 30, 2018, the annualized gross effective investment management fee rate was 0.616% of the Fund’s average daily net assets.
b. Administrative Fees
Under an agreement with Advisers, FT Services provides administrative services to the Fund. The fee is paid by Advisers based on the Fund’s average daily net assets, and is not an additional expense of the Fund.
| Semiannual Report | FGI-17 | |||||
FRANKLIN TEMPLETON VARIABLE INSURANCE PRODUCTS TRUST
NOTES TO FINANCIAL STATEMENTS (UNAUDITED)
Franklin Growth and Income VIP Fund (continued)
3. Transactions with Affiliates (continued)
c. Distribution Fees
The Board has adopted a distribution plan for Class 2 shares pursuant to Rule 12b-1 under the 1940 Act. Under the Fund’s compensation distribution plan, the Fund pays Distributors for costs incurred in connection with the servicing, sale and distribution of the Fund’s shares up to 0.35% per year of its average daily net assets. The Board has agreed to limit the current rate to 0.25% per year for Class 2. The plan year, for purposes of monitoring compliance with the maximum annual plan rate, is February 1 through January 31.
d. Transfer Agent Fees
Investor Services, under terms of an agreement, performs shareholder servicing for the Fund and is not paid by the Fund for the services.
e. Waiver and Expense Reimbursements
Advisers has contractually agreed in advance to waive or limit its fees and to assume as its own expense certain expenses otherwise payable by the Fund so that the expenses (excluding distribution fees and acquired fund fees and expenses), for each class of the Fund do not exceed 0.59% based on the average net assets of each class (other than certain non-routine expenses or costs, including those relating to litigation, indemnification, reorganizations, and liquidations) until April 30, 2019. Total expenses waived or paid are not subject to recapture subsequent to the Fund’s fiscal year end.
4. Expense Offset Arrangement
The Fund has entered into an arrangement with its custodian whereby credits realized as a result of uninvested cash balances are used to reduce a portion of the Fund’s custodian expenses. During the period ended June 30, 2018, the custodian fees were reduced as noted in the Statement of Operations.
5. Income Taxes
At June 30, 2018, the cost of investments and net unrealized appreciation (depreciation) for income tax purposes were as follows:
Cost of investments | $ | 75,340,979 | ||
|
| |||
Unrealized appreciation | $ | 30,540,942 | ||
Unrealized depreciation | (1,143,757) | |||
|
| |||
Net unrealized appreciation (depreciation) | $ | 29,397,185 | ||
|
| |||
Differences between income and/or capital gains as determined on a book basis and a tax basis are primarily due to differing treatment of equity-linked securities and bond discounts and premiums.
6. Investment Transactions
Purchases and sales of investments (excluding short term securities) for the period ended June 30, 2018, aggregated $12,123,232 and $16,183,996, respectively.
| FGI-18 | Semiannual Report | |||
FRANKLIN TEMPLETON VARIABLE INSURANCE PRODUCTS TRUST
NOTES TO FINANCIAL STATEMENTS (UNAUDITED)
Franklin Growth and Income VIP Fund (continued)
7. Credit Facility
The Fund, together with other U.S. registered and foreign investment funds (collectively, Borrowers), managed by Franklin Templeton Investments, are borrowers in a joint syndicated senior unsecured credit facility totaling $2 billion (Global Credit Facility) which matures on February 8, 2019. This Global Credit Facility provides a source of funds to the Borrowers for temporary and emergency purposes, including the ability to meet future unanticipated or unusually large redemption requests.
Under the terms of the Global Credit Facility, the Fund shall, in addition to interest charged on any borrowings made by the Fund and other costs incurred by the Fund, pay its share of fees and expenses incurred in connection with the implementation and maintenance of the Global Credit Facility, based upon its relative share of the aggregate net assets of all of the Borrowers, including an annual commitment fee of 0.15% based upon the unused portion of the Global Credit Facility. These fees are reflected in other expenses in the Statement of Operations. During the period ended June 30, 2018, the Fund did not use the Global Credit Facility.
8. Fair Value Measurements
The Fund follows a fair value hierarchy that distinguishes between market data obtained from independent sources (observable inputs) and the Fund’s own market assumptions (unobservable inputs). These inputs are used in determining the value of the Fund’s financial instruments and are summarized in the following fair value hierarchy:
| • | Level 1 – quoted prices in active markets for identical financial instruments |
| • | Level 2 – other significant observable inputs (including quoted prices for similar financial instruments, interest rates, prepayment speed, credit risk, etc.) |
| • | Level 3 – significant unobservable inputs (including the Fund’s own assumptions in determining the fair value of financial instruments) |
The input levels are not necessarily an indication of the risk or liquidity associated with financial instruments at that level.
For movements between the levels within the fair value hierarchy, the Fund has adopted a policy of recognizing the transfers as of the date of the underlying event which caused the movement.
A summary of inputs used as of June 30, 2018, in valuing the Fund’s assets carried at fair value, is as follows:
| Level 1 | Level 2 | Level 3 | Total | |||||||||||||
| ||||||||||||||||
| Assets: | ||||||||||||||||
Investments in Securities:a | ||||||||||||||||
Equity Investmentsb | $ 93,537,471 | $ — | $ | — | $ 93,537,471 | |||||||||||
Equity-Linked Securities | — | 8,437,204 | — | 8,437,204 | ||||||||||||
Short Term Investments | — | 2,763,489 | — | 2,763,489 | ||||||||||||
|
| |||||||||||||||
Total Investments in Securities | $ 93,537,471 | $ 11,200,693 | $ | — | $ 104,738,164 | |||||||||||
|
| |||||||||||||||
aFor detailed categories, see the accompanying Statement of Investments.
bIncludes common and convertible preferred stocks.
9. Subsequent Events
The Fund has evaluated subsequent events through the issuance of the financial statements and determined that no events have occurred that require disclosure.
| Semiannual Report | FGI-19 | |||
FRANKLIN TEMPLETON VARIABLE INSURANCE PRODUCTS TRUST
NOTES TO FINANCIAL STATEMENTS (UNAUDITED)
Franklin Growth and Income VIP Fund (continued)
Abbreviations
| Selected Portfolio | ||
| ||
| ADR | American Depositary Receipt | |
| FGI-20 | Semiannual Report | |||
This semiannual report for Franklin Income VIP Fund covers the period ended June 30, 2018.
Class 2 Performance Summary as of June 30, 2018
The Fund’s Class 2 Shares posted a +0.76% total return* for the six-month period ended June 30, 2018.
*The Fund has a fee waiver associated with any investment it makes in a Franklin Templeton money fund and/or other Franklin Templeton fund, contractually guaranteed through 4/30/19. Fund investment results reflect the fee waiver; without this waiver, the results would have been lower.
Performance reflects the Fund’s Class 2 operating expenses, but does not include any contract fees, expenses or sales charges. If they had been included, performance would be lower. These charges and deductions, particularly for variable life policies, can have a significant effect on contract values and insurance benefits. See the contract prospectus for a complete description of these expenses, including sales charges.
Performance data represent past performance, which does not guarantee future results. Investment return and principal value will fluctuate, and you may have a gain or loss when you sell your shares. Current performance may differ from figures shown.
| Semiannual Report | FI-1 | |||||
FRANKLIN INCOME VIP FUND
Fund Goal and Main Investments
The Fund seeks to maximize income, while maintaining prospects for capital appreciation. Under normal market conditions, the Fund invests in a diversified portfolio of debt and equity securities.
Fund Risks
All investments involve risks, including possible loss of principal. Stock prices fluctuate, sometimes rapidly and dramatically, due to factors affecting individual companies, particular industries or sectors, or general market conditions. The Fund’s portfolio includes a substantial portion of higher yielding, lower rated corporate bonds because of the relatively higher yields they offer. The Fund’s share price and yield will be affected by interest rate movements. Bond prices generally move in the opposite direction of interest rates. Thus, as prices of bonds in the Fund adjust to a rise in interest rates, the Fund’s share price may decline. Changes in the financial strength of a bond issuer or in a bond’s credit rating may affect its value. Foreign investing carries additional risks such as currency and market volatility and political or social instability, risks that are heightened in developing countries. The Fund is actively managed but there is no guarantee that the manager’s investment decisions will produce the desired results. The Fund’s prospectus also includes a description of the main investment risks.
Performance Overview
You can find the Fund’s six-month total return in the Performance Summary. For comparison, the Fund’s equity benchmark, the Standard & Poor’s® 500 Index (S&P 500®), posted a +2.65% total return, and its fixed income benchmark, the Bloomberg Barclays US Aggregate Bond Index, had a -1.62% total return for the same period.1
Economic and Market Overview
The US economy continued to grow during the six months under review. After moderating for three consecutive quarters, the economy grew faster in 2018’s second quarter, driven by consumer spending, exports, business investment and government spending. The manufacturing and services sectors expanded during the period. The unemployment rate declined slightly from 4.1% in December 2017, as reported at the
Portfolio Composition
6/30/18
% of Total Net Assets | ||
| Equity* | 48.7% | |
| Utilities | 7.0% | |
| Energy | 7.0% | |
| Financials | 6.9% | |
| Health Care | 5.6% | |
| Information Technology | 5.1% | |
| Consumer Discretionary | 3.9% | |
| Consumer Staples | 3.9% | |
| Industrials | 3.6% | |
| Materials | 3.5% | |
| Telecommunication Services | 1.6% | |
| Real Estate | 0.6% | |
| Fixed Income | 47.6% | |
| Health Care | 11.6% | |
| Financials | 10.8% | |
| Energy | 7.8% | |
| Consumer Discretionary | 6.6% | |
| Telecommunication Services | 3.1% | |
| Information Technology | 1.8% | |
| Utilities | 1.7% | |
| Industrials | 1.7% | |
| Consumer Staples | 1.0% | |
| Materials | 0.9% | |
| Real Estate | 0.6% | |
| Short-Term Investments & Other Net Assets | 3.7% | |
| *Includes convertible bonds. |
beginning of the six-month period, to 4.0% at period-end.2 Annual inflation, as measured by the Consumer Price Index, increased from 2.1% in December 2017, as reported at the beginning of the period, to 2.9% at period-end.2
In February 2018, the new US Federal Reserve (Fed) Chair Jerome Powell spoke before Congress for the first time and indicated the Fed saw signs of a continued strong labor market and economic growth. He reiterated the Fed’s intention to gradually raise interest rates in an effort to keep the economy from overheating and as inflation increases toward the Fed’s target. However, he noted there was no evidence of the economy overheating and he had yet to see a clear upward move in wages. The Fed raised its target range for the federal
1. Source: Morningstar. One cannot invest directly in an index, and an index is not representative of the Fund’s portfolio. Please see Index Descriptions following the Fund Summaries.
2. Source: Bureau of Labor Statistics.
The dollar value, number of shares or principal amount, and names of all portfolio holdings are listed in the Fund’s Statement of Investments (SOI).
| FI-2 | Semiannual Report | |||
FRANKLIN INCOME VIP FUND
funds rate 0.25% each at its March and June 2018 meetings to 1.75%–2.00% and continued reducing its balance sheet as part of its ongoing plan to normalize monetary policy. In June, the Fed upgraded its economic forecast for 2018 and its inflation forecasts for 2018 and 2019. Furthermore, the Fed forecasted an additional rate hike for 2018 and 2019 than previously anticipated.
The 10-year Treasury yield, which moves inversely to its price, increased during the period. The yield rose to multi-year highs in February, April and May amid indications of higher inflation. However, some factors weighed on the Treasury yield at certain points during the period, including concerns about political turmoil in Italy, political uncertainties in the US, the Trump administration’s protectionist trade policies, and US trade disputes between its allies and China. Overall, the 10-year Treasury yield rose from 2.40% at the beginning of the period to 2.85% at period-end.
Investment Strategy
We search for undervalued or out-of-favor securities we believe offer opportunities for income today and significant growth tomorrow. We generally perform independent analysis of the debt securities being considered for the Fund’s portfolio, as opposed to relying principally on ratings assigned by rating agencies. In analyzing debt and equity securities, we consider a variety of factors, including a security’s relative value based on such factors as anticipated cash flow, interest or dividend coverage, asset coverage, and earnings prospects; the experience and strength of a company’s management; a company’s changing financial condition and market recognition of the change; a company’s sensitivity to changes in interest rates and business conditions; and a company’s debt maturity schedules and borrowing requirements.
Manager’s Discussion
During the six months under review, we actively continued to manage the Fund’s multi-asset strategy relative to the opportunities available to us, while also remaining focused on bottom-up investing and individual security selection. Our view has been that the investment performance of securities within the Fund should be driven primarily by company-specific initiatives and opportunities, and secondarily by broader market or interest-rate movements. We strategically reduced our equity weighting from 56.6% to 48.7% due to relative value concerns and market strength versus other asset classes, as well as higher realized and anticipated volatility. We increased our fixed
Top Five Equity Holdings 6/30/18
| ||||
Company Sector/Industry | % of Total Net Assets | |||
| Wells Fargo & Co. Banks | 2.4% | |||
| The Southern Co. Utilities | 1.8% | |||
| Dominion Energy Inc. Utilities | 1.8% | |||
| General Electric Co. Industrials | 1.5% | |||
| Sempra Energy Utilities | 1.5% | |||
income weighting from 36.4% to 47.6% as interest rates rose. The Fund’s cash position decreased from 7.0% to 3.7% of total net assets.
Within equity, most sectors represented in the Fund’s portfolio delivered positive returns, with the largest contributions to absolute performance coming from information technology (IT), energy and consumer discretionary.
Within the IT sector, Microsoft, Apple and Intel contributed significantly to absolute results. In energy, companies levered to an improvement in oil prices tended to perform well, including oil and gas exploration and production companies Anadarko Petroleum, Royal Dutch Shell, Chevron, BP, Occidental Petroleum and Halliburton3. We took advantage of recent strength to reduce our positions in Royal Dutch Shell, BP and Chevron, while we added to our position in Exxon Mobile as the company has underperformed its peers thus far this year. In the consumer discretionary sector, retailer Target and automobile manufacturer General Motors3 benefited absolute results, and we reduced our holdings in the companies during the period.
In utilities, we increased our position as the sector came under pressure from rising interest rates and the negative impact of tax law changes. We added to our existing positions in Southern Co., Sempra Energy and Dominion Energy, and we initiated a position in Xcel Energy.
Equity sectors that detracted from the Fund’s absolute performance included financials, largely due to fears of an economic slowdown and potential weaker loan growth. Company-specific concerns led to weakness in large bank Wells Fargo, insurer MetLife and mortgage company Fannie
3. Not held at period-end.
| Semiannual Report | FI-3 | |||||
FRANKLIN INCOME VIP FUND
Mae. The industrials sector also hindered results, largely due to weakness in shares of industrial conglomerate General Electric. The consumer staples sector declined and detracted from performance, largely driven by concerns regarding growth in emerging-market economies and company-specific issues. Key sector detractors during the period included tobacco firm Philip Morris International, food and beverage company PepsiCo and beverages manufacturer Anheuser-Busch Inbev.
In fixed income, most sectors and industries represented in the Fund contributed to absolute performance, largely due to our bias toward issuers with strong credit fundamentals and bonds with shorter maturities. Hospitals and pharmaceuticals companies recovered during the period as fundamentals stabilized or improved and as upcoming maturities were extended.4 Contributors included hospital operator Community Health Systems, which addressed its short-term debt maturities through a successful exchange into new debt with better seniority. Fundamentals for health care services provider Tenet Healthcare stabilized, which supported its debt securities. Pharmaceuticals and medical devices firm Valeant Pharmaceuticals International also benefited the Fund’s absolute performance as it continued to make progress on improving its balance sheet.
Energy holdings generally performed well during the period amid higher oil prices and stable natural gas markets. Key contributors included Chesapeake Energy, W&T Offshore, Weatherford International, Ascent Resources Utica Holdings and Calumet Specialty Products.
Our position in DISH DBS was the main detractor during the period as its nationwide satellite video business experienced subscriber losses, due to secular changes within the industry, and as competing spectrum blocks on offer impacted the perceived value of its spectrum portfolio. However, the company continued to generate strong free cash flow to service its debt with strong asset coverage from the underlying value of its pay TV business. Smaller positions such as Belk, Rex Energy3 and Sanchez Energy also detracted. Department store operator Belk suffered from worsening comparable store sales and a decline in profitability, while the two energy holdings were impacted by their excessive debt balances amid a decline in US benchmark crude oil prices from recent highs.
During the reporting period, we modestly increased our exposure to corporate securities through select purchases of investment-grade corporate bonds, which have generally
| Top Five Fixed Income Holdings and Senior Floating Rate Interests* | ||||
6/30/18
| ||||
| Company Sector/Industry | % of Total Net Assets | |||
| U.S. Treasury Note Financials | 6.5% | |||
| CHS/Community Health Systems Inc. Health Care | 3.9% | |||
| Chesapeake Energy Corp. Energy | 2.6% | |||
| Tenet Healthcare Corp. Health Care | 2.0% | |||
| Weatherford International Ltd. Energy | 1.7% | |||
*Does not include convertible bonds.
underperformed both high-yield bonds and the broader fixed income asset class, as they looked more attractive to us on a relative value basis. Key additions included Capital One Financial, Citigroup, CVS Health, General Motors, Goldman Sachs and Mylan. We initiated a position in short- and intermediate-term US Treasury securities, with a particular emphasis on shorter maturities as interest rates moved up with Fed tightening. This move was largely in response to what we viewed as fuller valuations in many other asset classes, as well as a desire to help offset potentially higher volatility in the future.
Thank you for your participation in Franklin Income VIP Fund. We look forward to serving your future investment needs.
The foregoing information reflects our analysis, opinions and portfolio holdings as of June 30, 2018, the end of the reporting period. The way we implement our main investment strategies and the resulting portfolio holdings may change depending on factors such as market and economic conditions. These opinions may not be relied upon as investment advice or an offer for a particular security. The information is not a complete analysis of every aspect of any market, country, industry, security or the Fund. Statements of fact are from sources considered reliable, but the investment manager makes no representation or warranty as to their completeness or accuracy. Although historical performance is no guarantee of future results, these insights may help you understand our investment management philosophy.
4. Hospitals and pharmaceuticals holdings are in health care in the fixed income section of the SOI.
| FI-4 | Semiannual Report | |||
FRANKLIN INCOME VIP FUND
Class 2 Fund Expenses
As an investor in a variable insurance contract (Contract) that indirectly provides for investment in an underlying mutual fund, you can incur transaction and/or ongoing expenses at both the Fund level and the Contract Level: (1) transaction expenses can include sales charges (loads) on purchases, surrender fees, transfer fees and premium taxes; and (2) ongoing expenses can include management fees, distribution and service (12b-1) fees, contract fees, annual maintenance fees, mortality and expense risk fees and other fees and expenses. All mutual funds and Contracts have some types of ongoing expenses. The table below shows Fund-level ongoing expenses and can help you understand these costs and compare them with those of other mutual funds offered through the Contract. The table assumes a $1,000 investment held for the six months indicated. Please refer to the Fund prospectus for additional information on operating expenses.
Actual Fund Expenses
The table below provides information about the actual account values and actual expenses in the columns under the heading “Actual.” In these columns the Fund’s actual return, which includes the effect of ongoing Fund expenses but does not include the effect of ongoing Contract expenses, is used to calculate the “Ending Account Value.” You can estimate the Fund-level expenses you paid during the period by following these steps (of course, your account value and expenses will differ from those in this illustration): Divide your account value by $1,000 (if your account had an $8,600 value, then $8,600 ÷ $1,000 = 8.6). Then multiply the result by the number under the headings “Actual” and “Fund-Level Expenses Paid During Period” (if Fund-Level Expenses Paid During Period were $ 7.50, then 8.6 x $ 7.50 = $64.50). In this illustration, the estimated expenses paid this period at the Fund level are $64.50.
Hypothetical Example for Comparison with Other Mutual Funds
Under the heading “Hypothetical” in the table, information is provided about hypothetical account values and hypothetical expenses based on the Fund’s actual expense ratio and an assumed rate of return of 5% per year before expenses, which is not the Fund’s actual return. This information may not be used to estimate the actual ending account balance or expenses you paid for the period, but it can help you compare ongoing costs of investing in the Fund with those of other mutual funds offered through the Contract. To do so, compare this 5% hypothetical example with the 5% hypothetical examples that appear in the shareholder reports of other funds offered through the Contract.
Please note that expenses shown in the table are meant to highlight ongoing costs at the Fund level only and do not reflect any ongoing expenses at the Contract level, or transaction expenses at either the Fund or Contract levels. In addition, while the Fund does not have transaction expenses, if the transaction and ongoing expenses at the Contract level were included, the expenses shown below would be higher. You should consult your Contract prospectus or disclosure document for more information.
| Actual (actual return after expenses) | Hypothetical (5% annual return before expenses) | |||||||||||||||||
Share Class | Beginning Account Value 1/1/18 | Ending Account Value 6/30/18 | Fund-Level Paid During | Ending Account Value 6/30/18 | Fund-Level Paid During Period 1/1/18–6/30/181,2 | Net Annualized Expense Ratio2 | ||||||||||||
Class 2 | $1,000 | $1,007.60 | $3.48 | $1,021.32 | $3.51 | 0.70% | ||||||||||||
1. Expenses are equal to the annualized expense ratio for the six-month period as indicated above—in the far right column—multiplied by the simple average account value over the period indicated, and then multiplied by 181/365 to reflect the one-half year period.
2. Reflects expenses after fee waivers and expense reimbursements. Does not include any ongoing expenses of the Contract for which the Fund is an investment option or acquired fund fees and expenses.
| Semiannual Report | FI-5 | |||
FRANKLIN TEMPLETON VARIABLE INSURANCE PRODUCTS TRUST
Financial Highlights
Franklin Income VIP Fund
Six Months Ended June 30, 2018 (unaudited) | Year Ended December 31, | |||||||||||||||||||||||
| 2017 | 2016 | 2015 | 2014 | 2013 | ||||||||||||||||||||
| ||||||||||||||||||||||||
Class 1 | ||||||||||||||||||||||||
Per share operating performance (for a share outstanding throughout the period) | ||||||||||||||||||||||||
Net asset value, beginning of period | $16.72 | $15.87 | $14.64 | $16.48 | $16.53 | $15.47 | ||||||||||||||||||
|
| |||||||||||||||||||||||
Income from investment operationsa: | ||||||||||||||||||||||||
Net investment incomeb | 0.37 | 0.69 | 0.67 | 0.71 | 0.72 | 0.81 | ||||||||||||||||||
Net realized and unrealized gains (losses) | (0.22 | ) | 0.87 | 1.34 | (1.78 | ) | 0.11 | 1.31 | ||||||||||||||||
|
| |||||||||||||||||||||||
Total from investment operations | 0.15 | 1.56 | 2.01 | (1.07 | ) | 0.83 | 2.12 | |||||||||||||||||
|
| |||||||||||||||||||||||
Less distributions from net investment income | (0.82 | ) | (0.71 | ) | (0.78 | ) | (0.77 | ) | (0.88 | ) | (1.06) | |||||||||||||
|
| |||||||||||||||||||||||
Net asset value, end of period | $16.05 | $16.72 | $15.87 | $14.64 | $16.48 | $16.53 | ||||||||||||||||||
|
| |||||||||||||||||||||||
Total returnc | 0.87% | 9.94% | 14.33% | (6.84)% | 4.92% | 14.18% | ||||||||||||||||||
Ratios to average net assetsd | ||||||||||||||||||||||||
Expenses before waiver and payments by affiliates | 0.47% | 0.47% | 0.47% | 0.46% | 0.47% | 0.47% | ||||||||||||||||||
Expenses net of waiver and payments by affiliatese | 0.45% | 0.45% | 0.44% | 0.46% | f | 0.47% | 0.47% | |||||||||||||||||
Net investment income | 4.44% | 4.22% | 4.47% | 4.47% | 4.26% | 5.07% | ||||||||||||||||||
Supplemental data | ||||||||||||||||||||||||
Net assets, end of period (000’s) | $695,523 | $735,149 | $696,227 | $604,228 | $714,664 | $695,004 | ||||||||||||||||||
Portfolio turnover rate | 33.09% | 20.96% | 39.03% | 31.53% | 24.77% | 21.71% | ||||||||||||||||||
aThe amount shown for a share outstanding throughout the period may not correlate with the Statement of Operations for the period due to the timing of sales and repurchases of the Fund’s shares in relation to income earned and/or fluctuating fair value of the investments of the Fund.
bBased on average daily shares outstanding.
cTotal return does not include fees, charges or expenses imposed by the variable annuity and life insurance contracts for which Franklin Templeton Variable Insurance Products Trust serves as an underlying investment vehicle. Total return is not annualized for periods less than one year.
dRatios are annualized for periods less than one year.
eBenefit of expense reduction rounds to less than 0.01%.
fBenefit of waiver and payments by affiliates rounds to less than 0.01%.
| FI-6 | Semiannual Report | The accompanying notes are an integral part of these financial statements. | |||
FRANKLIN TEMPLETON VARIABLE INSURANCE PRODUCTS TRUST
FINANCIAL HIGHLIGHTS
Franklin Income VIP Fund (continued)
Six Months Ended June 30, 2018 (unaudited) | Year Ended December 31, | |||||||||||||||||||||||
| 2017 | 2016 | 2015 | 2014 | 2013 | ||||||||||||||||||||
| ||||||||||||||||||||||||
| Class 2 | ||||||||||||||||||||||||
| Per share operating performance (for a share outstanding throughout the period) | ||||||||||||||||||||||||
Net asset value, beginning of period | $16.17 | $15.38 | $14.20 | $16.00 | $16.07 | $15.07 | ||||||||||||||||||
|
| |||||||||||||||||||||||
Income from investment operationsa: | ||||||||||||||||||||||||
Net investment incomeb | 0.33 | 0.63 | 0.61 | 0.65 | 0.66 | 0.75 | ||||||||||||||||||
Net realized and unrealized gains (losses) | (0.20 | ) | 0.83 | 1.31 | (1.73 | ) | 0.11 | 1.27 | ||||||||||||||||
|
| |||||||||||||||||||||||
Total from investment operations | 0.13 | 1.46 | 1.92 | (1.08 | ) | 0.77 | 2.02 | |||||||||||||||||
|
| |||||||||||||||||||||||
Less distributions from net investment income . | (0.78 | ) | (0.67 | ) | (0.74 | ) | (0.72 | ) | (0.84 | ) | (1.02) | |||||||||||||
|
| |||||||||||||||||||||||
Net asset value, end of period | $15.52 | $16.17 | $15.38 | $14.20 | $16.00 | $16.07 | ||||||||||||||||||
|
| |||||||||||||||||||||||
Total returnc | 0.76% | 9.67% | 14.02% | (7.05)% | 4.62% | 13.94% | ||||||||||||||||||
Ratios to average net assetsd | ||||||||||||||||||||||||
Expenses before waiver and payments by affiliates | 0.72% | 0.72% | 0.72% | 0.71% | 0.72% | 0.72% | ||||||||||||||||||
Expenses net of waiver and payments by affiliatese | 0.70% | 0.70% | 0.69% | 0.71%f | 0.72% | 0.72% | ||||||||||||||||||
Net investment income | 4.19% | 3.97% | 4.22% | 4.22% | 4.01% | 4.82% | ||||||||||||||||||
Supplemental data | ||||||||||||||||||||||||
Net assets, end of period (000’s) | $4,732,266 | $5,041,498 | $5,088,556 | $4,907,599 | $6,022,804 | $6,188,045 | ||||||||||||||||||
Portfolio turnover rate | 33.09% | 20.96% | 39.03% | 31.53% | 24.77% | 21.71% | ||||||||||||||||||
aThe amount shown for a share outstanding throughout the period may not correlate with the Statement of Operations for the period due to the timing of sales and repurchases of the Fund’s shares in relation to income earned and/or fluctuating fair value of the investments of the Fund.
bBased on average daily shares outstanding.
cTotal return does not include fees, charges or expenses imposed by the variable annuity and life insurance contracts for which Franklin Templeton Variable Insurance Products Trust serves as an underlying investment vehicle. Total return is not annualized for periods less than one year.
dRatios are annualized for periods less than one year.
eBenefit of expense reduction rounds to less than 0.01%.
fBenefit of waiver and payments by affiliates rounds to less than 0.01%.
| The accompanying notes are an integral part of these financial statements. | Semiannual Report | FI-7 | |||||
FRANKLIN TEMPLETON VARIABLE INSURANCE PRODUCTS TRUST
FINANCIAL HIGHLIGHTS
Franklin Income VIP Fund (continued)
Six Months Ended (unaudited) | Year Ended December 31, | |||||||||||||||||||||||
| 2017 | 2016 | 2015 | 2014 | 2013 | ||||||||||||||||||||
| ||||||||||||||||||||||||
| Class 4 | ||||||||||||||||||||||||
| Per share operating performance (for a share outstanding throughout the period) | ||||||||||||||||||||||||
Net asset value, beginning of period | $16.53 | $15.71 | $14.49 | $16.31 | $16.36 | $15.32 | ||||||||||||||||||
|
| |||||||||||||||||||||||
Income from investment operationsa: | ||||||||||||||||||||||||
Net investment incomeb | 0.33 | 0.62 | 0.61 | 0.65 | 0.66 | 0.75 | ||||||||||||||||||
Net realized and unrealized gains (losses) | (0.21 | ) | 0.85 | 1.33 | (1.76 | ) | 0.11 | 1.30 | ||||||||||||||||
|
| |||||||||||||||||||||||
Total from investment operations | 0.12 | 1.47 | 1.94 | (1.11 | ) | 0.77 | 2.05 | |||||||||||||||||
|
| |||||||||||||||||||||||
Less distributions from net investment income | (0.76 | ) | (0.65 | ) | (0.72 | ) | (0.71 | ) | (0.82 | ) | (1.01) | |||||||||||||
|
| |||||||||||||||||||||||
Net asset value, end of period | $15.89 | $16.53 | $15.71 | $14.49 | $16.31 | $16.36 | ||||||||||||||||||
|
| |||||||||||||||||||||||
Total returnc | 0.72% | 9.55% | 13.87% | (7.15)% | 4.52% | 13.85% | ||||||||||||||||||
Ratios to average net assetsd | ||||||||||||||||||||||||
Expenses before waiver and payments by affiliates | 0.82% | 0.82% | 0.82% | 0.81% | 0.82% | 0.82% | ||||||||||||||||||
Expenses net of waiver and payments by affiliatese | 0.80% | 0.80% | 0.79% | 0.81% | f | 0.82% | 0.82% | |||||||||||||||||
Net investment income | 4.09% | 3.87% | 4.12% | 4.12% | 3.91% | 4.72% | ||||||||||||||||||
Supplemental data | ||||||||||||||||||||||||
Net assets, end of period (000’s) | $326,331 | $335,217 | $309,935 | $306,023 | $378,545 | $397,652 | ||||||||||||||||||
Portfolio turnover rate | 33.09% | 20.96% | 39.03% | 31.53% | 24.77% | 21.71% | ||||||||||||||||||
aThe amount shown for a share outstanding throughout the period may not correlate with the Statement of Operations for the period due to the timing of sales and repurchases of the Fund’s shares in relation to income earned and/or fluctuating fair value of the investments of the Fund.
bBased on average daily shares outstanding.
cTotal return does not include fees, charges or expenses imposed by the variable annuity and life insurance contracts for which Franklin Templeton Variable Insurance Products Trust serves as an underlying investment vehicle. Total return is not annualized for periods less than one year.
dRatios are annualized for periods less than one year.
eBenefit of expense reduction rounds to less than 0.01%.
fBenefit of waiver and payments by affiliates rounds to less than 0.01%.
| FI-8 | Semiannual Report | The accompanying notes are an integral part of these financial statements. | |||
FRANKLIN TEMPLETON VARIABLE INSURANCE PRODUCTS TRUST
Statement of Investments, June 30, 2018 (unaudited)
Franklin Income VIP Fund
| Country | Shares | Value | ||||||||||||
| ||||||||||||||
Common Stocks 39.0% | ||||||||||||||
Consumer Discretionary 1.9% | ||||||||||||||
Comcast Corp., A | United States | 800,000 | $ | 26,248,000 | ||||||||||
Ford Motor Co. | United States | 3,138,995 | 34,748,675 | |||||||||||
Target Corp. | United States | 650,000 | 49,478,000 | |||||||||||
|
| |||||||||||||
| 110,474,675 | ||||||||||||||
|
| |||||||||||||
Consumer Staples 3.9% | ||||||||||||||
Anheuser-Busch InBev SA/NV, ADR | Belgium | 512,500 | 51,639,500 | |||||||||||
The Coca-Cola Co. | United States | 700,000 | 30,702,000 | |||||||||||
Nestle SA | Switzerland | 400,000 | 31,058,158 | |||||||||||
PepsiCo Inc. | United States | 384,000 | 41,806,080 | |||||||||||
Philip Morris International Inc. | United States | 350,000 | 28,259,000 | |||||||||||
The Procter & Gamble Co. | United States | 500,000 | 39,030,000 | |||||||||||
|
| |||||||||||||
| 222,494,738 | ||||||||||||||
|
| |||||||||||||
Energy 5.7% | ||||||||||||||
a Anadarko Petroleum Corp. | United States | 400,000 | 29,300,000 | |||||||||||
Baker Hughes a GE Co., A | United States | 725,000 | 23,946,750 | |||||||||||
BP PLC, ADR | United Kingdom | 750,000 | 34,245,000 | |||||||||||
Chevron Corp. | United States | 400,000 | 50,572,000 | |||||||||||
Exxon Mobil Corp. | United States | 500,000 | 41,365,000 | |||||||||||
Occidental Petroleum Corp. | United States | 286,000 | 23,932,480 | |||||||||||
Royal Dutch Shell PLC, A, ADR | United Kingdom | 1,100,000 | 76,153,000 | |||||||||||
b Talos Energy Inc. | United States | 506,006 | 16,257,973 | |||||||||||
TransCanada Corp. | Canada | 350,000 | 15,120,000 | |||||||||||
b Weatherford International PLC | United States | 143,200 | 471,128 | |||||||||||
The Williams Cos. Inc. | United States | 500,000 | 13,555,000 | |||||||||||
|
| |||||||||||||
| 324,918,331 | ||||||||||||||
|
| |||||||||||||
Financials 5.7% | ||||||||||||||
Bank of America Corp. | United States | 1,000,000 | 28,190,000 | |||||||||||
HSBC Holdings PLC | United Kingdom | 3,500,000 | 32,849,263 | |||||||||||
JPMorgan Chase & Co. | United States | 600,000 | 62,520,000 | |||||||||||
MetLife Inc. | United States | 1,095,108 | 47,746,709 | |||||||||||
U.S. Bancorp | United States | 700,000 | 35,014,000 | |||||||||||
Wells Fargo & Co. | United States | 2,200,000 | 121,968,000 | |||||||||||
|
| |||||||||||||
| 328,287,972 | ||||||||||||||
|
| |||||||||||||
Health Care 5.1% | ||||||||||||||
AstraZeneca PLC | United Kingdom | 900,000 | 62,434,003 | |||||||||||
Eli Lilly & Co. | United States | 300,000 | 25,599,000 | |||||||||||
Johnson & Johnson | United States | 230,000 | 27,908,200 | |||||||||||
a Medtronic PLC | United States | 525,000 | 44,945,250 | |||||||||||
Merck & Co. Inc. | United States | 806,100 | 48,930,270 | |||||||||||
Pfizer Inc. | United States | 2,238,975 | 81,230,013 | |||||||||||
Sanofi, ADR | France | 89,292 | 3,572,573 | |||||||||||
|
| |||||||||||||
| 294,619,309 | ||||||||||||||
|
| |||||||||||||
Industrials 2.5% | ||||||||||||||
3M Co. | United States | 125,000 | 24,590,000 | |||||||||||
b,c CEVA Logistics AG | Switzerland | 283,295 | 6,378,320 | |||||||||||
Cummins Inc. | United States | 200,000 | 26,600,000 | |||||||||||
General Electric Co. | United States | 6,500,000 | 88,465,000 | |||||||||||
|
| |||||||||||||
| 146,033,320 | ||||||||||||||
|
| |||||||||||||
| Semiannual Report | FI-9 | |||||
FRANKLIN TEMPLETON VARIABLE INSURANCE PRODUCTS TRUST
STATEMENT OF INVESTMENTS (UNAUDITED)
Franklin Income VIP Fund (continued)
| Country | Shares | Value | ||||||||||||
| ||||||||||||||
Common Stocks (continued) | ||||||||||||||
Information Technology 2.1% | ||||||||||||||
Analog Devices Inc. | United States | 150,000 | $ | 14,388,000 | ||||||||||
Apple Inc. | United States | 153,317 | 28,380,510 | |||||||||||
Applied Materials Inc. | United States | 286,000 | 13,210,340 | |||||||||||
Microsoft Corp. | United States | 632,500 | 62,370,825 | |||||||||||
|
| |||||||||||||
| 118,349,675 | ||||||||||||||
|
| |||||||||||||
Materials 3.5% | ||||||||||||||
BASF SE | Germany | 700,000 | 66,989,684 | |||||||||||
DowDuPont Inc. | United States | 1,000,000 | 65,920,000 | |||||||||||
Rio Tinto PLC, ADR | United Kingdom | 1,250,000 | 69,350,000 | |||||||||||
|
| |||||||||||||
| 202,259,684 | ||||||||||||||
|
| |||||||||||||
Real Estate 0.6% | ||||||||||||||
Host Hotels & Resorts Inc. | United States | 1,500,000 | 31,605,000 | |||||||||||
|
| |||||||||||||
Telecommunication Services 1.6% | ||||||||||||||
BCE Inc. | Canada | 466,000 | 18,878,283 | |||||||||||
Verizon Communications Inc. | United States | 1,475,000 | 74,207,250 | |||||||||||
|
| |||||||||||||
| 93,085,533 | ||||||||||||||
|
| |||||||||||||
Utilities 6.4% | ||||||||||||||
Dominion Energy Inc. | United States | 1,501,638 | 102,381,679 | |||||||||||
Duke Energy Corp. | United States | 702,500 | 55,553,700 | |||||||||||
Sempra Energy | United States | 720,000 | 83,599,200 | |||||||||||
The Southern Co. | United States | 2,250,000 | 104,197,500 | |||||||||||
Xcel Energy Inc. | United States | 500,000 | 22,840,000 | |||||||||||
|
| |||||||||||||
| 368,572,079 | ||||||||||||||
|
| |||||||||||||
Total Common Stocks (Cost $1,903,937,850) | 2,240,700,316 | |||||||||||||
|
| |||||||||||||
d Equity-Linked Securities 6.8% | ||||||||||||||
Consumer Discretionary 2.0% | ||||||||||||||
e Merrill Lynch International & Co. CV into General Motor Co., 8.00%, 144A | United States | 1,425,000 | 58,006,287 | |||||||||||
e Wells Fargo Bank National Assn. into Ford Motor Co., 8.50%, 144A | United States | 2,500,000 | 28,463,517 | |||||||||||
e Wells Fargo Bank National Assn. into Target Corp., 8.00%, 144A | United States | 400,000 | 31,064,579 | |||||||||||
|
| |||||||||||||
| 117,534,383 | ||||||||||||||
|
| |||||||||||||
Energy 0.7% | ||||||||||||||
e UBS AG London into Halliburton Co., 7.00%, 144A | United States | 840,000 | 39,402,742 | |||||||||||
|
| |||||||||||||
Industrials 1.1% | ||||||||||||||
e Deutsche Bank AG/London into Union Pacific Corp., 6.50%, 144A | United States | 450,000 | 64,579,691 | |||||||||||
|
| |||||||||||||
Information Technology 3.0% | ||||||||||||||
e Citigroup Global Markets Holdings Inc. into Texas Instruments Inc., 7.00%, 144A | United States | 520,000 | 58,197,667 | |||||||||||
e Royal Bank of Canada into Apple Inc., 6.50%, 144A | United States | 310,000 | 57,241,258 | |||||||||||
e Wells Fargo Bank National Assn. into Intel Corp., 8.00%, 144A | United States | 1,100,000 | 56,551,379 | |||||||||||
|
| |||||||||||||
| 171,990,304 | ||||||||||||||
|
| |||||||||||||
Total Equity-Linked Securities (Cost $410,123,900) | 393,507,120 | |||||||||||||
|
| |||||||||||||
Convertible Preferred Stocks 1.8% | ||||||||||||||
Financials 1.2% | ||||||||||||||
Bank of America Corp., 7.25%, cvt. pfd., L | United States | 34,600 | 43,267,300 | |||||||||||
b FNMA, 5.375%, cvt. pfd | United States | 475 | 9,262,500 | |||||||||||
Wells Fargo & Co., 7.50%, cvt. pfd., L | United States | 12,400 | 15,617,304 | |||||||||||
|
| |||||||||||||
| 68,147,104 | ||||||||||||||
|
| |||||||||||||
| FI-10 | Semiannual Report | |||
FRANKLIN TEMPLETON VARIABLE INSURANCE PRODUCTS TRUST
STATEMENT OF INVESTMENTS (UNAUDITED)
Franklin Income VIP Fund (continued)
| Country | Shares | Value | ||||||||||||
| ||||||||||||||
Convertible Preferred Stocks (continued) | ||||||||||||||
Utilities 0.6% | ||||||||||||||
NextEra Energy Inc., 6.371%, cvt. pfd | United States | 500,000 | $ | 37,162,500 | ||||||||||
|
| |||||||||||||
Total Convertible Preferred Stocks (Cost $97,872,788) | 105,309,604 | |||||||||||||
|
| |||||||||||||
| Units | ||||||||||||||
|
| |||||||||||||
f Index-Linked Notes (Cost $14,054,540) 0.3% | ||||||||||||||
Financials 0.3% | ||||||||||||||
| e,g Morgan Stanley Finance LLC, senior note, 144A, 5.62%, 10/03/19 | United States | 106,000 | 14,320,600 | |||||||||||
|
| |||||||||||||
| Principal Amount* | ||||||||||||||
|
| |||||||||||||
Convertible Bonds 1.1% | ||||||||||||||
Energy 0.6% | ||||||||||||||
Chesapeake Energy Corp., cvt., senior note, 5.50%, 9/15/26 | United States | 10,000,000 | 10,190,800 | |||||||||||
Weatherford International Ltd., cvt., senior note, 5.875%, 7/01/21 | United States | 22,000,000 | 21,705,860 | |||||||||||
|
| |||||||||||||
| 31,896,660 | ||||||||||||||
|
| |||||||||||||
Health Care 0.5% | ||||||||||||||
e Bayer Capital Corp BV, cvt., junior sub. note, 144A, 5.625%, 11/22/19 | Germany | 25,000,000 | EUR | 31,196,698 | ||||||||||
|
| |||||||||||||
Total Convertible Bonds (Cost $58,017,168) | 63,093,358 | |||||||||||||
|
| |||||||||||||
Corporate Bonds 36.1% | ||||||||||||||
Consumer Discretionary 4.3% | ||||||||||||||
e 24 Hour Holdings III LLC, senior note, 144A, 8.00%, 6/01/22 | United States | 6,300,000 | 6,285,006 | |||||||||||
AMC Entertainment Holdings Inc., senior sub. note, 5.875%, 11/15/26 | United States | 10,000,000 | 9,650,000 | |||||||||||
CCO Holdings LLC/CCO Holdings Capital Corp., | ||||||||||||||
senior bond, 5.125%, 2/15/23 | United States | 10,000,000 | 9,921,900 | |||||||||||
senior bond, 5.75%, 1/15/24 | United States | 9,000,000 | 9,045,000 | |||||||||||
e senior bond, 144A, 5.50%, 5/01/26 | United States | 10,000,000 | 9,722,000 | |||||||||||
e senior bond, 144A, 5.00%, 2/01/28 | United States | 5,000,000 | 4,600,000 | |||||||||||
DISH DBS Corp., | ||||||||||||||
senior bond, 5.875%, 7/15/22 | United States | 40,000,000 | 37,750,000 | |||||||||||
senior bond, 5.00%, 3/15/23 | United States | 35,000,000 | 30,493,750 | |||||||||||
senior note, 5.875%, 11/15/24 | United States | 9,400,000 | 7,990,000 | |||||||||||
Fiat Chrysler Automobiles NV, senior note, 5.25%, 4/15/23 | United Kingdom | 9,300,000 | 9,385,560 | |||||||||||
Ford Motor Co., senior note, 4.346%, 12/08/26 | United States | 4,300,000 | 4,211,180 | |||||||||||
General Motors Co., senior bond, 5.15%, 4/01/38 | United States | 16,000,000 | 15,273,649 | |||||||||||
h iHeartCommunications Inc., senior secured note, first lien, 9.00%, 12/15/19 | United States | 16,600,000 | 12,657,500 | |||||||||||
KB Home, senior bond, 7.50%, 9/15/22 | United States | 3,400,000 | 3,683,186 | |||||||||||
e Shea Homes LP/Shea Homes Funding Corp., | ||||||||||||||
senior bond, 144A, 6.125%, 4/01/25 | United States | 8,000,000 | 8,000,000 | |||||||||||
senior note, 144A, 5.875%, 4/01/23 | United States | 5,000,000 | 5,031,250 | |||||||||||
e Sirius XM Radio Inc., senior bond, 144A, 6.00%, 7/15/24 | United States | 7,500,000 | 7,659,375 | |||||||||||
e,iTesla Inc., senior note, 144A, 5.30%, 8/15/25 | United States | 10,000,000 | 8,937,500 | |||||||||||
e Univision Communications Inc., | ||||||||||||||
senior secured note, first lien, 144A, 5.125%, 5/15/23 | United States | 15,000,000 | 14,437,500 | |||||||||||
senior secured note, first lien, 144A, 5.125%, 2/15/25 | United States | 7,140,000 | 6,613,425 | |||||||||||
| Semiannual Report | FI-11 | |||||
FRANKLIN TEMPLETON VARIABLE INSURANCE PRODUCTS TRUST
STATEMENT OF INVESTMENTS (UNAUDITED)
Franklin Income VIP Fund (continued)
| Country | Principal Amount* | Value | ||||||||||||
| ||||||||||||||
Corporate Bonds (continued) | ||||||||||||||
Consumer Discretionary (continued) | ||||||||||||||
e Virgin Media Secured Finance PLC, senior secured bond, first lien, 144A, 5.50%, 1/15/25 | United Kingdom | 7,000,000 | $ | 6,825,000 | ||||||||||
e Wynn Las Vegas LLC/Wynn Las Vegas Capital Corp., | ||||||||||||||
senior bond, 144A, 5.50%, 3/01/25 | United States | 13,200,000 | 13,002,000 | |||||||||||
senior bond, 144A, 5.25%, 5/15/27 | United States | 9,200,000 | 8,613,500 | |||||||||||
|
| |||||||||||||
| 249,788,281 | ||||||||||||||
|
| |||||||||||||
Consumer Staples 0.7% | ||||||||||||||
e BAT Capital Corp., senior note, 144A, 3.557%, 8/15/27 | United Kingdom | 20,000,000 | 18,647,700 | |||||||||||
e JBS USA LLC/Finance Inc., senior note, 144A, 7.25%, 6/01/21 | �� | United States | 10,900,000 | 11,063,500 | ||||||||||
Kraft Heinz Foods Co., senior bond, 4.625%, 1/30/29 | United States | 13,000,000 | 12,880,793 | |||||||||||
|
| |||||||||||||
| 42,591,993 | ||||||||||||||
|
| |||||||||||||
Energy 7.6% | ||||||||||||||
e Ascent Resources Utica Holdings LLC/ARU Finance Corp., senior note, 144A, 10.00%, 4/01/22 | United States | 25,000,000 | 27,625,000 | |||||||||||
Bill Barrett Corp., | ||||||||||||||
senior bond, 7.00%, 10/15/22 | United States | 17,937,000 | 18,026,685 | |||||||||||
senior note, 8.75%, 6/15/25 | United States | 23,400,000 | 25,155,000 | |||||||||||
Calumet Specialty Products Partners LP/Calumet Finance Corp., senior note, 6.50%, 4/15/21 | United States | 30,000,000 | 30,000,000 | |||||||||||
Chesapeake Energy Corp., | ||||||||||||||
e secured note, second lien, 144A, 8.00%, 12/15/22 | United States | 29,388,000 | 30,958,789 | |||||||||||
senior bond, 6.125%, 2/15/21 | United States | 16,000,000 | 16,280,000 | |||||||||||
i senior bond, 8.00%, 6/15/27 | United States | 26,000,000 | 26,520,000 | |||||||||||
senior note, 5.375%, 6/15/21 | United States | 12,875,000 | 12,681,875 | |||||||||||
senior note, 4.875%, 4/15/22 | United States | 5,000,000 | 4,825,000 | |||||||||||
senior note, 5.75%, 3/15/23 | United States | 5,000,000 | 4,750,000 | |||||||||||
i senior note, 8.00%, 1/15/25 | United States | 31,500,000 | 32,159,925 | |||||||||||
j senior note, FRN, 5.598%, (3-month USD LIBOR + 3.25%), 4/15/19 | United States | 9,800,000 | 9,800,000 | |||||||||||
Ferrellgas LP/Ferrellgas Finance Corp., | ||||||||||||||
senior note, 6.50%, 5/01/21 | United States | 9,500,000 | 8,763,750 | |||||||||||
senior note, 6.75%, 6/15/23 | United States | 5,000,000 | 4,387,500 | |||||||||||
Kinder Morgan Inc., | ||||||||||||||
senior bond, 7.75%, 1/15/32 | United States | 22,000,000 | 26,875,071 | |||||||||||
e senior secured bond, first lien, 144A, 5.625%, 11/15/23 | United States | 6,400,000 | 6,814,836 | |||||||||||
Sanchez Energy Corp., senior note, 7.75%, 6/15/21 | United States | 27,000,000 | 23,152,500 | |||||||||||
e Talos Production LLC/Talos Production Finance Inc., senior note, second lien, 144A, 11.00%, 4/03/22 | United States | 6,452,837 | 6,791,611 | |||||||||||
e,k W&T Offshore Inc., | ||||||||||||||
secured note, second lien, 144A, PIK, 9.00%, 5/15/20 | United States | 11,249,933 | 11,278,058 | |||||||||||
senior secured note, third lien, 144A, PIK, 10.00%, 6/15/21 | United States | 10,192,610 | 9,678,327 | |||||||||||
Weatherford International Ltd., | ||||||||||||||
senior note, 5.125%, 9/15/20 | United States | 17,500,000 | 17,675,000 | |||||||||||
senior note, 7.75%, 6/15/21 | United States | 31,000,000 | 32,007,500 | |||||||||||
senior note, 4.50%, 4/15/22 | United States | 11,900,000 | 10,982,272 | |||||||||||
senior note, 8.25%, 6/15/23 | United States | 37,500,000 | 37,297,125 | |||||||||||
|
| |||||||||||||
| 434,485,824 | ||||||||||||||
|
| |||||||||||||
| FI-12 | Semiannual Report | |||
FRANKLIN TEMPLETON VARIABLE INSURANCE PRODUCTS TRUST
STATEMENT OF INVESTMENTS (UNAUDITED)
Franklin Income VIP Fund (continued)
| Country | Principal Amount* | Value | ||||||||||||
| ||||||||||||||
Corporate Bonds (continued) | ||||||||||||||
Financials 4.0% | ||||||||||||||
Bank of America Corp., | ||||||||||||||
l junior sub. bond, AA, 6.10% to 3/17/25, FRN thereafter, Perpetual | United States | 8,000,000 | $ | 8,325,200 | ||||||||||
l junior sub. bond, U, 5.20% to 6/01/23, FRN thereafter, Perpetual | United States | 5,300,000 | 5,233,750 | |||||||||||
l junior sub. bond, X, 6.25% to 9/05/24, FRN thereafter, Perpetual | United States | 6,000,000 | 6,277,500 | |||||||||||
senior bond, 3.419% to 12/20/27, FRN thereafter, 12/20/28 | United States | 18,500,000 | 17,434,803 | |||||||||||
Capital One Financial Corp., senior sub. note, 4.20%, 10/29/25 | United States | 15,500,000 | 15,071,761 | |||||||||||
Citigroup Inc., | ||||||||||||||
l junior sub. bond, 5.35% to 5/15/23, FRN thereafter, Perpetual | United States | 10,000,000 | 9,887,000 | |||||||||||
l junior sub. bond, 5.90% to 2/15/23, FRN thereafter, Perpetual | United States | 12,500,000 | 12,750,000 | |||||||||||
l junior sub. bond, 5.95% to 1/30/23, FRN thereafter, Perpetual | United States | 4,500,000 | 4,584,375 | |||||||||||
l junior sub. bond, M, 6.30% to 5/15/24, FRN thereafter, Perpetual | United States | 15,800,000 | 16,055,328 | |||||||||||
l junior sub. bond, O, 5.875% to 3/27/20, FRN thereafter, Perpetual | United States | 25,000,000 | 25,640,000 | |||||||||||
l junior sub. bond, Q, 5.95% to 8/15/20, FRN thereafter, Perpetual | United States | 10,000,000 | 10,318,750 | |||||||||||
sub. bond, 4.125%, 7/25/28 | United States | 18,500,000 | 17,726,013 | |||||||||||
j The Goldman Sachs Group Inc., senior note, FRN, 3.272%, (3-month USD LIBOR + 1.201%), 9/29/25 | United States | 15,500,000 | 14,737,486 | |||||||||||
l JPMorgan Chase & Co., | ||||||||||||||
j junior sub. bond, FRN, 5.829%, (3-month USD LIBOR + 3.47%), Perpetual | United States | 40,000,000 | 40,432,000 | |||||||||||
junior sub. bond, R, 6.00% to 8/01/23, FRN thereafter, Perpetual | United States | 3,200,000 | 3,276,000 | |||||||||||
junior sub. bond, V, 5.00% to 7/30/19, FRN thereafter, Perpetual | United States | 10,000,000 | 10,062,500 | |||||||||||
l Morgan Stanley, junior sub. bond, 5.55% to 7/15/20, FRN thereafter, Perpetual | United States | 7,300,000 | 7,533,235 | |||||||||||
l Wells Fargo & Co., junior sub. bond, S, 5.90% to 6/15/24, FRN thereafter, | ||||||||||||||
Perpetual | United States | 6,600,000 | 6,630,030 | |||||||||||
|
| |||||||||||||
| 231,975,731 | ||||||||||||||
|
| |||||||||||||
Health Care 11.2% | ||||||||||||||
Allergan Funding SCS, senior bond, 3.80%, 3/15/25 | United States | 17,000,000 | 16,527,045 | |||||||||||
e Bausch Health Cos. Inc., | ||||||||||||||
senior bond, 144A, 6.125%, 4/15/25 | United States | 9,400,000 | 8,695,000 | |||||||||||
senior note, 144A, 5.875%, 5/15/23 | United States | 12,500,000 | 11,789,062 | |||||||||||
senior note, 144A, 9.00%, 12/15/25 | United States | 5,000,000 | 5,206,250 | |||||||||||
senior note, first lien, 144A, 7.00%, 3/15/24 | United States | 4,500,000 | 4,723,605 | |||||||||||
senior secured note, first lien, 144A, 6.50%, 3/15/22 | United States | 3,000,000 | 3,116,250 | |||||||||||
senior secured note, first lien, 144A, 5.50%, 11/01/25 | United States | 35,000,000 | 34,623,750 | |||||||||||
e Bayer US Finance II LLC, senior note, 144A, 4.25%, 12/15/25 | Germany | 15,000,000 | 15,106,050 | |||||||||||
CHS/Community Health Systems Inc., | ||||||||||||||
senior note, 6.875%, 2/01/22 | United States | 104,415,000 | 53,773,725 | |||||||||||
e senior note, 144A, 11.00%, 6/30/23 | United States | 104,896,000 | 94,799,760 | |||||||||||
e senior note, 144A, 8.125%, 6/30/24 | United States | 46,688,000 | 38,809,400 | |||||||||||
senior secured note, 5.125%, 8/01/21 | United States | 2,000,000 | 1,860,000 | |||||||||||
senior secured note, first lien, 6.25%, 3/31/23 | United States | 39,000,000 | 35,880,000 | |||||||||||
CVS Health Corp., | ||||||||||||||
senior bond, 4.30%, 3/25/28 | United States | 8,000,000 | 7,903,682 | |||||||||||
senior bond, 5.05%, 3/25/48 | United States | 3,900,000 | 3,954,064 | |||||||||||
senior note, 4.10%, 3/25/25 | United States | 5,100,000 | 5,079,446 | |||||||||||
DaVita Inc., | ||||||||||||||
senior bond, 5.125%, 7/15/24 | United States | 5,000,000 | 4,859,375 | |||||||||||
senior bond, 5.00%, 5/01/25 | United States | 4,000,000 | 3,775,000 | |||||||||||
e Endo DAC/Endo Finance LLC/Endo Finco Inc., | ||||||||||||||
senior bond, 144A, 6.00%, 2/01/25 | United States | 10,000,000 | 7,850,000 | |||||||||||
senior note, 144A, 6.00%, 7/15/23. | United States | 15,000,000 | 12,412,500 | |||||||||||
| Semiannual Report | FI-13 | |||||
FRANKLIN TEMPLETON VARIABLE INSURANCE PRODUCTS TRUST
STATEMENT OF INVESTMENTS (UNAUDITED)
Franklin Income VIP Fund (continued)
| Country | Principal Amount* | Value | ||||||||||||
| ||||||||||||||
Corporate Bonds (continued) | ||||||||||||||
Health Care (continued) | ||||||||||||||
e Endo Finance LLC, senior note, 144A, 5.75%, 1/15/22 | United States | 22,500,000 | $ | 20,250,000 | ||||||||||
HCA Inc., | ||||||||||||||
senior bond, 5.875%, 5/01/23 | United States | 7,500,000 | 7,800,000 | |||||||||||
senior note, 7.50%, 2/15/22 | United States | 25,000,000 | 27,250,000 | |||||||||||
senior secured note, first lien, 5.00%, 3/15/24 | United States | 10,400,000 | 10,426,000 | |||||||||||
Horizon Pharma Inc., senior note, 6.625%, 5/01/23 | United States | 9,000,000 | 9,101,250 | |||||||||||
i Mallinckrodt International Finance SA, senior bond, 4.75%, 4/15/23 | United States | 5,000,000 | 4,212,500 | |||||||||||
e Mallinckrodt International Finance SA/Mallinckrodt CB LLC, | ||||||||||||||
senior note, 144A, 4.875%, 4/15/20 | United States | 20,200,000 | 19,947,500 | |||||||||||
senior note, 144A, 5.75%, 8/01/22 | United States | 27,000,000 | 24,435,000 | |||||||||||
senior note, 144A, 5.625%, 10/15/23 | United States | 14,300,000 | 11,990,550 | |||||||||||
senior note, 144A, 5.50%, 4/15/25 | United States | 10,000,000 | 8,050,000 | |||||||||||
Mylan NV, senior note, 3.95%, 6/15/26 | United States | 13,600,000 | 13,027,032 | |||||||||||
Tenet Healthcare Corp., | ||||||||||||||
e secured note, second lien, 144A, 5.125%, 5/01/25 | United States | 2,500,000 | 2,385,937 | |||||||||||
senior note, 8.125%, 4/01/22 | United States | 52,600,000 | 55,098,500 | |||||||||||
senior note, 6.75%, 6/15/23 | United States | 58,200,000 | 58,127,250 | |||||||||||
|
| |||||||||||||
| 642,845,483 | ||||||||||||||
|
| |||||||||||||
Industrials 0.9% | ||||||||||||||
e,k CEVA Group PLC, senior secured note, first lien, 144A, PIK, 9.00%, 9/01/20 | United Kingdom | 13,428,791 | 13,914,317 | |||||||||||
e Cloud Crane LLC, secured note, second lien, 144A, 10.125%, 8/01/24 | United States | 4,400,000 | 4,741,000 | |||||||||||
United Rentals North America Inc., senior bond, 5.75%, 11/15/24 | United States | 1,800,000 | 1,836,000 | |||||||||||
e West Corp., senior note, 144A, 8.50%, 10/15/25 | United States | 11,000,000 | 10,092,500 | |||||||||||
e XPO Logistics Inc., senior note, 144A, 6.50%, 6/15/22 | United States | 19,580,000 | 20,142,925 | |||||||||||
|
| |||||||||||||
| 50,726,742 | ||||||||||||||
|
| |||||||||||||
Information Technology 1.6% | ||||||||||||||
e CommScope Inc., senior bond, 144A, 5.50%, 6/15/24 | United States | 10,000,000 | 10,087,500 | |||||||||||
e Dell International LLC/EMC Corp., | ||||||||||||||
senior secured note, first lien, 144A, 4.42%, 6/15/21 | United States | 12,500,000 | 12,685,881 | |||||||||||
senior secured note, first lien, 144A, 5.45%, 6/15/23 | United States | 21,100,000 | 22,090,281 | |||||||||||
e First Data Corp., | ||||||||||||||
secured note, second lien, 144A, 5.75%, 1/15/24 | United States | 5,000,000 | 5,015,500 | |||||||||||
senior note, 144A, 7.00%, 12/01/23. | United States | 25,000,000 | 26,102,000 | |||||||||||
NCR Corp., | ||||||||||||||
senior note, 5.00%, 7/15/22 | United States | 5,500,000 | 5,472,500 | |||||||||||
senior note, 6.375%, 12/15/23 | United States | 7,000,000 | 7,271,250 | |||||||||||
|
| |||||||||||||
| 88,724,912 | ||||||||||||||
|
| |||||||||||||
Materials 0.9% | ||||||||||||||
e BWAY Holding Co., | ||||||||||||||
secured note, 144A, 5.50%, 4/15/24 | United States | 10,000,000 | 9,775,000 | |||||||||||
senior note, 144A, 7.25%, 4/15/25 | United States | 23,000,000 | 22,482,500 | |||||||||||
e Cemex Finance LLC, senior secured note, first lien, 144A, 6.00%, 4/01/24 | Mexico | 14,700,000 | 14,946,886 | |||||||||||
e FMG Resources (August 2006) Pty. Ltd., senior note, 144A, 5.125%, 5/15/24 | Australia | 6,700,000 | 6,534,577 | |||||||||||
|
| |||||||||||||
| 53,738,963 | ||||||||||||||
|
| |||||||||||||
Real Estate 0.6% | ||||||||||||||
Equinix Inc., senior bond, 5.375%, 5/15/27 | United States | 16,500,000 | 16,500,000 | |||||||||||
Iron Mountain Inc., senior sub. bond, 5.75%, 8/15/24 | United States | 18,000,000 | 17,775,000 | |||||||||||
|
| |||||||||||||
| 34,275,000 | ||||||||||||||
|
| |||||||||||||
| FI-14 | Semiannual Report | |||
FRANKLIN TEMPLETON VARIABLE INSURANCE PRODUCTS TRUST
STATEMENT OF INVESTMENTS (UNAUDITED)
Franklin Income VIP Fund (continued)
| Country | Principal Amount* | Value | ||||||||||||
| ||||||||||||||
Corporate Bonds (continued) | ||||||||||||||
Telecommunication Services 2.8% | ||||||||||||||
AT&T Inc., senior bond, 4.125%, 2/17/26 | United States | 12,000,000 | $ | 11,748,615 | ||||||||||
e SFR Group SA, senior note, first lien, 144A, 6.00%, 5/15/22 | France | 15,000,000 | 15,112,500 | |||||||||||
Sprint Capital Corp., senior note, 6.90%, 5/01/19. | United States | 13,500,000 | 13,806,450 | |||||||||||
Sprint Communications Inc., senior bond, 11.50%, 11/15/21 | United States | 30,000,000 | 35,550,000 | |||||||||||
senior note, 7.00%, 8/15/20 | United States | 7,500,000 | 7,781,250 | |||||||||||
senior note, 6.00%, 11/15/22 | United States | 6,300,000 | 6,260,625 | |||||||||||
Sprint Corp., senior bond, 7.875%, 9/15/23 | United States | 37,500,000 | 38,976,563 | |||||||||||
senior bond, 7.125%, 6/15/24 | United States | 8,200,000 | 8,299,138 | |||||||||||
senior note, 7.625%, 3/01/26 | United States | 8,000,000 | 8,170,000 | |||||||||||
e Sprint Spectrum Co. LLC, senior secured bond, first lien, 144A, 5.152%, 9/20/29 | United States | 16,000,000 | 15,700,000 | |||||||||||
|
| |||||||||||||
| 161,405,141 | ||||||||||||||
|
| |||||||||||||
Utilities 1.5% | ||||||||||||||
Calpine Corp., senior bond, 5.75%, 1/15/25 | United States | 17,000,000 | 15,586,875 | |||||||||||
senior note, 5.375%, 1/15/23 | United States | 20,000,000 | 19,100,000 | |||||||||||
senior note, 5.50%, 2/01/24 | United States | 16,375,000 | 15,105,937 | |||||||||||
e InterGen NV, secured bond, 144A, 7.00%, 6/30/23 | Netherlands | 6,400,000 | 6,368,000 | |||||||||||
Vistra Energy Corp., senior note, 7.375%, 11/01/22 | United States | 20,000,000 | 20,950,000 | |||||||||||
senior note, 5.875%, 6/01/23 | United States | 8,000,000 | 8,270,000 | |||||||||||
|
| |||||||||||||
| 85,380,812 | ||||||||||||||
|
| |||||||||||||
Total Corporate Bonds (Cost $2,073,326,759) | 2,075,938,882 | |||||||||||||
|
| |||||||||||||
j,m Senior Floating Rate Interests 4.7% | ||||||||||||||
Consumer Discretionary 2.3% | ||||||||||||||
24 Hour Fitness Worldwide Inc., Term Loan, 5.594%, (1-month USD LIBOR + 3.50%), 3/31/25 | United States | 14,000,000 | 13,982,500 | |||||||||||
Academy Ltd., Initial Term Loan, 6.001% - 6.092%, (1-month USD LIBOR + 4.00%), 7/02/22 | United States | 1,571,092 | 1,313,826 | |||||||||||
Belk Inc., Closing Date Term Loan, 7.087%, (3-month USD LIBOR + 4.75%), 12/12/22 | United States | 24,404,557 | 18,950,139 | |||||||||||
BJ’s Wholesale Club Inc., n Second Lien Initial Term Loans, TBD, 3/24/25. | United States | 5,974,520 | 6,046,214 | |||||||||||
Tranche B Term Loans, 5.53%, (1-month USD LIBOR + 3.50%), 3/27/24 | United States | 10,826,489 | 10,838,669 | |||||||||||
h iHeartCommunications Inc., | ||||||||||||||
Tranche D Term Loan, 8.443%, (3-month USD LIBOR + 6.75%), 1/30/19 | United States | 45,864,664 | 35,103,667 | |||||||||||
Tranche E Term Loan, 9.193%, (3-month USD LIBOR + 7.50%), 7/30/19 | United States | 13,142,769 | 10,055,729 | |||||||||||
PetSmart Inc., Tranche B-2 Loans, 5.01%, (1-month USD LIBOR + 3.00%), 3/11/22 | United States | 18,500,000 | 15,340,848 | |||||||||||
n Stars Group Holdings BV Stars Group (US), Term Loan B, TBD, 7/10/25 | United States | 20,000,000 | 19,900,000 | |||||||||||
|
| |||||||||||||
| 131,531,592 | ||||||||||||||
|
| |||||||||||||
Consumer Staples 0.3% | ||||||||||||||
Almonde Inc., Dollar Term Loan, 5.807%, (3-month USD LIBOR + 3.50%), 6/13/24 | United States | 14,887,500 | 14,647,439 | |||||||||||
|
| |||||||||||||
Energy 0.2% | ||||||||||||||
W&T Offshore Inc., Second Lien Term Loan, 9.00%, 5/15/20 | United States | 11,000,000 | 11,041,250 | |||||||||||
|
| |||||||||||||
| �� | ||||||
| Semiannual Report |
|
FI-15 |
| |||
FRANKLIN TEMPLETON VARIABLE INSURANCE PRODUCTS TRUST
STATEMENT OF INVESTMENTS (UNAUDITED)
Franklin Income VIP Fund (continued)
| Country | Principal Amount* | Value | ||||||||||||
| ||||||||||||||
j,m Senior Floating Rate Interests (continued) | ||||||||||||||
Health Care 0.4% | ||||||||||||||
Amneal Pharmaceuticals LLC, Initial Term Loans, 5.625%, (1-month USD LIBOR + 3.50%), 5/04/25 | United States | 24,994,222 | $ | 24,986,474 | ||||||||||
|
| |||||||||||||
Industrials 0.8% | ||||||||||||||
CEVA Group PLC, Pre-Funded L/C, 6.50%, (3-month USD LIBOR + 5.50%), 3/19/21 | United Kingdom | 4,069,545 | 4,068,447 | |||||||||||
CEVA Intercompany BV, Dutch BV Term Loan, 7.859%, (3-month USD LIBOR + 5.50%), 3/19/21 | United Kingdom | 1,657,455 | 1,657,007 | |||||||||||
CEVA Logistics Canada ULC, Canadian Term Loan, 7.859%, (3-month USD LIBOR + 5.50%), 3/19/21 | Canada | 847,085 | 846,856 | |||||||||||
CEVA Logistics U.S. Holdings Inc., U.S. Term Loan, 7.859%, (3-month USD LIBOR + 5.50%), 3/19/21 | United Kingdom | 6,776,678 | 6,774,848 | |||||||||||
Commercial Barge Line Co., Initial Term Loan, 10.844%, (1-month USD LIBOR + 8.75%), 11/12/20 | United States | 8,875,000 | 6,213,876 | |||||||||||
Vertiv Group Corp., Term B Loans, 6.001%, (1-month USD LIBOR + 4.00%), 11/30/23 | United States | 8,574,569 | 8,494,182 | |||||||||||
West Corp., Term B Loans, 6.094%, (1-month USD LIBOR + 4.00%), 10/10/24 | United States | 17,549,481 | 17,513,434 | |||||||||||
|
| |||||||||||||
| 45,568,650 | ||||||||||||||
|
| |||||||||||||
Information Technology 0.2% | ||||||||||||||
MH Sub I LLC & Micro Holding Corp., | ||||||||||||||
Amendment No. 2 Initial Term Loan, 5.835%, (1-month USD LIBOR + 3.75%), 9/15/24 | United States | 8,942,450 | 8,951,795 | |||||||||||
Second Lien Initial Term Loan, 9.585%, (1-month USD LIBOR + 7.50%), 9/15/25 | United States | 5,000,000 | 5,037,500 | |||||||||||
|
| |||||||||||||
| 13,989,295 | ||||||||||||||
|
| |||||||||||||
Telecommunication Services 0.3% | ||||||||||||||
Securus Technologies Holdings Inc., n,o Delayed Draw Term Loan, TBD, 11/01/24 | United States | 8,800,000 | 8,729,600 | |||||||||||
o Initial Term Loan B, 6.594%, (1-month USD LIBOR + 4.50%), 11/01/24 | United States | 2,194,486 | 2,213,231 | |||||||||||
Second Lien Initial Loan, 10.344%, (1-month USD LIBOR + 8.25%), 11/01/25 | United States | 6,000,000 | 6,043,128 | |||||||||||
|
| |||||||||||||
| 16,985,959 | ||||||||||||||
|
| |||||||||||||
Utilities 0.2% | ||||||||||||||
Talen Energy Supply LLC, | ||||||||||||||
Initial Term Loan, 6.094%, (1-month USD LIBOR + 4.00%), 4/13/24 | United States | 7,876,000 | 7,912,096 | |||||||||||
Term B-1 Loans, 6.094%, (1-month USD LIBOR + 4.00%), 7/15/23 | United States | 5,925,000 | 5,960,550 | |||||||||||
|
| |||||||||||||
| 13,872,646 | ||||||||||||||
|
| |||||||||||||
Total Senior Floating Rate Interests (Cost $288,024,815) | 272,623,305 | |||||||||||||
|
| |||||||||||||
U.S. Government and Agency Securities 6.5% | ||||||||||||||
U.S. Treasury Note, 1.00%, 6/30/19 | United States | 50,000,000 | 49,336,914 | |||||||||||
2.25%, 3/31/20 | United States | 50,000,000 | 49,777,344 | |||||||||||
2.50%, 5/31/20 | United States | 75,000,000 | 74,969,238 | |||||||||||
2.50%, 6/30/20 | United States | 50,000,000 | 49,973,633 | |||||||||||
2.375%, 3/15/21 | United States | 50,000,000 | 49,698,242 | |||||||||||
2.75%, 4/30/23 | United States | 25,000,000 | 25,019,531 | |||||||||||
2.75%, 5/31/23 | United States | 50,000,000 | 50,050,781 | |||||||||||
FI-16 | Semiannual Report | |||
FRANKLIN TEMPLETON VARIABLE INSURANCE PRODUCTS TRUST
STATEMENT OF INVESTMENTS (UNAUDITED)
Franklin Income VIP Fund (continued)
| Country | Principal Amount* | Value | ||||||||||||
| ||||||||||||||
U.S. Government and Agency Securities (continued) | ||||||||||||||
U.S. Treasury Note, (continued) 2.875%, 5/31/25 | United States | 25,000,000 | $ | 25,094,239 | ||||||||||
|
| |||||||||||||
Total U.S. Government and Agency Securities | ||||||||||||||
(Cost $373,807,576) | 373,919,922 | |||||||||||||
|
| |||||||||||||
| Shares | ||||||||||||||
Escrows and Litigation Trusts (Cost $62,603) 0.0% | ||||||||||||||
b,c Motors Liquidation Co., Escrow Account, cvt. pfd., C | United States | 1,400,000 | — | |||||||||||
|
| |||||||||||||
Total Investments before Short Term Investments | ||||||||||||||
(Cost $5,219,227,999) | 5,539,413,107 | |||||||||||||
|
| |||||||||||||
Short Term Investments 4.7% | ||||||||||||||
Money Market Funds (Cost $266,334,565) 4.6% | ||||||||||||||
p,q Institutional Fiduciary Trust Money Market Portfolio, 1.51% | United States | 266,334,565 | 266,334,565 | |||||||||||
|
| |||||||||||||
r Investments from Cash Collateral Received for Loaned Securities 0.1% | ||||||||||||||
Money Market Funds (Cost $3,083,000) 0.1% | ||||||||||||||
p,q Institutional Fiduciary Trust Money Market Portfolio, 1.51% | United States | 3,083,000 | 3,083,000 | |||||||||||
|
| |||||||||||||
| Principal Amount* | ||||||||||||||
Repurchase Agreement (Cost $667,177) 0.0%† | ||||||||||||||
s Joint Repurchase Agreement, 2.10%, 7/02/18 (Maturity Value $667,294) | ||||||||||||||
J.P. Morgan Securities LLC | ||||||||||||||
Collateralized by U.S. Treasury Bond, Index Linked, 0.125%, 7/15/22; and | ||||||||||||||
U.S. Treasury Note, Index Linked, 0.125% - 1.875%, 7/15/19 - 1/15/22 | ||||||||||||||
(valued at $680,522) | United States | 667,177 | 667,177 | |||||||||||
|
| |||||||||||||
Total Investments from Cash Collateral Received for | ||||||||||||||
Loaned Securities (Cost $3,750,177) | 3,750,177 | |||||||||||||
|
| |||||||||||||
Total Investments (Cost $5,489,312,741) 101.0% | 5,809,497,849 | |||||||||||||
Options Written (0.0)%† | (1,315,000 | ) | ||||||||||||
Other Assets, less Liabilities (1.0)% | (54,062,172 | ) | ||||||||||||
|
| |||||||||||||
Net Assets 100.0% | $ | 5,754,120,677 | ||||||||||||
|
| |||||||||||||
Number of | Notional Amount* | |||||||||||||
t Options Written (0.0)%† | ||||||||||||||
Calls - Exchange-Traded | ||||||||||||||
Anadarko Petroleum Corp., August Strike Price $75, Expires 8/17/18 | 4,000 | 400,000 | (1,140,000 | ) | ||||||||||
Medtronic PLC, August Strike Price $90, Expires 8/17/18 | 3,500 | 350,000 | (175,000 | ) | ||||||||||
|
| |||||||||||||
Total Options Written (Premiums received $921,113) | $ | (1,315,000 | ) | |||||||||||
|
| |||||||||||||
| Semiannual Report |
|
FI-17 |
| |||
FRANKLIN TEMPLETON VARIABLE INSURANCE PRODUCTS TRUST
STATEMENT OF INVESTMENTS (UNAUDITED)
Franklin Income VIP Fund (continued)
See Abbreviations on page FI-31.
†Rounds to less than 0.1% of net assets.
*The principal/notional amount is stated in U.S. dollars unless otherwise indicated.
aA portion or all of the security is held in connection with written option contracts open at period end.
bNon-income producing.
cFair valued using significant unobservable inputs. See Note 10 regarding fair value measurements.
dSee Note 1(g) regarding equity-linked securities.
eSecurity was purchased pursuant to Rule 144A under the Securities Act of 1933 and may be sold in transactions exempt from registration only to qualified institutional buyers or in a public offering registered under the Securities Act of 1933. These securities have been deemed liquid under guidelines approved by the Trust’s Board of Trustees. At June 30, 2018, the aggregate value of these securities was $1,201,590,776, representing 20.7% of net assets.
fSee Note 1(f) regarding index-linked notes.
gSecurity pays a fixed 2.00% coupon rate and a variable coupon based on the distribution of the Morgan Stanley Custom Enhanced SPX B DT Index 20 Delta. The coupon rate shown represents the combined rate at period end. Cash payment at maturity or upon early redemption is based on the performance of the Morgan Stanley Custom Enhanced SPX B Index 20 Delta.
hSee Note 7 regarding defaulted securities.
iA portion or all of the security is on loan at June 30, 2018. See Note 1(h).
jThe coupon rate shown represents the rate at period end.
kIncome may be received in additional securities and/or cash.
lPerpetual security with no stated maturity date.
mSee Note 1(i) regarding senior floating rate interests.
nA portion or all of the security represents an unsettled loan commitment. The coupon rate is to-be determined (TBD) at the time of settlement and will be based upon a reference index/floor plus a spread.
oA portion or all of the security purchased on a delayed delivery basis. See Note 1(d).
pSee Note 3(e) regarding investments in affiliated management investment companies.
qThe rate shown is the annualized seven-day effective yield at period end.
rSee Note 1(h) regarding securities on loan.
sSee Note 1(c) regarding repurchase agreement.
tSee Note 1(e) regarding written options.
FI-18 | Semiannual Report | The accompanying notes are an integral part of these financial statements. | |||
FRANKLIN TEMPLETON VARIABLE INSURANCE PRODUCTS TRUST
Financial Statements
Statement of Assets and Liabilities
June 30, 2018 (unaudited)
Franklin Income VIP Fund | ||||
Assets: | ||||
Investments in securities: | ||||
Cost - Unaffiliated issuers | $ | 5,219,227,999 | ||
Cost - Non-controlled affiliates (Note 3e) | 269,417,565 | |||
Cost - Unaffiliated repurchase agreements | 667,177 | |||
|
| |||
Value - Unaffiliated issuers + | $ | 5,539,413,107 | ||
Value - Non-controlled affiliates (Note 3e) | 269,417,565 | |||
Value - Unaffiliated repurchase agreements | 667,177 | |||
Cash | 931,334 | |||
Receivables: | ||||
Investment securities sold | 9,605,399 | |||
Capital shares sold | 499,499 | |||
Dividends and interest | 39,937,486 | |||
Other assets | 3,971 | |||
|
| |||
Total assets | 5,860,475,538 | |||
|
| |||
Liabilities: | ||||
Payables: | ||||
Investment securities purchased | 92,138,885 | |||
Capital shares redeemed | 4,453,848 | |||
Management fees | 2,063,817 | |||
Distribution fees | 2,188,293 | |||
Options written, at value (premiums received $921,113) | 1,315,000 | |||
Payable upon return of securities loaned | 3,750,177 | |||
Accrued expenses and other liabilities. | 444,841 | |||
|
| |||
Total liabilities | 106,354,861 | |||
|
| |||
Net assets, at value | $ | 5,754,120,677 | ||
|
| |||
Net assets consist of: | ||||
Paid-in capital | $ | 5,273,711,114 | ||
Undistributed net investment income | 116,130,050 | |||
Net unrealized appreciation (depreciation) | 319,712,384 | |||
Accumulated net realized gain (loss) | 44,567,129 | |||
|
| |||
Net assets, at value | $ | 5,754,120,677 | ||
|
| |||
Class 1: | ||||
Net assets, at value | $ | 695,523,134 | ||
|
| |||
Shares outstanding. | 43,335,394 | |||
|
| |||
Net asset value and maximum offering price per share | $ | 16.05 | ||
|
| |||
Class 2: | ||||
Net assets, at value | $ | 4,732,266,474 | ||
|
| |||
Shares outstanding. | 304,926,392 | |||
|
| |||
Net asset value and maximum offering price per share | $ | 15.52 | ||
|
| |||
Class 4: | ||||
Net assets, at value | $ | 326,331,069 | ||
|
| |||
Shares outstanding. | 20,533,306 | |||
|
| |||
Net asset value and maximum offering price per share | $ | 15.89 | ||
|
| |||
+Includes securities loaned | $ | 3,626,882 | ||
| The accompanying notes are an integral part of these financial statements. | Semiannual Report |
|
FI-19 |
|
FRANKLIN TEMPLETON VARIABLE INSURANCE PRODUCTS TRUST
FINANCIAL STATEMENTS
Statement of Operations
for the six months ended June 30, 2018 (unaudited)
Franklin Income VIP Fund | ||||
| ||||
Investment income: | ||||
Dividends: (net of foreign taxes)* | ||||
Unaffiliated issuers | $ | 53,873,761 | ||
Non-controlled affiliates (Note 3e) | 1,833,368 | |||
Interest: | ||||
Unaffiliated issuers | 87,473,555 | |||
Income from securities loaned (net of fees and rebates) | 42,790 | |||
|
| |||
Total investment income | 143,223,474 | |||
|
| |||
Expenses: | ||||
Management fees (Note 3a) | 13,311,547 | |||
Distribution fees: (Note 3c) | ||||
Class 2 | 6,028,792 | |||
Class 4 | 568,957 | |||
Custodian fees (Note 4) | 33,600 | |||
Reports to shareholders | 224,618 | |||
Professional fees | 119,432 | |||
Trustees’ fees and expenses | 15,351 | |||
Other | 58,818 | |||
|
| |||
Total expenses | 20,361,115 | |||
Expense reductions (Note 4) | (21,306 | ) | ||
Expenses waived/paid by affiliates (Note 3e) | (543,023 | ) | ||
|
| |||
Net expenses | 19,796,786 | |||
|
| |||
Net investment income | 123,426,688 | |||
|
| |||
Realized and unrealized gains (losses): | ||||
Net realized gain (loss) from: | ||||
Investments: | ||||
Unaffiliated issuers | 276,372,576 | |||
Written options | 2,929,564 | |||
Realized gain distributions from REITs | 139,700 | |||
Foreign currency transactions | (260,875 | ) | ||
|
| |||
Net realized gain (loss) | 279,180,965 | |||
|
| |||
Net change in unrealized appreciation (depreciation) on: | ||||
Investments: | ||||
Unaffiliated issuers | (360,466,813 | ) | ||
Translation of other assets and liabilities denominated in foreign currencies | (120,478 | ) | ||
Written options | 182,007 | |||
|
| |||
Net change in unrealized appreciation (depreciation) | (360,405,284 | ) | ||
|
| |||
Net realized and unrealized gain (loss) | (81,224,319 | ) | ||
|
| |||
Net increase (decrease) in net assets resulting from operations | $ | 42,202,369 | ||
|
| |||
*Foreign taxes withheld on dividends | $ | 1,913,416 | ||
FI-20 | Semiannual Report | The accompanying notes are an integral part of these financial statements. |
FRANKLIN TEMPLETON VARIABLE INSURANCE PRODUCTS TRUST
FINANCIAL STATEMENTS
Statements of Changes in Net Assets
| Franklin Income VIP Fund | ||||||||
Six Months Ended June 30, 2018 (unaudited) | Year Ended December 31, 2017 | |||||||
| ||||||||
Increase (decrease) in net assets: | ||||||||
Operations: | ||||||||
Net investment income | $ 123,426,688 | $ 246,080,825 | ||||||
Net realized gain (loss) | 279,180,965 | 161,381,487 | ||||||
Net change in unrealized appreciation (depreciation) | (360,405,284 | ) | 162,933,235 | |||||
|
| |||||||
Net increase (decrease) in net assets resulting from operations | 42,202,369 | 570,395,547 | ||||||
|
| |||||||
Distributions to shareholders from: | ||||||||
Net investment income: | ||||||||
Class 1 | (34,377,723 | ) | (30,736,550 | ) | ||||
Class 2 | (227,495,537 | ) | (212,433,443 | ) | ||||
Class 4 | (14,948,805 | ) | (12,598,021 | ) | ||||
|
| |||||||
Total distributions to shareholders | (276,822,065 | ) | (255,768,014 | ) | ||||
|
| |||||||
Capital share transactions: (Note 2) | ||||||||
Class 1 | (11,252,125 | ) | 1,111,670 | |||||
Class 2 | (115,690,591 | ) | (307,051,941 | ) | ||||
Class 4 | 3,819,375 | 8,458,865 | ||||||
|
| |||||||
Total capital share transactions | (123,123,341 | ) | (297,481,406 | ) | ||||
|
| |||||||
Net increase (decrease) in net assets | (357,743,037 | ) | 17,146,127 | |||||
Net assets: | ||||||||
Beginning of period | 6,111,863,714 | 6,094,717,587 | ||||||
|
| |||||||
End of period | $5,754,120,677 | $6,111,863,714 | ||||||
|
| |||||||
Undistributed net investment income included in net assets: | ||||||||
End of period | $ 116,130,050 | $ 269,525,427 | ||||||
|
| |||||||
| The accompanying notes are an integral part of these financial statements. | Semiannual Report |
|
FI-21 |
|
FRANKLIN TEMPLETON VARIABLE INSURANCE PRODUCTS TRUST
Notes to Financial Statements (unaudited)
Franklin Income VIP Fund
1. Organization and Significant Accounting Policies
Franklin Templeton Variable Insurance Products Trust (Trust) is registered under the Investment Company Act of 1940 (1940 Act) as an open-end management investment company, consisting of eighteen separate funds and applies the specialized accounting and reporting guidance in U.S. Generally Accepted Accounting Principles (U.S. GAAP). Franklin Income VIP Fund (Fund) is included in this report. Shares of the Fund are generally sold only to insurance company separate accounts to fund the benefits of variable life insurance policies or variable annuity contracts. The Fund offers three classes of shares: Class 1, Class 2 and Class 4. Each class of shares may differ by its distribution fees, voting rights on matters affecting a single class and its exchange privilege.
The following summarizes the Fund’s significant accounting policies.
a. Financial Instrument Valuation
The Fund’s investments in financial instruments are carried at fair value daily. Fair value is the price that would be received to sell an asset or paid to transfer a liability in an orderly transaction between market participants on the measurement date. The Fund calculates the net asset value (NAV) per share each business day as of 4 p.m. Eastern time or the regularly scheduled close of the New York Stock Exchange (NYSE), whichever is earlier. Under compliance policies and procedures approved by the Trust’s Board of Trustees (the Board), the Fund’s administrator has responsibility for oversight of valuation, including leading the cross-functional Valuation Committee (VC). The VC provides administration and oversight of the Fund’s valuation policies and procedures, which are approved annually by the Board. Among other things, these procedures allow the Fund to utilize independent pricing services, quotations from securities and financial instrument dealers, and other market sources to determine fair value.
Equity securities and derivative financial instruments listed on an exchange or on the NASDAQ National Market System are valued at the last quoted sale price or the official closing price of the day, respectively. Foreign equity securities are valued as of the close of trading on the foreign stock exchange on which the security is primarily traded, or as of 4 p.m. Eastern time. The value is then converted into its U.S. dollar equivalent at the foreign exchange rate in effect at 4 p.m. Eastern time on the day that the value of the security is determined. Over-the-counter
(OTC) securities are valued within the range of the most recent quoted bid and ask prices. Securities that trade in multiple markets or on multiple exchanges are valued according to the broadest and most representative market. Certain equity securities are valued based upon fundamental characteristics or relationships to similar securities.
Debt securities generally trade in the OTC market rather than on a securities exchange. The Fund’s pricing services use multiple valuation techniques to determine fair value. In instances where sufficient market activity exists, the pricing services may utilize a market-based approach through which quotes from market makers are used to determine fair value. In instances where sufficient market activity may not exist or is limited, the pricing services also utilize proprietary valuation models which may consider market characteristics such as benchmark yield curves, credit spreads, estimated default rates, anticipated market interest rate volatility, coupon rates, anticipated timing of principal repayments, underlying collateral, and other unique security features in order to estimate the relevant cash flows, which are then discounted to calculate the fair value. Securities denominated in a foreign currency are converted into their U.S. dollar equivalent at the foreign exchange rate in effect at 4 p.m. Eastern time on the date that the values of the foreign debt securities are determined.
Investments in open-end mutual funds are valued at the closing NAV. Investments in repurchase agreements are valued at cost, which approximates fair value.
The Fund has procedures to determine the fair value of financial instruments for which market prices are not reliable or readily available. Under these procedures, the VC convenes on a regular basis to review such financial instruments and considers a number of factors, including significant unobservable valuation inputs, when arriving at fair value. The VC primarily employs a market-based approach which may use related or comparable assets or liabilities, recent transactions, market multiples, book values, and other relevant information for the investment to determine the fair value of the investment. An income-based valuation approach may also be used in which the anticipated future cash flows of the investment are discounted to calculate fair value. Discounts may also be applied due to the nature or duration of any restrictions on the disposition of the investments. Due to the inherent uncertainty of valuations of such investments, the fair values may differ significantly from the values that would have been used had an active market existed. The VC employs various methods for calibrating these
| FI-22 | Semiannual Report | |||
FRANKLIN TEMPLETON VARIABLE INSURANCE PRODUCTS TRUST
NOTES TO FINANCIAL STATEMENTS (UNAUDITED)
Franklin Income VIP Fund (continued)
valuation approaches including a regular review of key inputs and assumptions, transactional back-testing or disposition analysis, and reviews of any related market activity.
Trading in securities on foreign securities stock exchanges and OTC markets may be completed before 4 p.m. Eastern time. In addition, trading in certain foreign markets may not take place on every Fund’s business day. Occasionally, events occur between the time at which trading in a foreign security is completed and 4 p.m. Eastern time that might call into question the reliability of the value of a portfolio security held by the Fund. As a result, differences may arise between the value of the Fund’s portfolio securities as determined at the foreign market close and the latest indications of value at 4 p.m. Eastern time. In order to minimize the potential for these differences, the VC monitors price movements following the close of trading in foreign stock markets through a series of country specific market proxies (such as baskets of American Depositary Receipts, futures contracts and exchange traded funds). These price movements are measured against established trigger thresholds for each specific market proxy to assist in determining if an event has occurred that may call into question the reliability of the values of the foreign securities held by the Fund. If such an event occurs, the securities may be valued using fair value procedures, which may include the use of independent pricing services.
When the last day of the reporting period is a non-business day, certain foreign markets may be open on those days that the Fund’s NAV is not calculated, which could result in differences between the value of the Fund’s portfolio securities on the last business day and the last calendar day of the reporting period. Any significant security valuation changes due to an open foreign market are adjusted and reflected by the Fund for financial reporting purposes.
b. Foreign Currency Translation
Portfolio securities and other assets and liabilities denominated in foreign currencies are translated into U.S. dollars based on the exchange rate of such currencies against U.S. dollars on the date of valuation. The Fund may enter into foreign currency exchange contracts to facilitate transactions denominated in a foreign currency. Purchases and sales of securities, income and expense items denominated in foreign currencies are translated into U.S. dollars at the exchange rate in effect on the transaction date. Portfolio securities and assets and liabilities denominated in foreign currencies contain risks that those currencies will
decline in value relative to the U.S. dollar. Occasionally, events may impact the availability or reliability of foreign exchange rates used to convert the U.S. dollar equivalent value. If such an event occurs, the foreign exchange rate will be valued at fair value using procedures established and approved by the Board.
The Fund does not separately report the effect of changes in foreign exchange rates from changes in market prices on securities held. Such changes are included in net realized and unrealized gain or loss from investments in the Statement of Operations.
Realized foreign exchange gains or losses arise from sales of foreign currencies, currency gains or losses realized between the trade and settlement dates on securities transactions and the difference between the recorded amounts of dividends, interest, and foreign withholding taxes and the U.S. dollar equivalent of the amounts actually received or paid. Net unrealized foreign exchange gains and losses arise from changes in foreign exchange rates on foreign denominated assets and liabilities other than investments in securities held at the end of the reporting period.
c. Joint Repurchase Agreement
The Fund enters into a joint repurchase agreement whereby its uninvested cash balance is deposited into a joint cash account with other funds managed by the investment manager or an affiliate of the investment manager and is used to invest in one or more repurchase agreements. The value and face amount of the joint repurchase agreement are allocated to the funds based on their pro-rata interest. A repurchase agreement is accounted for as a loan by the Fund to the seller, collateralized by securities which are delivered to the Fund’s custodian. The fair value, including accrued interest, of the initial collateralization is required to be at least 102% of the dollar amount invested by the funds, with the value of the underlying securities marked to market daily to maintain coverage of at least 100%. Repurchase agreements are subject to the terms of Master Repurchase Agreements (MRAs) with approved counterparties (sellers). The MRAs contain various provisions, including but not limited to events of default and maintenance of collateral for repurchase agreements. In the event of default by either the seller or the Fund, certain MRAs may permit the non-defaulting party to net and close-out all transactions, if any, traded under such agreements. The Fund may sell securities it holds as collateral and apply the proceeds towards the repurchase price and any other amounts owed by the seller to the Fund in the event of
| Semiannual Report | FI-23 | |||||
FRANKLIN TEMPLETON VARIABLE INSURANCE PRODUCTS TRUST
NOTES TO FINANCIAL STATEMENTS (UNAUDITED)
Franklin Income VIP Fund (continued)
1. Organization and Significant Accounting
Policies (continued)
c. Joint Repurchase Agreement (continued)
default by the seller. This could involve costs or delays in addition to a loss on the securities if their value falls below the repurchase price owed by the seller. The joint repurchase agreement held by the Fund at period end, as indicated in the Statement of Investments, had been entered into on June 29, 2018.
d. Securities Purchased on a Delayed Delivery Basis
The Fund purchases securities on a delayed delivery basis, with payment and delivery scheduled for a future date. These transactions are subject to market fluctuations and are subject to the risk that the value at delivery may be more or less than the trade date purchase price. Although the Fund will generally purchase these securities with the intention of holding the securities, it may sell the securities before the settlement date. Sufficient assets have been segregated for these securities.
e. Derivative Financial Instruments
The Fund invested in derivative financial instruments in order to manage risk or gain exposure to various other investments or markets. Derivatives are financial contracts based on an underlying or notional amount, require no initial investment or an initial net investment that is smaller than would normally be required to have a similar response to changes in market factors, and require or permit net settlement. Derivatives contain various risks including the potential inability of the counterparty to fulfill their obligations under the terms of the contract, the potential for an illiquid secondary market, and/or the potential for market movements which expose the Fund to gains or losses in excess of the amounts shown in the Statement of Assets and Liabilities. Realized gain and loss and unrealized appreciation and depreciation on these contracts for the period are included in the Statement of Operations.
Collateral requirements differ by type of derivative. Collateral or initial margin requirements are set by the broker or exchange clearing house for exchange traded and centrally cleared derivatives. Initial margin deposited is held at the exchange and can be in the form of cash and/or securities.
The Fund purchased or wrote exchange traded option contracts primarily to gain exposure to equity price risk. An option is a contract entitling the holder to purchase or sell a specific
amount of shares or units of an asset or notional amount of a swap (swaption), at a specified price. When an option is purchased or written, an amount equal to the premium paid or received is recorded as an asset or liability, respectively. Upon exercise of an option, the acquisition cost or sales proceeds of the underlying investment is adjusted by any premium received or paid. Upon expiration of an option, any premium received or paid is recorded as a realized gain or loss. Upon closing an option other than through expiration or exercise, the difference between the premium received or paid and the cost to close the position is recorded as a realized gain or loss.
See Note 8 regarding other derivative information.
f. Index-Linked Notes
The Fund invests in index-linked notes. Index-linked notes are senior, unsecured, subordinated debt securities issued by a financial institution, and the value is based on the price movements of the underlying index. Index-linked notes are designed to provide investors access to the returns of various market benchmarks and intended to replicate the economic effects that would apply had the Fund directly purchased the underlying referenced asset or basket of assets. The risks of investing in index-linked notes include unfavorable price movements in the underlying index and the credit risk of the issuing financial institution. There may be no guarantee of a return of principal with index-linked notes and the appreciation potential may be limited. Index-linked notes may be more volatile and less liquid than other investments held by the Fund.
g. Equity-Linked Securities
The Fund invests in equity-linked securities. Equity-linked securities are hybrid financial instruments that generally combine both debt and equity characteristics into a single note form. Income received from equity-linked securities is recorded as realized gains in the Statement of Operations and may be based on the performance of an underlying equity security, an equity index, or an option position. The risks of investing in equity-linked securities include unfavorable price movements in the underlying security and the credit risk of the issuing financial institution. There may be no guarantee of a return of principal with equity-linked securities and the appreciation potential may be limited. Equity-linked securities may be more volatile and less liquid than other investments held by the Fund.
| FI-24 | Semiannual Report | |||
FRANKLIN TEMPLETON VARIABLE INSURANCE PRODUCTS TRUST
NOTES TO FINANCIAL STATEMENTS (UNAUDITED)
Franklin Income VIP Fund (continued)
h. Securities Lending
The Fund participates in an agency based securities lending program to earn additional income. The Fund receives cash collateral against the loaned securities in an amount equal to at least 102% of the fair value of the loaned securities. Collateral is maintained over the life of the loan in an amount not less than 100% of the fair value of loaned securities, as determined at the close of Fund business each day; any additional collateral required due to changes in security values is delivered to the Fund on the next business day. The collateral is deposited into a joint cash account with other funds and is used to invest in a money market fund managed by Franklin Advisers, Inc., an affiliate of the Fund, and/or a joint repurchase agreement. The Fund may receive income from the investment of cash collateral, in addition to lending fees and rebates paid by the borrower. Income from securities loaned, net of fees paid to the securities lending agent and/or third-party vendor, is reported separately in the Statement of Operations. The Fund bears the market risk with respect to the collateral investment, securities loaned, and the risk that the agent may default on its obligations to the Fund. If the borrower defaults on its obligation to return the securities loaned, the Fund has the right to repurchase the securities in the open market using the collateral received. The securities lending agent has agreed to indemnify the Fund in the event of default by a third party borrower.
i. Senior Floating Rate Interests
The Fund invests in senior secured corporate loans that pay interest at rates which are periodically reset by reference to a base lending rate plus a spread. These base lending rates are generally the prime rate offered by a designated U.S. bank or the London InterBank Offered Rate (LIBOR). Senior secured corporate loans often require prepayment of principal from excess cash flows or at the discretion of the borrower. As a result, actual maturity may be substantially less than the stated maturity. Senior secured corporate loans in which the Fund invests are generally readily marketable, but may be subject to certain restrictions on resale.
j. Income and Deferred Taxes
It is the Fund’s policy to qualify as a regulated investment company under the Internal Revenue Code. The Fund intends to distribute to shareholders substantially all of its taxable income and net realized gains to relieve it from federal income and if applicable, excise taxes. As a result, no provision for U.S. federal income taxes is required.
The Fund may be subject to foreign taxation related to income received, capital gains on the sale of securities and certain foreign currency transactions in the foreign jurisdictions in which it invests. Foreign taxes, if any, are recorded based on the tax regulations and rates that exist in the foreign markets in which the Fund invests. When a capital gain tax is determined to apply, the Fund records an estimated deferred tax liability in an amount that would be payable if the securities were disposed of on the valuation date.
As a result of several court cases, in certain countries across the European Union, the Fund filed additional tax reclaims for previously withheld taxes on dividends earned in those countries (EU reclaims). These additional filings are subject to various administrative proceedings by the local jurisdictions’ tax authorities within the European Union, as well as a number of related judicial proceedings. Income recognized, if any, for EU reclaims is reflected as other income in the Statement of Operations and any related receivable, if any, is reflected as European Union tax reclaims in the Statement of Assets and Liabilities. When uncertainty exists as to the ultimate resolution of these proceedings, the likelihood of receipt of these EU reclaims, and the potential timing of payment, no amounts are reflected in the financial statements. For U.S. income tax purposes, when EU reclaims are received by the Fund and the Fund previously passed foreign tax credit on to its shareholders, the Fund must either amend historic tax reporting to shareholders or enter into a closing agreement with the Internal Revenue Service (IRS) in order to pay the associated tax liability on behalf of the Fund’s shareholders.
The Fund may recognize an income tax liability related to its uncertain tax positions under U.S. GAAP when the uncertain tax position has a less than 50% probability that it will be sustained upon examination by the tax authorities based on its technical merits. As of June 30, 2018, the Fund has determined that no tax liability is required in its financial statements related to uncertain tax positions for any open tax years (or expected to be taken in future tax years). Open tax years are those that remain subject to examination and are based on the statute of limitations in each jurisdiction in which the Fund invests.
k. Security Transactions, Investment Income, Expenses and Distributions
Security transactions are accounted for on trade date. Realized gains and losses on security transactions are determined on a specific identification basis. Interest income and estimated
| Semiannual Report | FI-25 | |||
FRANKLIN TEMPLETON VARIABLE INSURANCE PRODUCTS TRUST
NOTES TO FINANCIAL STATEMENTS (UNAUDITED)
Franklin Income VIP Fund (continued)
1. Organization and Significant Accounting
Policies (continued)
k. Security Transactions, Investment Income, Expenses and Distributions (continued)
expenses are accrued daily. Amortization of premium and accretion of discount on debt securities are included in interest income. Facility fees are recognized as income over the expected term of the loan. Dividend income is recorded on the ex-dividend date except for certain dividends from securities where the dividend rate is not available. In such cases, the dividend is recorded as soon as the information is received by the Fund. Distributions to shareholders are recorded on the ex-dividend date. Distributable earnings are determined according to income tax regulations (tax basis) and may differ from earnings recorded in accordance with U.S. GAAP. These differences may be permanent or temporary. Permanent differences are reclassified among capital accounts to reflect their tax character. These reclassifications have no impact on net assets or the results of operations. Temporary differences are not reclassified, as they may reverse in subsequent periods.
Common expenses incurred by the Trust are allocated among the Funds based on the ratio of net assets of each Fund to the combined net assets of the Trust or based on the ratio of number of shareholders of each Fund to the combined number of shareholders of the Trust. Fund specific expenses are charged directly to the Fund that incurred the expense.
Realized and unrealized gains and losses and net investment income, excluding class specific expenses, are allocated daily to each class of shares based upon the relative proportion of net assets of each class. Differences in per share distributions by class are generally due to differences in class specific expenses.
l. Accounting Estimates
The preparation of financial statements in accordance with U.S. GAAP requires management to make estimates and assumptions that affect the reported amounts of assets and liabilities at the date of the financial statements and the amounts of income and expenses during the reporting period. Actual results could differ from those estimates.
m. Guarantees and Indemnifications
Under the Trust’s organizational documents, its officers and trustees are indemnified by the Trust against certain liabilities arising out of the performance of their duties to the Trust. Additionally, in the normal course of business, the Trust, on behalf of the Fund enters into contracts with service providers that contain general indemnification clauses. The Trust’s maximum exposure under these arrangements is unknown as this would involve future claims that may be made against the Trust that have not yet occurred. Currently, the Trust expects the risk of loss to be remote.
2. Shares of Beneficial Interest
At June 30, 2018, there were an unlimited number of shares authorized (without par value). Transactions in the Fund’s shares were as follows:
Six Months Ended June 30, 2018 | Year Ended December 31, 2017 | |||||||||||||||||||
|
| |||||||||||||||||||
| Shares | Amount | Shares | Amount | |||||||||||||||||
| ||||||||||||||||||||
| Class 1 Shares: | ||||||||||||||||||||
Shares sold | 927,947 | $ | 15,454,080 | 2,556,049 | $ | 41,649,315 | ||||||||||||||
Shares issued in reinvestment of distributions | 2,128,651 | 34,377,723 | 1,925,849 | 30,736,550 | ||||||||||||||||
Shares redeemed | (3,694,865 | ) | (61,083,928 | ) | (4,368,760 | ) | (71,274,195) | |||||||||||||
|
| |||||||||||||||||||
Net increase (decrease) | (638,267 | ) | $ | (11,252,125 | ) | 113,138 | $ | 1,111,670 | ||||||||||||
|
| |||||||||||||||||||
| Class 2 Shares: | ||||||||||||||||||||
Shares sold | 7,178,138 | $ | 115,490,704 | 12,063,249 | $ | 190,265,472 | ||||||||||||||
Shares issued in reinvestment of distributions | 14,573,705 | 227,495,537 | 13,740,843 | 212,433,443 | ||||||||||||||||
Shares redeemed | (28,622,492 | ) | (458,676,832 | ) | (44,928,166 | ) | (709,750,856) | |||||||||||||
|
| |||||||||||||||||||
Net increase (decrease) | (6,870,649 | ) | $ | (115,690,591 | ) | (19,124,074 | ) | $ | (307,051,941) | |||||||||||
|
| |||||||||||||||||||
FI-26 | Semiannual Report |
FRANKLIN TEMPLETON VARIABLE INSURANCE PRODUCTS TRUST
NOTES TO FINANCIAL STATEMENTS (UNAUDITED)
Franklin Income VIP Fund (continued)
Six Months Ended June 30, 2018 | Year Ended December 31, 2017 | |||||||||||||||||||
|
| |||||||||||||||||||
| Shares | Amount | Shares | Amount | |||||||||||||||||
| ||||||||||||||||||||
| Class 4 Shares: | ||||||||||||||||||||
Shares sold | 1,838,568 | $ | 30,247,769 | 3,354,488 | $ | 54,048,239 | ||||||||||||||
Shares issued in reinvestment of distributions | 934,885 | 14,948,805 | 796,839 | 12,598,021 | ||||||||||||||||
Shares redeemed | (2,514,552 | ) | (41,377,199 | ) | (3,605,896 | ) | (58,187,395) | |||||||||||||
|
| |||||||||||||||||||
Net increase (decrease) | 258,901 | $ | 3,819,375 | 545,431 | $ | 8,458,865 | ||||||||||||||
|
| |||||||||||||||||||
3. Transactions with Affiliates
Franklin Resources, Inc. is the holding company for various subsidiaries that together are referred to as Franklin Templeton Investments. Certain officers and trustees of the Fund are also officers and/or directors of the following subsidiaries:
| Subsidiary | Affiliation | |
Franklin Advisers, Inc. (Advisers) | Investment manager | |
Franklin Templeton Services, LLC (FT Services) | Administrative manager | |
Franklin Templeton Distributors, Inc. (Distributors) | Principal underwriter | |
Franklin Templeton Investor Services, LLC (Investor Services) | Transfer agent |
a. Management Fees
The Fund pays an investment management fee to Advisers based on the average daily net assets of the Fund as follows:
| Annualized Fee Rate | Net Assets | |
0.625% | Up to and including $100 million | |
0.500% | Over $100 million, up to and including $250 million | |
0.450% | Over $250 million, up to and including $7.5 billion | |
0.440% | Over $7.5 billion, up to and including $10 billion | |
0.430% | Over $10 billion, up to and including $12.5 billion | |
0.420% | Over $12.5 billion, up to and including $15 billion | |
0.400% | In excess of $15 billion |
For the period ended June 30, 2018, the annualized gross effective investment management fee rate was 0.454% of the Fund’s average daily net assets.
b. Administrative Fees
Under an agreement with Advisers, FT Services provides administrative services to the Fund. The fee is paid by Advisers based on the Fund’s average daily net assets, and is not an additional expense of the Fund.
c. Distribution Fees
The Board has adopted distribution plans for Class 2 and Class 4 shares pursuant to Rule 12b-1 under the 1940 Act. Under the Fund’s compensation distribution plans, the Fund pays Distributors for costs incurred in connection with the servicing, sale and distribution of the Fund’s shares up to 0.35% per year of its average daily net assets of each class. The Board has agreed to limit the current rate to 0.25% per year for Class 2. The plan year, for purposes of monitoring compliance with the maximum annual plan rates, is February 1 through January 31.
| Semiannual Report | FI-27 | |||||
FRANKLIN TEMPLETON VARIABLE INSURANCE PRODUCTS TRUST
NOTES TO FINANCIAL STATEMENTS (UNAUDITED)
Franklin Income VIP Fund (continued)
3. Transactions with Affiliates (continued)
d. Transfer Agent Fees
Investor Services, under terms of an agreement, performs shareholder servicing for the Fund and is not paid by the Fund for the services.
e. Investments in Affiliated Management Investment Companies
The Fund invests in one or more affiliated management investment companies for purposes other than exercising a controlling influence over the management or policies. Management fees paid by the Fund are waived on assets invested in the affiliated management investment companies, as noted in the Statement of Operations, in an amount not to exceed the management and administrative fees paid directly or indirectly by each affiliate. During the period ended June 30, 2018, the Fund held investments in affiliated management investment companies as follows:
| Number of Shares Held at Beginning of Period | Gross Additions | Gross Reductions | Number of Shares Held at End of Period | Value at End of Period | Dividend Income | Realized Gain (Loss) | Net Change in Unrealized Appreciation (Depreciation) | |||||||||||||||||||||||||
| Non-Controlled Affiliates | ||||||||||||||||||||||||||||||||
Institutional Fiduciary Trust | ||||||||||||||||||||||||||||||||
Money Market Portfolio, 1.51% | 352,824,455 | 1,257,337,756 | (1,340,744,646 | ) | 269,417,565 | $269,417,565 | $1,833,368 | $— | $— | |||||||||||||||||||||||
|
| |||||||||||||||||||||||||||||||
f. Other Affiliated Transactions
At June 30, 2018, Franklin Templeton Variable Insurance Products Trust - Franklin Founding Funds Allocation VIP Fund owned 5.2% of the Fund’s outstanding shares.
4. Expense Offset Arrangement
The Fund has entered into an arrangement with its custodian whereby credits realized as a result of uninvested cash balances are used to reduce a portion of the Fund’s custodian expenses. During the period ended June 30, 2018, the custodian fees were reduced as noted in the Statement of Operations.
5. Income Taxes
For tax purposes, capital losses may be carried over to offset future capital gains. Capital loss carryforwards with no expiration, if any, must be fully utilized before those losses with expiration dates.
At December 31, 2017, the Fund had capital loss carryforwards of $157,561,044 expiring in 2018 and short-term capital loss carryforwards of $72,609,502 not subject to expiration.
At June 30, 2018, the cost of investments and net unrealized appreciation (depreciation) for income tax purposes were as follows:
Cost of investments | $ | 5,502,193,887 | ||
|
| |||
Unrealized appreciation | $ | 589,884,591 | ||
Unrealized depreciation | (283,895,629) | |||
|
| |||
Net unrealized appreciation (depreciation) | $ | 305,988,962 | ||
|
| |||
Differences between income and/or capital gains as determined on a book basis and a tax basis are primarily due to differing treatments of bond discounts and premiums and equity-linked securities.
| FI-28 | Semiannual Report | |||
FRANKLIN TEMPLETON VARIABLE INSURANCE PRODUCTS TRUST
NOTES TO FINANCIAL STATEMENTS (UNAUDITED)
Franklin Income VIP Fund (continued)
6. Investment Transactions
Purchases and sales of investments (excluding short term securities) for the period ended June 30, 2018, aggregated $1,846,237,811 and $1,904,720,533, respectively.
At June 30, 2018, in connection with securities lending transactions, the Fund loaned corporate bonds and received $3,750,177 of cash collateral. The gross amount of recognized liability for such transactions is included in payable upon return of securities loaned in the Statement of Assets and Liabilities. The agreements can be terminated at any time.
7. Credit Risk and Defaulted Securities
At June 30, 2018, the Fund had 35.7% of its portfolio invested in high yield, senior secured floating rate notes, or other securities rated below investment grade and unrated securities, if any. These securities may be more sensitive to economic conditions causing greater price volatility and are potentially subject to a greater risk of loss due to default than higher rated securities.
The Fund held defaulted securities and/or other securities for which the income has been deemed uncollectible. At June 30, 2018, the aggregate value of these securities was $57,816,896, representing 1.0% of the Fund’s net assets. The Fund discontinues accruing income on securities for which income has been deemed uncollectible and provides an estimate for losses on interest receivable. The securities have been identified in the accompanying Statement of Investments.
8. Other Derivative Information
At June 30, 2018, the Fund’s investments in derivative contracts are reflected in the Statement of Assets and Liabilities as follows:
Asset Derivatives | Liability Derivatives | |||||||||||||||
Derivative Contracts Not Accounted for as Hedging Instruments | Statement of Assets and Liabilities Location | Fair Value | Statement of Assets and Liabilities Location | Fair Value | ||||||||||||
Equity contracts | Investments in securities, at value | $ — | Options written, at value | $ 1,315,000 | ||||||||||||
|
|
|
| |||||||||||||
For the period ended June 30, 2018, the effect of derivative contracts in the Fund’s Statement of Operations was as follows:
Derivative Contracts Not Accounted for as Hedging Instruments | Statement of Operations Location | Net Realized Gain (Loss) for the Period | Statement of Operations Location | Net Change in Unrealized Appreciation (Depreciation) for the Period | ||||||||||||
| Net realized gain (loss) from: | Net change in unrealized | |||||||||||||||
| appreciation (depreciation) on: | ||||||||||||||||
Equity contracts | Investments | $ | (1,532,000)a | Investments | $1,147,000a | |||||||||||
| Written options | 2,929,564 | Written options | 182,007 | |||||||||||||
|
|
|
| |||||||||||||
Totals | $ | 1,397,564 | $1,329,007 | |||||||||||||
|
|
|
| |||||||||||||
aPurchased option contracts are included in net realized gain (loss) from investments and net change in unrealized appreciation (depreciation) on investments in the Statement of Operations.
For the period ended June 30, 2018, the average month end notional amount of options represented $875,429.
See Note 1(e) regarding derivative financial instruments.
| Semiannual Report | FI-29 | |||
FRANKLIN TEMPLETON VARIABLE INSURANCE PRODUCTS TRUST
NOTES TO FINANCIAL STATEMENTS (UNAUDITED)
Franklin Income VIP Fund (continued)
9. Credit Facility
The Fund, together with other U.S. registered and foreign investment funds (collectively, Borrowers), managed by Franklin Templeton Investments, are borrowers in a joint syndicated senior unsecured credit facility totaling $2 billion (Global Credit Facility) which matures on February 8, 2019. This Global Credit Facility provides a source of funds to the Borrowers for temporary and emergency purposes, including the ability to meet future unanticipated or unusually large redemption requests.
Under the terms of the Global Credit Facility, the Fund shall, in addition to interest charged on any borrowings made by the Fund and other costs incurred by the Fund, pay its share of fees and expenses incurred in connection with the implementation and maintenance of the Global Credit Facility, based upon its relative share of the aggregate net assets of all of the Borrowers, including an annual commitment fee of 0.15% based upon the unused portion of the Global Credit Facility. These fees are reflected in other expenses in the Statement of Operations. During the period ended June 30, 2018, the Fund did not use the Global Credit Facility.
10. Fair Value Measurements
The Fund follows a fair value hierarchy that distinguishes between market data obtained from independent sources (observable inputs) and the Fund’s own market assumptions (unobservable inputs). These inputs are used in determining the value of the Fund’s financial instruments and are summarized in the following fair value hierarchy:
| • | Level 1 – quoted prices in active markets for identical financial instruments |
| • | Level 2 – other significant observable inputs (including quoted prices for similar financial instruments, interest rates, prepayment speed, credit risk, etc.) |
| • | Level 3 – significant unobservable inputs (including the Fund’s own assumptions in determining the fair value of financial instruments) |
The input levels are not necessarily an indication of the risk or liquidity associated with financial instruments at that level.
For movements between the levels within the fair value hierarchy, the Fund has adopted a policy of recognizing the transfers as of the date of the underlying event which caused the movement.
A summary of inputs used as of June 30, 2018, in valuing the Fund’s assets and liabilities carried at fair value, is as follows:
| Level 1 | Level 2 | Level 3 | Total | |||||||||||||
| ||||||||||||||||
| Assets: | ||||||||||||||||
Investments in Securities:a | ||||||||||||||||
Equity Investments:b | ||||||||||||||||
Financials | $ 387,172,576 | $ 9,262,500 | $ — | $ 396,435,076 | ||||||||||||
Industrials | 139,655,000 | — | 6,378,320 | 146,033,320 | ||||||||||||
All Other Equity Investments | 1,803,541,524 | — | — | 1,803,541,524 | ||||||||||||
Equity-Linked Securities | — | 393,507,120 | — | 393,507,120 | ||||||||||||
Index-Linked Notes | — | 14,320,600 | — | 14,320,600 | ||||||||||||
Convertible Bonds | — | 63,093,358 | — | 63,093,358 | ||||||||||||
Corporate Bonds | — | 2,075,938,882 | — | 2,075,938,882 | ||||||||||||
Senior Floating Rate Interests | — | 272,623,305 | — | 272,623,305 | ||||||||||||
U.S. Government and Agency Securities | — | 373,919,922 | — | 373,919,922 | ||||||||||||
Escrows and Litigation Trusts | — | — | — | c | — | |||||||||||
Short Term Investments | 269,417,565 | 667,177 | — | 270,084,742 | ||||||||||||
|
| |||||||||||||||
Total Investments in Securities | $ 2,599,786,665 | $ 3,203,332,864 | $ 6,378,320 | $ 5,809,497,849 | ||||||||||||
|
| |||||||||||||||
| FI-30 | Semiannual Report | |||
FRANKLIN TEMPLETON VARIABLE INSURANCE PRODUCTS TRUST
NOTES TO FINANCIAL STATEMENTS (UNAUDITED)
Franklin Income VIP Fund (continued)
| Level 1 | Level 2 | Level 3 | Total | |||||||||||||
| Liabilities: | ||||||||||||||||
Other Financial Instruments: | ||||||||||||||||
Options Written | $ | 1,315,000 | $ | — | $ | — | $ | 1,315,000 | ||||||||
|
| |||||||||||||||
aFor detailed categories, see the accompanying Statement of Investments.
bIncludes common and convertible preferred stocks.
cIncludes securities determined to have no value at June 30, 2018.
A reconciliation of assets in which Level 3 inputs are used in determining fair value is presented when there are significant Level 3 financial instruments at the beginning and/or end of the period.
11. New Accounting Pronouncements
In March 2017, the Financial Accounting Standards Board issued Accounting Standards Update (ASU) No. 2017-08, Receivables—Nonrefundable Fees and Other Costs (Subtopic 310-20): Premium Amortization on Purchased Callable Debt Securities. The amendments in the ASU shorten the amortization period for certain callable debt securities acquired at a premium, to be amortized to the earliest call date. The ASU does not require an accounting change for securities acquired at a discount, which continues to be amortized to maturity. The ASU is effective for fiscal years and interim periods within those fiscal years beginning after December 15, 2018. Management has reviewed the requirements and believes the adoption of this ASU will not have a material impact on the financial statements.
12. Subsequent Events
The Fund has evaluated subsequent events through the issuance of the financial statements and determined that no events have occurred that require disclosure.
Abbreviations
| Currency | Selected Portfolio | |||||
| EUR | Euro | ADR | American Depositary Receipt | |||
| USD | United States Dollar | FNMA | Federal National Mortgage Association | |||
| FRN | Floating Rate Note | |||||
| L/C | Letter of Credit | |||||
| LIBOR | London InterBank Offered Rate | |||||
| PIK | Payment-In-Kind | |||||
| Semiannual Report | FI-31 | |||||
This page intentionally left blank.
Franklin Large Cap Growth VIP Fund
We are pleased to bring you Franklin Large Cap Growth VIP Fund’s semiannual report for the period ended June 30, 2018.
Class 2 Performance Summary as of June 30, 2018
The Fund’s Class 2 Shares posted a +11.97% total return for the six-month period ended June 30, 2018.
Performance reflects the Fund’s Class 2 operating expenses, but does not include any contract fees, expenses or sales charges. If they had been included, performance would be lower. These charges and deductions, particularly for variable life policies, can have a significant effect on contract values and insurance benefits. See the contract prospectus for a complete description of these expenses, including sales charges.
Performance data represent past performance, which does not guarantee future results. Investment return and principal value will fluctuate, and you may have a gain or loss when you sell your shares. Current performance may differ from figures shown.
| Semiannual Report | FLG-1 | |||||
FRANKLIN LARGE CAP GROWTH VIP FUND
Fund Goal and Main Investments
The Fund seeks capital appreciation. Under normal market conditions, the Fund invests at least 80% of its net assets in investments of large capitalization companies. For this Fund, large capitalization companies are those with market capitalization values within those of the top 50% of companies in the Russell 1000® Index at the time of purchase.1
Fund Risks
All investments involve risks, including possible loss of principal. Stock prices fluctuate, sometimes rapidly and dramatically, due to factors affecting individual companies, particular industries or sectors, or general market conditions. Growth stock prices reflect projections of future earnings or revenues, and can, therefore, fall dramatically if the company fails to meet those projections. The Fund may focus on particular sectors of the market from time to time, which can carry greater risks of adverse developments in such sectors. Investments in foreign securities may involve special risks including currency fluctuations and economic and political uncertainty. Smaller or midsized companies can be particularly sensitive to changing economic conditions, and their prospects for growth are less certain than those of larger, more established companies. The Fund is actively managed but there is no guarantee that the manager’s investment decisions will produce the desired results. The Fund’s prospectus also includes a description of the main investment risks.
Performance Overview
You can find the Fund’s six-month total return in the Performance Summary. In comparison, the Fund’s benchmark, the Standard & Poor’s® 500 Index (S&P 500®), generated a +2.65% total return.2
Economic and Market Overview
The US economy continued to grow during the six months under review. After moderating for three consecutive quarters, the economy grew faster in 2018’s second quarter, driven by consumer spending, exports, business investment and government spending. The manufacturing and services sectors expanded during the period. The unemployment rate declined slightly from 4.1% in December 2017, as reported at the
Portfolio Composition
Based on Total Net Assets as of 6/30/18
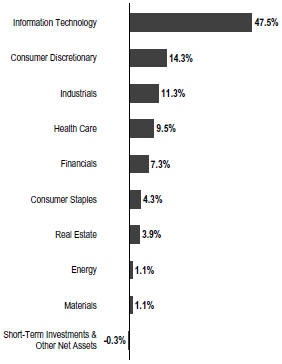
beginning of the six-month period, to 4.0% at period-end.3 Annual inflation, as measured by the Consumer Price Index, increased from 2.1% in December 2017, as reported at the beginning of the period, to 2.9% at period-end.3
In February 2018, the new US Federal Reserve (Fed) Chair Jerome Powell spoke before Congress for the first time and indicated the Fed saw signs of a continued strong labor market and economic growth. He reiterated the Fed’s intention to gradually raise interest rates in an effort to keep the economy from overheating and as inflation increases toward the Fed’s target. However, he noted there was no evidence of the economy overheating and he had yet to see a clear upward move in wages. The Fed raised its target range for the federal funds rate 0.25% each at its March and June 2018 meetings to 1.75%–2.00% and continued reducing its balance sheet as part of its ongoing plan to normalize monetary policy. In June, the Fed upgraded its economic forecast for 2018 and its inflation
1. Please see Index Descriptions following the Fund Summaries.
2. Source: Morningstar. One cannot invest directly in an index, and an index is not representative of the Fund’s portfolio. Please see Index Descriptions following the Fund Summaries.
3. Source: US Bureau of Labor Statistics.
The dollar value, number of shares or principal amount, and names of all portfolio holdings are listed in the Fund’s Statement of Investments (SOI).
| FLG-2 | Semiannual Report | |||
FRANKLIN LARGE CAP GROWTH VIP FUND
forecasts for 2018 and 2019. Furthermore, the Fed forecasted an additional rate hike for 2018 and 2019 than previously anticipated.
US equity markets rose overall during the period, benefiting from mostly upbeat economic data and better US corporate earnings. At certain points during the period, markets were also supported by the expectations of gradual rate increases. After reaching new all-time highs in January 2018, US stocks declined in February amid concerns that strong economic growth and rising inflation would lead the Fed to increase its target rate faster than expected. In March, markets were pressured further by a broad sell-off in information technology stocks due to a potential for tighter regulation in the sector arising from concerns about consumer data privacy. Other factors that curbed investor sentiment included tensions between the US and North Korea, political uncertainties in the US, the Trump administration’s protectionist policies and escalating trade tensions between the US and China. An overall easing of tensions in the Korean peninsula and intermittent US-China trade negotiations partially offset some of these concerns. However, US trade disputes with its allies and China near period-end dampened investor sentiment. In this environment, the broad US stock market, as measured by the S&P 500, generated a +2.65% total return for the period.2
Investment Strategy
We are a research driven, fundamental investor, pursuing a growth strategy. As a “bottom-up” investor focusing primarily on individual securities, we seek companies that have identifiable drivers of future earnings growth and that present, in our opinion, the best trade-off between that potential earnings growth, business and financial risk, and valuation.
Manager’s Discussion
Looking back on the key factors affecting the Fund’s returns during the six months under review, we would like to remind shareholders that our investment strategy is primarily bottom-up and driven by individual stock selection. However, we recognize that a sector-based discussion can be a helpful way to organize a portfolio review of key performance drivers. We employed our long-held strategy: bottom-up, individual company, fundamental research aimed at opportunistically finding what we believed to be outstanding large-cap companies across all sectors, at valuations we believed understated their fair worth, with future growth potential being a key driver of estimated worth.
| Top 10 Holdings | ||
| 6/30/18 | ||
Company Sector/Industry | % of Total Net Assets | |
Amazon.com Inc. | 8.2% | |
| Consumer Discretionary | ||
Apple Inc. | 5.1% | |
| Information Technology | ||
Mastercard Inc. | 5.1% | |
| Information Technology | ||
Visa Inc. | 4.5% | |
| Information Technology | ||
Facebook Inc. | 4.3% | |
| Information Technology | ||
Microsoft Corp. | 4.2% | |
| Information Technology | ||
Alphabet Inc. | 4.1% | |
| Information Technology | ||
UnitedHealth Group Inc. | 2.5% | |
| Health Care | ||
SBA Communications Corp. | 2.4% | |
| Real Estate | ||
ServiceNow Inc. | 2.4% | |
| Information Technology | ||
During the period, most sectors represented in the Fund’s portfolio contributed to absolute performance. Relative to the S&P 500, the information technology (IT) sector contributed significantly to performance due to an overweighted allocation and stock selection. Stock selection and an overweighted position in the consumer discretionary sector also aided relative results, as did stock selection and an underweighted allocation in financials.
In IT, payment technology company Mastercard contributed to relative performance. The company reported strong quarterly revenues that exceeded consensus expectations. In addition, it increased its 2018 revenue guidance and announced several growth initiatives. Other IT contributors included workflow platform company ServiceNow4 and diversified software firm Adobe Systems.
In the consumer discretionary sector, online retail shopping and cloud services provider Amazon.com helped relative results as it reported better-than-expected revenue and operating profits in the first quarter of 2018. Highlights included accelerating growth at its market-leading cloud business Amazon Web Services (AWS), as well as retail strength driven by advertising and its Prime service. Improved utilization in its fulfillment and
.
4. Not part of the index
| Semiannual Report | FLG-3 | |||||
FRANKLIN LARGE CAP GROWTH VIP FUND
data centers drove margins higher for the period, while the mix shift toward higher margin businesses continued to drive higher profitability over time. With e-commerce in its early days, we do not underestimate the growth and sustainability of Amazon.com, which continues to add new categories and countries to its footprint. The company also continues to see accelerated growth in AWS, which we consider a leader in Infrastructure-as-a-Service cloud computing.
In financials, diversified financial services company SVB Financial Group contributed to relative performance.
Elsewhere, medical devices manufacturer ABIOMED benefited relative results. The company has experienced strengthening sales, a trend we believe can continue. In addition, the company’s operating margins have improved, and it has benefited from US corporate tax reform. Commercial real estate information company CoStar Group4 also contributed to performance.
In contrast, an underweighting and stock selection in the energy sector detracted from the Fund’s results relative to the S&P 500, as did an overweighted position in the real estate sector. In real estate, data center operator Equinix was the sector’s largest detractor.
Elsewhere, biopharmaceuticals company Celgene hindered relative performance. The company’s application to the US Food and Drug Administration for Ozanimod, a new drug to treat multiple sclerosis and inflammatory bowel disease, was rejected during the period. In addition, concerns over patent expirations in coming years dampened investor sentiment. Machinery firm Stanley Black & Decker also detracted from relative results. The company reported revenues slightly above consensus expectations. However, its shares declined amid softer operating margins and guidance for future growth to come in below recent levels. Internet streaming service Netflix curbed relative performance due to the Fund’s underweighted position. The company’s shares performed well during the period amid solid quarterly results, with international subscriber trends that were particularly positive. Subscription gains came in ahead of estimates in the US and internationally, driven by a stronger-than-expected slate of content.
Thank you for your participation in Franklin Large Cap Growth VIP Fund. We look forward to serving your future investment needs.
The foregoing information reflects our analysis, opinions and portfolio holdings as of June 30, 2018, the end of the reporting period. The way we implement our main investment strategies and the resulting portfolio holdings may change depending on factors such as market and economic conditions. These opinions may not be relied upon as investment advice or an offer for a particular security. The information is not a complete analysis of every aspect of any market, country, industry, security or the Fund. Statements of fact are from sources considered reliable, but the investment manager makes no representation or warranty as to their completeness or accuracy. Although historical performance is no guarantee of future results, these insights may help you understand our investment management philosophy.
| FLG-4 | Semiannual Report | |||
FRANKLIN LARGE CAP GROWTH VIP FUND
Class 2 Fund Expenses
As an investor in a variable insurance contract (Contract) that indirectly provides for investment in an underlying mutual fund, you can incur transaction and/or ongoing expenses at both the Fund level and the Contract Level: (1) transaction expenses can include sales charges (loads) on purchases, surrender fees, transfer fees and premium taxes; and (2) ongoing expenses can include management fees, distribution and service (12b-1) fees, contract fees, annual maintenance fees, mortality and expense risk fees and other fees and expenses. All mutual funds and Contracts have some types of ongoing expenses. The table below shows Fund-level ongoing expenses and can help you understand these costs and compare them with those of other mutual funds offered through the Contract. The table assumes a $1,000 investment held for the six months indicated. Please refer to the Fund prospectus for additional information on operating expenses.
Actual Fund Expenses
The table below provides information about the actual account values and actual expenses in the columns under the heading “Actual.” In these columns the Fund’s actual return, which includes the effect of ongoing Fund expenses but does not include the effect of ongoing Contract expenses, is used to calculate the “Ending Account Value.” You can estimate the Fund-level expenses you paid during the period by following these steps (of course, your account value and expenses will differ from those in this illustration): Divide your account value by $1,000 (if your account had an $8,600 value, then $8,600 ÷ $1,000 = 8.6). Then multiply the result by the number under the headings “Actual” and “Fund-Level Expenses Paid During Period” (if Fund-Level Expenses Paid During Period were $ 7.50, then 8.6 x $ 7.50 = $64.50). In this illustration, the estimated expenses paid this period at the Fund level are $64.50.
Hypothetical Example for Comparison with Other Mutual Funds
Under the heading “Hypothetical” in the table, information is provided about hypothetical account values and hypothetical expenses based on the Fund’s actual expense ratio and an assumed rate of return of 5% per year before expenses, which is not the Fund’s actual return. This information may not be used to estimate the actual ending account balance or expenses you paid for the period, but it can help you compare ongoing costs of investing in the Fund with those of other mutual funds offered through the Contract. To do so, compare this 5% hypothetical example with the 5% hypothetical examples that appear in the shareholder reports of other funds offered through the Contract.
Please note that expenses shown in the table are meant to highlight ongoing costs at the Fund level only and do not reflect any ongoing expenses at the Contract level, or transaction expenses at either the Fund or Contract levels. In addition, while the Fund does not have transaction expenses, if the transaction and ongoing expenses at the Contract level were included, the expenses shown below would be higher. You should consult your Contract prospectus or disclosure document for more information.
| Actual (actual return after expenses) | Hypothetical (5% annual return before expenses) | |||||||||||||||
Share Class | Beginning Account Value 1/1/18 | Ending Account Value 6/30/18 | Fund-Level Paid During | Ending Value 6/30/18 | Fund-Level Paid During Period 1/1/18–6/30/181,2 | Net Annualized Expense Ratio2 | ||||||||||
|
|
|
| |||||||||||||
Class 2 | $1,000 | $1,119.70 | $5.68 | $1,019.44 | $5.41 | 1.08% | ||||||||||
1. Expenses are equal to the annualized expense ratio for the six-month period as indicated above—in the far right column—multiplied by the simple average account value over the period indicated, and then multiplied by 181/365 to reflect the one-half year period.
2. Reflects expenses after fee waivers and expense reimbursements. Does not include any ongoing expenses of the Contract for which the Fund is an investment option or acquired fund fees and expenses.
| Semiannual Report | FLG-5 | |||||
FRANKLIN TEMPLETON VARIABLE INSURANCE PRODUCTS TRUST
Financial Highlights
Franklin Large Cap Growth VIP Fund
Six Months Ended (unaudited) | Year Ended December 31, | |||||||||||||||||||||||
| 2017 | 2016 | 2015 | 2014 | 2013 | ||||||||||||||||||||
| ||||||||||||||||||||||||
| Class 1 | ||||||||||||||||||||||||
Per share operating performance (for a share outstanding throughout the period) | ||||||||||||||||||||||||
Net asset value, beginning of period | $20.93 | $17.85 | $18.42 | $23.26 | $20.91 | $16.43 | ||||||||||||||||||
|
| |||||||||||||||||||||||
| Income from investment operationsa: | ||||||||||||||||||||||||
Net investment income (loss)b | (0.01 | ) | (0.03 | ) | (0.04 | ) | (0.06 | ) | 0.11 | 0.24 | ||||||||||||||
Net realized and unrealized gains (losses) | 2.59 | 4.91 | (0.26 | ) | 1.56 | 2.54 | 4.48 | |||||||||||||||||
|
| |||||||||||||||||||||||
Total from investment operations | 2.58 | 4.88 | (0.30 | ) | 1.50 | 2.65 | 4.72 | |||||||||||||||||
|
| |||||||||||||||||||||||
| Less distributions from: | ||||||||||||||||||||||||
Net investment income | — | (0.20 | ) | — | (0.13 | ) | (0.30 | ) | (0.24) | |||||||||||||||
Net realized gains | (1.73 | ) | (1.60 | ) | (0.27 | ) | (6.21 | ) | — | — | ||||||||||||||
|
| |||||||||||||||||||||||
Total distributions | (1.73 | ) | (1.80 | ) | (0.27 | ) | (6.34 | ) | (0.30 | ) | (0.24) | |||||||||||||
|
| |||||||||||||||||||||||
Net asset value, end of period | $21.78 | $20.93 | $17.85 | $18.42 | $23.26 | $20.91 | ||||||||||||||||||
|
| |||||||||||||||||||||||
Total returnc | 12.09% | 28.38% | (1.49)% | 5.89% | 12.74% | 28.92% | ||||||||||||||||||
| Ratios to average net assetsd | ||||||||||||||||||||||||
Expenses | 0.83% | e | 0.87% | e | 0.80% | e | 0.78% | 0.79% | 0.79% | |||||||||||||||
Net investment income (loss) | (0.11)% | (0.14)% | (0.19)% | (0.27)% | 0.50% | 1.27% | ||||||||||||||||||
| Supplemental data | ||||||||||||||||||||||||
Net assets, end of period (000’s) | $1,214 | $1,092 | $883 | $47,864 | $54,971 | $54,291 | ||||||||||||||||||
Portfolio turnover rate | 11.60% | 24.96% | 36.26% | f | 23.23% | 93.53% | 28.27% | |||||||||||||||||
aThe amount shown for a share outstanding throughout the period may not correlate with the Statement of Operations for the period due to the timing of sales and repurchases of the Fund’s shares in relation to income earned and/or fluctuating fair value of the investments of the Fund.
bBased on average daily shares outstanding.
cTotal return does not include fees, charges or expenses imposed by the variable annuity and life insurance contracts for which Franklin Templeton Variable Insurance Products Trust serves as an underlying investment vehicle. Total return is not annualized for periods less than one year.
dRatios are annualized for periods less than one year.
eBenefit of expense reduction rounds to less than 0.01%.
fExcludes the value of portfolio securities delivered as a result of a redemption in-kind.
| FLG-6 | Semiannual Report | The accompanying notes are an integral part of these financial statements. | |||
FRANKLIN TEMPLETON VARIABLE INSURANCE PRODUCTS TRUST
FINANCIAL HIGHLIGHTS
Franklin Large Cap Growth VIP Fund (continued)
Six Months Ended (unaudited) | Year Ended December 31, | |||||||||||||||||||||||
| 2017 | 2016 | 2015 | 2014 | 2013 | ||||||||||||||||||||
| ||||||||||||||||||||||||
| Class 2 | ||||||||||||||||||||||||
Per share operating performance (for a share outstanding throughout the period) | ||||||||||||||||||||||||
Net asset value, beginning of period | $20.48 | $17.48 | $18.09 | $22.94 | $20.62 | $16.20 | ||||||||||||||||||
|
| |||||||||||||||||||||||
| Income from investment operationsa: | ||||||||||||||||||||||||
Net investment income (loss)b | (0.04 | ) | (0.08 | ) | (0.08 | ) | (0.11 | ) | 0.06 | 0.19 | ||||||||||||||
Net realized and unrealized gains (losses) | 2.54 | 4.81 | (0.26 | ) | 1.54 | 2.50 | 4.42 | |||||||||||||||||
|
| |||||||||||||||||||||||
Total from investment operations | 2.50 | 4.73 | (0.34 | ) | 1.43 | 2.56 | 4.61 | |||||||||||||||||
|
| |||||||||||||||||||||||
| Less distributions from: | ||||||||||||||||||||||||
Net investment income | — | (0.13 | ) | — | (0.07 | ) | (0.24 | ) | (0.19) | |||||||||||||||
Net realized gains | (1.73 | ) | (1.60 | ) | (0.27 | ) | (6.21 | ) | — | — | ||||||||||||||
|
| |||||||||||||||||||||||
Total distributions | (1.73 | ) | (1.73 | ) | (0.27 | ) | (6.28 | ) | (0.24 | ) | (0.19) | |||||||||||||
|
| |||||||||||||||||||||||
Net asset value, end of period | $21.25 | $20.48 | $17.48 | $18.09 | $22.94 | $20.62 | ||||||||||||||||||
|
| |||||||||||||||||||||||
Total returnc | 11.97% | 28.11% | (1.79)% | 5.62% | 12.46% | 28.63% | ||||||||||||||||||
| Ratios to average net assetsd | ||||||||||||||||||||||||
Expenses | 1.08% | e | 1.12% | e | 1.05% | e | 1.03% | 1.04% | 1.04% | |||||||||||||||
Net investment income (loss) | (0.36)% | (0.39)% | (0.44)% | (0.52)% | 0.25% | 1.02% | ||||||||||||||||||
| Supplemental data | ||||||||||||||||||||||||
Net assets, end of period (000’s) | $125,501 | $118,875 | $113,028 | $223,807 | $256,098 | $285,477 | ||||||||||||||||||
Portfolio turnover rate | 11.60% | 24.96% | 36.26% | f | 23.23% | 93.53% | 28.27% | |||||||||||||||||
aThe amount shown for a share outstanding throughout the period may not correlate with the Statement of Operations for the period due to the timing of sales and repurchases of the Fund’s shares in relation to income earned and/or fluctuating fair value of the investments of the Fund.
bBased on average daily shares outstanding.
cTotal return does not include fees, charges or expenses imposed by the variable annuity and life insurance contracts for which Franklin Templeton Variable Insurance Products Trust serves as an underlying investment vehicle. Total return is not annualized for periods less than one year.
dRatios are annualized for periods less than one year.
eBenefit of expense reduction rounds to less than 0.01%.
fExcludes the value of portfolio securities delivered as a result of a redemption in-kind.
| The accompanying notes are an integral part of these financial statements. | Semiannual Report | FLG-7 | |||||
FRANKLIN TEMPLETON VARIABLE INSURANCE PRODUCTS TRUST
Statement of Investments, June 30, 2018 (unaudited)
Franklin Large Cap Growth VIP Fund
| Shares | Value | |||||||
| ||||||||
Common Stocks 100.3% | ||||||||
Consumer Discretionary 14.3% | ||||||||
a Amazon.com Inc. | 6,135 | $ | 10,428,273 | |||||
Aptiv PLC | 9,872 | 904,571 | ||||||
a Booking Holdings Inc. | 820 | 1,662,214 | ||||||
a Charter Communications Inc., A | 4,551 | 1,334,399 | ||||||
Las Vegas Sands Corp. | 16,791 | 1,282,161 | ||||||
a Netflix Inc. | 3,089 | 1,209,127 | ||||||
The Walt Disney Co. | 7,169 | 751,383 | ||||||
Wynn Resorts Ltd. | 3,293 | 551,051 | ||||||
|
| |||||||
| 18,123,179 | ||||||||
|
| |||||||
Consumer Staples 4.3% | ||||||||
Constellation Brands Inc., A | 8,281 | 1,812,462 | ||||||
Lamb Weston Holdings Inc. | 17,116 | 1,172,617 | ||||||
a Monster Beverage Corp. | 20,889 | 1,196,940 | ||||||
Pinnacle Foods Inc. | 18,666 | 1,214,410 | ||||||
|
| |||||||
| 5,396,429 | ||||||||
|
| |||||||
Energy 1.1% | ||||||||
Diamondback Energy Inc. | 11,086 | 1,458,585 | ||||||
|
| |||||||
Financials 7.3% | ||||||||
a Athene Holding Ltd., A | 13,762 | 603,326 | ||||||
The Charles Schwab Corp. | 42,786 | 2,186,364 | ||||||
Intercontinental Exchange Inc. | 17,225 | 1,266,899 | ||||||
MarketAxess Holdings Inc. | 7,813 | 1,545,880 | ||||||
MSCI Inc. | 4,097 | 677,767 | ||||||
S&P Global Inc. | 6,749 | 1,376,054 | ||||||
a SVB Financial Group | 5,520 | 1,593,955 | ||||||
|
| |||||||
| 9,250,245 | ||||||||
|
| |||||||
Health Care 9.5% | ||||||||
a ABIOMED Inc. | 4,132 | 1,690,195 | ||||||
a Celgene Corp. | 7,750 | 615,505 | ||||||
a Clovis Oncology Inc. | 7,799 | 354,621 | ||||||
a Edwards Lifesciences Corp. | 12,371 | 1,800,846 | ||||||
a Heron Therapeutics Inc. | 27,758 | 1,078,398 | ||||||
a Intuitive Surgical Inc. | 1,659 | 793,798 | ||||||
Medtronic PLC | 8,071 | 690,958 | ||||||
a Nevro Corp. | 7,966 | 636,085 | ||||||
a Sage Therapeutics Inc. | 1,258 | 196,915 | ||||||
UnitedHealth Group Inc. | 12,676 | 3,109,930 | ||||||
West Pharmaceutical Services Inc. | 11,383 | 1,130,218 | ||||||
|
| |||||||
| 12,097,469 | ||||||||
|
| |||||||
Industrials 11.3% | ||||||||
Allegiant Travel Co. | 2,893 | 401,982 | ||||||
The Boeing Co. | 5,331 | 1,788,604 | ||||||
a CoStar Group Inc. | 6,136 | 2,531,898 | ||||||
Honeywell International Inc. | 8,212 | 1,182,939 | ||||||
a IHS Markit Ltd. | 22,035 | 1,136,786 | ||||||
Raytheon Co. | 14,585 | 2,817,530 | ||||||
Rockwell Automation Inc. | 5,278 | 877,362 | ||||||
Roper Technologies Inc. | 3,261 | 899,742 | ||||||
Stanley Black & Decker Inc. | 6,197 | 823,023 | ||||||
a Univar Inc. | 21,512 | 564,475 | ||||||
| FLG-8 | Semiannual Report | |||
FRANKLIN TEMPLETON VARIABLE INSURANCE PRODUCTS TRUST
STATEMENT OF INVESTMENTS (UNAUDITED)
Franklin Large Cap Growth VIP Fund (continued)
| Shares | Value | |||||||
| ||||||||
Common Stocks (continued) | ||||||||
Industrials (continued) | ||||||||
a Verisk Analytics Inc. | 12,259 | $ | 1,319,559 | |||||
|
| |||||||
| 14,343,900 | ||||||||
|
| |||||||
Information Technology 47.5% | ||||||||
a 2U Inc. | 15,380 | 1,285,153 | ||||||
a Adobe Systems Inc. | 10,435 | 2,544,157 | ||||||
a Adyen NV (Netherlands) | 300 | 165,351 | ||||||
a Alibaba Group Holding Ltd., ADR (China) | 5,331 | 989,060 | ||||||
a Alphabet Inc., A | 3,629 | 4,097,831 | ||||||
a Alphabet Inc., C | 1,014 | 1,131,269 | ||||||
Amphenol Corp., A | 3,513 | 306,158 | ||||||
Analog Devices Inc. | 9,752 | 935,412 | ||||||
Apple Inc. | 35,025 | 6,483,478 | ||||||
Applied Materials Inc. | 22,871 | 1,056,411 | ||||||
a Autodesk Inc. | 11,264 | 1,476,598 | ||||||
a Avalara Inc. | 1,800 | 96,066 | ||||||
Broadcom Inc. | 5,135 | 1,245,956 | ||||||
a DocuSign Inc. | 2,300 | 121,785 | ||||||
a Electronic Arts Inc. | 10,275 | 1,448,981 | ||||||
a Facebook Inc., A | 27,933 | 5,427,941 | ||||||
a Fiserv Inc. | 14,052 | 1,041,113 | ||||||
a InterXion Holding NV (Netherlands) | 19,875 | 1,240,598 | ||||||
Mastercard Inc., A | 32,890 | 6,463,543 | ||||||
Microsoft Corp. | 54,017 | 5,326,616 | ||||||
Monolithic Power Systems | 7,629 | 1,019,768 | ||||||
NVIDIA Corp. | 8,861 | 2,099,171 | ||||||
a PayPal Holdings Inc. | 11,738 | 977,423 | ||||||
a Pluralsight Inc., A | 2,800 | 68,460 | ||||||
a Salesforce.com Inc. | 16,134 | 2,200,678 | ||||||
a ServiceNow Inc. | 17,362 | 2,994,424 | ||||||
a Spotify Technology SA | 3,767 | 633,760 | ||||||
Visa Inc., A | 43,318 | 5,737,469 | ||||||
Xilinx Inc. | 9,819 | 640,788 | ||||||
a Zendesk Inc. | 17,307 | 943,058 | ||||||
|
| |||||||
| 60,198,476 | ||||||||
|
| |||||||
Materials 1.1% | ||||||||
a Axalta Coating Systems Ltd. | 23,209 | 703,465 | ||||||
a Ingevity Corp. | 8,218 | 664,507 | ||||||
|
| |||||||
| 1,367,972 | ||||||||
|
| |||||||
Real Estate 3.9% | ||||||||
American Tower Corp. | 7,083 | 1,021,156 | ||||||
Equinix Inc. | 1,960 | 842,585 | ||||||
a SBA Communications Corp., A | 18,318 | 3,024,668 | ||||||
|
| |||||||
| 4,888,409 | ||||||||
|
| |||||||
Total Common Stocks (Cost $64,674,012) | 127,124,664 | |||||||
|
| |||||||
| Semiannual Report | FLG-9 | |||||
FRANKLIN TEMPLETON VARIABLE INSURANCE PRODUCTS TRUST
STATEMENT OF INVESTMENTS (UNAUDITED)
Franklin Large Cap Growth VIP Fund (continued)
Principal Amount | Value | |||||||
| ||||||||
Short Term Investments (Cost $148,654) 0.1% | ||||||||
Repurchase Agreements 0.1% | ||||||||
b Joint Repurchase Agreement, 2.10%, 7/02/18 (Maturity Value $148,680) | ||||||||
BNP Paribas Securities Corp. (Maturity Value $53,355) | ||||||||
Deutsche Bank Securities Inc. (Maturity Value $1,952) | ||||||||
HSBC Securities (USA) Inc. (Maturity Value $93,373) | ||||||||
Collateralized by U.S. Government Agency Securities, 0.00% - 3.625%, 9/18/18 - 6/19/23; cU.S. | $148,654 | $ | 148,654 | |||||
|
| |||||||
Total Investments (Cost $64,822,666) 100.4% | 127,273,318 | |||||||
Other Assets, less Liabilities (0.4)% | (558,766 | ) | ||||||
|
| |||||||
Net Assets 100.0% | $ | 126,714,552 | ||||||
|
| |||||||
See Abbreviations on page FLG-19.
aNon-income producing.
bSee Note 1(c) regarding joint repurchase agreement.
cThe security was issued on a discount basis with no stated coupon rate.
| FLG-10 | Semiannual Report | The accompanying notes are an integral part of these financial statements. | |||
FRANKLIN TEMPLETON VARIABLE INSURANCE PRODUCTS TRUST
Financial Statements
Statement of Assets and Liabilities
June 30, 2018 (unaudited)
Franklin Large Cap Growth VIP Fund | ||||
| ||||
Assets: | ||||
Investments in securities: | ||||
Cost - Unaffiliated issuers | $ 64,674,012 | |||
Cost - Unaffiliated repurchase agreements | 148,654 | |||
|
| |||
Value - Unaffiliated issuers | $127,124,664 | |||
Value - Unaffiliated repurchase agreements | 148,654 | |||
Receivables: | ||||
Capital shares sold | 281 | |||
Dividends | 16,242 | |||
Other assets | 83 | |||
|
| |||
Total assets | 127,289,924 | |||
|
| |||
Liabilities: | ||||
Payables: | ||||
Investment securities purchased | 322,541 | |||
Capital shares redeemed | 66,203 | |||
Management fees | 80,034 | |||
Distribution fees | 53,281 | |||
Reports to shareholders | 30,958 | |||
Accrued expenses and other liabilities | 22,355 | |||
|
| |||
Total liabilities | 575,372 | |||
|
| |||
Net assets, at value | $126,714,552 | |||
|
| |||
Net assets consist of: | ||||
Paid-in capital | $ 59,223,017 | |||
Undistributed net investment income (loss) | (226,787 | ) | ||
Net unrealized appreciation (depreciation) | 62,450,652 | |||
Accumulated net realized gain (loss) | 5,267,670 | |||
|
| |||
Net assets, at value | $126,714,552 | |||
|
| |||
Class 1: | ||||
Net assets, at value | $ 1,213,875 | |||
|
| |||
Shares outstanding | 55,729 | |||
|
| |||
Net asset value and maximum offering price per share | $21.78 | |||
|
| |||
Class 2: | ||||
Net assets, at value | $125,500,677 | |||
|
| |||
Shares outstanding | 5,906,456 | |||
|
| |||
Net asset value and maximum offering price per share | $21.25 | |||
|
| |||
| The accompanying notes are an integral part of these financial statements. | Semiannual Report | FLG-11 | |||||
FRANKLIN TEMPLETON VARIABLE INSURANCE PRODUCTS TRUST
FINANCIAL STATEMENTS
Statement of Operations
for the six months ended June 30, 2018 (unaudited)
Franklin Large Cap Growth VIP Fund | ||||
| ||||
Investment income: | ||||
Dividends: | ||||
Unaffiliated issuers | $ 435,400 | |||
Interest: | ||||
Unaffiliated issuers | 14,409 | |||
|
| |||
Total investment income | 449,809 | |||
|
| |||
Expenses: | ||||
Management fees (Note 3a) | 469,341 | |||
Distribution fees: (Note 3c) | ||||
Class 2 | 154,968 | |||
Custodian fees (Note 4) | 589 | |||
Reports to shareholders | 27,022 | |||
Professional fees | 18,993 | |||
Trustees’ fees and expenses | 299 | |||
Other | 5,446 | |||
|
| |||
Total expenses | 676,658 | |||
Expense reductions (Note 4) | (62 | ) | ||
|
| |||
Net expenses | 676,596 | |||
|
| |||
Net investment income (loss) | (226,787 | ) | ||
|
| |||
Realized and unrealized gains (losses): | ||||
Net realized gain (loss) from: | ||||
Investments: | ||||
Unaffiliated issuers | 5,294,572 | |||
Foreign currency transactions | 145 | |||
|
| |||
Net realized gain (loss) | 5,294,717 | |||
|
| |||
Net change in unrealized appreciation (depreciation) on: | ||||
Investments: | ||||
Unaffiliated issuers | 8,807,301 | |||
|
| |||
Net realized and unrealized gain (loss) | 14,102,018 | |||
|
| |||
Net increase (decrease) in net assets resulting from operations | $13,875,231 | |||
|
| |||
| FLG-12 | Semiannual Report | The accompanying notes are an integral part of these financial statements. | |||
FRANKLIN TEMPLETON VARIABLE INSURANCE PRODUCTS TRUST
FINANCIAL STATEMENTS
Statements of Changes in Net Assets
| Franklin Large Cap Growth VIP Fund | ||||||||
Six Months Ended June 30, 2018 (unaudited) | Year Ended December 31, 2017 | |||||||
| ||||||||
Increase (decrease) in net assets: | ||||||||
Operations: | ||||||||
Net investment income (loss) | $ (226,787 | ) | $ (473,904 | ) | ||||
Net realized gain (loss) | 5,294,717 | 10,317,956 | ||||||
Net change in unrealized appreciation (depreciation) | 8,807,301 | 20,237,623 | ||||||
|
| |||||||
Net increase (decrease) in net assets resulting from operations | 13,875,231 | 30,081,675 | ||||||
|
| |||||||
Distributions to shareholders from: | ||||||||
Net investment income: | ||||||||
Class 1 | — | (9,601 | ) | |||||
Class 2 | — | (751,572 | ) | |||||
Net realized gains: | ||||||||
Class 1 | (89,524 | ) | (77,085 | ) | ||||
Class 2 | (9,610,684 | ) | (9,605,025 | ) | ||||
|
| |||||||
Total distributions to shareholders | (9,700,208 | ) | (10,443,283 | ) | ||||
|
| |||||||
Capital share transactions: (Note 2) | ||||||||
Class 1 | 79,446 | 49,428 | ||||||
Class 2 | 2,492,603 | (13,631,397 | ) | |||||
|
| |||||||
Total capital share transactions | 2,572,049 | (13,581,969 | ) | |||||
|
| |||||||
Net increase (decrease) in net assets | 6,747,072 | 6,056,423 | ||||||
Net assets: | ||||||||
Beginning of period | 119,967,480 | 113,911,057 | ||||||
|
| |||||||
End of period | $126,714,552 | $119,967,480 | ||||||
|
| |||||||
Undistributed net investment income (loss) included in net assets: | ||||||||
End of period | $ (226,787 | ) | $ — | |||||
|
| |||||||
| The accompanying notes are an integral part of these financial statements. | Semiannual Report | FLG-13 | |||||
FRANKLIN TEMPLETON VARIABLE INSURANCE PRODUCTS TRUST
Notes to Financial Statements (unaudited)
Franklin Large Cap Growth VIP Fund
1. Organization and Significant Accounting Policies
Franklin Templeton Variable Insurance Products Trust (Trust) is registered under the Investment Company Act of 1940 (1940 Act) as an open-end management investment company, consisting of eighteen separate funds and applies the specialized accounting and reporting guidance in U.S. Generally Accepted Accounting Principles (U.S. GAAP). Franklin Large Cap Growth VIP Fund (Fund) is included in this report. Shares of the Fund are generally sold only to insurance company separate accounts to fund the benefits of variable life insurance policies or variable annuity contracts. At June 30, 2018, 70.3% of the Fund’s shares were held through one insurance company. Investment activities of these insurance company separate accounts could have a material impact on the Fund. The Fund offers two classes of shares: Class 1 and Class 2. Each class of shares may differ by its distribution fees, voting rights on matters affecting a single class and its exchange privilege.
The following summarizes the Fund’s significant accounting policies.
a. Financial Instrument Valuation
The Fund’s investments in financial instruments are carried at fair value daily. Fair value is the price that would be received to sell an asset or paid to transfer a liability in an orderly transaction between market participants on the measurement date. The Fund calculates the net asset value (NAV) per share each business day as of 4 p.m. Eastern time or the regularly scheduled close of the New York Stock Exchange (NYSE), whichever is earlier. Under compliance policies and procedures approved by the Trust’s Board of Trustees (the Board), the Fund’s administrator has responsibility for oversight of valuation, including leading the cross-functional Valuation Committee (VC). The VC provides administration and oversight of the Fund’s valuation policies and procedures, which are approved annually by the Board. Among other things, these procedures allow the Fund to utilize independent pricing services, quotations from securities and financial instrument dealers, and other market sources to determine fair value.
Equity securities listed on an exchange or on the NASDAQ National Market System are valued at the last quoted sale price or the official closing price of the day, respectively. Foreign equity securities are valued as of the close of trading on the foreign stock exchange on which the security is primarily traded, or as of 4 p.m. Eastern time. The value is then converted
into its U.S. dollar equivalent at the foreign exchange rate in effect at 4 p.m. Eastern time on the day that the value of the security is determined. Over-the-counter (OTC) securities are valued within the range of the most recent quoted bid and ask prices. Securities that trade in multiple markets or on multiple exchanges are valued according to the broadest and most representative market. Certain equity securities are valued based upon fundamental characteristics or relationships to similar securities.
Investments in repurchase agreements are valued at cost, which approximates fair value.
The Fund has procedures to determine the fair value of financial instruments for which market prices are not reliable or readily available. Under these procedures, the VC convenes on a regular basis to review such financial instruments and considers a number of factors, including significant unobservable valuation inputs, when arriving at fair value. The VC primarily employs a market-based approach which may use related or comparable assets or liabilities, recent transactions, market multiples, book values, and other relevant information for the investment to determine the fair value of the investment. An income-based valuation approach may also be used in which the anticipated future cash flows of the investment are discounted to calculate fair value. Discounts may also be applied due to the nature or duration of any restrictions on the disposition of the investments. Due to the inherent uncertainty of valuations of such investments, the fair values may differ significantly from the values that would have been used had an active market existed. The VC employs various methods for calibrating these valuation approaches including a regular review of key inputs and assumptions, transactional back-testing or disposition analysis, and reviews of any related market activity.
Trading in securities on foreign securities stock exchanges and OTC markets may be completed before 4 p.m. Eastern time. In addition, trading in certain foreign markets may not take place on every Fund’s business day. Occasionally, events occur between the time at which trading in a foreign security is completed and 4 p.m. Eastern time that might call into question the reliability of the value of a portfolio security held by the Fund. As a result, differences may arise between the value of the Fund’s portfolio securities as determined at the foreign market close and the latest indications of value at 4 p.m. Eastern time. In order to minimize the potential for these differences, the VC monitors price movements following the close of trading in foreign stock markets through a series of country
| FLG-14 | Semiannual Report | |||
FRANKLIN TEMPLETON VARIABLE INSURANCE PRODUCTS TRUST
NOTES TO FINANCIAL STATEMENTS (UNAUDITED)
Franklin Large Cap Growth VIP Fund (continued)
specific market proxies (such as baskets of American Depositary Receipts, futures contracts and exchange traded funds). These price movements are measured against established trigger thresholds for each specific market proxy to assist in determining if an event has occurred that may call into question the reliability of the values of the foreign securities held by the Fund. If such an event occurs, the securities may be valued using fair value procedures, which may include the use of independent pricing services.
When the last day of the reporting period is a non-business day, certain foreign markets may be open on those days that the Fund’s NAV is not calculated, which could result in differences between the value of the Fund’s portfolio securities on the last business day and the last calendar day of the reporting period. Any significant security valuation changes due to an open foreign market are adjusted and reflected by the Fund for financial reporting purposes.
b. Foreign Currency Translation
Portfolio securities and other assets and liabilities denominated in foreign currencies are translated into U.S. dollars based on the exchange rate of such currencies against U.S. dollars on the date of valuation. The Fund may enter into foreign currency exchange contracts to facilitate transactions denominated in a foreign currency. Purchases and sales of securities, income and expense items denominated in foreign currencies are translated into U.S. dollars at the exchange rate in effect on the transaction date. Portfolio securities and assets and liabilities denominated in foreign currencies contain risks that those currencies will decline in value relative to the U.S. dollar. Occasionally, events may impact the availability or reliability of foreign exchange rates used to convert the U.S. dollar equivalent value. If such an event occurs, the foreign exchange rate will be valued at fair value using procedures established and approved by the Board.
The Fund does not separately report the effect of changes in foreign exchange rates from changes in market prices on securities held. Such changes are included in net realized and unrealized gain or loss from investments in the Statement of Operations.
Realized foreign exchange gains or losses arise from sales of foreign currencies, currency gains or losses realized between the trade and settlement dates on securities transactions and the difference between the recorded amounts of dividends, interest, and foreign withholding taxes and the U.S. dollar equivalent of
the amounts actually received or paid. Net unrealized foreign exchange gains and losses arise from changes in foreign exchange rates on foreign denominated assets and liabilities other than investments in securities held at the end of the reporting period.
c. Joint Repurchase Agreement
The Fund enters into a joint repurchase agreement whereby its uninvested cash balance is deposited into a joint cash account with other funds managed by the investment manager or an affiliate of the investment manager and is used to invest in one or more repurchase agreements. The value and face amount of the joint repurchase agreement are allocated to the funds based on their pro-rata interest. A repurchase agreement is accounted for as a loan by the Fund to the seller, collateralized by securities which are delivered to the Fund’s custodian. The fair value, including accrued interest, of the initial collateralization is required to be at least 102% of the dollar amount invested by the funds, with the value of the underlying securities marked to market daily to maintain coverage of at least 100%. Repurchase agreements are subject to the terms of Master Repurchase Agreements (MRAs) with approved counterparties (sellers). The MRAs contain various provisions, including but not limited to events of default and maintenance of collateral for repurchase agreements. In the event of default by either the seller or the Fund, certain MRAs may permit the non-defaulting party to net and close-out all transactions, if any, traded under such agreements. The Fund may sell securities it holds as collateral and apply the proceeds towards the repurchase price and any other amounts owed by the seller to the Fund in the event of default by the seller. This could involve costs or delays in addition to a loss on the securities if their value falls below the repurchase price owed by the seller. The joint repurchase agreement held by the Fund at period end, as indicated in the Statement of Investments, had been entered into on June 29, 2018.
d. Income and Deferred Taxes
It is the Fund’s policy to qualify as a regulated investment company under the Internal Revenue Code. The Fund intends to distribute to shareholders substantially all of its taxable income and net realized gains to relieve it from federal income and if applicable, excise taxes. As a result, no provision for U.S. federal income taxes is required.
| Semiannual Report | FLG-15 | |||||
FRANKLIN TEMPLETON VARIABLE INSURANCE PRODUCTS TRUST
NOTES TO FINANCIAL STATEMENTS (UNAUDITED)
Franklin Large Cap Growth VIP Fund (continued)
1. Organization and Significant Accounting
Policies (continued)
d. Income and Deferred Taxes (continued)
The Fund may be subject to foreign taxation related to income received, capital gains on the sale of securities and certain foreign currency transactions in the foreign jurisdictions in which it invests. Foreign taxes, if any, are recorded based on the tax regulations and rates that exist in the foreign markets in which the Fund invests. When a capital gain tax is determined to apply, the Fund records an estimated deferred tax liability in an amount that would be payable if the securities were disposed of on the valuation date.
The Fund may recognize an income tax liability related to its uncertain tax positions under U.S. GAAP when the uncertain tax position has a less than 50% probability that it will be sustained upon examination by the tax authorities based on its technical merits. As of June 30, 2018, the Fund has determined that no tax liability is required in its financial statements related to uncertain tax positions for any open tax years (or expected to be taken in future tax years). Open tax years are those that remain subject to examination and are based on the statute of limitations in each jurisdiction in which the Fund invests.
e. Security Transactions, Investment Income, Expenses and Distributions
Security transactions are accounted for on trade date. Realized gains and losses on security transactions are determined on a specific identification basis. Interest income and estimated expenses are accrued daily. Dividend income is recorded on the ex-dividend date except for certain dividends from securities where the dividend rate is not available. In such cases, the dividend is recorded as soon as the information is received by the Fund. Distributions to shareholders are recorded on the ex-dividend date. Distributable earnings are determined according to income tax regulations (tax basis) and may differ from earnings recorded in accordance with U.S. GAAP. These differences may be permanent or temporary. Permanent
differences are reclassified among capital accounts to reflect their tax character. These reclassifications have no impact on net assets or the results of operations. Temporary differences are not reclassified, as they may reverse in subsequent periods.
Common expenses incurred by the Trust are allocated among the Funds based on the ratio of net assets of each Fund to the combined net assets of the Trust or based on the ratio of number of shareholders of each Fund to the combined number of shareholders of the Trust. Fund specific expenses are charged directly to the Fund that incurred the expense.
Realized and unrealized gains and losses and net investment income, excluding class specific expenses, are allocated daily to each class of shares based upon the relative proportion of net assets of each class. Differences in per share distributions by class are generally due to differences in class specific expenses.
f. Accounting Estimates
The preparation of financial statements in accordance with U.S. GAAP requires management to make estimates and assumptions that affect the reported amounts of assets and liabilities at the date of the financial statements and the amounts of income and expenses during the reporting period. Actual results could differ from those estimates.
g. Guarantees and Indemnifications
Under the Trust’s organizational documents, its officers and trustees are indemnified by the Trust against certain liabilities arising out of the performance of their duties to the Trust. Additionally, in the normal course of business, the Trust, on behalf of the Fund, enters into contracts with service providers that contain general indemnification clauses. The Trust’s maximum exposure under these arrangements is unknown as this would involve future claims that may be made against the Trust that have not yet occurred. Currently, the Trust expects the risk of loss to be remote.
| FLG-16 | Semiannual Report | |||
FRANKLIN TEMPLETON VARIABLE INSURANCE PRODUCTS TRUST
NOTES TO FINANCIAL STATEMENTS (UNAUDITED)
Franklin Large Cap Growth VIP Fund (continued)
2. Shares of Beneficial Interest
At June 30, 2018, there were an unlimited number of shares authorized ( without par value ). Transactions in the Fund’s shares were as follows:
| Six Months Ended June 30, 2018 | Year Ended December 31, 2017 | |||||||||||||||||||
| Shares | Amount | Shares | Amount | |||||||||||||||||
| Class 1 Shares: | ||||||||||||||||||||
Shares issued in reinvestment of distributions | 3,993 | $ | 89,524 | 4,592 | $ | 86,686 | ||||||||||||||
Shares redeemed | (454 | ) | (10,078 | ) | (1,833 | ) | (37,258 | ) | ||||||||||||
Net increase (decrease) | 3,539 | $ | 79,446 | 2,759 | $ | 49,428 | ||||||||||||||
| Class 2 Shares: | ||||||||||||||||||||
Shares sold | 401,811 | $ | 8,938,769 | 325,624 | $ | 6,237,303 | ||||||||||||||
Shares issued in reinvestment of distributions | 439,446 | 9,610,684 | 559,816 | 10,356,597 | ||||||||||||||||
Shares redeemed | (738,592 | ) | (16,056,850 | ) | (1,547,426 | ) | (30,225,297 | ) | ||||||||||||
Net increase (decrease) | 102,665 | $ | 2,492,603 | (661,986 | ) | $ | (13,631,397 | ) | ||||||||||||
3. Transactions with Affiliates
Franklin Resources, Inc. is the holding company for various subsidiaries that together are referred to as Franklin Templeton Investments. Certain officers and trustees of the Fund are also officers and/or directors of the following subsidiaries:
| Subsidiary | Affiliation | |
Franklin Advisers, Inc. (Advisers) | Investment manager | |
Franklin Templeton Services, LLC (FT Services) | Administrative manager | |
Franklin Templeton Distributors, Inc. (Distributors) | Principal underwriter | |
Franklin Templeton Investor Services, LLC (Investor Services) | Transfer agent |
a. Management Fees
The Fund pays an investment management fee to Advisers based on the average daily net assets of the Fund as follows:
| Annualized Fee Rate | Net Assets | |
0.750% | Up to and including $500 million | |
0.625% | Over $500 million, up to and including $1 billion | |
0.500% | In excess of $1 billion |
For the period ended June 30, 2018, the annualized gross effective investment management fee rate was 0.750% of the Fund’s average daily net assets.
b. Administrative Fees
Under an agreement with Advisers, FT Services provides administrative services to the Fund. The fee is paid by Advisers based on the Fund’s average daily net assets, and is not an additional expense of the Fund.
| Semiannual Report | FLG-17 | |||||
FRANKLIN TEMPLETON VARIABLE INSURANCE PRODUCTS TRUST
NOTES TO FINANCIAL STATEMENTS (UNAUDITED)
Franklin Large Cap Growth VIP Fund (continued)
3. Transactions with Affiliates (continued)
c. Distribution Fees
The Board has adopted a distribution plan for Class 2 shares pursuant to Rule 12b-1 under the 1940 Act. Under the Fund’s compensation distribution plan, the Fund pays Distributors for costs incurred in connection with the servicing, sale and distribution of the Fund’s shares up to 0.35% per year of its average daily net assets. The Board has agreed to limit the current rate to 0.25% per year for Class 2. The plan year, for purposes of monitoring compliance with the maximum annual plan rate, is February 1 through January 31.
d. Transfer Agent Fees
Investor Services, under terms of an agreement, performs shareholder servicing for the Fund and is not paid by the Fund for the services.
e. Interfund Transactions
The Fund engaged in purchases and sales of investments with funds or other accounts that have common investment managers (or affiliated investment managers), directors, trustees or officers. During the period ended June 30, 2018, these purchase and sale transactions aggregated $93,292 and $0, respectively.
4. Expense Offset Arrangement
The Fund has entered into an arrangement with its custodian whereby credits realized as a result of uninvested cash balances are used to reduce a portion of the Fund’s custodian expenses. During the period ended June 30, 2018, the custodian fees were reduced as noted in the Statement of Operations.
5. Income Taxes
At June 30, 2018, the cost of investments and net unrealized appreciation (depreciation) for income tax purposes were as follows:
Cost of investments | $64,849,199 | |||
|
| |||
Unrealized appreciation | $63,205,054 | |||
Unrealized depreciation | (780,935) | |||
|
| |||
Net unrealized appreciation (depreciation) | $62,424,119 | |||
|
| |||
Differences between income and/or capital gains as determined on a book basis and a tax basis are primarily due to differing treatments of foreign currency transactions, passive foreign investment company shares and wash sales.
6. Investment Transactions
Purchases and sales of investments (excluding short term securities) for the period ended June 30, 2018, aggregated $14,344,806 and $20,560,146, respectively.
7. Credit Facility
The Fund, together with other U.S. registered and foreign investment funds (collectively, Borrowers), managed by Franklin Templeton Investments, are borrowers in a joint syndicated senior unsecured credit facility totaling $2 billion (Global Credit Facility) which matures on February 8, 2019. This Global Credit Facility provides a source of funds to the Borrowers for temporary and emergency purposes, including the ability to meet future unanticipated or unusually large redemption requests.
| FLG-18 | Semiannual Report | |||
FRANKLIN TEMPLETON VARIABLE INSURANCE PRODUCTS TRUST
NOTES TO FINANCIAL STATEMENTS (UNAUDITED)
Franklin Large Cap Growth VIP Fund (continued)
Under the terms of the Global Credit Facility, the Fund shall, in addition to interest charged on any borrowings made by the Fund and other costs incurred by the Fund, pay its share of fees and expenses incurred in connection with the implementation and maintenance of the Global Credit Facility, based upon its relative share of the aggregate net assets of all of the Borrowers, including an annual commitment fee of 0.15% based upon the unused portion of the Global Credit Facility. These fees are reflected in other expenses in the Statement of Operations. During the period ended June 30, 2018, the Fund did not use the Global Credit Facility.
8. Fair Value Measurements
The Fund follows a fair value hierarchy that distinguishes between market data obtained from independent sources (observable inputs) and the Fund’s own market assumptions (unobservable inputs). These inputs are used in determining the value of the Fund’s financial instruments and are summarized in the following fair value hierarchy:
| • | Level 1 – quoted prices in active markets for identical financial instruments |
| • | Level 2 – other significant observable inputs (including quoted prices for similar financial instruments, interest rates, prepayment speed, credit risk, etc.) |
| • | Level 3 – significant unobservable inputs (including the Fund’s own assumptions in determining the fair value of financial instruments) |
The input levels are not necessarily an indication of the risk or liquidity associated with financial instruments at that level.
For movements between the levels within the fair value hierarchy, the Fund has adopted a policy of recognizing the transfers as of the date of the underlying event which caused the movement.
A summary of inputs used as of June 30, 2018, in valuing the Fund’s assets carried at fair value, is as follows:
| Level 1 | Level 2 | Level 3 | Total | |||||||||||||||||||||||||
| Assets: | ||||||||||||||||||||||||||||
Investments in Securities:a | ||||||||||||||||||||||||||||
Equity Investments | $ | 127,124,664 | $ | — | $ | — | $ | 127,124,664 | ||||||||||||||||||||
Short Term Investments | — | 148,654 | — | 148,654 | ||||||||||||||||||||||||
|
| |||||||||||||||||||||||||||
Total Investments in Securities | $ | 127,124,664 | $ | 148,654 | $ | — | $ | 127,273,318 | ||||||||||||||||||||
|
| |||||||||||||||||||||||||||
aFor detailed categories, see the accompanying Statement of Investments.
9. Subsequent Events
The Fund has evaluated subsequent events through the issuance of the financial statements and determined that no events have occurred that require disclosure.
Abbreviations
Selected Portfolio |
| ADR American Depositary Receipt |
| Semiannual Report | FLG-19 | |||||
This page intentionally left blank.
Franklin Mutual Global Discovery VIP Fund
This semiannual report for Franklin Mutual Global Discovery VIP Fund covers the period ended June 30, 2018.
Class 2 Performance Summary as of June 30, 2018
The Fund’s Class 2 Shares had a -1.52% total return* for the six-month period ended June 30, 2018.
*The Fund has a fee waiver associated with any investment it makes in a Franklin Templeton money fund and/or other Franklin Templeton fund, contractually guaranteed through 4/30/19. Fund investment results reflect the fee waiver; without this waiver, the results would have been lower.
Performance reflects the Fund’s Class 2 operating expenses, but does not include any contract fees, expenses or sales charges. If they had been included, performance would be lower. These charges and deductions, particularly for variable life policies, can have a significant effect on contract values and insurance benefits. See the contract prospectus for a complete description of these expenses, including sales charges.
Performance data represent past performance, which does not guarantee future results. Investment return and principal value will fluctuate, and you may have a gain or loss when you sell your shares. Current performance may differ from figures shown.
| Semiannual Report | MGD-1 | |||||
FRANKLIN MUTUAL GLOBAL DISCOVERY VIP FUND
Fund Goal and Main Investments
The Fund seeks capital appreciation. Under normal market conditions, the Fund invests primarily in US and foreign equity securities that the investment manager believes are available at market prices less than their intrinsic value. The equity securities in which the Fund invests are primarily common stock. To a lesser extent, the Fund also invests in merger arbitrage securities and the debt and equity of distressed companies. The Fund may invest substantially and potentially up to 100% of its assets in foreign securities, which may include sovereign debt and participations in foreign government debt.
Fund Risks
All investments involve risks, including possible loss of principal. Value securities may not increase in price as anticipated, or may decline further in value. The Fund’s investments in foreign securities involve certain risks including currency fluctuations, and economic and political uncertainties. Because the Fund may invest at least a significant portion of its assets in companies in a specific region, including Europe, the Fund is subject to greater risks of adverse developments in that region and/or the surrounding regions than a fund that is more broadly diversified geographically. Securities issued by smaller and midsize companies may be more volatile in price than those of larger companies, involve substantial risks and should be considered speculative. Derivatives involve costs and can create economic leverage in the Fund’s portfolio which may result in significant volatility and cause the Fund to participate in losses (as well as gains) in an amount that exceeds the Fund’s initial investment. The Fund’s investments in companies engaged in mergers, reorganizations or liquidations also involve special risks as pending deals may not be completed on time or on favorable terms. The Fund may invest in lower rated bonds, which entail higher credit risk. The Fund is actively managed but there is no guarantee that the manager’s investment decisions will produce the desired results. The Fund’s prospectus also includes a description of the main investment risks.
Performance Overview
You can find the Fund’s six-month total return in the Performance Summary. In comparison, the Fund’s benchmark, the MSCI World Index, posted a +0.76% total return and the
Geographic Composition*
Based on Total Net Assets as of 6/30/18
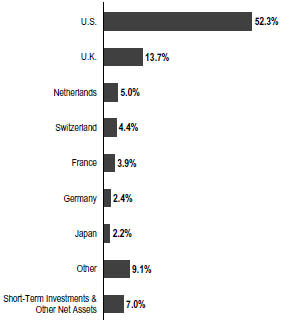
*Figures are stated as a percentage of total and may not equal 100% or may be negative due to rounding, use of any derivatives, unsettled trades or other factors.
Standard & Poor’s® 500 Index generated a +2.65% total return for the same period.1
Economic and Market Overview
The global economy expanded during the six-month period under review amid generally upbeat economic data across regions. In this environment, global developed and emerging market stocks reached a new all-time high in January 2018, as measured by the MSCI All Country World Index (ACWI). During the period, global markets were aided by price gains in oil and other commodities, encouraging corporate earnings reports and investor optimism about global economic growth. However, global stocks had a -0.13% total return for the six-month period, as measured by the MSCI ACWI, largely due to an overall decline in emerging market stocks.1
Global markets reflected investor concerns about tensions in the Korean peninsula and political uncertainties in the US and the European Union, as well as worries that strong economic
1. Source: Morningstar. One cannot invest directly in an index, and an index is not representative of the Fund’s portfolio. Please see Index Descriptions following the Fund Summaries
The dollar value, number of shares or principal amount, and names of all portfolio holdings are listed in the Fund’s Statement of Investments (SOI).
| MGD-2 | Semiannual Report | |||
FRANKLIN MUTUAL GLOBAL DISCOVERY VIP FUND
growth and rising inflation in some parts of the world, particularly in the US, would lead central banks to increase interest rates sooner than expected. Markets were further pressured by the Trump administration’s protectionist trade policies, uncertainty surrounding the US-China trade relationship, and a broad sell-off in information technology stocks in March due to a potential for tighter regulation in the sector arising from concerns about consumer data privacy. An overall easing of tensions in the Korean peninsula and intermittent US-China trade negotiations partially offset some of these concerns. However, US trade disputes with its allies and China near period-end dampened investor sentiment.
The US economy continued to grow during the six months under review. After moderating for three consecutive quarters, the economy grew faster in 2018’s second quarter, driven by consumer spending, exports, business investment and government spending. The unemployment rate declined from 4.1% in December 2017, as reported at the beginning of the six-month period, to 4.0% at period-end.2 Annual inflation, as measured by the Consumer Price Index, increased from 2.1% in December 2017, as reported at the beginning of the period, to 2.9% at period-end.2 The US Federal Reserve raised its target range for the federal funds rate in March and June 2018 and continued reducing its balance sheet as part of its ongoing plan to normalize monetary policy.
In Europe, the UK’s quarterly economic growth moderated in 2018’s first quarter amid a decline in construction output. The Bank of England kept its key policy rate unchanged during the period. The eurozone’s quarterly growth moderated in 2018’s first quarter due to a decline in external demand. The bloc’s annual inflation rate ended the period higher than in December 2017. The European Central Bank (ECB) kept its benchmark interest rate unchanged during the period. However, at its June meeting, the ECB announced it would further reduce its monthly bond purchases beginning in October 2018 and indicated it would conclude the program at the end of 2018 while continuing to keep interest rates unchanged through at least the summer of 2019.
In Asia, Japan’s quarterly gross domestic product (GDP) growth in 2018’s first quarter declined, the country’s first contraction since 2015’s fourth quarter, mainly due to a decline in private residential investment and household consumption.
The Bank of Japan left its benchmark interest rate unchanged during the period and continued its monetary stimulus measures.
In emerging markets, Brazil’s quarterly GDP accelerated in 2018’s first quarter compared to the previous quarter. The country’s central bank cut its benchmark interest rate twice during the period to spur economic growth. Russia’s annual GDP grew in 2018’s first quarter compared to the prior-year period, amid the Bank of Russia’s continued policy support. China’s annual GDP moderated in 2018’s first quarter compared to the prior-year period. The People’s Bank of China left its benchmark interest rate unchanged during the period. Overall, emerging market stocks, as measured by the MSCI Emerging Markets Index, declined during the period.3
Investment Strategy
At Franklin Mutual Advisors, we are committed to our distinctive value approach to investing. Our major investment strategy is investing in undervalued stocks. When selecting undervalued equities, we are attracted to what we believe are fundamentally strong companies with healthy balance sheets, high-quality assets, substantial free cash flow and shareholder-oriented management teams and whose stocks are trading at discounts to our assessment of the companies’ intrinsic or business value. We also look for asset-rich companies whose shares may be trading at depressed levels due to concerns over short-term earnings disappointments, litigation, management strategy or other perceived negatives. While the vast majority of our undervalued equity investments are made in publicly traded companies globally, we may invest occasionally in privately held companies as well.
We complement this more traditional investment strategy with two others. One is distressed investing, which is complex and can take many forms. The most common distressed investment the Fund undertakes is the purchase of financially troubled or bankrupt companies’ debt at a substantial discount to face value. After the financially distressed company is reorganized, often in bankruptcy court, the old debt is typically replaced with new securities issued by the financially stronger company.
The other piece of our investment strategy is participating in arbitrage situations, another highly specialized field. When companies announce proposed mergers or takeovers, commonly referred to as “deals,” the target company may trade at a discount to the bid it ultimately accepts. One form of
2. Source: Bureau of Labor Statistics.
3. Please see Index Descriptions following the Fund Summaries.
| Semiannual Report | MGD-3 | |||||
FRANKLIN MUTUAL GLOBAL DISCOVERY VIP FUND
arbitrage involves purchasing the target company’s stock when it is trading below the value we believe it would receive in a deal. In keeping with our commitment to a relatively conservative investment approach, we typically focus our arbitrage efforts on announced deals, and eschew rumored deals or other situations we consider relatively risky.
In addition, it is our practice to hedge the Fund’s currency exposure when we deem it advantageous for our shareholders.
What is meant by “hedge”?
To hedge an investment is to take a position intended to offset potential losses/gains that may be incurred by a companion financial instrument.
Manager’s Discussion
In the first half of 2018, positive corporate fundamentals were overshadowed by political and economic concerns. Corporate profits in the US and other developed markets continued their impressive year-over-year pace of growth. In the US and other developed markets, economic activity moderated during the first quarter, but appeared to have recovered during the second quarter. Financial markets were also aided by improved industrial commodity prices, most notably crude oil. Nonetheless, investor sentiment became less upbeat and volatility returned to financial markets, after an historically calm 2017.
As investors entered 2018, overall US equity market valuations (e.g., price-to-earnings, price-to-book or price-to-sales) were elevated relative to most historical benchmarks. The uneven equity market performance during the period and the strong pace of corporate earnings growth helped to reduce valuations somewhat. At the same time, the rise in volatility provided us with select opportunities to initiate or add to positions in companies that we believed were trading at undeservedly discounted prices.
A further escalation of trade-related rhetoric and tariffs, in our view, could have important consequences for the US and abroad. We have already begun to see disruptions to global supply chains and added pressure on China’s financial and credit markets. Additional tariffs imposed by the US and its trading partners could rattle business confidence, curb corporate earnings growth, undermine favorable fundamentals in specific industries, provoke further financial market volatility and raise uncertainty regarding the solid pace of synchronized global growth.
Top 10 Sectors/Industries
6/30/18
| % of Total Net Assets | ||||
Banks | 12.1% | |||
Oil, Gas & Consumable Fuels | 9.3% | |||
Pharmaceuticals | 9.2% | |||
Insurance | 8.4% | |||
Media | 5.4% | |||
Software | 4.7% | |||
Health Care Equipment & Supplies | 4.6% | |||
Tobacco | 3.2% | |||
Communications Equipment | 2.7% | |||
Automobiles | 2.6% | |||
Europe’s equity market overall was still trading at an attractively lower price-to-earnings multiple and higher dividend yield than the US equity market at period-end. However, in addition to trade tensions, we are paying close attention to Brexit negotiations, Italy’s new populist government, a potentially fraying relationship between Germany’s two conservative parties and the future of the international nuclear deal with Iran. As of period-end, we still believe Europe’s economic recovery is fairly resilient, but any of the aforementioned challenges has the potential to fuel volatility and even slow economic growth. In such an environment, we believe domestically oriented companies may fare relatively better.
In Asia, we have said for some time that China needs to address the high level of corporate leverage, and the People’s Bank of China has recently mandated that much of the debt residing in the shadow banking market be brought back onto bank balance sheets. The resulting burden may impair bank earnings in the short term, which, in our view, is underappreciated by many investors and could create some investment opportunities. Meanwhile, Japan’s government has proposed further amendments to its Corporate Governance Code. We believe the proposals have the potential to drive further improvements in capital allocation and operating discipline, which have long been a concern of investors. We have become more interested in finding opportunities to take advantage of this emerging trend.
Mergers and acquisitions (M&A) have remained active. In the first half of 2018, the market received some clarity regarding the regulatory environment when a federal judge ruled in favor
| MGD-4 | Semiannual Report | |||
FRANKLIN MUTUAL GLOBAL DISCOVERY VIP FUND
of AT&T and Time Warner4, and against the US Department of Justice (DOJ) in its antitrust lawsuit. The judge decided that the DOJ had failed to show that the merger would be anti-competitive, and the deal closed promptly after the opinion was released. In response, the shares of companies involved in several other pending deals traded higher, indicating a higher expected probability of closing. The market also saw the development of a bidding war between The Walt Disney Company and Comcast5 for control of Twenty-First Century Fox5 and Sky. As the year began, Disney had a deal to buy Fox and Fox had an offer pending to acquire the 61% of Sky it did not own. Comcast subsequently launched bids for both companies, and when Fox raised its bid for Sky, Comcast promptly raised its bid to a higher level. Comcast has indicated it will not bid further for Fox and, while Fox could raise its bid for Sky, it appears most likely that Comcast will purchase Sky. This bidding war showed the ongoing uncertainty in media, in which major media firms believe they need even more scale to compete with internet rivals that are experiencing significant growth. We expect ongoing activity in M&A markets and, with the increased regulatory clarity provided by the Time Warner decision, further opportunities in merger arbitrage.
Finding mispriced risk in credit markets remains difficult due in part to the decline in debt covenants, which include terms that restrict financial activities by the borrower or set parameters for specific financial metrics. The search is also complicated by private equity firms involved in leveraged buyout transactions using increasingly liberal interpretations of credit agreements and bond indentures to potentially shift valuable assets beyond the reach of creditors. We have directed much of our focus on out-of-favor industries in pursuit of securities with the potential to benefit most from liquidity-enhancing events, such as asset sales, the ability to issue secured debt within existing agreements, and free-cash flow that could buy time for a company to weather its financial storm.
Turning to Fund performance, top contributors included UK-based pharmaceutical company GlaxoSmithKline, Netherlands-based Koninklijke Philips and Finland-based global communications and information technology provider Nokia.
Investors reacted positively to GlaxoSmithKline’s March announcements that it had pulled out of the auction for Pfizer’s5 consumer health business and agreed to buy Novartis
Top 10 Holdings
6/30/18
Company Sector/Industry, Country | % of Total Net Assets | |||
Medtronic PLC | 2.8% | |||
Health Care Equipment & Supplies, U.S. | ||||
Novartis AG | 2.5% | |||
Pharmaceuticals, Switzerland | ||||
Eli Lilly & Co. | 2.4% | |||
Pharmaceuticals, U.S. | ||||
Royal Dutch Shell PLC | 2.3% | |||
Oil, Gas & Consumable Fuels, U.K. | ||||
Merck & Co. Inc. | 2.2% | |||
Pharmaceuticals, U.S. | ||||
British American Tobacco PLC | 2.2% | |||
Tobacco, U.K. | ||||
GlaxoSmithKline PLC | 2.1% | |||
Pharmaceuticals, U.K. | ||||
The Walt Disney Co. | 2.0% | |||
Media, U.S. | ||||
NN Group NV | 1.9% | |||
Insurance, Netherlands | ||||
Citizens Financial Group Inc. | 1.9% | |||
Banks, U.S. | ||||
out of its consumer health care joint venture for $13 billion. In our view, not purchasing the Pfizer consumer business at a high price demonstrated capital discipline and the ability to exercise restraint by not overpaying for strategically desirable assets, thus enhancing management credibility. In addition, not consummating the Pfizer consumer-asset deal eliminated concerns around a potential cut to the dividend to finance the deal, which had been a serious concern for investors. Also, investors have become more willing to give Glaxo some credit for research and development returns improving under the new management team.
Koninklijke Philips is near the end of its restructuring efforts. In line with our initial investment thesis, the company has almost fully pivoted its business model from being an industrial conglomerate to becoming a focused health care technology company. In April, Philips reported better-than-expected results, particularly strong order growth overall and sales growth within its diagnostics and treatment business. Recent positive results have increased our confidence in management’s ability to deliver on its long-term strategy and targets.
Nokia announced solid fourth quarter and full-year 2017 results in February 2018, particularly better-than-expected profits for
4. Not held at period-end.
5. Not a Fund holding.
| Semiannual Report | MGD-5 | |||||
FRANKLIN MUTUAL GLOBAL DISCOVERY VIP FUND
2017 and significant improvement in cash flow. Management also issued a new earnings target for 2020 that was higher than many investors had anticipated. Subsequent quarterly results issued in April 2018 were weaker than expected, but management emphasized the company’s strong levels of new and existing orders and indicated that sales for full-year 2018 could exceed its previous guidance. We believe Nokia is serious about cutting costs and improving cash flow following its acquisition of Alcatel in 2016 to increase its dividend in 2018 and stay on course to reach its 2020 earnings target.
During the period under review, Fund investments that detracted from performance included British American Tobacco, US-based industrials company General Electric (GE) and US-based digital security and storage provider Symantec.
British American Tobacco’s stock price faced downward pressure due to the potential for additional regulation in the US and concerns regarding next generation products. In March 2018, the US Food and Drug Administration issued an Advance Notice of Proposed Rulemaking, which started the process of examining the possibility of regulating nicotine levels in combustible cigarettes. The process may not result in regulation, but if it does, many experts believe the review could take seven to 10 years before a rule is adopted in the marketplace. Meanwhile, JUUL, produced by JUUL Labs5 has emerged as a popular e-cigarette in the US. JUUL’s growth rate is high and its product is popular with young consumers. It is unclear to what degree JUUL is cannibalizing the combustible market, but it has hurt investor sentiment toward the industry.
In January 2018, General Electric (GE) announced a greater-than-expected $6.2 billion after-tax charge related to its insurance subsidiary at GE Capital. Management also moved ahead with what amounts to a breakup of GE. In May 2018, the company announced the merger of its transportation operations into Wabtec5, and in June 2018 it announced a plan to spin off its health care division and divest its stake in oil-services firm Baker Hughes. Once completed, we believe the moves will streamline GE and enable the company to reduce debt and build up a cash buffer, as well as help management better focus on its key aviation, power and renewable energy divisions.
Shares of Symantec tumbled in May 2018 when the company disclosed an internal investigation resulting from concerns raised by a former employee that could result in a restatement of prior financials, as well as lowered earnings guidance. The stock partially recovered when Symantec’s management provided more information regarding the investigation and reassured investors that financial statements would likely not need to be restated.
During the period, the Fund held currency forwards and futures seeking to hedge most of the currency risk of the portfolio’s non-US dollar investments. The hedges had a positive overall impact on the Fund’s performance because of the appreciation of the US dollar versus the hedged currencies.
What is a currency forward?
A currency forward is an agreement between the Fund and a counterparty to buy or sell a foreign currency in exchange for another currency at a specific exchange rate on a future date.
What is a future?
A future is an agreement between the Fund and a counterparty made through a US or foreign futures exchange to buy or sell an underlying instrument or asset at a specific price on a future date.
As fellow shareholders, we found recent relative and absolute performance disappointing, but it is not uncommon for our strategy to lag the equity markets at times. We remain committed to our disciplined, value investment approach as we seek to generate attractive, long-term, risk-adjusted returns for shareholders.
Thank you for your participation in Franklin Mutual Global Discovery VIP Fund. We look forward to serving your future investment needs.
The foregoing information reflects our analysis, opinions and portfolio holdings as of June 30, 2018, the end of the reporting period. The way we implement our main investment strategies and the resulting portfolio holdings may change depending on factors such as market and economic conditions. These opinions may not be relied upon as investment advice or an offer for a particular security. The information is not a complete analysis of every aspect of any market, country, industry, security or the Fund. Statements of fact are from sources considered reliable, but the investment manager makes no representation or warranty as to their completeness or accuracy. Although historical performance is no guarantee of future results, these insights may help you understand our investment management philosophy.
| MGD-6 | Semiannual Report | |||
FRANKLIN MUTUAL GLOBAL DISCOVERY VIP FUND
Class 2 Fund Expenses
As an investor in a variable insurance contract (Contract) that indirectly provides for investment in an underlying mutual fund, you can incur transaction and/or ongoing expenses at both the Fund level and the Contract Level: (1) transaction expenses can include sales charges (loads) on purchases, surrender fees, transfer fees and premium taxes; and (2) ongoing expenses can include management fees, distribution and service (12b-1) fees, contract fees, annual maintenance fees, mortality and expense risk fees and other fees and expenses. All mutual funds and Contracts have some types of ongoing expenses. The table below shows Fund-level ongoing expenses and can help you understand these costs and compare them with those of other mutual funds offered through the Contract. The table assumes a $1,000 investment held for the six months indicated. Please refer to the Fund prospectus for additional information on operating expenses.
Actual Fund Expenses
The table below provides information about the actual account values and actual expenses in the columns under the heading “Actual.” In these columns the Fund’s actual return, which includes the effect of ongoing Fund expenses but does not include the effect of ongoing Contract expenses, is used to calculate the “Ending Account Value.” You can estimate the Fund-level expenses you paid during the period by following these steps (of course, your account value and expenses will differ from those in this illustration): Divide your account value by $1,000 (if your account had an $8,600 value, then $8,600 ÷ $1,000 = 8.6). Then multiply the result by the number under the headings “Actual” and “Fund-Level Expenses Paid During Period” (if Fund-Level Expenses Paid During Period were $ 7.50, then 8.6 x $ 7.50 = $64.50). In this illustration, the estimated expenses paid this period at the Fund level are $64.50.
Hypothetical Example for Comparison with Other Mutual Funds
Under the heading “Hypothetical” in the table, information is provided about hypothetical account values and hypothetical expenses based on the Fund’s actual expense ratio and an assumed rate of return of 5% per year before expenses, which is not the Fund’s actual return. This information may not be used to estimate the actual ending account balance or expenses you paid for the period, but it can help you compare ongoing costs of investing in the Fund with those of other mutual funds offered through the Contract. To do so, compare this 5% hypothetical example with the 5% hypothetical examples that appear in the shareholder reports of other funds offered through the Contract.
Please note that expenses shown in the table are meant to highlight ongoing costs at the Fund level only and do not reflect any ongoing expenses at the Contract level, or transaction expenses at either the Fund or Contract levels. In addition, while the Fund does not have transaction expenses, if the transaction and ongoing expenses at the Contract level were included, the expenses shown below would be higher. You should consult your Contract prospectus or disclosure document for more information.
| Actual (actual return after expenses) | Hypothetical (5% annual return before expenses) | |||||||||||
Share Class | Beginning Account Value 1/1/18 | Ending Account Value 6/30/18 | Fund-Level Paid During Period | Ending Account Value 6/30/18 | Fund-Level Paid During Period | Net Annualized Expense Ratio2 | ||||||
|
|
|
| |||||||||
Class 2 | $1,000 | $984.80 | $6.05 | $1,018.70 | $6.16 | 1.23% | ||||||
1. Expenses are equal to the annualized expense ratio for the six-month period as indicated above—in the far right column—multiplied by the simple average account value over the period indicated, and then multiplied by 181/365 to reflect the one-half year period.
2. Reflects expenses after fee waivers and expense reimbursements. Does not include any ongoing expenses of the Contract for which the Fund is an investment option or acquired fund fees and expenses.
| Semiannual Report | MGD-7 | |||||
FRANKLIN TEMPLETON VARIABLE INSURANCE PRODUCTS TRUST
Financial Highlights
Franklin Mutual Global Discovery VIP Fund
Six Months Ended June 30, 2018 (unaudited) | Year Ended December 31, | |||||||||||||||||||||||
| 2017 | 2016 | 2015 | 2014 | 2013 | ||||||||||||||||||||
| ||||||||||||||||||||||||
| Class 1 | ||||||||||||||||||||||||
Per share operating performance (for a share outstanding throughout the period) | ||||||||||||||||||||||||
Net asset value, beginning of period | $20.38 | $20.22 | $19.85 | $22.61 | $23.31 | $20.55 | ||||||||||||||||||
|
| |||||||||||||||||||||||
| Income from investment operationsa: | ||||||||||||||||||||||||
Net investment incomeb | 0.23 | 0.47 | 0.41 | 0.37 | 0.68 | c | 0.46 | |||||||||||||||||
Net realized and unrealized gains (losses) | (0.51 | ) | 1.29 | 1.92 | (1.17 | ) | 0.76 | 5.03 | ||||||||||||||||
|
| |||||||||||||||||||||||
Total from investment operations | (0.28 | ) | 1.76 | 2.33 | (0.80 | ) | 1.44 | 5.49 | ||||||||||||||||
|
| |||||||||||||||||||||||
| Less distributions from: | ||||||||||||||||||||||||
Net investment income | — | (0.42 | ) | (0.39 | ) | (0.69 | ) | (0.57 | ) | (0.58) | ||||||||||||||
Net realized gains | — | (1.18 | ) | (1.57 | ) | (1.27 | ) | (1.57 | ) | (2.15) | ||||||||||||||
|
| |||||||||||||||||||||||
Total distributions | — | (1.60 | ) | (1.96 | ) | (1.96 | ) | (2.14 | ) | (2.73) | ||||||||||||||
|
| |||||||||||||||||||||||
Net asset value, end of period | $20.10 | $20.38 | $20.22 | $19.85 | $22.61 | $23.31 | ||||||||||||||||||
|
| |||||||||||||||||||||||
Total returnd | (1.37)% | 8.99% | 12.32% | (3.39)% | 5.98% | 27.95% | ||||||||||||||||||
| Ratios to average net assetse | ||||||||||||||||||||||||
Expensesf,g | 0.98% | h | 1.01% | h | 1.01% | h | 1.02% | h | 1.00% | 0.97% | ||||||||||||||
Expenses incurred in connection with securities sold short | 0.01% | —% | 0.01% | 0.02% | 0.03% | —%i | ||||||||||||||||||
Net investment income | 2.26% | 2.29% | 2.10% | 1.71% | 2.85% | c | 2.13% | |||||||||||||||||
| Supplemental data | ||||||||||||||||||||||||
Net assets, end of period (000’s) | $3,580 | $3,189 | $3,084 | $2,632 | $2,313 | $2,465 | ||||||||||||||||||
Portfolio turnover rate | 16.69% | 17.49% | 17.54% | 21.88% | 22.18% | 15.58% | ||||||||||||||||||
aThe amount shown for a share outstanding throughout the period may not correlate with the Statement of Operations for the period due to the timing of sales and repurchases of the Fund’s shares in relation to income earned and/or fluctuating fair value of the investments of the Fund.
bBased on average daily shares outstanding.
cNet investment income per share includes approximately $0.34 per share related to income received in the form of special dividends in connection with certain Fund holdings. Excluding this amount, the ratio of net investment income to average net assets would have been 1.40%.
dTotal return does not include fees, charges or expenses imposed by the variable annuity and life insurance contracts for which Franklin Templeton Variable Insurance Products Trust serves as an underlying investment vehicle. Total return is not annualized for periods less than one year.
eRatios are annualized for periods less than one year.
fIncludes dividend and/or interest expense on securities sold short and security borrowing fees, if any. See below for the ratios of such expenses to average net assets for the periods presented. See Note 1(d).
gBenefit of expense reduction rounds to less than 0.01%.
hBenefit of waiver and payments by affiliates rounds to less than 0.01%.
iRounds to less than 0.01%.
| MGD-8 | Semiannual Report | The accompanying notes are an integral part of these financial statements. | |||
FRANKLIN TEMPLETON VARIABLE INSURANCE PRODUCTS TRUST
FINANCIAL HIGHLIGHTS
Franklin Mutual Global Discovery VIP Fund (continued)
Six Months Ended (unaudited) | Year Ended December 31, | |||||||||||||||||||||||
| 2017 | 2016 | 2015 | 2014 | 2013 | ||||||||||||||||||||
| ||||||||||||||||||||||||
| Class 2 | ||||||||||||||||||||||||
| Per share operating performance (for a share outstanding throughout the period) | ||||||||||||||||||||||||
Net asset value, beginning of period | $19.80 | $19.69 | $19.37 | $22.11 | $22.84 | $20.17 | ||||||||||||||||||
|
| |||||||||||||||||||||||
| Income from investment operationsa: | ||||||||||||||||||||||||
Net investment incomeb | 0.20 | 0.41 | 0.35 | 0.32 | 0.60 | c | 0.42 | |||||||||||||||||
Net realized and unrealized gains (losses) | (0.50 | ) | 1.25 | 1.87 | (1.16 | ) | 0.75 | 4.92 | ||||||||||||||||
|
| |||||||||||||||||||||||
Total from investment operations | (0.30 | ) | 1.66 | 2.22 | (0.84 | ) | 1.35 | 5.34 | ||||||||||||||||
|
| |||||||||||||||||||||||
Less distributions from: | ||||||||||||||||||||||||
Net investment income | — | (0.37 | ) | (0.33 | ) | (0.63 | ) | (0.51 | ) | (0.52) | ||||||||||||||
Net realized gains | — | (1.18 | ) | (1.57 | ) | (1.27 | ) | (1.57 | ) | (2.15) | ||||||||||||||
|
| |||||||||||||||||||||||
Total distributions | — | (1.55 | ) | (1.90 | ) | (1.90 | ) | (2.08 | ) | (2.67) | ||||||||||||||
|
| |||||||||||||||||||||||
Net asset value, end of period | $19.50 | $19.80 | $19.69 | $19.37 | $22.11 | $22.84 | ||||||||||||||||||
|
| |||||||||||||||||||||||
Total returnd | (1.52)% | 8.71% | 12.06% | (3.65)% | 5.71% | 27.61% | ||||||||||||||||||
| Ratios to average net assetse | ||||||||||||||||||||||||
Expensesf,g | 1.23% | h | 1.26% | h | 1.26% | h | 1.27% | h | 1.25% | 1.22% | ||||||||||||||
Expenses incurred in connection with securities sold short | 0.01% | —% | 0.01% | 0.02% | 0.03% | —%i | ||||||||||||||||||
Net investment income | 2.01% | 2.04% | 1.85% | 1.46% | 2.60% | c | 1.88% | |||||||||||||||||
| Supplemental data | ||||||||||||||||||||||||
Net assets, end of period (000’s) | $588,113 | $631,179 | $630,397 | $629,366 | �� | $685,711 | $684,780 | |||||||||||||||||
Portfolio turnover rate | 16.69% | 17.49% | 17.54% | 21.88% | 22.18% | 15.58% | ||||||||||||||||||
aThe amount shown for a share outstanding throughout the period may not correlate with the Statement of Operations for the period due to the timing of sales and repurchases of the Fund’s shares in relation to income earned and/or fluctuating fair value of the investments of the Fund.
bBased on average daily shares outstanding.
cNet investment income per share includes approximately $0.34 per share related to income received in the form of special dividends in connection with certain Fund holdings. Excluding this amount, the ratio of net investment income to average net assets would have been 1.15%.
dTotal return does not include fees, charges or expenses imposed by the variable annuity and life insurance contracts for which Franklin Templeton Variable Insurance Products Trust serves as an underlying investment vehicle. Total return is not annualized for periods less than one year.
eRatios are annualized for periods less than one year.
fIncludes dividend and/or interest expense on securities sold short and security borrowing fees, if any. See below for the ratios of such expenses to average net assets for the periods presented. See Note 1(d).
gBenefit of expense reduction rounds to less than 0.01%.
hBenefit of waiver and payments by affiliates rounds to less than 0.01%.
iRounds to less than 0.01%.
| The accompanying notes are an integral part of these financial statements. | Semiannual Report | MGD-9 | |||||
FRANKLIN TEMPLETON VARIABLE INSURANCE PRODUCTS TRUST
FINANCIAL HIGHLIGHTS
Franklin Mutual Global Discovery VIP Fund (continued)
Six Months Ended (unaudited) | Year Ended December 31, | |||||||||||||||||||||||
| 2017 | 2016 | 2015 | 2014 | 2013 | ||||||||||||||||||||
| ||||||||||||||||||||||||
| Class 4 | ||||||||||||||||||||||||
| Per share operating performance (for a share outstanding throughout the period) | ||||||||||||||||||||||||
Net asset value, beginning of period | $20.17 | $20.02 | $19.66 | $22.39 | $23.10 | $20.38 | ||||||||||||||||||
|
| |||||||||||||||||||||||
| Income from investment operationsa: | ||||||||||||||||||||||||
Net investment incomeb | 0.19 | 0.40 | 0.34 | 0.30 | 0.61 | c | 0.40 | |||||||||||||||||
Net realized and unrealized gains (losses) | (0.50 | ) | 1.27 | 1.89 | (1.17 | ) | 0.73 | 4.97 | ||||||||||||||||
|
| |||||||||||||||||||||||
Total from investment operations | (0.31 | ) | 1.67 | 2.23 | (0.87 | ) | 1.34 | 5.37 | ||||||||||||||||
|
| |||||||||||||||||||||||
| Less distributions from: | ||||||||||||||||||||||||
Net investment income | — | (0.34 | ) | (0.30 | ) | (0.59 | ) | (0.48 | ) | (0.50) | ||||||||||||||
Net realized gains | — | (1.18 | ) | (1.57 | ) | (1.27 | ) | (1.57 | ) | (2.15) | ||||||||||||||
|
| |||||||||||||||||||||||
Total distributions | — | (1.52 | ) | (1.87 | ) | (1.86 | ) | (2.05 | ) | (2.65) | ||||||||||||||
|
| |||||||||||||||||||||||
Net asset value, end of period | $19.86 | $20.17 | $20.02 | $19.66 | $22.39 | $23.10 | ||||||||||||||||||
|
| |||||||||||||||||||||||
Total returnd | (1.54)% | 8.61% | 11.91% | (3.74)% | 5.60% | 27.52% | ||||||||||||||||||
| Ratios to average net assetse | ||||||||||||||||||||||||
Expensesf,g | 1.33% | h | 1.36% | h | 1.36% | h | 1.37% | h | 1.35% | 1.32% | ||||||||||||||
Expenses incurred in connection with securities sold short | 0.01% | —% | 0.01% | 0.02% | 0.03% | —%i | ||||||||||||||||||
Net investment income | 1.91% | 1.94% | 1.75% | 1.36% | 2.50% | c | 1.78% | |||||||||||||||||
| Supplemental data | ||||||||||||||||||||||||
Net assets, end of period (000’s) | $36,558 | $41,713 | $45,262 | $49,054 | $59,961 | $70,354 | ||||||||||||||||||
Portfolio turnover rate | 16.69% | 17.49% | 17.54% | 21.88% | 22.18% | 15.58% | ||||||||||||||||||
aThe amount shown for a share outstanding throughout the period may not correlate with the Statement of Operations for the period due to the timing of sales and repurchases of the Fund’s shares in relation to income earned and/or fluctuating fair value of the investments of the Fund.
bBased on average daily shares outstanding.
cNet investment income per share includes approximately $0.34 per share related to income received in the form of special dividends in connection with certain Fund holdings. Excluding this amount, the ratio of net investment income to average net assets would have been 1.05%.
dTotal return does not include fees, charges or expenses imposed by the variable annuity and life insurance contracts for which Franklin Templeton Variable Insurance Products Trust serves as an underlying investment vehicle. Total return is not annualized for periods less than one year.
eRatios are annualized for periods less than one year.
fIncludes dividend and/or interest expense on securities sold short and security borrowing fees, if any. See below for the ratios of such expenses to average net assets for the periods presented. See Note 1(d).
gBenefit of expense reduction rounds to less than 0.01%.
hBenefit of waiver and payments by affiliates rounds to less than 0.01%.
iRounds to less than 0.01%.
| MGD-10 | Semiannual Report | The accompanying notes are an integral part of these financial statements. | |||
FRANKLIN TEMPLETON VARIABLE INSURANCE PRODUCTS TRUST
Statement of Investments, June 30, 2018 (unaudited)
Franklin Mutual Global Discovery VIP Fund
| Country | Shares/ Units/ Warrants | Value | ||||||||
Common Stocks and Other Equity Interests 87.8% | ||||||||||
Aerospace & Defense 1.0% | ||||||||||
BAE Systems PLC | United Kingdom | 755,507 | $ | 6,453,269 | ||||||
|
| |||||||||
Auto Components 0.5% | ||||||||||
| a,b,c International Automotive Components Group Brazil LLC | Brazil | 424,073 | 9,643 | |||||||
| a,b,c International Automotive Components Group North America LLC | United States | 4,052,916 | 1,213,398 | |||||||
Toyo Tire & Rubber Co. Ltd. | Japan | 136,700 | 2,001,813 | |||||||
|
| |||||||||
| 3,224,854 | ||||||||||
|
| |||||||||
Automobiles 1.1% | ||||||||||
General Motors Co. | United States | 175,900 | 6,930,460 | |||||||
|
| |||||||||
Banks 12.1% | ||||||||||
Barclays PLC | United Kingdom | 1,564,265 | 3,904,302 | |||||||
BNP Paribas SA | France | 106,195 | 6,599,439 | |||||||
CIT Group Inc. | United States | 136,169 | 6,864,279 | |||||||
Citigroup Inc. | United States | 162,150 | 10,851,078 | |||||||
Citizens Financial Group Inc. | United States | 303,023 | 11,787,595 | |||||||
First Horizon National Corp. | United States | 353,473 | 6,305,958 | |||||||
HSBC Holdings PLC | United Kingdom | 438,755 | 4,117,937 | |||||||
JPMorgan Chase & Co. | United States | 42,286 | 4,406,201 | |||||||
Societe Generale SA | France | 157,880 | 6,661,740 | |||||||
Standard Chartered PLC | United Kingdom | 442,523 | 4,047,526 | |||||||
Wells Fargo & Co. | United States | 192,020 | 10,645,589 | |||||||
|
| |||||||||
| 76,191,644 | ||||||||||
|
| |||||||||
Building Products 0.9% | ||||||||||
Johnson Controls International PLC | United States | 162,300 | 5,428,935 | |||||||
|
| |||||||||
Capital Markets 1.2% | ||||||||||
Credit Suisse Group AG | Switzerland | 191,359 | 2,888,547 | |||||||
Deutsche Bank AG | Germany | 207,029 | 2,230,639 | |||||||
Guotai Junan Securities Co. Ltd. | China | 1,275,797 | 2,712,230 | |||||||
|
| |||||||||
| 7,831,416 | ||||||||||
|
| |||||||||
Communications Equipment 2.7% | ||||||||||
Cisco Systems Inc. | United States | 169,680 | 7,301,330 | |||||||
Nokia OYJ, A | Finland | 611,269 | 3,520,888 | |||||||
Nokia OYJ, ADR | Finland | 1,095,886 | 6,301,345 | |||||||
|
| |||||||||
| 17,123,563 | ||||||||||
|
| |||||||||
Construction Materials 0.9% | ||||||||||
LafargeHolcim Ltd., B | Switzerland | 121,811 | 5,950,339 | |||||||
|
| |||||||||
Consumer Finance 1.3% | ||||||||||
Ally Financial Inc. | United States | 93,416 | 2,454,039 | |||||||
Capital One Financial Corp. | United States | 60,788 | 5,586,417 | |||||||
|
| |||||||||
| 8,040,456 | ||||||||||
|
| |||||||||
Containers & Packaging 0.5% | ||||||||||
International Paper Co. | United States | 63,500 | 3,307,080 | |||||||
|
| |||||||||
Diversified Financial Services 0.8% | ||||||||||
Voya Financial Inc. | United States | 101,650 | 4,777,550 | |||||||
|
| |||||||||
| Semiannual Report | MGD-11 | |||
FRANKLIN TEMPLETON VARIABLE INSURANCE PRODUCTS TRUST
STATEMENT OF INVESTMENTS (UNAUDITED)
Franklin Mutual Global Discovery VIP Fund (continued)
| Country | Shares/ Units/ Warrants | Value | ||||||||
Common Stocks and Other Equity Interests (continued) | ||||||||||
Diversified Telecommunication Services 2.4% | ||||||||||
AT&T Inc. | United States | 207,839 | $ | 6,673,710 | ||||||
Koninklijke KPN NV | Netherlands | 3,049,719 | 8,302,115 | |||||||
|
| |||||||||
| 14,975,825 | ||||||||||
|
| |||||||||
Electric Utilities 2.1% | ||||||||||
Enel SpA | Italy | 1,746,880 | 9,708,881 | |||||||
PG&E Corp. | United States | 79,400 | 3,379,264 | |||||||
|
| |||||||||
| 13,088,145 | ||||||||||
|
| |||||||||
Energy Equipment & Services 0.9% | ||||||||||
Baker Hughes a GE Co., A | United States | 178,964 | 5,911,181 | |||||||
|
| |||||||||
Food & Staples Retailing 1.1% | ||||||||||
| a Rite Aid Corp. | United States | 391,098 | 676,599 | |||||||
Walgreens Boots Alliance Inc. | United States | 102,904 | 6,175,784 | |||||||
|
| |||||||||
| 6,852,383 | ||||||||||
|
| |||||||||
Health Care Equipment & Supplies 4.6% | ||||||||||
Koninklijke Philips NV | Netherlands | 262,635 | 11,176,997 | |||||||
Medtronic PLC | United States | 204,810 | 17,533,784 | |||||||
|
| |||||||||
| 28,710,781 | ||||||||||
|
| |||||||||
Health Care Providers & Services 1.0% | ||||||||||
CVS Health Corp. | United States | 97,591 | 6,279,981 | |||||||
|
| |||||||||
Hotels, Restaurants & Leisure 2.3% | ||||||||||
Accor SA | France | 226,617 | 11,125,550 | |||||||
Sands China Ltd. | Hong Kong | 648,800 | 3,468,900 | |||||||
|
| |||||||||
| 14,594,450 | ||||||||||
|
| |||||||||
Independent Power & Renewable Electricity Producers 0.8% | ||||||||||
a Vistra Energy Corp. | United States | 199,533 | 4,720,951 | |||||||
|
| |||||||||
Industrial Conglomerates 1.8% | ||||||||||
General Electric Co. | United States | 823,100 | 11,202,391 | |||||||
|
| |||||||||
Insurance 8.4% | ||||||||||
Alleghany Corp. | United States | 2,730 | 1,569,668 | |||||||
American International Group Inc. | United States | 177,333 | 9,402,196 | |||||||
China Pacific Insurance Group Co. Ltd., H | China | 1,281,108 | 4,955,567 | |||||||
Chubb Ltd. | United States | 46,866 | 5,952,919 | |||||||
The Hartford Financial Services Group Inc. | United States | 161,696 | 8,267,517 | |||||||
MetLife Inc. | United States | 67,226 | 2,931,054 | |||||||
NN Group NV | Netherlands | 294,248 | 11,977,457 | |||||||
RSA Insurance Group PLC | United Kingdom | 501,149 | 4,496,387 | |||||||
T&D Holdings Inc. | Japan | 199,721 | 3,003,167 | |||||||
|
| |||||||||
| 52,555,932 | ||||||||||
|
| |||||||||
IT Services 1.6% | ||||||||||
Cognizant Technology Solutions Corp., A | United States | 130,860 | 10,336,631 | |||||||
|
| |||||||||
Media 5.4% | ||||||||||
a Charter Communications Inc., A | United States | 30,386 | 8,909,479 | |||||||
a Cumulus Media Inc., A | United States | 9,615 | 144,225 | |||||||
a Cumulus Media Inc., B | United States | 14,335 | 225,776 | |||||||
a DISH Network Corp., A | United States | 139,003 | 4,671,891 | |||||||
Sky PLC | United Kingdom | 403,819 | 7,793,936 | |||||||
| MGD-12 | Semiannual Report | |||
FRANKLIN TEMPLETON VARIABLE INSURANCE PRODUCTS TRUST
STATEMENT OF INVESTMENTS (UNAUDITED)
Franklin Mutual Global Discovery VIP Fund (continued)
| Country | Shares/ Units/ Warrants | Value | ||||||||||
Common Stocks and Other Equity Interests (continued) | ||||||||||||
Media (continued) | ||||||||||||
The Walt Disney Co. | United States | 118,700 | $ | 12,440,947 | ||||||||
|
| |||||||||||
| 34,186,254 | ||||||||||||
|
| |||||||||||
Metals & Mining 1.2% | ||||||||||||
Freeport-McMoRan Inc. | United States | 163,070 | 2,814,588 | |||||||||
thyssenkrupp AG | Germany | 159,357 | 3,876,366 | |||||||||
Warrior Met Coal Inc. | United States | 37,173 | 1,024,860 | |||||||||
|
| |||||||||||
| 7,715,814 | ||||||||||||
|
| |||||||||||
Oil, Gas & Consumable Fuels 9.3% | ||||||||||||
Anadarko Petroleum Corp. | United States | 62,642 | 4,588,526 | |||||||||
BP PLC | United Kingdom | 925,213 | 7,065,879 | |||||||||
Crescent Point Energy Corp. | Canada | 670,900 | 4,931,437 | |||||||||
JXTG Holdings Inc. | Japan | 669,532 | 4,658,508 | |||||||||
Kinder Morgan Inc. | United States | 428,870 | 7,578,133 | |||||||||
Marathon Oil Corp. | United States | 268,828 | 5,607,752 | |||||||||
Plains All American Pipeline LP | United States | 169,000 | 3,995,160 | |||||||||
Royal Dutch Shell PLC, A (EUR Traded) | United Kingdom | 237,549 | 8,262,377 | |||||||||
Royal Dutch Shell PLC, A (GBP Traded) | United Kingdom | 179,410 | 6,228,859 | |||||||||
The Williams Cos. Inc. | United States | 196,601 | 5,329,853 | |||||||||
|
| |||||||||||
| 58,246,484 | ||||||||||||
|
| |||||||||||
Pharmaceuticals 9.2% | ||||||||||||
Eli Lilly & Co. | United States | 176,580 | 15,067,571 | |||||||||
GlaxoSmithKline PLC | United Kingdom | 670,728 | 13,550,408 | |||||||||
Merck & Co. Inc. | United States | 229,318 | 13,919,603 | |||||||||
Novartis AG, ADR | Switzerland | 205,621 | 15,532,610 | |||||||||
|
| |||||||||||
| 58,070,192 | ||||||||||||
|
| |||||||||||
Semiconductors & Semiconductor Equipment 0.6% | ||||||||||||
| a Renesas Electronics Corp. | Japan | 386,368 | 3,790,558 | |||||||||
|
| |||||||||||
Software 4.7% | ||||||||||||
| a Avaya Holdings Corp., wts., 12/15/22 | United States | 5,179 | 23,953 | |||||||||
| a Check Point Software Technologies Ltd. | Israel | 107,967 | 10,546,216 | |||||||||
| a Dell Technologies Inc., V | United States | 33,415 | 2,826,241 | |||||||||
Microsoft Corp. | United States | 97,236 | 9,588,442 | |||||||||
Symantec Corp. | United States | 305,861 | 6,316,030 | |||||||||
|
| |||||||||||
| 29,300,882 | ||||||||||||
|
| |||||||||||
Specialty Retail 0.5% | ||||||||||||
Dufry AG | Switzerland | 23,184 | 2,958,863 | |||||||||
|
| |||||||||||
Technology Hardware, Storage & Peripherals 2.5% | ||||||||||||
Hewlett Packard Enterprise Co. | United States | 298,680 | 4,363,715 | |||||||||
Samsung Electronics Co. Ltd. | South Korea | 267,805 | 11,200,559 | |||||||||
|
| |||||||||||
| 15,564,274 | ||||||||||||
|
| |||||||||||
Tobacco 3.2% | ||||||||||||
Altria Group Inc. | United States | 107,584 | 6,109,696 | |||||||||
British American Tobacco PLC | United Kingdom | 188,332 | 9,525,640 | |||||||||
British American Tobacco PLC, ADR | United Kingdom | 83,985 | 4,237,043 | |||||||||
|
| |||||||||||
| 19,872,379 | ||||||||||||
|
| |||||||||||
| Semiannual Report | MGD-13 | |||||
FRANKLIN TEMPLETON VARIABLE INSURANCE PRODUCTS TRUST
STATEMENT OF INVESTMENTS (UNAUDITED)
Franklin Mutual Global Discovery VIP Fund (continued)
| Country | Shares/ Units/ Warrants | Value | ||||||||
Common Stocks and Other Equity Interests (continued) | ||||||||||
Wireless Telecommunication Services 1.2% | ||||||||||
Vodafone Group PLC | United Kingdom | 3,096,235 | $ | 7,516,193 | ||||||
|
| |||||||||
Total Common Stocks and Other Equity Interests | 551,710,110 | |||||||||
|
| |||||||||
Management Investment Companies (Cost $3,414,383) 0.6% | ||||||||||
Diversified Financial Services 0.6% | ||||||||||
a Altaba Inc. | United States | 52,100 | 3,814,241 | |||||||
|
| |||||||||
Preferred Stocks (Cost $10,006,188) 1.5% | ||||||||||
Automobiles 1.5% | ||||||||||
d Volkswagen AG, 2.784%, pfd | Germany | 54,800 | 9,105,718 | |||||||
|
| |||||||||
| Principal Amount | ||||||||||
Corporate Notes and Senior Floating Rate Interests 1.4% | ||||||||||
e,f Cumulus Media New Holdings Inc., Term Loan, 6.60%, (1-month USD LIBOR + 4.50%), | ||||||||||
5/13/22 | United States | $ | 1,864,393 | 1,856,236 | ||||||
Frontier Communications Corp., senior note, 10.50%, 9/15/22 | United States | 3,610,000 | 3,294,125 | |||||||
senior note, 11.00%, 9/15/25 | United States | 4,065,000 | 3,271,106 | |||||||
|
| |||||||||
Total Corporate Notes and Senior Floating Rate Interests | 8,421,467 | |||||||||
|
| |||||||||
Corporate Notes and Senior Floating Rate Interests in | ||||||||||
b,c,g Broadband Ventures III LLC, secured promissory note, 5.00%, 2/01/12 | United States | 595 | — | |||||||
g iHeartCommunications Inc., senior secured note, first lien, 9.00%, 12/15/19 | United States | 5,184,000 | 3,952,800 | |||||||
e,f Tranche D Term Loan, 8.443%, (3-month USD LIBOR + 6.75%), 1/30/19 | United States | 6,889,154 | 5,272,786 | |||||||
e,f Tranche E Term Loan, 9.193%, (3-month USD LIBOR + 7.50%), 7/30/19 | United States | 2,213,880 | 1,693,873 | |||||||
|
| |||||||||
Total Corporate Notes and Senior Floating Rate Interests in Reorganization (Cost $13,981,307) | 10,919,459 | |||||||||
|
| |||||||||
| Shares | ||||||||||
Companies in Liquidation 0.0%† | ||||||||||
| a,b,h Avaya Holdings Corp., Contingent Distribution | United States | 1,270,000 | — | |||||||
| a,b,h Avaya Inc., Contingent Distribution | United States | 1,668,000 | — | |||||||
a,b NewPage Corp., Litigation Trust | United States | 4,854,000 | — | |||||||
| a,b,h Tribune Media, Litigation Trust, Contingent Distribution | United States | 57,557 | — | |||||||
a,h Vistra Energy Corp., Litigation Trust, Contingent Distribution | United States | 11,807,264 | 95,934 | |||||||
a Vistra Energy Corp., Litigation Trust, TRA | United States | 199,534 | 129,697 | |||||||
|
| |||||||||
Total Companies in Liquidation (Cost $1,209,024) | 225,631 | |||||||||
|
| |||||||||
Total Investments before Short Term Investments | 584,196,626 | |||||||||
|
| |||||||||
| MGD-14 | Semiannual Report | |||
FRANKLIN TEMPLETON VARIABLE INSURANCE PRODUCTS TRUST
STATEMENT OF INVESTMENTS (UNAUDITED)
Franklin Mutual Global Discovery VIP Fund (continued)
| Country | Principal Amount | Value | ||||||||||
Short Term Investments 6.6% | ||||||||||||
U.S. Government and Agency Securities 6.6% | ||||||||||||
i FHLB, 7/02/18 | United States | $ | 15,800,000 | $ | 15,800,000 | |||||||
i U.S. Treasury Bill, j11/15/18 | United States | 3,000,000 | 2,977,390 | |||||||||
7/05/18 - 12/20/18 | United States | 23,000,000 | 22,901,181 | |||||||||
|
| |||||||||||
Total U.S. Government and Agency Securities | 41,678,571 | |||||||||||
|
| |||||||||||
Total Investments (Cost $546,549,519) 99.6% | 625,875,197 | |||||||||||
Securities Sold Short (0.6)% | (3,479,801 | ) | ||||||||||
Other Assets, less Liabilities 1.0% | 5,855,302 | |||||||||||
|
| |||||||||||
Net Assets 100.0% | $ | 628,250,698 | ||||||||||
|
| |||||||||||
| Shares | ||||||||||||
k Securities Sold Short (Proceeds $3,292,003) (0.6)% | ||||||||||||
Common Stocks (0.6)% | ||||||||||||
Internet Software & Services (0.6)% | ||||||||||||
Alibaba Group Holding Ltd., ADR | China | 18,756 | (3,479,801 | ) | ||||||||
|
| |||||||||||
†Rounds to less than 0.1% of net assets.
aNon-income producing.
bFair valued using significant unobservable inputs. See Note 11 regarding fair value measurements.
cSee Note 8 regarding restricted securities.
dVariable rate security. The rate shown represents the yield at period end.
eThe coupon rate shown represents the rate at period end.
fSee Note 1(f) regarding senior floating rate interests.
gSee Note 7 regarding credit risk and defaulted securities.
hContingent distributions represent the right to receive additional distributions, if any, during the reorganization of the underlying company. Shares represent total underlying principal of debt securities.
iThe security was issued on a discount basis with no stated coupon rate.
jA portion or all of the security has been segregated as collateral for securities sold short. At June 30, 2018, the value of this security pledged amounted to $1,905,529, representing 0.3% of net assets.
kSee Note 1(d) regarding securities sold short.
| Semiannual Report | MGD-15 | |||||
FRANKLIN TEMPLETON VARIABLE INSURANCE PRODUCTS TRUST
STATEMENT OF INVESTMENTS (UNAUDITED)
Franklin Mutual Global Discovery VIP Fund (continued)
At June 30, 2018, the Fund had the following futures contracts outstanding. See Note 1(c).
Futures Contracts
| Description | Type | Number of Contracts | Notional Amount* | Expiration Date | Value/ Unrealized Appreciation (Depreciation) | |||||||||||||||
| Currency Contracts | ||||||||||||||||||||
EUR/USD | Short | 208 | $30,514,900 | 9/17/18 | $312,029 | |||||||||||||||
GBP/USD | Short | 232 | 19,192,200 | 9/17/18 | 292,484 | |||||||||||||||
|
| |||||||||||||||||||
Total Futures Contracts | $604,513 | |||||||||||||||||||
|
| |||||||||||||||||||
*As of period end.
At June 30, 2018, the Fund had the following forward exchange contracts outstanding. See Note 1(c).
Forward Exchange Contracts
| Currency | Counterpartya | Type | Quantity | Contract Amount | Settlement Date | Unrealized Appreciation | Unrealized Depreciation | |||||||||||||||||
| ||||||||||||||||||||||||
| OTC Forward Exchange Contracts | ||||||||||||||||||||||||
Swiss Franc | BONY | Buy | 40,459 | $ | 40,724 | 7/09/18 | $ | 162 | $ | — | ||||||||||||||
Swiss Franc | UBSW | Buy | 115,441 | 117,519 | 7/09/18 | — | (859 | ) | ||||||||||||||||
Swiss Franc | UBSW | Buy | 125,008 | 126,121 | 7/09/18 | 208 | — | |||||||||||||||||
Swiss Franc | UBSW | Sell | 3,135,375 | 3,153,571 | 7/09/18 | — | (14,931 | ) | ||||||||||||||||
South Korean Won | HSBK | Buy | 842,189,044 | 772,672 | 7/13/18 | — | (17,331 | ) | ||||||||||||||||
South Korean Won | HSBK | Sell | 13,428,910,227 | 12,381,489 | 7/13/18 | 337,408 | — | |||||||||||||||||
British Pound | HSBK | Sell | 18,370,701 | 24,391,240 | 8/14/18 | 79,139 | — | |||||||||||||||||
Euro | BOFA | Buy | 955,931 | 1,114,289 | 8/20/18 | 7,041 | — | |||||||||||||||||
Euro | BONY | Buy | 69,519 | 80,568 | 8/20/18 | 980 | — | |||||||||||||||||
Euro | HSBK | Buy | 1,824,794 | 2,122,779 | 8/20/18 | 17,749 | — | |||||||||||||||||
Euro | HSBK | Sell | 2,921,872 | 3,419,359 | 8/20/18 | — | (8,069 | ) | ||||||||||||||||
Euro | SSBT | Buy | 173,797 | 202,357 | 8/20/18 | 1,511 | — | |||||||||||||||||
Euro | UBSW | Sell | 57,020,253 | 66,711,415 | 8/20/18 | — | (174,752 | ) | ||||||||||||||||
Japanese Yen | HSBK | Sell | 342,621,375 | 3,115,179 | 8/20/18 | 8,656 | — | |||||||||||||||||
Japanese Yen | UBSW | Buy | 2,296,792 | 20,809 | 8/20/18 | 16 | — | |||||||||||||||||
Japanese Yen | UBSW | Buy | 7,888,979 | 72,123 | 8/20/18 | — | (594 | ) | ||||||||||||||||
|
| |||||||||||||||||||||||
Total Forward Exchange Contracts | $ | 452,870 | $ | (216,536 | ) | |||||||||||||||||||
|
| |||||||||||||||||||||||
Net unrealized appreciation (depreciation) | $ | 236,334 | ||||||||||||||||||||||
|
| |||||||||||||||||||||||
aMay be comprised of multiple contracts with the same counterparty, currency and settlement date.
See Note 9 regarding other derivative information.
See Abbreviations on page MGD-31.
| MGD-16 | Semiannual Report | The accompanying notes are an integral part of these financial statements. | |||
FRANKLIN TEMPLETON VARIABLE INSURANCE PRODUCTS TRUST
Financial Statements
Statement of Assets and Liabilities
June 30, 2018 (unaudited)
Franklin Mutual Global Discovery VIP Fund | ||||
Assets: | ||||
Investments in securities: | ||||
Cost - Unaffiliated issuers | $546,549,519 | |||
|
| |||
Value - Unaffiliated issuers | $625,875,197 | |||
Cash | 167,863 | |||
Foreign currency, at value (cost $486,892) | 490,011 | |||
Receivables: | ||||
Investment securities sold | 1,417,692 | |||
Capital shares sold | 72,291 | |||
Dividends and interest | 1,984,889 | |||
European Union tax reclaims | 276,406 | |||
Deposits with brokers for: | ||||
Securities sold short | 3,667,277 | |||
Futures contracts | 939,220 | |||
Unrealized appreciation on OTC forward exchange contracts | 452,870 | |||
Other assets | 97,205 | |||
|
| |||
Total assets | 635,440,921 | |||
|
| |||
Liabilities: | ||||
Payables: | ||||
Investment securities purchased | 1,730,530 | |||
Capital shares redeemed | 379,114 | |||
Management fees | 459,688 | |||
Distribution fees | 274,829 | |||
Variation margin on futures contracts | 472,150 | |||
Securities sold short, at value (proceeds $3,292,003) | 3,479,801 | |||
Unrealized depreciation on OTC forward exchange contracts | 216,536 | |||
Accrued expenses and other liabilities | 177,575 | |||
|
| |||
Total liabilities | 7,190,223 | |||
|
| |||
Net assets, at value | $628,250,698 | |||
|
| |||
Net assets consist of: | ||||
Paid-in capital | $476,517,314 | |||
Undistributed net investment income | 20,638,004 | |||
Net unrealized appreciation (depreciation) | 79,956,558 | |||
Accumulated net realized gain (loss) | 51,138,822 | |||
|
| |||
Net assets, at value | $628,250,698 | |||
|
| |||
| The accompanying notes are an integral part of these financial statements. | Semiannual Report | MGD-17 | |||||
FRANKLIN TEMPLETON VARIABLE INSURANCE PRODUCTS TRUST
FINANCIAL STATEMENTS
Statement of Assets and Liabilities (continued)
June 30, 2018 (unaudited)
Franklin Mutual Global Discovery VIP Fund | ||||
Class 1: | ||||
Net assets, at value | $ 3,579,943 | |||
|
| |||
Shares outstanding | 178,148 | |||
|
| |||
Net asset value and maximum offering price per share | $20.10 | |||
|
| |||
Class 2: | ||||
Net assets, at value | $588,112,670 | |||
|
| |||
Shares outstanding | 30,157,648 | |||
|
| |||
Net asset value and maximum offering price per share | $19.50 | |||
|
| |||
Class 4: | ||||
Net assets, at value | $ 36,558,085 | |||
|
| |||
Shares outstanding | 1,841,161 | |||
|
| |||
Net asset value and maximum offering price per share | $19.86 | |||
|
| |||
| MGD-18 | Semiannual Report | The accompanying notes are an integral part of these financial statements. | |||
FRANKLIN TEMPLETON VARIABLE INSURANCE PRODUCTS TRUST
FINANCIAL STATEMENTS
Statement of Operations
for the six months ended June 30, 2018 (unaudited)
Franklin Mutual Global Discovery VIP Fund | ||||
| ||||
Investment income: | ||||
Dividends: (net of foreign taxes)* | ||||
Unaffiliated issuers | $ 9,631,953 | |||
Interest: | ||||
Unaffiliated issuers | 857,831 | |||
Income from securities loaned (net of fees and rebates) | 96,221 | |||
|
| |||
Total investment income | 10,586,005 | |||
|
| |||
Expenses: | ||||
Management fees (Note 3a) | 3,005,223 | |||
Distribution fees: (Note 3c) | ||||
Class 2 | 765,046 | |||
Class 4 | 68,221 | |||
Custodian fees (Note 4) | 12,690 | |||
Reports to shareholders | 77,979 | |||
Professional fees | 72,769 | |||
Trustees’ fees and expenses | 1,697 | |||
Dividends on securities sold short | 24,066 | |||
Other | 18,666 | |||
|
| |||
Total expenses | 4,046,357 | |||
Expense reductions (Note 4) | (1,461 | ) | ||
Expenses waived/paid by affiliates (Note 3e) | (4,024 | ) | ||
|
| |||
Net expenses | 4,040,872 | |||
|
| |||
Net investment income | 6,545,133 | |||
|
| |||
Realized and unrealized gains (losses): | ||||
Net realized gain (loss) from: | ||||
Investments: | ||||
Unaffiliated issuers | 40,448,815 | |||
Foreign currency transactions | (220,675 | ) | ||
Forward exchange contracts | 3,072,755 | |||
Futures contracts | 582,723 | |||
Securities sold short | 134,695 | |||
|
| |||
Net realized gain (loss) | 44,018,313 | |||
|
| |||
Net change in unrealized appreciation (depreciation) on: | ||||
Investments: | ||||
Unaffiliated issuers | (62,149,576 | ) | ||
Translation of other assets and liabilities denominated in foreign currencies | (45,523 | ) | ||
Forward exchange contracts | 1,217,399 | |||
Futures contracts | 1,305,791 | |||
Securities sold short | (229,748 | ) | ||
|
| |||
Net change in unrealized appreciation (depreciation) | (59,901,657 | ) | ||
|
| |||
Net realized and unrealized gain (loss) | (15,883,344 | ) | ||
|
| |||
Net increase (decrease) in net assets resulting from operations | $ (9,338,211 | ) | ||
|
| |||
*Foreign taxes withheld on dividends | $ 650,433 | |||
| The accompanying notes are an integral part of these financial statements. | Semiannual Report | MGD-19 | |||||
FRANKLIN TEMPLETON VARIABLE INSURANCE PRODUCTS TRUST
FINANCIAL STATEMENTS
Statements of Changes in Net Assets
| Franklin Mutual Global Discovery VIP Fund | ||||||||
Six Months Ended June 30, 2018 (unaudited) | Year Ended December 31, 2017 | |||||||
Increase (decrease) in net assets: | ||||||||
Operations: | ||||||||
Net investment income | $ 6,545,133 | $ 13,954,122 | ||||||
Net realized gain (loss) | 44,018,313 | 10,878,079 | ||||||
Net change in unrealized appreciation (depreciation) | (59,901,657 | ) | 32,155,121 | |||||
|
| |||||||
Net increase (decrease) in net assets resulting from operations | (9,338,211 | ) | 56,987,322 | |||||
|
| |||||||
Distributions to shareholders from: | ||||||||
Net investment income: | ||||||||
Class 1 | — | (66,311 | ) | |||||
Class 2 | — | (11,249,921 | ) | |||||
Class 4 | — | (685,349 | ) | |||||
Net realized gains: | ||||||||
Class 1 | — | (186,112 | ) | |||||
Class 2 | — | (35,820,607 | ) | |||||
Class 4 | — | (2,371,329 | ) | |||||
|
| |||||||
Total distributions to shareholders | — | (50,379,629 | ) | |||||
|
| |||||||
Capital share transactions: (Note 2) | ||||||||
Class 1 | 446,978 | 82,438 | ||||||
Class 2 | (34,303,146 | ) | (5,225,517 | ) | ||||
Class 4 | (4,636,255 | ) | (4,126,123 | ) | ||||
|
| |||||||
Total capital share transactions | (38,492,423 | ) | (9,269,202 | ) | ||||
|
| |||||||
Net increase (decrease) in net assets | (47,830,634 | ) | (2,661,509 | ) | ||||
Net assets: | ||||||||
Beginning of period | 676,081,332 | 678,742,841 | ||||||
|
| |||||||
End of period | $628,250,698 | $676,081,332 | ||||||
|
| |||||||
Undistributed net investment income included in net assets: | ||||||||
End of period | $ 20,638,004 | $ 14,092,871 | ||||||
|
| |||||||
| MGD-20 | Semiannual Report | The accompanying notes are an integral part of these financial statements. | |||
FRANKLIN TEMPLETON VARIABLE INSURANCE PRODUCTS TRUST
Notes to Financial Statements (unaudited)
Franklin Mutual Global Discovery VIP Fund
1. Organization and Significant Accounting Policies
Franklin Templeton Variable Insurance Products Trust (Trust) is registered under the Investment Company Act of 1940 (1940 Act) as an open-end management investment company, consisting of eighteen separate funds and applies the specialized accounting and reporting guidance in U.S. Generally Accepted Accounting Principles (U.S. GAAP). Franklin Mutual Global Discovery VIP Fund (Fund) is included in this report. Shares of the Fund are generally sold only to insurance company separate accounts to fund the benefits of variable life insurance policies or variable annuity contracts. At June 30, 2018, 46.6% of the Fund’s shares were held through one insurance company. Investment activities of these insurance company separate accounts could have a material impact on the Fund. The Fund offers three classes of shares: Class 1, Class 2 and Class 4. Each class of shares may differ by its distribution fees, voting rights on matters affecting a single class and its exchange privilege.
The following summarizes the Fund’s significant accounting policies.
a. Financial Instrument Valuation
The Fund’s investments in financial instruments are carried at fair value daily. Fair value is the price that would be received to sell an asset or paid to transfer a liability in an orderly transaction between market participants on the measurement date. The Fund calculates the net asset value (NAV) per share each business day as of 4 p.m. Eastern time or the regularly scheduled close of the New York Stock Exchange (NYSE), whichever is earlier. Under compliance policies and procedures approved by the Trust’s Board of Trustees (the Board), the Fund’s administrator has responsibility for oversight of valuation, including leading the cross-functional Valuation Committee (VC). The VC provides administration and oversight of the Fund’s valuation policies and procedures, which are approved annually by the Board. Among other things, these procedures allow the Fund to utilize independent pricing services, quotations from securities and financial instrument dealers, and other market sources to determine fair value.
Equity securities and derivative financial instruments listed on an exchange or on the NASDAQ National Market System are valued at the last quoted sale price or the official closing price of the day, respectively. Foreign equity securities are valued as of the close of trading on the foreign stock exchange on which the security is primarily traded, or as of 4 p.m. Eastern time.
The value is then converted into its U.S. dollar equivalent at the foreign exchange rate in effect at 4 p.m. Eastern time on the day that the value of the security is determined. Over-the-counter (OTC) securities are valued within the range of the most recent quoted bid and ask prices. Securities that trade in multiple markets or on multiple exchanges are valued according to the broadest and most representative market. Certain equity securities are valued based upon fundamental characteristics or relationships to similar securities.
Debt securities generally trade in the OTC market rather than on a securities exchange. The Fund’s pricing services use multiple valuation techniques to determine fair value. In instances where sufficient market activity exists, the pricing services may utilize a market-based approach through which quotes from market makers are used to determine fair value. In instances where sufficient market activity may not exist or is limited, the pricing services also utilize proprietary valuation models which may consider market characteristics such as benchmark yield curves, credit spreads, estimated default rates, anticipated market interest rate volatility, coupon rates, anticipated timing of principal repayments, underlying collateral, and other unique security features in order to estimate the relevant cash flows, which are then discounted to calculate the fair value.
Investments in open-end mutual funds are valued at the closing NAV.
Certain derivative financial instruments trade in the OTC market. The Fund’s pricing services use various techniques including industry standard option pricing models and proprietary discounted cash flow models to determine the fair value of those instruments. The Fund’s net benefit or obligation under the derivative contract, as measured by the fair value of the contract, is included in net assets.
The Fund has procedures to determine the fair value of financial instruments for which market prices are not reliable or readily available. Under these procedures, the VC convenes on a regular basis to review such financial instruments and considers a number of factors, including significant unobservable valuation inputs, when arriving at fair value. The VC primarily employs a market-based approach which may use related or comparable assets or liabilities, recent transactions, market multiples, book values, and other relevant information for the investment to determine the fair value of the investment. An income-based valuation approach may also be used in which the anticipated future cash flows of the investment are discounted to
| Semiannual Report | MGD-21 | |||
FRANKLIN TEMPLETON VARIABLE INSURANCE PRODUCTS TRUST
NOTES TO FINANCIAL STATEMENTS (UNAUDITED)
Franklin Mutual Global Discovery VIP Fund (continued)
1. Organization and Significant Accounting Policies (continued)
a. Financial Instrument Valuation (continued)
calculate fair value. Discounts may also be applied due to the nature or duration of any restrictions on the disposition of the investments. Due to the inherent uncertainty of valuations of such investments, the fair values may differ significantly from the values that would have been used had an active market existed. The VC employs various methods for calibrating these valuation approaches including a regular review of key inputs and assumptions, transactional back-testing or disposition analysis, and reviews of any related market activity.
Trading in securities on foreign securities stock exchanges and OTC markets may be completed before 4 p.m. Eastern time. In addition, trading in certain foreign markets may not take place on every Fund’s business day. Occasionally, events occur between the time at which trading in a foreign security is completed and 4 p.m. Eastern time that might call into question the reliability of the value of a portfolio security held by the Fund. As a result, differences may arise between the value of the Fund’s portfolio securities as determined at the foreign market close and the latest indications of value at 4 p.m. Eastern time. In order to minimize the potential for these differences, the VC monitors price movements following the close of trading in foreign stock markets through a series of country specific market proxies (such as baskets of American Depositary Receipts, futures contracts and exchange traded funds). These price movements are measured against established trigger thresholds for each specific market proxy to assist in determining if an event has occurred that may call into question the reliability of the values of the foreign securities held by the Fund. If such an event occurs, the securities may be valued using fair value procedures, which may include the use of independent pricing services.
When the last day of the reporting period is a non-business day, certain foreign markets may be open on those days that the Fund’s NAV is not calculated, which could result in differences between the value of the Fund’s portfolio securities on the last business day and the last calendar day of the reporting period. Any significant security valuation changes due to an open foreign market are adjusted and reflected by the Fund for financial reporting purposes.
b. Foreign Currency Translation
Portfolio securities and other assets and liabilities denominated in foreign currencies are translated into U.S. dollars based on the exchange rate of such currencies against U.S. dollars on the date of valuation. The Fund may enter into foreign currency exchange contracts to facilitate transactions denominated in a foreign currency. Purchases and sales of securities, income and expense items denominated in foreign currencies are translated into U.S. dollars at the exchange rate in effect on the transaction date. Portfolio securities and assets and liabilities denominated in foreign currencies contain risks that those currencies will decline in value relative to the U.S. dollar. Occasionally, events may impact the availability or reliability of foreign exchange rates used to convert the U.S. dollar equivalent value. If such an event occurs, the foreign exchange rate will be valued at fair value using procedures established and approved by the Board.
The Fund does not separately report the effect of changes in foreign exchange rates from changes in market prices on securities held. Such changes are included in net realized and unrealized gain or loss from investments in the Statement of Operations.
Realized foreign exchange gains or losses arise from sales of foreign currencies, currency gains or losses realized between the trade and settlement dates on securities transactions and the difference between the recorded amounts of dividends, interest, and foreign withholding taxes and the U.S. dollar equivalent of the amounts actually received or paid. Net unrealized foreign exchange gains and losses arise from changes in foreign exchange rates on foreign denominated assets and liabilities other than investments in securities held at the end of the reporting period.
c. Derivative Financial Instruments
The Fund invested in derivative financial instruments in order to manage risk or gain exposure to various other investments or markets. Derivatives are financial contracts based on an underlying or notional amount, require no initial investment or an initial net investment that is smaller than would normally be required to have a similar response to changes in market factors, and require or permit net settlement. Derivatives contain various risks including the potential inability of the counterparty to fulfill their obligations under the terms of the contract, the potential for an illiquid secondary market, and/or the potential for market movements which expose the Fund to gains or losses in excess of the amounts shown in the Statement of Assets and
| MGD-22 | Semiannual Report | |||
FRANKLIN TEMPLETON VARIABLE INSURANCE PRODUCTS TRUST
NOTES TO FINANCIAL STATEMENTS (UNAUDITED)
Franklin Mutual Global Discovery VIP Fund (continued)
Liabilities. Realized gain and loss and unrealized appreciation and depreciation on these contracts for the period are included in the Statement of Operations.
Derivative counterparty credit risk is managed through a formal evaluation of the creditworthiness of all potential counterparties. The Fund attempts to reduce its exposure to counterparty credit risk on OTC derivatives, whenever possible, by entering into International Swaps and Derivatives Association (ISDA) master agreements with certain counterparties. These agreements contain various provisions, including but not limited to collateral requirements, events of default, or early termination. Termination events applicable to the counterparty include certain deteriorations in the credit quality of the counterparty. Termination events applicable to the Fund include failure of the Fund to maintain certain net asset levels and/or limit the decline in net assets over various periods of time. In the event of default or early termination, the ISDA master agreement gives the non-defaulting party the right to net and close-out all transactions traded, whether or not arising under the ISDA agreement, to one net amount payable by one counterparty to the other. However, absent an event of default or early termination, OTC derivative assets and liabilities are presented gross and not offset in the Statement of Assets and Liabilities. Early termination by the counterparty may result in an immediate payment by the Fund of any net liability owed to that counterparty under the ISDA agreement. At June 30, 2018, the Fund had OTC derivatives in a net liability position of $190,912 and the aggregate value of collateral pledged for such contracts was $0.
Collateral requirements differ by type of derivative. Collateral or initial margin requirements are set by the broker or exchange clearing house for exchange traded and centrally cleared derivatives. Initial margin deposited is held at the exchange and can be in the form of cash and/or securities. For OTC derivatives traded under an ISDA master agreement, posting of collateral is required by either the Fund or the applicable counterparty if the total net exposure of all OTC derivatives with the applicable counterparty exceeds the minimum transfer amount, which typically ranges from $100,000 to $250,000, and can vary depending on the counterparty and the type of the agreement. Generally, collateral is determined at the close of Fund business each day and any additional collateral required due to changes in derivative values may be delivered by the Fund or the counterparty the next business day, or within a few business days. Collateral pledged and/or received by the Fund
for OTC derivatives, if any, is held in segregated accounts with the Fund’s custodian/counterparty broker and can be in the form of cash and/or securities. Unrestricted cash may be invested according to the Fund’s investment objectives. To the extent that the amounts due to the Fund from its counterparties are not subject to collateralization or are not fully collateralized, the Fund bears the risk of loss from counterparty non-performance.
At June 30, 2018, the Fund received $931,625 in United Kingdom Treasury Bonds and U.S. Treasury Notes as collateral for derivatives.
The Fund entered into exchange traded futures contracts primarily to manage exposure to certain foreign currencies. A futures contract is an agreement between the Fund and a counterparty to buy or sell an asset at a specified price on a future date. Required initial margins are pledged by the Fund, and the daily change in fair value is accounted for as a variation margin payable or receivable in the Statement of Assets and Liabilities.
The Fund entered into OTC forward exchange contracts primarily to manage exposure to certain foreign currencies. A forward exchange contract is an agreement between the Fund and a counterparty to buy or sell a foreign currency at a specific exchange rate on a future date.
See Note 9 regarding other derivative information.
d. Securities Sold Short
The Fund is engaged in selling securities short, which obligates the Fund to replace a borrowed security with the same security at current fair value. The Fund incurs a loss if the price of the security increases between the date of the short sale and the date on which the Fund replaces the borrowed security. The Fund realizes a gain if the price of the security declines between those dates. Gains are limited to the price at which the Fund sold the security short, while losses are potentially unlimited in size.
The Fund is required to establish a margin account with the broker lending the security sold short. While the short sale is outstanding, the broker retains the proceeds of the short sale to the extent necessary to meet margin requirements until the short position is closed out. A deposit must also be maintained with the Fund’s custodian/counterparty broker consisting of cash and/or securities having a value equal to a specified percentage of the value of the securities sold short. The Fund is obligated to pay fees for borrowing the securities sold short and is required
| Semiannual Report | MGD-23 | |||
FRANKLIN TEMPLETON VARIABLE INSURANCE PRODUCTS TRUST
NOTES TO FINANCIAL STATEMENTS (UNAUDITED)
Franklin Mutual Global Discovery VIP Fund (continued)
1. Organization and Significant Accounting Policies (continued)
d. Securities Sold Short (continued)
to pay the counterparty any dividends and/or interest due on securities sold short. Such dividends and/or interest and any security borrowing fees are recorded as an expense to the Fund.
e. Securities Lending
The Fund participates in an agency based securities lending program to earn additional income. The Fund receives cash collateral against the loaned securities in an amount equal to at least 102% of the fair value of the loaned securities. Collateral is maintained over the life of the loan in an amount not less than 100% of the fair value of loaned securities, as determined at the close of Fund business each day; any additional collateral required due to changes in security values is delivered to the Fund on the next business day. The collateral is deposited into a joint cash account with other funds and is used to invest in a money market fund managed by Franklin Advisers, Inc., an affiliate of the Fund. The Fund may receive income from the investment of cash collateral, in addition to lending fees and rebates paid by the borrower. Income from securities loaned, net of fees paid to the securities lending agent and/or third-party vendor, is reported separately in the Statement of Operations. The Fund bears the market risk with respect to the collateral investment, securities loaned, and the risk that the agent may default on its obligations to the Fund. If the borrower defaults on its obligation to return the securities loaned, the Fund has the right to repurchase the securities in the open market using the collateral received. The securities lending agent has agreed to indemnify the Fund in the event of default by a third party borrower. At June 30, 2018, the Fund had no securities on loan.
f. Senior Floating Rate Interests
The Fund invests in senior secured corporate loans that pay interest at rates which are periodically reset by reference to a base lending rate plus a spread. These base lending rates are generally the prime rate offered by a designated U.S. bank or the London InterBank Offered Rate (LIBOR). Senior secured corporate loans often require prepayment of principal from excess cash flows or at the discretion of the borrower. As a result, actual maturity may be substantially less than the stated maturity. Senior secured corporate loans in which the Fund invests are generally readily marketable, but may be subject to certain restrictions on resale.
g. Income and Deferred Taxes
It is the Fund’s policy to qualify as a regulated investment company under the Internal Revenue Code. The Fund intends to distribute to shareholders substantially all of its taxable income and net realized gains to relieve it from federal income and if applicable, excise taxes. As a result, no provision for U.S. federal income taxes is required.
The Fund may be subject to foreign taxation related to income received, capital gains on the sale of securities and certain foreign currency transactions in the foreign jurisdictions in which it invests. Foreign taxes, if any, are recorded based on the tax regulations and rates that exist in the foreign markets in which the Fund invests. When a capital gain tax is determined to apply, the Fund records an estimated deferred tax liability in an amount that would be payable if the securities were disposed of on the valuation date.
As a result of several court cases, in certain countries across the European Union, the Fund filed additional tax reclaims for previously withheld taxes on dividends earned in those countries (EU reclaims). These additional filings are subject to various administrative proceedings by the local jurisdictions’ tax authorities within the European Union, as well as a number of related judicial proceedings. Income recognized, if any, for EU reclaims is reflected as other income in the Statement of Operations and any related receivable, if any, is reflected as European Union tax reclaims in the Statement of Assets and Liabilities. When uncertainty exists as to the ultimate resolution of these proceedings, the likelihood of receipt of these EU reclaims, and the potential timing of payment, no amounts are reflected in the financial statements. For U.S. income tax purposes, when EU reclaims are received by the Fund and the Fund previously passed foreign tax credit on to its shareholders, the Fund must either amend historic tax reporting to shareholders or enter into a closing agreement with the Internal Revenue Service (IRS) in order to pay the associated tax liability on behalf of the Fund’s shareholders.
The Fund may recognize an income tax liability related to its uncertain tax positions under U.S. GAAP when the uncertain tax position has a less than 50% probability that it will be sustained upon examination by the tax authorities based on its technical merits. As of June 30, 2018, the Fund has determined that no tax liability is required in its financial statements related to uncertain tax positions for any open tax years (or expected to
| MGD-24 | Semiannual Report | |||
FRANKLIN TEMPLETON VARIABLE INSURANCE PRODUCTS TRUST
NOTES TO FINANCIAL STATEMENTS (UNAUDITED)
Franklin Mutual Global Discovery VIP Fund (continued)
be taken in future tax years). Open tax years are those that remain subject to examination and are based on the statute of limitations in each jurisdiction in which the Fund invests.
h. Security Transactions, Investment Income, Expenses and Distributions
Security transactions are accounted for on trade date. Realized gains and losses on security transactions are determined on a specific identification basis. Interest income and estimated expenses are accrued daily. Amortization of premium and accretion of discount on debt securities are included in interest income. Dividend income and dividends declared on securities sold short are recorded on the ex-dividend date except for certain dividends from securities where the dividend rate is not available. In such cases, the dividend is recorded as soon as the information is received by the Fund. Distributions to shareholders are recorded on the ex-dividend date. Distributable earnings are determined according to income tax regulations (tax basis) and may differ from earnings recorded in accordance with U.S. GAAP. These differences may be permanent or temporary. Permanent differences are reclassified among capital accounts to reflect their tax character. These reclassifications have no impact on net assets or the results of operations. Temporary differences are not reclassified, as they may reverse in subsequent periods.
Common expenses incurred by the Trust are allocated among the Funds based on the ratio of net assets of each Fund to the combined net assets of the Trust or based on the ratio of number of shareholders of each Fund to the combined number of shareholders of the Trust. Fund specific expenses are charged directly to the Fund that incurred the expense.
Realized and unrealized gains and losses and net investment income, excluding class specific expenses, are allocated daily to each class of shares based upon the relative proportion of net assets of each class. Differences in per share distributions by class are generally due to differences in class specific expenses.
i. Accounting Estimates
The preparation of financial statements in accordance with U.S. GAAP requires management to make estimates and assumptions that affect the reported amounts of assets and liabilities at the date of the financial statements and the amounts of income and expenses during the reporting period. Actual results could differ from those estimates.
j. Guarantees and Indemnifications
Under the Trust’s organizational documents, its officers and trustees are indemnified by the Trust against certain liabilities arising out of the performance of their duties to the Trust. Additionally, in the normal course of business, the Trust, on behalf of the Fund, enters into contracts with service providers that contain general indemnification clauses. The Trust’s maximum exposure under these arrangements is unknown as this would involve future claims that may be made against the Trust that have not yet occurred. Currently, the Trust expects the risk of loss to be remote.
2. Shares of Beneficial Interest
At June 30, 2018, there were an unlimited number of shares authorized (without par value). Transactions in the Funds’ shares were as follows:
Six Months Ended June 30, 2018 | Year Ended December 31, 2017 | |||||||||||||||||||
| Shares | Amount | Shares | Amount | |||||||||||||||||
| Class 1 Shares: | ||||||||||||||||||||
Shares sold | 30,209 | $ | 621,633 | 22,957 | $ | 477,994 | ||||||||||||||
Shares issued in reinvestment of distributions | — | — | 12,814 | 252,423 | ||||||||||||||||
Shares redeemed | (8,579 | ) | (174,655 | ) | (31,768 | ) | (647,979 | ) | ||||||||||||
Net increase (decrease) | 21,630 | $ | 446,978 | 4,003 | $ | 82,438 | ||||||||||||||
| Semiannual Report | MGD-25 | |||
FRANKLIN TEMPLETON VARIABLE INSURANCE PRODUCTS TRUST
NOTES TO FINANCIAL STATEMENTS (UNAUDITED)
Franklin Mutual Global Discovery VIP Fund (continued)
2. Shares of Beneficial Interest (continued)
Six Months Ended June 30, 2018 | Year Ended December 31, 2017 | |||||||||||||||||||
| Shares | Amount | Shares | Amount | |||||||||||||||||
| Class 2 Shares: | ||||||||||||||||||||
Shares sold | 547,473 | $ | 10,899,828 | 1,826,753 | $ | 36,854,231 | ||||||||||||||
Shares issued in reinvestment of distributions | — | — | 2,456,708 | 47,070,528 | ||||||||||||||||
Shares redeemed | (2,268,545 | ) | (45,202,974 | ) | (4,417,680 | ) | (89,150,276 | ) | ||||||||||||
Net increase (decrease) | (1,721,072 | ) | $ | (34,303,146 | ) | (134,219 | ) | $ | (5,225,517 | ) | ||||||||||
| Class 4 Shares: | ||||||||||||||||||||
Shares sold | 18,384 | $ | 363,219 | 74,244 | $ | 1,535,006 | ||||||||||||||
Shares issued in reinvestment of distributions | — | — | 156,592 | 3,056,678 | ||||||||||||||||
Shares redeemed | (245,361 | ) | (4,999,474 | ) | (423,086 | ) | (8,717,807 | ) | ||||||||||||
Net increase (decrease) | (226,977 | ) | $ | (4,636,255 | ) | (192,250 | ) | $ | (4,126,123 | ) | ||||||||||
3. Transactions with Affiliates
Franklin Resources, Inc. is the holding company for various subsidiaries that together are referred to as Franklin Templeton Investments. Certain officers and trustees of the Fund are also officers, and/or directors of the following subsidiaries:
| Subsidiary | Affiliation | |
Franklin Mutual Advisers, LLC (Franklin Mutual) | Investment manager | |
Franklin Templeton Services, LLC (FT Services) | Administrative manager | |
Franklin Templeton Distributors, Inc. (Distributors) | Principal underwriter | |
Franklin Templeton Investor Services, LLC (Investor Services) | Transfer agent |
a. Management Fees
Effective May 1, 2018, the Fund pays an investment management fee to Franklin Mutual based on the average daily net assets of the Fund as follows:
| Annualized Fee Rate | Net Assets | |
| 0.875% | Up to and including $4 billion | |
| 0.845% | Over $4 billion, up to and including $7 billion | |
| 0.825% | Over $7 billion, up to and including $10 billion | |
| 0.805% | Over $10 billion, up to and including $13 billion | |
| 0.785% | Over $13 billion, up to and including $16 billion | |
| 0.765% | Over $16 billion, up to and including $19 billion | |
| 0.745% | Over $19 billion, up to and including $22 billion | |
| 0.725% | Over $22 billion, up to and including $25 billion | |
| 0.705% | Over $25 billion, up to and including $28 billion | |
| 0.685% | In excess of $28 billion |
| MGD-26 | Semiannual Report | |||
FRANKLIN TEMPLETON VARIABLE INSURANCE PRODUCTS TRUST
NOTES TO FINANCIAL STATEMENTS (UNAUDITED)
Franklin Mutual Global Discovery VIP Fund (continued)
Prior to May 1, 2018, the Fund paid fees to Franklin Mutual based on the average daily net assets of the Fund as follows:
| Annualized Fee Rate | Net Assets | |
| 0.950% | Up to and including $200 million | |
| 0.935% | Over $200 million, up to and including $700 million | |
| 0.900% | Over $700 million, up to and including $1.2 billion | |
| 0.875% | Over $1.2 billion, up to and including $4 billion | |
| 0.845% | Over $4 billion, up to and including $7 billion | |
| 0.825% | Over $7 billion, up to and including $10 billion | |
| 0.805% | In excess of $10 billion |
For the period ended June 30, 2018, the annualized gross effective investment management fee rate was 0.919% of the Fund’s average daily net assets.
b. Administrative Fees
Under an agreement with Franklin Mutual, FT Services provides administrative services to the Fund. The fee is paid by Franklin Mutual based on the Fund’s average daily net assets, and is not an additional expense of the Fund.
c. Distribution Fees
The Board has adopted distribution plans for Class 2 and Class 4 shares pursuant to Rule 12b-1 under the 1940 Act. Under the Fund’s compensation distribution plans, the Fund pays Distributors for costs incurred in connection with the servicing, sale and distribution of the Fund’s shares up to 0.35% per year of its average daily net assets of each class. The Board has agreed to limit the current rate to 0.25% per year for Class 2. The plan year, for purposes of monitoring compliance with the maximum annual plan rates, is February 1 through January 31.
d. Transfer Agent Fees
Investor Services, under terms of an agreement, performs shareholder servicing for the Fund and is not paid by the Fund for the services.
e. Investments in Affiliated Management Investment Companies
The Fund invests in one or more affiliated management investment companies for purposes other than exercising a controlling influence over the management or policies. Management fees paid by the Fund are waived on assets invested in the affiliated management investment companies, as noted in the Statement of Operations, in an amount not to exceed the management and administrative fees paid directly or indirectly by each affiliate. During the period ended June 30, 2018, the Fund held investments in affiliated management investment companies as follows:
| Number of Shares Held at Beginning of Period | Gross Additions | Gross Reductions | Number of Shares Held at End of Period | Value at End of Period | Dividend Income | Realized Gain (Loss) | Net Change in Unrealized Appreciation (Depreciation) | |||||||||||||||||||||||||
| ||||||||||||||||||||||||||||||||
| Non-Controlled Affiliates | ||||||||||||||||||||||||||||||||
Institutional Fiduciary Trust Money Market Portfolio, 1.51% | — | 32,695,000 | (32,695,000 | ) | — | $ | — | $ — | $ — | $ — | ||||||||||||||||||||||
|
| |||||||||||||||||||||||||||||||
| Semiannual Report | MGD-27 | |||||
FRANKLIN TEMPLETON VARIABLE INSURANCE PRODUCTS TRUST
NOTES TO FINANCIAL STATEMENTS (UNAUDITED)
Franklin Mutual Global Discovery VIP Fund (continued)
4. Expense Offset Arrangement
The Fund has entered into an arrangement with its custodian whereby credits realized as a result of uninvested cash balances are used to reduce a portion of the Fund’s custodian expenses. During the period ended June 30, 2018, the custodian fees were reduced as noted in the Statement of Operations.
5. Income Taxes
At June 30, 2018, the cost of investments and net unrealized appreciation (depreciation) for income tax purposes were as follows:
Cost of investments | $ | 544,261,714 | ||
|
| |||
Unrealized appreciation | $ | 133,124,321 | ||
Unrealized depreciation | (54,148,247) | |||
|
| |||
Net unrealized appreciation (depreciation) | $ | 78,976,074 | ||
|
| |||
Differences between income and/or capital gains as determined on a book basis and a tax basis are primarily due to differing treatments of foreign currency transactions.
6. Investment Transactions
Purchases and sales of investments (excluding short term securities and securities sold short) for the period ended June 30, 2018, aggregated $103,932,974 and $147,388,457, respectively.
7. Credit Risk and Defaulted Securities
The Fund may purchase the pre-default or defaulted debt of distressed companies. Distressed companies are financially troubled and could be or are already involved in financial restructuring or bankruptcy. Risks associated with purchasing these securities include the possibility that the bankruptcy or other restructuring process takes longer than expected, or that distributions in restructuring are less than anticipated, either or both of which may result in unfavorable consequences to the Fund. If it becomes probable that the income on debt securities, including those of distressed companies, will not be collected, the Fund discontinues accruing income and recognizes an adjustment for uncollectible interest.
At June 30, 2018, the aggregate long value of distressed company securities for which interest recognition has been discontinued was $10,919,459, representing 1.7% of the Fund’s net assets. For information as to specific securities, see the accompanying Statement of Investments.
8. Restricted Securities
The Fund invests in securities that are restricted under the Securities Act of 1933 (1933 Act). Restricted securities are often purchased in private placement transactions, and cannot be sold without prior registration unless the sale is pursuant to an exemption under the 1933 Act. Disposal of these securities may require greater effort and expense, and prompt sale at an acceptable price may be difficult. The Fund may have registration rights for restricted securities. The issuer generally incurs all registration costs.
| MGD-28 | Semiannual Report | |||
FRANKLIN TEMPLETON VARIABLE INSURANCE PRODUCTS TRUST
NOTES TO FINANCIAL STATEMENTS (UNAUDITED)
Franklin Mutual Global Discovery VIP Fund (continued)
At June 30, 2018, investments in restricted securities, excluding securities exempt from registration under the 1933 Act deemed to be liquid, were as follows:
Principal Amount/ Shares | Issuer | Acquisition Date | Cost | Value | ||||||||||
595 | Broadband Ventures III LLC, secured promissory note, 5.00%, 2/01/12 | 7/01/10 - 11/30/12 | $ | 595 | $ | — | ||||||||
424,073 | International Automotive Components Group Brazil LLC | 4/13/06 - 12/26/08 | 281,629 | 9,643 | ||||||||||
4,052,916 | International Automotive Components Group North America LLC | 1/12/06 - 3/18/13 | 3,247,714 | 1,213,398 | ||||||||||
Total Restricted Securities (Value is 0.2% of Net Assets) | $ | 3,529,938 | $ | 1,223,041 | ||||||||||
9. Other Derivative Information
At June 30, 2018, the Fund’s investments in derivative contracts are reflected in the Statement of Assets and Liabilities as follows:
| Asset Derivatives | Liability Derivatives | |||||||||||
| Derivative Contracts | ||||||||||||
| Not Accounted for as | Statement of Assets and | Statement of Assets and | ||||||||||
| Hedging Instruments | Liabilities Location | Fair Value | Liabilities Location | Fair Value | ||||||||
Foreign exchange contracts | Variation margin on futures contracts | $ | 604,513 | a | Variation margin on futures contracts | $ | — | |||||
Unrealized appreciation on OTC forward exchange contracts | 452,870 | Unrealized depreciation on OTC forward exchange contracts | 216,536 | |||||||||
Totals | $ | 1,057,383 | $ | 216,536 | ||||||||
aThis amount reflects the cumulative appreciation (depreciation) of futures contracts as reported in the Statement of Investments. Only the variation margin receivable/payable at period end is separately reported within the Statement of Assets and Liabilities. Prior variation margin movements were recorded to cash upon receipt or payment.
For the period ended June 30, 2018, the effect of derivative contracts in the Fund’s Statement of Operations was as follows:
Derivative Contracts Not Accounted for as Hedging Instruments | Statement of Operations Location | Net Realized Gain (Loss) for the Period | Statement of Operations Location | Net Change in Unrealized Appreciation (Depreciation) for the Period | ||||||||
Net realized gain (loss) from: | Net change in unrealized appreciation (depreciation) on: | |||||||||||
Foreign exchange contracts | Forward exchange contracts | $3,072,755 | Forward exchange contracts | $1,217,399 | ||||||||
Futures contracts | 582,723 | Futures contracts | 1,305,791 | |||||||||
Totals | $3,655,478 | $2,523,190 | ||||||||||
For the period ended June 30, 2018, the average month end notional amount of futures contracts represented $51,905,207. The average month end contract value of forward exchange contracts was $133,864,413.
See Note 1(c) regarding derivative financial instruments.
10. Credit Facility
The Fund, together with other U.S. registered and foreign investment funds (collectively, Borrowers), managed by Franklin Templeton Investments, are borrowers in a joint syndicated senior unsecured credit facility totaling $2 billion (Global Credit Facility) which matures on February 8, 2019. This Global Credit Facility provides a source of funds to the Borrowers for temporary and emergency purposes, including the ability to meet future unanticipated or unusually large redemption requests.
| Semiannual Report | MGD-29 | |||||
FRANKLIN TEMPLETON VARIABLE INSURANCE PRODUCTS TRUST
NOTES TO FINANCIAL STATEMENTS (UNAUDITED)
Franklin Mutual Global Discovery VIP Fund (continued)
10. Credit Facility (continued)
Under the terms of the Global Credit Facility, the Fund shall, in addition to interest charged on any borrowings made by the Fund and other costs incurred by the Fund, pay its share of fees and expenses incurred in connection with the implementation and maintenance of the Global Credit Facility, based upon its relative share of the aggregate net assets of all of the Borrowers, including an annual commitment fee of 0.15% based upon the unused portion of the Global Credit Facility. These fees are reflected in other expenses in the Statement of Operations. During the period ended June 30, 2018, the Fund did not use the Global Credit Facility.
11. Fair Value Measurements
The Fund follows a fair value hierarchy that distinguishes between market data obtained from independent sources (observable inputs) and the Fund’s own market assumptions (unobservable inputs). These inputs are used in determining the value of the Fund’s financial instruments and are summarized in the following fair value hierarchy:
| • | Level 1 – quoted prices in active markets for identical financial instruments |
| • | Level 2 – other significant observable inputs (including quoted prices for similar financial instruments, interest rates, prepayment speed, credit risk, etc.) |
| • | Level 3 – significant unobservable inputs (including the Fund’s own assumptions in determining the fair value of financial instruments) |
The input levels are not necessarily an indication of the risk or liquidity associated with financial instruments at that level.
For movements between the levels within the fair value hierarchy, the Fund has adopted a policy of recognizing the transfers as of the date of the underlying event which caused the movement.
A summary of inputs used as of June 30, 2018, in valuing the Fund’s assets and liabilities carried at fair value, is as follows:
| Level 1 | Level 2 | Level 3 | Total | |||||||||||||
| ||||||||||||||||
| Assets: | ||||||||||||||||
Investments in Securities:a | ||||||||||||||||
Equity Investments:b | ||||||||||||||||
Auto Components | $ | 2,001,813 | $ | — | $ | 1,223,041 | $ | 3,224,854 | ||||||||
Media | 33,960,478 | 225,776 | — | 34,186,254 | ||||||||||||
Software | 29,276,929 | 23,953 | — | 29,300,882 | ||||||||||||
All Other Equity Investments | 497,918,079 | — | — | 497,918,079 | ||||||||||||
Corporate Notes and Senior Floating Rate Interests | — | 8,421,467 | — | 8,421,467 | ||||||||||||
Corporate Notes and Senior Floating Rate Interests in Reorganization | — | 10,919,459 | — | c | 10,919,459 | |||||||||||
Companies in Liquidation | — | 225,631 | — | c | 225,631 | |||||||||||
Short Term Investments | 25,878,571 | 15,800,000 | — | 41,678,571 | ||||||||||||
|
| |||||||||||||||
Total Investments in Securities | $ | 589,035,870 | $ | 35,616,286 | $ | 1,223,041 | $ | 625,875,197 | ||||||||
|
| |||||||||||||||
Other Financial Instruments: | ||||||||||||||||
Futures Contracts | $ | 604,513 | $ | — | $ | — | $ | 604,513 | ||||||||
Forward Exchange Contracts | — | 452,870 | — | 452,870 | ||||||||||||
|
| |||||||||||||||
Total Other Financial Instruments | $ | 604,513 | $ | 452,870 | $ | — | $ | 1,057,383 | ||||||||
|
| |||||||||||||||
| MGD-30 | Semiannual Report | |||
FRANKLIN TEMPLETON VARIABLE INSURANCE PRODUCTS TRUST
NOTES TO FINANCIAL STATEMENTS (UNAUDITED)
Franklin Mutual Global Discovery VIP Fund (continued)
| Level 1 | Level 2 | Level 3 | Total | |||||||||||||
| ||||||||||||||||
| Liabilities: |
| |||||||||||||||
Other Financial Instruments: | ||||||||||||||||
Securities Sold Short | $ | 3,479,801 | $ | — | $ | — | $ | 3,479,801 | ||||||||
Forward Exchange Contracts | — | 216,536 | — | 216,536 | ||||||||||||
|
| |||||||||||||||
Total Other Financial Instruments | $ | 3,479,801 | $ | 216,536 | $ | — | $ | 3,696,337 | ||||||||
|
| |||||||||||||||
aFor detailed categories, see the accompanying Statement of Investments.
bIncludes common and preferred stocks, management investment companies as well as other equity investments.
cIncludes securities determined to have no value at June 30, 2018.
A reconciliation of assets in which Level 3 inputs are used in determining fair value is presented when there are significant Level 3 financial instruments at the beginning and/or end of the period. At June 30, 2018, the reconciliation of assets is as follows:
Balance at Beginning of Period | Purchases | Sales | Transfer Into Level 3 | Transfer Out of Level 3a | Cost Basis Adjustments | Net Realized Gain (Loss) | Net Unrealized Appreciation (Depreciation) | Balance at End of Period | Net Change in Period End | |||||||||||||||||||||||||||||||
| ||||||||||||||||||||||||||||||||||||||||
| Assets: | ||||||||||||||||||||||||||||||||||||||||
Investments in Securities: | ||||||||||||||||||||||||||||||||||||||||
Equity Investments:b | ||||||||||||||||||||||||||||||||||||||||
Auto Components | $2,684,499 | $— | $ | — | $— | $ | — | $— | $ | — | $(1,461,458) | $1,223,041 | $(1,461,458 | ) | ||||||||||||||||||||||||||
Diversified Financial Services | 4,224,121 | — | (4,153,225) | — | — | — | (1,276,775) | 1,205,879 | — | — | ||||||||||||||||||||||||||||||
Software | 8,810 | — | — | — | (19,836) | — | — | 11,026 | — | — | ||||||||||||||||||||||||||||||
Companies in Liquidation | 136,964 | c | — | (1,162) | — | (118,073) | — | 1,162 | (18,891) | — | c | — | ||||||||||||||||||||||||||||
|
| |||||||||||||||||||||||||||||||||||||||
Total Investments in Securities | $7,054,394 | $— | $ | (4,154,387) | $— | $ | (137,909) | $— | $ | (1,275,613) | $(263,444) | $1,223,041 | $(1,461,458 | ) | ||||||||||||||||||||||||||
|
| |||||||||||||||||||||||||||||||||||||||
aThe investments were transferred out of Level 3 as a result of the availability of other significant observable valuation inputs. May include amounts related to a corporate action.
bIncludes common stocks as well as other equity investments.
cIncludes securities determined to have no value.
12. Subsequent Events
The Fund has evaluated subsequent events through the issuance of the financial statements and determined that no events have occurred that require disclosure.
Abbreviations
| Counterparty | Currency | Selected Portfolio | ||||||||
BOFA | Bank of America Corp. | EUR | Euro | ADR | American Depositary Receipt | |||||
BONY | The Bank of New York Mellon Corp. | GBP | British Pound | FHLB | Federal Home Loan Bank | |||||
HSBK | HSBC Bank PLC | USD | United States Dollar | LIBOR | London InterBank Offered Rate | |||||
SSBT | State Street Bank and Trust Co., N.A. | TRA | Tax Receivable Agreement Right | |||||||
UBSW | UBS AG | |||||||||
| Semiannual Report | MGD-31 | |||||
This page intentionally left blank.
Franklin Mutual Shares VIP Fund
This semiannual report for Franklin Mutual Shares VIP Fund covers the period ended June 30, 2018.
Class 2 Performance Summary as of June 30, 2018
The Fund’s Class 2 Shares had a -0.69% total return for the six-month period ended June 30, 2018.
*The Fund has a fee waiver associated with any investment it makes in a Franklin Templeton money fund and/or other Franklin Templeton fund, contractually guaranteed through 4/30/19. Fund investment results reflect the fee waiver; without this waiver, the results would have been lower.
Performance reflects the Fund’s Class 2 operating expenses, but does not include any contract fees, expenses or sales charges. If they had been included, performance would be lower. These charges and deductions, particularly for variable life policies, can have a significant effect on contract values and insurance benefits. See the contract prospectus for a complete description of these expenses, including sales charges.
Performance data represent past performance, which does not guarantee future results. Investment return and principal value will fluctuate, and you may have a gain or loss when you sell your shares. Current performance may differ from figures shown.
| Semiannual Report | MS-1 | |||||
FRANKLIN MUTUAL SHARES VIP FUND
Fund Goal and Main Investments
The Fund seeks capital appreciation, with income as a secondary goal, by investing primarily in equity securities of companies the Fund’s investment manager believes are available at market prices less than their intrinsic value. The equity securities in which the Fund invests are primarily common stock. To a lesser extent, the Fund also invests in merger arbitrage securities and the debt and equity of distressed companies. The Fund may invest up to 35% of its assets in foreign securities, which may include sovereign debt and participations in foreign debt.
Fund Risks
All investments involve risks, including possible loss of principal. Value securities may not increase in price as anticipated or may decline further in value. The Fund’s investments in foreign securities involve special risks including currency fluctuations, and economic and political uncertainties. Securities issued by smaller and midsize companies may be more volatile in price than those of larger companies, involve substantial risks and should be considered speculative. Derivatives involve costs and can create economic leverage in the Fund’s portfolio which may result in significant volatility and cause the Fund to participate in losses (as well as gains) in an amount that exceeds the Fund’s initial investment. The Fund may also invest in companies engaged in mergers, reorganizations or liquidations, which involve special risks as pending deals may not be completed on time or on favorable terms, as well as lower rated bonds, which entail higher credit risk. To the extent that the Fund focuses on particular countries, regions, industries, sectors or types of investment from time to time, the Fund may be subject to greater risks of adverse developments in such areas of focus than a fund that invests in a wider variety of countries, regions, industries, sectors or investments. The Fund is actively managed but there is no guarantee that the manager’s investment decisions will produce the desired results. The Fund’s prospectus also includes a description of the main investment risks.
Performance Overview
You can find the Fund’s six-month total return in the Performance Summary. In comparison, the Fund’s benchmark, the Standard & Poor’s® 500 Index (S&P 500®), posted a +2.65% total return for the period under review.1
Geographic Composition*
Based on Total Net Assets as of 6/30/18
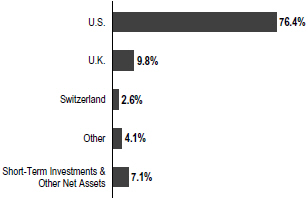
*Figures are stated as a percentage of total and may not equal 100% or may be negative due to rounding, use of any derivatives, unsettled trades or other factors.
Economic and Market Overview
The global economy expanded during the six-month period under review amid generally upbeat economic data across regions. In this environment, global developed and emerging market stocks reached a new all-time high in January 2018, as measured by the MSCI All Country World Index (ACWI). During the period, global markets were aided by price gains in oil and other commodities, encouraging corporate earnings reports and investor optimism about global economic growth. However, global stocks had a -0.13% total return for the six-month period, as measured by the MSCI ACWI, largely due to an overall decline in emerging market stocks.1
Global markets reflected investor concerns about tensions in the Korean peninsula and political uncertainties in the US and the European Union, as well as worries that strong economic growth and rising inflation in some parts of the world, particularly in the US, would lead central banks to increase interest rates sooner than expected. Markets were further pressured by the Trump administration’s protectionist trade policies, uncertainty surrounding the US-China trade relationship, and a broad sell-off in information technology stocks in March due to a potential for tighter regulation in the sector arising from concerns about consumer data privacy. An overall easing of tensions in the Korean peninsula and intermittent US-China trade negotiations partially offset some of these concerns. However, US trade disputes with its allies and China near period-end dampened investor sentiment.
1. Source: Morningstar. One cannot invest directly in an index, and an index is not representative of the Fund’s portfolio. Please see Index Descriptions following the Fund Summaries.
The dollar value, number of shares or principal amount, and names of all portfolio holdings are listed in the Fund’s Statement of Investments (SOI).
| MS-2 | Semiannual Report | |||
FRANKLIN MUTUAL SHARES VIP FUND
The US economy continued to grow during the six months under review. After moderating for three consecutive quarters, the economy grew faster in 2018’s second quarter, driven by consumer spending, exports, business investment and government spending. The unemployment rate declined from 4.1% in December 2017, as reported at the beginning of the six-month period, to 4.0% at period-end.2 Annual inflation, as measured by the Consumer Price Index, increased from 2.1% in December 2017, as reported at the beginning of the period, to 2.9% at period-end.2 The US Federal Reserve raised its target range for the federal funds rate in March and June 2018 and continued reducing its balance sheet as part of its ongoing plan to normalize monetary policy.
In Europe, the UK’s quarterly economic growth moderated in 2018’s first quarter amid a decline in construction output. The Bank of England kept its key policy rate unchanged during the period. The eurozone’s quarterly growth moderated in 2018’s first quarter due to a decline in external demand. The bloc’s annual inflation rate ended the period higher than in December 2017. The European Central Bank (ECB) kept its benchmark interest rate unchanged during the period. However, at its June meeting, the ECB announced it would further reduce its monthly bond purchases beginning in October 2018 and indicated it would conclude the program at the end of 2018 while continuing to keep interest rates unchanged through at least the summer of 2019.
In Asia, Japan’s quarterly gross domestic product (GDP) growth in 2018’s first quarter declined, the country’s first contraction since 2015’s fourth quarter, mainly due to a decline in private residential investment and household consumption. The Bank of Japan left its benchmark interest rate unchanged during the period and continued its monetary stimulus measures.
In emerging markets, Brazil’s quarterly GDP accelerated in 2018’s first quarter compared to the previous quarter. The country’s central bank cut its benchmark interest rate twice during the period to spur economic growth. Russia’s annual GDP grew in 2018’s first quarter compared to the prior-year period, amid the Bank of Russia’s continued policy support. China’s annual GDP moderated in 2018’s first quarter compared to the prior-year period. The People’s Bank of China left its benchmark interest rate unchanged during the period. Overall, emerging market stocks, as measured by the MSCI Emerging Markets Index, declined during the period.3
Top 10 Sectors/Industries
6/30/18
| % of Total Net Assets | ||||
Banks | 10.1% | |||
Oil, Gas & Consumable Fuels | 8.8% | |||
Pharmaceuticals | 7.9% | |||
Media | 7.4% | |||
Insurance | 7.3% | |||
Software | 5.2% | |||
Tobacco | 3.6% | |||
Health Care Equipment & Supplies | 3.5% | |||
Communications Equipment | 3.2% | |||
Food & Staples Retailing | 2.7% | |||
Investment Strategy
At Franklin Mutual Advisors, we are committed to our distinctive value approach to investing. Our major investment strategy is investing in undervalued stocks. When selecting undervalued equities, we are attracted to what we believe are fundamentally strong companies with healthy balance sheets, high-quality assets, substantial free cash flow and shareholder-oriented management teams and whose stocks are trading at discounts to our assessment of the companies’ intrinsic or business value. We also look for asset-rich companies whose shares may be trading at depressed levels due to concerns over short-term earnings disappointments, litigation, management strategy or other perceived negatives. While the vast majority of our undervalued equity investments are made in publicly traded companies globally, we may invest occasionally in privately held companies as well.
We complement this more traditional investment strategy with two others. One is distressed investing, which is complex and can take many forms. The most common distressed investment the Fund undertakes is the purchase of financially troubled or bankrupt companies’ debt at a substantial discount to face value. After the financially distressed company is reorganized, often in bankruptcy court, the old debt is typically replaced with new securities issued by the financially stronger company.
The other piece of our investment strategy is participating in arbitrage situations, another highly specialized field. When companies announce proposed mergers or takeovers, commonly referred to as “deals,” the target company may trade at a discount to the bid it ultimately accepts. One form of arbitrage involves purchasing the target company’s stock when
2. Source: Bureau of Labor Statistics.
3. Please see Index Descriptions following the Fund Summaries.
| Semiannual Report | MS-3 | |||||
FRANKLIN MUTUAL SHARES VIP FUND
it is trading below the value we believe it would receive in a deal. In keeping with our commitment to a relatively conservative investment approach, we typically focus our arbitrage efforts on announced deals, and eschew rumored deals or other situations we consider relatively risky.
In addition, it is our practice to hedge the Fund’s currency exposure when we deem it advantageous for our shareholders.
What is meant by “hedge”?
To hedge an investment is to take a position intended to offset potential losses/gains that may be incurred by a companion financial instrument.
Manager’s Discussion
In the first half of 2018, positive corporate fundamentals were overshadowed by political and economic concerns. Corporate profits in the US and other developed markets continued their impressive year-over-year pace of growth. In the US and other developed markets, economic activity moderated during the first quarter, but appeared to have recovered during the second quarter. Financial markets were also aided by improved industrial commodity prices, most notably crude oil. Nonetheless, investor sentiment became less upbeat and volatility returned to financial markets, after an historically calm 2017.
As investors entered 2018, overall US equity market valuations (e.g., price-to-earnings, price-to-book or price-to-sales) were elevated relative to most historical benchmarks. The uneven equity market performance during the period and the strong pace of corporate earnings growth helped to reduce valuations somewhat. At the same time, the rise in volatility provided us with select opportunities to initiate or add to positions in companies that we believed were trading at undeservedly discounted prices.
A further escalation of trade-related rhetoric and tariffs, in our view, could have important consequences for the US and abroad. We have already begun to see disruptions to global supply chains and added pressure on China’s financial and credit markets. Additional tariffs imposed by the US and its trading partners could rattle business confidence, curb corporate earnings growth, undermine favorable fundamentals in specific industries, provoke further financial market volatility and raise uncertainty regarding the solid pace of synchronized global growth.
Europe’s equity market overall was still trading at an attractively lower price-to-earnings multiple and higher dividend yield than the US equity market at period-end. However, in addition to trade tensions, we are paying close attention to Brexit negotiations, Italy’s new populist government, a potentially fraying relationship between Germany’s two conservative parties and the future of the international nuclear deal with Iran. As of period-end, we still believe Europe’s economic recovery is fairly resilient, but any of the aforementioned challenges has the potential to fuel volatility and even slow economic growth. In such an environment, we believe domestically oriented companies may fare relatively better.
Mergers and acquisitions (M&A) have remained active. In the first half of 2018, the market received some clarity regarding the regulatory environment when a federal judge ruled in favor of AT&T and Time Warner4, and against the US Department of Justice (DOJ) in its antitrust lawsuit. The judge decided that the DOJ had failed to show that the merger would be anti-competitive, and the deal closed promptly after the opinion was released. In response, the shares of companies involved in several other pending deals traded higher, indicating a higher expected probability of closing. The market also saw the development of a bidding war between The Walt Disney Company and Comcast for control of Twenty-First Century Fox and Sky. As the year began, Disney had a deal to buy Fox and Fox had an offer pending to acquire the 61% of Sky it did not own. Comcast subsequently launched bids for both companies, and when Fox raised its bid for Sky, Comcast promptly raised its bid to a higher level. Comcast has indicated it will not bid further for Fox and, while Fox could raise its bid for Sky, it appears most likely that Comcast will purchase Sky. This bidding war showed the ongoing uncertainty in media, in which major media firms believe they need even more scale to compete with internet rivals that are experiencing significant growth. We expect ongoing activity in M&A markets and, with the increased regulatory clarity provided by the Time Warner decision, further opportunities in merger arbitrage.
Finding mispriced risk in credit markets remains difficult due in part to the decline in debt covenants, which include terms that restrict financial activities by the borrower or set parameters for specific financial metrics. The search is also complicated by private equity firms involved in leveraged buyout transactions using increasingly liberal interpretations of credit agreements and bond indentures to potentially shift valuable assets beyond the reach of creditors. We have directed
4. Not held at period-end.
| MS-4 | Semiannual Report | |||
FRANKLIN MUTUAL SHARES VIP FUND
much of our focus on out-of-favor industries in pursuit of securities with the potential to benefit most from liquidity-enhancing events, such as asset sales, the ability to issue secured debt within existing agreements, and free-cash flow that could buy time for a company to weather its financial storm.
Turning to Fund performance, top positive contributors included US-based oil and gas exploration and production company Anadarko Petroleum, multinational software company Microsoft and global insurer XL Group.
Shares of Anadarko Petroleum were supported by rising crude oil prices, and continued disciplined capital allocation by management. Oil prices rose through the period, and in May 2018, Anadarko announced it would accelerate the completion of an existing $3 billion share buyback plan and consider further buybacks if the favorable operating environment persists and drives further increases in its free cash flow.
Microsoft continued to reap the rewards of its rapidly growing cloud computing business and its effort to move Microsoft Office software clients to its subscription-based services. In February and April 2018, Microsoft reported solid quarterly growth in revenues and earnings per share. The company also increased its operating margin estimate for 2018. We believe Microsoft’s cloud computing and subscription-based services can continue to grow at a strong pace, which may further lift its operating margin.
Shares of XL Group, a global insurance and reinsurance company, jumped in early March 2018 when it agreed to be acquired by French insurer AXA5. AXA has the ability to fully finance the acquisition from its current financial resources. In late March, the US Federal Trade Commission granted antitrust clearance and we believe other needed regulatory approvals are likely to be received.
During the period under review, Fund investments that detracted from performance included British American Tobacco, digital security and storage provider Symantec and US-based industrials company General Electric (GE).
British American Tobacco’s stock price faced downward pressure due to the potential for additional regulation in the US and concerns regarding next generation products. In March 2018, the US Food and Drug Administration issued an Advance Notice of Proposed Rulemaking, which started the process of examining the possibility of regulating nicotine
Top 10 Holdings
6/30/18
Company Sector/Industry, Country | % of Total Net Assets | |||
Medtronic PLC | 3.5% | |||
Health Care Equipment & Supplies, U.S. | ||||
Merck & Co. Inc. | 3.0% | |||
Pharmaceuticals, U.S. | ||||
Eli Lilly & Co. | 2.9% | |||
Pharmaceuticals, U.S. | ||||
Cisco Systems Inc. | 2.2% | |||
Communications Equipment, U.S. | ||||
British American Tobacco PLC | 2.2% | |||
Tobacco, U.K. | ||||
Microsoft Corp. | 2.1% | |||
Software, U.S. | ||||
American International Group Inc. | 2.1% | |||
Insurance, U.S. | ||||
Novartis AG | 2.0% | |||
Pharmaceuticals, Switzerland | ||||
The Walt Disney Co. | 2.0% | |||
Media, U.S. | ||||
Wells Fargo & Co. | 2.0% | |||
Banks, U.S. | ||||
levels in combustible cigarettes. The process may not result in regulation, but if it does, many experts believe the review could take seven to 10 years before a rule is adopted in the marketplace. Meanwhile, JUUL, produced by JUUL Labs5 has emerged as a popular e-cigarette in the US. JUUL’s growth rate is high and its product is popular with young consumers. It is unclear to what degree JUUL is cannibalizing the combustible market, but it has hurt investor sentiment toward the industry.
Shares of Symantec tumbled in May 2018 when the company disclosed an internal investigation resulting from concerns raised by a former employee that could result in a restatement of prior financials, as well as lowered earnings guidance. The stock partially recovered when Symantec’s management provided more information regarding the investigation and reassured investors that financial statements would likely not need to be restated.
In January 2018, General Electric (GE) announced a greater-than-expected $6.2 billion after-tax charge related to its insurance subsidiary at GE Capital. Management also moved ahead with what amounts to a breakup of GE. In May 2018, the company announced the merger of its transportation operations into Wabtec5, and in June 2018 it announced a plan to spin off
5. Not a Fund holding.
| Semiannual Report | MS-5 | |||
FRANKLIN MUTUAL SHARES VIP FUND
its health care division and divest its stake in oil-services firm Baker Hughes. Once completed, we believe the moves will streamline GE and enable the company to reduce debt and build up a cash buffer, as well as help management better focus on its key aviation, power and renewable energy divisions.
During the period, the Fund held currency forwards and futures seeking to hedge most of the currency risk of the portfolio’s non-US dollar investments. The hedges had a positive overall impact on the Fund’s performance because of the appreciation of the US dollar versus the hedged currencies.
What is a currency forward?
A currency forward is an agreement between the Fund and a counterparty to buy or sell a foreign currency in exchange for another currency at a specific exchange rate on a future date.
What is a future?
A future is an agreement between the Fund and a counterparty made through a US or foreign futures exchange to buy or sell an underlying instrument or asset at a specific price on a future date.
As fellow shareholders, we found recent relative and absolute performance disappointing, but it is not uncommon for our strategy to lag the equity markets at times. We remain committed to our disciplined, value investment approach as we seek to generate attractive, long-term, risk-adjusted returns for shareholders.
Thank you for your participation in Franklin Mutual Shares VIP Fund. We look forward to serving your future investment needs.
The foregoing information reflects our analysis, opinions and portfolio holdings as of June 30, 2018, the end of the reporting period. The way we implement our main investment strategies and the resulting portfolio holdings may change depending on factors such as market and economic conditions. These opinions may not be relied upon as investment advice or an offer for a particular security. The information is not a complete analysis of every aspect of any market, country, industry, security or the Fund. Statements of fact are from sources considered reliable, but the investment manager makes no representation or warranty as to their completeness or accuracy. Although historical performance is no guarantee of future results, these insights may help you understand our investment management philosophy.
| MS-6 | Semiannual Report | |||
FRANKLIN MUTUAL SHARES VIP FUND
Class 2 Fund Expenses
As an investor in a variable insurance contract (Contract) that indirectly provides for investment in an underlying mutual fund, you can incur transaction and/or ongoing expenses at both the Fund level and the Contract Level: (1) transaction expenses can include sales charges (loads) on purchases, surrender fees, transfer fees and premium taxes; and (2) ongoing expenses can include management fees, distribution and service (12b-1) fees, contract fees, annual maintenance fees, mortality and expense risk fees and other fees and expenses. All mutual funds and Contracts have some types of ongoing expenses. The table below shows Fund-level ongoing expenses and can help you understand these costs and compare them with those of other mutual funds offered through the Contract. The table assumes a $1,000 investment held for the six months indicated. Please refer to the Fund prospectus for additional information on operating expenses.
Actual Fund Expenses
The table below provides information about the actual account values and actual expenses in the columns under the heading “Actual.” In these columns the Fund’s actual return, which includes the effect of ongoing Fund expenses but does not include the effect of ongoing Contract expenses, is used to calculate the “Ending Account Value.” You can estimate the Fund-level expenses you paid during the period by following these steps (of course, your account value and expenses will differ from those in this illustration): Divide your account value by $1,000 (if your account had an $8,600 value, then $8,600 ÷ $1,000 = 8.6). Then multiply the result by the number under the headings “Actual” and “Fund-Level Expenses Paid During Period” (if Fund-Level Expenses Paid During Period were $ 7.50, then 8.6 x $ 7.50 = $64.50). In this illustration, the estimated expenses paid this period at the Fund level are $64.50.
Hypothetical Example for Comparison with Other Mutual Funds
Under the heading “Hypothetical” in the table, information is provided about hypothetical account values and hypothetical expenses based on the Fund’s actual expense ratio and an assumed rate of return of 5% per year before expenses, which is not the Fund’s actual return. This information may not be used to estimate the actual ending account balance or expenses you paid for the period, but it can help you compare ongoing costs of investing in the Fund with those of other mutual funds offered through the Contract. To do so, compare this 5% hypothetical example with the 5% hypothetical examples that appear in the shareholder reports of other funds offered through the Contract.
Please note that expenses shown in the table are meant to highlight ongoing costs at the Fund level only and do not reflect any ongoing expenses at the Contract level, or transaction expenses at either the Fund or Contract levels. In addition, while the Fund does not have transaction expenses, if the transaction and ongoing expenses at the Contract level were included, the expenses shown below would be higher. You should consult your Contract prospectus or disclosure document for more information.
| Actual (actual return after expenses) | Hypothetical (5% annual return before expenses) | |||||||||||
| Fund-Level | Fund-Level | |||||||||||
| Expenses | Expenses | Net | ||||||||||
| Beginning | Ending | Paid During | Ending | Paid During | Annualized | |||||||
| Share | Account | Account | Period | Account | Period | Expense | ||||||
| Class | Value 1/1/18 | Value 6/30/18 | 1/1/18–6/30/181,2 | Value 6/30/18 | 1/1/18–6/30/181,2 | Ratio2 | ||||||
|
|
|
| |||||||||
| Class 2 | $1,000 | $993.10 | $4.79 | $1,019.98 | $4.86 | 0.97% | ||||||
1. Expenses are equal to the annualized expense ratio for the six-month period as indicated above—in the far right column—multiplied by the simple average account value over the period indicated, and then multiplied by 181/365 to reflect the one-half year period.
2. Reflects expenses after fee waivers and expense reimbursements. Does not include any ongoing expenses of the Contract for which the Fund is an investment option or acquired fund fees and expenses.
| Semiannual Report | MS-7 | |||||
FRANKLIN TEMPLETON VARIABLE INSURANCE PRODUCTS TRUST
Financial Highlights
Franklin Mutual Shares VIP Fund
Six Months Ended (unaudited) | Year Ended December 31, | |||||||||||||||||||||||
| 2017 | 2016 | 2015 | 2014 | 2013 | ||||||||||||||||||||
| Class 1 | ||||||||||||||||||||||||
Per share operating performance (for a share outstanding throughout the period) | ||||||||||||||||||||||||
Net asset value, beginning of period | $20.71 | $20.40 | $19.48 | $22.91 | $21.92 | $17.45 | ||||||||||||||||||
|
| |||||||||||||||||||||||
| Income from investment operationsa: | ||||||||||||||||||||||||
Net investment incomeb | 0.20 | 0.49 | 0.50 | 0.44 | 0.62 | c | 0.42 | |||||||||||||||||
|
| |||||||||||||||||||||||
Net realized and unrealized gains (losses) | (0.33 | ) | 1.22 | 2.56 | (1.54 | ) | 1.01 | 4.52 | ||||||||||||||||
|
| |||||||||||||||||||||||
Total from investment operations | (0.13 | ) | 1.71 | 3.06 | (1.10 | ) | 1.63 | 4.94 | ||||||||||||||||
| Less distributions from: | ||||||||||||||||||||||||
Net investment income | — | (0.53 | ) | (0.46 | ) | (0.77 | ) | (0.52 | ) | (0.47) | ||||||||||||||
Net realized gains | — | (0.87 | ) | (1.68 | ) | (1.56 | ) | (0.12 | ) | — | ||||||||||||||
|
| |||||||||||||||||||||||
Total distributions | — | (1.40 | ) | (2.14 | ) | (2.33 | ) | (0.64 | ) | (0.47) | ||||||||||||||
|
| |||||||||||||||||||||||
Net asset value, end of period | $20.58 | $20.71 | $20.40 | $19.48 | $22.91 | $21.92 | ||||||||||||||||||
|
| |||||||||||||||||||||||
Total returnd | (0.63)% | 8.64% | 16.35% | (4.69)% | 7.38% | 28.53% | ||||||||||||||||||
| Ratios to average net assetse | ||||||||||||||||||||||||
Expensesf,g | 0.72%h | 0.72% | h | 0.72% | h | 0.73% | h | 0.73% | 0.71% | |||||||||||||||
Expenses incurred in connection with securities sold short | 0.01% | —% | 0.01% | 0.02% | 0.03% | —%i | ||||||||||||||||||
Net investment income | 1.93% | 2.34% | 2.57% | 2.00% | 2.83%c | 2.08% | ||||||||||||||||||
| Supplemental data | ||||||||||||||||||||||||
Net assets, end of period (000’s) | $614,055 | $653,700 | $610,395 | $643,438 | $656,463 | $552,163 | ||||||||||||||||||
Portfolio turnover rate | 11.15% | 18.32% | 24.45% | 19.88% | 21.33% | 24.05% | ||||||||||||||||||
aThe amount shown for a share outstanding throughout the period may not correlate with the Statement of Operations for the period due to the timing of sales and repurchases of the Fund’s shares in relation to income earned and/or fluctuating fair value of the investments of the Fund.
bBased on average daily shares outstanding.
cNet investment income per share includes approximately $0.23 per share related to income received in the form of special dividends in connection with certain Fund holdings. Excluding this amount, the ratio of net investment income to average net assets would have been 1.79%.
dTotal return does not include fees, charges or expenses imposed by the variable annuity and life insurance contracts for which Franklin Templeton Variable Insurance Products Trust serves as an underlying investment vehicle. Total return is not annualized for periods less than one year.
eRatios are annualized for periods less than one year.
fIncludes dividend and/or interest expense on securities sold short and security borrowing fees, if any. See below for the ratios of such expenses to average net assets for the periods presented. See Note 1(d).
gBenefit of expense reduction rounds to less than 0.01%.
hBenefit of waiver and payments by affiliates rounds to less than 0.01%.
iRounds to less than 0.01%.
| MS-8 | Semiannual Report | The accompanying notes are an integral part of these financial statements. | |||
FRANKLIN TEMPLETON VARIABLE INSURANCE PRODUCTS TRUST
FINANCIAL HIGHLIGHTS
Franklin Mutual Shares VIP Fund (continued)
Six Months Ended (unaudited) | Year Ended December 31, | |||||||||||||||||||||||
| 2017 | 2016 | 2015 | 2014 | 2013 | ||||||||||||||||||||
| Class 2 | ||||||||||||||||||||||||
Per share operating performance (for a share outstanding throughout the period) | ||||||||||||||||||||||||
Net asset value, beginning of period | $20.36 | $20.08 | $19.20 | $22.60 | $21.63 | $17.23 | ||||||||||||||||||
|
| |||||||||||||||||||||||
| Income from investment operationsa: | ||||||||||||||||||||||||
Net investment incomeb | 0.17 | 0.43 | 0.45 | 0.38 | 0.58 | c | 0.36 | |||||||||||||||||
Net realized and unrealized gains (losses) | (0.31 | ) | 1.20 | 2.52 | (1.51 | ) | 0.97 | 4.46 | ||||||||||||||||
|
| |||||||||||||||||||||||
Total from investment operations | (0.14 | ) | 1.63 | 2.97 | (1.13 | ) | 1.55 | 4.82 | ||||||||||||||||
|
| |||||||||||||||||||||||
Less distributions from: | ||||||||||||||||||||||||
Net investment income | — | (0.48 | ) | (0.41 | ) | (0.71 | ) | (0.46 | ) | (0.42) | ||||||||||||||
Net realized gains | — | (0.87 | ) | (1.68 | ) | (1.56 | ) | (0.12 | ) | — | ||||||||||||||
|
| |||||||||||||||||||||||
Total distributions | — | (1.35 | ) | (2.09 | ) | (2.27 | ) | (0.58 | ) | (0.42) | ||||||||||||||
|
| |||||||||||||||||||||||
Net asset value, end of period | $20.22 | $20.36 | $20.08 | $19.20 | $22.60 | $21.63 | ||||||||||||||||||
|
| |||||||||||||||||||||||
Total returnd | (0.69)% | 8.35% | 16.06% | (4.94)% | 7.12% | 28.26% | ||||||||||||||||||
| Ratios to average net assetse | ||||||||||||||||||||||||
Expensesf,g | 0.97% | h | 0.97% | h | 0.97% | h | 0.98% | h | 0.98% | 0.96% | ||||||||||||||
Expenses incurred in connection with securities sold short | 0.01% | —% | 0.01% | 0.02% | 0.03% | —%i | ||||||||||||||||||
Net investment income | 1.68% | 2.09% | 2.32% | 1.75% | 2.58% | c | 1.83% | |||||||||||||||||
| Supplemental data | ||||||||||||||||||||||||
Net assets, end of period (000’s) | $3,185,852 | $3,476,913 | $3,621,358 | $3,353,505 | $4,218,342 | $4,558,547 | ||||||||||||||||||
Portfolio turnover rate | 11.15% | 18.32% | 24.45% | 19.88% | 21.33% | 24.05% | ||||||||||||||||||
aThe amount shown for a share outstanding throughout the period may not correlate with the Statement of Operations for the period due to the timing of sales and repurchases of the Fund’s shares in relation to income earned and/or fluctuating fair value of the investments of the Fund.
bBased on average daily shares outstanding.
cNet investment income per share includes approximately $0.23 per share related to income received in the form of special dividends in connection with certain Fund holdings. Excluding this amount, the ratio of net investment income to average net assets would have been 1.54%.
dTotal return does not include fees, charges or expenses imposed by the variable annuity and life insurance contracts for which Franklin Templeton Variable Insurance Products Trust serves as an underlying investment vehicle. Total return is not annualized for periods less than one year.
eRatios are annualized for periods less than one year.
fIncludes dividend and/or interest expense on securities sold short and security borrowing fees, if any. See below for the ratios of such expenses to average net assets for the periods presented. See Note 1(d).
gBenefit of expense reduction rounds to less than 0.01%.
hBenefit of waiver and payments by affiliates rounds to less than 0.01%.
iRounds to less than 0.01%.
| The accompanying notes are an integral part of these financial statements. | Semiannual Report | MS-9 | |||||
FRANKLIN TEMPLETON VARIABLE INSURANCE PRODUCTS TRUST
FINANCIAL HIGHLIGHTS
Franklin Mutual Shares VIP Fund (continued)
Six Months Ended (unaudited) | Year Ended December 31, | |||||||||||||||||||||||
| 2017 | 2016 | 2015 | 2014 | 2013 | ||||||||||||||||||||
| Class 4 | ||||||||||||||||||||||||
Per share operating performance (for a share outstanding throughout the period) | ||||||||||||||||||||||||
Net asset value, beginning of period | $20.53 | $20.23 | $19.32 | $22.72 | $21.74 | $17.31 | ||||||||||||||||||
|
| |||||||||||||||||||||||
| Income from investment operationsa: | ||||||||||||||||||||||||
Net investment incomeb | 0.16 | 0.41 | 0.44 | 0.36 | 0.57 | c | 0.34 | |||||||||||||||||
Net realized and unrealized gains (losses) | (0.32 | ) | 1.21 | 2.53 | (1.52 | ) | 0.96 | 4.49 | ||||||||||||||||
|
| |||||||||||||||||||||||
Total from investment operations | (0.16 | ) | 1.62 | 2.97 | (1.16 | ) | 1.53 | 4.83 | ||||||||||||||||
|
| |||||||||||||||||||||||
| Less distributions from: | ||||||||||||||||||||||||
Net investment income | — | (0.45 | ) | (0.38 | ) | (0.68 | ) | (0.43 | ) | (0.40) | ||||||||||||||
Net realized gains | — | (0.87 | ) | (1.68 | ) | (1.56 | ) | (0.12 | ) | — | ||||||||||||||
|
| |||||||||||||||||||||||
Total distributions | — | (1.32 | ) | (2.06 | ) | (2.24 | ) | (0.55 | ) | (0.40) | ||||||||||||||
|
| |||||||||||||||||||||||
Net asset value, end of period | $20.37 | $20.53 | $20.23 | $19.32 | $22.72 | $21.74 | ||||||||||||||||||
|
| |||||||||||||||||||||||
Total returnd | (0.78)% | 8.25% | 15.94% | (5.05)% | 7.04% | 28.05% | ||||||||||||||||||
| Ratios to average net assetse | ||||||||||||||||||||||||
Expensesf,g | 1.07% | h | 1.07% | h | 1.07% | h | 1.08% | h | 1.08% | 1.06% | ||||||||||||||
Expenses incurred in connection with securities sold short | 0.01% | —% | 0.01% | 0.02% | 0.03% | —%i | ||||||||||||||||||
Net investment income | 1.58% | 1.99% | 2.22% | 1.65% | 2.48% | c | 1.73% | |||||||||||||||||
| Supplemental data | ||||||||||||||||||||||||
Net assets, end of period (000’s) | $119,681 | $122,942 | $122,476 | $130,978 | $158,020 | $188,153 | ||||||||||||||||||
Portfolio turnover rate | 11.15% | 18.32% | 24.45% | 19.88% | 21.33% | 24.05% | ||||||||||||||||||
aThe amount shown for a share outstanding throughout the period may not correlate with the Statement of Operations for the period due to the timing of sales and repurchases of the Fund’s shares in relation to income earned and/or fluctuating fair value of the investments of the Fund.
bBased on average daily shares outstanding.
cNet investment income per share includes approximately $0.23 per share related to income received in the form of special dividends in connection with certain Fund holdings. Excluding this amount, the ratio of net investment income to average net assets would have been 1.44%.
dTotal return does not include fees, charges or expenses imposed by the variable annuity and life insurance contracts for which Franklin Templeton Variable Insurance Products Trust serves as an underlying investment vehicle. Total return is not annualized for periods less than one year.
eRatios are annualized for periods less than one year.
fIncludes dividend and/or interest expense on securities sold short and security borrowing fees, if any. See below for the ratios of such expenses to average net assets for the periods presented. See Note 1(d).
gBenefit of expense reduction rounds to less than 0.01%.
hBenefit of waiver and payments by affiliates rounds to less than 0.01%.
iRounds to less than 0.01%.
| MS-10 | Semiannual Report | The accompanying notes are an integral part of these financial statements. | |||
FRANKLIN TEMPLETON VARIABLE INSURANCE PRODUCTS TRUST
Statement of Investments, June 30, 2018 (unaudited)
Franklin Mutual Shares VIP Fund
| ||||||||||||||
| Country | Shares/ Units/ Warrants | Value | ||||||||||||
| Common Stocks and Other Equity Interests 88.7% | ||||||||||||||
| Aerospace & Defense 0.9% | ||||||||||||||
BAE Systems PLC | United Kingdom | 4,337,775 | $ | 37,051,714 | ||||||||||
|
| |||||||||||||
| Auto Components 0.5% | ||||||||||||||
The Goodyear Tire & Rubber Co. | United States | 632,638 | 14,734,139 | |||||||||||
a,b,c International Automotive Components Group Brazil LLC | Brazil | 1,730,515 | 39,348 | |||||||||||
a,b,c International Automotive Components Group North America LLC | United States | 15,382,424 | 4,605,329 | |||||||||||
|
| |||||||||||||
| 19,378,816 | ||||||||||||||
|
| |||||||||||||
| Automobiles 1.2% | ||||||||||||||
General Motors Co. | United States | 1,190,330 | 46,899,002 | |||||||||||
|
| |||||||||||||
| Banks 10.1% | ||||||||||||||
Barclays PLC | United Kingdom | 10,570,083 | 26,382,228 | |||||||||||
CIT Group Inc. | United States | 719,826 | 36,286,429 | |||||||||||
Citigroup Inc. | United States | 921,219 | 61,647,976 | |||||||||||
Citizens Financial Group Inc. | United States | 1,837,966 | 71,496,877 | |||||||||||
a FCB Financial Holdings Inc., A | United States | 493,723 | 29,030,912 | |||||||||||
Guaranty Bancorp. | United States | 209,583 | 6,245,573 | |||||||||||
JPMorgan Chase & Co. | United States | 708,720 | 73,848,624 | |||||||||||
State Bank Financial Corp. | United States | 352,200 | 11,763,480 | |||||||||||
Wells Fargo & Co. | United States | 1,389,860 | 77,053,839 | |||||||||||
|
| |||||||||||||
| 393,755,938 | ||||||||||||||
|
| |||||||||||||
| Beverages 0.9% | ||||||||||||||
PepsiCo Inc. | United States | 319,942 | 34,832,086 | |||||||||||
|
| |||||||||||||
| Building Products 0.9% | ||||||||||||||
Johnson Controls International PLC | United States | 1,010,400 | 33,797,880 | |||||||||||
|
| |||||||||||||
| Chemicals 0.0% | ||||||||||||||
a,b,d Dow Corning Corp., Contingent Distribution | United States | 100,000 | — | |||||||||||
|
| |||||||||||||
| Communications Equipment 3.2% | ||||||||||||||
Cisco Systems Inc. | United States | 2,009,580 | 86,472,227 | |||||||||||
Nokia OYJ, A | Finland | 3,254,727 | 18,747,115 | |||||||||||
Nokia OYJ, ADR | Finland | 3,621,945 | 20,826,184 | |||||||||||
|
| |||||||||||||
| 126,045,526 | ||||||||||||||
|
| |||||||||||||
| Construction & Engineering 0.8% | ||||||||||||||
Fluor Corp. | United States | 627,182 | 30,593,938 | |||||||||||
|
| |||||||||||||
| Construction Materials 0.6% | ||||||||||||||
LafargeHolcim Ltd., B | Switzerland | 510,642 | 24,944,326 | |||||||||||
|
| |||||||||||||
| Consumer Finance 1.6% | ||||||||||||||
Ally Financial Inc. | United States | 763,354 | 20,053,310 | |||||||||||
Capital One Financial Corp. | United States | 471,385 | 43,320,281 | |||||||||||
|
| |||||||||||||
| 63,373,591 | ||||||||||||||
|
| |||||||||||||
| Containers & Packaging 1.6% | ||||||||||||||
International Paper Co. | United States | 878,375 | 45,745,770 | |||||||||||
WestRock Co. | United States | 325,371 | 18,552,654 | |||||||||||
|
| |||||||||||||
| 64,298,424 | ||||||||||||||
|
| |||||||||||||
| Diversified Financial Services 1.1% | ||||||||||||||
Voya Financial Inc. | United States | 903,710 | 42,474,370 | |||||||||||
|
| |||||||||||||
| Semiannual Report |
MS-11 |
FRANKLIN TEMPLETON VARIABLE INSURANCE PRODUCTS TRUST
STATEMENT OF INVESTMENTS (UNAUDITED)
Franklin Mutual Shares VIP Fund (continued)
| Country | Shares/ Units/ Warrants | Value | ||||||||||||
| Common Stocks and Other Equity Interests (continued) | ||||||||||||||
| Diversified Telecommunication Services 1.7% | ||||||||||||||
AT&T Inc. | United States | 1,300,478 | $ | 41,758,349 | ||||||||||
Koninklijke KPN NV | Netherlands | 8,368,425 | 22,780,991 | |||||||||||
|
| |||||||||||||
| 64,539,340 | ||||||||||||||
|
| |||||||||||||
| Electric Utilities 0.6% | ||||||||||||||
PG&E Corp. | United States | 502,843 | 21,400,998 | |||||||||||
|
| |||||||||||||
| Electrical Equipment 1.3% | ||||||||||||||
a Sensata Technologies Holding PLC | United States | 1,105,630 | 52,605,875 | |||||||||||
|
| |||||||||||||
| Energy Equipment & Services 1.2% | ||||||||||||||
Baker Hughes a GE Co., A | United States | 995,385 | 32,877,567 | |||||||||||
| a GulfMark Offshore Inc. | United States | 131 | 4,388 | |||||||||||
| a GulfMark Offshore Inc., wts., 11/14/24 | United States | 1,412 | 3,135 | |||||||||||
| a McDermott International Inc. | United States | 699,157 | 13,738,435 | |||||||||||
|
| |||||||||||||
| 46,623,525 | ||||||||||||||
|
| |||||||||||||
| Equity Real Estate Investment Trusts (REITs) 1.6% | ||||||||||||||
Alexander’s Inc. | United States | 40,126 | 15,353,412 | |||||||||||
JBG SMITH Properties | United States | 152,305 | 5,554,563 | |||||||||||
Vornado Realty Trust | United States | 552,996 | 40,877,464 | |||||||||||
|
| |||||||||||||
| 61,785,439 | ||||||||||||||
|
| |||||||||||||
| Food & Staples Retailing 2.7% | ||||||||||||||
The Kroger Co. | United States | 2,244,460 | 63,854,887 | |||||||||||
| a Rite Aid Corp. | United States | 2,439,970 | 4,221,148 | |||||||||||
Walgreens Boots Alliance Inc. | United States | 629,558 | 37,782,923 | |||||||||||
|
| |||||||||||||
| 105,858,958 | ||||||||||||||
|
| |||||||||||||
| Health Care Equipment & Supplies 3.5% | ||||||||||||||
Medtronic PLC | United States | 1,595,552 | 136,595,207 | |||||||||||
|
| |||||||||||||
| Health Care Providers & Services 1.4% | ||||||||||||||
CVS Health Corp. | United States | 823,961 | 53,021,890 | |||||||||||
|
| |||||||||||||
| Household Durables 0.2% | ||||||||||||||
Toll Brothers Inc. | United States | 205,449 | 7,599,559 | |||||||||||
|
| |||||||||||||
| Household Products 0.8% | ||||||||||||||
Energizer Holdings Inc. | United States | 494,900 | 31,158,904 | |||||||||||
|
| |||||||||||||
| Independent Power & Renewable Electricity Producers 0.8% | ||||||||||||||
| a Vistra Energy Corp. | United States | 1,388,895 | 32,861,256 | |||||||||||
|
| |||||||||||||
| Industrial Conglomerates 1.9% | ||||||||||||||
General Electric Co. | United States | 5,597,400 | 76,180,614 | |||||||||||
|
| |||||||||||||
| Insurance 7.3% | ||||||||||||||
Alleghany Corp. | United States | 102,188 | 58,755,034 | |||||||||||
American International Group Inc. | United States | 1,552,096 | 82,292,130 | |||||||||||
| a Brighthouse Financial Inc. | United States | 434,800 | 17,422,436 | |||||||||||
Chubb Ltd. | United States | 319,945 | 40,639,414 | |||||||||||
The Hartford Financial Services Group Inc. | United States | 622,878 | 31,847,752 | |||||||||||
MetLife Inc. | United States | 977,503 | 42,619,131 | |||||||||||
XL Group Ltd. | Bermuda | 224,612 | 12,567,042 | |||||||||||
|
| |||||||||||||
| 286,142,939 | ||||||||||||||
|
| |||||||||||||
| IT Services 1.6% | ||||||||||||||
Cognizant Technology Solutions Corp., A. | United States | 801,770 | 63,331,812 | |||||||||||
|
| |||||||||||||
MS-12 | Semiannual Report |
FRANKLIN TEMPLETON VARIABLE INSURANCE PRODUCTS TRUST
STATEMENT OF INVESTMENTS (UNAUDITED)
Franklin Mutual Shares VIP Fund (continued)
| Country | Shares/ Units/ Warrants | Value | ||||||||||||
| Common Stocks and Other Equity Interests (continued) | ||||||||||||||
| Machinery 0.7% | ||||||||||||||
CNH Industrial NV | United Kingdom | 860,940 | $ | 9,149,478 | ||||||||||
CNH Industrial NV, special voting | United Kingdom | 1,844,814 | 19,605,413 | |||||||||||
|
| |||||||||||||
| 28,754,891 | ||||||||||||||
|
| |||||||||||||
| Media 7.4% | ||||||||||||||
| a Charter Communications Inc., A | United States | 238,113 | 69,817,113 | |||||||||||
Comcast Corp., A | United States | 1,384,300 | 45,418,883 | |||||||||||
a Cumulus Media Inc., A. | United States | 60,894 | 913,410 | |||||||||||
| a Cumulus Media Inc., B. | United States | 90,790 | 1,429,942 | |||||||||||
| a DISH Network Corp., A | United States | 778,183 | 26,154,731 | |||||||||||
Sky PLC | United Kingdom | 2,470,415 | 47,680,413 | |||||||||||
Twenty-First Century Fox Inc., B | United States | 422,700 | 20,826,429 | |||||||||||
The Walt Disney Co. | United States | 741,600 | 77,727,096 | |||||||||||
|
| |||||||||||||
| 289,968,017 | ||||||||||||||
|
| |||||||||||||
| Metals & Mining 0.8% | ||||||||||||||
thyssenkrupp AG | Germany | 1,071,230 | 26,057,720 | |||||||||||
Warrior Met Coal Inc. | United States | 248,815 | 6,859,830 | |||||||||||
|
| |||||||||||||
| 32,917,550 | ||||||||||||||
|
| |||||||||||||
| Oil, Gas & Consumable Fuels 8.8% | ||||||||||||||
Anadarko Petroleum Corp. | United States | 948,307 | 69,463,488 | |||||||||||
BP PLC | United Kingdom | 3,759,822 | 28,713,871 | |||||||||||
Kinder Morgan Inc. | United States | 3,152,140 | 55,698,314 | |||||||||||
Marathon Oil Corp. | United States | 2,143,163 | 44,706,380 | |||||||||||
Plains All American Pipeline LP | United States | 1,058,500 | 25,022,940 | |||||||||||
Royal Dutch Shell PLC, A (EUR Traded) | United Kingdom | 1,247,949 | 43,405,887 | |||||||||||
Royal Dutch Shell PLC, A (GBP Traded) | United Kingdom | 927,720 | 32,209,114 | |||||||||||
The Williams Cos. Inc. | United States | 1,746,498 | 47,347,561 | |||||||||||
|
| |||||||||||||
| 346,567,555 | ||||||||||||||
|
| |||||||||||||
| Pharmaceuticals 7.9% | ||||||||||||||
Eli Lilly & Co. | United States | 1,358,736 | 115,940,943 | |||||||||||
Merck & Co. Inc. | United States | 1,910,248 | 115,952,053 | |||||||||||
Novartis AG, ADR | Switzerland | 1,040,581 | 78,605,489 | |||||||||||
|
| |||||||||||||
| 310,498,485 | ||||||||||||||
|
| |||||||||||||
| Professional Services 0.5% | ||||||||||||||
RELX PLC | United Kingdom | 852,110 | 18,257,934 | |||||||||||
|
| |||||||||||||
| Software 5.2% | ||||||||||||||
| a Avaya Holdings Corp., wts., 12/15/22 | United States | 91,551 | 423,423 | |||||||||||
CA Inc. | United States | 1,371,332 | 48,887,986 | |||||||||||
| a Dell Technologies Inc., V | United States | 198,331 | 16,774,836 | |||||||||||
Microsoft Corp. | United States | 854,447 | 84,257,019 | |||||||||||
Symantec Corp. | United States | 2,600,061 | 53,691,259 | |||||||||||
|
| |||||||||||||
| 204,034,523 | ||||||||||||||
|
| |||||||||||||
| Technology Hardware, Storage & Peripherals 2.3% | ||||||||||||||
Hewlett Packard Enterprise Co. | United States | 1,956,667 | 28,586,905 | |||||||||||
Samsung Electronics Co. Ltd. | South Korea | 1,502,417 | 62,836,429 | |||||||||||
|
| |||||||||||||
| 91,423,334 | ||||||||||||||
|
| |||||||||||||
| Semiannual Report |
MS-13 |
FRANKLIN TEMPLETON VARIABLE INSURANCE PRODUCTS TRUST
STATEMENT OF INVESTMENTS (UNAUDITED)
Franklin Mutual Shares VIP Fund (continued)
| Country | Shares/ Units/ Warrants | Value | ||||||||||||
| Common Stocks and Other Equity Interests (continued) | ||||||||||||||
| Tobacco 3.6% | ||||||||||||||
Altria Group Inc. | United States | 644,688 | $ | 36,611,831 | ||||||||||
British American Tobacco PLC | United Kingdom | 1,237,742 | 62,603,725 | |||||||||||
British American Tobacco PLC, ADR | United Kingdom | 446,833 | 22,542,725 | |||||||||||
Imperial Brands PLC | United Kingdom | 487,268 | 18,159,177 | |||||||||||
|
| |||||||||||||
| 139,917,458 | ||||||||||||||
|
| |||||||||||||
| Wireless Telecommunication Services 1.5% | ||||||||||||||
| a T-Mobile U.S. Inc. | United States | 660,900 | 39,488,775 | |||||||||||
Vodafone Group PLC | United Kingdom | 7,562,549 | 18,358,290 | |||||||||||
|
| |||||||||||||
| 57,847,065 | ||||||||||||||
|
| |||||||||||||
| Total Common Stocks and Other Equity Interests | ||||||||||||||
| (Cost $2,716,554,581) | 3,477,338,739 | |||||||||||||
|
| |||||||||||||
| Management Investment Companies (Cost $21,403,790) 0.6% | ||||||||||||||
| Diversified Financial Services 0.6% | ||||||||||||||
| a Altaba Inc. | United States | 326,600 | 23,910,386 | |||||||||||
|
| |||||||||||||
| Principal Amount | ||||||||||||||
| Corporate Notes and Senior Floating Rate Interests 1.8% | ||||||||||||||
| e,f Cumulus Media New Holdings Inc., Term Loan, 6.60%, (1-month USD LIBOR + 4.50%), 5/13/22 | United States | $ | 11,807,753 | 11,756,094 | ||||||||||
Frontier Communications Corp., | United States | 22,633,000 | 20,652,613 | |||||||||||
senior note, 11.00%, 9/15/25 | United States | 25,535,000 | 20,548,015 | |||||||||||
| g McDermott Technology Americas Inc., senior note, 144A, 10.625%, 5/01/24 | United States | 9,797,000 | 10,237,865 | |||||||||||
| e,f Toys R US-Delaware Inc., (DIP), 14.75%, (Prime + 9.75%), 1/18/19 | United States | 9,147,026 | 9,267,080 | |||||||||||
|
| |||||||||||||
| Total Corporate Notes and Senior Floating Rate Interests | ||||||||||||||
| (Cost $73,927,696) | 72,461,667 | |||||||||||||
|
| |||||||||||||
| Corporate Notes and Senior Floating Rate Interests in Reorganization 1.7% | ||||||||||||||
| b,c,h Broadband Ventures III LLC, secured promissory note, 5.00%, 2/01/12 | United States | 1,754 | — | |||||||||||
h iHeartCommunications Inc., senior secured note, first lien, 9.00%, 12/15/19 | United States | 26,449,000 | 20,167,362 | |||||||||||
e,f Tranche D Term Loan, 8.443%, (3-month USD LIBOR + 6.75%), 1/30/19 | United States | 34,746,619 | 26,594,194 | |||||||||||
| e,f Tranche E Term Loan, 9.193%, (3-month USD LIBOR + 7.50%), 7/30/19 | United States | 11,168,253 | 8,544,998 | |||||||||||
| e,f,h Toys R US-Delaware Inc., Term B-4 Loan, 10.067%, (1-month USD LIBOR + 8.75%), 4/24/20 | United States | 21,079,272 | 10,690,142 | |||||||||||
|
| |||||||||||||
| Total Corporate Notes and Senior Floating Rate Interests in Reorganization (Cost $91,131,705) | 65,996,696 | |||||||||||||
|
| |||||||||||||
| Shares | ||||||||||||||
| Companies in Liquidation 0.1% | ||||||||||||||
| a,b,d Avaya Holdings Corp., Contingent Distribution | United States | 30,319,000 | — | |||||||||||
| a,b,d Avaya Inc., Contingent Distribution | United States | 34,518,267 | — | |||||||||||
| a,b,d Tribune Media, Litigation Trust, Contingent Distribution | United States | 398,423 | — | |||||||||||
| a,d Vistra Energy Corp., Litigation Trust, Contingent Distribution | United States | 129,926,406 | 1,055,652 | |||||||||||
MS-14 | Semiannual Report |
FRANKLIN TEMPLETON VARIABLE INSURANCE PRODUCTS TRUST
STATEMENT OF INVESTMENTS (UNAUDITED)
Franklin Mutual Shares VIP Fund (continued)
| Country | Shares | Value | ||||||||||||
| Companies in Liquidation (continued) | ||||||||||||||
| a Vistra Energy Corp., Litigation Trust, TRA | United States | 2,184,095 | $ | 1,419,662 | ||||||||||
|
| |||||||||||||
Total Companies in Liquidation (Cost $13,274,471) | 2,475,314 | |||||||||||||
|
| |||||||||||||
Total Investments before Short Term Investments | ||||||||||||||
(Cost $2,916,292,243) | 3,642,182,802 | |||||||||||||
|
| |||||||||||||
| Principal Amount | ||||||||||||||
Short Term Investments 6.8% | ||||||||||||||
| U.S. Government and Agency Securities 6.8% | ||||||||||||||
| i FHLB, 7/02/18 | United States | $ | 69,600,000 | 69,600,000 | ||||||||||
| i U.S. Treasury Bill, | ||||||||||||||
j8/09/18 | United States | 21,000,000 | 20,959,629 | |||||||||||
7/05/18 - 12/27/18 | United States | 176,500,000 | 175,530,871 | |||||||||||
|
| |||||||||||||
Total U.S. Government and Agency Securities | ||||||||||||||
(Cost $266,055,744) | 266,090,500 | |||||||||||||
|
| |||||||||||||
Total Investments (Cost $3,182,347,987) 99.7% | 3,908,273,302 | |||||||||||||
Securities Sold Short (0.6)% | (21,813,875 | ) | ||||||||||||
Other Assets, less Liabilities 0.9% | 33,128,565 | |||||||||||||
|
| |||||||||||||
Net Assets 100.0% | $ | 3,919,587,992 | ||||||||||||
|
| |||||||||||||
| Shares | ||||||||||||||
| k Securities Sold Short (Proceeds $20,636,585) (0.6)% | ||||||||||||||
| Common Stocks (0.6)% | ||||||||||||||
| Internet Software & Services (0.6)% | ||||||||||||||
Alibaba Group Holding Ltd., ADR | China | 117,576 | (21,813,875 | ) | ||||||||||
|
| |||||||||||||
aNon-income producing.
bFair valued using significant unobservable inputs. See Note 12 regarding fair value measurements.
cSee Note 8 regarding restricted securities.
dContingent distributions represent the right to receive additional distributions, if any, during the reorganization of the underlying company. Shares represent total underlying principal of debt securities.
eThe coupon rate shown represents the rate at period end.
fSee Note 1(f) regarding senior floating rate interests.
gSecurity was purchased pursuant to Rule 144A under the Securities Act of 1933 and may be sold in transactions exempt from registration only to qualified institutional buyers or in a public offering registered under the Securities Act of 1933. This security has been deemed liquid under guidelines approved by the Trust’s Board of Trustees. At June 30, 2018, the value of this security was $10,237,865, representing 0.3% of net assets.
hSee Note 7 regarding credit risk and defaulted securities.
iThe security was issued on a discount basis with no stated coupon rate.
jA portion or all of the security has been segregated as collateral for securities sold short. At June 30, 2018, the value of this security pledged amounted to $10,809,185, representing 0.3% of net assets.
kSee Note 1(d) regarding securities sold short.
| Semiannual Report |
MS-15 |
FRANKLIN TEMPLETON VARIABLE INSURANCE PRODUCTS TRUST
STATEMENT OF INVESTMENTS (UNAUDITED)
Franklin Mutual Shares VIP Fund (continued)
At June 30, 2018, the Fund had the following futures contracts outstanding. See Note 1(c).
Futures Contracts
| Description | Type | Number of Contracts | Notional Amount* | Expiration Date | Value/ Unrealized Appreciation (Depreciation) | |||||||||||||||
| ||||||||||||||||||||
| Currency Contracts | ||||||||||||||||||||
EUR/USD | Short | 468 | $ | 68,658,525 | 9/17/18 | $ 715,096 | ||||||||||||||
GBP/USD | Short | 1,341 | 110,934,225 | 9/17/18 | 1,689,841 | |||||||||||||||
|
| |||||||||||||||||||
Total Futures Contracts | $ 2,404,937 | |||||||||||||||||||
|
| |||||||||||||||||||
*As of period end.
At June 30, 2018, the Fund had the following forward exchange contracts outstanding. See Note 1(c).
Forward Exchange Contracts
| Currency | Counterpartya | Type | Quantity | Contract Amount | Settlement Date | Unrealized Appreciation | Unrealized Depreciation | |||||||||||||||||
|
|
| ||||||||||||||||||||||
| OTC Forward Exchange Contracts | ||||||||||||||||||||||||
South Korean Won | HSBK | Buy | 5,681,720,417 | $ | 5,212,729 | 7/13/18 | $ — | $ | (116,923 | ) | ||||||||||||||
South Korean Won | HSBK | Sell | 51,514,745,353 | 47,709,882 | 7/13/18 | 1,507,488 | — | |||||||||||||||||
South Korean Won | UBSW | Sell | 24,780,574,064 | 22,971,883 | 7/13/18 | 746,754 | — | |||||||||||||||||
British Pound | HSBK | Sell | 70,555,504 | 93,678,306 | 8/14/18 | 303,944 | — | |||||||||||||||||
Euro | BOFA | Buy | 1,803,601 | 2,101,371 | 8/20/18 | 14,296 | — | |||||||||||||||||
Euro | BONY | Buy | 588,855 | 689,379 | 8/20/18 | 1,363 | — | |||||||||||||||||
Euro | HSBK | Buy | 3,126,626 | 3,644,193 | 8/20/18 | 23,417 | — | |||||||||||||||||
Euro | SSBT | Buy | 588,855 | 688,674 | 8/20/18 | 2,067 | — | |||||||||||||||||
Euro | UBSW | Buy | 588,855 | 688,670 | 8/20/18 | 2,072 | — | |||||||||||||||||
Euro | UBSW | Sell | 79,754,816 | 93,309,945 | 8/20/18 | — | (244,428 | ) | ||||||||||||||||
|
| |||||||||||||||||||||||
Total Forward Exchange Contracts | $ 2,601,401 | $ | (361,351 | ) | ||||||||||||||||||||
|
| |||||||||||||||||||||||
Net unrealized appreciation (depreciation) | $ 2,240,050 | |||||||||||||||||||||||
|
| |||||||||||||||||||||||
aMay be comprised of multiple contracts with the same counterparty, currency and settlement date.
See Note 9 regarding other derivative information.
See Abbreviations on page MS-30.
MS-16 | Semiannual Report | The accompanying notes are an integral part of these financial statements. |
FRANKLIN TEMPLETON VARIABLE INSURANCE PRODUCTS TRUST
Financial Statements
Statement of Assets and Liabilities
June 30, 2018 (unaudited)
Franklin Mutual Shares VIP Fund | ||||
Assets: | ||||
Investments in securities: | ||||
Cost - Unaffiliated issuers | $3,182,347,987 | |||
|
| |||
Value - Unaffiliated issuers | $3,908,273,302 | |||
Cash | 3,508,406 | |||
Foreign currency, at value (cost $2,184,216) | 2,204,112 | |||
Receivables: | ||||
Investment securities sold | 5,374,636 | |||
Capital shares sold | 16,756 | |||
Dividends and interest | 7,957,429 | |||
European Union tax reclaims. | 1,264,467 | |||
Deposits with brokers for: | ||||
Securities sold short | 22,624,902 | |||
Futures contracts | 3,660,390 | |||
Unrealized appreciation on OTC forward exchange contracts | 2,601,401 | |||
Other assets | 2,809 | |||
|
| |||
Total assets | 3,957,488,610 | |||
|
| |||
Liabilities: | ||||
Payables: | ||||
Investment securities purchased | 7,489,949 | |||
Capital shares redeemed | 2,371,859 | |||
Management fees | 2,210,191 | |||
Distribution fees | 1,425,325 | |||
Variation margin on futures contracts | 1,691,944 | |||
Securities sold short, at value (proceeds $20,636,585) | 21,813,875 | |||
Unrealized depreciation on OTC forward exchange contracts | 361,351 | |||
Accrued expenses and other liabilities | 536,124 | |||
|
| |||
Total liabilities | 37,900,618 | |||
|
| |||
Net assets, at value | $3,919,587,992 | |||
|
| |||
Net assets consist of: | ||||
Paid-in capital | $2,727,815,944 | |||
Undistributed net investment income | 124,314,287 | |||
Net unrealized appreciation (depreciation) | 729,336,757 | |||
Accumulated net realized gain (loss) | 338,121,004 | |||
|
| |||
Net assets, at value | $3,919,587,992 | |||
|
| |||
Class 1: | ||||
Net assets, at value | $614,055,240 | |||
|
| |||
Shares outstanding | 29,832,982 | |||
|
| |||
Net asset value and maximum offering price per share | $20.58 | |||
|
| |||
Class 2: | ||||
Net assets, at value | $3,185,851,962 | |||
|
| |||
Shares outstanding | 157,594,423 | |||
|
| |||
Net asset value and maximum offering price per share | $20.22 | |||
|
| |||
Class 4: | ||||
Net assets, at value | $119,680,790 | |||
|
| |||
Shares outstanding | 5,874,279 | |||
|
| |||
Net asset value and maximum offering price per share | $20.37 | |||
|
| |||
| The accompanying notes are an integral part of these financial statements. | Semiannual Report |
|
MS-17 |
|
FRANKLIN TEMPLETON VARIABLE INSURANCE PRODUCTS TRUST
FINANCIAL STATEMENTS
Statement of Operations
for the six months ended June 30, 2018 (unaudited)
| Franklin Mutual Shares VIP Fund | ||||
Investment income: | ||||
Dividends: (net of foreign taxes)* | ||||
Unaffiliated issuers | $ 46,531,264 | |||
Interest: | ||||
Unaffiliated issuers | 7,063,580 | |||
Income from securities loaned (net of fees and rebates) | 14,429 | |||
|
| |||
Total investment income | 53,609,273 | |||
|
| |||
Expenses: | ||||
Management fees (Note 3a) | 13,861,673 | |||
Distribution fees: (Note 3c) | ||||
Class 2 | 4,120,868 | |||
Class 4 | 211,896 | |||
Custodian fees (Note 4) | 55,599 | |||
Reports to shareholders | 248,751 | |||
Professional fees | 132,210 | |||
Trustees’ fees and expenses | 10,712 | |||
Dividends on securities sold short | 150,874 | |||
Other | 49,667 | |||
|
| |||
Total expenses | 18,842,250 | |||
Expense reductions (Note 4) | (11,337 | ) | ||
Expenses waived/paid by affiliates (Note 3e) | (4,644 | ) | ||
|
| |||
Net expenses | 18,826,269 | |||
|
| |||
Net investment income | 34,783,004 | |||
|
| |||
Realized and unrealized gains (losses): | ||||
Net realized gain (loss) from: | ||||
Investments: | ||||
Unaffiliated issuers | 196,562,827 | |||
Non-controlled affiliates (Note 3e and 10) | 4,122 | |||
Foreign currency transactions | 31,402 | |||
Forward exchange contracts | 1,476,562 | |||
Futures contracts | 2,160,136 | |||
Securities sold short | 844,435 | |||
|
| |||
Net realized gain (loss) | 201,079,484 | |||
|
| |||
Net change in unrealized appreciation (depreciation) on: | ||||
Investments: | ||||
Unaffiliated issuers | (279,785,900 | ) | ||
Translation of other assets and liabilities denominated in foreign currencies | (123,507 | ) | ||
Forward exchange contracts | 8,063,810 | |||
Futures contracts | 4,500,335 | |||
Securities sold short | (1,440,210 | ) | ||
|
| |||
Net change in unrealized appreciation (depreciation) | (268,785,472 | ) | ||
|
| |||
Net realized and unrealized gain (loss) | (67,705,988 | ) | ||
|
| |||
Net increase (decrease) in net assets resulting from operations | $ (32,922,984 | ) | ||
|
| |||
*Foreign taxes withheld on dividends | $ 1,417,956 |
MS-18 | Semiannual Report | The accompanying notes are an integral part of these financial statements. |
FRANKLIN TEMPLETON VARIABLE INSURANCE PRODUCTS TRUST
FINANCIAL STATEMENTS
Statements of Changes in Net Assets
| Franklin Mutual Shares VIP Fund | ||||||||
| Six Months Ended June 30, 2018 (unaudited) | Year Ended December 31, 2017 | |||||||
Increase (decrease) in net assets: | ||||||||
Operations: | ||||||||
Net investment income | $ 34,783,004 | $ 91,754,971 | ||||||
Net realized gain (loss) | 201,079,484 | 170,010,315 | ||||||
Net change in unrealized appreciation (depreciation) | (268,785,472 | ) | 86,743,730 | |||||
|
| |||||||
Net increase (decrease) in net assets resulting from operations | (32,922,984 | ) | 348,509,016 | |||||
|
| |||||||
Distributions to shareholders from: | ||||||||
Net investment income: | ||||||||
Class 1 | — | (15,730,869 | ) | |||||
Class 2 | — | (79,241,750 | ) | |||||
Class 4 | — | (2,544,123 | ) | |||||
Net realized gains: | ||||||||
Class 1 | — | (25,751,420 | ) | |||||
Class 2 | — | (143,703,429 | ) | |||||
Class 4 | — | (4,873,893 | ) | |||||
|
| |||||||
Total distributions to shareholders | — | (271,845,484 | ) | |||||
|
| |||||||
Capital share transactions: (Note 2) | ||||||||
Class 1 | (36,115,631 | ) | 32,173,830 | |||||
Class 2 | (262,521,274 | ) | (207,728,869 | ) | ||||
Class 4 | (2,407,806 | ) | (1,780,903 | ) | ||||
|
| |||||||
Total capital share transactions | (301,044,711 | ) | (177,335,942 | ) | ||||
|
| |||||||
Net increase (decrease) in net assets | (333,967,695 | ) | (100,672,410 | ) | ||||
Net assets: | ||||||||
Beginning of period | 4,253,555,687 | 4,354,228,097 | ||||||
|
| |||||||
End of period | $3,919,587,992 | $4,253,555,687 | ||||||
|
| |||||||
Undistributed net investment income included in net assets: | ||||||||
End of period | $ 124,314,287 | $ 89,531,283 | ||||||
|
| |||||||
| The accompanying notes are an integral part of these financial statements. | Semiannual Report |
|
MS-19 |
|
FRANKLIN TEMPLETON VARIABLE INSURANCE PRODUCTS TRUST
Notes to Financial Statements (unaudited)
Franklin Mutual Shares VIP Fund
1. Organization and Significant Accounting Policies
Franklin Templeton Variable Insurance Products Trust (Trust) is registered under the Investment Company Act of 1940 (1940 Act) as an open-end management investment company, consisting of eighteen separate funds and applies the specialized accounting and reporting guidance in U.S. Generally Accepted Accounting Principles (U.S. GAAP). Franklin Mutual Shares VIP Fund (Fund) is included in this report. Shares of the Fund are generally sold only to insurance company separate accounts to fund the benefits of variable life insurance policies or variable annuity contracts. The Fund offers three classes of shares: Class 1, Class 2 and Class 4. Each class of shares may differ by its distribution fees, voting rights on matters affecting a single class and its exchange privilege.
The following summarizes the Fund’s significant accounting policies.
a. Financial Instrument Valuation
The Fund’s investments in financial instruments are carried at fair value daily. Fair value is the price that would be received to sell an asset or paid to transfer a liability in an orderly transaction between market participants on the measurement date. The Fund calculates the net asset value (NAV) per share each business day as of 4 p.m. Eastern time or the regularly scheduled close of the New York Stock Exchange (NYSE), whichever is earlier. Under compliance policies and procedures approved by the Trust’s Board of Trustees (the Board), the Fund’s administrator has responsibility for oversight of valuation, including leading the cross-functional Valuation Committee (VC). The VC provides administration and oversight of the Fund’s valuation policies and procedures, which are approved annually by the Board. Among other things, these procedures allow the Fund to utilize independent pricing services, quotations from securities and financial instrument dealers, and other market sources to determine fair value.
Equity securities and derivative financial instruments listed on an exchange or on the NASDAQ National Market System are valued at the last quoted sale price or the official closing price of the day, respectively. Foreign equity securities are valued as of the close of trading on the foreign stock exchange on which the security is primarily traded, or as of 4 p.m. Eastern time. The value is then converted into its U.S. dollar equivalent at the foreign exchange rate in effect at 4 p.m. Eastern time on the day that the value of the security is determined. Over-the-counter
(OTC) securities are valued within the range of the most recent quoted bid and ask prices. Securities that trade in multiple markets or on multiple exchanges are valued according to the broadest and most representative market. Certain equity securities are valued based upon fundamental characteristics or relationships to similar securities.
Debt securities generally trade in the OTC market rather than on a securities exchange. The Fund’s pricing services use multiple valuation techniques to determine fair value. In instances where sufficient market activity exists, the pricing services may utilize a market-based approach through which quotes from market makers are used to determine fair value. In instances where sufficient market activity may not exist or is limited, the pricing services also utilize proprietary valuation models which may consider market characteristics such as benchmark yield curves, credit spreads, estimated default rates, anticipated market interest rate volatility, coupon rates, anticipated timing of principal repayments, underlying collateral, and other unique security features in order to estimate the relevant cash flows, which are then discounted to calculate the fair value.
Investments in open-end mutual funds are valued at the closing NAV.
Certain derivative financial instruments trade in the OTC market. The Fund’s pricing services use various techniques including industry standard option pricing models and proprietary discounted cash flow models to determine the fair value of those instruments. The Fund’s net benefit or obligation under the derivative contract, as measured by the fair value of the contract, is included in net assets.
The Fund has procedures to determine the fair value of financial instruments for which market prices are not reliable or readily available. Under these procedures, the VC convenes on a regular basis to review such financial instruments and considers a number of factors, including significant unobservable valuation inputs, when arriving at fair value. The VC primarily employs a market-based approach which may use related or comparable assets or liabilities, recent transactions, market multiples, book values, and other relevant information for the investment to determine the fair value of the investment. An income-based valuation approach may also be used in which the anticipated future cash flows of the investment are discounted to calculate fair value. Discounts may also be applied due to the nature or duration of any restrictions on the disposition of the investments. Due to the inherent uncertainty of valuations of
MS-20 | Semiannual Report |
FRANKLIN TEMPLETON VARIABLE INSURANCE PRODUCTS TRUST
NOTES TO FINANCIAL STATEMENTS (UNAUDITED)
Franklin Mutual Shares VIP Fund (continued)
such investments, the fair values may differ significantly from the values that would have been used had an active market existed. The VC employs various methods for calibrating these valuation approaches including a regular review of key inputs and assumptions, transactional back-testing or disposition analysis, and reviews of any related market activity.
Trading in securities on foreign securities stock exchanges and OTC markets may be completed before 4 p.m. Eastern time. In addition, trading in certain foreign markets may not take place on every Fund’s business day. Occasionally, events occur between the time at which trading in a foreign security is completed and 4 p.m. Eastern time that might call into question the reliability of the value of a portfolio security held by the Fund. As a result, differences may arise between the value of the Fund’s portfolio securities as determined at the foreign market close and the latest indications of value at 4 p.m. Eastern time. In order to minimize the potential for these differences, the VC monitors price movements following the close of trading in foreign stock markets through a series of country specific market proxies (such as baskets of American Depositary Receipts, futures contracts and exchange traded funds). These price movements are measured against established trigger thresholds for each specific market proxy to assist in determining if an event has occurred that may call into question the reliability of the values of the foreign securities held by the Fund. If such an event occurs, the securities may be valued using fair value procedures, which may include the use of independent pricing services.
When the last day of the reporting period is a non-business day, certain foreign markets may be open on those days that the Fund’s NAV is not calculated, which could result in differences between the value of the Fund’s portfolio securities on the last business day and the last calendar day of the reporting period. Any significant security valuation changes due to an open foreign market are adjusted and reflected by the Fund for financial reporting purposes.
b. Foreign Currency Translation
Portfolio securities and other assets and liabilities denominated in foreign currencies are translated into U.S. dollars based on the exchange rate of such currencies against U.S. dollars on the date of valuation. The Fund may enter into foreign currency exchange contracts to facilitate transactions denominated in a foreign currency. Purchases and sales of securities, income and expense items denominated in foreign currencies are translated
into U.S. dollars at the exchange rate in effect on the transaction date. Portfolio securities and assets and liabilities denominated in foreign currencies contain risks that those currencies will decline in value relative to the U.S. dollar. Occasionally, events may impact the availability or reliability of foreign exchange rates used to convert the U.S. dollar equivalent value. If such an event occurs, the foreign exchange rate will be valued at fair value using procedures established and approved by the Board.
The Fund does not separately report the effect of changes in foreign exchange rates from changes in market prices on securities held. Such changes are included in net realized and unrealized gain or loss from investments in the Statement of Operations.
Realized foreign exchange gains or losses arise from sales of foreign currencies, currency gains or losses realized between the trade and settlement dates on securities transactions and the difference between the recorded amounts of dividends, interest, and foreign withholding taxes and the U.S. dollar equivalent of the amounts actually received or paid. Net unrealized foreign exchange gains and losses arise from changes in foreign exchange rates on foreign denominated assets and liabilities other than investments in securities held at the end of the reporting period.
c. Derivative Financial Instruments
The Fund invested in derivative financial instruments in order to manage risk or gain exposure to various other investments or markets. Derivatives are financial contracts based on an underlying or notional amount, require no initial investment or an initial net investment that is smaller than would normally be required to have a similar response to changes in market factors, and require or permit net settlement. Derivatives contain various risks including the potential inability of the counterparty to fulfill their obligations under the terms of the contract, the potential for an illiquid secondary market, and/or the potential for market movements which expose the Fund to gains or losses in excess of the amounts shown in the Statement of Assets and Liabilities. Realized gain and loss and unrealized appreciation and depreciation on these contracts for the period are included in the Statement of Operations.
Derivative counterparty credit risk is managed through a formal evaluation of the creditworthiness of all potential counterparties. The Fund attempts to reduce its exposure to counterparty credit risk on OTC derivatives, whenever possible,
| Semiannual Report |
|
MS-21 |
|
FRANKLIN TEMPLETON VARIABLE INSURANCE PRODUCTS TRUST
NOTES TO FINANCIAL STATEMENTS (UNAUDITED)
Franklin Mutual Shares VIP Fund (continued)
1. Organization and Significant Accounting
Policies (continued)
c. Derivative Financial Instruments (continued)
by entering into International Swaps and Derivatives Association (ISDA) master agreements with certain counterparties. These agreements contain various provisions, including but not limited to collateral requirements, events of default, or early termination. Termination events applicable to the counterparty include certain deteriorations in the credit quality of the counterparty. Termination events applicable to the Fund include failure of the Fund to maintain certain net asset levels and/or limit the decline in net assets over various periods of time. In the event of default or early termination, the ISDA master agreement gives the non-defaulting party the right to net and close-out all transactions traded, whether or not arising under the ISDA agreement, to one net amount payable by one counterparty to the other. However, absent an event of default or early termination, OTC derivative assets and liabilities are presented gross and not offset in the Statement of Assets and Liabilities. Early termination by the counterparty may result in an immediate payment by the Fund of any net liability owed to that counterparty under the ISDA agreement.
Collateral requirements differ by type of derivative. Collateral or initial margin requirements are set by the broker or exchange clearing house for exchange traded and centrally cleared derivatives. Initial margin deposited is held at the exchange and can be in the form of cash and/or securities. For OTC derivatives traded under an ISDA master agreement, posting of collateral is required by either the Fund or the applicable counterparty if the total net exposure of all OTC derivatives with the applicable counterparty exceeds the minimum transfer amount, which typically ranges from $100,000 to $250,000, and can vary depending on the counterparty and the type of the agreement. Generally, collateral is determined at the close of Fund business each day and any additional collateral required due to changes in derivative values may be delivered by the Fund or the counterparty the next business day, or within a few business days. Collateral pledged and/or received by the Fund for OTC derivatives, if any, is held in segregated accounts with the Fund’s custodian/counterparty broker and can be in the form of cash and/or securities. Unrestricted cash may be invested according to the Fund’s investment objectives. To the extent that the amounts due to the Fund from its counterparties are not subject to collateralization or are not fully collateralized, the Fund bears the risk of loss from counterparty non-performance.
At June 30, 2018, the Fund received $3,519,810 in U.K. Treasury Bonds and U.S. Treasury Bills and Bonds as collateral for derivatives.
The Fund entered into exchange traded futures contracts primarily to manage exposure to certain foreign currencies. A futures contract is an agreement between the Fund and a counterparty to buy or sell an asset at a specified price on a future date. Required initial margins are pledged by the Fund, and the daily change in fair value is accounted for as a variation margin payable or receivable in the Statement of Assets and Liabilities.
The Fund entered into OTC forward exchange contracts primarily to manage exposure to certain foreign currencies. A forward exchange contract is an agreement between the Fund and a counterparty to buy or sell a foreign currency at a specific exchange rate on a future date.
See Note 9 regarding other derivative information.
d. Securities Sold Short
The Fund is engaged in selling securities short, which obligates the Fund to replace a borrowed security with the same security at current fair value. The Fund incurs a loss if the price of the security increases between the date of the short sale and the date on which the Fund replaces the borrowed security. The Fund realizes a gain if the price of the security declines between those dates. Gains are limited to the price at which the Fund sold the security short, while losses are potentially unlimited in size.
The Fund is required to establish a margin account with the broker lending the security sold short. While the short sale is outstanding, the broker retains the proceeds of the short sale to the extent necessary to meet margin requirements until the short position is closed out. A deposit must also be maintained with the Fund’s custodian/counterparty broker consisting of cash and/or securities having a value equal to a specified percentage of the value of the securities sold short. The Fund is obligated to pay fees for borrowing the securities sold short and is required to pay the counterparty any dividends and/or interest due on securities sold short. Such dividends and/or interest and any security borrowing fees are recorded as an expense to the Fund.
e. Securities Lending
The Fund participates in an agency based securities lending program to earn additional income. The Fund receives cash collateral against the loaned securities in an amount equal to at
MS-22 | Semiannual Report |
FRANKLIN TEMPLETON VARIABLE INSURANCE PRODUCTS TRUST
NOTES TO FINANCIAL STATEMENTS (UNAUDITED)
Franklin Mutual Shares VIP Fund (continued)
least 102% of the fair value of the loaned securities. Collateral is maintained over the life of the loan in an amount not less than 100% of the fair value of loaned securities, as determined at the close of Fund business each day; any additional collateral required due to changes in security values is delivered to the Fund on the next business day. The collateral is deposited into a joint cash account with other funds and is used to invest in a money market fund managed by Franklin Advisers, Inc., an affiliate of the Fund. The Fund may receive income from the investment of cash collateral, in addition to lending fees and rebates paid by the borrower. Income from securities loaned, net of fees paid to the securities lending agent and/or third-party vendor, is reported separately in the Statement of Operations. The Fund bears the market risk with respect to the collateral investment, securities loaned, and the risk that the agent may default on its obligations to the Fund. If the borrower defaults on its obligation to return the securities loaned, the Fund has the right to repurchase the securities in the open market using the collateral received. The securities lending agent has agreed to indemnify the Fund in the event of default by a third party borrower. At June 30, 2018, the Fund had no securities on loan.
f. Senior Floating Rate Interests
The Fund invests in senior secured corporate loans that pay interest at rates which are periodically reset by reference to a base lending rate plus a spread. These base lending rates are generally the prime rate offered by a designated U.S. bank or the London InterBank Offered Rate (LIBOR). Senior secured corporate loans often require prepayment of principal from excess cash flows or at the discretion of the borrower. As a result, actual maturity may be substantially less than the stated maturity. Senior secured corporate loans in which the Fund invests are generally readily marketable, but may be subject to certain restrictions on resale.
g. Income and Deferred Taxes
It is the Fund’s policy to qualify as a regulated investment company under the Internal Revenue Code. The Fund intends to distribute to shareholders substantially all of its taxable income and net realized gains to relieve it from federal income and if applicable, excise taxes. As a result, no provision for U.S. federal income taxes is required.
The Fund may be subject to foreign taxation related to income received, capital gains on the sale of securities and certain foreign currency transactions in the foreign jurisdictions in which it invests. Foreign taxes, if any, are recorded based on the
tax regulations and rates that exist in the foreign markets in which the Fund invests. When a capital gain tax is determined to apply, the Fund records an estimated deferred tax liability in an amount that would be payable if the securities were disposed of on the valuation date.
As a result of several court cases, in certain countries across the European Union, the Fund filed additional tax reclaims for previously withheld taxes on dividends earned in those countries (EU reclaims). These additional filings are subject to various administrative proceedings by the local jurisdictions’ tax authorities within the European Union, as well as a number of related judicial proceedings. Income recognized, if any, for EU reclaims is reflected as other income in the Statement of Operations and any related receivable, if any, is reflected as European Union tax reclaims in the Statement of Assets and Liabilities. When uncertainty exists as to the ultimate resolution of these proceedings, the likelihood of receipt of these EU reclaims, and the potential timing of payment, no amounts are reflected in the financial statements. For U.S. income tax purposes, when EU reclaims are received by the Fund and the Fund previously passed foreign tax credit on to its shareholders, the Fund must either amend historic tax reporting to shareholders or enter into a closing agreement with the Internal Revenue Service (IRS) in order to pay the associated tax liability on behalf of the Fund’s shareholders.
The Fund may recognize an income tax liability related to its uncertain tax positions under U.S. GAAP when the uncertain tax position has a less than 50% probability that it will be sustained upon examination by the tax authorities based on its technical merits. As of June 30, 2018, the Fund has determined that no tax liability is required in its financial statements related to uncertain tax positions for any open tax years (or expected to be taken in future tax years). Open tax years are those that remain subject to examination and are based on the statute of limitations in each jurisdiction in which the Fund invests.
h. Security Transactions, Investment Income, Expenses and Distributions
Security transactions are accounted for on trade date. Realized gains and losses on security transactions are determined on a specific identification basis. Interest income and estimated expenses are accrued daily. Amortization of premium and accretion of discount on debt securities are included in interest income. Dividend income and dividends declared on securities sold short are recorded on the ex-dividend date except for
| Semiannual Report |
|
MS-23 |
|
FRANKLIN TEMPLETON VARIABLE INSURANCE PRODUCTS TRUST
NOTES TO FINANCIAL STATEMENTS (UNAUDITED)
Franklin Mutual Shares VIP Fund (continued)
1. Organization and Significant Accounting
Policies (continued)
h. Security Transactions, Investment Income, Expenses and Distributions (continued)
certain dividends from securities where the dividend rate is not available. In such cases, the dividend is recorded as soon as the information is received by the Fund. Distributions to shareholders are recorded on the ex-dividend date. Distributable earnings are determined according to income tax regulations (tax basis) and may differ from earnings recorded in accordance with U.S. GAAP. These differences may be permanent or temporary. Permanent differences are reclassified among capital accounts to reflect their tax character. These reclassifications have no impact on net assets or the results of operations. Temporary differences are not reclassified, as they may reverse in subsequent periods.
Common expenses incurred by the Trust are allocated among the Funds based on the ratio of net assets of each Fund to the combined net assets of the Trust or based on the ratio of number of shareholders of each Fund to the combined number of shareholders of the Trust. Fund specific expenses are charged directly to the Fund that incurred the expense.
Realized and unrealized gains and losses and net investment income, excluding class specific expenses, are allocated daily to each class of shares based upon the relative proportion of net assets of each class. Differences in per share distributions by class are generally due to differences in class specific expenses.
i. Accounting Estimates
The preparation of financial statements in accordance with U.S. GAAP requires management to make estimates and assumptions that affect the reported amounts of assets and liabilities at the date of the financial statements and the amounts of income and expenses during the reporting period. Actual results could differ from those estimates.
j. Guarantees and Indemnifications
Under the Trust’s organizational documents, its officers and trustees are indemnified by the Trust against certain liabilities arising out of the performance of their duties to the Trust. Additionally, in the normal course of business, the Trust, on behalf of the Fund, enters into contracts with service providers that contain general indemnification clauses. The Trust’s maximum exposure under these arrangements is unknown as this would involve future claims that may be made against the Trust that have not yet occurred. Currently, the Trust expects the risk of loss to be remote.
2. Shares of Beneficial Interest
At June 30, 2018, there were an unlimited number of shares authorized (without par value). Transactions in the Fund’s shares were as follows:
Six Months Ended June 30, 2018 | Year Ended December 31, 2017 | |||||||||||||||
|
| |||||||||||||||
| Shares | Amount | Shares | Amount | |||||||||||||
| ||||||||||||||||
| Class 1 Shares: | ||||||||||||||||
Shares sold | 421,128 | $ | 8,739,546 | 2,282,225 | $ | 47,514,985 | ||||||||||
Shares issued in reinvestment of distributions | — | — | 2,083,490 | 41,482,289 | ||||||||||||
Shares redeemed | (2,155,181 | ) | (44,855,177 | ) | (2,721,619 | ) | (56,823,444) | |||||||||
|
| |||||||||||||||
Net increase (decrease) | (1,734,053 | ) | $ | (36,115,631 | ) | 1,644,096 | $ | 32,173,830 | ||||||||
|
| |||||||||||||||
| Class 2 Shares: | ||||||||||||||||
Shares sold | 11,505,416 | $ | 233,591,936 | 5,279,163 | $ | 107,845,830 | ||||||||||
Shares issued in reinvestment of distributions | — | — | 11,374,754 | 222,945,179 | ||||||||||||
Shares redeemed | (24,650,824 | ) | (496,113,210 | ) | (26,252,304 | ) | (538,519,878) | |||||||||
|
| |||||||||||||||
Net increase (decrease) | (13,145,408 | ) | $ | (262,521,274 | ) | (9,598,387 | ) | $ | (207,728,869) | |||||||
|
| |||||||||||||||
| MS-24 | Semiannual Report | |||
FRANKLIN TEMPLETON VARIABLE INSURANCE PRODUCTS TRUST
NOTES TO FINANCIAL STATEMENTS (UNAUDITED)
Franklin Mutual Shares VIP Fund (continued)
Six Months Ended June 30, 2018 | Year Ended December 31, 2017 | |||||||||||||||
|
| |||||||||||||||
| Shares | Amount | Shares | Amount | |||||||||||||
| ||||||||||||||||
| Class 4 Shares: | ||||||||||||||||
Shares sold | 376,941 | $ | 7,706,111 | 730,910 | $ | 15,136,184 | ||||||||||
Shares issued in reinvestment of distributions | — | — | 375,216 | 7,418,016 | ||||||||||||
Shares redeemed | (490,108 | ) | (10,113,917 | ) | (1,172,050 | ) | (24,335,103) | |||||||||
|
| |||||||||||||||
Net increase (decrease) | (113,167 | ) | $ | (2,407,806 | ) | (65,924 | ) | $ | (1,780,903) | |||||||
|
| |||||||||||||||
3. Transactions with Affiliates
Franklin Resources, Inc. is the holding company for various subsidiaries that together are referred to as Franklin Templeton Investments. Certain officers and trustees of the Fund are also officers and/or directors of the following subsidiaries:
| Subsidiary | Affiliation | |
Franklin Mutual Advisers, LLC (Franklin Mutual) | Investment manager | |
Franklin Templeton Services, LLC (FT Services) | Administrative manager | |
Franklin Templeton Distributors, Inc. (Distributors) | Principal underwriter | |
Franklin Templeton Investor Services, LLC (Investor Services) | Transfer agent |
a. Management Fees
Effective May 1, 2018, the Fund pays an investment management fee to Franklin Mutual based on the average daily net assets of the Fund as follows:
| Annualized Fee Rate | Net Assets | |
| 0.675% | Up to and including $5 billion | |
| 0.645% | Over $5 billion, up to and including $10 billion | |
| 0.625% | Over $10 billion, up to and including $15 billion | |
| 0.595% | Over $15 billion, up to and including $20 billion | |
| 0.585% | Over $20 billion, up to and including $25 billion | |
| 0.565% | Over $25 billion, up to and including $30 billion | |
| 0.555% | Over $30 billion, up to and including $35 billion | |
| 0.545% | In excess of $35 billion |
Prior to May 1, 2018, the Fund paid fees to Franklin Mutual based on the average daily net assets of the Fund as follows:
| Annualized Fee Rate | Net Assets | |
| 0.750% | Up to and including $200 million | |
| 0.735% | Over $200 million, up to and including $700 million | |
| 0.700% | Over $700 million, up to and including $1.2 billion | |
| 0.675% | Over $1.2 billion, up to and including $5 billion | |
| 0.645% | Over $5 billion, up to and including $10 billion | |
| 0.625% | Over $10 billion, up to and including $15 billion | |
| 0.605% | Over $15 billion, up to and including $20 billion | |
| 0.585% | In excess of $20 billion |
| Semiannual Report |
|
MS-25 |
|
FRANKLIN TEMPLETON VARIABLE INSURANCE PRODUCTS TRUST
NOTES TO FINANCIAL STATEMENTS (UNAUDITED)
Franklin Mutual Shares VIP Fund (continued)
3. Transactions with Affiliates (continued)
a. Management Fees (continued)
For the period ended June 30, 2018, the annualized gross effective investment management fee rate was 0.685% of the Fund’s average daily net assets.
b. Administrative Fees
Under an agreement with Franklin Mutual, FT Services provides administrative services to the Fund. The fee is paid by Franklin Mutual based on the Fund’s average daily net assets, and is not an additional expense of the Fund.
c. Distribution Fees
The Board has adopted distribution plans for Class 2 and Class 4 shares pursuant to Rule 12b-1 under the 1940 Act. Under the Fund’s compensation distribution plans, the Fund pays Distributors for costs incurred in connection with the servicing, sale and distribution of the Fund’s shares up to 0.35% per year of its average daily net assets of each class. The Board has agreed to limit the current rate to 0.25% per year for Class 2. The plan year, for purposes of monitoring compliance with the maximum annual plan rates, is February 1 through January 31.
d. Transfer Agent Fees
Investor Services, under terms of an agreement, performs shareholder servicing for the Fund and is not paid by the Fund for the services.
e. Investments in Affiliated Management Investment Companies
The Fund invests in one or more affiliated management investment companies for purposes other than exercising a controlling influence over the management or policies. Management fees paid by the Fund are waived on assets invested in the affiliated management investment companies, as noted in the Statement of Operations, in an amount not to exceed the management and administrative fees paid directly or indirectly by each affiliate. During the period ended June 30, 2018, the Fund held investments in affiliated management investment companies as follows:
| Number of Shares Held at Beginning of Period | Gross Additions | Gross Reductions | Number of Shares Held at End of Period | Value at End of Period | Dividend Income | Realized Gain (Loss) | Net Change in Unrealized | |||||||||||||||||||||||||
|
|
|
|
| ||||||||||||||||||||||||||||
| Non-Controlled Affiliates | ||||||||||||||||||||||||||||||||
Institutional Fiduciary Trust Money Market Portfolio, 1.51% | — | 83,705,000 | (83,705,000 | ) | — | $ — | $ — | $ — | $ — | |||||||||||||||||||||||
|
| |||||||||||||||||||||||||||||||
f. Other Affiliated Transactions
At June 30, 2018, Franklin Templeton Variable Insurance Products Trust – Franklin Founding Funds Allocation VIP Fund owned 7.7% of the Fund’s outstanding shares.
4. Expense Offset Arrangement
The Fund has entered into an arrangement with its custodian whereby credits realized as a result of uninvested cash balances are used to reduce a portion of the Fund’s custodian expenses. During the period ended June 30, 2018, the custodian fees were reduced as noted in the Statement of Operations.
MS-26 | Semiannual Report |
FRANKLIN TEMPLETON VARIABLE INSURANCE PRODUCTS TRUST
NOTES TO FINANCIAL STATEMENTS (UNAUDITED)
Franklin Mutual Shares VIP Fund (continued)
5. Income Taxes
At June 30, 2018, the cost of investments and net unrealized appreciation (depreciation) for income tax purposes were as follows:
Cost of investments | $3,171,242,036 | |||
|
| |||
Unrealized appreciation | $1,018,725,516 | |||
Unrealized depreciation | (298,856,785) | |||
|
| |||
Net unrealized appreciation (depreciation) | $ 719,868,731 | |||
|
| |||
Differences between income and/or capital gains as determined on a book basis and a tax basis are primarily due to differing treatments of foreign currency transactions, defaulted securities and wash sales.
6. Investment Transactions
Purchases and sales of investments (excluding short term securities and securities sold short) for the period ended June 30, 2018, aggregated $426,653,941 and $698,211,193, respectively.
7. Credit Risk and Defaulted Securities
The Fund may purchase the pre-default or defaulted debt of distressed companies. Distressed companies are financially troubled and could be or are already involved in financial restructuring or bankruptcy. Risks associated with purchasing these securities include the possibility that the bankruptcy or other restructuring process takes longer than expected, or that distributions in restructuring are less than anticipated, either or both of which may result in unfavorable consequences to the Fund. If it becomes probable that the income on debt securities, including those of distressed companies, will not be collected, the Fund discontinues accruing income and recognizes an adjustment for uncollectible interest.
At June 30, 2018, the aggregate long value of distressed company securities for which interest recognition has been discontinued was $65,996,696, representing 1.7% of the Fund’s net assets. For information as to specific securities, see the accompanying Statement of Investments.
8. Restricted Securities
The Fund invests in securities that are restricted under the Securities Act of 1933 (1933 Act). Restricted securities are often purchased in private placement transactions, and cannot be sold without prior registration unless the sale is pursuant to an exemption under the 1933 Act. Disposal of these securities may require greater effort and expense, and prompt sale at an acceptable price may be difficult. The Fund may have registration rights for restricted securities. The issuer generally incurs all registration costs.
At June 30, 2018, investments in restricted securities, excluding securities exempt from registration under the 1933 Act deemed to be liquid, were as follows:
| Principal Amount/ Shares | Issuer | Acquisition Date | Cost | Value | ||||||||||
| ||||||||||||||
1,754 | Broadband Ventures III LLC, secured promissory note, 5.00%, 2/01/12 | 7/01/10 - 11/30/12 | $ 1,754 | $ — | ||||||||||
1,730,515 | International Automotive Components Group Brazil LLC | 4/13/06 - 12/26/08 | 1,149,241 | 39,348 | ||||||||||
15,382,424 | International Automotive Components Group North America LLC | 1/12/06 - 3/18/13 | 12,591,586 | 4,605,329 | ||||||||||
|
| |||||||||||||
Total Restricted Securities (Value is 0.1% of Net Assets) | $13,742,581 | $4,644,677 | ||||||||||||
|
| |||||||||||||
| Semiannual Report |
|
MS-27 |
|
FRANKLIN TEMPLETON VARIABLE INSURANCE PRODUCTS TRUST
NOTES TO FINANCIAL STATEMENTS (UNAUDITED)
Franklin Mutual Shares VIP Fund (continued)
9. Other Derivative Information
At June 30, 2018, the Fund’s investments in derivative contracts are reflected in the Statement of Assets and Liabilities as follows:
Asset Derivatives | Liability Derivatives | |||||||||||
Derivative Contracts Not Accounted for as Hedging Instruments | Statement of Assets and Liabilities Location | Fair Value | Statement of Assets and Liabilities | Fair Value | ||||||||
| ||||||||||||
Foreign exchange contracts | Variation margin on futures contracts | $2,404,937 | a | Variation margin on futures contracts | $ — | |||||||
| Unrealized appreciation on OTC forward exchange contracts | 2,601,401 | Unrealized depreciation on OTC forward exchange contracts | 361,351 | |||||||||
|
|
|
| |||||||||
Totals | $5,006,338 | $361,351 | ||||||||||
|
|
|
| |||||||||
aThis amount reflects the cumulative appreciation (depreciation) of futures contracts as reported in the Statement of Investments. Only the variation margin receivable/ payable at period end is separately reported within the Statement of Assets and Liabilities. Prior variation margin movements were recorded to cash upon receipt or payment.
For the period ended June 30, 2018, the effect of derivative contracts in the Fund’s Statement of Operations was as follows:
Derivative Contracts Not Accounted for as Hedging Instruments | Statement of Operations Location | Net Realized Gain (Loss) for the Period | Statement of Operations Location | Net Change in Unrealized Appreciation (Depreciation) for the Period | ||||||
| ||||||||||
| Net realized gain (loss) from: | Net change in unrealized | |||||||||
| appreciation (depreciation) on: | ||||||||||
Foreign exchange contracts | Forward exchange contracts | $1,476,562 | Forward exchange contracts | $ 8,063,810 | ||||||
| Futures contracts | 2,160,136 | Futures contracts | 4,500,335 | |||||||
|
|
| ||||||||
Totals | $3,636,698 | $12,564,145 | ||||||||
|
|
| ||||||||
For the period ended June 30, 2018, the average month end notional amount of futures contracts represented $186,880,411. The average month end contract value of forward exchange contracts was $324,904,609.
See Note 1(c) regarding derivative financial instruments.
10. Holdings of 5% Voting Securities of Portfolio Companies
The 1940 Act defines “affiliated companies” to include investments in portfolio companies in which a fund owns 5% or more of the outstanding voting securities. During the period ended June 30, 2018, investments in “affiliated companies” were as follows:
| Name of Issuer | Number of Shares Held at Beginning of Period | Gross Additions | Gross Reductions | Number of at End of Period | Value at End of Period | Dividend Income | Realized Gain (Loss) | Net Change in Unrealized Appreciation (Depreciation) | ||||||||||||||||||||||||
| Non-Controlled Affiliates | ||||||||||||||||||||||||||||||||
CB FIM Coinvestors LLC | 6,400,507 | — | (6,400,507 | )a | — | $— | $— | $4,122 | $— | |||||||||||||||||||||||
|
| |||||||||||||||||||||||||||||||
aGross reduction was the result of a corporate action.
11. Credit Facility
The Fund, together with other U.S. registered and foreign investment funds (collectively, Borrowers), managed by Franklin Templeton Investments, are borrowers in a joint syndicated senior unsecured credit facility totaling $2 billion (Global Credit Facility) which matures on February 8, 2019. This Global Credit Facility provides a source of funds to the Borrowers for temporary and emergency purposes, including the ability to meet future unanticipated or unusually large redemption requests.
MS-28 | Semiannual Report |
FRANKLIN TEMPLETON VARIABLE INSURANCE PRODUCTS TRUST
NOTES TO FINANCIAL STATEMENTS (UNAUDITED)
Franklin Mutual Shares VIP Fund (continued)
Under the terms of the Global Credit Facility, the Fund shall, in addition to interest charged on any borrowings made by the Fund and other costs incurred by the Fund, pay its share of fees and expenses incurred in connection with the implementation and maintenance of the Global Credit Facility, based upon its relative share of the aggregate net assets of all of the Borrowers, including an annual commitment fee of 0.15% based upon the unused portion of the Global Credit Facility. These fees are reflected in other expenses in the Statement of Operations. During the period ended June 30, 2018, the Fund did not use the Global Credit Facility.
12. Fair Value Measurements
The Fund follows a fair value hierarchy that distinguishes between market data obtained from independent sources (observable inputs) and the Fund’s own market assumptions (unobservable inputs). These inputs are used in determining the value of the Fund’s financial instruments and are summarized in the following fair value hierarchy:
| • | Level 1 – quoted prices in active markets for identical financial instruments |
| • | Level 2 – other significant observable inputs (including quoted prices for similar financial instruments, interest rates, prepayment speed, credit risk, etc.) |
| • | Level 3 – significant unobservable inputs (including the Fund’s own assumptions in determining the fair value of financial instruments) |
The input levels are not necessarily an indication of the risk or liquidity associated with financial instruments at that level.
For movements between the levels within the fair value hierarchy, the Fund has adopted a policy of recognizing the transfers as of the date of the underlying event which caused the movement.
A summary of inputs used as of June 30, 2018, in valuing the Fund’s assets and liabilities carried at fair value, is as follows:
| Level 1 | Level 2 | Level 3 | Total | |||||||||||||
| ||||||||||||||||
| Assets: | ||||||||||||||||
Investments in Securities:a | ||||||||||||||||
Equity Investments:b | ||||||||||||||||
Auto Components | $ | 14,734,139 | $ | — | $ | 4,644,677 | $ | 19,378,816 | ||||||||
Machinery | 9,149,478 | 19,605,413 | — | 28,754,891 | ||||||||||||
Media | 288,538,075 | 1,429,942 | — | 289,968,017 | ||||||||||||
Software | 203,611,100 | 423,423 | — | 204,034,523 | ||||||||||||
All Other Equity Investments | 2,959,112,878 | — | — | c | 2,959,112,878 | |||||||||||
Corporate Notes and Senior Floating Rate | ||||||||||||||||
Interests | — | 72,461,667 | — | 72,461,667 | ||||||||||||
Corporate Notes and Senior Floating Rate Interests in | — | 65,996,696 | — | c | 65,996,696 | |||||||||||
Companies in Liquidation | — | 2,475,314 | — | c | 2,475,314 | |||||||||||
Short Term Investments | 196,490,500 | 69,600,000 | — | 266,090,500 | ||||||||||||
|
| |||||||||||||||
Total Investments in Securities | $ | 3,671,636,170 | $ | 231,992,455 | $ | 4,644,677 | $ | 3,908,273,302 | ||||||||
|
| |||||||||||||||
Other Financial Instruments: | ||||||||||||||||
Futures Contracts | $ | 2,404,937 | $ | — | $ | — | $ | 2,404,937 | ||||||||
Forward Exchange Contracts | — | 2,601,401 | — | 2,601,401 | ||||||||||||
|
| |||||||||||||||
Total Other Financial Instruments | $ | 2,404,937 | $ | 2,601,401 | $ | — | $ | 5,006,338 | ||||||||
|
| |||||||||||||||
| Semiannual Report |
|
MS-29 |
|
FRANKLIN TEMPLETON VARIABLE INSURANCE PRODUCTS TRUST
NOTES TO FINANCIAL STATEMENTS (UNAUDITED)
Franklin Mutual Shares VIP Fund (continued)
12. Fair Value Measurements (continued)
| Level 1 | Level 2 | Level 3 | Total | |||||||||||||
| ||||||||||||||||
| Liabilities: | ||||||||||||||||
Other Financial Instruments: | ||||||||||||||||
Securities Sold Short | $ | 21,813,875 | $ | — | $ | — | $ | 21,813,875 | ||||||||
Forward Exchange Contracts | — | 361,351 | — | 361,351 | ||||||||||||
|
| |||||||||||||||
Total Other Financial Instruments | $ | 21,813,875 | $ | 361,351 | $ | — | $ | 22,175,226 | ||||||||
|
| |||||||||||||||
aFor detailed categories, see the accompanying Statement of Investments.
bIncludes common stocks, management investment companies as well as other equity investments.
cIncludes securities determined to have no value at June 30, 2018.
A reconciliation of assets in which Level 3 inputs are used in determining fair value is presented when there are significant Level 3 financial instruments at the beginning and/or end of the period.
13. Subsequent Events
The Fund has evaluated subsequent events through the issuance of the financial statements and determined that no events have occurred that require disclosure.
Abbreviations
| Counterparty | Currency | Selected Portfolio | ||||||||
| BOFA | Bank of America Corp. | EUR | Euro | ADR | American Depositary Receipt | |||||
| BONY | The Bank of New York Mellon Corp. | GBP | British Pound | DIP | Debtor-In-Possession | |||||
| HSBK | HSBC Bank PLC | USD | United States Dollar | FHLB | Federal Home Loan Bank | |||||
| SSBT | State Street Bank and Trust Co., N.A. | LIBOR | London InterBank Offered Rate | |||||||
| UBSW | UBS AG | TRA | Tax Receivable Agreement | |||||||
MS-30 | Semiannual Report |
Franklin Rising Dividends VIP Fund
This semiannual report for Franklin Rising Dividends VIP Fund covers the period ended June 30, 2018.
Class 2 Performance Summary as of June 30, 2018
The Fund’s Class 2 Shares posted a +0.50% total return* for the six-month period ended June 30, 2018.
*The Fund has a fee waiver associated with any investment it makes in a Franklin Templeton money fund and/or other Franklin Templeton fund, contractually guaranteed through 4/30/19. Fund investment results reflect the fee waiver; without this waiver, the results would have been lower.
Performance reflects the Fund’s Class 2 operating expenses, but does not include any contract fees, expenses or sales charges. If they had been included, performance would be lower. These charges and deductions, particularly for variable life policies, can have a significant effect on contract values and insurance benefits. See the contract prospectus for a complete description of these expenses, including sales charges.
Performance data represent past performance, which does not guarantee future results. Investment return and principal value will fluctuate, and you may have a gain or loss when you sell your shares. Current performance may differ from figures shown.
Semiannual Report | FRD-1 |
FRANKLIN RISING DIVIDENDS VIP FUND
Fund Goal and Main Investments
The Fund seeks long-term capital appreciation, with preservation of capital as an important consideration. Preservation of capital, while not a goal, is also an important consideration. Under normal market conditions, the Fund invests at least 80% of its net assets in equity securities of financially sound companies that have paid consistently rising dividends.
Fund Risks
All investments involve risks, including possible loss of principal. Value securities may not increase in price as anticipated or may decline further in value. For stocks paying dividends, dividends are not guaranteed, and can increase, decrease or be totally eliminated without notice. Securities issued by smaller and midsize companies may be more volatile in price than those of larger companies, involve substantial risks and should be considered speculative. To the extent that the Fund focuses on particular countries, regions, industries, sectors or types of investment from time to time, the Fund may be subject to greater risks of adverse developments in such areas of focus than a fund that invests in a wider variety of countries, regions, industries, sectors or investments. Foreign investing carries additional risks such as currency and market volatility and political or social instability, risks that are heightened in developing countries. The Fund is actively managed but there is no guarantee that the manager’s investment decisions will produce the desired results. The Fund’s prospectus also includes a description of the main investment risks.
Performance Overview
You can find the Fund’s six-month total return in the Performance Summary. In comparison, the Standard & Poor’s® 500 Index (S&P 500®) rose +2.65% for the same period.1 Please note the Fund employs a bottom-up stock selection process, and the managers invest in securities without regard to benchmark comparisons.
Economic and Market Overview
The US economy continued to grow during the six months under review. After moderating for three consecutive quarters, the economy grew faster in 2018’s second quarter, driven by
consumer spending, exports, business investment and government spending. The manufacturing and services sectors expanded during the period. The unemployment rate declined slightly from 4.1% in December 2017, as reported at the beginning of the six-month period, to 4.0% at period-end.2 Annual inflation, as measured by the Consumer Price Index, increased from 2.1% in December 2017, as reported at the beginning of the period, to 2.9% at period-end.2
In February 2018, the new US Federal Reserve (Fed) Chair Jerome Powell spoke before Congress for the first time and indicated the Fed saw signs of a continued strong labor market and economic growth. He reiterated the Fed’s intention to gradually raise interest rates in an effort to keep the economy from overheating and as inflation increases toward the Fed’s target. However, he noted there was no evidence of the economy overheating and he had yet to see a clear upward move in wages. The Fed raised its target range for the federal funds rate 0.25% each at its March and June 2018 meetings to 1.75%–2.00% and continued reducing its balance sheet as part of its ongoing plan to normalize monetary policy. In June, the Fed upgraded its economic forecast for 2018 and its inflation forecasts for 2018 and 2019. Furthermore, the Fed forecasted an additional rate hike for 2018 and 2019 than previously anticipated.
US equity markets rose overall during the period, benefiting from mostly upbeat economic data and better US corporate earnings. At certain points during the period, markets were also supported by the expectations of gradual rate increases. After reaching new all-time highs in January 2018, US stocks declined in February amid concerns that strong economic growth and rising inflation would lead the Fed to increase its target rate faster than expected. In March, markets were pressured further by a broad sell-off in information technology stocks due to a potential for tighter regulation in the sector arising from concerns about consumer data privacy. Other factors that curbed investor sentiment included tensions between the US and North Korea, political uncertainties in the US, the Trump administration’s protectionist policies and escalating trade tensions between the US and China. An overall easing of tensions in the Korean peninsula and intermittent US-China trade negotiations partially offset some of these concerns. However, US trade disputes with its allies and China near period-end dampened investor sentiment. In this
1. Source: Morningstar. One cannot invest directly in an index, and an index is not representative of the Fund’s portfolio. Please see Index Descriptions following the Fund Summaries.
2. Source: Bureau of Labor Statistics.
The dollar value, number of shares or principal amount, and names of all portfolio holdings are listed in the Fund’s Statement of Investments (SOI).
FRD-2 | Semiannual Report |
FRANKLIN RISING DIVIDENDS VIP FUND
environment, the broad US stock market, as measured by the S&P 500, generated a +2.65% total return for the period.1
Investment Strategy
We are a research-driven, fundamental investment adviser, pursuing a disciplined value-oriented strategy. As bottom-up investors concentrating primarily on individual securities, we seek fundamentally sound companies that we believe meet our screening criteria, which include consistent, substantial dividend increases; reinvested earnings; and strong balance sheets. We attempt to acquire such stocks at attractive prices, often when they are out of favor with other investors. In following these criteria, we do not necessarily focus on companies whose securities pay a high dividend but rather on companies that consistently raise their dividends.
Manager’s Discussion
During the six-month period ended June 30, 2018, some holdings that contributed to absolute performance included Microsoft; NIKE; and Becton, Dickinson and Co.
Shares of Microsoft, a software company, moved higher as its cloud-based initiatives continued to deliver strong results, led by Office 365 subscriber growth and Azure revenue growth. Additionally, prudent expense management and better hardware gross margins led to better first quarter operating results and earnings per share growth, which topped the consensus expectation. The company has raised its dividend for 14 consecutive years.
Shares of NIKE, a designer and marketer of athletic footwear, rose based on improved results in its key North American market. The company employed a mix of direct selling, e-commerce, differentiated retail concepts and innovation to drive growth. Greater use of technology has revolutionized NIKE’s ability to connect with customers, manage inventory and upgrade its manufacturing capabilities. NIKE has raised its dividend for 16 years.
Shares of Becton, Dickinson and Co., a global medical technology company, rose based on two strong quarterly earnings reports. Factors that accelerated revenue growth included a strong pipeline, synergies from the acquisition of C. R. Bard and emerging market exposure. Becton has raised its dividend for 46 years.
Conversely, some holdings that detracted from absolute performance included Albemarle, ABM Industries and Dover.
Shares of Albemarle, a specialty chemicals producer, declined despite the company reporting strong performance during the
Portfolio Composition
Based on Total Net Assets as of 6/30/18
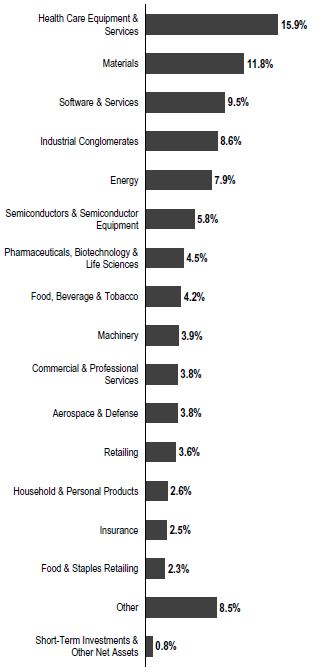
period. Although lithium producers broadly believe that the industry is unlikely to suffer from oversupply, investor concerns about the possible negative impact on pricing from such a scenario continue to weigh on the industry as a whole. We believe Albemarle’s long-term contracts, priced below lithium spot price, and low cost position could provide insulation from spot price fluctuations. The company has increased its dividend for 24 consecutive years.
| Semiannual Report |
|
FRD-3 |
|
FRANKLIN RISING DIVIDENDS VIP FUND
Shares of ABM Industries, a facility services contractor, declined during the period as the company’s exit from unprofitable contracts and increased investments have hurt growth and profitability. In addition, a secondary share offering announced in March put further downward pressure on the share price, as several private equity shareholders sold shares issued as part of last year’s acquisition of GCA Services Group. The management team has been clear about these challenges as part of the company’s comprehensive strategic turnaround plan, which we believe could improve ABM’s competitive position. The company has increased its dividend for 54 consecutive years.
Shares of Dover, a diversified industrial company, were weak during the period despite reporting solid financial results. Weak share performance during the period was likely due to investor concerns about the negative impact of restrictive trade actions. Although this theme has weighed on industrial stocks in general, we believe the recent appointment of Richard Tobin as Dover’s CEO could act as a catalyst in the near future given his reputation for strong operational leadership. Dover has grown its dividend for 62 consecutive years.
During the period, the Fund did not initiate new positions. We added to existing positions including Honeywell International, a diversified industrial company (eight consecutive years of dividend increases); Colgate-Palmolive, a consumer products company focused on household, health care and personal care products (56 consecutive years of dividend increases); and EOG Resources, a petroleum and natural gas exploration company.
We exited positions in The Archer Daniels Midland Company, Leggett & Platt and Brady. We also reduced several holdings including Arthur J. Gallagher & Co, John Wiley & Sons and the aforementioned Microsoft during the period.
Our 10 largest positions on June 30, 2018, represented 36.9% of the Fund’s total net assets. It is interesting to note how these 10 companies would respond to the Fund’s screening criteria based on a simple average of statistical measures. On average, these 10 companies have raised their dividends 22 years in a row and by 300% over the past 10 years. Their most recent year-over-year dividend increases averaged 10.1% with a yield of 1.5% on June 30, 2018, and a dividend payout ratio of 32.6%, based on estimates of calendar year 2018 operating earnings estimates. The average price/earnings ratio was 23.2 times calendar year 2018 estimates versus 17.1 for that of the unmanaged S&P 500.
| Top 10 Holdings | ||||
| 6/30/18 | ||||
Company Sector/Industry | % of Total Net Assets | |||
| Microsoft Corp. Software & Services | 5.5% | |||
| Roper Technologies Inc. Industrial Conglomerates | 5.2% | |||
| Stryker Corp. Health Care Equipment & Services | 3.7% | |||
| Becton, Dickinson and Co. Health Care Equipment & Services | 3.7% | |||
| Albemarle Corp. Materials | 3.6% | |||
| Praxair Inc. Materials | 3.4% | |||
| Accenture PLC Software & Services | 3.3% | |||
| Texas Instruments Inc. Semiconductors & Semiconductor Equipment | 2.9% | |||
| West Pharmaceutical Services Inc. Health Care Equipment & Services | 2.8% | |||
| Honeywell International Inc. Industrial Conglomerates | 2.8% | |||
Thank you for your participation in Franklin Rising Dividends VIP Fund. We look forward to continuing to serve your investment needs.
The foregoing information reflects our analysis, opinions and portfolio holdings as of June 30, 2018, the end of the reporting period. The way we implement our main investment strategies and the resulting portfolio holdings may change depending on factors such as market and economic conditions. These opinions may not be relied upon as investment advice or an offer for a particular security. The information is not a complete analysis of every aspect of any market, country, industry, security or the Fund. Statements of fact are from sources considered reliable, but the investment manager makes no representation or warranty as to their completeness or accuracy. Although historical performance is no guarantee of future results, these insights may help you understand our investment management philosophy.
FRD-4 | Semiannual Report |
FRANKLIN RISING DIVIDENDS VIP FUND
Class 2 Fund Expenses
As an investor in a variable insurance contract (Contract) that indirectly provides for investment in an underlying mutual fund, you can incur transaction and/or ongoing expenses at both the Fund level and the Contract Level: (1) transaction expenses can include sales charges (loads) on purchases, surrender fees, transfer fees and premium taxes; and (2) ongoing expenses can include management fees, distribution and service (12b-1) fees, contract fees, annual maintenance fees, mortality and expense risk fees and other fees and expenses. All mutual funds and Contracts have some types of ongoing expenses. The table below shows Fund-level ongoing expenses and can help you understand these costs and compare them with those of other mutual funds offered through the Contract. The table assumes a $1,000 investment held for the six months indicated. Please refer to the Fund prospectus for additional information on operating expenses.
Actual Fund Expenses
The table below provides information about the actual account values and actual expenses in the columns under the heading “Actual.” In these columns the Fund’s actual return, which includes the effect of ongoing Fund expenses but does not include the effect of ongoing Contract expenses, is used to calculate the “Ending Account Value.” You can estimate the Fund-level expenses you paid during the period by following these steps (of course, your account value and expenses will differ from those in this illustration): Divide your account value by $1,000 (if your account had an $8,600 value, then $8,600 ÷ $1,000 = 8.6). Then multiply the result by the number under the headings “Actual” and “Fund-Level Expenses Paid During Period” (if Fund-Level Expenses Paid During Period were $ 7.50, then 8.6 x $ 7.50 = $64.50). In this illustration, the estimated expenses paid this period at the Fund level are $64.50.
Hypothetical Example for Comparison with Other Mutual Funds
Under the heading “Hypothetical” in the table, information is provided about hypothetical account values and hypothetical expenses based on the Fund’s actual expense ratio and an assumed rate of return of 5% per year before expenses, which is not the Fund’s actual return. This information may not be used to estimate the actual ending account balance or expenses you paid for the period, but it can help you compare ongoing costs of investing in the Fund with those of other mutual funds offered through the Contract. To do so, compare this 5% hypothetical example with the 5% hypothetical examples that appear in the shareholder reports of other funds offered through the Contract.
Please note that expenses shown in the table are meant to highlight ongoing costs at the Fund level only and do not reflect any ongoing expenses at the Contract level, or transaction expenses at either the Fund or Contract levels. In addition, while the Fund does not have transaction expenses, if the transaction and ongoing expenses at the Contract level were included, the expenses shown below would be higher. You should consult your Contract prospectus or disclosure document for more information.
| Actual (actual return after expenses) | Hypothetical (5% annual return before expenses) | |||||||||||
Share Class | Beginning Account Value 1/1/18 | Ending Account Value 6/30/18 | Fund-Level Expenses Paid During Period 1/1/18–6/30/181,2 | Ending Account Value 6/30/18 | Fund-Level Expenses Paid During Period 1/1/18–6/30/181,2 | Net Annualized Expense Ratio2 | ||||||
|
|
|
| |||||||||
Class 2 | $1,000 | $1,005.00 | $4.33 | $1,020.48 | $4.36 | 0.87% | ||||||
1. Expenses are equal to the annualized expense ratio for the six-month period as indicated above—in the far right column—multiplied by the simple average account value over the period indicated, and then multiplied by 181/365 to reflect the one-half year period.
2. Reflects expenses after fee waivers and expense reimbursements. Does not include any ongoing expenses of the Contract for which the Fund is an investment option or acquired fund fees and expenses.
| Semiannual Report | FRD-5 | |||||
FRANKLIN TEMPLETON VARIABLE INSURANCE PRODUCTS TRUST
Financial Highlights
Franklin Rising Dividends VIP Fund
Six Months Ended (unaudited) | Year Ended December 31, | |||||||||||||||||||||||
| 2017 | 2016 | 2015 | 2014 | 2013 | ||||||||||||||||||||
| ||||||||||||||||||||||||
| Class 1 | ||||||||||||||||||||||||
Per share operating performance (for a share outstanding throughout the period) | ||||||||||||||||||||||||
Net asset value, beginning of period | $29.21 | $25.51 | $25.26 | $29.63 | $28.14 | $22.03 | ||||||||||||||||||
|
| |||||||||||||||||||||||
| Income from investment operationsa: | ||||||||||||||||||||||||
Net investment incomeb | 0.19 | 0.40 | 0.42 | 0.45 | 0.45 | 0.40 | ||||||||||||||||||
Net realized and unrealized gains (losses) | 0.03 | 4.76 | 3.45 | (1.33 | ) | 2.03 | 6.16 | |||||||||||||||||
|
| |||||||||||||||||||||||
Total from investment operations | 0.22 | 5.16 | 3.87 | (0.88 | ) | 2.48 | 6.56 | |||||||||||||||||
|
| |||||||||||||||||||||||
| Less distributions from: | ||||||||||||||||||||||||
Net investment income | (0.44 | ) | (0.48 | ) | (0.44 | ) | (0.48 | ) | (0.44 | ) | (0.45) | |||||||||||||
Net realized gains | (1.76 | ) | (0.98 | ) | (3.18 | ) | (3.01 | ) | (0.55 | ) | — | |||||||||||||
|
| |||||||||||||||||||||||
Total distributions | (2.20 | ) | (1.46 | ) | (3.62 | ) | (3.49 | ) | (0.99 | ) | (0.45) | |||||||||||||
|
| |||||||||||||||||||||||
Net asset value, end of period | $27.23 | $29.21 | $25.51 | $25.26 | $29.63 | $28.14 | ||||||||||||||||||
|
| |||||||||||||||||||||||
Total returnc | 0.63% | 20.85% | 16.33% | (3.42)% | 9.01% | 30.05% | ||||||||||||||||||
| Ratios to average net assetsd | ||||||||||||||||||||||||
Expenses before waiver and payments by affiliates | 0.62% | 0.62% | 0.63% | 0.63% | 0.62% | 0.61% | ||||||||||||||||||
Expenses net of waiver and payments by affiliates | 0.62% | e,f | 0.62% | e,f | 0.62% | e | 0.63% | f | 0.62% | f | 0.61% | |||||||||||||
Net investment income | 1.32% | 1.49% | 1.67% | 1.65% | 1.58% | 1.59% | ||||||||||||||||||
| Supplemental data | ||||||||||||||||||||||||
Net assets, end of period (000’s) | $176,886 | $216,015 | $181,072 | $143,376 | $160,480 | $168,380 | ||||||||||||||||||
Portfolio turnover rate | 1.86% | 3.36% | 6.66% | 4.74% | 8.61% | 0.07% | ||||||||||||||||||
aThe amount shown for a share outstanding throughout the period may not correlate with the Statement of Operations for the period due to the timing of sales and repurchases of the Fund’s shares in relation to income earned and/or fluctuating fair value of the investments of the Fund.
bBased on average daily shares outstanding.
cTotal return does not include fees, charges or expenses imposed by the variable annuity and life insurance contracts for which Franklin Templeton Variable Insurance Products Trust serves as an underlying investment vehicle. Total return is not annualized for periods less than one year.
dRatios are annualized for periods less than one year.
eBenefit of expense reduction rounds to less than 0.01%.
fBenefit of waiver and payments by affiliates rounds to less than 0.01%.
| FRD-6 | Semiannual Report | The accompanying notes are an integral part of these financial statements. | |||
FRANKLIN TEMPLETON VARIABLE INSURANCE PRODUCTS TRUST
FINANCIAL HIGHLIGHTS
Franklin Rising Dividends VIP Fund (continued)
Six Months Ended (unaudited) | Year Ended December 31, | |||||||||||||||||||||||
| 2017 | 2016 | 2015 | 2014 | 2013 | ||||||||||||||||||||
| ||||||||||||||||||||||||
| Class 2 | ||||||||||||||||||||||||
Per share operating performance (for a share outstanding throughout the period) | ||||||||||||||||||||||||
Net asset value, beginning of period | $28.46 | $24.89 | $24.72 | $29.06 | $27.62 | $21.64 | ||||||||||||||||||
|
| |||||||||||||||||||||||
| Income from investment operationsa: | ||||||||||||||||||||||||
Net investment incomeb | 0.15 | 0.33 | 0.35 | 0.37 | 0.37 | 0.33 | ||||||||||||||||||
Net realized and unrealized gains (losses) | 0.02 | 4.63 | 3.37 | (1.29 | ) | 1.99 | 6.04 | |||||||||||||||||
|
| |||||||||||||||||||||||
Total from investment operations | 0.17 | 4.96 | 3.72 | (0.92 | ) | 2.36 | 6.37 | |||||||||||||||||
|
| |||||||||||||||||||||||
| Less distributions from: | ||||||||||||||||||||||||
Net investment income | (0.36 | ) | (0.41 | ) | (0.37 | ) | (0.41 | ) | (0.37 | ) | (0.39) | |||||||||||||
Net realized gains | (1.76 | ) | (0.98 | ) | (3.18 | ) | (3.01 | ) | (0.55 | ) | — | |||||||||||||
|
| |||||||||||||||||||||||
Total distributions | (2.12 | ) | (1.39 | ) | (3.55 | ) | (3.42 | ) | (0.92 | ) | (0.39) | |||||||||||||
|
| |||||||||||||||||||||||
Net asset value, end of period | $26.51 | $28.46 | $24.89 | $24.72 | $29.06 | $27.62 | ||||||||||||||||||
|
| |||||||||||||||||||||||
Total returnc | 0.50% | 20.56% | 16.04% | (3.65)% | 8.72% | 29.69% | ||||||||||||||||||
| Ratios to average net assetsd | ||||||||||||||||||||||||
Expenses before waiver and payments by affiliates | 0.87% | 0.87% | 0.88% | 0.88% | 0.87% | 0.86% | ||||||||||||||||||
Expenses net of waiver and payments by affiliates | 0.87% | e,f | 0.87% | e,f | 0.87% | e | 0.88% | f | 0.87% | f | 0.86% | |||||||||||||
Net investment income | 1.07% | 1.24% | 1.42% | 1.40% | 1.33% | 1.34% | ||||||||||||||||||
| Supplemental data | ||||||||||||||||||||||||
Net assets, end of period (000’s) | $1,547,979 | $1,640,883 | $1,530,374 | $1,310,783 | $1,667,816 | $1,752,012 | ||||||||||||||||||
Portfolio turnover rate | 1.86% | 3.36% | 6.66% | 4.74% | 8.61% | 0.07% | ||||||||||||||||||
aThe amount shown for a share outstanding throughout the period may not correlate with the Statement of Operations for the period due to the timing of sales and repurchases of the Fund’s shares in relation to income earned and/or fluctuating fair value of the investments of the Fund.
bBased on average daily shares outstanding.
cTotal return does not include fees, charges or expenses imposed by the variable annuity and life insurance contracts for which Franklin Templeton Variable Insurance Products Trust serves as an underlying investment vehicle. Total return is not annualized for periods less than one year.
dRatios are annualized for periods less than one year.
eBenefit of expense reduction rounds to less than 0.01%.
fBenefit of waiver and payments by affiliates rounds to less than 0.01%.
| The accompanying notes are an integral part of these financial statements. | Semiannual Report | FRD-7 | |||||
FRANKLIN TEMPLETON VARIABLE INSURANCE PRODUCTS TRUST
FINANCIAL HIGHLIGHTS
Franklin Rising Dividends VIP Fund (continued)
Six Months Ended (unaudited) | Year Ended December 31, | |||||||||||||||||||||||
| 2017 | 2016 | 2015 | 2014 | 2013 | ||||||||||||||||||||
| ||||||||||||||||||||||||
| Class 4 | ||||||||||||||||||||||||
Per share operating performance (for a share outstanding throughout the period) | ||||||||||||||||||||||||
Net asset value, beginning of period | $28.54 | $24.98 | $24.81 | $29.19 | $27.76 | $21.78 | ||||||||||||||||||
|
| |||||||||||||||||||||||
| Income from investment operationsa: | ||||||||||||||||||||||||
Net investment incomeb | 0.14 | 0.30 | 0.32 | 0.35 | 0.35 | 0.32 | ||||||||||||||||||
Net realized and unrealized gains (losses) | 0.02 | 4.65 | 3.39 | (1.31 | ) | 2.00 | 6.07 | |||||||||||||||||
|
| |||||||||||||||||||||||
Total from investment operations | 0.16 | 4.95 | 3.71 | (0.96 | ) | 2.35 | 6.39 | |||||||||||||||||
|
| |||||||||||||||||||||||
| Less distributions from: | ||||||||||||||||||||||||
Net investment income | (0.34 | ) | (0.41 | ) | (0.36 | ) | (0.41 | ) | (0.37 | ) | (0.41) | |||||||||||||
Net realized gains | (1.76 | ) | (0.98 | ) | (3.18 | ) | (3.01 | ) | (0.55 | ) | — | |||||||||||||
|
| |||||||||||||||||||||||
Total distributions | (2.10 | ) | (1.39 | ) | (3.54 | ) | (3.42 | ) | (0.92 | ) | (0.41) | |||||||||||||
|
| |||||||||||||||||||||||
Net asset value, end of period | $26.60 | $28.54 | $24.98 | $24.81 | $29.19 | $27.76 | ||||||||||||||||||
|
| |||||||||||||||||||||||
Total returnc | 0.46% | 20.40% | 15.93% | (3.75)% | 8.62% | 29.57% | ||||||||||||||||||
| Ratios to average net assetsd | ||||||||||||||||||||||||
Expenses before waiver and payments by affiliates | 0.97% | 0.97% | 0.98% | 0.98% | 0.97% | 0.96% | ||||||||||||||||||
Expenses net of waiver and payments by affiliates | 0.97% | e,f | 0.97% | e,f | 0.97% | e | 0.98% | f | 0.97% | f | 0.96% | |||||||||||||
Net investment income | 0.97% | 1.14% | 1.32% | 1.30% | 1.23% | 1.24% | ||||||||||||||||||
| Supplemental data | ||||||||||||||||||||||||
Net assets, end of period (000’s) | $35,211 | $36,407 | $28,579 | $20,453 | $15,503 | $12,028 | ||||||||||||||||||
Portfolio turnover rate | 1.86% | 3.36% | 6.66% | 4.74% | 8.61% | 0.07% | ||||||||||||||||||
aThe amount shown for a share outstanding throughout the period may not correlate with the Statement of Operations for the period due to the timing of sales and repurchases of the Fund’s shares in relation to income earned and/or fluctuating fair value of the investments of the Fund.
bBased on average daily shares outstanding.
cTotal return does not include fees, charges or expenses imposed by the variable annuity and life insurance contracts for which Franklin Templeton Variable Insurance Products Trust serves as an underlying investment vehicle. Total return is not annualized for periods less than one year.
dRatios are annualized for periods less than one year.
eBenefit of expense reduction rounds to less than 0.01%.
fBenefit of waiver and payments by affiliates rounds to less than 0.01%.
| FRD-8 | Semiannual Report | The accompanying notes are an integral part of these financial statements. | |||
FRANKLIN TEMPLETON VARIABLE INSURANCE PRODUCTS TRUST
Statement of Investments, June 30, 2018 (unaudited)
Franklin Rising Dividends VIP Fund
| Shares | Value | |||||
| ||||||
Common Stocks 99.2% | ||||||
Aerospace & Defense 3.8% | ||||||
General Dynamics Corp. | 157,911 | $ | 29,436,190 | |||
United Technologies Corp. | 299,511 | 37,447,860 | ||||
|
| |||||
| 66,884,050 | ||||||
|
| |||||
Building Products 1.5% | ||||||
Johnson Controls International PLC | 800,153 | 26,765,118 | ||||
|
| |||||
Commercial & Professional Services 3.8% | ||||||
ABM Industries Inc. | 704,666 | 20,562,154 | ||||
Cintas Corp. | 178,275 | 32,993,354 | ||||
Matthews International Corp., A | 238,957 | 14,050,672 | ||||
|
| |||||
| 67,606,180 | ||||||
|
| |||||
Consumer Durables & Apparel 1.9% | ||||||
NIKE Inc., B | 427,700 | 34,079,136 | ||||
|
| |||||
Consumer Services 2.0% | ||||||
McDonald’s Corp. | 184,245 | 28,869,349 | ||||
Yum! Brands Inc. | 72,900 | 5,702,238 | ||||
|
| |||||
| 34,571,587 | ||||||
|
| |||||
Diversified Financials 0.5% | ||||||
State Street Corp. | 101,700 | 9,467,253 | ||||
|
| |||||
Electrical Equipment 0.7% | ||||||
a nVent Electric PLC (United Kingdom) | 499,900 | 12,547,490 | ||||
|
| |||||
Energy 7.9% | ||||||
a Apergy Corp. | 231,638 | 9,670,887 | ||||
Chevron Corp. | 243,800 | 30,823,634 | ||||
EOG Resources Inc. | 95,800 | 11,920,394 | ||||
Exxon Mobil Corp. | 353,300 | 29,228,509 | ||||
Occidental Petroleum Corp. | 357,390 | 29,906,395 | ||||
Schlumberger Ltd. | 398,000 | 26,677,940 | ||||
|
| |||||
| 138,227,759 | ||||||
|
| |||||
Food & Staples Retailing 2.3% | ||||||
Walgreens Boots Alliance Inc. | 302,100 | 18,130,532 | ||||
Walmart Inc. | 256,100 | 21,934,965 | ||||
|
| |||||
| 40,065,497 | ||||||
|
| |||||
Food, Beverage & Tobacco 4.2% | ||||||
Bunge Ltd. | 307,700 | 21,449,767 | ||||
McCormick & Co. Inc. | 206,700 | 23,995,803 | ||||
PepsiCo Inc. | 262,900 | 28,621,923 | ||||
|
| |||||
| 74,067,493 | ||||||
|
| |||||
Health Care Equipment & Services 15.9% | ||||||
Abbott Laboratories | 550,300 | 33,562,797 | ||||
Becton, Dickinson and Co. | 270,000 | 64,681,200 | ||||
CVS Health Corp. | 227,100 | 14,613,885 | ||||
DENTSPLY SIRONA Inc. | 65,900 | 2,884,443 | ||||
Medtronic PLC | 568,000 | 48,626,480 | ||||
Stryker Corp. | 390,000 | 65,855,400 | ||||
West Pharmaceutical Services Inc. | 501,918 | 49,835,438 | ||||
|
| |||||
| 280,059,643 | ||||||
|
| |||||
| Semiannual Report | FRD-9 | |||
FRANKLIN TEMPLETON VARIABLE INSURANCE PRODUCTS TRUST
STATEMENT OF INVESTMENTS (UNAUDITED)
Franklin Rising Dividends VIP Fund (continued)
| Shares | Value | |||||
| ||||||
Common Stocks (continued) | ||||||
Household & Personal Products 2.6% | ||||||
Colgate-Palmolive Co. | 327,700 | $ | 21,238,237 | |||
The Procter & Gamble Co. | 306,100 | 23,894,166 | ||||
|
| |||||
| 45,132,403 | ||||||
|
| |||||
Industrial Conglomerates 8.6% | ||||||
Carlisle Cos. Inc. | 101,061 | 10,945,917 | ||||
Honeywell International Inc. | 339,100 | 48,847,355 | ||||
Roper Technologies Inc. | 331,143 | 91,365,665 | ||||
|
| |||||
| 151,158,937 | ||||||
|
| |||||
Insurance 2.5% | ||||||
Aflac Inc. | 485,000 | 20,864,700 | ||||
Arthur J. Gallagher & Co. | 81,300 | 5,307,264 | ||||
Erie Indemnity Co., A | 144,547 | 16,949,581 | ||||
|
| |||||
| 43,121,545 | ||||||
|
| |||||
Machinery 3.9% | ||||||
Donaldson Co. Inc. | 294,168 | 13,272,860 | ||||
Dover Corp. | 463,276 | 33,911,803 | ||||
Pentair PLC (United Kingdom) | 496,500 | 20,892,720 | ||||
|
| |||||
| 68,077,383 | ||||||
|
| |||||
Materials 11.8% | ||||||
Air Products and Chemicals Inc. | 305,000 | 47,497,650 | ||||
Albemarle Corp. | 678,700 | 64,021,771 | ||||
Ecolab Inc. | 115,600 | 16,222,148 | ||||
Nucor Corp. | 338,155 | 21,134,687 | ||||
Praxair Inc. | 374,960 | 59,299,924 | ||||
|
| |||||
| 208,176,180 | ||||||
|
| |||||
Media 1.0% | ||||||
Comcast Corp., A | 286,000 | 9,383,660 | ||||
John Wiley & Sons Inc., A | 133,800 | 8,349,120 | ||||
|
| |||||
| 17,732,780 | ||||||
|
| |||||
Pharmaceuticals, Biotechnology & Life Sciences 4.5% | ||||||
AbbVie Inc. | 190,600 | 17,659,090 | ||||
Johnson & Johnson | 308,000 | 37,372,720 | ||||
Perrigo Co. PLC | 167,100 | 12,183,261 | ||||
Pfizer Inc. | 331,900 | 12,041,332 | ||||
Roche Holding AG, ADR (Switzerland) | 25,000 | 690,750 | ||||
|
| |||||
| 79,947,153 | ||||||
|
| |||||
Retailing 3.6% | ||||||
The Gap Inc. | 439,500 | 14,235,405 | ||||
Ross Stores Inc. | 185,000 | 15,678,750 | ||||
Target Corp. | 164,600 | 12,529,352 | ||||
Tiffany & Co. | 161,500 | 21,253,400 | ||||
|
| |||||
| 63,696,907 | ||||||
|
| |||||
Semiconductors & Semiconductor Equipment 5.8% | ||||||
Analog Devices Inc. | 457,737 | 43,906,133 | ||||
Texas Instruments Inc. | 468,800 | 51,685,200 | ||||
Versum Materials Inc. | 182,000 | 6,761,300 | ||||
|
| |||||
| 102,352,633 | ||||||
|
| |||||
FRD-10 |
Semiannual Report |
FRANKLIN TEMPLETON VARIABLE INSURANCE PRODUCTS TRUST
STATEMENT OF INVESTMENTS (UNAUDITED)
Franklin Rising Dividends VIP Fund (continued)
| Shares | Value | |||||
| ||||||
Common Stocks (continued) | ||||||
Software & Services 9.5% | ||||||
Accenture PLC, A | 350,400 | $ | 57,321,936 | |||
Microsoft Corp. | 987,700 | 97,397,097 | ||||
Visa Inc., A | 89,500 | 11,854,275 | ||||
|
| |||||
| 166,573,308 | ||||||
|
| |||||
Trading Companies & Distributors 0.5% | ||||||
W.W. Grainger Inc. | 28,100 | 8,666,040 | ||||
|
| |||||
Transportation 0.4% | ||||||
United Parcel Service Inc., B | 64,800 | 6,883,704 | ||||
|
| |||||
Total Common Stocks (Cost $899,769,568) | 1,745,860,179 | |||||
|
| |||||
Short Term Investments (Cost $10,448,294) 0.6% | ||||||
Money Market Funds 0.6% | ||||||
b,c Institutional Fiduciary Trust Money Market Portfolio, 1.51% | 10,448,294 | 10,448,294 | ||||
|
| |||||
Total Investments (Cost $910,217,862) 99.8% | 1,756,308,473 | |||||
Other Assets, less Liabilities 0.2% | 3,766,985 | |||||
|
| |||||
Net Assets 100.0% | $ | 1,760,075,458 | ||||
|
| |||||
See Abbreviations on page FRD-20.
aNon-income producing.
bSee Note 3(e) regarding investments in affiliated management investment companies.
cThe rate shown is the annualized seven-day effective yield at period end.
| The accompanying notes are an integral part of these financial statements. | Semiannual Report | FRD-11 | |||||
FRANKLIN TEMPLETON VARIABLE INSURANCE PRODUCTS TRUST
Financial Statements
Statement of Assets and Liabilities
June 30, 2018 (unaudited)
| Franklin Rising Dividends VIP Fund | ||||
Assets: | ||||
Investments in securities: | ||||
Cost - Unaffiliated issuers | $899,769,568 | |||
Cost - Non-controlled affiliates (Note 3e) | 10,448,294 | |||
|
| |||
Value - Unaffiliated issuers | $1,745,860,179 | |||
Value - Non-controlled affiliates (Note 3e) | 10,448,294 | |||
Receivables: | ||||
Investment securities sold | 4,090,856 | |||
Capital shares sold | 437,173 | |||
Dividends | 1,834,152 | |||
Other assets | 1,254 | |||
|
| |||
Total assets | 1,762,671,908 | |||
|
| |||
Liabilities: | ||||
Payables: | ||||
Capital shares redeemed | 882,681 | |||
Management fees | 879,161 | |||
Distribution fees | 672,603 | |||
Accrued expenses and other liabilities | 162,005 | |||
|
| |||
Total liabilities | 2,596,450 | |||
|
| |||
Net assets, at value | $1,760,075,458 | |||
|
| |||
Net assets consist of: | ||||
Paid-in capital | $832,082,911 | |||
Undistributed net investment income | 5,491,440 | |||
Net unrealized appreciation (depreciation) | 846,090,611 | |||
Accumulated net realized gain (loss) | 76,410,496 | |||
|
| |||
Net assets, at value | $1,760,075,458 | |||
|
| |||
| Class 1: | ||||
Net assets, at value | $176,886,189 | |||
|
| |||
Shares outstanding | 6,496,006 | |||
|
| |||
Net asset value and maximum offering price per share | $27.23 | |||
|
| |||
| Class 2: | ||||
Net assets, at value | $1,547,978,542 | |||
|
| |||
Shares outstanding | 58,390,261 | |||
|
| |||
Net asset value and maximum offering price per share | $26.51 | |||
|
| |||
| Class 4: | ||||
Net assets, at value | $35,210,727 | |||
|
| |||
Shares outstanding | 1,323,520 | |||
|
| |||
Net asset value and maximum offering price per share | $26.60 | |||
|
| |||
| FRD-12 | Semiannual Report | The accompanying notes are an integral part of these financial statements. | |||
FRANKLIN TEMPLETON VARIABLE INSURANCE PRODUCTS TRUST
FINANCIAL STATEMENTS
Statement of Operations
for the six months ended June 30, 2018 (unaudited)
| Franklin Rising Dividends VIP Fund | ||||
Investment income: | ||||
Dividends: (net of foreign taxes)* | ||||
Unaffiliated issuers | $17,328,630 | |||
Non-controlled affiliates (Note 3e) | 96,072 | |||
|
| |||
Total investment income | 17,424,702 | |||
|
| |||
Expenses: | ||||
Management fees (Note 3a) | 5,432,565 | |||
Distribution fees: (Note 3c) | ||||
Class 2 | 1,965,442 | |||
Class 4 | 61,762 | |||
Custodian fees (Note 4) | 8,153 | |||
Reports to shareholders | 107,274 | |||
Professional fees | 41,524 | |||
Trustees’ fees and expenses | 4,551 | |||
Other | 15,534 | |||
|
| |||
Total expenses | 7,636,805 | |||
Expense reductions (Note 4) | (149 | ) | ||
Expenses waived/paid by affiliates (Note 3e) | (28,685 | ) | ||
|
| |||
Net expenses | 7,607,971 | |||
|
| |||
Net investment income | 9,816,731 | |||
|
| |||
Realized and unrealized gains (losses): | ||||
Net realized gain (loss) from: | ||||
Investments: | ||||
Unaffiliated issuers | 76,412,885 | |||
Foreign currency transactions | (653 | ) | ||
|
| |||
Net realized gain (loss) | 76,412,232 | |||
|
| |||
Net change in unrealized appreciation (depreciation) on: | ||||
Investments: | ||||
Unaffiliated issuers | (77,427,987 | ) | ||
|
| |||
Net realized and unrealized gain (loss) | (1,015,755 | ) | ||
|
| |||
Net increase (decrease) in net assets resulting from operations | $8,800,976 | |||
|
| |||
*Foreign taxes withheld on dividends | $ 4,873 |
| The accompanying notes are an integral part of these financial statements. | Semiannual Report | FRD-13 | |||
FRANKLIN TEMPLETON VARIABLE INSURANCE PRODUCTS TRUST
FINANCIAL STATEMENTS
Statements of Changes in Net Assets
| Franklin Rising Dividends VIP Fund | ||||||||
| Six Months Ended June 30, 2018 (unaudited) | Year Ended December 31, 2017 | |||||||
Increase (decrease) in net assets: | ||||||||
Operations: | ||||||||
Net investment income | $ 9,816,731 | $ 22,882,157 | ||||||
Net realized gain (loss) | 76,412,232 | 108,533,229 | ||||||
Net change in unrealized appreciation (depreciation) | (77,427,987 | ) | 207,698,448 | |||||
|
| |||||||
Net increase (decrease) in net assets resulting from operations | 8,800,976 | 339,113,834 | ||||||
|
| |||||||
Distributions to shareholders from: | ||||||||
Net investment income: | ||||||||
Class 1 | (2,645,067 | ) | (3,388,715 | ) | ||||
Class 2 | (19,814,681 | ) | (24,052,908 | ) | ||||
Class 4 | (420,918 | ) | (476,793 | ) | ||||
Net realized gains: | ||||||||
Class 1 | (10,684,448 | ) | (7,011,086 | ) | ||||
Class 2 | (95,972,257 | ) | (57,291,559 | ) | ||||
Class 4 | (2,154,046 | ) | (1,158,380 | ) | ||||
|
| |||||||
Total distributions to shareholders | (131,691,417 | ) | (93,379,441 | ) | ||||
|
| |||||||
Capital share transactions: (Note 2) | ||||||||
Class 1 | (27,018,355 | ) | 7,492,496 | |||||
Class 2 | 15,437,655 | (103,411,809 | ) | |||||
Class 4 | 1,240,595 | 3,465,199 | ||||||
|
| |||||||
Total capital share transactions | (10,340,105 | ) | (92,454,114 | ) | ||||
|
| |||||||
Net increase (decrease) in net assets | (133,230,546 | ) | 153,280,279 | |||||
Net assets: | ||||||||
Beginning of period | 1,893,306,004 | 1,740,025,725 | ||||||
|
| |||||||
End of period | $1,760,075,458 | $1,893,306,004 | ||||||
|
| |||||||
Undistributed net investment income included in net assets: | ||||||||
End of period | $ 5,491,440 | $18,555,375 | ||||||
|
| |||||||
| FRD-14 | Semiannual Report | The accompanying notes are an integral part of these financial statements. | |||
FRANKLIN TEMPLETON VARIABLE INSURANCE PRODUCTS TRUST
Notes to Financial Statements (unaudited)
Franklin Rising Dividends VIP Fund
1. Organization and Significant Accounting Policies
Franklin Templeton Variable Insurance Products Trust (Trust) is registered under the Investment Company Act of 1940 (1940 Act) as an open-end management investment company, consisting of eighteen separate funds and applies the specialized accounting and reporting guidance in U.S. Generally Accepted Accounting Principles (U.S. GAAP). Franklin Rising Dividends VIP Fund (Fund) is included in this report. Shares of the Fund are generally sold only to insurance company separate accounts to fund the benefits of variable life insurance policies or variable annuity contracts. The Fund offers three classes of shares: Class 1, Class 2 and Class 4. Each class of shares may differ by its distribution fees, voting rights on matters affecting a single class and its exchange privilege.
The following summarizes the Fund’s significant accounting policies.
a. Financial Instrument Valuation
The Fund’s investments in financial instruments are carried at fair value daily. Fair value is the price that would be received to sell an asset or paid to transfer a liability in an orderly transaction between market participants on the measurement date. The Fund calculates the net asset value (NAV) per share each business day as of 4 p.m. Eastern time or the regularly scheduled close of the New York Stock Exchange (NYSE), whichever is earlier. Under compliance policies and procedures approved by the Trust’s Board of Trustees (the Board), the Fund’s administrator has responsibility for oversight of valuation, including leading the cross-functional Valuation Committee (VC). The VC provides administration and oversight of the Fund’s valuation policies and procedures, which are approved annually by the Board. Among other things, these procedures allow the Fund to utilize independent pricing services, quotations from securities and financial instrument dealers, and other market sources to determine fair value.
Equity securities listed on an exchange or on the NASDAQ National Market System are valued at the last quoted sale price or the official closing price of the day, respectively. Foreign equity securities are valued as of the close of trading on the foreign stock exchange on which the security is primarily traded, or as of 4 p.m. Eastern time. The value is then converted into its U.S. dollar equivalent at the foreign exchange rate in effect at 4 p.m. Eastern time on the day that the value of the security is determined. Over-the-counter (OTC) securities are
valued within the range of the most recent quoted bid and ask prices. Securities that trade in multiple markets or on multiple exchanges are valued according to the broadest and most representative market. Certain equity securities are valued based upon fundamental characteristics or relationships to similar securities.
Investments in open-end mutual funds are valued at the closing NAV.
The Fund has procedures to determine the fair value of financial instruments for which market prices are not reliable or readily available. Under these procedures, the VC convenes on a regular basis to review such financial instruments and considers a number of factors, including significant unobservable valuation inputs, when arriving at fair value. The VC primarily employs a market-based approach which may use related or comparable assets or liabilities, recent transactions, market multiples, book values, and other relevant information for the investment to determine the fair value of the investment. An income-based valuation approach may also be used in which the anticipated future cash flows of the investment are discounted to calculate fair value. Discounts may also be applied due to the nature or duration of any restrictions on the disposition of the investments. Due to the inherent uncertainty of valuations of such investments, the fair values may differ significantly from the values that would have been used had an active market existed. The VC employs various methods for calibrating these valuation approaches including a regular review of key inputs and assumptions, transactional back-testing or disposition analysis, and reviews of any related market activity.
Trading in securities on foreign securities stock exchanges and OTC markets may be completed before 4 p.m. Eastern time. In addition, trading in certain foreign markets may not take place on every Fund’s business day. Occasionally, events occur between the time at which trading in a foreign security is completed and 4 p.m. Eastern time that might call into question the reliability of the value of a portfolio security held by the Fund. As a result, differences may arise between the value of the Fund’s portfolio securities as determined at the foreign market close and the latest indications of value at 4 p.m. Eastern time. In order to minimize the potential for these differences, the VC monitors price movements following the close of trading in foreign stock markets through a series of country specific market proxies (such as baskets of American Depositary Receipts, futures contracts and exchange traded funds). These price movements are measured against
| Semiannual Report | FRD-15 | |||
FRANKLIN TEMPLETON VARIABLE INSURANCE PRODUCTS TRUST
NOTES TO FINANCIAL STATEMENTS (UNAUDITED)
Franklin Rising Dividends VIP Fund (continued)
1. Organization and Significant Accounting
Policies (continued)
a. Financial Instrument Valuation (continued)
established trigger thresholds for each specific market proxy to assist in determining if an event has occurred that may call into question the reliability of the values of the foreign securities held by the Fund. If such an event occurs, the securities may be valued using fair value procedures, which may include the use of independent pricing services.
When the last day of the reporting period is a non-business day, certain foreign markets may be open on those days that the Fund’s NAV is not calculated, which could result in differences between the value of the Fund’s portfolio securities on the last business day and the last calendar day of the reporting period. Any significant security valuation changes due to an open foreign market are adjusted and reflected by the Fund for financial reporting purposes.
b. Foreign Currency Translation
Portfolio securities and other assets and liabilities denominated in foreign currencies are translated into U.S. dollars based on the exchange rate of such currencies against U.S. dollars on the date of valuation. The Fund may enter into foreign currency exchange contracts to facilitate transactions denominated in a foreign currency. Purchases and sales of securities, income and expense items denominated in foreign currencies are translated into U.S. dollars at the exchange rate in effect on the transaction date. Portfolio securities and assets and liabilities denominated in foreign currencies contain risks that those currencies will decline in value relative to the U.S. dollar. Occasionally, events may impact the availability or reliability of foreign exchange rates used to convert the U.S. dollar equivalent value. If such an event occurs, the foreign exchange rate will be valued at fair value using procedures established and approved by the Board.
The Fund does not separately report the effect of changes in foreign exchange rates from changes in market prices on securities held. Such changes are included in net realized and unrealized gain or loss from investments in the Statement of Operations.
Realized foreign exchange gains or losses arise from sales of foreign currencies, currency gains or losses realized between the trade and settlement dates on securities transactions and the difference between the recorded amounts of dividends, interest, and foreign withholding taxes and the U.S. dollar equivalent of
the amounts actually received or paid. Net unrealized foreign exchange gains and losses arise from changes in foreign exchange rates on foreign denominated assets and liabilities other than investments in securities held at the end of the reporting period.
c. Income and Deferred Taxes
It is the Fund’s policy to qualify as a regulated investment company under the Internal Revenue Code. The Fund intends to distribute to shareholders substantially all of its taxable income and net realized gains to relieve it from federal income and if applicable, excise taxes. As a result, no provision for U.S. federal income taxes is required.
The Fund may be subject to foreign taxation related to income received, capital gains on the sale of securities and certain foreign currency transactions in the foreign jurisdictions in which it invests. Foreign taxes, if any, are recorded based on the tax regulations and rates that exist in the foreign markets in which the Fund invests. When a capital gain tax is determined to apply, the Fund records an estimated deferred tax liability in an amount that would be payable if the securities were disposed of on the valuation date.
The Fund may recognize an income tax liability related to its uncertain tax positions under U.S. GAAP when the uncertain tax position has a less than 50% probability that it will be sustained upon examination by the tax authorities based on its technical merits. As of June 30, 2018, the Fund has determined that no tax liability is required in its financial statements related to uncertain tax positions for any open tax years (or expected to be taken in future tax years). Open tax years are those that remain subject to examination and are based on the statute of limitations in each jurisdiction in which the Fund invests.
d. Security Transactions, Investment Income, Expenses and Distributions
Security transactions are accounted for on trade date. Realized gains and losses on security transactions are determined on a specific identification basis. Estimated expenses are accrued daily. Dividend income is recorded on the ex-dividend date except for certain dividends from securities where the dividend rate is not available. In such cases, the dividend is recorded as soon as the information is received by the Fund. Distributions to shareholders are recorded on the ex-dividend date. Distributable earnings are determined according to income tax regulations (tax basis) and may differ from earnings recorded in accordance
| FRD-16 | Semiannual Report | |||
FRANKLIN TEMPLETON VARIABLE INSURANCE PRODUCTS TRUST
NOTES TO FINANCIAL STATEMENTS (UNAUDITED)
Franklin Rising Dividends VIP Fund (continued)
with U.S. GAAP. These differences may be permanent or temporary. Permanent differences are reclassified among capital accounts to reflect their tax character. These reclassifications have no impact on net assets or the results of operations. Temporary differences are not reclassified, as they may reverse in subsequent periods.
Common expenses incurred by the Trust are allocated among the Funds based on the ratio of net assets of each Fund to the combined net assets of the Trust or based on the ratio of number of shareholders of each Fund to the combined number of shareholders of the Trust. Fund specific expenses are charged directly to the Fund that incurred the expense.
Realized and unrealized gains and losses and net investment income, excluding class specific expenses, are allocated daily to each class of shares based upon the relative proportion of net assets of each class. Differences in per share distributions by class are generally due to differences in class specific expenses.
e. Accounting Estimates
The preparation of financial statements in accordance with U.S. GAAP requires management to make estimates and assumptions that affect the reported amounts of assets and
liabilities at the date of the financial statements and the amounts of income and expenses during the reporting period. Actual results could differ from those estimates.
f. Guarantees and Indemnifications
Under the Trust’s organizational documents, its officers and trustees are indemnified by the Trust against certain liabilities arising out of the performance of their duties to the Trust. Additionally, in the normal course of business, the Trust, on behalf of the Fund, enters into contracts with service providers that contain general indemnification clauses. The Trust’s maximum exposure under these arrangements is unknown as this would involve future claims that may be made against the Trust that have not yet occurred. Currently, the Trust expects the risk of loss to be remote.
2. Shares of Beneficial Interest
At June 30, 2018, there were an unlimited number of shares authorized (without par value). Transactions in the Fund’s shares were as follows:
Six Months Ended June 30, 2018 | Year Ended December 31, 2017 | |||||||||||||||||||
| Shares | Amount | Shares | Amount | |||||||||||||||||
| Class 1 Shares: | ||||||||||||||||||||
Shares sold | 167,630 | $ | 4,898,014 | 968,022 | $ | 25,981,840 | ||||||||||||||
Shares issued in reinvestment of distributions | 481,210 | 13,329,515 | 394,680 | 10,399,801 | ||||||||||||||||
Shares redeemed | (1,548,584 | ) | (45,245,884 | ) | (1,064,640 | ) | (28,889,145 | ) | ||||||||||||
|
| |||||||||||||||||||
Net increase (decrease) | (899,744 | ) | $ | (27,018,355 | ) | 298,062 | $ | 7,492,496 | ||||||||||||
|
| |||||||||||||||||||
| Class 2 Shares: | ||||||||||||||||||||
Shares sold | 1,584,292 | $ | 44,398,614 | 2,058,817 | $ | 54,342,881 | ||||||||||||||
Shares issued in reinvestment of distributions | 4,293,175 | 115,786,938 | 3,163,923 | 81,344,467 | ||||||||||||||||
Shares redeemed | (5,148,403 | ) | (144,747,897 | ) | (9,039,170 | ) | (239,099,157 | ) | ||||||||||||
|
| |||||||||||||||||||
Net increase (decrease) | 729,064 | $ | 15,437,655 | (3,816,430 | ) | $ | (103,411,809 | ) | ||||||||||||
|
| |||||||||||||||||||
| Class 4 Shares: | ||||||||||||||||||||
Shares sold | 98,799 | $ | 2,785,841 | 269,622 | $ | 7,129,389 | ||||||||||||||
Shares issued in reinvestment of distributions | 95,123 | 2,574,964 | 63,379 | 1,635,173 | ||||||||||||||||
Shares redeemed | (145,855 | ) | (4,120,210 | ) | (201,530 | ) | (5,299,363 | ) | ||||||||||||
|
| |||||||||||||||||||
Net increase (decrease) | 48,067 | $ | 1,240,595 | 131,471 | $ | 3,465,199 | ||||||||||||||
|
| |||||||||||||||||||
| Semiannual Report | FRD-17 | |||
FRANKLIN TEMPLETON VARIABLE INSURANCE PRODUCTS TRUST
NOTES TO FINANCIAL STATEMENTS (UNAUDITED)
Franklin Rising Dividends VIP Fund (continued)
3. Transactions with Affiliates
Franklin Resources, Inc. is the holding company for various subsidiaries that together are referred to as Franklin Templeton Investments. Certain officers and trustees of the Fund are also officers and/or directors of the following subsidiaries:
| Subsidiary | Affiliation | |
Franklin Advisers, Inc. (Advisers) | Investment manager | |
Franklin Templeton Services, LLC (FT Services) | Administrative manager | |
Franklin Templeton Distributors, Inc. (Distributors) | Principal underwriter | |
Franklin Templeton Investor Services, LLC (Investor Services) | Transfer agent |
a. Management Fees
The Fund pays an investment management fee to Advisers based on the average daily net assets of the Fund as follows:
| Annualized Fee Rate | Net Assets | |
0.750% | Up to and including $500 million | |
0.625% | Over $500 million, up to and including $1 billion | |
0.500% | Over $1 billion, up to and including $5 billion | |
0.490% | In excess of $5 billion |
For the period ended June 30, 2018, the annualized gross effective investment management fee rate was 0.603% of the Fund’s average daily net assets.
b. Administrative Fees
Under an agreement with Advisers, FT Services provides administrative services to the Fund. The fee is paid by Advisers based on the Fund’s average daily net assets, and is not an additional expense of the Fund.
c. Distribution Fees
The Board has adopted distribution plans for Class 2 and Class 4 shares pursuant to Rule 12b-1 under the 1940 Act. Under the Fund’s compensation distribution plans, the Fund pays Distributors for costs incurred in connection with the servicing, sale and distribution of the Fund’s shares up to 0.35% per year of its average daily net assets of each class. The Board has agreed to limit the current rate to 0.25% per year for Class 2. The plan year, for purposes of monitoring compliance with the maximum annual plan rates, is February 1 through January 31.
d. Transfer Agent Fees
Investor Services, under terms of an agreement, performs shareholder servicing for the Fund and is not paid by the Fund for the services.
| FRD-18 | Semiannual Report | |||
FRANKLIN TEMPLETON VARIABLE INSURANCE PRODUCTS TRUST
NOTES TO FINANCIAL STATEMENTS (UNAUDITED)
Franklin Rising Dividends VIP Fund (continued)
e. Investments in Affiliated Management Investment Companies
The Fund invests in one or more affiliated management investment companies for purposes other than exercising a controlling influence over the management or policies. Management fees paid by the Fund are waived on assets invested in the affiliated management investment companies, as noted in the Statement of Operations, in an amount not to exceed the management and administrative fees paid directly or indirectly by each affiliate. Prior to January 1, 2014, the waiver was accounted for as a reduction management fees. During the period ended June 30, 2018, the Fund held investments in affiliated management investment companies as follows:
Number of Shares Held at Beginning of Period | Gross Additions | Gross Reductions | Number of Shares Held at End of Period | Value at End of Period | Dividend Income | Realized Gain (Loss) | Net Change in Unrealized Appreciation (Depreciation) | |||||||||||||||||||||||||
| Non-Controlled Affiliates | ||||||||||||||||||||||||||||||||
Institutional Fiduciary Trust Money Market Portfolio, 1.51% | 13,833,792 | 125,390,674 | (128,776,172 | ) | 10,448,294 | $ 10,448,294 | $ 96,072 | $ — | $ — | |||||||||||||||||||||||
|
| |||||||||||||||||||||||||||||||
4. Expense Offset Arrangement
The Fund has entered into an arrangement with its custodian whereby credits realized as a result of uninvested cash balances are used to reduce a portion of the Fund’s custodian expenses. During the period ended June 30, 2018, the custodian fees were reduced as noted in the Statement of Operations.
5. Income Taxes
At June 30, 2018, the cost of investments and net unrealized appreciation (depreciation) for income tax purposes were as follows:
Cost of investments | $914,292,331 | |||
|
| |||
Unrealized appreciation | $883,012,713 | |||
Unrealized depreciation | (40,996,571) | |||
|
| |||
Net unrealized appreciation (depreciation) | $842,016,142 | |||
|
| |||
Differences between income and/or capital gains as determined on a book basis and a tax basis are primarily due to differing treatment of corporate actions.
6. Investment Transactions
Purchases and sales of investments (excluding short term securities) for the period ended June 30, 2018, aggregated $33,348,897 and $154,824,663, respectively.
7. Credit Facility
The Fund, together with other U.S. registered and foreign investment funds (collectively, Borrowers), managed by Franklin Templeton Investments, are borrowers in a joint syndicated senior unsecured credit facility totaling $2 billion (Global Credit Facility) which matures on February 8, 2019. This Global Credit Facility provides a source of funds to the Borrowers for temporary and emergency purposes, including the ability to meet future unanticipated or unusually large redemption requests.
| Semiannual Report | FRD-19 | |||
FRANKLIN TEMPLETON VARIABLE INSURANCE PRODUCTS TRUST
NOTES TO FINANCIAL STATEMENTS (UNAUDITED)
Franklin Rising Dividends VIP Fund (continued)
7. Credit Facility (continued)
Under the terms of the Global Credit Facility, the Fund shall, in addition to interest charged on any borrowings made by the Fund and other costs incurred by the Fund, pay its share of fees and expenses incurred in connection with the implementation and maintenance of the Global Credit Facility, based upon its relative share of the aggregate net assets of all of the Borrowers, including an annual commitment fee of 0.15% based upon the unused portion of the Global Credit Facility. These fees are reflected in other expenses in the Statement of Operations. During the period ended June 30, 2018, the Fund did not use the Global Credit Facility.
8. Fair Value Measurements
The Fund follows a fair value hierarchy that distinguishes between market data obtained from independent sources (observable inputs) and the Fund’s own market assumptions (unobservable inputs). These inputs are used in determining the value of the Fund’s financial instruments and are summarized in the following fair value hierarchy:
| • | Level 1 – quoted prices in active markets for identical financial instruments |
| • | Level 2 – other significant observable inputs (including quoted prices for similar financial instruments, interest rates, prepayment speed, credit risk, etc.) |
| • | Level 3 – significant unobservable inputs (including the Fund’s own assumptions in determining the fair value of financial instruments) |
The input levels are not necessarily an indication of the risk or liquidity associated with financial instruments at that level.
For movements between the levels within the fair value hierarchy, the Fund has adopted a policy of recognizing the transfers as of the date of the underlying event which caused the movement.
At June 30, 2018, all of the Fund’s investments in financial instruments carried at fair value were valued using Level 1 inputs. For detailed categories, see the accompanying Statement of Investments.
9. Subsequent Events
The Fund has evaluated subsequent events through the issuance of the financial statements and determined that no events have occurred that require disclosure.
Abbreviations
Selected Portfolio
ADR American Depositary Receipt
| FRD-20 | Semiannual Report | |||
Franklin Small Cap Value VIP Fund
This semiannual report for Franklin Small Cap Value VIP Fund covers the period ended June 30, 2018.
Class 2 Performance Summary as of June 30, 2018
The Fund’s Class 2 Shares posted a +2.34% total return* for the six-month period ended June 30, 2018.
*The Fund has a fee waiver associated with any investment it makes in a Franklin Templeton money fund and/or other Franklin Templeton fund, contractually guaranteed through 4/30/19. Fund investment results reflect the fee waiver; without this waiver, the results would have been lower.
Performance reflects the Fund’s Class 2 operating expenses, but does not include any contract fees, expenses or sales charges. If they had been included, performance would be lower. These charges and deductions, particularly for variable life policies, can have a significant effect on contract values and insurance benefits. See the contract prospectus for a complete description of these expenses, including sales charges.
Performance data represent past performance, which does not guarantee future results. Investment return and principal value will fluctuate, and you may have a gain or loss when you sell your shares. Current performance may differ from figures shown.
| Semiannual Report | FSV-1 | |||
FRANKLIN SMALL CAP VALUE VIP FUND
Fund Goal and Main Investments
The Fund seeks long-term total return. Under normal market conditions, the Fund invests at least 80% of its net assets in investments of small capitalization companies. For this Fund, small capitalization companies are those with market capitalizations not exceeding either the highest market capitalization in the Russell 2000® Index or the 12-month average of the highest market capitalization in the Russell 2000® Index, whichever is greater, at the time of purchase. The Fund generally invests in equity securities of companies that the manager believes are undervalued at the time of purchase and have the potential for capital appreciation.
Fund Risks
All investments involve risks, including possible loss of principal. Value securities may not increase in price as anticipated, or may decline further in value. The Fund’s investments in smaller company stocks carry special risks as such stocks have historically exhibited greater price volatility than large-company stocks, particularly over the short term. Additionally, smaller companies often have relatively small revenues, limited product lines and a small market share. In addition, the Fund may invest up to 25% of its total assets in foreign securities, which involve special risks, including currency fluctuations and economic and political uncertainty. The Fund also may invest in equity real estate investment trusts (REITs). The Fund is actively managed but there is no guarantee that the manager’s investment decisions will produce the desired results. The Fund’s prospectus also includes a description of the main investment risks.
Performance Overview
You can find the Fund’s six-month total return in the Performance Summary. In comparison, the Russell 2000® Value Index posted a +5.44% total return for the same period.1 Please note the Fund employs a bottom-up stock selection process, and the managers invest in securities without regard to benchmark comparisons.
Economic and Market Overview
The US economy continued to grow during the six months under review. After moderating for three consecutive quarters, the economy grew faster in 2018’s second quarter, driven by
consumer spending, exports, business investment and government spending. The manufacturing and services sectors expanded during the period. The unemployment rate declined slightly from 4.1% in December 2017, as reported at the beginning of the six-month period, to 4.0% at period-end.2 Annual inflation, as measured by the Consumer Price Index, increased from 2.1% in December 2017, as reported at the beginning of the period, to 2.9% at period-end.2
In February 2018, the new US Federal Reserve (Fed) Chair Jerome Powell spoke before Congress for the first time and indicated the Fed saw signs of a continued strong labor market and economic growth. He reiterated the Fed’s intention to gradually raise interest rates in an effort to keep the economy from overheating and as inflation increases toward the Fed’s target. However, he noted there was no evidence of the economy overheating and he had yet to see a clear upward move in wages. The Fed raised its target range for the federal funds rate 0.25% each at its March and June 2018 meetings to 1.75%–2.00% and continued reducing its balance sheet as part of its ongoing plan to normalize monetary policy. In June, the Fed upgraded its economic forecast for 2018 and its inflation forecasts for 2018 and 2019. Furthermore, the Fed forecasted an additional rate hike for 2018 and 2019 than previously anticipated.
US equity markets rose overall during the period, benefiting from mostly upbeat economic data and better US corporate earnings. At certain points during the period, markets were also supported by the expectations of gradual rate increases. After reaching new all-time highs in January 2018, US stocks declined in February amid concerns that strong economic growth and rising inflation would lead the Fed to increase its target rate faster than expected. In March, markets were pressured further by a broad sell-off in information technology stocks due to a potential for tighter regulation in the sector arising from concerns about consumer data privacy. Other factors that curbed investor sentiment included tensions between the US and North Korea, political uncertainties in the US, the Trump administration’s protectionist policies and escalating trade tensions between the US and China. An overall easing of tensions in the Korean peninsula and intermittent US-China trade negotiations partially offset some of these concerns. However, US trade disputes with its allies and China near period-end dampened investor sentiment. In this
1. Source: Morningstar. One cannot invest directly in an index, and an index is not representative of the Fund’s portfolio. Please see Index Descriptions following the Fund Summaries.
2. Source: Bureau of Labor Statistics.
The dollar value, number of shares or principal amount, and names of all portfolio holdings are listed in the Fund’s Statement of Investments (SOI).
| FSV-2 | Semiannual Report | |||
FRANKLIN SMALL CAP VALUE VIP FUND
environment, the broad US stock market, as measured by the Standard & Poor’s® 500 Index, generated a +2.65% total return for the period.1
Investment Strategy
We generally invest in stocks that we believe are undervalued and have the potential for capital appreciation. We consider a stock price a “value” when it trades at less than the price at which we believe it would trade if the market reflected all factors relating to the company’s worth. Accordingly, we invest in companies that we believe have, for example, stock prices that are low relative to current or historical or future earnings, book value, cash flow or sales; recent sharp price declines but the potential for good long-term earnings prospects; and valuable intangibles not reflected in the stock price. Companies in which we may invest include those that may be considered out of favor, due to actual or perceived cyclical or secular challenges, are experiencing temporal setbacks, diminished expectations, mismanagement or undermanagement, or are financially stressed.
Manager’s Discussion
For the period ended June 30, 2018, some contributors to absolute Fund performance included Hunting, McGrath RentCorp and Brinker International.
Shares of Hunting, an equipment provider for onshore and offshore well construction, completion and intervention services, rose with the price of crude oil. In addition, the stock price benefited from a better-than-expected trading update in March 2018 as robust onshore drilling activity in the US boosted Hunting’s well-completion business segment. Profits for full-year 2017 were expected to be minimal due to continued weakness in its offshore end markets, but Hunting’s results released in March indicated a better performance in the second half of 2017 and positive momentum entering 2018. Given the improvement in its operating results, Hunting also was able to loosen covenant restrictions placed on it by its lenders, allowing for the potential resumption of dividends in the future.
McGrath RentCorp, which rents relocatable modular offices and classrooms, electronic test equipment and oil storage tanks, performed well during the period. The stock reacted favorably to improving rental rates across all three business segments, which resulted in improved operating profit margins and earnings per share. The company benefited from improving utilization levels in electronic test equipment and oil storage tanks; the latter had been hampered by the decline in oil prices and on-shore drilling activity following the 2014 decline in oil
Portfolio Composition
Based on Total Net Assets as of 6/30/18
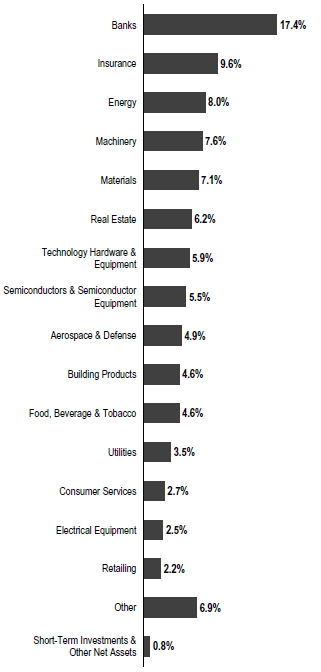
prices. Additional positive factors were new management invoking improved capital discipline in an effort to increase return on invested capital and free cash flow generation, along with a material decline in McGrath’s tax rate from the recently enacted Tax Cuts and Jobs Act.
Restaurant stocks, including Brinker International, rose due to signs of further improvement in sales as a healthier labor market and US income tax cuts resulted in greater levels of
| Semiannual Report | FSV-3 | |||
FRANKLIN SMALL CAP VALUE VIP FUND
Top 10 Holdings
6/30/18
Company Sector/Industry | % of Total Net Assets | |||
Chemical Financial Corp. Banks | 3.1% | |||
Energen Corp. Energy | 2.9% | |||
The Hanover Insurance Group Inc. Insurance | 2.8% | |||
Columbia Banking System Inc. Banks | 2.8% | |||
First Horizon National Corp. Banks | 2.8% | |||
Old Republic International Corp. Insurance | 2.7% | |||
Brinker International Inc. Consumer Services | 2.7% | |||
Astec Industries Inc. Machinery | 2.5% | |||
Zebra Technologies Corp. Technology Hardware & Equipment | 2.4% | |||
Maple Leaf Foods Inc. Food, Beverage & Tobacco | 2.3% | |||
consumer confidence. In the case of Brinker, a revamped menu and focus on driving increased traffic through quality and value offerings helped to improve same-store sales trends to the highest levels since 2015. Although same-store sales on a year-over-year basis remained slightly negative, we are optimistic that a return to positive trends could occur in the near future. Furthermore, the company has stated its intention to utilize some of the benefits from corporate tax reform to remodel a significant number of restaurants.
Detractors from absolute Fund performance included Manitowoc, Thor Industries and Detour Gold3.
Manitowoc, which is a manufacturer of cranes, underperformed during the period due to investor concerns that higher steel prices could suppress margins. The focus on steel prices overshadowed Manitowoc’s third consecutive quarter of year-over-year revenue growth and fourth consecutive quarter of year-over-year new order growth. We believe the new management team’s decision to significantly reduce excess capacity, coupled with price increases and an improved demand cycle for cranes, could help offset the impact of higher steel prices.
Thor Industries, a leading original equipment manufacturer of recreational vehicles (RVs) saw its shares decline due to investor concerns about growing inventory levels among its dealership customers stemming from slower-than-expected sales, as well as rising steel and aluminum costs. We believe that earlier-than-normal ordering patterns by RV dealers, coupled with poor weather conditions that delayed the start of the selling season in some areas, were negative factors. However, sales in warmer weather states outperformed other regions, indicating an otherwise healthy demand environment. Nonetheless, we believe it will take some time for the industry to adjust to the elevated level of inventories and take appropriate measures to offset the increase in costs.
Detour Gold, a gold mining company with assets located in Ontario, Canada, was hurt by an unexpected structural increase in mining costs, which caused a reduction in Detour’s net asset value. As a result, we exited the position during the period.
During the reporting period, we added some new positions with the largest purchases including Carpenter Technology, a producer and distributor of premium specialty alloys; Retail Properties of America, a real estate investment trust that owns and manages shopping centers; and Synaptics, a developer of human interface hardware and software. We added to existing positions in Regal Beloit, a manufacturer of electric motors; Esterline Technologies, a specialized manufacturing company serving the aerospace and defense markets; and Caleres, a footwear company that owns and operates a variety of footwear brands. Conversely, we exited some positions including BRP and Pinnacle Financial Partners. We also reduced our positions in Spirit Airlines, Universal Forest Products and Simpson Manufacturing.
Thank you for your participation in Franklin Small Cap Value VIP Fund. We look forward to serving your future investment needs.
3. Not held at period-end.
| FSV-4 | Semiannual Report | |||
FRANKLIN SMALL CAP VALUE VIP FUND
The foregoing information reflects our analysis, opinions and portfolio holdings as of June 30, 2018, the end of the reporting period. The way we implement our main investment strategies and the resulting portfolio holdings may change depending on factors such as market and economic conditions. These opinions may not be relied upon as investment advice or an offer for a particular security. The information is not a complete analysis of every aspect of any market, country, industry, security or the Fund. Statements of fact are from sources considered reliable, but the investment manager makes no representation or warranty as to their completeness or accuracy. Although historical performance is no guarantee of future results, these insights may help you understand our investment management philosophy.
| Semiannual Report | FSV-5 | |||
FRANKLIN SMALL CAP VALUE VIP FUND
Class 2 Fund Expenses
As an investor in a variable insurance contract (Contract) that indirectly provides for investment in an underlying mutual fund, you can incur transaction and/or ongoing expenses at both the Fund level and the Contract Level: (1) transaction expenses can include sales charges (loads) on purchases, surrender fees, transfer fees and premium taxes; and (2) ongoing expenses can include management fees, distribution and service (12b-1) fees, contract fees, annual maintenance fees, mortality and expense risk fees and other fees and expenses. All mutual funds and Contracts have some types of ongoing expenses. The table below shows Fund-level ongoing expenses and can help you understand these costs and compare them with those of other mutual funds offered through the Contract. The table assumes a $1,000 investment held for the six months indicated. Please refer to the Fund prospectus for additional information on operating expenses.
Actual Fund Expenses
The table below provides information about the actual account values and actual expenses in the columns under the heading “Actual.” In these columns the Fund’s actual return, which includes the effect of ongoing Fund expenses but does not include the effect of ongoing Contract expenses, is used to calculate the “Ending Account Value.” You can estimate the Fund-level expenses you paid during the period by following these steps (of course, your account value and expenses will differ from those in this illustration): Divide your account value by $1,000 (if your account had an $8,600 value, then $8,600 ÷ $1,000 = 8.6). Then multiply the result by the number under the headings “Actual” and “Fund-Level Expenses Paid During Period” (if Fund-Level Expenses Paid During Period were $ 7.50, then 8.6 x $ 7.50 = $64.50). In this illustration, the estimated expenses paid this period at the Fund level are $64.50.
Hypothetical Example for Comparison with Other Mutual Funds
Under the heading “Hypothetical” in the table, information is provided about hypothetical account values and hypothetical expenses based on the Fund’s actual expense ratio and an assumed rate of return of 5% per year before expenses, which is not the Fund’s actual return. This information may not be used to estimate the actual ending account balance or expenses you paid for the period, but it can help you compare ongoing costs of investing in the Fund with those of other mutual funds offered through the Contract. To do so, compare this 5% hypothetical example with the 5% hypothetical examples that appear in the shareholder reports of other funds offered through the Contract.
Please note that expenses shown in the table are meant to highlight ongoing costs at the Fund level only and do not reflect any ongoing expenses at the Contract level, or transaction expenses at either the Fund or Contract levels. In addition, while the Fund does not have transaction expenses, if the transaction and ongoing expenses at the Contract level were included, the expenses shown below would be higher. You should consult your Contract prospectus or disclosure document for more information.
| Actual (actual return after expenses) | Hypothetical (5% annual return before expenses) | |||||||||||
Share Class | Beginning Account | Ending Account | Fund-Level Expenses Paid During | Ending Account | Fund-Level Expenses Paid During | Net Annualized Expense Ratio2 | ||||||
|
|
|
| |||||||||
Class 2 | $1,000 | $1,023.40 | $4.52 | $1,020.33 | $4.51 | 0.90% | ||||||
1. Expenses are equal to the annualized expense ratio for the six-month period as indicated above—in the far right column—multiplied by the simple average account value over the period indicated, and then multiplied by 181/365 to reflect the one-half year period.
2. Reflects expenses after fee waivers and expense reimbursements. Does not include any ongoing expenses of the Contract for which the Fund is an investment option or acquired fund fees and expenses.
| FSV-6 | Semiannual Report | |||
FRANKLIN TEMPLETON VARIABLE INSURANCE PRODUCTS TRUST
Financial Highlights
Franklin Small Cap Value VIP Fund
Six Months Ended (unaudited) | Year Ended December 31, | |||||||||||||||||||||||
| 2017 | 2016 | 2015 | 2014 | 2013 | ||||||||||||||||||||
| Class 1 | ||||||||||||||||||||||||
Per share operating performance (for a share outstanding throughout the period) | ||||||||||||||||||||||||
Net asset value, beginning of period | $20.43 | $19.93 | $18.12 | $22.81 | $24.54 | $18.58 | ||||||||||||||||||
|
| |||||||||||||||||||||||
| Income from investment operationsa: | ||||||||||||||||||||||||
Net investment incomeb | 0.11 | 0.21 | c | 0.15 | 0.21 | 0.19 | 0.19 | |||||||||||||||||
Net realized and unrealized gains (losses) | 0.43 | 1.82 | 4.79 | (1.53 | ) | 0.06 | 6.45 | |||||||||||||||||
|
| |||||||||||||||||||||||
Total from investment operations | 0.54 | 2.03 | 4.94 | (1.32 | ) | 0.25 | 6.64 | |||||||||||||||||
|
| |||||||||||||||||||||||
| Less distributions from: | ||||||||||||||||||||||||
Net investment income | (0.23 | ) | (0.15 | ) | (0.21 | ) | (0.20 | ) | (0.20 | ) | (0.32) | |||||||||||||
Net realized gains | (2.98 | ) | (1.38 | ) | (2.92 | ) | (3.17 | ) | (1.78 | ) | (0.36) | |||||||||||||
|
| |||||||||||||||||||||||
Total distributions | (3.21 | ) | (1.53 | ) | (3.13 | ) | (3.37 | ) | (1.98 | ) | (0.68) | |||||||||||||
|
| |||||||||||||||||||||||
Net asset value, end of period | $17.76 | $20.43 | $19.93 | $18.12 | $22.81 | $24.54 | ||||||||||||||||||
|
| |||||||||||||||||||||||
Total returnd | 2.42% | 10.92% | 30.54% | (7.18)% | 0.88% | 36.50% | ||||||||||||||||||
| Ratios to average net assetse | ||||||||||||||||||||||||
Expenses before waiver and payments by affiliates | 0.66% | 0.66% | 0.66% | 0.65% | 0.63% | 0.63% | ||||||||||||||||||
Expenses net of waiver and payments by affiliates | 0.65% | f | 0.65% | f | 0.64% | f | 0.64% | f | 0.63% | f,g | 0.63% | |||||||||||||
Net investment income | 1.09% | 1.06% | c | 0.84% | 1.04% | 0.82% | 0.90% | |||||||||||||||||
| Supplemental data | ||||||||||||||||||||||||
Net assets, end of period (000’s) | $49,186 | $51,245 | $47,831 | $45,897 | $57,843 | $62,408 | ||||||||||||||||||
Portfolio turnover rate | 25.36% | 33.36% | 34.60% | 27.05% | 19.45% | 10.44% | ||||||||||||||||||
aThe amount shown for a share outstanding throughout the period may not correlate with the Statement of Operations for the period due to the timing of sales and repurchases of the Fund’s shares in relation to income earned and/or fluctuating fair value of the investments of the Fund.
bBased on average daily shares outstanding.
cNet investment income per share includes approximately $0.06 per share related to income received in the form of special dividends in connection with certain Fund holdings. Excluding this amount, the ratio of net investment income to average net assets would have been 0.75%.
dTotal return does not include fees, charges or expenses imposed by the variable annuity and life insurance contracts for which Franklin Templeton Variable Insurance Products Trust serves as an underlying investment vehicle. Total return is not annualized for periods less than one year.
eRatios are annualized for periods less than one year.
fBenefit of expense reduction rounds to less than 0.01%.
gBenefit of waiver and payments by affiliates rounds to less than 0.01%.
| The accompanying notes are an integral part of these financial statements. | Semiannual Report | FSV-7 | |||||
FRANKLIN TEMPLETON VARIABLE INSURANCE PRODUCTS TRUST
FINANCIAL HIGHLIGHTS
Franklin Small Cap Value VIP Fund (continued)
Six Months Ended (unaudited) | Year Ended December 31, | |||||||||||||||||||||||
| 2017 | 2016 | 2015 | 2014 | 2013 | ||||||||||||||||||||
| Class 2 | ||||||||||||||||||||||||
Per share operating performance (for a share outstanding throughout the period) | ||||||||||||||||||||||||
Net asset value, beginning of period | $19.80 | $19.36 | $17.68 | $22.32 | $24.07 | $18.23 | ||||||||||||||||||
|
| |||||||||||||||||||||||
| Income from investment operationsa: | ||||||||||||||||||||||||
Net investment incomeb | 0.08 | 0.15 | c | 0.10 | 0.16 | 0.13 | 0.14 | |||||||||||||||||
Net realized and unrealized gains (losses) | 0.43 | 1.77 | 4.66 | (1.49 | ) | 0.05 | 6.34 | |||||||||||||||||
|
| |||||||||||||||||||||||
Total from investment operations | 0.51 | 1.92 | 4.76 | (1.33 | ) | 0.18 | 6.48 | |||||||||||||||||
|
| |||||||||||||||||||||||
| Less distributions from: | ||||||||||||||||||||||||
Net investment income | (0.18 | ) | (0.10 | ) | (0.16 | ) | (0.14 | ) | (0.15 | ) | (0.28) | |||||||||||||
Net realized gains | (2.98 | ) | (1.38 | ) | (2.92 | ) | (3.17 | ) | (1.78 | ) | (0.36) | |||||||||||||
|
| |||||||||||||||||||||||
Total distributions | (3.16 | ) | (1.48 | ) | (3.08 | ) | (3.31 | ) | (1.93 | ) | (0.64) | |||||||||||||
|
| |||||||||||||||||||||||
Net asset value, end of period | $17.15 | $19.80 | $19.36 | $17.68 | $22.32 | $24.07 | ||||||||||||||||||
|
| |||||||||||||||||||||||
Total returnd | 2.34% | 10.65% | 30.19% | (7.39)% | 0.57% | 36.24% | ||||||||||||||||||
| Ratios to average net assetse | ||||||||||||||||||||||||
Expenses before waiver and payments by affiliates | 0.91% | 0.91% | 0.91% | 0.90% | 0.88% | 0.88% | ||||||||||||||||||
Expenses net of waiver and payments by affiliates | 0.90% | f | 0.90% | f | 0.89% | f | 0.89% | f | 0.88% | f,g | 0.88% | |||||||||||||
Net investment income | 0.84% | 0.81% | c | 0.59% | 0.79% | 0.57% | 0.65% | |||||||||||||||||
| Supplemental data | ||||||||||||||||||||||||
Net assets, end of period (000’s) | $1,235,065 | $1,302,055 | $1,366,807 | $1,172,173 | $1,445,325 | $1,606,802 | ||||||||||||||||||
Portfolio turnover rate | 25.36% | 33.36% | 34.60% | 27.05% | 19.45% | 10.44% | ||||||||||||||||||
aThe amount shown for a share outstanding throughout the period may not correlate with the Statement of Operations for the period due to the timing of sales and repurchases of the Fund’s shares in relation to income earned and/or fluctuating fair value of the investments of the Fund.
bBased on average daily shares outstanding.
cNet investment income per share includes approximately $0.06 per share related to income received in the form of special dividends in connection with certain Fund holdings. Excluding this amount, the ratio of net investment income to average net assets would have been 0.50%.
dTotal return does not include fees, charges or expenses imposed by the variable annuity and life insurance contracts for which Franklin Templeton Variable Insurance Products Trust serves as an underlying investment vehicle. Total return is not annualized for periods less than one year.
eRatios are annualized for periods less than one year.
fBenefit of expense reduction rounds to less than 0.01%.
gBenefit of waiver and payments by affiliates rounds to less than 0.01%.
| FSV-8 | Semiannual Report | The accompanying notes are an integral part of these financial statements. | |||
FRANKLIN TEMPLETON VARIABLE INSURANCE PRODUCTS TRUST
FINANCIAL HIGHLIGHTS
Franklin Small Cap Value VIP Fund (continued)
Six Months Ended (unaudited) | Year Ended December 31, | |||||||||||||||||||||||
| 2017 | 2016 | 2015 | 2014 | 2013 | ||||||||||||||||||||
| Class 4 | ||||||||||||||||||||||||
Per share operating performance (for a share outstanding throughout the period) | ||||||||||||||||||||||||
Net asset value, beginning of period | $20.22 | $19.74 | $17.96 | $22.63 | $24.37 | $18.44 | ||||||||||||||||||
| Income from investment operationsa: | ||||||||||||||||||||||||
Net investment incomeb | 0.07 | 0.14 | c | 0.09 | 0.14 | 0.11 | 0.12 | |||||||||||||||||
Net realized and unrealized gains (losses) | 0.42 | 1.81 | 4.75 | (1.52 | ) | 0.05 | 6.42 | |||||||||||||||||
Total from investment operations | 0.49 | 1.95 | 4.84 | (1.38 | ) | 0.16 | 6.54 | |||||||||||||||||
| Less distributions from: | ||||||||||||||||||||||||
Net investment income | (0.15 | ) | (0.09 | ) | (0.14 | ) | (0.12 | ) | (0.12 | ) | (0.25 | ) | ||||||||||||
Net realized gains | (2.98 | ) | (1.38 | ) | (2.92 | ) | (3.17 | ) | (1.78 | ) | (0.36 | ) | ||||||||||||
Total distributions | (3.13 | ) | (1.47 | ) | (3.06 | ) | (3.29 | ) | (1.90 | ) | (0.61 | ) | ||||||||||||
Net asset value, end of period | $17.58 | $20.22 | $19.74 | $17.96 | $22.63 | $24.37 | ||||||||||||||||||
Total returnd | 2.23% | 10.56% | 30.12% | (7.52)% | 0.48% | 36.12% | ||||||||||||||||||
| Ratios to average net assetse | ||||||||||||||||||||||||
Expenses before waiver and payments by affiliates | 1.01% | 1.01% | 1.01% | 1.00% | 0.98% | 0.98% | ||||||||||||||||||
Expenses net of waiver and payments by affiliates | 1.00% | f | 1.00% | f | 0.99% | f | 0.99% | f | 0.98% | f,g | 0.98% | |||||||||||||
Net investment income | 0.74% | 0.71%c | 0.49% | 0.69% | 0.47% | 0.55% | ||||||||||||||||||
| Supplemental data | ||||||||||||||||||||||||
Net assets, end of period (000’s) | $29,920 | $32,053 | $32,751 | $26,128 | $30,452 | $35,936 | ||||||||||||||||||
Portfolio turnover rate | 25.36% | 33.36% | 34.60% | 27.05% | 19.45% | 10.44% | ||||||||||||||||||
aThe amount shown for a share outstanding throughout the period may not correlate with the Statement of Operations for the period due to the timing of sales and repurchases of the Fund’s shares in relation to income earned and/or fluctuating fair value of the investments of the Fund.
bBased on average daily shares outstanding.
cNet investment income per share includes approximately $0.06 per share related to income received in the form of special dividends in connection with certain Fund holdings. Excluding this amount, the ratio of net investment income to average net assets would have been 0.40%.
dTotal return does not include fees, charges or expenses imposed by the variable annuity and life insurance contracts for which Franklin Templeton Variable Insurance Products Trust serves as an underlying investment vehicle. Total return is not annualized for periods less than one year.
eRatios are annualized for periods less than one year.
fBenefit of expense reduction rounds to less than 0.01%.
gBenefit of waiver and payments by affiliates rounds to less than 0.01%.
| The accompanying notes are an integral part of these financial statements. | Semiannual Report | FSV-9 | |||||
FRANKLIN TEMPLETON VARIABLE INSURANCE PRODUCTS TRUST
Statement of Investments, June 30, 2018 (unaudited)
Franklin Small Cap Value VIP Fund
| Shares | Value | |||||
Common Stocks 98.3% | ||||||
Aerospace & Defense 4.9% | ||||||
AAR Corp. | 648,173 | $ | 30,133,563 | |||
a Esterline Technologies Corp. | 349,555 | 25,797,159 | ||||
a Wesco Aircraft Holdings Inc. | 736,087 | 8,280,978 | ||||
|
| |||||
| 64,211,700 | ||||||
|
| |||||
Automobiles & Components 1.9% | ||||||
Gentex Corp. | 36,000 | 828,720 | ||||
LCI Industries | 120,269 | 10,842,250 | ||||
Thor Industries Inc. | 129,559 | 12,617,751 | ||||
|
| |||||
| 24,288,721 | ||||||
|
| |||||
Banks 17.4% | ||||||
Access National Corp. | 244,865 | 7,003,139 | ||||
Bryn Mawr Bank Corp. | 319,083 | 14,773,543 | ||||
Chemical Financial Corp. | 722,542 | 40,223,913 | ||||
Columbia Banking System Inc. | 908,300 | 37,149,470 | ||||
First Horizon National Corp. | 2,041,037 | 36,412,100 | ||||
First of Long Island Corp. | 614,355 | 15,266,722 | ||||
German American BanCorp Inc. | 125,323 | 4,492,830 | ||||
Glacier Bancorp Inc. | 542,000 | 20,964,560 | ||||
Lakeland Financial Corp. | 551,400 | 26,571,966 | ||||
Peoples Bancorp Inc. | 289,712 | 10,945,319 | ||||
TrustCo Bank Corp. NY | 880,900 | 7,840,010 | ||||
Washington Trust BanCorp Inc. | 124,891 | 7,256,167 | ||||
|
| |||||
| 228,899,739 | ||||||
|
| |||||
Building Products 4.6% | ||||||
a Gibraltar Industries Inc. | 758,279 | 28,435,462 | ||||
Insteel Industries Inc. | 366,339 | 12,235,723 | ||||
Simpson Manufacturing Co. Inc. | 302,381 | 18,805,074 | ||||
Universal Forest Products Inc. | 17,640 | 645,977 | ||||
|
| |||||
| 60,122,236 | ||||||
|
| |||||
Commercial & Professional Services 2.0% | ||||||
a Huron Consulting Group Inc. | 48,106 | 1,967,536 | ||||
McGrath RentCorp | 318,789 | 20,169,780 | ||||
a Team Inc. | 192,222 | 4,440,328 | ||||
|
| |||||
| 26,577,644 | ||||||
|
| |||||
Construction & Engineering 0.2% | ||||||
EMCOR Group Inc. | 42,134 | 3,209,768 | ||||
|
| |||||
Consumer Durables & Apparel 0.4% | ||||||
La-Z-Boy Inc. | 49,100 | 1,502,460 | ||||
a M/I Homes Inc. | 126,339 | 3,345,457 | ||||
|
| |||||
| 4,847,917 | ||||||
|
| |||||
Consumer Services 2.7% | ||||||
Brinker International Inc. | 736,240 | 35,045,024 | ||||
|
| |||||
Electrical Equipment 2.5% | ||||||
Encore Wire Corp. | 75,262 | 3,571,182 | ||||
Regal Beloit Corp. | 354,000 | 28,957,200 | ||||
|
| |||||
| 32,528,382 | ||||||
|
| |||||
| FSV-10 | Semiannual Report | |||
FRANKLIN TEMPLETON VARIABLE INSURANCE PRODUCTS TRUST
STATEMENT OF INVESTMENTS (UNAUDITED)
Franklin Small Cap Value VIP Fund (continued)
| Shares | Value | |||||||||
Common Stocks (continued) | ||||||||||
Energy 7.3% | ||||||||||
a Energen Corp. | 518,707 | $ | 37,772,244 | |||||||
a Hunting PLC (United Kingdom) | 2,714,839 | 27,821,278 | ||||||||
a Natural Gas Services Group Inc. | 173,987 | 4,106,093 | ||||||||
a Oil States International Inc. | 804,623 | 25,828,398 | ||||||||
|
| |||||||||
| 95,528,013 | ||||||||||
|
| |||||||||
Food, Beverage & Tobacco 4.6% | ||||||||||
Dairy Crest Group PLC (United Kingdom) | 2,549,200 | 16,529,384 | ||||||||
a Landec Corp. | 848,600 | 12,644,140 | ||||||||
Maple Leaf Foods Inc. (Canada) | 1,213,649 | 30,696,768 | ||||||||
|
| |||||||||
| 59,870,292 | ||||||||||
|
| |||||||||
Health Care Equipment & Services 1.2% | ||||||||||
Hill-Rom Holdings Inc. | 90,101 | 7,869,421 | ||||||||
STERIS PLC | 78,750 | 8,269,538 | ||||||||
|
| |||||||||
| 16,138,959 | ||||||||||
|
| |||||||||
Industrial Conglomerates 0.5% | ||||||||||
Carlisle Cos. Inc. | 66,400 | 7,191,784 | ||||||||
|
| |||||||||
Insurance 9.6% | ||||||||||
Aspen Insurance Holdings Ltd. | 86,800 | 3,532,760 | ||||||||
The Hanover Insurance Group Inc. | 314,100 | 37,553,796 | ||||||||
Horace Mann Educators Corp. | 589,548 | 26,293,841 | ||||||||
Old Republic International Corp. | 1,789,700 | 35,632,927 | ||||||||
Validus Holdings Ltd. | 346,300 | 23,409,880 | ||||||||
|
| |||||||||
| 126,423,204 | ||||||||||
|
| |||||||||
Machinery 7.4% | ||||||||||
Astec Industries Inc. | 554,150 | 33,138,170 | ||||||||
Federal Signal Corp. | 295,697 | 6,886,783 | ||||||||
Kennametal Inc. | 66,836 | 2,399,412 | ||||||||
a The Manitowoc Co. Inc. | 126,744 | 3,277,600 | ||||||||
Mueller Industries Inc. | 352,800 | 10,411,128 | ||||||||
Mueller Water Products Inc., A | 2,159,000 | 25,303,480 | ||||||||
REV Group Inc. | 400,761 | 6,816,945 | ||||||||
Titan International Inc. | 789,683 | 8,473,299 | ||||||||
|
| |||||||||
| 96,706,817 | ||||||||||
|
| |||||||||
Materials 7.1% | ||||||||||
A Schulman Inc. | 167,228 | 7,441,646 | ||||||||
Carpenter Technology Corp. | 369,424 | 19,420,620 | ||||||||
a Ingevity Corp. | 145,500 | 11,765,130 | ||||||||
Minerals Technologies Inc. | 314,052 | 23,663,818 | ||||||||
OceanaGold Corp. (Australia) | 5,258,900 | 14,605,832 | ||||||||
PH Glatfelter Co. | 128,479 | 2,516,904 | ||||||||
Reliance Steel & Aluminum Co. | 159,330 | 13,947,748 | ||||||||
|
| |||||||||
| 93,361,698 | ||||||||||
|
| |||||||||
Pharmaceuticals, Biotechnology & Life Sciences 0.3% | ||||||||||
a Cambrex Corp. | 65,017 | 3,400,389 | ||||||||
|
| |||||||||
Real Estate 6.2% | ||||||||||
Brandywine Realty Trust | 1,087,000 | 18,348,560 | ||||||||
Highwoods Properties Inc. | 336,600 | 17,075,718 | ||||||||
LTC Properties Inc. | 319,555 | 13,657,781 | ||||||||
| Semiannual Report | FSV-11 | |||||
FRANKLIN TEMPLETON VARIABLE INSURANCE PRODUCTS TRUST
STATEMENT OF INVESTMENTS (UNAUDITED)
Franklin Small Cap Value VIP Fund (continued)
| Shares | Value | |||||||||
Common Stocks (continued) | ||||||||||
Real Estate (continued) | ||||||||||
Retail Properties of America Inc., A | 1,475,211 | $ | 18,853,196 | |||||||
Sunstone Hotel Investors Inc. | 837,097 | 13,912,552 | ||||||||
|
| |||||||||
| 81,847,807 | ||||||||||
|
| |||||||||
Retailing 2.2% | ||||||||||
Caleres Inc. | 844,245 | 29,033,586 | ||||||||
|
| |||||||||
Semiconductors & Semiconductor Equipment 5.5% | ||||||||||
a Advanced Energy Industries Inc. | 257,800 | 14,975,602 | ||||||||
Cohu Inc. | 396,917 | 9,728,436 | ||||||||
Kulicke and Soffa Industries Inc. (Singapore) | 292,500 | 6,967,350 | ||||||||
MKS Instruments Inc. | 26,993 | 2,583,230 | ||||||||
a Synaptics Inc. | 383,400 | 19,311,858 | ||||||||
Versum Materials Inc. | 507,679 | 18,860,275 | ||||||||
|
| |||||||||
| 72,426,751 | ||||||||||
|
| |||||||||
Technology Hardware & Equipment 5.9% | ||||||||||
a Coherent Inc. | 42,508 | 6,649,101 | ||||||||
a Finisar Corp. | 737,700 | 13,278,600 | ||||||||
a Plexus Corp. | 440,774 | 26,243,684 | ||||||||
a Zebra Technologies Corp., A | 217,200 | 31,113,900 | ||||||||
|
| |||||||||
| 77,285,285 | ||||||||||
|
| |||||||||
Transportation 0.4% | ||||||||||
Heartland Express Inc. | 273,486 | 5,073,165 | ||||||||
a Spirit Airlines Inc. | 18,400 | 668,840 | ||||||||
|
| |||||||||
| 5,742,005 | ||||||||||
|
| |||||||||
Utilities 3.5% | ||||||||||
Black Hills Corp. | 249,400 | 15,265,774 | ||||||||
Connecticut Water Service Inc. | 47,200 | 3,083,104 | ||||||||
IDACORP Inc. | 117,289 | 10,818,737 | ||||||||
Spire Inc. | 243,155 | 17,178,901 | ||||||||
|
| |||||||||
| 46,346,516 | ||||||||||
|
| |||||||||
Total Common Stocks (Cost $987,494,965) | 1,291,034,237 | |||||||||
|
| |||||||||
| Principal Amount | ||||||||||
Corporate Bonds 0.9% | ||||||||||
Energy 0.7% | ||||||||||
Unit Corp., senior sub. note, 6.625%, 5/15/21 | $ | 9,632,000 | 9,656,080 | |||||||
|
| |||||||||
Machinery 0.2% | ||||||||||
Mueller Industries Inc., sub. bond, 6.00%, 3/01/27 | 2,378,000 | 2,342,330 | ||||||||
|
| |||||||||
Total Corporate Bonds (Cost $11,671,222) | 11,998,410 | |||||||||
|
| |||||||||
Total Investments before Short Term Investments (Cost $999,166,187) | 1,303,032,647 | |||||||||
|
| |||||||||
| FSV-12 | Semiannual Report | |||
FRANKLIN TEMPLETON VARIABLE INSURANCE PRODUCTS TRUST
STATEMENT OF INVESTMENTS (UNAUDITED)
Franklin Small Cap Value VIP Fund (continued)
| Shares | Value | |||||||||
Short Term Investments (Cost $18,863,400) 1.4% | ||||||||||
Money Market Funds 1.4% | ||||||||||
b,c Institutional Fiduciary Trust Money Market Portfolio, 1.51% | 18,863,400 | $ | 18,863,400 | |||||||
|
| |||||||||
Total Investments (Cost $1,018,029,587) 100.6% | 1,321,896,047 | |||||||||
Other Assets, less Liabilities (0.6)% | (7,725,045 | ) | ||||||||
|
| |||||||||
Net Assets 100.0% | $ | 1,314,171,002 | ||||||||
|
| |||||||||
aNon-income producing.
bSee Note 3(e) regarding investments in affiliated management investment companies.
cThe rate shown is the annualized seven-day effective yield at period end.
| The accompanying notes are an integral part of these financial statements. | Semiannual Report | FSV-13 | |||||
FRANKLIN TEMPLETON VARIABLE INSURANCE PRODUCTS TRUST
Financial Statements
Statement of Assets and Liabilities
June 30, 2018 (unaudited)
Franklin Small VIP Fund | ||||
Assets: | ||||
Investments in securities: | ||||
Cost - Unaffiliated issuers | $ 999,166,187 | |||
Cost - Non-controlled affiliates (Note 3e) | 18,863,400 | |||
|
| |||
Value - Unaffiliated issuers | $1,303,032,647 | |||
Value - Non-controlled affiliates (Note 3e) | 18,863,400 | |||
Receivables: | ||||
Investment securities sold | 919,393 | |||
Capital shares sold | 59,828 | |||
Dividends and interest | 1,176,839 | |||
Other assets | 881 | |||
|
| |||
Total assets | 1,324,052,988 | |||
|
| |||
Liabilities: | ||||
Payables: | ||||
Investment securities purchased | 7,011,498 | |||
Capital shares redeemed | 1,458,197 | |||
Management fees | 676,173 | |||
Distribution fees | 542,559 | |||
Accrued expenses and other liabilities | 193,559 | |||
|
| |||
Total liabilities | 9,881,986 | |||
|
| |||
Net assets, at value | $1,314,171,002 | |||
|
| |||
Net assets consist of: | ||||
Paid-in capital | $ 912,334,743 | |||
Undistributed net investment income | 6,225,475 | |||
Net unrealized appreciation (depreciation) | 303,866,460 | |||
Accumulated net realized gain (loss) | 91,744,324 | |||
|
| |||
Net assets, at value | $1,314,171,002 | |||
|
| |||
| Class 1: | ||||
Net assets, at value | $ 49,185,608 | |||
|
| |||
Shares outstanding | 2,768,982 | |||
|
| |||
Net asset value and maximum offering price per share | $17.76 | |||
|
| |||
| Class 2: | ||||
Net assets, at value | $1,235,065,499 | |||
|
| |||
Shares outstanding | 72,025,807 | |||
|
| |||
Net asset value and maximum offering price per share | $17.15 | |||
|
| |||
| Class 4: | ||||
Net assets, at value | $ 29,919,895 | |||
|
| |||
Shares outstanding | 1,701,604 | |||
|
| |||
Net asset value and maximum offering price per share | $17.58 | |||
|
| |||
| FSV-14 | Semiannual Report | The accompanying notes are an integral part of these financial statements. | |||
FRANKLIN TEMPLETON VARIABLE INSURANCE PRODUCTS TRUST
FINANCIAL STATEMENTS
Statement of Operations
for the six months ended June 30, 2018 (unaudited)
Franklin Small VIP Fund | ||||
Investment income: | ||||
Dividends: (net of foreign taxes)* | ||||
Unaffiliated issuers | $ 10,785,806 | |||
Non-controlled affiliates (Note 3e) | 333,104 | |||
Interest: | ||||
Unaffiliated issuers | 440,213 | |||
|
| |||
Total investment income | 11,559,123 | |||
|
| |||
Expenses: | ||||
Management fees (Note 3a) | 4,185,645 | |||
Distribution fees: (Note 3c) | ||||
Class 2 | 1,563,803 | |||
Class 4 | 53,336 | |||
Custodian fees (Note 4) | 9,811 | |||
Reports to shareholders | 149,953 | |||
Professional fees | 29,305 | |||
Trustees’ fees and expenses | 3,451 | |||
Other | 15,010 | |||
|
| |||
Total expenses | 6,010,314 | |||
Expense reductions (Note 4) | (69 | ) | ||
Expenses waived/paid by affiliates (Note 3e) | (98,732 | ) | ||
|
| |||
Net expenses | 5,911,513 | |||
|
| |||
Net investment income | 5,647,610 | |||
|
| |||
Realized and unrealized gains (losses): | ||||
Net realized gain (loss) from: | ||||
Investments: | ||||
Unaffiliated issuers | 93,833,160 | |||
Realized gain distributions from REITs | 680,677 | |||
Foreign currency transactions | 46,667 | |||
|
| |||
Net realized gain (loss) | 94,560,504 | |||
|
| |||
Net change in unrealized appreciation (depreciation) on: | ||||
Investments: | ||||
Unaffiliated issuers | (69,483,090 | ) | ||
Translation of other assets and liabilities denominated in foreign currencies | (4,741 | ) | ||
|
| |||
Net change in unrealized appreciation (depreciation) | (69,487,831 | ) | ||
|
| |||
Net realized and unrealized gain (loss) | 25,072,673 | |||
|
| |||
Net increase (decrease) in net assets resulting from operations | $ 30,720,283 | |||
|
| |||
*Foreign taxes withheld on dividends | $ 40,789 | |||
| The accompanying notes are an integral part of these financial statements. | Semiannual Report | FSV-15 | |||||
FRANKLIN TEMPLETON VARIABLE INSURANCE PRODUCTS TRUST
FINANCIAL STATEMENTS
Statements of Changes in Net Assets
| Franklin Small Cap Value VIP Fund | ||||||||
| Six Months Ended June 30, 2018 (unaudited) | Year Ended December 31, 2017 | |||||||
Increase (decrease) in net assets: | ||||||||
Operations: | ||||||||
Net investment income | $ 5,647,610 | $ 11,278,129 | ||||||
Net realized gain (loss) | 94,560,504 | 193,444,952 | ||||||
Net change in unrealized appreciation (depreciation) | (69,487,831 | ) | (67,851,820 | ) | ||||
|
| |||||||
Net increase (decrease) in net assets resulting from operations | 30,720,283 | 136,871,261 | ||||||
|
| |||||||
Distributions to shareholders from: | ||||||||
Net investment income: | ||||||||
Class 1 | (536,056 | ) | (357,335 | ) | ||||
Class 2 | (10,764,694 | ) | (6,657,162 | ) | ||||
Class 4 | (222,383 | ) | (135,526 | ) | ||||
Net realized gains: | ||||||||
Class 1 | (7,019,373 | ) | (3,344,066 | ) | ||||
Class 2 | (183,325,811 | ) | (91,049,189 | ) | ||||
Class 4 | (4,351,723 | ) | (2,178,640 | ) | ||||
|
| |||||||
Total distributions to shareholders | (206,220,040 | ) | (103,721,918 | ) | ||||
|
| |||||||
Capital share transactions: (Note 2) | ||||||||
Class 1 | 4,258,009 | 2,002,869 | ||||||
Class 2 | 98,310,306 | (95,665,942 | ) | |||||
Class 4 | 1,749,294 | (1,521,461 | ) | |||||
|
| |||||||
Total capital share transactions | 104,317,609 | (95,184,534 | ) | |||||
|
| |||||||
Net increase (decrease) in net assets | (71,182,148 | ) | (62,035,191 | ) | ||||
Net assets: | ||||||||
Beginning of period | 1,385,353,150 | 1,447,388,341 | ||||||
|
| |||||||
End of period | $1,314,171,002 | $1,385,353,150 | ||||||
|
| |||||||
Undistributed net investment income included in net assets: | ||||||||
End of period | $ 6,225,475 | $ 12,100,998 | ||||||
|
| |||||||
| FSV-16 | Semiannual Report | The accompanying notes are an integral part of these financial statements. | |||
FRANKLIN TEMPLETON VARIABLE INSURANCE PRODUCTS TRUST
Notes to Financial Statements (unaudited)
Franklin Small Cap Value VIP Fund
1. Organization and Significant Accounting
Policies
Franklin Templeton Variable Insurance Products Trust (Trust) is registered under the Investment Company Act of 1940 (1940 Act) as an open-end management investment company, consisting of eighteen separate funds and applies the specialized accounting and reporting guidance in U.S. Generally Accepted Accounting Principles (U.S. GAAP). Franklin Small Cap Value VIP Fund (Fund) is included in this report. Shares of the Fund are generally sold only to insurance company separate accounts to fund the benefits of variable life insurance policies or variable annuity contracts. The Fund offers three classes of shares: Class 1, Class 2 and Class 4. Each class of shares may differ by its distribution fees, voting rights on matters affecting a single class and its exchange privilege.
The following summarizes the Fund’s significant accounting policies.
a. Financial Instrument Valuation
The Fund’s investments in financial instruments are carried at fair value daily. Fair value is the price that would be received to sell an asset or paid to transfer a liability in an orderly transaction between market participants on the measurement date. The Fund calculates the net asset value (NAV) per share each business day as of 4 p.m. Eastern time or the regularly scheduled close of the New York Stock Exchange (NYSE), whichever is earlier. Under compliance policies and procedures approved by the Trust’s Board of Trustees (the Board), the Fund’s administrator has responsibility for oversight of valuation, including leading the cross-functional Valuation Committee (VC). The VC provides administration and oversight of the Fund’s valuation policies and procedures, which are approved annually by the Board. Among other things, these procedures allow the Fund to utilize independent pricing services, quotations from securities and financial instrument dealers, and other market sources to determine fair value.
Equity securities listed on an exchange or on the NASDAQ National Market System are valued at the last quoted sale price or the official closing price of the day, respectively. Foreign equity securities are valued as of the close of trading on the foreign stock exchange on which the security is primarily traded, or as of 4 p.m. Eastern time. The value is then converted into its U.S. dollar equivalent at the foreign exchange rate in effect at 4 p.m. Eastern time on the day that the value of the security is determined. Over-the-counter (OTC) securities are
valued within the range of the most recent quoted bid and ask prices. Securities that trade in multiple markets or on multiple exchanges are valued according to the broadest and most representative market. Certain equity securities are valued based upon fundamental characteristics or relationships to similar securities.
Debt securities generally trade in the OTC market rather than on a securities exchange. The Fund’s pricing services use multiple valuation techniques to determine fair value. In instances where sufficient market activity exists, the pricing services may utilize a market-based approach through which quotes from market makers are used to determine fair value. In instances where sufficient market activity may not exist or is limited, the pricing services also utilize proprietary valuation models which may consider market characteristics such as benchmark yield curves, credit spreads, estimated default rates, anticipated market interest rate volatility, coupon rates, anticipated timing of principal repayments, underlying collateral, and other unique security features in order to estimate the relevant cash flows, which are then discounted to calculate the fair value.
Investments in open-end mutual funds are valued at the closing NAV.
The Fund has procedures to determine the fair value of financial instruments for which market prices are not reliable or readily available. Under these procedures, the VC convenes on a regular basis to review such financial instruments and considers a number of factors, including significant unobservable valuation inputs, when arriving at fair value. The VC primarily employs a market-based approach which may use related or comparable assets or liabilities, recent transactions, market multiples, book values, and other relevant information for the investment to determine the fair value of the investment. An income-based valuation approach may also be used in which the anticipated future cash flows of the investment are discounted to calculate fair value. Discounts may also be applied due to the nature or duration of any restrictions on the disposition of the investments. Due to the inherent uncertainty of valuations of such investments, the fair values may differ significantly from the values that would have been used had an active market existed. The VC employs various methods for calibrating these valuation approaches including a regular review of key inputs and assumptions, transactional back-testing or disposition analysis, and reviews of any related market activity.
| Semiannual Report | FSV-17 | |||
FRANKLIN TEMPLETON VARIABLE INSURANCE PRODUCTS TRUST
NOTES TO FINANCIAL STATEMENTS (UNAUDITED)
Franklin Small Cap Value VIP Fund (continued)
1. Organization and Significant Accounting
Policies (continued)
a. Financial Instrument Valuation (continued)
Trading in securities on foreign securities stock exchanges and OTC markets may be completed before 4 p.m. Eastern time. In addition, trading in certain foreign markets may not take place on every Fund’s business day. Occasionally, events occur between the time at which trading in a foreign security is completed and 4 p.m. Eastern time that might call into question the reliability of the value of a portfolio security held by the Fund. As a result, differences may arise between the value of the Fund’s portfolio securities as determined at the foreign market close and the latest indications of value at 4 p.m. Eastern time. In order to minimize the potential for these differences, the VC monitors price movements following the close of trading in foreign stock markets through a series of country specific market proxies (such as baskets of American Depositary Receipts, futures contracts and exchange traded funds). These price movements are measured against established trigger thresholds for each specific market proxy to assist in determining if an event has occurred that may call into question the reliability of the values of the foreign securities held by the Fund. If such an event occurs, the securities may be valued using fair value procedures, which may include the use of independent pricing services.
When the last day of the reporting period is a non-business day, certain foreign markets may be open on those days that the Fund’s NAV is not calculated, which could result in differences between the value of the Fund’s portfolio securities on the last business day and the last calendar day of the reporting period. Any significant security valuation changes due to an open foreign market are adjusted and reflected by the Fund for financial reporting purposes.
b. Foreign Currency Translation
Portfolio securities and other assets and liabilities denominated in foreign currencies are translated into U.S. dollars based on the exchange rate of such currencies against U.S. dollars on the date of valuation. The Fund may enter into foreign currency exchange contracts to facilitate transactions denominated in a foreign currency. Purchases and sales of securities, income and expense items denominated in foreign currencies are translated into U.S. dollars at the exchange rate in effect on the transaction date. Portfolio securities and assets and liabilities denominated in foreign currencies contain risks that those currencies will
decline in value relative to the U.S. dollar. Occasionally, events may impact the availability or reliability of foreign exchange rates used to convert the U.S. dollar equivalent value. If such an event occurs, the foreign exchange rate will be valued at fair value using procedures established and approved by the Board.
The Fund does not separately report the effect of changes in foreign exchange rates from changes in market prices on securities held. Such changes are included in net realized and unrealized gain or loss from investments in the Statement of Operations.
Realized foreign exchange gains or losses arise from sales of foreign currencies, currency gains or losses realized between the trade and settlement dates on securities transactions and the difference between the recorded amounts of dividends, interest, and foreign withholding taxes and the U.S. dollar equivalent of the amounts actually received or paid. Net unrealized foreign exchange gains and losses arise from changes in foreign exchange rates on foreign denominated assets and liabilities other than investments in securities held at the end of the reporting period.
c. Income and Deferred Taxes
It is the Fund’s policy to qualify as a regulated investment company under the Internal Revenue Code. The Fund intends to distribute to shareholders substantially all of its taxable income and net realized gains to relieve it from federal income and if applicable, excise taxes. As a result, no provision for U.S. federal income taxes is required.
The Fund may be subject to foreign taxation related to income received, capital gains on the sale of securities and certain foreign currency transactions in the foreign jurisdictions in which it invests. Foreign taxes, if any, are recorded based on the tax regulations and rates that exist in the foreign markets in which the Fund invests. When a capital gain tax is determined to apply, the Fund records an estimated deferred tax liability in an amount that would be payable if the securities were disposed of on the valuation date.
The Fund may recognize an income tax liability related to its uncertain tax positions under U.S. GAAP when the uncertain tax position has a less than 50% probability that it will be sustained upon examination by the tax authorities based on its technical merits. As of June 30, 2018, the Fund has determined that no tax liability is required in its financial statements related to uncertain tax positions for any open tax years (or expected to
| FSV-18 | Semiannual Report | |||
FRANKLIN TEMPLETON VARIABLE INSURANCE PRODUCTS TRUST
NOTES TO FINANCIAL STATEMENTS (UNAUDITED)
Franklin Small Cap Value VIP Fund (continued)
be taken in future tax years). Open tax years are those that remain subject to examination and are based on the statute of limitations in each jurisdiction in which the Fund invests.
d. Security Transactions, Investment Income, Expenses and Distributions
Security transactions are accounted for on trade date. Realized gains and losses on security transactions are determined on a specific identification basis. Interest income and estimated expenses are accrued daily. Amortization of premium and accretion of discount on debt securities are included in interest income. Dividend income and realized gain distributions are recorded on the ex-dividend date except for certain dividends from securities where the dividend rate is not available. In such cases, the dividend is recorded as soon as the information is received by the Fund. Distributions to shareholders are recorded on the ex-dividend date. Distributable earnings are determined according to income tax regulations (tax basis) and may differ from earnings recorded in accordance with U.S. GAAP. These differences may be permanent or temporary. Permanent differences are reclassified among capital accounts to reflect their tax character. These reclassifications have no impact on net assets or the results of operations. Temporary differences are not reclassified, as they may reverse in subsequent periods.
Common expenses incurred by the Trust are allocated among the Funds based on the ratio of net assets of each Fund to the combined net assets of the Trust or based on the ratio of number of shareholders of each Fund to the combined number of shareholders of the Trust. Fund specific expenses are charged directly to the Fund that incurred the expense.
Realized and unrealized gains and losses and net investment income, excluding class specific expenses, are allocated daily to each class of shares based upon the relative proportion of net assets of each class. Differences in per share distributions by class are generally due to differences in class specific expenses.
e. Accounting Estimates
The preparation of financial statements in accordance with U.S. GAAP requires management to make estimates and assumptions that affect the reported amounts of assets and liabilities at the date of the financial statements and the amounts of income and expenses during the reporting period. Actual results could differ from those estimates.
f. Guarantees and Indemnifications
Under the Trust’s organizational documents, its officers and trustees are indemnified by the Trust against certain liabilities arising out of the performance of their duties to the Trust. Additionally, in the normal course of business, the Trust, on behalf of the Fund, enters into contracts with service providers that contain general indemnification clauses. The Trust’s maximum exposure under these arrangements is unknown as this would involve future claims that may be made against the Trust that have not yet occurred. Currently, the Trust expects the risk of loss to be remote.
2. Shares of Beneficial Interest
At June 30, 2018, there were an unlimited number of shares authorized (without par value). Transactions in the Fund’s shares were as follows:
Six Months Ended June 30, 2018 | Year Ended December 31, 2017 | |||||||||||||||
| Shares | Amount | Shares | Amount | |||||||||||||
| Class 1 Shares: | ||||||||||||||||
Shares sold | 68,047 | $ | 1,381,910 | 296,526 | $ | 5,843,664 | ||||||||||
Shares issued in reinvestment of distributions | 419,746 | 7,555,429 | 198,148 | 3,701,401 | ||||||||||||
Shares redeemed | (227,074 | ) | (4,679,330 | ) | (386,641 | ) | (7,542,196) | |||||||||
|
| |||||||||||||||
Net increase (decrease) | 260,719 | $ | 4,258,009 | 108,033 | $ | 2,002,869 | ||||||||||
|
| |||||||||||||||
| Semiannual Report | FSV-19 | |||||
FRANKLIN TEMPLETON VARIABLE INSURANCE PRODUCTS TRUST
NOTES TO FINANCIAL STATEMENTS (UNAUDITED)
Franklin Small Cap Value VIP Fund (continued)
2. Shares of Beneficial Interest (continued)
Six Months Ended June 30, 2018 | Year Ended December 31, 2017 | |||||||||||||||
| Shares | Amount | Shares | Amount | |||||||||||||
| Class 2 Shares: | ||||||||||||||||
Shares sold | 1,525,161 | $ 29,817,047 | 4,717,681 | $ 89,392,050 | ||||||||||||
Shares issued in reinvestment of distributions | 11,167,463 | 194,090,505 | 5,389,208 | 97,706,351 | ||||||||||||
Shares redeemed | (6,417,830 | ) | (125,597,246 | ) | (14,948,104 | ) | (282,764,343) | |||||||||
|
| |||||||||||||||
Net increase (decrease) | 6,274,794 | $ 98,310,306 | (4,841,215 | ) | $ (95,665,942) | |||||||||||
|
| |||||||||||||||
| Class 4 Shares: | ||||||||||||||||
Shares sold | 43,820 | $ 872,956 | 232,357 | $ 4,483,471 | ||||||||||||
Shares issued in reinvestment of distributions | 256,684 | 4,574,106 | 124,955 | 2,314,166 | ||||||||||||
Shares redeemed | (184,320 | ) | (3,697,768 | ) | (430,938 | ) | (8,319,098) | |||||||||
|
| |||||||||||||||
Net increase (decrease) | 116,184 | $ 1,749,294 | (73,626 | ) | $ (1,521,461) | |||||||||||
|
| |||||||||||||||
3. Transactions with Affiliates
Franklin Resources, Inc. is the holding company for various subsidiaries that together are referred to as Franklin Templeton Investments. Certain officers and trustees of the Fund are also officers and/or directors of the following subsidiaries:
| Subsidiary | Affiliation | |
Franklin Advisory Services, LLC (Advisory Services) | Investment manager | |
Franklin Templeton Services, LLC (FT Services) | Administrative manager | |
Franklin Templeton Distributors, Inc. (Distributors) | Principal underwriter | |
Franklin Templeton Investor Services, LLC (Investor Services) | Transfer agent |
a. Management Fees
The Fund pays an investment management fee to Advisory Services based on the average daily net assets of the Fund as follows:
| Annualized Fee Rate | Net Assets | |
0.750% | Up to and including $200 million | |
0.635% | Over $200 million, up to and including $700 million | |
0.600% | Over $700 million, up to and including $1.2 billion | |
0.575% | Over $1.2 billion, up to and including $1.3 billion | |
0.475% | In excess of $1.3 billion |
For the period ended June 30, 2018, the annualized gross effective investment management fee rate was 0.630% of the Fund’s average daily net assets.
b. Administrative Fees
Under an agreement with Advisory Services, FT Services provides administrative services to the Fund. The fee is paid by Advisory Services based on the Fund’s average daily net assets, and is not an additional expense of the Fund.
| FSV-20 | Semiannual Report | |||
FRANKLIN TEMPLETON VARIABLE INSURANCE PRODUCTS TRUST
NOTES TO FINANCIAL STATEMENTS (UNAUDITED)
Franklin Small Cap Value VIP Fund (continued)
c. Distribution Fees
The Board has adopted distribution plans for Class 2 and Class 4 shares pursuant to Rule 12b-1 under the 1940 Act. Under the Fund’s compensation distribution plans, the Fund pays Distributors for costs incurred in connection with the servicing, sale and distribution of the Fund’s shares up to 0.35% per year of its average daily net assets of each class. The Board has agreed to limit the current rate to 0.25% per year for Class 2. The plan year, for purposes of monitoring compliance with the maximum annual plan rates, is February 1 through January 31.
d. Transfer Agent Fees
Investor Services, under terms of an agreement, performs shareholder servicing for the Fund and is not paid by the Fund for the services.
e. Investments in Affiliated Management Investment Companies
The Fund invests in one or more affiliated management investment companies for purposes other than exercising a controlling influence over the management or policies. Management fees paid by the Fund are waived on assets invested in the affiliated management investment companies, as noted in the Statement of Operations, in an amount not to exceed the management and administrative fees paid directly or indirectly by each affiliate. Prior to January 1, 2014, the waiver was accounted for as a reduction to management fees. During the period ended June 30, 2018, the Fund held investments in affiliated management investment companies as follows:
| Number of Shares Held at Beginning of Period | Gross Additions | Gross Reductions | Number of Shares Held at End of Period | Value at End of Period | Dividend Income | Realized Gain (Loss) | Net Change in Unrealized Appreciation (Depreciation) | |||||||||||||||||||||||||
| Non-Controlled Affiliates | ||||||||||||||||||||||||||||||||
Institutional Fiduciary Trust Money Market Portfolio, 1.51% | 43,492,005 | 125,341,722 | (149,970,327 | ) | 18,863,400 | $18,863,400 | $333,104 | $ — | $ — | |||||||||||||||||||||||
|
| |||||||||||||||||||||||||||||||
4. Expense Offset Arrangement
The Fund has entered into an arrangement with its custodian whereby credits realized as a result of uninvested cash balances are used to reduce a portion of the Fund’s custodian expenses. During the period ended June 30, 2018, the custodian fees were reduced as noted in the Statement of Operations.
5. Income Taxes
At June 30, 2018, the cost of investments and net unrealized appreciation (depreciation) for income tax purposes were as follows:
Cost of investments | $1,020,177,850 | |||
|
| |||
Unrealized appreciation | $ 310,865,909 | |||
Unrealized depreciation | (9,147,712) | |||
|
| |||
Net unrealized appreciation (depreciation) | $ 301,718,197 | |||
|
| |||
Differences between income and/or capital gains as determined on a book basis and a tax basis are primarily due to differing treatment of wash sales.
| Semiannual Report | FSV-21 | |||||
FRANKLIN TEMPLETON VARIABLE INSURANCE PRODUCTS TRUST
NOTES TO FINANCIAL STATEMENTS (UNAUDITED)
Franklin Small Cap Value VIP Fund (continued)
6. Investment Transactions
Purchases and sales of investments (excluding short term securities) for the period ended June 30, 2018, aggregated $325,261,925 and $389,142,527, respectively.
7. Credit Facility
The Fund, together with other U.S. registered and foreign investment funds (collectively, Borrowers), managed by Franklin Templeton Investments, are borrowers in a joint syndicated senior unsecured credit facility totaling $2 billion (Global Credit Facility) which matures on February 8, 2019. This Global Credit Facility provides a source of funds to the Borrowers for temporary and emergency purposes, including the ability to meet future unanticipated or unusually large redemption requests.
Under the terms of the Global Credit Facility, the Fund shall, in addition to interest charged on any borrowings made by the Fund and other costs incurred by the Fund, pay its share of fees and expenses incurred in connection with the implementation and maintenance of the Global Credit Facility, based upon its relative share of the aggregate net assets of all of the Borrowers, including an annual commitment fee of 0.15% based upon the unused portion of the Global Credit Facility. These fees are reflected in other expenses in the Statement of Operations. During the period ended June 30, 2018, the Fund did not use the Global Credit Facility.
8. Fair Value Measurements
The Fund follows a fair value hierarchy that distinguishes between market data obtained from independent sources (observable inputs) and the Fund’s own market assumptions (unobservable inputs). These inputs are used in determining the value of the Fund’s financial instruments and are summarized in the following fair value hierarchy:
| • | Level 1 – quoted prices in active markets for identical financial instruments |
| • | Level 2 – other significant observable inputs (including quoted prices for similar financial instruments, interest rates, prepayment speed, credit risk, etc.) |
| • | Level 3 – significant unobservable inputs (including the Fund’s own assumptions in determining the fair value of financial instruments) |
The input levels are not necessarily an indication of the risk or liquidity associated with financial instruments at that level.
For movements between the levels within the fair value hierarchy, the Fund has adopted a policy of recognizing the transfers as of the date of the underlying event which caused the movement.
A summary of inputs used as of June 30, 2018, in valuing the Fund’s assets carried at fair value, is as follows:
| Level 1 | Level 2 | Level 3 | Total | |||||||||||||
| ||||||||||||||||
| Assets: | ||||||||||||||||
Investments in Securities:a | ||||||||||||||||
Equity Investments | $ | 1,291,034,237 | $ | — | $ | — | $ | 1,291,034,237 | ||||||||
Corporate Bonds | — | 11,998,410 | — | 11,998,410 | ||||||||||||
Short Term Investments | 18,863,400 | — | — | 18,863,400 | ||||||||||||
|
| |||||||||||||||
Total Investments in Securities | $ | 1,309,897,637 | $ | 11,998,410 | $ | — | $ | 1,321,896,047 | ||||||||
|
| |||||||||||||||
aFor detailed categories, see the accompanying Statement of Investments.
| FSV-22 | Semiannual Report | |||
FRANKLIN TEMPLETON VARIABLE INSURANCE PRODUCTS TRUST
NOTES TO FINANCIAL STATEMENTS (UNAUDITED)
Franklin Small Cap Value VIP Fund (continued)
9. Subsequent Events
The Fund has evaluated subsequent events through the issuance of the financial statements and determined that no events have occurred that require disclosure.
| Semiannual Report | FSV-23 | |||||
This page intentionally left blank.
Franklin Small-Mid Cap Growth VIP Fund
We are pleased to bring you Franklin Small-Mid Cap Growth VIP Fund’s
semiannual report for the period ended June 30, 2018.
Class 2 Performance Summary as of June 30, 2018
The Fund’s Class 2 Shares posted a +5.57% total return* for the six-month period ended June 30, 2018.
*The Fund has a fee waiver associated with any investment it makes in a Franklin Templeton money fund and/or other Franklin Templeton fund, contractually guaranteed through 4/30/19. Fund investment results reflect the fee waiver; without this waiver, the results would have been lower.
Performance reflects the Fund’s Class 2 operating expenses, but does not include any contract fees, expenses or sales charges. If they had been included, performance would be lower. These charges and deductions, particularly for variable life policies, can have a significant effect on contract values and insurance benefits. See the contract prospectus for a complete description of these expenses, including sales charges.
Performance data represent past performance, which does not guarantee future results. Investment return and principal value will fluctuate, and you may have a gain or loss when you sell your shares. Current performance may differ from figures shown.
| Semiannual Report | FSC-1 | |||||
FRANKLIN SMALL-MID CAP GROWTH VIP FUND
Fund Goal and Main Investments
The Fund seeks long-term capital growth. Under normal market conditions, the Fund invests at least 80% of its net assets in equity securities of small-capitalization and mid-capitalization companies. For this Fund, small cap companies are those within the market capitalization range of companies in the Russell 2500TM Index at the time of purchase, and midcap companies are those within the market capitalization range of companies in the Russell Midcap® Index at the time of purchase.1
Fund Risks
All investments involve risks, including possible loss of principal. Growth stock prices reflect projections of future earnings or revenues, and can, therefore, fall dramatically if the company fails to meet those projections. Smaller, midsized or relatively new or unseasoned companies can be particularly sensitive to changing economic conditions, and their prospects for growth are less certain than those of larger, more established companies. Historically, these securities have experienced more price volatility than larger company stocks, especially over the short term. To the extent the Fund focuses on particular countries, regions, industries, sectors or types of investment from time to time, it may be subject to greater risk of adverse developments in such areas of focus than a fund that invests in a wider variety of countries, regions, industries, sectors or investments. From time to time, the trading market for a particular security or type of security in which the Fund invests may become less liquid or even illiquid. The Fund is actively managed but there is no guarantee that the manager’s investment decisions will produce the desired results. The Fund’s prospectus also includes a description of the main investment risks.
Performance Overview
You can find the Fund’s six-month total return in the Performance Summary. In comparison, the Fund’s narrow benchmark, the Russell Midcap® Growth Index, generated a +5.40% total return, and its broad benchmark, the Standard & Poor’s® 500 Index (S&P 500®), produced a +2.65% total return for the same period.2
Portfolio Composition
Based on Total Net Assets as of 6/30/18
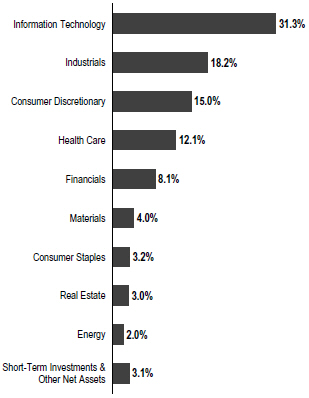
Economic and Market Overview
The US economy continued to grow during the six months under review. After moderating for three consecutive quarters, the economy grew faster in 2018’s second quarter, driven by consumer spending, exports, business investment and government spending. The manufacturing and services sectors expanded during the period. The unemployment rate declined slightly from 4.1% in December 2017, as reported at the beginning of the six-month period, to 4.0% at period-end.3 Annual inflation, as measured by the Consumer Price Index, increased from 2.1% in December 2017, as reported at the beginning of the period, to 2.9% at period-end.3
In February 2018, the new US Federal Reserve (Fed) Chair Jerome Powell spoke before Congress for the first time and indicated the Fed saw signs of a continued strong labor market and economic growth. He reiterated the Fed’s intention to
1. Please see Index Descriptions following the Fund Summaries.
2. Source: Morningstar. One cannot invest directly in an index, and an index is not representative of the Fund’s portfolio. Please see Index Descriptions following the Fund Summaries.
3. Source: Bureau of Labor Statistics.
The dollar value, number of shares or principal amount, and names of all portfolio holdings are listed in the Fund’s Statement of Investments (SOI).
| FSC-2 | Semiannual Report | |||
FRANKLIN SMALL-MID CAP GROWTH VIP FUND
gradually raise interest rates in an effort to keep the economy from overheating and as inflation increases toward the Fed’s target. However, he noted there was no evidence of the economy overheating and he had yet to see a clear upward move in wages. The Fed raised its target range for the federal funds rate 0.25% each at its March and June 2018 meetings to 1.75%–2.00% and continued reducing its balance sheet as part of its ongoing plan to normalize monetary policy. In June, the Fed upgraded its economic forecast for 2018 and its inflation forecasts for 2018 and 2019. Furthermore, the Fed forecasted an additional rate hike for 2018 and 2019 than previously anticipated.
US equity markets rose overall during the period, benefiting from mostly upbeat economic data and better US corporate earnings. At certain points during the period, markets were also supported by the expectations of gradual rate increases. After reaching new all-time highs in January 2018, US stocks declined in February amid concerns that strong economic growth and rising inflation would lead the Fed to increase its target rate faster than expected. In March, markets were pressured further by a broad sell-off in information technology (IT) stocks due to a potential for tighter regulation in the sector arising from concerns about consumer data privacy. Other factors that curbed investor sentiment included tensions between the US and North Korea, political uncertainties in the US, the Trump administration’s protectionist policies and escalating trade tensions between the US and China. An overall easing of tensions in the Korean peninsula and intermittent US-China trade negotiations partially offset some of these concerns. However, US trade disputes with its allies and China near period-end dampened investor sentiment. In this environment, the broad US stock market, as measured by the S&P 500, generated a +2.65% total return for the period.2
Investment Strategy
We use fundamental, bottom-up research to seek companies meeting our criteria of growth potential, quality and valuation. In seeking sustainable growth characteristics, we look for companies we believe can produce sustainable earnings and cash flow growth, evaluating the long-term market opportunity and competitive structure of an industry to target leaders and emerging leaders. We define quality companies as those with strong and improving competitive positions in attractive markets. We also believe important attributes of quality are experienced and talented management teams as well as financial strength reflected in the capital structure, gross and operating margins, free cash flow generation and returns on capital employed. In assessing value, we consider whether
Top 10 Holdings
6/30/18
| Company Sector/Industry | % of Total Net Assets | |||
| Roper Technologies Inc. Industrials | 2.5% | |||
| Edwards Lifesciences Corp. Health Care | 2.0% | |||
| 2U Inc. Information Technology | 2.0% | |||
| ServiceNow Inc. Information Technology | 1.9% | |||
| GoDaddy Inc. Information Technology | 1.8% | |||
| Worldpay Inc. Information Technology | 1.8% | |||
| CoStar Group Inc. Industrials | 1.7% | |||
| SBA Communications Corp. Real Estate | 1.6% | |||
| Rockwell Automation Inc. Industrials | 1.6% | |||
| Autodesk Inc. Information Technology | 1.5% | |||
security prices fully reflect the balance of the sustainable growth opportunities relative to business and financial risks.
Manager’s Discussion
During the period under review, most sectors represented in the Fund’s portfolio generated positive returns and contributed to absolute performance. Relative to the Fund’s narrow benchmark, the Russell Midcap® Growth Index, key contributors included the IT sector, due to stock selection and an overweighted position. An underweighted position and stock selection in the materials sector also benefited relative results, as did stock selection in health care.
In IT, 2U, a provider of cloud-based software-as-a-service solutions for non-profit colleges and universities, contributed to relative performance. The company reported quarterly results that exceeded consensus expectations, and it raised its 2018 revenue guidance, largely due to early strength in recently acquired GetSmarter. 2U has continued to progress in line with its multi-year accelerating annual growth guidance. In addition, the company is actively working on the undergraduate market at the request of current partners, which we believe could represent the next wave of growth for the company. Domain name registration and web hosting services provider GoDaddy also benefited results. The company reported quarterly revenues that exceeded consensus expectations, with organic revenue growth accelerating. In addition, business application
| Semiannual Report | FSC-3 | |||||
FRANKLIN SMALL-MID CAP GROWTH VIP FUND
revenue grew significantly. Commercial real estate information company CoStar Group also contributed to the Fund’s relative performance in the IT sector. CoStar Group’s stock rose amid solid quarterly results. The company’s net bookings strength has led to positive revenue revisions, and profitability is improving.
In the health care sector, DexCom, a medical devices company, and Edward Lifesciences, a provider of health products and technologies, contributed to relative performance.
Other notable individual contributors included pizza delivery company Domino’s Pizza and education services provider Grand Canyon Education.
In contrast, stock selection in the energy and consumer discretionary sectors detracted from the Fund’s relative performance. In energy, oilfield services provider RPC hindered results, as did independent oil and natural gas company Jagged Peak Energy (not part of the index).
In the consumer discretionary sector, NVR, which builds and sells residential properties, hindered relative performance. The company’s shares declined amid lower homebuilding revenue and higher expenses. Other detractors in the sector included discount retailer Dollar Tree and recreational vehicle manufacturer Thor Industries.
Other key individual detractors included machine vision products provider Cognex and machinery firm Stanley Black & Decker. During the period, Cognex confirmed consumer electronics-related fears by issuing flat revenue guidance through the end of the year. Quarterly revenues came in below consensus expectations, although earnings per share were better than expected. Stanley Black & Decker reported revenues slightly above consensus expectations. However, its shares declined amid softer operating margins and guidance for future growth to come in below recent levels.
Thank you for your participation in Franklin Small-Mid Cap Growth VIP Fund. We look forward to serving your future investment needs.
The foregoing information reflects our analysis, opinions and portfolio holdings as of June 30, 2018, the end of the reporting period. The way we implement our main investment strategies and the resulting portfolio holdings may change depending on factors such as market and economic conditions. These opinions may not be relied upon as investment advice or an offer for a particular security. The information is not a complete analysis of every aspect of any market, country, industry, security or the Fund. Statements of fact are from sources considered reliable, but the investment manager makes no representation or warranty as to their completeness or accuracy. Although historical performance is no guarantee of future results, these insights may help you understand our investment management philosophy.
| FSC-4 | Semiannual Report | |||
FRANKLIN SMALL-MID CAP GROWTH VIP FUND
Class 2 Fund Expenses
As an investor in a variable insurance contract (Contract) that indirectly provides for investment in an underlying mutual fund, you can incur transaction and/or ongoing expenses at both the Fund level and the Contract Level: (1) transaction expenses can include sales charges (loads) on purchases, surrender fees, transfer fees and premium taxes; and (2) ongoing expenses can include management fees, distribution and service (12b-1) fees, contract fees, annual maintenance fees, mortality and expense risk fees and other fees and expenses. All mutual funds and Contracts have some types of ongoing expenses. The table below shows Fund-level ongoing expenses and can help you understand these costs and compare them with those of other mutual funds offered through the Contract. The table assumes a $1,000 investment held for the six months indicated. Please refer to the Fund prospectus for additional information on operating expenses.
Actual Fund Expenses
The table below provides information about the actual account values and actual expenses in the columns under the heading “Actual.” In these columns the Fund’s actual return, which includes the effect of ongoing Fund expenses but does not include the effect of ongoing Contract expenses, is used to calculate the “Ending Account Value.” You can estimate the Fund-level expenses you paid during the period by following these steps (of course, your account value and expenses will differ from those in this illustration): Divide your account value by $1,000 (if your account had an $8,600 value, then $8,600 ÷ $1,000 = 8.6). Then multiply the result by the number under the headings “Actual” and “Fund-Level Expenses Paid During Period” (if Fund-Level Expenses Paid During Period were $ 7.50, then 8.6 x $ 7.50 = $64.50). In this illustration, the estimated expenses paid this period at the Fund level are $64.50.
Hypothetical Example for Comparison with Other Mutual Funds
Under the heading “Hypothetical” in the table, information is provided about hypothetical account values and hypothetical expenses based on the Fund’s actual expense ratio and an assumed rate of return of 5% per year before expenses, which is not the Fund’s actual return. This information may not be used to estimate the actual ending account balance or expenses you paid for the period, but it can help you compare ongoing costs of investing in the Fund with those of other mutual funds offered through the Contract. To do so, compare this 5% hypothetical example with the 5% hypothetical examples that appear in the shareholder reports of other funds offered through the Contract.
Please note that expenses shown in the table are meant to highlight ongoing costs at the Fund level only and do not reflect any ongoing expenses at the Contract level, or transaction expenses at either the Fund or Contract levels. In addition, while the Fund does not have transaction expenses, if the transaction and ongoing expenses at the Contract level were included, the expenses shown below would be higher. You should consult your Contract prospectus or disclosure document for more information.
| Actual (actual return after expenses) | Hypothetical (5% annual return before expenses) | |||||||||||
Share Class | Beginning Account Value 1/1/18 | Ending Account Value 6/30/18 | Fund-Level Expenses Paid During Period 1/1/18–6/30/181,2 | Ending Account Value 6/30/18 | Fund-Level Expenses Paid During Period 1/1/18–6/30/181,2 | Net Annualized Expense Ratio2 | ||||||
|
|
|
| |||||||||
Class 2 | $1,000 | $1,055.70 | $5.56 | $1,019.39 | $5.46 | 1.09% | ||||||
1. Expenses are equal to the annualized expense ratio for the six-month period as indicated above—in the far right column—multiplied by the simple average account value over the period indicated, and then multiplied by 181/365 to reflect the one-half year period.
2. Reflects expenses after fee waivers and expense reimbursements. Does not include any ongoing expenses of the Contract for which the Fund is an investment option or acquired fund fees and expenses.
| Semiannual Report | FSC-5 | |||||
FRANKLIN TEMPLETON VARIABLE INSURANCE PRODUCTS TRUST
Financial Highlights
Franklin Small-Mid Cap Growth VIP Fund
Six Months Ended June 30, 2018 (unaudited) | Year Ended December 31, | |||||||||||||||||||||||
| 2017 | 2016 | 2015 | 2014 | 2013 | ||||||||||||||||||||
| ||||||||||||||||||||||||
| Class 1 | ||||||||||||||||||||||||
Per share operating performance (for a share outstanding throughout the period) | ||||||||||||||||||||||||
Net asset value, beginning of period | $19.71 | $17.77 | $19.09 | $24.95 | $28.38 | $21.87 | ||||||||||||||||||
|
| |||||||||||||||||||||||
| Income from investment operationsa: | ||||||||||||||||||||||||
Net investment income (loss)b | (0.02 | ) | (0.04 | ) | (0.03 | ) | — | c,d | (0.07 | ) | (0.09) | |||||||||||||
Net realized and unrealized gains (losses) | 1.22 | 3.74 | 0.77 | (0.03) | 2.04 | 8.19 | ||||||||||||||||||
|
| |||||||||||||||||||||||
Total from investment operations | 1.20 | 3.70 | 0.74 | (0.03 | ) | 1.97 | 8.10 | |||||||||||||||||
|
| |||||||||||||||||||||||
Less distributions from net realized gains | (1.92 | ) | (1.76 | ) | (2.06 | ) | (5.83 | ) | (5.40 | ) | (1.59) | |||||||||||||
|
| |||||||||||||||||||||||
Net asset value, end of period | $18.99 | $19.71 | $17.77 | $19.09 | $24.95 | $28.38 | ||||||||||||||||||
|
| |||||||||||||||||||||||
Total returne | 5.70% | 21.75% | 4.40% | (2.44)% | 7.78% | 38.50% | ||||||||||||||||||
| Ratios to average net assetsf | ||||||||||||||||||||||||
Expenses before waiver and payments by affiliates | 0.85% | 0.85% | 0.84% | 0.81% | 0.80% | 0.80% | ||||||||||||||||||
Expenses net of waiver and payments by affiliates | 0.84% | 0.84% | g | 0.82% | g | 0.81% | h | 0.80% | h | 0.80% | g�� | |||||||||||||
Net investment income (loss) | (0.22)% | (0.24)% | (0.16)% | 0.01% | d | (0.29)% | (0.35)% | |||||||||||||||||
| Supplemental data | ||||||||||||||||||||||||
Net assets, end of period (000’s) | $38,473 | $36,864 | $31,756 | $87,866 | $99,803 | $98,020 | ||||||||||||||||||
Portfolio turnover rate | 13.91% | 40.49% | 32.23% | i | 37.85% | 48.73% | 42.77% | |||||||||||||||||
aThe amount shown for a share outstanding throughout the period may not correlate with the Statement of Operations for the period due to the timing of sales and repurchases of the Fund’s shares in relation to income earned and/or fluctuating fair value of the investments of the Fund.
bBased on average daily shares outstanding.
cAmount rounds to less than $0.01 per share.
dNet investment income per share includes approximately $0.05 per share related to income received in the form of special dividends in connection with certain Fund holdings. Excluding this amount, the ratio of net investment income to average net assets would have been (0.24)%.
eTotal return does not include fees, charges or expenses imposed by the variable annuity and life insurance contracts for which Franklin Templeton Variable Insurance Products Trust serves as an underlying investment vehicle. Total return is not annualized for periods less than one year.
fRatios are annualized for periods less than one year.
gBenefit of expense reduction rounds to less than 0.01%.
hBenefit of waiver and payments by affiliates rounds to less than 0.01%.
iExcludes the value of portfolio securities delivered as a result of a redemption in-kind.
| FSC-6 | Semiannual Report | The accompanying notes are an integral part of these financial statements. | |||
FRANKLIN TEMPLETON VARIABLE INSURANCE PRODUCTS TRUST
FINANCIAL HIGHLIGHTS
Franklin Small-Mid Cap Growth VIP Fund (continued)
|
| |||||||||||||||||||||||
Six Months Ended (unaudited) | Year Ended December 31, | |||||||||||||||||||||||
| 2017 | 2016 | 2015 | 2014 | 2013 | ||||||||||||||||||||
| ||||||||||||||||||||||||
| Class 2 | ||||||||||||||||||||||||
Per share operating performance (for a share outstanding throughout the period) | ||||||||||||||||||||||||
Net asset value, beginning of period | $17.83 | $16.27 | $17.69 | $23.56 | $27.16 | $21.04 | ||||||||||||||||||
|
| |||||||||||||||||||||||
| Income from investment operationsa: | ||||||||||||||||||||||||
Net investment income (loss)b | (0.04 | ) | (0.08 | ) | (0.07 | ) | (0.05 | )c | (0.13 | ) | (0.14) | |||||||||||||
Net realized and unrealized gains (losses) | 1.11 | 3.40 | 0.71 | 0.01 | 1.93 | 7.85 | ||||||||||||||||||
|
| |||||||||||||||||||||||
Total from investment operations | 1.07 | 3.32 | 0.64 | (0.04 | ) | 1.80 | 7.71 | |||||||||||||||||
|
| |||||||||||||||||||||||
Less distributions from net realized gains | (1.92 | ) | (1.76 | ) | (2.06 | ) | (5.83 | ) | (5.40 | ) | (1.59) | |||||||||||||
|
| |||||||||||||||||||||||
Net asset value, end of period | $16.98 | $17.83 | $16.27 | $17.69 | $23.56 | $27.16 | ||||||||||||||||||
|
| |||||||||||||||||||||||
Total returnd | 5.57% | 21.40% | 4.17% | (2.66)% | 7.47% | 38.15% | ||||||||||||||||||
| Ratios to average net assetse | ||||||||||||||||||||||||
Expenses before waiver and payments by affiliates | 1.10% | 1.10% | 1.09% | 1.06% | 1.05% | 1.05% | ||||||||||||||||||
Expenses net of waiver and payments by affiliates | 1.09% | 1.09% | f | 1.07% | f | 1.06% | g | 1.05% | g | 1.05% | f | |||||||||||||
Net investment income (loss) | (0.47)% | (0.49)% | (0.41)% | (0.24)% | c | (0.54)% | (0.60)% | |||||||||||||||||
| Supplemental data | ||||||||||||||||||||||||
Net assets, end of period (000’s) | $385,584 | $390,094 | $392,777 | $478,649 | $582,772 | $660,806 | ||||||||||||||||||
Portfolio turnover rate | 13.91% | 40.49% | 32.23% | h | 37.85% | 48.73% | 42.77% | |||||||||||||||||
aThe amount shown for a share outstanding throughout the period may not correlate with the Statement of Operations for the period due to the timing of sales and repurchases of the Fund’s shares in relation to income earned and/or fluctuating fair value of the investments of the Fund.
bBased on average daily shares outstanding.
cNet investment income per share includes approximately $0.05 per share related to income received in the form of special dividends in connection with certain Fund holdings. Excluding this amount, the ratio of net investment income to average net assets would have been (0.49)%.
dTotal return does not include fees, charges or expenses imposed by the variable annuity and life insurance contracts for which Franklin Templeton Variable Insurance Products Trust serves as an underlying investment vehicle. Total return is not annualized for periods less than one year.
eRatios are annualized for periods less than one year.
fBenefit of expense reduction rounds to less than 0.01%.
gBenefit of waiver and payments by affiliates rounds to less than 0.01%.
hExcludes the value of portfolio securities delivered as a result of a redemption in-kind.
| The accompanying notes are an integral part of these financial statements. | Semiannual Report | FSC-7 | |||||
FRANKLIN TEMPLETON VARIABLE INSURANCE PRODUCTS TRUST
FINANCIAL HIGHLIGHTS
Franklin Small-Mid Cap Growth VIP Fund (continued)
|
| |||||||||||||||||||||||
Six Months Ended (unaudited) | Year Ended December 31, | |||||||||||||||||||||||
| 2017 | 2016 | 2015 | 2014 | 2013 | ||||||||||||||||||||
| ||||||||||||||||||||||||
| Class 4 | ||||||||||||||||||||||||
Per share operating performance (for a share outstanding throughout the period) | ||||||||||||||||||||||||
Net asset value, beginning of period | $18.47 | $16.81 | $18.23 | $24.14 | $27.72 | $21.47 | ||||||||||||||||||
|
| |||||||||||||||||||||||
| Income from investment operationsa: | ||||||||||||||||||||||||
Net investment income (loss)b | (0.05 | ) | (0.10 | ) | (0.09 | ) | (0.07 | )c | (0.16 | ) | (0.17) | |||||||||||||
Net realized and unrealized gains (losses) | 1.15 | 3.52 | 0.73 | (0.01 | ) | 1.98 | 8.01 | |||||||||||||||||
|
| |||||||||||||||||||||||
Total from investment operations | 1.10 | 3.42 | 0.64 | (0.08 | ) | 1.82 | 7.84 | |||||||||||||||||
|
| |||||||||||||||||||||||
Less distributions from net realized gains | (1.92 | ) | (1.76 | ) | (2.06 | ) | (5.83 | ) | (5.40 | ) | (1.59) | |||||||||||||
|
| |||||||||||||||||||||||
Net asset value, end of period | $17.65 | $18.47 | $16.81 | $18.23 | $24.14 | $27.72 | ||||||||||||||||||
|
| |||||||||||||||||||||||
Total returnd | 5.55% | 21.30% | 4.04% | (2.77)% | 7.39% | 37.99% | ||||||||||||||||||
| Ratios to average net assetse | ||||||||||||||||||||||||
Expenses before waiver and payments by affiliates | 1.20% | 1.20% | 1.19% | 1.16% | 1.15% | 1.15% | ||||||||||||||||||
Expenses net of waiver and payments by affiliates | 1.19% | 1.19% | f | 1.17% | f | 1.16% | g | 1.15% | g | 1.15% | f | |||||||||||||
Net investment income (loss) | (0.57)% | (0.59)% | (0.51)% | (0.34)% | c | (0.64)% | (0.70)% | |||||||||||||||||
| Supplemental data | ||||||||||||||||||||||||
Net assets, end of period (000’s) | $15,431 | $15,829 | $13,825 | $15,105 | $16,384 | $19,132 | ||||||||||||||||||
Portfolio turnover rate | 13.91% | 40.49% | 32.23% | h | 37.85% | 48.73% | 42.77% | |||||||||||||||||
aThe amount shown for a share outstanding throughout the period may not correlate with the Statement of Operations for the period due to the timing of sales and repurchases of the Fund’s shares in relation to income earned and/or fluctuating fair value of the investments of the Fund.
bBased on average daily shares outstanding.
cNet investment income per share includes approximately $0.05 per share related to income received in the form of special dividends in connection with certain Fund holdings. Excluding this amount, the ratio of net investment income to average net assets would have been (0.59)%.
dTotal return does not include fees, charges or expenses imposed by the variable annuity and life insurance contracts for which Franklin Templeton Variable Insurance Products Trust serves as an underlying investment vehicle. Total return is not annualized for periods less than one year.
eRatios are annualized for periods less than one year.
fBenefit of expense reduction rounds to less than 0.01%.
gBenefit of waiver and payments by affiliates rounds to less than 0.01%.
hExcludes the value of portfolio securities delivered as a result of a redemption in-kind.
| FSC-8 | Semiannual Report | The accompanying notes are an integral part of these financial statements. | |||
FRANKLIN TEMPLETON VARIABLE INSURANCE PRODUCTS TRUST
Statement of Investments, June 30, 2018 (unaudited)
Franklin Small-Mid Cap Growth VIP Fund
| ||||||||||
| Shares | Value | |||||||||
| Common Stocks 96.9% | ||||||||||
| Consumer Discretionary 15.0% | ||||||||||
Aptiv PLC | 63,777 | $ 5,843,886 | ||||||||
| a | Burlington Stores Inc. | 29,500 | 4,440,635 | |||||||
| a | Dollar Tree Inc. | 62,411 | 5,304,935 | |||||||
Domino’s Pizza Inc. | 18,700 | 5,276,579 | ||||||||
| a,b,c | DraftKings Inc. | 733,541 | 1,621,649 | |||||||
Expedia Group Inc. | 32,500 | 3,906,175 | ||||||||
| a | Grand Canyon Education Inc. | 44,157 | 4,928,363 | |||||||
Hasbro Inc. | 20,000 | 1,846,200 | ||||||||
| a | Liberty Broadband Corp., C | 36,550 | 2,767,566 | |||||||
MGM Resorts International | 51,000 | 1,480,530 | ||||||||
| a | Norwegian Cruise Line Holdings Ltd. | 41,778 | 1,974,010 | |||||||
| a | NVR Inc. | 1,482 | 4,402,059 | |||||||
| a | O’Reilly Automotive Inc. | 13,107 | 3,585,682 | |||||||
Ross Stores Inc. | 73,885 | 6,261,754 | ||||||||
Tapestry Inc. | 18,500 | 864,135 | ||||||||
Thor Industries Inc. | 22,700 | 2,210,753 | ||||||||
Tractor Supply Co. | 32,037 | 2,450,510 | ||||||||
Vail Resorts Inc. | 13,000 | 3,564,470 | ||||||||
Wynn Resorts Ltd. | 18,000 | 3,012,120 | ||||||||
|
| |||||||||
| 65,742,011 | ||||||||||
|
| |||||||||
| Consumer Staples 3.2% | ||||||||||
Church & Dwight Co. Inc. | 92,500 | 4,917,300 | ||||||||
| a | Hostess Brands Inc., A | 93,200 | 1,267,520 | |||||||
Lamb Weston Holdings Inc. | 35,000 | 2,397,850 | ||||||||
| a | Monster Beverage Corp. | 66,516 | 3,811,367 | |||||||
Pinnacle Foods Inc. | 22,794 | 1,482,978 | ||||||||
|
| |||||||||
| 13,877,015 | ||||||||||
|
| |||||||||
| Energy 2.0% | ||||||||||
Cabot Oil & Gas Corp., A | 98,749 | 2,350,226 | ||||||||
| a | Concho Resources Inc. | 20,900 | 2,891,515 | |||||||
Diamondback Energy Inc. | 3,400 | 447,338 | ||||||||
| a,d | Jagged Peak Energy Inc. | 150,000 | 1,953,000 | |||||||
| d | RPC Inc. | 73,000 | 1,063,610 | |||||||
|
| |||||||||
| 8,705,689 | ||||||||||
|
| |||||||||
| Financials 8.1% | ||||||||||
Arthur J. Gallagher & Co. | 81,608 | 5,327,370 | ||||||||
CBOE Global Markets Inc. | 37,000 | 3,850,590 | ||||||||
First Republic Bank | 44,000 | 4,258,760 | ||||||||
MarketAxess Holdings Inc. | 19,296 | 3,817,907 | ||||||||
Moody’s Corp. | 26,909 | 4,589,599 | ||||||||
MSCI Inc. | 10,000 | 1,654,300 | ||||||||
The Progressive Corp. | 54,200 | 3,205,930 | ||||||||
| a | SVB Financial Group | 17,178 | 4,960,319 | |||||||
| a | Western Alliance Bancorp | 22,000 | 1,245,420 | |||||||
Willis Towers Watson PLC | 19,100 | 2,895,560 | ||||||||
|
| |||||||||
| 35,805,755 | ||||||||||
|
| |||||||||
| Health Care 12.1% | ||||||||||
| a | ABIOMED Inc. | 6,800 | 2,781,540 | |||||||
| a | Agios Pharmaceuticals Inc. | 6,500 | 547,495 | |||||||
| a | Alkermes PLC | 19,200 | 790,272 | |||||||
| Semiannual Report | FSC-9 | |||||
FRANKLIN TEMPLETON VARIABLE INSURANCE PRODUCTS TRUST
STATEMENT OF INVESTMENTS (UNAUDITED)
Franklin Small-Mid Cap Growth VIP Fund (continued)
| Shares | Value | |||||||||
Common Stocks (continued) | ||||||||||
| Health Care (continued) | ||||||||||
| a | Alnylam Pharmaceuticals Inc. | 8,900 | $ 876,561 | |||||||
| a | BioMarin Pharmaceutical Inc. | 25,208 | 2,374,594 | |||||||
| a | Centene Corp. | 25,000 | 3,080,250 | |||||||
| a | Cerner Corp. | 58,895 | 3,521,332 | |||||||
| a | DexCom Inc. | 27,188 | 2,582,316 | |||||||
| a | Edwards Lifesciences Corp. | 61,521 | 8,955,612 | |||||||
| a | Exelixis Inc. | 43,700 | 940,424 | |||||||
| a | Incyte Corp. | 24,669 | 1,652,823 | |||||||
| a,d | Inspire Medical Systems Inc. | 18,000 | 641,880 | |||||||
| a | Insulet Corp. | 30,688 | 2,629,962 | |||||||
| a | Ionis Pharmaceuticals Inc. | 13,400 | 558,378 | |||||||
| a | iRhythm Technologies Inc. | 24,300 | 1,971,459 | |||||||
| a | Jazz Pharmaceuticals PLC | 9,600 | 1,654,080 | |||||||
| a | Mettler-Toledo International Inc. | 8,855 | 5,123,769 | |||||||
| a | Neurocrine Biosciences Inc. | 13,244 | 1,301,090 | |||||||
| a | Nevro Corp. | 30,081 | 2,401,968 | |||||||
| a | Penumbra Inc. | 17,248 | 2,382,811 | |||||||
| a | Revance Therapeutics Inc. | 43,972 | 1,207,031 | |||||||
| a | Seattle Genetics Inc. | 12,500 | 829,875 | |||||||
| a | Waters Corp. | 18,300 | 3,542,697 | |||||||
West Pharmaceutical Services Inc. | 9,000 | 893,610 | ||||||||
|
| |||||||||
| 53,241,829 | ||||||||||
|
| |||||||||
| Industrials 18.2% | ||||||||||
Allegiant Travel Co. | 9,426 | 1,309,743 | ||||||||
BWX Technologies Inc. | 42,000 | 2,617,440 | ||||||||
| a | CoStar Group Inc. | 18,335 | 7,565,571 | |||||||
Fortive Corp. | 52,500 | 4,048,275 | ||||||||
Heico Corp. | 5,500 | 401,115 | ||||||||
Hexcel Corp. | 65,234 | 4,330,233 | ||||||||
IDEX Corp. | 22,200 | 3,029,856 | ||||||||
| a | IHS Markit Ltd. | 107,515 | 5,546,699 | |||||||
J.B. Hunt Transport Services Inc. | 35,646 | 4,332,771 | ||||||||
| a | Mercury Systems Inc. | 45,000 | 1,712,700 | |||||||
Old Dominion Freight Line Inc. | 19,000 | 2,830,240 | ||||||||
Republic Services Inc. | 53,300 | 3,643,588 | ||||||||
Rockwell Automation Inc. | 41,500 | 6,898,545 | ||||||||
Roper Technologies Inc. | 40,743 | 11,241,401 | ||||||||
Stanley Black & Decker Inc. | 29,296 | 3,890,802 | ||||||||
Textron Inc. | 41,100 | 2,708,901 | ||||||||
TransUnion | 12,000 | 859,680 | ||||||||
| a | Univar Inc. | 115,800 | 3,038,592 | |||||||
| a | Verisk Analytics Inc. | 61,061 | 6,572,606 | |||||||
| a | WABCO Holdings Inc. | 28,300 | 3,311,666 | |||||||
|
| |||||||||
| 79,890,424 | ||||||||||
|
| |||||||||
| Information Technology 31.3% | ||||||||||
| a | 2U Inc. | 105,079 | 8,780,401 | |||||||
| a | Adyen NV (Netherlands) | 1,400 | 771,637 | |||||||
| a | Alarm.com Holdings Inc. | 48,696 | 1,966,344 | |||||||
Amphenol Corp., A | 54,600 | 4,758,390 | ||||||||
Analog Devices Inc. | 67,591 | 6,483,329 | ||||||||
| a | ANSYS Inc. | 13,569 | 2,363,448 | |||||||
| FSC-10 | Semiannual Report | |||
FRANKLIN TEMPLETON VARIABLE INSURANCE PRODUCTS TRUST
STATEMENT OF INVESTMENTS (UNAUDITED)
Franklin Small-Mid Cap Growth VIP Fund (continued)
| Shares | Value | |||||||||
| Common Stocks (continued) | ||||||||||
| Information Technology (continued) | ||||||||||
| a | Arista Networks Inc. | 4,000 | $ 1,029,960 | |||||||
| a | Atlassian Corp. PLC (Australia) | 28,182 | 1,761,939 | |||||||
| a | Autodesk Inc. | 50,800 | 6,659,372 | |||||||
| a | Avalara Inc. | 6,100 | 325,557 | |||||||
| a | Black Knight Inc. | 32,000 | 1,713,600 | |||||||
| a | Ceridian HCM Holding Inc. | 12,000 | 398,280 | |||||||
Cognex Corp. | 107,496 | 4,795,397 | ||||||||
| a | Coherent Inc. | 6,500 | 1,016,730 | |||||||
DXC Technology Co. | 38,500 | 3,103,485 | ||||||||
| a | EPAM Systems Inc. | 3,600 | 447,588 | |||||||
| a | FleetCor Technologies Inc. | 21,995 | 4,633,247 | |||||||
| a | GoDaddy Inc., A | 109,617 | 7,738,960 | |||||||
| a | GreenSky Inc., A | 43,700 | 924,255 | |||||||
| a | Guidewire Software Inc. | 31,000 | 2,752,180 | |||||||
| a | I3 Verticals Inc., A | 21,200 | 322,664 | |||||||
| a | Inphi Corp. | 75,000 | 2,445,750 | |||||||
| a | Integrated Device Technology Inc. | 88,140 | 2,809,903 | |||||||
| a | InterXion Holding NV (Netherlands) | 45,000 | 2,808,900 | |||||||
KLA-Tencor Corp. | 41,687 | 4,274,168 | ||||||||
Lam Research Corp. | 26,916 | 4,652,431 | ||||||||
LogMeIn Inc. | 28,500 | 2,942,625 | ||||||||
Marvell Technology Group Ltd. (Bermuda) | 44,500 | 954,080 | ||||||||
Microchip Technology Inc. | 72,227 | 6,569,046 | ||||||||
Monolithic Power Systems | 24,100 | 3,221,447 | ||||||||
| a | Pluralsight Inc., A | 19,000 | 464,550 | |||||||
| a | PTC Inc. | 9,500 | 891,195 | |||||||
| a | Q2 Holdings Inc. | 22,696 | 1,294,807 | |||||||
| a | Red Hat Inc. | 28,000 | 3,762,360 | |||||||
| a | ServiceNow Inc. | 47,437 | 8,181,459 | |||||||
Skyworks Solutions Inc. | 13,500 | 1,304,775 | ||||||||
| a | Square Inc., A | 68,500 | 4,222,340 | |||||||
| a | Synopsys Inc. | 15,000 | 1,283,550 | |||||||
| a | Trimble Inc. | 22,500 | 738,900 | |||||||
| a,d | ViaSat Inc. | 57,366 | 3,770,094 | |||||||
| a | Wix.com Ltd. (Israel) | 32,000 | 3,209,600 | |||||||
| a | Workday Inc., A | 45,443 | 5,504,056 | |||||||
| a | Worldpay Inc., A | 94,534 | 7,730,990 | |||||||
Xilinx Inc. | 16,000 | 1,044,160 | ||||||||
| a,d | Zscaler Inc. | 23,000 | 822,250 | |||||||
|
| |||||||||
| 137,650,199 | ||||||||||
|
| |||||||||
| Materials 4.0% | ||||||||||
Albemarle Corp. | 13,500 | 1,273,455 | ||||||||
Avery Dennison Corp. | 28,500 | 2,909,850 | ||||||||
| a | Axalta Coating Systems Ltd. | 117,707 | 3,567,699 | |||||||
| a | Ingevity Corp. | 34,641 | 2,801,071 | |||||||
Packaging Corp. of America | 27,000 | 3,018,330 | ||||||||
Vulcan Materials Co. | 31,000 | 4,000,860 | ||||||||
|
| |||||||||
| 17,571,265 | ||||||||||
|
| |||||||||
| Semiannual Report | FSC-11 | |||||
FRANKLIN TEMPLETON VARIABLE INSURANCE PRODUCTS TRUST
STATEMENT OF INVESTMENTS (UNAUDITED)
Franklin Small-Mid Cap Growth VIP Fund (continued)
| Shares | Value | |||||||||
| Common Stocks (continued) | ||||||||||
| Real Estate 3.0% | ||||||||||
| a | CBRE Group Inc. | 84,521 | $ 4,035,033 | |||||||
Equinix Inc. | 5,153 | 2,215,223 | ||||||||
| a | SBA Communications Corp., A | 42,457 | 7,010,500 | |||||||
|
| |||||||||
| 13,260,756 | ||||||||||
|
| |||||||||
Total Common Stocks (Cost $285,891,283) | 425,744,943 | |||||||||
|
| |||||||||
Short Term Investments 4.4% | ||||||||||
Money Market Funds (Cost $14,063,833) 3.2% | ||||||||||
| e,f | Institutional Fiduciary Trust Money Market Portfolio, 1.51% | 14,063,833 | 14,063,833 | |||||||
|
| |||||||||
| g | Investments from Cash Collateral Received for Loaned Securities (Cost $5,454,860) 1.2% | |||||||||
| Money Market Funds 1.2% | ||||||||||
| e,f | Institutional Fiduciary Trust Money Market Portfolio, 1.51% | 5,454,860 | 5,454,860 | |||||||
|
| |||||||||
Total Investments (Cost $305,409,976) 101.3% | 445,263,636 | |||||||||
Other Assets, less Liabilities (1.3)% | (5,774,942 | ) | ||||||||
|
| |||||||||
Net Assets 100.0% | $ 439,488,694 | |||||||||
|
| |||||||||
aNon-income producing.
bFair valued using significant unobservable inputs. See Note 9 regarding fair value measurements.
cSee Note 7 regarding restricted securities.
dA portion or all of the security is on loan at June 30, 2018. See Note 1(c).
eSee Note 3(e) regarding investments in affiliated management investment companies.
fThe rate shown is the annualized seven-day effective yield at period end.
gSee Note 1(c) regarding securities on loan.
| FSC-12 | Semiannual Report | The accompanying notes are an integral part of these financial statements. | |||
FRANKLIN TEMPLETON VARIABLE INSURANCE PRODUCTS TRUST
Financial Statements
Statement of Assets and Liabilities
June 30, 2018 (unaudited)
Franklin Small-Mid VIP Fund | ||||
Assets: | ||||
Investments in securities: | ||||
Cost - Unaffiliated issuers | $285,891,283 | |||
Cost - Non-controlled affiliates (Note 3e) | 19,518,693 | |||
|
| |||
Value - Unaffiliated issuers + | $425,744,943 | |||
Value - Non-controlled affiliates (Note 3e) | 19,518,693 | |||
Receivables: | ||||
Investment securities sold | 268,818 | |||
Capital shares sold | 209,266 | |||
Dividends and interest | 134,037 | |||
Due from custodian | 515,900 | |||
Other assets | 295 | |||
|
| |||
Total assets | 446,391,952 | |||
|
| |||
Liabilities: | ||||
Payables: | ||||
Capital shares redeemed | 359,196 | |||
Management fees | 290,070 | |||
Distribution fees | 173,201 | |||
Payable upon return of securities loaned | 5,970,760 | |||
Accrued expenses and other liabilities | 110,031 | |||
|
| |||
Total liabilities | 6,903,258 | |||
|
| |||
Net assets, at value | $439,488,694 | |||
|
| |||
Net assets consist of: | ||||
Paid-in capital | $278,942,889 | |||
Undistributed net investment income (loss) | (994,830 | ) | ||
Net unrealized appreciation (depreciation) | 139,853,660 | |||
Accumulated net realized gain (loss) | 21,686,975 | |||
|
| |||
Net assets, at value | $439,488,694 | |||
|
| |||
Class 1: | ||||
Net assets, at value | $ 38,473,380 | |||
|
| |||
Shares outstanding | 2,025,665 | |||
|
| |||
Net asset value and maximum offering price per share | $18.99 | |||
|
| |||
Class 2: | ||||
Net assets, at value | $385,584,369 | |||
|
| |||
Shares outstanding | 22,706,385 | |||
|
| |||
Net asset value and maximum offering price per share | $16.98 | |||
|
| |||
Class 4: | ||||
Net assets, at value | $ 15,430,945 | |||
|
| |||
Shares outstanding | 874,414 | |||
|
| |||
Net asset value and maximum offering price per share | $17.65 | |||
|
| |||
+Includes securities loaned | $ 5,846,471 | |||
| The accompanying notes are an integral part of these financial statements. | Semiannual Report | FSC-13 | |||||
FRANKLIN TEMPLETON VARIABLE INSURANCE PRODUCTS TRUST
FINANCIAL STATEMENTS
Statement of Operations
for the six months ended June 30, 2018 (unaudited)
Franklin Small-Mid VIP Fund | ||||
| ||||
Investment income: | ||||
Dividends: (net of foreign taxes)* | ||||
Unaffiliated issuers | $ 1,289,821 | |||
Non-controlled affiliates (Note 3e) | 66,044 | |||
Income from securities loaned (net of fees and rebates) | 27,249 | |||
|
| |||
Total investment income | 1,383,114 | |||
|
| |||
Expenses: | ||||
Management fees (Note 3a) | 1,776,558 | |||
Distribution fees: (Note 3c) | ||||
Class 2 | 488,369 | |||
Class 4 | 27,322 | |||
Custodian fees (Note 4) | 1,798 | |||
Reports to shareholders | 83,863 | |||
Professional fees | 21,292 | |||
Trustees’ fees and expenses | 1,143 | |||
Other | 7,611 | |||
|
| |||
Total expenses | 2,407,956 | |||
Expenses waived/paid by affiliates (Note 3e) | (30,012 | ) | ||
|
| |||
Net expenses | 2,377,944 | |||
|
| |||
Net investment income (loss) | (994,830 | ) | ||
|
| |||
Realized and unrealized gains (losses): | ||||
Net realized gain (loss) from: | ||||
Investments: | ||||
Unaffiliated issuers | 22,128,871 | |||
Foreign currency transactions | (400 | ) | ||
|
| |||
Net realized gain (loss) | 22,128,471 | |||
|
| |||
Net change in unrealized appreciation (depreciation) on: | ||||
Investments: | ||||
Unaffiliated issuers | 3,219,990 | |||
|
| |||
Net realized and unrealized gain (loss) | 25,348,461 | |||
|
| |||
Net increase (decrease) in net assets resulting from operations | $24,353,631 | |||
|
| |||
*Foreign taxes withheld on dividends | $ 15 | |||
| FSC-14 | Semiannual Report | The accompanying notes are an integral part of these financial statements. | |||
FRANKLIN TEMPLETON VARIABLE INSURANCE PRODUCTS TRUST
FINANCIAL STATEMENTS
Statements of Changes in Net Assets
| Franklin Small-Mid Cap Growth VIP Fund | ||||||||
| Six Months Ended June 30, 2018 (unaudited) | Year Ended December 31, 2017 | |||||||
| ||||||||
Increase (decrease) in net assets: | ||||||||
Operations: | ||||||||
Net investment income (loss) | $ (994,830 | ) | $ (2,151,916 | ) | ||||
Net realized gain (loss) | 22,128,471 | 46,758,513 | ||||||
Net change in unrealized appreciation (depreciation) | 3,219,990 | 44,201,889 | ||||||
|
| |||||||
Net increase (decrease) in net assets resulting from operations | 24,353,631 | 88,808,486 | ||||||
|
| |||||||
Distributions to shareholders from: | ||||||||
Net realized gains: | ||||||||
Class 1 | (3,540,738 | ) | (3,085,657 | ) | ||||
Class 2 | (39,501,499 | ) | (39,960,537 | ) | ||||
Class 4 | (1,517,449 | ) | (1,450,459 | ) | ||||
|
| |||||||
Total distributions to shareholders | (44,559,686 | ) | (44,496,653 | ) | ||||
|
| |||||||
Capital share transactions: (Note 2) | ||||||||
Class 1 | 3,058,630 | 1,442,945 | ||||||
Class 2 | 13,573,870 | (41,878,699 | ) | |||||
Class 4 | 275,877 | 552,508 | ||||||
|
| |||||||
Total capital share transactions | 16,908,377 | (39,883,246 | ) | |||||
|
| |||||||
Net increase (decrease) in net assets | (3,297,678 | ) | 4,428,587 | |||||
Net assets: | ||||||||
Beginning of period | 442,786,372 | 438,357,785 | ||||||
|
| |||||||
End of period | $439,488,694 | $442,786,372 | ||||||
|
| |||||||
Undistributed net investment income (loss) included in net assets: | ||||||||
End of period | $ (994,830 | ) | $ — | |||||
|
| |||||||
| The accompanying notes are an integral part of these financial statements. | Semiannual Report | FSC-15 | |||||
FRANKLIN TEMPLETON VARIABLE INSURANCE PRODUCTS TRUST
Notes to Financial Statements (unaudited)
Franklin Small-Mid Cap Growth VIP Fund
1. Organization and Significant Accounting
Policies
Franklin Templeton Variable Insurance Products Trust (Trust) is registered under the Investment Company Act of 1940 (1940 Act) as an open-end management investment company, consisting of eighteen separate funds and applies the specialized accounting and reporting guidance in U.S. Generally Accepted Accounting Principles (U.S. GAAP). Franklin Small-Mid Cap Growth VIP Fund (Fund) is included in this report. Shares of the Fund are generally sold only to insurance company separate accounts to fund the benefits of variable life insurance policies or variable annuity contracts. At June 30, 2018, 46.8% of the Fund’s shares were held through one insurance company. Investment activities of these insurance company separate accounts could have a material impact on the Fund. The Fund offers three classes of shares: Class 1, Class 2 and Class 4. Each class of shares may differ by its distribution fees, voting rights on matters affecting a single class and its exchange privilege.
The following summarizes the Fund’s significant accounting policies.
a. Financial Instrument Valuation
The Fund’s investments in financial instruments are carried at fair value daily. Fair value is the price that would be received to sell an asset or paid to transfer a liability in an orderly transaction between market participants on the measurement date. The Fund calculates the net asset value (NAV) per share each business day as of 4 p.m. Eastern time or the regularly scheduled close of the New York Stock Exchange (NYSE), whichever is earlier. Under compliance policies and procedures approved by the Trust’s Board of Trustees (the Board), the Fund’s administrator has responsibility for oversight of valuation, including leading the cross-functional Valuation Committee (VC). The VC provides administration and oversight of the Fund’s valuation policies and procedures, which are approved annually by the Board. Among other things, these procedures allow the Fund to utilize independent pricing services, quotations from securities and financial instrument dealers, and other market sources to determine fair value.
Equity securities listed on an exchange or on the NASDAQ National Market System are valued at the last quoted sale price or the official closing price of the day, respectively. Foreign equity securities are valued as of the close of trading on the foreign stock exchange on which the security is primarily traded, or as of 4 p.m. Eastern time. The value is then converted
into its U.S. dollar equivalent at the foreign exchange rate in effect at 4 p.m. Eastern time on the day that the value of the security is determined. Over-the-counter (OTC) securities are valued within the range of the most recent quoted bid and ask prices. Securities that trade in multiple markets or on multiple exchanges are valued according to the broadest and most representative market. Certain equity securities are valued based upon fundamental characteristics or relationships to similar securities.
Investments in open-end mutual funds are valued at the closing NAV.
The Fund has procedures to determine the fair value of financial instruments for which market prices are not reliable or readily available. Under these procedures, the VC convenes on a regular basis to review such financial instruments and considers a number of factors, including significant unobservable valuation inputs, when arriving at fair value. The VC primarily employs a market-based approach which may use related or comparable assets or liabilities, recent transactions, market multiples, book values, and other relevant information for the investment to determine the fair value of the investment. An income-based valuation approach may also be used in which the anticipated future cash flows of the investment are discounted to calculate fair value. Discounts may also be applied due to the nature or duration of any restrictions on the disposition of the investments. Due to the inherent uncertainty of valuations of such investments, the fair values may differ significantly from the values that would have been used had an active market existed. The VC employs various methods for calibrating these valuation approaches including a regular review of key inputs and assumptions, transactional back-testing or disposition analysis, and reviews of any related market activity.
Trading in securities on foreign securities stock exchanges and OTC markets may be completed before 4 p.m. Eastern time. In addition, trading in certain foreign markets may not take place on every Fund’s business day. Occasionally, events occur between the time at which trading in a foreign security is completed and 4 p.m. Eastern time that might call into question the reliability of the value of a portfolio security held by the Fund. As a result, differences may arise between the value of the Fund’s portfolio securities as determined at the foreign market close and the latest indications of value at 4 p.m. Eastern time. In order to minimize the potential for these differences, the VC monitors price movements following the close of trading in foreign stock markets through a series of country
| FSC-16 | Semiannual Report | |||
FRANKLIN TEMPLETON VARIABLE INSURANCE PRODUCTS TRUST
NOTES TO FINANCIAL STATEMENTS (UNAUDITED)
Franklin Small-Mid Cap Growth VIP Fund (continued)
specific market proxies (such as baskets of American Depositary Receipts, futures contracts and exchange traded funds). These price movements are measured against established trigger thresholds for each specific market proxy to assist in determining if an event has occurred that may call into question the reliability of the values of the foreign securities held by the Fund. If such an event occurs, the securities may be valued using fair value procedures, which may include the use of independent pricing services.
When the last day of the reporting period is a non-business day, certain foreign markets may be open on those days that the Fund’s NAV is not calculated, which could result in differences between the value of the Fund’s portfolio securities on the last business day and the last calendar day of the reporting period. Any significant security valuation changes due to an open foreign market are adjusted and reflected by the Fund for financial reporting purposes.
b. Foreign Currency Translation
Portfolio securities and other assets and liabilities denominated in foreign currencies are translated into U.S. dollars based on the exchange rate of such currencies against U.S. dollars on the date of valuation. The Fund may enter into foreign currency exchange contracts to facilitate transactions denominated in a foreign currency. Purchases and sales of securities, income and expense items denominated in foreign currencies are translated into U.S. dollars at the exchange rate in effect on the transaction date. Portfolio securities and assets and liabilities denominated in foreign currencies contain risks that those currencies will decline in value relative to the U.S. dollar. Occasionally, events may impact the availability or reliability of foreign exchange rates used to convert the U.S. dollar equivalent value. If such an event occurs, the foreign exchange rate will be valued at fair value using procedures established and approved by the Board.
The Fund does not separately report the effect of changes in foreign exchange rates from changes in market prices on securities held. Such changes are included in net realized and unrealized gain or loss from investments in the Statement of Operations.
Realized foreign exchange gains or losses arise from sales of foreign currencies, currency gains or losses realized between the trade and settlement dates on securities transactions and the difference between the recorded amounts of dividends, interest, and foreign withholding taxes and the U.S. dollar equivalent of
the amounts actually received or paid. Net unrealized foreign exchange gains and losses arise from changes in foreign exchange rates on foreign denominated assets and liabilities other than investments in securities held at the end of the reporting period.
c. Securities Lending
The Fund participates in an agency based securities lending program to earn additional income. The Fund receives cash collateral against the loaned securities in an amount equal to at least 102% of the fair value of the loaned securities. Collateral is maintained over the life of the loan in an amount not less than 100% of the fair value of loaned securities, as determined at the close of Fund business each day; any additional collateral required due to changes in security values is delivered to the Fund on the next business day. The collateral is deposited into a joint cash account with other funds and is used to invest in a money market fund managed by Franklin Advisers, Inc., an affiliate of the Fund. The Fund may receive income from the investment of cash collateral, in addition to lending fees and rebates paid by the borrower. Income from securities loaned, net of fees paid to the securities lending agent and/or third-party vendor, is reported separately in the Statement of Operations. The Fund bears the market risk with respect to the collateral investment, securities loaned, and the risk that the agent may default on its obligations to the Fund. If the borrower defaults on its obligation to return the securities loaned, the Fund has the right to repurchase the securities in the open market using the collateral received. The securities lending agent has agreed to indemnify the Fund in the event of default by a third party borrower.
d. Income and Deferred Taxes
It is the Fund’s policy to qualify as a regulated investment company under the Internal Revenue Code. The Fund intends to distribute to shareholders substantially all of its taxable income and net realized gains to relieve it from federal income and if applicable, excise taxes. As a result, no provision for U.S. federal income taxes is required.
The Fund may be subject to foreign taxation related to income received, capital gains on the sale of securities and certain foreign currency transactions in the foreign jurisdictions in which it invests. Foreign taxes, if any, are recorded based on the tax regulations and rates that exist in the foreign markets in which the Fund invests. When a capital gain tax is determined
| Semiannual Report | FSC-17 | |||||
FRANKLIN TEMPLETON VARIABLE INSURANCE PRODUCTS TRUST
NOTES TO FINANCIAL STATEMENTS (UNAUDITED)
Franklin Small-Mid Cap Growth VIP Fund (continued)
1. Organization and Significant Accounting
Policies (continued)
d. Income and Deferred Taxes (continued)
to apply, the Fund records an estimated deferred tax liability in an amount that would be payable if the securities were disposed of on the valuation date.
The Fund may recognize an income tax liability related to its uncertain tax positions under U.S. GAAP when the uncertain tax position has a less than 50% probability that it will be sustained upon examination by the tax authorities based on its technical merits. As of June 30, 2018, the Fund has determined that no tax liability is required in its financial statements related to uncertain tax positions for any open tax years (or expected to be taken in future tax years). Open tax years are those that remain subject to examination and are based on the statute of limitations in each jurisdiction in which the Fund invests.
e. Security Transactions, Investment Income, Expenses and Distributions
Security transactions are accounted for on trade date. Realized gains and losses on security transactions are determined on a specific identification basis. Estimated expenses are accrued daily. Dividend income is recorded on the ex-dividend date except for certain dividends from securities where the dividend rate is not available. In such cases, the dividend is recorded as soon as the information is received by the Fund. Distributions to shareholders are recorded on the ex-dividend date. Distributable earnings are determined according to income tax regulations (tax basis) and may differ from earnings recorded in accordance with U.S. GAAP. These differences may be permanent or temporary. Permanent differences are reclassified among capital accounts to reflect their tax character. These reclassifications have no impact on net assets or the results of operations. Temporary differences are not reclassified, as they may reverse in subsequent periods.
Common expenses incurred by the Trust are allocated among the Funds based on the ratio of net assets of each Fund to the combined net assets of the Trust or based on the ratio of number of shareholders of each Fund to the combined number of shareholders of the Trust. Fund specific expenses are charged directly to the Fund that incurred the expense.
Realized and unrealized gains and losses and net investment income, excluding class specific expenses, are allocated daily to each class of shares based upon the relative proportion of net assets of each class. Differences in per share distributions by class are generally due to differences in class specific expenses.
f. Accounting Estimates
The preparation of financial statements in accordance with U.S. GAAP requires management to make estimates and assumptions that affect the reported amounts of assets and liabilities at the date of the financial statements and the amounts of income and expenses during the reporting period. Actual results could differ from those estimates.
g. Guarantees and Indemnifications
Under the Trust’s organizational documents, its officers and trustees are indemnified by the Trust against certain liabilities arising out of the performance of their duties to the Trust. Additionally, in the normal course of business, the Trust, on behalf of the Fund, enters into contracts with service providers that contain general indemnification clauses. The Trust’s maximum exposure under these arrangements is unknown as this would involve future claims that may be made against the Trust that have not yet occurred. Currently, the Trust expects the risk of loss to be remote.
| FSC-18 | Semiannual Report | |||
FRANKLIN TEMPLETON VARIABLE INSURANCE PRODUCTS TRUST
NOTES TO FINANCIAL STATEMENTS (UNAUDITED)
Franklin Small-Mid Cap Growth VIP Fund (continued)
2. Shares of Beneficial Interest
At June 30, 2018, there were an unlimited number of shares authorized (without par value). Transactions in the Fund’s shares were as follows:
Six Months Ended June 30, 2018 | Year Ended December 31, 2017 | |||||||||||||||||||
|
| |||||||||||||||||||
| Shares | Amount | Shares | Amount | |||||||||||||||||
| Class 1 Shares: | ||||||||||||||||||||
Shares sold | 60,491 | $ | 1,244,530 | 111,735 | $ | 2,131,300 | ||||||||||||||
Shares issued in reinvestment of distributions | 179,278 | 3,540,738 | 170,856 | 3,085,657 | ||||||||||||||||
Shares redeemed | (84,312 | ) | (1,726,638 | ) | (198,990 | ) | (3,774,012) | |||||||||||||
|
| |||||||||||||||||||
Net increase (decrease) | 155,457 | $ | 3,058,630 | 83,601 | $ | 1,442,945 | ||||||||||||||
|
| |||||||||||||||||||
| Class 2 Shares: | ||||||||||||||||||||
Shares sold | 319,605 | $ | 5,945,455 | 683,937 | $ | 11,660,672 | ||||||||||||||
Shares issued in reinvestment of distributions | 2,236,778 | 39,501,499 | 2,442,575 | 39,960,537 | ||||||||||||||||
Shares redeemed | (1,728,283 | ) | (31,873,084 | ) | (5,392,842 | ) | (93,499,908) | |||||||||||||
|
| |||||||||||||||||||
Net increase (decrease) | 828,100 | $ | 13,573,870 | (2,266,330 | ) | $ | (41,878,699) | |||||||||||||
|
| |||||||||||||||||||
| Class 4 Shares: | ||||||||||||||||||||
Shares sold | 54,667 | $ | 1,045,847 | 145,506 | $ | 2,584,438 | ||||||||||||||
Shares issued in reinvestment of distributions | 82,695 | 1,517,449 | 85,574 | 1,450,459 | ||||||||||||||||
Shares redeemed | (119,935 | ) | (2,287,419 | ) | (196,455 | ) | (3,482,389) | |||||||||||||
|
| |||||||||||||||||||
Net increase (decrease) | 17,427 | $ | 275,877 | 34,625 | $ | 552,508 | ||||||||||||||
|
| |||||||||||||||||||
3. Transactions with Affiliates
Franklin Resources, Inc. is the holding company for various subsidiaries that together are referred to as Franklin Templeton Investments. Certain officers and trustees of the Fund are also officers and/or directors of the following subsidiaries:
| Subsidiary | Affiliation | |
Franklin Advisers, Inc. (Advisers) | Investment manager | |
Franklin Templeton Services, LLC (FT Services) | Administrative manager | |
Franklin Templeton Distributors, Inc. (Distributors) | Principal underwriter | |
Franklin Templeton Investor Services, LLC (Investor Services) | Transfer agent |
| Semiannual Report | FSC-19 | |||||
FRANKLIN TEMPLETON VARIABLE INSURANCE PRODUCTS TRUST
NOTES TO FINANCIAL STATEMENTS (UNAUDITED)
Franklin Small-Mid Cap Growth VIP Fund (continued)
3. Transactions with Affiliates (continued)
a. Management Fees
The Fund pays an investment management fee to Advisers based on the average daily net assets of the Fund as follows:
| Annualized Fee Rate | Net Assets | |
0.800% | Up to and including $500 million | |
0.700% | Over $500 million, up to and including $1 billion | |
0.650% | Over $1 billion, up to and including $1.5 billion | |
0.600% | Over $1.5 billion, up to and including $6.5 billion | |
0.575% | Over $6.5 billion, up to and including $11.5 billion | |
0.550% | Over $11.5 billion, up to and including $16.5 billion | |
0.540% | Over $16.5 billion, up to and including $19 billion | |
0.530% | Over $19 billion, up to and including $21.5 billion | |
0.520% | In excess of $21.5 billion |
For the period ended June 30, 2018, the annualized gross effective investment management fee rate was 0.800% of the Fund’s average daily net assets.
b. Administrative Fees
Under an agreement with Advisers, FT Services provides administrative services to the Fund. The fee is paid by Advisers based on the Fund’s average daily net assets, and is not an additional expense of the Fund.
c. Distribution Fees
The Board has adopted distribution plans for Class 2 and Class 4 shares pursuant to Rule 12b-1 under the 1940 Act. Under the Fund’s compensation distribution plans, the Fund pays Distributors for costs incurred in connection with the servicing, sale and distribution of the Fund’s shares up to 0.35% per year of its average daily net assets of each class. The Board has agreed to limit the current rate to 0.25% per year for Class 2. The plan year, for purposes of monitoring compliance with the maximum annual plan rates, is February 1 through January 31.
d. Transfer Agent Fees
Investor Services, under terms of an agreement, performs shareholder servicing for the Fund and is not paid by the Fund for the services.
| FSC-20 | Semiannual Report | |||
FRANKLIN TEMPLETON VARIABLE INSURANCE PRODUCTS TRUST
NOTES TO FINANCIAL STATEMENTS (UNAUDITED)
Franklin Small-Mid Cap Growth VIP Fund (continued)
e. Investments in Affiliated Management Investment Companies
The Fund invests in one or more affiliated management investment companies for purposes other than exercising a controlling influence over the management or policies. Management fees paid by the Fund are waived on assets invested in the affiliated management investment companies, as noted in the Statement of Operations, in an amount not to exceed the management and administrative fees paid directly or indirectly by each affiliate. Prior to January 1, 2014, the waiver was accounted for as a reduction to management fees. During the period ended June 30, 2018, the Fund held investments in affiliated management investment companies as follows:
| Number of Shares Held at Beginning of Period | Gross Additions | Gross Reductions | Number of Shares Held at End of Period | Value at End of Period | Dividend Income | Realized Gain (Loss) | Net Change in Unrealized Appreciation (Depreciation) | |||||||||||||||||||||||||
| Non-Controlled Affiliates | ||||||||||||||||||||||||||||||||
Institutional Fiduciary Trust Money Market Portfolio, 1.51% | 15,691,885 | 81,989,174 | (78,162,366 | ) | 19,518,693 | $19,518,693 | $66,044 | $ — | $ — | |||||||||||||||||||||||
|
| |||||||||||||||||||||||||||||||
f. Interfund Transactions
The Fund engaged in purchases and sales of investments with funds or other accounts that have common investment managers (or affiliated investment managers), directors, trustees or officers. During the period ended June 30, 2018, these purchase and sale transactions aggregated $0 and $55,780, respectively.
4. Expense Offset Arrangement
The Fund has entered into an arrangement with their custodian whereby credits realized as a result of uninvested cash balances are used to reduce a portion of the Fund’s custodian expenses. During the period ended June 30, 2018, there were no credits earned.
5. Income Taxes
At June 30, 2018, the cost of investments and net unrealized appreciation (depreciation) for income tax purposes were as follows:
Cost of investments | $ | 305,848,678 | ||
|
| |||
Unrealized appreciation | $ | 146,524,930 | ||
Unrealized depreciation | (7,109,972) | |||
|
| |||
Net unrealized appreciation (depreciation) | $ | 139,414,958 | ||
|
| |||
Differences between income and/or capital gains as determined on a book basis and a tax basis are primarily due to differing treatment of pass-through entity income and wash sales.
6. Investment Transactions
Purchases and sales of investments (excluding short term securities) for the period ended June 30, 2018, aggregated $60,242,709 and $95,353,163, respectively.
At June 30, 2018, in connection with securities lending transactions, the Fund loaned equity investments and received $5,970,760 of cash collateral. The gross amount of recognized liability for such transactions is included in payable upon return of securities loaned in the Statement of Assets and Liabilities. The agreements can be terminated at any time.
| Semiannual Report | FSC-21 | |||||
FRANKLIN TEMPLETON VARIABLE INSURANCE PRODUCTS TRUST
NOTES TO FINANCIAL STATEMENTS (UNAUDITED)
Franklin Small-Mid Cap Growth VIP Fund (continued)
7. Restricted Securities
The Fund invests in securities that are restricted under the Securities Act of 1933 (1933 Act). Restricted securities are often purchased in private placement transactions, and cannot be sold without prior registration unless the sale is pursuant to an exemption under the 1933 Act. Disposal of these securities may require greater effort and expense, and prompt sale at an acceptable price may be difficult. The Fund may have registration rights for restricted securities. The issuer generally incurs all registration costs.
At June 30, 2018, investments in restricted securities, excluding securities exempt from registration under the 1933 Act deemed to be liquid, were as follows:
| Shares | Issuer | Acquisition Date | Cost | Value | ||||||||||
| 733,541 | DraftKings Inc. (Value is 0.4% of Net Assets) | 8/07/15 | $ | 2,800,003 | $ | 1,621,649 | ||||||||
|
| |||||||||||||
8. Credit Facility
The Fund, together with other U.S. registered and foreign investment funds (collectively, Borrowers), managed by Franklin Templeton Investments, are borrowers in a joint syndicated senior unsecured credit facility totaling $2 billion (Global Credit Facility) which matures on February 8, 2019. This Global Credit Facility provides a source of funds to the Borrowers for temporary and emergency purposes, including the ability to meet future unanticipated or unusually large redemption requests.
Under the terms of the Global Credit Facility, the Fund shall, in addition to interest charged on any borrowings made by the Fund and other costs incurred by the Fund, pay its share of fees and expenses incurred in connection with the implementation and maintenance of the Global Credit Facility, based upon its relative share of the aggregate net assets of all of the Borrowers, including an annual commitment fee of 0.15% based upon the unused portion of the Global Credit Facility. These fees are reflected in other expenses in the Statement of Operations. During the period ended June 30, 2018, the Fund did not use the Global Credit Facility.
9. Fair Value Measurements
The Fund follows a fair value hierarchy that distinguishes between market data obtained from independent sources (observable inputs) and the Fund’s own market assumptions (unobservable inputs). These inputs are used in determining the value of the Fund’s financial instruments and are summarized in the following fair value hierarchy:
| • | Level 1 – quoted prices in active markets for identical financial instruments |
| • | Level 2 – other significant observable inputs (including quoted prices for similar financial instruments, interest rates, prepayment speed, credit risk, etc.) |
| • | Level 3 – significant unobservable inputs (including the Fund’s own assumptions in determining the fair value of financial instruments) |
The input levels are not necessarily an indication of the risk or liquidity associated with financial instruments at that level.
For movements between the levels within the fair value hierarchy, the Fund has adopted a policy of recognizing the transfers as of the date of the underlying event which caused the movement.
| FSC-22 | Semiannual Report | |||
FRANKLIN TEMPLETON VARIABLE INSURANCE PRODUCTS TRUST
NOTES TO FINANCIAL STATEMENTS (UNAUDITED)
Franklin Small-Mid Cap Growth VIP Fund (continued)
A summary of inputs used as of June 30, 2018, in valuing the Fund’s assets carried at fair value, is as follows:
| Level 1 | Level 2 | Level 3 | Total | |||||||||||||
| ||||||||||||||||
| Assets: | ||||||||||||||||
Investments in Securities:a | ||||||||||||||||
Equity Investments: | ||||||||||||||||
Consumer Discretionary | $ 64,120,362 | $ — | $ 1,621,649 | $ 65,742,011 | ||||||||||||
All Other Equity Investments | 360,002,932 | — | — | 360,002,932 | ||||||||||||
Short Term Investments | 19,518,693 | — | — | 19,518,693 | ||||||||||||
|
| |||||||||||||||
Total Investments in Securities | $ 443,641,987 | $ — | $ 1,621,649 | $ 445,263,636 | ||||||||||||
|
| |||||||||||||||
aFor detailed categories, see the accompanying Statement of Investments.
A reconciliation of assets in which Level 3 inputs are used in determining fair value is presented when there are significant Level 3 financial instruments at the beginning and/or end of the period.
10. Subsequent Events
The Fund has evaluated subsequent events through the issuance of the financial statements and determined that no events have occurred that require disclosure.
| Semiannual Report | FSC-23 | |||||
This page intentionally left blank.
Franklin Strategic Income VIP Fund
This semiannual report for Franklin Strategic Income VIP Fund covers the period ended June 30, 2018.
Class 2 Performance Summary as of June 30, 2018
The Fund’s Class 2 Shares had a -1.47% total return*,** for the six-month period ended June 30, 2018.
*The Fund has a fee waiver associated with any investment it makes in a Franklin Templeton money fund and/or other Franklin Templeton fund, contractually guaranteed through 4/30/19. Fund investment results reflect the fee waiver; without this waiver, the results would have been lower.
**Total return information is based on asset values calculated for shareholder transactions. Certain adjustments were made to the net assets of the Fund at 12/31/17 for financial reporting purposes, and as a result, the total returns based on those net asset values differ from the adjusted total returns reported in the Financial Highlights.
Performance reflects the Fund’s Class 2 operating expenses, but does not include any contract fees, expenses or sales charges. If they had been included, performance would be lower. These charges and deductions, particularly for variable life policies, can have a significant effect on contract values and insurance benefits. See the contract prospectus for a complete description of these expenses, including sales charges.
Performance data represent past performance, which does not guarantee future results. Investment return and principal value will fluctuate, and you may have a gain or loss when you sell your shares. Current performance may differ from figures shown.
| Semiannual Report | FSI-1 | |||||
FRANKLIN STRATEGIC INCOME VIP FUND
Fund Goal and Main Investments
The Fund seeks a high level of current income, with capital appreciation over the long term as a secondary goal. Under normal market conditions, the Fund invests primarily to predominantly in US and foreign debt securities, including those in emerging markets.
Fund Risks
All investments involve risks, including possible loss of principal. Bond prices generally move in the opposite direction of interest rates. Thus, as prices of bonds in the Fund adjust to a rise in interest rates, the Fund’s share price may decline. Changes in the financial strength of a bond issuer or in a bond’s credit rating may affect its value. High yields reflect the higher credit risks associated with certain lower rated securities held in the portfolio. Floating rate loans and high yield corporate bonds are rated below investment grade and are subject to greater risk of default, which could result in loss of principal—a risk that may be heightened in a slowing economy. The risks of foreign securities include currency fluctuations and political uncertainty. Investments in developing markets involve heightened risks related to the same factors, in addition to those associated with their relatively small size and lesser liquidity. Investing in derivative securities and the use of foreign currency techniques involve special risks as such may not achieve the anticipated benefits and/or may result in losses to the Fund. The Fund is actively managed but there is no guarantee that the manager’s investment decisions will produce the desired results. The Fund’s prospectus also includes a description of the main investment risks.
Performance Overview
You can find the Fund’s six-month total return in the Performance Summary. For comparison, the Fund’s benchmark, the Bloomberg Barclays US Aggregate Index, had a -1.62% total return for the period under review.1 The Fund’s peers, as measured by the Lipper Multi-Sector Income Funds Classification Average, had a -1.18% return.2
Economic and Market Overview
The US economy continued to grow during the six months under review. After moderating for three consecutive quarters,
the economy grew faster in 2018’s second quarter, driven by consumer spending, exports, business investment and government spending. The unemployment rate declined slightly from 4.1% in December 2017, as reported at the beginning of the six-month period, to 4.0% at period-end.3 Annual inflation, as measured by the Consumer Price Index, increased from 2.1% in December 2017, as reported at the beginning of the period, to 2.9% at period-end.3
In February 2018, the new US Federal Reserve (Fed) Chair Jerome Powell spoke before Congress for the first time and indicated the Fed saw signs of a continued strong labor market and economic growth. He reiterated the Fed’s intention to gradually raise interest rates in an effort to keep the economy from overheating and as inflation increases toward the Fed’s target. However, he noted there was no evidence of the economy overheating and he had yet to see a clear upward move in wages. The Fed raised its target range for the federal funds rate 0.25% each at its March and June 2018 meetings to 1.75%–2.00% and continued reducing its balance sheet as part of its ongoing plan to normalize monetary policy. In June, the Fed upgraded its economic forecast for 2018 and its inflation forecasts for 2018 and 2019. Furthermore, the Fed forecasted an additional rate hike for 2018 and 2019 than previously anticipated.
The 10-year Treasury yield, which moves inversely to its price, increased during the period. The yield rose to multi-year highs in February, April and May amid indications of higher inflation. However, some factors weighed on the Treasury yield at certain points during the period, including concerns about political turmoil in Italy, political uncertainties in the US, the Trump administration’s protectionist trade policies, and US trade disputes between its allies and China. Overall, the 10-year Treasury yield rose from 2.40% at the beginning of the period to 2.85% at period-end.
Investment Strategy
We allocate our investments among the various types of debt available based on our assessment of changing economic, global market, industry and issuer conditions. We use a top-down analysis of macroeconomic trends, combined with a bottom-up fundamental analysis of market sectors, industries
1. Source: Morningstar.
2. Source: Lipper, a Thomson Reuters Company.
One cannot invest directly in an index, and an index is not representative of the Fund’s portfolio. Please see Index Descriptions following the Fund Summaries.
3. Source: Bureau of Labor Statistics.
The dollar value, number of shares or principal amount, and names of all portfolio holdings are listed in the Fund’s Statement of Investments (SOI).
| FSI-2 | Semiannual Report | |||
FRANKLIN STRATEGIC INCOME VIP FUND
and issuers, seeking to take advantage of varying sector reactions to economic events. For example, we may evaluate business cycles, yield curves, country risk, and the relative interest rates among currencies, and values between and within markets. In selecting debt securities, we generally conduct our own analysis of the security’s intrinsic value rather than simply relying on the coupon rate or rating. We may also enter into various transactions involving certain currency-, interest rate-or credit-related derivative instruments.
What is the yield curve?
A yield curve is a line that plots the yield to maturity of bonds having equal credit quality against their maturity dates.
|
Manager’s Discussion
The Fund allocated assets across the broad fixed income markets. During the period, we maintained large allocations to spread sectors, primarily high-yield corporate credit, with smaller exposures to senior secured floating rate loans and investment-grade corporate bonds. The Fund also held positions in select non-US dollar global government bonds and securitized sectors. Additionally, the Fund sought to maintain a relatively defensive positioning to US interest rates.
The Fund’s exposure to sovereign emerging-market securities was the most significant contributor to performance. Non-dollar developed securities, tax-exempt municipal bonds, senior secured floating rate loans and non-agency residential mortgage-backed securities were all additive to performance. In addition, US dollar yield curve positioning boosted absolute returns.
In contrast, our currency exposures had a significant negative impact on returns. Additionally, exposure to high yield corporate credit, investment-grade corporate bonds and fixed-rate agency mortgage-backed securities detracted from performance.
The Fund utilized derivatives, including credit default swaps, currency forwards and government bond futures, primarily as a tool for efficient portfolio management and to manage overall portfolio risk. These derivative transactions may provide the same, or similar, net long or short exposure to select currencies, interest rates, countries, duration or credit risks compared to holding securities.
| Portfolio Composition* | ||||||||
Based on Consolidated Net Assets
| ||||||||
| 6/30/18 | 12/31/17 | |||||||
| High-Yield Corporate Bonds | 31.96% | 29.82% | ||||||
| Floating-Rate Loans | 17.86% | 16.10% | ||||||
| Investment-Grade Corporate Bonds | 16.56% | 17.60% | ||||||
| International Government & Agency Bonds | 10.21% | 9.07% | ||||||
| Agency Mortgage-Backed Securities | 9.14% | 9.90% | ||||||
| Collateralized Loan Obligations | 6.08% | 4.00% | ||||||
| Residential Mortgage-Backed Securities | 5.27% | 3.10% | ||||||
| U.S. Treasury Securities | 4.24% | 4.10% | ||||||
| Other | 2.89% | 0.90% | ||||||
| Commercial Mortgage-Backed Securities | 2.36% | 2.40% | ||||||
| Treasury-Inflation Protected Securities | 2.03% | 2.80% | ||||||
| Asset-Backed Securities | 1.98% | 2.10% | ||||||
| Municipal Bonds | 1.47% | 0.90% | ||||||
| Short Term Investments & Other Net Assets | -4.87% | -2.80% | ||||||
*Figures reflect certain derivatives held in the portfolio (or their underlying reference assets) and may not total 100% or may be negative due to rounding, use of any derivatives, unsettled trades or other factors. The composition may not match the Statement of Investments (SOI).
What is a currency forward?
A currency forward is an agreement between the Fund and a counterparty to buy or sell a foreign currency in exchange for another currency at a specific exchange rate on a future date.
|
What is a credit derivative?
A credit derivative is a contract agreement between the Fund and a counterparty that is principally used by the Fund to gain or increase exposure to certain financial assets and/or to hedge against credit risk.
|
What is meant by “hedge”?
To hedge an investment is to take a position intended to offset potential losses/gains that may be incurred by a companion financial instrument.
|
Thank you for your participation in Franklin Strategic Income VIP Fund. We look forward to serving your future investment needs.
| Semiannual Report | FSI-3 | |||||
FRANKLIN STRATEGIC INCOME VIP FUND
The foregoing information reflects our analysis, opinions and portfolio holdings as of June 30, 2018, the end of the reporting period. The way we implement our main investment strategies and the resulting portfolio holdings may change depending on factors such as market and economic conditions. These opinions may not be relied upon as investment advice or an offer for a particular security. The information is not a complete analysis of every aspect of any market, country, industry, security or the Fund. Statements of fact are from sources considered reliable, but the investment manager makes no representation or warranty as to their completeness or accuracy. Although historical performance is no guarantee of future results, these insights may help you understand our investment management philosophy.
| FSI-4 | Semiannual Report | |||
FRANKLIN STRATEGIC INCOME VIP FUND
Class 2 Fund Expenses
As an investor in a variable insurance contract (Contract) that indirectly provides for investment in an underlying mutual fund, you can incur transaction and/or ongoing expenses at both the Fund level and the Contract Level: (1) transaction expenses can include sales charges (loads) on purchases, surrender fees, transfer fees and premium taxes; and (2) ongoing expenses can include management fees, distribution and service (12b-1) fees, contract fees, annual maintenance fees, mortality and expense risk fees and other fees and expenses. All mutual funds and Contracts have some types of ongoing expenses. The table below shows Fund-level ongoing expenses and can help you understand these costs and compare them with those of other mutual funds offered through the Contract. The table assumes a $1,000 investment held for the six months indicated. Please refer to the Fund prospectus for additional information on operating expenses.
Actual Fund Expenses
The table below provides information about the actual account values and actual expenses in the columns under the heading “Actual.” In these columns the Fund’s actual return, which includes the effect of ongoing Fund expenses but does not include the effect of ongoing Contract expenses, is used to calculate the “Ending Account Value.” You can estimate the Fund-level expenses you paid during the period by following these steps (of course, your account value and expenses will differ from those in this illustration): Divide your account value by $1,000 (if your account had an $8,600 value, then $8,600 ÷ $1,000 = 8.6). Then multiply the result by the number under the headings “Actual” and “Fund-Level Expenses Paid During Period” (if Fund-Level Expenses Paid During Period were $ 7.50, then 8.6 x $ 7.50 = $64.50). In this illustration, the estimated expenses paid this period at the Fund level are $64.50.
Hypothetical Example for Comparison with Other Mutual Funds
Under the heading “Hypothetical” in the table, information is provided about hypothetical account values and hypothetical expenses based on the Fund’s actual expense ratio and an assumed rate of return of 5% per year before expenses, which is not the Fund’s actual return. This information may not be used to estimate the actual ending account balance or expenses you paid for the period, but it can help you compare ongoing costs of investing in the Fund with those of other mutual funds offered through the Contract. To do so, compare this 5% hypothetical example with the 5% hypothetical examples that appear in the shareholder reports of other funds offered through the Contract.
Please note that expenses shown in the table are meant to highlight ongoing costs at the Fund level only and do not reflect any ongoing expenses at the Contract level, or transaction expenses at either the Fund or Contract levels. In addition, while the Fund does not have transaction expenses, if the transaction and ongoing expenses at the Contract level were included, the expenses shown below would be higher. You should consult your Contract prospectus or disclosure document for more information.
| Actual (actual return after expenses) | Hypothetical (5% annual return before expenses) | |||||||||||
Share Class | Beginning Account Value 1/1/18 | Ending Account Value 6/30/18 | Fund-Level Expenses Paid During Period 1/1/18–6/30/181,2 | Ending Account Value 6/30/18 | Fund-Level Expenses Paid During Period 1/1/18–6/30/181,2 | Net Annualized Expense Ratio2 | ||||||
|
|
|
| |||||||||
Class 2 | $1,000 | $989.00 | $4.29 | $1,020.48 | $4.36 | 0.87% | ||||||
1. Expenses are equal to the annualized expense ratio for the six-month period as indicated above—in the far right column—multiplied by the simple average account value over the period indicated, and then multiplied by 181/365 to reflect the one-half year period.
2. Reflects expenses after fee waivers and expense reimbursements. Does not include any ongoing expenses of the Contract for which the Fund is an investment option or acquired fund fees and expenses.
| Semiannual Report | FSI-5 | |||||
FRANKLIN TEMPLETON VARIABLE INSURANCE PRODUCTS TRUST
Consolidated Financial Highlights
Franklin Strategic Income VIP Fund
Six Months Ended (unaudited) | Year Ended December 31, | |||||||||||||||||||||||
| 2017 | 2016 | 2015 | 2014 | 2013 | ||||||||||||||||||||
| ||||||||||||||||||||||||
Class 1 | ||||||||||||||||||||||||
| Per share operating performance | ||||||||||||||||||||||||
(for a share outstanding throughout the period) | ||||||||||||||||||||||||
Net asset value, beginning of period | $11.15 | $11.01 | $10.55 | $11.90 | $12.64 | $13.17 | ||||||||||||||||||
|
| |||||||||||||||||||||||
Income from investment operationsa: | ||||||||||||||||||||||||
Net investment incomeb | 0.23 | 0.45 | 0.48 | 0.53 | 0.54 | 0.59 | ||||||||||||||||||
Net realized and unrealized gains (losses) | (0.35 | ) | 0.04 | 0.37 | (0.91 | ) | (0.25 | ) | (0.15) | |||||||||||||||
|
| |||||||||||||||||||||||
Total from investment operations | (0.12 | ) | 0.49 | 0.85 | (0.38 | ) | 0.29 | 0.44 | ||||||||||||||||
Less distributions from: | ||||||||||||||||||||||||
Net investment income and net foreign currency gains | (0.32 | ) | (0.35 | ) | (0.39 | ) | (0.77 | ) | (0.78 | ) | (0.80) | |||||||||||||
Net realized gains | — | — | — | (0.20 | ) | (0.25 | ) | (0.17) | ||||||||||||||||
|
| |||||||||||||||||||||||
Total distributions | (0.32 | ) | (0.35 | ) | (0.39 | ) | (0.97 | ) | (1.03 | ) | (0.97) | |||||||||||||
|
| |||||||||||||||||||||||
Net asset value, end of period | $10.71 | $11.15 | $11.01 | $10.55 | $11.90 | $12.64 | ||||||||||||||||||
|
| |||||||||||||||||||||||
Total returnc | (1.09)% | 4.46% | 8.25% | (3.62)% | 2.12% | 3.52% | ||||||||||||||||||
| Ratios to average net assetsd | ||||||||||||||||||||||||
Expenses before waiver and payments by affiliates | 0.67% | 0.68% | 0.67% | 0.63% | 0.63% | 0.60% | ||||||||||||||||||
Expenses net of waiver and payments by affiliatese | 0.62% | 0.63% | 0.60% | 0.62% | 0.62% | 0.60% | ||||||||||||||||||
Net investment income | 4.17% | 4.00% | 4.42% | 4.71% | 4.34% | 4.58% | ||||||||||||||||||
| Supplemental data | ||||||||||||||||||||||||
Net assets, end of period (000’s) | $333,801 | $361,465 | $396,170 | $441,658 | $574,850 | $705,493 | ||||||||||||||||||
Portfolio turnover rate | 62.81% | 108.73% | 128.51% | 85.85% | 55.64% | 48.06% | ||||||||||||||||||
Portfolio turnover rate excluding mortgage dollar rollsf | 30.03% | 48.11% | 77.93% | 51.47% | 48.86% | 47.01% | ||||||||||||||||||
aThe amount shown for a share outstanding throughout the period may not correlate with the Consolidated Statement of Operations for the period due to the timing of sales and repurchases of the Fund’s shares in relation to income earned and/or fluctuating fair value of the investments of the Fund.
bBased on average daily shares outstanding.
cTotal return does not include fees, charges or expenses imposed by the variable annuity and life insurance contracts for which Franklin Templeton Variable Insurance Products Trust serves as an underlying investment vehicle. Total return is not annualized for periods less than one year.
dRatios are annualized for periods less than one year.
eBenefit of expense reduction rounds to less than 0.01%.
fSee Note 1(h) regarding mortgage dollar rolls.
| FSI-6 | Semiannual Report | The accompanying notes are an integral part of these consolidated financial statements. | |||
FRANKLIN TEMPLETON VARIABLE INSURANCE PRODUCTS TRUST
CONSOLIDATED FINANCIAL HIGHLIGHTS
Franklin Strategic Income VIP Fund (continued)
Six Months Ended (unaudited) | Year Ended December 31, | |||||||||||||||||||||||
| 2017 | 2016 | 2015 | 2014 | 2013 | ||||||||||||||||||||
| ||||||||||||||||||||||||
Class 2 | ||||||||||||||||||||||||
| Per share operating performance | ||||||||||||||||||||||||
(for a share outstanding throughout the period) | ||||||||||||||||||||||||
Net asset value, beginning of period | $10.76 | $10.64 | $10.21 | $11.55 | $12.30 | $12.84 | ||||||||||||||||||
|
| |||||||||||||||||||||||
Income from investment operationsa: | ||||||||||||||||||||||||
Net investment incomeb | 0.21 | 0.40 | 0.43 | 0.49 | 0.49 | 0.54 | ||||||||||||||||||
Net realized and unrealized gains (losses) | (0.33 | ) | 0.04 | 0.36 | (0.89 | ) | (0.24 | ) | (0.13) | |||||||||||||||
|
| |||||||||||||||||||||||
Total from investment operations | (0.12 | ) | 0.44 | 0.79 | (0.40 | ) | 0.25 | 0.41 | ||||||||||||||||
|
| |||||||||||||||||||||||
Less distributions from: | ||||||||||||||||||||||||
Net investment income and net foreign currency gains | (0.29 | ) | (0.32 | ) | (0.36 | ) | (0.74 | ) | (0.75 | ) | (0.78) | |||||||||||||
Net realized gains | — | — | — | (0.20 | ) | (0.25 | ) | (0.17) | ||||||||||||||||
|
| |||||||||||||||||||||||
Total distributions | (0.29 | ) | (0.32 | ) | (0.36 | ) | (0.94 | ) | (1.00 | ) | (0.95) | |||||||||||||
|
| |||||||||||||||||||||||
Net asset value, end of period | $10.35 | $10.76 | $10.64 | $10.21 | $11.55 | $12.30 | ||||||||||||||||||
|
| |||||||||||||||||||||||
Total returnc | (1.10)% | 4.17% | 7.94% | (3.87)% | 1.86% | 3.32% | ||||||||||||||||||
Ratios to average net assetsd | ||||||||||||||||||||||||
Expenses before waiver and payments by affiliates | 0.92% | 0.93% | 0.92% | 0.88% | 0.88% | 0.85% | ||||||||||||||||||
Expenses net of waiver and payments by affiliatese | 0.87% | 0.88% | 0.85% | 0.87% | 0.87% | 0.85% | ||||||||||||||||||
Net investment income | 3.92% | 3.75% | 4.17% | 4.46% | 4.09% | 4.33% | ||||||||||||||||||
Supplemental data | ||||||||||||||||||||||||
Net assets, end of period (000’s) | $208,250 | $214,271 | $203,418 | $202,192 | $206,571 | $175,307 | ||||||||||||||||||
Portfolio turnover rate | 62.81% | 108.73% | 128.51% | 85.85% | 55.64% | 48.06% | ||||||||||||||||||
Portfolio turnover rate excluding mortgage dollar rollsf | 30.03% | 48.11% | 77.93% | 51.47% | 48.86% | 47.01% | ||||||||||||||||||
aThe amount shown for a share outstanding throughout the period may not correlate with the Consolidated Statement of Operations for the period due to the timing of sales and repurchases of the Fund’s shares in relation to income earned and/or fluctuating fair value of the investments of the Fund.
bBased on average daily shares outstanding.
cTotal return does not include fees, charges or expenses imposed by the variable annuity and life insurance contracts for which Franklin Templeton Variable Insurance Products Trust serves as an underlying investment vehicle. Total return is not annualized for periods less than one year.
dRatios are annualized for periods less than one year.
eBenefit of expense reduction rounds to less than 0.01%.
fSee Note 1(h) regarding mortgage dollar rolls.
| The accompanying notes are an integral part of these consolidated financial statements. | Semiannual Report | FSI-7 | |||||
FRANKLIN TEMPLETON VARIABLE INSURANCE PRODUCTS TRUST
CONSOLIDATED FINANCIAL HIGHLIGHTS
Franklin Strategic Income VIP Fund (continued)
Six Months Ended (unaudited) | Year Ended December 31, | |||||||||||||||||||||||
| 2017 | 2016 | 2015 | 2014 | 2013 | ||||||||||||||||||||
| ||||||||||||||||||||||||
Class 4 | ||||||||||||||||||||||||
| Per share operating performance | ||||||||||||||||||||||||
(for a share outstanding throughout the period) | ||||||||||||||||||||||||
Net asset value, beginning of period | $11.04 | $10.90 | $10.44 | $11.78 | $12.51 | $13.04 | ||||||||||||||||||
|
| |||||||||||||||||||||||
Income from investment operationsa: | ||||||||||||||||||||||||
Net investment incomeb | 0.21 | 0.40 | 0.43 | 0.49 | 0.49 | 0.54 | ||||||||||||||||||
Net realized and unrealized gains (losses) | (0.34 | ) | 0.04 | 0.38 | (0.91 | ) | (0.25 | ) | (0.14) | |||||||||||||||
|
| |||||||||||||||||||||||
Total from investment operations | (0.13 | ) | 0.44 | 0.81 | (0.42 | ) | 0.24 | 0.40 | ||||||||||||||||
|
| |||||||||||||||||||||||
Less distributions from: | ||||||||||||||||||||||||
Net investment income and net foreign currency gains | (0.27 | ) | (0.30 | ) | (0.35 | ) | (0.72 | ) | (0.72 | ) | (0.76) | |||||||||||||
Net realized gains | — | — | — | (0.20 | ) | (0.25 | ) | (0.17) | ||||||||||||||||
|
| |||||||||||||||||||||||
Total distributions | (0.27 | ) | (0.30 | ) | (0.35 | ) | (0.92 | ) | (0.97 | ) | (0.93) | |||||||||||||
|
| |||||||||||||||||||||||
Net asset value, end of period | $10.64 | $11.04 | $10.90 | $10.44 | $11.78 | $12.51 | ||||||||||||||||||
|
| |||||||||||||||||||||||
Total returnc | (1.14)% | 4.08% | 7.86% | (3.98)% | 1.75% | 3.17% | ||||||||||||||||||
Ratios to average net assetsd | ||||||||||||||||||||||||
Expenses before waiver and payments by affiliates | 1.02% | 1.03% | 1.02% | 0.98% | 0.98% | 0.95% | ||||||||||||||||||
Expenses net of waiver and payments by affiliatese | 0.97% | 0.98% | 0.95% | 0.97% | 0.97% | 0.95% | ||||||||||||||||||
Net investment income | 3.82% | 3.65% | 4.07% | 4.36% | 3.99% | 4.23% | ||||||||||||||||||
Supplemental data | ||||||||||||||||||||||||
Net assets, end of period (000’s) | $66,630 | $74,013 | $80,175 | $92,965 | $113,986 | $134,970 | ||||||||||||||||||
Portfolio turnover rate | 62.81% | 108.73% | 128.51% | 85.85% | 55.64% | 48.06% | ||||||||||||||||||
Portfolio turnover rate excluding mortgage dollar rollsf | 30.03% | 48.11% | 77.93% | 51.47% | 48.86% | 47.01% | ||||||||||||||||||
aThe amount shown for a share outstanding throughout the period may not correlate with the Consolidated Statement of Operations for the period due to the timing of sales and repurchases of the Fund’s shares in relation to income earned and/or fluctuating fair value of the investments of the Fund.
bBased on average daily shares outstanding.
cTotal return does not include fees, charges or expenses imposed by the variable annuity and life insurance contracts for which Franklin Templeton Variable Insurance Products Trust serves as an underlying investment vehicle. Total return is not annualized for periods less than one year.
dRatios are annualized for periods less than one year.
eBenefit of expense reduction rounds to less than 0.01%.
fSee Note 1(h) regarding mortgage dollar rolls.
| FSI-8 | Semiannual Report | The accompanying notes are an integral part of these consolidated financial statements. | |||
FRANKLIN TEMPLETON VARIABLE INSURANCE PRODUCTS TRUST
Consolidated Statement of Investments, June 30, 2018 (unaudited)
Franklin Strategic Income VIP Fund
| Country | Shares/ Warrants | Value | ||||||||||||||
Common Stocks and Other Equity Interests 0.4% | ||||||||||||||||
Consumer Services 0.1% | ||||||||||||||||
a,aa,ab Turtle Bay Resort | United States | 1,901,449 | $ | 343,871 | ||||||||||||
|
| |||||||||||||||
Energy 0.3% | ||||||||||||||||
a Birch Permian Holdings Inc. | United States | 99,812 | 1,197,744 | |||||||||||||
a Energy XXI Gulf Coast Inc., wts., 12/30/21 | United States | 4,009 | 40 | |||||||||||||
a Halcon Resources Corp. | United States | 97,655 | 428,706 | |||||||||||||
a Halcon Resources Corp., wts., 9/09/20 | United States | 8,155 | 3,384 | |||||||||||||
a Linn Energy Inc. | United States | 8,565 | 331,037 | |||||||||||||
a Midstates Petroleum Co. Inc. | United States | 698 | 9,500 | |||||||||||||
a,ab Midstates Petroleum Co. Inc., wts., 4/21/20 | United States | 4,955 | 132 | |||||||||||||
|
| |||||||||||||||
| 1,970,543 | ||||||||||||||||
|
| |||||||||||||||
Materials 0.0%† | ||||||||||||||||
a Verso Corp., A | United States | 6,954 | 151,319 | |||||||||||||
a Verso Corp., wts., 7/25/23 | United States | 732 | 2,818 | |||||||||||||
|
| |||||||||||||||
| 154,137 | ||||||||||||||||
|
| |||||||||||||||
Retailing 0.0%† | ||||||||||||||||
a,ab,b K2016470219 South Africa Ltd., A | South Africa | 14,792,309 | 10,788 | |||||||||||||
a,ab,b K2016470219 South Africa Ltd., B | South Africa | 1,472,041 | 1,074 | |||||||||||||
|
| |||||||||||||||
| 11,862 | ||||||||||||||||
|
| |||||||||||||||
Transportation 0.0%† | ||||||||||||||||
a,ab CEVA Logistics AG | Switzerland | 7,190 | 161,881 | |||||||||||||
|
| |||||||||||||||
Total Common Stocks and Other Equity Interests | 2,642,294 | |||||||||||||||
|
| |||||||||||||||
Management Investment Companies 6.5% | ||||||||||||||||
Diversified Financials 6.5% | ||||||||||||||||
c Franklin Lower Tier Floating Rate Fund | United States | 2,081,861 | 20,423,054 | |||||||||||||
c Franklin Middle Tier Floating Rate Fund | United States | 2,024,951 | 19,135,791 | |||||||||||||
|
| |||||||||||||||
Total Management Investment Companies | 39,558,845 | |||||||||||||||
|
| |||||||||||||||
| | Principal Amount | * | ||||||||||||||
Corporate Bonds 47.6% | ||||||||||||||||
Automobiles & Components 0.5% | ||||||||||||||||
Fiat Chrysler Automobiles NV, senior note, 5.25%, 4/15/23 | United Kingdom | 1,200,000 | 1,211,040 | |||||||||||||
The Goodyear Tire & Rubber Co., senior bond, 5.00%, 5/31/26 | United States | 1,800,000 | 1,680,750 | |||||||||||||
senior note, 5.125%, 11/15/23 | United States | 400,000 | 397,400 | |||||||||||||
|
| |||||||||||||||
| 3,289,190 | ||||||||||||||||
|
| |||||||||||||||
Banks 4.4% | ||||||||||||||||
Bank of America Corp., | ||||||||||||||||
senior bond, 3.248%, 10/21/27 | United States | 800,000 | 746,164 | |||||||||||||
senior note, 3.50%, 4/19/26 | United States | 4,800,000 | 4,646,010 | |||||||||||||
CIT Group Inc., senior bond, 5.00%, 8/15/22 | United States | 2,058,000 | 2,086,298 | |||||||||||||
Citigroup Inc., senior note, 3.30%, 4/27/25 | United States | 300,000 | 287,971 | |||||||||||||
senior note, 3.40%, 5/01/26 | United States | 3,100,000 | 2,946,140 | |||||||||||||
senior note, 3.20%, 10/21/26 | United States | 3,000,000 | 2,794,374 | |||||||||||||
| Semiannual Report | FSI-9 | |||||
FRANKLIN TEMPLETON VARIABLE INSURANCE PRODUCTS TRUST
CONSOLIDATED STATEMENT OF INVESTMENTS (UNAUDITED)
Franklin Strategic Income VIP Fund (continued)
| Country | Principal Amount* | Value | ||||||||||||||
Corporate Bonds (continued) | ||||||||||||||||
Banks (continued) | ||||||||||||||||
Citigroup Inc., (continued) | ||||||||||||||||
sub. bond, 5.50%, 9/13/25 | United States | 500,000 | $ | 531,481 | ||||||||||||
sub. note, 4.05%, 7/30/22 | United States | 300,000 | 301,814 | |||||||||||||
d ICICI Bank Ltd./Dubai, senior note, 144A, 3.80%, 12/14/27 | India | 1,600,000 | 1,463,168 | |||||||||||||
JPMorgan Chase & Co., | ||||||||||||||||
e junior sub. bond, R, 6.00% to 8/01/23, FRN thereafter, Perpetual | United States | 1,500,000 | 1,535,625 | |||||||||||||
e junior sub. bond, X, 6.10% to 10/01/24, FRN thereafter, Perpetual | United States | 500,000 | 516,925 | |||||||||||||
senior bond, 3.30%, 4/01/26 | United States | 400,000 | 382,766 | |||||||||||||
senior bond, 3.20%, 6/15/26 | United States | 1,500,000 | 1,419,361 | |||||||||||||
sub. note, 3.375%, 5/01/23 | United States | 1,000,000 | 977,018 | |||||||||||||
sub. note, 3.875%, 9/10/24 | United States | 1,000,000 | 991,121 | |||||||||||||
Royal Bank of Scotland Group PLC, sub. note, 5.125%, 5/28/24 | United Kingdom | 500,000 | 504,843 | |||||||||||||
f Turkiye Vakiflar Bankasi TAO, secured note, Reg S, 2.375%, 11/04/22 | Turkey | 500,000 | EUR | 578,868 | ||||||||||||
Wells Fargo & Co., | ||||||||||||||||
e junior sub. bond, S, 5.90% to 6/15/24, FRN thereafter, Perpetual | United States | 1,500,000 | 1,506,825 | |||||||||||||
senior note, 3.00%, 4/22/26 | United States | 2,500,000 | 2,326,183 | |||||||||||||
|
| |||||||||||||||
| 26,542,955 | ||||||||||||||||
|
| |||||||||||||||
Capital Goods 1.6% | ||||||||||||||||
Aircastle Ltd., senior note, 4.125%, 5/01/24 | United States | 2,600,000 | 2,496,260 | |||||||||||||
d Beacon Roofing Supply Inc., senior note, 144A, 4.875%, 11/01/25 | United States | 1,600,000 | 1,488,000 | |||||||||||||
CNH Industrial NV, senior bond, 3.85%, 11/15/27 | United Kingdom | 700,000 | 651,627 | |||||||||||||
General Electric Co., senior bond, 4.50%, 3/11/44 | United States | 200,000 | 196,372 | |||||||||||||
Legrand France SA, senior bond, 8.50%, 2/15/25 | France | 100,000 | 125,471 | |||||||||||||
Tennant Co., senior note, 5.625%, 5/01/25 | United States | 1,000,000 | 997,500 | |||||||||||||
d Terex Corp., senior note, 144A, 5.625%, 2/01/25 | United States | 2,000,000 | 1,992,500 | |||||||||||||
d Vertiv Group Corp., senior note, 144A, 9.25%, 10/15/24 | United States | 1,600,000 | 1,576,000 | |||||||||||||
|
| |||||||||||||||
| 9,523,730 | ||||||||||||||||
|
| |||||||||||||||
Commercial & Professional Services 0.8% | ||||||||||||||||
d IHS Markit Ltd., senior note, 144A, 4.00%, 3/01/26 | United States | 1,200,000 | 1,140,000 | |||||||||||||
United Rentals North America Inc., senior bond, 5.875%, 9/15/26 | United States | 1,600,000 | 1,618,000 | |||||||||||||
d West Corp., senior note, 144A, 8.50%, 10/15/25 | United States | 2,500,000 | 2,293,750 | |||||||||||||
|
| |||||||||||||||
| 5,051,750 | ||||||||||||||||
|
| |||||||||||||||
Consumer Durables & Apparel 1.3% | ||||||||||||||||
d Hanesbrands Inc., senior bond, 144A, 4.875%, 5/15/26 | United States | 2,700,000 | 2,619,000 | |||||||||||||
KB Home, | ||||||||||||||||
senior note, 4.75%, 5/15/19 | United States | 1,000,000 | 1,009,100 | |||||||||||||
senior note, 7.00%, 12/15/21 | United States | 1,200,000 | 1,266,000 | |||||||||||||
PulteGroup Inc., senior bond, 5.00%, 1/15/27 | United States | 2,000,000 | 1,907,500 | |||||||||||||
Toll Brothers Finance Corp., senior bond, 5.625%, 1/15/24 | United States | 1,100,000 | 1,137,125 | |||||||||||||
|
| |||||||||||||||
| 7,938,725 | ||||||||||||||||
|
| |||||||||||||||
Consumer Services 2.4% | ||||||||||||||||
d 1011778 BC ULC/New Red Finance Inc., | ||||||||||||||||
secured note, second lien, 144A, 5.00%, 10/15/25 | Canada | 1,200,000 | 1,141,440 | |||||||||||||
senior secured note, first lien, 144A, 4.25%, 5/15/24 | Canada | 900,000 | 857,250 | |||||||||||||
| FSI-10 | Semiannual Report | |||
FRANKLIN TEMPLETON VARIABLE INSURANCE PRODUCTS TRUST
CONSOLIDATED STATEMENT OF INVESTMENTS (UNAUDITED)
Franklin Strategic Income VIP Fund (continued)
| Country | Principal Amount* | Value | ||||||||||||||
Corporate Bonds (continued) | ||||||||||||||||
Consumer Services (continued) | ||||||||||||||||
d Golden Nugget Inc., senior note, 144A, 6.75%, 10/15/24 | United States | 1,400,000 | $ | 1,403,752 | ||||||||||||
d International Game Technology PLC, senior secured bond, 144A, 6.50%, 2/15/25 | United States | 3,300,000 | 3,423,750 | |||||||||||||
d KFC Holding Co./Pizza Hut Holdings LLC/Taco Bell of America LLC, senior note, 144A, 5.00%, 6/01/24 | United States | 900,000 | 890,730 | |||||||||||||
senior note, 144A, 5.25%, 6/01/26 | United States | 1,300,000 | 1,283,750 | |||||||||||||
Marriott International Inc., senior bond, 3.75%, 10/01/25 | United States | 2,800,000 | 2,749,075 | |||||||||||||
MGM Resorts International, senior note, 6.75%, 10/01/20 | United States | 200,000 | 210,000 | |||||||||||||
d,g Stars Group Holdings BV/Stars Group US Co-Borrower LLC, senior note, 144A, 7.00%, 7/15/26 | Canada | 700,000 | 709,187 | |||||||||||||
d Wynn Las Vegas LLC/Wynn Las Vegas Capital Corp., senior bond, 144A, 5.50%, 3/01/25 | United States | 1,200,000 | 1,182,000 | |||||||||||||
d Wynn Macau Ltd., senior note, 144A, 4.875%, 10/01/24 | Macau | 1,000,000 | 957,920 | |||||||||||||
|
| |||||||||||||||
| 14,808,854 | ||||||||||||||||
|
| |||||||||||||||
Diversified Financials 2.6% | ||||||||||||||||
Capital One Financial Corp., senior note, 3.20%, 2/05/25 | United States | 2,000,000 | 1,879,755 | |||||||||||||
The Goldman Sachs Group Inc., | ||||||||||||||||
senior note, 3.50%, 1/23/25 | United States | 3,000,000 | 2,898,713 | |||||||||||||
senior note, 3.75%, 2/25/26 | United States | 1,500,000 | 1,455,255 | |||||||||||||
d Lincoln Finance Ltd., senior secured note, 144A, 6.875%, 4/15/21 | Netherlands | 600,000 | EUR | 725,665 | ||||||||||||
Morgan Stanley, | ||||||||||||||||
senior bond, 3.591% to 7/22/27, FRN thereafter, 7/22/28 | United States | 1,000,000 | 951,169 | |||||||||||||
senior note, 3.875%, 1/27/26 | United States | 4,200,000 | 4,136,973 | |||||||||||||
Navient Corp., | ||||||||||||||||
senior note, 6.625%, 7/26/21 | United States | 800,000 | 823,760 | |||||||||||||
senior note, 7.25%, 9/25/23 | United States | 2,500,000 | 2,631,250 | |||||||||||||
senior note, 6.125%, 3/25/24 | United States | 500,000 | 496,250 | |||||||||||||
|
| |||||||||||||||
| 15,998,790 | ||||||||||||||||
|
| |||||||||||||||
Energy 5.0% | ||||||||||||||||
Anadarko Petroleum Corp., | ||||||||||||||||
senior bond, 3.45%, 7/15/24 | United States | 100,000 | 96,455 | |||||||||||||
senior bond, 7.95%, 6/15/39 | United States | 100,000 | 131,819 | |||||||||||||
Apache Corp., senior bond, 2.625%, 1/15/23 | United States | 1,900,000 | 1,804,621 | |||||||||||||
d BG Energy Capital PLC, senior bond, 144A, 5.125%, 10/15/41 | United Kingdom | 100,000 | 111,226 | |||||||||||||
d California Resources Corp., secured note, second lien, 144A, 8.00%, 12/15/22 | United States | 716,000 | 653,350 | |||||||||||||
Cheniere Corpus Christi Holdings LLC, | ||||||||||||||||
senior secured note, first lien, 7.00%, 6/30/24 | United States | 800,000 | 875,000 | |||||||||||||
senior secured note, first lien, 5.875%, 3/31/25 | United States | 700,000 | 730,625 | |||||||||||||
d Cheniere Energy Partners LP, senior secured note, first lien, 144A, 5.25%, 10/01/25 | United States | 1,200,000 | 1,173,540 | |||||||||||||
CNOOC Finance 2015 USA LLC, senior note, 3.50%, 5/05/25 | China | 1,300,000 | 1,255,384 | |||||||||||||
CONSOL Energy Inc., senior note, 5.875%, 4/15/22 | United States | 2,500,000 | 2,519,225 | |||||||||||||
Energy Transfer Equity LP, senior note, first lien, 7.50%, 10/15/20 | United States | 1,900,000 | 2,030,625 | |||||||||||||
Energy Transfer Partners LP, senior note, 5.20%, 2/01/22 | United States | 1,000,000 | 1,037,889 | |||||||||||||
Energy Transfer Partners LP/Regency Energy Finance Corp., | ||||||||||||||||
senior note, 5.875%, 3/01/22 | United States | 200,000 | 211,683 | |||||||||||||
senior note, 5.00%, 10/01/22 | United States | 500,000 | 518,033 | |||||||||||||
| Semiannual Report | FSI-11 | |||||
FRANKLIN TEMPLETON VARIABLE INSURANCE PRODUCTS TRUST
CONSOLIDATED STATEMENT OF INVESTMENTS (UNAUDITED)
Franklin Strategic Income VIP Fund (continued)
| Country | Principal Amount* | Value | ||||||||||||||
Corporate Bonds (continued) | ||||||||||||||||
Energy (continued) | ||||||||||||||||
d,h EnQuest PLC, senior note, 144A, PIK, 7.00%, 4/15/22 | United Kingdom | 1,262,556 | $ | 1,133,967 | ||||||||||||
Enterprise Products Operating LLC, senior bond, 6.125%, 10/15/39 | United States | 100,000 | 114,441 | |||||||||||||
d,i Gaz Capital SA, (OJSC Gazprom), loan participation, senior note, 144A, 3.85%, 2/06/20 | Russia | 1,500,000 | 1,504,133 | |||||||||||||
Kinder Morgan Inc., | ||||||||||||||||
senior bond, 4.30%, 6/01/25 | United States | 2,000,000 | 1,992,489 | |||||||||||||
senior note, 3.15%, 1/15/23 | United States | 1,500,000 | 1,449,100 | |||||||||||||
Martin Midstream Partners LP/Martin Midstream Finance Corp., senior note, 7.25%, 2/15/21 | United States | 2,000,000 | 1,985,000 | |||||||||||||
Oceaneering International Inc., senior note, 4.65%, 11/15/24 | United States | 200,000 | 191,232 | |||||||||||||
Sabine Pass Liquefaction LLC, | ||||||||||||||||
senior secured note, first lien, 5.625%, 2/01/21 | United States | 2,000,000 | 2,092,756 | |||||||||||||
senior secured note, first lien, 5.625%, 4/15/23 | United States | 900,000 | 955,537 | |||||||||||||
Sanchez Energy Corp., senior note, 6.125%, 1/15/23 | United States | 300,000 | 204,750 | |||||||||||||
d Sinopec Group Overseas Development 2016 Ltd., senior note, 144A, 2.75%, 9/29/26 | China | 1,300,000 | 1,170,280 | |||||||||||||
d Sunoco LP/Sunoco Finance Corp., senior note, 144A, 4.875%, 1/15/23 | United States | 600,000 | 577,500 | |||||||||||||
d,h W&T Offshore Inc., | ||||||||||||||||
secured note, second lien, 144A, PIK, 9.00%, 5/15/20 | United States | 499,995 | 501,245 | |||||||||||||
senior secured note, third lien, 144A, PIK, 10.00%, 6/15/21 | United States | 453,003 | 430,146 | |||||||||||||
Weatherford International Ltd., | ||||||||||||||||
senior note, 7.75%, 6/15/21 | United States | 800,000 | 826,000 | |||||||||||||
senior note, 8.25%, 6/15/23 | United States | 1,000,000 | 994,590 | |||||||||||||
d Woodside Finance Ltd., | ||||||||||||||||
senior bond, 144A, 3.70%, 3/15/28 | Australia | 800,000 | 759,856 | |||||||||||||
senior note, 144A, 3.70%, 9/15/26 | Australia | 500,000 | 481,133 | |||||||||||||
|
| |||||||||||||||
| 30,513,630 | ||||||||||||||||
|
| |||||||||||||||
Food & Staples Retailing 0.9% | ||||||||||||||||
d Aramark Services Inc., senior bond, 144A, 5.00%, 2/01/28 | United States | 800,000 | 766,000 | |||||||||||||
Kroger Co., senior bond, 2.65%, 10/15/26 | United States | 1,400,000 | 1,241,165 | |||||||||||||
Walgreens Boots Alliance Inc., senior note, 3.80%, 11/18/24 | United States | 3,200,000 | 3,145,960 | |||||||||||||
|
| |||||||||||||||
| 5,153,125 | ||||||||||||||||
|
| |||||||||||||||
Food, Beverage & Tobacco 1.4% | ||||||||||||||||
Bunge Ltd. Finance Corp., senior note, 3.25%, 8/15/26 | United States | 200,000 | 182,800 | |||||||||||||
Coca-Cola Femsa SAB de CV, senior bond, 5.25%, 11/26/43 | Mexico | 200,000 | 224,125 | |||||||||||||
d Imperial Brands Finance PLC, senior note, 144A, 3.50%, 2/11/23 | United Kingdom | 2,100,000 | 2,053,745 | |||||||||||||
d JBS USA LLC/Finance Inc., senior note, 144A, 5.75%, 6/15/25 | United States | 500,000 | 467,500 | |||||||||||||
Kraft Heinz Foods Co., senior bond, 3.00%, 6/01/26 | United States | 2,400,000 | 2,164,235 | |||||||||||||
d Lamb Weston Holdings Inc., | ||||||||||||||||
senior note, 144A, 4.625%, 11/01/24 | United States | 600,000 | 586,500 | |||||||||||||
senior note, 144A, 4.875%, 11/01/26 | United States | 1,400,000 | 1,365,000 | |||||||||||||
d Post Holdings Inc., | ||||||||||||||||
senior bond, 144A, 5.625%, 1/15/28 | United States | 500,000 | 470,625 | |||||||||||||
senior note, 144A, 5.50%, 3/01/25 | United States | 1,000,000 | 978,750 | |||||||||||||
Reynolds American Inc., senior note, 4.45%, 6/12/25 | United Kingdom | 200,000 | 201,290 | |||||||||||||
|
| |||||||||||||||
| 8,694,570 | ||||||||||||||||
|
| |||||||||||||||
| FSI-12 | Semiannual Report | |||
FRANKLIN TEMPLETON VARIABLE INSURANCE PRODUCTS TRUST
CONSOLIDATED STATEMENT OF INVESTMENTS (UNAUDITED)
| Franklin Strategic Income VIP Fund (continued) | ||||||||||||||||
| Country | Principal Amount* | Value | ||||||||||||||
Corporate Bonds (continued) | ||||||||||||||||
Health Care Equipment & Services 2.6% | ||||||||||||||||
d Avantor Inc., senior secured note, first lien, 144A, 6.00%, 10/01/24 | United States | 2,000,000 | $ | 1,983,400 | ||||||||||||
Centene Corp., senior note, 4.75%, 5/15/22 | United States | 1,700,000 | 1,719,125 | |||||||||||||
d Centene Escrow I Corp., senior note, 144A, 5.375%, 6/01/26 | United States | 600,000 | 609,378 | |||||||||||||
CHS/Community Health Systems Inc., | ||||||||||||||||
senior note, 6.875%, 2/01/22 | United States | 349,000 | 179,735 | |||||||||||||
d senior note, 144A, 8.125%, 6/30/24 | United States | 38,000 | 31,588 | |||||||||||||
senior secured note, first lien, 6.25%, 3/31/23 | United States | 500,000 | 460,000 | |||||||||||||
CVS Health Corp., senior bond, 4.30%, 3/25/28 | United States | 1,000,000 | 987,960 | |||||||||||||
DaVita Inc., | ||||||||||||||||
senior bond, 5.125%, 7/15/24 | United States | 500,000 | 485,938 | |||||||||||||
senior bond, 5.00%, 5/01/25 | United States | 900,000 | 849,375 | |||||||||||||
senior note, 5.75%, 8/15/22 | United States | 1,500,000 | 1,526,258 | |||||||||||||
Edwards Lifesciences Corp., senior note, 4.30%, 6/15/28 | United States | 300,000 | 299,995 | |||||||||||||
HCA Inc., | ||||||||||||||||
senior bond, 5.875%, 5/01/23 | United States | 1,500,000 | 1,560,000 | |||||||||||||
senior secured bond, first lien, 5.875%, 3/15/22 | United States | 450,000 | 470,250 | |||||||||||||
senior secured bond, first lien, 5.25%, 4/15/25 | United States | 600,000 | 601,500 | |||||||||||||
senior secured bond, first lien, 5.50%, 6/15/47 | United States | 1,200,000 | 1,104,000 | |||||||||||||
d MPH Acquisition Holdings LLC, senior note, 144A, 7.125%, 6/01/24 | United States | 900,000 | 924,750 | |||||||||||||
d,h Polaris Intermediate Corp., senior note, 144A, PIK, 8.50%, 12/01/22 | United States | 200,000 | 207,000 | |||||||||||||
Stryker Corp., senior bond, 3.50%, 3/15/26 | United States | 500,000 | 486,089 | |||||||||||||
Tenet Healthcare Corp., | ||||||||||||||||
senior note, 5.50%, 3/01/19 | United States | 300,000 | 304,500 | |||||||||||||
senior note, 8.125%, 4/01/22 | United States | 1,000,000 | 1,047,500 | |||||||||||||
|
| |||||||||||||||
| 15,838,341 | ||||||||||||||||
|
| |||||||||||||||
Insurance 0.6% | ||||||||||||||||
d Nippon Life Insurance Co., sub. bond, 144A, 5.10% to 10/16/24, FRN thereafter, 10/16/44 | Japan | 3,500,000 | 3,572,765 | |||||||||||||
|
| |||||||||||||||
Materials 6.2% | ||||||||||||||||
ArcelorMittal, | ||||||||||||||||
senior note, 5.50%, 3/01/21 | France | 1,800,000 | 1,879,002 | |||||||||||||
senior note, 6.125%, 6/01/25 | France | 300,000 | 323,531 | |||||||||||||
d Ardagh Packaging Finance PLC/Ardagh MP Holdings USA Inc., | ||||||||||||||||
senior note, 144A, 6.00%, 6/30/21 | Luxembourg | 1,300,000 | 1,319,500 | |||||||||||||
senior note, 144A, 6.00%, 2/15/25 | Luxembourg | 900,000 | 877,500 | |||||||||||||
d BWAY Holding Co., senior note, 144A, 7.25%, 4/15/25 | United States | 2,700,000 | 2,639,250 | |||||||||||||
d Cemex Finance LLC, senior secured note, first lien, 144A, 6.00%, 4/01/24 | Mexico | 1,000,000 | 1,016,795 | |||||||||||||
d Cemex SAB de CV, senior secured bond, first lien, 144A, 5.70%, 1/11/25 | Mexico | 1,500,000 | 1,482,960 | |||||||||||||
The Chemours Co., senior note, 6.625%, 5/15/23 | United States | 1,035,000 | 1,086,750 | |||||||||||||
d Crown Americas LLC/Crown Americas Capital Corp., senior note, 144A, 4.75%, 2/01/26 | United States | 700,000 | 666,750 | |||||||||||||
d First Quantum Minerals Ltd., | ||||||||||||||||
senior note, 144A, 7.00%, 2/15/21 | Zambia | 625,000 | 632,422 | |||||||||||||
senior note, 144A, 7.25%, 4/01/23 | Zambia | 1,600,000 | 1,604,000 | |||||||||||||
d FMG Resources (August 2006) Pty. Ltd., | ||||||||||||||||
senior note, 144A, 5.125%, 3/15/23 | Australia | 400,000 | 398,000 | |||||||||||||
senior note, 144A, 5.125%, 5/15/24 | Australia | 800,000 | 780,248 | |||||||||||||
Freeport-McMoRan Inc., senior note, 4.55%, 11/14/24 | United States | 2,500,000 | 2,387,500 | |||||||||||||
d Glencore Finance Canada Ltd., senior bond, 144A, 4.95%, 11/15/21 | Switzerland | 1,000,000 | 1,038,702 | |||||||||||||
| Semiannual Report | FSI-13 | |||||
FRANKLIN TEMPLETON VARIABLE INSURANCE PRODUCTS TRUST
CONSOLIDATED STATEMENT OF INVESTMENTS (UNAUDITED)
Franklin Strategic Income VIP Fund (continued)
| Country | Principal Amount* | Value | ||||||||||||||
Corporate Bonds (continued) | ||||||||||||||||
Materials (continued) | ||||||||||||||||
d Glencore Funding LLC, | ||||||||||||||||
senior note, 144A, 4.125%, 5/30/23 | Switzerland | 600,000 | $ | 599,345 | ||||||||||||
senior note, 144A, 4.625%, 4/29/24 | Switzerland | 250,000 | 251,887 | |||||||||||||
d INVISTA Finance LLC, senior secured note, 144A, 4.25%, 10/15/19 | United States | 3,000,000 | 3,016,500 | |||||||||||||
LYB International Finance BV, senior note, 4.00%, 7/15/23 | United States | 2,100,000 | 2,107,886 | |||||||||||||
d New Gold Inc., senior note, 144A, 6.375%, 5/15/25 | Canada | 700,000 | 691,250 | |||||||||||||
d Northwest Acquisitions ULC/Dominion Finco Inc., secured note, second lien, 144A, 7.125%, 11/01/22 | Canada | 400,000 | 400,000 | |||||||||||||
d Novelis Corp., senior bond, 144A, 5.875%, 9/30/26 | United States | 2,300,000 | 2,208,000 | |||||||||||||
d Owens-Brockway Glass Container Inc., | ||||||||||||||||
senior note, 144A, 5.00%, 1/15/22 | United States | 1,400,000 | 1,400,000 | |||||||||||||
senior note, 144A, 5.875%, 8/15/23 | United States | 700,000 | 710,500 | |||||||||||||
Reynolds Group Issuer Inc./Reynolds Group Issuer LLC/Reynolds Group Issuer Luxembourg SA, | ||||||||||||||||
d senior note, 144A, 7.00%, 7/15/24 | United States | 500,000 | 511,563 | |||||||||||||
senior secured note, first lien, 5.75%, 10/15/20 | United States | 678,376 | 681,767 | |||||||||||||
d senior secured note, first lien, 144A, 5.125%, 7/15/23 | United States | 700,000 | 692,125 | |||||||||||||
d Sealed Air Corp., | ||||||||||||||||
senior bond, 144A, 5.125%, 12/01/24 | United States | 1,000,000 | 1,012,500 | |||||||||||||
senior bond, 144A, 5.50%, 9/15/25 | United States | 400,000 | 412,000 | |||||||||||||
senior note, 144A, 4.875%, 12/01/22 | United States | 1,000,000 | 1,013,750 | |||||||||||||
Steel Dynamics Inc., | ||||||||||||||||
senior bond, 5.50%, 10/01/24 | United States | 1,000,000 | 1,021,250 | |||||||||||||
senior note, 5.125%, 10/01/21 | United States | 1,000,000 | 1,011,250 | |||||||||||||
d SunCoke Energy Partners LP/SunCoke Energy Partners Finance Corp., senior note, 144A, 7.50%, 6/15/25 | United States | 2,000,000 | 2,045,000 | |||||||||||||
|
| |||||||||||||||
| 37,919,483 | ||||||||||||||||
|
| |||||||||||||||
Media 4.9% | ||||||||||||||||
d Altice Financing SA, secured bond, 144A, 7.50%, 5/15/26 | Luxembourg | 200,000 | 193,500 | |||||||||||||
d Altice U.S. Finance I Corp., senior secured bond, 144A, 5.50%, 5/15/26 | United States | 2,200,000 | 2,128,500 | |||||||||||||
AMC Networks Inc., senior note, 5.00%, 4/01/24 | United States | 2,000,000 | 1,975,000 | |||||||||||||
CCO Holdings LLC/CCO Holdings Capital Corp., | ||||||||||||||||
senior bond, 5.25%, 9/30/22 | United States | 1,100,000 | 1,107,562 | |||||||||||||
d senior bond, 144A, 5.375%, 5/01/25 | United States | 900,000 | 873,000 | |||||||||||||
Clear Channel Worldwide Holdings Inc., | ||||||||||||||||
senior note, 6.50%, 11/15/22 | United States | 1,000,000 | 1,025,000 | |||||||||||||
senior sub. note, 7,625%, 3/15/20 | United States | 700,000 | 698,395 | |||||||||||||
CSC Holdings LLC, senior note, 6.75%, 11/15/21 | United States | 2,000,000 | 2,100,000 | |||||||||||||
DISH DBS Corp., | ||||||||||||||||
senior bond, 5.875%, 7/15/22 | United States | 500,000 | 471,875 | |||||||||||||
senior note, 6.75%, 6/01/21 | United States | 500,000 | 501,875 | |||||||||||||
senior note, 5.875%, 11/15/24 | United States | 1,200,000 | 1,020,000 | |||||||||||||
j iHeartCommunications Inc., | ||||||||||||||||
senior secured bond, first lien, 9.00%, 3/01/21 | United States | 600,000 | 459,000 | |||||||||||||
senior secured note, first lien, 9.00%, 9/15/22 | United States | 400,000 | 306,000 | |||||||||||||
d Nexstar Broadcasting Inc., senior note, 144A, 5.625%, 8/01/24 | United States | 2,000,000 | 1,932,500 | |||||||||||||
d Sirius XM Radio Inc., | ||||||||||||||||
senior bond, 144A, 6.00%, 7/15/24 | United States | 1,400,000 | 1,429,750 | |||||||||||||
senior bond, 144A, 5.375%, 4/15/25 | United States | 800,000 | 791,000 | |||||||||||||
| FSI-14 | Semiannual Report | |||
FRANKLIN TEMPLETON VARIABLE INSURANCE PRODUCTS TRUST
CONSOLIDATED STATEMENT OF INVESTMENTS (UNAUDITED)
Franklin Strategic Income VIP Fund (continued)
| Country | | Principal Amount | * | Value | ||||||||||||
Corporate Bonds (continued) | ||||||||||||||||
Media (continued) | ||||||||||||||||
Tegna Inc., | ||||||||||||||||
senior bond, 6.375%, 10/15/23 | United States | 1,000,000 | $ | 1,031,250 | ||||||||||||
d senior bond, 144A, 5.50%, 9/15/24 | United States | 500,000 | 501,875 | |||||||||||||
senior note, 5.125%, 7/15/20 | United States | 1,000,000 | 1,007,500 | |||||||||||||
Time Warner Inc., senior bond, 2.95%, 7/15/26 | United States | 2,500,000 | 2,250,553 | |||||||||||||
d Unitymedia KabelBW GmbH, senior bond, 144A, 6.125%, 1/15/25 | Germany | 1,700,000 | 1,725,500 | |||||||||||||
d Univision Communications Inc., senior secured note, first lien, 144A, 5.125%, 2/15/25 | United States | 2,500,000 | 2,315,625 | |||||||||||||
d Virgin Media Finance PLC, senior bond, 144A, 6.375%, 10/15/24 | United Kingdom | 900,000 | GBP | 1,237,098 | ||||||||||||
d Virgin Media Secured Finance PLC, senior secured bond, first lien, 144A, 5.50%, 1/15/25 | United Kingdom | 1,900,000 | 1,852,500 | |||||||||||||
d Ziggo Secured Finance BV, senior secured bond, 144A, 4.25%, 1/15/27 | Netherlands | 700,000 | EUR | 810,493 | ||||||||||||
|
| |||||||||||||||
| 29,745,351 | ||||||||||||||||
|
| |||||||||||||||
Pharmaceuticals, Biotechnology & Life Sciences 1.8% | ||||||||||||||||
Allergan Funding SCS, senior bond, 3.80%, 3/15/25 | United States | 2,200,000 | 2,138,794 | |||||||||||||
d Bausch Health Cos. Inc., | ||||||||||||||||
senior bond, 144A, 6.125%, 4/15/25 | United States | 300,000 | 277,500 | |||||||||||||
senior note, 144A, 5.50%, 3/01/23 | United States | 400,000 | 374,000 | |||||||||||||
senior note, first lien, 144A, 7.00%, 3/15/24 | United States | 200,000 | 209,938 | |||||||||||||
Baxalta Inc., senior note, 4.00%, 6/23/25 | United States | 1,100,000 | 1,078,165 | |||||||||||||
d Bayer US Finance II LLC, senior bond, 144A, 4.375%, 12/15/28 | Germany | 1,100,000 | 1,103,925 | |||||||||||||
Celgene Corp., senior bond, 3.45%, 11/15/27 | United States | 800,000 | 736,741 | |||||||||||||
d,h Eagle Holdings Co. II LLC, senior note, 144A, PIK, 7.625%, 5/15/22 | United States | 700,000 | 708,890 | |||||||||||||
d Endo DAC/Endo Finance LLC/Endo Finco Inc., | ||||||||||||||||
senior bond, 144A, 6.00%, 2/01/25 | United States | 1,200,000 | 942,000 | |||||||||||||
senior note, 144A, 6.00%, 7/15/23 | United States | 400,000 | 331,000 | |||||||||||||
d Jaguar Holding Co. II/Pharmaceutical Product Development LLC, senior note, 144A, 6.375%, 8/01/23 | United States | 1,200,000 | 1,197,240 | |||||||||||||
d Valeant Pharmaceuticals International, | ||||||||||||||||
senior note, 144A, 6.375%, 10/15/20 | United States | 542,000 | 550,639 | |||||||||||||
senior note, 144A, 8.50%, 1/31/27 | United States | 1,000,000 | 1,017,500 | |||||||||||||
|
| |||||||||||||||
| 10,666,332 | ||||||||||||||||
|
| |||||||||||||||
Real Estate 1.2% | ||||||||||||||||
American Homes 4 Rent LP, senior bond, 4.25%, 2/15/28 | United States | 800,000 | 767,324 | |||||||||||||
American Tower Corp., senior bond, 3.375%, 10/15/26 | United States | 2,400,000 | 2,224,547 | |||||||||||||
Equinix Inc., | ||||||||||||||||
senior bond, 5.375%, 4/01/23 | United States | 2,500,000 | 2,571,562 | |||||||||||||
senior bond, 5.875%, 1/15/26 | United States | 100,000 | 101,550 | |||||||||||||
MPT Operating Partnership LP/MPT Finance Corp., | ||||||||||||||||
senior bond, 5.25%, 8/01/26 | United States | 800,000 | 788,000 | |||||||||||||
senior bond, 5.00%, 10/15/27 | United States | 1,100,000 | 1,053,250 | |||||||||||||
|
| |||||||||||||||
| 7,506,233 | ||||||||||||||||
|
| |||||||||||||||
Retailing 0.9% | ||||||||||||||||
Amazon.com Inc., senior note, 2.80%, 8/22/24 | United States | 1,000,000 | 954,728 | |||||||||||||
Home Depot Inc., senior note, 2.125%, 9/15/26 | United States | 1,500,000 | 1,338,866 | |||||||||||||
JD.com Inc., senior note, 3.125%, 4/29/21 | China | 200,000 | 195,211 | |||||||||||||
ab,b,h K2016470219 South Africa Ltd., senior secured note, 144A, PIK, 3.00%, 12/31/22 | South Africa | 1,137,987 | 7,007 | |||||||||||||
| Semiannual Report | FSI-15 | |||||
FRANKLIN TEMPLETON VARIABLE INSURANCE PRODUCTS TRUST
CONSOLIDATED STATEMENT OF INVESTMENTS (UNAUDITED)
Franklin Strategic Income VIP Fund (continued)
| Country | | Principal Amount | * | Value | ||||||||||||
Corporate Bonds (continued) | ||||||||||||||||
Retailing (continued) | ||||||||||||||||
b,h K2016470260 South Africa Ltd., senior secured note, 144A, PIK, 25.00%, 12/31/22 | South Africa | 220,087 | $ | 19,563 | ||||||||||||
Netflix Inc., senior bond, 5.875%, 2/15/25 | United States | 2,300,000 | 2,365,067 | |||||||||||||
d PetSmart Inc., senior secured note, first lien, 144A, 5.875%, 6/01/25 | United States | 1,000,000 | 772,500 | |||||||||||||
|
| |||||||||||||||
| 5,652,942 | ||||||||||||||||
|
| |||||||||||||||
Semiconductors & Semiconductor Equipment 0.3% | ||||||||||||||||
Maxim Integrated Products Inc., senior note, 3.375%, 3/15/23 | United States | 100,000 | 98,871 | |||||||||||||
Qorvo Inc., senior bond, 7.00%, 12/01/25 | United States | 1,400,000 | 1,512,000 | |||||||||||||
Xilinx Inc., senior note, 2.125%, 3/15/19 | United States | 200,000 | 199,144 | |||||||||||||
|
| |||||||||||||||
| 1,810,015 | ||||||||||||||||
|
| |||||||||||||||
Software & Services 1.3% | ||||||||||||||||
d First Data Corp., | ||||||||||||||||
secured note, second lien, 144A, 5.75%, 1/15/24 | United States | 2,100,000 | 2,106,510 | |||||||||||||
senior note, 144A, 7.00%, 12/01/23 | United States | 700,000 | 730,856 | |||||||||||||
Fiserv Inc., senior bond, 3.85%, 6/01/25 | United States | 600,000 | 598,293 | |||||||||||||
Infor (U.S.) Inc., senior note, 6.50%, 5/15/22 | United States | 2,000,000 | 2,017,500 | |||||||||||||
d Symantec Corp., senior note, 144A, 5.00%, 4/15/25 | United States | 2,200,000 | 2,136,198 | |||||||||||||
|
| |||||||||||||||
| 7,589,357 | ||||||||||||||||
|
| |||||||||||||||
Technology Hardware & Equipment 0.6% | ||||||||||||||||
d CommScope Technologies LLC, | ||||||||||||||||
senior bond, 144A, 6.00%, 6/15/25 | United States | 1,400,000 | 1,436,750 | |||||||||||||
senior bond, 144A, 5.00%, 3/15/27 | United States | 1,700,000 | 1,604,375 | |||||||||||||
d Dell International LLC/EMC Corp., | ||||||||||||||||
senior note, 144A, 5.875%, 6/15/21 | United States | 300,000 | 304,821 | |||||||||||||
senior note, 144A, 7.125%, 6/15/24 | United States | 200,000 | 212,068 | |||||||||||||
Juniper Networks Inc., senior bond, 5.95%, 3/15/41 | United States | 100,000 | 102,759 | |||||||||||||
Tech Data Corp., senior bond, 4.95%, 2/15/27 | United States | 200,000 | 196,572 | |||||||||||||
|
| |||||||||||||||
| 3,857,345 | ||||||||||||||||
|
| |||||||||||||||
Telecommunication Services 1.8% | ||||||||||||||||
d Digicel Group Ltd., senior note, 144A, 8.25%, 9/30/20 | Bermuda | 1,200,000 | 892,656 | |||||||||||||
d Digicel Ltd., senior note, 144A, 6.00%, 4/15/21 | Bermuda | 1,000,000 | 908,550 | |||||||||||||
Hughes Satellite Systems Corp., senior bond, 6.625%, 8/01/26 | United States | 1,600,000 | 1,484,000 | |||||||||||||
Sprint Communications Inc., | ||||||||||||||||
senior note, 6.00%, 11/15/22 | United States | 500,000 | 496,875 | |||||||||||||
d senior note, 144A, 9.00%, 11/15/18 | United States | 148,000 | 151,145 | |||||||||||||
d senior note, 144A, 7.00%, 3/01/20 | United States | 800,000 | 832,000 | |||||||||||||
Sprint Corp., senior bond, 7.875%, 9/15/23 | United States | 500,000 | 519,687 | |||||||||||||
d Sprint Spectrum Co. LLC, senior secured bond, first lien, 144A, 5.152%, 9/20/29 | United States | 1,600,000 | 1,570,000 | |||||||||||||
T-Mobile USA Inc., | ||||||||||||||||
senior bond, 6.50%, 1/15/24 | United States | 500,000 | 521,530 | |||||||||||||
senior bond, 6.375%, 3/01/25 | United States | 1,300,000 | 1,352,000 | |||||||||||||
senior note, 6.00%, 4/15/24 | United States | 200,000 | 207,500 | |||||||||||||
Verizon Communications Inc., senior note, 5.15%, 9/15/23 | United States | 2,000,000 | 2,133,625 | |||||||||||||
|
| |||||||||||||||
| 11,069,568 | ||||||||||||||||
|
| |||||||||||||||
Transportation 1.1% | ||||||||||||||||
d DAE Funding LLC, | ||||||||||||||||
senior note, 144A, 4.50%, 8/01/22 | United Arab Emirates | 700,000 | 678,125 | |||||||||||||
senior note, 144A, 5.00%, 8/01/24 | United Arab Emirates | 1,600,000 | 1,533,080 | |||||||||||||
| FSI-16 | Semiannual Report | |||
FRANKLIN TEMPLETON VARIABLE INSURANCE PRODUCTS TRUST
CONSOLIDATED STATEMENT OF INVESTMENTS (UNAUDITED)
Franklin Strategic Income VIP Fund (continued)
| Country | | Principal Amount | * | Value | ||||||||||||
Corporate Bonds (continued) | ||||||||||||||||
Transportation (continued) | ||||||||||||||||
d Park Aerospace Holdings Ltd., | ||||||||||||||||
senior note, 144A, 5.25%, 8/15/22 | Ireland | 1,000,000 | $ | 992,200 | ||||||||||||
senior note, 144A, 5.50%, 2/15/24 | Ireland | 1,300,000 | 1,287,000 | |||||||||||||
d Transurban Finance Co. Pty. Ltd., senior secured bond, 144A, 3.375%, 3/22/27 | Australia | 1,100,000 | 1,021,559 | |||||||||||||
United Airlines Pass Through Trust, second lien, 2016-1, A, 3.45%, 1/07/30 | United States | 973,619 | 942,441 | |||||||||||||
|
| |||||||||||||||
| 6,454,405 | ||||||||||||||||
|
| |||||||||||||||
Utilities 3.4% | ||||||||||||||||
Calpine Corp., | ||||||||||||||||
senior bond, 5.75%, 1/15/25 | United States | 1,200,000 | 1,100,250 | |||||||||||||
senior note, 5.375%, 1/15/23 | United States | 1,300,000 | 1,241,500 | |||||||||||||
d Colbun SA, senior note, 144A, 3.95%, 10/11/27 | Chile | 700,000 | 653,282 | |||||||||||||
Dominion Energy Inc., senior bond, 2.85%, 8/15/26 | United States | 1,100,000 | 997,849 | |||||||||||||
d,e EDF SA, junior sub. note, 144A, 5.25% to 1/29/23, FRN thereafter, Perpetual | France | 3,000,000 | 2,928,405 | |||||||||||||
Exelon Corp., senior bond, 3.95%, 6/15/25 | United States | 1,800,000 | 1,791,308 | |||||||||||||
d InterGen NV, secured bond, 144A, 7.00%, 6/30/23 | Netherlands | 700,000 | 696,500 | |||||||||||||
d Israel Electric Corp. Ltd., secured bond, 144A, 4.25%, 8/14/28 | Israel | 1,000,000 | 971,075 | |||||||||||||
The Southern Co., senior bond, 3.25%, 7/01/26 | United States | 3,600,000 | 3,383,901 | |||||||||||||
d State Grid Overseas Investments 2016 Ltd., senior note, 144A, 3.50%, 5/04/27 | China | 1,300,000 | 1,240,635 | |||||||||||||
d Talen Energy Supply LLC, | ||||||||||||||||
senior note, 144A, 9.50%, 7/15/22 | United States | 1,700,000 | 1,677,696 | |||||||||||||
senior note, 144A, 10.50%, 1/15/26 | United States | 500,000 | 447,500 | |||||||||||||
d Three Gorges Finance I Cayman Islands Ltd., senior note, 144A, 3.15%, 6/02/26 | China | 1,300,000 | 1,219,446 | |||||||||||||
d Vistra Energy Corp., senior note, 144A, 8.00%, 1/15/25 | United States | 2,000,000 | 2,156,900 | |||||||||||||
|
| |||||||||||||||
| 20,506,247 | ||||||||||||||||
|
| |||||||||||||||
Total Corporate Bonds (Cost $298,618,029) | 289,703,703 | |||||||||||||||
|
| |||||||||||||||
k,l Senior Floating Rate Interests 11.6% | ||||||||||||||||
Automobiles & Components 0.4% | ||||||||||||||||
Allison Transmission Inc., New Term Loans, 3.85%, (1-month USD LIBOR + 1.75%), 9/23/22 | United States | 828,930 | 833,126 | |||||||||||||
TI Group Automotive Systems LLC, Initial US Term Loan, 4.594%, (1-month USD LIBOR + 2.50%), 6/30/22 | United States | 1,823,170 | 1,826,589 | |||||||||||||
|
| |||||||||||||||
| 2,659,715 | ||||||||||||||||
|
| |||||||||||||||
Capital Goods 0.1% | ||||||||||||||||
Doncasters U.S. Finance LLC, Second Lien Term Loan, 10.584%, (3-month USD LIBOR + 8.25%), 10/09/20 | United States | 76,700 | 72,738 | |||||||||||||
Harsco Corp., Term Loan B-2, 4.375%, (1-month USD LIBOR + 2.25%), 12/10/24 | United States | 231,424 | 232,002 | |||||||||||||
Leidos Innovations Corp., Term Loan B, 3.875%, (1-month USD LIBOR + 1.75%), 8/16/23 | United States | 158,538 | 159,302 | |||||||||||||
|
| |||||||||||||||
| 464,042 | ||||||||||||||||
|
| |||||||||||||||
| Semiannual Report | FSI-17 | |||||
FRANKLIN TEMPLETON VARIABLE INSURANCE PRODUCTS TRUST
CONSOLIDATED STATEMENT OF INVESTMENTS (UNAUDITED)
Franklin Strategic Income VIP Fund (continued)
| Country | | Principal Amount | * | Value | ||||||||||||
k,l Senior Floating Rate Interests (continued) | ||||||||||||||||
Commercial & Professional Services 0.1% | ||||||||||||||||
KAR Auction Services Inc., Tranche B-5 Term Loans, 4.625%, (1-month USD LIBOR + 2.50%), 3/09/23 | United States | 686,117 | $ | 688,690 | ||||||||||||
Ventia Pty. Ltd., Term B Loans (USD), 5.834%, (3-month USD LIBOR + 3.50%), 5/21/22 | Australia | 83,231 | 83,959 | |||||||||||||
|
| |||||||||||||||
| 772,649 | ||||||||||||||||
|
| |||||||||||||||
Consumer Services 0.6% | ||||||||||||||||
Aristocrat Technologies Inc., Term B-3 Loans, 4.105%, (2-month USD LIBOR + 1.75%), 10/19/24 | United States | 945,559 | 941,007 | |||||||||||||
Avis Budget Car Rental LLC, Tranche B Term Loans, 4.34%, (3-month USD LIBOR + 2.00%), 2/13/25 | United States | 1,024,168 | 1,026,728 | |||||||||||||
Eldorado Resorts, Inc., | ||||||||||||||||
Initial Term Loan, 4.375%, (1-month USD LIBOR + 2.25%), 4/17/24 | United States | 161,502 | 161,956 | |||||||||||||
Initial Term Loan, 4.375%, (2-month USD LIBOR + 2.25%), 4/17/24 | United States | 183,594 | 184,110 | |||||||||||||
Greektown Holdings LLC, Initial Term Loan, 5.094%, (1-month USD LIBOR + 3.00%), 4/25/24 | United States | 279,865 | 279,865 | |||||||||||||
Las Vegas Sands LLC, Term B Loans, 3.844%, (1-month USD LIBOR + 1.75%), 3/27/25 | United States | 847,875 | 843,477 | |||||||||||||
|
| |||||||||||||||
| 3,437,143 | ||||||||||||||||
|
| |||||||||||||||
Diversified Financials 0.1% | ||||||||||||||||
m,n Trans Union LLC, Term A-2 Facility, TBD, 8/09/22 | United States | 822,628 | 821,600 | |||||||||||||
|
| |||||||||||||||
Energy 1.5% | ||||||||||||||||
Bowie Resource Holdings LLC, | ||||||||||||||||
First Lien Initial Term Loan, 7.844%, (1-month USD LIBOR + 5.75%), 8/14/20 | United States | 2,234,507 | 2,205,644 | |||||||||||||
Second Lien Initial Term Loan, 12.844%, (1-month USD LIBOR + 10.75%), 2/16/21 | United States | 1,248,332 | 1,145,345 | |||||||||||||
Fieldwood Energy LLC, Closing Date Loans, 7.344%, (1-month USD LIBOR + 5.25%), 4/11/22 | United States | 4,096,974 | 4,111,805 | |||||||||||||
Foresight Energy LLC, Term Loans, 8.109%, (3-month USD LIBOR + 5.75%), 3/28/22 | United States | 1,147,018 | 1,141,761 | |||||||||||||
OSG Bulk Ships Inc., Initial Term Loan, 6.77%, (3-month USD LIBOR + 4.25%), 8/05/19 | United States | 826,633 | 822,500 | |||||||||||||
|
| |||||||||||||||
| 9,427,055 | ||||||||||||||||
|
| |||||||||||||||
Food & Staples Retailing 0.3% | ||||||||||||||||
Aramark Corp., Term B-3 Loan, 4.084%, (3-month USD LIBOR + 1.75%), 3/11/25 | United States | 384,646 | 384,887 | |||||||||||||
Smart & Final Stores LLC, First Lien Term Loan, 5.594%, (1-month USD LIBOR + 3.50%), 11/15/22 | United States | 1,157,580 | 1,132,498 | |||||||||||||
|
| |||||||||||||||
| 1,517,385 | ||||||||||||||||
|
| |||||||||||||||
Food, Beverage & Tobacco 0.8% | ||||||||||||||||
B&G Foods Inc., Tranche B-3 Term Loan, 4.094%, (1-month USD LIBOR + 2.00%), 11/02/22 | United States | 2,211,651 | 2,213,955 | |||||||||||||
JBS USA LUX SA, New Initial Term Loans, 4.834% - 4.835%, (3-month USD LIBOR + 2.50%), 10/30/22 | United States | 2,132,608 | 2,123,499 | |||||||||||||
m Pinnacle Foods Finance LLC, Initial B Term Loan, 3.751%, (1-month USD LIBOR + 1.75%), 2/03/24 | United States | 370,384 | 370,894 | |||||||||||||
|
| |||||||||||||||
| 4,708,348 | ||||||||||||||||
|
| |||||||||||||||
| FSI-18 | Semiannual Report | |||
FRANKLIN TEMPLETON VARIABLE INSURANCE PRODUCTS TRUST
CONSOLIDATED STATEMENT OF INVESTMENTS (UNAUDITED)
Franklin Strategic Income VIP Fund (continued)
| Country | | Principal Amount | * | Value | ||||||||||||
k,l Senior Floating Rate Interests (continued) | ||||||||||||||||
Health Care Equipment & Services 0.6% | ||||||||||||||||
DaVita Healthcare Partners Inc., Tranche B Term Loan, 4.844%, (1-month USD LIBOR + 2.75%), 6/24/21 | United States | 1,114,197 | $ | 1,118,471 | ||||||||||||
m,n IQVIA Inc., U.S. Term Loan B, TBD, 6/08/25 | United States | 702,075 | 704,562 | |||||||||||||
Quintiles IMS Inc., Term B-2 Dollar Loans, 4.334%, (3-month USD LIBOR + 2.00%), 1/20/25 | United States | 1,150,921 | 1,148,907 | |||||||||||||
U.S. Renal Care Inc., Initial Term Loan, 6.584%, (3-month USD LIBOR + 4.25%), 12/31/22 | United States | 468,694 | 464,359 | |||||||||||||
|
| |||||||||||||||
| 3,436,299 | ||||||||||||||||
|
| |||||||||||||||
Household & Personal Products 0.2% | ||||||||||||||||
Spectrum Brands, Inc., | ||||||||||||||||
USD Term Loans, 4.094%, (1-month USD LIBOR + 2.00%), 6/23/22 | United States | 351,274 | 350,615 | |||||||||||||
USD Term Loans, 4.085% - 4.097%, (2-month USD LIBOR + 2.00%), 6/23/22 | United States | 362,838 | 362,158 | |||||||||||||
USD Term Loans, 4.363%, (3-month USD LIBOR + 2.00%), 6/23/22 | United States | 229,177 | 228,747 | |||||||||||||
|
| |||||||||||||||
| 941,520 | ||||||||||||||||
|
| |||||||||||||||
Materials 1.3% | ||||||||||||||||
Ashland LLC, Term B Loan, 3.835% - 3.844%, (1-month USD LIBOR + 1.75%), 5/17/24 | United States | 2,445,209 | 2,442,152 | |||||||||||||
Axalta Coating Systems U.S. Holdings Inc., Term B-3 Dollar Loan, 4.084%, (3-month USD LIBOR + 1.75%), 6/01/24 | United States | 575,339 | 573,227 | |||||||||||||
Chemours Co., Tranche B-2 US$ Term Loan, 3.85%, (1-month USD LIBOR + 1.75%), 4/03/25 | United States | 1,343,406 | 1,331,652 | |||||||||||||
Crown Americas LLC, Term B Loans, 4.312%, (3-month USD LIBOR + 2.00%), 4/03/25 | United States | 1,482,156 | 1,485,759 | |||||||||||||
Oxbow Carbon LLC, | ||||||||||||||||
Second Lien Term Loan, 9.594%, (1-month USD LIBOR + 7.50%), 1/04/24 | United States | 229,047 | 232,483 | |||||||||||||
Tranche A Term Loan, 4.594%, (1-month USD LIBOR + 2.50%), 1/04/22 | United States | 1,282,500 | 1,284,103 | |||||||||||||
Tranche B Term Loan, 5.844%, (1-month USD LIBOR + 3.75%), 1/04/23 | United States | 546,000 | 552,143 | |||||||||||||
|
| |||||||||||||||
| 7,901,519 | ||||||||||||||||
|
| |||||||||||||||
Media 1.2% | ||||||||||||||||
Altice U.S. Finance I Corp., March 2017 Refinancing Term Loan Commitments, 4.344%, (1-month USD LIBOR + 2.25%), 7/28/25 | United States | 198,107 | 197,942 | |||||||||||||
AMC Entertainment Holdings Inc., | ||||||||||||||||
2016 Incremental Term Loans, 4.323%, (1-month USD LIBOR + 2.25%), 12/15/23 | United States | 736,061 | 735,026 | |||||||||||||
Initial Term Loans, 4.323%, (1-month USD LIBOR + 2.25%), 12/15/22 | United States | 989,116 | 989,028 | |||||||||||||
Charter Communications Operating LLC, Term A-2 Loan, 3.60%, (1-month USD LIBOR + 1.50%), 3/31/23 | United States | 915,936 | 916,795 | |||||||||||||
CSC Holdings LLC, March 2017 Incremental Term Loans, 4.323%, (1-month USD LIBOR + 2.25%), 7/17/25 | United States | 1,221,857 | 1,214,514 | |||||||||||||
Gray Television Inc., Term B-2 Loan, 4.251%, (1-month USD LIBOR + 2.25%), 2/07/24 | United States | 895,455 | 893,776 | |||||||||||||
Lions Gate Capital Holdings LLC, Term A Loan, 3.841%, (1-month USD LIBOR + 1.75%), 3/22/23 | Canada | 255,898 | 255,578 | |||||||||||||
| Semiannual Report | FSI-19 | |||||
FRANKLIN TEMPLETON VARIABLE INSURANCE PRODUCTS TRUST
CONSOLIDATED STATEMENT OF INVESTMENTS (UNAUDITED)
Franklin Strategic Income VIP Fund (continued)
| Country | | Principal Amount | * | Value | ||||||||||||
k,l Senior Floating Rate Interests (continued) | ||||||||||||||||
Media (continued) | ||||||||||||||||
Live Nation Entertainment Inc., Term B-3 Loans, 3.875%, (1-month USD LIBOR + 1.75%), 10/31/23 | United States | 577,078 | $ | 576,357 | ||||||||||||
m,n Sinclair Television Group Inc., Tranche B-1 Term Loans, TBD, 1/31/25 | United States | 1,300,000 | 1,299,668 | |||||||||||||
|
| |||||||||||||||
| 7,078,684 | ||||||||||||||||
|
| |||||||||||||||
Pharmaceuticals, Biotechnology & Life Sciences 1.3% | ||||||||||||||||
Endo Luxembourg Finance Co. I S.A.R.L. and Endo LLC, Initial Term Loans, 6.375%, (1-month USD LIBOR + 4.25%), 4/29/24 | United States | 2,237,719 | 2,227,228 | |||||||||||||
Grifols Worldwide Operations USA Inc., Tranche B Term Loan, 4.238%, (1-week USD LIBOR + 2.25%), 1/31/25 | United States | 2,329,537 | 2,332,206 | |||||||||||||
Syneos Health Inc., Initial Term B Loans, 4.094%, (1-month USD LIBOR + 2.00%), 8/01/24 | United States | 3,344,952 | 3,332,927 | |||||||||||||
Valeant Pharmaceuticals International Inc., Initial Term Loans, 5.092%, (1-month USD LIBOR + 3.00%), 6/02/25 | United States | 314,372 | 313,665 | |||||||||||||
|
| |||||||||||||||
| 8,206,026 | ||||||||||||||||
|
| |||||||||||||||
Retailing 1.1% | ||||||||||||||||
Ascena Retail Group Inc., Tranche B Term Loan, 6.625%, (1-month USD LIBOR + 4.50%), 8/21/22 | United States | 2,952,482 | 2,645,424 | |||||||||||||
General Nutrition Centers Inc., Tranche B-2 Term Loans, 10.85%, (1-month USD LIBOR + 8.75%), 3/04/21 | United States | 1,041,233 | 1,006,526 | |||||||||||||
Harbor Freight Tools USA Inc., Refinancing Loans, 4.594%, (1-month USD LIBOR + 2.50%), 8/19/23 | United States | 1,990,000 | 1,983,604 | |||||||||||||
Jo-Ann Stores Inc., Initial Loans, 7.509%, (6-month USD LIBOR + 5.00%), 10/23/23 | United States | 1,360,152 | 1,352,784 | |||||||||||||
|
| |||||||||||||||
| 6,988,338 | ||||||||||||||||
|
| |||||||||||||||
Semiconductors & Semiconductor Equipment 0.2% | ||||||||||||||||
MKS Instruments Inc., Tranche B-4 Term Loan, 3.844%, (1-month USD LIBOR + 1.75%), 4/29/23 | United States | 262,472 | 263,128 | |||||||||||||
ON Semiconductor Corp., 2018 New Replacement Term B-3 Loans, 3.844%, (1-month USD LIBOR + 1.75%), 3/31/23 | United States | 1,160,052 | 1,160,857 | |||||||||||||
|
| |||||||||||||||
| 1,423,985 | ||||||||||||||||
|
| |||||||||||||||
Software & Services 0.2% | ||||||||||||||||
m First Data Corp., Term A Loan, 3.841%, (1-month USD LIBOR + 1.75%), 6/02/20 | United States | 390,796 | 389,657 | |||||||||||||
Rackspace Hosting Inc., Term B Loans, 5.363%, (3-month USD LIBOR + 3.00%), 11/03/23 | United States | 384,735 | 380,485 | |||||||||||||
Wex Inc., Term B-2 Loan, 4.344%, (1-month USD LIBOR + 2.25%), 7/01/23 | United States | 649,939 | 650,954 | |||||||||||||
|
| |||||||||||||||
| 1,421,096 | ||||||||||||||||
|
| |||||||||||||||
Technology Hardware & Equipment 0.3% | ||||||||||||||||
Ciena Corp., Refinancing Term Loan, 4.584%, (1-month USD LIBOR + 2.50%), 1/28/22 | United States | 180,406 | 181,308 | |||||||||||||
CommScope Inc., Tranche 5 Term Loans, 4.094%, (1-month USD LIBOR + 2.00%), 12/29/22 | United States | 1,519,956 | 1,527,556 | |||||||||||||
|
| |||||||||||||||
| 1,708,864 | ||||||||||||||||
|
| |||||||||||||||
| FSI-20 | Semiannual Report | |||
FRANKLIN TEMPLETON VARIABLE INSURANCE PRODUCTS TRUST
CONSOLIDATED STATEMENT OF INVESTMENTS (UNAUDITED)
Franklin Strategic Income VIP Fund (continued)
| Country | | Principal Amount | * | Value | ||||||||||||
k,l Senior Floating Rate Interests (continued) | ||||||||||||||||
Telecommunication Services 0.1% | ||||||||||||||||
Consolidated Communications Inc., Initial Term Loan, 5.10%, (1-month USD LIBOR + 3.00%), 10/05/23 | United States | 236,372 | $ | 233,772 | ||||||||||||
Global Tel*Link Corp., Term Loan, 6.334%, (3-month USD LIBOR + 4.00%), 5/23/20 | United States | 272,305 | 273,582 | |||||||||||||
|
| |||||||||||||||
| 507,354 | ||||||||||||||||
|
| |||||||||||||||
Transportation 0.6% | ||||||||||||||||
Air Canada, Term Loan, 4.094%, (1-month USD LIBOR + 2.00%), 10/06/23 | Canada | 49,179 | 49,445 | |||||||||||||
Hertz Corp., Tranche B-1 Term Loan, 4.85%, (1-month USD LIBOR + 2.75%), 6/30/23 | United States | 1,693,763 | 1,688,646 | |||||||||||||
International Seaways Operating Corp., Initial Term Loans, 8.10%, (1-month USD LIBOR + 5.50%), 6/22/22 | United States | 684,008 | 684,008 | |||||||||||||
Navios Maritime Midstream Partners LP, Initial Term Loan, 6.83%, (3-month USD LIBOR + 4.50%), 6/18/20 | Marshall Islands | 1,265,982 | 1,258,070 | |||||||||||||
|
| |||||||||||||||
| 3,680,169 | ||||||||||||||||
|
| |||||||||||||||
Utilities 0.6% | ||||||||||||||||
EFS Cogen Holdings I LLC (Linden), Term B Advance, 5.59%, (3-month USD LIBOR + 3.25%), 6/28/23 | United States | 2,864,650 | 2,866,217 | |||||||||||||
NRG Energy Inc., Term Loan B, 4.084%, (3-month USD LIBOR + 1.75%), 6/30/23 | United States | 852,600 | 848,817 | |||||||||||||
|
| |||||||||||||||
| 3,715,034 | ||||||||||||||||
|
| |||||||||||||||
Total Senior Floating Rate Interests | 70,816,825 | |||||||||||||||
|
| |||||||||||||||
Foreign Government and Agency Securities 4.9% | ||||||||||||||||
d The Export-Import Bank of India, senior note, 144A, 3.875%, 2/01/28 | India | 1,800,000 | 1,685,997 | |||||||||||||
Government of Hungary, senior note, 6.25%, 1/29/20 | Hungary | 1,500,000 | 1,572,083 | |||||||||||||
Government of Indonesia, | ||||||||||||||||
senior bond, FR34, 12.80%, 6/15/21 | Indonesia | 17,235,000,000 | IDR | 1,367,735 | ||||||||||||
senior bond, FR64, 6.125%, 5/15/28 | Indonesia | 34,000,000,000 | IDR | 2,124,704 | ||||||||||||
senior bond, FR70, 8.375%, 3/15/24 | Indonesia | 19,648,000,000 | IDR | 1,403,604 | ||||||||||||
Government of Mexico, | ||||||||||||||||
senior bond, M, 6.50%, 6/10/21 | Mexico | 362,000 | o | MXN | 1,765,965 | |||||||||||
senior note, M 10, 8.50%, 12/13/18 | Mexico | 1,255,200 | o | MXN | 6,350,202 | |||||||||||
d Government of Serbia, | ||||||||||||||||
senior note, 144A, 4.875%, 2/25/20 | Serbia | 4,000,000 | 4,069,760 | |||||||||||||
senior note, 144A, 7.25%, 9/28/21 | Serbia | 200,000 | 218,622 | |||||||||||||
d Government of Ukraine, | ||||||||||||||||
144A, 7.75%, 9/01/22 | Ukraine | 200,000 | 195,730 | |||||||||||||
144A, 7.75%, 9/01/23 | Ukraine | 369,000 | 355,864 | |||||||||||||
144A, 7.75%, 9/01/24 | Ukraine | 369,000 | 349,281 | |||||||||||||
144A, 7.75%, 9/01/25 | Ukraine | 369,000 | 346,057 | |||||||||||||
144A, 7.75%, 9/01/26 | Ukraine | 369,000 | 342,091 | |||||||||||||
144A, 7.75%, 9/01/27 | Ukraine | 369,000 | 339,489 | |||||||||||||
a,p 144A, VRI, GDP Linked Security, 5/31/40 | Ukraine | 1,952,000 | 1,234,845 | |||||||||||||
| Semiannual Report | FSI-21 | |||||
FRANKLIN TEMPLETON VARIABLE INSURANCE PRODUCTS TRUST
CONSOLIDATED STATEMENT OF INVESTMENTS (UNAUDITED)
Franklin Strategic Income VIP Fund (continued)
| Country | | Principal Amount | * | Value | ||||||||||
Foreign Government and Agency Securities (continued) | ||||||||||||||
Nota Do Tesouro Nacional, | ||||||||||||||
10.00%, 1/01/21 | Brazil | 13,900q | BRL | $ | 3,645,154 | |||||||||
10.00%, 1/01/23 | Brazil | 2,800q | BRL | 708,633 | ||||||||||
r Index Linked, 6.00%, 5/15/23 | Brazil | 1,950q | BRL | 1,593,971 | ||||||||||
|
| |||||||||||||
Total Foreign Government and Agency Securities | 29,669,787 | |||||||||||||
|
| |||||||||||||
U.S. Government and Agency Securities 6.2% | ||||||||||||||
U.S. Treasury Bond, | ||||||||||||||
7.875%, 2/15/21 | United States | 900,000 | 1,019,918 | |||||||||||
6.50%, 11/15/26 | United States | 2,400,000 | 3,055,969 | |||||||||||
3.00%, 11/15/45 | United States | 5,000,000 | 5,013,867 | |||||||||||
s Index Linked, 0.625%, 1/15/24 | United States | 3,661,111 | 3,657,362 | |||||||||||
U.S. Treasury Note, | ||||||||||||||
3.75%, 11/15/18 | United States | 7,000,000 | 7,042,383 | |||||||||||
2.75%, 2/15/24 | United States | 1,000,000 | 998,652 | |||||||||||
2.25%, 11/15/25 | United States | 8,500,000 | 8,175,107 | |||||||||||
s Index Linked, 0.125%, 7/15/24 | United States | 8,988,868 | 8,740,526 | |||||||||||
|
| |||||||||||||
Total U.S. Government and Agency Securities | 37,703,784 | |||||||||||||
|
| |||||||||||||
Asset-Backed Securities and Commercial Mortgage-Backed Securities 15.6% | ||||||||||||||
Banks 0.7% | ||||||||||||||
Citigroup Commercial Mortgage Trust, 2006-C5, AJ, 5.482%, 10/15/49 | United States | 874,583 | 835,675 | |||||||||||
t Commercial Mortgage Trust, 2006-GG7, AJ, FRN, 5.951%, 7/10/38 | United States | 1,045,000 | 963,499 | |||||||||||
CSAIL Commercial Mortgage Trust, 2015-C1, A4, 3.505%, 4/15/50 | United States | 915,000 | 911,619 | |||||||||||
t CWABS Asset-Backed Certificates Trust, 2005-11, AF4, FRN, 4.472%, 3/25/34 | United States | 1,275,000 | 1,287,010 | |||||||||||
u Merrill Lynch Mortgage Investors Trust, 2005-A6, 2A3, FRN, 2.471%, (1-month USD LIBOR + 0.38%), 8/25/35 | United States | 125,134 | 125,544 | |||||||||||
|
| |||||||||||||
| 4,123,347 | ||||||||||||||
|
| |||||||||||||
Diversified Financials 14.9% | ||||||||||||||
d,u AMMC CLO XI Ltd., | ||||||||||||||
2012-11A, BR2, 144A, FRN, 3.959%, (3-month USD LIBOR + 1.60%), 4/30/31 | United States | 350,000 | 350,011 | |||||||||||
2012-11A, DR2, 144A, FRN, 5.209%, (3-month USD LIBOR + 2.85%), 4/30/31 | United States | 300,000 | 297,864 | |||||||||||
d,u Antares CLO Ltd., 2018-1A, B, 144A, FRN, 4.104%, (3-month USD LIBOR + 1.65%), 4/20/31 | United States | 1,800,000 | 1,799,982 | |||||||||||
d,u Ares CLO Ltd., 2018-48A, D, 144A, FRN, 5.039%, (3-month USD LIBOR + 2.70%), 7/20/30 | United States | 400,000 | 399,996 | |||||||||||
d,u Ares XLIII CLO Ltd., 2017-43A, A, 144A, FRN, 3.568%, (3-month USD LIBOR + 1.22%), 10/15/29 | United States | 432,000 | 432,389 | |||||||||||
d,u Atrium VIII, | ||||||||||||||
8A, BR, 144A, FRN, 4.262%, (3-month USD LIBOR + 1.90%), 10/23/24 | United States | 350,000 | 350,781 | |||||||||||
8A, CR, 144A, FRN, 4.862%, (3-month USD LIBOR + 2.50%), 10/23/24 | United States | 470,000 | 472,040 | |||||||||||
| FSI-22 | Semiannual Report | |||
FRANKLIN TEMPLETON VARIABLE INSURANCE PRODUCTS TRUST
CONSOLIDATED STATEMENT OF INVESTMENTS (UNAUDITED)
Franklin Strategic Income VIP Fund (continued)
| Country | | Principal Amount | * | Value | ||||||||||
Asset-Backed Securities and Commercial Mortgage-Backed Securities (continued) | ||||||||||||||
Diversified Financials (continued) | ||||||||||||||
d,u Atrium XI, 11A, CR, 144A, FRN, 4.512%, (3-month USD LIBOR + 2.15%), 10/23/25 | United States | 1,820,000 | $ | 1,823,749 | ||||||||||
Banc of America Commercial Mortgage Trust, | ||||||||||||||
2015-UBS7, A3, 3.441%, 9/15/48 | United States | 1,050,000 | 1,038,782 | |||||||||||
2015-UBS7, A4, 3.705%, 9/15/48 | United States | 1,170,000 | 1,174,816 | |||||||||||
t 2015-UBS7, B, FRN, 4.507%, 9/15/48 | United States | 760,000 | 779,721 | |||||||||||
d,t BCAP LLC Trust, 2009-RR1, 2A2, 144A, FRN, 3.938%, 5/26/35 | United States | 383,883 | 372,727 | |||||||||||
d,u Betony CLO 2 Ltd., 2018-1A, C, 144A, FRN, 5.009%, (3-month USD LIBOR + 2.90%), 4/30/31 | United States | 400,000 | 400,000 | |||||||||||
d,u Birchwood Park CLO Ltd., 2014-1A, AR, 144A, FRN, 3.528%, (3-month USD LIBOR + 1.18%), 7/15/26 | United States | 250,000 | 250,185 | |||||||||||
d,u BlueMountain CLO Ltd., | ||||||||||||||
2012-2A, BR, 144A, FRN, 4.231%, (3-month USD LIBOR + 1.90%), 11/20/28 | United States | 510,000 | 511,535 | |||||||||||
2012-2A, CR, 144A, FRN, 4.931%, (3-month USD LIBOR + 2.60%), 11/20/28 | United States | 270,000 | 271,256 | |||||||||||
d,u BlueMountain Fuji U.S. CLO II Ltd., 2017-2A, A1A, 144A, FRN, 3.559%, (3-month USD LIBOR + 1.20%), 10/20/30 | United States | 1,800,000 | 1,815,210 | |||||||||||
d,u BlueMountain Fuji U.S. CLO III Ltd., 2017-3A, A2, 144A, FRN, 2.877%, (3-month USD LIBOR + 1.15%), 1/15/30 | United States | 200,000 | 200,274 | |||||||||||
d,u Burnham Park CLO Ltd., | ||||||||||||||
2016-1A, A, 144A, FRN, 3.789%, (3-month USD LIBOR + 1.43%), 10/20/29 | United States | 350,000 | 351,964 | |||||||||||
2016-1A, B, 144A, FRN, 4.159%, (3-month USD LIBOR + 1.80%), 10/20/29 | United States | 460,000 | 461,205 | |||||||||||
2016-1A, C, 144A, FRN, 4.759%, (3-month USD LIBOR + 2.40%), 10/20/29 | United States | 460,000 | 460,851 | |||||||||||
u Capital One Multi-Asset Execution Trust, | ||||||||||||||
2014-A3, A3, FRN, 2.453%, (1-month USD LIBOR + 0.38%), 1/18/22 | United States | 370,000 | 370,774 | |||||||||||
2016-A1, A1, FRN, 2.523%, (1-month USD LIBOR + 0.45%), 2/15/22 | United States | 2,950,000 | 2,958,226 | |||||||||||
2016-A2, A2, FRN, 2.703%, (1-month USD LIBOR + 0.63%), 2/15/24 | United States | 3,990,000 | 4,034,056 | |||||||||||
d,u Carlyle Global Market Strategies, 2014-4RA, C, 144A, FRN, 4.887%, (3-month USD LIBOR + 2.90%), 7/15/30 | United States | 300,000 | 300,000 | |||||||||||
d,u Carlyle Global Market Strategies CLO Ltd., | ||||||||||||||
2012-4A, BR, 144A, FRN, 4.259%, (3-month USD LIBOR + 1.90%), 1/20/29 | United States | 500,000 | 503,110 | |||||||||||
2012-4A, C1R, 144A, FRN, 4.959%, (3-month USD LIBOR + 2.60%), 1/20/29 | United States | 480,000 | 483,216 | |||||||||||
d,u Carlyle U.S. CLO Ltd., 2017-2A, A1B, 144A, FRN, 3.579%, (3-month USD LIBOR + 1.22%), 7/20/31 | United States | 1,150,000 | 1,153,312 | |||||||||||
d,u Catamaran CLO Ltd., 2014-2A, BR, 144A, FRN, 5.305%, (3-month USD LIBOR + 2.95%), 10/18/26 | United States | 1,550,000 | 1,557,455 | |||||||||||
d,u Cent CLO LP, | ||||||||||||||
2014-22A, A2AR, 144A, FRN, 4.313%, (3-month USD LIBOR + 1.95%), 11/07/26 | United States | 392,000 | 392,584 | |||||||||||
2014-22A, BR, 144A, FRN, 5.313%, (3-month USD LIBOR + 2.95%), 11/07/26 | United States | 340,000 | 340,904 | |||||||||||
| Semiannual Report | FSI-23 | |||||
FRANKLIN TEMPLETON VARIABLE INSURANCE PRODUCTS TRUST
CONSOLIDATED STATEMENT OF INVESTMENTS (UNAUDITED)
Franklin Strategic Income VIP Fund (continued)
| Country | | Principal Amount | * | Value | ||||||||||
Asset-Backed Securities and Commercial Mortgage-Backed Securities (continued) | ||||||||||||||
Diversified Financials (continued) | ||||||||||||||
d,t CGRBS Commercial Mortgage Trust, 2013-VN05, C, 144A, FRN, 3.703%, 3/13/35 | United States | 870,000 | $ | 858,102 | ||||||||||
u Chase Issuance Trust, 2013-A6, A6, FRN, 2.493%, (1-month USD LIBOR + 0.42%), 7/15/20 | United States | 1,090,000 | 1,090,251 | |||||||||||
u Citibank Credit Card Issuance Trust, 2013-A4, A4, FRN, 2.511%, (1-month USD LIBOR + 0.42%), 7/24/20 | United States | 710,000 | 710,011 | |||||||||||
d,u Cole Park CLO Ltd., 2015-1A, B, 144A, FRN, 4.609%, (3-month USD LIBOR + 2.25%), 10/20/28 | United States | 270,000 | 270,451 | |||||||||||
t COMM Mortgage Trust, 2014-CR19, B, FRN, 4.703%, 8/10/47 | United States | 870,000 | 893,365 | |||||||||||
d Core Industrial Trust, 2015-CALW, A, 144A, 3.04%, 2/10/34 | United States | 1,410,000 | 1,400,147 | |||||||||||
u Discover Card Execution Note Trust, 2016-A2, A2, FRN, 2.613%, (1-month USD LIBOR + 0.54%), 9/15/21 | United States | 2,950,000 | 2,958,342 | |||||||||||
d,u Dryden 33 Senior Loan Fund, | ||||||||||||||
2014-33A, BR, 144A, FRN, 4.198%, (3-month USD LIBOR + 1.85%), 10/15/28 | United States | 535,000 | 536,268 | |||||||||||
2014-33A, CR, 144A, FRN, 4.848%, (3-month USD LIBOR + 2.50%), 10/15/28 | United States | 270,000 | 271,061 | |||||||||||
d,u Dryden CLO Ltd., | ||||||||||||||
2018-55A, A1, 144A, FRN, 3.061%, (3-month USD LIBOR + 1.02%), 4/15/31 | United States | 500,000 | 499,790 | |||||||||||
2018-55A, D, 144A, FRN, 4.891%, (3-month USD LIBOR + 2.85%), 4/15/31 | United States | 300,000 | 299,844 | |||||||||||
2018-64A, D, 144A, FRN, 4.869%, (3-month USD LIBOR + 2.65%), 4/18/31 | United States | 300,000 | 299,943 | |||||||||||
d,g,v Dryden Senior Loan Fund, 2016-42A, DR, 144A, FRN, (3-month USD LIBOR | United States | 1,600,000 | 1,600,000 | |||||||||||
d,t Eleven Madison Trust Mortgage Trust, 2015-11MD, A, 144A, FRN, 3.673%, 9/10/35 | United States | 1,350,000 | 1,345,534 | |||||||||||
u FHLMC Structured Agency Credit Risk Debt Notes, | ||||||||||||||
2014-DN1, M2, FRN, 4.291%, (1-month USD LIBOR + 2.20%), 2/25/24 | United States | 1,117,015 | 1,148,832 | |||||||||||
2014-DN3, M3, FRN, 6.091%, (1-month USD LIBOR + 4.00%), 8/25/24 | United States | 215,682 | 235,586 | |||||||||||
2014-DN4, M3, FRN, 6.641%, (1-month USD LIBOR + 4.55%), 10/25/24 | United States | 1,449,443 | 1,608,588 | |||||||||||
2014-HQ1, M3, FRN, 6.191%, (1-month USD LIBOR + 4.10%), 8/25/24 | United States | 380,000 | 419,166 | |||||||||||
2014-HQ2, M2, FRN, 4.291%, (1-month USD LIBOR + 2.20%), 9/25/24 | United States | 814,387 | 839,291 | |||||||||||
2014-HQ3, M3, FRN, 6.841%, (1-month USD LIBOR + 4.75%), 10/25/24 | United States | 880,519 | 979,183 | |||||||||||
2015-DNA3, M3, FRN, 6.791%, (1-month USD LIBOR + 4.70%), 4/25/28 | United States | 2,250,000 | 2,668,934 | |||||||||||
2015-HQ1, M2, FRN, 4.291%, (1-month USD LIBOR + 2.20%), 3/25/25 | United States | 176,137 | 176,928 | |||||||||||
2015-HQ1, M3, FRN, 5.891%, (1-month USD LIBOR + 3.80%), 3/25/25 | United States | 970,000 | 1,039,746 | |||||||||||
2016-DNA2, M3, FRN, 6.741%, (1-month USD LIBOR + 4.65%), 10/25/28 | United States | 940,000 | 1,085,574 | |||||||||||
| FSI-24 | Semiannual Report | |||
FRANKLIN TEMPLETON VARIABLE INSURANCE PRODUCTS TRUST
CONSOLIDATED STATEMENT OF INVESTMENTS (UNAUDITED)
Franklin Strategic Income VIP Fund (continued)
| Country | | Principal Amount | * | Value | ||||||||||||
Asset-Backed Securities and Commercial Mortgage-Backed | ||||||||||||||||
Diversified Financials (continued) | ||||||||||||||||
d,u Flagship CLO VIII Ltd., | ||||||||||||||||
2014-8A, ARR, 144A, FRN, 2.899%, (3-month USD LIBOR + 0.85%), 1/16/26 | United States | 540,000 | $ | 539,827 | ||||||||||||
2014-8A, DR, 144A, FRN, 5.099%, (3-month USD LIBOR + 3.05%), 1/16/26 | United States | 350,000 | 349,927 | |||||||||||||
u FNMA Connecticut Avenue Securities, | ||||||||||||||||
2014-C02, 1M2, FRN, 4.691%, (1-month USD LIBOR + 2.60%), 5/25/24 | United States | 1,750,000 | 1,857,686 | |||||||||||||
2014-C03, 1M2, FRN, 5.091%, (1-month USD LIBOR + 3.00%), 7/25/24 | United States | 3,151,185 | 3,378,840 | |||||||||||||
2015-C01, 1M2, FRN, 6.391%, (1-month USD LIBOR + 4.30%), 2/25/25 | United States | 923,729 | 1,019,116 | |||||||||||||
2015-C01, 2M2, FRN, 6.641%, (1-month USD LIBOR + 4.55%), 2/25/25 | United States | 1,383,978 | 1,499,314 | |||||||||||||
2015-C02, 1M2, FRN, 6.091%, (1-month USD LIBOR + 4.00%), 5/25/25 | United States | 966,987 | 1,059,610 | |||||||||||||
2015-C02, 2M2, FRN, 6.091%, (1-month USD LIBOR + 4.00%), 5/25/25 | United States | 1,588,365 | 1,716,389 | |||||||||||||
2015-C03, 1M2, FRN, 7.091%, (1-month USD LIBOR + 5.00%), 7/25/25 | United States | 2,662,853 | 3,024,747 | |||||||||||||
2015-C03, 2M2, FRN, 7.091%, (1-month USD LIBOR + 5.00%), 7/25/25 | United States | 2,295,127 | 2,546,032 | |||||||||||||
2017-C01, 1M2, FRN, 5.641%, (1-month USD LIBOR + 3.55%), 7/25/29 | United States | 1,890,000 | 2,054,915 | |||||||||||||
d,u Galaxy CLO Ltd., | ||||||||||||||||
2014-17A, AR, 144A, FRN, 3.748%, (3-month USD LIBOR + 1.40%), 7/15/26 | United States | 720,000 | 721,008 | |||||||||||||
2014-17A, BR, 144A, FRN, 4.148%, (3-month USD LIBOR + 1.80%), 7/15/26 | United States | 470,000 | 470,851 | |||||||||||||
2014-17A, C1R, 144A, FRN, 4.748%, (3-month USD LIBOR + 2.40%), 7/15/26 | United States | 250,000 | 250,530 | |||||||||||||
d,g,v Galaxy XVIII CLO Ltd., 2018-28A, C, 144A, FRN, (3-month USD LIBOR + 1.95%), 7/15/31 | United States | 250,000 | 250,000 | |||||||||||||
d,u Galaxy XXVII CLO Ltd., 2018-27A, C, 144A, FRN, 5.103%, (3-month USD LIBOR + 2.75%), 5/16/31 | United States | 600,000 | 594,537 | |||||||||||||
d G-Force LLC, 2005-RRA, C, 144A, 5.20%, 8/22/36 | United States | 346,209 | 343,549 | |||||||||||||
GS Mortgage Securities Trust, | ||||||||||||||||
t 2016-GS3, B, FRN, 3.395%, 10/10/49 | United States | 900,000 | 863,941 | |||||||||||||
2017-GS6, B, 3.869%, 5/10/50 | United States | 870,000 | 859,238 | |||||||||||||
d,t J.P. Morgan Chase Commercial Mortgage Securities, 2016-Nine, B, 144A, FRN, 2.949%, 10/06/38 | United States | 1,200,000 | 1,110,019 | |||||||||||||
JPMCC Commercial Mortgage Securities Trust, 2017-JP6, B, 3.946%, 7/15/50 | United States | 1,040,000 | 1,028,702 | |||||||||||||
d,u LCM 26 Ltd., 26A, B, 144A, FRN, 3.326%, (3-month USD LIBOR + 1.40%), 1/20/31 | United States | 250,000 | 247,813 | |||||||||||||
d,u LCM XVI LP, 2016A, BR, 144A, FRN, 3.848%, (3-month USD LIBOR + 1.50%), 7/15/26 | United States | 570,000 | 570,684 | |||||||||||||
| Semiannual Report | FSI-25 | |||||
FRANKLIN TEMPLETON VARIABLE INSURANCE PRODUCTS TRUST
CONSOLIDATED STATEMENT OF INVESTMENTS (UNAUDITED)
Franklin Strategic Income VIP Fund (continued)
| Country | | Principal Amount | * | Value | ||||||||||||
Asset-Backed Securities and Commercial Mortgage-Backed | ||||||||||||||||
Diversified Financials (continued) | ||||||||||||||||
d,u LCM XVII LP, | ||||||||||||||||
2017A, BR, 144A, FRN, 4.198%, (3-month USD LIBOR + 1.85%), 10/15/26 | United States | 350,000 | $ | 350,469 | ||||||||||||
2017A, CR, 144A, FRN, 4.848%, (3-month USD LIBOR + 2.50%), 10/15/26 | United States | 320,000 | 320,464 | |||||||||||||
d,u LCM XVIII LP, 2018A, DR, 144A, FRN, 5.039%, (3-month USD LIBOR + 2.80%), 4/20/31 | United States | 770,000 | 770,316 | |||||||||||||
d,u LCM XXIV Ltd., 24A, A, 144A, FRN, 3.669%, (3-month USD LIBOR + 1.31%), 3/20/30 | United States | 480,000 | 487,109 | |||||||||||||
d,u Madison Park Funding XXIII Ltd., | ||||||||||||||||
2017-23A, B, 144A, FRN, 4.066%, (3-month USD LIBOR + 1.70%), 7/27/30 | United States | 400,000 | 402,024 | |||||||||||||
2017-23A, C, 144A, FRN, 4.716%, (3-month USD LIBOR + 2.35%), 7/27/30 | United States | 500,000 | 503,925 | |||||||||||||
d,u Magnetite XVIII Ltd., 2016-18A, B, 144A, FRN, 4.093%, (3-month USD LIBOR + 1.75%), 11/15/28 | United States | 200,000 | 200,544 | |||||||||||||
u MortgageIT Trust, 2004-1, A2, FRN, 2.991%, (1-month USD LIBOR + 0.90%), 11/25/34 | United States | 180,544 | 178,106 | |||||||||||||
d,u NZCG Funding Ltd., 2015-1A, A2R, 144A, FRN, 3.869%, (3-month USD LIBOR + 1.55%), 2/26/31 | United States | 2,700,000 | 2,701,458 | |||||||||||||
d,u Octagon Investment Partners 30 Ltd., 144A, FRN, 3.679%, (3-month USD LIBOR + 1.32%), 3/17/30 | United States | 480,000 | 482,285 | |||||||||||||
d,g,v Octagon Investment Partners 37 Ltd., 2018-2A, C, 144A, FRN, (3-month USD LIBOR + 2.85%), 7/25/30 | United States | 400,000 | 400,000 | |||||||||||||
d,g,v Octagon Investment Partners XVI Ltd., 2013-1A, DR, 144A, FRN, (3-month USD LIBOR + 3.00%), 7/17/30 | United States | 400,000 | 400,000 | |||||||||||||
d,u Octagon Investment Partners XX Ltd., 2014-1A, AR, 144A, FRN, 3.485%, (3-month USD LIBOR + 1.13%), 8/12/26 | United States | 900,000 | 901,404 | |||||||||||||
d,u Octagon Investment Partners XXIII Ltd., | ||||||||||||||||
2015-1A, BR, 144A, FRN, 3.461%, (3-month USD LIBOR + 1.20%), 7/15/27 | United States | 400,000 | 397,436 | |||||||||||||
2015-1A, DR, 144A, FRN, 4.811%, (3-month USD LIBOR + 2.55%), 7/15/27 | United States | 800,000 | 800,744 | |||||||||||||
u Opteum Mortgage Acceptance Corp. Trust, 2005-4, 1APT, FRN, 2.401%, (1-month USD LIBOR + 0.31%), 11/25/35 | United States | 248,813 | 247,394 | |||||||||||||
u Structured Asset Securities Corp., 2005-2XS, 2A2, FRN, 3.482%, (1-month USD LIBOR + 1.50%), 2/25/35 | United States | 175,187 | 173,018 | |||||||||||||
t Thornburg Mortgage Securities Trust, 2005-1, A3, FRN, 3.379%, 4/25/45 | United States | 167,344 | 168,757 | |||||||||||||
d,u Voya CLO, 2017-2A, B, 144A, FRN, 4.698%, (3-month USD LIBOR + 2.35%), 6/07/30 | United States | 1,800,000 | 1,812,147 | |||||||||||||
d,u Voya CLO Ltd., | ||||||||||||||||
2013-2A, BR, 144A, FRN, 4.194%, (3-month USD LIBOR + 1.85%), 4/25/31 | United States | 780,000 | 776,170 | |||||||||||||
2014-1A, CR2, 144A, FRN, 5.155%, (3-month USD LIBOR + 2.80%), 4/18/31 | United States | 1,000,000 | 1,002,010 | |||||||||||||
2015-2A, B, 144A, FRN, 4.342%, (3-month USD LIBOR + 1.98%), 7/23/27 | United States | 820,000 | 821,788 | |||||||||||||
2018-2A, D, 144A, FRN, 5.124%, (3-month USD LIBOR + 2.75%), 7/15/31 | United States | 300,000 | 299,946 | |||||||||||||
| FSI-26 | Semiannual Report | |||
FRANKLIN TEMPLETON VARIABLE INSURANCE PRODUCTS TRUST
CONSOLIDATED STATEMENT OF INVESTMENTS (UNAUDITED)
Franklin Strategic Income VIP Fund (continued)
| Country | | Principal Amount | * | Value | ||||||||||||
Asset-Backed Securities and Commercial Mortgage-Backed | ||||||||||||||||
Diversified Financials (continued) | ||||||||||||||||
Wells Fargo Mortgage Backed Securities Trust, | ||||||||||||||||
t 2004-W, A9, FRN, 3.72%, 11/25/34 | United States | 438,847 | $ | 451,321 | ||||||||||||
2007-3, 3A1, 5.50%, 4/25/22 | United States | 80,186 | 81,745 | |||||||||||||
|
| |||||||||||||||
| 90,831,767 | ||||||||||||||||
|
| |||||||||||||||
Total Asset-Backed Securities and Commercial Mortgage-Backed Securities (Cost $94,955,192) | 94,955,114 | |||||||||||||||
|
| |||||||||||||||
Mortgage-Backed Securities 9.2% | ||||||||||||||||
w Federal Home Loan Mortgage Corp. (FHLMC) Adjustable Rate 0.0%† | ||||||||||||||||
FHLMC, 3.679%, (US 1 Year CMT T-Note +/- MBS Margin), 1/01/33 | United States | 9,105 | 9,382 | |||||||||||||
|
| |||||||||||||||
Federal Home Loan Mortgage Corp. (FHLMC) Fixed Rate 5.1% | ||||||||||||||||
FHLMC Gold 15 Year, 5.50%, 1/01/19 - 7/01/19 | United States | 7,624 | 7,680 | |||||||||||||
FHLMC Gold 30 Year, 3.50%, 12/01/47 | United States | 2,564,544 | 2,552,352 | |||||||||||||
x FHLMC Gold 30 Year, 3.50%, 8/01/48 | United States | 10,530,000 | 10,460,191 | |||||||||||||
FHLMC Gold 30 Year, 4.00%, 5/01/48 | United States | 6,834,538 | 6,973,180 | |||||||||||||
x FHLMC Gold 30 Year, 4.00%, 8/01/48 | United States | 10,320,000 | 10,501,014 | |||||||||||||
FHLMC Gold 30 Year, 5.00%, 4/01/34 - 8/01/35 | United States | 209,382 | 222,905 | |||||||||||||
FHLMC Gold 30 Year, 5.50%, 3/01/33 - 1/01/35 | United States | 170,052 | 183,178 | |||||||||||||
FHLMC Gold 30 Year, 6.00%, 4/01/33 - 2/01/36 | United States | 135,700 | 149,041 | |||||||||||||
FHLMC Gold 30 Year, 6.50%, 11/01/27 - 6/01/36 | United States | 30,217 | 33,670 | |||||||||||||
FHLMC Gold 30 Year, 7.00%, 9/01/21 - 4/01/30 | United States | 11,066 | 11,611 | |||||||||||||
FHLMC Gold 30 Year, 7.50%, 8/01/30 - 7/01/31 | United States | 979 | 1,031 | |||||||||||||
|
| |||||||||||||||
| 31,095,853 | ||||||||||||||||
|
| |||||||||||||||
w Federal National Mortgage Association (FNMA) Adjustable Rate 0.0%† | ||||||||||||||||
FNMA, 3.418% - 4.08%, (US 1 Year CMT T-Note +/- MBS Margin), 4/01/20 - 12/01/34 | United States | 99,969 | 105,678 | |||||||||||||
|
| |||||||||||||||
Federal National Mortgage Association (FNMA) Fixed Rate 3.5% | ||||||||||||||||
FNMA 15 Year, 2.50%, 7/01/22 - 6/01/27 | United States | 298,689 | 292,871 | |||||||||||||
FNMA 15 Year, 3.00%, 4/01/33 | United States | 3,847,590 | 3,828,219 | |||||||||||||
FNMA 15 Year, 4.50%, 6/01/19 - 3/01/20 | United States | 9,409 | 9,480 | |||||||||||||
FNMA 15 Year, 5.50%, 9/01/18 - 11/01/18 | United States | 6,345 | 6,340 | |||||||||||||
FNMA 30 Year, 3.50%, 11/01/47 | United States | 4,488,415 | 4,471,055 | |||||||||||||
x FNMA 30 Year, 3.50%, 8/01/48 | United States | 4,580,000 | 4,551,700 | |||||||||||||
x FNMA 30 Year, 4.00%, 8/01/48 | United States | 5,120,000 | 5,212,400 | |||||||||||||
x FNMA 30 Year, 4.50%, 8/01/48 | United States | 2,700,000 | 2,806,576 | |||||||||||||
FNMA 30 Year, 5.00%, 4/01/30 | United States | 55,736 | 59,117 | |||||||||||||
FNMA 30 Year, 6.50%, 6/01/28 - 10/01/37 | United States | 150,204 | 166,157 | |||||||||||||
|
| |||||||||||||||
| 21,403,915 | ||||||||||||||||
|
| |||||||||||||||
Government National Mortgage Association (GNMA) Fixed Rate 0.6% | ||||||||||||||||
GNMA I SF 30 Year, 5.00%, 11/15/33 - 7/15/34 | United States | 226,525 | 241,219 | |||||||||||||
GNMA I SF 30 Year, 7.00%, 10/15/28 - 6/15/32 | United States | 15,721 | 15,911 | |||||||||||||
GNMA I SF 30 Year, 7.50%, 9/15/30 | United States | 1,230 | 1,397 | |||||||||||||
GNMA II SF 30 Year, 3.50%, 9/20/47 | United States | 782,017 | 785,721 | |||||||||||||
x GNMA II SF 30 Year, 3.50%, 8/01/48 | United States | 1,910,000 | 1,914,626 | |||||||||||||
GNMA II SF 30 Year, 5.00%, 9/20/33 - 11/20/33 | United States | 60,694 | 65,274 | |||||||||||||
GNMA II SF 30 Year, 6.00%, 11/20/34 | United States | 79,455 | 87,863 | |||||||||||||
GNMA II SF 30 Year, 6.50%, 4/20/31 - 2/20/34 | United States | 38,886 | 43,602 | |||||||||||||
| Semiannual Report | FSI-27 | |||||
FRANKLIN TEMPLETON VARIABLE INSURANCE PRODUCTS TRUST
CONSOLIDATED STATEMENT OF INVESTMENTS (UNAUDITED)
Franklin Strategic Income VIP Fund (continued)
| Country | Principal Amount* | Value | ||||||||||||||
Mortgage-Backed Securities (continued) | ||||||||||||||||
Government National Mortgage Association (GNMA) Fixed Rate (continued) | ||||||||||||||||
GNMA II SF 30 Year, 7.50%, 1/20/28 - 4/20/32 | United States | 9,891 | $ | 11,018 | ||||||||||||
|
| |||||||||||||||
| 3,166,631 | ||||||||||||||||
|
| |||||||||||||||
Total Mortgage-Backed Securities | 55,781,459 | |||||||||||||||
|
| |||||||||||||||
Municipal Bonds 1.1% | ||||||||||||||||
California State GO, Various Purpose, Refunding, 5.00%, 9/01/29 | United States | 1,650,000 | 1,955,448 | |||||||||||||
New York City HDC Capital Fund Grant Program Revenue, New York City Housing Authority Program, Series B1, 5.00%, 7/01/33 | United States | 500,000 | 542,440 | |||||||||||||
Orlando Health Obligated Group, 3.777%, 10/01/28 | United States | 405,000 | 401,365 | |||||||||||||
Port Authority of New York and New Jersey Revenue, Consolidated, One Hundred Ninety-First Series, 4.823%, 6/01/45 | United States | 1,490,000 | 1,580,189 | |||||||||||||
j Puerto Rico Electric Power Authority Power Revenue, | ||||||||||||||||
Series A, 6.75%, 7/01/36 | United States | 3,465,000 | 1,559,250 | |||||||||||||
Series XX, 5.25%, 7/01/40 | United States | 165,000 | 74,250 | |||||||||||||
San Jose RDA Successor Agency Tax Allocation, Senior, Refunding, Series A-T, 3.25%, 8/01/29 | United States | 540,000 | 524,162 | |||||||||||||
|
| |||||||||||||||
Total Municipal Bonds (Cost $8,219,834) | 6,637,104 | |||||||||||||||
|
| |||||||||||||||
| Shares | ||||||||||||||||
Escrows and Litigation Trusts 0.0%† | ||||||||||||||||
a,ab Midstates Petroleum Co. Inc./Midstates Petroleum Co. LLC, Escrow Account | United States | 1,500,000 | — | |||||||||||||
a,ab NewPage Corp., Litigation Trust | United States | 2,500,000 | — | |||||||||||||
a Penn Virginia Corp., Escrow Account | United States | 1,500,000 | 3,750 | |||||||||||||
a Vistra Energy Corp., Escrow Account | United States | 3,000,000 | 24,375 | |||||||||||||
|
| |||||||||||||||
Total Escrows and Litigation Trusts (Cost $91,006) | 28,125 | |||||||||||||||
|
| |||||||||||||||
Total Investments before Short Term Investments | 627,497,040 | |||||||||||||||
|
| |||||||||||||||
| | Principal Amount | * | ||||||||||||||
Short Term Investments 1.5% | ||||||||||||||||
U.S. Government and Agency Securities (Cost $496,564) 0.1% | ||||||||||||||||
y U.S. Treasury Bill, 11/01/18 | United States | 500,000 | 496,664 | |||||||||||||
|
| |||||||||||||||
Total Investments before Money Market Funds | 627,993,704 | |||||||||||||||
|
| |||||||||||||||
| FSI-28 | Semiannual Report | |||
FRANKLIN TEMPLETON VARIABLE INSURANCE PRODUCTS TRUST
CONSOLIDATED STATEMENT OF INVESTMENTS (UNAUDITED)
Franklin Strategic Income VIP Fund (continued)
| Country | Shares | Value | ||||||||||||||
Short Term Investments (continued) | ||||||||||||||||
Money Market Funds (Cost $8,777,736) 1.4% | ||||||||||||||||
c,z Institutional Fiduciary Trust Money Market Portfolio, 1.51% | United States | 8,777,736 | $ | 8,777,736 | ||||||||||||
|
| |||||||||||||||
Total Investments (Cost $656,019,272) 104.6% | 636,771,440 | |||||||||||||||
Other Assets, less Liabilities (4.6)% | (28,090,122 | ) | ||||||||||||||
|
| |||||||||||||||
Net Assets 100.0% | $ | 608,681,318 | ||||||||||||||
|
| |||||||||||||||
†Rounds to less than 0.1% of net assets.
*The principal amount is stated in U.S. dollars unless otherwise indicated.
aNon-income producing.
aaThe security is owned by FT Holdings Corporation III, a wholly-owned subsidiary of the Fund. See Note 1(g).
abFair valued using significant unobservable inputs. See Note 11 regarding fair value measurements.
bSee Note 8 regarding restricted securities.
cSee Note 3(e) regarding investments in affiliated management investment companies.
dSecurity was purchased pursuant to Rule 144A under the Securities Act of 1933 and may be sold in transactions exempt from registration only to qualified institutional buyers or in a public offering registered under the Securities Act of 1933. These securities have been deemed liquid under guidelines approved by the Trust’s Board of Trustees. At June 30, 2018, the aggregate value of these securities was $209,048,537, representing 34.3% of net assets.
ePerpetual security with no stated maturity date.
fSecurity was purchased pursuant to Regulation S under the Securities Act of 1933, which exempts from registration securities offered and sold outside of the United States. Such a security cannot be sold in the United States without either an effective registration statement filed pursuant to the Securities Act of 1933, or pursuant to an exemption from registration. These securities have been deemed liquid under guidelines approved by the Trust’s Board of Trustees. At June 30, 2018, the aggregate value of these securities was $578,868, representing 0.1% of net assets.
gSecurity purchased on a when-issued basis. See Note 1(c).
hIncome may be received in additional securities and/or cash.
iSee Note 1(f) regarding loan participation notes.
jSee Note 7 regarding defaulted securities.
kThe coupon rate shown represents the rate at period end.
lSee Note 1(i) regarding senior floating rate interests.
mSecurity purchased on a delayed delivery basis. See Note 1(c).
nA portion or all of the security represents an unsettled loan commitment. The coupon rate is to-be determined (TBD) at the time of settlement and will be based upon a reference index/floor plus a spread.
oPrincipal amount is stated in 100 Mexican Peso Units.
pThe principal represents the notional amount. See Note 1(d) regarding value recovery instruments.
qPrincipal amount is stated in 1,000 Brazilian Real Units.
rRedemption price at maturity and coupon payment are adjusted for inflation. See Note 1(k).
sPrincipal amount of security is adjusted for inflation. See Note 1(k).
tAdjustable rate security with an interest rate that is not based on a published reference index and spread. The rate is based on the structure of the agreement and current market conditions. The coupon rate shown represents the rate at period end.
uThe coupon rate shown represents the rate inclusive of any caps or floors, if applicable, in effect at period end.
vThe coupon rate will be determined at time of issue.
wAdjustable Rate Mortgage-Backed Security (ARM); the rate shown is the effective rate at period end. ARM rates are not based on a published reference rate and spread, but instead pass-through weighted average interest income inclusive of any caps or floors, if applicable, from the underlying mortgage loans in which the majority of mortgages pay interest based on the index shown at their designated reset dates plus a spread, less the applicable servicing and guaranty fee (MBS margin).
xSecurity purchased on a to-be-announced (TBA) basis. See Note 1(c).
yThe security was issued on a discount basis with no stated coupon rate.
zThe rate shown is the annualized seven-day effective yield at period end.
| Semiannual Report | FSI-29 | |||||
FRANKLIN TEMPLETON VARIABLE INSURANCE PRODUCTS TRUST
CONSOLIDATED STATEMENT OF INVESTMENTS (UNAUDITED)
Franklin Strategic Income VIP Fund (continued)
At June 30, 2018, the Fund had the following futures contracts outstanding. See Note 1(d).
Futures Contracts
| Description | Type | | Number of Contracts | | | Notional Amount | * | | Expiration Date |
| | Value/ Unrealized Appreciation (Depreciation) |
| |||||||
| Interest Rate Contracts | ||||||||||||||||||||
Euro-Bund | Short | 50 | $ | 9,495,765 | 9/06/18 | $(146,065 | ) | |||||||||||||
Long Gilt | Long | 46 | 7,475,599 | 9/26/18 | (40,774 | ) | ||||||||||||||
Ultra 10 Yr. U.S. Treasury Note | Long | 100 | 12,823,438 | 9/19/18 | 140,753 | |||||||||||||||
|
| |||||||||||||||||||
Total Futures Contracts | $ (46,086 | ) | ||||||||||||||||||
|
| |||||||||||||||||||
*As of period end.
At June 30, 2018, the Fund had the following forward exchange contracts outstanding. See Note 1(d).
Forward Exchange Contracts
| Currency | Counterparty | a | Type | Quantity | | Contract Amount | | | Settlement Date | | | Unrealized Appreciation | | | Unrealized Depreciation | | ||||||||||||
| ||||||||||||||||||||||||||||
| OTC Forward Exchange Contracts |
| |||||||||||||||||||||||||||
Mexican Peso | JPHQ | Buy | 17,800,000 | $ | 859,530 | 7/19/18 | $ 34,077 | $ | — | |||||||||||||||||||
Mexican Peso | JPHQ | Buy | 18,200,000 | 990,713 | 7/19/18 | — | (77,026 | ) | ||||||||||||||||||||
Mexican Peso | JPHQ | Sell | 36,000,000 | 1,904,963 | 7/19/18 | 97,670 | — | |||||||||||||||||||||
Polish Zloty | DBAB | Buy | 6,600,000 | 1,944,436 | 7/19/18 | — | (180,827 | ) | ||||||||||||||||||||
Polish Zloty | DBAB | Sell | 6,600,000 | 1,771,850 | 7/19/18 | 8,241 | — | |||||||||||||||||||||
Brazilian Real | JPHQ | Sell | 10,200,000 | 2,743,773 | 8/15/18 | 123,326 | — | |||||||||||||||||||||
British Pound | JPHQ | Buy | 500,000 | 680,200 | 8/15/18 | — | (18,461 | ) | ||||||||||||||||||||
British Pound | JPHQ | Sell | 1,250,000 | 1,649,375 | 8/15/18 | — | (4,971 | ) | ||||||||||||||||||||
Euro | JPHQ | Buy | 1,400,000 | 1,637,535 | 8/15/18 | 4,045 | — | |||||||||||||||||||||
Euro | JPHQ | Sell | 1,400,000 | 1,735,300 | 8/15/18 | 93,720 | — | |||||||||||||||||||||
Swedish Krona | JPHQ | Buy | 23,600,000 | 2,846,172 | 8/15/18 | — | (200,271 | ) | ||||||||||||||||||||
Polish Zloty | JPHQ | Buy | 6,000,000 | 1,784,917 | 8/16/18 | — | (180,898 | ) | ||||||||||||||||||||
British Pound | JPHQ | Sell | 150,000 | 213,740 | 9/19/18 | 14,912 | — | |||||||||||||||||||||
Euro | BZWS | Buy | 2,561,255 | 3,002,303 | 9/19/18 | 9,100 | — | |||||||||||||||||||||
Euro | BZWS | Sell | 2,561,255 | 3,200,523 | 9/19/18 | 189,120 | — | |||||||||||||||||||||
Euro | CITI | Buy | 850,000 | 996,083 | 9/19/18 | 3,307 | — | |||||||||||||||||||||
Euro | CITI | Sell | 2,131,200 | 2,664,192 | 9/19/18 | 158,427 | — | |||||||||||||||||||||
Euro | JPHQ | Buy | 1,300,000 | 1,574,918 | 9/19/18 | — | (46,439 | ) | ||||||||||||||||||||
Euro | JPHQ | Sell | 3,740,000 | 4,673,205 | 9/19/18 | 275,889 | — | |||||||||||||||||||||
Norwegian Krone | JPHQ | Buy | 13,700,000 | 1,763,941 | 9/19/18 | — | (76,321 | ) | ||||||||||||||||||||
Norwegian Krone | JPHQ | Sell | 13,700,000 | 1,694,107 | 9/19/18 | 6,487 | — | |||||||||||||||||||||
Swedish Krona | JPHQ | Buy | 13,900,000 | 1,691,615 | 9/19/18 | — | (128,931 | ) | ||||||||||||||||||||
Australian Dollar | DBAB | Buy | 4,000,000 | 2,976,980 | 10/09/18 | — | (15,233 | ) | ||||||||||||||||||||
Australian Dollar | DBAB | Sell | 5,308,345 | 4,123,257 | 10/09/18 | 192,764 | — | |||||||||||||||||||||
Australian Dollar | JPHQ | Sell | 4,700,000 | 3,626,280 | 10/09/18 | 146,227 | — | |||||||||||||||||||||
Brazilian Real | JPHQ | Sell | 6,300,000 | 1,575,788 | 10/09/18 | — | (32,976 | ) | ||||||||||||||||||||
Canadian Dollar | JPHQ | Buy | 2,300,000 | 1,730,520 | 10/09/18 | 22,684 | — | |||||||||||||||||||||
Canadian Dollar | JPHQ | Sell | 10,000,000 | 7,942,125 | 10/09/18 | 319,496 | — | |||||||||||||||||||||
Indian Rupee | DBAB | Buy | 350,093,000 | 5,304,439 | 10/09/18 | — | (262,584 | ) | ||||||||||||||||||||
Indian Rupee | HSBK | Buy | 144,338,000 | 2,181,453 | 10/09/18 | — | (102,773 | ) | ||||||||||||||||||||
| FSI-30 | Semiannual Report | |||
FRANKLIN TEMPLETON VARIABLE INSURANCE PRODUCTS TRUST
CONSOLIDATED STATEMENT OF INVESTMENTS (UNAUDITED)
Franklin Strategic Income VIP Fund (continued)
Forward Exchange Contracts (continued)
| Currency | Counterpartya | Type | Quantity | Contract Amount | Settlement Date | Unrealized Appreciation | Unrealized Depreciation | |||||||||||||||||||||
| OTC Forward Exchange Contracts (continued) |
| |||||||||||||||||||||||||||
Indian Rupee | HSBK | Sell | 130,000,000 | $ | 1,890,222 | 10/09/18 | $ | 18,030 | $ | — | ||||||||||||||||||
Indian Rupee | JPHQ | Buy | 44,000,000 | 665,155 | 10/09/18 | — | (31,490 | ) | ||||||||||||||||||||
Mexican Peso | JPHQ | Buy | 12,400,000 | 590,828 | 10/09/18 | 23,644 | — | |||||||||||||||||||||
South Korean Won | JPHQ | Buy | 1,800,000,000 | 1,690,093 | 10/10/18 | — | (70,109 | ) | ||||||||||||||||||||
South Korean Won | JPHQ | Sell | 1,800,000,000 | 1,700,600 | 10/10/18 | 80,615 | — | |||||||||||||||||||||
Argentine Peso | JPHQ | Buy | 13,500,000 | 605,245 | 10/31/18 | — | (169,247 | ) | ||||||||||||||||||||
|
| |||||||||||||||||||||||||||
Total Forward Exchange Contracts |
| $ | 1,821,781 | $ | (1,598,557 | ) | ||||||||||||||||||||||
|
| |||||||||||||||||||||||||||
Net unrealized appreciation (depreciation) |
| $ | 223,224 | |||||||||||||||||||||||||
|
| |||||||||||||||||||||||||||
aMay be comprised of multiple contracts with the same counterparty, currency and settlement date.
At June 30, 2018, the Fund had the following credit default swap contracts outstanding. See Note 1(d).
Credit Default Swap Contracts
| Description | | Periodic Payment Rate Received (Paid) | | | Payment Frequency | | | Counter- party | | | Maturity Date | | | Notional Amount | a | Value | | Unamortized Upfront Payments (Receipts) | | | Unrealized Appreciation (Depreciation) | | Ratingb | |||||||||||||
Centrally Cleared Swap Contracts | ||||||||||||||||||||||||||||||||||||
Contracts to Sell Protectionc,d | ||||||||||||||||||||||||||||||||||||
Traded Index | ||||||||||||||||||||||||||||||||||||
CDX.EM.29 | 1.00 | % | Quarterly | 6/20/23 | $ | 4,100,000 | $ | (162,110) | $ | (89,734) | $ | (72,376) | Non- | |||||||||||||||||||||||
| Investment | ||||||||||||||||||||||||||||||||||||
| Grade | ||||||||||||||||||||||||||||||||||||
CDX.NA.HY.30 | 5.00 | % | Quarterly | 6/20/23 | $ | 4,400,000 | 260,243 | 255,577 | 4,666 | Non- | ||||||||||||||||||||||||||
| Investment | ||||||||||||||||||||||||||||||||||||
| Grade | ||||||||||||||||||||||||||||||||||||
CDX.NA.HY.30 | 5.00 | % | Quarterly | 6/20/23 | 1,500,000 | 88,719 | 91,464 | (2,745) | Non- | |||||||||||||||||||||||||||
|
| |||||||||||||||||||||||||||||||||||
| Investment | ||||||||||||||||||||||||||||||||||||
| Grade | ||||||||||||||||||||||||||||||||||||
Total Centrally Cleared Swap Contracts |
| $ | 186,852 | $ | 257,307 | $ | (70,455) | |||||||||||||||||||||||||||||
|
| |||||||||||||||||||||||||||||||||||
OTC Swap Contracts | ||||||||||||||||||||||||||||||||||||
Contracts to Buy Protectionc | ||||||||||||||||||||||||||||||||||||
Single Name | ||||||||||||||||||||||||||||||||||||
Ally Financial Inc. | (5.00) | % | Quarterly | CITI | 12/20/22 | $ | 750,000 | $ | (115,194) | $ | (122,482) | $ | 7,288 | |||||||||||||||||||||||
Ally Financial Inc. | (5.00) | % | Quarterly | JPHQ | 12/20/22 | 1,250,000 | (191,990) | (205,545) | 13,555 | |||||||||||||||||||||||||||
Contracts to Sell Protectionc,d | ||||||||||||||||||||||||||||||||||||
Single Name | ||||||||||||||||||||||||||||||||||||
Government of Argentina | 5.00 | % | Quarterly | MSCO | 6/20/23 | 5,000,000 | 84,969 | 496,617 | (411,648) | B+ | ||||||||||||||||||||||||||
Government of Brazil | 1.00 | % | Quarterly | CITI | 6/20/23 | 3,250,000 | (239,343) | (187,754) | (51,589) | BB- | ||||||||||||||||||||||||||
Government of Colombia | 1.00 | % | Quarterly | CITI | 6/20/23 | 3,700,000 | (38,879) | (9,625) | (29,254) | BBB- | ||||||||||||||||||||||||||
Government of Indonesia | 1.00 | % | Quarterly | JPHQ | 6/20/23 | 2,000,000 | (32,417) | (24,414) | (8,003) | BBB- | ||||||||||||||||||||||||||
Government of Mexico | 1.00 | % | Quarterly | BZWS | 6/20/23 | 900,000 | (13,526) | (16,758) | 3,232 | BBB+ | ||||||||||||||||||||||||||
Government of Mexico | 1.00 | % | Quarterly | CITI | 6/20/23 | 900,000 | (13,526) | (11,103) | (2,423) | BBB+ | ||||||||||||||||||||||||||
Government of Mexico | 1.00 | % | Quarterly | JPHQ | 6/20/23 | 1,700,000 | (25,549) | (12,340) | (13,209) | BBB+ | ||||||||||||||||||||||||||
| Semiannual Report | FSI-31 | |||||
FRANKLIN TEMPLETON VARIABLE INSURANCE PRODUCTS TRUST
CONSOLIDATED STATEMENT OF INVESTMENTS (UNAUDITED)
Franklin Strategic Income VIP Fund (continued)
Credit Default Swap Contracts (continued)
| Description | Periodic Payment Rate Received (Paid) | Payment Frequency | Counter- party | Maturity Date | Notional Amounta | Value | Unamortized Upfront Payments (Receipts) | Unrealized Appreciation (Depreciation) | Ratingb | |||||||||||||||||||||||||||
OTC Swap Contracts (continued) |
| |||||||||||||||||||||||||||||||||||
Contracts to Sell Protectionc,d (continued) |
| |||||||||||||||||||||||||||||||||||
Traded Index |
| |||||||||||||||||||||||||||||||||||
eCitibank Bespoke Cambridge Index, Equity Tranche 0-3% | 0.00 | % | Quarterly | CITI | 12/20/19 | $ | 2,900,000 | $ | (594,823 | ) | $ | (349,890 | ) | $ | (244,933 | ) | Non- | |||||||||||||||||||
| Investment | ||||||||||||||||||||||||||||||||||||
| Grade | ||||||||||||||||||||||||||||||||||||
eCitibank Bespoke Index, Tranche 3-7% | 1.30 | % | Quarterly | CITI | 6/20/19 | 1,600,000 | (10,317 | ) | — | (10,317 | ) | Non- | ||||||||||||||||||||||||
| Investment | ||||||||||||||||||||||||||||||||||||
| Grade | ||||||||||||||||||||||||||||||||||||
eCitibank Bespoke Index, Tranche 3-7% | 1.40 | % | Quarterly | CITI | 6/20/19 | 1,300,000 | (7,092 | ) | — | (7,092 | ) | Non- | ||||||||||||||||||||||||
| Investment | ||||||||||||||||||||||||||||||||||||
| Grade | ||||||||||||||||||||||||||||||||||||
eCitibank Bespoke Lisbon Index, Equity Tranche 0-3% | 0.00 | % | Quarterly | CITI | 6/20/19 | 530,000 | (45,285 | ) | (60,985 | ) | 15,700 | Non- | ||||||||||||||||||||||||
| Investment | ||||||||||||||||||||||||||||||||||||
| Grade | ||||||||||||||||||||||||||||||||||||
eCitibank Bespoke Verona Index, Equity Tranche 0-3% | 0.00 | % | Quarterly | CITI | 12/20/19 | 1,100,000 | (195,468 | ) | (162,911 | ) | (32,557 | ) | Non- | |||||||||||||||||||||||
| Investment | ||||||||||||||||||||||||||||||||||||
| Grade | ||||||||||||||||||||||||||||||||||||
eCitibank Bespoke Verona Index, Mezzanine Tranche 7-15% | 0.40 | % | Quarterly | CITI | 12/20/19 | 3,100,000 | (634 | ) | — | (634 | ) | Non- | ||||||||||||||||||||||||
| Investment | ||||||||||||||||||||||||||||||||||||
| Grade | ||||||||||||||||||||||||||||||||||||
MCDX.NA.30 | 1.00 | % | Quarterly | CITI | 6/20/23 | 2,270,000 | 48,576 | 52,839 | (4,263 | ) | Investment | |||||||||||||||||||||||||
|
|
| ||||||||||||||||||||||||||||||||||
| Grade | ||||||||||||||||||||||||||||||||||||
Total OTC Swap Contracts |
| $ | (1,390,498 | ) | $ | (614,351 | ) | $ | (776,147 | ) | ||||||||||||||||||||||||||
|
|
| ||||||||||||||||||||||||||||||||||
Total Credit Default Swap Contracts |
| $ | (1,203,646 | ) | $ | (357,044 | ) | $ | (846,602 | ) | ||||||||||||||||||||||||||
|
|
| ||||||||||||||||||||||||||||||||||
aFor contracts to sell protection, the notional amount is equal to the maximum potential amount of the future payments and no recourse provisions have been entered into in association with the contracts.
bBased on Standard and Poor’s (S&P) Rating for single name swaps and internal ratings for index swaps. Internal ratings based on mapping into equivalent ratings from external vendors.
cPerformance triggers for settlement of contract include default, bankruptcy or restructuring for single name swaps and failure to pay or bankruptcy of the underlying securities for traded index swaps.
dThe fund enters contracts to sell protection to create a long credit position.
eRepresents a custom index comprised of a basket of underlying issuers.
FSI-32 | Semiannual Report |
FRANKLIN TEMPLETON VARIABLE INSURANCE PRODUCTS TRUST
CONSOLIDATED STATEMENT OF INVESTMENTS (UNAUDITED)
Franklin Strategic Income VIP Fund (continued)
At June 30, 2018, the Fund had the following cross-currency swap contracts outstanding. See Note 1(d).
Cross-Currency Swap Contracts
| Description | Payment Frequency | Counter- party | Maturity Date | Notional Amount | Value/ Unrealized Appreciation (Depreciation) | |||||||||||||||||||
OTC Swap Contracts | ||||||||||||||||||||||||
Receive Floating 3-month USD LIBOR + 2.87% | Quarterly | 464,800 | USD | |||||||||||||||||||||
Pay Fixed 2.50% | Annual | CITI | 5/04/21 | 400,000 | EUR | $(2,260 | ) | |||||||||||||||||
|
| |||||||||||||||||||||||
At June 30, 2018, the Fund had the following total return swap contracts outstanding. See Note 1(d).
Total Return Swap Contracts
| Underlying Instruments | Financing Rate | Payment Frequency | Counterparty | Maturity Date | Notional Value | Value/ Unrealized Appreciation (Depreciation) | ||||||||||||||||||
OTC Swap Contracts | ||||||||||||||||||||||||
Longa | ||||||||||||||||||||||||
IBOXX USD Liquid Leveraged Loans | 3-month USD LIBOR | Quarterly | GSCO | 6/20/19 | $5,500,000 | $(16,350 | ) | |||||||||||||||||
|
| |||||||||||||||||||||||
aThe Fund receives the total return on the underlying instrument and pays a variable financing rate.
See Note 9 regarding other derivative information.
See Abbreviations on page FSI-52.
| The accompanying notes are an integral part of these consolidated financial statements. | Semiannual Report | FSI-33 | |||||
FRANKLIN TEMPLETON VARIABLE INSURANCE PRODUCTS TRUST
Consolidated Financial Statements
Consolidated Statement of Assets and Liabilities
June 30, 2018 (unaudited)
| Franklin Strategic Income VIP Fund | ||||
Assets: | ||||
Investments in securities: | ||||
Cost - Unaffiliated issuers | $606,656,315 | |||
Cost - Non-controlled affiliates (Note 3e) | 49,362,957 | |||
|
| |||
Value - Unaffiliated issuers | $588,434,859 | |||
Value - Non-controlled affiliates (Note 3e) | 48,336,581 | |||
Cash | 6,529,244 | |||
Restricted cash for OTC derivative contracts (Note 1e) | 300,000 | |||
Foreign currency, at value (cost $604,297) | 610,413 | |||
Receivables: | ||||
Investment securities sold | 39,279,139 | |||
Capital shares sold | 45,517 | |||
Dividends and interest | 5,548,816 | |||
Deposits with brokers for: | ||||
OTC derivative contracts | 1,310,000 | |||
Futures contracts | 397,358 | |||
Centrally cleared swap contracts | 849,519 | |||
OTC swap contracts (upfront payments $581,522) | 549,456 | |||
Unrealized appreciation on OTC forward exchange contracts | 1,821,781 | |||
Unrealized appreciation on OTC swap contracts | 39,775 | |||
FT Subsidiary deferred tax benefit (Note 1g) | 473,781 | |||
Other assets | 300 | |||
|
| |||
Total assets | 694,526,539 | |||
|
| |||
Liabilities: | ||||
Payables: | ||||
Investment securities purchased | 80,805,389 | |||
Capital shares redeemed | 484,582 | |||
Management fees | 284,274 | |||
Distribution fees | 127,060 | |||
Variation margin on futures contracts | 21,073 | |||
Variation margin on centrally cleared swap contracts | 5,492 | |||
Deposits from brokers for: | ||||
OTC derivative contracts | 300,000 | |||
OTC swap contracts (upfront receipts $1,519,209) | 1,163,807 | |||
Unrealized depreciation on OTC forward exchange contracts | 1,598,557 | |||
Unrealized depreciation on OTC swap contracts | 834,532 | |||
Deferred tax | 20,651 | |||
Accrued expenses and other liabilities | 199,804 | |||
|
| |||
Total liabilities | 85,845,221 | |||
|
| |||
Net assets, at value | $608,681,318 | |||
|
| |||
Net assets consist of: | ||||
Paid-in capital | $651,307,141 | |||
Undistributed net investment income | 8,924,235 | |||
Net unrealized appreciation (depreciation) | (19,521,367 | ) | ||
Accumulated net realized gain (loss) | (32,028,691 | ) | ||
|
| |||
Net assets, at value | $608,681,318 | |||
|
| |||
| FSI-34 | Semiannual Report | The accompanying notes are an integral part of these consolidated financial statements. | |||
FRANKLIN TEMPLETON VARIABLE INSURANCE PRODUCTS TRUST
CONSOLIDATED FINANCIAL STATEMENTS
Consolidated Statement of Assets and Liabilities (continued)
June 30, 2018 (unaudited)
| Franklin Strategic Income VIP Fund | ||||
| Class 1: | ||||
Net assets, at value | $333,800,530 | |||
|
| |||
Shares outstanding | 31,158,509 | |||
|
| |||
Net asset value and maximum offering price per share | $10.71 | |||
|
| |||
| Class 2: | ||||
Net assets, at value | $208,250,300 | |||
|
| |||
Shares outstanding | 20,125,973 | |||
|
| |||
Net asset value and maximum offering price per share | $10.35 | |||
|
| |||
| Class 4: | ||||
Net assets, at value | $ 66,630,488 | |||
|
| |||
Shares outstanding | 6,264,838 | |||
|
| |||
Net asset value and maximum offering price per share | $10.64 | |||
|
| |||
| The accompanying notes are an integral part of these consolidated financial statements. | Semiannual Report | FSI-35 | |||||
FRANKLIN TEMPLETON VARIABLE INSURANCE PRODUCTS TRUST
CONSOLIDATED FINANCIAL STATEMENTS
Consolidated Statement of Operations
for the six months ended June 30, 2018 (unaudited)
| Franklin Strategic Income VIP Fund | ||||
Investment income: | ||||
Dividends: | ||||
Non-controlled affiliates (Note 3e) | $ 1,780,439 | |||
Interest: (net of foreign taxes)~ | ||||
Unaffiliated issuers | 13,186,954 | |||
|
| |||
Total investment income | 14,967,393 | |||
|
| |||
Expenses: | ||||
Management fees (Note 3a) | 1,888,689 | |||
Distribution fees: (Note 3c) | ||||
Class 2 | 262,061 | |||
Class 4 | 122,654 | |||
Custodian fees (Note 4) | 13,874 | |||
Reports to shareholders | 74,940 | |||
Professional fees | 67,534 | |||
Trustees’ fees and expenses | 1,667 | |||
Other | 32,761 | |||
|
| |||
Total expenses | 2,464,180 | |||
Expense reductions (Note 4) | (14,303 | ) | ||
Expenses waived/paid by affiliates (Note 3e) | (140,208 | ) | ||
|
| |||
Net expenses | 2,309,669 | |||
|
| |||
Net investment income | 12,657,724 | |||
|
| |||
Realized and unrealized gains (losses): | ||||
Net realized gain (loss) from: | ||||
Investments:# | ||||
Unaffiliated issuers | (3,663,105 | ) | ||
Foreign currency transactions | (109,737 | ) | ||
Forward exchange contracts | (1,008,966 | ) | ||
Futures contracts | (153,794 | ) | ||
Swap contracts | 383,598 | |||
|
| |||
Net realized gain (loss) | (4,552,004 | ) | ||
|
| |||
Net change in unrealized appreciation (depreciation) on: | ||||
Investments: | ||||
Unaffiliated issuers | (14,244,361 | ) | ||
Non-controlled affiliates (Note 3e) | (760,045 | ) | ||
Translation of other assets and liabilities denominated in foreign currencies | (15,760 | ) | ||
Forward exchange contracts | 341,237 | |||
Futures contracts | (73,783 | ) | ||
Swap contracts | (922,608 | ) | ||
Change in FT Subsidiary deferred tax benefit (Note 1g) | 473,781 | |||
Change in deferred taxes on unrealized appreciation | 70,028 | |||
|
| |||
Net change in unrealized appreciation (depreciation) | (15,131,511 | ) | ||
|
| |||
Net realized and unrealized gain (loss) | (19,683,515 | ) | ||
|
| |||
Net increase (decrease) in net assets resulting from operations | $ (7,025,791 | ) | ||
|
| |||
~Foreign taxes withheld on interest | $ 32,069 | |||
#Net of foreign taxes | $ 19,017 | |||
FSI-36 | Semiannual Report | The accompanying notes are an integral part of these consolidated financial statements. |
FRANKLIN TEMPLETON VARIABLE INSURANCE PRODUCTS TRUST
CONSOLIDATED FINANCIAL STATEMENTS
Consolidated Statements of Changes in Net Assets
Franklin Strategic Income VIP Fund | ||||||||
| Six Months Ended June 30, 2018 (unaudited) | Year Ended December 31, 2017 | |||||||
Increase (decrease) in net assets: | ||||||||
Operations: | ||||||||
Net investment income | $ 12,657,724 | $ 26,009,801 | ||||||
Net realized gain (loss) | (4,552,004 | ) | (9,146,959 | ) | ||||
Net change in unrealized appreciation (depreciation) | (15,131,511 | ) | 11,365,697 | |||||
|
| |||||||
Net increase (decrease) in net assets resulting from operations | (7,025,791 | ) | 28,228,539 | |||||
|
| |||||||
Distributions to shareholders from: | ||||||||
Net investment income: | ||||||||
Class 1 | (9,703,924 | ) | (11,689,930 | ) | ||||
Class 2 | (5,724,625 | ) | (6,228,631 | ) | ||||
Class 4 | (1,690,861 | ) | (2,076,378 | ) | ||||
|
| |||||||
Total distributions to shareholders | (17,119,410 | ) | (19,994,939 | ) | ||||
|
| |||||||
Capital share transactions: (Note 2) | ||||||||
Class 1 | (14,273,855 | ) | (39,684,506 | ) | ||||
Class 2 | 2,164,813 | 8,628,689 | ||||||
Class 4 | (4,813,441 | ) | (7,192,045 | ) | ||||
|
| |||||||
Total capital share transactions | (16,922,483 | ) | (38,247,862 | ) | ||||
|
| |||||||
Net increase (decrease) in net assets | (41,067,684 | ) | (30,014,262 | ) | ||||
Net assets: | ||||||||
Beginning of period | 649,749,002 | 679,763,264 | ||||||
|
| |||||||
End of period | $608,681,318 | $649,749,002 | ||||||
|
| |||||||
Undistributed net investment income included in net assets: | ||||||||
End of period | $ 8,924,235 | $ 13,385,921 | ||||||
|
| |||||||
| The accompanying notes are an integral part of these consolidated financial statements. | Semiannual Report | FSI-37 | |||||
FRANKLIN TEMPLETON VARIABLE INSURANCE PRODUCTS TRUST
Notes to Consolidated Financial Statements (unaudited)
Franklin Strategic Income VIP Fund
1. Organization and Significant Accounting Policies
Franklin Templeton Variable Insurance Products Trust (Trust) is registered under the Investment Company Act of 1940 (1940 Act) as an open-end management investment company, consisting of eighteen separate funds and applies the specialized accounting and reporting guidance in U.S. Generally Accepted Accounting Principles (U.S. GAAP). Franklin Strategic Income VIP Fund (Fund) is included in this report. Shares of the Fund are generally sold only to insurance company separate accounts to fund the benefits of variable life insurance policies or variable annuity contracts. At June 30, 2018, 66.4% of the Fund’s shares were held through one insurance company. Investment activities of these insurance company separate accounts could have a material impact on the Fund. The Fund offers three classes of shares: Class 1, Class 2 and Class 4. Each class of shares may differ by its distribution fees, voting rights on matters affecting a single class and its exchange privilege.
The following summarizes the Fund’s significant accounting policies.
a. Financial Instrument Valuation
The Fund’s investments in financial instruments are carried at fair value daily. Fair value is the price that would be received to sell an asset or paid to transfer a liability in an orderly transaction between market participants on the measurement date. The Fund calculates the net asset value (NAV) per share each business day as of 4 p.m. Eastern time or the regularly scheduled close of the New York Stock Exchange (NYSE), whichever is earlier. Under compliance policies and procedures approved by the Trust’s Board of Trustees (the Board), the Fund’s administrator has responsibility for oversight of valuation, including leading the cross-functional Valuation Committee (VC). The VC provides administration and oversight of the Fund’s valuation policies and procedures, which are approved annually by the Board. Among other things, these procedures allow the Fund to utilize independent pricing services, quotations from securities and financial instrument dealers, and other market sources to determine fair value.
Equity securities and derivative financial instruments listed on an exchange or on the NASDAQ National Market System are valued at the last quoted sale price or the official closing price of the day, respectively. Foreign equity securities are valued as of the close of trading on the foreign stock exchange on which the security is primarily traded, or as of 4 p.m. Eastern time.
The value is then converted into its U.S. dollar equivalent at the foreign exchange rate in effect at 4 p.m. Eastern time on the day that the value of the security is determined. Over-the-counter (OTC) securities are valued within the range of the most recent quoted bid and ask prices. Securities that trade in multiple markets or on multiple exchanges are valued according to the broadest and most representative market. Certain equity securities are valued based upon fundamental characteristics or relationships to similar securities.
Debt securities generally trade in the OTC market rather than on a securities exchange. The Fund’s pricing services use multiple valuation techniques to determine fair value. In instances where sufficient market activity exists, the pricing services may utilize a market-based approach through which quotes from market makers are used to determine fair value. In instances where sufficient market activity may not exist or is limited, the pricing services also utilize proprietary valuation models which may consider market characteristics such as benchmark yield curves, credit spreads, estimated default rates, anticipated market interest rate volatility, coupon rates, anticipated timing of principal repayments, underlying collateral, and other unique security features in order to estimate the relevant cash flows, which are then discounted to calculate the fair value. Securities denominated in a foreign currency are converted into their U.S. dollar equivalent at the foreign exchange rate in effect at 4 p.m. Eastern time on the date that the values of the foreign debt securities are determined.
Investments in open-end mutual funds are valued at the closing NAV.
Certain derivative financial instruments are centrally cleared or trade in the OTC market. The Fund’s pricing services use various techniques including industry standard option pricing models and proprietary discounted cash flow models to determine the fair value of those instruments. The Fund’s net benefit or obligation under the derivative contract, as measured by the fair value of the contract, is included in net assets.
The Fund has procedures to determine the fair value of financial instruments for which market prices are not reliable or readily available. Under these procedures, the VC convenes on a regular basis to review such financial instruments and considers a number of factors, including significant unobservable valuation inputs, when arriving at fair value. The VC primarily employs a market-based approach which may use related or comparable assets or liabilities, recent transactions, market
| FSI-38 | Semiannual Report | |||
FRANKLIN TEMPLETON VARIABLE INSURANCE PRODUCTS TRUST
NOTES TO CONSOLIDATED FINANCIAL STATEMENTS (UNAUDITED)
Franklin Strategic Income VIP Fund (continued)
multiples, book values, and other relevant information for the investment to determine the fair value of the investment. An income-based valuation approach may also be used in which the anticipated future cash flows of the investment are discounted to calculate fair value. Discounts may also be applied due to the nature or duration of any restrictions on the disposition of the investments. Due to the inherent uncertainty of valuations of such investments, the fair values may differ significantly from the values that would have been used had an active market existed. The VC employs various methods for calibrating these valuation approaches including a regular review of key inputs and assumptions, transactional back-testing or disposition analysis, and reviews of any related market activity.
Trading in securities on foreign securities stock exchanges and OTC markets may be completed before 4 p.m. Eastern time. In addition, trading in certain foreign markets may not take place on every Fund’s business day. Occasionally, events occur between the time at which trading in a foreign security is completed and 4 p.m. Eastern time that might call into question the reliability of the value of a portfolio security held by the Fund. As a result, differences may arise between the value of the Fund’s portfolio securities as determined at the foreign market close and the latest indications of value at 4 p.m. Eastern time. In order to minimize the potential for these differences, the VC monitors price movements following the close of trading in foreign stock markets through a series of country specific market proxies (such as baskets of American Depositary Receipts, futures contracts and exchange traded funds). These price movements are measured against established trigger thresholds for each specific market proxy to assist in determining if an event has occurred that may call into question the reliability of the values of the foreign securities held by the Fund. If such an event occurs, the securities may be valued using fair value procedures, which may include the use of independent pricing services.
When the last day of the reporting period is a non-business day, certain foreign markets may be open on those days that the Fund’s NAV is not calculated, which could result in differences between the value of the Fund’s portfolio securities on the last business day and the last calendar day of the reporting period. Any significant security valuation changes due to an open foreign market are adjusted and reflected by the Fund for financial reporting purposes.
b. Foreign Currency Translation
Portfolio securities and other assets and liabilities denominated in foreign currencies are translated into U.S. dollars based on the exchange rate of such currencies against U.S. dollars on the date of valuation. The Fund may enter into foreign currency exchange contracts to facilitate transactions denominated in a foreign currency. Purchases and sales of securities, income and expense items denominated in foreign currencies are translated into U.S. dollars at the exchange rate in effect on the transaction date. Portfolio securities and assets and liabilities denominated in foreign currencies contain risks that those currencies will decline in value relative to the U.S. dollar. Occasionally, events may impact the availability or reliability of foreign exchange rates used to convert the U.S. dollar equivalent value. If such an event occurs, the foreign exchange rate will be valued at fair value using procedures established and approved by the Board.
The Fund does not separately report the effect of changes in foreign exchange rates from changes in market prices on securities held. Such changes are included in net realized and unrealized gain or loss from investments in the Consolidated Statement of Operations.
Realized foreign exchange gains or losses arise from sales of foreign currencies, currency gains or losses realized between the trade and settlement dates on securities transactions and the difference between the recorded amounts of dividends, interest, and foreign withholding taxes and the U.S. dollar equivalent of the amounts actually received or paid. Net unrealized foreign exchange gains and losses arise from changes in foreign exchange rates on foreign denominated assets and liabilities other than investments in securities held at the end of the reporting period.
c. Securities Purchased on a When-Issued or Delayed Delivery and TBA Basis
The Fund purchases securities on a when-issued or delayed delivery and to-be-announced (TBA) basis, with payment and delivery scheduled for a future date. These transactions are subject to market fluctuations and are subject to the risk that the value at delivery may be more or less than the trade date purchase price. Although the Fund will generally purchase these securities with the intention of holding the securities, it may sell the securities before the settlement date. Sufficient assets have been segregated for these securities.
| Semiannual Report | FSI-39 | |||||
FRANKLIN TEMPLETON VARIABLE INSURANCE PRODUCTS TRUST
NOTES TO CONSOLIDATED FINANCIAL STATEMENTS (UNAUDITED)
Franklin Strategic Income VIP Fund (continued)
1. Organization and Significant Accounting Policies (continued)
d. Derivative Financial Instruments
The Fund invested in derivative financial instruments in order to manage risk or gain exposure to various other investments or markets. Derivatives are financial contracts based on an underlying or notional amount, require no initial investment or an initial net investment that is smaller than would normally be required to have a similar response to changes in market factors, and require or permit net settlement. Derivatives contain various risks including the potential inability of the counterparty to fulfill their obligations under the terms of the contract, the potential for an illiquid secondary market, and/or the potential for market movements which expose the Fund to gains or losses in excess of the amounts shown in the Consolidated Statement of Assets and Liabilities. Realized gain and loss and unrealized appreciation and depreciation on these contracts for the period are included in the Consolidated Statement of Operations.
Derivative counterparty credit risk is managed through a formal evaluation of the creditworthiness of all potential counterparties. The Fund attempts to reduce its exposure to counterparty credit risk on OTC derivatives, whenever possible, by entering into International Swaps and Derivatives Association (ISDA) master agreements with certain counterparties. These agreements contain various provisions, including but not limited to collateral requirements, events of default, or early termination. Termination events applicable to the counterparty include certain deteriorations in the credit quality of the counterparty. Termination events applicable to the Fund include failure of the Fund to maintain certain net asset levels and/or limit the decline in net assets over various periods of time. In the event of default or early termination, the ISDA master agreement gives the non-defaulting party the right to net and close-out all transactions traded, whether or not arising under the ISDA agreement, to one net amount payable by one counterparty to the other. However, absent an event of default or early termination, OTC derivative assets and liabilities are presented gross and not offset in the Consolidated Statement of Assets and Liabilities. Early termination by the counterparty may result in an immediate payment by the Fund of any net liability owed to that counterparty under the ISDA agreement.
Collateral requirements differ by type of derivative. Collateral or initial margin requirements are set by the broker or exchange clearing house for exchange traded and centrally cleared derivatives. Initial margin deposited is held at the exchange and
can be in the form of cash and/or securities. For OTC derivatives traded under an ISDA master agreement, posting of collateral is required by either the Fund or the applicable counterparty if the total net exposure of all OTC derivatives with the applicable counterparty exceeds the minimum transfer amount, which typically ranges from $100,000 to $250,000, and can vary depending on the counterparty and the type of the agreement. Generally, collateral is determined at the close of Fund business each day and any additional collateral required due to changes in derivative values may be delivered by the Fund or the counterparty the next business day, or within a few business days. Collateral pledged and/or received by the Fund for OTC derivatives, if any, is held in segregated accounts with the Fund’s custodian/counterparty broker and can be in the form of cash and/or securities. Unrestricted cash may be invested according to the Fund’s investment objectives. To the extent that the amounts due to the Fund from its counterparties are not subject to collateralization or are not fully collateralized, the Fund bears the risk of loss from counterparty non-performance.
The Fund entered into exchange traded futures contracts primarily to manage and/or gain exposure to interest rate risk. A futures contract is an agreement between the Fund and a counterparty to buy or sell an asset at a specified price on a future date. Required initial margins are pledged by the Fund, and the daily change in fair value is accounted for as a variation margin payable or receivable.
The Fund entered into OTC forward exchange contracts primarily to manage and/or gain exposure to certain foreign currencies. A forward exchange contract is an agreement between the Fund and a counterparty to buy or sell a foreign currency at a specific exchange rate on a future date.
The Fund entered into credit default swap contracts primarily to manage exposure to credit risk. A credit default swap is an agreement between the Fund and a counterparty whereby the buyer of the contract receives credit protection and the seller of the contract guarantees the credit worthiness of a referenced debt obligation. These agreements may be privately negotiated in the over-the-counter market (OTC credit default swaps) or may be executed in a multilateral trade facility platform, such as a registered exchange (centrally cleared credit default swaps). The underlying referenced debt obligation may be a single issuer of corporate or sovereign debt, a credit index, a basket of issuers or indices, or a tranche of a credit index or basket of issuers or indices. In the event of a default of the underlying referenced debt obligation, the buyer is entitled to receive the
| FSI-40 | Semiannual Report | |||
FRANKLIN TEMPLETON VARIABLE INSURANCE PRODUCTS TRUST
NOTES TO CONSOLIDATED FINANCIAL STATEMENTS (UNAUDITED)
Franklin Strategic Income VIP Fund (continued)
notional amount of the credit default swap contract from the seller in exchange for the referenced debt obligation, a net settlement amount equal to the notional amount of the credit default swap less the recovery value of the referenced debt obligation, or other agreed upon amount. For centrally cleared credit default swaps, required initial margins are pledged by the Fund, and the daily change in fair value is accounted for as a variation margin payable or receivable in the Consolidated Statement of Assets and Liabilities. Over the term of the contract, the buyer pays the seller a periodic stream of payments, provided that no event of default has occurred. Such periodic payments are accrued daily as an unrealized appreciation or depreciation until the payments are made, at which time they are realized. Upfront payments and receipts are reflected in the Consolidated Statement of Assets and Liabilities and represent compensating factors between stated terms of the credit default swap agreement and prevailing market conditions (credit spreads and other relevant factors). These upfront payments and receipts are amortized over the term of the contract as a realized gain or loss in the Consolidated Statement of Operations.
The Fund entered into OTC cross currency swap contracts primarily to manage and/or gain exposure to interest rate risk and certain foreign currencies. A cross currency swap is an agreement between the Fund and a counterparty to exchange cash flows (determined using either a fixed or floating rate) based on the notional amounts of two different currencies. The notional amounts are typically determined based on the spot exchange rates at the opening of the contract. Cross currency swaps may require the exchange of notional amounts at the opening and/or closing of the contract. Over the term of the contract, contractually required payments to be paid and to be received are accrued daily and recorded as unrealized depreciation and appreciation until the payments are made, at which time they are realized. Upfront payments and receipts are reflected in the Consolidated Statement of Assets and Liabilities and represent compensating factors between stated terms of the cross currency swap contract and prevailing market conditions (interest rate spreads and other relevant factors). These upfront payments and receipts are amortized over the term of the contract as a realized gain or loss in the Consolidated Statement of Operations.
The Fund entered into OTC total return swap contracts primarily to manage and/or gain exposure to interest rate risk of an underlying instrument such as a stock, bond, index or basket
of securities or indices. A total return swap is an agreement between the Fund and a counterparty to exchange a return linked to an underlying instrument for a floating or fixed rate payment, both based upon a notional amount. Over the term of the contract, contractually required payments to be paid or received are accrued daily and recorded as unrealized appreciation or depreciation until the payments are made, at which time they are recognized as realized gain or loss.
The Fund invests in value recovery instruments (VRI) primarily to gain exposure to economic growth. Periodic payments from VRI are dependent on established benchmarks for underlying variables. VRI has a notional amount, which is used to calculate amounts of payments to holders. Payments are recorded upon receipt as realized gains in the Consolidated Statement of Operations. The risks of investing in VRI include growth risk, liquidity, and the potential loss of investment.
See Note 9 regarding other derivative information.
e. Restricted Cash
At June 30, 2018, the Fund held restricted cash in connection with investments in certain derivative securities. Restricted cash is held in a segregated account with the Fund’s custodian and is reflected in the Consolidated Statement of Assets and Liabilities.
f. Loan Participation Notes
The Fund invests in loan participation notes (Participations). Participations are loans originally issued to a borrower by one or more financial institutions (the Lender) and subsequently sold to other investors, such as the Fund. Participations typically result in the Fund having a contractual relationship only with the Lender and not with the borrower. The Fund has the right to receive from the Lender any payments of principal, interest and fees which the Lender received from the borrower. The Fund generally has no rights to either enforce compliance by the borrower with the terms of the loan agreement or to any collateral relating to the original loan. As a result, the Fund assumes the credit risk of both the borrower and the Lender that is selling the Participation. The Participations may also involve interest rate risk and liquidity risk, including the potential default or insolvency of the borrower and/or the Lender.
| Semiannual Report | FSI-41 | |||||
FRANKLIN TEMPLETON VARIABLE INSURANCE PRODUCTS TRUST
NOTES TO CONSOLIDATED FINANCIAL STATEMENTS (UNAUDITED)
Franklin Strategic Income VIP Fund (continued)
1. Organization and Significant Accounting Policies (continued)
g. Investments in FT Holdings Corporation III (FT Subsidiary)
The Fund invests in certain financial instruments through its investment in FT Subsidiary. FT Subsidiary is a Delaware Corporation, is a wholly-owned subsidiary of the Fund, and is able to invest in certain financial instruments consistent with the investment objective of the Fund. At June 30, 2018, FT Subsidiary’s investment, Turtle Bay Resort, as well as any other assets and liabilities of FT Subsidiary are reflected in the Fund’s Consolidated Statement of Investments and Consolidated Statement of Assets and Liabilities.
A deferred tax benefit was recorded on the unrealized depreciation of the security. When the Fund disposes of the security, the deferred asset is relieved and the Fund should incur a realized tax benefit. The estimated deferred tax benefit was calculated using a federal rate of 21% and a Hawaii state rate (net of federal tax benefit) of 3%. This is reflected as FT Subsidiary deferred tax benefit in the Consolidated Statement of Assets and Liabilities.
The financial statements have been consolidated and include the accounts of the Fund and FT Subsidiary. All intercompany transactions and balances have been eliminated. At June 30, 2018, the net assets of FT Subsidiary were $6,639,124, representing 1.1% of the Fund’s consolidated net assets. The Fund’s investment in FT Subsidiary is limited to 25% of consolidated assets.
h. Mortgage Dollar Rolls
The Fund enters into mortgage dollar rolls, typically on a TBA basis. Mortgage dollar rolls are agreements between the Fund and a financial institution where the Fund sells (or buys) mortgage-backed securities for delivery on a specified date and simultaneously contracts to repurchase (or sell) substantially similar (same type, coupon, and maturity) securities at a future date and at a predetermined price. Gains or losses are realized on the initial sale, and the difference between the repurchase price and the sale price is recorded as an unrealized gain or loss to the Fund upon entering into the mortgage dollar roll. In addition, the Fund may invest the cash proceeds that are received from the initial sale. During the period between the sale and repurchase, the Fund is not entitled to principal and interest paid on the mortgage backed securities. Transactions in mortgage dollar rolls are accounted for as purchases and sales
and may result in an increase to the Fund’s portfolio turnover rate. The risks of mortgage dollar roll transactions include the potential inability of the counterparty to fulfill its obligations.
i. Senior Floating Rate Interests
The Fund invests in senior secured corporate loans that pay interest at rates which are periodically reset by reference to a base lending rate plus a spread. These base lending rates are generally the prime rate offered by a designated U.S. bank or the London InterBank Offered Rate (LIBOR). Senior secured corporate loans often require prepayment of principal from excess cash flows or at the discretion of the borrower. As a result, actual maturity may be substantially less than the stated maturity. Senior secured corporate loans in which the Fund invests are generally readily marketable, but may be subject to certain restrictions on resale.
j. Income and Deferred Taxes
It is the Fund’s policy to qualify as a regulated investment company under the Internal Revenue Code. The Fund intends to distribute to shareholders substantially all of its taxable income and net realized gains to relieve it from federal income and if applicable, excise taxes. As a result, no provision for U.S. federal income taxes is required.
The Fund may be subject to foreign taxation related to income received, capital gains on the sale of securities and certain foreign currency transactions in the foreign jurisdictions in which it invests. Foreign taxes, if any, are recorded based on the tax regulations and rates that exist in the foreign markets in which the Fund invests. When a capital gain tax is determined to apply, the Fund records an estimated deferred tax liability in an amount that would be payable if the securities were disposed of on the valuation date.
The Fund may recognize an income tax liability related to its uncertain tax positions under U.S. GAAP when the uncertain tax position has a less than 50% probability that it will be sustained upon examination by the tax authorities based on its technical merits. As of June 30, 2018, the Fund has determined that no tax liability is required in its financial statements related to uncertain tax positions for any open tax years (or expected to be taken in future tax years). Open tax years are those that remain subject to examination and are based on the statute of limitations in each jurisdiction in which the Fund invests.
| FSI-42 | Semiannual Report | |||
FRANKLIN TEMPLETON VARIABLE INSURANCE PRODUCTS TRUST
NOTES TO CONSOLIDATED FINANCIAL STATEMENTS (UNAUDITED)
Franklin Strategic Income VIP Fund (continued)
k. Security Transactions, Investment Income, Expenses and Distributions
Security transactions are accounted for on trade date. Realized gains and losses on security transactions are determined on a specific identification basis. Interest income and estimated expenses are accrued daily. Amortization of premium and accretion of discount on debt securities are included in interest income. Paydown gains and losses are recorded as an adjustment to interest income. Facility fees are recognized as income over the expected term of the loan. Dividend income is recorded on the ex-dividend date except for certain dividends from securities where the dividend rate is not available. In such cases, the dividend is recorded as soon as the information is received by the Fund. Distributions to shareholders are recorded on the ex-dividend date. Distributable earnings are determined according to income tax regulations (tax basis) and may differ from earnings recorded in accordance with U.S. GAAP. These differences may be permanent or temporary. Permanent differences are reclassified among capital accounts to reflect their tax character. These reclassifications have no impact on net assets or the results of operations. Temporary differences are not reclassified, as they may reverse in subsequent periods.
Common expenses incurred by the Trust are allocated among the Funds based on the ratio of net assets of each Fund to the combined net assets of the Trust or based on the ratio of number of shareholders of each Fund to the combined number of shareholders of the Trust. Fund specific expenses are charged directly to the Fund that incurred the expense.
Realized and unrealized gains and losses and net investment income, excluding class specific expenses, are allocated daily to each class of shares based upon the relative proportion of net assets of each class. Differences in per share distributions by class are generally due to differences in class specific expenses.
Inflation-indexed bonds are adjusted for inflation through periodic increases or decreases in the security’s interest accruals, face amount, or principal redemption value, by amounts corresponding to the rate of inflation as measured by an index. Any increase or decrease in the face amount or principal redemption value will be included as interest income in the Consolidated Statement of Operations.
l. Accounting Estimates
The preparation of financial statements in accordance with U.S. GAAP requires management to make estimates and assumptions that affect the reported amounts of assets and liabilities at the date of the financial statements and the amounts of income and expenses during the reporting period. Actual results could differ from those estimates.
m. Guarantees and Indemnifications
Under the Trust’s organizational documents, its officers and trustees are indemnified by the Trust against certain liabilities arising out of the performance of their duties to the Trust. Additionally, in the normal course of business, the Trust, on behalf of the Fund, enters into contracts with service providers that contain general indemnification clauses. The Trust’s maximum exposure under these arrangements is unknown as this would involve future claims that may be made against the Trust that have not yet occurred. Currently, the Trust expects the risk of loss to be remote.
| Semiannual Report | FSI-43 | |||||
FRANKLIN TEMPLETON VARIABLE INSURANCE PRODUCTS TRUST
NOTES TO CONSOLIDATED FINANCIAL STATEMENTS (UNAUDITED)
Franklin Strategic Income VIP Fund (continued)
2. Shares of Beneficial Interest
At June 30, 2018, there were an unlimited number of shares authorized (without par value). Transactions in the Fund’s shares were as follows:
Six Months Ended June 30, 2018 | Year Ended December 31, 2017 | |||||||||||||||||||
| Shares | Amount | Shares | Amount | |||||||||||||||||
| Class 1 Shares: | ||||||||||||||||||||
Shares sold | 334,481 | $ | 3,713,207 | 707,945 | $ | 8,170,021 | ||||||||||||||
Shares issued in reinvestment of distributions | 904,373 | 9,703,924 | 1,057,912 | 11,689,930 | ||||||||||||||||
Shares redeemed | (2,510,355 | ) | (27,690,986 | ) | (5,334,630 | ) | (59,544,457 | ) | ||||||||||||
Net increase (decrease) | (1,271,501 | ) | $ | (14,273,855 | ) | (3,568,773 | ) | $ | (39,684,506 | ) | ||||||||||
| Class 2 Shares: | ||||||||||||||||||||
Shares sold | 1,129,752 | $ | 12,049,181 | 3,399,404 | $ | 36,838,010 | ||||||||||||||
Shares issued in reinvestment of distributions | 552,570 | 5,724,625 | 583,205 | 6,228,631 | ||||||||||||||||
Shares redeemed | (1,464,919 | ) | (15,608,993 | ) | (3,193,383 | ) | (34,437,952 | ) | ||||||||||||
Net increase (decrease) | 217,403 | $ | 2,164,813 | 789,226 | $ | 8,628,689 | ||||||||||||||
| Class 4 Shares: | ||||||||||||||||||||
Shares sold | 190,580 | $ | 2,115,498 | 426,432 | $ | 4,757,499 | ||||||||||||||
Shares issued in reinvestment of distributions | 158,766 | 1,690,861 | 189,278 | 2,076,378 | ||||||||||||||||
Shares redeemed | (786,993 | ) | (8,619,800 | ) | (1,268,068 | ) | (14,025,922 | ) | ||||||||||||
Net increase (decrease) | (437,647 | ) | $ | (4,813,441 | ) | (652,358 | ) | $ | (7,192,045 | ) | ||||||||||
3. Transactions with Affiliates
Franklin Resources, Inc. is the holding company for various subsidiaries that together are referred to as Franklin Templeton Investments. Certain officers and trustees of the Fund are also officers and/or directors of the following subsidiaries:
| Subsidiary | Affiliation | |
| Franklin Advisers, Inc. (Advisers) | Investment manager | |
| Franklin Templeton Services, LLC (FT Services) | Administrative manager | |
| Franklin Templeton Distributors, Inc. (Distributors) | Principal underwriter | |
| Franklin Templeton Investor Services, LLC (Investor Services) | Transfer agent |
| FSI-44 | Semiannual Report | |||
FRANKLIN TEMPLETON VARIABLE INSURANCE PRODUCTS TRUST
NOTES TO CONSOLIDATED FINANCIAL STATEMENTS (UNAUDITED)
Franklin Strategic Income VIP Fund (continued)
a. Management Fees
The Fund pays an investment management fee to Advisers based on the average daily net assets of the Fund as follows:
| Annualized Fee Rate | Net Assets | |
| 0.625% | Up to and including $500 million | |
| 0.525% | Over $500 million, up to and including $1 billion | |
| 0.480% | Over $1 billion, up to and including $1.5 billion | |
| 0.435% | Over $1.5 billion, up to and including $6.5 billion | |
| 0.415% | Over $6.5 billion, up to and including $11.5 billion | |
| 0.400% | Over $11.5 billion, up to and including $16.5 billion | |
| 0.390% | Over $16.5 billion, up to and including $19 billion | |
| 0.380% | Over $19 billion, up to and including $21.5 billion | |
| 0.370% | In excess of $21.5 billion |
For the period ended June 30, 2018, the annualized gross effective investment management fee rate was 0.605% of the Fund’s average daily net assets.
b. Administrative Fees
Under an agreement with Advisers, FT Services provides administrative services to the Fund. The fee is paid by Advisers based on the Fund’s average daily net assets, and is not an additional expense of the Fund.
c. Distribution Fees
The Board has adopted distribution plans for Class 2 and Class 4 shares pursuant to Rule 12b-1 under the 1940 Act. Under the Fund’s compensation distribution plans, the Fund pays Distributors for costs incurred in connection with the servicing, sale and distribution of the Fund’s shares up to 0.25% and 0.35% per year of its average daily net assets of Class 2 and Class 4, respectively. The plan year, for purposes of monitoring compliance with the maximum annual plan rates, is February 1 through January 31.
d. Transfer Agent Fees
Investor Services, under terms of an agreement, performs shareholder servicing for the Fund and is not paid by the Fund for the services.
e. Investments in Affiliated Management Investment Companies
The Fund invests in one or more affiliated management investment companies for purposes other than exercising a controlling influence over the management or policies. Management fees paid by the Fund are waived on assets invested in the affiliated management investment companies, as noted in the Consolidated Statement of Operations, in an amount not to exceed the management and administrative fees paid directly or indirectly by each affiliate. Prior to January 1, 2014, the waiver was accounted for as a reduction to management fees. During the period ended June 30, 2018, the Fund held investments in affiliated management investment companies as follows:
| Number of Shares Held at Beginning of Period | Gross Additions | Gross Reductions | Number of Shares Held at End of Period | Value at End of Period | Dividend Income | Realized Gain (Loss) | Net Change in Unrealized | |||||||||||||||||||||||||
| ||||||||||||||||||||||||||||||||
| Non-Controlled Affiliates | ||||||||||||||||||||||||||||||||
Franklin Lower Tier Floating Rate Fund | 2,081,861 | — | — | 2,081,861 | $ | 20,423,054 | $ | 984,337 | $ | — | $ | (395,554 | ) | |||||||||||||||||||
Franklin Middle Tier Floating Rate Fund | 2,024,951 | — | — | 2,024,951 | 19,135,791 | 714,688 | — | (364,491 | ) | |||||||||||||||||||||||
| Semiannual Report | FSI-45 | |||||
FRANKLIN TEMPLETON VARIABLE INSURANCE PRODUCTS TRUST
NOTES TO CONSOLIDATED FINANCIAL STATEMENTS (UNAUDITED)
Franklin Strategic Income VIP Fund (continued)
3. Transactions with Affiliates (continued)
e. Investments in Affiliated Management Investment Companies (continued)
Number of at Beginning | Gross Additions | Gross Reductions | Number of Shares Held at End of Period | Value at End of Period | Dividend Income | Realized Gain (Loss) | Net Change in Unrealized | |||||||||||||||||||||||||
| ||||||||||||||||||||||||||||||||
| Non-Controlled Affiliates | ||||||||||||||||||||||||||||||||
Institutional Fiduciary Trust Money Market Portfolio, 1.51% | 10,018,679 | 71,900,296 | (73,141,239 | ) | 8,777,736 | $ | 8,777,736 | $ | 81,414 | $ | — | $ | — | |||||||||||||||||||
|
| |||||||||||||||||||||||||||||||
Total Affiliated Securities | $ | 48,336,581 | $ | 1,780,439 | $ | — | $ | (760,045 | ) | |||||||||||||||||||||||
|
| |||||||||||||||||||||||||||||||
4. Expense Offset Arrangement
The Fund has entered into an arrangement with its custodian whereby credits realized as a result of uninvested cash balances are used to reduce a portion of the Fund’s custodian expenses. During the period ended June 30, 2018, the custodian fees were reduced as noted in the Consolidated Statement of Operations.
5. Income Taxes
For tax purposes, capital losses may be carried over to offset future capital gains, if any. At December 31, 2017, the capital loss carryforwards, not subject to expiration, were as follows:
Capital loss carryforwards: | ||||
Short term | $ | 1,255,880 | ||
Long term | 31,844,879 | |||
|
|
| ||
Total capital loss carryforwards | $ | 33,100,759 | ||
|
|
| ||
At June 30, 2018, the cost of investments and net unrealized appreciation (depreciation) for income tax purposes were as follows:
Cost of investments | $ | 659,033,853 | ||
|
|
| ||
Unrealized appreciation | $ | 7,599,565 | ||
Unrealized depreciation | (30,908,064 | ) | ||
|
|
| ||
Net unrealized appreciation (depreciation) | $ | (23,308,499 | ) | |
|
|
| ||
Differences between income and/or capital gains as determined on a book basis and a tax basis are primarily due to differing treatments of foreign currency transactions and bond discounts and premiums.
6. Investment Transactions
Purchases and sales of investments (excluding short term securities) for the period ended June 30, 2018, aggregated $409,973,912 and $432,022,151, respectively.
7. Credit Risk and Defaulted Securities
At June 30, 2018, the Fund had 44.9% of its portfolio invested in high yield, senior secured floating rate notes, or other securities rated below investment grade and unrated securities, if any. These securities may be more sensitive to economic conditions causing greater price volatility and are potentially subject to a greater risk of loss due to default than higher rated securities.
| FSI-46 | Semiannual Report | |||
FRANKLIN TEMPLETON VARIABLE INSURANCE PRODUCTS TRUST
NOTES TO CONSOLIDATED FINANCIAL STATEMENTS (UNAUDITED)
Franklin Strategic Income VIP Fund (continued)
The Fund held defaulted securities and/or other securities for which the income has been deemed uncollectible. At June 30, 2018, the aggregate value of these securities was $2,398,500, representing 0.4% of the Fund’s net assets. The Fund discontinues accruing income on securities for which income has been deemed uncollectible and provides an estimate for losses on interest receivable. The securities have been identified in the accompanying Consolidated Statement of Investments.
8. Restricted Securities
The Fund invests in securities that are restricted under the Securities Act of 1933 (1933 Act). Restricted securities are often purchased in private placement transactions, and cannot be sold without prior registration unless the sale is pursuant to an exemption under the 1933 Act. Disposal of these securities may require greater effort and expense, and prompt sale at an acceptable price may be difficult. The Fund may have registration rights for restricted securities. The issuer generally incurs all registration costs.
At June 30, 2018, investments in restricted securities, excluding securities exempt from registration under the 1933 Act deemed to be liquid, were as follows:
| Principal Amount/ Shares | Issuer | Acquisition Date | Cost | Value | ||||||||||
14,792,309 | K2016470219 South Africa Ltd., A | 2/08/13 - 2/01/17 | $ | 114,768 | $ | 10,788 | ||||||||
1,472,041 | K2016470219 South Africa Ltd., B | 2/01/17 | 1,093 | 1,074 | ||||||||||
1,137,987 | K2016470219 South Africa Ltd., senior secured note, 144A, PIK, 3.00%, | |||||||||||||
| 12/31/22 | 2/08/13 - 6/30/18 | 1,878,937 | 7,007 | |||||||||||
220,087 | K2016470260 South Africa Ltd., senior secured note, 144A, PIK, 25.00%, | |||||||||||||
| 12/31/22 | 2/01/17 - 6/30/18 | 192,807 | 19,563 | |||||||||||
| Total Restricted Securities (Value is 0.0%† of Net Assets) | $ | 2,187,605 | $ | 38,432 | ||||||||||
†Rounds to less than 0.1% of net assets.
9. Other Derivative Information
At June 30, 2018, the Fund’s investments in derivative contracts are reflected in the Consolidated Statement of Assets and Liabilities as follows:
| Asset Derivatives | Liability Derivatives | |||||||||||||||
|
| |||||||||||||||
Derivative Contracts Not Accounted for as Hedging Instruments | Consolidated Statement of Location | Fair Value | Consolidated Statement of Assets and Liabilities Location | Fair Value | ||||||||||||
| ||||||||||||||||
Interest rate contracts | Variation margin on futures | $ | 140,753 | a | Variation margin on futures | $ | 186,839 | a | ||||||||
contracts | contracts | |||||||||||||||
Unrealized appreciation on OTC | — | Unrealized depreciation on OTC | 18,610 | |||||||||||||
swap contracts | swap contracts | |||||||||||||||
Foreign exchange contracts | Unrealized appreciation on OTC | 1,821,781 | Unrealized depreciation on OTC | 1,598,557 | ||||||||||||
forward exchange contracts | forward exchange contracts | |||||||||||||||
Credit contracts | Variation margin on centrally | 4,666 | a | Variation margin on centrally | 75,121 | a | ||||||||||
cleared swap contracts | cleared swap contracts | |||||||||||||||
OTC swap contracts (premium | 549,456 | OTC swap contracts (premium | 1,163,807 | |||||||||||||
paid) | received) | |||||||||||||||
Unrealized appreciation on OTC | 39,775 | Unrealized depreciation on OTC | 815,922 | |||||||||||||
swap contracts | swap contracts | |||||||||||||||
| Semiannual Report | FSI-47 | |||||
FRANKLIN TEMPLETON VARIABLE INSURANCE PRODUCTS TRUST
NOTES TO CONSOLIDATED FINANCIAL STATEMENTS (UNAUDITED)
Franklin Strategic Income VIP Fund (continued)
9. Other Derivative Information (continued)
| Asset Derivatives | Liability Derivatives | |||||||||||||||
|
| |||||||||||||||
Derivative Contracts Not Accounted for as Hedging Instruments | Consolidated Statement of Location | Fair Value | Consolidated Statement of Assets and Liabilities Location | Fair Value | ||||||||||||
| ||||||||||||||||
Value recovery instruments | Investments in securities, at value | $ | 1,234,845 | b | ||||||||||||
|
|
|
| |||||||||||||
Totals | $ | 3,791,276 | $ | 3,858,856 | ||||||||||||
|
|
|
| |||||||||||||
aThis amount reflects the cumulative appreciation (depreciation) of futures contracts and centrally cleared swap contracts as reported in the Consolidated Statement of Investments. Only the variation margin receivable/payable at period end is separately reported within the Consolidated Statement of Assets and Liabilities. Prior variation margin movements were recorded to cash upon receipt or payment.
bVRI are included in investments in securities, at value in the Consolidated Statement of Assets and Liabilities.
For the period ended June 30, 2018, the effect of derivative contracts in the Fund’s Consolidated Statement of Operations was as follows:
| Derivative Contracts Not Accounted for as Hedging Instruments | Consolidated Statement of Operations Location | Net Realized Gain (Loss) for the Period | Consolidated Statement of Operations Location | Net Change in Unrealized Appreciation (Depreciation) for the Period | ||||||||||||
Net realized gain (loss) from: | Net change in unrealized | |||||||||||||||
| appreciation (depreciation) on: | ||||||||||||||||
Interest rate contracts | Futures contracts | $ | (153,794) | Futures contracts | $ | (73,783) | ||||||||||
Swap contracts | (1,614) | Swap contracts | (18,610) | |||||||||||||
Foreign exchange contracts | Forward exchange contracts | (1,008,966) | Forward exchange contracts | 341,237 | ||||||||||||
Credit contracts | Swap contracts | 385,212 | Swap contracts | (903,998) | ||||||||||||
Value recovery instruments | Investments | — | Investments | 147,093 | a | |||||||||||
|
|
|
| |||||||||||||
Totals | $ | (779,162) | $ | (508,061) | ||||||||||||
|
|
|
| |||||||||||||
aVRI are included in net change in unrealized appreciation (depreciation) on investments in the Consolidated Statement of Operations.
For the period ended June 30, 2018, the average month end notional amount of futures contracts and swap contracts and the average month end contract value for forward exchange contracts, and average month end fair value of VRI, were as follows:
Futures Contracts | $ | 14,887,332 | ||
Swap contracts | 38,109,829 | |||
Forward exchange contracts | 92,815,933 | |||
VRI | 1,292,310 |
Gross Amounts of Assets and Liabilities Presented in the Consolidated Statement of Assets and Liabilities | ||||||||
| Assetsa | Liabilitiesa | |||||||
| Derivatives | ||||||||
Forward exchange contracts | $1,821,781 | $1,598,557 | ||||||
Swap contracts | 589,231 | 1,998,339 | ||||||
Total | $2,411,012 | $3,596,896 | ||||||
aAbsent an event of default or early termination, OTC derivative assets and liabilities are presented gross and not offset in the Consolidated Statement of Assets and Liabilities.
| FSI-48 | Semiannual Report | |||
FRANKLIN TEMPLETON VARIABLE INSURANCE PRODUCTS TRUST
NOTES TO CONSOLIDATED FINANCIAL STATEMENTS (UNAUDITED)
Franklin Strategic Income VIP Fund (continued)
At June 30, 2018, the Fund’s OTC derivative assets, which may be offset against the Fund’s OTC derivative liabilities and collateral received from the counterparty, are as follows:
Amounts Not Offset in the Consolidated Statement of Assets and Liabilities | ||||||||||||||||||||
Gross Amounts of | Financial Instruments Available for Offset | Financial Instruments Collateral Received | Cash Collateral Receiveda | Net Amount (Not less than zero) | ||||||||||||||||
| Counterparty | ||||||||||||||||||||
BZWS | $ 201,452 | $ (16,758 | ) | $ — | $ — | $184,694 | ||||||||||||||
CITI | 237,561 | (237,561 | ) | — | — | — | ||||||||||||||
DBAB | 201,005 | (201,005 | ) | — | — | — | ||||||||||||||
GSCO | — | — | — | — | — | |||||||||||||||
HSBK | 18,030 | (18,030 | ) | — | — | — | ||||||||||||||
JPHQ | 1,256,347 | (1,256,347 | ) | — | — | — | ||||||||||||||
MSCO | 496,617 | (411,648 | ) | — | (84,969 | ) | — | |||||||||||||
Total | $2,411,012 | $(2,141,349 | ) | $ — | $(84,969 | ) | $184,694 | |||||||||||||
At June 30, 2018, the Fund’s OTC derivative liabilities, which may be offset against the Fund’s OTC derivative assets and collateral pledged to the counterparty, are as follows:
Amounts Not Offset in the Consolidated Statement of Assets and Liabilities | ||||||||||||||||||||
Gross Amounts of the Consolidated Statement of | Financial Instruments Available for Offset | Financial Instruments Collateral Pledged | Cash Collateral Pledgeda | Net Amount (Not less than zero) | ||||||||||||||||
| Counterparty | ||||||||||||||||||||
BZWS | $ 16,758 | $ (16,758 | ) | $ — | $ — | $ — | ||||||||||||||
CITI | 1,290,072 | (237,561 | ) | — | (1,050,000 | ) | 2,511 | |||||||||||||
DBAB | 458,644 | (201,005 | ) | — | (257,639 | ) | — | |||||||||||||
GSCO | 16,350 | — | — | — | 16,350 | |||||||||||||||
HSBK | 102,773 | (18,030 | ) | — | — | 84,743 | ||||||||||||||
JPHQ | 1,300,651 | (1,256,347 | ) | — | — | 44,304 | ||||||||||||||
MSCO | 411,648 | (411,648 | ) | — | — | — | ||||||||||||||
Total | $3,596,896 | $(2,141,349 | ) | $ — | $(1,307,639 | ) | $147,908 | |||||||||||||
aIn some instances, the collateral amounts disclosed in the table above were adjusted due to the requirement to limit collateral amounts to avoid the effect of overcollateralization. Actual collateral received and/or pledged may be more than the amounts disclosed herein.
See Note 1(d) regarding derivative financial instruments.
See Abbreviations on page FSI-52.
10. Credit Facility
The Fund, together with other U.S. registered and foreign investment funds (collectively, Borrowers), managed by Franklin Templeton Investments, are borrowers in a joint syndicated senior unsecured credit facility totaling $2 billion (Global Credit Facility) which matures on February 8, 2019. This Global Credit Facility provides a source of funds to the Borrowers for temporary and emergency purposes, including the ability to meet future unanticipated or unusually large redemption requests.
| Semiannual Report | FSI-49 | |||||
FRANKLIN TEMPLETON VARIABLE INSURANCE PRODUCTS TRUST
NOTES TO CONSOLIDATED FINANCIAL STATEMENTS (UNAUDITED)
Franklin Strategic Income VIP Fund (continued)
10. Credit Facility (continued)
Under the terms of the Global Credit Facility, the Fund shall, in addition to interest charged on any borrowings made by the Fund and other costs incurred by the Fund, pay its share of fees and expenses incurred in connection with the implementation and maintenance of the Global Credit Facility, based upon its relative share of the aggregate net assets of all of the Borrowers, including an annual commitment fee of 0.15% based upon the unused portion of the Global Credit Facility. These fees are reflected in other expenses in the Consolidated Statement of Operations. During the period ended June 30, 2018, the Fund did not use the Global Credit Facility.
11. Fair Value Measurements
The Fund follows a fair value hierarchy that distinguishes between market data obtained from independent sources (observable inputs) and the Fund’s own market assumptions (unobservable inputs). These inputs are used in determining the value of the Fund’s financial instruments and are summarized in the following fair value hierarchy:
| • | Level 1 – quoted prices in active markets for identical financial instruments |
| • | Level 2 – other significant observable inputs (including quoted prices for similar financial instruments, interest rates, prepayment speed, credit risk, etc.) |
| • | Level 3 – significant unobservable inputs (including the Fund’s own assumptions in determining the fair value of financial instruments) |
The input levels are not necessarily an indication of the risk or liquidity associated with financial instruments at that level.
For movements between the levels within the fair value hierarchy, the Fund has adopted a policy of recognizing the transfers as of the date of the underlying event which caused the movement.
| FSI-50 | Semiannual Report | |||
FRANKLIN TEMPLETON VARIABLE INSURANCE PRODUCTS TRUST
NOTES TO CONSOLIDATED FINANCIAL STATEMENTS (UNAUDITED)
Franklin Strategic Income VIP Fund (continued)
A summary of inputs used as of June 30, 2018, in valuing the Fund’s assets and liabilities carried at fair value, is as follows:
| Level 1 | Level 2 | Level 3 | Total | |||||||||||||
| ||||||||||||||||
| Assets: | ||||||||||||||||
Investments in Securities:a | ||||||||||||||||
Equity Investments:b | ||||||||||||||||
Consumer Services | $ | — | $ | — | $ | 343,871 | $ | 343,871 | ||||||||
Energy | 772,667 | 1,197,744 | 132 | 1,970,543 | ||||||||||||
Retailing | — | — | 11,862 | 11,862 | ||||||||||||
Transportation | — | — | 161,881 | 161,881 | ||||||||||||
All Other Equity Investments | 39,712,982 | — | — | 39,712,982 | ||||||||||||
Corporate Bonds: | ||||||||||||||||
Retailing | — | 5,645,935 | 7,007 | 5,652,942 | ||||||||||||
All Other Corporate Bonds | — | 284,050,761 | — | 284,050,761 | ||||||||||||
Senior Floating Rate Interests | — | 70,816,825 | — | 70,816,825 | ||||||||||||
Foreign Government and Agency Securities | — | 29,669,787 | — | 29,669,787 | ||||||||||||
U.S. Government and Agency Securities | — | 37,703,784 | — | 37,703,784 | ||||||||||||
Asset-Backed Securities and Commercial Mortgage-Backed Securities | — | 94,955,114 | — | 94,955,114 | ||||||||||||
Mortgage-Backed Securities | — | 55,781,459 | — | 55,781,459 | ||||||||||||
Municipal Bonds | — | 6,637,104 | — | 6,637,104 | ||||||||||||
Escrows and Litigation Trusts | — | 28,125 | — | c | 28,125 | |||||||||||
Short Term Investments | 9,274,400 | — | — | 9,274,400 | ||||||||||||
|
| |||||||||||||||
Total Investments in Securities | $ | 49,760,049 | $ | 586,486,638 | $ | 524,753 | $ | 636,771,440 | ||||||||
|
| |||||||||||||||
Other Financial Instruments: | ||||||||||||||||
Futures Contracts | $ | 140,753 | $ | — | $ | — | $ | 140,753 | ||||||||
Forward Exchange Contracts | — | 1,821,781 | — | 1,821,781 | ||||||||||||
Swap Contracts | — | 44,441 | — | 44,441 | ||||||||||||
|
| |||||||||||||||
Total Other Financial Instruments | $ | 140,753 | $ | 1,866,222 | $ | — | $ | 2,006,975 | ||||||||
|
| |||||||||||||||
| Liabilities: | ||||||||||||||||
Other Financial Instruments: | ||||||||||||||||
Futures Contracts | $ | 186,839 | $ | — | $ | — | $ | 186,839 | ||||||||
Forward Exchange Contracts | — | 1,598,557 | — | 1,598,557 | ||||||||||||
Swap Contracts | — | 909,653 | — | 909,653 | ||||||||||||
|
| |||||||||||||||
Total Other Financial Instruments | $ | 186,839 | $ | 2,508,210 | $ | — | $ | 2,695,049 | ||||||||
|
| |||||||||||||||
aFor detailed categories, see the accompanying Consolidated Statement of Investments.
bIncludes common stocks and management investment companies as well as other equity interests.
cIncludes securities determined to have no value at June 30, 2018.
A reconciliation of assets in which Level 3 inputs are used in determining fair value is presented when there are significant Level 3 financial instruments at the beginning and/or end of the period.
12. New Accounting Pronouncements
In March 2017, the Financial Accounting Standards Board (FASB) issued Accounting Standards Update (ASU) No. 2017-08, Receivables—Nonrefundable Fees and Other Costs (Subtopic 310-20): Premium Amortization on Purchased Callable Debt Securities. The amendments in the ASU shorten the amortization period for certain callable debt securities acquired at a premium, to be amortized to the earliest call date. The ASU does not require an accounting change for securities acquired at a discount, which continues to be amortized to maturity. The ASU is effective for fiscal years and interim periods within those fiscal years beginning after December 15, 2018. Management has reviewed the requirements and believes the adoption of this ASU will not have a material impact on the financial statements.
| Semiannual Report | FSI-51 | |||||
FRANKLIN TEMPLETON VARIABLE INSURANCE PRODUCTS TRUST
NOTES TO CONSOLIDATED FINANCIAL STATEMENTS (UNAUDITED)
Franklin Strategic Income VIP Fund (continued)
13. Subsequent Events
The Fund has evaluated subsequent events through the issuance of the consolidated financial statements and determined that no events have occurred that require disclosure.
Abbreviations
| Counterparty | Currency | Selected Portfolio | ||||||||
BZWS | Barclays Bank PLC | BRL | Brazilian Real | ARM | Adjustable Rate Mortgage | |||||
CITI | Citigroup, Inc. | EUR | Euro | CLO | Collateralized Loan Obligation | |||||
DBAB | Deutsche Bank AG | GBP | British Pound | CMT | 1 year Constant Maturity Treasury Index | |||||
GSCO | The Goldman Sachs Group, Inc. | IDR | Indonesian Rupiah | FRN | Floating Rate Note | |||||
HSBK | HSBC Bank PLC | MXN | Mexican Peso | GDP | Gross Domestic Product | |||||
JPHQ | JP Morgan Chase & Co. | USD | United States Dollar | GO | General Obligation | |||||
MSCO | Morgan Stanley | HDC | Housing Development Corp. | |||||||
LIBOR | London InterBank Offered Rate | |||||||||
MBS | Mortgage-Backed Security | |||||||||
PIK | Payment-In-Kind | |||||||||
RDA | Redevelopment Agency/Authority | |||||||||
SF | Single Family | |||||||||
T-Note | Treasury Note | |||||||||
VRI | Value Recovery Instrument | |||||||||
| Index | ||
CDX.EM.Series number | CDX Emerging Markets Index | |
CDX.NA.HY.Series number | CDX North America High Yield Index | |
MCDX.NA.Series number | MCDX North America Index | |
| FSI-52 | Semiannual Report | |||
Franklin U.S. Government Securities VIP Fund
This semiannual report for Franklin U.S. Government Securities VIP Fund covers the period ended June 30, 2018.
Class 2 Performance Summary as of June 30, 2018
The Fund’s Class 2 Shares had a -1.02% total return for the six-month period ended June 30, 2018.
Performance reflects the Fund’s Class 2 operating expenses, but does not include any contract fees, expenses or sales charges. If they had been included, performance would be lower. These charges and deductions, particularly for variable life policies, can have a significant effect on contract values and insurance benefits. See the contract prospectus for a complete description of these expenses, including sales charges.
Performance data represent past performance, which does not guarantee future results. Investment return and principal value will fluctuate, and you may have a gain or loss when you sell your shares. Current performance may differ from figures shown.
| Semiannual Report | FUS-1 | |||||
FRANKLIN U.S. GOVERNMENT SECURITIES VIP FUND
Fund Goal and Main Investments
The Fund seeks income. Under normal market conditions, the Fund invests at least 80% of its net assets in US government securities.
Fund Risks
All investments involve risks, including possible loss of principal. The Fund’s share price and yield will be affected by interest rate movements and mortgage prepayments. Bond prices generally move in the opposite direction of interest rates. Thus, as prices of bonds in the Fund adjust to a rise in interest rates, the Fund’s share price may decline. Changes in the financial strength of a bond issuer or in a bond’s credit rating may affect its value. The Fund is actively managed but there is no guarantee that the manager’s investment decisions will produce the desired results. The Fund’s prospectus also includes a description of the main investment risks.
Performance Overview
You can find the Fund’s six-month total return in the Performance Summary. In comparison, the Fund’s primary benchmark, the Bloomberg Barclays US Government Index: Intermediate Component, had a -0.67% total return.1 The Fund’s secondary benchmark, the Lipper VIP General US Government Funds Classification Average, had a -1.22% total return.2 Funds in the Lipper average may allocate as much as 35% of their investments in asset types other than US government and agency mortgage-backed securities.
Economic and Market Overview
The US economy continued to grow during the six months under review. After moderating for three consecutive quarters, the economy grew faster in 2018’s second quarter, driven by consumer spending, exports, business investment and government spending. The manufacturing and services sectors expanded during the period. The unemployment rate declined slightly from 4.1% in December 2017, as reported at the beginning of the six-month period, to 4.0% at period-end.3 Annual inflation, as measured by the Consumer Price Index, increased from 2.1% in December 2017, as reported at the beginning of the period, to 2.9% at period-end.3
Portfolio Composition
Based on Total Net Assets as of 6/30/18
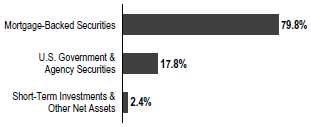
In February 2018, the new US Federal Reserve (Fed) Chair Jerome Powell spoke before Congress for the first time and indicated the Fed saw signs of a continued strong labor market and economic growth. He reiterated the Fed’s intention to gradually raise interest rates in an effort to keep the economy from overheating and as inflation increases toward the Fed’s target. However, he noted there was no evidence of the economy overheating and he had yet to see a clear upward move in wages. The Fed raised its target range for the federal funds rate 0.25% each at its March and June 2018 meetings to 1.75%–2.00% and continued reducing its balance sheet as part of its ongoing plan to normalize monetary policy. In June, the Fed upgraded its economic forecast for 2018 and its inflation forecasts for 2018 and 2019. Furthermore, the Fed forecasted an additional rate hike for 2018 and 2019 than previously anticipated.
The 10-year Treasury yield, which moves inversely to its price, increased during the period. The yield rose to multi-year highs in February, April and May amid indications of higher inflation. However, some factors weighed on the Treasury yield at certain points during the period, including concerns about political turmoil in Italy, political uncertainties in the US, the Trump administration’s protectionist trade policies, and US trade disputes between its allies and China. Overall, the 10-year Treasury yield rose from 2.40% at the beginning of the period to 2.85% at period-end.
1. Source: Morningstar.
2. Source: Lipper, a Thomson Reuters Company.
One cannot invest directly in an index, and an index is not representative of the Fund’s portfolio. Please see Index Descriptions following the Fund Summaries.
3. Source: Bureau of Labor Statistics.
The dollar value, number of shares or principal amount, and names of all portfolio holdings are listed in the Fund’s Statement of Investments (SOI).
| FUS-2 | Semiannual Report | |||
FRANKLIN U.S. GOVERNMENT SECURITIES VIP FUND
Investment Strategy
Using our straightforward investment approach, we seek to produce current income with a high degree of credit safety from a conservatively managed portfolio of US government securities. Analyzing securities using proprietary and nonproprietary research, we seek to identify attractive investment opportunities.
Manager’s Discussion
From a perspective of excess returns over Treasuries of similar duration as measured by Bloomberg Barclays indexes, all major fixed income sectors related to this portfolio had negative excess returns during the period. US economic indicators were generally encouraging during the reporting period. Steady growth in the services sector created new jobs and boosted employment levels. Retail sales grew for most of the period, while gains in energy prices pulled inflation higher. In this environment, home sales slowed due to low supply levels and rising prices.
The Fund maintains a consistent and disciplined approach to our investment strategy. The Fund’s investment process and strategy have not changed, and the team continues to look for strong cash flow fundamentals and valuations seeking to uncover opportunities across the agency mortgage and agency debenture universe. The Fund emphasizes agency pass-throughs and invests in other agency securities for diversification purposes.
Within the agency mortgage pass-through sector, Freddie Mac MBS, Fannie Mae MBS and GNMA MBS underperformed US Treasuries and posted negative total returns during the period.
During the period, we were more weighted toward GNMA IIs (pools of mortgages from multiple issuers) than GNMA Is (pools of mortgages from single issuers). Over the period, we increased exposure to GNMA II 4.0% coupons, while reducing the exposure to 3.0% coupons. At period-end, our heaviest exposures were in GN II 3.5% and 4.0% coupons. Based on excess returns over Treasuries, coupon performance was mixed. GN II 5.0% securities were among the best performers, while GN I & II 3.5 and 3.0% securities lagged.
The Fund’s exposure security selection in agency fixed-rate mortgages, allocation to Treasury-inflation protected securities (TIPS) and adjustable-rate MBS were contributors during the period. In contrast, our exposure to fixed-rate agency MBS was a detractor. The Fund’s US yield curve positioning was also a detractor during the period as yield curve movements had a negative impact relative to the benchmark.
Thank you for your participation in Franklin U.S. Government Securities VIP Fund. We look forward to serving your future investment needs.
The foregoing information reflects our analysis, opinions and portfolio holdings as of June 30, 2018, the end of the reporting period. The way we implement our main investment strategies and the resulting portfolio holdings may change depending on factors such as market and economic conditions. These opinions may not be relied upon as investment advice or an offer for a particular security. The information is not a complete analysis of every aspect of any market, country, industry, security or the Fund. Statements of fact are from sources considered reliable, but the investment manager makes no representation or warranty as to their completeness or accuracy. Although historical performance is no guarantee of future results, these insights may help you understand our investment management philosophy.
| Semiannual Report | FUS-3 | |||||
FRANKLIN U.S. GOVERNMENT SECURITIES VIP FUND
Class 2 Fund Expenses
As an investor in a variable insurance contract (Contract) that indirectly provides for investment in an underlying mutual fund, you can incur transaction and/or ongoing expenses at both the Fund level and the Contract Level: (1) transaction expenses can include sales charges (loads) on purchases, surrender fees, transfer fees and premium taxes; and (2) ongoing expenses can include management fees, distribution and service (12b-1) fees, contract fees, annual maintenance fees, mortality and expense risk fees and other fees and expenses. All mutual funds and Contracts have some types of ongoing expenses. The table below shows Fund-level ongoing expenses and can help you understand these costs and compare them with those of other mutual funds offered through the Contract. The table assumes a $1,000 investment held for the six months indicated. Please refer to the Fund prospectus for additional information on operating expenses.
Actual Fund Expenses
The table below provides information about the actual account values and actual expenses in the columns under the heading “Actual.” In these columns the Fund’s actual return, which includes the effect of ongoing Fund expenses but does not include the effect of ongoing Contract expenses, is used to calculate the “Ending Account Value.” You can estimate the Fund-level expenses you paid during the period by following these steps (of course, your account value and expenses will differ from those in this illustration): Divide your account value by $1,000 (if your account had an $8,600 value, then $8,600 ÷ $1,000 = 8.6). Then multiply the result by the number under the headings “Actual” and “Fund-Level Expenses Paid During Period” (if Fund-Level Expenses Paid During Period were $ 7.50, then 8.6 x $7.50 = $64.50). In this illustration, the estimated expenses paid this period at the Fund level are $64.50.
Hypothetical Example for Comparison with Other Mutual Funds
Under the heading “Hypothetical” in the table, information is provided about hypothetical account values and hypothetical expenses based on the Fund’s actual expense ratio and an assumed rate of return of 5% per year before expenses, which is not the Fund’s actual return. This information may not be used to estimate the actual ending account balance or expenses you paid for the period, but it can help you compare ongoing costs of investing in the Fund with those of other mutual funds offered through the Contract. To do so, compare this 5% hypothetical example with the 5% hypothetical examples that appear in the shareholder reports of other funds offered through the Contract.
Please note that expenses shown in the table are meant to highlight ongoing costs at the Fund level only and do not reflect any ongoing expenses at the Contract level, or transaction expenses at either the Fund or Contract levels. In addition, while the Fund does not have transaction expenses, if the transaction and ongoing expenses at the Contract level were included, the expenses shown below would be higher. You should consult your Contract prospectus or disclosure document for more information.
| Actual (actual return after expenses) | Hypothetical (5% annual return before expenses) | |||||||||||
Share Class | Beginning Account Value 1/1/18 | Ending Account Value 6/30/18 | Fund-Level Expenses Paid During Period 1/1/18–6/30/181,2 | Ending Account Value 6/30/18 | Fund-Level Paid During Period 1/1/18–6/30/181,2 | Annualized Expense Ratio2 | ||||||
|
|
|
| |||||||||
Class 2 | $1,000 | $989.80 | $3.70 | $1,021.08 | $3.76 | 0.75% | ||||||
1. Expenses are equal to the annualized expense ratio for the six-month period as indicated above—in the far right column—multiplied by the simple average account value over the period indicated, and then multiplied by 181/365 to reflect the one-half year period.
2. Does not include any ongoing expenses of the Contract for which the Fund is an investment option or acquired fund fees and expenses.
| FUS-4 | Semiannual Report | |||
FRANKLIN TEMPLETON VARIABLE INSURANCE PRODUCTS TRUST
Financial Highlights
Franklin U.S. Government Securities VIP Fund
Six Months Ended (unaudited) | Year Ended December 31, | |||||||||||||||||||||||
| 2017 | 2016 | 2015 | 2014 | 2013 | ||||||||||||||||||||
| ||||||||||||||||||||||||
| Class 1 | ||||||||||||||||||||||||
| Per share operating performance (for a share outstanding throughout the period) | ||||||||||||||||||||||||
Net asset value, beginning of period | $12.36 | $12.51 | $12.74 | $13.00 | $12.91 | $13.57 | ||||||||||||||||||
|
| |||||||||||||||||||||||
| Income from investment operationsa: | ||||||||||||||||||||||||
Net investment incomeb | 0.14 | 0.25 | 0.22 | 0.21 | 0.24 | 0.24 | ||||||||||||||||||
Net realized and unrealized gains (losses) | (0.26 | ) | (0.04 | ) | (0.10 | ) | (0.12 | ) | 0.22 | (0.51) | ||||||||||||||
|
| |||||||||||||||||||||||
Total from investment operations | (0.12 | ) | 0.21 | 0.12 | 0.09 | 0.46 | (0.27) | |||||||||||||||||
|
| |||||||||||||||||||||||
Less distributions from net investment income | (0.36 | ) | (0.36 | ) | (0.35 | ) | (0.35 | ) | (0.37 | ) | (0.39) | |||||||||||||
|
| |||||||||||||||||||||||
Net asset value, end of period | $11.88 | $12.36 | $12.51 | $12.74 | $13.00 | $12.91 | ||||||||||||||||||
|
| |||||||||||||||||||||||
Total returnc | (0.99)% | 1.66% | 0.90% | 0.71% | 3.64% | (1.99)% | ||||||||||||||||||
| Ratios to average net assetsd | ||||||||||||||||||||||||
Expensese | 0.50% | 0.50% | 0.50% | 0.50% | 0.49% | 0.49% | ||||||||||||||||||
Net investment income | 2.37% | 2.00% | 1.75% | 1.64% | 1.84% | 1.84% | ||||||||||||||||||
Supplemental data | ||||||||||||||||||||||||
| Net assets, end of period (000’s) | $62,259 | $66,404 | $73,695 | $79,620 | $90,656 | $99,947 | ||||||||||||||||||
Portfolio turnover rate | 18.65% | 80.49% | 86.28% | 61.91% | 42.88% | 69.47% | ||||||||||||||||||
Portfolio turnover rate excluding mortgage dollar rollsf | 18.65% | 80.49% | 86.28% | 61.91% | 42.88% | 67.80% | ||||||||||||||||||
aThe amount shown for a share outstanding throughout the period may not correlate with the Statement of Operations for the period due to the timing of sales and repurchases of the Fund’s shares in relation to income earned and/or fluctuating fair value of the investments of the Fund.
bBased on average daily shares outstanding.
cTotal return does not include fees, charges or expenses imposed by the variable annuity and life insurance contracts for which Franklin Templeton Variable Insurance Products Trust serves as an underlying investment vehicle. Total return is not annualized for periods less than one year.
dRatios are annualized for periods less than one year.
eBenefit of expense reduction rounds to less than 0.01%.
fSee Note 1(c) regarding mortgage dollar rolls.
| The accompanying notes are an integral part of these financial statements. | Semiannual Report | FUS-5 | |||||
FRANKLIN TEMPLETON VARIABLE INSURANCE PRODUCTS TRUST
FINANCIAL HIGHLIGHTS
Franklin U.S. Government Securities VIP Fund (continued)
Six Months Ended (unaudited) | Year Ended December 31, | |||||||||||||||||||||||
| 2017 | 2016 | 2015 | 2014 | 2013 | ||||||||||||||||||||
| ||||||||||||||||||||||||
| Class 2 | ||||||||||||||||||||||||
| Per share operating performance (for a share outstanding throughout the period) | ||||||||||||||||||||||||
Net asset value, beginning of period | $12.09 | $12.24 | $12.47 | $12.73 | $12.65 | $13.31 | ||||||||||||||||||
|
| |||||||||||||||||||||||
| Income from investment operationsa: | ||||||||||||||||||||||||
Net investment incomeb | 0.12 | 0.21 | 0.19 | 0.18 | 0.20 | 0.21 | ||||||||||||||||||
Net realized and unrealized gains (losses) | (0.25 | ) | (0.04 | ) | (0.10 | ) | (0.12 | ) | 0.22 | (0.50) | ||||||||||||||
|
| |||||||||||||||||||||||
Total from investment operations | (0.13 | ) | 0.17 | 0.09 | 0.06 | 0.42 | (0.29) | |||||||||||||||||
|
| |||||||||||||||||||||||
Less distributions from net investment income | (0.33 | ) | (0.32 | ) | (0.32 | ) | (0.32 | ) | (0.34 | ) | (0.37) | |||||||||||||
|
| |||||||||||||||||||||||
Net asset value, end of period | $11.63 | $12.09 | $12.24 | $12.47 | $12.73 | $12.65 | ||||||||||||||||||
|
| |||||||||||||||||||||||
Total returnc | (1.02)% | 1.34% | 0.66% | 0.47% | 3.38% | (2.24)% | ||||||||||||||||||
| Ratios to average net assetsd | ||||||||||||||||||||||||
Expensese | 0.75% | 0.75% | 0.75% | 0.75% | 0.74% | 0.74% | ||||||||||||||||||
Net investment income | 2.12% | 1.75% | 1.50% | 1.39% | 1.59% | 1.59% | ||||||||||||||||||
Supplemental data | ||||||||||||||||||||||||
| Net assets, end of period (000’s) | $1,159,208 | $1,223,491 | $1,268,963 | $1,311,974 | $1,369,037 | $1,267,994 | ||||||||||||||||||
Portfolio turnover rate | 18.65% | 80.49% | 86.28% | 61.91% | 42.88% | 69.47% | ||||||||||||||||||
Portfolio turnover rate excluding mortgage dollar rollsf | 18.65% | 80.49% | 86.28% | 61.91% | 42.88% | 67.80% | ||||||||||||||||||
aThe amount shown for a share outstanding throughout the period may not correlate with the Statement of Operations for the period due to the timing of sales and repurchases of the Fund’s shares in relation to income earned and/or fluctuating fair value of the investments of the Fund.
bBased on average daily shares outstanding.
cTotal return does not include fees, charges or expenses imposed by the variable annuity and life insurance contracts for which Franklin Templeton Variable Insurance Products Trust serves as an underlying investment vehicle. Total return is not annualized for periods less than one year.
dRatios are annualized for periods less than one year.
eBenefit of expense reduction rounds to less than 0.01%.
fSee Note 1(c) regarding mortgage dollar rolls.
| FUS-6 | Semiannual Report | The accompanying notes are an integral part of these financial statements. | |||
FRANKLIN TEMPLETON VARIABLE INSURANCE PRODUCTS TRUST
Statement of Investments, June 30, 2018 (unaudited)
Franklin U.S. Government Securities VIP Fund
| Principal Amount | Value | |||||||
Mortgage-Backed Securities 79.8% | ||||||||
a Federal Home Loan Mortgage Corp. (FHLMC) Adjustable Rate 1.2% | ||||||||
FHLMC, 3.759%, (12-month USD LIBOR +/- MBS Margin), 4/01/40 | $ | 6,370,168 | $ | 6,672,640 | ||||
FHLMC, 4.011%, (US 1 Year CMT T-Note +/- MBS Margin), 5/01/37 | 718,505 | 755,307 | ||||||
FHLMC, 3.762% - 4.41%, (12-month USD LIBOR +/- MBS Margin), 3/01/36 - 5/01/38 | 7,202,663 | 7,560,214 | ||||||
|
| |||||||
| 14,988,161 | ||||||||
|
| |||||||
Federal Home Loan Mortgage Corp. (FHLMC) Fixed Rate 10.6% | ||||||||
FHLMC Gold 15 Year, 4.50%, 3/01/25 - 4/01/25 | 982,689 | 1,004,156 | ||||||
FHLMC Gold 30 Year, 3.00%, 5/01/43 | 468,822 | 457,727 | ||||||
FHLMC Gold 30 Year, 3.00%, 6/01/46 | 37,246,752 | 36,105,207 | ||||||
FHLMC Gold 30 Year, 3.00%, 10/01/46 | 26,350,929 | 25,539,225 | ||||||
FHLMC Gold 30 Year, 3.50%, 3/01/32 - 5/01/43 | 3,778,577 | 3,832,205 | ||||||
FHLMC Gold 30 Year, 3.50%, 12/01/47 | 7,725,814 | 7,689,084 | ||||||
FHLMC Gold 30 Year, 3.50%, 1/01/48 | 14,578,068 | 14,510,879 | ||||||
FHLMC Gold 30 Year, 4.00%, 9/01/40 - 1/01/48 | 11,862,893 | 12,169,034 | ||||||
FHLMC Gold 30 Year, 4.00%, 5/01/48 | 3,967,802 | 4,048,290 | ||||||
FHLMC Gold 30 Year, 4.00%, 7/01/48 | 13,615,782 | 13,888,872 | ||||||
FHLMC Gold 30 Year, 4.50%, 5/01/40 - 7/01/41 | 2,477,629 | 2,603,062 | ||||||
FHLMC Gold 30 Year, 5.00%, 9/01/33 - 4/01/40 | 4,684,889 | 5,004,595 | ||||||
FHLMC Gold 30 Year, 5.50%, 7/01/33 - 5/01/38 | 1,186,332 | 1,284,860 | ||||||
FHLMC Gold 30 Year, 6.00%, 1/01/24 - 8/01/35 | 800,091 | 878,595 | ||||||
FHLMC Gold 30 Year, 6.50%, 12/01/23 - 5/01/35 | 406,122 | 452,587 | ||||||
FHLMC Gold 30 Year, 7.00%, 4/01/24 - 9/01/31 | 137,161 | 148,572 | ||||||
FHLMC Gold 30 Year, 7.50%, 12/01/22 | 424 | 428 | ||||||
FHLMC Gold 30 Year, 8.00%, 9/01/21 - 5/01/22 | 2,423 | 2,559 | ||||||
FHLMC Gold 30 Year, 8.50%, 10/01/21 - 7/01/31 | 298,650 | 347,654 | ||||||
FHLMC PC 30 Year, 8.50%, 9/01/20 | 83 | 83 | ||||||
|
| |||||||
| 129,967,674 | ||||||||
|
| |||||||
a Federal National Mortgage Association (FNMA) Adjustable Rate 4.4% | ||||||||
FNMA, 3.671%, (12-month USD LIBOR +/- MBS Margin), 8/01/36 | 5,737,600 | 6,005,268 | ||||||
FNMA, 2.67% - 3.724%, (US 1 Year CMT T-Note +/- MBS Margin), 9/01/18 - 10/01/44 | 8,009,633 | 8,404,606 | ||||||
FNMA, 3.028% - 3.818%, (12-month USD LIBOR +/- MBS Margin), 1/01/19 - 1/01/40 | 6,665,292 | 6,946,808 | ||||||
FNMA, 4.039%, (12-month USD LIBOR +/- MBS Margin), 9/01/37 | 15,500,481 | 16,394,190 | ||||||
FNMA, 3.21% - 4.133%, (US 3 Year CMT T-Note +/- MBS Margin), 3/01/20 - 3/01/29 | 38,448 | 38,901 | ||||||
FNMA, 2.064% - 5.437%, (11th District COF +/- MBS Margin), 9/01/19 - 6/01/38 | 169,378 | 171,930 | ||||||
FNMA, 2.901% - 5.793%, (6-month USD LIBOR +/- MBS Margin), 6/01/21 - 7/01/37 | 1,162,164 | 1,193,329 | ||||||
FNMA, 3.835% - 5.875%, (12-month USD LIBOR +/- MBS Margin), 3/01/33 - 3/01/47 | 8,145,479 | 8,546,985 | ||||||
FNMA, 3.725% - 7.22%, (US 1 Year CMT T-Note +/- MBS Margin), 7/01/19 - 12/01/40 | 5,320,138 | 5,576,116 | ||||||
|
| |||||||
| 53,278,133 | ||||||||
|
| |||||||
Federal National Mortgage Association (FNMA) Fixed Rate 12.0% | ||||||||
FNMA 15 Year, 2.64%, 7/01/25 | 2,500,000 | 2,408,353 | ||||||
FNMA 15 Year, 2.77%, 4/01/25 | 3,500,000 | 3,396,839 | ||||||
FNMA 15 Year, 2.99%, 11/01/24 | 2,971,843 | 2,934,669 | ||||||
FNMA 15 Year, 3.14%, 10/01/25 | 4,000,000 | 3,981,863 | ||||||
FNMA 15 Year, 3.28%, 7/01/27 | 4,000,000 | 3,931,332 | ||||||
FNMA 15 Year, 3.51%, 8/01/23 | 3,000,000 | 3,060,604 | ||||||
FNMA 15 Year, 5.50%, 1/01/25 | 963,339 | 1,005,774 | ||||||
FNMA 30 Year, 3.00%, 12/01/42 | 198,329 | 193,391 | ||||||
FNMA 30 Year, 3.00%, 9/01/47 | 19,301,810 | 18,726,749 | ||||||
FNMA 30 Year, 3.50%, 7/01/45 | 34,633,220 | 34,574,429 | ||||||
FNMA 30 Year, 4.00%, 1/01/41 - 8/01/41 | 7,985,676 | 8,204,825 | ||||||
FNMA 30 Year, 4.00%, 4/01/48 | 44,458,707 | 45,404,853 | ||||||
| Semiannual Report | FUS-7 | |||||
FRANKLIN TEMPLETON VARIABLE INSURANCE PRODUCTS TRUST
STATEMENT OF INVESTMENTS (UNAUDITED)
Franklin U.S. Government Securities VIP Fund (continued)
| Principal Amount | Value | |||||||
Mortgage-Backed Securities (continued) | ||||||||
Federal National Mortgage Association (FNMA) Fixed Rate (continued) | ||||||||
FNMA 30 Year, 4.50%, 8/01/40 - 6/01/41 | $ | 7,936,326 | $ | 8,348,494 | ||||
FNMA 30 Year, 5.00%, 3/01/34 - 7/01/41 | 4,476,063 | 4,799,330 | ||||||
FNMA 30 Year, 5.50%, 12/01/32 - 8/01/35 | 1,815,611 | 1,961,452 | ||||||
FNMA 30 Year, 6.00%, 1/01/24 - 8/01/38 | 2,009,188 | 2,202,516 | ||||||
FNMA 30 Year, 6.50%, 1/01/24 - 9/01/36 | 363,920 | 401,389 | ||||||
FNMA 30 Year, 7.50%, 4/01/23 - 8/01/25 | 16,093 | 16,456 | ||||||
FNMA 30 Year, 8.00%, 3/01/22 - 12/01/24 | 76,333 | 77,572 | ||||||
FNMA 30 Year, 8.50%, 3/01/20 - 6/01/21 | 272 | 277 | ||||||
FNMA 30 Year, 9.00%, 10/01/26 | 79,937 | 83,582 | ||||||
FNMA PL 30 Year, 5.50%, 4/01/34 | 1,146,830 | 1,203,124 | ||||||
|
| |||||||
| 146,917,873 | ||||||||
|
| |||||||
Government National Mortgage Association (GNMA) Fixed Rate 51.6% | ||||||||
GNMA I SF 30 Year, 3.00%, 7/15/42 | 537,755 | 528,684 | ||||||
GNMA I SF 30 Year, 4.00%, 10/15/40 - 8/15/46 | 11,138,582 | 11,490,520 | ||||||
GNMA I SF 30 Year, 4.50%, 1/15/39 - 6/15/40 | 10,754,163 | 11,368,271 | ||||||
GNMA I SF 30 Year, 4.50%, 7/15/40 - 6/15/41 | 4,446,098 | 4,700,107 | ||||||
GNMA I SF 30 Year, 5.00%, 6/15/30 - 11/15/39 | 11,378,435 | 12,103,185 | ||||||
GNMA I SF 30 Year, 5.00%, 11/15/39 - 9/15/40 | 11,464,409 | 12,198,092 | ||||||
GNMA I SF 30 Year, 5.50%, 12/15/28 - 10/15/39 | 5,633,039 | 6,131,817 | ||||||
GNMA I SF 30 Year, 6.00%, 11/15/23 - 11/15/38 | 2,844,991 | 3,142,930 | ||||||
GNMA I SF 30 Year, 6.50%, 6/15/23 - 9/15/38 | 1,438,816 | 1,593,518 | ||||||
GNMA I SF 30 Year, 7.00%, 9/15/22 - 1/15/32 | 374,857 | 390,663 | ||||||
GNMA I SF 30 Year, 7.50%, 2/15/22 - 8/15/33 | 420,929 | 469,161 | ||||||
GNMA I SF 30 Year, 8.00%, 12/15/21 - 7/15/23 | 93,832 | 95,575 | ||||||
GNMA I SF 30 Year, 8.50%, 6/15/22 - 12/15/24 | 37,483 | 38,162 | ||||||
GNMA I SF 30 Year, 9.00%, 9/15/19 - 3/15/20 | 651 | 653 | ||||||
GNMA I SF 30 Year, 9.50%, 1/15/20 - 12/15/20 | 12,328 | 12,477 | ||||||
GNMA I SF 30 Year, 10.00%, 9/15/18 - 8/15/21 | 3,753 | 3,771 | ||||||
GNMA II SF 30 Year, 3.00%, 12/20/42 - 2/20/45 | 2,546,000 | 2,514,686 | ||||||
GNMA II SF 30 Year, 3.00%, 9/20/45 | 10,334,271 | 10,168,567 | ||||||
GNMA II SF 30 Year, 3.00%, 7/20/47 | 22,800,909 | 22,336,997 | ||||||
GNMA II SF 30 Year, 3.00%, 9/20/47 | 28,842,415 | 28,243,843 | ||||||
GNMA II SF 30 Year, 3.50%, 12/20/40 - 8/20/43 | 2,573,733 | 2,604,337 | ||||||
GNMA II SF 30 Year, 3.50%, 8/20/42 | 7,179,325 | 7,264,697 | ||||||
GNMA II SF 30 Year, 3.50%, 9/20/42 | 20,839,022 | 21,086,830 | ||||||
GNMA II SF 30 Year, 3.50%, 10/20/42 | 6,367,792 | 6,443,516 | ||||||
GNMA II SF 30 Year, 3.50%, 11/20/42 | 12,467,057 | 12,615,311 | ||||||
GNMA II SF 30 Year, 3.50%, 12/20/42 | 9,412,876 | 9,524,812 | ||||||
GNMA II SF 30 Year, 3.50%, 1/20/43 | 15,853,960 | 16,042,589 | ||||||
GNMA II SF 30 Year, 3.50%, 3/20/43 | 5,692,347 | 5,760,042 | ||||||
GNMA II SF 30 Year, 3.50%, 4/20/43 | 7,124,926 | 7,209,658 | ||||||
GNMA II SF 30 Year, 3.50%, 5/20/43 | 13,097,167 | 13,252,926 | ||||||
GNMA II SF 30 Year, 3.50%, 6/20/43 | 5,979,465 | 6,050,576 | ||||||
GNMA II SF 30 Year, 3.50%, 9/20/47 | 94,260,543 | 94,707,046 | ||||||
GNMA II SF 30 Year, 3.50%, 10/20/47 | 7,714,459 | 7,751,001 | ||||||
GNMA II SF 30 Year, 3.50%, 11/20/47 | 139,483,023 | 140,143,740 | ||||||
GNMA II SF 30 Year, 4.00%, 11/20/39 - 7/20/41 | 11,426,025 | 11,828,159 | ||||||
GNMA II SF 30 Year, 4.00%, 9/20/41 - 2/20/44 | 4,225,666 | 4,356,423 | ||||||
GNMA II SF 30 Year, 4.00%, 11/20/41 | 6,979,969 | 7,219,526 | ||||||
GNMA II SF 30 Year, 4.00%, 1/20/48 | 9,769,931 | 10,024,452 | ||||||
GNMA II SF 30 Year, 4.00%, 4/20/48 | 63,545,515 | 65,200,970 | ||||||
| FUS-8 | Semiannual Report | |||
FRANKLIN TEMPLETON VARIABLE INSURANCE PRODUCTS TRUST
STATEMENT OF INVESTMENTS (UNAUDITED)
Franklin U.S. Government Securities VIP Fund (continued)
| Principal Amount | Value | |||||||
Mortgage-Backed Securities (continued) | ||||||||
Government National Mortgage Association (GNMA) Fixed Rate (continued) | ||||||||
GNMA II SF 30 Year, 4.50%, 10/20/39 - 6/20/41 | $ | 10,784,168 | $ | 11,341,070 | ||||
GNMA II SF 30 Year, 4.50%, 7/20/41 - 2/20/44 | 10,776,714 | 11,342,591 | ||||||
GNMA II SF 30 Year, 4.50%, 9/20/41 | 5,517,914 | 5,807,741 | ||||||
GNMA II SF 30 Year, 4.50%, 10/20/44 | 2,984,014 | 3,144,736 | ||||||
GNMA II SF 30 Year, 5.00%, 9/20/33 - 10/20/42 | 9,225,524 | 9,904,279 | ||||||
GNMA II SF 30 Year, 5.00%, 6/20/44 | 2,862,359 | 3,048,829 | ||||||
GNMA II SF 30 Year, 5.50%, 5/20/34 - 6/20/38 | 4,638,950 | 5,048,380 | ||||||
GNMA II SF 30 Year, 6.00%, 11/20/23 - 7/20/39 | 2,931,387 | 3,247,238 | ||||||
GNMA II SF 30 Year, 6.50%, 12/20/27 - 4/20/34 | 463,030 | 516,023 | ||||||
GNMA II SF 30 Year, 7.00%, 5/20/32 | 8,291 | 9,571 | ||||||
GNMA II SF 30 Year, 7.50%, 9/20/22 - 5/20/33 | 82,647 | 89,527 | ||||||
GNMA II SF 30 Year, 8.00%, 8/20/26 | 5,431 | 6,215 | ||||||
GNMA II SF 30 Year, 9.50%, 4/20/25 | 1,998 | 2,005 | ||||||
|
| |||||||
| 630,126,495 | ||||||||
|
| |||||||
Total Mortgage-Backed Securities (Cost $1,001,272,993) | 975,278,336 | |||||||
|
| |||||||
U.S. Government and Agency Securities 17.8% | ||||||||
Federal Agricultural Mortgage Corp., | ||||||||
4.30%, 5/13/19 | 1,010,000 | 1,026,879 | ||||||
1.41%, 3/06/20 | 10,000,000 | 9,815,440 | ||||||
2.66%, 4/12/22 | 7,000,000 | 6,972,504 | ||||||
FHLB, 2.625%, 9/12/25 | 20,000,000 | 19,464,680 | ||||||
FICO, | ||||||||
13P, Strip, 12/27/18 | 2,500,000 | 2,471,443 | ||||||
15P, Strip, 3/07/19 | 1,798,000 | 1,769,117 | ||||||
D-P, Strip, 9/26/19 | 7,605,000 | 7,373,561 | ||||||
E-P, Strip, 11/02/18 | 8,896,000 | 8,828,731 | ||||||
Israel Government Agency for International Development Bond, | ||||||||
5.50%, 9/18/23 | 12,000,000 | 13,512,506 | ||||||
7-Z, U.S. Government Guaranteed, Strip, 8/15/22 | 5,619,000 | 5,016,355 | ||||||
New Valley Generation IV, secured bond, 4.687%, 1/15/22 | 1,474,708 | 1,524,125 | ||||||
Overseas Private Investment Corp., A, zero cpn., 11/15/20 | 2,575,000 | 3,108,107 | ||||||
Petroleos Mexicanos, 2.378%, 4/15/25 (Mexico) | 2,303,000 | 2,258,264 | ||||||
Private Export Funding Corp., | ||||||||
secured bond, 2.80%, 5/15/22 | 9,000,000 | 8,979,750 | ||||||
secured note, 4.30%, 12/15/21 | 1,865,000 | 1,950,706 | ||||||
secured note, LL, 2.25%, 3/15/20 | 1,700,000 | 1,688,607 | ||||||
senior secured note, MM, 2.30%, 9/15/20 | 3,500,000 | 3,458,767 | ||||||
Reliance Industries Ltd., senior bond, 2.512%, 1/15/26 (India) | 10,500,000 | 10,299,240 | ||||||
SBA, PC, 1998-20I, 1, 6.00%, 9/01/18 | 29,965 | 30,046 | ||||||
Tunisia Government Agency for International Development Bonds, 1.686%, 7/16/19 | 7,000,000 | 6,970,355 | ||||||
TVA, | ||||||||
1.875%, 8/15/22 | 6,000,000 | 5,805,078 | ||||||
5.88%, 4/01/36 | 5,000,000 | 6,554,790 | ||||||
Strip, 11/01/18 | 2,644,000 | 2,623,687 | ||||||
Strip, 6/15/19 | 5,973,000 | 5,816,470 | ||||||
Strip, 6/15/20 | 6,138,000 | 5,808,143 | ||||||
| . Semiannual Report |
|
FUS-9 |
|
FRANKLIN TEMPLETON VARIABLE INSURANCE PRODUCTS TRUST
STATEMENT OF INVESTMENTS (UNAUDITED)
Franklin U.S. Government Securities VIP Fund (continued)
| Principal Amount | Value | |||||||
U.S. Government and Agency Securities (continued) | ||||||||
U.S. Treasury Bond, | ||||||||
2.50%, 2/15/46 | $ | 4,000,000 | $ | 3,633,906 | ||||
b Index Linked, 2.00%, 1/15/26 | 1,893,260 | 2,074,908 | ||||||
b Index Linked, 1.75%, 1/15/28 | 9,566,288 | 10,456,315 | ||||||
b Index Linked, 3.625%, 4/15/28 | 7,744,310 | 9,839,632 | ||||||
U.S. Treasury Note, | ||||||||
2.375%, 8/15/24 | 22,000,000 | 21,476,641 | ||||||
2.25%, 8/15/27 | 6,000,000 | 5,709,844 | ||||||
b Index Linked, 0.125%, 7/15/24 | 16,352,987 | 15,901,191 | ||||||
Ukraine Government Agency for International Development Bonds, 1.844%, 5/16/19 | 5,000,000 | 4,987,420 | ||||||
|
| |||||||
Total U.S. Government and Agency Securities (Cost $220,058,541) | 217,207,208 | |||||||
|
| |||||||
Total Investments before Short Term Investments (Cost $1,221,331,534) | 1,192,485,544 | |||||||
|
| |||||||
Short Term Investments (Cost $20,573,815) 1.7% | ||||||||
Repurchase Agreements 1.7% | ||||||||
c Joint Repurchase Agreement, 2.10%, 7/02/18 (Maturity Value $20,577,415) | ||||||||
BNP Paribas Securities Corp. (Maturity Value $7,384,411) | ||||||||
Deutsche Bank Securities Inc. (Maturity Value $270,182) | ||||||||
HSBC Securities (USA) Inc. (Maturity Value $12,922,822) | ||||||||
Collateralized by U.S. Government Agency Securities, 0.00% - 3.625%, 9/18/18 - 6/19/23; dU.S. Treasury Bill, 10/04/18 - 10/18/18; and U.S. Treasury Note, 2.00% - 3.50%, 5/15/20 - 8/31/21 (valued at $20,996,991) | 20,573,815 | 20,573,815 | ||||||
|
| |||||||
Total Investments (Cost $1,241,905,349) 99.3% | 1,213,059,359 | |||||||
Other Assets, less Liabilities 0.7% | 8,408,088 | |||||||
|
| |||||||
Net Assets 100.0% | $ | 1,221,467,447 | ||||||
|
| |||||||
See Abbreviations on page FUS-19.
aAdjustable Rate Mortgage-Backed Security (ARM); the rate shown is the effective rate at period end. ARM rates are not based on a published reference rate and spread, but instead pass-through weighted average interest income inclusive of any caps or floors, if applicable, from the underlying mortgage loans in which the majority of mortgages pay interest based on the index shown at their designated reset dates plus a spread, less the applicable servicing and guaranty fee (MBS margin).
bPrincipal amount of security is adjusted for inflation. See Note 1(e).
cSee Note 1(b) regarding joint repurchase agreement.
dThe security was issued on a discount basis with no stated coupon rate.
FUS-10 | Semiannual Report | The accompanying notes are an integral part of these financial statements. |
FRANKLIN TEMPLETON VARIABLE INSURANCE PRODUCTS TRUST
Financial Statements
Statement of Assets and Liabilities
June 30, 2018 (unaudited)
| Franklin U.S. Government Securities VIP Fund | ||||
Assets: | ||||
Investments in securities: | ||||
Cost - Unaffiliated issuers | $1,221,331,534 | |||
Cost - Unaffiliated repurchase agreements | 20,573,815 | |||
|
| |||
Value - Unaffiliated issuers | $1,192,485,544 | |||
Value - Unaffiliated repurchase agreements | 20,573,815 | |||
Receivables: | ||||
Investment securities sold | 5,707,945 | |||
Capital shares sold | 144,096 | |||
Interest | 4,232,087 | |||
Other assets | 813 | |||
|
| |||
Total assets | 1,223,144,300 | |||
|
| |||
Liabilities: | ||||
Payables: | ||||
Capital shares redeemed | 529,436 | |||
Management fees | 472,464 | |||
Distribution fees | 487,027 | |||
Reports to shareholders | 90,642 | |||
Accrued expenses and other liabilities | 97,284 | |||
|
| |||
Total liabilities | 1,676,853 | |||
|
| |||
Net assets, at value | $1,221,467,447 | |||
|
| |||
Net assets consist of: | ||||
Paid-in capital | $1,327,344,322 | |||
Undistributed net investment income | 10,351,671 | |||
Net unrealized appreciation (depreciation) | (28,845,990 | ) | ||
Accumulated net realized gain (loss) | (87,382,556 | ) | ||
|
| |||
Net assets, at value | $1,221,467,447 | |||
|
| |||
| Class 1: | ||||
Net assets, at value | $ 62,259,427 | |||
|
| |||
Shares outstanding | 5,239,030 | |||
|
| |||
Net asset value and maximum offering price per share | $11.88 | |||
|
| |||
| Class 2: | ||||
Net assets, at value | $1,159,208,020 | |||
|
| |||
Shares outstanding | 99,699,380 | |||
|
| |||
Net asset value and maximum offering price per share | $11.63 | |||
|
| |||
| The accompanying notes are an integral part of these financial statements. | Semiannual Report | FUS-11 | |||||
FRANKLIN TEMPLETON VARIABLE INSURANCE PRODUCTS TRUST
FINANCIAL STATEMENTS
Statement of Operations
for the six months ended June 30, 2018 (unaudited)
| Franklin U.S. Government Securities VIP Fund | ||||
Investment income: | ||||
Interest: | ||||
Unaffiliated issuers: | ||||
Paydown gain (loss) | $ (3,002,903 | ) | ||
Paid in cash | 20,847,362 | |||
|
| |||
Total investment income | 17,844,459 | |||
|
| |||
Expenses: | ||||
Management fees (Note 3a) | 2,925,917 | |||
Distribution fees: (Note 3c) | ||||
Class 2 | 1,477,684 | |||
Custodian fees (Note 4) | 5,503 | |||
Reports to shareholders | 69,052 | |||
Professional fees | 36,541 | |||
Trustees’ fees and expenses | 3,288 | |||
Other | 69,651 | |||
|
| |||
Total expenses | 4,587,636 | |||
Expense reductions (Note 4) | (200 | ) | ||
|
| |||
Net expenses | 4,587,436 | |||
|
| |||
Net investment income | 13,257,023 | |||
|
| |||
Realized and unrealized gains (losses): | ||||
Net realized gain (loss) from: | ||||
Investments: | ||||
Unaffiliated issuers | (2,700,396 | ) | ||
|
| |||
Net change in unrealized appreciation (depreciation) on: | ||||
Investments: | ||||
Unaffiliated issuers | (24,797,930 | ) | ||
|
| |||
Net realized and unrealized gain (loss) | (27,498,326 | ) | ||
|
| |||
Net increase (decrease) in net assets resulting from operations | $(14,241,303 | ) | ||
|
| |||
| FUS-12 | Semiannual Report | The accompanying notes are an integral part of these financial statements. | |||
FRANKLIN TEMPLETON VARIABLE INSURANCE PRODUCTS TRUST
FINANCIAL STATEMENTS
Statements of Changes in Net Assets
| Franklin U.S. Government Securities VIP Fund | ||||||||
| Six Months Ended June 30, 2018 (unaudited) | Year Ended December 31, 2017 | |||||||
Increase (decrease) in net assets: | ||||||||
Operations: | ||||||||
Net investment income | $ 13,257,023 | $ 23,425,605 | ||||||
Net realized gain (loss) | (2,700,396 | ) | (9,244,107 | ) | ||||
Net change in unrealized appreciation (depreciation) | (24,797,930 | ) | 4,564,648 | |||||
|
| |||||||
Net increase (decrease) in net assets resulting from operations | (14,241,303 | ) | 18,746,146 | |||||
|
| |||||||
Distributions to shareholders from: | ||||||||
Net investment income: | ||||||||
Class 1 | (1,830,491 | ) | (2,011,168 | ) | ||||
Class 2 | (31,691,784 | ) | (33,122,555 | ) | ||||
|
| |||||||
Total distributions to shareholders | (33,522,275 | ) | (35,133,723 | ) | ||||
|
| |||||||
Capital share transactions: (Note 2) | ||||||||
Class 1 | (1,659,895 | ) | (6,455,480 | ) | ||||
Class 2 | (19,003,872 | ) | (29,919,965 | ) | ||||
|
| |||||||
Total capital share transactions | (20,663,767 | ) | (36,375,445 | ) | ||||
|
| |||||||
Net increase (decrease) in net assets | (68,427,345 | ) | (52,763,022 | ) | ||||
Net assets: | ||||||||
Beginning of period | 1,289,894,792 | 1,342,657,814 | ||||||
|
| |||||||
End of period | $1,221,467,447 | $1,289,894,792 | ||||||
|
| |||||||
Undistributed net investment income included in net assets: | ||||||||
End of period | $ 10,351,671 | $ 30,616,923 | ||||||
|
| |||||||
| The accompanying notes are an integral part of these financial statements. | Semiannual Report | FUS-13 | |||||
FRANKLIN TEMPLETON VARIABLE INSURANCE PRODUCTS TRUST
Notes to Financial Statements (unaudited)
Franklin U.S. Government Securities VIP Fund
1. Organization and Significant Accounting Policies
Franklin Templeton Variable Insurance Products Trust (Trust) is registered under the Investment Company Act of 1940 (1940 Act) as an open-end management investment company, consisting of eighteen separate funds and applies the specialized accounting and reporting guidance in U.S. Generally Accepted Accounting Principles (U.S. GAAP). Franklin U.S. Government Securities VIP Fund (Fund) is included in this report. Shares of the Fund are generally sold only to insurance company separate accounts to fund the benefits of variable life insurance policies or variable annuity contracts. At June 30, 2018, 43.6% of the Fund’s shares were held through one insurance company. Investment activities of these insurance company separate accounts could have a material impact on the Fund. The Fund offers two classes of shares: Class 1 and Class 2. Each class of shares may differ by its distribution fees, voting rights on matters affecting a single class and its exchange privilege.
The following summarizes the Fund’s significant accounting policies.
a. Financial Instrument Valuation
The Fund’s investments in financial instruments are carried at fair value daily. Fair value is the price that would be received to sell an asset or paid to transfer a liability in an orderly transaction between market participants on the measurement date. The Fund calculates the net asset value (NAV) per share each business day as of 4 p.m. Eastern time or the regularly scheduled close of the New York Stock Exchange (NYSE), whichever is earlier. Under compliance policies and procedures approved by the Trust’s Board of Trustees (the Board), the Fund’s administrator has responsibility for oversight of valuation, including leading the cross-functional Valuation Committee (VC). The VC provides administration and oversight of the Fund’s valuation policies and procedures, which are approved annually by the Board. Among other things, these procedures allow the Fund to utilize independent pricing services, quotations from securities and financial instrument dealers, and other market sources to determine fair value.
Debt securities generally trade in the over-the-counter market rather than on a securities exchange. The Fund’s pricing services use multiple valuation techniques to determine fair value. In instances where sufficient market activity exists, the pricing services may utilize a market-based approach through which quotes from market makers are used to determine fair
value. In instances where sufficient market activity may not exist or is limited, the pricing services also utilize proprietary valuation models which may consider market characteristics such as benchmark yield curves, credit spreads, estimated default rates, anticipated market interest rate volatility, coupon rates, anticipated timing of principal repayments, underlying collateral, and other unique security features in order to estimate the relevant cash flows, which are then discounted to calculate the fair value.
Investments in repurchase agreements are valued at cost, which approximates fair value.
The Fund has procedures to determine the fair value of financial instruments for which market prices are not reliable or readily available. Under these procedures, the VC convenes on a regular basis to review such financial instruments and considers a number of factors, including significant unobservable valuation inputs, when arriving at fair value. The VC primarily employs a market-based approach which may use related or comparable assets or liabilities, recent transactions, market multiples, book values, and other relevant information for the investment to determine the fair value of the investment. An income-based valuation approach may also be used in which the anticipated future cash flows of the investment are discounted to calculate fair value. Discounts may also be applied due to the nature or duration of any restrictions on the disposition of the investments. Due to the inherent uncertainty of valuations of such investments, the fair values may differ significantly from the values that would have been used had an active market existed. The VC employs various methods for calibrating these valuation approaches including a regular review of key inputs and assumptions, transactional back-testing or disposition analysis, and reviews of any related market activity.
b. Joint Repurchase Agreement
The Fund enters into a joint repurchase agreement whereby its uninvested cash balance is deposited into a joint cash account with other funds managed by the investment manager or an affiliate of the investment manager and is used to invest in one or more repurchase agreements. The value and face amount of the joint repurchase agreement are allocated to the funds based on their pro-rata interest. A repurchase agreement is accounted for as a loan by the Fund to the seller, collateralized by securities which are delivered to the Fund’s custodian. The fair value, including accrued interest, of the initial collateralization is required to be at least 102% of the dollar amount invested by
| FUS-14 | Semiannual Report | |||
FRANKLIN TEMPLETON VARIABLE INSURANCE PRODUCTS TRUST
NOTES TO FINANCIAL STATEMENTS (UNAUDITED)
Franklin U.S. Government Securities VIP Fund (continued)
the funds, with the value of the underlying securities marked to market daily to maintain coverage of at least 100%. Repurchase agreements are subject to the terms of Master Repurchase Agreements (MRAs) with approved counterparties (sellers). The MRAs contain various provisions, including but not limited to events of default and maintenance of collateral for repurchase agreements. In the event of default by either the seller or the Fund, certain MRAs may permit the non-defaulting party to net and close-out all transactions, if any, traded under such agreements. The Fund may sell securities it holds as collateral and apply the proceeds towards the repurchase price and any other amounts owed by the seller to the Fund in the event of default by the seller. This could involve costs or delays in addition to a loss on the securities if their value falls below the repurchase price owed by the seller. The joint repurchase agreement held by the Fund at period end, as indicated in the Statement of Investments, had been entered into on June 29, 2018.
c. Mortgage Dollar Rolls
The Fund enters into mortgage dollar rolls, typically on a TBA basis. Mortgage dollar rolls are agreements between the Fund and a financial institution where the Fund sells (or buys) mortgage-backed securities for delivery on a specified date and simultaneously contracts to repurchase (or sell) substantially similar (same type, coupon, and maturity) securities at a future date and at a predetermined price. Gains or losses are realized on the initial sale, and the difference between the repurchase price and the sale price is recorded as an unrealized gain or loss to the Fund upon entering into the mortgage dollar roll. In addition, the Fund may invest the cash proceeds that are received from the initial sale. During the period between the sale and repurchase, the Fund is not entitled to principal and interest paid on the mortgage backed securities. Transactions in mortgage dollar rolls are accounted for as purchases and sales and may result in an increase to the Fund’s portfolio turnover rate. The risks of mortgage dollar roll transactions include the potential inability of the counterparty to fulfill its obligations.
d. Income Taxes
It is the Fund’s policy to qualify as a regulated investment company under the Internal Revenue Code. The Fund intends to distribute to shareholders substantially all of its taxable income and net realized gains to relieve it from federal income and if applicable, excise taxes. As a result, no provision for U.S. federal income taxes is required.
The Fund may recognize an income tax liability related to its uncertain tax positions under U.S. GAAP when the uncertain tax position has a less than 50% probability that it will be sustained upon examination by the tax authorities based on its technical merits. As of June 30, 2018, the Fund has determined that no tax liability is required in its financial statements related to uncertain tax positions for any open tax years (or expected to be taken in future tax years). Open tax years are those that remain subject to examination and are based on the statute of limitations in each jurisdiction in which the Fund invests.
e. Security Transactions, Investment Income, Expenses and Distributions
Security transactions are accounted for on trade date. Realized gains and losses on security transactions are determined on a specific identification basis. Interest income and estimated expenses are accrued daily. Amortization of premium and accretion of discount on debt securities are included in interest income. Paydown gains and losses are recorded separately in the Statement of Operations. Distributions to shareholders are recorded on the ex-dividend date. Distributable earnings are determined according to income tax regulations (tax basis) and may differ from earnings recorded in accordance with U.S. GAAP. These differences may be permanent or temporary. Permanent differences are reclassified among capital accounts to reflect their tax character. These reclassifications have no impact on net assets or the results of operations. Temporary differences are not reclassified, as they may reverse in subsequent periods.
Common expenses incurred by the Trust are allocated among the Funds based on the ratio of net assets of each Fund to the combined net assets of the Trust or based on the ratio of number of shareholders of each Fund to the combined number of shareholders of the Trust. Fund specific expenses are charged directly to the Fund that incurred the expense.
Realized and unrealized gains and losses and net investment income, excluding class specific expenses, are allocated daily to each class of shares based upon the relative proportion of net assets of each class. Differences in per share distributions by class are generally due to differences in class specific expenses.
Inflation-indexed bonds are adjusted for inflation through periodic increases or decreases in the security’s interest accruals, face amount, or principal redemption value, by amounts corresponding to the rate of inflation as measured by
| Semiannual Report | FUS-15 | |||||
FRANKLIN TEMPLETON VARIABLE INSURANCE PRODUCTS TRUST
NOTES TO FINANCIAL STATEMENTS (UNAUDITED)
Franklin U.S. Government Securities VIP Fund (continued)
1. Organization and Significant Accounting
Policies (continued)
e. Security Transactions, Investment Income, Expenses and Distributions (continued)
an index. Any increase or decrease in the face amount or principal redemption value will be included as interest income in the Statement of Operations.
f. Accounting Estimates
The preparation of financial statements in accordance with U.S. GAAP requires management to make estimates and assumptions that affect the reported amounts of assets and liabilities at the date of the financial statements and the amounts of income and expenses during the reporting period. Actual results could differ from those estimates.
g. Guarantees and Indemnifications
Under the Trust’s organizational documents, its officers and trustees are indemnified by the Trust against certain liabilities arising out of the performance of their duties to the Trust. Additionally, in the normal course of business, the Trust, on behalf of the Fund, enters into contracts with service providers that contain general indemnification clauses. The Trust’s maximum exposure under these arrangements is unknown as this would involve future claims that may be made against the Trust that have not yet occurred. Currently, the Trust expects the risk of loss to be remote.
2. Shares of Beneficial Interest
At June 30, 2018, there were an unlimited number of shares authorized (without par value). Transactions in the Fund’s shares were as follows:
Six Months Ended June 30, 2018 | Year Ended December 31, 2017 | |||||||||||||||||||
|
| |||||||||||||||||||
| Shares | Amount | Shares | Amount | |||||||||||||||||
| Class 1 Shares: | ||||||||||||||||||||
Shares sold | 79,910 | $ | 974,342 | 214,758 | $ | 2,678,926 | ||||||||||||||
Shares issued in reinvestment of distributions | 154,472 | 1,830,491 | 163,377 | 2,011,168 | ||||||||||||||||
Shares redeemed | (366,821 | ) | (4,464,728 | ) | (896,031 | ) | (11,145,574) | |||||||||||||
|
| |||||||||||||||||||
Net increase (decrease) | (132,439 | ) | $ | (1,659,895 | ) | (517,896 | ) | $ | (6,455,480) | |||||||||||
|
| |||||||||||||||||||
| Class 2 Shares: | ||||||||||||||||||||
Shares sold | 3,116,396 | $ | 37,136,911 | 7,795,899 | $ | 95,146,101 | ||||||||||||||
Shares issued in reinvestment of distributions | 2,734,408 | 31,691,784 | 2,748,760 | 33,122,555 | ||||||||||||||||
Shares redeemed | (7,388,399 | ) | (87,832,567 | ) | (12,993,385 | ) | (158,188,621) | |||||||||||||
|
| |||||||||||||||||||
Net increase (decrease) | (1,537,595 | ) | $ | (19,003,872 | ) | (2,448,726 | ) | $ | (29,919,965) | |||||||||||
|
| |||||||||||||||||||
3. Transactions with Affiliates
Franklin Resources, Inc. is the holding company for various subsidiaries that together are referred to as Franklin Templeton Investments. Certain officers and trustees of the Fund are also officers and/or directors of the following subsidiaries:
| Subsidiary | Affiliation | |
Franklin Advisers, Inc. (Advisers) | Investment manager | |
Franklin Templeton Services, LLC (FT Services) | Administrative manager | |
Franklin Templeton Distributors, Inc. (Distributors) | Principal underwriter | |
Franklin Templeton Investor Services, LLC (Investor Services) | Transfer agent |
| FUS-16 | Semiannual Report | |||
FRANKLIN TEMPLETON VARIABLE INSURANCE PRODUCTS TRUST
NOTES TO FINANCIAL STATEMENTS (UNAUDITED)
Franklin U.S. Government Securities VIP Fund (continued)
a. Management Fees
The Fund pays an investment management fee to Advisers based on the average daily net assets of the Fund as follows:
| Annualized Fee Rate | Net Assets | |
0.625% | Up to and including $100 million | |
0.500% | Over $100 million, up to and including $250 million | |
0.450% | Over $250 million, up to and including $7.5 billion | |
0.440% | Over $7.5 billion, up to and including $10 billion | |
0.430% | Over $10 billion, up to and including $12.5 billion | |
0.420% | Over $12.5 billion, up to and including $15 billion | |
0.400% | In excess of $15 billion |
For the period ended June 30, 2018, the annualized gross effective investment management fee rate was 0.470% of the Fund’s average daily net assets.
b. Administrative Fees
Under an agreement with Advisers, FT Services provides administrative services to the Fund. The fee is paid by Advisers based on the Fund’s average daily net assets, and is not an additional expense of the Fund.
c. Distribution Fees
The Board has adopted a distribution plan for Class 2 shares pursuant to Rule 12b-1 under the 1940 Act. Under the Fund’s compensation distribution plan, the Fund pays Distributors for costs incurred in connection with the servicing, sale and distribution of the Fund’s shares up to 0.35% per year of its average daily net assets. The Board has agreed to limit the current rate to 0.25% per year for Class 2. The plan year, for purposes of monitoring compliance with the maximum annual plan rate, is February 1 through January 31.
d. Transfer Agent Fees
Investor Services, under terms of an agreement, performs shareholder servicing for the Fund and is not paid by the Fund for the services.
4. Expense Offset Arrangement
The Fund has entered into an arrangement with its custodian whereby credits realized as a result of uninvested cash balances are used to reduce a portion of the Fund’s custodian expenses. During the period ended June 30, 2018, the custodian fees were reduced as noted in the Statement of Operations.
5. Income Taxes
For tax purposes, capital losses may be carried over to offset future capital gains. Capital loss carryforwards with no expiration, if any, must be fully utilized before those losses with expiration dates.
| Semiannual Report | FUS-17 | |||||
FRANKLIN TEMPLETON VARIABLE INSURANCE PRODUCTS TRUST
NOTES TO FINANCIAL STATEMENTS (UNAUDITED)
Franklin U.S. Government Securities VIP Fund (continued)
5. Income Taxes (continued)
At December 31, 2017, capital loss carryforwards were as follows:
Capital loss carryforwards subject to expiration: | ||||
2018 | $ | 426,637 | ||
Capital loss carryforwards not subject to expiration: | ||||
Short Term | 34,314,790 | |||
Long Term | 49,844,292 | |||
|
| |||
Total capital loss carryforwards | $ | 84,585,719 | ||
|
| |||
At June 30, 2018, the cost of investments and net unrealized appreciation (depreciation) for income tax purposes were as follows:
Cost of investments | $ | 1,244,873,669 | ||
|
| |||
Unrealized appreciation | $ | 5,263,511 | ||
Unrealized depreciation | (37,077,821) | |||
|
| |||
Net unrealized appreciation (depreciation) | $ | (31,814,310) | ||
|
| |||
Differences between income and/or capital gains as determined on a book basis and a tax basis are primarily due to differing treatments of paydown losses and bond discounts and premiums.
6. Investment Transactions
Purchases and sales of investments (excluding short term securities) for the period ended June 30, 2018, aggregated $229,265,403 and $268,157,896, respectively.
7. Credit Facility
The Fund, together with other U.S. registered and foreign investment funds (collectively, Borrowers), managed by Franklin Templeton Investments, are borrowers in a joint syndicated senior unsecured credit facility totaling $2 billion (Global Credit Facility) which matures on February 8, 2019. This Global Credit Facility provides a source of funds to the Borrowers for temporary and emergency purposes, including the ability to meet future unanticipated or unusually large redemption requests.
Under the terms of the Global Credit Facility, the Fund shall, in addition to interest charged on any borrowings made by the Fund and other costs incurred by the Fund, pay its share of fees and expenses incurred in connection with the implementation and maintenance of the Global Credit Facility, based upon its relative share of the aggregate net assets of all of the Borrowers, including an annual commitment fee of 0.15% based upon the unused portion of the Global Credit Facility. These fees are reflected in other expenses in the Statement of Operations. During the period ended June 30, 2018, the Fund did not use the Global Credit Facility.
8. Fair Value Measurements
The Fund follows a fair value hierarchy that distinguishes between market data obtained from independent sources (observable inputs) and the Fund’s own market assumptions (unobservable inputs). These inputs are used in determining the value of the Fund’s financial instruments and are summarized in the following fair value hierarchy:
| • | Level 1 – quoted prices in active markets for identical financial instruments |
| • | Level 2 – other significant observable inputs (including quoted prices for similar financial instruments, interest rates, prepayment speed, credit risk, etc.) |
FUS-18 | Semiannual Report | |||
FRANKLIN TEMPLETON VARIABLE INSURANCE PRODUCTS TRUST
NOTES TO FINANCIAL STATEMENTS (UNAUDITED)
Franklin U.S. Government Securities VIP Fund (continued)
| • | Level 3 – significant unobservable inputs (including the Fund’s own assumptions in determining the fair value of financial instruments) |
The input levels are not necessarily an indication of the risk or liquidity associated with financial instruments at that level.
For movements between the levels within the fair value hierarchy, the Fund has adopted a policy of recognizing the transfers as of the date of the underlying event which caused the movement.
At June 30, 2018, all of the Fund’s investments in financial instruments carried at fair value were valued using Level 2 inputs.
9. Subsequent Events
The Fund has evaluated subsequent events through the issuance of the financial statements and determined that no events have occurred that require disclosure.
| Abbreviations | ||||||
| Currency | Selected Portfolio | |||||
| ||||||
USD United States Dollar | CMT | Constant Maturity Treasury Index | ||||
| COF | Cost of Funds | |||||
| FHLB | Federal Home Loan Bank | |||||
| FICO | Financing Corp. | |||||
| LIBOR | London InterBank Offered Rate | |||||
| MBS | Mortgage-Backed Security | |||||
| PC | Participation Certificate | |||||
| PL | Project Loan | |||||
| SBA | Small Business Administration | |||||
| SF | Single Family | |||||
| T-Note | Treasury Note | |||||
| TVA | Tennessee Valley Authority | |||||
| . Semiannual Report | FUS-19 | |||||
This page intentionally left blank.
Franklin VolSmart Allocation VIP Fund
This semiannual report for Franklin VolSmart Allocation VIP Fund covers the period ended June 30, 2018.
Class 2 Performance Summary as of June 30, 2018
The Fund’s Class 2 Shares had a -1.69% total return* for the six-month period ended June 30, 2018.
*The Fund has an expense reduction contractually guaranteed through 4/30/19. Fund investment results reflect the expense reduction; without this reduction, the results would have been lower.
Performance reflects the Fund’s Class 2 operating expenses, but does not include any contract fees, expenses or sales charges. If they had been included, performance would be lower. These charges and deductions, particularly for variable life policies, can have a significant effect on contract values and insurance benefits. See the contract prospectus for a complete description of these expenses, including sales charges.
Performance data represent past performance, which does not guarantee future results. Investment return and principal value will fluctuate, and you may have a gain or loss when you sell your shares. Current performance may differ from figures shown.
| Semiannual Report | FVA-1 | |||||
FRANKLIN VOLSMART ALLOCATION VIP FUND
Fund Goal and Main Investments
The Fund seeks total return (including income and capital gains) while seeking to manage volatility. The Fund is structured as a limited “fund-of-funds” that seeks to achieve its investment goal by investing its assets partially in other mutual funds, which include other Franklin Templeton mutual funds as well as Franklin Templeton and third-party exchange-traded funds (ETFs) (underlying funds). Each underlying fund is allocated to the equity, fixed income, multi-class or cash asset class based on its predominant asset class and strategies. These underlying funds, in turn, invest in a variety of US and foreign equity, fixed-income and money market securities. The Fund also obtains exposure to certain strategies and investments in its core portfolio by directly investing in the securities and instruments in that strategy.
Fund Risks
All investments involve risks, including possible loss of principal. There can be no guarantee that the Fund will stay within its target volatility. Also, the managed volatility and tail risk protection strategies could negatively impact the Fund’s return and expose the Fund to additional costs. Generally, investors should be comfortable with fluctuation in the value of their investments, especially over the short term. Stock prices fluctuate, sometimes rapidly and dramatically, due to factors affecting individual companies, particular industries or sectors, or general market conditions. Bond prices generally move in the opposite direction of interest rates. Changes in the financial strength of a bond issuer or in a bond’s credit rating may affect its value. Derivatives involve costs and can create economic leverage in the portfolio, which may result in significant volatility and cause the Fund to participate in losses (as well as gains) in an amount that exceeds the Fund’s initial investment. The Fund may not achieve the anticipated benefits, and may realize losses when a counterparty fails to perform. Because the Fund allocates assets to a variety of investment strategies, ETFs and other mutual funds, which involve certain risks, it may be subject to those same risks. The Fund is actively managed but there is no guarantee that the manager’s investment decisions will produce the desired results. The Fund’s prospectus also includes a description of the main investment risks.
Performance Overview
You can find the Fund’s six-month total return in the Performance Summary. For comparison, the Fund’s benchmarks, the Standard & Poor’s® 500 Index (S&P 500®) and the Bloomberg Barclays US Aggregate Bond Index, posted +2.65% and -1.62% total returns, respectively, for the period under review.1 The Fund’s blended benchmark, a combination of leading stock and bond indexes that better reflects the asset allocation of the Fund’s portfolio, returned +1.29% for the same period.2
Economic and Market Overview
The US economy continued to grow during the six months under review. After moderating for three consecutive quarters, the economy grew faster in 2018’s second quarter, driven by consumer spending, exports, business investment and government spending. The manufacturing and services sectors expanded during the period. The unemployment rate declined slightly from 4.1% in December 2017, as reported at the beginning of the six-month period, to 4.0% at period-end.3 Annual inflation, as measured by the Consumer Price Index, increased from 2.1% in December 2017, as reported at the beginning of the period, to 2.9% at period-end.3
In February 2018, the new US Federal Reserve (Fed) Chair Jerome Powell spoke before Congress for the first time and indicated the Fed saw signs of a continued strong labor market and economic growth. He reiterated the Fed’s intention to gradually raise interest rates in an effort to keep the economy from overheating and as inflation increases toward the Fed’s target. However, he noted there was no evidence of the economy overheating and he had yet to see a clear upward move in wages. The Fed raised its target range for the federal funds rate 0.25% each at its March and June 2018 meetings to 1.75%–2.00% and continued reducing its balance sheet as part of its ongoing plan to normalize monetary policy. In June, the Fed upgraded its economic forecast for 2018 and its inflation forecasts for 2018 and 2019. Furthermore, the Fed forecasted an additional rate hike for 2018 and 2019 than previously anticipated.
1. Source: Morningstar.
2. The Fund’s blended benchmark was calculated internally and rebalanced monthly and was composed of 60% S&P 500, 30% Bloomberg Barclays US Aggregate Bond Index and 10% Bloomberg Barclays 1-3 Month US Treasury Bill Index.
One cannot invest directly in an index, and an index is not representative of the Fund’s portfolio. Please see Index Descriptions following the Fund Summaries.
3. Source: Bureau of Labor Statistics.
The dollar value, number of shares or principal amount, and names of all portfolio holdings are listed in the Fund’s Statement of Investments (SOI).
| FVA-2 | Semiannual Report | |||
FRANKLIN VOLSMART ALLOCATION VIP FUND
US equity markets rose overall during the period, benefiting from mostly upbeat economic data and better US corporate earnings. At certain points during the period, markets were also supported by the expectations of gradual rate increases. After reaching new all-time highs in January 2018, US stocks declined in February amid concerns that strong economic growth and rising inflation would lead the Fed to increase its target rate faster than expected. In March, markets were pressured further by a broad sell-off in information technology (IT) stocks due to a potential for tighter regulation in the sector arising from concerns about consumer data privacy. Other factors that curbed investor sentiment included tensions between the US and North Korea, political uncertainties in the US, the Trump administration’s protectionist policies and escalating trade tensions between the US and China. An overall easing of tensions in the Korean peninsula and intermittent US-China trade negotiations partially offset some of these concerns. However, US trade disputes with its allies and China near period-end dampened investor sentiment. In this environment, the broad US stock market, as measured by the S&P 500, generated a +2.65% total return for the period.1
The 10-year Treasury yield, which moves inversely to its price, increased during the period. The yield rose to multi-year highs in February, April and May amid indications of higher inflation. However, some factors weighed on the Treasury yield at certain points during the period, including concerns about political turmoil in Italy, political uncertainties in the US, the Trump administration’s protectionist trade policies, and US trade disputes between its allies and China. Overall, the 10-year Treasury yield rose from 2.40% at the beginning of the period to 2.85% at period-end.
Investment Strategy
Under normal market conditions, the Fund seeks to achieve its investment goal by allocating its assets across certain asset classes, sectors and strategies in an attempt to produce a diversified portfolio that will generate returns, while minimizing the expected volatility of the Fund’s returns so that volatility does not exceed a target of 10% per year. (Volatility within the 10% target is referred to as “Target Volatility.”) The Fund’s assets are primarily invested in its “core portfolio,” which is principally composed of various US equity and fixed income investments and strategies, including other mutual funds that provide exposure to such investments and strategies.
In addition, the Fund employs a volatility management strategy, which is designed to manage the expected volatility of the Fund’s returns so that volatility remains within the Fund’s Target Volatility. Thus, the Fund may utilize certain derivative
Portfolio Composition*
6/30/18
| % of Total Net Assets | ||||
| Stocks | 51.0% | |||
| Capital Goods | 10.3% | |||
| Health Care Equipment & Services | 7.4% | |||
| Materials | 5.9% | |||
| Software & Services | 5.3% | |||
| Energy | 3.8% | |||
| Semiconductors & Semiconductor Equipment | 3.3% | |||
| Retailing | 2.5% | |||
| Food, Beverage & Tobacco | 2.3% | |||
| Pharmaceuticals, Biotechnology & Life Sciences | 2.2% | |||
| Household & Personal Products | 1.4% | |||
| Consumer Services | 1.1% | |||
| Commercial & Professional Services | 1.1% | |||
| Food & Staples Retailing | 1.1% | |||
| Consumer Durables & Apparel | 1.0% | |||
| Insurance | 0.8% | |||
| Media | 0.7% | |||
| Transportation | 0.6% | |||
| Diversified Financials | 0.2% | |||
| Underlying Funds – Equity | 20.5% | |||
| Franklin DynaTech Fund – Class R6 | 11.1% | |||
| Franklin Income Fund – Class R6 | 5.1% | |||
| iShares Core MSCI EAFE ETF | 4.3% | |||
| Underlying Funds - Fixed Income | 26.2% | |||
| Franklin Low Duration Total Return Fund – Class R6 | 12.1% | |||
| Franklin Strategic Income Fund – Class R6 | 9.9% | |||
| Franklin Income Fund – Class R6 | 4.2% | |||
| Hedge Strategy | 0.8% | |||
| Short-Term Investments & Other Net Assets | 1.5% | |||
*Figures are stated as a percentage of total and may not equal 100% or may be negative due to rounding, use of any derivatives, unsettled trades or other factors. The breakdown may not match the SOI.
instruments (primarily futures contracts on indexes) in an effort to adjust the Fund’s expected volatility to within the Target Volatility. There is no guarantee that the Fund will stay within its Target Volatility. The Fund also employs a “tail risk protection strategy,” designed to protect the Fund from risks related to extreme short-term market downturns (tail risk). Thus, the Fund may utilize certain derivatives (primarily total return swap agreements) in an effort to hedge the tail risk of the Fund. There is no guarantee that the Fund’s volatility management or tail risk protection strategies will be successful.
| Semiannual Report | FVA-3 | |||||
FRANKLIN VOLSMART ALLOCATION VIP FUND
What is a futures contract? |
A futures contract is an agreement between the Fund and a counterparty made through a US or foreign futures exchange to buy or sell an underlying instrument or asset at a specific price on a future date.
|
What is a total return swap agreement? |
A swap agreement, such as an equity total return swap, is a contract between the Fund and a counterparty to exchange on a future date the returns, or differentials in rates of return, that would have been earned or realized if a notional amount were invested in specific instruments.
|
Manager’s Discussion
At the top-down asset allocation level, equities remained near the high end of their allowable allocation range, while fixed income is toward the lower end of its allocation range. The Fund held nominal exposure to cash and portfolio hedges.
Equities
The Fund had an overweighting in equity relative to its blended benchmark index, and this strengthened relative returns for the six-month period. Earnings growth has continued to support global equities, with US-based companies leading the way. We viewed recent US earnings expansion and rising profit margins as providing an appealing backdrop for maintaining an overweighted position in US equities. In addition, the Fund also held a small position in non-US developed market equities, which detracted from performance as leadership and trade concerns weighed on European exchanges for part of the period.
With regards to underlying stock funds, US growth strategies generally outperformed their value peers for the review period. Hindering results relative to the underlying equity benchmark, the S&P 500, were the value-oriented Franklin Rising Dividends Strategy and the equity component of Franklin Income Fund. In contrast, Franklin DynaTech Fund was a meaningful contributor, with growth-oriented IT and select health care sector positions supporting performance.
Fixed Income
The Fund had an underweighting in fixed income relative to its blended benchmark index, and this strengthened relative results. Our cautious view of the asset class reflected what we believe were signs that the credit cycle may be further along than previously thought as US interest rates rose during the period.
Portfolio Strategy Holdings*
6/30/18
| % of Total Net Assets | ||||
| Franklin Rising Dividends Strategy | 51.0% | |||
| Franklin Low Duration Total Return Fund | 12.1% | |||
| Franklin DynaTech Fund | 11.1% | |||
| Franklin Strategic Income Fund | 9.9% | |||
| Franklin Income Fund | 9.3% | |||
| iShares Core MSCI EAFE ETF | 4.3% | |||
| Hedge Strategy | 0.8% | |||
| Short-Term Investments & Other Net Assets | 1.5% | |||
*The breakdown may not match the SOI.
The Fund’s fixed income component performed better than its benchmark index, the Bloomberg Barclays US Aggregate Bond Index. All three underlying bond funds benefited relative returns—Franklin Low Duration Total Return Fund, the fixed income component of Franklin Income Fund and Franklin Strategic Income Fund.
The fixed income allocation had shorter duration relative to its benchmark index and was a positive performance contributor. Issue selection was a key driver of relative performance, particularly in the high-yield and investment-grade corporate bond sectors. In aggregate, the Fund’s high-yield bond component delivered positive results. Within the investment-grade bond sector, the Fund benefited from careful issue selection in what was generally a negative environment for the sector.
Hedging
The Fund’s tactical hedging comprised two strategies that were active during the six-month review period, most notably in February and March. The Fund held a hedge linked to a market volatility index (VIX) with a lower notional exposure at period-end than at the start of the period. This VIX-linked hedge is designed to provide tail risk protection during periods of increased market volatility and drawdowns. Although the hedge helped dampen portfolio volatility, it negatively impacted performance when the equity market quickly reversed course following the short-lived February correction.
The Fund also held an independent volatility management strategy (implemented using S&P futures), designed to keep overall volatility below 10%. This volatility management strategy was also active for part of the period. Although the hedging strategy detracted from relative performance, it performed its role of reducing overall portfolio volatility.
| FVA-4 | Semiannual Report | |||
FRANKLIN VOLSMART ALLOCATION VIP FUND
Thank you for your participation in Franklin VolSmart Allocation VIP Fund. We look forward to serving your future investment needs.
The foregoing information reflects our analysis, opinions and portfolio holdings as of June 30, 2018, the end of the reporting period. The way we implement our main investment strategies and the resulting portfolio holdings may change depending on factors such as market and economic conditions. These opinions may not be relied upon as investment advice or an offer for a particular security. The information is not a complete analysis of every aspect of any market, country, industry, security or the Fund. Statements of fact are from sources considered reliable, but the investment manager makes no representation or warranty as to their completeness or accuracy. Although historical performance is no guarantee of future results, these insights may help you understand our investment management philosophy.
| Semiannual Report | FVA-5 | |||||
FRANKLIN VOLSMART ALLOCATION VIP FUND
Class 2 Fund Expenses
As an investor in a variable insurance contract (Contract) that indirectly provides for investment in an underlying mutual fund, you can incur transaction and/or ongoing expenses at both the Fund level and the Contract Level: (1) transaction expenses can include sales charges (loads) on purchases, surrender fees, transfer fees and premium taxes; and (2) ongoing expenses can include management fees, distribution and service (12b-1) fees, contract fees, annual maintenance fees, mortality and expense risk fees and other fees and expenses. All mutual funds and Contracts have some types of ongoing expenses. The table below shows Fund-level ongoing expenses and can help you understand these costs and compare them with those of other mutual funds offered through the Contract. The table assumes a $1,000 investment held for the six months indicated. Please refer to the Fund prospectus for additional information on operating expenses.
Actual Fund Expenses
The table below provides information about the actual account values and actual expenses in the columns under the heading “Actual.” In these columns the Fund’s actual return, which includes the effect of ongoing Fund expenses but does not include the effect of ongoing Contract expenses, is used to calculate the “Ending Account Value.” You can estimate the Fund-level expenses you paid during the period by following these steps (of course, your account value and expenses will differ from those in this illustration): Divide your account value by $1,000 (if your account had an $8,600 value, then $8,600 ÷ $1,000 = 8.6). Then multiply the result by the number under the headings “Actual” and “Fund-Level Expenses Paid During Period” (if Fund-Level Expenses Paid During Period were $ 7.50, then 8.6 x $7.50 = $64.50). In this illustration, the estimated expenses paid this period at the Fund level are $64.50.
Hypothetical Example for Comparison with Other Mutual Funds
Under the heading “Hypothetical” in the table, information is provided about hypothetical account values and hypothetical expenses based on the Fund’s actual expense ratio and an assumed rate of return of 5% per year before expenses, which is not the Fund’s actual return. This information may not be used to estimate the actual ending account balance or expenses you paid for the period, but it can help you compare ongoing costs of investing in the Fund with those of other mutual funds offered through the Contract. To do so, compare this 5% hypothetical example with the 5% hypothetical examples that appear in the shareholder reports of other funds offered through the Contract.
Please note that expenses shown in the table are meant to highlight ongoing costs at the Fund level only and do not reflect any ongoing expenses at the Contract level, or transaction expenses at either the Fund or Contract levels. In addition, while the Fund does not have transaction expenses, if the transaction and ongoing expenses at the Contract level were included, the expenses shown below would be higher. You should consult your Contract prospectus or disclosure document for more information.
| Actual (actual return after expenses) | Hypothetical (5% annual return before expenses) | |||||||||||
Share Class | Beginning Account Value 1/1/18 | Ending Account Value 6/30/18 | Fund-Level Paid During | Ending Account Value 6/30/18 | Fund-Level Expenses Paid During Period 1/1/18–6/30/181,2 | Net Annualized Expense Ratio2 | ||||||
|
|
|
| |||||||||
Class 2 | $1,000 | $983.10 | $3.69 | $1,021.08 | $3.76 | 0.75% | ||||||
1. Expenses are equal to the annualized expense ratio for the six-month period as indicated above—in the far right column—multiplied by the simple average account value over the period indicated, and then multiplied by 181/365 to reflect the one-half year period.
2. Reflects expenses after fee waivers and expense reimbursements. Does not include any ongoing expenses of the Contract for which the Fund is an investment option or acquired fund fees and expenses.
| FVA-6 | Semiannual Report | |||
FRANKLIN TEMPLETON VARIABLE INSURANCE PRODUCTS TRUST
Financial Highlights
Franklin VolSmart Allocation VIP Fund
Six Months Ended June 30, 2018 (unaudited) | Year Ended December 31, | |||||||||||||||||||||||
| 2017 | 2016 | 2015 | 2014 | 2013a | ||||||||||||||||||||
| Class 2 |
| |||||||||||||||||||||||
| Per share operating performance (for a share outstanding throughout the period) | ||||||||||||||||||||||||
| Net asset value, beginning of period | $11.67 | $10.10 | $ 9.68 | $10.20 | $10.07 | $10.00 | ||||||||||||||||||
|
| |||||||||||||||||||||||
| Income from investment operationsb: | ||||||||||||||||||||||||
Net investment incomec,d | 0.10 | 0.16 | 0.16 | 0.10 | 0.11 | 0.09 | ||||||||||||||||||
Net realized and unrealized gains (losses) | (0.30 | ) | 1.41 | 0.28 | (0.42 | ) | 0.25 | 0.17 | ||||||||||||||||
|
| |||||||||||||||||||||||
Total from investment operations | (0.20 | ) | 1.57 | 0.44 | (0.32 | ) | 0.36 | 0.26 | ||||||||||||||||
|
| |||||||||||||||||||||||
Less distributions from: | ||||||||||||||||||||||||
Net investment income and net foreign currency gains. | (0.04 | ) | — | (— | )e | (0.05 | ) | (0.23 | ) | (0.19 | ) | |||||||||||||
Net realized gains | — | — | (0.02 | ) | (0.15 | ) | (— | )e | — | |||||||||||||||
|
| |||||||||||||||||||||||
Total distributions | (0.04 | ) | — | (0.02 | ) | (0.20 | ) | (0.23 | ) | (0.19) | ||||||||||||||
|
| |||||||||||||||||||||||
Net asset value, end of period | $11.43 | $11.67 | $10.10 | $ 9.68 | $10.20 | $10.07 | ||||||||||||||||||
|
| |||||||||||||||||||||||
Total returnf | (1.69)% | 15.54% | 4.39% | (3.12)% | 3.60% | 2.56% | ||||||||||||||||||
| Ratios to average net assetsg | ||||||||||||||||||||||||
Expenses before waiver and payments by affiliatesh | 1.11% | 1.14% | 1.25% | 1.77% | 1.97% | 2.97% | ||||||||||||||||||
Expenses net of waiver and payments by affiliatesh | 0.75%i | 0.73%i | 0.73%i | 0.93% | 1.08%i | 1.08%i | ||||||||||||||||||
Net investment incomed | 1.74% | 1.44% | 1.50% | 1.30% | 1.07% | 1.21% | ||||||||||||||||||
| Supplemental data | ||||||||||||||||||||||||
Net assets, end of period (000’s) | $35 | $36 | $31 | $8,703 | $10,201 | $10,065 | ||||||||||||||||||
Portfolio turnover rate | 1.38% | 5.69% | 1.00% | 95.15% | 22.04% | 8.12% | ||||||||||||||||||
aFor the period April 1, 2013 (commencement of operations) to December 31, 2013.
bThe amount shown for a share outstanding throughout the period may not correlate with the Statement of Operations for the period due to the timing of sales and repurchases of the Fund’s shares in relation to income earned and/or fluctuating fair value of the investments of the Fund.
cBased on average daily shares outstanding.
dRecognition of net investment income by the Fund is affected by the timing of declaration of dividends by the Underlying Funds and exchange traded funds in which the Fund invests.
eAmount rounds to less than $0.01 per share.
fTotal return does not include fees, charges or expenses imposed by the variable annuity and life insurance contracts for which Franklin Templeton Variable Insurance Products Trust serves as an underlying investment vehicle. Total return is not annualized for periods less than one year.
gRatios are annualized for periods less than one year.
hDoes not include expenses of the Underlying Funds and exchange traded funds in which the Fund invests. The weighted average indirect expenses of the Underlying Funds and exchange traded funds was 0.38% for the period ended June 30, 2018.
iBenefit of expense reduction rounds to less than 0.01%.
| The accompanying notes are an integral part of these financial statements. | Semiannual Report | FVA-7 | |||||
FRANKLIN TEMPLETON VARIABLE INSURANCE PRODUCTS TRUST
FINANCIAL HIGHLIGHTS
Franklin VolSmart Allocation VIP Fund (continued)
Six Months Ended June 30, 2018 (unaudited) | Year Ended December 31, | |||||||||||||||||||||||
| 2017 | 2016 | 2015 | 2014 | 2013a | ||||||||||||||||||||
| ||||||||||||||||||||||||
| Class 5 | ||||||||||||||||||||||||
| Per share operating performance (for a share outstanding throughout the period) | ||||||||||||||||||||||||
Net asset value, beginning of period | $11.65 | $10.07 | $ 9.67 | $10.20 | $10.07 | $10.00 | ||||||||||||||||||
|
| |||||||||||||||||||||||
| Income from investment operationsb: | ||||||||||||||||||||||||
Net investment incomec,d | 0.10 | 0.17 | 0.16 | 0.16 | 0.13 | 0.10 | ||||||||||||||||||
Net realized and unrealized gains (losses) | (0.29 | ) | 1.41 | 0.29 | (0.47 | ) | 0.25 | 0.17 | ||||||||||||||||
|
| |||||||||||||||||||||||
Total from investment operations | (0.19 | ) | 1.58 | 0.45 | (0.31 | ) | 0.38 | 0.27 | ||||||||||||||||
|
| |||||||||||||||||||||||
Less distributions from: | ||||||||||||||||||||||||
Net investment income and net foreign currency gains. | (0.06 | ) | — | (0.03 | ) | (0.07 | ) | (0.25 | ) | (0.20) | ||||||||||||||
Net realized gains | — | — | (0.02 | ) | (0.15 | ) | (— | )e | — | |||||||||||||||
|
| |||||||||||||||||||||||
Total distributions | (0.06) | — | (0.05) | (0.22) | (0.25) | (0.20) | ||||||||||||||||||
|
| |||||||||||||||||||||||
Net asset value, end of period | $11.40 | $11.65 | $10.07 | $ 9.67 | $10.20 | $10.07 | ||||||||||||||||||
|
| |||||||||||||||||||||||
Total returnf | (1.67)% | 15.69% | 4.59% | (3.10)% | 3.75% | 2.68% | ||||||||||||||||||
| Ratios to average net assetsg | ||||||||||||||||||||||||
Expenses before waiver and payments by affiliatesh | 1.01% | 1.04% | 1.15% | 1.66% | 1.82% | 2.82% | ||||||||||||||||||
Expenses net of waiver and payments by affiliatesh | 0.65%i | 0.63%i | 0.63%i | 0.82% | 0.93%i | 0.93%i | ||||||||||||||||||
Net investment incomed | 1.84% | 1.54% | 1.60% | 1.41% | 1.22% | 1.36% | ||||||||||||||||||
Supplemental data | ||||||||||||||||||||||||
Net assets, end of period (000’s) | $188,929 | $188,240 | $124,581 | $54,816 | $10,201 | $10,065 | ||||||||||||||||||
Portfolio turnover rate | 1.38% | 5.69% | 1.00% | 95.15% | 22.04% | 8.12% | ||||||||||||||||||
aFor the period April 1, 2013 (commencement of operations) to December 31, 2013.
bThe amount shown for a share outstanding throughout the period may not correlate with the Statement of Operations for the period due to the timing of sales and repurchases of the Fund’s shares in relation to income earned and/or fluctuating fair value of the investments of the Fund.
cBased on average daily shares outstanding.
dRecognition of net investment income by the Fund is affected by the timing of declaration of dividends by the Underlying Funds and exchange traded funds in which the Fund invests.
eAmount rounds to less than $0.01 per share.
fTotal return does not include fees, charges or expenses imposed by the variable annuity and life insurance contracts for which Franklin Templeton Variable Insurance Products Trust serves as an underlying investment vehicle. Total return is not annualized for periods less than one year.
gRatios are annualized for periods less than one year.
hDoes not include expenses of the Underlying Funds and exchange traded funds in which the Fund invests. The weighted average indirect expenses of the Underlying Funds and exchange traded funds was 0.38% for the period ended June 30, 2018.
iBenefit of expense reduction rounds to less than 0.01%.
| FVA-8 | Semiannual Report | The accompanying notes are an integral part of these financial statements. | |||
FRANKLIN TEMPLETON VARIABLE INSURANCE PRODUCTS TRUST
Statement of Investments, June 30, 2018 (unaudited)
Franklin VolSmart Allocation VIP Fund
| Shares | Value | |||||||
Common Stocks 51.0% | ||||||||
Capital Goods 10.3% | ||||||||
Carlisle Cos. Inc. | 7,460 | $ | 807,993 | |||||
Donaldson Co. Inc. | 13,830 | 624,010 | ||||||
Dover Corp. | 25,900 | 1,895,880 | ||||||
General Dynamics Corp. | 11,100 | 2,069,151 | ||||||
Honeywell International Inc. | 22,400 | 3,226,720 | ||||||
Johnson Controls International PLC | 40,092 | 1,341,077 | ||||||
a nVent Electric PLC (United Kingdom) | 27,100 | 680,210 | ||||||
Pentair PLC (United Kingdom) | 27,100 | 1,140,368 | ||||||
Roper Technologies Inc. | 17,300 | 4,773,243 | ||||||
United Technologies Corp. | 15,900 | 1,987,977 | ||||||
W.W. Grainger Inc. | 2,750 | 848,100 | ||||||
|
| |||||||
| 19,394,729 | ||||||||
|
| |||||||
Commercial & Professional Services 1.1% | ||||||||
Cintas Corp. | 7,700 | 1,425,039 | ||||||
Matthews International Corp., A | 11,870 | 697,956 | ||||||
|
| |||||||
| 2,122,995 | ||||||||
|
| |||||||
Consumer Durables & Apparel 1.0% | ||||||||
NIKE Inc., B | 24,400 | 1,944,192 | ||||||
|
| |||||||
Consumer Services 1.1% | ||||||||
McDonald’s Corp. | 9,980 | 1,563,766 | ||||||
Yum! Brands Inc. | 7,700 | 602,294 | ||||||
|
| |||||||
| 2,166,060 | ||||||||
|
| |||||||
Diversified Financials 0.2% | ||||||||
State Street Corp. | 3,750 | 349,087 | ||||||
|
| |||||||
Energy 3.8% | ||||||||
a Apergy Corp. | 12,950 | 540,662 | ||||||
Chevron Corp. | 10,590 | 1,338,894 | ||||||
EOG Resources Inc. | 10,030 | 1,248,033 | ||||||
Exxon Mobil Corp. | 14,800 | 1,224,404 | ||||||
Occidental Petroleum Corp. | 16,600 | 1,389,088 | ||||||
Schlumberger Ltd. | 21,300 | 1,427,739 | ||||||
|
| |||||||
| 7,168,820 | ||||||||
|
| |||||||
Food & Staples Retailing 1.1% | ||||||||
Walgreens Boots Alliance Inc. | 14,300 | 858,215 | ||||||
Walmart Inc. | 13,390 | 1,146,853 | ||||||
|
| |||||||
| 2,005,068 | ||||||||
|
| |||||||
Food, Beverage & Tobacco 2.3% | ||||||||
Bunge Ltd. | 19,100 | 1,331,461 | ||||||
McCormick & Co. Inc. | 12,050 | 1,398,884 | ||||||
PepsiCo Inc. | 14,300 | 1,556,841 | ||||||
|
| |||||||
| 4,287,186 | ||||||||
|
| |||||||
Health Care Equipment & Services 7.4% | ||||||||
Abbott Laboratories | 27,960 | 1,705,280 | ||||||
Becton, Dickinson and Co. | 15,000 | 3,593,400 | ||||||
CVS Health Corp. | 12,550 | 807,593 | ||||||
DENTSPLY SIRONA Inc. | 13,000 | 569,010 | ||||||
Medtronic PLC | 30,500 | 2,611,105 | ||||||
Stryker Corp. | 19,600 | 3,309,656 | ||||||
| Semiannual Report | FVA-9 | |||||
FRANKLIN TEMPLETON VARIABLE INSURANCE PRODUCTS TRUST
STATEMENT OF INVESTMENTS (UNAUDITED)
Franklin VolSmart Allocation VIP Fund (continued)
| Shares | Value | |||||||
Common Stocks (continued) | ||||||||
Health Care Equipment & Services (continued) | ||||||||
West Pharmaceutical Services Inc. | 14,900 | $ | 1,479,421 | |||||
|
| |||||||
| 14,075,465 | ||||||||
|
| |||||||
Household & Personal Products 1.4% | ||||||||
Colgate-Palmolive Co. | 20,200 | 1,309,162 | ||||||
The Procter & Gamble Co. | 16,280 | 1,270,817 | ||||||
|
| |||||||
| 2,579,979 | ||||||||
|
| |||||||
Insurance 0.8% | ||||||||
Aflac Inc. | 18,240 | 784,685 | ||||||
Chubb Ltd. | 3,981 | 505,667 | ||||||
Erie Indemnity Co., A | 2,720 | 318,947 | ||||||
|
| |||||||
| 1,609,299 | ||||||||
|
| |||||||
Materials 5.9% | ||||||||
Air Products and Chemicals Inc. | 17,100 | 2,662,983 | ||||||
Albemarle Corp. | 38,100 | 3,593,973 | ||||||
Ecolab Inc. | 7,660 | 1,074,928 | ||||||
Nucor Corp. | 12,200 | 762,500 | ||||||
Praxair Inc. | 18,800 | 2,973,220 | ||||||
|
| |||||||
| 11,067,604 | ||||||||
|
| |||||||
Media 0.7% | ||||||||
Comcast Corp., A | 24,400 | 800,564 | ||||||
John Wiley & Sons Inc., A | 7,600 | 474,240 | ||||||
|
| |||||||
| 1,274,804 | ||||||||
|
| |||||||
Pharmaceuticals, Biotechnology & Life Sciences 2.2% | ||||||||
AbbVie Inc. | 9,040 | 837,556 | ||||||
Johnson & Johnson | 17,000 | 2,062,780 | ||||||
Perrigo Co. PLC | 7,640 | 557,032 | ||||||
Pfizer Inc. | 13,410 | 486,515 | ||||||
Roche Holding AG, ADR (Switzerland) | 7,500 | 207,225 | ||||||
|
| |||||||
| 4,151,108 | ||||||||
|
| |||||||
Retailing 2.5% | ||||||||
The Gap Inc. | 15,720 | 509,171 | ||||||
Ross Stores Inc. | 22,600 | 1,915,350 | ||||||
Target Corp. | 10,840 | 825,141 | ||||||
Tiffany & Co. | 11,100 | 1,460,760 | ||||||
|
| |||||||
| 4,710,422 | ||||||||
|
| |||||||
Semiconductors & Semiconductor Equipment 3.3% | ||||||||
Analog Devices Inc. | 29,914 | 2,869,351 | ||||||
Texas Instruments Inc. | 29,500 | 3,252,375 | ||||||
Versum Materials Inc. | 5,495 | 204,139 | ||||||
|
| |||||||
| 6,325,865 | ||||||||
|
| |||||||
Software & Services 5.3% | ||||||||
Accenture PLC, A | 21,100 | 3,451,749 | ||||||
Microsoft Corp. | 52,300 | 5,157,303 | ||||||
Visa Inc., A | 11,200 | 1,483,440 | ||||||
|
| |||||||
| 10,092,492 | ||||||||
|
| |||||||
| FVA-10 | Semiannual Report | |||
FRANKLIN TEMPLETON VARIABLE INSURANCE PRODUCTS TRUST
STATEMENT OF INVESTMENTS (UNAUDITED)
Franklin VolSmart Allocation VIP Fund (continued)
| Shares | Value | |||||||
Common Stocks (continued) | ||||||||
Transportation 0.6% | ||||||||
United Parcel Service Inc., B | 10,300 | $ | 1,094,169 | |||||
|
| |||||||
Total Common Stocks (Cost $77,290,896) | 96,419,344 | |||||||
|
| |||||||
Investments in Underlying Funds and Exchange Traded Funds 46.7% | ||||||||
Domestic Equity 11.1% | ||||||||
a,b Franklin DynaTech Fund, Class R6 | 269,702 | 20,880,350 | ||||||
|
| |||||||
Domestic Fixed Income 22.0% | ||||||||
b Franklin Low Duration Total Return Fund, Class R6 | 2,363,299 | 22,923,993 | ||||||
b Franklin Strategic Income Fund, Class R6 | 1,948,215 | 18,605,454 | ||||||
|
| |||||||
| 41,529,447 | ||||||||
|
| |||||||
Domestic Hybrid 9.3% | ||||||||
b Franklin Income Fund, Class R6 | 7,710,386 | 17,656,784 | ||||||
|
| |||||||
Foreign Equity 4.3% | ||||||||
iShares Core MSCI EAFE ETF | 126,900 | 8,041,653 | ||||||
|
| |||||||
Total Investments in Underlying Funds and Exchange Traded Funds (Cost $80,712,576) | 88,108,234 | |||||||
|
| |||||||
Total Investments before Short Term Investments (Cost $158,003,472) | 184,527,578 | |||||||
|
| |||||||
Short Term Investments (Cost $4,544,973) 2.4% | ||||||||
Money Market Funds 2.4% | ||||||||
b,c Institutional Fiduciary Trust Money Market Portfolio, 1.51% | 4,544,973 | 4,544,973 | ||||||
|
| |||||||
Total Investments (Cost $162,548,445) 100.1% | 189,072,551 | |||||||
Other Assets, less Liabilities (0.1)% | (108,200 | ) | ||||||
|
| |||||||
Net Assets 100.0% | $ | 188,964,351 | ||||||
|
| |||||||
aNon-income producing.
bSee Note 3(e) regarding investments in Underlying Funds.
cThe rate shown is the annualized seven-day effective yield at period end.
| Semiannual Report | FVA-11 | |||||
FRANKLIN TEMPLETON VARIABLE INSURANCE PRODUCTS TRUST
STATEMENT OF INVESTMENTS (UNAUDITED)
Franklin VolSmart Allocation VIP Fund (continued)
At June 30, 2018, the Fund had the following total return swap contracts outstanding. See Note 1(c).
Total Return Swap Contracts
| Underlying Instruments | Financing Rate | Payment Frequency | Counterparty | Maturity Date | Notional Value | Value/ Unrealized Appreciation (Depreciation) | ||||||||||||||||||
| OTC Swap Contracts | ||||||||||||||||||||||||
| Longa | ||||||||||||||||||||||||
Dynamic VIX Backwardation (BEFSDVB1) | 0.70 | % | Monthly | BZWS | 3/08/19 | $ | 19,100,000 | $(17,479) | ||||||||||||||||
|
| |||||||||||||||||||||||
aThe Fund receives the total return on the underlying instrument and pays a financing rate.
See Note 7 regarding other derivative information.
See Abbreviations on page FVA-23.
| FVA-12 | Semiannual Report | The accompanying notes are an integral part of these financial statements. | |||
FRANKLIN TEMPLETON VARIABLE INSURANCE PRODUCTS TRUST
Financial Statements
Statement of Assets and Liabilities
June 30, 2018 (unaudited)
| Franklin VolSmart Allocation VIP Fund | ||||
Assets: | ||||
Investments in securities: | ||||
Cost - Unaffiliated issuers | $ 85,064,740 | |||
Cost - Non-controlled affiliates (Note 3e) | 77,483,705 | |||
|
| |||
Value - Unaffiliated issuers | $104,460,997 | |||
Value - Non-controlled affiliates (Note 3e) | 84,611,554 | |||
Receivables: | ||||
Capital shares sold | 66,231 | |||
Dividends | 97,983 | |||
Other assets | 126 | |||
|
| |||
Total assets | 189,236,891 | |||
|
| |||
Liabilities: | ||||
Payables: | ||||
Capital shares redeemed | 54,960 | |||
Management fees | 69,603 | |||
Distribution fees | 47,565 | |||
Professional fees | 58,974 | |||
Unrealized depreciation on OTC swap contracts | 17,479 | |||
Accrued expenses and other liabilities | 23,959 | |||
|
| |||
Total liabilities | 272,540 | |||
|
| |||
Net assets, at value | $188,964,351 | |||
|
| |||
Net assets consist of: | ||||
Paid-in capital | $167,505,836 | |||
Undistributed net investment income | 1,574,437 | |||
Net unrealized appreciation (depreciation) | 26,506,627 | |||
Accumulated net realized gain (loss) | (6,622,549 | ) | ||
|
| |||
Net assets, at value | $188,964,351 | |||
|
| |||
| Class 2: | ||||
Net assets, at value | $ 34,982 | |||
|
| |||
Shares outstanding | 3,061 | |||
|
| |||
Net asset value and maximum offering price per share | $11.43 | |||
|
| |||
| Class 5: | ||||
Net assets, at value | $188,929,369 | |||
|
| |||
Shares outstanding | 16,573,482 | |||
|
| |||
Net asset value and maximum offering price per share | $11.40 | |||
|
| |||
| The accompanying notes are an integral part of these financial statements. | Semiannual Report |
|
FVA-13 |
|
FRANKLIN TEMPLETON VARIABLE INSURANCE PRODUCTS TRUST
FINANCIAL STATEMENTS
Statement of Operations
for the six months ended June 30, 2018 (unaudited)
| Franklin VolSmart Allocation VIP Fund | ||||
Investment income: | ||||
Dividends: (net of foreign taxes)* | ||||
Unaffiliated issuers | $ 1,061,924 | |||
Non-controlled affiliates (Note 3e) | 1,262,547 | |||
|
| |||
Total investment income | 2,324,471 | |||
|
| |||
Expenses: | ||||
Management fees (Note 3a) | 748,572 | |||
Distribution fees: (Note 3c) | ||||
Class 2 | 44 | |||
Class 5 | 140,297 | |||
Custodian fees (Note 4) | 587 | |||
Reports to shareholders | 10,460 | |||
Professional fees | 31,490 | |||
Trustees’ fees and expenses | 486 | |||
Other | 10,681 | |||
|
| |||
Total expenses | 942,617 | |||
Expense reductions (Note 4) | (7 | ) | ||
Expenses waived/paid by affiliates (Note 3e and 3f) | (337,632 | ) | ||
|
| |||
Net expenses | 604,978 | |||
|
| |||
Net investment income | 1,719,493 | |||
|
| |||
Realized and unrealized gains (losses): | ||||
Net realized gain (loss) from: | ||||
Investments: | ||||
Unaffiliated issuers | 73,004 | |||
Non-controlled affiliates (Note 3e) | 13,261 | |||
Futures contracts | (1,446,957 | ) | ||
Swap contracts | (4,319,595 | ) | ||
|
| |||
Net realized gain (loss) | (5,680,287 | ) | ||
|
| |||
Net change in unrealized appreciation (depreciation) on: | ||||
Investments: | ||||
Unaffiliated issuers | (296,412 | ) | ||
Non-controlled affiliates (Note 3e) | 1,225,442 | |||
Swap contracts | (14,315 | ) | ||
|
| |||
Net change in unrealized appreciation (depreciation) | 914,715 | |||
|
| |||
Net realized and unrealized gain (loss) | (4,765,572 | ) | ||
|
| |||
Net increase (decrease) in net assets resulting from operations | $(3,046,079 | ) | ||
|
| |||
*Foreign taxes withheld on dividends | $ 1,439 | |||
FVA-14 | Semiannual Report | The accompanying notes are an integral part of these financial statements. |
FRANKLIN TEMPLETON VARIABLE INSURANCE PRODUCTS TRUST
FINANCIAL STATEMENTS
Statements of Changes in Net Assets
| Franklin VolSmart Allocation VIP Fund | ||||||||
| Six Months Ended June 30, 2018 (unaudited) | Year Ended December 31, 2017 | |||||||
Increase (decrease) in net assets: | ||||||||
Operations: | ||||||||
Net investment income | $ 1,719,493 | $ 2,538,797 | ||||||
Net realized gain (loss) | (5,680,287 | ) | 791,929 | |||||
Net change in unrealized appreciation (depreciation) | 914,715 | 20,274,940 | ||||||
|
| |||||||
Net increase (decrease) in net assets resulting from operations | (3,046,079 | ) | 23,605,666 | |||||
|
| |||||||
Distributions to shareholders from: | ||||||||
Net investment income: | ||||||||
Class 2 | (134 | ) | — | |||||
Class 5 | (923,085 | ) | — | |||||
|
| |||||||
Total distributions to shareholders | (923,219 | ) | — | |||||
|
| |||||||
Capital share transactions: (Note 2) | ||||||||
Class 5 | 4,657,849 | 40,058,190 | ||||||
|
| |||||||
Total capital share transactions | 4,657,849 | 40,058,190 | ||||||
|
| |||||||
Net increase (decrease) in net assets | 688,551 | 63,663,856 | ||||||
Net assets: | ||||||||
Beginning of period | 188,275,800 | 124,611,944 | ||||||
|
| |||||||
End of period | $188,964,351 | $188,275,800 | ||||||
|
| |||||||
Undistributed net investment income included in net assets: | ||||||||
End of period | $ 1,574,437 | $ 778,163 | ||||||
|
| |||||||
| The accompanying notes are an integral part of these financial statements. | Semiannual Report |
|
FVA-15 |
|
FRANKLIN TEMPLETON VARIABLE INSURANCE PRODUCTS TRUST
Notes to Financial Statements (unaudited)
Franklin VolSmart Allocation VIP Fund
1. Organization and Significant Accounting Policies
Franklin Templeton Variable Insurance Products Trust (Trust) is registered under the Investment Company Act of 1940 (1940 Act) as an open-end management investment company, consisting of eighteen separate funds and applies the specialized accounting and reporting guidance in U.S. Generally Accepted Accounting Principles (U.S. GAAP). Franklin VolSmart Allocation VIP Fund (Fund) is included in this report. The Fund invests in affiliated funds managed by Franklin Templeton (Underlying Funds). Shares of the Fund are generally sold only to insurance company separate accounts to fund the benefits of variable life insurance policies or variable annuity contracts. At June 30, 2018, 98.5% of the Fund’s shares were held through one insurance company. Investment activities of these insurance company separate accounts could have a material impact on the Fund. The Fund offers two classes of shares: Class 2 and Class 5. Each class of shares may differ by its distribution fees, voting rights on matters affecting a single class and its exchange privilege.
The accounting policies of the Underlying Funds are outlined in their respective shareholder reports. A copy of the Underlying Funds’ shareholder reports is available on the U.S. Securities and Exchange Commission (SEC) website at sec.gov or at the SEC’s Public Reference Room in Washington, D.C. The Underlying Funds’ shareholder reports are not covered by this report.
The following summarizes the Fund’s significant accounting policies.
a. Financial Instrument Valuation
The Fund’s investments in financial instruments are carried at fair value daily. Fair value is the price that would be received to sell an asset or paid to transfer a liability in an orderly transaction between market participants on the measurement date. The Fund calculates the net asset value (NAV) per share each business day as of 4 p.m. Eastern time or the regularly scheduled close of the New York Stock Exchange (NYSE), whichever is earlier. Under compliance policies and procedures approved by the Trust’s Board of Trustees (the Board), the Fund’s administrator has responsibility for oversight of valuation, including leading the cross-functional Valuation Committee (VC). The VC provides administration and oversight of the Fund’s valuation policies and procedures, which are approved annually by the Board. Among other things,
these procedures allow the Fund to utilize independent pricing services, quotations from securities and financial instrument dealers, and other market sources to determine fair value.
Investments in the Underlying Funds are valued at their closing NAV each trading day.
Equity securities and exchange traded funds (ETFs) listed on an exchange or on the NASDAQ National Market System are valued at the last quoted sale price or the official closing price of the day, respectively. Foreign equity securities are valued as of the close of trading on the foreign stock exchange on which the security is primarily traded, or as of 4 p.m. Eastern time. The value is then converted into its U.S. dollar equivalent at the foreign exchange rate in effect at 4 p.m. Eastern time on the day that the value of the security is determined. Over-the-counter (OTC) securities are valued within the range of the most recent quoted bid and ask prices. Securities that trade in multiple markets or on multiple exchanges are valued according to the broadest and most representative market. Certain equity securities are valued based upon fundamental characteristics or relationships to similar securities.
Certain derivative financial instruments trade in the OTC market. The Fund’s pricing services use various techniques including industry standard option pricing models and proprietary discounted cash flow models to determine the fair value of those instruments. The Fund’s net benefit or obligation under the derivative contract, as measured by the fair value of the contract, is included in net assets.
The Fund has procedures to determine the fair value of financial instruments for which market prices are not reliable or readily available. Under these procedures, the VC convenes on a regular basis to review such financial instruments and considers a number of factors, including significant unobservable valuation inputs, when arriving at fair value. The VC primarily employs a market-based approach which may use related or comparable assets or liabilities, recent transactions, market multiples, book values, and other relevant information for the investment to determine the fair value of the investment. An income-based valuation approach may also be used in which the anticipated future cash flows of the investment are discounted to calculate fair value. Discounts may also be applied due to the nature or duration of any restrictions on the disposition of the investments. Due to the inherent uncertainty of valuations of such investments, the fair values may differ significantly from the values that would have been used had an active market
FVA-16 | Semiannual Report |
FRANKLIN TEMPLETON VARIABLE INSURANCE PRODUCTS TRUST
NOTES TO FINANCIAL STATEMENTS (UNAUDITED)
Franklin VolSmart Allocation VIP Fund (continued)
existed. The VC employs various methods for calibrating these valuation approaches including a regular review of key inputs and assumptions, transactional back-testing or disposition analysis, and reviews of any related market activity.
Trading in securities on foreign securities stock exchanges and OTC markets may be completed before 4 p.m. Eastern time. In addition, trading in certain foreign markets may not take place on every Fund’s business day. Occasionally, events occur between the time at which trading in a foreign security is completed and 4 p.m. Eastern time that might call into question the reliability of the value of a portfolio security held by the Fund. As a result, differences may arise between the value of the Fund’s portfolio securities as determined at the foreign market close and the latest indications of value at 4 p.m. Eastern time. In order to minimize the potential for these differences, the VC monitors price movements following the close of trading in foreign stock markets through a series of country specific market proxies (such as baskets of American Depositary Receipts, futures contracts and exchange traded funds). These price movements are measured against established trigger thresholds for each specific market proxy to assist in determining if an event has occurred that may call into question the reliability of the values of the foreign securities held by the Fund. If such an event occurs, the securities may be valued using fair value procedures, which may include the use of independent pricing services.
When the last day of the reporting period is a non-business day, certain foreign markets may be open on those days that the Fund’s NAV is not calculated, which could result in differences between the value of the Fund’s portfolio securities on the last business day and the last calendar day of the reporting period. Any significant security valuation changes due to an open foreign market are adjusted and reflected by the Fund for financial reporting purposes.
b. Foreign Currency Translation
Portfolio securities and other assets and liabilities denominated in foreign currencies are translated into U.S. dollars based on the exchange rate of such currencies against U.S. dollars on the date of valuation. The Fund may enter into foreign currency exchange contracts to facilitate transactions denominated in a foreign currency. Purchases and sales of securities, income and expense items denominated in foreign currencies are translated into U.S. dollars at the exchange rate in effect on the transaction date. Portfolio securities and assets and liabilities denominated
in foreign currencies contain risks that those currencies will decline in value relative to the U.S. dollar. Occasionally, events may impact the availability or reliability of foreign exchange rates used to convert the U.S. dollar equivalent value. If such an event occurs, the foreign exchange rate will be valued at fair value using procedures established and approved by the Board.
The Fund does not separately report the effect of changes in foreign exchange rates from changes in market prices on securities held. Such changes are included in net realized and unrealized gain or loss from investments in the Statement of Operations.
Realized foreign exchange gains or losses arise from sales of foreign currencies, currency gains or losses realized between the trade and settlement dates on securities transactions and the difference between the recorded amounts of dividends, interest, and foreign withholding taxes and the U.S. dollar equivalent of the amounts actually received or paid. Net unrealized foreign exchange gains and losses arise from changes in foreign exchange rates on foreign denominated assets and liabilities other than investments in securities held at the end of the reporting period.
c. Derivative Financial Instruments
The Fund invested in derivative financial instruments in order to manage risk or gain exposure to various other investments or markets. Derivatives are financial contracts based on an underlying or notional amount, require no initial investment or an initial net investment that is smaller than would normally be required to have a similar response to changes in market factors, and require or permit net settlement. Derivatives contain various risks including the potential inability of the counterparty to fulfill their obligations under the terms of the contract, the potential for an illiquid secondary market, and/or the potential for market movements which expose the Fund to gains or losses in excess of the amounts shown in the Statement of Assets and Liabilities. Realized gain and loss and unrealized appreciation and depreciation on these contracts for the period are included in the Statement of Operations.
Derivative counterparty credit risk is managed through a formal evaluation of the creditworthiness of all potential counter-parties. The Fund attempts to reduce its exposure to counterparty credit risk on OTC derivatives, whenever possible, by entering into International Swaps and Derivatives Association (ISDA) master agreements with certain
| Semiannual Report |
|
FVA-17 |
|
FRANKLIN TEMPLETON VARIABLE INSURANCE PRODUCTS TRUST
NOTES TO FINANCIAL STATEMENTS (UNAUDITED)
Franklin VolSmart Allocation VIP Fund (continued)
1. Organization and Significant Accounting
Policies (continued)
c. Derivative Financial Instruments (continued)
counterparties. These agreements contain various provisions, including but not limited to collateral requirements, events of default, or early termination. Termination events applicable to the counterparty include certain deteriorations in the credit quality of the counterparty. Termination events applicable to the Fund include failure of the Fund to maintain certain net asset levels and/or limit the decline in net assets over various periods of time. In the event of default or early termination, the ISDA master agreement gives the non-defaulting party the right to net and close-out all transactions traded, whether or not arising under the ISDA agreement, to one net amount payable by one counterparty to the other. However, absent an event of default or early termination, OTC derivative assets and liabilities are presented gross and not offset in the Statement of Assets and Liabilities. Early termination by the counterparty may result in an immediate payment by the Fund of any net liability owed to that counterparty under the ISDA agreement. At June 30, 2018, the Fund had OTC derivatives in a net liability position for such contracts of $17,479.
Collateral requirements differ by type of derivative. Collateral terms are contract specific for OTC derivatives. For OTC derivatives traded under an ISDA master agreement, posting of collateral is required by either the Fund or the applicable counterparty if the total net exposure of all OTC derivatives with the applicable counterparty exceeds the minimum transfer amount, which typically ranges from $100,000 to $250,000, and can vary depending on the counterparty and the type of the agreement. Generally, collateral is determined at the close of Fund business each day and any additional collateral required due to changes in derivative values may be delivered by the Fund or the counterparty the next business day, or within a few business days. Collateral pledged and/or received by the Fund, if any, is held in segregated accounts with the Fund’s custodian/counterparty broker and can be in the form of cash and/or securities. Unrestricted cash may be invested according to the Fund’s investment objectives. To the extent that the amounts due to the Fund from its counterparties are not subject to collateralization or are not fully collateralized, the Fund bears the risk of loss from counterparty non-performance.
The Fund entered into exchange traded futures contracts primarily to manage and/or gain exposure to interest rate risk and/or certain foreign currencies. A futures contract is an agreement between the Fund and a counterparty to buy or sell an asset at a specified price on a future date. Required initial margins are pledged by the Fund, and the daily change in fair value is accounted for as a variation margin payable or receivable in the Statement of Assets and Liabilities.
The Fund entered into OTC total return swap contracts primarily to manage and/or gain exposure to equity price risk of an underlying instrument such as a stock, bond, index or basket of securities or indices. A total return swap is an agreement between the Fund and a counterparty to exchange a return linked to an underlying instrument for a floating or fixed rate payment, both based upon a notional amount. Over the term of the contract, contractually required payments to be paid or received are accrued daily and recorded as unrealized appreciation or depreciation until the payments are made, at which time they are recognized as realized gain or loss.
See Note 7 regarding other derivative information.
d. Income and Deferred Taxes
It is the Fund’s policy to qualify as a regulated investment company under the Internal Revenue Code. The Fund intends to distribute to shareholders substantially all of its taxable income and net realized gains to relieve it from federal income and if applicable, excise taxes. As a result, no provision for U.S. federal income taxes is required.
The Fund may be subject to foreign taxation related to income received, capital gains on the sale of securities and certain foreign currency transactions in the foreign jurisdictions in which it invests. Foreign taxes, if any, are recorded based on the tax regulations and rates that exist in the foreign markets in which the Fund invests. When a capital gain tax is determined to apply, the Fund records an estimated deferred tax liability in an amount that would be payable if the securities were disposed of on the valuation date.
The Fund may recognize an income tax liability related to its uncertain tax positions under U.S. GAAP when the uncertain tax position has a less than 50% probability that it will be sustained upon examination by the tax authorities based on its technical merits. As of June 30, 2018, the Fund has determined that no tax liability is required in its financial statements related to uncertain tax positions for any open tax years (or expected to
FVA-18 | Semiannual Report |
FRANKLIN TEMPLETON VARIABLE INSURANCE PRODUCTS TRUST
NOTES TO FINANCIAL STATEMENTS (UNAUDITED)
Franklin VolSmart Allocation VIP Fund (continued)
be taken in future tax years). Open tax years are those that remain subject to examination and are based on the statute of limitations in each jurisdiction in which the Fund invests.
e. Security Transactions, Investment Income, Expenses and Distributions
Security transactions are accounted for on trade date. Realized gains and losses on security transactions are determined on a specific identification basis. Estimated expenses are accrued daily. Dividend income and realized gain distributions are recorded on the ex-dividend date except for certain dividends from securities where the dividend rate is not available. In such cases, the dividend is recorded as soon as the information is received by the Fund. Distributions to shareholders are recorded on the ex-dividend date. Distributable earnings are determined according to income tax regulations (tax basis) and may differ from earnings recorded in accordance with U.S. GAAP. These differences may be permanent or temporary. Permanent differences are reclassified among capital accounts to reflect their tax character. These reclassifications have no impact on net assets or the results of operations. Temporary differences are not reclassified, as they may reverse in subsequent periods.
Common expenses incurred by the Trust are allocated among the Funds based on the ratio of net assets of each Fund to the combined net assets of the Trust or based on the ratio of number of shareholders of each Fund to the combined number of shareholders of the Trust. Fund specific expenses are charged directly to the Fund that incurred the expense.
The Fund indirectly bears its proportionate share of expenses from the Underlying Funds and ETFs. Since the Underlying Funds and ETFs have varied expense levels and the Fund may
own different proportions of the Underlying Funds and ETFs at different times, the amount of expenses incurred indirectly by the Fund will vary.
Realized and unrealized gains and losses and net investment income, excluding class specific expenses, are allocated daily to each class of shares based upon the relative proportion of net assets of each class. Differences in per share distributions by class are generally due to differences in class specific expenses.
f. Accounting Estimates
The preparation of financial statements in accordance with U.S. GAAP requires management to make estimates and assumptions that affect the reported amounts of assets and liabilities at the date of the financial statements and the amounts of income and expenses during the reporting period. Actual results could differ from those estimates.
g. Guarantees and Indemnifications
Under the Trust’s organizational documents, its officers and trustees are indemnified by the Trust against certain liabilities arising out of the performance of their duties to the Trust. Additionally, in the normal course of business, the Trust, on behalf of the Fund enters into contracts with service providers that contain general indemnification clauses. The Trust’s maximum exposure under these arrangements is unknown as this would involve future claims that may be made against the Trust that have not yet occurred. Currently, the Trust expects the risk of loss to be remote.
2. Shares of Beneficial Interest
At June 30, 2018, there were an unlimited number of shares authorized (without par value). During the period ended June 30, 2018 and the year ended December 31, 2017, there were no transactions of the Fund’s Class 2 shares. Transactions in the Fund’s Class 5 shares were as follows:
| Six Months Ended June 30, 2018 | Year Ended December 31, 2017 | |||||||||||||||||||
| Shares | Amount | Shares | Amount | |||||||||||||||||
| Class 5 Shares: | ||||||||||||||||||||
Shares sold | 1,474,850 | $ | 16,912,573 | 6,311,063 | $ | 67,303,086 | ||||||||||||||
Shares issued in reinvestment of distributions | 79,783 | 923,085 | — | — | ||||||||||||||||
Shares redeemed | (1,143,818 | ) | (13,177,809 | ) | (2,514,276 | ) | (27,244,896 | ) | ||||||||||||
|
| |||||||||||||||||||
Net increase (decrease) | 410,815 | $ | 4,657,849 | 3,796,787 | $ | 40,058,190 | ||||||||||||||
|
| |||||||||||||||||||
| Semiannual Report |
|
FVA-19 |
|
FRANKLIN TEMPLETON VARIABLE INSURANCE PRODUCTS TRUST
NOTES TO FINANCIAL STATEMENTS (UNAUDITED)
Franklin VolSmart Allocation VIP Fund (continued)
3. Transactions with Affiliates
Franklin Resources, Inc. is the holding company for various subsidiaries that together are referred to as Franklin Templeton Investments. Certain officers and trustees of the Fund are also officers, directors and/or trustees of certain of the Underlying Funds and of the following subsidiaries:
| Subsidiary | Affiliation | |
Franklin Advisers, Inc. (Advisers) | Investment manager | |
K2/D&S Management Co., LLC (K2 Advisors) | Investment manager | |
Franklin Templeton Services, LLC (FT Services) | Administrative manager | |
Franklin Templeton Distributors, Inc. (Distributors) | Principal underwriter | |
Franklin Templeton Investor Services, LLC (Investor Services) | Transfer agent |
a. Management Fees
The Fund pays an investment management fee to Advisers of 0.80% per year of the average daily net assets of the Fund.
Under a subadvisory agreement, K2 Advisors, an affiliate of Advisers, provides subadvisory services to Fund. The subadvisory fee is paid by Advisers based on the Fund’s average daily net assets, and is not an additional expense of the Fund. Effective January 1, 2018, the subadvisory agreement was terminated for Franklin Advisory Services, LLC.
b. Administrative Fees
Under an agreement with Advisers, FT Services provides administrative services to the Fund. The fee is paid by Advisers based on the Fund’s average daily net assets, and is not an additional expense of the Fund.
c. Distribution Fees
The Board has adopted distribution plans for Class 2 and Class 5 shares pursuant to Rule 12b-1 under the 1940 Act. Under the Fund’s compensation distribution plans, the Fund pays Distributors for costs incurred in connection with the servicing, sale and distribution of the Fund’s shares up to 0.35% and 0.15% per year of its average daily net assets of Class 2 and Class 5, respectively. The Board has agreed to limit the current rate to 0.25% per year for Class 2. The plan year, for purposes of monitoring compliance with the maximum annual plan rates, is February 1 through January 31.
d. Transfer Agent Fees
Investor Services, under terms of an agreement, performs shareholder servicing for the Fund and is not paid by the Fund for the services.
e. Investments in Underlying Funds
The Fund invests in Underlying Funds which are managed by Advisers or affiliates of Advisers. The Fund does not invest in Underlying Funds for the purpose of exercising a controlling influence over the management or policies. Management fees paid by the Fund are waived on assets invested in the Underlying Funds, as noted in the Statement of Operations, in an amount not to exceed the management and administrative fees paid directly or indirectly by the Underlying Funds.
FVA-20 | Semiannual Report |
FRANKLIN TEMPLETON VARIABLE INSURANCE PRODUCTS TRUST
NOTES TO FINANCIAL STATEMENTS (UNAUDITED)
Franklin VolSmart Allocation VIP Fund (continued)
Investments in Underlying Funds for the period ended June 30, 2018, were as follows:
| Underlying Funds | Number of Shares Held at Beginning of Period | Gross Additions | Gross Reductions | Number of Held at End | Value at End of Period | Dividend Income | Realized Gain (Loss) | Net Change in Unrealized Appreciation (Depreciation) | ||||||||||||||||
| Non-Controlled Affiliates | ||||||||||||||||||||||||
Franklin DynaTech Fund, Class R6 | 272,141 | — | (2,439 | ) | 269,702 | $20,880,350 | $ — | $20,000 | $2,607,777 | |||||||||||||||
Franklin Income Fund, Class R6 | 7,571,482 | 206,295 | (67,391 | ) | 7,710,386 | 17,656,784 | 474,889 | (6,739 | ) | (525,062 | ) | |||||||||||||
Franklin Low Duration Total Return Fund, Class R6 | 2,325,396 | 37,903 | — | 2,363,299 | 22,923,993 | 369,185 | — | (280,582 | ) | |||||||||||||||
Franklin Strategic Income Fund, Class R6 | 1,907,939 | 40,276 | — | 1,948,215 | 18,605,454 | 388,948 | — | (576,691 | ) | |||||||||||||||
Institutional Fiduciary Trust Money Market Portfolio, 1.51% | 6,861,620 | 15,471,478 | (17,788,125 | ) | 4,544,973 | 4,544,973 | 29,525 | — | — | |||||||||||||||
| ||||||||||||||||||||||||
Total Affiliated Securities | $84,611,554 | $1,262,547 | $13,261 | $1,225,442 | ||||||||||||||||||||
| ||||||||||||||||||||||||
f. Waiver and Expense Reimbursements
Advisers has contractually agreed in advance to waive or limit its fees and to assume as its own expense certain expenses otherwise payable by the Fund so that the expenses (excluding distribution fees and acquired fund fees and expenses) for each class of the Fund do not exceed 0.65%, based on the average net assets of each class (other than certain non-routine expenses or costs, including those relating to litigation, indemnification, reorganizations, and liquidations) until April 30, 2019. Total expenses waived or paid are not subject to recapture subsequent to the Fund’s fiscal year end.
4. Expense Offset Arrangement
The Fund has entered into an arrangement with its custodian whereby credits realized as a result of uninvested cash balances are used to reduce a portion of the Fund’s custodian expenses. During the period ended June 30, 2018, the custodian fees were reduced as noted in the Statement of Operations.
5. Income Taxes
For tax purposes, capital losses may be carried over to offset future capital gains, if any.
At December 31, 2017, the capital loss carryforwards were as follows:
Capital loss carryforwards not subject to expiration: | ||||
Short Term | $ | 164,571 | ||
Long Term | 455,583 | |||
|
| |||
Total capital loss carryforwards | $ | 620,154 | ||
|
| |||
At June 30, 2018, the cost of investments and net unrealized appreciation (depreciation) for income tax purposes were as follows:
Cost of investments | $ | 163,014,107 | ||
|
| |||
Unrealized appreciation | $ | 29,112,153 | ||
Unrealized depreciation | (3,071,188) | |||
|
| |||
Net unrealized appreciation (depreciation) | $ | 26,040,965 | ||
|
| |||
Differences between income and/or capital gains as determined on a book basis and a tax basis are primarily due to differing treatment of swaps.
| Semiannual Report |
|
FVA-21 |
|
FRANKLIN TEMPLETON VARIABLE INSURANCE PRODUCTS TRUST
NOTES TO FINANCIAL STATEMENTS (UNAUDITED)
Franklin VolSmart Allocation VIP Fund (continued)
6. Investment Transactions
Purchases and sales of investments (excluding short term securities) for the period ended June 30, 2018, aggregated $3,294,413 and $2,510,184, respectively.
7. Other Derivative Information
At June 30, 2018, the Fund’s investments in derivative contracts are reflected in the Statement of Assets and Liabilities as follows:
| Asset Derivatives | Liability Derivatives | |||||||||||
|
| |||||||||||
Derivative Contracts Not Accounted for as Hedging Instruments | Statement of Assets and Liabilities Location | Fair Value | Statement of Assets and Liabilities Location | Fair Value | ||||||||
Equity contracts | Unrealized appreciation on OTC | $ — | Unrealized depreciation on OTC swap contracts | $ | 17,479 | |||||||
|
|
|
| |||||||||
For the period ended June 30, 2018, the effect of derivative contracts in the Fund’s Statement of Operations was as follows:
Derivative Contracts Not Accounted for as Hedging Instruments | Statement of Operations Location | Net Realized Gain (Loss) for the Period | Statement of Operations Location | Net Change in Unrealized for the Period | ||||||||||||
Net realized gain (loss) from: | Net change in unrealized | |||||||||||||||
| appreciation (depreciation) on: | ||||||||||||||||
Equity contracts | Futures contracts | $(1,446,957) | ` | Futures contracts | $ — | |||||||||||
Swap contracts | (4,319,595) | Swap contracts | (14,315) | |||||||||||||
|
|
|
| |||||||||||||
Totals | $(5,766,552) | $(14,315) | ||||||||||||||
|
|
|
| |||||||||||||
For the period ended June 30, 2018, the average month end notional amount of futures contracts and swap contracts represented $6,846,776 and $29,814,286, respectively.
See Note 1(c) regarding derivative financial instruments.
8. Credit Facility
The Fund, together with other U.S. registered and foreign investment funds (collectively, Borrowers), managed by Franklin Templeton Investments, are borrowers in a joint syndicated senior unsecured credit facility totaling $2 billion (Global Credit Facility) which matures on February 8, 2019. This Global Credit Facility provides a source of funds to the Borrowers for temporary and emergency purposes, including the ability to meet future unanticipated or unusually large redemption requests.
Under the terms of the Global Credit Facility, the Fund shall, in addition to interest charged on any borrowings made by the Fund and other costs incurred by the Fund, pay its share of fees and expenses incurred in connection with the implementation and maintenance of the Global Credit Facility, based upon its relative share of the aggregate net assets of all of the Borrowers, including an annual commitment fee of 0.15% based upon the unused portion of the Global Credit Facility. These fees are reflected in other expenses in the Statement of Operations. During the period ended June 30, 2018, the Fund did not use the Global Credit Facility.
FVA-22 | Semiannual Report |
FRANKLIN TEMPLETON VARIABLE INSURANCE PRODUCTS TRUST
NOTES TO FINANCIAL STATEMENTS (UNAUDITED)
Franklin VolSmart Allocation VIP Fund (continued)
9. Fair Value Measurements
The Fund follows a fair value hierarchy that distinguishes between market data obtained from independent sources (observable inputs) and the Fund’s own market assumptions (unobservable inputs). These inputs are used in determining the value of the Fund’s financial instruments and are summarized in the following fair value hierarchy:
| • | Level 1 – quoted prices in active markets for identical financial instruments |
| • | Level 2 – other significant observable inputs (including quoted prices for similar financial instruments, interest rates, prepayment speed, credit risk, etc.) |
| • | Level 3 – significant unobservable inputs (including the Fund’s own assumptions in determining the fair value of financial instruments) |
The input levels are not necessarily an indication of the risk or liquidity associated with financial instruments at that level.
For movements between the levels within the fair value hierarchy, the Fund has adopted a policy of recognizing the transfers as of the date of the underlying event which caused the movement.
A summary of inputs used as of June 30, 2018, in valuing the Fund’s assets and liabilities carried at fair value, is as follows:
| Level 1 | Level 2 | Level 3 | Total | |||||||||||||
| Assets: | ||||||||||||||||
Investments in Securities:a | $ | 96,419,344 | $ | — | $ | — | $ | 96,419,344 | ||||||||
Investments in Underlying Funds and Exchange | 88,108,234 | — | — | 88,108,234 | ||||||||||||
Short Term Investments | 4,544,973 | — | — | 4,544,973 | ||||||||||||
|
| |||||||||||||||
Total Investments in Securities | $ | 189,072,551 | $ | — | $ | — | $ | 189,072,551 | ||||||||
|
| |||||||||||||||
| Liabilities: | ||||||||||||||||
Other Financial Instruments: | $ | — | $ | 17,479 | $ | — | $ | 17,479 | ||||||||
|
| |||||||||||||||
aFor detailed categories, see the accompanying Statement of Investments. | ||||||||||||||||
10. Subsequent Events
The Fund has evaluated subsequent events through the issuance of the financial statements and determined that no events have occurred that require disclosure.
| Abbreviations | ||||||
| Counterparty | Selected Portfolio | |||||
BZWS Barclays Bank PLC | ADR | American Depositary Receipt | ||||
| EAFE | Europe, Australia & Far East | |||||
| VIX | Market Volatility Index | |||||
| Semiannual Report |
|
FVA-23 |
|
This page intentionally left blank.
Templeton Developing Markets VIP Fund
This semiannual report for Templeton Developing Markets VIP Fund covers the period ended June 30, 2018.
Class 2 Performance Summary as of June 30, 2018
The Fund’s Class 2 Shares had a -7.81% total return* for the six-month period ended June 30, 2018.
*The Fund has a fee waiver associated with any investment it makes in a Franklin Templeton money fund and/or other Franklin Templeton fund, contractually guaranteed through 4/30/19. Fund investment results reflect the fee waiver; without this waiver, the results would have been lower.
Performance reflects the Fund’s Class 2 operating expenses, but does not include any contract fees, expenses or sales charges. If they had been included, performance would be lower. These charges and deductions, particularly for variable life policies, can have a significant effect on contract values and insurance benefits. See the contract prospectus for a complete description of these expenses, including sales charges.
Performance data represent past performance, which does not guarantee future results. Investment return and principal value will fluctuate, and you may have a gain or loss when you sell your shares. Current performance may differ from figures shown.
Semiannual Report | TD-1 |
TEMPLETON DEVELOPING MARKETS VIP FUND
Fund Goal and Main Investments
The Fund seeks long-term capital appreciation. Under normal market conditions, the Fund invests at least 80% of its net assets in emerging market investments.
Fund Risks
All investments involve risks, including possible loss of principal. Special risks are associated with foreign investing, including currency fluctuations, economic instability and political developments. Investments in developing markets, of which frontier markets are a subset, involve heightened risks related to the same factors, in addition to those associated with these markets’ smaller size, lesser liquidity and lack of established legal, political, business and social frameworks to support securities markets. Because these frameworks are typically even less developed in frontier markets, as well as various factors including the increased potential for extreme price volatility, illiquidity, trade barriers and exchange controls, the risks associated with developing markets are magnified in frontier markets. The Fund is designed for the aggressive portion of a well-diversified portfolio. The Fund is actively managed but there is no guarantee that the manager’s investment decisions will produce the desired results. The Fund’s prospectus also includes a description of the main investment risks.
Performance Overview
You can find the Fund’s six-month total return in the Performance Summary. In comparison, the MSCI Emerging Markets (EM) Index had a -6.51% total return, and the Standard & Poor’s®/International Finance Corporation Investable Composite Index had a -6.31% total return for the same period.1 Please note, index performance numbers are for reference and we do not attempt to track an index but rather undertake investments on the basis of fundamental research.
Economic and Market Overview
Emerging market economies in general continued to grow faster than developed market economies during the six months under review. China’s economy grew slightly slower in 2018’s first half compared to the second half of 2017, amid faster growth in consumer spending and slower growth in industrial production, the service industry and fixed-asset investment.
Geographic Composition
Based on Total Net Assets as of 6/30/18
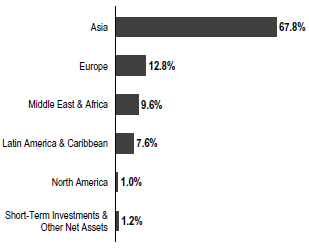
India’s annualized growth rate in 2018’s first quarter was the highest it has been since 2016’s second quarter, driven by growth in investment, manufacturing and construction. Russia’s economy grew in 2018’s first quarter compared to the prior-year period, driven by higher oil prices and growth in financials and insurance, real estate and public administration, though US sanctions and a decline in construction weighed on the economy. Brazil’s economy grew in 2018’s first quarter compared to the prior-year period, though fixed-asset investment growth slowed and government spending contracted. South Africa’s economy contracted in the first quarter of 2018 and grew at its slowest annualized rate since 2016’s second quarter, with slowing growth in manufacturing and a decline in mining being the main factors. South Korea’s economy grew in 2018’s first quarter compared to the prior-year period, as did Poland’s and Mexico’s economies.
Monetary policies varied among emerging market central banks. Brazil’s, Russia’s and South Africa’s central banks cut their benchmark interest rates during the six-month period, while some, including those of India, Turkey and the Czech Republic, raised their benchmark rates. Mexico’s central bank raised its benchmark rate twice during the period to ameliorate risk factors for inflation amid uncertainty around the renegotiations of the North American Free Trade Agreement and the country’s presidential election in July. China’s, South Korea’s and Taiwan’s central banks left their benchmark interest rates unchanged during the period.
1. Source: Morningstar. One cannot invest directly in an index, and an index is not representative of the Fund’s portfolio. Please see Index Descriptions following the Fund Summaries.
The dollar value, number of shares or principal amount, and names of all portfolio holdings are listed in the Fund’s Statement of Investments (SOI).
TD-2 | Semiannual Report |
TEMPLETON DEVELOPING MARKETS VIP FUND
Emerging market stocks declined during the six months under review due to investor concerns over rising US interest rates, a strengthening US dollar and rising global trade tensions, particularly between the US and China. Emerging market European stocks were pressured by political instability in Italy, and Asian stocks were hurt by increased tensions in the Korean peninsula, although tensions eased later in the period. However, continued solid earnings performance by many emerging market companies, MSCI’s addition of Chinese A-share companies to the MSCI EM Index and MSCI’s decision to add Saudi Arabia to the same index in 2019—which could boost investment across the Middle East—offered some encouragement to investors. In this environment, emerging market stocks, as measured by the MSCI EM Index, had a -6.51% total return for the six months ended June 30, 2018.1
Investment Strategy
We employ a fundamental research, value-oriented, long-term investment approach. We focus on the market price of a company’s securities relative to our evaluation of its long-term earnings, asset value and cash flow potential. We also consider a company’s profit and loss outlook, balance sheet strength, cash flow trends and asset value in relation to the current price of the company’s securities. Our analysis considers the company’s corporate governance behavior as well as its position in its sector, the economic framework and political environment.
Manager’s Discussion
During the six months under review, key contributors to the Fund’s absolute performance included Fila Korea, Uni-President China Holdings and China Petroleum & Chemical (Sinopec).
Fila Korea is one of South Korea’s leading sportswear companies. It also licenses the FILA brand around the world and owns a stake in US golf product manufacturer Acushnet. Shares of Fila Korea advanced as the company’s efforts to revitalize its domestic business and expand in China helped improve quarterly earnings. Steady financial results from Acushnet also buoyed the stock.
Uni-President China is a leading beverage and instant noodle manufacturer in its home market. It is a unit of Uni-President Enterprises, a food and beverage conglomerate in Taiwan. Shares of Uni-President China rose amid stronger full-year 2017 earnings as the company took steps to raise its profitability. As part of its strategy, it phased out underperforming products and increased its focus on higher margin brands.
Top 10 Countries
6/30/18
| % of Total Net Assets | ||
China | 22.8% | |
South Korea | 17.2% | |
Taiwan | 10.6% | |
South Africa | 8.8% | |
Russia | 8.0% | |
India | 6.3% | |
Brazil | 4.3% | |
Thailand | 3.9% | |
U.K. | 3.0% | |
Indonesia | 2.9% |
Sinopec is one of China’s largest integrated energy and chemical companies. It is engaged in oil and gas exploration and production. It also manufactures and markets petrochemicals and other chemical products. Sinopec shares benefited from soaring oil prices, with Brent crude oil touching US$80 per barrel during the period under review. The company also reported robust quarterly earnings.
In contrast, key detractors from the Fund’s absolute performance included Brilliance China Automotive Holdings, Samsung Electronics and Naspers.
Brilliance China Automotive manufactures and sells automobiles for the Chinese domestic market, predominantly through its joint venture with German luxury car maker BMW. Brilliance China’s share price weakened as its full-year 2017 profit growth missed market expectations. China’s plans to remove foreign ownership limits and reduce import tariffs in the auto industry also weighed on the stock. Overall, however, rising wealth in China continued to underpin sales of premium cars in the country, and Brilliance China unveiled plans for new launches to meet consumer demand.
Samsung Electronics is a South Korea-based consumer electronics and semiconductor manufacturer. It is one of the world’s largest smartphone and memory chip producers as well as a key supplier of organic light-emitting diode (OLED) displays. Shares of the export-focused company were caught in the crosshairs of mounting global trade tensions. Concerns that Samsung could reduce its production of OLED smartphone panels amid weak demand for Apple’s iPhone X also created selling pressure. The stock’s decline was capped as Samsung reported better-than-expected quarterly earnings, thanks to strength in its semiconductor business.
| Semiannual Report |
|
TD-3 |
|
TEMPLETON DEVELOPING MARKETS VIP FUND
Naspers is an internet and media group based in South Africa. It is a leading provider of pay-television services in sub-Saharan Africa. It also has sizable investments in some of the world’s leading technology companies, including China-based Tencent Holdings and Russia-based Mail.Ru Group. Shares of Naspers retreated as it trimmed its stake in Tencent to raise cash for e-commerce investments. Nevertheless, it retains a considerable stake in Tencent and its results for fiscal-year 2018 (ended March 31) were significantly lifted by the Chinese company’s strong performance.
It is important to recognize the effect of currency movements on the Fund’s performance. In general, if the value of the US dollar goes up compared with a foreign currency, an investment traded in that foreign currency will go down in value because it will be worth fewer US dollars. This can have a negative effect on Fund performance. Conversely, when the US dollar weakens in relation to a foreign currency, an investment traded in that foreign currency will increase in value, which can contribute to Fund performance. For the six months ended June 30, 2018, the US dollar rose in value relative to most currencies. As a result, the Fund’s performance was negatively affected by the portfolio’s investment predominantly in securities with non-US currency exposure.
During the past six months, we increased the Fund’s holdings mainly in Mexico as interesting investment opportunities emerged. Key purchases included additional investments in Banco Santander Mexico, one of Mexico’s leading banks, as well as in Naver, a South Korea-based online search and mobile messenger company with users across Asia.
Meanwhile, we conducted some sales in favor of stocks that we considered more attractive within our investment universe. We reduced the Fund’s holdings mainly in China, South Korea and Hong Kong. From a sector perspective, we sold positions in information technology (IT), consumer discretionary and consumer staples.2 Key sales included reducing holdings in South Korea-based memory chip maker SK Hynix, Hong Kong-listed gaming company MGM China Holdings, and the aforementioned Tencent Holdings.
Thank you for your participation in Templeton Developing
Markets VIP Fund. We look forward to serving your future investment needs.
Top 10 Holdings
6/30/18
Company Sector/Industry, Country | % of Total Net Assets | |
Naspers Ltd. Media, South Africa | 7.9% | |
Samsung Electronics Co. Ltd. Technology Hardware, Storage & Peripherals, South Korea | 7.8% | |
Taiwan Semiconductor Manufacturing Co. Ltd. Semiconductors & Semiconductor Equipment, Taiwan | 6.5% | |
Brilliance China Automotive Holdings Ltd. Automobiles, China | 5.1% | |
Alibaba Group Holding Ltd. Internet Software & Services, China | 4.9% | |
Tencent Holdings Ltd. Internet Software & Services, China | 3.4% | |
Unilever PLC Personal Products, U.K. | 3.0% | |
ICICI Bank Ltd. Banks, India | 2.3% | |
LUKOIL PJSC Oil, Gas & Consumable Fuels, Russia | 2.1% | |
Sberbank of Russia PJSC Banks, Russia | 1.8% |
The foregoing information reflects our analysis, opinions and portfolio holdings as of June 30, 2018, the end of the reporting period. The way we implement our main investment strategies and the resulting portfolio holdings may change depending on factors such as market and economic conditions. These opinions may not be relied upon as investment advice or an offer for a particular security. The information is not a complete analysis of every aspect of any market, country, industry, security or the Fund. Statements of fact are from sources considered reliable, but the investment manager makes no representation or warranty as to their completeness or accuracy. Although historical performance is no guarantee of future results, these insights may help you understand our investment management philosophy.
2. The IT sector comprises electronic equipment, instruments and components; internet software and services; IT services; semiconductors and semiconductor equipment; and technology hardware, storage and peripherals in the SOI. The consumer discretionary sector comprises auto components; automobiles; distributors; hotels, restaurants and leisure; internet and direct marketing retail; media; and textiles, apparel and luxury goods in the SOI. The consumer staples sector comprises beverages, food and staples retailing, food products and personal products in the SOI.
TD-4 | Semiannual Report |
TEMPLETON DEVELOPING MARKETS VIP FUND
Class 2 Fund Expenses
As an investor in a variable insurance contract (Contract) that indirectly provides for investment in an underlying mutual fund, you can incur transaction and/or ongoing expenses at both the Fund level and the Contract Level: (1) transaction expenses can include sales charges (loads) on purchases, surrender fees, transfer fees and premium taxes; and (2) ongoing expenses can include management fees, distribution and service (12b-1) fees, contract fees, annual maintenance fees, mortality and expense risk fees and other fees and expenses. All mutual funds and Contracts have some types of ongoing expenses. The table below shows Fund-level ongoing expenses and can help you understand these costs and compare them with those of other mutual funds offered through the Contract. The table assumes a $1,000 investment held for the six months indicated. Please refer to the Fund prospectus for additional information on operating expenses.
Actual Fund Expenses
The table below provides information about the actual account values and actual expenses in the columns under the heading “Actual.” In these columns the Fund’s actual return, which includes the effect of ongoing Fund expenses but does not include the effect of ongoing Contract expenses, is used to calculate the “Ending Account Value.” You can estimate the Fund-level expenses you paid during the period by following these steps (of course, your account value and expenses will differ from those in this illustration): Divide your account value by $1,000 (if your account had an $8,600 value, then $8,600 ÷ $1,000 = 8.6). Then multiply the result by the number under the headings “Actual” and “Fund-Level Expenses Paid During Period” (if Fund-Level Expenses Paid During Period were $ 7.50, then 8.6 x $7.50 = $64.50). In this illustration, the estimated expenses paid this period at the Fund level are $64.50.
Hypothetical Example for Comparison with Other Mutual Funds
Under the heading “Hypothetical” in the table, information is provided about hypothetical account values and hypothetical expenses based on the Fund’s actual expense ratio and an assumed rate of return of 5% per year before expenses, which is not the Fund’s actual return. This information may not be used to estimate the actual ending account balance or expenses you paid for the period, but it can help you compare ongoing costs of investing in the Fund with those of other mutual funds offered through the Contract. To do so, compare this 5% hypothetical example with the 5% hypothetical examples that appear in the shareholder reports of other funds offered through the Contract.
Please note that expenses shown in the table are meant to highlight ongoing costs at the Fund level only and do not reflect any ongoing expenses at the Contract level, or transaction expenses at either the Fund or Contract levels. In addition, while the Fund does not have transaction expenses, if the transaction and ongoing expenses at the Contract level were included, the expenses shown below would be higher. You should consult your Contract prospectus or disclosure document for more information.
Actual (actual return after expenses) | Hypothetical (5% annual return before expenses) | |||||||||||
|
| |||||||||||
| Share Class | Beginning Account Value 1/1/18 | Ending Account Value 6/30/18 | Fund-Level Paid During Period 1/1/18–6/30/181,2 | Ending Value | Fund-Level Expenses Paid During Period 1/1/18–6/30/181,2 | Net Annualized Ratio2 | ||||||
| �� |
|
|
| ||||||||
Class 2 | $1,000 | $921.90 | $7.39 | $1,017.11 | $7.75 | 1.55% | ||||||
1. Expenses are equal to the annualized expense ratio for the six-month period as indicated above—in the far right column—multiplied by the simple average account value over the period indicated, and then multiplied by 181/365 to reflect the one-half year period.
2. Reflects expenses after fee waivers and expense reimbursements. Does not include any ongoing expenses of the Contract for which the Fund is an investment option or acquired fund fees and expenses.
| Semiannual Report |
|
TD-5 |
|
FRANKLIN TEMPLETON VARIABLE INSURANCE PRODUCTS TRUST
Financial Highlights
Templeton Developing Markets VIP Fund
Six Months Ended (unaudited) | Year Ended December 31, | |||||||||||||||||||||||
| 2017 | 2016 | 2015 | 2014 | 2013 | ||||||||||||||||||||
| ||||||||||||||||||||||||
Class 1 | ||||||||||||||||||||||||
| Per share operating performance (for a share outstanding throughout the period) | ||||||||||||||||||||||||
Net asset value, beginning of period | $10.31 | $7.42 | $6.37 | $9.27 | $10.26 | $10.58 | ||||||||||||||||||
|
| |||||||||||||||||||||||
| Income from investment operationsa: | ||||||||||||||||||||||||
Net investment incomeb | 0.05 | 0.08 | 0.05 | 0.06 | 0.15 | c | 0.13 | |||||||||||||||||
Net realized and unrealized gains (losses) | (0.84 | ) | 2.92 | 1.08 | (1.63 | ) | (0.97 | ) | (0.22) | |||||||||||||||
|
| |||||||||||||||||||||||
Total from investment operations | (0.79 | ) | 3.00 | 1.13 | (1.57 | ) | (0.82 | ) | (0.09) | |||||||||||||||
|
| |||||||||||||||||||||||
| Less distributions from: | ||||||||||||||||||||||||
Net investment income | (0.11 | ) | (0.11 | ) | (0.08 | ) | (0.20 | ) | (0.17 | ) | (0.23) | |||||||||||||
Net realized gains | — | — | — | (1.13 | ) | — | — | |||||||||||||||||
|
| |||||||||||||||||||||||
Total distributions | (0.11 | ) | (0.11 | ) | (0.08 | ) | (1.33 | ) | (0.17 | ) | (0.23) | |||||||||||||
|
| |||||||||||||||||||||||
| Redemption fees | — | — | — | — | — | d | —d | |||||||||||||||||
|
| |||||||||||||||||||||||
Net asset value, end of period | $9.41 | $10.31 | $7.42 | $6.37 | $9.27 | $10.26 | ||||||||||||||||||
|
| |||||||||||||||||||||||
Total returne | (7.69)% | 40.65% | 17.79% | (19.42)% | (8.09)% | (0.73)% | ||||||||||||||||||
| Ratios to average net assetsf | ||||||||||||||||||||||||
Expenses before waiver and payments by affiliates | 1.30% | 1.36% | 1.38% | 1.33% | 1.36% | 1.35% | ||||||||||||||||||
Expenses net of waiver and payments by affiliates | 1.30% | g | 1.35% | h | 1.36% | 1.32% | 1.36% | g | 1.35% | |||||||||||||||
Net investment income | 0.95% | 0.86% | 0.79% | 0.74% | 1.51% | c | 1.25% | |||||||||||||||||
| Supplemental data | ||||||||||||||||||||||||
Net assets, end of period (000’s) | $87,782 | $105,493 | $82,596 | $77,000 | $114,487 | $145,707 | ||||||||||||||||||
Portfolio turnover rate | 1.78% | 10.76% | 26.78% | 71.69% | 82.87% | 44.59% | ||||||||||||||||||
aThe amount shown for a share outstanding throughout the period may not correlate with the Statement of Operations for the period due to the timing of sales and repurchases of the Fund’s shares in relation to income earned and/or fluctuating fair value of the investments of the Fund.
bBased on average daily shares outstanding.
cNet investment income per share includes approximately $0.04 per share related to income received in the form of special dividends in connection with certain Fund holdings. Excluding this amount, the ratio of net investment income to average net assets would have been 1.11%.
dAmount rounds to less than $0.01 per share.
eTotal return does not include fees, charges or expenses imposed by the variable annuity and life insurance contracts for which Franklin Templeton Variable Insurance Products Trust serves as an underlying investment vehicle. Total return is not annualized for periods less than one year.
fRatios are annualized for periods less than one year.
gBenefit of waiver and payments by affiliates rounds to less than 0.01%.
hBenefit of expense reduction rounds to less than 0.01%.
TD-6 | Semiannual Report | The accompanying notes are an integral part of these financial statements. |
FRANKLIN TEMPLETON VARIABLE INSURANCE PRODUCTS TRUST
FINANCIAL HIGHLIGHTS
Templeton Developing Markets VIP Fund (continued)
Six Months Ended (unaudited) | Year Ended December 31, | |||||||||||||||||||||||
| 2017 | 2016 | 2015 | 2014 | 2013 | ||||||||||||||||||||
| ||||||||||||||||||||||||
Class 2 |
| |||||||||||||||||||||||
| Per share operating performance (for a share outstanding throughout the period) | ||||||||||||||||||||||||
Net asset value, beginning of period | $10.23 | $7.36 | $6.32 | $9.20 | $10.19 | $10.50 | ||||||||||||||||||
|
| |||||||||||||||||||||||
| Income from investment operationsa: | ||||||||||||||||||||||||
Net investment incomeb | 0.04 | 0.05 | 0.04 | 0.04 | 0.12 | c | 0.10 | |||||||||||||||||
Net realized and unrealized gains (losses) | (0.84 | ) | 2.91 | 1.06 | (1.61 | ) | (0.96 | ) | (0.21) | |||||||||||||||
|
| |||||||||||||||||||||||
Total from investment operations | (0.80 | ) | 2.96 | 1.10 | (1.57 | ) | (0.84 | ) | (0.11) | |||||||||||||||
|
| |||||||||||||||||||||||
Less distributions from: | ||||||||||||||||||||||||
Net investment income | (0.08 | ) | (0.09 | ) | (0.06 | ) | (0.18 | ) | (0.15 | ) | (0.20) | |||||||||||||
Net realized gains | — | — | — | (1.13 | ) | — | — | |||||||||||||||||
|
| |||||||||||||||||||||||
| Total distributions | (0.08 | ) | (0.09 | ) | (0.06 | ) | (1.31 | ) | (0.15 | ) | (0.20) | |||||||||||||
|
| |||||||||||||||||||||||
| Redemption fees | — | — | — | — | — | d | —d | |||||||||||||||||
| Net asset value, end of period | $9.35 | $10.23 | $7.36 | $6.32 | $9.20 | $10.19 | ||||||||||||||||||
|
| |||||||||||||||||||||||
Total returne | (7.81)% | 40.41% | 17.44% | (19.60)% | (8.39)% | (0.92)% | ||||||||||||||||||
| Ratios to average net assetsf | ||||||||||||||||||||||||
Expenses before waiver and payments by affiliates | 1.55% | 1.61% | 1.63% | 1.58% | 1.61% | 1.60% | ||||||||||||||||||
Expenses net of waiver and payments by affiliates | 1.55% | g | 1.60% | h | 1.61% | 1.57% | 1.61% | g | 1.60% | |||||||||||||||
Net investment income | 0.70% | 0.61% | 0.54% | 0.49% | 1.26% | c | 1.00% | |||||||||||||||||
| Supplemental data | ||||||||||||||||||||||||
Net assets, end of period (000’s) | $220,393 | $270,433 | $205,151 | $192,120 | $250,813 | $274,683 | ||||||||||||||||||
Portfolio turnover rate | 1.78% | 10.76% | 26.78% | 71.69% | 82.87% | 44.59% | ||||||||||||||||||
aThe amount shown for a share outstanding throughout the period may not correlate with the Statement of Operations for the period due to the timing of sales and repurchases of the Fund’s shares in relation to income earned and/or fluctuating fair value of the investments of the Fund.
bBased on average daily shares outstanding.
cNet investment income per share includes approximately $0.04 per share related to income received in the form of special dividends in connection with certain Fund holdings. Excluding this amount, the ratio of net investment income to average net assets would have been 0.86%.
dAmount rounds to less than $0.01 per share.
eTotal return does not include fees, charges or expenses imposed by the variable annuity and life insurance contracts for which Franklin Templeton Variable Insurance Products Trust serves as an underlying investment vehicle. Total return is not annualized for periods less than one year.
fRatios are annualized for periods less than one year.
gBenefit of waiver and payments by affiliates rounds to less than 0.01%.
hBenefit of expense reduction rounds to less than 0.01%.
| The accompanying notes are an integral part of these financial statements. | Semiannual Report |
|
TD-7 |
|
FRANKLIN TEMPLETON VARIABLE INSURANCE PRODUCTS TRUST
FINANCIAL HIGHLIGHTS
Templeton Developing Markets VIP Fund (continued)
Six Months Ended (unaudited) | Year Ended December 31, | |||||||||||||||||||||||
| 2017 | 2016 | 2015 | 2014 | 2013 | ||||||||||||||||||||
| ||||||||||||||||||||||||
Class 4 | ||||||||||||||||||||||||
| Per share operating performance (for a share outstanding throughout the period) |
| |||||||||||||||||||||||
Net asset value, beginning of period | $10.28 | $7.39 | $6.34 | $9.22 | $10.20 | $10.50 | ||||||||||||||||||
|
| |||||||||||||||||||||||
| Income from investment operationsa: | ||||||||||||||||||||||||
Net investment incomeb | 0.03 | 0.05 | 0.03 | 0.03 | 0.12 | c | 0.10 | |||||||||||||||||
Net realized and unrealized gains (losses) | (0.84 | ) | 2.92 | 1.06 | (1.62 | ) | (0.97 | ) | (0.21) | |||||||||||||||
|
| |||||||||||||||||||||||
Total from investment operations | (0.81 | ) | 2.97 | 1.09 | (1.59 | ) | (0.85 | ) | (0.11) | |||||||||||||||
|
| |||||||||||||||||||||||
| Less distributions from: | ||||||||||||||||||||||||
Net investment income | (0.07 | ) | (0.08 | ) | (0.04 | ) | (0.16 | ) | (0.13 | ) | (0.19) | |||||||||||||
Net realized gains | — | — | — | (1.13 | ) | — | — | |||||||||||||||||
|
| |||||||||||||||||||||||
Total distributions | (0.07 | ) | (0.08 | ) | (0.04 | ) | (1.29 | ) | (0.13 | ) | (0.19) | |||||||||||||
|
| |||||||||||||||||||||||
Redemption fees | — | — | — | — | — | d | —d | |||||||||||||||||
|
| |||||||||||||||||||||||
| Net asset value, end of period | $9.40 | $10.28 | $7.39 | $6.34 | $9.22 | $10.20 | ||||||||||||||||||
|
| |||||||||||||||||||||||
Total returne | (7.87)% | 40.30% | 17.32% | (19.70)% | (8.48)% | (1.07)% | ||||||||||||||||||
| Ratios to average net assetsf | ||||||||||||||||||||||||
Expenses before waiver and payments by affiliates | 1.65% | 1.71% | 1.73% | 1.68% | 1.71% | 1.70% | ||||||||||||||||||
Expenses net of waiver and payments by affiliates | 1.65% | g | 1.70% | h | 1.71% | 1.67% | 1.71% | g | 1.70% | |||||||||||||||
Net investment income | 0.60% | 0.51% | 0.44% | 0.39% | 1.16% | c | 0.90% | |||||||||||||||||
| Supplemental data | ||||||||||||||||||||||||
Net assets, end of period (000’s) | $6,154 | $7,199 | $6,377 | $7,109 | $11,106 | $15,225 | ||||||||||||||||||
Portfolio turnover rate | 1.78% | 10.76% | 26.78% | 71.69% | 82.87% | 44.59% | ||||||||||||||||||
aThe amount shown for a share outstanding throughout the period may not correlate with the Statement of Operations for the period due to the timing of sales and repurchases of the Fund’s shares in relation to income earned and/or fluctuating fair value of the investments of the Fund.
bBased on average daily shares outstanding.
cNet investment income per share includes approximately $0.04 per share related to income received in the form of special dividends in connection with certain Fund holdings. Excluding this amount, the ratio of net investment income to average net assets would have been 0.76%.
dAmount rounds to less than $0.01 per share.
eTotal return does not include fees, charges or expenses imposed by the variable annuity and life insurance contracts for which Franklin Templeton Variable Insurance Products Trust serves as an underlying investment vehicle. Total return is not annualized for periods less than one year.
fRatios are annualized for periods less than one year.
gBenefit of waiver and payments by affiliates rounds to less than 0.01%.
hBenefit of expense reduction rounds to less than 0.01%.
TD-8 | Semiannual Report | The accompanying notes are an integral part of these financial statements. |
FRANKLIN TEMPLETON VARIABLE INSURANCE PRODUCTS TRUST
Statement of Investments, June 30, 2018 (unaudited)
Templeton Developing Markets VIP Fund
| Industry | Shares | Value | ||||||||
Common Stocks 95.1% | ||||||||||
Belgium 0.4% | ||||||||||
Anheuser-Busch InBev SA/NV | Beverages | 12,444 | $ 1,257,619 | |||||||
|
| |||||||||
Brazil 1.1% | ||||||||||
a B2W Cia Digital | Internet & Direct Marketing Retail | 148,600 | 1,031,558 | |||||||
B3 SA - Brasil Bolsa Balcao | Capital Markets | 55,400 | 292,365 | |||||||
M. Dias Branco SA | Food Products | 136,200 | 1,314,533 | |||||||
Mahle-Metal Leve SA | Auto Components | 136,600 | 917,235 | |||||||
|
| |||||||||
| 3,555,691 | ||||||||||
|
| |||||||||
Cambodia 1.4% | ||||||||||
NagaCorp Ltd. | Hotels, Restaurants & Leisure | 4,780,800 | 4,344,492 | |||||||
|
| |||||||||
China 22.8% | ||||||||||
a Alibaba Group Holding Ltd., ADR | Internet Software & Services | 82,310 | 15,270,974 | |||||||
BAIC Motor Corp. Ltd., H | Automobiles | 1,686,100 | 1,611,735 | |||||||
a Baidu Inc., ADR | Internet Software & Services | 9,411 | 2,286,873 | |||||||
Brilliance China Automotive Holdings Ltd. | Automobiles | 8,909,300 | 16,078,879 | |||||||
China Mobile Ltd. | Wireless Telecommunication Services | 490,500 | 4,357,333 | |||||||
China Petroleum & Chemical Corp., H | Oil, Gas & Consumable Fuels | 4,030,000 | 3,600,576 | |||||||
CNOOC Ltd. | Oil, Gas & Consumable Fuels | 2,000,500 | 3,452,281 | |||||||
COSCO Shipping Ports Ltd. | Transportation Infrastructure | 1,091,638 | 909,924 | |||||||
Dah Chong Hong Holdings Ltd. | Distributors | 1,746,100 | 870,151 | |||||||
a Inner Mongolia Yitai Coal Co. Ltd., B | Oil, Gas & Consumable Fuels | 441,500 | 602,206 | |||||||
NetEase Inc., ADR | Internet Software & Services | 8,147 | 2,058,503 | |||||||
Ping An Bank Co. Ltd., A | Banks | 1,636,500 | 2,246,758 | |||||||
Ping An Insurance Group Co. of China Ltd., A | Insurance | 446,198 | 3,947,110 | |||||||
Poly Culture Group Corp. Ltd., H | Media | 229,200 | 365,152 | |||||||
Tencent Holdings Ltd. | Internet Software & Services | 213,900 | 10,735,825 | |||||||
Uni-President China Holdings Ltd. | Food Products | 2,099,700 | 2,697,533 | |||||||
Weifu High-Technology Co. Ltd., B | Auto Components | 334,339 | 727,820 | |||||||
|
| |||||||||
| 71,819,633 | ||||||||||
|
| |||||||||
Czech Republic 0.4% | ||||||||||
Moneta Money Bank AS | Banks | 390,403 | 1,339,889 | |||||||
|
| |||||||||
Hong Kong 1.7% | ||||||||||
Dairy Farm International Holdings Ltd. | Food & Staples Retailing | 149,333 | 1,312,637 | |||||||
MGM China Holdings Ltd. | Hotels, Restaurants & Leisure | 603,200 | 1,399,206 | |||||||
Sands China Ltd. | Hotels, Restaurants & Leisure | 469,600 | 2,510,782 | |||||||
|
| |||||||||
| 5,222,625 | ||||||||||
|
| |||||||||
Hungary 1.0% | ||||||||||
Richter Gedeon Nyrt | Pharmaceuticals | 177,170 | 3,238,997 | |||||||
|
| |||||||||
India 6.3% | ||||||||||
Bajaj Holdings & Investment Ltd. | Diversified Financial Services | 35,390 | 1,490,040 | |||||||
Biocon Ltd. | Biotechnology | 332,552 | 3,009,533 | |||||||
Coal India Ltd. | Oil, Gas & Consumable Fuels | 245,918 | 949,583 | |||||||
Glenmark Pharmaceuticals Ltd. | Pharmaceuticals | 292,323 | 2,489,613 | |||||||
ICICI Bank Ltd. | Banks | 1,806,409 | 7,266,799 | |||||||
Infosys Ltd. | IT Services | 119,268 | 2,277,346 | |||||||
Tata Chemicals Ltd. | Chemicals | 131,000 | 1,335,354 | |||||||
a Tata Motors Ltd., A | Automobiles | 401,271 | 929,910 | |||||||
|
| |||||||||
| 19,748,178 | ||||||||||
|
| |||||||||
| Semiannual Report |
|
TD-9 |
|
FRANKLIN TEMPLETON VARIABLE INSURANCE PRODUCTS TRUST
STATEMENT OF INVESTMENTS (UNAUDITED)
Templeton Developing Markets VIP Fund (continued)
| Industry | Shares | Value | ||||||||
Common Stocks (continued) | ||||||||||
Indonesia 2.9% | ||||||||||
Astra International Tbk PT | Automobiles | 10,115,100 | $ 4,658,734 | |||||||
Bank Danamon Indonesia Tbk PT | Banks | 5,707,000 | 2,538,878 | |||||||
Perusahaan Gas Negara (Persero) Tbk PT | Gas Utilities | 4,738,900 | 659,742 | |||||||
Semen Indonesia (Persero) Tbk PT | Construction Materials | 2,764,700 | 1,374,633 | |||||||
|
| |||||||||
| 9,231,987 | ||||||||||
|
| |||||||||
Kenya 0.3% | ||||||||||
Equity Group Holdings Ltd. | Banks | 2,127,994 | 975,419 | |||||||
|
| |||||||||
Mexico 2.0% | ||||||||||
Banco Santander Mexico SA Institucion de Banca Multiple Grupo Financiero Santander, ADR | Banks | 770,019 | 5,151,427 | |||||||
Nemak SAB de CV | Auto Components | 1,426,300 | 980,556 | |||||||
|
| |||||||||
| 6,131,983 | ||||||||||
|
| |||||||||
Nigeria 0.0%† | ||||||||||
Nigerian Breweries PLC | Beverages | 170,327 | 53,807 | |||||||
|
| |||||||||
Pakistan 0.6% | ||||||||||
Habib Bank Ltd. | Banks | 1,460,000 | 1,996,879 | |||||||
|
| |||||||||
Peru 1.3% | ||||||||||
Compania de Minas Buenaventura SA, ADR | Metals & Mining | 299,680 | 4,084,638 | |||||||
|
| |||||||||
Philippines 0.2% | ||||||||||
BDO Unibank Inc. | Banks | 327,469 | 770,140 | |||||||
|
| |||||||||
Russia 8.0% | ||||||||||
Gazprom PJSC, ADR | Oil, Gas & Consumable Fuels | 666,900 | 2,935,027 | |||||||
LUKOIL PJSC, ADR | Oil, Gas & Consumable Fuels | 95,300 | 6,516,614 | |||||||
a,b Mail.Ru Group Ltd., GDR, Reg S | Internet Software & Services | 127,199 | 3,688,771 | |||||||
MMC Norilsk Nickel PJSC, ADR | Metals & Mining | 63,900 | 1,147,005 | |||||||
Sberbank of Russia PJSC, ADR | Banks | 402,166 | 5,805,266 | |||||||
a Yandex NV, A | Internet Software & Services | 136,818 | 4,911,766 | |||||||
|
| |||||||||
| 25,004,449 | ||||||||||
|
| |||||||||
Singapore 0.2% | ||||||||||
DBS Group Holdings Ltd. | Banks | 25,706 | 502,064 | |||||||
|
| |||||||||
South Africa 8.8% | ||||||||||
Massmart Holdings Ltd. | Food & Staples Retailing | 293,714 | 2,391,047 | |||||||
MTN Group Ltd. | Wireless Telecommunication Services | 80,702 | 635,078 | |||||||
Naspers Ltd., N | Media | 97,448 | 24,768,350 | |||||||
|
| |||||||||
| 27,794,475 | ||||||||||
|
| |||||||||
South Korea 17.2% | ||||||||||
Daelim Industrial Co. Ltd. | Construction & Engineering | 32,958 | 2,260,433 | |||||||
Fila Korea Ltd. | Textiles, Apparel & Luxury Goods | 147,630 | 4,453,783 | |||||||
Hankook Tire Co. Ltd. | Auto Components | 21,600 | 815,277 | |||||||
Hankook Tire Worldwide Co. Ltd. | Diversified Financial Services | 37,500 | 588,354 | |||||||
Hanon Systems | Auto Components | 198,341 | 1,884,897 | |||||||
HDC Holdings Co. Ltd. | Construction & Engineering | 30,176 | 773,744 | |||||||
a HDC Hyundai Development Co-Engineering & Construction | Construction & Engineering | 49,151 | 2,375,147 | |||||||
Hite Jinro Co. Ltd. | Beverages | 64,320 | 1,133,125 | |||||||
Interpark Holdings Corp. | Internet & Direct Marketing Retail | 142,053 | 359,781 | |||||||
KT Skylife Co. Ltd. | Media | 176,060 | 2,162,473 | |||||||
LG Corp. | Industrial Conglomerates | 19,524 | 1,262,041 | |||||||
Naver Corp. | Internet Software & Services | 6,587 | 4,505,900 | |||||||
POSCO | Metals & Mining | 13,592 | 4,009,116 | |||||||
TD-10 | Semiannual Report |
FRANKLIN TEMPLETON VARIABLE INSURANCE PRODUCTS TRUST
STATEMENT OF INVESTMENTS (UNAUDITED)
Templeton Developing Markets VIP Fund (continued)
| Industry | Shares | Value | ||||||||
Common Stocks (continued) | ||||||||||
South Korea (continued) | ||||||||||
Samsung Electronics Co. Ltd. | Technology Hardware, Storage & Peripherals | 588,200 | $ 24,600,619 | |||||||
SK Hynix Inc | Semiconductors & Semiconductor Equipment | 37,980 | 2,918,133 | |||||||
|
| |||||||||
| 54,102,823 | ||||||||||
|
| |||||||||
Taiwan 10.6% | ||||||||||
Catcher Technology Co. Ltd. | Technology Hardware, Storage & Peripherals | 341,000 | 3,817,248 | |||||||
FIT Hon Teng Ltd. | Electronic Equipment, Instruments | |||||||||
& Components | 1,759,800 | 796,234 | ||||||||
Hon Hai Precision Industry Co. Ltd. | Electronic Equipment, Instruments | |||||||||
& Components | 1,906,500 | 5,207,170 | ||||||||
Largan Precision Co. Ltd. | Electronic Equipment, Instruments | |||||||||
& Components | 11,900 | 1,754,021 | ||||||||
Pegatron Corp. | Technology Hardware, Storage & Peripherals | 563,800 | 1,160,471 | |||||||
Taiwan Semiconductor Manufacturing Co. Ltd. | Semiconductors & Semiconductor Equipment | 2,879,000 | 20,461,673 | |||||||
|
| |||||||||
| 33,196,817 | ||||||||||
|
| |||||||||
Thailand 3.9% | ||||||||||
Kasikornbank PCL, fgn | Banks | 619,500 | 3,754,546 | |||||||
Kiatnakin Bank PCL, fgn | Banks | 1,009,800 | 2,073,150 | |||||||
Land and Houses PCL, fgn | Real Estate Management & Development | 4,853,900 | 1,662,093 | |||||||
PTT Exploration and Production PCL, fgn | Oil, Gas & Consumable Fuels | 241,600 | 1,028,630 | |||||||
Siam Commercial Bank PCL, fgn | Banks | 306,400 | 1,100,255 | |||||||
Thai Beverage PCL, fgn | Beverages | 4,816,500 | 2,545,326 | |||||||
|
| |||||||||
| 12,164,000 | ||||||||||
|
| |||||||||
United Kingdom 3.0% | ||||||||||
Unilever PLC | Personal Products | 167,932 | 9,296,640 | |||||||
|
| |||||||||
United States 1.0% | ||||||||||
a IMAX Corp | Media | 135,942 | 3,011,115 | |||||||
|
| |||||||||
Total Common Stocks (Cost $216,603,137) | 298,844,360 | |||||||||
|
| |||||||||
c Participatory Notes (Cost $1,403,975) 0.5% | ||||||||||
Saudi Arabia 0.5% | ||||||||||
HSBC Bank PLC, Saudi Basic Industries Corp., 1/19/21 | Chemicals | 51,820 | 1,743,753 | |||||||
|
| |||||||||
Preferred Stocks 3.2% | ||||||||||
Brazil 3.2% | ||||||||||
d Banco Bradesco SA, 5.48%, ADR, pfd | Banks | 690,596 | 4,737,489 | |||||||
d Itau Unibanco Holding SA, 8.866%, ADR, pfd | Banks | 517,962 | 5,376,445 | |||||||
|
| |||||||||
Total Preferred Stocks (Cost $5,860,355) | 10,113,934 | |||||||||
|
| |||||||||
Total Investments before Short Term Investments (Cost $223,867,467) | 310,702,047 | |||||||||
|
| |||||||||
Short Term Investments (Cost $1,862,370) 0.6% | ||||||||||
Money Market Funds 0.6% | ||||||||||
United States 0.6% | ||||||||||
e,f Institutional Fiduciary Trust Money Market Portfolio, 1.51% | 1,862,370 | 1,862,370 | ||||||||
|
| |||||||||
Total Investments (Cost $225,729,837) 99.4% | 312,564,417 | |||||||||
Other Assets, less Liabilities 0.6% | 1,763,651 | |||||||||
|
| |||||||||
Net Assets 100.0% | $314,328,068 | |||||||||
|
| |||||||||
| Semiannual Report |
|
TD-11 |
|
FRANKLIN TEMPLETON VARIABLE INSURANCE PRODUCTS TRUST
STATEMENT OF INVESTMENTS (UNAUDITED)
Templeton Developing Markets VIP Fund (continued)
See Abbreviations on page TD-22.
†Rounds to less than 0.1% of net assets.
aNon-income producing.
bSecurity was purchased pursuant to Regulation S under the Securities Act of 1933, which exempts from registration securities offered and sold outside of the United States. Such a security cannot be sold in the United States without either an effective registration statement filed pursuant to the Securities Act of 1933, or pursuant to an exemption from registration. This security has been deemed liquid under guidelines approved by the Trust’s Board of Trustees. At June 30, 2018, the value of this security was $3,688,771, representing 1.2% of net assets.
cSee Note 1(c) regarding Participatory Notes.
dVariable rate security. The rate shown represents the yield at period end.
eSee Note 3(e) regarding investments in affiliated management investment companies.
fThe rate shown is the annualized seven-day effective yield at period end.
TD-12 | Semiannual Report | The accompanying notes are an integral part of these financial statements. |
FRANKLIN TEMPLETON VARIABLE INSURANCE PRODUCTS TRUST
Financial Statements
Statement of Assets and Liabilities
June 30, 2018 (unaudited)
Templeton VIP Fund | ||||
Assets: | ||||
Investments in securities: | ||||
Cost - Unaffiliated issuers | $223,867,467 | |||
Cost - Non-controlled affiliates (Note 3e) | 1,862,370 | |||
|
| |||
Value - Unaffiliated issuers | $310,702,047 | |||
Value - Non-controlled affiliates (Note 3e) | 1,862,370 | |||
Foreign currency, at value (cost $11,190) | 11,190 | |||
Receivables: | ||||
Investment securities sold | 1,171,090 | |||
Capital shares sold | 201,329 | |||
Dividends | 1,496,452 | |||
Foreign tax refund | 22,404 | |||
Other assets | 260 | |||
|
| |||
Total assets | 315,467,142 | |||
|
| |||
Liabilities: | ||||
Payables: | ||||
Capital shares redeemed | 359,983 | |||
Management fees | 279,336 | |||
Distribution fees | 101,265 | |||
Reports to shareholders | 74,072 | |||
Deferred tax | 249,187 | |||
Accrued expenses and other liabilities. | 75,231 | |||
|
| |||
Total liabilities | 1,139,074 | |||
|
| |||
Net assets, at value | $314,328,068 | |||
|
| |||
Net assets consist of: | ||||
Paid-in capital | $240,937,924 | |||
Distributions in excess of net investment income | (20,426 | ) | ||
Net unrealized appreciation (depreciation) | 86,556,822 | |||
Accumulated net realized gain (loss) | (13,146,252 | ) | ||
|
| |||
Net assets, at value | $314,328,068 | |||
|
| |||
| Class 1: | ||||
Net assets, at value | $ 87,781,537 | |||
|
| |||
Shares outstanding | 9,325,509 | |||
|
| |||
Net asset value and maximum offering price per share | $9.41 | |||
|
| |||
| Class 2: | ||||
Net assets, at value | $220,392,764 | |||
|
| |||
Shares outstanding | 23,580,188 | |||
|
| |||
Net asset value and maximum offering price per share | $9.35 | |||
|
| |||
| Class 4: | ||||
Net assets, at value | $ 6,153,767 | |||
|
| |||
Shares outstanding | 654,694 | |||
|
| |||
Net asset value and maximum offering price per share | $9.40 | |||
|
| |||
| The accompanying notes are an integral part of these financial statements. | Semiannual Report |
|
TD-13 |
|
FRANKLIN TEMPLETON VARIABLE INSURANCE PRODUCTS TRUST
FINANCIAL STATEMENTS
Statement of Operations
for the six months ended June 30, 2018 (unaudited)
| Templeton Developing Markets VIP Fund | ||||
Investment income: | ||||
Dividends: (net of foreign taxes)* | ||||
Unaffiliated issuers | $ 4,054,911 | |||
Non-controlled affiliates (Note 3e) | 8,814 | |||
|
| |||
Total investment income | 4,063,725 | |||
|
| |||
Expenses: | ||||
Management fees (Note 3a) | 2,146,662 | |||
Distribution fees: (Note 3c) | ||||
Class 2 | 318,312 | |||
Class 4 | 11,951 | |||
Custodian fees (Note 4) | 64,288 | |||
Reports to shareholders | 78,967 | |||
Professional fees | 39,502 | |||
Trustees’ fees and expenses | 875 | |||
Other | 14,361 | |||
|
| |||
Total expenses | 2,674,918 | |||
Expenses waived/paid by affiliates (Note 3e) | (2,904 | ) | ||
|
| |||
Net expenses | 2,672,014 | |||
|
| |||
Net investment income | 1,391,711 | |||
|
| |||
Realized and unrealized gains (losses): | ||||
Net realized gain (loss) from: | ||||
Investments: | ||||
Unaffiliated issuers | 14,951,646 | |||
Foreign currency transactions | (50,073 | ) | ||
|
| |||
Net realized gain (loss) | 14,901,573 | |||
|
| |||
Net change in unrealized appreciation (depreciation) on: | ||||
Investments: | ||||
Unaffiliated issuers | (44,021,324 | ) | ||
Translation of other assets and liabilities denominated in foreign currencies | (15,117 | ) | ||
Change in deferred taxes on unrealized appreciation | 412,851 | |||
|
| |||
Net change in unrealized appreciation (depreciation) | (43,623,590 | ) | ||
|
| |||
Net realized and unrealized gain (loss) | (28,722,017 | ) | ||
|
| |||
Net increase (decrease) in net assets resulting from operations | $(27,330,306 | ) | ||
|
| |||
*Foreign taxes withheld on dividends | $ 635,816 | |||
TD-14 | Semiannual Report | The accompanying notes are an integral part of these financial statements. |
FRANKLIN TEMPLETON VARIABLE INSURANCE PRODUCTS TRUST
FINANCIAL STATEMENTS
Statements of Changes in Net Assets
| Templeton Developing Markets VIP Fund | ||||||||
| Six Months Ended June 30, 2018 (unaudited) | Year Ended December 31, 2017 | |||||||
Increase (decrease) in net assets: | ||||||||
Operations: | ||||||||
Net investment income | $1,391,711 | $ 2,374,437 | ||||||
Net realized gain (loss) | 14,901,573 | 15,871,903 | ||||||
Net change in unrealized appreciation (depreciation) | (43,623,590 | ) | 97,762,101 | |||||
|
| |||||||
Net increase (decrease) in net assets resulting from operations | (27,330,306 | ) | 116,008,441 | |||||
|
| |||||||
Distributions to shareholders from: | ||||||||
Net investment income: | ||||||||
Class 1 | (1,013,838 | ) | (1,158,124 | ) | ||||
Class 2 | (1,947,210 | ) | (2,409,152 | ) | ||||
Class 4 | (46,243 | ) | (56,318 | ) | ||||
|
| |||||||
Total distributions to shareholders | (3,007,291 | ) | (3,623,594 | ) | ||||
|
| |||||||
Capital share transactions: (Note 2) | ||||||||
Class 1 | (9,191,054 | ) | (8,439,257 | ) | ||||
Class 2 | (28,786,843 | ) | (13,542,309 | ) | ||||
Class 4 | (481,542 | ) | (1,401,998 | ) | ||||
|
| |||||||
Total capital share transactions | (38,459,439 | ) | (23,383,564 | ) | ||||
|
| |||||||
Net increase (decrease) in net assets | (68,797,036 | ) | 89,001,283 | |||||
Net assets: | ||||||||
Beginning of period | 383,125,104 | 294,123,821 | ||||||
|
| |||||||
End of period | $314,328,068 | $383,125,104 | ||||||
|
| |||||||
Undistributed net investment income included in net assets: | ||||||||
End of period | $ — | $ 1,595,154 | ||||||
|
| |||||||
Distributions in excess of net investment income included in net assets: | ||||||||
End of period | $ (20,426 | ) | $ — | |||||
|
| |||||||
| The accompanying notes are an integral part of these financial statements. | Semiannual Report |
|
TD-15 |
|
FRANKLIN TEMPLETON VARIABLE INSURANCE PRODUCTS TRUST
Notes to Financial Statements (unaudited)
Templeton Developing Markets VIP Fund
1. Organization and Significant Accounting Policies
Franklin Templeton Variable Insurance Products Trust (Trust) is registered under the Investment Company Act of 1940 (1940 Act) as an open-end management investment company, consisting of eighteen separate funds and applies the specialized accounting and reporting guidance in U.S. Generally Accepted Accounting Principles (U.S. GAAP). Templeton Developing Markets VIP Fund (Fund) is included in this report. Shares of the Fund are generally sold only to insurance company separate accounts to fund the benefits of variable life insurance policies or variable annuity contracts. The Fund offers three classes of shares: Class 1, Class 2 and Class 4. Each class of shares may differ by its distribution fees, voting rights on matters affecting a single class and its exchange privilege.
The following summarizes the Fund’s significant accounting policies.
a. Financial Instrument Valuation
The Fund’s investments in financial instruments are carried at fair value daily. Fair value is the price that would be received to sell an asset or paid to transfer a liability in an orderly transaction between market participants on the measurement date. The Fund calculates the net asset value (NAV) per share each business day as of 4 p.m. Eastern time or the regularly scheduled close of the New York Stock Exchange (NYSE), whichever is earlier. Under compliance policies and procedures approved by the Trust’s Board of Trustees (the Board), the Fund’s administrator has responsibility for oversight of valuation, including leading the cross-functional Valuation Committee (VC). The VC provides administration and oversight of the Fund’s valuation policies and procedures, which are approved annually by the Board. Among other things, these procedures allow the Fund to utilize independent pricing services, quotations from securities and financial instrument dealers, and other market sources to determine fair value.
Equity securities listed on an exchange or on the NASDAQ National Market System are valued at the last quoted sale price or the official closing price of the day, respectively. Foreign equity securities are valued as of the close of trading on the foreign stock exchange on which the security is primarily traded, or as of 4 p.m. Eastern time. The value is then converted into its U.S. dollar equivalent at the foreign exchange rate in effect at 4 p.m. Eastern time on the day that the value of the security is determined. Over-the-counter (OTC) securities are
valued within the range of the most recent quoted bid and ask prices. Securities that trade in multiple markets or on multiple exchanges are valued according to the broadest and most representative market. Certain equity securities are valued based upon fundamental characteristics or relationships to similar securities.
Investments in open-end mutual funds are valued at the closing NAV.
The Fund has procedures to determine the fair value of financial instruments for which market prices are not reliable or readily available. Under these procedures, the VC convenes on a regular basis to review such financial instruments and considers a number of factors, including significant unobservable valuation inputs, when arriving at fair value. The VC primarily employs a market-based approach which may use related or comparable assets or liabilities, recent transactions, market multiples, book values, and other relevant information for the investment to determine the fair value of the investment. An income-based valuation approach may also be used in which the anticipated future cash flows of the investment are discounted to calculate fair value. Discounts may also be applied due to the nature or duration of any restrictions on the disposition of the investments. Due to the inherent uncertainty of valuations of such investments, the fair values may differ significantly from the values that would have been used had an active market existed. The VC employs various methods for calibrating these valuation approaches including a regular review of key inputs and assumptions, transactional back-testing or disposition analysis, and reviews of any related market activity.
Trading in securities on foreign securities stock exchanges and OTC markets may be completed before 4 p.m. Eastern time. In addition, trading in certain foreign markets may not take place on every Fund’s business day. Occasionally, events occur between the time at which trading in a foreign security is completed and 4 p.m. Eastern time that might call into question the reliability of the value of a portfolio security held by the Fund. As a result, differences may arise between the value of the Fund’s portfolio securities as determined at the foreign market close and the latest indications of value at 4 p.m. Eastern time. In order to minimize the potential for these differences, the VC monitors price movements following the close of trading in foreign stock markets through a series of country specific market proxies (such as baskets of American Depositary Receipts, futures contracts and exchange traded funds). These price movements are measured against
TD-16 | Semiannual Report |
FRANKLIN TEMPLETON VARIABLE INSURANCE PRODUCTS TRUST
NOTES TO FINANCIAL STATEMENTS (UNAUDITED)
Templeton Developing Markets VIP Fund (continued)
established trigger thresholds for each specific market proxy to assist in determining if an event has occurred that may call into question the reliability of the values of the foreign securities held by the Fund. If such an event occurs, the securities may be valued using fair value procedures, which may include the use of independent pricing services.
When the last day of the reporting period is a non-business day, certain foreign markets may be open on those days that the Fund’s NAV is not calculated, which could result in differences between the value of the Fund’s portfolio securities on the last business day and the last calendar day of the reporting period. Any significant security valuation changes due to an open foreign market are adjusted and reflected by the Fund for financial reporting purposes.
b. Foreign Currency Translation
Portfolio securities and other assets and liabilities denominated in foreign currencies are translated into U.S. dollars based on the exchange rate of such currencies against U.S. dollars on the date of valuation. The Fund may enter into foreign currency exchange contracts to facilitate transactions denominated in a foreign currency. Purchases and sales of securities, income and expense items denominated in foreign currencies are translated into U.S. dollars at the exchange rate in effect on the transaction date. Portfolio securities and assets and liabilities denominated in foreign currencies contain risks that those currencies will decline in value relative to the U.S. dollar. Occasionally, events may impact the availability or reliability of foreign exchange rates used to convert the U.S. dollar equivalent value. If such an event occurs, the foreign exchange rate will be valued at fair value using procedures established and approved by the Board.
The Fund does not separately report the effect of changes in foreign exchange rates from changes in market prices on securities held. Such changes are included in net realized and unrealized gain or loss from investments in the Statement of Operations.
Realized foreign exchange gains or losses arise from sales of foreign currencies, currency gains or losses realized between the trade and settlement dates on securities transactions and the difference between the recorded amounts of dividends, interest, and foreign withholding taxes and the U.S. dollar equivalent of the amounts actually received or paid. Net unrealized foreign exchange gains and losses arise from changes in foreign
exchange rates on foreign denominated assets and liabilities other than investments in securities held at the end of the reporting period.
c. Participatory Notes
The Fund invests in Participatory Notes (P-Notes). P-Notes are promissory notes that are designed to offer a return linked to the performance of a particular underlying equity security or market. P-Notes are issued by banks or broker-dealers and allow the Fund to gain exposure to common stocks in certain foreign markets without registering with the market regulator. Income received from P-Notes is recorded as dividend income in the Statement of Operations. P-Notes may contain various risks including the potential inability of the counterparty to fulfill their obligations under the terms of the contract. These securities may be more volatile and less liquid than other investments held by the Fund.
d. Income and Deferred Taxes
It is the Fund’s policy to qualify as a regulated investment company under the Internal Revenue Code. The Fund intends to distribute to shareholders substantially all of its taxable income and net realized gains to relieve it from federal income and if applicable, excise taxes. As a result, no provision for U.S. federal income taxes is required.
The Fund may be subject to foreign taxation related to income received, capital gains on the sale of securities and certain foreign currency transactions in the foreign jurisdictions in which it invests. Foreign taxes, if any, are recorded based on the tax regulations and rates that exist in the foreign markets in which the Fund invests. When a capital gain tax is determined to apply, the Fund records an estimated deferred tax liability in an amount that would be payable if the securities were disposed of on the valuation date.
The Fund may recognize an income tax liability related to its uncertain tax positions under U.S. GAAP when the uncertain tax position has a less than 50% probability that it will be sustained upon examination by the tax authorities based on its technical merits. As of June 30, 2018, the Fund has determined that no tax liability is required in its financial statements related to uncertain tax positions for any open tax years (or expected to be taken in future tax years). Open tax years are those that remain subject to examination and are based on the statute of limitations in each jurisdiction in which the Fund invests.
| Semiannual Report |
|
TD-17 |
|
FRANKLIN TEMPLETON VARIABLE INSURANCE PRODUCTS TRUST
NOTES TO FINANCIAL STATEMENTS (UNAUDITED)
Templeton Developing Markets VIP Fund (continued)
1. Organization and Significant Accounting
Policies (continued)
e. Security Transactions, Investment Income, Expenses and Distributions
Security transactions are accounted for on trade date. Realized gains and losses on security transactions are determined on a specific identification basis. Estimated expenses are accrued daily. Dividend income is recorded on the ex-dividend date except for certain dividends from securities where the dividend rate is not available. In such cases, the dividend is recorded as soon as the information is received by the Fund. Distributions to shareholders are recorded on the ex-dividend date. Distributable earnings are determined according to income tax regulations (tax basis) and may differ from earnings recorded in accordance with U.S. GAAP. These differences may be permanent or temporary. Permanent differences are reclassified among capital accounts to reflect their tax character. These reclassifications have no impact on net assets or the results of operations. Temporary differences are not reclassified, as they may reverse in subsequent periods.
Common expenses incurred by the Trust are allocated among the Funds based on the ratio of net assets of each Fund to the combined net assets of the Trust or based on the ratio of number of shareholders of each Fund to the combined number of shareholders of the Trust. Fund specific expenses are charged directly to the Fund that incurred the expense.
Realized and unrealized gains and losses and net investment income, excluding class specific expenses, are allocated daily to each class of shares based upon the relative proportion of net assets of each class. Differences in per share distributions by class are generally due to differences in class specific expenses.
f. Accounting Estimates
The preparation of financial statements in accordance with U.S. GAAP requires management to make estimates and assumptions that affect the reported amounts of assets and liabilities at the date of the financial statements and the amounts of income and expenses during the reporting period. Actual results could differ from those estimates.
g. Guarantees and Indemnifications
Under the Trust’s organizational documents, its officers and trustees are indemnified by the Trust against certain liabilities arising out of the performance of their duties to the Trust. Additionally, in the normal course of business, the Trust, on behalf of the Fund, enters into contracts with service providers that contain general indemnification clauses. The Trust’s maximum exposure under these arrangements is unknown as this would involve future claims that may be made against the Trust that have not yet occurred. Currently, the Trust expects the risk of loss to be remote.
2. Shares of Beneficial Interest
At June 30, 2018, there were an unlimited number of shares authorized (without par value). Transactions in the Fund’s shares were as follows:
Six Months Ended June 30, 2018 | Year Ended December 31, 2017 | |||||||||||||||||||
| Shares | Amount | Shares | Amount | |||||||||||||||||
| Class 1 Shares: | ||||||||||||||||||||
Shares sold | 388,890 | $ | 4,044,488 | 1,136,991 | $ | 10,043,847 | ||||||||||||||
Shares issued in reinvestment of distributions | 105,170 | 1,013,838 | 132,055 | 1,158,124 | ||||||||||||||||
Shares redeemed | (1,396,049 | ) | (14,249,380 | ) | (2,176,842 | ) | (19,641,228 | ) | ||||||||||||
|
| |||||||||||||||||||
Net increase (decrease) | (901,989 | ) | $ | (9,191,054 | ) | (907,796 | ) | $ | (8,439,257 | ) | ||||||||||
|
| |||||||||||||||||||
| Class 2 Shares: | ||||||||||||||||||||
Shares sold | 2,492,278 | $ | 25,493,243 | 6,636,331 | $ | 58,458,562 | ||||||||||||||
Shares issued in reinvestment of distributions | 203,470 | 1,947,210 | 276,596 | 2,409,152 | ||||||||||||||||
Shares redeemed | (5,557,181 | ) | (56,227,296 | ) | (8,351,598 | ) | (74,410,023 | ) | ||||||||||||
|
| |||||||||||||||||||
Net increase (decrease) | (2,861,433 | ) | $ | (28,786,843 | ) | (1,438,671 | ) | $ | (13,542,309 | ) | ||||||||||
|
| |||||||||||||||||||
TD-18 | Semiannual Report |
FRANKLIN TEMPLETON VARIABLE INSURANCE PRODUCTS TRUST
NOTES TO FINANCIAL STATEMENTS (UNAUDITED)
Templeton Developing Markets VIP Fund (continued)
| Six Months Ended June 30, 2018 | Year Ended December 31, 2017 | |||||||||||||||||||
| Shares | Amount | Shares | Amount | |||||||||||||||||
| Class 4 Shares: | ||||||||||||||||||||
Shares sold | 37,504 | $ | 374,300 | 85,028 | $ | 793,112 | ||||||||||||||
Shares issued in reinvestment of distributions | 4,802 | 46,243 | 6,437 | 56,318 | ||||||||||||||||
Shares redeemed | (87,994 | ) | (902,085 | ) | (253,881 | ) | (2,251,428 | ) | ||||||||||||
|
| |||||||||||||||||||
Net increase (decrease) | (45,688 | ) | $ | (481,542 | ) | (162,416 | ) | $ | (1,401,998 | ) | ||||||||||
|
| |||||||||||||||||||
3. Transactions with Affiliates
Franklin Resources, Inc. is the holding company for various subsidiaries that together are referred to as Franklin Templeton Investments. Certain officers and trustees of the Fund are also officers and/or trustees of the following subsidiaries:
| Subsidiary | Affiliation | |
Templeton Asset Management Ltd. (TAML) | Investment manager | |
Franklin Templeton Services, LLC (FT Services) | Administrative manager | |
Franklin Templeton Distributors, Inc. (Distributors) | Principal underwriter | |
Franklin Templeton Investor Services, LLC (Investor Services) | Transfer agent |
a. Management Fees
Effective May 1, 2018, the Fund pays an investment management fee to TAML based on the average daily net assets of the Fund as follows:
| Annualized Fee Rate | Net Assets | |
1.050% | Up to and including $1 billion | |
1.000% | Over $1 billion, up to and including $5 billion | |
0.950% | Over $5 billion, up to and including $10 billion | |
0.900% | Over $10 billion, up to and including $15 billion | |
0.850% | Over $15 billion, up to and including $20 billion | |
0.800% | In excess of $20 billion |
Prior to May 1, 2018, the Fund paid fees to TAML based on the average daily net assets of the Fund as follows:
| Annualized Fee Rate | Net Assets | |
1.250% | Up to and including $200 million | |
1.235% | Over $200 million, up to and including $700 million | |
1.200% | Over $700 million, up to and including $1 billion | |
1.150% | Over $1 billion, up to and including $1.2 billion | |
1.125% | Over $1.2 billion, up to and including $5 billion | |
1.075% | Over $5 billion, up to and including $10 billion | |
1.025% | Over $10 billion, up to and including $15 billion | |
0.975% | Over $15 billion, up to and including $20 billion | |
0.925% | In excess of $20 billion |
For the period ended June 30, 2018, the annualized gross effective investment management fee rate was 1.186% of the Fund’s average daily net assets.
| Semiannual Report |
|
TD-19 |
|
FRANKLIN TEMPLETON VARIABLE INSURANCE PRODUCTS TRUST
NOTES TO FINANCIAL STATEMENTS (UNAUDITED)
Templeton Developing Markets VIP Fund (continued)
3. Transactions with Affiliates (continued)
b. Administrative Fees
Under an agreement with TAML, FT Services provides administrative services to the Fund. The fee is paid by TAML based on the Fund’s average daily net assets, and is not an additional expense of the Fund.
c. Distribution Fees
The Board has adopted distribution plans for Class 2 and Class 4 shares pursuant to Rule 12b-1 under the 1940 Act. Under the Fund’s compensation distribution plans, the Fund pays Distributors for costs incurred in connection with the servicing, sale and distribution of the Fund’s shares up to 0.25% and 0.35% per year of its average daily net assets of Class 2 and Class 4 respectively. The plan year, for purposes of monitoring compliance with the maximum annual plan rates, is February 1 through January 31.
d. Transfer Agent Fees
Investor Services, under terms of an agreement, performs shareholder servicing for the Fund and is not paid by the Fund for the services.
e. Investments in Affiliated Management Investment Companies
The Fund invests in one or more affiliated management investment companies for purposes other than exercising a controlling influence over the management or policies. Management fees paid by the Fund are waived on assets invested in the affiliated management investment companies, as noted in the Statement of Operations, in an amount not to exceed the management and administrative fees paid directly or indirectly by each affiliate. Prior to January 1, 2014, the waiver was accounted for as a reduction to management fees. During the period ended June 30, 2018, the Fund held investments in affiliated management investment companies as follows:
| Number of Shares Held at Beginning of Period | Gross Additions | Gross Reductions | Number of Shares Held at End of Period | Value at End of Period | Dividend Income | Realized Gain (Loss) | Net Change in Unrealized Appreciation (Depreciation) | |||||||||||||||||||||||
| Non-Controlled Affiliates | ||||||||||||||||||||||||||||||
Institutional Fiduciary Trust Money Market Portfolio, 1.51% | 1,128,203 | 21,905,607 | (21,171,440 | ) | 1,862,370 | $ | 1,862,370 | $ | 8,814 | $ — | $ — | |||||||||||||||||||
|
| |||||||||||||||||||||||||||||
4. Expense Offset Arrangement
The Fund has entered into an arrangement with its custodian whereby credits realized as a result of uninvested cash balances are used to reduce a portion of the Fund’s custodian expenses. During the period ended June 30, 2018, there were no credits earned.
5. Income Taxes
For tax purposes, capital losses may be carried over to offset future capital gains, if any. At December 31, 2017, the capital loss carryforwards were as follows:
Capital loss carryforwards not subject to expiration: | ||||
Short Term | $ | 17,661,798 | ||
Long Term | 7,528,497 | |||
|
| |||
Total capital loss carryforwards | $ | 25,190,295 | ||
|
| |||
TD-20 | Semiannual Report |
FRANKLIN TEMPLETON VARIABLE INSURANCE PRODUCTS TRUST
NOTES TO FINANCIAL STATEMENTS (UNAUDITED)
Templeton Developing Markets VIP Fund (continued)
At June 30, 2018, the cost of investments and net unrealized appreciation (depreciation) for income tax purposes were as follows:
Cost of investments | $ | 230,611,976 | ||
|
|
| ||
Unrealized appreciation | $ | 99,880,240 | ||
Unrealized depreciation | (17,927,799 | ) | ||
|
|
| ||
Net unrealized appreciation (depreciation) | $ | 81,952,441 | ||
|
|
| ||
Differences between income and/or capital gains as determined on a book basis and a tax basis are primarily due to differing treatment of corporate actions.
6. Investment Transactions
Purchases and sales of investments (excluding short term securities) for the period ended June 30, 2018, aggregated $6,428,581 and $49,027,914, respectively.
7. Concentration of Risk
Investing in foreign securities may include certain risks and considerations not typically associated with investing in U.S. securities, such as fluctuating currency values and changing local and regional economic, political and social conditions, which may result in greater market volatility. In addition, certain foreign securities may not be as liquid as U.S. securities.
The United States and other nations have imposed and could impose additional sanctions on certain issuers in Russia due to regional conflicts. These sanctions could result in the devaluation of Russia’s currency, a downgrade in Russian issuers’ credit ratings, or a decline in the value and liquidity of Russian stocks or other securities. Such sanctions could also adversely affect Russia’s economy, possibly forcing the economy into a recession. The Fund may be prohibited from investing in securities issued by companies subject to such sanctions. In addition, if the Fund holds the securities of an issuer that is subject to such sanctions, an immediate freeze of that issuer’s securities could result, impairing the ability of the Fund to buy, sell, receive or deliver those securities. There is also the risk that countermeasures could be taken by Russia’s government, which could involve the seizure of the Fund’s assets. These risks could affect the value of the Fund’s portfolio. While the Fund holds securities of certain issuers impacted by the sanctions, existing investments do not presently violate the applicable terms and conditions of the sanctions. The sanctions currently do not affect the Fund’s ability to sell these securities. At June 30, 2018, the Fund had 8.0% of its net assets invested in Russia.
8. Credit Facility
The Fund, together with other U.S. registered and foreign investment funds (collectively, Borrowers), managed by Franklin Templeton Investments, are borrowers in a joint syndicated senior unsecured credit facility totaling $2 billion (Global Credit Facility) which matures on February 8, 2019. This Global Credit Facility provides a source of funds to the Borrowers for temporary and emergency purposes, including the ability to meet future unanticipated or unusually large redemption requests.
Under the terms of the Global Credit Facility, the Fund shall, in addition to interest charged on any borrowings made by the Fund and other costs incurred by the Fund, pay its share of fees and expenses incurred in connection with the implementation and maintenance of the Global Credit Facility, based upon its relative share of the aggregate net assets of all of the Borrowers, including an annual commitment fee of 0.15% based upon the unused portion of the Global Credit Facility. These fees are reflected in other expenses in the Statement of Operations. During the period ended June 30, 2018, the Fund did not use the Global Credit Facility.
| Semiannual Report |
|
TD-21 |
|
FRANKLIN TEMPLETON VARIABLE INSURANCE PRODUCTS TRUST
NOTES TO FINANCIAL STATEMENTS (UNAUDITED)
Templeton Developing Markets VIP Fund (continued)
9. Fair Value Measurements
The Fund follows a fair value hierarchy that distinguishes between market data obtained from independent sources (observable inputs) and the Fund’s own market assumptions (unobservable inputs). These inputs are used in determining the value of the Fund’s financial instruments and are summarized in the following fair value hierarchy:
| • | Level 1 – quoted prices in active markets for identical financial instruments |
| • | Level 2 – other significant observable inputs (including quoted prices for similar financial instruments, interest rates, prepayment speed, credit risk, etc.) |
| • | Level 3 – significant unobservable inputs (including the Fund’s own assumptions in determining the fair value of financial instruments) |
The input levels are not necessarily an indication of the risk or liquidity associated with financial instruments at that level.
For movements between the levels within the fair value hierarchy, the Fund has adopted a policy of recognizing the transfers as of the date of the underlying event which caused the movement.
A summary of inputs used as of June 30, 2018, in valuing the Fund’s assets carried at fair value, is as follows:
| Level 1 | Level 2 | Level 3 | Total | |||||||||||||
| Assets: | ||||||||||||||||
Investments in Securities:a | ||||||||||||||||
Equity Investmentsb | $ | 308,958,294 | $ | — | $ | — | $ | 308,958,294 | ||||||||
Participatory Notes | — | 1,743,753 | — | 1,743,753 | ||||||||||||
Short Term Investments | 1,862,370 | — | — | 1,862,370 | ||||||||||||
|
| |||||||||||||||
Total Investments in Securities | $ | 310,820,664 | $ | 1,743,753 | $ | — | $ | 312,564,417 | ||||||||
|
| |||||||||||||||
aFor detailed categories, see the accompanying Statement of Investments.
bIncludes common and preferred stocks.
10. Subsequent Events
The Fund has evaluated subsequent events through the issuance of the financial statements and determined that no events have occurred that require disclosure.
Abbreviations
| Selected Portfolio | ||
| ADR | American Depositary Receipt | |
| GDR | Global Depositary Receipt | |
| HDC | Housing Development Corp. | |
TD-22 | Semiannual Report |
FRANKLIN TEMPLETON VARIABLE INSURANCE PRODUCTS TRUST
Tax Information (unaudited)
Templeton Developing Markets VIP Fund
At December 31, 2017, more than 50% of the Fund’s total assets were invested in securities of foreign issuers. In most instances, foreign taxes were withheld from income paid to the Fund on these investments. As shown in the table below, the Fund hereby reports to shareholders the foreign source income and foreign taxes paid, pursuant to Section 853 of the Internal Revenue Code. This written statement will allow shareholders of record on June 14, 2018, to treat their proportionate share of foreign taxes paid by the Fund as having been paid directly by them. The shareholder shall consider these amounts as foreign taxes paid in the tax year in which they receive the Fund distribution.
The following table provides a detailed analysis of foreign tax paid, and foreign source income as reported by the Fund, to Class 1, Class 2, and Class 4 shareholders of record.
| Class | Foreign Tax Paid Per Share | Foreign Source Income Per Share | ||
Class 1 | $0.0330 | $0.1410 | ||
Class 2 | $0.0330 | $0.1150 | ||
Class 4 | $0.0330 | $0.1042 |
Foreign Tax Paid Per Share (Column 1) is the amount per share available to you, as a tax credit (assuming you held your shares in the Fund for a minimum of 16 days during the 31-day period beginning 15 days before the ex-dividend date of the Fund’s distribution to which the foreign taxes relate), or, as a tax deduction.
Foreign Source Income Per Share (Column 2) is the amount per share of income dividends attributable to foreign securities held by the Fund, plus any foreign taxes withheld on these dividends.
| Semiannual Report |
|
TD-23 |
|
This page intentionally left blank.
This semiannual report for Templeton Foreign VIP Fund covers the period ended June 30, 2018.
Class 2 Performance Summary as of June 30, 2018
The Fund’s Class 2 Shares had a -3.89% total return* for the six-month period ended June 30, 2018.
*The Fund has a fee waiver associated with any investment it makes in a Franklin Templeton money fund and/or other Franklin Templeton fund, contractually guaranteed through 4/30/19. Fund investment results reflect the fee waiver; without this waiver, the results would have been lower.
Performance reflects the Fund’s Class 2 operating expenses, but does not include any contract fees, expenses or sales charges. If they had been included, performance would be lower. These charges and deductions, particularly for variable life policies, can have a significant effect on contract values and insurance benefits. See the contract prospectus for a complete description of these expenses, including sales charges.
Performance data represent past performance, which does not guarantee future results. Investment return and principal value will fluctuate, and you may have a gain or loss when you sell your shares. Current performance may differ from figures shown.
Semiannual Report | TF-1 |
TEMPLETON FOREIGN VIP FUND
Fund Goal and Main Investments
The Fund seeks long-term capital growth. Under normal market conditions, the Fund invests at least 80% of its net assets in investments of issuers located outside the US, including those in emerging markets.
Fund Risks
All investments involve risks, including possible loss of principal. Special risks are associated with foreign investing, including currency fluctuations, economic instability and political developments; investments in emerging markets involve heightened risks related to the same factors. Currency rates may fluctuate significantly over short periods of time, and can reduce returns. Because the Fund may invest its assets in companies in a specific region, including Europe, it is subject to greater risks of adverse developments in that region and/or the surrounding regions than a fund that is more broadly diversified geographically. Current political and financial uncertainty surrounding the European Union may increase market volatility and the economic risk of investing in companies in Europe. The Fund is actively managed but there is no guarantee that the manager’s investment decisions will produce the desired results. The Fund’s prospectus also includes a description of the main investment risks.
Performance Overview
You can find the Fund’s six-month total return in the Performance Summary. In comparison, the Fund’s benchmark, the MSCI All Country World Index (ACWI) ex USA Index, had a -3.44% total return for the same period.1 Please note, index performance information is provided for reference and we do not attempt to track the index but rather undertake investments on the basis of fundamental research.
Economic and Market Overview
The global economy expanded during the six-month period under review amid generally upbeat economic data across regions. In this environment, global developed and emerging market stocks reached a new all-time high in January 2018, as measured by the MSCI ACWI.2 During the period, global markets were aided by price gains in oil and other commodities, encouraging corporate earnings reports and
Geographic Composition
Based on Total Net Assets as of 6/30/18
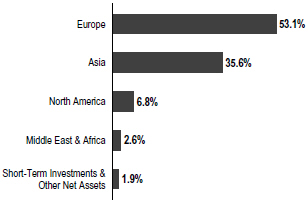
investor optimism about global economic growth. However, global stocks had a -0.13% total return for the six-month period, as measured by the MSCI ACWI, largely due to an overall decline in emerging market stocks.1
Global markets reflected investor concerns about tensions in the Korean peninsula and political uncertainties in the US and the European Union, as well as worries that strong economic growth and rising inflation in some parts of the world, particularly in the US, would lead central banks to increase interest rates sooner than expected. Markets were further pressured by the Trump administration’s protectionist trade policies, uncertainty surrounding the US-China trade relationship, and a broad sell-off in information technology stocks in March due to a potential for tighter regulation in the sector arising from concerns about consumer data privacy. An overall easing of tensions in the Korean peninsula and intermittent US-China trade negotiations partially offset some of these concerns. However, US trade disputes with its allies and China near period-end dampened investor sentiment.
The US economy continued to grow during the six months under review. After moderating for three consecutive quarters, the economy grew faster in 2018’s second quarter, driven by consumer spending, exports, business investment and government spending. The unemployment rate declined from 4.1% in December 2017, as reported at the beginning of the six-month period, to 4.0% at period-end.3 Annual inflation, as measured by the Consumer Price Index, increased from 2.1% in December 2017, as reported at the beginning of the period, to
1. Source: Morningstar. One cannot invest directly in an index, and an index is not representative of the Fund’s portfolio. Please see Index Descriptions following the Fund Summaries.
2. Please see Index Descriptions following the Fund Summaries.
3. Source: US Bureau of Labor Statistics.
The dollar value, number of shares or principal amount, and names of all portfolio holdings are listed in the Fund’s Statement of Investments (SOI).
TF-2 | Semiannual Report |
TEMPLETON FOREIGN VIP FUND
2.9% at period-end.3 The US Federal Reserve raised its target range for the federal funds rate in March and June 2018 and continued reducing its balance sheet as part of its ongoing plan to normalize monetary policy.
In Europe, the UK’s quarterly economic growth moderated in 2018’s first quarter amid a decline in construction output. The Bank of England kept its key policy rate unchanged during the period. The eurozone’s quarterly growth moderated in 2018’s first quarter due to a decline in external demand. The bloc’s annual inflation rate ended the period higher than in December 2017. The European Central Bank (ECB) kept its benchmark interest rate unchanged during the period. However, at its June meeting, the ECB announced it would further reduce its monthly bond purchases beginning in October 2018 and indicated it would conclude the program at the end of 2018 while continuing to keep interest rates unchanged through at least the summer of 2019.
In Asia, Japan’s quarterly gross domestic product (GDP) growth in 2018’s first quarter declined, the country’s first contraction since 2015’s fourth quarter, mainly due to a decline in private residential investment and household consumption. The Bank of Japan left its benchmark interest rate unchanged during the period and continued its monetary stimulus measures.
In emerging markets, Brazil’s quarterly GDP accelerated in 2018’s first quarter compared to the previous quarter. The country’s central bank cut its benchmark interest rate twice during the period to spur economic growth. Russia’s annual GDP grew in 2018’s first quarter compared to the prior-year period, amid the Bank of Russia’s continued policy support. China’s annual GDP moderated in 2018’s first quarter compared to the prior-year period. The People’s Bank of China left its benchmark interest rate unchanged during the period. Overall, emerging market stocks, as measured by the MSCI Emerging Markets Index, declined during the period.2
Investment Strategy
Our investment philosophy is bottom up, value oriented and long term. When choosing investments for the Fund, we generally focus on the market price of a company’s securities relative to our evaluation of the company’s potential long-term earnings, asset value and cash flow. We also consider a company’s price/earnings ratio, profit margins and liquidation value.
| Top 10 Holdings | ||
| 6/30/18 | ||
| Company Sector/Industry, Country | % of Total Net Assets | |
| Samsung Electronics Co. Ltd. Technology Hardware, Storage & Peripherals, South Korea | 3.6% | |
| BP PLC Oil, Gas & Consumable Fuels, U.K. | 3.3% | |
| Royal Dutch Shell PLC Oil, Gas & Consumable Fuels, U.K. | 3.0% | |
| Teva Pharmaceutical Industries Ltd. Pharmaceuticals, Israel | 2.5% | |
| Wheaton Precious Metals Corp. Metals & Mining, Canada | 2.4% | |
| Standard Chartered PLC Banks, U.K. | 2.3% | |
| Baidu Inc. Internet Software & Services, China | 2.2% | |
| SoftBank Group Corp. Wireless Telecommunication Services, Japan | 2.2% | |
| Roche Holding AG Pharmaceuticals, Switzerland | 2.1% | |
| BNP Paribas SA Banks, France | 2.0% | |
Manager’s Discussion
During the six months under review, an overweighted allocation and stock selection in the health care sector, especially in pharmaceuticals, contributed significantly to the Fund’s performance relative to its benchmark, the MSCI ACWI ex USA Index.4 Notably, our positions in pharmaceutical firms Teva Pharmaceutical Industries (Israel) and Astellas Pharma (Japan), as well as in life sciences tools and services companies MorphoSys5 (Germany) and QIAGEN (the Netherlands), helped the Fund’s performance. Teva’s shares rose following a major vote of confidence from Warren Buffett’s Berkshire Hathaway (not a Fund holding), which initiated a stake in Teva during 2018’s first quarter. The stock found additional support from better-than-expected first quarter results and an upwardly revised full-year guidance. Further boosting its share price was the company’s price reduction of its flagship multiple sclerosis drug Copaxone® in an effort to compete with emerging generic-drug competitors.
An overweighted allocation and stock selection in the energy sector, especially in oil, gas and consumable fuels, supported
4. The health care sector comprises biotechnology, health care equipment and supplies, health care providers and services, life sciences tools and services, and pharmaceuticals in the SOI.
5. Not part of the index.
| Semiannual Report |
|
TF-3 |
|
TEMPLETON FOREIGN VIP FUND
relative performance.6 Notably, our positions in oil and gas companies BP (UK), Royal Dutch Shell (UK) and Eni (Italy) aided the Fund’s performance. Shares of BP were supported by rising crude oil prices and solid quarterly results released in May. BP’s results reflected strong cost control and very strong operational and project delivery performance, resulting in increased oil and gas production and further improvements to its balance sheet. BP also stated the company’s board will discuss a dividend hike later in 2018.
Stock selection in the consumer staples sector, especially in beverages, also supported relative performance.7
Other key individual contributors included media firm SES (Luxembourg), chemicals company Johnson Matthey (UK) and internet services company Baidu (China).
In contrast, stock selection in the financials sector detracted from relative results, especially banks, notably our positions in South Korean banks KB Financial Group5 and Hana Financial Group and UK bank Standard Chartered (UK).8 Shares of KB Financial and Hana Financial declined amid general concerns about regulatory and geopolitical risks in South Korea.
Our positioning in the information technology (IT) sector, especially an overweighting in technology hardware, storage and peripherals, hampered relative results.9 Our investments in multinational electronics company Samsung Electronics (South Korea), online game publisher NetEase (China) and computer manufacturer Quanta Computer (Taiwan) weighed on relative performance. NetEase’s shares declined due to weaker-than-expected fourth-quarter 2017 results and mixed first-quarter 2018 results.
Stock selection in the materials sector also weighed on relative performance, particularly our investments in cement company Taiheiyo Cement (Japan) and metals and mining company Sumitomo Metal Mining (Japan).10
Key individual detractors included professional services firm Capita (UK),11 auto component company Hyundai Mobis (South Korea)11 and health care equipment and supplies firm Getinge (Sweden).
From a geographic perspective, an overweighted allocation and stock selection in Israel contributed to the Fund’s relative performance. Stock selection and an overweighting in Europe, mainly our positioning in Germany and Italy, also aided relative results. In contrast, stock selection in Asia detracted from relative performance, especially holdings in South Korea, Japan, Hong Kong and Taiwan. An overweighting in North America, particularly in Canada, weighed on relative results.
It is important to recognize the effect of currency movements on the Fund’s performance. In general, if the value of the US dollar goes up compared with a foreign currency, an investment traded in that foreign currency will go down in value because it will be worth fewer US dollars. This can have a negative effect on Fund performance. Conversely, when the US dollar weakens in relation to a foreign currency, an investment traded in that foreign currency will increase in value, which can contribute to Fund performance. For the six months ended June 30, 2018, the US dollar rose in value relative to most currencies. As a result, the Fund’s performance was negatively affected by the portfolio’s investment predominantly in securities with non-US currency exposure.
Thank you for your participation in Templeton Foreign VIP Fund. We look forward to serving your future investment needs.
The foregoing information reflects our analysis, opinions and portfolio holdings as of June 30, 2018, the end of the reporting period. The way we implement our main investment strategies and the resulting portfolio holdings may change depending on factors such as market and economic conditions. These opinions may not be relied upon as investment advice or an offer for a particular security. The information is not a complete analysis of every aspect of any market, country, industry, security or the Fund. Statements of fact are from sources considered reliable, but the investment manager makes no representation or warranty as to their completeness or accuracy. Although historical performance is no guarantee of future results, these insights may help you understand our investment management philosophy.
6. The energy sector comprises energy equipment and services and oil, gas and consumable fuels in the SOI.
7. The consumer staples sector comprises beverages, food and staples retailing and food products in the SOI.
8. The financials sector comprises banks, capital markets and insurance in the SOI.
9. The IT sector comprises electronic equipment, instruments and components; internet software and services; semiconductors and semiconductor equipment; and technology hardware, storage and peripherals in the SOI.
10. The materials sector comprises chemicals, construction materials, and metals and mining in the SOI.
11. Not held at period-end.
TF-4 | Semiannual Report |
TEMPLETON FOREIGN VIP FUND
Class 2 Fund Expenses
As an investor in a variable insurance contract (Contract) that indirectly provides for investment in an underlying mutual fund, you can incur transaction and/or ongoing expenses at both the Fund level and the Contract Level: (1) transaction expenses can include sales charges (loads) on purchases, surrender fees, transfer fees and premium taxes; and (2) ongoing expenses can include management fees, distribution and service (12b-1) fees, contract fees, annual maintenance fees, mortality and expense risk fees and other fees and expenses. All mutual funds and Contracts have some types of ongoing expenses. The table below shows Fund-level ongoing expenses and can help you understand these costs and compare them with those of other mutual funds offered through the Contract. The table assumes a $1,000 investment held for the six months indicated. Please refer to the Fund prospectus for additional information on operating expenses.
Actual Fund Expenses
The table below provides information about the actual account values and actual expenses in the columns under the heading “Actual.” In these columns the Fund’s actual return, which includes the effect of ongoing Fund expenses but does not include the effect of ongoing Contract expenses, is used to calculate the “Ending Account Value.” You can estimate the Fund-level expenses you paid during the period by following these steps (of course, your account value and expenses will differ from those in this illustration): Divide your account value by $1,000 (if your account had an $8,600 value, then $8,600 ÷ $1,000 = 8.6). Then multiply the result by the number under the headings “Actual” and “Fund-Level Expenses Paid During Period” (if Fund-Level Expenses Paid During Period were $ 7.50, then 8.6 x $7.50 = $64.50). In this illustration, the estimated expenses paid this period at the Fund level are $64.50.
Hypothetical Example for Comparison with Other Mutual Funds
Under the heading “Hypothetical” in the table, information is provided about hypothetical account values and hypothetical expenses based on the Fund’s actual expense ratio and an assumed rate of return of 5% per year before expenses, which is not the Fund’s actual return. This information may not be used to estimate the actual ending account balance or expenses you paid for the period, but it can help you compare ongoing costs of investing in the Fund with those of other mutual funds offered through the Contract. To do so, compare this 5% hypothetical example with the 5% hypothetical examples that appear in the shareholder reports of other funds offered through the Contract.
Please note that expenses shown in the table are meant to highlight ongoing costs at the Fund level only and do not reflect any ongoing expenses at the Contract level, or transaction expenses at either the Fund or Contract levels. In addition, while the Fund does not have transaction expenses, if the transaction and ongoing expenses at the Contract level were included, the expenses shown below would be higher. You should consult your Contract prospectus or disclosure document for more information.
| Actual (actual return after expenses) | Hypothetical (5% annual return before expenses) | |||||||||||
Share Class | Beginning Account Value 1/1/18 | Ending Account Value 6/30/18 | Fund-Level Paid During Period | Ending Account Value 6/30/18 | Fund-Level Paid During Period | Net Annualized Expense Ratio2 | ||||||
|
|
|
| |||||||||
Class 2 | $1,000 | $961.10 | $5.15 | $1,019.54 | $5.31 | 1.06% | ||||||
1. Expenses are equal to the annualized expense ratio for the six-month period as indicated above—in the far right column—multiplied by the simple average account value over the period indicated, and then multiplied by 181/365 to reflect the one-half year period.
2. Reflects expenses after fee waivers and expense reimbursements. Does not include any ongoing expenses of the Contract for which the Fund is an investment option or acquired fund fees and expenses.
| Semiannual Report |
|
TF-5 |
|
FRANKLIN TEMPLETON VARIABLE INSURANCE PRODUCTS TRUST
Financial Highlights
Templeton Foreign VIP Fund
Six Months Ended June 30, 2018 (unaudited) | Year Ended December 31, | |||||||||||||||||||||||
| 2017 | 2016 | 2015 | 2014 | 2013 | ||||||||||||||||||||
| ||||||||||||||||||||||||
| Class 1 | ||||||||||||||||||||||||
| Per share operating performance (for a share outstanding throughout the period) | ||||||||||||||||||||||||
Net asset value, beginning of period | $15.80 | $13.89 | $13.46 | $15.34 | $17.56 | $14.63 | ||||||||||||||||||
|
| |||||||||||||||||||||||
| Income from investment operationsa: | ||||||||||||||||||||||||
Net investment incomeb | 0.20 | 0.30 | 0.33 | 0.31 | 0.53 | c | 0.34 | |||||||||||||||||
Net realized and unrealized gains (losses) | (0.79 | ) | 2.03 | 0.62 | (1.16 | ) | (2.39 | ) | 3.00 | |||||||||||||||
|
| |||||||||||||||||||||||
Total from investment operations | (0.59 | ) | 2.33 | 0.95 | (0.85 | ) | (1.86 | ) | 3.34 | |||||||||||||||
|
| |||||||||||||||||||||||
Less distributions from: | ||||||||||||||||||||||||
Net investment income | (0.44 | ) | (0.42 | ) | (0.29 | ) | (0.53 | ) | (0.36 | ) | (0.41) | |||||||||||||
Net realized gains | — | — | (0.23 | ) | (0.50 | ) | — | — | ||||||||||||||||
|
| |||||||||||||||||||||||
Total distributions | (0.44 | ) | (0.42 | ) | (0.52 | ) | (1.03 | ) | (0.36 | ) | (0.41) | |||||||||||||
|
| |||||||||||||||||||||||
Redemption fees | — | — | — | — | — | d | —d | |||||||||||||||||
|
| |||||||||||||||||||||||
Net asset value, end of period | $14.77 | $15.80 | $13.89 | $13.46 | $15.34 | $17.56 | ||||||||||||||||||
|
| |||||||||||||||||||||||
Total returne | (3.81)% | 17.02% | 7.49% | (6.31)% | (10.89)% | 23.27% | ||||||||||||||||||
| Ratios to average net assetsf | ||||||||||||||||||||||||
Expenses before waiver and payments by affiliates | 0.82% | 0.82% | 0.80% | 0.78% | 0.77% | 0.78% | ||||||||||||||||||
Expenses net of waiver and payments by affiliates | 0.81% | 0.81% | g | 0.78% | 0.78% | h | 0.77% | h | 0.78% | |||||||||||||||
Net investment income | 2.60% | 1.99% | 2.38% | 2.05% | 3.11% | c | 2.16% | |||||||||||||||||
| Supplemental data | ||||||||||||||||||||||||
Net assets, end of period (000’s) | $137,696 | $152,684 | $133,218 | $214,172 | $248,355 | $298,468 | ||||||||||||||||||
Portfolio turnover rate | 11.87% | 26.81% | 20.93% | 15.15% | 25.71% | 23.61% | ||||||||||||||||||
aThe amount shown for a share outstanding throughout the period may not correlate with the Statement of Operations for the period due to the timing of sales and repurchases of the Fund’s shares in relation to income earned and/or fluctuating fair value of the investments of the Fund.
bBased on average daily shares outstanding.
cNet investment income per share includes approximately $0.16 per share related to income received in the form of special dividends in connection with certain Fund holdings. Excluding this amount, the ratio of net investment income to average net assets would have been 2.13%.
dAmount rounds to less than $0.01 per share.
eTotal return does not include fees, charges or expenses imposed by the variable annuity and life insurance contracts for which Franklin Templeton Variable Insurance Products Trust serves as an underlying investment vehicle. Total return is not annualized for periods less than one year.
fRatios are annualized for periods less than one year.
gBenefit of expense reduction rounds to less than 0.01%.
hBenefit of waiver and payments by affiliates rounds to less than 0.01%.
TF-6 | Semiannual Report | The accompanying notes are an integral part of these financial statements. |
FRANKLIN TEMPLETON VARIABLE INSURANCE PRODUCTS TRUST
FINANCIAL HIGHLIGHTS
Templeton Foreign VIP Fund (continued)
Six Months Ended June 30, 2018 (unaudited) | Year Ended December 31, | |||||||||||||||||||||||
| 2017 | 2016 | 2015 | 2014 | 2013 | ||||||||||||||||||||
| ||||||||||||||||||||||||
| Class 2 | ||||||||||||||||||||||||
| Per share operating performance (for a share outstanding throughout the period) | ||||||||||||||||||||||||
Net asset value, beginning of period | $15.47 | $13.61 | $13.20 | $15.05 | $17.24 | $14.37 | ||||||||||||||||||
|
| |||||||||||||||||||||||
| Income from investment operationsa: | ||||||||||||||||||||||||
Net investment incomeb | 0.18 | 0.26 | 0.28 | 0.27 | 0.48 | c | 0.30 | |||||||||||||||||
Net realized and unrealized gains (losses) | (0.77 | ) | 1.98 | 0.62 | (1.13 | ) | (2.35 | ) | 2.94 | |||||||||||||||
|
| |||||||||||||||||||||||
Total from investment operations | (0.59 | ) | 2.24 | 0.90 | (0.86 | ) | (1.87 | ) | 3.24 | |||||||||||||||
|
| |||||||||||||||||||||||
Less distributions from: | ||||||||||||||||||||||||
Net investment income | (0.40 | ) | (0.38 | ) | (0.26 | ) | (0.49 | ) | (0.32 | ) | (0.37) | |||||||||||||
Net realized gains | — | — | (0.23 | ) | (0.50 | ) | — | — | ||||||||||||||||
|
| |||||||||||||||||||||||
Total distributions | (0.40 | ) | (0.38 | ) | (0.49 | ) | (0.99 | ) | (0.32 | ) | (0.37) | |||||||||||||
|
| |||||||||||||||||||||||
Redemption fees | — | — | — | — | — | d | —d | |||||||||||||||||
|
| |||||||||||||||||||||||
Net asset value, end of period | $14.48 | $15.47 | $13.61 | $13.20 | $15.05 | $17.24 | ||||||||||||||||||
|
| |||||||||||||||||||||||
Total returne | (3.89)% | 16.69% | 7.18% | (6.49)% | (11.13)% | 22.97% | ||||||||||||||||||
| Ratios to average net assetsf | ||||||||||||||||||||||||
Expenses before waiver and payments by affiliates | 1.07% | 1.07% | 1.05% | 1.03% | 1.02% | 1.03% | ||||||||||||||||||
Expenses net of waiver and payments by affiliates | 1.06% | 1.06% | g | 1.03% | 1.03% | h | 1.02% | h | 1.03% | |||||||||||||||
Net investment income | 2.35% | 1.74% | 2.13% | 1.80% | 2.86% | c | 1.91% | |||||||||||||||||
| Supplemental data | ||||||||||||||||||||||||
Net assets, end of period (000’s) | $1,245,991 | $1,394,475 | $1,436,518 | $1,456,854 | $1,645,571 | $1,873,586 | ||||||||||||||||||
Portfolio turnover rate | 11.87% | 26.81% | 20.93% | 15.15% | 25.71% | 23.61% | ||||||||||||||||||
aThe amount shown for a share outstanding throughout the period may not correlate with the Statement of Operations for the period due to the timing of sales and repurchases of the Fund’s shares in relation to income earned and/or fluctuating fair value of the investments of the Fund.
bBased on average daily shares outstanding.
cNet investment income per share includes approximately $0.16 per share related to income received in the form of special dividends in connection with certain Fund holdings. Excluding this amount, the ratio of net investment income to average net assets would have been 1.88%.
dAmount rounds to less than $0.01 per share.
eTotal return does not include fees, charges or expenses imposed by the variable annuity and life insurance contracts for which Franklin Templeton Variable Insurance Products Trust serves as an underlying investment vehicle. Total return is not annualized for periods less than one year.
fRatios are annualized for periods less than one year.
gBenefit of expense reduction rounds to less than 0.01%.
hBenefit of waiver and payments by affiliates rounds to less than 0.01%.
| The accompanying notes are an integral part of these financial statements. | Semiannual Report |
|
TF-7 |
|
FRANKLIN TEMPLETON VARIABLE INSURANCE PRODUCTS TRUST
FINANCIAL HIGHLIGHTS
Templeton Foreign VIP Fund (continued)
Six Months Ended June 30, 2018 (unaudited) | Year Ended December 31, | |||||||||||||||||||||||
| 2017 | 2016 | 2015 | 2014 | 2013 | ||||||||||||||||||||
| ||||||||||||||||||||||||
| Class 4 | ||||||||||||||||||||||||
| Per share operating performance (for a share outstanding throughout the period) | ||||||||||||||||||||||||
Net asset value, beginning of period | $15.71 | $13.71 | $13.29 | $15.16 | $17.37 | $14.48 | ||||||||||||||||||
|
| |||||||||||||||||||||||
| Income from investment operationsa: | ||||||||||||||||||||||||
Net investment incomeb | 0.17 | 0.23 | 0.26 | 0.25 | 0.46 | c | 0.28 | |||||||||||||||||
Net realized and unrealized gains (losses) | (0.78 | ) | 2.03 | 0.63 | (1.14 | ) | (2.36 | ) | 2.97 | |||||||||||||||
|
| |||||||||||||||||||||||
Total from investment operations | (0.61 | ) | 2.26 | 0.89 | (0.89 | ) | (1.90 | ) | 3.25 | |||||||||||||||
|
| |||||||||||||||||||||||
Less distributions from: | ||||||||||||||||||||||||
Net investment income | (0.36 | ) | (0.26 | ) | (0.24 | ) | (0.48 | ) | (0.31 | ) | (0.36) | |||||||||||||
Net realized gains | — | — | (0.23 | ) | (0.50 | ) | — | — | ||||||||||||||||
|
| |||||||||||||||||||||||
Total distributions | (0.36 | ) | (0.26 | ) | (0.47 | ) | (0.98 | ) | (0.31 | ) | (0.36) | |||||||||||||
|
| |||||||||||||||||||||||
Redemption fees | — | — | — | — | — | d | —d | |||||||||||||||||
|
| |||||||||||||||||||||||
Net asset value, end of period | $14.74 | $15.71 | $13.71 | $13.29 | $15.16 | $17.37 | ||||||||||||||||||
|
| |||||||||||||||||||||||
Total returne | (3.94)% | 16.62% | 7.09% | (6.65)% | (11.22)% | 22.86% | ||||||||||||||||||
| Ratios to average net assetsf | ||||||||||||||||||||||||
Expenses before waiver and payments by affiliates | 1.17% | 1.17% | 1.15% | 1.13% | 1.12% | 1.13% | ||||||||||||||||||
Expenses net of waiver and payments by affiliates | 1.16% | 1.16% | g | 1.13% | 1.13% | h | 1.12% | h | 1.13% | |||||||||||||||
Net investment income | 2.25% | 1.64% | 2.03% | 1.70% | 2.76% | c | 1.81% | |||||||||||||||||
| Supplemental data | ||||||||||||||||||||||||
Net assets, end of period (000’s) | $149,188 | $159,944 | $484,763 | $472,189 | $503,143 | $513,098 | ||||||||||||||||||
Portfolio turnover rate | 11.87% | 26.81% | 20.93% | 15.15% | 25.71% | 23.61% | ||||||||||||||||||
aThe amount shown for a share outstanding throughout the period may not correlate with the Statement of Operations for the period due to the timing of sales and repurchases of the Fund’s shares in relation to income earned and/or fluctuating fair value of the investments of the Fund.
bBased on average daily shares outstanding.
cNet investment income per share includes approximately $0.16 per share related to income received in the form of special dividends in connection with certain Fund holdings. Excluding this amount, the ratio of net investment income to average net assets would have been 1.78%.
dAmount rounds to less than $0.01 per share.
eTotal return does not include fees, charges or expenses imposed by the variable annuity and life insurance contracts for which Franklin Templeton Variable Insurance Products Trust serves as an underlying investment vehicle. Total return is not annualized for periods less than one year.
fRatios are annualized for periods less than one year.
gBenefit of expense reduction rounds to less than 0.01%.
hBenefit of waiver and payments by affiliates rounds to less than 0.01%.
TF-8 | Semiannual Report | The accompanying notes are an integral part of these financial statements. |
FRANKLIN TEMPLETON VARIABLE INSURANCE PRODUCTS TRUST
Statement of Investments, June 30, 2018 (unaudited)
Templeton Foreign VIP Fund
| Country | Shares | Value | ||||||||||
Common Stocks 98.1% | ||||||||||||
Aerospace & Defense 2.6% | ||||||||||||
BAE Systems PLC | United Kingdom | 1,854,352 | $ | 15,839,208 | ||||||||
a Cobham PLC | United Kingdom | 5,307,199 | 9,016,675 | |||||||||
Rolls-Royce Holdings PLC | United Kingdom | 1,153,600 | 15,054,675 | |||||||||
|
| |||||||||||
| 39,910,558 | ||||||||||||
|
| |||||||||||
Auto Components 1.3% | ||||||||||||
Cie Generale des Etablissements Michelin SCA | France | 67,168 | 8,185,019 | |||||||||
Sumitomo Rubber Industries Ltd. | Japan | 712,200 | 11,323,655 | |||||||||
|
| |||||||||||
| 19,508,674 | ||||||||||||
|
| |||||||||||
Automobiles 0.5% | ||||||||||||
Hero Motocorp Ltd. | India | 154,059 | 7,816,593 | |||||||||
|
| |||||||||||
Banks 14.2% | ||||||||||||
Bangkok Bank PCL, fgn | Thailand | 3,144,600 | 18,915,245 | |||||||||
Bank of Ireland Group PLC | Ireland | 2,346,131 | 18,324,268 | |||||||||
Barclays PLC | United Kingdom | 8,453,430 | 21,099,202 | |||||||||
BNP Paribas SA | France | 497,898 | 30,941,641 | |||||||||
Hana Financial Group Inc. | South Korea | 494,927 | 19,013,468 | |||||||||
HSBC Holdings PLC | United Kingdom | 3,012,800 | 28,261,619 | |||||||||
ING Groep NV | Netherlands | 1,052,890 | 15,165,216 | |||||||||
Kasikornbank PCL, fgn | Thailand | 249,500 | 1,512,121 | |||||||||
Kasikornbank PCL, NVDR | Thailand | 1,610,500 | 9,467,788 | |||||||||
KB Financial Group Inc., ADR | South Korea | 437,706 | 20,344,575 | |||||||||
Standard Chartered PLC | United Kingdom | 3,816,307 | 34,905,757 | |||||||||
|
| |||||||||||
| 217,950,900 | ||||||||||||
|
| |||||||||||
Beverages 2.2% | ||||||||||||
Kirin Holdings Co. Ltd. | Japan | 709,500 | 18,991,359 | |||||||||
Suntory Beverage & Food Ltd. | Japan | 363,800 | 15,545,183 | |||||||||
|
| |||||||||||
| 34,536,542 | ||||||||||||
|
| |||||||||||
Biotechnology 1.2% | ||||||||||||
Shire PLC | United Kingdom | 318,110 | 17,917,096 | |||||||||
|
| |||||||||||
Capital Markets 1.3% | ||||||||||||
UBS Group AG | Switzerland | 1,326,231 | 20,521,496 | |||||||||
|
| |||||||||||
Chemicals 1.5% | ||||||||||||
Johnson Matthey PLC | United Kingdom | 494,842 | 23,649,742 | |||||||||
|
| |||||||||||
Construction & Engineering 1.2% | ||||||||||||
Sinopec Engineering Group Co. Ltd. | China | 17,492,000 | 18,281,097 | |||||||||
|
| |||||||||||
Construction Materials 1.6% | ||||||||||||
CRH PLC | Ireland | 294,271 | 10,434,680 | |||||||||
Taiheiyo Cement Corp. | Japan | 452,700 | 14,906,649 | |||||||||
|
| |||||||||||
| 25,341,329 | ||||||||||||
|
| |||||||||||
Diversified Telecommunication Services 3.7% | ||||||||||||
China Telecom Corp. Ltd., H | China | 50,418,357 | 23,583,251 | |||||||||
Singapore Telecommunications Ltd. | Singapore | 8,548,100 | 19,324,121 | |||||||||
Telefonica Deutschland Holding AG | Germany | 3,443,999 | 13,584,336 | |||||||||
|
| |||||||||||
| 56,491,708 | ||||||||||||
|
| |||||||||||
Electrical Equipment 0.7% | ||||||||||||
Vestas Wind Systems AS | Denmark | 169,868 | 10,522,019 | |||||||||
|
| |||||||||||
Electronic Equipment, Instruments & Components 0.4% | ||||||||||||
a Landis+Gyr Group AG | Switzerland | 78,096 | 5,436,914 | |||||||||
|
| |||||||||||
| Semiannual Report |
|
TF-9 |
|
FRANKLIN TEMPLETON VARIABLE INSURANCE PRODUCTS TRUST
STATEMENT OF INVESTMENTS (UNAUDITED)
Templeton Foreign VIP Fund (continued)
| Country | Shares | Value | ||||||||||
Common Stocks (continued) | ||||||||||||
Energy Equipment & Services 0.7% | ||||||||||||
b SBM Offshore NV. | Netherlands | 683,691 | $ | 10,643,882 | ||||||||
|
| |||||||||||
Food & Staples Retailing 0.8% | ||||||||||||
Seven & i Holdings Co. Ltd. | Japan | 292,000 | 12,743,593 | |||||||||
|
| |||||||||||
Food Products 0.6% | ||||||||||||
Ezaki Glico Co. Ltd. | Japan | 177,800 | 8,545,065 | |||||||||
|
| |||||||||||
Health Care Equipment & Supplies 0.8% | ||||||||||||
Getinge AB, B | Sweden | 651,040 | 5,927,074 | |||||||||
Shandong Weigao Group Medical Polymer Co. Ltd., H | China | 9,924,000 | 7,019,864 | |||||||||
|
| |||||||||||
| 12,946,938 | ||||||||||||
|
| |||||||||||
Health Care Providers & Services 1.8% | ||||||||||||
Shanghai Pharmaceuticals Holding Co. Ltd., H | China | 5,083,800 | 14,027,985 | |||||||||
Sinopharm Group Co. Ltd., H | China | 3,443,200 | 13,845,560 | |||||||||
|
| |||||||||||
| 27,873,545 | ||||||||||||
|
| |||||||||||
Household Durables 0.6% | ||||||||||||
Panasonic Corp. | Japan | 634,900 | 8,566,088 | |||||||||
|
| |||||||||||
Industrial Conglomerates 2.4% | ||||||||||||
CK Hutchison Holdings Ltd. | Hong Kong | 2,021,500 | 21,436,111 | |||||||||
Siemens AG | Germany | 122,182 | 16,162,307 | |||||||||
|
| |||||||||||
| 37,598,418 | ||||||||||||
|
| |||||||||||
Insurance 4.9% | ||||||||||||
Aegon NV | Netherlands | 3,130,143 | 18,782,879 | |||||||||
Aviva PLC | United Kingdom | 1,743,972 | 11,607,570 | |||||||||
AXA SA | France | 722,428 | 17,737,685 | |||||||||
China Life Insurance Co. Ltd., H | China | 4,639,000 | 11,972,872 | |||||||||
Chubb Ltd. | United States | 113,369 | 14,400,130 | |||||||||
|
| |||||||||||
| 74,501,136 | ||||||||||||
|
| |||||||||||
Internet Software & Services 3.0% | ||||||||||||
a Baidu Inc., ADR | China | 138,230 | 33,589,890 | |||||||||
NetEase Inc., ADR | China | 48,100 | 12,153,427 | |||||||||
|
| |||||||||||
| 45,743,317 | ||||||||||||
|
| |||||||||||
Life Sciences Tools & Services 2.3% | ||||||||||||
a MorphoSys AG | Germany | 156,612 | 19,212,651 | |||||||||
a QIAGEN NV | Netherlands | 432,810 | 15,777,015 | |||||||||
|
| |||||||||||
| 34,989,666 | ||||||||||||
|
| |||||||||||
Marine 0.4% | ||||||||||||
A.P. Moeller-Maersk AS, B | Denmark | 5,208 | 6,491,114 | |||||||||
|
| |||||||||||
Media 1.6% | ||||||||||||
SES SA, IDR | Luxembourg | 1,315,990 | 24,123,954 | |||||||||
|
| |||||||||||
Metals & Mining 5.2% | ||||||||||||
Alamos Gold Inc., A | Canada | 3,063,752 | 17,432,749 | |||||||||
Barrick Gold Corp. | Canada | 843,220 | 11,071,479 | |||||||||
Sumitomo Metal Mining Co. Ltd. | Japan | 370,600 | 14,188,561 | |||||||||
Wheaton Precious Metals Corp. | Canada | 1,647,300 | 36,375,472 | |||||||||
|
| |||||||||||
| 79,068,261 | ||||||||||||
|
| |||||||||||
TF-10 | Semiannual Report |
FRANKLIN TEMPLETON VARIABLE INSURANCE PRODUCTS TRUST
STATEMENT OF INVESTMENTS (UNAUDITED)
Templeton Foreign VIP Fund (continued)
| Country | Shares | Value | ||||||||||
Common Stocks (continued) | ||||||||||||
Multi-Utilities 2.6% | ||||||||||||
E.ON SE | Germany | 1,516,092 | $ | 16,214,719 | ||||||||
Orsted AS | Denmark | 144,200 | 8,728,567 | |||||||||
Veolia Environnement SA | France | 671,188 | 14,374,066 | |||||||||
|
| |||||||||||
| 39,317,352 | ||||||||||||
|
| |||||||||||
Oil, Gas & Consumable Fuels 12.1% | ||||||||||||
BP PLC | United Kingdom | 6,554,082 | 50,053,717 | |||||||||
Cenovus Energy Inc. | Canada | 1,082,702 | 11,245,535 | |||||||||
Eni SpA | Italy | 1,507,144 | 28,008,425 | |||||||||
Husky Energy Inc. | Canada | 880,500 | 13,728,082 | |||||||||
INPEX Corp. | Japan | 938,800 | 9,748,865 | |||||||||
Kunlun Energy Co. Ltd. | China | 7,166,000 | 6,274,548 | |||||||||
Royal Dutch Shell PLC, A | United Kingdom | 16,803 | 583,376 | |||||||||
Royal Dutch Shell PLC, B | United Kingdom | 1,253,971 | 44,935,398 | |||||||||
Total SA | France | 332,436 | 20,278,448 | |||||||||
|
| |||||||||||
| 184,856,394 | ||||||||||||
|
| |||||||||||
Pharmaceuticals 11.4% | ||||||||||||
Astellas Pharma Inc. | Japan | 1,689,500 | 25,778,630 | |||||||||
Bayer AG | Germany | 215,217 | 23,724,193 | |||||||||
Merck KGaA | Germany | 151,830 | 14,833,400 | |||||||||
Novartis AG | Switzerland | 128,920 | 9,799,170 | |||||||||
Roche Holding AG | Switzerland | 143,560 | 31,969,061 | |||||||||
Sanofi | France | 370,668 | 29,730,253 | |||||||||
Teva Pharmaceutical Industries Ltd., ADR | Israel | 1,610,544 | 39,168,430 | |||||||||
|
| |||||||||||
| 175,003,137 | ||||||||||||
|
| |||||||||||
Real Estate Management & Development 0.4% | ||||||||||||
Mitsui Fudosan Co. Ltd. | Japan | 257,800 | 6,227,537 | |||||||||
|
| |||||||||||
Semiconductors & Semiconductor Equipment 2.2% | ||||||||||||
Infineon Technologies AG | Germany | 590,665 | 15,064,958 | |||||||||
Taiwan Semiconductor Manufacturing Co. Ltd. | Taiwan | 2,587,000 | 18,386,367 | |||||||||
|
| |||||||||||
| 33,451,325 | ||||||||||||
|
| |||||||||||
Specialty Retail 1.4% | ||||||||||||
Kingfisher PLC | United Kingdom | 5,347,092 | 20,972,267 | |||||||||
|
| |||||||||||
Technology Hardware, Storage & Peripherals 4.9% | ||||||||||||
Catcher Technology Co. Ltd. | Taiwan | 925,000 | 10,354,704 | |||||||||
Quanta Computer Inc. | Taiwan | 5,640,000 | 9,905,456 | |||||||||
Samsung Electronics Co. Ltd. | South Korea | 1,311,300 | 54,843,236 | |||||||||
|
| |||||||||||
| 75,103,396 | ||||||||||||
|
| |||||||||||
Trading Companies & Distributors 1.7% | ||||||||||||
SIG PLC | United Kingdom | 5,760,800 | 10,627,974 | |||||||||
Travis Perkins PLC | United Kingdom | 856,731 | 16,094,149 | |||||||||
|
| |||||||||||
| 26,722,123 | ||||||||||||
|
| |||||||||||
Wireless Telecommunication Services 3.9% | ||||||||||||
China Mobile Ltd. | China | 1,821,000 | 16,176,764 | |||||||||
SoftBank Group Corp. | Japan | 464,700 | 33,470,826 | |||||||||
Vodafone Group PLC, ADR | United Kingdom | 434,503 | 10,562,768 | |||||||||
|
| |||||||||||
| 60,210,358 | ||||||||||||
|
| |||||||||||
Total Common Stocks (Cost $1,258,614,513) | 1,503,583,534 | |||||||||||
|
| |||||||||||
| Semiannual Report |
|
TF-11 |
|
FRANKLIN TEMPLETON VARIABLE INSURANCE PRODUCTS TRUST
STATEMENT OF INVESTMENTS (UNAUDITED)
Templeton Foreign VIP Fund (continued)
| Country | Shares | Value | ||||||||||
Preferred Stocks (Cost $114,062) 0.0%† | ||||||||||||
Aerospace & Defense 0.0%† | ||||||||||||
a Rolls-Royce Holdings PLC, pfd. | United Kingdom | 81,905,600 | $ | 108,164 | ||||||||
|
| |||||||||||
Total Investments before Short Term Investments | 1,503,691,698 | |||||||||||
|
| |||||||||||
Short Term Investments 1.8% | ||||||||||||
Money Market Funds (Cost $23,027,774) 1.5% | ||||||||||||
c,d Institutional Fiduciary Trust Money Market Portfolio, 1.51% | United States | 23,027,774 | 23,027,774 | |||||||||
|
| |||||||||||
e Investments from Cash Collateral Received for Loaned Securities (Cost $5,325,483) 0.3% | ||||||||||||
Money Market Funds 0.3% | ||||||||||||
c,d Institutional Fiduciary Trust Money Market Portfolio, 1.51% | United States | 5,325,483 | 5,325,483 | |||||||||
|
| |||||||||||
Total Investments (Cost $1,287,081,832) 99.9% | 1,532,044,955 | |||||||||||
Other Assets, less Liabilities 0.1% | 829,061 | |||||||||||
|
| |||||||||||
Net Assets 100.0% | $ | 1,532,874,016 | ||||||||||
|
| |||||||||||
See Abbreviations on page TF-22.
†Rounds to less than 0.1% of net assets.
aNon-income producing.
bA portion or all of the security is on loan at June 30, 2018. See Note 1(c).
cSee Note 3(e) regarding investments in affiliated management investment companies.
dThe rate shown is the annualized seven-day effective yield at period end.
eSee Note 1(c) regarding securities on loan.
TF-12 | Semiannual Report | The accompanying notes are an integral part of these financial statements. |
FRANKLIN TEMPLETON VARIABLE INSURANCE PRODUCTS TRUST
Financial Statements
Statement of Assets and Liabilities
June 30, 2018 (unaudited)
Templeton VIP Fund | ||||
Assets: | ||||
Investments in securities: | ||||
Cost - Unaffiliated issuers | $1,258,728,575 | |||
Cost - Non-controlled affiliates (Note 3e) | 28,353,257 | |||
|
| |||
Value - Unaffiliated issuers + | $1,503,691,698 | |||
Value - Non-controlled affiliates (Note 3e) | 28,353,257 | |||
Cash | 79,000 | |||
Receivables: | ||||
Capital shares sold | 188,347 | |||
Dividends | 8,316,903 | |||
European Union tax reclaims | 172,319 | |||
Other assets | 1,125 | |||
|
| |||
Total assets | 1,540,802,649 | |||
|
| |||
Liabilities: | ||||
Payables: | ||||
Capital shares redeemed | 597,149 | |||
Management fees | 996,323 | |||
Distribution fees | 636,569 | |||
Payable upon return of securities loaned | 5,325,483 | |||
Accrued expenses and other liabilities | 373,109 | |||
|
| |||
Total liabilities | 7,928,633 | |||
|
| |||
Net assets, at value | $1,532,874,016 | |||
|
| |||
Net assets consist of: | ||||
Paid-in capital | $1,320,640,556 | |||
Undistributed net investment income | 13,698,228 | |||
Net unrealized appreciation (depreciation) | 244,956,799 | |||
Accumulated net realized gain (loss) | (46,421,567 | ) | ||
|
| |||
Net assets, at value | $1,532,874,016 | |||
|
| |||
| Class 1: | ||||
Net assets, at value | $ 137,695,650 | |||
|
| |||
Shares outstanding. | 9,324,159 | |||
|
| |||
Net asset value and maximum offering price per share | $14.77 | |||
|
| |||
| Class 2: | ||||
Net assets, at value | $1,245,990,550 | |||
|
| |||
Shares outstanding | 86,057,168 | |||
|
| |||
Net asset value and maximum offering price per share | $14.48 | |||
|
| |||
| Class 4: | ||||
Net assets, at value | $ 149,187,816 | |||
|
| |||
Shares outstanding | 10,123,298 | |||
|
| |||
Net asset value and maximum offering price per share | $14.74 | |||
|
| |||
| +Includes securities loaned | $ 4,631,761 | |||
| The accompanying notes are an integral part of these financial statements. | Semiannual Report |
|
TF-13 |
|
FRANKLIN TEMPLETON VARIABLE INSURANCE PRODUCTS TRUST
FINANCIAL STATEMENTS
Statement of Operations
for the six months ended June 30, 2018 (unaudited)
| Templeton Foreign VIP Fund | ||||
Investment income: | ||||
Dividends: (net of foreign taxes)* | ||||
Unaffiliated issuers | $ 27,495,791 | |||
Non-controlled affiliates (Note 3e) | 285,796 | |||
Interest: | ||||
Unaffiliated issuers | 384 | |||
Income from securities loaned (net of fees and rebates) | 111,397 | |||
|
| |||
Total investment income | 27,893,368 | |||
|
| |||
Expenses: | ||||
Management fees (Note 3a) | 6,369,713 | |||
Distribution fees: (Note 3c) | ||||
Class 2 | 1,669,480 | |||
Class 4 | 268,662 | |||
Custodian fees (Note 4) | 98,375 | |||
Reports to shareholders | 154,405 | |||
Professional fees | 66,552 | |||
Trustees’ fees and expenses | 4,503 | |||
Other | 24,729 | |||
|
| |||
Total expenses | 8,656,419 | |||
Expenses waived/paid by affiliates (Note 3e) | (122,872 | ) | ||
|
| |||
Net expenses | 8,533,547 | |||
|
| |||
Net investment income | 19,359,821 | |||
|
| |||
Realized and unrealized gains (losses): | ||||
Net realized gain (loss) from: | ||||
Investments: | ||||
Unaffiliated issuers | 39,869,704 | |||
Foreign currency transactions. | (451,514 | ) | ||
|
| |||
Net realized gain (loss) | 39,418,190 | |||
|
| |||
Net change in unrealized appreciation (depreciation) on: | ||||
Investments: | ||||
Unaffiliated issuers | (122,171,877 | ) | ||
Translation of other assets and liabilities denominated in foreign currencies | (197,371 | ) | ||
|
| |||
Net change in unrealized appreciation (depreciation) | (122,369,248 | ) | ||
|
| |||
Net realized and unrealized gain (loss) | (82,951,058 | ) | ||
|
| |||
Net increase (decrease) in net assets resulting from operations | $ (63,591,237 | ) | ||
|
| |||
*Foreign taxes withheld on dividends | $ 2,789,020 | |||
TF-14 | Semiannual Report | The accompanying notes are an integral part of these financial statements. |
FRANKLIN TEMPLETON VARIABLE INSURANCE PRODUCTS TRUST
FINANCIAL STATEMENTS
Statements of Changes in Net Assets
| Templeton Foreign VIP Fund | ||||||||
| Six Months Ended June 30, 2018 (unaudited) | Year Ended December 31, 2017 | |||||||
Increase (decrease) in net assets: | ||||||||
Operations: | ||||||||
Net investment income | $ | 19,359,821 | $ | 31,019,303 | ||||
Net realized gain (loss) | 39,418,190 | (10,184,192 | ) | |||||
Net change in unrealized appreciation (depreciation) | (122,369,248 | ) | 263,520,898 | |||||
|
| |||||||
Net increase (decrease) in net assets resulting from operations | (63,591,237 | ) | 284,356,009 | |||||
|
| |||||||
Distributions to shareholders from: | ||||||||
Net investment income: | ||||||||
Class 1 | (3,961,619 | ) | (3,928,195 | ) | ||||
Class 2 | (33,465,356 | ) | (35,708,156 | ) | ||||
Class 4 | (3,521,973 | ) | (2,623,801 | ) | ||||
|
| |||||||
Total distributions to shareholders | (40,948,948 | ) | (42,260,152 | ) | ||||
|
| |||||||
Capital share transactions: (Note 2) | ||||||||
Class 1 | (5,708,269 | ) | 1,154,617 | |||||
Class 2 | (62,897,290 | ) | (225,298,981 | ) | ||||
Class 4 | (1,083,202 | ) | (365,347,762 | ) | ||||
|
| |||||||
Total capital share transactions | (69,688,761 | ) | (589,492,126 | ) | ||||
|
| |||||||
Net increase (decrease) in net assets | (174,228,946 | ) | (347,396,269 | ) | ||||
Net assets: | ||||||||
Beginning of period | 1,707,102,962 | 2,054,499,231 | ||||||
|
| |||||||
End of period | $ | 1,532,874,016 | $ | 1,707,102,962 | ||||
|
| |||||||
Undistributed net investment income included in net assets: | ||||||||
End of period | $ | 13,698,228 | $ | 35,287,355 | ||||
|
| |||||||
| The accompanying notes are an integral part of these financial statements. | Semiannual Report |
|
TF-15 |
|
FRANKLIN TEMPLETON VARIABLE INSURANCE PRODUCTS TRUST
Notes to Financial Statements (unaudited)
Templeton Foreign VIP Fund
1. Organization and Significant Accounting Policies
Franklin Templeton Variable Insurance Products Trust (Trust) is registered under the Investment Company Act of 1940 (1940 Act) as an open-end management investment company, consisting of eighteen separate funds and applies the specialized accounting and reporting guidance in U.S. Generally Accepted Accounting Principles (U.S. GAAP). Templeton Foreign VIP Fund (Fund) is included in this report. Shares of the Fund are generally sold only to insurance company separate accounts to fund the benefits of variable life insurance policies or variable annuity contracts. The Fund offers three classes of shares: Class 1, Class 2, and Class 4. Each class of shares may differ by its distribution fees, voting rights on matters affecting a single class and its exchange privilege.
The following summarizes the Fund’s significant accounting policies.
a. Financial Instrument Valuation
The Fund’s investments in financial instruments are carried at fair value daily. Fair value is the price that would be received to sell an asset or paid to transfer a liability in an orderly transaction between market participants on the measurement date. The Fund calculates the net asset value (NAV) per share each business day as of 4 p.m. Eastern time or the regularly scheduled close of the New York Stock Exchange (NYSE), whichever is earlier. Under compliance policies and procedures approved by the Trust’s Board of Trustees (the Board), the Fund’s administrator has responsibility for oversight of valuation, including leading the cross-functional Valuation Committee (VC). The VC provides administration and oversight of the Fund’s valuation policies and procedures, which are approved annually by the Board. Among other things, these procedures allow the Fund to utilize independent pricing services, quotations from securities and financial instrument dealers, and other market sources to determine fair value.
Equity securities listed on an exchange or on the NASDAQ National Market System are valued at the last quoted sale price or the official closing price of the day, respectively. Foreign equity securities are valued as of the close of trading on the foreign stock exchange on which the security is primarily traded, or as of 4 p.m. Eastern time. The value is then converted into its U.S. dollar equivalent at the foreign exchange rate in effect at 4 p.m. Eastern time on the day that the value of the security is determined. Over-the-counter (OTC) securities are
valued within the range of the most recent quoted bid and ask prices. Securities that trade in multiple markets or on multiple exchanges are valued according to the broadest and most representative market. Certain equity securities are valued based upon fundamental characteristics or relationships to similar securities.
Investments in open-end mutual funds are valued at the closing NAV.
The Fund has procedures to determine the fair value of financial instruments for which market prices are not reliable or readily available. Under these procedures, the VC convenes on a regular basis to review such financial instruments and considers a number of factors, including significant unobservable valuation inputs, when arriving at fair value. The VC primarily employs a market-based approach which may use related or comparable assets or liabilities, recent transactions, market multiples, book values, and other relevant information for the investment to determine the fair value of the investment. An income-based valuation approach may also be used in which the anticipated future cash flows of the investment are discounted to calculate fair value. Discounts may also be applied due to the nature or duration of any restrictions on the disposition of the investments. Due to the inherent uncertainty of valuations of such investments, the fair values may differ significantly from the values that would have been used had an active market existed. The VC employs various methods for calibrating these valuation approaches including a regular review of key inputs and assumptions, transactional back-testing or disposition analysis, and reviews of any related market activity.
Trading in securities on foreign securities stock exchanges and OTC markets may be completed before 4 p.m. Eastern time. In addition, trading in certain foreign markets may not take place on every Fund’s business day. Occasionally, events occur between the time at which trading in a foreign security is completed and 4 p.m. Eastern time that might call into question the reliability of the value of a portfolio security held by the Fund. As a result, differences may arise between the value of the Fund’s portfolio securities as determined at the foreign market close and the latest indications of value at 4 p.m. Eastern time. In order to minimize the potential for these differences, the VC monitors price movements following the close of trading in foreign stock markets through a series of country specific market proxies (such as baskets of American Depositary Receipts, futures contracts and exchange traded funds). These price movements are measured against
TF-16 | Semiannual Report |
FRANKLIN TEMPLETON VARIABLE INSURANCE PRODUCTS TRUST
NOTES TO FINANCIAL STATEMENTS (UNAUDITED)
Templeton Foreign VIP Fund (continued)
established trigger thresholds for each specific market proxy to assist in determining if an event has occurred that may call into question the reliability of the values of the foreign securities held by the Fund. If such an event occurs, the securities may be valued using fair value procedures, which may include the use of independent pricing services.
When the last day of the reporting period is a non-business day, certain foreign markets may be open on those days that the Fund’s NAV is not calculated, which could result in differences between the value of the Fund’s portfolio securities on the last business day and the last calendar day of the reporting period. Any significant security valuation changes due to an open foreign market are adjusted and reflected by the Fund for financial reporting purposes.
b. Foreign Currency Translation
Portfolio securities and other assets and liabilities denominated in foreign currencies are translated into U.S. dollars based on the exchange rate of such currencies against U.S. dollars on the date of valuation. The Fund may enter into foreign currency exchange contracts to facilitate transactions denominated in a foreign currency. Purchases and sales of securities, income and expense items denominated in foreign currencies are translated into U.S. dollars at the exchange rate in effect on the transaction date. Portfolio securities and assets and liabilities denominated in foreign currencies contain risks that those currencies will decline in value relative to the U.S. dollar. Occasionally, events may impact the availability or reliability of foreign exchange rates used to convert the U.S. dollar equivalent value. If such an event occurs, the foreign exchange rate will be valued at fair value using procedures established and approved by the Board.
The Fund does not separately report the effect of changes in foreign exchange rates from changes in market prices on securities held. Such changes are included in net realized and unrealized gain or loss from investments in the Statement of Operations.
Realized foreign exchange gains or losses arise from sales of foreign currencies, currency gains or losses realized between the trade and settlement dates on securities transactions and the difference between the recorded amounts of dividends, interest, and foreign withholding taxes and the U.S. dollar equivalent of the amounts actually received or paid. Net unrealized foreign exchange gains and losses arise from changes in foreign
exchange rates on foreign denominated assets and liabilities other than investments in securities held at the end of the reporting period.
c. Securities Lending
The Fund participates in an agency based securities lending program to earn additional income. The Fund receives cash collateral against the loaned securities in an amount equal to at least 102% of the fair value of the loaned securities. Collateral is maintained over the life of the loan in an amount not less than 100% of the fair value of loaned securities, as determined at the close of Fund business each day; any additional collateral required due to changes in security values is delivered to the Fund on the next business day. The collateral is deposited into a joint cash account with other funds and is used to invest in a money market fund managed by Franklin Advisers, Inc., an affiliate of the Fund. The Fund may receive income from the investment of cash collateral, in addition to lending fees and rebates paid by the borrower. Income from securities loaned, net of fees paid to the securities lending agent and/or third-party vendor, is reported separately in the Statement of Operations. The Fund bears the market risk with respect to the collateral investment, securities loaned, and the risk that the agent may default on its obligations to the Fund. If the borrower defaults on its obligation to return the securities loaned, the Fund has the right to repurchase the securities in the open market using the collateral received. The securities lending agent has agreed to indemnify the Fund in the event of default by a third party borrower.
d. Income and Deferred Taxes
It is the Fund’s policy to qualify as a regulated investment company under the Internal Revenue Code. The Fund intends to distribute to shareholders substantially all of its taxable income and net realized gains to relieve it from federal income and if applicable, excise taxes. As a result, no provision for U.S. federal income taxes is required.
The Fund may be subject to foreign taxation related to income received, capital gains on the sale of securities and certain foreign currency transactions in the foreign jurisdictions in which it invests. Foreign taxes, if any, are recorded based on the tax regulations and rates that exist in the foreign markets in which the Fund invests. When a capital gain tax is determined to apply, the Fund records an estimated deferred tax liability in an amount that would be payable if the securities were disposed of on the valuation date.
| Semiannual Report |
|
TF-17 |
|
FRANKLIN TEMPLETON VARIABLE INSURANCE PRODUCTS TRUST
NOTES TO FINANCIAL STATEMENTS (UNAUDITED)
Templeton Foreign VIP Fund (continued)
1. Organization and Significant Accounting Policies (continued)
d. Income and Deferred Taxes (continued)
As a result of several court cases, in certain countries across the European Union, the Fund filed additional tax reclaims for previously withheld taxes on dividends earned in those countries (EU reclaims). These additional filings are subject to various administrative proceedings by the local jurisdictions’ tax authorities within the European Union, as well as a number of related judicial proceedings. Income recognized, if any, for EU reclaims is reflected as other income in the Statement of Operations and any related receivable, if any, is reflected as European Union tax reclaims in the Statement of Assets and Liabilities. When uncertainty exists as to the ultimate resolution of these proceedings, the likelihood of receipt of these EU reclaims, and the potential timing of payment, no amounts are reflected in the financial statements. For U.S. income tax purposes, when EU reclaims are received by the Fund and the Fund previously passed foreign tax credit on to its shareholders, the Fund must either amend historic tax reporting to shareholders or enter into a closing agreement with the Internal Revenue Service (IRS) in order to pay the associated tax liability on behalf of the Fund’s shareholders.
The Fund may recognize an income tax liability related to its uncertain tax positions under U.S. GAAP when the uncertain tax position has a less than 50% probability that it will be sustained upon examination by the tax authorities based on its technical merits. As of June 30, 2018, the Fund has determined that no tax liability is required in its financial statements related to uncertain tax positions for any open tax years (or expected to be taken in future tax years). Open tax years are those that remain subject to examination and are based on the statute of limitations in each jurisdiction in which the Fund invests.
e. Security Transactions, Investment Income, Expenses and Distributions
Security transactions are accounted for on trade date. Realized gains and losses on security transactions are determined on a specific identification basis. Interest income and estimated expenses are accrued daily. Dividend income is recorded on the ex-dividend date except for certain dividends from securities where the dividend rate is not available. In such cases, the
dividend is recorded as soon as the information is received by the Fund. Distributions to shareholders are recorded on the ex-dividend date. Distributable earnings are determined according to income tax regulations (tax basis) and may differ from earnings recorded in accordance with U.S. GAAP. These differences may be permanent or temporary. Permanent differences are reclassified among capital accounts to reflect their tax character. These reclassifications have no impact on net assets or the results of operations. Temporary differences are not reclassified, as they may reverse in subsequent periods.
Common expenses incurred by the Trust are allocated among the Funds based on the ratio of net assets of each Fund to the combined net assets of the Trust or based on the ratio of number of shareholders of each Fund to the combined number of shareholders of the Trust. Fund specific expenses are charged directly to the Fund that incurred the expense.
Realized and unrealized gains and losses and net investment income, excluding class specific expenses, are allocated daily to each class of shares based upon the relative proportion of net assets of each class. Differences in per share distributions by class are generally due to differences in class specific expenses.
f. Accounting Estimates
The preparation of financial statements in accordance with U.S. GAAP requires management to make estimates and assumptions that affect the reported amounts of assets and liabilities at the date of the financial statements and the amounts of income and expenses during the reporting period. Actual results could differ from those estimates.
g. Guarantees and Indemnifications
Under the Trust’s organizational documents, its officers and trustees are indemnified by the Trust against certain liabilities arising out of the performance of their duties to the Trust. Additionally, in the normal course of business, the Trust, on behalf of the Fund, enters into contracts with service providers that contain general indemnification clauses. The Trust’s maximum exposure under these arrangements is unknown as this would involve future claims that may be made against the Trust that have not yet occurred. Currently, the Trust expects the risk of loss to be remote.
TF-18 | Semiannual Report |
FRANKLIN TEMPLETON VARIABLE INSURANCE PRODUCTS TRUST
NOTES TO FINANCIAL STATEMENTS (UNAUDITED)
Templeton Foreign VIP Fund (continued)
2. Shares of Beneficial Interest
At June 30, 2018, there were an unlimited number of shares authorized (without par value). Transactions in the Fund’s shares were as follows:
Six Months Ended June 30, 2018 | Year Ended December 31, 2017 | |||||||||||||||
|
| |||||||||||||||
| Shares | Amount | Shares | Amount | |||||||||||||
| ||||||||||||||||
| Class 1 Shares: | ||||||||||||||||
Shares sold | 302,886 | $ | 4,750,015 | 769,055 | $ | 11,623,740 | ||||||||||
Shares issued in reinvestment of distributions | 263,056 | 3,961,619 | 267,406 | 3,928,195 | ||||||||||||
Shares redeemed | (906,379) | (14,419,903) | (965,539) | (14,397,318) | ||||||||||||
|
| |||||||||||||||
Net increase (decrease) | (340,437) | $ | (5,708,269) | 70,922 | $ | 1,154,617 | ||||||||||
|
| |||||||||||||||
| Class 2 Shares: | ||||||||||||||||
Shares sold | 3,025,833 | $ | 46,252,289 | 4,540,875 | $ | 66,812,334 | ||||||||||
Shares issued in reinvestment of distributions | 2,265,765 | 33,465,356 | 2,478,012 | 35,708,156 | ||||||||||||
Shares redeemed | (9,346,735) | (142,614,935) | (22,468,600) | (327,819,471) | ||||||||||||
|
| |||||||||||||||
Net increase (decrease) | (4,055,137) | $ | (62,897,290) | (15,449,713) | $ | (225,298,981) | ||||||||||
|
| |||||||||||||||
| Class 4 Shares: | ||||||||||||||||
Shares sold | 705,590 | $ | 10,915,838 | 1,442,499 | $ | 21,238,967 | ||||||||||
Shares issued in reinvestment of distributions | 234,330 | 3,521,973 | 179,222 | 2,623,801 | ||||||||||||
Shares redeemed | (994,934) | (15,521,013) | (26,802,238) | (389,210,530) | ||||||||||||
|
| |||||||||||||||
Net increase (decrease) | (55,014) | $ | (1,083,202) | (25,180,517) | $ | (365,347,762) | ||||||||||
|
| |||||||||||||||
3. Transactions with Affiliates
Franklin Resources, Inc. is the holding company for various subsidiaries that together are referred to as Franklin Templeton Investments. Certain officers and trustees of the Fund are also officers and/or directors of the following subsidiaries:
| Subsidiary | Affiliation | |
Templeton Investment Counsel, LLC (TIC) | Investment manager | |
Franklin Templeton Services, LLC (FT Services) | Administrative manager | |
Franklin Templeton Distributors, Inc. (Distributors) | Principal underwriter | |
Franklin Templeton Investor Services, LLC (Investor Services) | Transfer agent |
a. Management Fees
The Fund pays an investment management fee to TIC based on the average daily net assets of the Fund as follows:
| Annualized Fee Rate | Net Assets | |
0.900% | Up to and including $200 million | |
0.810% | Over $200 million, up to and including $700 million | |
0.775% | Over $700 million, up to and including $1.2 billion | |
0.750% | Over $1.2 billion, up to and including $1.3 billion | |
0.675% | Over $1.3 billion, up to and including $10 billion | |
0.655% | Over $10 billion, up to and including $15 billion | |
0.635% | Over $15 billion, up to and including $20 billion | |
0.615% | In excess of $20 billion |
| Semiannual Report |
|
TF-19 |
|
FRANKLIN TEMPLETON VARIABLE INSURANCE PRODUCTS TRUST
NOTES TO FINANCIAL STATEMENTS (UNAUDITED)
Templeton Foreign VIP Fund (continued)
3. Transactions with Affiliates (continued)
a. Management Fees (continued)
For the period ended June 30, 2018, the annualized gross effective investment management fee rate was 0.778% of the Fund’s average daily net assets.
b. Administrative Fees
Under an agreement with TIC, FT Services provides administrative services to the Fund. The fee is paid by TIC based on the Fund’s average daily net assets, and is not an additional expense of the Fund.
c. Distribution Fees
The Board has adopted distribution plans for Class 2 and Class 4 shares pursuant to Rule 12b-1 under the 1940 Act. Under the Fund’s compensation distribution plans, the Fund pays Distributors for costs incurred in connection with the servicing, sale and distribution of the Fund’s shares up to 0.25% and 0.35% per year of its average daily net assets of Class 2 and Class 4, respectively. The plan year, for purposes of monitoring compliance with the maximum annual plan rates, is February 1 through January 31.
d. Transfer Agent Fees
Investor Services, under terms of an agreement, performs shareholder servicing for the Fund and is not paid by the Fund for the services.
e. Investments in Affiliated Management Investment Companies
The Fund invests in one or more affiliated management investment companies for purposes other than exercising a controlling influence over the management or policies. Management fees paid by the Fund are waived on assets invested in the affiliated management investment companies, as noted in the Statement of Operations, in an amount not to exceed the management and administrative fees paid directly or indirectly by each affiliate. Prior to January 1, 2014, the waiver was accounted for as a reduction to management fees. During the period ended June 30, 2018, the Fund held investments in affiliated management investment companies as follows:
| Number of Shares Held at Beginning of Period | Gross Additions | Gross Reductions | Number of Shares Held at End | Value at End of Period | Dividend Income | Realized Gain (Loss) | Net Change in Unrealized Appreciation (Depreciation) | |||||||||||||||||||||
| Non-Controlled Affiliates | ||||||||||||||||||||||||||||
Institutional Fiduciary Trust Money Market Portfolio, 1.51% | 25,636,178 | 400,352,542 | (397,635,463 | ) | 28,353,257 | $28,353,257 | $285,796 | $ — | $ — | |||||||||||||||||||
|
| |||||||||||||||||||||||||||
4. Expense Offset Arrangement
The Fund has entered into an arrangement with its custodian whereby credits realized as a result of uninvested cash balances are used to reduce a portion of the Fund’s custodian expenses. During the period ended June 30, 2018, there were no credits earned.
5. Income Taxes
For tax purposes, capital losses may be carried over to offset future capital gains, if any. At December 31, 2017, the Fund had long-term capital loss carryforwards, not subject to expiration, of $79,259,651.
TF-20 | Semiannual Report |
FRANKLIN TEMPLETON VARIABLE INSURANCE PRODUCTS TRUST
NOTES TO FINANCIAL STATEMENTS (UNAUDITED)
Templeton Foreign VIP Fund (continued)
At June 30, 2018, the cost of investments and net unrealized appreciation (depreciation) for income tax purposes were as follows:
Cost of investments | $ | 1,300,280,052 | ||
|
| |||
Unrealized appreciation | $ | 321,413,830 | ||
Unrealized depreciation | (89,648,927) | |||
|
| |||
Net unrealized appreciation (depreciation) | $ | 231,764,903 | ||
|
| |||
Differences between income and/or capital gains as determined on a book basis and a tax basis are primarily due to differing treatments of passive foreign investment company shares, foreign capital gains tax and wash sales.
6. Investment Transactions
Purchases and sales of investments (excluding short term securities) for the period ended June 30, 2018, aggregated $188,983,672 and $279,041,455, respectively.
At June 30, 2018, in connection with securities lending transactions, the Fund loaned equity investments and received $5,325,483 of cash collateral. The gross amount of recognized liability for such transactions is included in payable upon return of securities loaned in the Statement of Assets and Liabilities. The agreements can be terminated at any time.
7. Concentration of Risk
Investing in foreign securities may include certain risks and considerations not typically associated with investing in U.S. securities, such as fluctuating currency values and changing local and regional economic, political and social conditions, which may result in greater market volatility. In addition, certain foreign securities may not be as liquid as U.S. securities.
8. Credit Facility
The Fund, together with other U.S. registered and foreign investment funds (collectively, Borrowers), managed by Franklin Templeton Investments, are borrowers in a joint syndicated senior unsecured credit facility totaling $2 billion (Global Credit Facility) which matures on February 8, 2019. This Global Credit Facility provides a source of funds to the Borrowers for temporary and emergency purposes, including the ability to meet future unanticipated or unusually large redemption requests.
Under the terms of the Global Credit Facility, the Fund shall, in addition to interest charged on any borrowings made by the Fund and other costs incurred by the Fund, pay its share of fees and expenses incurred in connection with the implementation and maintenance of the Global Credit Facility, based upon its relative share of the aggregate net assets of all of the Borrowers, including an annual commitment fee of 0.15% based upon the unused portion of the Global Credit Facility. These fees are reflected in other expenses in the Statement of Operations. During the period ended June 30, 2018, the Fund did not use the Global Credit Facility.
9. Fair Value Measurements
The Fund follows a fair value hierarchy that distinguishes between market data obtained from independent sources (observable inputs) and the Fund’s own market assumptions (unobservable inputs). These inputs are used in determining the value of the Fund’s financial instruments and are summarized in the following fair value hierarchy:
| • | Level 1 – quoted prices in active markets for identical financial instruments |
| • | Level 2 – other significant observable inputs (including quoted prices for similar financial instruments, interest rates, prepayment speed, credit risk, etc.) |
| Semiannual Report |
|
TF-21 |
|
FRANKLIN TEMPLETON VARIABLE INSURANCE PRODUCTS TRUST
NOTES TO FINANCIAL STATEMENTS (UNAUDITED)
Templeton Foreign VIP Fund (continued)
9. Fair Value Measurements (continued)
| • | Level 3 – significant unobservable inputs (including the Fund’s own assumptions in determining the fair value of financial instruments) |
The input levels are not necessarily an indication of the risk or liquidity associated with financial instruments at that level.
For movements between the levels within the fair value hierarchy, the Fund has adopted a policy of recognizing the transfers as of the date of the underlying event which caused the movement.
A summary of inputs used as of June 30, 2018, in valuing the Fund’s assets carried at fair value, is as follows:
| Level 1 | Level 2 | Level 3 | Total | |||||||||||||
| ||||||||||||||||
| Assets: | ||||||||||||||||
Investments in Securities:a | ||||||||||||||||
Equity Investments:b | ||||||||||||||||
Aerospace & Defense | $ | 39,910,558 | $ | 108,164 | $ | — | $ | 40,018,722 | ||||||||
All Other Equity Investments | 1,463,672,976 | — | — | 1,463,672,976 | ||||||||||||
Short Term Investments | 28,353,257 | — | — | 28,353,257 | ||||||||||||
|
| |||||||||||||||
Total Investments in Securities | $ | 1,531,936,791 | $ | 108,164 | $ | — | $ | 1,532,044,955 | ||||||||
|
| |||||||||||||||
aFor detailed categories, see the accompanying Statement of Investments.
bIncludes common and preferred stocks as well as other equity investments.
10. Subsequent Events
The Fund has evaluated subsequent events through the issuance of the financial statements and determined that no events have occurred that require disclosure.
Abbreviations
| Selected Portfolio | ||
| ||
| ADR | American Depositary Receipt | |
| IDR | International Depositary Receipt | |
| NVDR | Non-Voting Depositary Receipt | |
TF-22 | Semiannual Report |
FRANKLIN TEMPLETON VARIABLE INSURANCE PRODUCTS TRUST
Tax Information (unaudited)
Templeton Foreign VIP Fund
At December 31, 2017, more than 50% of the Fund’s total assets were invested in securities of foreign issuers. In most instances, foreign taxes were withheld from income paid to the Fund on these investments. As shown in the table below, the Fund hereby reports to shareholders the foreign source income and foreign taxes paid, pursuant to Section 853 of the Internal Revenue Code. This written statement will allow shareholders of record on June 14, 2018, to treat their proportionate share of foreign taxes paid by the Fund as having been paid directly by them. The shareholder shall consider these amounts as foreign taxes paid in the tax year in which they receive the Fund distribution.
The following table provides a detailed analysis of foreign tax paid, and foreign source income as reported by the Fund, to Class 1, Class 2 and Class 4 shareholders of record.
| Class | Foreign Tax Paid Per Share | Foreign Source Income Per Share | ||
Class 1 | $0.0430 | $0.4150 | ||
Class 2 | $0.0430 | $0.3791 | ||
Class 4 | $0.0430 | $0.3470 |
Foreign Tax Paid Per Share (Column 1) is the amount per share available to you, as a tax credit (assuming you held your shares in the Fund for a minimum of 16 days during the 31-day period beginning 15 days before the ex-dividend date of the Fund’s distribution to which the foreign taxes relate), or, as a tax deduction.
Foreign Source Income Per Share (Column 2) is the amount per share of income dividends attributable to foreign securities held by the Fund, plus any foreign taxes withheld on these dividends.
| Semiannual Report |
|
TF-23 |
|
This page intentionally left blank.
Templeton Global Bond VIP Fund
This semiannual report for Templeton Global Bond VIP Fund covers the period ended June 30, 2018.
Class 2 Performance Summary as of June 30, 2018
The Fund’s Class 2 Shares had a -0.73% total return* for the six-month period ended June 30, 2018.
*The Fund has a fee waiver associated with any investment it makes in a Franklin Templeton money fund and/or other Franklin Templeton fund, contractually guaranteed through 4/30/19. Fund investment results reflect the fee waiver; without this waiver, the results would have been lower.
Performance reflects the Fund’s Class 2 operating expenses, but does not include any contract fees, expenses or sales charges. If they had been included, performance would be lower. These charges and deductions, particularly for variable life policies, can have a significant effect on contract values and insurance benefits. See the contract prospectus for a complete description of these expenses, including sales charges.
Performance data represent past performance, which does not guarantee future results. Investment return and principal value will fluctuate, and you may have a gain or loss when you sell your shares. Current performance may differ from figures shown.
Semiannual Report | TGB-1 |
TEMPLETON GLOBAL BOND VIP FUND
Fund Goal and Main Investments
The Fund seeks high current income, consistent with preservation of capital, with capital appreciation as a secondary consideration. Under normal market conditions, the Fund invests at least 80% of its net assets in bonds, which include debt securities of any maturity, such as bonds, notes, bills and debentures.
Fund Risks
All investments involve risks, including possible loss of principal. Foreign securities involve special risks, including currency fluctuations and economic and political uncertainties. Currency rates may fluctuate significantly over short periods of time, and can reduce returns. Sovereign debt securities are subject to various risks in addition to those relating to debt securities and foreign securities generally, including, but not limited to, the risk that a governmental entity may be unwilling or unable to pay interest and repay principal on its sovereign debt, or otherwise meet its obligations when due. Adverse conditions in a certain region or country can adversely affect securities of issuers in other countries whose economies appear to be unrelated. Investments in developing markets involve heightened risks related to the same factors, in addition to those associated with these markets’ smaller size, lesser liquidity and lack of established legal, political, business and social frameworks to support securities market. The Fund is actively managed but there is no guarantee that the manager’s investment decisions will produce the desired results. The Fund’s prospectus also includes a description of the main investment risks.
Performance Overview
You can find the Fund’s six-month total return in the Performance Summary. For comparison, the J.P. Morgan Global Government Bond Index had a -0.93% total return and the FTSE World Government Bond Index (WGBI), the new name for the Citigroup WGBI, had a -0.94% total return for the same period.1
Economic and Market Overview
The six-month period began with sharply rising yields in the US and Europe as reflation sentiments appeared to return to markets. Deregulation efforts and tax cuts were anticipated to
Geographic Composition*
Based on Total Net Assets as of 6/30/18
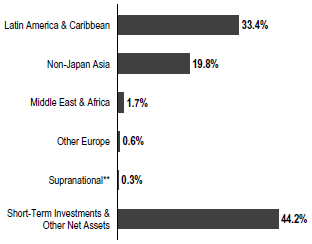
*Figures represent the net Fund exposure and include certain derivatives held in the portfolio (or their underlying reference assets) and may not total 100% or may be negative due to rounding, use of any derivatives or other factors.
**The Fund’s supranational investment was denominated in the Mexican peso.
add stimulus to an already strong US economy. The 10-year US Treasury yield rose 45 basis points (bps), finishing February at 2.86%. In Europe, the 10-year German bund yield rose 27 bps during January, reaching its peak yield for the period at 0.70% on February 2, its highest level since 2015. Markets appeared to initially anticipate upcoming rate adjustments from the European Central Bank (ECB) later in the year, but those expectations would diminish by the end of the period. Overall, the US dollar was broadly weaker against the euro and global currencies during the opening months of the period, but that trend would sharply reverse in April.
In February, Jerome Powell took over as US Federal Reserve (Fed) Chairman, replacing Janet Yellen. The Fed continued to unwind its balance sheet throughout the period, and raised the federal funds target rate 25 basis points twice; once in March and again in June. In Japan, Haruhiko Kuroda was reappointed to a second five-year term as Bank of Japan (BOJ) Governor, effectively extending the BOJ’s current monetary accommodation indefinitely.
By March, the rising yield trends in the US and Europe stalled and moderately reversed. Protectionist trade activity from the US in the form of steel and aluminum tariffs, as well as sector-specific tariffs on China, appeared to amplify risk
1. Source: Morningstar. One cannot invest directly in an index, and an index is not representative of the Fund’s portfolio. Please see Index Descriptions following the Fund Summaries.
The dollar value, number of shares or principal amount, and names of all portfolio holdings are listed in the Fund’s Statement of Investments (SOI).
TGB-2 | Semiannual Report |
TEMPLETON GLOBAL BOND VIP FUND
aversion across global financial markets. Credit spreads widened across investment-grade and high yield credit tiers in the US and Europe during the month, ultimately widening even further by the end of June.
In April, US Treasury yields rose sharply and the US dollar strengthened broadly as reflation sentiments appeared to again return to financial markets. The 10-year US Treasury yield rose above 3.00% for the first time in more than four years, ultimately reaching 3.11% on May 17, its highest level since 2011. However, risk aversion returned to global bond markets in the second half of May, as political issues in Italy raised concerns over the euro and Italian debt ratios. Consequently, yields in Italy, Spain, and much of peripheral Europe rose sharply, while yields in Germany, France, and the US declined as investors shifted to what they perceived as less risky investments. Several Latin American countries also saw rising yields and depreciations of their exchange rates during May, as upcoming elections in Mexico and Brazil, as well as policy concerns in Argentina appeared to increase regional volatility.
In the second half of June, a return of tariff threats from the US reintroduced risk aversion, driving the 10-year US Treasury yield back to where it began the month at 2.86%. Overall, the 10-year US Treasury yield finished the period 45 bps higher. In Europe, ECB president Mario Draghi provided updated guidance on the ECB’s monetary policy timeline at its June 14 meeting: The net asset purchase program will be reduced to €15 billion per month for October, November and December, and conclude at the end 2018. Draghi also indicated that rates would likely remain unchanged until at least the summer of 2019. The 10-year German bund correspondingly finished June four bps lower for the month at 0.30%, finishing the six-month period 13 bps lower than where it started.
On the whole, duration exposures in the US and in several parts of the world faced headwinds from rising rates during the period, with the exception of core European countries, which began the period with rising yields, but finished with sharply declining yields. Additionally, the US dollar started the period weaker before significantly strengthening against global currencies over the final three months. Avoiding US Treasury duration proved important to performance during the period, as did long exposure to the US dollar.
Investment Strategy
We invest selectively in bonds around the world based upon our assessment of changing market, political and economic conditions. While seeking opportunities, we monitor various factors including changes in interest rates, currency exchange rates and credit risks. We seek to manage the Fund’s exposure
Currency Composition*
6/30/18
% of Total Net Assets | ||||
| ||||
Americas | 159.9% | |||
| ||||
U.S. Dollar | 121.2% | |||
| ||||
Mexican Peso | 19.8% | |||
| ||||
Brazilian Real | 10.5% | |||
| ||||
Colombian Peso | 4.2% | |||
| ||||
Argentine Peso | 4.1% | |||
| ||||
Peruvian Nuevo Sol | 0.1% | |||
| ||||
Middle East & Africa | 1.7% | |||
| ||||
Ghanaian Cedi | 1.7% | |||
| ||||
Australia & New Zealand | -7.9% | |||
| ||||
New Zealand Dollar | 0.0% | ** | ||
| ||||
Australian Dollar | -7.9% | |||
| ||||
Asia Pacific | -13.6% | |||
| ||||
Indian Rupee | 10.2% | |||
| ||||
Indonesian Rupiah | 9.0% | |||
| ||||
Philippine Peso | 1.6% | |||
| ||||
South Korean Won | 0.0% | ** | ||
| ||||
Japanese Yen | -34.4% | |||
| ||||
Europe | -40.1% | |||
| ||||
Euro | -40.1% | |||
| ||||
*Figures represent the net Fund exposure and include certain derivatives held in the portfolio (or their underlying reference assets) and may not total 100% or may be negative due to rounding, use of any derivatives or other factors.
**Rounds to less than 0.1%.
to various currencies and regularly utilize currency and cross currency forward contracts and may also use currency and currency index futures contracts and other derivative instruments.
What is a currency forward contract?
A currency forward contract is an agreement between the Fund and a counterparty to buy or sell a foreign currency in exchange for another currency at a specific exchange rate on a future date. Currency forward contracts are privately traded in the interbank market, not on a centralized exchange.
|
Manager’s Discussion
On the whole, we continued to position our strategies for rising rates by maintaining low portfolio duration and aiming at a negative correlation with US Treasury returns. We also
| Semiannual Report |
|
TGB-3 |
|
TEMPLETON GLOBAL BOND VIP FUND
What is a futures contract?
A futures contract is an agreement between the Fund and a counterparty made through a US or foreign futures exchange to buy or sell an underlying instrument or asset at a specific price on a future date.
|
continued to actively seek select duration exposures that we believe can offer positive real yields without taking undue interest-rate risk, favoring countries that have solid underlying fundamentals and prudent fiscal and monetary policies. We continued to prefer local-currency positions in specific countries that we believed to have resilient economies and relatively higher, maintainable rate differentials. During the period, we held notable local-currency duration exposures in Brazil, Argentina, Colombia, Indonesia and India, and notable currency exposure to the Mexican peso. We also continued to hold net-negative positions in the euro and Japanese yen as hedges against a broadly strengthening US dollar and as directional views on the currencies. We also held net-negative positioning in the Australian dollar based on the Reserve Bank of Australia’s continued rate accommodation, and as a partial hedge against potential economic risks in China as well as broad-based beta risks across emerging markets. In credit markets, we continued to see areas of value in specific sovereign credits, but we largely preferred the risk-adjusted returns in specific areas of the local-currency bond markets over the more fully valued credit markets. Overall, the strategy was positioned for depreciation of the euro and yen, rising US Treasury yields, and currency appreciation in select emerging markets. During the period, we used currency forward contracts to actively manage currencies. We also used interest-rate swaps to tactically manage duration exposures.
What is duration?
Duration is a measure of a bond’s price sensitivity to interest-rate changes. In general, a portfolio of securities with a lower duration can be expected to be less sensitive to interest-rate changes than a portfolio with a higher duration.
|
What is an interest-rate swap?
An interest-rate swap is an agreement between two parties to exchange interest-rate payment obligations, generally one based on an interest rate fixed to maturity and the other based on an interest rate that changes in accordance with changes in a designated benchmark (for example, LIBOR, prime, commercial paper or other benchmarks).
|
During the period, the Fund’s negative absolute performance was primarily due to currency positions. Interest-rate strategies
and sovereign credit exposures had largely neutral effects on absolute results. Among currencies, positions in Latin America and Asia ex-Japan largely detracted from absolute performance (the Brazilian real, Argentine peso and Indian rupee detracted, while the Mexican peso contributed). The Fund’s net-negative position in the euro contributed to absolute results, while its net-negative position in the Japanese yen had a largely neutral effect. The Fund maintained a defensive approach regarding interest rates in developed markets, while holding duration exposures in select emerging markets. Select duration exposures in Latin America detracted from absolute performance, while negative duration exposure to US Treasuries moderately contributed.
On a relative basis, currency positions, interest-rate strategies and sovereign credit exposures had largely neutral effects on the Fund’s relative performance during the period. Among currencies, overweighted positions in Latin America and Asia ex-Japan largely detracted from relative results (the Brazilian real, Argentine peso and Indian rupee detracted, while the Mexican peso contributed). The Fund’s underweighted position in the euro contributed to relative results, while its underweighted position in the Japanese yen detracted. The Fund maintained a defensive approach regarding interest rates in developed markets, while holding duration exposures in select emerging markets. Select overweighted duration exposures in Latin America detracted from relative performance, while underweighted duration exposure in the US contributed.
Thank you for your participation in Templeton Global Bond VIP Fund. We look forward to serving your future investment needs.
The foregoing information reflects our analysis, opinions and portfolio holdings as of June 30, 2018, the end of the reporting period. The way we implement our main investment strategies and the resulting portfolio holdings may change depending on factors such as market and economic conditions. These opinions may not be relied upon as investment advice or an offer for a particular security. The information is not a complete analysis of every aspect of any market, country, industry, security or the Fund. Statements of fact are from sources considered reliable, but the investment manager makes no representation or warranty as to their completeness or accuracy. Although historical performance is no guarantee of future results, these insights may help you understand our investment management philosophy.
TGB-4 | Semiannual Report |
TEMPLETON GLOBAL BOND VIP FUND
Class 2 Fund Expenses
As an investor in a variable insurance contract (Contract) that indirectly provides for investment in an underlying mutual fund, you can incur transaction and/or ongoing expenses at both the Fund level and the Contract Level: (1) transaction expenses can include sales charges (loads) on purchases, surrender fees, transfer fees and premium taxes; and (2) ongoing expenses can include management fees, distribution and service (12b-1) fees, contract fees, annual maintenance fees, mortality and expense risk fees and other fees and expenses. All mutual funds and Contracts have some types of ongoing expenses. The table below shows Fund-level ongoing expenses and can help you understand these costs and compare them with those of other mutual funds offered through the Contract. The table assumes a $1,000 investment held for the six months indicated. Please refer to the Fund prospectus for additional information on operating expenses.
Actual Fund Expenses
The table below provides information about the actual account values and actual expenses in the columns under the heading “Actual.” In these columns the Fund’s actual return, which includes the effect of ongoing Fund expenses but does not include the effect of ongoing Contract expenses, is used to calculate the “Ending Account Value.” You can estimate the Fund-level expenses you paid during the period by following these steps (of course, your account value and expenses will differ from those in this illustration): Divide your account value by $1,000 (if your account had an $8,600 value, then $8,600 ÷ $1,000 = 8.6). Then multiply the result by the number under the headings “Actual” and “Fund-Level Expenses Paid During Period” (if Fund-Level Expenses Paid During Period were $ 7.50, then 8.6 x $7.50 = $64.50). In this illustration, the estimated expenses paid this period at the Fund level are $64.50.
Hypothetical Example for Comparison with Other Mutual Funds
Under the heading “Hypothetical” in the table, information is provided about hypothetical account values and hypothetical expenses based on the Fund’s actual expense ratio and an assumed rate of return of 5% per year before expenses, which is not the Fund’s actual return. This information may not be used to estimate the actual ending account balance or expenses you paid for the period, but it can help you compare ongoing costs of investing in the Fund with those of other mutual funds offered through the Contract. To do so, compare this 5% hypothetical example with the 5% hypothetical examples that appear in the shareholder reports of other funds offered through the Contract.
Please note that expenses shown in the table are meant to highlight ongoing costs at the Fund level only and do not reflect any ongoing expenses at the Contract level, or transaction expenses at either the Fund or Contract levels. In addition, while the Fund does not have transaction expenses, if the transaction and ongoing expenses at the Contract level were included, the expenses shown below would be higher. You should consult your Contract prospectus or disclosure document for more information.
| Actual (actual return after expenses) | Hypothetical (5% annual return before expenses) | |||||||||||
Share Class | Beginning Account Value 1/1/18 | Ending Account Value 6/30/18 | Fund-Level Expenses Paid During Period 1/1/18–6/30/181,2 | Ending Account Value 6/30/18 | Fund-Level Paid During Period 1/1/18–6/30/181,2 | Net Annualized Expense Ratio2 | ||||||
|
|
|
| |||||||||
Class 2 | $1,000 | $992.70 | $3.46 | $1,021.32 | $3.51 | 0.70% | ||||||
1. Expenses are equal to the annualized expense ratio for the six-month period as indicated above—in the far right column—multiplied by the simple average account value over the period indicated, and then multiplied by 181/365 to reflect the one-half year period.
2. Reflects expenses after fee waivers and expense reimbursements. Does not include any ongoing expenses of the Contract for which the Fund is an investment option or acquired fund fees and expenses.
| Semiannual Report |
|
TGB-5 |
|
FRANKLIN TEMPLETON VARIABLE INSURANCE PRODUCTS TRUST
Financial Highlights
Templeton Global Bond VIP Fund
Six Months Ended June 30, 2018 (unaudited) | Year Ended December 31, | |||||||||||||||||||||||
| 2017 | 2016 | 2015 | 2014 | 2013 | ||||||||||||||||||||
| ||||||||||||||||||||||||
Class 1 | ||||||||||||||||||||||||
| Per share operating performance (for a share outstanding throughout the period) | ||||||||||||||||||||||||
Net asset value, beginning of period | $17.17 | $16.85 | $16.34 | $18.56 | $19.15 | $20.01 | ||||||||||||||||||
|
| |||||||||||||||||||||||
| Income from investment operationsa: | ||||||||||||||||||||||||
Net investment incomeb | 0.41 | 0.83 | 0.62 | 0.52 | 0.58 | 0.64 | ||||||||||||||||||
Net realized and unrealized gains (losses) | (0.52 | ) | (0.46 | ) | (0.10 | ) | (1.22 | ) | (0.16 | ) | (0.30) | |||||||||||||
|
| |||||||||||||||||||||||
Total from investment operations | (0.11 | ) | 0.37 | 0.52 | (0.70 | ) | 0.42 | 0.34 | ||||||||||||||||
|
| |||||||||||||||||||||||
Less distributions from: | ||||||||||||||||||||||||
Net investment income and net foreign currency gains | — | — | — | (1.43 | ) | (1.01 | ) | (0.96) | ||||||||||||||||
Net realized gains | — | (0.05 | ) | (0.01 | ) | (0.09 | ) | — | (0.24) | |||||||||||||||
|
| |||||||||||||||||||||||
Total distributions | — | (0.05 | ) | (0.01 | ) | (1.52 | ) | (1.01 | ) | (1.20) | ||||||||||||||
|
| |||||||||||||||||||||||
Redemption fees | — | — | — | — | — | c | —c | |||||||||||||||||
|
| |||||||||||||||||||||||
Net asset value, end of period | $17.06 | $17.17 | $16.85 | $16.34 | $18.56 | $19.15 | ||||||||||||||||||
|
| |||||||||||||||||||||||
Total returnd | (0.64)% | 2.15% | 3.21% | (4.10)% | 2.12% | 1.89% | ||||||||||||||||||
| Ratios to average net assetse | ||||||||||||||||||||||||
Expenses before waiver and payments by affiliates and expense reduction | 0.55% | 0.53% | 0.53% | 0.52% | 0.51% | 0.51% | ||||||||||||||||||
Expenses net of waiver and payments by affiliates | 0.46% | 0.46% | 0.48% | 0.52% | g | 0.51% | 0.51% | |||||||||||||||||
Expenses net of waiver and payments by affiliates and expense reduction | 0.45% | 0.46% | f | 0.48% | f | 0.52% | f,g | 0.51% | f | 0.51%f | ||||||||||||||
Net investment income | 4.80% | 4.81% | 3.88% | 2.99% | 3.08% | 3.26% | ||||||||||||||||||
| Supplemental data | ||||||||||||||||||||||||
Net assets, end of period (000’s) | $275,800 | $286,502 | $241,792 | $292,802 | $323,491 | $280,963 | ||||||||||||||||||
Portfolio turnover rate | 11.89% | 37.97% | 59.00% | 51.58% | 39.14% | 34.39% | ||||||||||||||||||
aThe amount shown for a share outstanding throughout the period may not correlate with the Statement of Operations for the period due to the timing of sales and repurchases of the Fund’s shares in relation to income earned and/or fluctuating fair value of the investments of the Fund.
bBased on average daily shares outstanding.
cAmount rounds to less than $0.01 per share.
dTotal return does not include fees, charges or expenses imposed by the variable annuity and life insurance contracts for which Franklin Templeton Variable Insurance Products Trust serves as an underlying investment vehicle. Total return is not annualized for periods less than one year.
eRatios are annualized for periods less than one year.
fBenefit of expense reduction rounds to less than 0.01%.
gBenefit of waiver and payments by affiliates rounds to less than 0.01%.
TGB-6 | Semiannual Report | The accompanying notes are an integral part of these financial statements. |
FRANKLIN TEMPLETON VARIABLE INSURANCE PRODUCTS TRUST
FINANCIAL HIGHLIGHTS
Templeton Global Bond VIP Fund (continued)
Six Months Ended June 30, 2018 (unaudited) | Year Ended December 31, | |||||||||||||||||||||||
| 2017 | 2016 | 2015 | 2014 | 2013 | ||||||||||||||||||||
| ||||||||||||||||||||||||
Class 2 | ||||||||||||||||||||||||
| Per share operating performance (for a share outstanding throughout the period) | ||||||||||||||||||||||||
Net asset value, beginning of period | $16.51 | $16.25 | $15.80 | $17.99 | $18.60 | $19.47 | ||||||||||||||||||
|
| |||||||||||||||||||||||
| Income from investment operationsa: | ||||||||||||||||||||||||
Net investment incomeb | 0.38 | 0.76 | 0.56 | 0.46 | 0.52 | 0.57 | ||||||||||||||||||
Net realized and unrealized gains (losses) | (0.50 | ) | (0.45 | ) | (0.10 | ) | (1.17 | ) | (0.17 | ) | (0.27) | |||||||||||||
|
| |||||||||||||||||||||||
Total from investment operations | (0.12 | ) | 0.31 | 0.46 | (0.71 | ) | 0.35 | 0.30 | ||||||||||||||||
|
| |||||||||||||||||||||||
Less distributions from: | ||||||||||||||||||||||||
Net investment income and net foreign currency gains | — | — | — | (1.39 | ) | (0.96 | ) | (0.93) | ||||||||||||||||
Net realized gains | — | (0.05 | ) | (0.01 | ) | (0.09 | ) | — | (0.24) | |||||||||||||||
|
| |||||||||||||||||||||||
Total distributions | — | (0.05 | ) | (0.01 | ) | (1.48 | ) | (0.96 | ) | (1.17) | ||||||||||||||
|
| |||||||||||||||||||||||
Redemption fees | — | — | — | — | — | c | —c | |||||||||||||||||
|
| |||||||||||||||||||||||
Net asset value, end of period | $16.39 | $16.51 | $16.25 | $15.80 | $17.99 | $18.60 | ||||||||||||||||||
|
| |||||||||||||||||||||||
Total returnd | (0.73)% | 1.93% | 2.94% | (4.30)% | 1.83% | 1.63% | ||||||||||||||||||
| Ratios to average net assetse | ||||||||||||||||||||||||
Expenses before waiver and payments by affiliates and expense reduction | 0.80% | 0.78% | 0.78% | 0.77% | 0.76% | 0.76% | ||||||||||||||||||
Expenses net of waiver and payments by affiliates | 0.71% | 0.71% | 0.73% | 0.77% | g | 0.76% | 0.76% | |||||||||||||||||
Expenses net of waiver and payments by affiliates and expense reduction | 0.70% | 0.71% | f | 0.73% | f | 0.77% | f,g | 0.76% | f | 0.76%f | ||||||||||||||
Net investment income | 4.55% | 4.56% | 3.63% | 2.74% | 2.83% | 3.01% | ||||||||||||||||||
Supplemental data | ||||||||||||||||||||||||
Net assets, end of period (000’s) | $2,642,931 | $2,730,081 | $2,812,535 | $2,971,667 | $3,177,638 | $2,826,039 | ||||||||||||||||||
Portfolio turnover rate | 11.89% | 37.97% | 59.00% | 51.58% | 39.14% | 34.39% | ||||||||||||||||||
aThe amount shown for a share outstanding throughout the period may not correlate with the Statement of Operations for the period due to the timing of sales and repurchases of the Fund’s shares in relation to income earned and/or fluctuating fair value of the investments of the Fund.
bBased on average daily shares outstanding.
cAmount rounds to less than $0.01 per share.
dTotal return does not include fees, charges or expenses imposed by the variable annuity and life insurance contracts for which Franklin Templeton Variable Insurance Products Trust serves as an underlying investment vehicle. Total return is not annualized for periods less than one year.
eRatios are annualized for periods less than one year.
fBenefit of expense reduction rounds to less than 0.01%.
gBenefit of waiver and payments by affiliates rounds to less than 0.01%.
| The accompanying notes are an integral part of these financial statements. | Semiannual Report |
|
TGB-7 |
|
FRANKLIN TEMPLETON VARIABLE INSURANCE PRODUCTS TRUST
FINANCIAL HIGHLIGHTS
Templeton Global Bond VIP Fund (continued)
Six Months Ended (unaudited) | Year Ended December 31, | |||||||||||||||||||||||
| 2017 | 2016 | 2015 | 2014 | 2013 | ||||||||||||||||||||
| ||||||||||||||||||||||||
Class 4 | ||||||||||||||||||||||||
| Per share operating performance (for a share outstanding throughout the period) | ||||||||||||||||||||||||
Net asset value, beginning of period | $16.88 | $16.62 | $16.18 | $18.38 | $18.97 | $19.82 | ||||||||||||||||||
|
| |||||||||||||||||||||||
| Income from investment operationsa: | ||||||||||||||||||||||||
Net investment incomeb | 0.38 | 0.76 | 0.56 | 0.46 | 0.51 | 0.56 | ||||||||||||||||||
Net realized and unrealized gains (losses) | (0.52 | ) | (0.45 | ) | (0.11 | ) | (1.21 | ) | (0.18 | ) | (0.28) | |||||||||||||
|
| |||||||||||||||||||||||
Total from investment operations | (0.14 | ) | 0.31 | 0.45 | (0.75 | ) | 0.33 | 0.28 | ||||||||||||||||
|
| |||||||||||||||||||||||
Less distributions from: | ||||||||||||||||||||||||
Net investment income and net foreign currency gains | — | — | — | (1.36 | ) | (0.92 | ) | (0.89) | ||||||||||||||||
Net realized gains | — | (0.05 | ) | (0.01 | ) | (0.09 | ) | — | (0.24) | |||||||||||||||
|
| |||||||||||||||||||||||
Total distributions | — | (0.05 | ) | (0.01 | ) | (1.45 | ) | (0.92 | ) | (1.13) | ||||||||||||||
|
| |||||||||||||||||||||||
Redemption fees | — | — | — | — | — | c | —c | |||||||||||||||||
|
| |||||||||||||||||||||||
Net asset value, end of period | $16.74 | $16.88 | $16.62 | $16.18 | $18.38 | $18.97 | ||||||||||||||||||
|
| |||||||||||||||||||||||
Total returnd | (0.83)% | 1.76% | 2.87% | (4.39)% | 1.69% | 1.54% | ||||||||||||||||||
| Ratios to average net assetse | ||||||||||||||||||||||||
Expenses before waiver and payments by affiliates and expense reduction | 0.90% | 0.88% | 0.88% | 0.87% | 0.86% | 0.86% | ||||||||||||||||||
Expenses net of waiver and payments by affiliates | 0.81% | 0.81% | 0.83% | 0.87% | g | 0.86% | 0.86% | |||||||||||||||||
Expenses net of waiver and payments by affiliates and expense reduction | 0.80% | 0.81% | f | 0.83% | f | 0.87% | f,g | 0.86% | f | 0.86% | f | |||||||||||||
| Net investment income | 4.45% | 4.46% | 3.53% | 2.64% | 2.73% | 2.91% | ||||||||||||||||||
Supplemental data | ||||||||||||||||||||||||
Net assets, end of period (000’s) | $94,514 | $98,934 | $96,798 | $103,045 | $111,199 | $118,145 | ||||||||||||||||||
Portfolio turnover rate | 11.89% | 37.97% | 59.00% | 51.58% | 39.14% | 34.39% | ||||||||||||||||||
aThe amount shown for a share outstanding throughout the period may not correlate with the Statement of Operations for the period due to the timing of sales and repurchases of the Fund’s shares in relation to income earned and/or fluctuating fair value of the investments of the Fund.
bBased on average daily shares outstanding.
cAmount rounds to less than $0.01 per share.
dTotal return does not include fees, charges or expenses imposed by the variable annuity and life insurance contracts for which Franklin Templeton Variable Insurance Products Trust serves as an underlying investment vehicle. Total return is not annualized for periods less than one year.
eRatios are annualized for periods less than one year.
fBenefit of expense reduction rounds to less than 0.01%.
gBenefit of waiver and payments by affiliates rounds to less than 0.01%.
TGB-8 | Semiannual Report | The accompanying notes are an integral part of these financial statements. |
FRANKLIN TEMPLETON VARIABLE INSURANCE PRODUCTS TRUST
Statement of Investments, June 30, 2018 (unaudited)
Templeton Global Bond VIP Fund
| | Principal Amount | * | Value | |||||||||
| ||||||||||||
Foreign Government and Agency Securities 55.8% | ||||||||||||
Argentina 3.6% | ||||||||||||
Argentine Bonos del Tesoro, | ||||||||||||
21.20%, 9/19/18 | 64,168,000 | ARS | $ | 2,127,569 | ||||||||
18.20%, 10/03/21 | 813,341,000 | ARS | 24,371,979 | |||||||||
16.00%, 10/17/23 | 844,288,000 | ARS | 26,224,971 | |||||||||
senior note, 15.50%, 10/17/26 | 1,668,306,000 | ARS | 52,169,512 | |||||||||
Government of Argentina, | ||||||||||||
3.75%, 2/08/19 | 34,010,000 | ARS | 1,260,328 | |||||||||
a FRN, 27.947%, (ARS Badlar + 2.00%), 4/03/22 | 24,036,000 | ARS | 758,821 | |||||||||
|
| |||||||||||
| 106,913,180 | ||||||||||||
|
| |||||||||||
Brazil 8.7% | ||||||||||||
Letra Tesouro Nacional, | ||||||||||||
Strip, 1/01/19 | 33,250 | b | BRL | 8,305,310 | ||||||||
Strip, 7/01/19 | 102,840 | b | BRL | 24,689,429 | ||||||||
Strip, 7/01/20 | 118,041 | b | BRL | 25,774,260 | ||||||||
Strip, 7/01/21 | 24,360 | b | BRL | 4,773,974 | ||||||||
Nota Do Tesouro Nacional, | ||||||||||||
10.00%, 1/01/21 | 38,520 | b | BRL | 10,101,535 | ||||||||
10.00%, 1/01/23 | 522,145 | b | BRL | 132,146,066 | ||||||||
10.00%, 1/01/25 | 69,029 | b | BRL | 16,876,984 | ||||||||
10.00%, 1/01/27 | 46,543 | b | BRL | 11,088,084 | ||||||||
c Index Linked, 6.00%, 5/15/19 | 2,087 | b | BRL | 1,718,404 | ||||||||
c Index Linked, 6.00%, 8/15/22 | 18,002 | b | BRL | 14,776,874 | ||||||||
c Index Linked, 6.00%, 5/15/23 | 4,510 | b | BRL | 3,686,569 | ||||||||
c Index Linked, 6.00%, 8/15/24 | 3,110 | b | BRL | 2,549,007 | ||||||||
senior note, 10.00%, 1/01/19 | 21,390 | b | BRL | 5,603,260 | ||||||||
|
| |||||||||||
| 262,089,756 | ||||||||||||
|
| |||||||||||
Colombia 4.1% | ||||||||||||
Government of Colombia, | ||||||||||||
senior bond, 7.75%, 4/14/21 | 2,386,000,000 | COP | 854,501 | |||||||||
senior bond, 4.375%, 3/21/23 | 362,000,000 | COP | 117,950 | |||||||||
senior bond, 9.85%, 6/28/27 | 576,000,000 | COP | 248,297 | |||||||||
Titulos de Tesoreria, | ||||||||||||
B, 5.00%, 11/21/18 | 2,882,000,000 | COP | 986,156 | |||||||||
B, 7.75%, 9/18/30 | 140,945,200,000 | COP | 51,802,083 | |||||||||
B, 7.00%, 6/30/32 | 5,967,000,000 | COP | 2,030,588 | |||||||||
senior bond, B, 11.25%, 10/24/18 | 5,135,000,000 | COP | 1,799,360 | |||||||||
senior bond, B, 11.00%, 7/24/20 | 9,167,000,000 | COP | 3,472,751 | |||||||||
senior bond, B, 7.00%, 5/04/22 | 10,237,000,000 | COP | 3,656,174 | |||||||||
senior bond, B, 10.00%, 7/24/24 | 40,977,000,000 | COP | 16,636,715 | |||||||||
senior bond, B, 7.50%, 8/26/26 | 77,594,200,000 | COP | 28,044,492 | |||||||||
senior bond, B, 6.00%, 4/28/28 | 42,303,600,000 | COP | 13,878,563 | |||||||||
senior note, B, 7.00%, 9/11/19 | 4,056,000,000 | COP | 1,417,722 | |||||||||
|
| |||||||||||
| 124,945,352 | ||||||||||||
|
| |||||||||||
Ghana 1.7% | ||||||||||||
Government of Ghana, | ||||||||||||
24.75%, 3/01/21 | 690,000 | GHS | 164,138 | |||||||||
16.25%, 5/17/21 | 7,250,000 | GHS | 1,458,591 | |||||||||
24.50%, 6/21/21 | 80,000 | GHS | 19,161 | |||||||||
24.75%, 7/19/21 | 1,190,000 | GHS | 286,156 | |||||||||
18.75%, 1/24/22 | 26,840,000 | GHS | 5,723,388 | |||||||||
| Semiannual Report |
|
TGB-9 |
|
FRANKLIN TEMPLETON VARIABLE INSURANCE PRODUCTS TRUST
STATEMENT OF INVESTMENTS (UNAUDITED)
Templeton Global Bond VIP Fund (continued)
| | Principal Amount | * | Value | |||||||||
| ||||||||||||
Foreign Government and Agency Securities (continued) | ||||||||||||
Ghana (continued) | ||||||||||||
Government of Ghana, (continued) | ||||||||||||
17.60%, 11/28/22 | 370,000 | GHS | $ | 76,531 | ||||||||
19.75%, 3/25/24 | 26,840,000 | GHS | 5,975,788 | |||||||||
19.00%, 11/02/26 | 80,510,000 | GHS | 17,400,956 | |||||||||
senior bond, 19.75%, 3/15/32 | 80,510,000 | GHS | 18,140,562 | |||||||||
senior note, 21.50%, 3/09/20 | 1,270,000 | GHS | 278,283 | |||||||||
senior note, 18.50%, 6/01/20 | 500,000 | GHS | 105,325 | |||||||||
senior note, 18.25%, 9/21/20 | 480,000 | GHS | 100,338 | |||||||||
senior note, 16.50%, 3/22/21 | 1,730,000 | GHS | 350,365 | |||||||||
|
| |||||||||||
| 50,079,582 | ||||||||||||
|
| |||||||||||
India 7.9% | ||||||||||||
Government of India, | ||||||||||||
senior bond, 8.20%, 2/15/22 | 500,000,000 | INR | 7,358,385 | |||||||||
senior bond, 8.35%, 5/14/22 | 212,700,000 | INR | 3,152,285 | |||||||||
senior bond, 8.08%, 8/02/22 | 1,783,000,000 | INR | 26,195,463 | |||||||||
senior bond, 8.13%, 9/21/22 | 28,000,000 | INR | 411,963 | |||||||||
senior bond, 9.15%, 11/14/24 | 2,409,000,000 | INR | 37,006,265 | |||||||||
senior note, 8.27%, 6/09/20 | 1,222,000,000 | INR | 18,068,857 | |||||||||
senior note, 7.80%, 4/11/21 | 1,980,300,000 | INR | 28,963,261 | |||||||||
senior note, 8.79%, 11/08/21 | 653,000,000 | INR | 9,807,305 | |||||||||
senior note, 8.15%, 6/11/22 | 1,621,000,000 | INR | 23,813,025 | |||||||||
senior note, 6.84%, 12/19/22 | 98,000,000 | INR | 1,373,374 | |||||||||
senior note, 7.16%, 5/20/23 | 133,700,000 | INR | 1,887,629 | |||||||||
senior note, 8.83%, 11/25/23 | 2,983,900,000 | INR | 45,102,830 | |||||||||
senior note, 7.68%, 12/15/23 | 1,376,000,000 | INR | 19,808,993 | |||||||||
senior note, 6.79%, 5/15/27 | 1,142,800,000 | INR | 15,390,992 | |||||||||
|
| |||||||||||
| 238,340,627 | ||||||||||||
|
| |||||||||||
Indonesia 4.1% | ||||||||||||
Government of Indonesia, | ||||||||||||
senior bond, FR34, 12.80%, 6/15/21 | 324,406,000,000 | IDR | 25,744,211 | |||||||||
senior bond, FR35, 12.90%, 6/15/22 | 71,229,000,000 | IDR | 5,835,507 | |||||||||
senior bond, FR39, 11.75%, 8/15/23 | 5,491,000,000 | IDR | 446,388 | |||||||||
senior bond, FR40, 11.00%, 9/15/25 | 46,856,000,000 | IDR | 3,807,992 | |||||||||
senior bond, FR43, 10.25%, 7/15/22 | 147,832,000,000 | IDR | 11,214,284 | |||||||||
senior bond, FR44, 10.00%, 9/15/24 | 4,454,000,000 | IDR | 342,675 | |||||||||
senior bond, FR46, 9.50%, 7/15/23 | 226,780,000,000 | IDR | 17,180,218 | |||||||||
senior bond, FR47, 10.00%, 2/15/28 | 12,000,000 | IDR | 942 | |||||||||
senior bond, FR52, 10.50%, 8/15/30 | 6,960,000,000 | IDR | 570,157 | |||||||||
senior bond, FR59, 7.00%, 5/15/27 | 47,752,000,000 | IDR | 3,150,701 | |||||||||
senior bond, FR61, 7.00%, 5/15/22 | 244,849,000,000 | IDR | 16,718,241 | |||||||||
senior bond, FR63, 5.625%, 5/15/23 | 258,951,000,000 | IDR | 16,868,871 | |||||||||
senior bond, FR64, 6.125%, 5/15/28 | 37,000,000 | IDR | 2,312 | |||||||||
senior bond, FR68, 8.375%, 3/15/34 | 81,180,000,000 | IDR | 5,717,442 | |||||||||
senior bond, FR70, 8.375%, 3/15/24 | 78,915,000,000 | IDR | 5,637,490 | |||||||||
senior bond, FR71, 9.00%, 3/15/29 | 51,222,000,000 | IDR | 3,811,265 | |||||||||
senior bond, FR73, 8.75%, 5/15/31 | 85,845,000,000 | IDR | 6,241,284 | |||||||||
|
| |||||||||||
| 123,289,980 | ||||||||||||
|
| |||||||||||
TGB-10 | Semiannual Report |
FRANKLIN TEMPLETON VARIABLE INSURANCE PRODUCTS TRUST
STATEMENT OF INVESTMENTS (UNAUDITED)
Templeton Global Bond VIP Fund (continued)
| | Principal Amount | * | Value | |||||||||
| ||||||||||||
Foreign Government and Agency Securities (continued) | ||||||||||||
Mexico 16.9% | ||||||||||||
Government of Mexico, | ||||||||||||
senior bond, M, 8.00%, 6/11/20. | 3,814,000 | d | MXN | $ | 19,320,536 | |||||||
senior bond, M, 6.50%, 6/10/21. | 18,568,200 | d | MXN | 90,582,288 | ||||||||
senior note, M, 5.00%, 12/11/19 | 18,742,300 | d | MXN | 90,827,100 | ||||||||
senior note, M 10, 8.50%, 12/13/18 | 60,159,700 | d | MXN | 304,354,897 | ||||||||
e Mexican Udibonos, | ||||||||||||
Index Linked, 4.00%, 6/13/19 | 465,586 | f | MXN | 2,350,166 | ||||||||
Index Linked, 2.50%, 12/10/20 | 366,672 | f | MXN | 1,792,202 | ||||||||
|
| |||||||||||
| 509,227,189 | ||||||||||||
|
| |||||||||||
Peru 0.1% | ||||||||||||
Government of Peru, | ||||||||||||
senior bond, 7.84%, 8/12/20 | 11,090,000 | PEN | 3,729,703 | |||||||||
|
| |||||||||||
Philippines 1.2% | ||||||||||||
Government of the Philippines, | ||||||||||||
senior note, 3.375%, 8/20/20 | 1,102,110,000 | PHP | 20,169,168 | |||||||||
senior note, 7-51, 5.00%, 8/18/18 | 64,060,000 | PHP | 1,201,724 | |||||||||
senior note, 7-56, 3.875%, 11/22/19 | 813,510,000 | PHP | 15,126,270 | |||||||||
|
| |||||||||||
| 36,497,162 | ||||||||||||
|
| |||||||||||
South Korea 6.6% | ||||||||||||
Korea Monetary Stabilization Bond, | ||||||||||||
senior note, 1.72%, 12/02/18 | 8,710,000,000 | KRW | 7,810,255 | |||||||||
senior note, 2.06%, 12/02/19 | 82,700,000,000 | KRW | 74,230,329 | |||||||||
Korea Treasury Bond, | ||||||||||||
senior note, 1.75%, 12/10/18 | 107,140,000,000 | KRW | 96,102,673 | |||||||||
senior note, 1.25%, 12/10/19 | 18,280,000,000 | KRW | 16,221,886 | |||||||||
senior note, 3.00%, 3/10/23 | 3,919,000,000 | KRW | 3,609,777 | |||||||||
|
| |||||||||||
| 197,974,920 | ||||||||||||
|
| |||||||||||
g Supranational 0.3% | ||||||||||||
Inter-American Development Bank, | ||||||||||||
senior bond, 7.50%, 12/05/24 | 200,000,000 | MXN | 9,821,280 | |||||||||
|
| |||||||||||
Ukraine 0.6% | ||||||||||||
h,i,j Government of Ukraine, 144A, VRI, GDP Linked Security, 5/31/40 | 29,791,000 | 18,845,936 | ||||||||||
|
| |||||||||||
Total Foreign Government and Agency Securities | 1,681,754,667 | |||||||||||
|
| |||||||||||
Short Term Investments 39.9% | ||||||||||||
Foreign Government and Agency Securities 5.0% | ||||||||||||
Argentina 0.5% | ||||||||||||
k Argentina Treasury Bill, 9/14/18 - 10/12/18 | 32,201,000 | ARS | 1,154,269 | |||||||||
Letras del Banco Central de la Republica Argentina, Strip, 7/18/18 - 11/21/18 | 472,458,000 | ARS | 15,216,009 | |||||||||
|
| |||||||||||
| 16,370,278 | ||||||||||||
|
| |||||||||||
Mexico 2.3% | ||||||||||||
k Mexico Treasury Bill, 7/05/18 - 5/23/19 | 143,049,780 | l | MXN | 68,804,900 | ||||||||
|
| |||||||||||
Philippines 0.4% | ||||||||||||
k Philippine Treasury Bill, 8/29/18 - 12/12/18 | 690,620,000 | PHP | 12,831,154 | |||||||||
|
| |||||||||||
| Semiannual Report |
|
TGB-11 |
|
FRANKLIN TEMPLETON VARIABLE INSURANCE PRODUCTS TRUST
STATEMENT OF INVESTMENTS (UNAUDITED)
Templeton Global Bond VIP Fund (continued)
| | Principal Amount | * | Value | |||||||||
| ||||||||||||
Short Term Investments (continued) | ||||||||||||
Foreign Government and Agency Securities (continued) | ||||||||||||
South Korea 1.8% | ||||||||||||
Korea Monetary Stabilization Bond, senior note, 1.61%, 10/08/18 | 60,000,000,000 | KRW | $ | 53,787,252 | ||||||||
|
| |||||||||||
Total Foreign Government and Agency Securities (Cost $158,783,902) | 151,793,584 | |||||||||||
|
| |||||||||||
U.S. Government and Agency Securities 3.1% | ||||||||||||
United States 3.1% | ||||||||||||
k U.S. Treasury Bill, 9/13/18 - 2/28/19 | 76,809,000 | 76,090,547 | ||||||||||
U.S. Treasury Note, | ||||||||||||
1.50%, 8/31/18 | 8,602,000 | 8,596,280 | ||||||||||
2.75%, 2/15/19 | 8,339,000 | 8,365,222 | ||||||||||
|
| |||||||||||
Total U.S. Government and Agency Securities (Cost $93,081,306) | 93,052,049 | |||||||||||
|
| |||||||||||
Total Investment before Money Market Funds and Repurchase Agreements (Cost $2,094,589,992) | 1,926,600,300 | |||||||||||
|
| |||||||||||
| Shares | ||||||||||||
Money Market Funds (Cost $805,945,058) 26.8% | ||||||||||||
United States 26.8% | ||||||||||||
m,n Institutional Fiduciary Trust Money Market Portfolio, 1.51% | 805,945,058 | 805,945,058 | ||||||||||
|
| |||||||||||
| | Principal Amount | * | ||||||||||
Repurchase Agreements (Cost $151,947,582) 5.0% | ||||||||||||
United States 5.0% | ||||||||||||
o Joint Repurchase Agreement, 2.10%, 7/02/18 (Maturity Value $151,974,172) Collateralized by U.S. Government Agency Securities, 0.00% - 3.625%, 9/18/18 - 6/19/23; kU.S. Treasury Bill, 10/04/18 - 10/18/18; and U.S. Treasury Note, 2.00% - 3.50%, 5/15/20 - 8/31/21 (valued at $155,072,942) | 151,947,582 | 151,947,582 | ||||||||||
|
| |||||||||||
Total Investments (Cost $3,052,482,632) 95.7% | 2,884,492,940 | |||||||||||
Other Assets, less Liabilities 4.3%. | 128,751,988 | |||||||||||
|
| |||||||||||
Net Assets 100.0% | $ | 3,013,244,928 | ||||||||||
|
| |||||||||||
TGB-12 | Semiannual Report |
FRANKLIN TEMPLETON VARIABLE INSURANCE PRODUCTS TRUST
STATEMENT OF INVESTMENTS (UNAUDITED)
Templeton Global Bond VIP Fund (continued)
*The principal amount is stated in U.S. dollars unless otherwise indicated.
aThe coupon rate shown represents the rate at period end.
bPrincipal amount is stated in 1,000 Brazilian Real Units.
cRedemption price at maturity and coupon payment are adjusted for inflation. See Note 1(g).
dPrincipal amount is stated in 100 Mexican Peso Units.
ePrincipal amount of security is adjusted for inflation. See Note 1(g).
fPrincipal amount is stated in 100 Unidad de Inversion Units.
gA supranational organization is an entity formed by two or more central governments through international treaties.
hNon-income producing.
iSecurity was purchased pursuant to Rule 144A under the Securities Act of 1933 and may be sold in transactions exempt from registration only to qualified institutional buyers or in a public offering registered under the Securities Act of 1933. This security has been deemed liquid under guidelines approved by the Trust’s Board of Trustees.
jThe principal represents the notional amount. See Note 1(d) regarding value recovery instruments.
kThe security was issued on a discount basis with no stated coupon rate.
lPrincipal amount is stated in 10 Mexican Peso Units.
mSee Note 3(e) regarding investments in affiliated management investment companies.
nThe rate shown is the annualized seven-day effective yield at period end.
oSee Note 1(c) regarding joint repurchase agreement.
At June 30, 2018, the Fund had the following forward exchange contracts outstanding. See Note 1(d).
Forward Exchange Contracts
| Currency | Counterparty | a | Type | Quantity | | Contract Amount | * | | Settlement Date | | | Unrealized Appreciation | | | Unrealized Depreciation | | ||||||||||||||||
| OTC Forward Exchange Contracts |
| |||||||||||||||||||||||||||||||
Brazilian Real | CITI | Buy | 206,375,000 | 49,201,335 | EUR | 7/05/18 | $ | — | $ | (4,293,805 | ) | |||||||||||||||||||||
Brazilian Real | CITI | Sell | 206,375,000 | 46,409,778 | EUR | 7/05/18 | 1,030,828 | — | ||||||||||||||||||||||||
Euro | DBAB | Sell | 8,136,104 | 9,522,496 | 7/05/18 | 12,423 | — | |||||||||||||||||||||||||
Japanese Yen | DBAB | Buy | 229,660,000 | 2,082,517 | 7/05/18 | — | (6,952 | ) | ||||||||||||||||||||||||
Japanese Yen | DBAB | Sell | 229,660,000 | 2,120,904 | 7/05/18 | 45,339 | — | |||||||||||||||||||||||||
Euro | JPHQ | Sell | 32,859,900 | 40,725,739 | 7/06/18 | 2,313,817 | — | |||||||||||||||||||||||||
Euro | BOFA | Sell | 24,933,432 | 30,142,392 | 7/09/18 | 989,670 | — | |||||||||||||||||||||||||
Euro | GSCO | Sell | 8,105,300 | 10,005,993 | 7/09/18 | 529,096 | — | |||||||||||||||||||||||||
Euro | UBSW | Sell | 8,311,299 | 10,256,559 | 7/09/18 | 538,803 | — | |||||||||||||||||||||||||
Euro | HSBK | Sell | 33,800,018 | 41,617,118 | 7/10/18 | 2,094,436 | — | |||||||||||||||||||||||||
Euro | JPHQ | Sell | 7,171,498 | 8,861,677 | 7/10/18 | 475,976 | — | |||||||||||||||||||||||||
Japanese Yen | BZWS | Sell | 1,712,605,900 | 16,096,147 | 7/11/18 | 611,985 | — | |||||||||||||||||||||||||
Japanese Yen | DBAB | Sell | 770,370,000 | 6,919,077 | 7/11/18 | — | (46,060 | ) | ||||||||||||||||||||||||
Australian Dollar | JPHQ | Sell | 6,994,145 | 5,348,632 | 7/12/18 | 171,668 | — | |||||||||||||||||||||||||
Euro | DBAB | Sell | 25,440,500 | 31,645,565 | 7/12/18 | 1,893,305 | — | |||||||||||||||||||||||||
Japanese Yen | CITI | Sell | 138,680,000 | 1,257,162 | 7/12/18 | 3,230 | — | |||||||||||||||||||||||||
Euro | BOFA | Sell | 17,769,000 | 22,138,752 | 7/13/18 | 1,356,638 | — | |||||||||||||||||||||||||
Euro | GSCO | Sell | 1,789,884 | 2,229,139 | 7/13/18 | 135,742 | — | |||||||||||||||||||||||||
Indian Rupee | JPHQ | Buy | 179,045,721 | 2,725,616 | 7/13/18 | — | (115,585 | ) | ||||||||||||||||||||||||
Japanese Yen | CITI | Sell | 261,800,000 | 2,463,594 | 7/13/18 | 96,260 | — | |||||||||||||||||||||||||
Japanese Yen | DBAB | Sell | 1,406,600,000 | 13,241,081 | 7/13/18 | 521,857 | — | |||||||||||||||||||||||||
Australian Dollar | JPHQ | Sell | 25,071,750 | 19,085,619 | 7/16/18 | 527,598 | — | |||||||||||||||||||||||||
Euro | HSBK | Sell | 8,692,000 | 10,785,772 | 7/16/18 | 617,580 | — | |||||||||||||||||||||||||
Euro | JPHQ | Sell | 30,863,836 | 36,487,319 | 7/16/18 | 381,770 | — | |||||||||||||||||||||||||
Indian Rupee | JPHQ | Buy | 179,029,279 | 2,712,770 | 7/16/18 | — | (104,112 | ) | ||||||||||||||||||||||||
Japanese Yen | BZWS | Sell | 2,516,120,000 | 22,820,294 | 7/17/18 | 61,940 | — | |||||||||||||||||||||||||
Japanese Yen | HSBK | Sell | 536,380,000 | 4,867,332 | 7/17/18 | 15,765 | — | |||||||||||||||||||||||||
Euro | GSCO | Sell | 1,898,500 | 2,367,809 | 7/18/18 | 146,548 | — | |||||||||||||||||||||||||
| Semiannual Report |
|
TGB-13 |
|
FRANKLIN TEMPLETON VARIABLE INSURANCE PRODUCTS TRUST
STATEMENT OF INVESTMENTS (UNAUDITED)
Templeton Global Bond VIP Fund (continued)
Forward Exchange Contracts (continued)
| Currency | Counterparty | a | Type | Quantity | | Contract Amount | * | | Settlement Date | | | Unrealized Appreciation | | | Unrealized Depreciation | | ||||||||||||
| OTC Forward Exchange Contracts (continued) |
| |||||||||||||||||||||||||||
Euro | MSCO | Sell | 15,372,250 | 17,947,563 | 7/19/18 | $ | — | $ | (39,440 | ) | ||||||||||||||||||
Indian Rupee | DBAB | Buy | 1,228,359,494 | 18,834,093 | 7/19/18 | — | (943,277 | ) | ||||||||||||||||||||
Japanese Yen | JPHQ | Sell | 1,886,055,000 | 17,696,393 | 7/20/18 | 633,466 | — | |||||||||||||||||||||
Euro | JPHQ | Sell | 28,236,000 | 32,751,501 | 7/23/18 | — | (297,196 | ) | ||||||||||||||||||||
Euro | MSCO | Sell | 7,686,125 | 9,107,097 | 7/23/18 | 110,907 | — | |||||||||||||||||||||
Euro | MSCO | Sell | 7,686,125 | 8,921,362 | 7/23/18 | — | (74,828 | ) | ||||||||||||||||||||
Euro | SCNY | Sell | 4,975,000 | 5,803,636 | 7/23/18 | — | (19,330 | ) | ||||||||||||||||||||
Japanese Yen | JPHQ | Sell | 2,504,432,000 | 22,796,635 | 7/23/18 | 134,644 | — | |||||||||||||||||||||
Indian Rupee | JPHQ | Buy | 200,268,000 | 2,999,708 | 7/24/18 | — | (84,952 | ) | ||||||||||||||||||||
South Korean Won | HSBK | Sell | 18,482,000,000 | 17,469,635 | 7/24/18 | 888,645 | — | |||||||||||||||||||||
Euro | DBAB | Sell | 4,518,681 | 5,248,561 | 7/25/18 | — | (41,099 | ) | ||||||||||||||||||||
Indian Rupee | DBAB | Buy | 79,271,000 | 1,186,248 | 7/25/18 | — | (32,682 | ) | ||||||||||||||||||||
Japanese Yen | MSCO | Sell | 287,615,000 | 2,653,838 | 7/26/18 | 50,743 | — | |||||||||||||||||||||
Indian Rupee | DBAB | Buy | 838,950,988 | 12,483,461 | 7/27/18 | — | (278,431 | ) | ||||||||||||||||||||
Indonesian Rupiah | HSBK | Buy | 424,000,000,000 | 31,454,006 | 7/27/18 | — | (1,913,829 | ) | ||||||||||||||||||||
Euro | BOFA | Sell | 33,910,662 | 39,663,946 | 7/30/18 | — | (47,600 | ) | ||||||||||||||||||||
Japanese Yen | DBAB | Sell | 9,266,366,552 | 86,107,180 | 7/30/18 | 2,217,386 | — | |||||||||||||||||||||
Japanese Yen | JPHQ | Sell | 490,100,000 | 4,555,743 | 7/30/18 | 118,795 | — | |||||||||||||||||||||
Euro | BZWS | Sell | 22,495,165 | 27,604,942 | 7/31/18 | 1,259,573 | — | |||||||||||||||||||||
Euro | CITI | Sell | 77,832,770 | 94,893,713 | 7/31/18 | 3,739,326 | — | |||||||||||||||||||||
Euro | GSCO | Sell | 2,227,000 | 2,718,343 | 7/31/18 | 110,177 | — | |||||||||||||||||||||
Euro | SCNY | Sell | 12,300,264 | 15,010,689 | 7/31/18 | 605,149 | — | |||||||||||||||||||||
Japanese Yen | BZWS | Sell | 1,079,470,000 | 10,027,822 | 7/31/18 | 254,513 | — | |||||||||||||||||||||
Japanese Yen | GSCO | Sell | 944,420,000 | 8,695,356 | 7/31/18 | 144,763 | — | |||||||||||||||||||||
Japanese Yen | MSCO | Sell | 287,615,000 | 2,612,022 | 7/31/18 | 8,012 | — | |||||||||||||||||||||
Euro | HSBK | Sell | 25,974,891 | 31,678,717 | 8/02/18 | 1,253,199 | — | |||||||||||||||||||||
Euro | JPHQ | Sell | 11,263,000 | 13,710,168 | 8/02/18 | 517,327 | — | |||||||||||||||||||||
Indian Rupee | HSBK | Buy | 679,529,000 | 10,044,032 | 8/02/18 | — | (166,813 | ) | ||||||||||||||||||||
Japanese Yen | DBAB | Sell | 115,414,516 | 1,048,463 | 8/02/18 | 3,372 | — | |||||||||||||||||||||
Euro | GSCO | Sell | 13,037,050 | 15,851,749 | 8/03/18 | 579,670 | — | |||||||||||||||||||||
Indian Rupee | JPHQ | Buy | 378,455,000 | 5,834,503 | 8/06/18 | — | (336,676 | ) | ||||||||||||||||||||
Indian Rupee | HSBK | Buy | 240,033,500 | 3,695,381 | 8/08/18 | — | (209,410 | ) | ||||||||||||||||||||
Japanese Yen | JPHQ | Sell | 1,719,500,000 | 15,884,747 | 8/08/18 | 307,712 | — | |||||||||||||||||||||
Japanese Yen | SCNY | Sell | 1,720,000,000 | 15,925,484 | 8/08/18 | 343,920 | — | |||||||||||||||||||||
Euro | DBAB | Sell | 13,483,000 | 16,170,566 | 8/09/18 | 368,535 | — | |||||||||||||||||||||
Euro | JPHQ | Sell | 9,220,500 | 11,061,649 | 8/09/18 | 255,254 | — | |||||||||||||||||||||
Japanese Yen | BZWS | Sell | 1,720,220,000 | 15,901,461 | 8/09/18 | 316,775 | — | |||||||||||||||||||||
Japanese Yen | CITI | Sell | 708,852,119 | 6,541,892 | 8/09/18 | 119,902 | — | |||||||||||||||||||||
Euro | BZWS | Sell | 7,003,000 | 8,366,449 | 8/10/18 | 158,302 | — | |||||||||||||||||||||
Euro | JPHQ | Sell | 6,147,005 | 7,342,782 | 8/10/18 | 137,938 | — | |||||||||||||||||||||
Australian Dollar | JPHQ | Sell | 6,989,428 | 5,346,108 | 8/13/18 | 172,099 | — | |||||||||||||||||||||
Japanese Yen | CITI | Sell | 1,245,045,665 | 11,473,493 | 8/13/18 | 190,479 | — | |||||||||||||||||||||
Euro | CITI | Sell | 37,063,039 | 44,531,241 | 8/14/18 | 1,076,171 | — | |||||||||||||||||||||
Euro | HSBK | Sell | 1,800,000 | 2,164,567 | 8/14/18 | 54,132 | — | |||||||||||||||||||||
Japanese Yen | CITI | Sell | 493,314,665 | 4,417,414 | 8/14/18 | — | (53,490 | ) | ||||||||||||||||||||
Australian Dollar | JPHQ | Sell | 25,071,750 | 18,971,292 | 8/15/18 | 411,520 | — | |||||||||||||||||||||
Euro | DBAB | Sell | 5,008,730 | 6,022,622 | 8/15/18 | 149,600 | — | |||||||||||||||||||||
Japanese Yen | HSBK | Sell | 413,563,000 | 3,807,780 | 8/15/18 | 59,393 | — | |||||||||||||||||||||
Japanese Yen | JPHQ | Sell | 2,553,380,000 | 23,997,594 | 8/15/18 | 854,669 | — | |||||||||||||||||||||
TGB-14 | Semiannual Report |
FRANKLIN TEMPLETON VARIABLE INSURANCE PRODUCTS TRUST
STATEMENT OF INVESTMENTS (UNAUDITED)
Templeton Global Bond VIP Fund (continued)
Forward Exchange Contracts (continued)
| Currency | Counterparty | a | Type | Quantity | | Contract Amount | * | | Settlement Date | | | Unrealized Appreciation | | | Unrealized Depreciation | | ||||||||||||
| OTC Forward Exchange Contracts (continued) |
| |||||||||||||||||||||||||||
Euro | BOFA | Sell | 5,251,819 | 6,329,177 | 8/16/18 | $ | 170,628 | $ | — | |||||||||||||||||||
Euro | SCNY | Sell | 657,000 | 792,033 | 8/16/18 | 21,602 | — | |||||||||||||||||||||
Indian Rupee | HSBK | Buy | 402,232,000 | 5,905,623 | 8/16/18 | — | (70,779 | ) | ||||||||||||||||||||
Japanese Yen | CITI | Sell | 183,340,000 | 1,684,599 | 8/16/18 | 22,751 | — | |||||||||||||||||||||
Japanese Yen | JPHQ | Sell | 709,066,000 | 6,599,478 | 8/16/18 | 172,291 | — | |||||||||||||||||||||
Japanese Yen | SCNY | Sell | 340,600,700 | 3,129,112 | 8/16/18 | 41,805 | — | |||||||||||||||||||||
Euro | JPHQ | Sell | 15,313,111 | 18,259,200 | 8/17/18 | 300,839 | — | |||||||||||||||||||||
South Korean Won | HSBK | Sell | 75,818,000,000 | 70,851,322 | 8/17/18 | 2,776,188 | — | |||||||||||||||||||||
Euro | JPHQ | Sell | 32,873,792 | 38,987,759 | 8/20/18 | 425,987 | — | |||||||||||||||||||||
Japanese Yen | BOFA | Sell | 903,250,850 | 8,248,866 | 8/20/18 | 59,156 | — | |||||||||||||||||||||
Euro | JPHQ | Sell | 14,818,028 | 17,609,744 | 8/21/18 | 226,445 | — | |||||||||||||||||||||
Euro | UBSW | Sell | 1,922,305 | 2,286,024 | 8/21/18 | 30,933 | — | |||||||||||||||||||||
Japanese Yen | CITI | Sell | 1,599,308,500 | 14,530,384 | 8/21/18 | 28,519 | — | |||||||||||||||||||||
Japanese Yen | DBAB | Sell | 1,635,382,000 | 14,861,705 | 8/21/18 | 32,740 | — | |||||||||||||||||||||
Australian Dollar | CITI | Sell | 13,307,000 | 9,976,258 | 8/22/18 | 125,347 | — | |||||||||||||||||||||
Euro | BOFA | Sell | 7,066,000 | 8,369,465 | 8/22/18 | 79,550 | — | |||||||||||||||||||||
Euro | UBSW | Sell | 678,250 | 803,543 | 8/22/18 | 7,812 | — | |||||||||||||||||||||
Japanese Yen | BOFA | Sell | 1,105,842,500 | 10,034,868 | 8/22/18 | 6,821 | — | |||||||||||||||||||||
Japanese Yen | CITI | Sell | 376,247,000 | 3,411,403 | 8/22/18 | — | (496 | ) | ||||||||||||||||||||
Euro | UBSW | Sell | 11,641,500 | 13,779,054 | 8/23/18 | 120,019 | — | |||||||||||||||||||||
Japanese Yen | CITI | Sell | 1,866,452,000 | 16,891,274 | 8/23/18 | — | (35,391 | ) | ||||||||||||||||||||
Euro | DBAB | Sell | 14,940,282 | 17,715,514 | 8/24/18 | 184,602 | — | |||||||||||||||||||||
Euro | JPHQ | Sell | 5,030,771 | 5,974,747 | 8/24/18 | 71,645 | — | |||||||||||||||||||||
Japanese Yen | BOFA | Sell | 1,085,075,000 | 9,843,468 | 8/24/18 | 2,319 | — | |||||||||||||||||||||
Japanese Yen | SCNY | Sell | 937,086,000 | 8,503,696 | 8/24/18 | 4,741 | — | |||||||||||||||||||||
Japanese Yen | DBAB | Sell | 371,821,000 | 3,518,700 | 8/27/18 | 145,715 | — | |||||||||||||||||||||
Japanese Yen | JPHQ | Sell | 1,130,199,000 | 10,349,429 | 8/27/18 | 96,795 | — | |||||||||||||||||||||
Euro | DBAB | Sell | 14,781,916 | 17,457,000 | 8/29/18 | 105,050 | — | |||||||||||||||||||||
Euro | GSCO | Sell | 3,469,000 | 4,096,924 | 8/29/18 | 24,792 | — | |||||||||||||||||||||
Euro | SCNY | Sell | 12,544,218 | 14,806,066 | 8/29/18 | 80,868 | — | |||||||||||||||||||||
Japanese Yen | BZWS | Sell | 1,920,010,000 | 17,704,920 | 8/29/18 | 284,948 | — | |||||||||||||||||||||
Japanese Yen | DBAB | Sell | 685,950,000 | 6,326,143 | 8/29/18 | 102,618 | — | |||||||||||||||||||||
Japanese Yen | HSBK | Sell | 1,339,587,000 | 12,241,777 | 8/29/18 | 87,898 | — | |||||||||||||||||||||
South Korean Won | HSBK | Sell | 35,277,000,000 | 32,747,273 | 8/30/18 | 1,057,455 | — | |||||||||||||||||||||
Euro | BZWS | Sell | 22,495,166 | 26,529,898 | 8/31/18 | 119,605 | — | |||||||||||||||||||||
Euro | BOFA | Sell | 2,694,506 | 3,157,153 | 9/04/18 | — | (7,282 | ) | ||||||||||||||||||||
Euro | GSCO | Sell | 34,088,050 | 40,160,836 | 9/04/18 | 127,740 | — | |||||||||||||||||||||
Japanese Yen | HSBK | Sell | 1,247,125,000 | 11,510,152 | 9/04/18 | 190,173 | — | |||||||||||||||||||||
Australian Dollar | GSCO | Sell | 127,700,540 | 96,633,553 | 9/05/18 | 2,095,502 | — | |||||||||||||||||||||
Japanese Yen | JPHQ | Sell | 848,300,000 | 7,794,690 | 9/05/18 | 94,223 | — | |||||||||||||||||||||
South Korean Won | HSBK | Sell | 42,561,000,000 | 39,637,718 | 9/05/18 | 1,393,932 | — | |||||||||||||||||||||
Euro | SCNY | Sell | 17,972,751 | 21,165,287 | 9/06/18 | 54,808 | — | |||||||||||||||||||||
Euro | UBSW | Sell | 6,231,299 | 7,351,313 | 9/06/18 | 32,138 | — | |||||||||||||||||||||
Japanese Yen | HSBK | Sell | 400,800,000 | 3,676,052 | 9/06/18 | 37,511 | — | |||||||||||||||||||||
Euro | BOFA | Sell | 34,170,296 | 40,111,827 | 9/07/18 | — | (27,079 | ) | ||||||||||||||||||||
Euro | DBAB | Sell | 8,136,104 | 9,566,431 | 9/07/18 | 9,174 | — | |||||||||||||||||||||
Euro | GSCO | Sell | 2,045,000 | 2,406,147 | 9/07/18 | 3,942 | — | |||||||||||||||||||||
Japanese Yen | CITI | Sell | 1,370,500,000 | 12,533,150 | 9/10/18 | 87,819 | — | |||||||||||||||||||||
Euro | JPHQ | Sell | 7,171,498 | 8,539,569 | 9/11/18 | 112,826 | — | |||||||||||||||||||||
| Semiannual Report |
|
TGB-15 |
|
FRANKLIN TEMPLETON VARIABLE INSURANCE PRODUCTS TRUST
STATEMENT OF INVESTMENTS (UNAUDITED)
Templeton Global Bond VIP Fund (continued)
Forward Exchange Contracts (continued)
| Currency | Counterparty | a | Type | Quantity | | Contract Amount | * | | Settlement Date | | | Unrealized Appreciation | | | Unrealized Depreciation | | ||||||||||||||||
| OTC Forward Exchange Contracts (continued) |
| |||||||||||||||||||||||||||||||
Japanese Yen | CITI | Sell | 2,595,800,000 | 23,752,574 | 9/11/18 | $ | 178,717 | $ | — | |||||||||||||||||||||||
Japanese Yen | HSBK | Sell | 1,026,200,000 | 9,257,472 | 9/11/18 | — | (62,003 | ) | ||||||||||||||||||||||||
Japanese Yen | HSBK | Sell | 1,026,200,000 | 9,409,284 | 9/11/18 | 89,809 | — | |||||||||||||||||||||||||
Australian Dollar | JPHQ | Sell | 6,989,428 | 5,347,227 | 9/12/18 | 172,770 | — | |||||||||||||||||||||||||
Euro | DBAB | Sell | 25,440,500 | 30,134,527 | 9/12/18 | 238,824 | — | |||||||||||||||||||||||||
Japanese Yen | DBAB | Sell | 595,700,000 | 5,481,229 | 9/12/18 | 70,959 | — | |||||||||||||||||||||||||
Japanese Yen | HSBK | Sell | 1,798,900,000 | 16,542,294 | 9/12/18 | 204,312 | — | |||||||||||||||||||||||||
Japanese Yen | JPHQ | Sell | 1,666,680,000 | 15,323,046 | 9/12/18 | 185,913 | — | |||||||||||||||||||||||||
Australian Dollar | CITI | Sell | 58,003,000 | 44,170,735 | 9/13/18 | 1,229,461 | — | |||||||||||||||||||||||||
Japanese Yen | CITI | Sell | 310,702,000 | 2,857,253 | 9/13/18 | 35,186 | — | |||||||||||||||||||||||||
Australian Dollar | JPHQ | Sell | 25,071,750 | 19,092,489 | 9/14/18 | 531,101 | — | |||||||||||||||||||||||||
Indian Rupee | DBAB | Buy | 258,123,000 | 3,779,253 | 9/14/18 | — | (49,736 | ) | ||||||||||||||||||||||||
Japanese Yen | JPHQ | Sell | 335,950,000 | 3,065,965 | 9/14/18 | 14,348 | — | |||||||||||||||||||||||||
Japanese Yen | SCNY | Sell | 366,681,000 | 3,347,707 | 9/14/18 | 16,944 | — | |||||||||||||||||||||||||
Euro | JPHQ | Sell | 5,131,690 | 6,089,289 | 9/17/18 | 56,614 | — | |||||||||||||||||||||||||
Euro | BOFA | Sell | 16,317,286 | 19,301,391 | 9/18/18 | 117,764 | — | |||||||||||||||||||||||||
Euro | GSCO | Sell | 1,789,884 | 2,096,827 | 9/18/18 | — | (7,473 | ) | ||||||||||||||||||||||||
Japanese Yen | BOFA | Sell | 903,250,850 | 8,217,871 | 9/18/18 | 10,734 | — | |||||||||||||||||||||||||
Japanese Yen | GSCO | Sell | 1,695,805,280 | 15,967,394 | 9/18/18 | 558,933 | — | |||||||||||||||||||||||||
Japanese Yen | HSBK | Sell | 1,035,240,000 | 9,878,244 | 9/18/18 | 471,825 | — | |||||||||||||||||||||||||
Japanese Yen | JPHQ | Sell | 702,800,000 | 6,406,096 | 9/18/18 | 20,300 | — | |||||||||||||||||||||||||
Japanese Yen | MSCO | Sell | 300,000,000 | 2,738,126 | 9/18/18 | 12,259 | — | |||||||||||||||||||||||||
Japanese Yen | BZWS | Sell | 981,707,504 | 8,930,865 | 9/19/18 | 10,197 | — | |||||||||||||||||||||||||
Euro | GSCO | Sell | 3,692,733 | 4,314,884 | 9/20/18 | — | (27,190 | ) | ||||||||||||||||||||||||
Euro | UBSW | Sell | 1,922,305 | 2,246,213 | 9/20/18 | — | (14,116 | ) | ||||||||||||||||||||||||
Japanese Yen | CITI | Sell | 1,372,892,008 | 12,509,267 | 9/20/18 | 33,029 | — | |||||||||||||||||||||||||
Japanese Yen | BOFA | Sell | 1,102,846,375 | 10,081,784 | 9/21/18 | 58,864 | — | |||||||||||||||||||||||||
Japanese Yen | HSBK | Sell | 1,106,730,400 | 10,125,251 | 9/21/18 | 67,031 | — | |||||||||||||||||||||||||
Euro | DBAB | Sell | 8,405,717 | 9,797,997 | 9/24/18 | — | (88,838 | ) | ||||||||||||||||||||||||
Euro | HSBK | Sell | 19,488,000 | 22,715,408 | 9/24/18 | — | (206,452 | ) | ||||||||||||||||||||||||
Euro | JPHQ | Sell | 14,818,028 | 17,285,229 | 9/25/18 | — | (145,128 | ) | ||||||||||||||||||||||||
Japanese Yen | DBAB | Sell | 2,181,107,000 | 19,924,590 | 9/25/18 | 96,347 | — | |||||||||||||||||||||||||
Japanese Yen | HSBK | Sell | 1,621,372,000 | 14,815,168 | 9/25/18 | 75,424 | — | |||||||||||||||||||||||||
Japanese Yen | JPHQ | Sell | 1,203,160,329 | 10,991,609 | 9/25/18 | 53,789 | — | |||||||||||||||||||||||||
Euro | BOFA | Sell | 33,910,662 | 39,842,655 | 9/28/18 | — | (55,768 | ) | ||||||||||||||||||||||||
Euro | DBAB | Sell | 14,776,109 | 17,274,306 | 9/28/18 | — | (110,888 | ) | ||||||||||||||||||||||||
Euro | GSCO | Sell | 3,469,000 | 4,051,896 | 9/28/18 | — | (29,641 | ) | ||||||||||||||||||||||||
Japanese Yen | JPHQ | Sell | 1,302,406,000 | 11,947,067 | 9/28/18 | 104,275 | — | |||||||||||||||||||||||||
Brazilian Real | CITI | Buy | 206,375,000 | 45,732,045 | EUR | 10/02/18 | — | (1,094,270 | ) | |||||||||||||||||||||||
Japanese Yen | DBAB | Sell | 114,245,484 | 1,042,405 | 10/02/18 | 3,221 | — | |||||||||||||||||||||||||
Japanese Yen | SCNY | Sell | 415,980,000 | 3,976,560 | 10/05/18 | 191,826 | — | |||||||||||||||||||||||||
Indian Rupee | JPHQ | Buy | 82,107,000 | 1,238,463 | 10/09/18 | — | (56,001 | ) | ||||||||||||||||||||||||
Japanese Yen | JPHQ | Sell | 2,831,950,000 | 26,985,730 | 10/09/18 | 1,210,983 | — | |||||||||||||||||||||||||
Japanese Yen | HSBK | Sell | 2,816,800,000 | 26,657,203 | 10/11/18 | 1,016,034 | — | |||||||||||||||||||||||||
Australian Dollar | JPHQ | Sell | 25,071,750 | 18,978,813 | 10/15/18 | 413,809 | — | |||||||||||||||||||||||||
Japanese Yen | BZWS | Sell | 983,714,840 | 9,016,304 | 10/26/18 | 50,305 | — | |||||||||||||||||||||||||
Indonesian Rupiah | JPHQ | Buy | 1,721,000,000,000 | 120,518,207 | 10/29/18 | — | (2,503,182 | ) | ||||||||||||||||||||||||
South Korean Won | HSBK | Sell | 8,274,880,977 | 7,499,439 | 10/29/18 | 45,957 | — | |||||||||||||||||||||||||
South Korean Won | HSBK | Sell | 15,755,000,000 | 14,744,970 | 10/30/18 | 553,258 | — | |||||||||||||||||||||||||
TGB-16 | Semiannual Report |
FRANKLIN TEMPLETON VARIABLE INSURANCE PRODUCTS TRUST
STATEMENT OF INVESTMENTS (UNAUDITED)
Templeton Global Bond VIP Fund (continued)
Forward Exchange Contracts (continued)
| Currency | Counterparty | a | Type | Quantity | | Contract Amount | * | | Settlement Date | | | Unrealized Appreciation | | | Unrealized Depreciation | | ||||||||||||
| OTC Forward Exchange Contracts (continued) |
| |||||||||||||||||||||||||||
South Korean Won | DBAB | Sell | 13,920,000,000 | 13,038,591 | 11/19/18 | $ | 488,874 | $ | — | |||||||||||||||||||
South Korean Won | GSCO | Sell | 44,346,000,000 | 41,277,051 | 12/07/18 | 1,265,081 | — | |||||||||||||||||||||
South Korean Won | DBAB | Sell | 13,919,000,000 | 13,105,786 | 12/11/18 | 544,929 | — | |||||||||||||||||||||
Japanese Yen | CITI | Sell | 1,782,638,500 | 16,331,632 | 12/18/18 | 11,137 | — | |||||||||||||||||||||
Japanese Yen | DBAB | Sell | 1,453,310,000 | 13,350,021 | 12/18/18 | 44,610 | — | |||||||||||||||||||||
Japanese Yen | HSBK | Sell | 1,455,540,000 | 13,357,561 | 12/18/18 | 31,733 | — | |||||||||||||||||||||
Indian Rupee | CITI | Buy | 69,318,000 | 1,000,693 | 12/19/18 | — | (11,459 | ) | ||||||||||||||||||||
South Korean Won | CITI | Sell | 4,215,000,000 | 3,921,113 | 12/20/18 | 115,896 | — | |||||||||||||||||||||
Japanese Yen | BZWS | Sell | 1,689,110,000 | 15,356,662 | 1/11/19 | — | (137,695 | ) | ||||||||||||||||||||
Japanese Yen | GSCO | Sell | 329,010,000 | 2,990,185 | 1/11/19 | — | (27,854 | ) | ||||||||||||||||||||
Japanese Yen | JPHQ | Sell | 2,831,950,000 | 25,730,614 | 1/11/19 | — | (247,116 | ) | ||||||||||||||||||||
Japanese Yen | JPHQ | Sell | 708,450,000 | 6,511,489 | 1/16/19 | 10,230 | — | |||||||||||||||||||||
Japanese Yen | SCNY | Sell | 707,660,000 | 6,540,296 | 1/22/19 | 43,187 | — | |||||||||||||||||||||
Japanese Yen | BZWS | Sell | 735,200,000 | 6,802,746 | 1/24/19 | 51,716 | — | |||||||||||||||||||||
Japanese Yen | DBAB | Sell | 858,140,000 | 7,912,844 | 1/24/19 | 32,908 | — | |||||||||||||||||||||
Japanese Yen | JPHQ | Sell | 7,105,349,700 | 65,733,367 | 1/24/19 | 487,950 | — | |||||||||||||||||||||
Japanese Yen | CITI | Sell | 913,412,000 | 8,480,447 | 1/25/19 | 92,304 | — | |||||||||||||||||||||
Japanese Yen | JPHQ | Sell | 1,407,000,000 | 13,052,069 | 1/25/19 | 131,156 | — | |||||||||||||||||||||
Japanese Yen | HSBK | Sell | 1,162,462,488 | 10,918,216 | 1/31/19 | 237,868 | — | |||||||||||||||||||||
Japanese Yen | JPHQ | Sell | 1,723,960,000 | 16,157,682 | 2/12/19 | 303,322 | — | |||||||||||||||||||||
Japanese Yen | CITI | Sell | 1,182,704,670 | 11,163,647 | 2/14/19 | 285,196 | — | |||||||||||||||||||||
Japanese Yen | CITI | Sell | 683,420,000 | 6,520,250 | 2/15/19 | 233,690 | — | |||||||||||||||||||||
South Korean Won | HSBK | Sell | 7,007,000,000 | 6,538,515 | 3/20/19 | 188,336 | — | |||||||||||||||||||||
|
| |||||||||||||||||||||||||||
Total Forward Exchange Contracts |
| $ | 56,237,859 | $ | (14,121,404 | ) | ||||||||||||||||||||||
|
| |||||||||||||||||||||||||||
Net unrealized appreciation (depreciation) |
| $ | 42,116,455 | |||||||||||||||||||||||||
|
| |||||||||||||||||||||||||||
*In U.S. dollars unless otherwise indicated.
aMay be comprised of multiple contracts with the same counterparty, currency and settlement date.
At June 30, 2018, the Fund had the following interest rate swap contracts outstanding. See Note 1(d).
Interest Rate Swap Contracts
| Description | | Payment Frequency | | | Counter- party |
| | Maturity Date | | | Notional Amount | | | Value/ Unrealized Appreciation (Depreciation) |
| |||||
Centrally Cleared Swap Contracts | ||||||||||||||||||||
Receive Floating 3-month USD LIBOR | Quarterly | |||||||||||||||||||
Pay Fixed 3.558% | Semi-Annual | 3/04/21 | $ 3,240,000 | $ (91,546 | ) | |||||||||||||||
Receive Floating 3-month USD LIBOR | Quarterly | |||||||||||||||||||
Pay Fixed 2.775% | Semi-Annual | 10/04/23 | 13,090,000 | 58,582 | ||||||||||||||||
Receive Floating 3-month USD LIBOR | Quarterly | |||||||||||||||||||
Pay Fixed 2.795% | Semi-Annual | 10/04/23 | 13,090,000 | 45,116 | ||||||||||||||||
Receive Floating 3-month USD LIBOR | Quarterly | |||||||||||||||||||
Pay Fixed 2.765% | Semi-Annual | 10/07/23 | 13,090,000 | 66,907 | ||||||||||||||||
Receive Floating 3-month USD LIBOR | Quarterly | |||||||||||||||||||
| Semiannual Report |
|
TGB-17 |
|
FRANKLIN TEMPLETON VARIABLE INSURANCE PRODUCTS TRUST
STATEMENT OF INVESTMENTS (UNAUDITED)
Templeton Global Bond VIP Fund (continued)
Interest Rate Swap Contracts (continued)
| Description | Payment Frequency | Counter- party | Maturity Date | Notional Amount | Value/ (Depreciation) | |||||||||||||||
Centrally Cleared Swap Contracts (continued) | ||||||||||||||||||||
Pay Fixed 2.731% | Semi-Annual | 7/07/24 | $ | 34,000,000 | $ 33,286 | |||||||||||||||
Receive Floating 3-month USD LIBOR | Quarterly | |||||||||||||||||||
Pay Fixed 1.914% | Semi-Annual | 1/22/25 | 114,670,000 | 6,301,939 | ||||||||||||||||
Receive Floating 3-month USD LIBOR | Quarterly | |||||||||||||||||||
Pay Fixed 1.970% | Semi-Annual | 1/23/25 | 143,340,000 | 7,375,667 | ||||||||||||||||
Receive Floating 3-month USD LIBOR | Quarterly | |||||||||||||||||||
Pay Fixed 1.973% | Semi-Annual | 1/27/25 | 84,590,000 | 4,347,577 | ||||||||||||||||
Receive Floating 3-month USD LIBOR | Quarterly | |||||||||||||||||||
Pay Fixed 1.937% | Semi-Annual | 1/29/25 | 21,150,000 | 1,132,118 | ||||||||||||||||
Receive Floating 3-month USD LIBOR | Quarterly | |||||||||||||||||||
Pay Fixed 1.942% | Semi-Annual | 1/30/25 | 17,910,000 | 955,537 | ||||||||||||||||
Receive Floating 3-month USD LIBOR | Quarterly | |||||||||||||||||||
Pay Fixed 1.817% | Semi-Annual | 2/03/25 | 28,210,000 | 1,734,912 | ||||||||||||||||
Receive Floating 3-month USD LIBOR | Quarterly | |||||||||||||||||||
Pay Fixed 4.349% | Semi-Annual | 2/25/41 | 7,460,000 | (1,888,731 | ) | |||||||||||||||
Receive Floating 3-month USD LIBOR | Quarterly | |||||||||||||||||||
Pay Fixed 4.320% | Semi-Annual | 2/28/41 | 5,600,000 | (1,375,122 | ) | |||||||||||||||
Receive Floating 3-month USD LIBOR | Quarterly | |||||||||||||||||||
Pay Fixed 4.299% | Semi-Annual | 3/01/41 | 1,870,000 | (452,871 | ) | |||||||||||||||
Receive Floating 3-month USD LIBOR | Quarterly | |||||||||||||||||||
Pay Fixed 3.668% | Semi-Annual | 10/04/43 | 6,370,000 | (868,332 | ) | |||||||||||||||
Receive Floating 3-month USD LIBOR | Quarterly | |||||||||||||||||||
Pay Fixed 3.687% | Semi-Annual | 10/04/43 | 6,370,000 | (890,518 | ) | |||||||||||||||
Receive Floating 3-month USD LIBOR | Quarterly | |||||||||||||||||||
Pay Fixed 3.675% | Semi-Annual | 10/07/43 | 6,370,000 | (875,400 | ) | |||||||||||||||
Receive Floating 3-month USD LIBOR | Quarterly | |||||||||||||||||||
Pay Fixed 2.378% | Semi-Annual | 11/18/46 | 122,400,000 | 13,818,881 | ||||||||||||||||
Receive Floating 3-month USD LIBOR | Quarterly | |||||||||||||||||||
Pay Fixed 2.537% | Semi-Annual | 4/13/47 | 72,700,000 | 5,892,801 | ||||||||||||||||
Receive Floating 3-month USD LIBOR | Quarterly | |||||||||||||||||||
Pay Fixed 2.587% | Semi-Annual | 7/27/47 | 36,700,000 | 2,378,306 | ||||||||||||||||
Receive Floating 3-month USD LIBOR | Quarterly | |||||||||||||||||||
Pay Fixed 2.980% | Semi-Annual | 2/20/48 | 15,638,000 | (304,472 | ) | |||||||||||||||
Receive Floating 3-month USD LIBOR | Quarterly | |||||||||||||||||||
Pay Fixed 3.002% | Semi-Annual | 2/22/48 | 15,638,000 | (353,897 | ) | |||||||||||||||
Receive Floating 3-month USD LIBOR | Quarterly | |||||||||||||||||||
Pay Fixed 3.019% | Semi-Annual | 2/23/48 | 15,638,000 | (409,729 | ) | |||||||||||||||
|
| |||||||||||||||||||
Total Centrally Cleared Swap Contracts |
| $36,631,011 | ||||||||||||||||||
|
| |||||||||||||||||||
| OTC Swap Contracts | ||||||||||||||||||||
Receive Floating 3-month USD LIBOR | Quarterly | |||||||||||||||||||
Pay Fixed 3.523% | Semi-Annual | DBAB | 3/28/21 | $ | 14,630,000 | $ (393,535 | ) | |||||||||||||
Receive Floating 3-month USD LIBOR | Quarterly | |||||||||||||||||||
TGB-18 | Semiannual Report |
FRANKLIN TEMPLETON VARIABLE INSURANCE PRODUCTS TRUST
STATEMENT OF INVESTMENTS (UNAUDITED)
Templeton Global Bond VIP Fund (continued)
Interest Rate Swap Contracts (continued)
| Description | Payment Frequency | Counter- party | Maturity Date | Notional Amount | Value/ (Depreciation) | |||||||||||||||
OTC Swap Contracts (continued) | ||||||||||||||||||||
Pay Fixed 4.347% | Semi-Annual | CITI | 2/25/41 | $7,460,000 | $ (1,867,404 | ) | ||||||||||||||
|
| |||||||||||||||||||
Total OTC Swap Contracts |
| $ (2,260,939 | ) | |||||||||||||||||
|
| |||||||||||||||||||
Total Interest Rate Swap Contracts |
| $34,370,072 | ||||||||||||||||||
|
| |||||||||||||||||||
See Note 9 regarding other derivative information.
See Abbreviations on page TGB-33.
| The accompanying notes are an integral part of these financial statements. | Semiannual Report |
|
TGB-19 |
|
FRANKLIN TEMPLETON VARIABLE INSURANCE PRODUCTS TRUST
Financial Statements
Statement of Assets and Liabilities
June 30, 2018 (unaudited)
| Templeton Global Bond VIP Fund | ||||
Assets: | ||||
Investments in securities: | ||||
Cost - Unaffiliated issuers | $2,094,589,992 | |||
Cost - Non-controlled affiliates (Note 3e) | 805,945,058 | |||
Cost - Unaffiliated repurchase agreements | 151,947,582 | |||
|
| |||
Value - Unaffiliated issuers | $1,926,600,300 | |||
Value - Non-controlled affiliates (Note 3e) | 805,945,058 | |||
Value - Unaffiliated repurchase agreements | 151,947,582 | |||
Cash | 1,044,673 | |||
Restricted cash for OTC derivative contracts (Note 1e) | 28,928,000 | |||
Foreign currency, at value (cost $11,669,030) | 11,420,607 | |||
Receivables: | ||||
Capital shares sold | 597,963 | |||
Interest | 30,723,814 | |||
Deposits with brokers for: | ||||
Centrally cleared swap contracts | 51,134,246 | |||
Variation margin on centrally cleared swap contracts | 455,423 | |||
Unrealized appreciation on OTC forward exchange contracts | 56,237,859 | |||
Other assets | 3,346 | |||
|
| |||
Total assets | 3,065,038,871 | |||
|
| |||
Liabilities: | ||||
Payables: | ||||
Investment securities purchased | 353,160 | |||
Capital shares redeemed | 538,672 | |||
Management fees | 930,999 | |||
Distribution fees | 1,179,251 | |||
Deposits from brokers for: | ||||
OTC derivative contracts | 28,928,000 | |||
Unrealized depreciation on OTC forward exchange contracts | 14,121,404 | |||
Unrealized depreciation on OTC swap contracts | 2,260,939 | |||
Deferred tax | 2,205,085 | |||
Accrued expenses and other liabilities | 1,276,433 | |||
|
| |||
Total liabilities | 51,793,943 | |||
|
| |||
Net assets, at value | $3,013,244,928 | |||
|
| |||
Net assets consist of: | ||||
Paid-in capital | $3,072,086,718 | |||
Undistributed net investment income | 63,261,797 | |||
Net unrealized appreciation (depreciation) | (96,287,489 | ) | ||
Accumulated net realized gain (loss) | (25,816,098 | ) | ||
|
| |||
Net assets, at value | $3,013,244,928 | |||
|
| |||
TGB-20 | Semiannual Report | The accompanying notes are an integral part of these financial statements. |
FRANKLIN TEMPLETON VARIABLE INSURANCE PRODUCTS TRUST
FINANCIAL STATEMENTS
Statement of Assets and Liabilities (continued)
June 30, 2018 (unaudited)
| Templeton Global Bond VIP Fund | ||||
| Class 1: | ||||
Net assets, at value | $ 275,800,139 | |||
|
| |||
Shares outstanding | 16,164,681 | |||
|
| |||
Net asset value and maximum offering price per share | $17.06 | |||
|
| |||
| Class 2: | ||||
Net assets, at value | $2,642,930,839 | |||
|
| |||
Shares outstanding | 161,269,749 | |||
|
| |||
Net asset value and maximum offering price per share | $16.39 | |||
|
| |||
| Class 4: | ||||
Net assets, at value | $ 94,513,950 | |||
|
| |||
Shares outstanding | 5,644,672 | |||
|
| |||
Net asset value and maximum offering price per share | $16.74 | |||
|
| |||
| The accompanying notes are an integral part of these financial statements. | Semiannual Report |
|
TGB-21 |
|
FRANKLIN TEMPLETON VARIABLE INSURANCE PRODUCTS TRUST
FINANCIAL STATEMENTS
Statement of Operations
for the six months ended June 30, 2018 (unaudited)
Templeton VIP Fund | ||||
Investment income: | ||||
Dividends: | ||||
Non-controlled affiliates (Note 3e) | $ 4,499,234 | |||
Interest: (net of foreign taxes)~ | ||||
Unaffiliated issuers | 76,563,073 | |||
|
| |||
Total investment income | 81,062,307 | |||
|
| |||
Expenses: | ||||
Management fees (Note 3a) | 7,073,129 | |||
Distribution fees: (Note 3c) | ||||
Class 2 | 3,382,076 | |||
Class 4 | 171,030 | |||
Custodian fees (Note 4) | 800,826 | |||
Reports to shareholders | 151,761 | |||
Professional fees | 65,388 | |||
Trustees’ fees and expenses | 7,824 | |||
Other | 416,737 | |||
|
| |||
Total expenses | 12,068,771 | |||
Expense reductions (Note 4) | (209,316 | ) | ||
Expenses waived/paid by affiliates (Note 3e) | (1,324,573 | ) | ||
|
| |||
Net expenses | 10,534,882 | |||
|
| |||
Net investment income | 70,527,425 | |||
|
| |||
Realized and unrealized gains (losses): | ||||
Net realized gain (loss) from: | ||||
Investments:# | ||||
Unaffiliated issuers | 12,360,018 | |||
Foreign currency transactions | (929,683 | ) | ||
Forward exchange contracts | (31,380,623 | ) | ||
Swap contracts | (2,591,540 | ) | ||
|
| |||
Net realized gain (loss) | (22,541,828 | ) | ||
|
| |||
Net change in unrealized appreciation (depreciation) on: | ||||
Investments: | ||||
Unaffiliated issuers | (185,584,551 | ) | ||
Translation of other assets and liabilities denominated in foreign currencies | (2,874,542 | ) | ||
Forward exchange contracts | 79,116,706 | |||
Swap contracts | 39,130,242 | |||
Change in deferred taxes on unrealized appreciation | 1,044,419 | |||
|
| |||
Net change in unrealized appreciation (depreciation) | (69,167,726 | ) | ||
|
| |||
Net realized and unrealized gain (loss) | (91,709,554 | ) | ||
|
| |||
Net increase (decrease) in net assets resulting from operations | $ (21,182,129 | ) | ||
|
| |||
~Foreign taxes withheld on interest | $ 2,010,809 | |||
#Net of foreign taxes. | $ 42,741 | |||
TGB-22 | Semiannual Report | The accompanying notes are an integral part of these financial statements. |
FRANKLIN TEMPLETON VARIABLE INSURANCE PRODUCTS TRUST
FINANCIAL STATEMENTS
Statements of Changes in Net Assets
| Templeton Global Bond VIP Fund | ||||||||
| Six Months Ended June 30, 2018 (unaudited) | Year Ended December 31, 2017 | |||||||
Increase (decrease) in net assets: | ||||||||
Operations: | ||||||||
Net investment income | $ 70,527,425 | $ 144,457,894 | ||||||
Net realized gain (loss) | (22,541,828 | ) | (84,441,214 | ) | ||||
Net change in unrealized appreciation (depreciation) | (69,167,726 | ) | 1,318,770 | |||||
|
| |||||||
Net increase (decrease) in net assets resulting from operations | (21,182,129 | ) | 61,335,450 | |||||
|
| |||||||
Distributions to shareholders from: | ||||||||
Net realized gains: | ||||||||
Class 1 | — | (806,829 | ) | |||||
Class 2 | — | (8,999,053 | ) | |||||
Class 4 | — | (307,109 | ) | |||||
|
| |||||||
Total distributions to shareholders | — | (10,112,991 | ) | |||||
|
| |||||||
Capital share transactions: (Note 2) | ||||||||
Class 1 | (9,086,480 | ) | 40,791,975 | |||||
Class 2 | (68,299,542 | ) | (128,337,512 | ) | ||||
Class 4 | (3,704,195 | ) | 715,746 | |||||
|
| |||||||
Total capital share transactions | (81,090,217 | ) | (86,829,791 | ) | ||||
|
| |||||||
Net increase (decrease) in net assets | (102,272,346 | ) | (35,607,332 | ) | ||||
Net assets: | ||||||||
Beginning of period | 3,115,517,274 | 3,151,124,606 | ||||||
|
| |||||||
End of period | $3,013,244,928 | $3,115,517,274 | ||||||
|
| |||||||
Undistributed net investment income included in net assets: | ||||||||
End of period | $ 63,261,797 | $ — | ||||||
|
| |||||||
Accumulated net investment loss included in net assets: | ||||||||
End of period | $ — | $ (7,265,628 | ) | |||||
|
| |||||||
| The accompanying notes are an integral part of these financial statements. | Semiannual Report |
|
TGB-23 |
|
FRANKLIN TEMPLETON VARIABLE INSURANCE PRODUCTS TRUST
Notes to Financial Statements (unaudited)
Templeton Global Bond VIP Fund
1. Organization and Significant Accounting Policies
Franklin Templeton Variable Insurance Products Trust (Trust) is registered under the Investment Company Act of 1940 (1940 Act) as an open-end management investment company, consisting of eighteen separate funds and applies the specialized accounting and reporting guidance in U.S. Generally Accepted Accounting Principles (U.S. GAAP). Templeton Global Bond VIP Fund (Fund) is included in this report. Shares of the Fund are generally sold only to insurance company separate accounts to fund the benefits of variable life insurance policies or variable annuity contracts. The Fund offers three classes of shares: Class 1, Class 2 and Class 4. Each class of shares may differ by its distribution fees, voting rights on matters affecting a single class and its exchange privilege.
The following summarizes the Fund’s significant accounting policies.
a. Financial Instrument Valuation
The Fund’s investments in financial instruments are carried at fair value daily. Fair value is the price that would be received to sell an asset or paid to transfer a liability in an orderly transaction between market participants on the measurement date. The Fund calculates the net asset value (NAV) per share each business day as of 4 p.m. Eastern time or the regularly scheduled close of the New York Stock Exchange (NYSE), whichever is earlier. Under compliance policies and procedures approved by the Trust’s Board of Trustees (the Board), the Fund’s administrator has responsibility for oversight of valuation, including leading the cross-functional Valuation Committee (VC). The VC provides administration and oversight of the Fund’s valuation policies and procedures, which are approved annually by the Board. Among other things, these procedures allow the Fund to utilize independent pricing services, quotations from securities and financial instrument dealers, and other market sources to determine fair value.
Debt securities generally trade in the over-the-counter (OTC) market rather than on a securities exchange. The Fund’s pricing services use multiple valuation techniques to determine fair value. In instances where sufficient market activity exists, the pricing services may utilize a market-based approach through which quotes from market makers are used to determine fair value. In instances where sufficient market activity may not exist or is limited, the pricing services also utilize proprietary valuation models which may consider market characteristics
such as benchmark yield curves, credit spreads, estimated default rates, anticipated market interest rate volatility, coupon rates, anticipated timing of principal repayments, underlying collateral, and other unique security features in order to estimate the relevant cash flows, which are then discounted to calculate the fair value. Securities denominated in a foreign currency are converted into their U.S. dollar equivalent at the foreign exchange rate in effect at 4 p.m. Eastern time on the date that the values of the foreign debt securities are determined.
Investments in open-end mutual funds are valued at the closing NAV. Investments in repurchase agreements are valued at cost, which approximates fair value.
Derivative financial instruments listed on an exchange are valued at the official closing price of the day. Certain derivative financial instruments are centrally cleared or trade in the OTC market. The Fund’s pricing services use various techniques including industry standard option pricing models and proprietary discounted cash flow models to determine the fair value of those instruments. The Fund’s net benefit or obligation under the derivative contract, as measured by the fair value of the contract, is included in net assets.
The Fund has procedures to determine the fair value of financial instruments for which market prices are not reliable or readily available. Under these procedures, the VC convenes on a regular basis to review such financial instruments and considers a number of factors, including significant unobservable valuation inputs, when arriving at fair value. The VC primarily employs a market-based approach which may use related or comparable assets or liabilities, recent transactions, market multiples, book values, and other relevant information for the investment to determine the fair value of the investment. An income-based valuation approach may also be used in which the anticipated future cash flows of the investment are discounted to calculate fair value. Discounts may also be applied due to the nature or duration of any restrictions on the disposition of the investments. Due to the inherent uncertainty of valuations of such investments, the fair values may differ significantly from the values that would have been used had an active market existed. The VC employs various methods for calibrating these valuation approaches including a regular review of key inputs and assumptions, transactional back-testing or disposition analysis, and reviews of any related market activity.
TGB-24 | Semiannual Report |
FRANKLIN TEMPLETON VARIABLE INSURANCE PRODUCTS TRUST
NOTES TO FINANCIAL STATEMENTS (UNAUDITED)
Templeton Global Bond VIP Fund (continued)
b. Foreign Currency Translation
Portfolio securities and other assets and liabilities denominated in foreign currencies are translated into U.S. dollars based on the exchange rate of such currencies against U.S. dollars on the date of valuation. The Fund may enter into foreign currency exchange contracts to facilitate transactions denominated in a foreign currency. Purchases and sales of securities, income and expense items denominated in foreign currencies are translated into U.S. dollars at the exchange rate in effect on the transaction date. Portfolio securities and assets and liabilities denominated in foreign currencies contain risks that those currencies will decline in value relative to the U.S. dollar. Occasionally, events may impact the availability or reliability of foreign exchange rates used to convert the U.S. dollar equivalent value. If such an event occurs, the foreign exchange rate will be valued at fair value using procedures established and approved by the Board.
The Fund does not separately report the effect of changes in foreign exchange rates from changes in market prices on securities held. Such changes are included in net realized and unrealized gain or loss from investments in the Statement of Operations.
Realized foreign exchange gains or losses arise from sales of foreign currencies, currency gains or losses realized between the trade and settlement dates on securities transactions and the difference between the recorded amounts of dividends, interest, and foreign withholding taxes and the U.S. dollar equivalent of the amounts actually received or paid. Net unrealized foreign exchange gains and losses arise from changes in foreign exchange rates on foreign denominated assets and liabilities other than investments in securities held at the end of the reporting period.
c. Joint Repurchase Agreement
The Fund enters into a joint repurchase agreement whereby its uninvested cash balance is deposited into a joint cash account with other funds managed by the investment manager or an affiliate of the investment manager and is used to invest in one or more repurchase agreements. The value and face amount of the joint repurchase agreement are allocated to the funds based on their pro-rata interest. A repurchase agreement is accounted for as a loan by the Fund to the seller, collateralized by securities which are delivered to the Fund’s custodian. The fair value, including accrued interest, of the initial collateralization is required to be at least 102% of the dollar amount invested by the funds, with the value of the underlying securities marked to
market daily to maintain coverage of at least 100%. Repurchase agreements are subject to the terms of Master Repurchase Agreements (MRAs) with approved counterparties (sellers). The MRAs contain various provisions, including but not limited to events of default and maintenance of collateral for repurchase agreements. In the event of default by either the seller or the Fund, certain MRAs may permit the non-defaulting party to net and close-out all transactions, if any, traded under such agreements. The Fund may sell securities it holds as collateral and apply the proceeds towards the repurchase price and any other amounts owed by the seller to the Fund in the event of default by the seller. This could involve costs or delays in addition to a loss on the securities if their value falls below the repurchase price owed by the seller. The joint repurchase agreement held by the Fund at period end, as indicated in the Statement of Investments, had been entered into on June 29, 2018.
d. Derivative Financial Instruments
The Fund invested in derivative financial instruments in order to manage risk or gain exposure to various other investments or markets. Derivatives are financial contracts based on an underlying or notional amount, require no initial investment or an initial net investment that is smaller than would normally be required to have a similar response to changes in market factors, and require or permit net settlement. Derivatives contain various risks including the potential inability of the counterparty to fulfill their obligations under the terms of the contract, the potential for an illiquid secondary market, and/or the potential for market movements which expose the Fund to gains or losses in excess of the amounts shown in the Statement of Assets and Liabilities. Realized gain and loss and unrealized appreciation and depreciation on these contracts for the period are included in the Statement of Operations.
Derivative counterparty credit risk is managed through a formal evaluation of the creditworthiness of all potential counterparties. The Fund attempts to reduce its exposure to counterparty credit risk on OTC derivatives, whenever possible, by entering into International Swaps and Derivatives Association (ISDA) master agreements with certain counterparties. These agreements contain various provisions, including but not limited to collateral requirements, events of default, or early termination. Termination events applicable to the counterparty include certain deteriorations in the credit quality of the counterparty. Termination events applicable to the Fund include failure of the Fund to maintain certain net asset
| Semiannual Report |
|
TGB-25 |
|
FRANKLIN TEMPLETON VARIABLE INSURANCE PRODUCTS TRUST
NOTES TO FINANCIAL STATEMENTS (UNAUDITED)
Templeton Global Bond VIP Fund (continued)
1. Organization and Significant Accounting Policies (continued)
d. Derivative Financial Instruments (continued)
levels and/or limit the decline in net assets over various periods of time. In the event of default or early termination, the ISDA master agreement gives the non-defaulting party the right to net and close-out all transactions traded, whether or not arising under the ISDA agreement, to one net amount payable by one counterparty to the other. However, absent an event of default or early termination, OTC derivative assets and liabilities are presented gross and not offset in the Statement of Assets and Liabilities. Early termination by the counterparty may result in an immediate payment by the Fund of any net liability owed to that counterparty under the ISDA agreement.
Collateral requirements differ by type of derivative. Collateral or initial margin requirements are set by the broker or exchange clearing house for exchange traded and centrally cleared derivatives. Initial margin deposited is held at the exchange and can be in the form of cash and/or securities. For OTC derivatives traded under an ISDA master agreement, posting of collateral is required by either the Fund or the applicable counterparty if the total net exposure of all OTC derivatives with the applicable counterparty exceeds the minimum transfer amount, which typically ranges from $100,000 to $250,000, and can vary depending on the counterparty and the type of the agreement. Generally, collateral is determined at the close of Fund business each day and any additional collateral required due to changes in derivative values may be delivered by the Fund or the counterparty the next business day, or within a few business days. Collateral pledged and/or received by the Fund for OTC derivatives, if any, is held in segregated accounts with the Fund’s custodian/counterparty broker and can be in the form of cash and/or securities. Unrestricted cash may be invested according to the Fund’s investment objectives. To the extent that the amounts due to the Fund from its counterparties are not subject to collateralization or are not fully collateralized, the Fund bears the risk of loss from counterparty non-performance.
The Fund entered into OTC forward exchange contracts primarily to manage and/or gain exposure to certain foreign currencies. A forward exchange contract is an agreement between the Fund and a counterparty to buy or sell a foreign currency at a specific exchange rate on a future date.
The Fund entered into interest rate swap contracts primarily to manage interest rate risk. An interest rate swap is an agreement between the Fund and a counterparty to exchange cash flows based on the difference between two interest rates, applied to a notional amount. These agreements may be privately negotiated in the over-the-counter market (OTC interest rate swaps) or may be executed on a registered exchange (centrally cleared interest rate swaps). For centrally cleared interest rate swaps, required initial margins are pledged by the Fund, and the daily change in fair value is accounted for as a variation margin payable or receivable in the Statement of Assets and Liabilities. Over the term of the contract, contractually required payments to be paid and to be received are accrued daily and recorded as unrealized depreciation and appreciation until the payments are made, at which time they are realized.
The Fund invests in value recovery instruments (VRI) primarily to gain exposure to economic growth. Periodic payments from VRI are dependent on established benchmarks for underlying variables. VRI has a notional amount, which is used to calculate amounts of payments to holders. Payments are recorded upon receipt as realized gains in the Statement of Operations. The risks of investing in VRI include growth risk, liquidity, and the potential loss of investment.
See Note 9 regarding other derivative information.
e. Restricted Cash
At June 30, 2018, the Fund held restricted cash in connection with investments in certain derivative securities. Restricted cash is held in a segregated account with the Fund’s counterparty broker and is reflected in the Statement of Assets and Liabilities.
f. Income and Deferred Taxes
It is the Fund’s policy to qualify as a regulated investment company under the Internal Revenue Code. The Fund intends to distribute to shareholders substantially all of its taxable income and net realized gains to relieve it from federal income and if applicable, excise taxes. As a result, no provision for U.S. federal income taxes is required.
The Fund may be subject to foreign taxation related to income received, capital gains on the sale of securities and certain foreign currency transactions in the foreign jurisdictions in which it invests. Foreign taxes, if any, are recorded based on the tax regulations and rates that exist in the foreign markets in
TGB-26 | Semiannual Report |
FRANKLIN TEMPLETON VARIABLE INSURANCE PRODUCTS TRUST
NOTES TO FINANCIAL STATEMENTS (UNAUDITED)
Templeton Global Bond VIP Fund (continued)
which the Fund invests. When a capital gain tax is determined to apply, the Fund records an estimated deferred tax liability in an amount that would be payable if the securities were disposed of on the valuation date.
The Fund may recognize an income tax liability related to its uncertain tax positions under U.S. GAAP when the uncertain tax position has a less than 50% probability that it will be sustained upon examination by the tax authorities based on its technical merits. As of June 30, 2018, the Fund has determined that no tax liability is required in its financial statements related to uncertain tax positions for any open tax years (or expected to be taken in future tax years). Open tax years are those that remain subject to examination and are based on the statute of limitations in each jurisdiction in which the Fund invests.
g. Security Transactions, Investment Income, Expenses and Distributions
Security transactions are accounted for on trade date. Realized gains and losses on security transactions are determined on a specific identification basis. Interest income and estimated expenses are accrued daily. Amortization of premium and accretion of discount on debt securities are included in interest income. Dividend income is recorded on the ex-dividend date. Distributions to shareholders are recorded on the ex-dividend date. Distributable earnings are determined according to income tax regulations (tax basis) and may differ from earnings recorded in accordance with U.S. GAAP. These differences may be permanent or temporary. Permanent differences are reclassified among capital accounts to reflect their tax character. These reclassifications have no impact on net assets or the results of operations. Temporary differences are not reclassified, as they may reverse in subsequent periods.
Common expenses incurred by the Trust are allocated among the Funds based on the ratio of net assets of each Fund to the combined net assets of the Trust or based on the ratio of number of shareholders of each Fund to the combined number of shareholders of the Trust. Fund specific expenses are charged directly to the Fund that incurred the expense.
Realized and unrealized gains and losses and net investment income, excluding class specific expenses, are allocated daily to each class of shares based upon the relative proportion of net assets of each class. Differences in per share distributions by class are generally due to differences in class specific expenses.
Inflation-indexed bonds are adjusted for inflation through periodic increases or decreases in the security’s interest accruals, face amount, or principal redemption value, by amounts corresponding to the rate of inflation as measured by an index. Any increase or decrease in the face amount or principal redemption value will be included as interest income in the Statement of Operations.
h. Accounting Estimates
The preparation of financial statements in accordance with U.S. GAAP requires management to make estimates and assumptions that affect the reported amounts of assets and liabilities at the date of the financial statements and the amounts of income and expenses during the reporting period. Actual results could differ from those estimates.
i. Guarantees and Indemnifications
Under the Trust’s organizational documents, its officers and trustees are indemnified by the Trust against certain liabilities arising out of the performance of their duties to the Trust. Additionally, in the normal course of business, the Trust, on behalf of the Fund, enters into contracts with service providers that contain general indemnification clauses. The Trust’s maximum exposure under these arrangements is unknown as this would involve future claims that may be made against the Trust that have not yet occurred. Currently, the Trust expects the risk of loss to be remote.
| Semiannual Report |
|
TGB-27 |
|
FRANKLIN TEMPLETON VARIABLE INSURANCE PRODUCTS TRUST
NOTES TO FINANCIAL STATEMENTS (UNAUDITED)
Templeton Global Bond VIP Fund (continued)
2. Shares of Beneficial Interest
At June 30, 2018, there were an unlimited number of shares authorized (without par value). Transactions in the Fund’s shares were as follows:
Six Months Ended June 30, 2018 | Year Ended December 31, 2017 | |||||||||||||||||||
| Shares | Amount | Shares | Amount | |||||||||||||||||
| Class 1 Shares: | ||||||||||||||||||||
Shares sold | 1,962,316 | $ | 34,030,349 | 4,567,479 | $ | 79,103,441 | ||||||||||||||
Shares issued in reinvestment of distributions | — | — | 46,290 | 806,829 | ||||||||||||||||
Shares redeemed | (2,487,886 | ) | (43,116,829 | ) | (2,272,230 | ) | (39,118,295 | ) | ||||||||||||
|
|
| ||||||||||||||||||
Net increase (decrease) | (525,570 | ) | $ | (9,086,480 | ) | 2,341,539 | $ | 40,791,975 | ||||||||||||
|
|
| ||||||||||||||||||
| Class 2 Shares: | ||||||||||||||||||||
Shares sold | 6,063,848 | $ | 101,036,285 | 10,419,624 | $ | 173,987,516 | ||||||||||||||
Shares issued in reinvestment of distributions | — | — | 535,977 | 8,999,053 | ||||||||||||||||
Shares redeemed | (10,167,314 | ) | (169,335,827 | ) | (18,675,809 | ) | (311,324,081 | ) | ||||||||||||
|
|
| ||||||||||||||||||
Net increase (decrease) | (4,103,466 | ) | $ | (68,299,542 | ) | (7,720,208 | ) | $ | (128,337,512 | ) | ||||||||||
|
|
| ||||||||||||||||||
| Class 4 Shares: | ||||||||||||||||||||
Shares sold | 347,150 | $ | 5,913,449 | 1,027,651 | $ | 17,546,285 | ||||||||||||||
Shares issued in reinvestment of distributions | — | — | 17,886 | 307,109 | ||||||||||||||||
Shares redeemed | (565,158 | ) | (9,617,644 | ) | (1,005,305 | ) | (17,137,648 | ) | ||||||||||||
|
|
| ||||||||||||||||||
Net increase (decrease) | (218,008 | ) | $ | (3,704,195 | ) | 40,232 | $ | 715,746 | ||||||||||||
|
|
| ||||||||||||||||||
3. Transactions with Affiliates
Franklin Resources, Inc. is the holding company for various subsidiaries that together are referred to as Franklin Templeton Investments. Certain officers and trustees of the Fund are also officers and/or directors of the following subsidiaries:
| Subsidiary | Affiliation | |
Franklin Advisers, Inc. (Advisers) | Investment manager | |
Franklin Templeton Services, LLC (FT Services) | Administrative manager | |
Franklin Templeton Distributors, Inc. (Distributors) | Principal underwriter | |
Franklin Templeton Investor Services, LLC (Investor Services) | Transfer agent |
a. Management Fees
The Fund pays an investment management fee to Advisers based on the average daily net assets of the Fund as follows:
| Annualized Fee Rate | Net Assets | |
0.625% | Up to and including $100 million | |
0.500% | Over $100 million, up to and including $250 million | |
0.450% | Over $250 million, up to and including $7.5 billion | |
0.440% | Over $7.5 billion, up to and including $10 billion | |
0.430% | Over $10 billion, up to and including $12.5 billion | |
0.420% | Over $12.5 billion, up to and including $15 billion | |
0.400% | In excess of $15 billion |
TGB-28 | Semiannual Report |
FRANKLIN TEMPLETON VARIABLE INSURANCE PRODUCTS TRUST
NOTES TO FINANCIAL STATEMENTS (UNAUDITED)
Templeton Global Bond VIP Fund (continued)
For the period ended June 30, 2018, the annualized gross effective investment management fee rate was 0.458% of the Fund’s average daily net assets.
b. Administrative Fees
Under an agreement with Advisers, FT Services provides administrative services to the Fund. The fee is paid by Advisers based on the Fund’s average daily net assets, and is not an additional expense of the Fund.
c. Distribution Fees
The Board has adopted distribution plans for Class 2 and Class 4 shares pursuant to Rule 12b-1 under the 1940 Act. Under the Fund’s compensation distribution plans, the Fund pays Distributors for costs incurred in connection with the servicing, sale and distribution of the Fund’s shares up to 0.25% and 0.35% per year of its average daily net assets of Class 2 and Class 4, respectively. The plan year, for purposes of monitoring compliance with the maximum annual plan rates, is February 1 through January 31.
d. Transfer Agent Fees
Investor Services, under terms of an agreement, performs shareholder servicing for the Fund and is not paid by the Fund for the services.
e. Investments in Affiliated Management Investment Companies
The Fund invests in one or more affiliated management investment companies for purposes other than exercising a controlling influence over the management or policies. Management fees paid by the Fund are waived on assets invested in the affiliated management investment companies, as noted in the Statement of Operations, in an amount not to exceed the management and administrative fees paid directly or indirectly by each affiliate. During the period ended June 30, 2018, the Fund held investments in affiliated management investment companies as follows:
| Number of Shares Held at Beginning of Period | Gross Additions | Gross Reductions | Number of Shares Held at End of Period | Value at End | Dividend Income | Realized Gain (Loss) | Net Change in Unrealized Appreciation (Depreciation) | |||||||||||||||||||||||||
| Non-Controlled Affiliates | ||||||||||||||||||||||||||||||||
Institutional Fiduciary Trust Money Market Portfolio, 1.51% | 664,514,279 | 392,495,000 | (251,064,221 | ) | 805,945,058 | $805,945,058 | $4,499,234 | $ — | $ — | |||||||||||||||||||||||
|
| |||||||||||||||||||||||||||||||
4. Expense Offset Arrangement
The Fund has entered into an arrangement with its custodian whereby credits realized as a result of uninvested cash balances are used to reduce a portion of the Fund’s custodian expenses. During the period ended June 30, 2018, the custodian fees were reduced as noted in the Statement of Operations.
5. Income Taxes
For tax purposes, capital losses may be carried over to offset future capital gains, if any. At December 31, 2017, the capital loss carryforwards were as follows:
Capital loss carryforwards not subject to expiration: | ||||
Short term | $2,981,110 | |||
Long term | 294,319 | |||
|
| |||
Total capital loss carryforwards | $3,275,429 | |||
|
|
| Semiannual Report |
|
TGB-29 |
|
FRANKLIN TEMPLETON VARIABLE INSURANCE PRODUCTS TRUST
NOTES TO FINANCIAL STATEMENTS (UNAUDITED)
Templeton Global Bond VIP Fund (continued)
5. Income Taxes (continued)
At June 30, 2018, the cost of investments and net unrealized appreciation (depreciation) for income tax purposes were as follows:
Cost of investments | $3,070,645,157 | |||
|
|
| ||
Unrealized appreciation | $ 178,895,528 | |||
Unrealized depreciation | (288,561,218 | ) | ||
|
|
| ||
Net unrealized appreciation (depreciation) | $ (109,665,690 | ) | ||
|
|
| ||
Differences between income and/or capital gains as determined on a book basis and a tax basis are primarily due to differing treatments of foreign currency transactions and bond discounts and premiums.
6. Investment Transactions
Purchases and sales of investments (excluding short term securities) for the period ended June 30, 2018, aggregated $233,730,514 and $264,006,033, respectively.
7. Credit Risk
At June 30, 2018, the Fund had 15.7% of its portfolio invested in high yield or other securities rated below investment grade and unrated securities, if any. These securities may be more sensitive to economic conditions causing greater price volatility and are potentially subject to a greater risk of loss due to default than higher rated securities.
8. Concentration of Risk
Investing in foreign securities may include certain risks and considerations not typically associated with investing in U.S. securities, such as fluctuating currency values and changing local and regional economic, political and social conditions, which may result in greater market volatility. In addition, certain foreign securities may not be as liquid as U.S. securities.
9. Other Derivative Information
At June 30, 2018, the Fund’s investments in derivative contracts are reflected in the Statement of Assets and Liabilities as follows:
| Asset Derivatives | Liability Derivatives | |||||||||||||||
Derivative Contracts Not Accounted for as Hedging Instruments | Statement of Assets and Liabilities | Fair Value | Statement of Assets and Liabilities | Fair Value | ||||||||||||
Interest rate contracts | Variation margin on centrally cleared swap contracts | $ | 44,141,629 | a | Variation margin on centrally cleared swap contracts | $ | 7,510,618 | a | ||||||||
Unrealized appreciation on OTC swap contracts | — | Unrealized depreciation on OTC swap contracts | 2,260,939 | |||||||||||||
Foreign exchange contracts | Unrealized appreciation on OTC forward exchange contracts | 56,237,859 | Unrealized depreciation on OTC forward exchange contracts | 14,121,404 | ||||||||||||
Value recovery instruments | Investments in securities, at value | 18,845,936 | b | |||||||||||||
|
|
|
| |||||||||||||
Totals | $ | 119,225,424 | $ | 23,892,961 | ||||||||||||
|
|
|
| |||||||||||||
aThis amount reflects the cumulative appreciation (depreciation) of centrally cleared swap contracts as reported in the Statement of Investments. Only the variation margin receivable/payable at period end is separately reported within the Statement of Assets and Liabilities. Prior variation margin movements were recorded to cash upon receipt or payment.
bVRI are included in investments in securities, at value in the Statement of Assets and Liabilities.
TGB-30 | Semiannual Report |
FRANKLIN TEMPLETON VARIABLE INSURANCE PRODUCTS TRUST
NOTES TO FINANCIAL STATEMENTS (UNAUDITED)
Templeton Global Bond VIP Fund (continued)
For the period ended June 30, 2018, the effect of derivative contracts in the Fund’s Statement of Operations was as follows:
Derivative Contracts Not Accounted for as Hedging Instruments | Statement of Operations Location | Net Realized Gain (Loss) for the Period | Statement of Operations Location | Net Change in Unrealized Appreciation (Depreciation) for the Period | ||||||||||||
Net realized gain (loss) from: | Net change in unrealized | |||||||||||||||
appreciation (depreciation) on: | ||||||||||||||||
Interest rate contracts | Swap contracts | $ | (2,591,540 | ) | Swap contracts | $ | 39,130,242 | |||||||||
Foreign exchange contracts | Forward exchange contracts | (31,380,623 | ) | Forward exchange contracts | 79,116,706 | |||||||||||
Value recovery instruments | Investments | 59,466 | a | Investments | 2,214,879 | a | ||||||||||
|
|
|
| |||||||||||||
Totals | $ | (33,912,697 | ) | $ | 120,461,827 | |||||||||||
|
|
|
| |||||||||||||
aVRI are included in net realized gain (loss) from investments and net change in unrealized appreciation (depreciation) on investments in the Statement of Operations.
For the period ended June 30, 2018, the average month end notional amount of swap contracts represented $807,820,000. The average month end contract value and fair value of forward exchange contracts and VRI, was $3,340,565,128 and $19,811,075, respectively.
See Note 1(d) regarding derivative financial instruments.
At June 30, 2018, the Fund’s OTC derivative assets and liabilities are as follows:
Gross Amounts of Assets and Liabilities Presented | ||||||||
| Assetsa | Liabilitiesa | |||||||
| Derivatives | ||||||||
Forward exchange contracts | $56,237,859 | $14,121,404 | ||||||
Swap contracts | — | 2,260,939 | ||||||
|
| |||||||
Total | $56,237,859 | $16,382,343 | ||||||
|
| |||||||
aAbsent an event of default or early termination, OTC derivative assets and liabilities are presented gross and not offset in the Statement of Assets and Liabilities.
At June 30, 2018, the Fund’s OTC derivative assets, which may be offset against the Fund’s OTC derivative liabilities and collateral received from the counterparty, are as follows:
| Amounts Not Offset in the | ||||||||||||||||||||
| Statement of Assets and Liabilities | ||||||||||||||||||||
Gross Amounts of Assets Presented in | Financial Instruments Available for Offset | Financial Instruments Collateral Receiveda,b | Cash Collateral Receivedb | Net Amount (Not less than zero) | ||||||||||||||||
| Counterparty | ||||||||||||||||||||
BOFA | $ 2,852,144 | $ | (137,729 | ) | $ | — | $ | (2,714,415 | ) | $ | — | |||||||||
BZWS | 3,179,859 | (137,695 | ) | (3,042,164 | ) | — | — | |||||||||||||
CITI | 8,735,248 | (7,356,315 | ) | — | (1,378,933 | ) | — | |||||||||||||
DBAB | 7,312,388 | (1,991,498 | ) | — | (5,320,890 | ) | — | |||||||||||||
GSCO | 5,721,986 | (92,158 | ) | — | (5,629,828 | ) | — | |||||||||||||
HSBK | 13,507,894 | (2,629,286 | ) | (7,873,655 | ) | — | 3,004,953 | |||||||||||||
JPHQ | 12,611,864 | (3,889,948 | ) | (8,721,916 | ) | — | — | |||||||||||||
MSCO | 181,921 | (114,268 | ) | — | (67,653 | ) | — | |||||||||||||
SCNY | 1,404,850 | (19,330 | ) | — | (1,385,520 | ) | — | |||||||||||||
UBSW | 729,705 | (14,116 | ) | (715,589 | ) | — | — | |||||||||||||
|
| |||||||||||||||||||
Total | $56,237,859 | $ | (16,382,343 | ) | $ | (20,353,324 | ) | $ | (16,497,239 | ) | $ | 3,004,953 | ||||||||
|
| |||||||||||||||||||
| Semiannual Report |
|
TGB-31 |
|
FRANKLIN TEMPLETON VARIABLE INSURANCE PRODUCTS TRUST
NOTES TO FINANCIAL STATEMENTS (UNAUDITED)
Templeton Global Bond VIP Fund (continued)
9. Other Derivative Information (continued)
At June 30, 2018, the Fund’s OTC derivative liabilities, which may be offset against the Fund’s OTC derivative assets and collateral pledged to the counterparty, are as follows:
| Amounts Not Offset in the | ||||||||||||||||||||
| Statement of Assets and Liabilities | ||||||||||||||||||||
Gross Amounts of | Financial Instruments Available for Offset | Financial Instruments Collateral Pledged | Cash Collateral Pledged | Net Amount (Not less than zero) | ||||||||||||||||
| Counterparty | ||||||||||||||||||||
BOFA | $ 137,729 | $ (137,729 | ) | $ — | $ — | $ — | ||||||||||||||
BZWS | 137,695 | (137,695 | ) | — | — | — | ||||||||||||||
CITI | 7,356,315 | (7,356,315 | ) | — | — | — | ||||||||||||||
DBAB | 1,991,498 | (1,991,498 | ) | — | — | — | ||||||||||||||
GSCO | 92,158 | (92,158 | ) | — | — | — | ||||||||||||||
HSBK | 2,629,286 | (2,629,286 | ) | — | — | — | ||||||||||||||
JPHQ | 3,889,948 | (3,889,948 | ) | — | — | — | ||||||||||||||
MSCO | 114,268 | (114,268 | ) | — | — | — | ||||||||||||||
SCNY | 19,330 | (19,330 | ) | — | — | — | ||||||||||||||
UBSW | 14,116 | (14,116 | ) | — | — | — | ||||||||||||||
|
| |||||||||||||||||||
Total | $16,382,343 | $(16,382,343 | ) | $ — | $ — | $ — | ||||||||||||||
|
| |||||||||||||||||||
aAt June 30, 2018, the Fund received United Kingdom Treasury Bonds and U.S. Treasury Bills, Bonds and Notes as collateral for derivatives.
bIn some instances, the collateral amounts disclosed in the table above were adjusted due to the requirement to limit collateral amounts to avoid the effect of overcollateralization. Actual collateral received and/or pledged may be more than the amounts disclosed herein.
See Abbreviations on page TGB-33.
10. Credit Facility
The Fund, together with other U.S. registered and foreign investment funds (collectively, Borrowers), managed by Franklin Templeton Investments, are borrowers in a joint syndicated senior unsecured credit facility totaling $2 billion (Global Credit Facility) which matures on February 8, 2019. This Global Credit Facility provides a source of funds to the Borrowers for temporary and emergency purposes, including the ability to meet future unanticipated or unusually large redemption requests.
Under the terms of the Global Credit Facility, the Fund shall, in addition to interest charged on any borrowings made by the Fund and other costs incurred by the Fund, pay its share of fees and expenses incurred in connection with the implementation and maintenance of the Global Credit Facility, based upon its relative share of the aggregate net assets of all of the Borrowers, including an annual commitment fee of 0.15% based upon the unused portion of the Global Credit Facility. These fees are reflected in other expenses in the Statement of Operations. During the period ended June 30, 2018, the Fund did not use the Global Credit Facility.
11. Fair Value Measurements
The Fund follows a fair value hierarchy that distinguishes between market data obtained from independent sources (observable inputs) and the Fund’s own market assumptions (unobservable inputs). These inputs are used in determining the value of the Fund’s financial instruments and are summarized in the following fair value hierarchy:
| • | Level 1 – quoted prices in active markets for identical financial instruments |
| • | Level 2 – other significant observable inputs (including quoted prices for similar financial instruments, interest rates, prepayment speed, credit risk, etc.) |
TGB-32 | Semiannual Report |
FRANKLIN TEMPLETON VARIABLE INSURANCE PRODUCTS TRUST
NOTES TO FINANCIAL STATEMENTS (UNAUDITED)
Templeton Global Bond VIP Fund (continued)
| • | Level 3 – significant unobservable inputs (including the Fund’s own assumptions in determining the fair value of financial instruments) |
The input levels are not necessarily an indication of the risk or liquidity associated with financial instruments at that level.
For movements between the levels within the fair value hierarchy, the Fund has adopted a policy of recognizing the transfers as of the date of the underlying event which caused the movement.
A summary of inputs used as of June 30, 2018, in valuing the Fund’s assets and liabilities carried at fair value, is as follows:
| Level 1 | Level 2 | Level 3 | Total | |||||||||||||
| ||||||||||||||||
| Assets: | ||||||||||||||||
Investments in Securities:a | ||||||||||||||||
Foreign Government and Agency Securities | $ | — | $ | 1,681,754,667 | $ | — | $ | 1,681,754,667 | ||||||||
Short Term Investments | 1,033,983,187 | 168,755,086 | — | 1,202,738,273 | ||||||||||||
|
| |||||||||||||||
Total Investments in Securities | $ | 1,033,983,187 | $ | 1,850,509,753 | $ | — | $ | 2,884,492,940 | ||||||||
|
| |||||||||||||||
Other Financial Instruments: | ||||||||||||||||
Forward Exchange Contracts | $ | — | $ | 56,237,859 | $ | — | $ | 56,237,859 | ||||||||
Swap Contracts | — | 44,141,629 | — | 44,141,629 | ||||||||||||
|
| |||||||||||||||
Total Other Financial Instruments | $ | — | $ | 100,379,488 | $ | — | $ | 100,379,488 | ||||||||
|
| |||||||||||||||
| Liabilities: | ||||||||||||||||
Other Financial Instruments: | ||||||||||||||||
Forward Exchange Contracts | $ | — | $ | 14,121,404 | $ | — | $ | 14,121,404 | ||||||||
Swap Contracts | — | 9,771,557 | — | 9,771,557 | ||||||||||||
|
| |||||||||||||||
Total Other Financial Instruments | $ | — | $ | 23,892,961 | $ | — | $ | 23,892,961 | ||||||||
|
| |||||||||||||||
aFor detailed categories, see the accompanying Statement of Investments.
12. Subsequent Events
The Fund has evaluated subsequent events through the issuance of the financial statements and determined that no events have occurred that require disclosure.
Abbreviations
| Counterparty/Exchange | Currency | Selected Portfolio | ||||||||
| BOFA | Bank of America Corp. | ARS | Argentine Peso | BADLAR | Argentina Deposit Rates Badlar Private | |||||
| BZWS | Barclays Bank PLC | BRL | Brazilian Real | Banks ARS | ||||||
| CITI | Citigroup, Inc. | COP | Colombian Peso | FRN | Floating Rate Note | |||||
| DBAB | Deutsche Bank AG | EUR | Euro | GDP | Gross Domestic Product | |||||
| GSCO | The Goldman Sachs Group, Inc. | GHS | Ghanaian Cedi | LIBOR | London InterBank Offered Rate | |||||
| HSBK | HSBC Bank PLC | IDR | Indonesian Rupiah | VRI | Value Recovery Instrument | |||||
| JPHQ | JP Morgan Chase & Co. | INR | Indian Rupee | |||||||
| MSCO | Morgan Stanley | KRW | South Korean Won | |||||||
| SCNY | Standard Chartered Bank | MXN | Mexican Peso | |||||||
| UBSW | UBS AG | PEN | Peruvian Nuevo Sol | |||||||
| PHP | Philippine Peso | |||||||||
| USD | United States Dollar | |||||||||
| Semiannual Report |
|
TGB-33 |
|
FRANKLIN TEMPLETON VARIABLE INSURANCE PRODUCTS TRUST
Tax Information (unaudited)
Templeton Global Bond VIP Fund
At December 31, 2017, more than 50% of the Fund’s total assets were invested in securities of foreign issuers. In most instances, foreign taxes were withheld from income paid to the Fund on these investments. As shown in the table below, the Fund hereby reports to shareholders the foreign source income and foreign taxes paid, pursuant to Section 853 of the Internal Revenue Code (Code). This written statement will allow shareholders of record on June 14, 2018, to treat their proportionate share of foreign taxes paid by the Funds as having been paid directly by them. The shareholder shall consider these amounts as foreign taxes paid in the tax year in which they receive the Fund distribution.
The following table provides a detailed analysis of foreign tax paid, and foreign source income as reported by the Fund, to Class 1, Class 2, and Class 4 shareholders of record.
| Class | Foreign Tax Paid Per Share | Foreign Source Income Per Share | ||||||
| Class 1 | $0.0402 | $0.9616 | ||||||
| Class 2 | $0.0402 | $0.9177 | ||||||
| Class 4 | $0.0402 | $0.8998 | ||||||
Foreign Tax Paid Per Share (Column 1) is the amount per share available to you, as a tax credit (assuming you held your shares in the Fund for a minimum of 16 days during the 31-day period beginning 15 days before the ex-dividend date of the Fund’s distribution to which the foreign taxes relate), or, as a tax deduction.
Foreign Source Income Per Share (Column 2) is the amount per share of income dividends attributable to foreign securities held by the Fund, plus any foreign taxes withheld on these dividends.
TGB-34 | Semiannual Report |
This semiannual report for Templeton Growth VIP Fund covers the period ended June 30, 2018.
Class 2 Performance Summary as of June 30, 2018
The Fund’s Class 2 Shares had a -2.51% total return for the six-month period ended June 30, 2018.
Performance reflects the Fund’s Class 2 operating expenses, but does not include any contract fees, expenses or sales charges. If they had been included, performance would be lower. These charges and deductions, particularly for variable life policies, can have a significant effect on contract values and insurance benefits. See the contract prospectus for a complete description of these expenses, including sales charges.
Performance data represent past performance, which does not guarantee future results. Investment return and principal value will fluctuate, and you may have a gain or loss when you sell your shares. Current performance may differ from figures shown.
Semiannual Report | TG-1 |
TEMPLETON GROWTH VIP FUND
Fund Goal and Main Investments
The Fund seeks long-term capital growth. Under normal market conditions, the Fund invests predominantly in equity securities (primarily common stocks) of companies located anywhere in the world, including developing markets.
Fund Risks
All investments involve risks, including possible loss of principal. Special risks are associated with foreign investing, including currency fluctuations, economic instability and political developments; investments in emerging markets involve heightened risks related to the same factors. Because the Fund may invest its assets in companies in a specific region, including Europe, it is subject to greater risks of adverse developments in that region and/or the surrounding regions than a fund that is more broadly diversified geographically. Political, social or economic disruptions in the region, even in countries in which the fund is not invested, may adversely affect the value of securities held by the Fund. Current political and financial uncertainty surrounding the European Union (EU) and the financial instability of some countries in the EU may increase market volatility and the economic risk of investing in companies in Europe. In addition, smaller company stocks have historically experienced more price volatility than larger company stocks, especially over the short term. The Fund is actively managed but there is no guarantee that the manager’s investment decisions will produce the desired results. The Fund’s prospectus also includes a description of the main investment risks.
Performance Overview
You can find the Fund’s six-month total return in the Performance Summary. For comparison, the Fund’s benchmark, the MSCI All Country World Index (ACWI), had a -0.13% total return for the period under review.1
Economic and Market Overview
The global economy expanded during the six-month period under review amid generally upbeat economic data across regions. In this environment, global developed and emerging market stocks reached a new all-time high in January 2018, as measured by the MSCI ACWI. During the period, global markets were aided by price gains in oil and other
Geographic Composition
Based on Total Net Assets as of 6/30/18
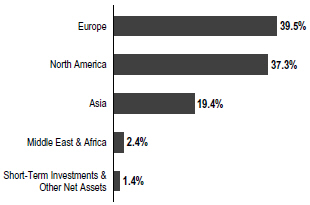
commodities, encouraging corporate earnings reports and investor optimism about global economic growth. However, global stocks had a -0.13% total return for the six-month period, as measured by the MSCI ACWI, largely due to an overall decline in emerging market stocks.1
Global markets reflected investor concerns about tensions in the Korean peninsula and political uncertainties in the US and the European Union, as well as worries that strong economic growth and rising inflation in some parts of the world, particularly in the US, would lead central banks to increase interest rates sooner than expected. Markets were further pressured by the Trump administration’s protectionist trade policies, uncertainty surrounding the US-China trade relationship, and a broad sell-off in information technology stocks in March due to a potential for tighter regulation in the sector arising from concerns about consumer data privacy. An overall easing of tensions in the Korean peninsula and intermittent US-China trade negotiations partially offset some of these concerns. However, US trade disputes with its allies and China near period-end dampened investor sentiment.
The US economy continued to grow during the six months under review. After moderating for three consecutive quarters, the economy grew faster in 2018’s second quarter, driven by consumer spending, exports, business investment and government spending. The unemployment rate declined from 4.1% in December 2017, as reported at the beginning of the six-month period, to 4.0% at period-end.2 Annual inflation, as measured by the Consumer Price Index, increased from 2.1% in
1. Source: Morningstar. One cannot invest directly in an index, and an index is not representative of the Fund’s portfolio. Please see Index Descriptions following the Fund Summaries.
2. Source: US Bureau of Labor Statistics.
The dollar value, number of shares or principal amount, and names of all portfolio holdings are listed in the Fund’s Statement of Investments (SOI).
TG-2 | Semiannual Report |
TEMPLETON GROWTH VIP FUND
December 2017, as reported at the beginning of the period, to 2.9% at period-end.2 The US Federal Reserve raised its target range for the federal funds rate in March and June 2018 and continued reducing its balance sheet as part of its ongoing plan to normalize monetary policy.
In Europe, the UK’s quarterly economic growth moderated in 2018’s first quarter amid a decline in construction output. The Bank of England kept its key policy rate unchanged during the period. The eurozone’s quarterly growth moderated in 2018’s first quarter due to a decline in external demand. The bloc’s annual inflation rate ended the period higher than in December 2017. The European Central Bank (ECB) kept its benchmark interest rate unchanged during the period. However, at its June meeting, the ECB announced it would further reduce its monthly bond purchases beginning in October 2018 and indicated it would conclude the program at the end of 2018 while continuing to keep interest rates unchanged through at least the summer of 2019.
In Asia, Japan’s quarterly gross domestic product (GDP) growth in 2018’s first quarter declined, the country’s first contraction since 2015’s fourth quarter, mainly due to a decline in private residential investment and household consumption. The Bank of Japan left its benchmark interest rate unchanged during the period and continued its monetary stimulus measures.
In emerging markets, Brazil’s quarterly GDP accelerated in 2018’s first quarter compared to the previous quarter. The country’s central bank cut its benchmark interest rate twice during the period to spur economic growth. Russia’s annual GDP grew in 2018’s first quarter compared to the prior-year period, amid the Bank of Russia’s continued policy support. China’s annual GDP moderated in 2018’s first quarter compared to the prior-year period. The People’s Bank of China left its benchmark interest rate unchanged during the period. Overall, emerging market stocks, as measured by the MSCI Emerging Markets Index, declined during the period.3
Investment Strategy
Our investment philosophy is bottom up, value oriented and long term. When choosing equity investments for the Fund, we focus on the market price of a company’s securities relative to our evaluation of the company’s potential long-term earnings, asset value and cash flow. We also consider a company’s
price/earnings ratio, price/cash flow ratio, profit margins and liquidation value.
Manager’s Discussion
Global equities modestly retreated during the first half of 2018 amid concerns about escalating trade tensions and the impact of a stronger US dollar and tighter monetary policy on emerging markets. The performance trends dominant during this market cycle remained largely intact, with a few exceptions. Information technology (IT) and other growth-oriented sectors maintained their long-running leadership, while energy extended more recent gains as supply concerns and solid demand supported the price of crude. Among new developments during the period, health care stocks rebounded while financials underperformance deepened.
The Fund’s stock selection and overweighted allocation in financials detracted significantly from the Fund’s performance relative to its benchmark, as the sector was led lower by a mix of European and Asian lenders and insurers.4 European lenders were negatively impacted by flagging regional growth and Italian political turmoil. We believe investor concerns about Italy are overblown. Italy certainly has its challenges, including high public debt, rigid labor markets, low productivity, high unit labor costs, a fragmented banking system, inefficient tax base, political fragility and so on. But, by any objective assessment, we believe the country is far better off in the EU than it would be outside of it. Were Italy to leave, we think its banks would be insolvent, its government would default on its obligations, and the purchasing power of household savings would be vastly diminished once redenominated into lira. In all likelihood, the recent Italian crisis has done little more than postpone ECB interest rate hikes a few months and take some air out of the euro—not necessarily adverse developments for an export-oriented trading bloc accustomed to expansive monetary policy. The largest one-day spike in Italian bond yields since 1993 may also be a helpful warning—much like the one experienced by Greece in 2015—that financial markets remain vigilant. After reducing exposure to European financials amid last year’s strength, we have viewed more recent volatility as a selective buying opportunity. Meanwhile, shares of South Korean lender KB Financial Group led the Fund’s Asian bank holdings lower as general concerns about regulatory and geopolitical risks in South Korea outweighed continued fundamental strength.
3. Please see Index Descriptions following the Fund Summaries.
4. The financials sector comprises banks, capital markets, consumer finance, diversified financial services and insurance in the SOI.
| Semiannual Report |
|
TG-3 |
|
TEMPLETON GROWTH VIP FUND
Stock selection and an underweighted allocation in IT also detracted, though there were no IT holdings among the Fund’s biggest single-stock laggards.5 We remain skeptical about the sustainability of IT’s outperformance given that recent strength has been driven primarily by valuation multiples expansion, not earnings growth. Indeed, the price/sales ratio for the S&P 500 IT Index has almost doubled over the past five years, while the earnings growth trend has stagnated. We cannot explain why flat growth is being rewarded with an expanding multiple, and we continue to underweight the sector amid what appears to be the biggest divergence between IT valuations and fundamentals since the late 1990s.
The only other sectors that detracted from relative performance during the first half of 2018 were health care and telecommunication services due to stock selection for health care (that offset the positive effect of an overweighted allocation) and an overweighting in telecommunication services.6 The health care sector delivered the Fund’s biggest detractor during the period: Swedish medical devices firm Getinge (though it bears mentioning that Israel’s Teva Pharmaceutical Industries, another health care holding, was the Fund’s biggest individual contributor). Shares of Getinge have come under pressure in recent years as regulatory issues and management turnover transformed what was once viewed as a quality growth stock into something now viewed as a complex restructuring story. Yet, at this point, Getinge appears to be nearing the bottom of its financial performance. Although challenges persist, we believe the most vexing aspects of regulatory compliance and restructuring progress should be over. The stock simply remains too cheap for a market leader with a solid track record and strong position in businesses with high barriers to entry, in our view. More generally, we believe we have assembled a balanced portfolio of health care stocks that discounts well-known macroeconomic headwinds and offers unique catalysts for sustainable outperformance. From the telecommunications sector, shares of Singapore Telecommunications (Singtel) declined after reporting a drop in net income. Although currency fluctuations and a new 4G mobile entry in Australia and Singapore may pressure profits in the near term, we believe consolidation in the promising Indian market should help earnings recover over our investment horizon. Recently trading at what we consider to be a relatively cheap valuation multiple and featuring a strong balance sheet, attractive dividend yield, and compelling emerging market growth
Top 10 Holdings
6/30/18
Company Sector/Industry, Country | % of Total Net Assets | |||
| Royal Dutch Shell PLC Oil, Gas & Consumable Fuels, U.K. | 2.6% | |||
| Teva Pharmaceutical Industries Ltd. Pharmaceuticals, Israel | 2.4% | |||
| BP PLC Oil, Gas & Consumable Fuels, U.K. | 2.4% | |||
| SES SA Media, Luxembourg | 2.3% | |||
| Citigroup Inc. Banks, U.S. | 2.1% | |||
| Eni SpA Oil, Gas & Consumable Fuels, Italy | 2.0% | |||
| Allergan PLC Pharmaceuticals, U.S. | 2.0% | |||
| Oracle Corp. Software, U.S. | 1.8% | |||
Samsung Electronics Co. Ltd. Technology Hardware, Storage & Peripherals, | 1.8% | |||
| HSBC Holdings PLC Banks, U.K. | 1.8% | |||
prospects, we believe Singtel remains significantly undervalued relative to its long-term fundamentals.
Turning to contributors, we were encouraged by the outperformance of the Fund’s energy holdings, which benefited from both stock selection and an overweighted allocation.7 Oil prices surged to a multi-year high during the period due to a combination of geopolitical risks to supply, coordinated supply management by the Organization of the Petroleum Exporting Counties along with other oil-producing countries, and stronger-than-expected global demand. US exploration and production firm ConocoPhillips advanced as management maintained capital discipline, returning excess cash flows from higher oil prices to shareholders through dividends and share buybacks. Italy-based oil major Eni gained after reporting increased production and stronger earnings. UK-based integrated energy firm BP also contributed. We believe BP should be able to generate substantial free cash flow that will likely be returned to shareholders through improved dividends and share repurchases. In the integrated oil segment more generally, production growth is finally coming through as
5. The IT sector comprises communications equipment; internet software and services; and technology hardware, storage and peripherals in the SOI.
6. The health care sector comprises biotechnology, health care equipment and supplies, health care providers and services, life sciences tools and services, and pharmaceuticals in the SOI. The telecommunication services sector comprises diversified telecommunication services and wireless telecommunication services in the SOI.
7. The energy sector comprises energy equipment and services and oil, gas and consumable fuels in the SOI.
TG-4 | Semiannual Report |
TEMPLETON GROWTH VIP FUND
operating and capital expenditures come down and oil prices normalize higher. As a result, the integrated oil segment looks set to generate more free cash flow this year than it did when oil traded at US$100 per barrel, in our view, and much of that cash could be returned to shareholders in the form of dividends and share buybacks. As the commodity cycle matures, we have begun to take profits on higher volatility oil services holdings and focus instead on more stable and cash-generative integrated energy firms.
Stock selection in consumer discretionary also boosted relative performance.8 Shares of Luxembourg-based satellite specialist SES bounced back during the period after a strong earnings report helped improve recently lackluster sentiment. We continue to believe that SES’s new management team is executing a sensible turnaround plan and the company should benefit over our long-term horizon from the structural growth in global data demand, given the high barriers to entry associated with its difficult-to-replicate orbital slots. US media group Twenty-First Century Fox also delivered solid returns after a bidding war broke out for the firm’s assets.
From a regional standpoint, stock selection and an underweighted position in the resilient US market detracted from the Fund’s relative performance, as did stock selection and a slight overweighting in Asia. Stock selection in Europe contributed to relative results, but this was offset by the negative effect of an overweighting in the region. In the Middle East and Africa region, an overweighting in Israel contributed.
It is important to recognize the effect of currency movements on the Fund’s performance. In general, if the value of the US dollar goes up compared with a foreign currency, an investment traded in that foreign currency will go down in value because it will be worth fewer US dollars. This can have a negative effect on Fund performance. Conversely, when the US dollar weakens in relation to a foreign currency, an investment traded in that foreign currency will increase in value, which can contribute to Fund performance. For the six months ended June 30, 2018, the US dollar rose in value relative to most currencies. As a result, the Fund’s performance was negatively affected by the portfolio’s substantial investment in securities with non-US currency exposure.
At the end of the first half of 2018, we remained optimistic about the prospects for value, and we maintained the belief that companies whose fundamentals are underappreciated by a short-term market are well positioned for outperformance over
time. Global valuation spreads (the gap between the market’s cheapest and most expensive stocks) at the end of the period were the widest they have been in at least 30 years. Put another way, value globally has only been this cheap a very small percentage of the time in the past three decades. Though it may not feel like it, we believe this could be a uniquely great opportunity for value investors. Yet, despite our conviction on value’s long-term prospects, we are not sitting idly by waiting for the cycle to turn. We have worked hard to continuously refine and improve our process, with recent initiatives including improved risk management strategies and the integration of environmental, social and governance analysis into our investment framework. The goal in these efforts is to ensure that our investment process remains true to Templeton’s time-tested fundamental value approach, while also evolving to best address client goals and market conditions.
Thank you for your participation in Templeton Growth VIP Fund. We look forward to serving your future investment needs.
The foregoing information reflects our analysis, opinions and portfolio holdings as of June 30, 2018, the end of the reporting period. The way we implement our main investment strategies and the resulting portfolio holdings may change depending on factors such as market and economic conditions. These opinions may not be relied upon as investment advice or an offer for a particular security. The information is not a complete analysis of every aspect of any market, country, industry, security or the Fund. Statements of fact are from sources considered reliable, but the investment manager makes no representation or warranty as to their completeness or accuracy. Although historical performance is no guarantee of future results, these insights may help you understand our investment management philosophy.
8. The consumer discretionary sector comprises automobiles, household durables, leisure products, media and specialty retail in the SOI.
| Semiannual Report |
|
TG-5 |
|
TEMPLETON GROWTH VIP FUND
Class 2 Fund Expenses
As an investor in a variable insurance contract (Contract) that indirectly provides for investment in an underlying mutual fund, you can incur transaction and/or ongoing expenses at both the Fund level and the Contract Level: (1) transaction expenses can include sales charges (loads) on purchases, surrender fees, transfer fees and premium taxes; and (2) ongoing expenses can include management fees, distribution and service (12b-1) fees, contract fees, annual maintenance fees, mortality and expense risk fees and other fees and expenses. All mutual funds and Contracts have some types of ongoing expenses. The table below shows Fund-level ongoing expenses and can help you understand these costs and compare them with those of other mutual funds offered through the Contract. The table assumes a $1,000 investment held for the six months indicated. Please refer to the Fund prospectus for additional information on operating expenses.
Actual Fund Expenses
The table below provides information about the actual account values and actual expenses in the columns under the heading “Actual.” In these columns the Fund’s actual return, which includes the effect of ongoing Fund expenses but does not include the effect of ongoing Contract expenses, is used to calculate the “Ending Account Value.” You can estimate the Fund-level expenses you paid during the period by following these steps (of course, your account value and expenses will differ from those in this illustration): Divide your account value by $1,000 (if your account had an $8,600 value, then $8,600 ÷ $1,000 = 8.6). Then multiply the result by the number under the headings “Actual” and “Fund-Level Expenses Paid During Period” (if Fund-Level Expenses Paid During Period were $ 7.50, then 8.6 x $7.50 = $64.50). In this illustration, the estimated expenses paid this period at the Fund level are $64.50.
Hypothetical Example for Comparison with Other Mutual Funds
Under the heading “Hypothetical” in the table, information is provided about hypothetical account values and hypothetical expenses based on the Fund’s actual expense ratio and an assumed rate of return of 5% per year before expenses, which is not the Fund’s actual return. This information may not be used to estimate the actual ending account balance or expenses you paid for the period, but it can help you compare ongoing costs of investing in the Fund with those of other mutual funds offered through the Contract. To do so, compare this 5% hypothetical example with the 5% hypothetical examples that appear in the shareholder reports of other funds offered through the Contract.
Please note that expenses shown in the table are meant to highlight ongoing costs at the Fund level only and do not reflect any ongoing expenses at the Contract level, or transaction expenses at either the Fund or Contract levels. In addition, while the Fund does not have transaction expenses, if the transaction and ongoing expenses at the Contract level were included, the expenses shown below would be higher. You should consult your Contract prospectus or disclosure document for more information.
| Actual (actual return after expenses) | Hypothetical (5% annual return before expenses) | |||||||||||
Share Class | Beginning Account Value 1/1/18 | Ending Account Value 6/30/18 | Fund-Level Paid During Period 1/1/18–6/30/181,2 | Ending Account Value 6/30/18 | Fund-Level Paid During Period 1/1/18–6/30/181,2 | Net Annualized Expense Ratio2 | ||||||
|
|
|
| |||||||||
Class 2 | $1,000 | $974.90 | $5.24 | $1,019.49 | $5.36 | 1.07% | ||||||
1. Expenses are equal to the annualized expense ratio for the six-month period as indicated above—in the far right column—multiplied by the simple average account value over the period indicated, and then multiplied by 181/365 to reflect the one-half year period.
2. Reflects expenses after fee waivers and expense reimbursements. Does not include any ongoing expenses of the Contract for which the Fund is an investment option or acquired fund fees and expenses.
TG-6 | Semiannual Report |
FRANKLIN TEMPLETON VARIABLE INSURANCE PRODUCTS TRUST
Financial Highlights
Templeton Growth VIP Fund
Six Months Ended June 30, 2018 (unaudited) | Year Ended December 31, | |||||||||||||||||||||||
| 2017 | 2016 | 2015 | 2014 | 2013 | ||||||||||||||||||||
| ||||||||||||||||||||||||
Class 1 | ||||||||||||||||||||||||
Per share operating performance (for a share outstanding throughout the period) | ||||||||||||||||||||||||
Net asset value, beginning of period | $16.24 | $13.93 | $13.54 | $14.85 | $15.47 | $12.16 | ||||||||||||||||||
|
| |||||||||||||||||||||||
Income from investment operationsa: | ||||||||||||||||||||||||
Net investment incomeb | 0.20 | 0.29 | 0.26 | 0.28 | 0.38 | c | 0.22 | |||||||||||||||||
Net realized and unrealized gains (losses) | (0.56 | ) | 2.30 | 0.96 | (1.17 | ) | (0.75 | ) | 3.49 | |||||||||||||||
|
| |||||||||||||||||||||||
Total from investment operations | (0.36 | ) | 2.59 | 1.22 | (0.89 | ) | (0.37 | ) | 3.71 | |||||||||||||||
|
| |||||||||||||||||||||||
Less distributions from: | ||||||||||||||||||||||||
Net investment income | (0.35 | ) | (0.28 | ) | (0.31 | ) | (0.42 | ) | (0.25 | ) | (0.40) | |||||||||||||
Net realized gains | (1.31 | ) | — | (0.52 | ) | — | — | — | ||||||||||||||||
|
| |||||||||||||||||||||||
Total distributions | (1.66 | ) | (0.28 | ) | (0.83 | ) | (0.42 | ) | (0.25 | ) | (0.40) | |||||||||||||
|
| |||||||||||||||||||||||
Net asset value, end of period | $14.22 | $16.24 | $13.93 | $13.54 | $14.85 | $15.47 | ||||||||||||||||||
|
| |||||||||||||||||||||||
Total returnd | (2.39)% | 18.77% | 9.90% | (6.24)% | (2.53)% | 31.05% | ||||||||||||||||||
Ratios to average net assetse | ||||||||||||||||||||||||
Expenses | 0.82% | f | 0.82% | f,g | 0.82% | f | 0.80% | f | 0.78% | 0.78%g | ||||||||||||||
Net investment income | 2.51% | 1.94% | 2.01% | 1.96% | 2.46% | c | 1.62% | |||||||||||||||||
Supplemental data | ||||||||||||||||||||||||
Net assets, end of period (000’s) | $423,028 | $466,207 | $453,997 | $468,548 | $572,860 | $588,409 | ||||||||||||||||||
Portfolio turnover rate | 15.61% | 26.46% | 22.88% | 20.92% | 17.46% | 11.60% | ||||||||||||||||||
aThe amount shown for a share outstanding throughout the period may not correlate with the Statement of Operations for the period due to the timing of sales and repurchases of the Fund’s shares in relation to income earned and/or fluctuating fair value of the investments of the Fund.
bBased on average daily shares outstanding.
cNet investment income per share includes approximately $0.09 per share related to income received in the form of special dividends in connection with certain Fund holdings. Excluding this amount, the ratio of net investment income to average net assets would have been 1.88%.
dTotal return does not include fees, charges or expenses imposed by the variable annuity and life insurance contracts for which Franklin Templeton Variable Insurance Products Trust serves as an underlying investment vehicle. Total return is not annualized for periods less than one year.
eRatios are annualized for periods less than one year.
fBenefit of waiver and payments by affiliates rounds to less than 0.01%.
gBenefit of expense reduction rounds to less than 0.01%.
| The accompanying notes are an integral part of these financial statements. | Semiannual Report |
|
TG-7 |
|
FRANKLIN TEMPLETON VARIABLE INSURANCE PRODUCTS TRUST
FINANCIAL HIGHLIGHTS
Templeton Growth VIP Fund (continued)
Six Months Ended June 30, 2018 (unaudited) | Year Ended December 31, | |||||||||||||||||||||||
| 2017 | 2016 | 2015 | 2014 | 2013 | ||||||||||||||||||||
| ||||||||||||||||||||||||
Class 2 | ||||||||||||||||||||||||
Per share operating performance (for a share outstanding throughout the period) | ||||||||||||||||||||||||
Net asset value, beginning of period | $15.97 | $13.70 | $13.32 | $14.61 | $15.23 | $11.97 | ||||||||||||||||||
|
| |||||||||||||||||||||||
Income from investment operationsa: | ||||||||||||||||||||||||
Net investment incomeb | 0.18 | 0.25 | �� | 0.23 | 0.25 | 0.34 | c | 0.19 | ||||||||||||||||
Net realized and unrealized gains (losses) | (0.55 | ) | 2.26 | 0.94 | (1.16 | ) | (0.75 | ) | 3.44 | |||||||||||||||
|
| |||||||||||||||||||||||
Total from investment operations | (0.37 | ) | 2.51 | 1.17 | (0.91 | ) | (0.41 | ) | 3.63 | |||||||||||||||
|
| |||||||||||||||||||||||
Less distributions from: | ||||||||||||||||||||||||
Net investment income | (0.31 | ) | (0.24 | ) | (0.27 | ) | (0.38 | ) | (0.21 | ) | (0.37) | |||||||||||||
Net realized gains | (1.31 | ) | — | (0.52 | ) | — | — | — | ||||||||||||||||
|
| |||||||||||||||||||||||
Total distributions | (1.62 | ) | (0.24 | ) | (0.79 | ) | (0.38 | ) | (0.21 | ) | (0.37) | |||||||||||||
|
| |||||||||||||||||||||||
Net asset value, end of period | $13.98 | $15.97 | $13.70 | $13.32 | $14.61 | $15.23 | ||||||||||||||||||
|
| |||||||||||||||||||||||
Total returnd | (2.51)% | 18.50% | 9.62% | (6.49)% | (2.81)% | 30.82% | ||||||||||||||||||
Ratios to average net assetse | ||||||||||||||||||||||||
Expenses | 1.07% | f | 1.07% | f,g | 1.07% | f | 1.05% | f | 1.03% | 1.03%g | ||||||||||||||
Net investment income | 2.26% | 1.69% | 1.76% | 1.71% | 2.21% | c | 1.37% | |||||||||||||||||
Supplemental data | ||||||||||||||||||||||||
Net assets, end of period (000’s) | $782,451 | $879,521 | $876,128 | $921,895 | $1,171,896 | $1,450,304 | ||||||||||||||||||
Portfolio turnover rate | 15.61% | 26.46% | 22.88% | 20.92% | 17.46% | 11.60% | ||||||||||||||||||
aThe amount shown for a share outstanding throughout the period may not correlate with the Statement of Operations for the period due to the timing of sales and repurchases of the Fund’s shares in relation to income earned and/or fluctuating fair value of the investments of the Fund.
bBased on average daily shares outstanding.
cNet investment income per share includes approximately $0.09 per share related to income received in the form of special dividends in connection with certain Fund holdings. Excluding this amount, the ratio of net investment income to average net assets would have been 1.63%.
dTotal return does not include fees, charges or expenses imposed by the variable annuity and life insurance contracts for which Franklin Templeton Variable Insurance Products Trust serves as an underlying investment vehicle. Total return is not annualized for periods less than one year.
eRatios are annualized for periods less than one year.
fBenefit of waiver and payments by affiliates rounds to less than 0.01%.
gBenefit of expense reduction rounds to less than 0.01%.
TG-8 | Semiannual Report | The accompanying notes are an integral part of these financial statements. |
FRANKLIN TEMPLETON VARIABLE INSURANCE PRODUCTS TRUST
FINANCIAL HIGHLIGHTS
Templeton Growth VIP Fund (continued)
Six Months Ended June 30, 2018 (unaudited) | Year Ended December 31, | |||||||||||||||||||||||
| 2017 | 2016 | 2015 | 2014 | 2013 | ||||||||||||||||||||
| ||||||||||||||||||||||||
Class 4 | ||||||||||||||||||||||||
Per share operating performance (for a share outstanding throughout the period) | ||||||||||||||||||||||||
Net asset value, beginning of period | $16.13 | $13.83 | $13.44 | $14.73 | $15.35 | $12.07 | ||||||||||||||||||
|
| |||||||||||||||||||||||
Income from investment operationsa: | ||||||||||||||||||||||||
Net investment incomeb | 0.17 | 0.24 | 0.22 | 0.23 | 0.33 | c | 0.17 | |||||||||||||||||
Net realized and unrealized gains (losses) | (0.55 | ) | 2.28 | 0.94 | (1.16 | ) | (0.76 | ) | 3.47 | |||||||||||||||
|
| |||||||||||||||||||||||
Total from investment operations | (0.38 | ) | 2.52 | 1.16 | (0.93 | ) | (0.43 | ) | 3.64 | |||||||||||||||
|
| |||||||||||||||||||||||
Less distributions from: | ||||||||||||||||||||||||
Net investment income | (0.29 | ) | (0.22 | ) | (0.25 | ) | (0.36 | ) | (0.19 | ) | (0.36) | |||||||||||||
Net realized gains | (1.31 | ) | — | (0.52 | ) | — | — | — | ||||||||||||||||
|
| |||||||||||||||||||||||
Total distributions | (1.60 | ) | (0.22 | ) | (0.77 | ) | (0.36 | ) | (0.19 | ) | (0.36) | |||||||||||||
|
| |||||||||||||||||||||||
Net asset value, end of period | $14.15 | $16.13 | $13.83 | $13.44 | $14.73 | $15.35 | ||||||||||||||||||
|
| |||||||||||||||||||||||
Total returnd | (2.55)% | 18.38% | 9.47% | (6.54)% | (2.88)% | 30.64% | ||||||||||||||||||
Ratios to average net assetse | ||||||||||||||||||||||||
Expenses | 1.17% | f | 1.17% | f,g | 1.17% | f | 1.15% | f | 1.13% | 1.13%g | ||||||||||||||
Net investment income | 2.16% | 1.59% | 1.66% | 1.61% | 2.11% | c | 1.27% | |||||||||||||||||
Supplemental data | ||||||||||||||||||||||||
Net assets, end of period (000’s) | $34,436 | $38,798 | $43,286 | $47,777 | $59,989 | $72,683 | ||||||||||||||||||
Portfolio turnover rate | 15.61% | 26.46% | 22.88% | 20.92% | 17.46% | 11.60% | ||||||||||||||||||
aThe amount shown for a share outstanding throughout the period may not correlate with the Statement of Operations for the period due to the timing of sales and repurchases of the Fund’s shares in relation to income earned and/or fluctuating fair value of the investments of the Fund.
bBased on average daily shares outstanding.
cNet investment income per share includes approximately $0.09 per share related to income received in the form of special dividends in connection with certain Fund holdings. Excluding this amount, the ratio of net investment income to average net assets would have been 1.53%.
dTotal return does not include fees, charges or expenses imposed by the variable annuity and life insurance contracts for which Franklin Templeton Variable Insurance Products Trust serves as an underlying investment vehicle. Total return is not annualized for periods less than one year.
eRatios are annualized for periods less than one year.
fBenefit of waiver and payments by affiliates rounds to less than 0.01%.
gBenefit of expense reduction rounds to less than 0.01%.
| The accompanying notes are an integral part of these financial statements. | Semiannual Report |
|
TG-9 |
|
FRANKLIN TEMPLETON VARIABLE INSURANCE PRODUCTS TRUST
Statement of Investments, June 30, 2018 (unaudited)
Templeton Growth VIP Fund
| Country | Shares | Value | ||||||||
| ||||||||||
Common Stocks 98.0% | ||||||||||
Aerospace & Defense 1.1% | ||||||||||
BAE Systems PLC | United Kingdom | 1,565,162 | $ | 13,369,051 | ||||||
|
| |||||||||
Air Freight & Logistics 1.1% | ||||||||||
United Parcel Service Inc., B | United States | 127,570 | 13,551,761 | |||||||
|
| |||||||||
Automobiles 0.8% | ||||||||||
Hero Motocorp Ltd. | India | 199,170 | 10,105,419 | |||||||
|
| |||||||||
Banks 12.6% | ||||||||||
Bangkok Bank PCL, fgn | Thailand | 1,704,150 | 10,250,720 | |||||||
Bangkok Bank PCL, NVDR | Thailand | 913,600 | 5,412,388 | |||||||
Bank of Ireland Group PLC | Ireland | 792,800 | 6,192,101 | |||||||
Barclays PLC | United Kingdom | 2,662,560 | 6,645,574 | |||||||
BNP Paribas SA | France | 243,927 | 15,158,730 | |||||||
Citigroup Inc. | United States | 384,990 | 25,763,531 | |||||||
Credit Agricole SA | France | 626,216 | 8,366,297 | |||||||
HSBC Holdings PLC | United Kingdom | 2,362,494 | 22,161,414 | |||||||
ING Groep NV | Netherlands | 579,536 | 8,347,300 | |||||||
JPMorgan Chase & Co. | United States | 124,540 | 12,977,068 | |||||||
KB Financial Group Inc. | South Korea | 328,964 | 15,572,260 | |||||||
Standard Chartered PLC | United Kingdom | 2,125,883 | 19,444,336 | |||||||
|
| |||||||||
| 156,291,719 | ||||||||||
|
| |||||||||
Beverages 0.8% | ||||||||||
Suntory Beverage & Food Ltd. | Japan | 232,900 | 9,951,823 | |||||||
|
| |||||||||
Biotechnology 2.5% | ||||||||||
Amgen Inc. | United States | 35,375 | 6,529,871 | |||||||
a Celgene Corp. | United States | 60,320 | 4,790,614 | |||||||
Gilead Sciences Inc. | United States | 283,260 | 20,066,139 | |||||||
|
| |||||||||
| 31,386,624 | ||||||||||
|
| |||||||||
Building Products 0.7% | ||||||||||
Compagnie de Saint-Gobain | France | 187,590 | 8,387,666 | |||||||
|
| |||||||||
Capital Markets 1.9% | ||||||||||
Man Group PLC | United Kingdom | 2,385,372 | 5,563,116 | |||||||
UBS Group AG | Switzerland | 1,096,280 | 16,963,339 | |||||||
Value Partners Group Ltd. | Hong Kong | 2,079,300 | 1,643,076 | |||||||
|
| |||||||||
| 24,169,531 | ||||||||||
|
| |||||||||
Chemicals 1.2% | ||||||||||
Akzo Nobel NV | Netherlands | 169,645 | 14,532,371 | |||||||
|
| |||||||||
Communications Equipment 1.6% | ||||||||||
a CommScope Holding Co. Inc. | United States | 270,890 | 7,911,343 | |||||||
Ericsson, B | Sweden | 1,247,952 | 9,655,070 | |||||||
a NetScout Systems Inc. | United States | 86,600 | 2,572,020 | |||||||
|
| |||||||||
| 20,138,433 | ||||||||||
|
| |||||||||
Construction Materials 0.5% | ||||||||||
Taiheiyo Cement Corp. | Japan | 191,970 | 6,321,249 | |||||||
|
| |||||||||
Consumer Finance 1.7% | ||||||||||
Ally Financial Inc. | United States | 160,390 | 4,213,445 | |||||||
Capital One Financial Corp. | United States | 187,470 | 17,228,493 | |||||||
|
| |||||||||
| 21,441,938 | ||||||||||
|
| |||||||||
Diversified Financial Services 0.6% | ||||||||||
Voya Financial Inc. | United States | 157,941 | 7,423,227 | |||||||
|
| |||||||||
TG-10 | Semiannual Report |
FRANKLIN TEMPLETON VARIABLE INSURANCE PRODUCTS TRUST
STATEMENT OF INVESTMENTS (UNAUDITED)
Templeton Growth VIP Fund (continued)
| Country | Shares | Value | ||||||||
| ||||||||||
Common Stocks (continued) | ||||||||||
Diversified Telecommunication Services 3.5% | ||||||||||
b China Telecom Corp. Ltd., ADR | China | 269,865 | $ | 12,529,832 | ||||||
China Telecom Corp. Ltd., H | China | 2,006,000 | 938,309 | |||||||
Singapore Telecommunications Ltd. | Singapore | 9,169,600 | 20,729,104 | |||||||
Telefonica SA | Spain | 1,008,135 | 8,573,603 | |||||||
|
| |||||||||
| 42,770,848 | ||||||||||
|
| |||||||||
Electrical Equipment 1.0% | ||||||||||
Vestas Wind Systems AS | Denmark | 193,200 | 11,967,257 | |||||||
|
| |||||||||
Energy Equipment & Services 0.3% | ||||||||||
Helmerich & Payne Inc. | United States | 63,820 | 4,069,163 | |||||||
|
| |||||||||
Food & Staples Retailing 1.6% | ||||||||||
The Kroger Co. | United States | 44,600 | 1,268,870 | |||||||
Seven & i Holdings Co. Ltd. | Japan | 166,400 | 7,262,102 | |||||||
Walgreens Boots Alliance Inc. | United States | 193,029 | 11,584,635 | |||||||
|
| |||||||||
| 20,115,607 | ||||||||||
|
| |||||||||
Food Products 0.7% | ||||||||||
Kellogg Co. | United States | 116,730 | 8,155,925 | |||||||
|
| |||||||||
Health Care Equipment & Supplies 1.6% | ||||||||||
Arjo AB, B | Sweden | 1,057,200 | 3,773,142 | |||||||
Getinge AB, B | Sweden | 1,057,200 | 9,624,758 | |||||||
Medtronic PLC | United States | 74,440 | 6,372,808 | |||||||
|
| |||||||||
| 19,770,708 | ||||||||||
|
| |||||||||
Health Care Providers & Services 2.0% | ||||||||||
AmerisourceBergen Corp. | United States | 168,500 | 14,367,995 | |||||||
Cardinal Health Inc. | United States | 207,060 | 10,110,740 | |||||||
|
| |||||||||
| 24,478,735 | ||||||||||
|
| |||||||||
Household Durables 1.4% | ||||||||||
Panasonic Corp. | Japan | 1,255,690 | 16,941,804 | |||||||
|
| |||||||||
Industrial Conglomerates 2.6% | ||||||||||
CK Hutchison Holdings Ltd. | Hong Kong | 1,114,010 | 11,813,031 | |||||||
Siemens AG | Germany | 150,912 | 19,962,728 | |||||||
|
| |||||||||
| 31,775,759 | ||||||||||
|
| |||||||||
Insurance 4.1% | ||||||||||
Aegon NV | Netherlands | 2,921,736 | 17,532,302 | |||||||
AXA SA | France | 722,148 | 17,730,810 | |||||||
China Life Insurance Co. Ltd., H | China | 6,041,230 | 15,591,910 | |||||||
|
| |||||||||
| 50,855,022 | ||||||||||
|
| |||||||||
Internet Software & Services 2.9% | ||||||||||
a Alphabet Inc., A | United States | 15,190 | 17,152,396 | |||||||
a Baidu Inc., ADR | China | 76,100 | 18,492,300 | |||||||
|
| |||||||||
| 35,644,696 | ||||||||||
|
| |||||||||
Leisure Products 1.0% | ||||||||||
Mattel Inc. | United States | 722,640 | 11,865,749 | |||||||
|
| |||||||||
Life Sciences Tools & Services 0.6% | ||||||||||
a QIAGEN NV | Netherlands | 205,690 | 7,497,919 | |||||||
|
| |||||||||
Machinery 1.4% | ||||||||||
a Navistar International Corp. | United States | 438,140 | 17,841,061 | |||||||
|
| |||||||||
| Semiannual Report |
|
TG-11 |
|
FRANKLIN TEMPLETON VARIABLE INSURANCE PRODUCTS TRUST
STATEMENT OF INVESTMENTS (UNAUDITED)
Templeton Growth VIP Fund (continued)
| Country | Shares | Value | ||||||||
| ||||||||||
Common Stocks (continued) | ||||||||||
Media 4.4% | ||||||||||
Comcast Corp., A | United States | 455,054 | $ | 14,930,322 | ||||||
SES SA, IDR | Luxembourg | 1,571,620 | 28,810,013 | |||||||
Twenty-First Century Fox Inc., A. | United States | 218,492 | 10,856,867 | |||||||
|
| |||||||||
| 54,597,202 | ||||||||||
|
| |||||||||
Metals & Mining 2.1% | ||||||||||
Barrick Gold Corp. | Canada | 865,310 | 11,361,520 | |||||||
Wheaton Precious Metals Corp. | Canada | 689,844 | 15,233,049 | |||||||
|
| |||||||||
| 26,594,569 | ||||||||||
|
| |||||||||
Multi-Utilities 2.4% | ||||||||||
E.ON SE | Germany | 590,630 | 6,316,833 | |||||||
innogy SE | Germany | 212,620 | 9,114,331 | |||||||
Veolia Environnement SA | France | 693,260 | 14,846,756 | |||||||
|
| |||||||||
| 30,277,920 | ||||||||||
|
| |||||||||
Oil, Gas & Consumable Fuels 10.9% | ||||||||||
Apache Corp. | United States | 413,010 | 19,308,217 | |||||||
BP PLC | United Kingdom | 3,841,161 | 29,335,060 | |||||||
ConocoPhillips | United States | 81,210 | 5,653,840 | |||||||
Eni SpA | Italy | 1,331,279 | 24,740,190 | |||||||
Exxon Mobil Corp. | United States | 39,050 | 3,230,607 | |||||||
Husky Energy Inc. | Canada | 719,150 | 11,212,436 | |||||||
Kunlun Energy Co. Ltd. | China | 10,519,540 | 9,210,907 | |||||||
Royal Dutch Shell PLC, B | United Kingdom | 913,539 | 32,736,194 | |||||||
|
| |||||||||
| 135,427,451 | ||||||||||
|
| |||||||||
Personal Products 1.4% | ||||||||||
Coty Inc., A | United States | 1,211,910 | 17,087,931 | |||||||
|
| |||||||||
Pharmaceuticals 11.7% | ||||||||||
Allergan PLC | United States | 144,924 | 24,161,729 | |||||||
Bayer AG | Germany | 141,926 | 15,645,046 | |||||||
Eli Lilly & Co. | United States | 192,470 | 16,423,465 | |||||||
Merck KGaA | Germany | 163,224 | 15,946,565 | |||||||
Novartis AG | Switzerland | 41,900 | 3,184,806 | |||||||
Perrigo Co. PLC | United States | 192,570 | 14,040,279 | |||||||
Roche Holding AG | Switzerland | 45,563 | 10,146,324 | |||||||
Sanofi | France | 199,167 | 15,974,633 | |||||||
Teva Pharmaceutical Industries Ltd., ADR | Israel | 1,230,810 | 29,933,299 | |||||||
|
| |||||||||
| 145,456,146 | ||||||||||
|
| |||||||||
Real Estate Management & Development 1.0% | ||||||||||
Mitsui Fudosan Co. Ltd. | Japan | 513,520 | 12,404,828 | |||||||
|
| |||||||||
Software 2.7% | ||||||||||
Microsoft Corp. | United States | 106,789 | 10,530,438 | |||||||
Oracle Corp. | United States | 519,600 | 22,893,576 | |||||||
|
| |||||||||
| 33,424,014 | ||||||||||
|
| |||||||||
Specialty Retail 3.0% | ||||||||||
Advance Auto Parts Inc. | United States | 154,170 | 20,920,869 | |||||||
Kingfisher PLC | United Kingdom | 4,237,152 | 16,618,881 | |||||||
|
| |||||||||
| 37,539,750 | ||||||||||
|
| |||||||||
TG-12 | Semiannual Report |
FRANKLIN TEMPLETON VARIABLE INSURANCE PRODUCTS TRUST
STATEMENT OF INVESTMENTS (UNAUDITED)
Templeton Growth VIP Fund (continued)
| Country | Shares | Value | ||||||||
| ||||||||||
Common Stocks (continued) | ||||||||||
Technology Hardware, Storage & Peripherals 2.9% | ||||||||||
Apple Inc. | United States | 71,001 | $ | 13,142,995 | ||||||
Samsung Electronics Co. Ltd. | South Korea | 532,970 | 22,290,703 | |||||||
|
| |||||||||
| 35,433,698 | ||||||||||
|
| |||||||||
Wireless Telecommunication Services 3.7% | ||||||||||
Bharti Airtel Ltd. | India | 1,500,058 | 8,369,079 | |||||||
China Mobile Ltd. | China | 1,390,300 | 12,350,662 | |||||||
SoftBank Group Corp. | Japan | 154,450 | 11,124,530 | |||||||
Vodafone Group PLC | United Kingdom | 5,744,853 | 13,945,785 | |||||||
|
| |||||||||
| 45,790,056 | ||||||||||
|
| |||||||||
Total Common Stocks (Cost $1,069,627,450) | 1,214,854,630 | |||||||||
|
| |||||||||
| Principal Amount | ||||||||||
Corporate Bonds (Cost $6,457,527) 0.6% | ||||||||||
Oil, Gas & Consumable Fuels 0.6% | ||||||||||
c Chesapeake Energy Corp., secured note, second lien, 144A, 8.00%, 12/15/22 | United States | $ | 6,893,000 | 7,261,431 | ||||||
|
| |||||||||
Total Investments before Short Term Investments | 1,222,116,061 | |||||||||
|
| |||||||||
Short Term Investments 1.0% | ||||||||||
U.S. Government and Agency Securities (Cost $599,949) 0.0%† | ||||||||||
d FHLB, 7/02/18 | United States | 600,000 | 600,000 | |||||||
|
| |||||||||
Time Deposits (Cost $10,800,000) 0.9% | ||||||||||
Royal Bank of Canada, 1.85%, 7/02/18 | United States | 10,800,000 | 10,800,000 | |||||||
|
| |||||||||
| Shares | ||||||||||
e Investments from Cash Collateral Received for Loaned Securities (Cost $849,950) 0.1% | ||||||||||
Money Market Funds 0.1% | ||||||||||
f,g Institutional Fiduciary Trust Money Market Portfolio, 1.51% | United States | 849,950 | 849,950 | |||||||
|
| |||||||||
Total Investments (Cost $1,088,334,876) 99.6% | 1,234,366,011 | |||||||||
Other Assets, less Liabilities 0.4% | 5,548,615 | |||||||||
|
| |||||||||
Net Assets 100.0% | $ | 1,239,914,626 | ||||||||
|
| |||||||||
See Abbreviations on page TG-23.
†Rounds to less than 0.1% of net assets.
aNon-income producing.
bA portion or all of the security is on loan at June 30, 2018. See Note 1(c).
cSecurity was purchased pursuant to Rule 144A under the Securities Act of 1933 and may be sold in transactions exempt from registration only to qualified institutional buyers or in a public offering registered under the Securities Act of 1933. This security has been deemed liquid under guidelines approved by the Trust’s Board of Trustees.
dThe security was issued on a discount basis with no stated coupon rate.
eSee Note 1(c) regarding securities on loan.
fSee Note 3(e) regarding investments in affiliated management investment companies.
gThe rate shown is the annualized seven-day effective yield at period end.
| The accompanying notes are an integral part of these financial statements. | Semiannual Report |
|
TG-13 |
|
FRANKLIN TEMPLETON VARIABLE INSURANCE PRODUCTS TRUST
Financial Statements
Statement of Assets and Liabilities
June 30, 2018 (unaudited)
Templeton Growth VIP Fund | ||||
Assets: | ||||
Investments in securities: | ||||
Cost - Unaffiliated issuers | $1,087,484,926 | |||
Cost - Non-controlled affiliates (Note 3e) | 849,950 | |||
|
| |||
Value - Unaffiliated issuers + | $1,233,516,061 | |||
Value - Non-controlled affiliates (Note 3e) | 849,950 | |||
Receivables: | ||||
Investment securities sold | 4,355,861 | |||
Capital shares sold | 163,425 | |||
Dividends and interest | 4,002,573 | |||
European Union tax reclaims | 820,169 | |||
Other assets | 920 | |||
|
| |||
Total assets | 1,243,708,959 | |||
|
| |||
Liabilities: | ||||
Payables: | ||||
Investment securities purchased | 617,762 | |||
Capital shares redeemed | 456,796 | |||
Management fees | 811,465 | |||
Distribution fees | 358,083 | |||
Funds advanced by custodian | 413,500 | |||
Payable upon return of securities loaned | 849,950 | |||
Accrued expenses and other liabilities | 286,777 | |||
|
| |||
Total liabilities | 3,794,333 | |||
|
| |||
Net assets, at value | $1,239,914,626 | |||
|
| |||
Net assets consist of: | ||||
Paid-in capital | $ 984,805,933 | |||
Undistributed net investment income | 16,172,733 | |||
Net unrealized appreciation (depreciation) | 146,013,189 | |||
Accumulated net realized gain (loss) | 92,922,771 | |||
|
| |||
Net assets, at value | $1,239,914,626 | |||
|
| |||
| Class 1: | ||||
Net assets, at value | $ 423,028,201 | |||
|
| |||
Shares outstanding | 29,749,018 | |||
|
| |||
Net asset value and maximum offering price per share | $14.22 | |||
|
| |||
| Class 2: | ||||
Net assets, at value | $ 782,450,814 | |||
|
| |||
Shares outstanding | 55,970,263 | |||
|
| |||
Net asset value and maximum offering price per share | $13.98 | |||
|
| |||
| Class 4: | ||||
Net assets, at value | $ 34,435,611 | |||
|
| |||
Shares outstanding | 2,433,865 | |||
|
| |||
Net asset value and maximum offering price per share | $14.15 | |||
|
| |||
+Includes securities loaned | $ 826,454 | |||
TG-14 | Semiannual Report | The accompanying notes are an integral part of these financial statements. |
FRANKLIN TEMPLETON VARIABLE INSURANCE PRODUCTS TRUST
FINANCIAL STATEMENTS
Statement of Operations
for the six months ended June 30, 2018 (unaudited)
| Templeton Growth VIP Fund | ||||
Investment income: | ||||
Dividends: (net of foreign taxes)* | ||||
Unaffiliated issuers | $ 21,327,965 | |||
Interest: | ||||
Unaffiliated issuers | 468,878 | |||
Income from securities loaned (net of fees and rebates) | 77,845 | |||
|
| |||
Total investment income | 21,874,688 | |||
|
| |||
Expenses: | ||||
Management fees (Note 3a) | 5,151,038 | |||
Distribution fees: (Note 3c) | ||||
Class 2 | 1,042,948 | |||
Class 4 | 63,849 | |||
Custodian fees (Note 4) | 53,178 | |||
Reports to shareholders | 92,680 | |||
Professional fees | 72,685 | |||
Trustees’ fees and expenses | 3,457 | |||
Other | 19,735 | |||
|
| |||
Total expenses | 6,499,570 | |||
Expenses waived/paid by affiliates (Note 3e) | (13,064 | ) | ||
|
| |||
Net expenses | 6,486,506 | |||
|
| |||
Net investment income | 15,388,182 | |||
|
| |||
Realized and unrealized gains (losses): | ||||
Net realized gain (loss) from: | ||||
Investments: | ||||
Unaffiliated issuers | 99,170,841 | |||
Foreign currency transactions | (206,642 | ) | ||
|
| |||
Net realized gain (loss) | 98,964,199 | |||
|
| |||
Net change in unrealized appreciation (depreciation) on: | ||||
Investments: | ||||
Unaffiliated issuers | (145,334,986 | ) | ||
Translation of other assets and liabilities denominated in foreign currencies | (157,977 | ) | ||
Change in deferred taxes on unrealized appreciation | 61,785 | |||
|
| |||
Net change in unrealized appreciation (depreciation) | (145,431,178 | ) | ||
|
| |||
Net realized and unrealized gain (loss) | (46,466,979 | ) | ||
|
| |||
Net increase (decrease) in net assets resulting from operations | $ (31,078,797 | ) | ||
|
| |||
*Foreign taxes withheld on dividends | $ 1,991,319 | |||
| The accompanying notes are an integral part of these financial statements. | Semiannual Report |
|
TG-15 |
|
FRANKLIN TEMPLETON VARIABLE INSURANCE PRODUCTS TRUST
FINANCIAL STATEMENTS
Statements of Changes in Net Assets
Templeton Growth VIP Fund | ||||||||
| Six Months Ended June 30, 2018 (unaudited) | Year Ended December 31, 2017 | |||||||
Increase (decrease) in net assets: | ||||||||
Operations: | ||||||||
Net investment income | $ 15,388,182 | $ 24,695,547 | ||||||
Net realized gain (loss) | 98,964,199 | 117,077,131 | ||||||
Net change in unrealized appreciation (depreciation) | (145,431,178 | ) | 96,156,461 | |||||
|
| |||||||
Net increase (decrease) in net assets resulting from operations | (31,078,797 | ) | 237,929,139 | |||||
|
| |||||||
Distributions to shareholders from: | ||||||||
Net investment income: | ||||||||
Class 1 | (9,443,906 | ) | (8,645,537 | ) | ||||
Class 2 | (15,736,729 | ) | (14,420,565 | ) | ||||
Class 4 | (638,119 | ) | (607,359 | ) | ||||
Net realized gains: | ||||||||
Class 1 | (35,064,775 | ) | — | |||||
Class 2 | (66,647,585 | ) | — | |||||
Class 4 | (2,903,936 | ) | — | |||||
|
| |||||||
Total distributions to shareholders | (130,435,050 | ) | (23,673,461 | ) | ||||
|
| |||||||
Capital share transactions: (Note 2) | ||||||||
Class 1 | 11,297,942 | (59,747,929 | ) | |||||
Class 2 | 5,574,536 | (132,483,391 | ) | |||||
Class 4 | 30,208 | (10,910,240 | ) | |||||
|
| |||||||
Total capital share transactions | 16,902,686 | (203,141,560 | ) | |||||
|
| |||||||
Net increase (decrease) in net assets | (144,611,161 | ) | 11,114,118 | |||||
Net assets: | ||||||||
Beginning of period | 1,384,525,787 | 1,373,411,669 | ||||||
|
| |||||||
End of period | $1,239,914,626 | $1,384,525,787 | ||||||
|
| |||||||
Undistributed net investment income included in net assets: | ||||||||
End of period | $ 16,172,733 | $ 26,603,305 | ||||||
|
| |||||||
TG-16 | Semiannual Report | The accompanying notes are an integral part of these financial statements. |
FRANKLIN TEMPLETON VARIABLE INSURANCE PRODUCTS TRUST
Notes to Financial Statements (unaudited)
Templeton Growth VIP Fund
1. Organization and Significant Accounting Policies
Franklin Templeton Variable Insurance Products Trust (Trust) is registered under the Investment Company Act of 1940 (1940 Act) as an open-end management investment company, consisting of eighteen separate funds and applies the specialized accounting and reporting guidance in U.S. Generally Accepted Accounting Principles (U.S. GAAP). Templeton Growth VIP Fund (Fund) is included in this report. Shares of the Fund are generally sold only to insurance company separate accounts to fund the benefits of variable life insurance policies or variable annuity contracts. The Fund offers three classes of shares: Class 1, Class 2 and Class 4. Each class of shares may differ by its distribution fees, voting rights on matters affecting a single class and its exchange privilege.
The following summarizes the Fund’s significant accounting policies.
a. Financial Instrument Valuation
The Fund’s investments in financial instruments are carried at fair value daily. Fair value is the price that would be received to sell an asset or paid to transfer a liability in an orderly transaction between market participants on the measurement date. The Fund calculates the net asset value (NAV) per share each business day as of 4 p.m. Eastern time or the regularly scheduled close of the New York Stock Exchange (NYSE), whichever is earlier. Under compliance policies and procedures approved by the Trust’s Board of Trustees (the Board), the Fund’s administrator has responsibility for oversight of valuation, including leading the cross-functional Valuation Committee (VC). The VC provides administration and oversight of the Fund’s valuation policies and procedures, which are approved annually by the Board. Among other things, these procedures allow the Fund to utilize independent pricing services, quotations from securities and financial instrument dealers, and other market sources to determine fair value.
Equity securities listed on an exchange or on the NASDAQ National Market System are valued at the last quoted sale price or the official closing price of the day, respectively. Foreign equity securities are valued as of the close of trading on the foreign stock exchange on which the security is primarily traded, or as of 4 p.m. Eastern time. The value is then converted into its U.S. dollar equivalent at the foreign exchange rate in effect at 4 p.m. Eastern time on the day that the value of the security is determined. Over-the-counter (OTC) securities are
valued within the range of the most recent quoted bid and ask prices. Securities that trade in multiple markets or on multiple exchanges are valued according to the broadest and most representative market. Certain equity securities are valued based upon fundamental characteristics or relationships to similar securities.
Debt securities generally trade in the OTC market rather than on a securities exchange. The Fund’s pricing services use multiple valuation techniques to determine fair value. In instances where sufficient market activity exists, the pricing services may utilize a market-based approach through which quotes from market makers are used to determine fair value. In instances where sufficient market activity may not exist or is limited, the pricing services also utilize proprietary valuation models which may consider market characteristics such as benchmark yield curves, credit spreads, estimated default rates, anticipated market interest rate volatility, coupon rates, anticipated timing of principal repayments, underlying collateral, and other unique security features in order to estimate the relevant cash flows, which are then discounted to calculate the fair value.
Investments in open-end mutual funds are valued at the closing NAV. Investments in time deposits are valued at cost, which approximates fair value.
The Fund has procedures to determine the fair value of financial instruments for which market prices are not reliable or readily available. Under these procedures, the VC convenes on a regular basis to review such financial instruments and considers a number of factors, including significant unobservable valuation inputs, when arriving at fair value. The VC primarily employs a market-based approach which may use related or comparable assets or liabilities, recent transactions, market multiples, book values, and other relevant information for the investment to determine the fair value of the investment. An income-based valuation approach may also be used in which the anticipated future cash flows of the investment are discounted to calculate fair value. Discounts may also be applied due to the nature or duration of any restrictions on the disposition of the investments. Due to the inherent uncertainty of valuations of such investments, the fair values may differ significantly from the values that would have been used had an active market existed. The VC employs various methods for calibrating these valuation approaches including a regular review of key inputs and assumptions, transactional back-testing or disposition analysis, and reviews of any related market activity.
| Semiannual Report |
|
TG-17 |
|
FRANKLIN TEMPLETON VARIABLE INSURANCE PRODUCTS TRUST
NOTES TO FINANCIAL STATEMENTS (UNAUDITED)
Templeton Growth VIP Fund (continued)
1. Organization and Significant Accounting
Policies (continued)
a. Financial Instrument Valuation (continued)
Trading in securities on foreign securities stock exchanges and OTC markets may be completed before 4 p.m. Eastern time. In addition, trading in certain foreign markets may not take place on every Fund’s business day. Occasionally, events occur between the time at which trading in a foreign security is completed and 4 p.m. Eastern time that might call into question the reliability of the value of a portfolio security held by the Fund. As a result, differences may arise between the value of the Fund’s portfolio securities as determined at the foreign market close and the latest indications of value at 4 p.m. Eastern time. In order to minimize the potential for these differences, the VC monitors price movements following the close of trading in foreign stock markets through a series of country specific market proxies (such as baskets of American Depositary Receipts, futures contracts and exchange traded funds). These price movements are measured against established trigger thresholds for each specific market proxy to assist in determining if an event has occurred that may call into question the reliability of the values of the foreign securities held by the Fund. If such an event occurs, the securities may be valued using fair value procedures, which may include the use of independent pricing services.
When the last day of the reporting period is a non-business day, certain foreign markets may be open on those days that the Fund’s NAV is not calculated, which could result in differences between the value of the Fund’s portfolio securities on the last business day and the last calendar day of the reporting period. Any significant security valuation changes due to an open foreign market are adjusted and reflected by the Fund for financial reporting purposes.
b. Foreign Currency Translation
Portfolio securities and other assets and liabilities denominated in foreign currencies are translated into U.S. dollars based on the exchange rate of such currencies against U.S. dollars on the date of valuation. The Fund may enter into foreign currency exchange contracts to facilitate transactions denominated in a foreign currency. Purchases and sales of securities, income and expense items denominated in foreign currencies are translated into U.S. dollars at the exchange rate in effect on the transaction date. Portfolio securities and assets and liabilities denominated in foreign currencies contain risks that those currencies will
decline in value relative to the U.S. dollar. Occasionally, events may impact the availability or reliability of foreign exchange rates used to convert the U.S. dollar equivalent value. If such an event occurs, the foreign exchange rate will be valued at fair value using procedures established and approved by the Board.
The Fund does not separately report the effect of changes in foreign exchange rates from changes in market prices on securities held. Such changes are included in net realized and unrealized gain or loss from investments in the Statement of Operations.
Realized foreign exchange gains or losses arise from sales of foreign currencies, currency gains or losses realized between the trade and settlement dates on securities transactions and the difference between the recorded amounts of dividends, interest, and foreign withholding taxes and the U.S. dollar equivalent of the amounts actually received or paid. Net unrealized foreign exchange gains and losses arise from changes in foreign exchange rates on foreign denominated assets and liabilities other than investments in securities held at the end of the reporting period.
c. Securities Lending
The Fund participates in an agency based securities lending program to earn additional income. The Fund receives cash collateral against the loaned securities in an amount equal to at least 102% of the fair value of the loaned securities. Collateral is maintained over the life of the loan in an amount not less than 100% of the fair value of loaned securities, as determined at the close of Fund business each day; any additional collateral required due to changes in security values is delivered to the Fund on the next business day. The collateral is deposited into a joint cash account with other funds and is used to invest in a money market fund managed by Franklin Advisers, Inc., an affiliate of the Fund. The Fund may receive income from the investment of cash collateral, in addition to lending fees and rebates paid by the borrower. Income from securities loaned, net of fees paid to the securities lending agent and/or third-party vendor, is reported separately in the Statement of Operations. The Fund bears the market risk with respect to the collateral investment, securities loaned, and the risk that the agent may default on its obligations to the Fund. If the borrower defaults on its obligation to return the securities loaned, the Fund has the
TG-18 | Semiannual Report |
FRANKLIN TEMPLETON VARIABLE INSURANCE PRODUCTS TRUST
NOTES TO FINANCIAL STATEMENTS (UNAUDITED)
Templeton Growth VIP Fund (continued)
right to repurchase the securities in the open market using the collateral received. The securities lending agent has agreed to indemnify the Fund in the event of default by a third party borrower.
d. Income and Deferred Taxes
It is the Fund’s policy to qualify as a regulated investment company under the Internal Revenue Code. The Fund intends to distribute to shareholders substantially all of its taxable income and net realized gains to relieve it from federal income and if applicable, excise taxes. As a result, no provision for U.S. federal income taxes is required.
The Fund may be subject to foreign taxation related to income received, capital gains on the sale of securities and certain foreign currency transactions in the foreign jurisdictions in which it invests. Foreign taxes, if any, are recorded based on the tax regulations and rates that exist in the foreign markets in which the Fund invests. When a capital gain tax is determined to apply, the Fund records an estimated deferred tax liability in an amount that would be payable if the securities were disposed of on the valuation date.
As a result of several court cases, in certain countries across the European Union, the Fund filed additional tax reclaims for previously withheld taxes on dividends earned in those countries (EU reclaims). These additional filings are subject to various administrative proceedings by the local jurisdictions’ tax authorities within the European Union, as well as a number of related judicial proceedings. Income recognized, if any, for EU reclaims is reflected as other income in the Statement of Operations and any related receivable, if any, is reflected as European Union tax reclaims in the Statement of Assets and Liabilities. When uncertainty exists as to the ultimate resolution of these proceedings, the likelihood of receipt of these EU reclaims, and the potential timing of payment, no amounts are reflected in the financial statements. For U.S. income tax purposes, when EU reclaims are received by the Fund and the Fund previously passed foreign tax credit on to its shareholders, the Fund must either amend historic tax reporting to shareholders or enter into a closing agreement with the Internal Revenue Service (IRS) in order to pay the associated tax liability on behalf of the Fund’s shareholders.
The Fund may recognize an income tax liability related to its uncertain tax positions under U.S. GAAP when the uncertain tax position has a less than 50% probability that it will be
sustained upon examination by the tax authorities based on its technical merits. As of June 30, 2018, the Fund has determined that no tax liability is required in its financial statements related to uncertain tax positions for any open tax years (or expected to be taken in future tax years). Open tax years are those that remain subject to examination and are based on the statute of limitations in each jurisdiction in which the Fund invests.
e. Security Transactions, Investment Income, Expenses and Distributions
Security transactions are accounted for on trade date. Realized gains and losses on security transactions are determined on a specific identification basis. Interest income and estimated expenses are accrued daily. Amortization of premium and accretion of discount on debt securities are included in interest income. Dividend income is recorded on the ex-dividend date except for certain dividends from securities where the dividend rate is not available. In such cases, the dividend is recorded as soon as the information is received by the Fund. Distributions to shareholders are recorded on the ex-dividend date. Distributable earnings are determined according to income tax regulations (tax basis) and may differ from earnings recorded in accordance with U.S. GAAP. These differences may be permanent or temporary. Permanent differences are reclassified among capital accounts to reflect their tax character. These reclassifications have no impact on net assets or the results of operations. Temporary differences are not reclassified, as they may reverse in subsequent periods.
Common expenses incurred by the Trust are allocated among the Funds based on the ratio of net assets of each Fund to the combined net assets of the Trust or based on the ratio of number of shareholders of each Fund to the combined number of shareholders of the Trust. Fund specific expenses are charged directly to the Fund that incurred the expense.
Realized and unrealized gains and losses and net investment income, excluding class specific expenses, are allocated daily to each class of shares based upon the relative proportion of net assets of each class. Differences in per share distributions by class are generally due to differences in class specific expenses.
f. Accounting Estimates
The preparation of financial statements in accordance with U.S. GAAP requires management to make estimates and assumptions that affect the reported amounts of assets and
| Semiannual Report |
|
TG-19 |
|
FRANKLIN TEMPLETON VARIABLE INSURANCE PRODUCTS TRUST
NOTES TO FINANCIAL STATEMENTS (UNAUDITED)
Templeton Growth VIP Fund (continued)
1. Organization and Significant Accounting
Policies (continued)
f. Accounting Estimates (continued)
liabilities at the date of the financial statements and the amounts of income and expenses during the reporting period. Actual results could differ from those estimates.
g. Guarantees and Indemnifications
Under the Trust’s organizational documents, its officers and trustees are indemnified by the Trust against certain liabilities arising out of the performance of their duties to the Trust.
Additionally, in the normal course of business, the Trust, on behalf of the Fund, enters into contracts with service providers that contain general indemnification clauses. The Trust’s maximum exposure under these arrangements is unknown as this would involve future claims that may be made against the Trust that have not yet occurred. Currently, the Trust expects the risk of loss to be remote.
2. Shares of Beneficial Interest
At June 30, 2018, there were an unlimited number of shares authorized (without par value). Transactions in the Fund’s shares were as follows:
Six Months Ended June 30, 2018 | Year Ended December 31, 2017 | |||||||||||||||||||
|
| |||||||||||||||||||
| Shares | Amount | Shares | Amount | |||||||||||||||||
| ||||||||||||||||||||
| Class 1 Shares: | ||||||||||||||||||||
Shares sold | 74,424 | $ | 1,212,566 | 276,995 | $ | 4,131,560 | ||||||||||||||
Shares issued in reinvestment of distributions | 3,065,336 | 44,508,681 | 578,684 | 8,645,537 | ||||||||||||||||
Shares redeemed | (2,093,901 | ) | (34,423,305 | ) | (4,745,568 | ) | (72,525,026) | |||||||||||||
|
| |||||||||||||||||||
Net increase (decrease) | 1,045,859 | $ | 11,297,942 | (3,889,889 | ) | $ | (59,747,929) | |||||||||||||
|
| |||||||||||||||||||
| Class 2 Shares: | ||||||||||||||||||||
Shares sold | 801,771 | $ | 12,691,363 | 1,016,363 | $ | 15,049,406 | ||||||||||||||
Shares issued in reinvestment of distributions | 5,773,253 | 82,384,314 | 980,324 | 14,420,565 | ||||||||||||||||
Shares redeemed | (5,668,385 | ) | (89,501,141 | ) | (10,869,278 | ) | (161,953,362) | |||||||||||||
|
| |||||||||||||||||||
Net increase (decrease) | 906,639 | $ | 5,574,536 | (8,872,591 | ) | $ | (132,483,391) | |||||||||||||
|
| |||||||||||||||||||
| Class 4 Shares: | ||||||||||||||||||||
Shares sold | 54,800 | $ | 867,228 | 26,043 | $ | 392,232 | ||||||||||||||
Shares issued in reinvestment of distributions | 245,125 | 3,542,055 | 40,845 | 607,359 | ||||||||||||||||
Shares redeemed | (271,135 | ) | (4,379,075 | ) | (791,302 | ) | (11,909,831) | |||||||||||||
|
| |||||||||||||||||||
Net increase (decrease) | 28,790 | $ | 30,208 | (724,414 | ) | $ | (10,910,240) | |||||||||||||
|
| |||||||||||||||||||
3. Transactions with Affiliates
Franklin Resources, Inc. is the holding company for various subsidiaries that together are referred to as Franklin Templeton Investments. Certain officers and trustees of the Fund are also officers and/or directors of the following subsidiaries:
| Subsidiary | Affiliation | |
Templeton Global Advisors Limited (TGAL) | Investment manager | |
Franklin Templeton Services, LLC (FT Services) | Administrative manager | |
Franklin Templeton Distributors, Inc. (Distributors) | Principal underwriter | |
Franklin Templeton Investor Services, LLC (Investor Services) | Transfer agent |
TG-20 | Semiannual Report |
FRANKLIN TEMPLETON VARIABLE INSURANCE PRODUCTS TRUST
NOTES TO FINANCIAL STATEMENTS (UNAUDITED)
Templeton Growth VIP Fund (continued)
a. Management Fees
The Fund pays an investment management fee to TGAL based on the average daily net assets of the Fund as follows:
| Annualized Fee Rate | Net Assets | |
1.000% | Up to and including $100 million | |
0.900% | Over $100 million, up to and including $250 million | |
0.800% | Over $250 million, up to and including $500 million | |
0.750% | Over $500 million, up to and including $1 billion | |
0.700% | Over $1 billion, up to and including $5 billion | |
0.675% | Over $5 billion, up to and including $10 billion | |
0.655% | Over $10 billion, up to and including $15 billion | |
0.635% | Over $15 billion, up to and including $20 billion | |
0.615% | In excess of $20 billion |
For the period ended June 30, 2018, the annualized gross effective investment management fee rate was 0.783% of the Fund’s average daily net assets.
b. Administrative Fees
Under an agreement with TGAL, FT Services provides administrative services to the Fund. The fee is paid by TGAL based on the Fund’s average daily net assets, and is not an additional expense of the Fund.
c. Distribution Fees
The Board has adopted distribution plans for Class 2 and Class 4 shares pursuant to Rule 12b-1 under the 1940 Act. Under the Fund’s compensation distribution plans, the Fund pays Distributors for costs incurred in connection with the servicing, sale and distribution of the Fund’s shares up to 0.35% per year of its average daily net assets of each class. The Board has agreed to limit the current rate to 0.25% per year for Class 2. The plan year, for purposes of monitoring compliance with the maximum annual plan rates, is February 1 through January 31.
d. Transfer Agent Fees
Investor Services, under terms of an agreement, performs shareholder servicing for the Fund and is not paid by the Fund for the services.
e. Investments in Affiliated Management Investment Companies
The Fund invests in one or more affiliated management investment companies for purposes other than exercising a controlling influence over the management or policies. Management fees paid by the Fund are waived on assets invested in the affiliated management investment companies, as noted in the Statement of Operations, in an amount not to exceed the management and administrative fees paid directly or indirectly by each affiliate. During the period ended June 30, 2018, the Fund held investments in affiliated management investment companies as follows:
Number of Shares Held | Gross Additions | Gross Reductions | Number of Shares Held at End of Period | Value at End of Period | Dividend Income | Realized Gain (Loss) | Net Change in Unrealized Appreciation (Depreciation) | |||||||||||||||||||||||||
| Non-Controlled Affiliates | ||||||||||||||||||||||||||||||||
Institutional Fiduciary Trust Money Market Portfolio, 1.51% | — | 150,102,325 | (149,252,375 | ) | 849,950 | $849,950 | $ — | $ — | $ — | |||||||||||||||||||||||
|
| |||||||||||||||||||||||||||||||
| Semiannual Report |
|
TG-21 |
|
FRANKLIN TEMPLETON VARIABLE INSURANCE PRODUCTS TRUST
NOTES TO FINANCIAL STATEMENTS (UNAUDITED)
Templeton Growth VIP Fund (continued)
3. Transactions with Affiliates (continued)
f. Other Affiliated Transactions
At June 30, 2018, Franklin Templeton Variable Insurance Products Trust - Franklin Founding Funds Allocation VIP Fund owned 24.5% of the Fund’s outstanding shares.
4. Expense Offset Arrangement
The Fund has entered into an arrangement with its custodian whereby credits realized as a result of uninvested cash balances are used to reduce a portion of the Fund’s custodian expenses. During the period ended June 30, 2018, there were no credits earned.
5. Income Taxes
At June 30, 2018, the cost of investments and net unrealized appreciation (depreciation) for income tax purposes were as follows:
Cost of investments | $ | 1,094,403,210 | ||
|
| |||
Unrealized appreciation | $ | 233,479,658 | ||
Unrealized depreciation | (93,516,857) | |||
|
| |||
Net unrealized appreciation (depreciation) | $ | 139,962,801 | ||
|
| |||
Differences between income and/or capital gains as determined on a book basis and a tax basis are primarily due to differing treatments of EU reclaims and foreign capital gains tax.
6. Investment Transactions
Purchases and sales of investments (excluding short term securities) for the period ended June 30, 2018, aggregated $202,579,807 and $305,550,421, respectively.
At June 30, 2018, in connection with securities lending transactions, the Fund loaned equity investments and received $849,950 of cash collateral. The gross amount of recognized liability for such transactions is included in payable upon return of securities loaned in the Statement of Assets and Liabilities. The agreements can be terminated at any time.
7. Concentration of Risk
Investing in foreign securities may include certain risks and considerations not typically associated with investing in U.S. securities, such as fluctuating currency values and changing local and regional economic, political and social conditions, which may result in greater market volatility. In addition, certain foreign securities may not be as liquid as U.S. securities.
8. Credit Facility
The Fund, together with other U.S. registered and foreign investment funds (collectively, Borrowers), managed by Franklin Templeton Investments, are borrowers in a joint syndicated senior unsecured credit facility totaling $2 billion (Global Credit Facility) which matures on February 8, 2019. This Global Credit Facility provides a source of funds to the Borrowers for temporary and emergency purposes, including the ability to meet future unanticipated or unusually large redemption requests.
TG-22 | Semiannual Report |
FRANKLIN TEMPLETON VARIABLE INSURANCE PRODUCTS TRUST
NOTES TO FINANCIAL STATEMENTS (UNAUDITED)
Templeton Growth VIP Fund (continued)
Under the terms of the Global Credit Facility, the Fund shall, in addition to interest charged on any borrowings made by the Fund and other costs incurred by the Fund, pay its share of fees and expenses incurred in connection with the implementation and maintenance of the Global Credit Facility, based upon its relative share of the aggregate net assets of all of the Borrowers, including an annual commitment fee of 0.15% based upon the unused portion of the Global Credit Facility. These fees are reflected in other expenses in the Statement of Operations. During the period ended June 30, 2018, the Fund did not use the Global Credit Facility.
9. Fair Value Measurements
The Fund follows a fair value hierarchy that distinguishes between market data obtained from independent sources (observable inputs) and the Fund’s own market assumptions (unobservable inputs). These inputs are used in determining the value of the Fund’s financial instruments and are summarized in the following fair value hierarchy:
| • | Level 1 – quoted prices in active markets for identical financial instruments |
| • | Level 2 – other significant observable inputs (including quoted prices for similar financial instruments, interest rates, prepayment speed, credit risk, etc.) |
| • | Level 3 – significant unobservable inputs (including the Fund’s own assumptions in determining the fair value of financial instruments) |
The input levels are not necessarily an indication of the risk or liquidity associated with financial instruments at that level.
For movements between the levels within the fair value hierarchy, the Fund has adopted a policy of recognizing the transfers as of the date of the underlying event which caused the movement.
A summary of inputs used as of June 30, 2018, in valuing the Fund’s assets carried at fair value, is as follows:
| Level 1 | Level 2 | Level 3 | Total | |||||||||||||
| Assets: | ||||||||||||||||
Investments in Securities:a | ||||||||||||||||
Equity Investments | $ | 1,214,854,630 | $ | — | $ | — | $ | 1,214,854,630 | ||||||||
Corporate Bonds | — | 7,261,431 | — | 7,261,431 | ||||||||||||
Short Term Investments | 849,950 | 11,400,000 | — | 12,249,950 | ||||||||||||
|
| |||||||||||||||
Total Investments in Securities | $ | 1,215,704,580 | $ | 18,661,431 | $ | — | $ | 1,234,366,011 | ||||||||
|
| |||||||||||||||
| aFor detailed categories, see the accompanying Statement of Investments. |
| |||||||||||||||
10. Subsequent Events
The Fund has evaluated subsequent events through the issuance of the financial statements and determined that no events have occurred that require disclosure.
Abbreviations
| Selected Portfolio | ||
ADR | American Depositary Receipt | |
| FHLB | Federal Home Loan Bank | |
| IDR | International Depositary Receipt | |
| NVDR | Non-Voting Depositary Receipt | |
| Semiannual Report |
|
TG-23 |
|
FRANKLIN TEMPLETON VARIABLE INSURANCE PRODUCTS TRUST
Tax Information (unaudited)
At December 31, 2017, more than 50% of the Fund’s total assets were invested in securities of foreign issuers. In most instances, foreign taxes were withheld from income paid to the Fund on these investments. As shown in the table below, the Fund hereby reports to shareholders the foreign source income and foreign taxes paid, pursuant to Section 853 of the Internal Revenue Code. This written statement will allow shareholders of record on June 14, 2018, to treat their proportionate share of foreign taxes paid by the Funds as having been paid directly by them. The shareholder shall consider these amounts as foreign taxes paid in the tax year in which they receive the Fund distribution.
The following table provides a detailed analysis of foreign tax paid, and foreign source income as reported by the Fund, to Class 1, Class 2, and Class 4 shareholders of record.
| Class | Foreign Tax Paid Per Share | Foreign Source Income Per Share | ||||||
| ||||||||
| Class 1 | $0.0322 | $0.3124 | ||||||
| Class 2 | $0.0322 | $0.2841 | ||||||
| Class 4 | $0.0322 | $0.2702 | ||||||
Foreign Tax Paid Per Share (Column 1) is the amount per share available to you, as a tax credit (assuming you held your shares in the Fund for a minimum of 16 days during the 31-day period beginning 15 days before the ex-dividend date of the Fund’s distribution to which the foreign taxes relate), or, as a tax deduction.
Foreign Source Income Per Share (Column 2) is the amount per share of income dividends attributable to foreign securities held by the Fund, plus any foreign taxes withheld on these dividends.
TG-24 | Semiannual Report |
FRANKLIN TEMPLETON VARIABLE INSURANCE PRODUCTS TRUST
The indexes are unmanaged and include reinvestment of any income or distributions. They do not reflect any fees, expenses or sales charges.
For Russell Indexes: Frank Russell Company is the source and owner of the trademarks, service marks and copyrights related to the Russell Indexes. Russell® is a trademark of Frank Russell Company.
See www.franklintempletondatasources.com for additional data provider information.
Bloomberg Barclays US Aggregate Bond Index is a market capitalization-weighted index representing the US investment-grade, fixed-rate, taxable bond market with index components for government and corporate, mortgage pass-through and asset-backed securities. All issues included are SEC registered, taxable, dollar denominated and nonconvertible, must have at least one year to final maturity and must be rated investment grade (Baa3/BBB-/BBB- or higher) using the middle rating of Moody’s, Standard & Poor’s and Fitch, respectively.
Bloomberg Barclays US Government Index: Intermediate Component is the intermediate component of the Barclays US Government Index, which includes public obligations of the US Treasury with at least one year to final maturity and publicly issued debt of US government agencies, quasi-federal corporations, and corporate or foreign debt guaranteed by the US government.
Consumer Price Index (CPI) is a commonly used measure of the inflation rate.
FTSE® EPRA®/NAREIT® Developed Index is a free float-adjusted index designed to measure the performance of publicly traded real estate securities in the North American, European and Asian real estate markets.
FTSE World Government Bond Index is a market capitalization-weighted index consisting of investment-grade world government bond markets.
J.P. Morgan (JPM) Global Government Bond Index (GGBI) tracks total returns for liquid, fixed-rate, domestic government bonds with maturities greater than one year issued by developed countries globally.
Lipper Multi-Sector Income Funds Classification Average is calculated by averaging the total returns of all funds within the Lipper Multi-Sector Income Funds Classification in the Lipper Open-End underlying funds universe. Lipper Multi-Sector Income Funds are defined as funds that seek current income by allocation of assets among different fixed income securities sectors (not primarily in one sector except for defensive purposes), including US and foreign governments, with a significant portion rated below investment grade. For the six-month period ended 6/30/18, there were 331 funds in this category. Lipper calculations do not include contract fees, expenses or sales charges, and may have been different if such charges had been considered.
Lipper VIP Equity Income Funds Classification Average is an equally weighted average calculation of performance figures for all funds within the Lipper Equity Income Funds classification in the Lipper VIP underlying funds universe. Lipper Equity Income Funds seek relatively high current income and growth of income through investing 60% or more of their portfolios in equities. For the six-month period ended 6/30/18, there were 81 funds in this category. Lipper calculations do not include contract fees, expenses or sales charges, and may have been different if such charges had been considered.
Lipper VIP General US Government Funds Classification Average is an equally weighted average calculation of performance figures for all funds within the Lipper General US Government Funds classification in the Lipper VIP underlying funds universe. Lipper General US Government Funds invest primarily in US government and agency issues. For the six-month period ended 6/30/18, there were 57 funds in this category. Lipper calculations do not include contract fees, expenses or sales charges, and may have been different if such charges had been considered.
MSCI All Country World Index (ACWI) is a free float-adjusted, market capitalization-weighted index designed to measure equity market performance in global developed and emerging markets.
MSCI All Country World Index (ACWI) ex USA Index captures large- and mid-capitalization representation across 22 of 23 developed markets countries (excluding the US) and 23 emerging markets countries. The index covers approximately 85% of the global equity opportunity set outside the US.
| Semiannual Report |
|
I-1 |
|
FRANKLIN TEMPLETON VARIABLE INSURANCE PRODUCTS TRUST
INDEX DESCRIPTIONS
MSCI Emerging Markets (EM) Index is a free float-adjusted, market capitalization-weighted index designed to measure equity market performance in global emerging markets.
MSCI World Index is a free float-adjusted, market capitalization-weighted index designed to measure equity market performance in global developed markets.
Russell 1000® Growth Index is market capitalization weighted and measures performance of those Russell 1000® Index companies with higher price-to-book ratios and higher forecasted growth values.
Russell 1000® Index is market capitalization weighted and measures performance of the largest companies in the Russell 3000® Index, which represents the majority of the U.S. market’s total capitalization.
Russell 2000® Index is market capitalization weighted and measures performance of the 2,000 smallest companies in the Russell 3000® Index, which represent a small amount of the total market capitalization of the Russell 3000® Index.
Russell 2000® Value Index is market capitalization weighted and measures performance of those Russell 2000® Index companies with lower price-to-book ratios and lower forecasted growth values.
Russell 2500TM Index is market capitalization weighted and measures performance of the smallest companies in the Russell 3000® Index, which represent a modest amount of the Russell 3000® Index’s total market capitalization.
Russell 3000® Growth Index is market capitalization weighted and measures performance of those Russell 3000® Index companies with higher price-to-book ratios and higher forecasted growth values.
Russell Midcap® Growth Index is market capitalization weighted and measures performance of those Russell Midcap® Index companies with higher price-to-book ratios and higher forecasted growth values.
Russell Midcap® Index is market capitalization weighted and measures performance of the smallest companies in the Russell 1000® Index, which represents a modest amount of the Russell 1000® Index’s total market capitalization.
Standard & Poor’s® 500 Index (S&P 500®) is a market capitalization-weighted index of 500 stocks designed to measure total US equity market performance.
Standard & Poor’s®/International Finance Corporation Investable (S&P/IFCI) Composite Index is a free float-adjusted, market capitalization-weighted index designed to measure equity performance in global emerging markets.
I-2 | Semiannual Report |
FRANKLIN TEMPLETON VARIABLE INSURANCE PRODUCTS TRUST
Board Approval of Investment Management
Agreements
FRANKLIN TEMPLETON VARIABLE INSURANCE
PRODUCTS TRUST
Franklin Flex Cap Growth VIP Fund
Franklin Global Real Estate VIP Fund
Franklin Growth and Income VIP Fund
Franklin Income VIP Fund
Franklin Large Cap Growth VIP Fund
Franklin Mutual Global Discovery VIP Fund
Franklin Mutual Shares VIP Fund
Franklin Rising Dividends VIP Fund
Franklin Small Cap Value VIP Fund
Franklin Small-Mid Cap Growth VIP Fund
Franklin Strategic Income VIP Fund
Franklin U.S. Government Securities VIP Fund
Franklin VolSmart Allocation VIP Fund
Templeton Developing Markets VIP Fund
Templeton Foreign VIP Fund
Templeton Global Bond VIP Fund
Templeton Growth VIP Fund
(each a Fund)
At an in-person meeting held on April 17, 2018 (Meeting), the Board of Trustees (Board) of Franklin Templeton Variable Insurance Products Trust (Trust), including a majority of the trustees who are not “interested persons” as defined in the Investment Company Act of 1940 (Independent Trustees), reviewed and approved the continuance of the (i) investment management agreement between Franklin Advisers, Inc. (FAI) and the Trust, on behalf of each of Franklin Flex Cap Growth VIP Fund, Franklin Growth and Income VIP Fund, Franklin Income VIP Fund, Franklin Large Cap Growth VIP Fund, Franklin Rising Dividends VIP Fund, Franklin Small Mid-Cap Growth VIP Fund, Franklin Strategic Income VIP Fund, Franklin U.S. Government Securities VIP Fund, Franklin VolSmart Allocation VIP Fund, and Templeton Global Bond VIP Fund; (ii) the investment sub-advisory agreements between FAI and each of Franklin Advisory Services, LLC and K2/D&S Management Co., LLC (each a Sub-Adviser), affiliates of FAI, on behalf of Franklin VolSmart Allocation VIP Fund; (iii) the investment management agreement between Franklin Templeton Institutional, LLC (FTIL) and the Trust, on behalf of Franklin Global Real Estate VIP Fund; (iv) the investment management agreement between Franklin Mutual Advisers, LLC (FMA) and the Trust, on behalf of each of Franklin Mutual Global Discovery VIP Fund and Franklin
Mutual Shares VIP Fund; (v) the investment management agreement between Franklin Advisory Services, LLC (FAS) and the Trust, on behalf of Franklin Small Cap Value VIP Fund; (vi) the investment management agreement between Templeton Asset Management Ltd. (TAML) and the Trust, on behalf of Templeton Developing Markets VIP Fund; (vii) the investment management agreement between Templeton Investment Counsel, LLC (TICL) and the Trust, on behalf of Templeton Foreign VIP Fund; and (viii) the investment management agreement between Templeton Global Advisors Limited (TGAL) and the Trust, on behalf of Templeton Growth VIP Fund (each a Management Agreement) for an additional one-year period. The Independent Trustees received advice from and met separately with Independent Trustee counsel in considering whether to approve the continuation of each Management Agreement. Although the Management Agreements for the Funds were considered at the same Board meeting, the Board considered the information provided to it about the Funds together and with respect to each Fund separately as the Board deemed appropriate. FAI, FTIL, FMA, FAS, TAML, TICL, TGAL and the Sub-Advisers are each referred to herein as a Manager.
In considering the continuation of each Management Agreement, the Board reviewed and considered information provided by each Manager at the Meeting and throughout the year at meetings of the Board and its committees. The Board also reviewed and considered information provided in response to a detailed set of requests for information submitted to each Manager by Independent Trustee counsel on behalf of the Independent Trustees in connection with the annual contract renewal process. In addition, prior to the Meeting, the Independent Trustees held a telephonic contract renewal meeting at which the Independent Trustees conferred amongst themselves and Independent Trustee counsel about contract renewal matters. The Board reviewed and considered all of the factors it deemed relevant in approving the continuance of each Management Agreement, including, but not limited to: (i) the nature, extent and quality of the services provided by each Manager; (ii) the investment performance of each Fund; (iii) the costs of the services provided and profits realized by each Manager and its affiliates from the relationship with each Fund; (iv) the extent to which economies of scale are realized as each Fund grows; and (v) whether fee levels reflect these economies of scale for the benefit of Fund investors.
In approving the continuance of each Management Agreement, the Board, including a majority of the Independent Trustees, determined that the terms of the Management Agreement are
| Semiannual Report |
|
SI-1 |
|
FRANKLIN TEMPLETON VARIABLE INSURANCE PRODUCTS TRUST
SHAREHOLDER INFORMATION
fair and reasonable and that the continuance of such Management Agreement is in the interests of the applicable Fund and its shareholders. While attention was given to all information furnished, the following discusses some primary factors relevant to the Board’s determination.
Nature, Extent and Quality of Services
The Board reviewed and considered information regarding the nature, extent and quality of investment management services provided by each Manager and its affiliates to the Funds and their shareholders. This information included, among other things, the qualifications, background and experience of the senior management and investment personnel of each Manager; the structure of investment personnel compensation; oversight of third-party service providers; investment performance reports and related financial information for each Fund; reports on expenses, shareholder services, marketing support payments made to financial intermediaries and third party servicing arrangements; legal and compliance matters; risk controls; pricing and other services provided by each Manager and its affiliates; and management fees charged by each Manager and its affiliates to U.S. funds and other accounts, including management’s explanation of differences among accounts where relevant. The Board also reviewed and considered an annual report on payments made by Franklin Templeton Investments (FTI) or the Funds to financial intermediaries, as well as a memorandum relating to third-party servicing arrangements in response to a guidance update in 2016 from the U.S. Securities and Exchange Commission (SEC) relating to mutual fund distribution and sub-accounting fees. The Board noted management’s continuing efforts and expenditures in establishing effective business continuity plans and developing strategies to address areas of heightened concern in the mutual fund industry, such as cybersecurity and liquidity risk management. The Board also recognized management’s commitment to facilitating Board oversight of particular areas, including derivatives and payments to intermediaries, by enhanced reporting.
The Board also reviewed and considered the benefits provided to Fund shareholders of investing in a fund that is part of the Franklin Templeton family of funds. The Board noted the financial position of Franklin Resources, Inc. (FRI), the Managers’ parent, and its commitment to the mutual fund business as evidenced by its continued introduction of new funds, reassessment of the fund offerings in response to the market environment and project initiatives and capital investments relating to the services provided to the Funds by the FTI organization.
Following consideration of such information, the Board was satisfied with the nature, extent and quality of services provided by each Manager and its affiliates to the Funds and their shareholders.
Fund Performance
The Board reviewed and considered the performance results of each Fund over various time periods ended January 31, 2018. The Board considered the performance returns for each Fund in comparison to the performance returns of mutual funds deemed comparable to the Fund included in a universe (Performance Universe) selected by Broadridge Financial Solutions, Inc. (Broadridge), an independent provider of investment company data. The Board received a description of the methodology used by Broadridge to select the mutual funds included in a Performance Universe. The Board also reviewed and considered Fund performance reports provided and discussions that occurred with portfolio managers at Board meetings throughout the year. A summary of each Fund’s performance results is below.
Franklin Flex Cap Growth VIP Fund - The Performance Universe for this Fund included the Fund and all multi-cap growth funds underlying variable insurance products (VIPs). The Board noted that the Fund’s annualized total return for the one-year period was above the median of its Performance Universe, but for the three-, five- and 10-year periods was below the median of its Performance Universe. The Board concluded that the Fund’s performance was satisfactory, noting the Fund’s second quintile, one-year period performance of 33.96%. The Board also noted the actions management has taken in an effort to address the Fund’s performance, including changes to the Fund’s portfolio management team and enhancements to the team’s security selection process.
Franklin Global Real Estate VIP Fund - The Performance Universe for this Fund included the Fund and all global real estate funds underlying VIPs. The Board noted that the Fund’s annualized total return for the one- and 10-year periods was below the median of its Performance Universe, but for the three- and five-year periods was above the median of its Performance Universe. The Board concluded that the Fund’s performance was acceptable. In doing so, the Board noted that the Fund’s annualized total return for the one-year period, while below the median, exceeded 10.3%.
Franklin Growth and Income VIP Fund - The Performance Universe for this Fund included the Fund and all equity income funds underlying VIPs. The Board noted that the Fund’s annualized income return and annualized total return for the
SI-2 | Semiannual Report |
FRANKLIN TEMPLETON VARIABLE INSURANCE PRODUCTS TRUST
SHAREHOLDER INFORMATION
one-, three-, five- and 10-year periods were above the medians of its Performance Universe. The Board concluded that the Fund’s performance was satisfactory.
Franklin Income VIP Fund and Franklin Strategic Income VIP Fund - The Performance Universe for the Franklin Income VIP Fund included the Fund and all mixed-asset target allocation moderate funds underlying VIPs. The Performance Universe for the Franklin Strategic Income VIP Fund included the Fund and all general bond funds underlying VIPs. The Board noted that the Funds’ annualized income returns for the one-, three-, five- and 10-year periods were above the medians of their respective Performance Universes. The Board also noted that the Funds’ annualized total returns for the one-, three- and five-year periods were below the medians of their respective Performance Universes, but for the 10-year period were above the medians of their respective Performance Universes. Given the Funds’ income-oriented investment objectives, the Board concluded that the Funds’ performance was satisfactory.
Franklin Large Cap Growth VIP Fund - The Performance Universe for this Fund included the Fund and all multi-cap growth funds underlying VIPs. The Board noted that the Fund’s annualized total return for the one- and three-year periods was above the median of its Performance Universe, but for the five- and 10-year periods was below the median of its Performance Universe. The Board concluded that the Fund’s performance was satisfactory. In doing so, the Board noted that the Fund’s annualized total return for the one-year period exceeded 32% and the annualized total return for the five- and 10-year periods, while below the median, exceeded 14.9% and 8.9%, respectively.
Franklin Mutual Global Discovery VIP Fund - The Performance Universe for this Fund included the Fund and all global multi-cap value funds underlying VIPs. The Board noted that the Fund’s annualized total return for the one- and three-year periods was below the median of its Performance Universe, but for the five- and 10-year periods was above the median and in the first quintile (the best) of its Performance Universe. The Board concluded that the Fund’s performance was acceptable. In doing so, the Board noted that the Fund’s annualized total return for the one- and three-year periods, while below the median, exceeded 11.0% and 7.7%, respectively.
Franklin Mutual Shares VIP Fund and Franklin Small-Mid Cap Growth VIP Fund - The Performance Universe for the Franklin Mutual Shares VIP Fund included the Fund and all large-cap value funds underlying VIPs. The Performance
Universe for the Franklin Small-Mid Cap Growth VIP Fund included the Fund and all mid-cap growth funds underlying VIPs. The Board noted that the Funds’ annualized total returns for the one-, three-, five- and 10-year periods were below the medians of their respective Performance Universes. The Board discussed the Funds’ performance with management. The Board noted management’s explanation that the Franklin Mutual Shares VIP Fund’s overweight exposure to U.S. based insurance companies, pharmaceutical stocks, and media stocks detracted from Fund performance. Management further explained that it remains consistent in its disciplined bottom-up investment approach focused on identifying and investing in companies that are trading at a significant discount to their intrinsic value. The Board also noted management’s explanation that the Franklin Small-Mid Cap Growth VIP Fund’s positioning in the healthcare, consumer discretionary, and industrial sectors was a primary detractor from relative performance over the one-, three-, and five-year periods. The Board further noted management’s explanation that it has reduced the Fund’s exposure to stock selection risk in those industries and had made changes to the portfolio management team in 2017. The Board also noted management’s report that, since January 31, 2018, the Fund has recovered approximately 150 basis points in relative performance for the one-year period and is approximately even with the index and peer average, year-to-date. The Board further noted that the annualized total returns for the one-year period, while below the median, exceeded 11.1% for the Franklin Mutual Shares VIP Fund and 22.4% for the Franklin Small-Mid Cap Growth VIP Fund.
Franklin Rising Dividends VIP Fund and Templeton Developing Markets VIP Fund - The Performance Universe for the Franklin Rising Dividends VIP Fund included the Fund and all multi-cap core funds underlying VIPs. The Performance Universe for the Templeton Developing Markets VIP Fund included the Fund and all emerging markets funds underlying VIPs. The Board noted that the Funds’ annualized total returns for the one-, three- and 10-year periods were above the medians of their respective Performance Universes, but for the five-year period were below the medians of their respective Performance Universes. The Board concluded that the Funds’ performance was satisfactory. In doing so, the Board noted that the annualized total returns for the one-year period exceeded 24.8% for the Franklin Rising Dividends VIP Fund and 41.4% for the Templeton Developing Markets VIP Fund.
Franklin Small Cap Value VIP Fund - The Performance Universe for this Fund included the Fund and all small-cap value funds underlying VIPs. The Board noted that the Fund’s
| Semiannual Report |
|
SI-3 |
|
FRANKLIN TEMPLETON VARIABLE INSURANCE PRODUCTS TRUST
SHAREHOLDER INFORMATION
annualized total return for the one-, three-, five- and 10-year periods was above the median of its Performance Universe. The Board concluded that the Fund’s performance was satisfactory.
Franklin U.S. Government Securities VIP Fund - The Performance Universe for this Fund included the Fund and all general U.S. government funds underlying VIPs. The Board noted that the Fund’s annualized income return for the one-, three-, five- and 10-year periods was above the median and in the first quintile (the best) of its Performance Universe. The Board also noted that the Fund’s annualized total return for the one-, five- and 10-year periods was slightly below the median of its Performance Universe, but for the three-year period was above the median and in the first quintile (the best) of its Performance Universe. The Board concluded that the Fund’s performance was satisfactory given the Fund’s income-oriented investment objective and the nature of the Fund’s investments, which are primarily in U.S. mortgage-backed securities.
Franklin VolSmart Allocation VIP Fund - The Performance Universe for this Fund included the Fund and all flexible portfolio funds underlying VIPs. The Fund has been in operation for less than five years. The Board noted that the Fund’s annualized total return for the one- and three-year periods was above the median of its Performance Universe. The Board concluded that the Fund’s performance was satisfactory.
Templeton Foreign VIP Fund - The Performance Universe for this Fund included the Fund and all international multi-cap value funds underlying VIPs. The Board noted that the Fund’s annualized total return for one-, three- and five-year periods was below the median of its Performance Universe, but for the 10-year period was above the median and in the first quintile (the best) of its Performance Universe. The Board discussed the Fund’s performance with management and noted management’s explanation that Fund positions in the health care, energy, materials and technology sectors detracted from Fund performance over the one-, three- and five-year periods. Management further explained that it was reviewing the relevant thesis underlying its research conclusions to ensure management’s continued conviction that the Fund’s portfolio holdings are undervalued. The Board concluded that the Fund’s performance was acceptable. In doing so, the Board noted management’s explanation and that the Fund’s annualized total return for the one-year period, while below the median, exceeded 17.2%.
Templeton Global Bond VIP Fund - The Performance Universe for this Fund included the Fund and all global income funds underlying VIPs. The Board noted that the Fund’s annualized
income return for the one-year period was below the median of its Performance Universe, but for the three-, five- and 10-year periods was above the median and in the first (the best) or second quintile of its Performance Universe. The Board also noted that the Fund’s annualized total return for the one- and three-year periods was below the median of its Performance Universe, but for the five- and 10-year periods was above the median of its Performance Universe. Given the Fund’s income-oriented investment objective, the Board concluded that the Fund’s performance was satisfactory.
Templeton Growth VIP Fund - The Performance Universe for this Fund included the Fund and all global multi-cap value funds underlying VIPs. The Board noted that the Fund’s annualized total return for the one-, three- and five-year periods was above the median and in the first (the best) or second quintile of its Performance Universe, but for the 10-year period was below the median of its Performance Universe. The Board concluded that the Fund’s performance was satisfactory. In doing so, the Board noted that the Fund’s annualized total return for the one-year period exceeded 22.1%.
Comparative Fees and Expenses
The Board reviewed and considered information regarding each Fund’s actual total expense ratio and its various components, including, as applicable, management fees; transfer agent expenses; underlying fund expenses; Rule 12b-1 and non-Rule 12b-1 service fees; and other non-management fees. The Board also noted the quarterly and annual reports it receives on all marketing support payments made by FTI to financial intermediaries. The Board considered the actual total expense ratio and, separately, the contractual management fee rate, without the effect of fee waivers (Management Rate), if any, of each Fund in comparison to the median expense ratio and median Management Rate, respectively, of other mutual funds deemed comparable to and with a similar expense structure as the Fund selected by Broadridge (Expense Group). Broadridge fee and expense data is based upon information taken from each fund’s most recent annual report, which reflects historical asset levels that may be quite different from those currently existing, particularly in a period of market volatility. While recognizing such inherent limitation and the fact that expense ratios and Management Rates generally increase as assets decline and decrease as assets grow, the Board believed the independent analysis conducted by Broadridge to be an appropriate measure of comparative fees and expenses. The Broadridge Management Rate includes administrative charges. The Board received a description of the
SI-4 | Semiannual Report |
FRANKLIN TEMPLETON VARIABLE INSURANCE PRODUCTS TRUST
SHAREHOLDER INFORMATION
methodology used by Broadridge to select the mutual funds included in an Expense Group.
Franklin Flex Cap Growth VIP Fund, Franklin Strategic Income VIP Fund, and Templeton Growth VIP Fund - The Expense Group for the Franklin Flex Cap Growth VIP Fund included the Fund and eight other multi-cap growth funds underlying VIPs. The Expense Group for the Franklin Strategic Income VIP Fund included the Fund and eight other general bond funds underlying VIPs. The Expense Group for the Templeton Growth VIP Fund included the Fund, one other global multi-cap value fund underlying VIPs, three global multi-cap core funds underlying VIPs and two global multi-cap growth funds underlying VIPs. The Board noted that the Management Rates for these Funds were slightly above the medians of their respective Expense Groups, but their actual total expense ratios were below the medians of their respective Expense Groups. The Board concluded that the Management Rates charged to these Funds are reasonable. In doing so, the Board noted that the Franklin Flex Cap Growth Fund’s actual total expense ratio reflected a fee waiver from management.
Franklin Small-Mid Cap Growth VIP Fund - The Expense Group for the Fund included the Fund and eight other mid-cap growth funds underlying VIPs. The Board noted that the Management Rate and actual total expense ratio for the Fund were equal to the medians of its Expense Group. The Board concluded that the Management Rate charged to the Fund is reasonable.
Franklin Global Real Estate VIP Fund, Franklin Mutual Global Discovery VIP Fund, Franklin Mutual Shares VIP Fund, Templeton Developing Markets VIP Fund - The Expense Group for the Franklin Global Real Estate VIP Fund included the Fund and seven other global real estate funds underlying VIPs. The Expense Group for the Franklin Mutual Global Discovery VIP Fund included the Fund, one other global multi-cap value fund underlying VIPs, three global multi-cap core funds underlying VIPs and five global multi-cap growth funds underlying VIPs. The Expense Group for the Franklin Mutual Shares VIP Fund included the Fund and 10 other large-cap value funds underlying VIPs. The Expense Group for the Templeton Developing Markets VIP Fund included the Fund and eight other emerging markets funds underlying VIPs. The Board noted that the Management Rates and actual total expense ratios for these Funds were above the medians of their respective Expense Groups. The Board concluded that the Management Rates charged to these Funds are reasonable. With respect to the Franklin Mutual Shares VIP Fund and the
Franklin Mutual Global Discovery VIP Fund, the Board noted management’s explanation that the portfolio management team makes investments in distressed securities and merger arbitrage that are specialist in nature and therefore merit a higher Management Rate. With respect to the Franklin Global Real Estate VIP Fund, the Board noted management’s explanation that the portfolio managers’ rigorous fundamental analysis with the inclusion of more active risk controls merits a higher Management Rate. Finally, with respect to the Templeton Developing Markets VIP Fund, the Board noted management’s agreement to reduce the Management Rate applicable to the Fund.
Franklin Growth and Income VIP Fund, Franklin Income VIP Fund, Franklin Rising Dividends VIP Fund, Franklin Small Cap Value VIP Fund, Franklin U.S. Government Securities VIP Fund, Templeton Foreign VIP Fund and Templeton Global Bond VIP Fund – The Expense Group for the Franklin Growth and Income VIP Fund included the Fund and seven other equity income funds underlying VIPs. The Expense Group for the Franklin Income VIP Fund included the Fund and seven other mixed-asset target allocation moderate funds underlying VIPs. The Expense Group for the Franklin Rising Dividends VIP Fund included the Fund and nine other multi-cap core funds underlying VIPs. The Expense Group for the Franklin Small Cap Value VIP Fund included the Fund and eight other small-cap value funds underlying VIPs. The Expense Group for the Franklin U.S. Government Securities VIP Fund included the Fund and nine other general U.S. government funds underlying VIPs. The Expense Group for the Templeton Foreign VIP Fund included the Fund, five other international multi-cap value funds underlying VIPs and four international multi-cap core funds underlying VIPs. The Expense Group for the Templeton Global Bond VIP Fund included the Fund and seven other global income funds underlying VIPs. The Board noted that the Management Rates and actual total expense ratios for these Funds were below the medians of their respective Expense Groups. The Board concluded that the Management Rates charged to these Funds are reasonable. The Board also noted that the Franklin Growth and Income VIP Fund’s actual total expense ratio reflected a fee waiver from management.
Franklin Large Cap Growth VIP Fund - The Expense Group for the Fund included the Fund and seven other multi-cap growth funds underlying VIPs. The Board noted that the Management Rate for the Fund was equal to the median of its Expense Group, but its actual total expense ratio was below the
| Semiannual Report |
|
SI-5 |
|
FRANKLIN TEMPLETON VARIABLE INSURANCE PRODUCTS TRUST
SHAREHOLDER INFORMATION
median of its Expense Group. The Board concluded that the Management Rate charged to the Fund is reasonable.
Franklin VolSmart Allocation VIP Fund – The Expense Group for the Fund included the Fund and four other flexible portfolio funds underlying VIPs. The Board noted the small size of the Expense Group. The Board also noted that the Management Rate for the Fund was below the median of its Expense Group and its actual total expense ratio was slightly above the median of its Expense Group. The Board concluded that the Management Rate charged to the Fund is reasonable. In doing so, the Board noted that the Fund’s actual total expense ratio reflected a fee waiver from management and that the Sub-Advisers were paid by FAI out of the management fee FAI received from the Fund.
Profitability
The Board reviewed and considered information regarding the profits realized by each Manager and its affiliates in connection with the operation of each Fund. In this respect, the Board considered the Fund profitability analysis provided by each Manager that addresses the overall profitability of FTI’s U.S. fund business, as well as its profits in providing investment management and other services to each of the individual funds during the 12-month period ended September 30, 2017, being the most recent fiscal year-end for FRI. The Board noted that although management continually makes refinements to its methodologies used in calculating profitability in response to organizational and product related changes, the overall methodology has remained consistent with that used in the Funds’ profitability report presentations from prior years. Additionally, PricewaterhouseCoopers LLP, auditor to Franklin Resources, Inc. and certain Franklin Templeton funds, has been engaged by each Manager to periodically review and assess the allocation methodologies to be used solely by the Funds’ Board with respect to the profitability analysis.
The Board noted management’s belief that costs incurred in establishing the infrastructure necessary for the type of mutual fund operations conducted by each Manager and its affiliates may not be fully reflected in the expenses allocated to each Fund in determining its profitability, as well as the fact that the level of profits, to a certain extent, reflected operational cost savings and efficiencies initiated by management. The Board also noted management’s expenditures in improving shareholder services provided to the Funds, as well as the need to implement systems and meet additional regulatory and compliance requirements resulting from recent SEC and other regulatory requirements.
The Board also considered the extent to which each Manager and its affiliates might derive ancillary benefits from fund operations, including revenues generated from transfer agent services, potential benefits resulting from personnel and systems enhancements necessitated by fund growth, as well as increased leverage with service providers and counterparties. Based upon its consideration of all these factors, the Board concluded that the level of profits realized by each Manager and its affiliates from providing services to each Fund was not excessive in view of the nature, extent and quality of services provided to each Fund.
Economies of Scale
The Board reviewed and considered the extent to which each Manager may realize economies of scale, if any, as each Fund grows larger and whether the Fund’s management fee structure reflects any economies of scale for the benefit of shareholders. With respect to possible economies of scale, the Board noted the existence of management fee breakpoints for each Fund (except for the Franklin VolSmart Allocation VIP Fund), which operate generally to share any economies of scale with a Fund’s shareholders by reducing the Fund’s effective management fees as the Fund grows in size. The Board considered each Manager’s view that any analyses of potential economies of scale in managing a particular fund are inherently limited in light of the joint and common costs and investments each Manager incurs across the Franklin Templeton family of funds as a whole. The Board concluded that to the extent economies of scale may be realized by each Manager and its affiliates, each Fund’s management fee structure (except that of the Franklin VolSmart Allocation VIP Fund) provided a sharing of benefits with the Fund and its shareholders as the Fund grows. The Board recognized that there would not likely be any economies of scale for the Franklin Flex Cap Growth VIP Fund, Franklin Global Real Estate VIP Fund, Franklin Growth and Income VIP Fund, Franklin Large Cap Growth VIP Fund and Franklin VolSmart Allocation VIP Fund until each Fund’s assets grow. The Board also recognized that given the decline in assets over the past three calendar years for each of the Franklin Small-Mid Cap Growth VIP Fund, Franklin Strategic Income VIP Fund, Templeton Foreign VIP Fund and Templeton Growth VIP Fund, these Funds are not expected to experience additional economies of scale in the foreseeable future.
Conclusion
Based on its review, consideration and evaluation of all factors it believed relevant, including the above-described factors and
SI-6 | Semiannual Report |
FRANKLIN TEMPLETON VARIABLE INSURANCE PRODUCTS TRUST
SHAREHOLDER INFORMATION
conclusions, the Board unanimously approved the continuation
of each Management Agreement for an additional one-year
period.
Proxy Voting Policies and Procedures
The Trust’s investment manager has established Proxy Voting Policies and Procedures (Policies) that the Trust uses to determine how to vote proxies relating to portfolio securities. Shareholders may view the Trust’s complete Policies online at franklintempleton.com. Alternatively, shareholders may request copies of the Policies free of charge by calling the Proxy Group collect at (954) 527-7678 or by sending a written request to: Franklin Templeton Companies, LLC, 300 S.E. 2nd Street, Fort Lauderdale, FL 33301, Attention: Proxy Group. Copies of the Trust’s proxy voting records are also made available online at franklintempleton.com and posted on the US Securities and Exchange Commission’s website at sec.gov and reflect the most recent 12-month period ended June 30.
Quarterly Statement of Investments
The Trust files a complete statement of investments with the US Securities and Exchange Commission for the first and third quarters for each fiscal year on Form N-Q. Shareholders may view the filed Form N-Q by visiting the Commission’s website at sec.gov. The filed form may also be viewed and copied at the Commission’s Public Reference Room in Washington, DC. Information regarding the operations of the Public Reference Room may be obtained by calling (800) SEC-0330.
| Semiannual Report |
|
SI-7 |
|
This page intentionally left blank.
| Semiannual Report | |
| Franklin Templeton Variable Insurance Products Trust | ||
Investment Managers | ||
Franklin Advisers, Inc. Franklin Advisory Services, LLC Franklin Mutual Advisers, LLC Franklin Templeton Institutional, LLC Templeton Asset Management Ltd. Templeton Global Advisors Limited Templeton Investment Counsel, LLC | ||
Fund Administrator | ||
| Franklin Templeton Services, LLC | ||
Distributor | ||
| Franklin Templeton Distributors, Inc. | ||

Franklin Templeton Variable Insurance Products Trust (FTVIP) shares are not offered to the public; they are offered and sold only to: (1) insurance company separate accounts (Separate Account) to serve as the underlying investment vehicle for variable contracts; (2) certain qualified plans; and (3) other mutual funds (funds of funds).
Authorized for distribution to investors in Separate Accounts only when accompanied or preceded by the current prospectus for the applicable contract, which includes the Separate Account and the FTVIP prospectuses. Investors should carefully consider a fund’s investment goals, risks, charges and expenses before investing. The prospectus contains this and other information; please read it carefully before investing.
To help ensure we provide you with quality service, all calls to and from our service areas are monitored and/or recorded.
| © 2018 Franklin Templeton Investments. All rights reserved. | VIP2 S 08/18 |
| Item 2. | Code of Ethics. |
| (a) | The Registrant has adopted a code of ethics that applies to its principal executive officers and principal financial and accounting officer. |
| (c) | N/A |
| (d) | N/A |
| (f) | Pursuant to Item 12(a)(1), the Registrant is attaching as an exhibit a copy of its code of ethics that applies to its principal executive officers and principal financial and accounting officer. |
| Item 3. | Audit Committee Financial Expert. |
(a) (1) The Registrant has an audit committee financial expert serving on its audit committee.
| (2) | The audit committee financial expert is John B. Wilson and he is “independent” as defined under the relevant Securities and Exchange Commission Rules and Releases. |
| Item 4. | Principal Accountant Fees and Services. | N/A | ||
| Item 5. | Audit Committee of Listed Registrants. | N/A | ||
| Item 6. | Schedule of Investments. | N/A | ||
| Item 7. | Disclosure of Proxy Voting Policies and Procedures for Closed-End Management Investment Companies. | N/A | ||
| Item 8. | Portfolio Managers of Closed-End Management Investment Companies. | N/A | ||
| Item 9. | Purchases of Equity Securities by Closed-End Management Investment Company and Affiliated Purchasers. | N/A | ||
| Item 10. | Submission of Matters to a Vote of Security Holders. | |||
There have been no changes to the procedures by which shareholders may recommend nominees to the Registrant’s Board of Trustees that would require disclosure herein.
| Item 11. | Controls and Procedures. |
(a) Evaluation of Disclosure Controls and Procedures. The Registrant maintains disclosure controls and procedures that are designed to ensure that information required to be disclosed in the Registrant’s
filings under the Securities Exchange Act of 1934 and the Investment Company Act of 1940 is recorded, processed, summarized and reported within the periods specified in the rules and forms of the Securities and Exchange Commission. Such information is accumulated and communicated to the Registrant’s management, including its principal executive officer and principal financial officer, as appropriate, to allow timely decisions regarding required disclosure. The Registrant’s management, including the principal executive officer and the principal financial officer, recognizes that any set of controls and procedures, no matter how well designed and operated, can provide only reasonable assurance of achieving the desired control objectives.
Within 90 days prior to the filing date of this Shareholder Report on Form N-CSR, the Registrant had carried out an evaluation, under the supervision and with the participation of the Registrant’s management, including the Registrant’s principal executive officer and the Registrant’s principal financial officer, of the effectiveness of the design and operation of the Registrant’s disclosure controls and procedures. Based on such evaluation, the Registrant’s principal executive officer and principal financial officer concluded that the Registrant’s disclosure controls and procedures are effective.
(b) Changes in Internal Controls. There have been no changes in the Registrant’s internal controls or in other factors that could materially affect the internal controls over financial reporting subsequent to the date of their evaluation in connection with the preparation of this Shareholder Report on Form N-CSR.
| Item 12. | Disclosure of Securities Lending Activities for Closed-End Management Investment Company. | N/A |
| Item 13. | Exhibits. |
(a) (1) Code of Ethics
(a) (2) Certifications pursuant to Section 302 of the Sarbanes-Oxley Act of 2002 of Matthew T. Hinkle, Chief Executive Officer - Finance and Administration, and Gaston Gardey, Chief Financial Officer and Chief Accounting Officer
(b) Certifications pursuant to Section 906 of the Sarbanes-Oxley Act of 2002 of Matthew T. Hinkle, Chief Executive Officer - Finance and Administration, and Gaston Gardey, Chief Financial Officer and Chief Accounting Officer
SIGNATURES
Pursuant to the requirements of the Securities Exchange Act of 1934 and the Investment Company Act of 1940, the registrant has duly caused this report to be signed on its behalf by the undersigned, thereunto duly authorized.
Franklin Templeton Variable Insurance Products Trust
| By | /s/ MATTHEW T. HINKLE | |
| Matthew T. Hinkle | ||
| Chief Executive Officer – | ||
| Finance and Administration | ||
| Date August 24, 2018 | ||
Pursuant to the requirements of the Securities Exchange Act of 1934 and the Investment Company Act of 1940, this report has been signed below by the following persons on behalf of the registrant and in the capacities and on the dates indicated.
| By | /s/ MATTHEW T. HINKLE | |
| Matthew T. Hinkle | ||
| Chief Executive Officer – | ||
| Finance and Administration | ||
| Date August 24, 2018 | ||
| By | /s/ GASTON GARDEY | |
| Gaston Gardey | ||
| Chief Financial Officer and | ||
| Chief Accounting Officer | ||
| Date August 24, 2018 | ||