UNITED STATES
SECURITIES AND EXCHANGE COMMISSION
Washington, DC 20549
FORMN-CSR
CERTIFIED SHAREHOLDER REPORT OF REGISTERED
MANAGEMENT INVESTMENT COMPANIES
Investment Company Act file number811-05583
Franklin Templeton Variable Insurance Products Trust
(Exact name of registrant as specified in charter)
One Franklin Parkway, San Mateo, CA 94403-1906
(Address of principal executive offices) (Zip code)
Craig S. Tyle, One Franklin Parkway, San Mateo, CA 94403-1906
(Name and address of agent for service)
Registrant’s telephone number, including area code: (650)312-2000
Date of fiscal year end: 12/31
Date of reporting period: 12/31/18
| Item 1. | Reports to Stockholders. |
| | |
 | | Annual Report December 31, 2018 |
Franklin Templeton Variable Insurance
Products Trust

Internet Delivery of Shareholder Reports: Effective January 1, 2021, as permitted by regulations adopted by the SEC, you may not be receiving paper copies of the Fund’s annual or semiannual shareholder reports by mail, unless you specifically request them from the insurance company that offers your variable annuity or variable life insurance contract or your financial intermediary. Instead of delivering paper copies of the report, the insurance company may choose to make the reports available on a website, and will notify you by mail each time a shareholder report is posted and provide you with a website link to access the report. Instructions for requesting paper copies will be provided by your insurance company.
If you already elected to receive shareholder reports electronically, you will not be affected by this change and you need not take any action. You may elect to receive shareholder reports and other communications from the insurance company or your financial intermediary electronically by following the instructions provided by the insurance company or by contacting your financial intermediary.
You may elect to receive all future Fund shareholder reports in paper free of charge from the insurance company. You can inform the insurance company or your financial intermediary that you wish to continue receiving paper copies of your shareholder reports by following the instructions provided by the insurance company or by contacting your financial intermediary. Your election to receive reports in paper will apply to all portfolio companies available under your contract with the insurance company.
This notice is not legally a part of the shareholder report.
Franklin Templeton Variable Insurance
Products Trust Annual Report
*Not part of the annual report. Retain for your records.
|
| |
| Not FDIC Insured | May Lose Value | No Bank Guarantee |
MASTER CLASS – 1
FRANKLIN TEMPLETON VARIABLE INSURANCE PRODUCTS TRUST
Important Notes to
Performance Information
Performance data is historical and cannot predict or guarantee future results. Principal value and investment return will fluctuate with market conditions, and you may have a gain or loss when you withdraw your money. Inception dates of the funds may have preceded the effective dates of the subaccounts, contracts or their availability in all states.
When reviewing the index comparisons, please keep in mind that indexes have a number of inherent performance differentials over the funds. First, unlike the funds, which must hold a minimum amount of cash to maintain liquidity, indexes do not
have a cash component. Second, the funds are actively managed and, thus, are subject to management fees to cover salaries of securities analysts or portfolio managers in addition to other expenses. Indexes are unmanaged and do not include any commissions or other expenses typically associated with investing in securities. Third, indexes often contain a different mix of securities than the fund to which they are compared. Additionally, please remember that indexes are simply a measure of performance and cannot be invested in directly.
VIP P1 07/18
SUPPLEMENT DATED JULY 10, 2018
TO THE PROSPECTUS DATED MAY 1, 2018
OF
FRANKLIN FLEX CAP GROWTH VIP FUND
FRANKLIN FOUNDING FUNDS ALLOCATION VIP FUND
FRANKLIN GLOBAL REAL ESTATE VIP FUND
FRANKLIN GROWTH AND INCOME VIP FUND
FRANKLIN INCOME VIP FUND
FRANKLIN LARGE CAP GROWTH VIP FUND
FRANKLIN MUTUAL GLOBAL DISCOVERY VIP FUND
FRANKLIN MUTUAL SHARES VIP FUND
FRANKLIN RISING DIVIDENDS VIP FUND
FRANKLIN SMALL CAP VALUE VIP FUND
FRANKLINSMALL-MID CAP GROWTH VIP FUND
FRANKLIN STRATEGIC INCOME VIP FUND
FRANKLIN U.S. GOVERNMENT SECURITIES VIP FUND
FRANKLIN VOLSMART ALLOCATION VIP FUND
TEMPLETON DEVELOPING MARKETS VIP FUND
TEMPLETON FOREIGN VIP FUND
TEMPLETON GLOBAL BOND VIP FUND
TEMPLETON GROWTH VIP FUND
(EACHASERIESOF FRANKLIN TEMPLETON VARIABLE INSURANCE PRODUCTS TRUST)
I. The following replaces the third paragraph in the prospectus under “Additional Information, All Funds – Fund Account Information – Fund Account Policies – Calculating Share Price:”
The Fund calculates the NAV per share each business day as of 1 p.m. Pacific time or the regularly scheduled close of the New York Stock Exchange (NYSE), whichever is earlier. The Fund does not calculate the NAV on days the NYSE is closed for trading, which include New Year’s Day, Martin Luther King Jr. Day, President’s Day, Good Friday, Memorial Day, Independence Day, Labor Day, Thanksgiving Day and Christmas Day. If the NYSE has a scheduled early close, the Fund’s share price would be determined as of the time of the close of the NYSE. If, due to weather or other special or unexpected circumstances, the NYSE has an unscheduled early close on a day that it has opened for business, the Fund reserves the right to consider that day as a regular business day and accept purchase and redemption orders and calculate its share price as of the normally scheduled close of regular trading on the NYSE.
Please keep this supplement with your prospectus for future reference.
This page intentionally left blank.
Franklin Founding Funds Allocation VIP Fund
This annual report for Franklin Founding Funds Allocation VIP Fund covers the fiscal year ended December 31, 2018.
Class 1 Performance Summary as of December 31, 2018
Average annual total return of Class 1 shares* represents the average annual change in value, assuming reinvestment of dividends and capital gains. Average returns smooth out variations in returns, which can be significant; they are not the same asyear-by-year results.
| | | | | | | | | | | | |
| | | |
| Periods ended 12/31/18 | | 1-Year | | | 5-Year | | | 10-Year | |
Average Annual Total Return | | | -9.34% | | | | +2.26% | | | | +8.62% | |
*The Fund has an expense reduction contractually guaranteed through 4/30/19. Fund investment results reflect the expense reduction; without this reduction, the results would have been lower.
Performance reflects the Fund’s Class 1 operating expenses, but doesnotinclude any contract fees, expenses or sales charges. If they had been included, performance would be lower. These charges and deductions, particularly for variable life policies, can have a significant effect on contract values and insurance benefits. See the contract prospectus for a complete description of these expenses, including sales charges.
Performance data represent past performance, which does not guarantee future results. Investment return and principal value will fluctuate, and you may have a gain or loss when you sell your shares. Current performance may differ from figures shown.
Total Return Index Comparison for a Hypothetical $10,000 Investment (1/1/09–12/31/18)
The graph below shows the change in value of a hypothetical $10,000 investment in the Fund over the indicated period and includes reinvestment of any income or distributions. The Fund’s performance* is compared to the performance of the Standard & Poor’s® 500 Index (S&P 500®) and the MSCI World Index. One cannot invest directly in an index, and an index is not representative of the Fund��s portfolio.Please see Important Notes to Performance Information preceding the Fund Summaries.
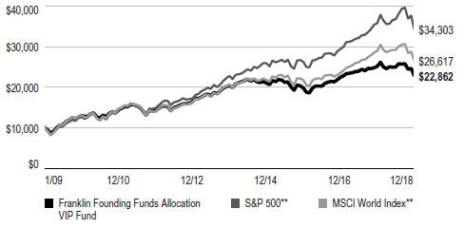
**Source: Morningstar. Please see Index Descriptions following the Fund Summaries.
FRANKLIN FOUNDING FUNDS ALLOCATION VIP FUND
Fund Goal and Main Investments
The Fund seeks capital appreciation, with income as a secondary goal. Under normal market conditions, the Fund invests equal portions in Class 1 shares of Franklin Income VIP Fund, Franklin Mutual Shares VIP Fund and Templeton Growth VIP Fund.
Fund Risks
All investments involve risks, including possible loss of principal. Because the Fund invests in underlying funds, and the Fund’s performance is directly related to the performance of the underlying funds held by it, the ability of the Fund to achieve its investment goals is directly related to the ability of the underlying funds to meet their investment goals. Additionally, because these underlying funds may engage in a variety of investment strategies involving certain risks, the Fund may be subject to these same risks. Stock prices fluctuate, sometimes rapidly and dramatically, due to factors affecting individual companies, particular industries or sectors, or general market conditions. Bonds are affected by changes in interest rates and the creditworthiness of their issuers. Bond prices generally move in the opposite direction of interest rates. Thus, as prices of bonds adjust to a rise in interest rates, the Fund’s share price may decline. Higher yielding, lower rated corporate bonds entail a greater degree of credit risk compared to investment-grade securities. Foreign investing carries additional risks such as currency and market volatility and political or social instability, risks that are heightened in developing countries. Value securities may not increase in price as anticipated or may decline further in value. The Fund’s prospectus also includes a description of the main investment risks.
Performance Overview
You can find the Fund’sone-year total return in the Performance Summary. In comparison, the S&P 500 had a-4.38% total return and the MSCI World Index had a-8.20% total return for the same period.1
Economic and Market Overview
The global economy expanded during the 12 months under review, despite weakness in certain regions. Global developed and emerging market stocks were aided at certain points during
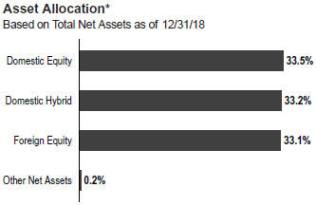
*The asset allocation is based on the Statement of Investments (SOI), which classifies each underlying fund into a broad asset class.
the period by higher crude oil prices, upbeat economic data, easing trade tensions and encouraging corporate earnings reports, as well as indications of a slower pace of interest-rate increases from the U.S. Federal Reserve (Fed).
However, various factors weighed on global markets during the period, including concerns about tighter regulation of technology companies, political uncertainties in the U.S. and the European Union, and major central banks’ interest-rate path and unwinding of monetary stimulus measures. Markets were further pressured by U.S. trade disputes with its allies and China, and their impact on global growth and corporate earnings. In this environment, global stocks, as measured by the MSCI All Country World Index, had a-8.93% total return for the 12 months ended December 31, 2018.1
The U.S. economy grew during the12-month period. After moderating for three consecutive quarters, the economy grew faster in 2018’s second quarter, driven by consumer spending, business investment, exports and government spending. However, growth moderated in the third quarter due to declines in exports and housing investment. The unemployment rate declined from 4.1% in December 2017 to 3.9% at period-end.2 Annual inflation, as measured by the Consumer Price Index, decreased from 2.1% in December 2017 to 1.9% at period-end.2 The Fed raised its target range for the federal funds rate four times during the period, to 2.25%–2.50%, and continued reducing its balance sheet as part of an ongoing plan to normalize monetary policy. At its December meeting, the
1. Source: Morningstar.
One cannot invest directly in an index, and an index is not representative of the Fund’s portfolio. Please see Index Descriptions following the Fund Summaries.
2. Source: US Bureau of Labor Statistics.
The dollar value, number of shares or principal amount, and names of all portfolio holdings are listed in the Fund’s Statement of Investments (SOI).
FRANKLIN FOUNDING FUNDS ALLOCATION VIP FUND
Fed reduced the projected 2019 rate increases to two, compared to three projected previously.
In Europe, the U.K.’s quarterly economic growth moderated in 2018’s first quarter, but accelerated in 2018’s second and third quarters. The Bank of England raised its key policy rate once during the review period. After moderating in 2018’s first quarter, the eurozone’s quarterly growth remained stable in the second quarter, but eased in the third quarter. The bloc’s annual inflation rate ended the period higher than in December 2017. The European Central Bank (ECB) kept its benchmark interest rate unchanged during the period. In December 2018, the ECB confirmed its plan to conclude its bond purchase program at the end of 2018 and reiterated it expects key interest rates to remain unchanged through the summer of 2019.
In Asia, Japan’s quarterly gross domestic product (GDP) grew in 2018’s second quarter, following a contraction in the first quarter, but contracted again in the third quarter. The Bank of Japan left its benchmark interest rate unchanged during the period and continued its monetary stimulus measures.
In emerging markets, Brazil’s quarterly GDP growth remained stable in 2018’s first and second quarters, but accelerated in the third quarter. The Central Bank of Brazil lowered its benchmark interest rate twice during the period. Russia’s annual GDP growth rate accelerated in 2018’s first and second quarters, but moderated in the third quarter. After lowering its key rate twice early in the period, the Bank of Russia raised it twice in the period’s second half to curtail inflation risks. China’s annual GDP grew at a stable rate in 2018’s first quarter, but it moderated in the second and third quarters. The People’s Bank of China left its benchmark interest rate unchanged during the period, but it took measures to improve financial liquidity to mitigate the negative effects of the U.S.-China trade dispute and support economic growth. Overall, emerging market stocks, as measured by the MSCI Emerging Markets Index, had a-14.25% total return during the period.1
Investment Strategy
The Fund normally invests its assets in an equally weighted combination of Class 1 shares of Franklin Income VIP Fund, Franklin Mutual Shares VIP Fund and Templeton Growth VIP Fund. These underlying funds, in turn, invest in a variety of U.S. and foreign equity securities and, to a lesser extent, fixed income and money market securities, each following a value-oriented approach. As market conditions affect the underlying funds, we rebalance the Fund’s allocations seeking to maintain equal weightings of approximately 331⁄3% of total net assets in each underlying fund whenever the actual
allocations exceed plus or minus 3% of the fixed allocation percentages.
Manager’s Discussion
The Fund’s performance can be attributed largely to its allocation among the underlying funds and their investments in domestic and foreign equities, fixed income securities, and short-term investments and other net assets.
During the 12 months under review, Franklin Income VIP Fund – Class 1 performed in line with the S&P 500 and Franklin Mutual Shares VIP Fund – Class 1 underperformed the index. Templeton Growth VIP Fund – Class 1 underperformed the MSCI World Index.
Thank you for your participation in Franklin Founding Funds Allocation VIP Fund. We look forward to serving your future investment needs.
The foregoing information reflects our analysis, opinions and portfolio holdings as of December 31, 2018, the end of the reporting period. The way we implement our main investment strategies and the resulting portfolio holdings may change depending on factors such as market and economic conditions. These opinions may not be relied upon as investment advice or an offer for a particular security. The information is not a complete analysis of every aspect of any market, country, industry, security or the Fund. Statements of fact are from sources considered reliable, but the investment manager makes no representation or warranty as to their completeness or accuracy. Although historical performance is no guarantee of future results, these insights may help you understand our investment management philosophy.
FRANKLIN FOUNDING FUNDS ALLOCATION VIP FUND
Class 1 Fund Expenses
As an investor in a variable insurance contract (Contract) that indirectly provides for investment in an underlying mutual fund, you can incur transaction and/or ongoing expenses at both the Fund level and the Contract Level: (1) transaction expenses can include sales charges (loads) on purchases, surrender fees, transfer fees and premium taxes; and (2) ongoing expenses can include management fees, distribution and service (12b-1) fees, contract fees, annual maintenance fees, mortality and expense risk fees and other fees and expenses. All mutual funds and Contracts have some types of ongoing expenses. The table below shows Fund-level ongoing expenses and can help you understand these costs and compare them with those of other mutual funds offered through the Contract. The table assumes a $1,000 investment held for the six months indicated. Please refer to the Fund prospectus for additional information on operating expenses.
Actual Fund Expenses
The table below provides information about the actual account values and actual expenses in the columns under the heading “Actual.” In these columns the Fund’s actual return, which includes the effect of ongoing Fund expenses but does not include the effect of ongoing Contract expenses, is used to calculate the “Ending Account Value.” You can estimate the Fund-level expenses you paid during the period by following these steps (ofcourse, your account value and expenses will differ from those in this illustration):Divide your account value by $1,000 (ifyour account had an $8,600 value, then $8,600 ÷ $1,000 = 8.6). Then multiply the result by the number under the headings “Actual” and “Fund-Level Expenses Paid During Period” (ifFund-Level Expenses Paid During Period were $ 7.50, then 8.6 × $7.50 = $64.50). In this illustration, the estimated expenses paid this period at the Fund level are $64.50.
Hypothetical Example for Comparison with Other Mutual Funds
Under the heading “Hypothetical” in the table, information is provided about hypothetical account values and hypothetical expenses based on the Fund’s actual expense ratio and an assumed rate of return of 5% per year before expenses, which is not the Fund’s actual return. This information may not be used to estimate the actual ending account balance or expenses you paid for the period, but it can help you compare ongoing costs of investing in the Fund with those of other mutual funds offered through the Contract. To do so, compare this 5% hypothetical example with the 5% hypothetical examples that appear in the shareholder reports of other funds offered through the Contract.
Please note that expenses shown in the table are meant to highlight ongoing costs at the Fund level only and do not reflect any ongoing expenses at the Contract level, or transaction expenses at either the Fund or Contract levels. In addition, while the Fund does not have transaction expenses, if the transaction and ongoing expenses at the Contract level were included, the expenses shown below would be higher. You should consult your Contract prospectus or disclosure document for more information.
| | | | | | | | | | | | | | | | | | | | | | | | | | | | | | | | |
| | | | | | |
| | | | | | Actual (actual return after expenses) | | | | | | Hypothetical (5% annual return before expenses) | | | | | | | |
| | | | | | | | |
Share Class | | Beginning Account
Value 7/1/18 | | | Ending Account
Value 12/31/18 | | | Fund-Level Expenses
Paid During Period
7/1/18–12/31/181,2 | | | | | | Ending Account
Value 12/31/18 | | | Fund-Level Expenses
Paid During Period
7/1/18–12/31/181,2 | | | | | | Net
Annualized
Expense
Ratio2 | |
Class 1 | | | $1,000 | | | | $913.90 | | | | $0.48 | | | | | | | | $1,024.70 | | | | $0.51 | | | | | | | | 0.10% | |
1. Expenses are equal to the annualized expense ratio for thesix-month period as indicated above — in the far right column — multiplied by the simple average account value over the period indicated, and then multiplied by 184/365 to reflect theone-half year period.
2. Reflects expenses after fee waivers and expense reimbursements. Does not include any ongoing expenses of the Contract for which the Fund is an investment option or acquired fund fees and expenses.
FFA P1 11/18
SUPPLEMENT DATED NOVEMBER 5, 2018
TO THE PROSPECTUS
DATED MAY 1, 2018
OF
FRANKLIN FOUNDING FUNDS ALLOCATION VIP FUND
(ASERIESOF FRANKLIN TEMPLETON VARIABLE INSURANCE PRODUCTS TRUST)
The prospectus is amended as follows:
I. The Board of Trustees of Franklin Templeton Variable Insurance Products Trust (Trust) recently approved a proposal to reposition the Franklin Founding Funds Allocation VIP Fund (Fund), a series of the Trust, subject to shareholder approval of certain matters. Among other things, the repositioning of the Fund as a directly managed allocation fund would involve entering into investment management andsub-advisory arrangements with various Franklin Templeton advisers, changing the name of the Fund to the “Franklin Allocation VIP Fund” and modifying the Fund’s principal investment strategies.
It is anticipated that in December 2018 shareholders of the Fund will receive a proxy statement requesting their votes on certain proposals related to the repositioning and other matters. If such proposals are approved by the Fund’s shareholders, the repositioning is currently expected to be completed on or about May 1, 2019.
The Fund reserves the right to change the above at any time.
Please keep this supplement with your prospectus for future reference.
FRANKLIN TEMPLETON VARIABLE INSURANCE PRODUCTS TRUST
Financial Highlights
Franklin Founding Funds Allocation VIP Fund
| | | | | | | | | | | | | | | | | | | | |
| |
| | | Year Ended December 31, | |
| | | | | |
| | | 2018 | | | 2017 | | | 2016 | | | 2015 | | | 2014 | |
| Class 1 | | | | | | | | | | | | | | | | | | | | |
Per share operating performance
(for a share outstanding throughout the year) | | | | | | | | | | | | | | | | | | | | |
| | | | | |
Net asset value, beginning of year | | | $ 7.44 | | | | $ 7.13 | | | | $ 6.80 | | | | $ 7.47 | | | | $ 7.47 | |
| | | | |
| | | | | |
| Income from investment operationsa: | | | | | | | | | | | | | | | | | | | | |
| | | | | |
Net investment incomeb,c | | | 0.23 | | | | 0.21 | | | | 0.21 | | | | 0.26 | | | | 0.22 | |
| | | | | |
Net realized and unrealized gains (losses) | | | (0.89 | ) | | | 0.63 | | | | 0.64 | | | | (0.68 | ) | | | 0.02 | |
| | | | |
Total from investment operations | | | (0.66 | ) | | | 0.84 | | | | 0.85 | | | | (0.42 | ) | | | 0.24 | |
| | | | |
| | | | | |
| Less distributions from: | | | | | | | | | | | | | | | | | | | | |
| | | | | |
Net investment income | | | (0.24 | ) | | | (0.22 | ) | | | (0.29 | ) | | | (0.24 | ) | | | (0.23 | ) |
| | | | | |
Net realized gains | | | (0.17 | ) | | | (0.31 | ) | | | (0.23 | ) | | | (0.01 | ) | | | (0.01 | ) |
| | | | |
Total distributions | | | (0.41 | ) | | | (0.53 | ) | | | (0.52 | ) | | | (0.25 | ) | | | (0.24 | ) |
| | | | |
Net asset value, end of year | | | $ 6.37 | | | | $ 7.44 | | | | $ 7.13 | | | | $ 6.80 | | | | $ 7.47 | |
| | | | |
| | | | | |
Total returnd | | | (9.34)% | | | | 12.17% | | | | 13.43% | | | | (5.93)% | | | | 3.05% | |
| | | | | |
| Ratios to average net assets | | | | | | | | | | | | | | | | | | | | |
| | | | | |
Expenses before waiver and payments by affiliatese | | | 0.12% | | | | 0.12% | | | | 0.11% | | | | 0.11% | | | | 0.11% | |
| | | | | |
Expenses net of waiver and payments by affiliatese | | | 0.10% | | | | 0.10% | | | | 0.10% | | | | 0.10% | | | | 0.10% | |
| | | | | |
Net investment incomec | | | 3.13% | | | | 2.75% | | | | 3.09% | | | | 3.51% | | | | 2.88% | |
| | | | | |
| Supplemental data | | | | | | | | | | | | | | | | | | | | |
| | | | | |
Net assets, end of year (000’s) | | | $984 | | | | $1,047 | | | | $1,025 | | | | $1,083 | | | | $1,114 | |
| | | | | |
Portfolio turnover rate | | | 2.23% | | | | 1.28% | | | | 0.10% | | | | 0.26% | | | | 4.80% | |
aThe amount shown for a share outstanding throughout the period may not correlate with the Statement of Operations for the period due to the timing of sales and repurchases of the Fund’s shares in relation to income earned and/or fluctuating fair value of the investments of the Fund.
bBased on average daily shares outstanding.
cRecognition of net investment income by the Fund is affected by the timing of declaration of dividends by the Underlying Funds in which the Fund invests.
dTotal return does not include fees, charges or expenses imposed by the variable annuity and life insurance contracts for which Franklin Templeton Variable Insurance Products Trust serves as an underlying investment vehicle.
eDoes not include expenses of the Underlying Funds in which the Fund invests. The weighted average indirect expenses of the Underlying Funds was 0.66% for the year ended December 31, 2018.
| | | | |
| | | |
| FFA-6 | | Annual Report | The accompanying notes are an integral part of these financial statements. | | |
FRANKLIN TEMPLETON VARIABLE INSURANCE PRODUCTS TRUST
FINANCIAL HIGHLIGHTS
Franklin Founding Funds Allocation VIP Fund(continued)
| | | | | | | | | | | | | | | | | | | | |
| |
| | | Year Ended December 31, | |
| | | | | |
| | | 2018 | | | 2017 | | | 2016 | | | 2015 | | | 2014 | |
Class 2 | | | | | | | | | | | | | | | | | | | | |
Per share operating performance
(for a share outstanding throughout the year) | | | | | | | | | | | | | | | | | | | | |
| | | | | |
Net asset value, beginning of year | | | $ 7.39 | | | | $ 7.08 | | | | $ 6.75 | | | | $ 7.42 | | | | $ 7.42 | |
| | | | |
| | | | | |
| Income from investment operationsa: | | | | | | | | | | | | | | | | | | | | |
| | | | | |
Net investment incomeb,c | | | 0.21 | | | | 0.18 | | | | 0.19 | | | | 0.24 | | | | 0.20 | |
| | | | | |
Net realized and unrealized gains (losses) | | | (0.89 | ) | | | 0.64 | | | | 0.64 | | | | (0.68 | ) | | | 0.02 | |
| | | | |
Total from investment operations | | | (0.68 | ) | | | 0.82 | | | | 0.83 | | | | (0.44 | ) | | | 0.22 | |
| | | | |
| | | | | |
| Less distributions from: | | | | | | | | | | | | | | | | | | | | |
| | | | | |
Net investment income | | | (0.22 | ) | | | (0.20 | ) | | | (0.27 | ) | | | (0.22 | ) | | | (0.21 | ) |
| | | | | |
Net realized gains | | | (0.17 | ) | | | (0.31 | ) | | | (0.23 | ) | | | (0.01 | ) | | | (0.01 | ) |
| | | | |
Total distributions | | | (0.39 | ) | | | (0.51 | ) | | | (0.50 | ) | | | (0.23 | ) | | | (0.22 | ) |
| | | | |
Net asset value, end of year | | | $ 6.32 | | | | $ 7.39 | | | | $ 7.08 | | | | $ 6.75 | | | | $ 7.42 | |
| | | | |
| | | | | |
Total returnd | | | (9.65)% | | | | 11.98% | | | | 13.18% | | | | (6.21)% | | | | 2.85% | |
| | | | | |
| Ratios to average net assets | | | | | | | | | | | | | | | | | | | | |
| | | | | |
Expenses before waiver and payments by affiliatese | | | 0.37% | | | | 0.37% | | | | 0.36% | | | | 0.36% | | | | 0.36% | |
| | | | | |
Expenses net of waiver and payments by affiliatese | | | 0.35% | | | | 0.35% | | | | 0.35% | | | | 0.35% | | | | 0.35% | |
| | | | | |
Net investment incomec | | | 2.88% | | | | 2.50% | | | | 2.84% | | | | 3.26% | | | | 2.63% | |
| | | | | |
| Supplemental data | | | | | | | | | | | | | | | | | | | | |
| | | | | |
Net assets, end of year (000’s) | | | $390,300 | | | | $480,402 | | | | $474,669 | | | | $480,715 | | | | $557,704 | |
| | | | | |
Portfolio turnover rate | | | 2.23% | | | | 1.28% | | | | 0.10% | | | | 0.26% | | | | 4.80% | |
aThe amount shown for a share outstanding throughout the period may not correlate with the Statement of Operations for the period due to the timing of sales and repurchases of the Fund’s shares in relation to income earned and/or fluctuating fair value of the investments of the Fund.
bBased on average daily shares outstanding.
cRecognition of net investment income by the Fund is affected by the timing of declaration of dividends by the Underlying Funds in which the Fund invests.
dTotal return does not include fees, charges or expenses imposed by the variable annuity and life insurance contracts for which Franklin Templeton Variable Insurance Products Trust serves as an underlying investment vehicle.
eDoes not include expenses of the Underlying Funds in which the Fund invests. The weighted average indirect expenses of the Underlying Funds was 0.66% for the year ended December 31, 2018.
| | | | | | |
| | | |
| | The accompanying notes are an integral part of these financial statements. | Annual Report | | | FFA-7 | |
FRANKLIN TEMPLETON VARIABLE INSURANCE PRODUCTS TRUST
FINANCIAL HIGHLIGHTS
Franklin Founding Funds Allocation VIP Fund(continued)
| | | | | | | | | | | | | | | | | | | | |
| |
| | | Year Ended December 31, | |
| | | | | |
| | | 2018 | | | 2017 | | | 2016 | | | 2015 | | | 2014 | |
| Class 4 | | | | | | | | | | | | | | | | | | | | |
Per share operating performance
(for a share outstanding throughout the year) | | | | | | | | | | | | | | | | | | | | |
| | | | | |
Net asset value, beginning of year | | | $ 7.53 | | | | $ 7.21 | | | | $ 6.87 | | | | $ 7.54 | | | | $ 7.54 | |
| | | | |
| | | | | |
| Income from investment operationsa: | | | | | | | | | | | | | | | | | | | | |
| | | | | |
Net investment incomeb,c | | | 0.20 | | | | 0.18 | | | | 0.19 | | | | 0.23 | | | | 0.20 | |
| | | | | |
Net realized and unrealized gains (losses) | | | (0.89 | ) | | | 0.64 | | | | 0.64 | | | | (0.68 | ) | | | 0.02 | |
| | | | |
Total from investment operations | | | (0.69 | ) | | | 0.82 | | | | 0.83 | | | | (0.45 | ) | | | 0.22 | |
| | | | |
| | | | | |
| Less distributions from: | | | | | | | | | | | | | | | | | | | | |
| | | | | |
Net investment income | | | (0.21 | ) | | | (0.19 | ) | | | (0.26 | ) | | | (0.21 | ) | | | (0.21 | ) |
| | | | | |
Net realized gains | | | (0.17 | ) | | | (0.31 | ) | | | (0.23 | ) | | | (0.01 | ) | | | (0.01 | ) |
| | | | |
Total distributions | | | (0.38 | ) | | | (0.50 | ) | | | (0.49 | ) | | | (0.22 | ) | | | (0.22 | ) |
| | | | |
Net asset value, end of year | | | $ 6.46 | | | | $ 7.53 | | | | $ 7.21 | | | | $ 6.87 | | | | $ 7.54 | |
| | | | |
| | | | | |
Total returnd | | | (9.58)% | | | | 11.78% | | | | 12.92% | | | | (6.24)% | | | | 2.75% | |
| | | | | |
| Ratios to average net assets | | | | | | | | | | | | | | | | | | | | |
| | | | | |
Expenses before waiver and payments by affiliatese | | | 0.47% | | | | 0.47% | | | | 0.46% | | | | 0.46% | | | | 0.46% | |
| | | | | |
Expenses net of waiver and payments by affiliatese | | | 0.45% | | | | 0.45% | | | | 0.45% | | | | 0.45% | | | | 0.45% | |
| | | | | |
Net investment incomec | | | 2.78% | | | | 2.40% | | | | 2.74% | | | | 3.16% | | | | 2.53% | |
| | | | | |
| Supplemental data | | | | | | | | | | | | | | | | | | | | |
| | | | | |
Net assets, end of year (000’s) | | | $393,385 | | | | $528,862 | | | | $530,403 | | | | $550,825 | | | | $702,324 | |
| | | | | |
Portfolio turnover rate | | | 2.23% | | | | 1.28% | | | | 0.10% | | | | 0.26% | | | | 4.80% | |
aThe amount shown for a share outstanding throughout the period may not correlate with the Statement of Operations for the period due to the timing of sales and repurchases of the Fund’s shares in relation to income earned and/or fluctuating fair value of the investments of the Fund.
bBased on average daily shares outstanding.
cRecognition of net investment income by the Fund is affected by the timing of declaration of dividends by the Underlying Funds in which the Fund invests.
dTotal return does not include fees, charges or expenses imposed by the variable annuity and life insurance contracts for which Franklin Templeton Variable Insurance Products Trust serves as an underlying investment vehicle.
eDoes not include expenses of the Underlying Funds in which the Fund invests. The weighted average indirect expenses of the Underlying Funds was 0.66% for the year ended December 31, 2018.
| | | | |
| | | |
| FFA-8 | | Annual Report | The accompanying notes are an integral part of these financial statements. | | |
FRANKLIN TEMPLETON VARIABLE INSURANCE PRODUCTS TRUST
Statement of Investments, December 31, 2018
| | | | | | | | | | |
Franklin Founding Funds Allocation VIP Fund | |
| | | | | Shares | | | Value | |
| | | |
| | Investments in Underlying Funds 99.8% | | | | | | | | |
| | | Domestic Equity 33.5% | | | | | | |
| a | | Franklin Mutual Shares VIP Fund, Class 1 | | | 14,842,790 | | | $ | 262,865,813 | |
| | | | | | | | | | |
| | | Domestic Hybrid 33.2% | | | | | | |
| a | | Franklin Income VIP Fund, Class 1 | | | 17,074,938 | | | | 260,563,549 | |
| | | | | | | | | | |
| | | Foreign Equity 33.1% | | | | | | |
| a | | Templeton Growth VIP Fund, Class 1 | | | 20,860,740 | | | | 259,507,605 | |
| | | | | | | | | | |
| | | |
| | Total Investments in Underlying Funds (Cost $ 638,939,461) | | | | | | | 782,936,967 | |
| | | |
| | Other Assets, less Liabilities 0.2% | | | | | | | 1,731,903 | |
| | | | | | | | | | |
| | | |
| | Net Assets 100.0% | | | | | | $ | 784,668,870 | |
| | | | | | | | | | |
aSee Note 3(d) regarding investments in Underlying Funds.
| | | | | | |
| | | |
| | The accompanying notes are an integral part of these financial statements. | Annual Report | | | FFA-9 | |
FRANKLIN TEMPLETON VARIABLE INSURANCE PRODUCTS TRUST
Financial Statements
Statement of Assets and Liabilities
December 31, 2018
| | | | |
| |
| | | Franklin Founding
Funds Allocation
VIP Fund | |
Assets: | | | | |
Investments in securities: | | | | |
Cost - Controlled affiliates (Note 3d) | | $ | 202,630,726 | |
Cost -Non-controlled affiliates (Note 3d) | | | 436,308,735 | |
| | | | |
Value - Controlled affiliates (Note 3d) | | $ | 259,507,605 | |
Value -Non-controlled affiliates (Note 3d) | | | 523,429,362 | |
Cash | | | 1,652,238 | |
Receivables: | | | | |
Investment securities sold | | | 100,000 | |
Capital shares sold | | | 915,922 | |
Other assets | | | 116 | |
| | | | |
Total assets | | | 785,605,243 | |
| | | | |
Liabilities: | | | | |
Payables: | | | | |
Capital shares redeemed | | | 383,351 | |
Administrative fees | | | 60,130 | |
Distribution fees | | | 414,196 | |
Reports to shareholders | | | 48,959 | |
Accrued expenses and other liabilities | | | 29,737 | |
| | | | |
Total liabilities | | | 936,373 | |
| | | | |
Net assets, at value | | $ | 784,668,870 | |
| | | | |
Net assets consist of: | | | | |
Paid-in capital | | $ | 598,839,513 | |
Total distributable earnings (loss) | | | 185,829,357 | |
| | | | |
Net assets, at value | | $ | 784,668,870 | |
| | | | |
| |
| Class 1: | | | | |
Net assets, at value | | $ | 984,078 | |
| | | | |
Shares outstanding | | | 154,435 | |
| | | | |
Net asset value and maximum offering price per share | | $ | 6.37 | |
| | | | |
| |
| Class 2: | | | | |
Net assets, at value | | $ | 390,300,175 | |
| | | | |
Shares outstanding | | | 61,729,115 | |
| | | | |
Net asset value and maximum offering price per share | | $ | 6.32 | |
| | | | |
| |
| Class 4: | | | | |
Net assets, at value | | $ | 393,384,617 | |
| | | | |
Shares outstanding | | | 60,922,444 | |
| | | | |
Net asset value and maximum offering price per share | | $ | 6.46 | |
| | | | |
| | | | |
| | | |
| FFA-10 | | Annual Report | The accompanying notes are an integral part of these financial statements. | | |
FRANKLIN TEMPLETON VARIABLE INSURANCE PRODUCTS TRUST
FINANCIAL STATEMENTS
Statement of Operations
for the year ended December 31, 2018
| | | | |
| |
| | | Franklin Founding
Funds Allocation
VIP Fund | |
Investment income: | | | | |
Dividends: | | | | |
Controlled affiliates (Note 3d) | | $ | 6,862,014 | |
Non-controlled affiliates (Note 3d) | | | 23,048,469 | |
| | | | |
Total investment income | | | 29,910,483 | |
| | | | |
Expenses: | | | | |
Administrative fees (Note 3a) | | | 925,679 | |
Distribution fees: (Note 3b) | | | | |
Class 2 | | | 1,122,300 | |
Class 4 | | | 1,671,408 | |
Reports to shareholders | | | 82,848 | |
Professional fees | | | 37,428 | |
Trustees’ fees and expenses | | | 6,835 | |
Other | | | 20,588 | |
| | | | |
Total expenses | | | 3,867,086 | |
Expenses waived/paid by affiliates (Note 3e) | | | (145,358 | ) |
| | | | |
Net expenses | | | 3,721,728 | |
| | | | |
Net investment income | | | 26,188,755 | |
| | | | |
Realized and unrealized gains (losses): | | | | |
Net realized gain (loss) from: | | | | |
Investments: | | | | |
Controlled affiliates (Note 3d) | | | 8,019,382 | |
Non-controlled affiliates (Note 3d) | | | 12,999,950 | |
Capital gain distributions from Underlying Funds: | | | | |
Controlled affiliates (Note 3d) | | | 25,478,331 | |
Non-controlled affiliates (Note 3d) | | | 10,870,531 | |
| | | | |
Net realized gain (loss) | | | 57,368,194 | |
| | | | |
Net change in unrealized appreciation (depreciation) on: | | | | |
Investments: | | | | |
Controlled affiliates (Note 3d) | | | (83,880,006 | ) |
Non-controlled affiliates (Note 3d) | | | (82,426,366 | ) |
| | | | |
Net change in unrealized appreciation (depreciation) | | | (166,306,372 | ) |
| | | | |
Net realized and unrealized gain (loss) | | | (108,938,178 | ) |
| | | | |
Net increase (decrease) in net assets resulting from operations | | $ | (82,749,423 | ) |
| | | | |
| | | | | | |
| | | |
| | The accompanying notes are an integral part of these financial statements. | Annual Report | | | FFA-11 | |
FRANKLIN TEMPLETON VARIABLE INSURANCE PRODUCTS TRUST
FINANCIAL STATEMENTS
Statements of Changes in Net Assets
| | | | | | | | |
| |
| | | Franklin Founding Funds Allocation VIP Fund | |
| |
| | | Year Ended December 31, | |
| | |
| | | 2018 | | | 2017 | |
Increase (decrease) in net assets: | | | | | | | | |
Operations: | | | | | | | | |
Net investment income | | $ | 26,188,755 | | | $ | 25,006,932 | |
Net realized gain (loss) | | | 57,368,194 | | | | 32,208,741 | |
Net change in unrealized appreciation (depreciation) | | | (166,306,372 | ) | | | 57,408,783 | |
| | | | |
Net increase (decrease) in net assets resulting from operations | | | (82,749,423 | ) | | | 114,624,456 | |
| | | | |
Distributions to shareholders: (Note 1c) | | | | | | | | |
Class 1 | | | (60,348 | ) | | | (77,907 | ) |
Class 2 | | | (24,442,861 | ) | | | (33,015,869 | ) |
Class 4 | | | (24,951,975 | ) | | | (35,554,538 | ) |
| | | | |
Total distributions to shareholders | | | (49,455,184 | ) | | | (68,648,314 | ) |
| | | | |
Capital share transactions: (Note 2) | | | | | | | | |
Class 1 | | | 99,087 | | | | (23,477 | ) |
Class 2 | | | (25,472,556 | ) | | | (15,665,134 | ) |
Class 4 | | | (68,063,868 | ) | | | (26,073,212 | ) |
| | | | |
Total capital share transactions | | | (93,437,337 | ) | | | (41,761,823 | ) |
| | | | |
Net increase (decrease) in net assets | | | (225,641,944 | ) | | | 4,214,319 | |
Net assets: | | | | | | | | |
Beginning of year | | | 1,010,310,814 | | | | 1,006,096,495 | |
| | | | |
End of year (Note 1c) | | $ | 784,668,870 | | | $ | 1,010,310,814 | |
| | | | |
| | | | |
| | | |
| FFA-12 | | Annual Report | The accompanying notes are an integral part of these financial statements. | | |
FRANKLIN TEMPLETON VARIABLE INSURANCE PRODUCTS TRUST
Notes to Financial Statements
Franklin Founding Funds Allocation VIP Fund
1. Organization and Significant Accounting Policies
Franklin Templeton Variable Insurance Products Trust (Trust) is registered under the Investment Company Act of 1940 (1940 Act) as anopen-end management investment company, consisting of eighteen separate funds and applies the specialized accounting and reporting guidance in U.S. Generally Accepted Accounting Principles (U.S. GAAP). Franklin Founding Funds Allocation VIP Fund (Fund) is included in this report. The Fund invests primarily in other funds of the Trust (Underlying Funds). Shares of the Fund are generally sold only to insurance company separate accounts to fund the benefits of variable life insurance policies or variable annuity contracts. The Fund offers three classes of shares: Class 1, Class 2 and Class 4. Each class of shares may differ by its distribution fees, voting rights on matters affecting a single class and its exchange privilege.
The accounting policies of the Underlying Funds are outlined in their respective shareholder reports. A copy of the Underlying Funds’ shareholder reports is available on the U.S. Securities and Exchange Commission (SEC) website at sec.gov. The Underlying Funds’ shareholder reports are not covered by this report.
The following summarizes the Fund’s significant accounting policies.
a. Financial Instrument Valuation
The Fund’s investments in financial instruments are carried at fair value daily. Fair value is the price that would be received to sell an asset or paid to transfer a liability in an orderly transaction between market participants on the measurement date. The Fund calculates the net asset value (NAV) per share each business day as of 4 p.m. Eastern time or the regularly scheduled close of the New York Stock Exchange (NYSE), whichever is earlier. Under compliance policies and procedures approved by the Trust’s Board of Trustees (the Board), the Fund’s administrator has responsibility for oversight of valuation, including leading the cross-functional Valuation Committee (VC). The Fund may utilize independent pricing services, quotations from securities and financial instrument dealers, and other market sources to determine fair value.
Investments in the Underlying Funds are valued at their closing NAV each trading day.
b. Income Taxes
It is the Fund’s policy to qualify as a regulated investment company under the Internal Revenue Code. The Fund intends to distribute to shareholders substantially all of its taxable income and net realized gains to relieve it from federal income and if applicable, excise taxes. As a result, no provision for U.S. federal income taxes is required.
The Fund may recognize an income tax liability related to its uncertain tax positions under U.S. GAAP when the uncertain tax position has a less than 50% probability that it will be sustained upon examination by the tax authorities based on its technical merits. As of December 31, 2018, the Fund has determined that no tax liability is required in its financial statements related to uncertain tax positions for any open tax years (or expected to be taken in future tax years). Open tax years are those that remain subject to examination and are based on the statute of limitations in each jurisdiction in which the Fund invests.
c. Security Transactions, Investment Income, Expenses and Distributions
Security transactions are accounted for on trade date. Realized gains and losses on security transactions are determined on a specific identification basis. Estimated expenses are accrued daily. Dividend income and capital gain distributions by Underlying Funds are recorded on theex-dividend date. Distributions to shareholders are recorded on theex-dividend date. Distributable earnings are determined according to income tax regulations (tax basis) and may differ from earnings recorded in accordance with U.S. GAAP. These differences may be permanent or temporary. Permanent differences are reclassified among capital accounts to reflect their tax character. These reclassifications have no impact on net assets or the results of operations. Temporary differences are not reclassified, as they may reverse in subsequent periods.*
Common expenses incurred by the Trust are allocated among the Funds based on the ratio of net assets of each Fund to the combined net assets of the Trust or based on the ratio of number of shareholders of each Fund to the combined number of shareholders of the Trust. Fund specific expenses are charged directly to the Fund that incurred the expense.
FRANKLIN TEMPLETON VARIABLE INSURANCE PRODUCTS TRUST
NOTES TO FINANCIAL STATEMENTS
Franklin Founding Funds Allocation VIP Fund(continued)
1. Organization and Significant Accounting Policies(continued)
c. Security Transactions, Investment Income, Expenses and Distributions(continued)
The Fund indirectly bears its proportionate share of expenses from the Underlying Funds. Since the Underlying Funds have varied expense levels and the Fund may own different proportions of the Underlying Funds at different times, the amount of expenses incurred indirectly by the Fund will vary.
Realized and unrealized gains and losses and net investment income, excluding class specific expenses, are allocated daily to each class of shares based upon the relative proportion of net assets of each class. Differences in per share distributions by class are generally due to differences in class specific expenses.
d. Accounting Estimates
The preparation of financial statements in accordance with U.S. GAAP requires management to make estimates and assumptions that affect the reported amounts of assets and
liabilities at the date of the financial statements and the amounts of income and expenses during the reporting period. Actual results could differ from those estimates.
e. Guarantees and Indemnifications
Under the Trust’s organizational documents, its officers and trustees are indemnified by the Trust against certain liabilities arising out of the performance of their duties to the Trust. Additionally, in the normal course of business, the Trust, on behalf of the Fund, enters into contracts with service providers that contain general indemnification clauses. The Trust’s maximum exposure under these arrangements is unknown as this would involve future claims that may be made against the Trust that have not yet occurred. Currently, the Trust expects the risk of loss to be remote.
*Effective during the current reporting period, it is no longer required to present certain line items in the Statements of Changes in Net Assets. The below prior period amounts affected by this change are shown as they were in the prior year Statements of Changes in Net Assets.
For the year ended December 31, 2017, distributions to shareholders were as follows:
| | | | |
Distributions from net investment income: | | | | |
Class 1 | | $ | (32,261 | ) |
Class 2 | | | (12,990,591 | ) |
Class 4 | | | (13,655,260 | ) |
Distributions from net realized gains: | | | | |
Class 1 | | | (45,646 | ) |
Class 2 | | | (20,025,278 | ) |
Class 4 | | | (21,899,278 | ) |
For the year ended December 31, 2017, undistributed net investment income included in net assets was $27,465,052.
FRANKLIN TEMPLETON VARIABLE INSURANCE PRODUCTS TRUST
NOTES TO FINANCIAL STATEMENTS
Franklin Founding Funds Allocation VIP Fund(continued)
2. Shares of Beneficial Interest
At December 31, 2018, there were an unlimited number of shares authorized (without par value). Transactions in the Fund’s shares were as follows:
| | | | | | | | | | | | | | | | | | | | |
| |
| | | Year Ended December 31, | |
| | | |
| | | 2018 | | | | | | 2017 | |
| | | | | |
| | | Shares | | | Amount | | | | | | Shares | | | Amount | |
| | | | | |
| Class 1 Shares: | | | | | | | | | | | | | | | | | | | | |
Shares sold | | | 17,451 | | | $ | 125,360 | | | | | | | | 15,386 | | | $ | 112,506 | |
Shares issued in reinvestment of distributions | | | 8,536 | | | | 60,348 | | | | | | | | 11,035 | | | | 77,907 | |
Shares redeemed | | | (12,205 | ) | | | (86,621 | ) | | | | | | | (29,626 | ) | | | (213,890 | ) |
| | | | |
Net increase (decrease) | | | 13,782 | | | $ | 99,087 | | | | | | | | (3,205 | ) | | $ | (23,477 | ) |
| | | | |
| Class 2 Shares: | | | | | | | | | | | | | | | | | | | | |
Shares sold | | | 4,193,705 | | | $ | 28,329,864 | | | | | | | | 3,596,772 | | | $ | 26,184,474 | |
Shares issued in reinvestment of distributions | | | 3,476,936 | | | | 24,442,861 | | | | | | | | 4,703,115 | | | | 33,015,869 | |
Shares redeemed | | | (10,985,773 | ) | | | (78,245,281 | ) | | | | | | | (10,329,852 | ) | | | (74,865,477 | ) |
| | | | |
Net increase (decrease) | | | (3,315,132 | ) | | $ | (25,472,556 | ) | | | | | | | (2,029,965 | ) | | $ | (15,665,134 | ) |
| | | | |
| Class 4 Shares: | | | | | | | | | | | | | | | | | | | | |
Shares sold | | | 1,130,901 | | | $ | 8,277,821 | | | | | | | | 2,459,253 | | | $ | 18,233,389 | |
Shares issued in reinvestment of distributions | | | 3,475,205 | | | | 24,951,975 | | | | | | | | 4,965,718 | | | | 35,554,538 | |
Shares redeemed | | | (13,897,304 | ) | | | (101,293,664 | ) | | | | | | | (10,802,755 | ) | | | (79,861,139 | ) |
| | | | |
Net increase (decrease) | | | (9,291,198 | ) | | $ | (68,063,868 | ) | | | | | | | (3,377,784 | ) | | $ | (26,073,212 | ) |
| | | | |
3. Transactions with Affiliates
Franklin Resources, Inc. is the holding company for various subsidiaries that together are referred to as Franklin Templeton. Certain officers and/or trustees of the Fund are also officers and directors of the following subsidiaries:
| | |
| |
| Subsidiary | | Affiliation |
Franklin Templeton Services, LLC (FT Services) | | Administrative manager |
Franklin Templeton Distributors, Inc. (Distributors) | | Principal underwriter |
Franklin Templeton Investor Services, LLC (Investor Services) | | Transfer agent |
a. Administrative Fees
The Fund pays an administrative fee to FT Services of 0.10% per year of the average daily net assets of the Fund for administrative services including monitoring and rebalancing the percentage of the Fund’s investments in the Underlying Funds.
b. Distribution Fees
The Board has adopted distribution plans for Class 2 and Class 4 shares pursuant to Rule 12b-1 under the 1940 Act. Under the Fund’s compensation distribution plans, the Fund pays Distributors for costs incurred in connection with the servicing, sale and distribution of the Fund’s shares up to 0.35% per year of its average daily net assets of each class. The Board has agreed to limit the current rate to 0.25% per year for Class 2. The plan year, for purposes of monitoring compliance with the maximum annual plan rates, is February 1 through January 31.
(continued)
3. Transactions with Affiliates(continued)
c. Transfer Agent Fees
Investor Services, under terms of an agreement, performs shareholder servicing for the Fund and is not paid by the Fund for the services.
d. Investments in Underlying Funds
The Fund invests in Underlying Funds which are managed by affiliates of the Fund’s administrative manager, FT Services. The Fund does not invest in Underlying Funds for the purpose of exercising a controlling influence over the management or policies.
Investments in Underlying Funds for the year ended December 31, 2018, were as follows:
| | | | | | | | | | | | | | | | | | | | | | | | | | | | | | | | |
| | | | | | | | |
| Underlying Funds | | Number of Shares Held at Beginning of Year | | | Gross Additions | | | Gross Reductions | | | Number of Shares Held at End of Year | | | Value at End of Year | | | Dividend Income | | | Realized Gain (Loss) | | | Net Change in Unrealized Appreciation (Depreciation) | |
| Controlled Affiliates | | | | | | | | | | | | | | | | | | | | | | | | | | | | | | | | |
Templeton Growth VIP Fund, Class 1 | | | 20,714,775 | | | | 2,870,791 | | | | (2,724,826 | ) | | | 20,860,740 | | | $ | 259,507,605 | | | $ | 6,862,014 | | | $ | 33,497,713 | a | | $ | (83,880,006 | ) |
| | | | | | | | | | | | | | | | | | | | |
| Non-Controlled Affiliates | | | | | | | | | | | | | | | | | | | | | | | | | | | | | | | | |
Franklin Income VIP Fund, Class 1 | | | 20,134,973 | | | | 1,315,294 | | | | (4,375,329 | ) | | | 17,074,938 | | | | 260,563,549 | | | | 15,250,044 | | | | 5,211,707 | | | | (31,570,800 | ) |
Franklin Mutual Shares VIP Fund, Class 1 | | | 16,254,912 | | | | 1,268,701 | | | | (2,680,823 | ) | | | 14,842,790 | | | | 262,865,813 | | | | 7,798,425 | | | | 18,658,774 | a | | | (50,855,566 | ) |
| | | | | | | | | | | | | | | | | | | | |
TotalNon-Controlled Affiliates | | | | | | | | | | | | | | | | | | $ | 523,429,362 | | | $ | 23,048,469 | | | $ | 23,870,481 | | | $ | (82,426,366 | ) |
| | | | | | | | | | | | | | | | | | | | |
Total Affiliated Securities | | | | | | | | | | | | | | | | | | $ | 782,936,967 | | | $ | 29,910,483 | | | $ | 57,368,194 | | | $ | (166,306,372 | ) |
| | | | | | | | | | | | | | | | | | | | |
aIncludes capital gain distributions received.
e. Waiver and Expense Reimbursements
FT Services has contractually agreed in advance to waive or limit its fees and to assume as its own expense certain expenses otherwise payable by the Fund so that the expenses (excluding distribution fees, and acquired fund fees and expenses) and certainnon-routine expenses or costs, including those relating to litigation, indemnification, reorganizations, and liquidations) for each class of the Fund do not exceed 0.10%, based on the average net assets of each class until April 30, 2019. Total expenses waived or paid are not subject to recapture subsequent to the Fund’s fiscal year end.
4. Income Taxes
The tax character of distributions paid during the years ended December 31, 2018 and 2017, was as follows:
| | | | | | | | |
| | |
| | | 2018 | | | 2017 | |
Distributions paid from: | | | | | | | | |
Ordinary income | | $ | 29,280,715 | | | $ | 28,262,149 | |
Long term capital gain | | | 20,174,469 | | | | 40,386,165 | |
| | | | |
| | $ | 49,455,184 | | | $ | 68,648,314 | |
| | | | |
FRANKLIN TEMPLETON VARIABLE INSURANCE PRODUCTS TRUST
NOTES TO FINANCIAL STATEMENTS
Franklin Founding Funds Allocation VIP Fund(continued)
At December 31, 2018, the cost of investments, net unrealized appreciation (depreciation), undistributed ordinary income and undistributed long term capital gains for income tax purposes were as follows:
| | | | |
Cost of investments | | $ | 678,111,544 | |
| | | | |
Unrealized appreciation | | $ | 143,997,507 | |
Unrealized depreciation | | | (39,172,084 | ) |
| | | | |
Net unrealized appreciation (depreciation) | | $ | 104,825,423 | |
| | | | |
Distributable earnings: | | | | |
Undistributed ordinary income | | $ | 28,490,096 | |
Undistributed long term capital gains | | | 52,513,831 | |
| | | | |
Total distributable earnings | | $ | 81,003,927 | |
| | | | |
Differences between income and/or capital gains as determined on a book basis and a tax basis are primarily due to differing treatments of short term capital gains distributions from Underlying Funds and wash sales.
5. Investment Transactions
Purchases and sales of Underlying Funds (excluding short term securities) for the year ended December 31, 2018, aggregated $20,600,000 and $168,339,264, respectively.
6. Credit Facility
The Fund, together with other U.S. registered and foreign investment funds (collectively, Borrowers), managed by Franklin Templeton, are borrowers in a joint syndicated senior unsecured credit facility totaling $2 billion (Global Credit Facility) which matured on February 8, 2019. This Global Credit Facility provides a source of funds to the Borrowers for temporary and emergency purposes, including the ability to meet future unanticipated or unusually large redemption requests. Effective February 8, 2019, the Borrowers renewed the Global Credit Facility for a one year term, maturing February 7, 2020, for a total of $2 billion.
Under the terms of the Global Credit Facility, the Fund shall, in addition to interest charged on any borrowings made by the Fund and other costs incurred by the Fund, pay its share of fees and expenses incurred in connection with the implementation and maintenance of the Global Credit Facility, based upon its relative share of the aggregate net assets of all of the Borrowers, including an annual commitment fee of 0.15% based upon the unused portion of the Global Credit Facility. These fees are reflected in other expenses in the Statement of Operations. During the year ended December 31, 2018, the Fund did not use the Global Credit Facility.
7. Fair Value Measurements
The Fund follows a fair value hierarchy that distinguishes between market data obtained from independent sources (observable inputs) and the Fund’s own market assumptions (unobservable inputs). These inputs are used in determining the value of the Fund’s financial instruments and are summarized in the following fair value hierarchy:
| | • | | Level 1 – quoted prices in active markets for identical financial instruments |
| | • | | Level 2 – other significant observable inputs (including quoted prices for similar financial instruments, interest rates, prepayment speed, credit risk, etc.) |
| | • | | Level 3 – significant unobservable inputs (including the Fund’s own assumptions in determining the fair value of financial instruments) |
The input levels are not necessarily an indication of the risk or liquidity associated with financial instruments at that level.
FRANKLIN TEMPLETON VARIABLE INSURANCE PRODUCTS TRUST
NOTES TO FINANCIAL STATEMENTS
Franklin Founding Funds Allocation VIP Fund(continued)
7. Fair Value Measurements(continued)
At December 31, 2018 , all of the Fund’s investments in financial instruments carried at fair value were valued using Level 1 inputs. For detailed categories, see the accompanying Statement of Investments.
8. Subsequent Events
The Fund has evaluated subsequent events through the issuance of the financial statements and determined that no events have occurred that require disclosure other than those already disclosed in the financial statements, except for the following:
On October 23, 2018, the Board approved a plan to reposition the Fund to a direct investment fund with an actively managed dynamic allocation strategy. This will involve entering into an investment management arrangement with Franklin Advisers, Inc. (Advisers) andsub-advisory arrangements with various Franklin Templeton affiliated advisers, changing the name of the Fund to “Franklin Allocation VIP Fund” and modifying the Fund’s principal investment strategies. The services to be provided by Advisers to the Fund will include investment advisory services as well as administrative services, for which the Fund would pay an overall investment management fee of 0.55%. Thesub-advisory fees are paid by Advisers and are not an additional expense to the Fund. The repositioning was approved by the shareholders on January 17, 2019 and is expected to be completed on or about May 1, 2019.
FRANKLIN TEMPLETON VARIABLE INSURANCE PRODUCTS TRUST
Report of Independent Registered Public Accounting Firm
To the Board of Trustees of Franklin Templeton Variable Insurance Products Trust and Shareholders of Franklin Founding Funds Allocation VIP Fund
Opinion on the Financial Statements
We have audited the accompanying statement of assets and liabilities, including the statement of investments, of Franklin Founding Funds Allocation VIP Fund (the “Fund”) as of December 31, 2018, the related statement of operations for the year ended December 31, 2018, the statement of changes in net assets for each of the two years in the period ended December 31, 2018, including the related notes, and the financial highlights for each of the five years in the period ended December 31, 2018 (collectively referred to as the “financial statements”). In our opinion, the financial statements present fairly, in all material respects, the financial position of the Fund as of December 31, 2018, the results of its operations for the year then ended, the changes in its net assets for each of the two years in the period ended December 31, 2018 and the financial highlights for each of the five years in the period ended December 31, 2018 in conformity with accounting principles generally accepted in the United States of America.
Basis for Opinion
These financial statements are the responsibility of the Fund’s management. Our responsibility is to express an opinion on the Fund’s financial statements based on our audits. We are a public accounting firm registered with the Public Company Accounting Oversight Board (United States) (PCAOB) and are required to be independent with respect to the Fund in accordance with the U.S. federal securities laws and the applicable rules and regulations of the Securities and Exchange Commission and the PCAOB.
We conducted our audits of these financial statements in accordance with the standards of the PCAOB. Those standards require that we plan and perform the audit to obtain reasonable assurance about whether the financial statements are free of material misstatement, whether due to error or fraud.
Our audits included performing procedures to assess the risks of material misstatement of the financial statements, whether due to error or fraud, and performing procedures that respond to those risks. Such procedures included examining, on a test basis, evidence regarding the amounts and disclosures in the financial statements. Our audits also included evaluating the accounting principles used and significant estimates made by management, as well as evaluating the overall presentation of the financial statements. Our procedures included confirmation of securities owned as of December 31, 2018 by correspondence with the transfer agent. We believe that our audits provide a reasonable basis for our opinion.
PricewaterhouseCoopers LLP
San Francisco, California
February 15, 2019
We have served as the auditor of one or more investment companies in the Franklin Templeton Group of Funds since 1948.
FRANKLIN TEMPLETON VARIABLE INSURANCE PRODUCTS TRUST
Tax Information (unaudited)
Franklin Founding Funds Allocation VIP Fund
Under Section 852(b)(3)(C) of the Internal Revenue Code, the Fund hereby reports the maximum amount allowable but no less than $20,174,469 as a long term capital gain dividend for the fiscal year ended December 31, 2018.
Under Section 854(b)(1)(A) of the Internal Revenue Code, the Fund hereby reports 30.36% of the ordinary income dividends as income qualifying for the dividends received deduction for the fiscal year ended December 31, 2018.
During the year ended December 31, 2018, the Fund, a qualified fund of funds under Section 852(g)(2) of the Internal Revenue Code, received an allocation of foreign taxes paid from one or more of its underlying funds. The Fund elects to treat foreign taxes paid as allowed under Section 853 of the Internal Revenue Code. This election will allow shareholders of record as of the 2019 distribution date, to treat its proportionate share of foreign taxes paid by the underlying funds as having been paid directly by them. The shareholder shall consider these amounts as foreign taxes paid in the tax year in which they receive the Fund distribution.
Franklin Global Real Estate VIP Fund
This annual report for Franklin Global Real Estate VIP Fund covers the fiscal year ended December 31, 2018.
Class 1 Performance Summary as of December 31, 2018
Average annual total return of Class 1 shares represents the average annual change in value, assuming reinvestment of dividends and capital gains. Average returns smooth out variations in returns, which can be significant; they are not the same asyear-by-year results.
| | | | | | | | | | | | |
| | | |
| Periods ended 12/31/18 | | 1-Year | | | 5-Year | | | 10-Year | |
Average Annual Total Return | | | -6.52% | | | | +3.94% | | | | +8.09% | |
Performance reflects the Fund’s Class 1 operating expenses, but doesnotinclude any contract fees, expenses or sales charges. If they had been included, performance would be lower. These charges and deductions, particularly for variable life policies, can have a significant effect on contract values and insurance benefits. See the contract prospectus for a complete description of these expenses, including sales charges.
Performance data represent past performance, which does not guarantee future results. Investment return and principal value will fluctuate, and you may have a gain or loss when you sell your shares. Current performance may differ from figures shown.
Total Return Index Comparison for a Hypothetical $10,000 Investment (1/1/09–12/31/18)
The graph below shows the change in value of a hypothetical $10,000 investment in the Fund over the indicated period and includes reinvestment of any income or distributions. The Fund’s performance is compared to the performance of the FTSE® EPRA®/NAREIT® Developed Index. One cannot invest directly in an index, and an index is not representative of the Fund’s portfolio.Please see Important Notes to Performance Information preceding the Fund Summaries.
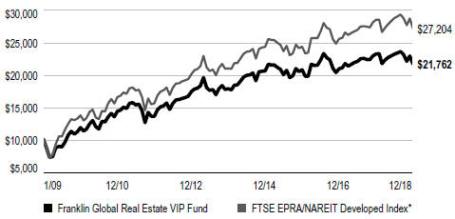
*Source: Morningstar. Please see Index Descriptions following the Fund Summaries.
FRANKLIN GLOBAL REAL ESTATE VIP FUND
Fund Goal and Main Investments
The Fund seeks high total return. Under normal market conditions, the Fund invests at least 80% of its net assets in investments of companies located anywhere in the world that operate in the real estate sector, including: real estate investment trusts (REITs) and similar REIT-like entities domiciled outside the U.S.; companies qualifying under U.S. federal tax law as REITs; and companies that derive at least half of their assets or revenues from the ownership, management, development or sale of residential or commercial real estate (such as real estate operating or service companies).
What is a REIT?
A REIT is a type of real estate company that is dedicated to owning and usually operating income-producing real estate properties such as apartments, hotels, industrial properties, office buildings or shopping centers. Equity REITs generally receive income from rents received, are generally operated by experienced property management teams and typically concentrate on a specific geographic region or property type.
Fund Risks
All investments involve risks, including possible loss of principal. The Fund concentrates in real estate securities, which involve special risks, such as declines in the value of real estate and increased susceptibility to adverse economic or regulatory developments affecting the sector. The Fund’s investments in REITs involve additional risks; since REITs typically are invested in a limited number of projects or in a particular market segment, they are more susceptible to adverse developments affecting a single project or market segment than more broadly diversified investments. Foreign investing, especially in emerging markets, involves additional risks such as currency and market volatility, as well as political and social instability. The Fund is actively managed but there is no guarantee that the manager’s investment decisions will produce the desired results. The Fund’s prospectus also includes a description of the main investment risks.
Performance Overview
You can find the Fund’s one-year total return in the Performance Summary. In comparison, the FTSE EPRA/NAREIT Developed Index had a -4.74% total return for the same period.1

Economic and Market Overview
The global economy expanded during the 12 months under review, despite weakness in certain regions. Global developed and emerging market stocks were aided at certain points during the period by higher crude oil prices, upbeat economic data, easing trade tensions and encouraging corporate earnings reports, as well as indications of a slower pace of interest-rate increases from the U.S. Federal Reserve (Fed).
However, various factors weighed on global markets during the period, including concerns about tighter regulation of technology companies, political uncertainties in the U.S. and
1. Source: Morningstar.
One cannot invest directly in an index, and an index is not representative of the Fund’s portfolio. Please see Index Descriptions following the Fund Summaries.
The dollar value, number of shares or principal amount, and names of all portfolio holdings are listed in the Fund’s Statement of Investments (SOI).
FRANKLIN GLOBAL REAL ESTATE VIP FUND
the European Union, and major central banks’ interest-rate path and unwinding of monetary stimulus measures. Markets were further pressured by U.S. trade disputes with its allies and China, and their impact on global growth and corporate earnings. In this environment, global stocks, as measured by the MSCI All Country World Index, had a-8.93% total return for the 12 months ended December 31, 2018.1
The U.S. economy grew during the12-month period. After moderating for three consecutive quarters, the economy grew faster in 2018’s second quarter, driven by consumer spending, business investment, exports and government spending. However, growth moderated in the third quarter due to declines in exports and housing investment. The unemployment rate declined from 4.1% in December 2017 to 3.9% at period-end.2 Annual inflation, as measured by the Consumer Price Index, decreased from 2.1% in December 2017 to 1.9% at period-end.2 The Fed raised its target range for the federal funds rate four times during the period, to 2.25%–2.50%, and continued reducing its balance sheet as part of an ongoing plan to normalize monetary policy. At its December meeting, the Fed reduced the projected 2019 rate increases to two, compared to three projected previously.
In Europe, the U.K.’s quarterly economic growth moderated in 2018’s first quarter, but accelerated in 2018’s second and third quarters. The Bank of England raised its key policy rate once during the review period. After moderating in 2018’s first quarter, the eurozone’s quarterly growth remained stable in the second quarter, but eased in the third quarter. The bloc’s annual inflation rate ended the period higher than in December 2017. The European Central Bank (ECB) kept its benchmark interest rate unchanged during the period. In December 2018, the ECB confirmed its plan to conclude its bond purchase program at the end of 2018 and reiterated it expects key interest rates to remain unchanged through the summer of 2019.
In Asia, Japan’s quarterly gross domestic product (GDP) grew in 2018’s second quarter, following a contraction in the first quarter, but contracted again in the third quarter. The Bank of Japan left its benchmark interest rate unchanged during the period and continued its monetary stimulus measures.
In emerging markets, Brazil’s quarterly GDP growth remained stable in 2018’s first and second quarters, but accelerated in the third quarter. The Central Bank of Brazil lowered its benchmark interest rate twice during the period. Russia’s
| | | | |
| Top 10 Countries | | | |
| 12/31/18 | | | |
| |
| | | % of Total
Net Assets | |
| U.S. | | | 52.0% | |
| Japan | | | 10.9% | |
| Hong Kong | | | 7.8% | |
| Germany | | | 6.1% | |
| Australia | | | 5.5% | |
| U.K. | | | 4.9% | |
| Singapore | | | 3.2% | |
| France | | | 2.9% | |
| Sweden | | | 2.7% | |
| Canada | | | 2.2% | |
annual GDP growth rate accelerated in 2018’s first and second quarters, but moderated in the third quarter. After lowering its key rate twice early in the period, the Bank of Russia raised it twice in the period’s second half to curtail inflation risks. China’s annual GDP grew at a stable rate in 2018’s first quarter, but it moderated in the second and third quarters. The People’s Bank of China left its benchmark interest rate unchanged during the period, but it took measures to improve financial liquidity to mitigate the negative effects of the U.S.-China trade dispute and support economic growth. Overall, emerging market stocks, as measured by the MSCI Emerging Markets Index, had a-14.25% total return during the period.1
Investment Strategy
We seek to limit price volatility by investing across markets and property types. When selecting investments for the Fund’s portfolio, we apply a“bottom-up” stock selection process that incorporates macro-level views in the evaluation process. Our portfolio construction process combinesbottom-up analysis of individual stock and real estate market fundamentals andtop-down macro overlays to provide country/regional, property type, and company size perspectives in identifying international/local cyclical and thematic trends that highlight investment opportunities.
Manager’s Discussion
During the 12 months under review, key detractors from the Fund’s performance relative to the FTSE EPRA/NAREIT Developed Index included stock selection in the office space
2. Source: U.S. Bureau of Labor Statistics.
FRANKLIN GLOBAL REAL ESTATE VIP FUND
sector.3 Shares of Brandywine Realty Trust, a Philadelphia-based office REIT, underperformed partially due to broader negative investor sentiment towards office REITs. We believe Brandywine’s near-term lease rolls, above-average leverage and recent earnings guidance, which came in below investor expectation, also pressured the stock.
Stock selection and an overweighting in the diversified sector also hampered relative results.4 Shares of City Developments, the largest private developer in Singapore, were a major detractor during the period. After private home prices continued to rise in the first half of 2018, the Singaporean government announced it would raise the Additional Buyers Stamp Duty and tightenloan-to-value ratios in an effort to cool down the property market. While the government’s move was meant to bepre-emptive, property developers weresold-off in response to the government intervention. In the second half of 2018, concerns over rising interest rates and an overheated equity market weighed on City Developments’ share performance as investors turned more risk-averse.
Other significant detractors included shares of Weyerhaeuser, an integrated timber, land and forest products company that owns or controls more than 13 million acres of timberlands in the U.S. and Canada. The company harvests trees to produce a variety of softwood lumber and other wood products. Weyerhaeuser faced multiple headwinds in the third quarter of 2018, including severe weather and uncertain trade policy with China affecting its export business. The lumber and oriented strand board (also known as flakeboard) markets were unusually volatile, with lumber prices seeing a record decline after reaching a peak in June. Additionally, the outlook for U.S. housing starts has moderated following a slew of weaker-than-expected housing market data. While we believe Weyerhaeuser has a quality portfolio, strong balance sheet and an attractive valuation, we sold our position in the company during the period on account of the softening in its fundamental outlook.
Conversely, an underweighting in the struggling retail property sector supported relative performance over the period, as did an overweighting and stock selection in the residential sector.5Shares of Deutsche Wohnen, which owns residential properties in Germany, contributed to results. Rents in the Berlin residential market, which comprises the majority of the company’s portfolio, continue to increase due to demand exceeding supply. Management has continued to see further
| | | | |
| Top 10 Holdings | | | |
| 12/31/18 | | | |
| |
Company Sector/Industry, Country | | % of Total
Net Assets | |
Simon Property Group Inc. Retail REITs, U.S. | | | 4.5% | |
Prologis Inc. Industrial REITs, U.S. | | | 3.3% | |
Equity Residential Residential REITs, U.S. | | | 2.7% | |
Mitsui Fudosan Co. Ltd. Diversified Real Estate Activities, Japan | | | 2.7% | |
Deutsche Wohnen SE Real Estate Operating Companies, Germany | | | 2.5% | |
AvalonBay Communities Inc. Residential REITs, U.S. | | | 2.5% | |
Welltower Inc. Health Care REITs, U.S. | | | 2.4% | |
Digital Realty Trust Inc. Specialized REITs, U.S. | | | 2.3% | |
CK Asset Holdings Ltd. Real Estate Development, Hong Kong | | | 2.2% | |
Mitsubishi Estate Co. Ltd. Diversified Real Estate Activities, Japan | | | 2.0% | |
reversionary potential in the existing portfolio. We believe new supply for lower- to middle-income housing is limited as portfolio valuations remain far below replacement costs. Berlin still offers low average rent levels compared to other larger western German cities and major cities in Europe. The company’s assets have also been revalued upward and share dividends increased during the period. In our analysis, Deutsche Wohnen continues to be attractive based on our internal momentum model and on valuation metrics.
Stock selection in the regional malls and specialty sector also supported relative results.6 In the specialty sector, anoff-benchmark investment in American Tower boosted performance. American Tower owns and operates approximately 140,000 telecommunications towers globally. Of those, approximately 40,000 are located in the U.S., where a majority of the company’s operating profits are generated, and the remainder are located elsewhere, notably in India and Latin America. American Tower benefited from stronger-than-expected growth from its U.S. business, with organic tenant billings growth accelerating over the third and fourth quarters of 2018. The U.S. tower business has continued to benefit from
3. Office holdings are in office REITs in the SOI.
4. Diversified holdings are in diversified real estate activities, diversified REITs, real estate development and real estate operating companies in the SOI.
5. Retail property holdings are in retail REITs in the SOI. Residential holdings are in real estate operating companies and residential REITs in the SOI.
6. Regional malls holdings are in retail REITs in the SOI. Specialty holdings are in specialized REITs in the SOI.
FRANKLIN GLOBAL REAL ESTATE VIP FUND
industry-wide tailwinds, such as the substantial investment by national wireless operators in their networks to support significant annual growth rates in domestic mobile data usage. The demand profile is also supported by the early stages of deployment of spectrum assets for 5G next-generation technology. Outside the U.S., American Tower has also seen an acceleration in its growth trajectory, notably in Brazil, Mexico and South Africa.
Elsewhere, shares of Japanese office landlord Kenedix Office Investment contributed to relative performance. The central Tokyo office markets remain fundamentally solid, with low vacancy rates fueling rent increases throughout the period. While many Japanese REITs continued to acquire properties to drive earnings, Kenedix Office enjoyed solidlike-for-like growth from rental reversions on the strength ofgrade-B buildings due to a favorable supply and demand dynamic. We believe Kenedix Office has attractive growth prospects, solid execution capabilities, and strong momentum.
It is important to recognize the effect of currency movements on the Fund’s performance. In general, if the value of the U.S. dollar goes up compared with a foreign currency, an investment traded in that foreign currency will go down in value because it will be worth fewer U.S. dollars. This can have a negative effect on Fund performance. Conversely, when the U.S. dollar weakens in relation to a foreign currency, an investment traded in that foreign currency will increase in value, which can contribute to Fund performance. For the 12 months ended December 31, 2018, the U.S. dollar rose in value relative to most currencies. As a result, the Fund’s performance was negatively affected by the portfolio’s significant investment in securities withnon-U.S. currency exposure.
Thank you for your participation in Franklin Global Real Estate VIP Fund. We look forward to serving your future investment needs.
The foregoing information reflects our analysis, opinions and portfolio holdings as of December 31, 2018, the end of the reporting period. The way we implement our main investment strategies and the resulting portfolio holdings may change depending on factors such as market and economic conditions. These opinions may not be relied upon as investment advice or an offer for a particular security. The information is not a complete analysis of every aspect of any market, country, industry, security or the Fund. Statements of fact are from sources considered reliable, but the investment manager makes no representation or warranty as to their completeness or accuracy. Although historical performance is no guarantee of future results, these insights may help you understand our investment management philosophy.
FRANKLIN GLOBAL REAL ESTATE VIP FUND
Class 1 Fund Expenses
As an investor in a variable insurance contract (Contract) that indirectly provides for investment in an underlying mutual fund, you can incur transaction and/or ongoing expenses at both the Fund level and the Contract Level: (1) transaction expenses can include sales charges (loads) on purchases, surrender fees, transfer fees and premium taxes; and (2) ongoing expenses can include management fees, distribution and service (12b-1) fees, contract fees, annual maintenance fees, mortality and expense risk fees and other fees and expenses. All mutual funds and Contracts have some types of ongoing expenses. The table below shows Fund-level ongoing expenses and can help you understand these costs and compare them with those of other mutual funds offered through the Contract. The table assumes a $1,000 investment held for the six months indicated. Please refer to the Fund prospectus for additional information on operating expenses.
Actual Fund Expenses
The table below provides information about the actual account values and actual expenses in the columns under the heading “Actual.” In these columns the Fund’s actual return, which includes the effect of ongoing Fund expenses but does not include the effect of ongoing Contract expenses, is used to calculate the “Ending Account Value.” You can estimate the Fund-level expenses you paid during the period by following these steps (ofcourse, your account value and expenses will differ from those in this illustration):Divide your account value by $1,000 (ifyour account had an $8,600 value, then $8,600 ÷ $1,000 = 8.6). Then multiply the result by the number under the headings “Actual” and “Fund-Level Expenses Paid During Period” (ifFund-Level Expenses Paid During Period were $ 7.50, then 8.6 × $7.50 = $64.50). In this illustration, the estimated expenses paid this period at the Fund level are $64.50.
Hypothetical Example for Comparison with Other Mutual Funds
Under the heading “Hypothetical” in the table, information is provided about hypothetical account values and hypothetical expenses based on the Fund’s actual expense ratio and an assumed rate of return of 5% per year before expenses, which is not the Fund’s actual return. This information may not be used to estimate the actual ending account balance or expenses you paid for the period, but it can help you compare ongoing costs of investing in the Fund with those of other mutual funds offered through the Contract. To do so, compare this 5% hypothetical example with the 5% hypothetical examples that appear in the shareholder reports of other funds offered through the Contract.
Please note that expenses shown in the table are meant to highlight ongoing costs at the Fund level only and do not reflect any ongoing expenses at the Contract level, or transaction expenses at either the Fund or Contract levels. In addition, while the Fund does not have transaction expenses, if the transaction and ongoing expenses at the Contract level were included, the expenses shown below would be higher. You should consult your Contract prospectus or disclosure document for more information.
| | | | | | | | | | | | | | | | | | | | | | | | | | | | |
| | | | | |
| | | | | | Actual (actual return after expenses) | | | | | | Hypothetical (5% annual return before expenses) | | | | |
| | | | | | | |
Share Class | | Beginning Account
Value 7/1/18 | | | Ending Account
Value 12/31/18 | | | Fund-Level Expenses
Paid During Period
7/1/18–12/31/181,2 | | | | | | Ending Account
Value 12/31/18 | | | Fund-Level Expenses Paid During Period
7/1/18–12/31/181,2 | | | Net
Annualized
Expense
Ratio2 | |
Class 1 | | | $1,000 | | | | $935.60 | | | | $5.66 | | | | | | | | $1,019.36 | | | | $5.90 | | | | 1.16% | |
1. Expenses are equal to the annualized expense ratio for thesix-month period as indicated above — in the far right column — multiplied by the simple average account value over the period indicated, and then multiplied by 184/365 to reflect theone-half year period.
2. Does not include any ongoing expenses of the Contract for which the Fund is an investment option or acquired fund fees and expenses.
FRANKLIN TEMPLETON VARIABLE INSURANCE PRODUCTS TRUST
Financial Highlights
Franklin Global Real Estate VIP Fund
| | | | | | | | | | | | | | | | | | | | |
| |
| | | Year Ended December 31, | |
| | | | | |
| | | 2018 | | | 2017 | | | 2016 | | | 2015 | | | 2014 | |
| Class 1 | | | | | | | | | | | | | | | | | | | | |
Per share operating performance (for a share outstanding throughout the year) | | | | | | | | | | | | | | | | | | | | |
| | | | | |
Net asset value, beginning of year | | | $16.96 | | | | $15.83 | | | | $15.93 | | | | $16.36 | | | | $14.29 | |
| | | | |
| | | | | |
Income from investment operationsa: | | | | | | | | | | | | | | | | | | | | |
| | | | | |
Net investment incomeb | | | 0.33 | | | | 0.17 | | | | 0.30 | c | | | 0.24 | | | | 0.26 | |
| | | | | |
Net realized and unrealized gains (losses) | | | (1.41 | ) | | | 1.52 | | | | (0.16 | ) | | | (0.12 | ) | | | 1.92 | |
| | | | |
Total from investment operations | | | (1.08 | ) | | | 1.69 | | | | 0.14 | | | | 0.12 | | | | 2.18 | |
| | | | |
| | | | | |
Less distributions from net investment income | | | (0.47 | ) | | | (0.56 | ) | | | (0.24 | ) | | | (0.55 | ) | | | (0.11 | ) |
| | | | |
| | | | | |
Net asset value, end of year | | | $15.41 | | | | $16.96 | | | | $15.83 | | | | $15.93 | | | | $16.36 | |
| | | | |
| | | | | |
Total returnd | | | (6.52)% | | | | 10.76% | | | | 0.81% | | | | 0.83% | | | | 15.27% | |
| | | | | |
| Ratios to average net assets | | | | | | | | | | | | | | | | | | | | |
| | | | | |
Expenses | | | 1.15% | e | | | 1.14% | f | | | 1.11% | f | | | 1.11% | | | | 1.10% | e |
| | | | | | |
Net investment income | | | 1.92% | | | | 1.04% | | | | 1.99% | c | | | 1.49% | | | | 1.66% | |
| | | | | |
| Supplemental data | | | | | | | | | | | | | | | | | | | | |
| | | | | |
Net assets, end of year (000’s) | | | $878 | | | | $819 | | | | $821 | | | | $32,161 | | | | $35,686 | |
| | | | | |
Portfolio turnover rate | | | 17.78% | | | | 22.18% | | | | 28.53% | g | | | 23.35% | | | | 16.67% | |
aThe amount shown for a share outstanding throughout the period may not correlate with the Statement of Operations for the period due to the timing of sales and repurchases of the Fund’s shares in relation to income earned and/or fluctuating fair value of the investments of the Fund.
bBased on average daily shares outstanding.
cNet investment income per share includes approximately $0.06 per share related to income received in the form of special dividends in connection with certain Fund holdings. Excluding this amount, the ratio of net investment income to average net assets would have been 1.59%.
dTotal return does not include fees, charges or expenses imposed by the variable annuity and life insurance contracts for which Franklin Templeton Variable Insurance Products Trust serves as an underlying investment vehicle.
eBenefit of expense reduction rounds to less than 0.01%.
fBenefit of waiver and payments by affiliates rounds to less than 0.01%.
gExcludes the value of portfolio securities delivered as a result of a redemptionin-kind.
| | | | | | |
| | | |
| | The accompanying notes are an integral part of these financial statements. | Annual Report | | | FGR-7 | |
FRANKLIN TEMPLETON VARIABLE INSURANCE PRODUCTS TRUST
FINANCIAL HIGHLIGHTS
Franklin Global Real Estate VIP Fund(continued)
| | | | | | | | | | | | | | | | | | | | |
| |
| | | Year Ended December 31, | |
| | | | | |
| | | 2018 | | | 2017 | | | 2016 | | | 2015 | | | 2014 | |
| Class 2 | | | | | | | | | | | | | | | | | | | | |
Per share operating performance (for a share outstanding throughout the year) | | | | | | | | | | | | | | | | | | | | |
| | | | | |
Net asset value, beginning of year | | | $16.52 | | | | $15.42 | | | | $15.52 | | | | $15.95 | | | | $13.93 | |
| | | | |
| | | | | |
Income from investment operationsa: | | | | | | | | | | | | | | | | | | | | |
| | | | | |
Net investment incomeb | | | 0.27 | | | | 0.13 | | | | 0.28 | c | | | 0.20 | | | | 0.21 | |
| | | | | |
Net realized and unrealized gains (losses) | | | (1.36 | ) | | | 1.47 | | | | (0.19 | ) | | | (0.12 | ) | | | 1.88 | |
| | | | |
Total from investment operations | | | (1.09 | ) | | | 1.60 | | | | 0.09 | | | | 0.08 | | | | 2.09 | |
| | | | |
| | | | | |
Less distributions from net investment income | | | (0.43 | ) | | | (0.50 | ) | | | (0.19 | ) | | | (0.51 | ) | | | (0.07 | ) |
| | | | |
| | | | | |
Net asset value, end of year | | | $15.00 | | | | $16.52 | | | | $15.42 | | | | $15.52 | | | | $15.95 | |
| | | | |
| | | | | |
Total returnd | | | (6.77)% | | | | 10.47% | | | | 0.54% | | | | 0.57% | | | | 15.01% | |
| | | | | |
| Ratios to average net assets | | | | | | | | | | | | | | | | | | | | |
| | | | | |
Expenses | | | 1.40% | e | | | 1.39% | f | | | 1.36% | f | | | 1.36% | | | | 1.35% | e |
| | | | | | |
Net investment income | | | 1.67% | | | | 0.79% | | | | 1.74% | c | | | 1.24% | | | | 1.41% | |
| | | | | |
| Supplemental data | | | | | | | | | | | | | | | | | | | | |
| | | | | |
Net assets, end of year (000’s) | | | $146,408 | | | | $183,532 | | | | $193,707 | | | | $287,473 | | | | $333,554 | |
| | | | | |
Portfolio turnover rate | | | 17.78% | | | | 22.18% | | | | 28.53% | g | | | 23.35% | | | | 16.67% | |
aThe amount shown for a share outstanding throughout the period may not correlate with the Statement of Operations for the period due to the timing of sales and repurchases of the Fund’s shares in relation to income earned and/or fluctuating fair value of the investments of the Fund.
bBased on average daily shares outstanding.
cNet investment income per share includes approximately $0.06 per share related to income received in the form of special dividends in connection with certain Fund holdings. Excluding this amount, the ratio of net investment income to average net assets would have been 1.34%.
dTotal return does not include fees, charges or expenses imposed by the variable annuity and life insurance contracts for which Franklin Templeton Variable Insurance Products Trust serves as an underlying investment vehicle.
eBenefit of expense reduction rounds to less than 0.01%.
fBenefit of waiver and payments by affiliates rounds to less than 0.01%.
gExcludes the value of portfolio securities delivered as a result of a redemptionin-kind.
| | | | |
| | | |
| FGR-8 | | Annual Report | The accompanying notes are an integral part of these financial statements. | | |
FRANKLIN TEMPLETON VARIABLE INSURANCE PRODUCTS TRUST
Statement of Investments, December 31, 2018
Franklin Global Real Estate VIP Fund
| | | | | | | | | | | | | | |
| | | | |
| | | | | Country | | | Shares | | | Value | |
| | Common Stocks 99.5% | | | | | | | | | | | | |
| | Diversified Real Estate Activities 10.8% | | | | | | | | | | | | |
| | CapitaLand Ltd. | | | Singapore | | | | 659,895 | | | $ | 1,505,648 | |
| | City Developments Ltd. | | | Singapore | | | | 179,447 | | | | 1,069,007 | |
| | Mitsubishi Estate Co. Ltd. | | | Japan | | | | 183,956 | | | | 2,902,846 | |
| | Mitsui Fudosan Co. Ltd. | | | Japan | | | | 176,378 | | | | 3,934,710 | |
| | New World Development Co. Ltd. | | | Hong Kong | | | | 1,336,585 | | | | 1,768,344 | |
| | Nomura Real Estate Holdings Inc. | | | Japan | | | | 55,200 | | | | 1,014,854 | |
| | Sun Hung Kai Properties Ltd. | | | Hong Kong | | | | 190,171 | | | | 2,710,310 | |
| | Tokyo Tatemono Co. Ltd. | | | Japan | | | | 96,632 | | | | 1,005,114 | |
| | | | | | | | | | | | | | |
| | | | | | | | | | | | | 15,910,833 | |
| | | | | | | | | | | | | | |
| | Diversified REITs 7.4% | | | | | | | | | | | | |
| | Activia Properties Inc. | | | Japan | | | | 304 | | | | 1,232,920 | |
| | Gecina SA | | | France | | | | 13,194 | | | | 1,708,298 | |
| | GPT Group | | | Australia | | | | 404,792 | | | | 1,522,948 | |
| | Hulic REIT Inc. | | | Japan | | | | 699 | | | | 1,086,766 | |
| | Kenedix Office Investment Corp. | | | Japan | | | | 246 | | | | 1,571,168 | |
| | Land Securities Group PLC | | | United Kingdom | | | | 139,282 | | | | 1,428,770 | |
| | PLA Administradora Industrial S de RL de CV | | | Mexico | | | | 491,207 | | | | 584,434 | |
| | Premier Investment Corp. | | | Japan | | | | 720 | | | | 820,511 | |
| | Stockland | | | Australia | | | | 405,390 | | | | 1,005,374 | |
| | | | | | | | | | | | | | |
| | | | | | | | | | | | | 10,961,189 | |
| | | | | | | | | | | | | | |
| | Health Care REITs 5.3% | | | | | | | | | | | | |
| | HCP Inc. | | | United States | | | | 75,389 | | | | 2,105,615 | |
| | Physicians Realty Trust | | | United States | | | | 41,700 | | | | 668,451 | |
| | Ventas Inc. | | | United States | | | | 25,317 | | | | 1,483,323 | |
| | Welltower Inc. | | | United States | | | | 50,476 | | | | 3,503,539 | |
| | | | | | | | | | | | | | |
| | | | | | | | | | | | | 7,760,928 | |
| | | | | | | | | | | | | | |
| | Hotel & Resort REITs 4.0% | | | | | | | | | | | | |
| | Host Hotels & Resorts Inc. | | | United States | | | | 133,306 | | | | 2,222,211 | |
| | MGM Growth Properties LLC, A | | | United States | | | | 51,900 | | | | 1,370,679 | |
| | Ryman Hospitality Properties Inc. | | | United States | | | | 17,700 | | | | 1,180,413 | |
| | Sunstone Hotel Investors Inc. | | | United States | | | | 81,509 | | | | 1,060,432 | |
| | | | | | | | | | | | | | |
| | | | | | | | | | | | | 5,833,735 | |
| | | | | | | | | | | | | | |
| | Hotels, Resorts & Cruise Lines 0.5% | | | | | | | | | | | | |
| | Hilton Worldwide Holdings Inc. | | | United States | | | | 10,614 | | | | 762,085 | |
| | | | | | | | | | | | | | |
| | Industrial REITs 11.7% | | | | | | | | | | | | |
| | First Industrial Realty Trust Inc. | | | United States | | | | 67,753 | | | | 1,955,352 | |
| | GLPJ-REIT | | | Japan | | | | 1,205 | | | | 1,230,287 | |
| | Goodman Group | | | Australia | | | | 367,978 | | | | 2,755,922 | |
| | Mapletree Logistics Trust | | | Singapore | | | | 1,006,471 | | | | 930,379 | |
| | Nippon Prologis REIT Inc. | | | Japan | | | | 551 | | | | 1,165,848 | |
| | Prologis Inc. | | | United States | | | | 83,369 | | | | 4,895,428 | |
| | Rexford Industrial Realty Inc. | | | United States | | | | 55,674 | | | | 1,640,713 | |
| | Segro PLC | | | United Kingdom | | | | 358,514 | | | | 2,691,049 | |
| | | | | | | | | | | | | | |
| | | | | | | | | | | | | 17,264,978 | |
| | | | | | | | | | | | | | |
| | Office REITs 11.0% | | | | | | | | | | | | |
| | Alexandria Real Estate Equities Inc. | | | United States | | | | 21,421 | | | | 2,468,556 | |
| | Boston Properties Inc. | | | United States | | | | 21,585 | | | | 2,429,392 | |
| | Brandywine Realty Trust | | | United States | | | | 59,395 | | | | 764,413 | |
| | Cousins Properties Inc. | | | United States | | | | 126,300 | | | | 997,770 | |
FRANKLIN TEMPLETON VARIABLE INSURANCE PRODUCTS TRUST
STATEMENT OF INVESTMENTS
Franklin Global Real Estate VIP Fund(continued)
| | | | | | | | | | | | | | |
| | | | |
| | | | | Country | | | Shares | | | Value | |
| | Common Stocks(continued) | | | | | | | | | | | | |
| | Office REITs(continued) | | | | | | | | | | | | |
| | Derwent London PLC | | | United Kingdom | | | | 41,258 | | | $ | 1,501,085 | |
| | Dexus | | | Australia | | | | 275,845 | | | | 2,063,961 | |
| | Highwoods Properties Inc. | | | United States | | | | 28,610 | | | | 1,106,921 | |
| | Inmobiliaria Colonial SA | | | Spain | | | | 143,609 | | | | 1,338,591 | |
| | Kilroy Realty Corp. | | | United States | | | | 26,544 | | | | 1,669,087 | |
| | SL Green Realty Corp. | | | United States | | | | 14,022 | | | | 1,108,860 | |
| | Vornado Realty Trust | | | United States | | | | 11,727 | | | | 727,426 | |
| | | | | | | | | | | | | | |
| | | | | | | | | | | | | 16,176,062 | |
| | | | | | | | | | | | | | |
| | Real Estate Development 2.6% | | | | | | | | | | | | |
| | CK Asset Holdings Ltd. | | | Hong Kong | | | | 440,627 | | | | 3,224,306 | |
| a | | Howard Hughes Corp. | | | United States | | | | 6,440 | | | | 628,673 | |
| | | | | | | | | | | | | | |
| | | | | | | | | | | | | 3,852,979 | |
| | | | | | | | | | | | | | |
| | Real Estate Operating Companies 10.8% | | | | | | | | | | | | |
| | ADO Properties SA | | | Germany | | | | 38,262 | | | | 1,990,679 | |
| | Aroundtown SA | | | Germany | | | | 199,557 | | | | 1,655,589 | |
| | Deutsche Wohnen SE | | | Germany | | | | 82,127 | | | | 3,753,430 | |
| | Fabege AB | | | Sweden | | | | 125,141 | | | | 1,673,247 | |
| | First Capital Realty Inc. | | | Canada | | | | 48,164 | | | | 665,146 | |
| | Hemfosa Fastigheter AB | | | Sweden | | | | 102,632 | | | | 810,191 | |
| | Hufvudstaden AB, A | | | Sweden | | | | 67,318 | | | | 1,042,200 | |
| | Hysan Development Co. Ltd. | | | Hong Kong | | | | 216,065 | | | | 1,027,830 | |
| a | | Nyfosa AB | | | Sweden | | | | 103,203 | | | | 498,035 | |
| | Swire Properties Ltd. | | | Hong Kong | | | | 343,600 | | | | 1,206,692 | |
| | Vonovia SE | | | Germany | | | | 35,838 | | | | 1,626,611 | |
| | | | | | | | | | | | | | |
| | | | | | | | | | | | | 15,949,650 | |
| | | | | | | | | | | | | | |
| | Residential REITs 12.2% | | | | | | | | | | | | |
| | American Homes 4 Rent, A | | | United States | | | | 56,000 | | | | 1,111,600 | |
| | AvalonBay Communities Inc. | | | United States | | | | 21,189 | | | | 3,687,945 | |
| | Camden Property Trust | | | United States | | | | 26,700 | | | | 2,350,935 | |
| | Canadian Apartment Properties REIT | | | Canada | | | | 55,975 | | | | 1,816,691 | |
| | Equity Lifestyle Properties Inc. | | | United States | | | | 23,458 | | | | 2,278,476 | |
| | Equity Residential | | | United States | | | | 61,433 | | | | 4,055,192 | |
| | Essex Property Trust Inc. | | | United States | | | | 3,852 | | | | 944,549 | |
| | Unite Group PLC | | | United Kingdom | | | | 164,251 | | | | 1,688,256 | |
| | | | | | | | | | | | | | |
| | | | | | | | | | | | | 17,933,644 | |
| | | | | | | | | | | | | | |
| | Retail REITs 15.5% | | | | | | | | | | | | |
| | Agree Realty Corp. | | | United States | | | | 21,421 | | | | 1,266,410 | |
| | CapitaLand Mall Trust | | | Singapore | | | | 798,500 | | | | 1,323,950 | |
| | Link REIT | | | Hong Kong | | | | 154,337 | | | | 1,562,981 | |
| | The Macerich Co. | | | United States | | | | 11,000 | | | | 476,080 | |
| | Realty Income Corp. | | | United States | | | | 43,217 | | | | 2,724,400 | |
| | Regency Centers Corp. | | | United States | | | | 33,139 | | | | 1,944,597 | |
| | Retail Properties of America Inc., A | | | United States | | | | 117,600 | | | | 1,275,960 | |
| | Scentre Group | | | Australia | | | | 259,898 | | | | 714,133 | |
| | Simon Property Group Inc. | | | United States | | | | 39,626 | | | | 6,656,772 | |
| | SmartCentres REIT | | | Canada | | | | 34,530 | | | | 779,926 | |
| | Taubman Centers Inc. | | | United States | | | | 14,100 | | | | 641,409 | |
| | Unibail-Rodamco-Westfield | | | France | | | | 14,664 | | | | 2,274,992 | |
| a | | Unibail-Rodamco-Westfield, IDR | | | France | | | | 45,491 | | | | 342,942 | |
FRANKLIN TEMPLETON VARIABLE INSURANCE PRODUCTS TRUST
STATEMENT OF INVESTMENTS
| | | | | | | | | | | | | | |
| | | Franklin Global Real Estate VIP Fund(continued) | | | | | | | | | |
| | | | |
| | | | | Country | | | Shares | | | Value | |
| | Common Stocks(continued) | | | | | | | | | | | | |
| | Retail REITs(continued) | | | | | | | | | | | | |
| | Weingarten Realty Investors | | | United States | | | | 35,029 | | | $ | 869,069 | |
| | | | | | | | | | | | | | |
| | | | | | | | | | | | | 22,853,621 | |
| | | | | | | | | | | | | | |
| | Specialized REITs 7.7% | | | | | | | | | | | | |
| | American Tower Corp. | | | United States | | | | 8,700 | | | | 1,376,253 | |
| | Coresite Realty Corp. | | | United States | | | | 10,469 | | | | 913,211 | |
| | CubeSmart | | | United States | | | | 52,493 | | | | 1,506,024 | |
| | Digital Realty Trust Inc. | | | United States | | | | 31,168 | | | | 3,320,950 | |
| | Extra Space Storage Inc. | | | United States | | | | 21,600 | | | | 1,954,368 | |
| | Iron Mountain Inc. | | | United States | | | | 21,600 | | | | 700,056 | |
| | Public Storage | | | United States | | | | 7,644 | | | | 1,547,222 | |
| | | | | | | | | | | | | | |
| | | | | | | | | | | | | 11,318,084 | |
| | | | | | | | | | | | | | |
| | | | |
| | Total Common Stocks (Cost $105,184,897) | | | | | | | | | | | 146,577,788 | |
| | | | | | | | | | | | | | |
| | | | |
| | | | | | | | Principal Amount | | | | |
| | Short Term Investments (Cost $281,832) 0.2% | | | | | | | | | | | | |
| | Repurchase Agreements 0.2% | | | | | | | | | | | | |
| b | | Joint Repurchase Agreement, 2.922%, 1/02/19 (Maturity Value $281,877) | | | | | | | | | | | | |
| | BNP Paribas Securities Corp. (Maturity Value $125,393) Deutsche Bank Securities Inc. (Maturity Value $46,766) HSBC Securities (USA) Inc. (Maturity Value $109,718) | | | | | | | | | | | | |
| | Collateralized by U.S. Government Agency Securities, 3.00% - 8.00%, 12/15/25 - 12/20/48;cU.S. Treasury Bills, 1/17/19; and U.S. Treasury Notes, 1.25% - 3.50%, 5/31/19 - 9/30/20 (valued at $287,556) | | | United States | | | $ | 281,832 | | | | 281,832 | |
| | | | | | | | | | | | | | |
| | Total Investments (Cost $105,466,729) 99.7% | | | | | | | | | | | 146,859,620 | |
| | Other Assets, less Liabilities 0.3% | | | | | | | | | | | 426,865 | |
| | | | | | | | | | | | | | |
| | Net Assets 100.0% | | | | | | | | | | $ | 147,286,485 | |
| | | | | | | | | | | | | | |
See Abbreviations on page FGR-22.
aNon-income producing.
bSee Note 1(c) regarding joint repurchase agreement.
cThe security was issued on a discount basis with no stated coupon rate.
| | | | | | |
| | | |
| | The accompanying notes are an integral part of these financial statements. | Annual Report | | | FGR-11 | |
FRANKLIN TEMPLETON VARIABLE INSURANCE PRODUCTS TRUST
Financial Statements
Statement of Assets and Liabilities
December 31, 2018
| | | | |
| |
| | | Franklin Global
Real Estate VIP Fund | |
Assets: | | | | |
Investments in securities: | | | | |
Cost - Unaffiliated issuers | | $ | 105,184,897 | |
Cost - Unaffiliated repurchase agreements | | | 281,832 | |
| | | | |
Value - Unaffiliated issuers | | $ | 146,577,788 | |
Value - Unaffiliated repurchase agreements | | | 281,832 | |
Receivables: | | | | |
Capital shares sold | | | 328 | |
Dividends | | | 769,084 | |
European Union tax reclaims | | | 107,052 | |
Other assets | | | 19 | |
| | | | |
Total assets | | | 147,736,103 | |
| | | | |
Liabilities: | | | | |
Payables: | | | | |
Capital shares redeemed | | | 150,839 | |
Management fees | | | 136,626 | |
Distribution fees | | | 64,277 | |
Reports to shareholders | | | 38,691 | |
Professional fees | | | 52,081 | |
Accrued expenses and other liabilities | | | 7,104 | |
| | | | |
Total liabilities | | | 449,618 | |
| | | | |
Net assets, at value | | $ | 147,286,485 | |
| | | | |
Net assets consist of: | | | | |
Paid-in capital | | $ | 106,231,130 | |
Total distributable earnings (loss) | | | 41,055,355 | |
| | | | |
Net assets, at value | | $ | 147,286,485 | |
| | | | |
| Class 1: | | | | |
Net assets, at value | | $ | 878,281 | |
| | | | |
Shares outstanding | | | 57,009 | |
| | | | |
Net asset value and maximum offering price per share | | $ | 15.41 | |
| | | | |
| Class 2: | | | | |
Net assets, at value | | $ | 146,408,204 | |
| | | | |
Shares outstanding | | | 9,759,424 | |
| | | | |
Net asset value and maximum offering price per share | | $ | 15.00 | |
| | | | |
| | | | |
| | | |
| FGR-12 | | Annual Report | The accompanying notes are an integral part of these financial statements. | | |
FRANKLIN TEMPLETON VARIABLE INSURANCE PRODUCTS TRUST
FINANCIAL STATEMENTS
Statement of Operations
for the year ended December 31, 2018
| | | | |
| |
| | | Franklin Global
Real Estate
VIP Fund | |
Investment income: | | | | |
Dividends: (net of foreign taxes)* | | | | |
Unaffiliated issuers | | $ | 5,121,668 | |
Interest: | | | | |
Unaffiliated issuers | | | 9,597 | |
| | | | |
Total investment income | | | 5,131,265 | |
| | | | |
Expenses: | | | | |
Management fees (Note 3a) | | | 1,753,720 | |
Distribution fees: (Note 3c) | | | | |
Class 2 | | | 415,045 | |
Custodian fees (Note 4) | | | 13,468 | |
Reports to shareholders | | | 57,070 | |
Professional fees | | | 76,157 | |
Trustees’ fees and expenses | | | 1,234 | |
Other | | | 19,813 | |
| | | | |
Total expenses | | | 2,336,507 | |
Expense reductions (Note 4) | | | (14 | ) |
| | | | |
Net expenses | | | 2,336,493 | |
| | | | |
Net investment income | | | 2,794,772 | |
| | | | |
Realized and unrealized gains (losses): | | | | |
Net realized gain (loss) from: | | | | |
Investments: | | | | |
Unaffiliated issuers | | | 7,806,232 | |
Realized gain distributions from REITs | | | 544,978 | |
Foreign currency transactions | | | (12,712 | ) |
| | | | |
Net realized gain (loss) | | | 8,338,498 | |
| | | | |
Net change in unrealized appreciation (depreciation) on: | | | | |
Investments: | | | | |
Unaffiliated issuers | | | (22,342,401 | ) |
Translation of other assets and liabilities denominated in foreign currencies | | | (9,052 | ) |
| | | | |
Net change in unrealized appreciation (depreciation) | | | (22,351,453 | ) |
| | | | |
Net realized and unrealized gain (loss) | | | (14,012,955 | ) |
| | | | |
Net increase (decrease) in net assets resulting from operations | | $ | (11,218,183 | ) |
| | | | |
| | | | |
| |
*Foreign taxes withheld on dividends | | $ | 231,510 | |
| | | | | | |
| | | |
| | The accompanying notes are an integral part of these financial statements. | Annual Report | | | FGR-13 | |
FRANKLIN TEMPLETON VARIABLE INSURANCE PRODUCTS TRUST
FINANCIAL STATEMENTS
Statements of Changes in Net Assets
| | | | | | | | |
| |
| | | Franklin Global Real Estate VIP Fund | |
| |
| | | Year Ended December 31, | |
| | |
| | | 2018 | | | 2017 | |
Increase (decrease) in net assets: | | | | | | | | |
Operations: | | | | | | | | |
Net investment income | | $ | 2,794,772 | | | $ | 1,509,596 | |
Net realized gain (loss) | | | 8,338,498 | | | | 11,105,782 | |
Net change in unrealized appreciation (depreciation) | | | (22,351,453 | ) | | | 6,230,763 | |
| | | | |
Net increase (decrease) in net assets resulting from operations | | | (11,218,183 | ) | | | 18,846,141 | |
| | | | |
Distributions to shareholders: (Note 1f) | | | | | | | | |
Class 1 | | | (26,319 | ) | | | (26,726 | ) |
Class 2 | | | (4,381,023 | ) | | | (5,862,949 | ) |
| | | | |
Total distributions to shareholders | | | (4,407,342 | ) | | | (5,889,675 | ) |
| | | | |
Capital share transactions: (Note 2) | | | | | | | | |
Class 1 | | | 146,852 | | | | (57,079 | ) |
Class 2 | | | (21,586,275 | ) | | | (23,075,937 | ) |
| | | | |
Total capital share transactions | | | (21,439,423 | ) | | | (23,133,016 | ) |
| | | | |
Net increase (decrease) in net assets | | | (37,064,948 | ) | | | (10,176,550 | ) |
Net assets: | | | | | | | | |
Beginning of year | | | 184,351,433 | | | | 194,527,983 | |
| | | | |
End of year (Note 1f) | | $ | 147,286,485 | | | $ | 184,351,433 | |
| | | | |
| | | | |
| | | |
| FGR-14 | | Annual Report | The accompanying notes are an integral part of these financial statements. | | |
FRANKLIN TEMPLETON VARIABLE INSURANCE PRODUCTS TRUST
Notes to Financial Statements
Franklin Global Real Estate VIP Fund
1. Organization and Significant Accounting Policies
Franklin Templeton Variable Insurance Products Trust (Trust) is registered under the Investment Company Act of 1940 (1940 Act) as anopen-end management investment company, consisting of eighteen separate funds and applies the specialized accounting and reporting guidance in U.S. Generally Accepted Accounting Principles (U.S. GAAP). Franklin Global Real Estate VIP Fund (Fund) is included in this report. Shares of the Fund are generally sold only to insurance company separate accounts to fund the benefits of variable life insurance policies or variable annuity contracts. At December 31, 2018, 84.2% of the Fund’s shares were held through one insurance company. Investment activities of these insurance company separate accounts could have a material impact on the Fund. The Fund offers two classes of shares: Class 1 and Class 2. Each class of shares may differ by its distribution fees, voting rights on matters affecting a single class and its exchange privilege.
The following summarizes the Fund’s significant accounting policies.
a. Financial Instrument Valuation
The Fund’s investments in financial instruments are carried at fair value daily. Fair value is the price that would be received to sell an asset or paid to transfer a liability in an orderly transaction between market participants on the measurement date. The Fund calculates the net asset value (NAV) per share each business day as of 4 p.m. Eastern time or the regularly scheduled close of the New York Stock Exchange (NYSE), whichever is earlier. Under compliance policies and procedures approved by the Trust’s Board of Trustees (the Board), the Fund’s administrator has responsibility for oversight of valuation, including leading the cross-functional Valuation Committee (VC). The Fund may utilize independent pricing services, quotations from securities and financial instrument dealers, and other market sources to determine fair value.
Equity securities listed on an exchange or on the NASDAQ National Market System are valued at the last quoted sale price or the official closing price of the day, respectively. Foreign equity securities are valued as of the close of trading on the foreign stock exchange on which the security is primarily traded, or as of 4 p.m. Eastern time. The value is then converted into its U.S. dollar equivalent at the foreign exchange rate in effect at 4 p.m. Eastern time on the day that the value of the security is determined.Over-the-counter (OTC) securities are
valued within the range of the most recent quoted bid and ask prices. Securities that trade in multiple markets or on multiple exchanges are valued according to the broadest and most representative market. Certain equity securities are valued based upon fundamental characteristics or relationships to similar securities.
Investments in repurchase agreements are valued at cost, which approximates fair value.
The Fund has procedures to determine the fair value of financial instruments for which market prices are not reliable or readily available. Under these procedures, the Fund primarily employs a market-based approach which may use related or comparable assets or liabilities, recent transactions, market multiples, book values, and other relevant information for the investment to determine the fair value of the investment. An income-based valuation approach may also be used in which the anticipated future cash flows of the investment are discounted to calculate fair value. Discounts may also be applied due to the nature or duration of any restrictions on the disposition of the investments. Due to the inherent uncertainty of valuations of such investments, the fair values may differ significantly from the values that would have been used had an active market existed.
Trading in securities on foreign securities stock exchanges and OTC markets may be completed before 4 p.m. Eastern time. In addition, trading in certain foreign markets may not take place on every Fund’s business day. Occasionally, events occur between the time at which trading in a foreign security is completed and 4 p.m. Eastern time that might call into question the reliability of the value of a portfolio security held by the Fund. As a result, differences may arise between the value of the Fund’s portfolio securities as determined at the foreign market close and the latest indications of value at 4 p.m. Eastern time. In order to minimize the potential for these differences, the VC monitors price movements following the close of trading in foreign stock markets through a series of country specific market proxies (such as baskets of American Depositary Receipts, futures contracts and exchange traded funds). These price movements are measured against established trigger thresholds for each specific market proxy to assist in determining if an event has occurred that may call into question the reliability of the values of the foreign securities held by the Fund. If such an event occurs, the securities may be valued using fair value procedures, which may include the use
FRANKLIN TEMPLETON VARIABLE INSURANCE PRODUCTS TRUST
NOTES TO FINANCIAL STATEMENTS
Franklin Global Real Estate VIP Fund(continued)
1. Organization and Significant Accounting Policies (continued)
a. Financial Instrument Valuation(continued)
of independent pricing services. At December 31, 2018, a market event occurred resulting in a portion of the securities held by the Fund being valued using fair value procedures.
When the last day of the reporting period is anon-business day, certain foreign markets may be open on those days that the Fund’s NAV is not calculated, which could result in differences between the value of the Fund’s portfolio securities on the last business day and the last calendar day of the reporting period. Any significant security valuation changes due to an open foreign market are adjusted and reflected by the Fund for financial reporting purposes.
b. Foreign Currency Translation
Portfolio securities and other assets and liabilities denominated in foreign currencies are translated into U.S. dollars based on the exchange rate of such currencies against U.S. dollars on the date of valuation. The Fund may enter into foreign currency exchange contracts to facilitate transactions denominated in a foreign currency. Purchases and sales of securities, income and expense items denominated in foreign currencies are translated into U.S. dollars at the exchange rate in effect on the transaction date. Portfolio securities and assets and liabilities denominated in foreign currencies contain risks that those currencies will decline in value relative to the U.S. dollar. Occasionally, events may impact the availability or reliability of foreign exchange rates used to convert the U.S. dollar equivalent value. If such an event occurs, the foreign exchange rate will be valued at fair value using procedures established and approved by the Board.
The Fund does not separately report the effect of changes in foreign exchange rates from changes in market prices on securities held. Such changes are included in net realized and unrealized gain or loss from investments in the Statement of Operations.
Realized foreign exchange gains or losses arise from sales of foreign currencies, currency gains or losses realized between the trade and settlement dates on securities transactions and the difference between the recorded amounts of dividends, interest, and foreign withholding taxes and the U.S. dollar equivalent of the amounts actually received or paid. Net unrealized foreign exchange gains and losses arise from changes in foreign
exchange rates on foreign denominated assets and liabilities other than investments in securities held at the end of the reporting period.
c. Joint Repurchase Agreement
The Fund enters into a joint repurchase agreement whereby its uninvested cash balance is deposited into a joint cash account with other funds managed by the investment manager or an affiliate of the investment manager and is used to invest in one or more repurchase agreements. The value and face amount of the joint repurchase agreement are allocated to the funds based on theirpro-rata interest. A repurchase agreement is accounted for as a loan by the Fund to the seller, collateralized by securities which are delivered to the Fund’s custodian. The fair value, including accrued interest, of the initial collateralization is required to be at least 102% of the dollar amount invested by the funds, with the value of the underlying securities marked to market daily to maintain coverage of at least 100%. Repurchase agreements are subject to the terms of Master Repurchase Agreements (MRAs) with approved counterparties (sellers). The MRAs contain various provisions, including but not limited to events of default and maintenance of collateral for repurchase agreements. In the event of default by either the seller or the Fund, certain MRAs may permit thenon-defaulting party to net andclose-out all transactions, if any, traded under such agreements. The Fund may sell securities it holds as collateral and apply the proceeds towards the repurchase price and any other amounts owed by the seller to the Fund in the event of default by the seller. This could involve costs or delays in addition to a loss on the securities if their value falls below the repurchase price owed by the seller. The joint repurchase agreement held by the Fund at year end, as indicated in the Statement of Investments, had been entered into on December 31, 2018.
d. Securities Lending
The Fund participates in an agency based securities lending program to earn additional income. The Fund receives cash collateral against the loaned securities in an amount equal to at least 102% of the fair value of the loaned securities. Collateral is maintained over the life of the loan in an amount not less than 100% of the fair value of loaned securities, as determined at the close of Fund business each day; any additional collateral required due to changes in security values is delivered to the Fund on the next business day. The collateral is deposited into a joint cash account with other funds and is used to invest in a
FRANKLIN TEMPLETON VARIABLE INSURANCE PRODUCTS TRUST
NOTES TO FINANCIAL STATEMENTS
Franklin Global Real Estate VIP Fund(continued)
money market fund managed by Franklin Advisers, Inc., an affiliate of the Fund. The Fund may receive income from the investment of cash collateral, in addition to lending fees and rebates paid by the borrower. Income from securities loaned, net of fees paid to the securities lending agent and/or third-party vendor, is reported separately in the Statement of Operations. The Fund bears the market risk with respect to the collateral investment, securities loaned, and the risk that the agent may default on its obligations to the Fund. If the borrower defaults on its obligation to return the securities loaned, the Fund has the right to repurchase the securities in the open market using the collateral received. The securities lending agent has agreed to indemnify the Fund in the event of default by a third party borrower. At December 31, 2018, the Fund had no securities on loan.
e. Income and Deferred Taxes
It is the Fund’s policy to qualify as a regulated investment company under the Internal Revenue Code. The Fund intends to distribute to shareholders substantially all of its taxable income and net realized gains to relieve it from federal income and if applicable, excise taxes. As a result, no provision for U.S. federal income taxes is required.
The Fund may be subject to foreign taxation related to income received, capital gains on the sale of securities and certain foreign currency transactions in the foreign jurisdictions in which it invests. Foreign taxes, if any, are recorded based on the tax regulations and rates that exist in the foreign markets in which the Fund invests. When a capital gain tax is determined to apply, the Fund records an estimated deferred tax liability in an amount that would be payable if the securities were disposed of on the valuation date.
As a result of several court cases, in certain countries across the European Union, the Fund filed additional tax reclaims for previously withheld taxes on dividends earned in those countries (EU reclaims). These additional filings are subject to various administrative proceedings by the local jurisdictions’ tax authorities within the European Union, as well as a number of related judicial proceedings. Income recognized, if any, for EU reclaims is reflected as other income in the Statement of Operations and any related receivable, if any, is reflected as European Union tax reclaims in the Statement of Assets and Liabilities. When uncertainty exists as to the ultimate resolution of these proceedings, the likelihood of receipt of these EU reclaims, and the potential timing of payment, no amounts are
reflected in the financial statements. For U.S. income tax purposes, when EU reclaims are received by the Fund and the Fund previously passed foreign tax credit on to its shareholders, the Fund must either amend historic tax reporting to shareholders or enter into a closing agreement with the Internal Revenue Service (IRS) in order to pay the associated tax liability on behalf of the Fund’s shareholders.
The Fund may recognize an income tax liability related to its uncertain tax positions under U.S. GAAP when the uncertain tax position has a less than 50% probability that it will be sustained upon examination by the tax authorities based on its technical merits. As of December 31, 2018, the Fund has determined that no tax liability is required in its financial statements related to uncertain tax positions for any open tax years (or expected to be taken in future tax years). Open tax years are those that remain subject to examination and are based on the statute of limitations in each jurisdiction in which the Fund invests.
f. Security Transactions, Investment Income, Expenses and Distributions
Security transactions are accounted for on trade date. Realized gains and losses on security transactions are determined on a specific identification basis. Interest income and estimated expenses are accrued daily. Dividend income and realized gain distributions are recorded on theex-dividend date except for certain dividends from securities where the dividend rate is not available. In such cases, the dividend is recorded as soon as the information is received by the Fund. Distributions to shareholders are recorded on theex-dividend date. Distributable earnings are determined according to income tax regulations (tax basis) and may differ from earnings recorded in accordance with U.S. GAAP. These differences may be permanent or temporary. Permanent differences are reclassified among capital accounts to reflect their tax character. These reclassifications have no impact on net assets or the results of operations. Temporary differences are not reclassified, as they may reverse in subsequent periods.*
Common expenses incurred by the Trust are allocated among the Funds based on the ratio of net assets of each Fund to the combined net assets of the Trust or based on the ratio of number of shareholders of each Fund to the combined number of shareholders of the Trust. Fund specific expenses are charged directly to the Fund that incurred the expense.
FRANKLIN TEMPLETON VARIABLE INSURANCE PRODUCTS TRUST
NOTES TO FINANCIAL STATEMENTS
Franklin Global Real Estate VIP Fund(continued)
1. Organization and Significant Accounting
Policies (continued)
f. Security Transactions, Investment Income, Expenses and Distributions(continued)
Realized and unrealized gains and losses and net investment income, excluding class specific expenses, are allocated daily to each class of shares based upon the relative proportion of net assets of each class. Differences in per share distributions by class are generally due to differences in class specific expenses.
Distributions received by the Fund from certain securities may be a return of capital (ROC). Such distributions reduce the cost basis of the securities, and any distributions in excess of the cost basis are recognized as capital gains. For U.S. Real Estate Investment Trust (REIT) securities, the Fund records ROC estimates, if any, on theex-dividend date and are adjusted once actual tax designations are known.
g. Accounting Estimates
The preparation of financial statements in accordance with U.S. GAAP requires management to make estimates and assumptions that affect the reported amounts of assets and
liabilities at the date of the financial statements and the amounts of income and expenses during the reporting period. Actual results could differ from those estimates.
h. Guarantees and Indemnifications
Under the Trust’s organizational documents, its officers and trustees are indemnified by the Trust against certain liabilities arising out of the performance of their duties to the Trust. Additionally, in the normal course of business, the Trust, on behalf of the Fund, enters into contracts with service providers that contain general indemnification clauses. The Trust’s maximum exposure under these arrangements is unknown as this would involve future claims that may be made against the Trust that have not yet occurred. Currently, the Trust expects the risk of loss to be remote.
* Effective during the current reporting period, it is no longer required to present certain line items in the Statements of Changes in Net Assets. The below prior period amounts affected by this change are shown as they were in the prior year Statements of Changes in Net Assets.
For the year ended December 31, 2017, distributions to shareholders were as follows:
| | | | |
Distributions from net investment income: | | | | |
Class 1 | | $ | (26,726 | ) |
Class 2 | | | (5,862,949 | ) |
For the year ended December 31, 2017, distributions in excess of net investment income included in net assets was $(259,145).
2. Shares of Beneficial Interest
At December 31, 2018, there were an unlimited number of shares authorized (without par value). Transactions in the Fund’s shares were as follows:
| | | | | | | | | | | | | | | | | | | | |
| |
| | | Year Ended December 31, | |
| | | |
| | | 2018 | | | | | | 2017 | |
| | | | | |
| | | Shares | | | Amount | | | | | | Shares | | | Amount | |
| | | | | |
| Class 1 Shares: | | | | | | | | | | | | | | | | | | | | |
Shares sold | | | 9,088 | | | $ | 153,008 | | | | | | | | 1,644 | | | $ | 26,478 | |
Shares issued in reinvestment of distributions | | | 1,610 | | | | 26,319 | | | | | | | | 1,626 | | | | 26,726 | |
Shares redeemed | | | (2,003 | ) | | | (32,475 | ) | | | | | | | (6,836 | ) | | | (110,283 | ) |
| | | | |
Net increase (decrease) | | | 8,695 | | | $ | 146,852 | | | | | | | | (3,566 | ) | | $ | (57,079 | ) |
| | | | |
FRANKLIN TEMPLETON VARIABLE INSURANCE PRODUCTS TRUST
NOTES TO FINANCIAL STATEMENTS
Franklin Global Real Estate VIP Fund(continued)
| | | | | | | | | | | | | | | | | | | | |
| |
| | | Year Ended December 31, | |
| | | |
| | | 2018 | | | | | | 2017 | |
| | | | | |
| | | Shares | | | Amount | | | | | | Shares | | | Amount | |
| | | | | |
| Class 2 Shares: | | | | | | | | | | | | | | | | | | | | |
Shares sold | | | 144,050 | | | $ | 2,286,461 | | | | | | | | 147,438 | | | $ | 2,348,274 | |
Shares issued in reinvestment of distributions | | | 274,845 | | | | 4,381,023 | | | | | | | | 365,520 | | | | 5,862,949 | |
Shares redeemed | | | (1,771,140 | ) | | | (28,253,759 | ) | | | | | | | (1,961,819 | ) | | | (31,287,160 | ) |
| | | | |
Net increase (decrease) | | | (1,352,245 | ) | | $ | (21,586,275 | ) | | | | | | | (1,448,861 | ) | | $ | (23,075,937 | ) |
| | | | |
3. Transactions with Affiliates
Franklin Resources, Inc. is the holding company for various subsidiaries that together are referred to as Franklin Templeton. Certain officers and trustees of the Fund are also officers and/or directors of the following subsidiaries:
| | |
| |
| Subsidiary | | Affiliation |
Franklin Templeton Institutional, LLC (FT Institutional) | | Investment manager |
Franklin Templeton Services, LLC (FT Services) | | Administrative manager |
Franklin Templeton Distributors, Inc. (Distributors) | | Principal underwriter |
Franklin Templeton Investor Services, LLC (Investor Services) | | Transfer agent |
a. Management Fees
The Fund pays an investment management fee to FT Institutional based on the average daily net assets of the Fund as follows:
| | |
| |
| Annualized Fee Rate | | Net Assets |
1.050% | | Up to and including $500 million |
0.950% | | Over $500 million, up to and including $1 billion |
0.900% | | Over $1 billion, up to and including $1.5 billion |
0.850% | | Over $1.5 billion, up to and including $6.5 billion |
0.830% | | Over $6.5 billion, up to and including $11.5 billion |
0.810% | | Over $11.5 billion, up to and including $16.5 billion |
0.790% | | Over $16.5 billion, up to and including $19 billion |
0.780% | | Over $19 billion, up to and including $21.5 billion |
0.770% | | In excess of $21.5 billion |
b. Administrative Fees
Under an agreement with FT Institutional, FT Services provides administrative services to the Fund. The fee is paid by FT Institutional based on the Fund’s average daily net assets, and is not an additional expense of the Fund.
c. Distribution Fees
The Board has adopted a distribution plan for Class 2 shares pursuant to Rule 12b-1 under the 1940 Act. Under the Fund’s compensation distribution plan, the Fund pays Distributors for costs incurred in connection with the servicing, sale and distribution of the Fund’s shares up to 0.35% per year of its average daily net assets. The Board has agreed to limit the current rate to 0.25% per year for Class 2. The plan year, for purposes of monitoring compliance with the maximum annual plan rates, is February 1 through January 31.
FRANKLIN TEMPLETON VARIABLE INSURANCE PRODUCTS TRUST
NOTES TO FINANCIAL STATEMENTS
Franklin Global Real Estate VIP Fund(continued)
3. Transactions with Affiliates(continued)
d. Transfer Agent Fees
Investor Services, under terms of an agreement, performs shareholder servicing for the Fund and is not paid by the Fund for the services.
4. Expense Offset Arrangement
The Fund has entered into an arrangement with its custodian whereby credits realized as a result of uninvested cash balances are used to reduce a portion of the Fund’s custodian expenses. During the year ended December 31, 2018, the custodian fees were reduced as noted in the Statement of Operations.
5. Income Taxes
During the year ended December 31, 2018, the Fund utilized $2,192,369 of capital loss carryforwards.
The tax character of distributions paid during the years ended December 31, 2018 and 2017, was as follows:
| | | | | | | | |
| | |
| | | 2018 | | | 2017 | |
Distributions paid from ordinary income | | $ | 4,407,342 | | | $ | 5,889,675 | |
| | | | |
At December 31, 2018, the cost of investments, net unrealized appreciation (depreciation), undistributed ordinary income and undistributed long term capital gains for income tax purposes were as follows:
| | | | |
Cost of investments | | $ | 113,429,658 | |
| | | | |
Unrealized appreciation | | $ | 47,109,110 | |
Unrealized depreciation | | | (13,679,148 | ) |
| | | | |
Net unrealized appreciation (depreciation) | | $ | 33,429,962 | |
| | | | |
Distributable earnings: | | | | |
Undistributed ordinary income | | $ | 4,232,907 | |
Undistributed long term capital gains | | | 3,284,783 | |
| | | | |
Total distributable earnings | | $ | 7,517,690 | |
| | | | |
Differences between income and/or capital gains as determined on a book basis and a tax basis are primarily due to differing treatment of passive foreign investment company shares.
6. Investment Transactions
Purchases and sales (excluding short term securities) for the year ended December 31, 2018, aggregated $29,630,160 and $51,238,536, respectively.
7. Concentration of Risk
Investing in foreign securities may include certain risks and considerations not typically associated with investing in U.S. securities, such as fluctuating currency values and changing local and regional economic, political and social conditions, which may result in greater market volatility. Current political and financial uncertainty surrounding the European Union may increase market volatility and the economic risk of investing in securities in Europe. In addition, certain foreign securities may not be as liquid as U.S. securities.
FRANKLIN TEMPLETON VARIABLE INSURANCE PRODUCTS TRUST
NOTES TO FINANCIAL STATEMENTS
Franklin Global Real Estate VIP Fund(continued)
The Fund invests a large percentage of its total assets in REIT securities. Such concentration may subject the Fund to special risks associated with real estate securities. These securities may be more sensitive to economic or regulatory developments due to a variety of factors such as local, regional, national and global economic conditions, interest rates and tax considerations.
8. Credit Facility
The Fund, together with other U.S. registered and foreign investment funds (collectively, Borrowers), managed by Franklin Templeton, are borrowers in a joint syndicated senior unsecured credit facility totaling $2 billion (Global Credit Facility) which matured on February 8, 2019. This Global Credit Facility provides a source of funds to the Borrowers for temporary and emergency purposes, including the ability to meet future unanticipated or unusually large redemption requests. Effective February 8, 2019, the Borrowers renewed the Global Credit Facility for a one year term, maturing February 7, 2020, for a total of $2 billion.
Under the terms of the Global Credit Facility, the Fund shall, in addition to interest charged on any borrowings made by the Fund and other costs incurred by the Fund, pay its share of fees and expenses incurred in connection with the implementation and maintenance of the Global Credit Facility, based upon its relative share of the aggregate net assets of all of the Borrowers, including an annual commitment fee of 0.15% based upon the unused portion of the Global Credit Facility. These fees are reflected in other expenses in the Statement of Operations. During the year ended December 31, 2018, the Fund did not use the Global Credit Facility.
9. Fair Value Measurements
The Fund follows a fair value hierarchy that distinguishes between market data obtained from independent sources (observable inputs) and the Fund’s own market assumptions (unobservable inputs). These inputs are used in determining the value of the Fund’s financial instruments and are summarized in the following fair value hierarchy:
| | • | | Level 1 – quoted prices in active markets for identical financial instruments |
| | • | | Level 2 – other significant observable inputs (including quoted prices for similar financial instruments, interest rates, prepayment speed, credit risk, etc.) |
| | • | | Level 3 – significant unobservable inputs (including the Fund’s own assumptions in determining the fair value of financial instruments) |
The input levels are not necessarily an indication of the risk or liquidity associated with financial instruments at that level.
A summary of inputs used as of December 31, 2018, in valuing the Fund’s assets carried at fair value, is as follows:
| | | | | | | | | | | | | | | | |
| | | | |
| | | Level 1 | | | Level 2 | | | Level 3 | | | Total | |
| |
| Assets: | | | | | | | | | | | | | | | | |
Investments in Securities:a | | | | | | | | | | | | | | | | |
Equity Investments: | | | | | | | | | | | | | | | | |
Real Estate Operating Companies | | $ | 3,397,703 | | | $ | 12,551,947 | | | $ | — | | | $ | 15,949,650 | |
All Other Equity Investments | | | 130,628,138 | | | | — | | | | — | | | | 130,628,138 | |
Short Term Investments | | | — | | | | 281,832 | | | | — | | | | 281,832 | |
| | | | |
Total Investments in Securities | | $ | 134,025,841 | | | $ | 12,833,779 | | | $ | — | | | $ | 146,859,620 | |
| | | | |
aFor detailed categories, see the accompanying Statement of Investments.
FRANKLIN TEMPLETON VARIABLE INSURANCE PRODUCTS TRUST
NOTES TO FINANCIAL STATEMENTS
Franklin Global Real Estate VIP Fund(continued)
10. Subsequent Events
The Fund has evaluated subsequent events through the issuance of the financial statements and determined that no events have occurred that require disclosure other than those already disclosed in the financial statements.
Abbreviations
| | |
|
| Selected Portfolio |
| |
| IDR | | International Depositary Receipt |
| |
| REIT | | Real Estate Investment Trust |
FRANKLIN TEMPLETON VARIABLE INSURANCE PRODUCTS TRUST
Report of Independent Registered Public Accounting Firm
To the Board of Trustees of Franklin Templeton Variable Insurance Products Trust and Shareholders of Franklin Global Real Estate VIP Fund
Opinion on the Financial Statements
We have audited the accompanying statement of assets and liabilities, including the statement of investments, of Franklin Global Real Estate VIP Fund (the “Fund”) as of December 31, 2018, the related statement of operations for the year ended December 31, 2018, the statement of changes in net assets for each of the two years in the period ended December 31, 2018, including the related notes, and the financial highlights for each of the five years in the period ended December 31, 2018 (collectively referred to as the “financial statements”). In our opinion, the financial statements present fairly, in all material respects, the financial position of the Fund as of December 31, 2018, the results of its operations for the year then ended, the changes in its net assets for each of the two years in the period ended December 31, 2018 and the financial highlights for each of the five years in the period ended December 31, 2018 in conformity with accounting principles generally accepted in the United States of America.
Basis for Opinion
These financial statements are the responsibility of the Fund’s management. Our responsibility is to express an opinion on the Fund’s financial statements based on our audits. We are a public accounting firm registered with the Public Company Accounting Oversight Board (United States) (PCAOB) and are required to be independent with respect to the Fund in accordance with the U.S. federal securities laws and the applicable rules and regulations of the Securities and Exchange Commission and the PCAOB.
We conducted our audits of these financial statements in accordance with the standards of the PCAOB. Those standards require that we plan and perform the audit to obtain reasonable assurance about whether the financial statements are free of material misstatement, whether due to error or fraud.
Our audits included performing procedures to assess the risks of material misstatement of the financial statements, whether due to error or fraud, and performing procedures that respond to those risks. Such procedures included examining, on a test basis, evidence regarding the amounts and disclosures in the financial statements. Our audits also included evaluating the accounting principles used and significant estimates made by management, as well as evaluating the overall presentation of the financial statements. Our procedures included confirmation of securities owned as of December 31, 2018 by correspondence with the custodian. We believe that our audits provide a reasonable basis for our opinion.
PricewaterhouseCoopers LLP
San Francisco, California
February 15, 2019
We have served as the auditor of one or more investment companies in the Franklin Templeton Group of Funds since 1948.
This page intentionally left blank.
Franklin Growth and Income VIP Fund
This annual report for Franklin Growth and Income VIP Fund covers the fiscal year ended December 31, 2018.
Class 1 Performance Summary as of December 31, 2018
Average annual total return of Class 1 shares* represents the average annual change in value, assuming reinvestment of dividends and capital gains. Average returns smooth out variations in returns, which can be significant; they are not the same asyear-by-year results.
| | | | | | | | | | | | |
| | | |
| Periods ended 12/31/18 | | 1-Year | | | 5-Year | | | 10-Year | |
Average Annual Total Return | | | -4.37% | | | | +6.20% | | | | +11.64% | |
*The Fund has an expense reduction contractually guaranteed through 4/30/19. Fund investment results reflect the expense reduction; without this reduction, the results would have been lower.
Performance reflects the Fund’s Class 1 operating expenses, but doesnotinclude any contract fees, expenses or sales charges. If they had been included, performance would be lower. These charges and deductions, particularly for variable life policies, can have a significant effect on contract values and insurance benefits. See the contract prospectus for a complete description of these expenses, including sales charges.
Performance data represent past performance, which does not guarantee future results. Investment return and principal value will fluctuate, and you may have a gain or loss when you sell your shares. Current performance may differ from figures shown.
Total Return Index Comparison for a Hypothetical $10,000 Investment (1/1/09–12/31/18)
The graph below shows the change in value of a hypothetical $10,000 investment in the Fund over the indicated period and includes reinvestment of any income or distributions. The Fund’s performance* is compared to the performance of the Standard & Poor’s® 500 Index (S&P 500®), the Lipper VIP Equity Income Funds Classification Average and the Consumer Price Index. One cannot invest directly in an index, and an index is not representative of the Fund’s portfolio.Please see Important Notes to Performance Information preceding the Fund Summaries.
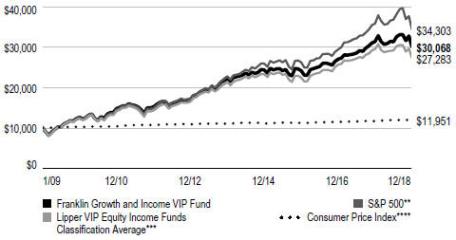
**Source: Morningstar. Please see Index Descriptions following the Fund Summaries.
***Source: Lipper, a Thomson Reuters Company. Please see Index Descriptions following the Fund Summaries.
****Source: Bureau of Labor Statistics, bls.gov/cpi. Please see Index Descriptions following the Fund Summaries.
FRANKLIN GROWTH AND INCOME VIP FUND
Fund Goal and Main Investments
The Fund seeks capital appreciation with current income as a secondary goal. Under normal market conditions, the Fund invests predominantly in equity securities, including common stock, preferred stock and securities convertible into common stock.
Fund Risks
All investments involve risks, including possible loss of principal. Stock prices fluctuate, sometimes rapidly and dramatically, due to factors affecting individual companies, particular industries or sectors, or general market conditions. Growth stock prices reflect projections of future earnings or revenues, and can, therefore, fall dramatically if the company fails to meet those projections. Value securities may not increase in price as anticipated or may decline further if other investors fail to recognize the company’s value or favor investing in faster growing companies. Because the Fund can only distribute what it earns, the Fund’s distributions to shareholders may decline when prevailing interest rates fall, when dividend income from investments in stocks decline, or when the Fund experiences defaults on debt securities it holds. To the extent the Fund focuses on particular countries, regions, industries, sectors or types of investment from time to time, it may be subject to greater risks of adverse developments in such areas of focus than a fund that invests in a wider variety of countries, regions, industries, sectors or investments. Special risks are associated with foreign investing, including currency fluctuations, economic instability and political developments; investments in emerging markets involve heightened risks related to the same factors. The Fund is actively managed but there is no guarantee that the manager’s investment decisions will produce the desired results. The Fund’s prospectus also includes a description of the main investment risks.
Performance Overview
You can find the Fund’sone-year total return in the Performance Summary. In comparison, the Fund’s benchmark, the S&P 500 had a-4.38% total return.1 The Fund’s peers, as measured by the Lipper VIP Equity Income Funds Classification Average, had a-7.90% total return for the same period.2
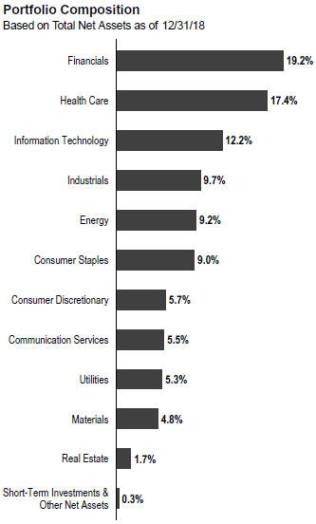
Economic and Market Overview
The U.S. economy grew during the 12 months under review. After moderating for three consecutive quarters, the economy grew faster in 2018’s second quarter, driven by consumer spending, business investment, exports and government spending. However, growth moderated in the third quarter due to declines in exports and housing investment. The manufacturing and services sectors expanded during the period. The unemployment rate declined from 4.1% in December 2017 to 3.9% at period-end.3 Annual inflation, as measured by the Consumer Price Index, decreased from 2.1% in December 2017 to 1.9% at period-end.3
1. Source: Morningstar.
2. Source: Lipper, a Thomson Reuters Company.
One cannot invest directly in an index, and an index is not representative of the Fund’s portfolio. Please see Index Descriptions following the Fund Summaries.
3. Source: U.S. Bureau of Labor Statistics.
The dollar value, number of shares or principal amount, and names of all portfolio holdings are listed in the Fund’s Statement of Investments (SOI).
FRANKLIN GROWTH AND INCOME VIP FUND
The U.S. Federal Reserve (Fed) raised its target range for the federal funds rate four times during the period, to 2.25%–2.50%, and continued to reduce its balance sheet as part of its ongoing plan to normalize monetary policy. At its December meeting, the Fed reduced the projected 2019 rate increases to two, compared to three projected previously.
U.S. equity markets overall declined during the period amid concerns about tighter regulation of technology companies, the pace of the Fed’s rate increases, U.S. political uncertainties, the Trump administration’s protectionist policies, and the potential impact of the U.S.-China trade dispute on U.S. and global growth and corporate earnings. However, these concerns were partially alleviated by an overall easing of tensions in the Korean peninsula, ongoing trade negotiations between the U.S. and the European Union, and a new trade deal between the U.S., Mexico and Canada (pending ratification by the three countries’ legislatures), and intermittent U.S.-China trade negotiations, including a temporary truce that the two countries reached in December. Markets also benefited from mostly upbeat economic data, better U.S. corporate earnings, results of the U.S.mid-term elections and a potentially slower pace to the Fed’s rate increases. In this environment, the broad U.S. stock market, as measured by the S&P 500, reached a newall-time high in September 2018, but had a-4.38% total return for the12-month period.1
Investment Strategy
We seek to invest in a broadly diversified portfolio of equity securities that we consider to be financially strong, with a focus on “blue chip” companies. We apply abottom-up approach to investing in individual securities. We will assess the market price of a company’s securities relative to our evaluation of the company’s long-term earnings, asset value and cash flow potential. We also consider a company’s price/earnings ratio, profit margins, balance sheet and liquidation value. We consider dividend yield and the opportunity for dividend growth in selecting stocks for the Fund because we believe that, over time, dividend income can contribute significantly to total return and can be a more consistent source of investment return than capital appreciation. We seek to take advantage of price dislocations that result from the market’s short-term focus and choose to invest in those companies that, in our opinion, offer the besttrade-off between growth opportunity, business and financial risk, and valuation.
| | | | |
| Top 10 Holdings | | | |
| 12/31/18 | | | |
| |
Company Sector/Industry | | % of Total
Net Assets | |
JPMorgan Chase & Co. Financials | | | 4.2% | |
Microsoft Corp. Information Technology | | | 3.5% | |
Bank of America Corp. Financials | | | 2.6% | |
Wells Fargo & Co. Financials | | | 2.6% | |
Chevron Corp. Energy | | | 2.6% | |
Merck & Co. Inc. Health Care | | | 2.6% | |
The Procter & Gamble Co. Consumer Staples | | | 2.6% | |
Pfizer Inc. Health Care | | | 2.6% | |
PepsiCo Inc. Consumer Staples | | | 2.5% | |
Johnson & Johnson Health Care | | | 2.3% | |
Manager’s Discussion
During the period under review, sectors that rose in value among the Fund’s investments included health care, information technology (IT) and utilities. In contrast, the financials, industrials and energy sectors declined.
In the health care sector, pharmaceutical firms Merck and Pfizer benefited performance. Merck benefited after releasing favorable clinical trial results for its Keytruda oncology drug in treating lung cancer. The company also raised its dividend and authorized a new significant share buyback plan. Shares of Pfizer increased amid growing earnings, optimism about the company’s pipeline of late-state products and firm restructuring plans. Eli Lilly also helped results in the sector.
In the IT sector, information software and services firm Microsoft continued to be rewarded by its growing cloud computing business and efforts to move Microsoft Office clients to a subscription-based service, and the company reported solid quarterly growth in revenues and earnings per share. Networking firm Cisco Systems also boosted results.
In the utilities sector, electric utility NextEra Energy helped results. In other sectors, positions in oil and gas exploration and
FRANKLIN GROWTH AND INCOME VIP FUND
production company Anadarko Petroleum4 and insurance brokerage firm Arthur Gallagher aided performance even though their sectors underperformed.
In the financials sector, large bank Wells Fargo, financial services firm Morgan Stanley and investment manager BlackRock were notable detractors. Wells Fargo continued to be negatively impacted by reports of a sales practices scandal and increased Fed scrutiny that limited asset growth. The company also reported weak earnings amid declining levels of loans and deposits. Consistent with a general slump in the financials sector, shares of Morgan Stanley declined despite favorable guidance and increased quarterly earnings helped by growing asset management levels and good cost management. Although BlackRock reported better-than-expected earnings for the second and third quarters of 2018, its shares declined due to investor concerns about slower investment inflows.
In the industrials sector, engine manufacturer Cummins detracted from performance, and energy equipment and services provider Schlumberger in the energy sector also detracted. In other sectors, chemicals company BASF, specialty materials and chemicals company DowDuPont and food manufacturer Kraft Heinz4 hindered results.
Thank you for your participation in Franklin Growth and Income VIP Fund. We look forward to serving your future investment needs.
The foregoing information reflects our analysis, opinions and portfolio holdings as of December 31, 2018, the end of the reporting period. The way we implement our main investment strategies and the resulting portfolio holdings may change depending on factors such as market and economic conditions. These opinions may not be relied upon as investment advice or an offer for a particular security. The information is not a complete analysis of every aspect of any market, country, industry, security or the Fund. Statements of fact are from sources considered reliable, but the investment manager makes no representation or warranty as to their completeness or accuracy. Although historical performance is no guarantee of future results, these insights may help you understand our investment management philosophy.
4. Not held atperiod-end.
FRANKLIN GROWTH AND INCOME VIP FUND
Class 1 Fund Expenses
As an investor in a variable insurance contract (Contract) that indirectly provides for investment in an underlying mutual fund, you can incur transaction and/or ongoing expenses at both the Fund level and the Contract Level: (1) transaction expenses can include sales charges (loads) on purchases, surrender fees, transfer fees and premium taxes; and (2) ongoing expenses can include management fees, distribution and service (12b-1) fees, contract fees, annual maintenance fees, mortality and expense risk fees and other fees and expenses. All mutual funds and Contracts have some types of ongoing expenses. The table below shows Fund-level ongoing expenses and can help you understand these costs and compare them with those of other mutual funds offered through the Contract. The table assumes a $1,000 investment held for the six months indicated. Please refer to the Fund prospectus for additional information on operating expenses.
Actual Fund Expenses
The table below provides information about the actual account values and actual expenses in the columns under the heading “Actual.” In these columns the Fund’s actual return, which includes the effect of ongoing Fund expenses but does not include the effect of ongoing Contract expenses, is used to calculate the “Ending Account Value.” You can estimate the Fund-level expenses you paid during the period by following these steps (ofcourse, your account value and expenses will differ from those in this illustration):Divide your account value by $1,000 (ifyour account had an $8,600 value, then $8,600 ÷ $1,000 = 8.6). Then multiply the result by the number under the headings “Actual” and “Fund-Level Expenses Paid During Period” (ifFund-Level Expenses Paid During Period were $ 7.50, then 8.6 × $7.50 = $64.50). In this illustration, the estimated expenses paid this period at the Fund level are $64.50.
Hypothetical Example for Comparison with Other Mutual Funds
Under the heading “Hypothetical” in the table, information is provided about hypothetical account values and hypothetical expenses based on the Fund’s actual expense ratio and an assumed rate of return of 5% per year before expenses, which is not the Fund’s actual return. This information may not be used to estimate the actual ending account balance or expenses you paid for the period, but it can help you compare ongoing costs of investing in the Fund with those of other mutual funds offered through the Contract. To do so, compare this 5% hypothetical example with the 5% hypothetical examples that appear in the shareholder reports of other funds offered through the Contract.
Please note that expenses shown in the table are meant to highlight ongoing costs at the Fund level only and do not reflect any ongoing expenses at the Contract level, or transaction expenses at either the Fund or Contract levels. In addition, while the Fund does not have transaction expenses, if the transaction and ongoing expenses at the Contract level were included, the expenses shown below would be higher. You should consult your Contract prospectus or disclosure document for more information.
| | | | | | | | | | | | | | | | | | | | | | | | | | |
| | | | | |
| | | | | | Actual (actual return after expenses) | | | | | Hypothetical (5% annual return before expenses) | | | | |
| | | | | | | |
Share
Class | | Beginning Account
Value 7/1/18 | | | Ending Account
Value 12/31/18 | | | Fund-Level Expenses
Paid During Period
7/1/18–12/31/181,2 | | | | | Ending Account Value 12/31/18 | | | Fund-Level Expenses
Paid During Period
7/1/18–12/31/181,2 | | | Net
Annualized
Expense
Ratio2 | |
Class 1 | | | $1,000 | | | | $959.10 | | | | $2.91 | | | | | | $1,022.23 | | | | $3.01 | | | | 0.59 | % |
1. Expenses are equal to the annualized expense ratio for thesix-month period as indicated above—in the far right column—multiplied by the simple average account value over the period indicated, and then multiplied by 184/365 to reflect theone-half year period.
2. Reflects expenses after fee waivers and expense reimbursements. Does not include any ongoing expenses of the Contract for which the Fund is an investment option or acquired fund fees and expenses.
FRANKLIN TEMPLETON VARIABLE INSURANCE PRODUCTS TRUST
Financial Highlights
Franklin Growth and Income VIP Fund
| | | | | | | | | | | | | | | | | | | | |
| |
| | | Year Ended December 31, | |
| | | | | |
| | | 2018 | | | 2017 | | | 2016 | | | 2015 | | | 2014 | |
| Class 1 | | | | | | | | | | | | | | | | | | | | |
| | | | | |
Per share operating performance (for a share outstanding throughout the year) | | | | | | | | | | | | | | | | | | | | |
| | | | | |
Net asset value, beginning of year | | | $16.32 | | | | $15.97 | | | | $15.94 | | | | $17.02 | | | | $15.97 | |
| | | | |
| | | | | |
| Income from investment operationsa: | | | | | | | | | | | | | | | | | | | | |
| | | | | |
Net investment incomeb | | | 0.31 | | | | 0.35 | | | | 0.40 | | | | 0.45 | | | | 0.53 | c |
| | | | | | |
Net realized and unrealized gains (losses) | | | (0.97 | ) | | | 2.04 | | | | 1.33 | | | | (0.54 | ) | | | 0.95 | |
| | | | |
| | | | | |
Total from investment operations | | | (0.66 | ) | | | 2.39 | | | | 1.73 | | | | (0.09 | ) | | | 1.48 | |
| | | | |
| | | | | |
| Less distributions from: | | | | | | | | | | | | | | | | | | | | |
| | | | | |
Net investment income | | | (0.43 | ) | | | (1.03 | ) | | | (0.46 | ) | | | (0.61 | ) | | | (0.43 | ) |
| | | | | |
Net realized gains | | | (0.43 | ) | | | (1.01 | ) | | | (1.24 | ) | | | (0.38 | ) | | | — | |
| | | | |
| | | | | |
Total distributions | | | (0.86 | ) | | | (2.04 | ) | | | (1.70 | ) | | | (0.99 | ) | | | (0.43 | ) |
| | | | |
| | | | | |
Net asset value, end of year | | | $14.80 | | | | $16.32 | | | | $15.97 | | | | $15.94 | | | | $17.02 | |
| | | | |
| | | | | |
Total returnd | | | (4.37)% | | | | 16.15% | | | | 11.86% | | | | (0.62)% | | | | 9.40% | |
| | | | | |
| Ratios to average net assets | | | | | | | | | | | | | | | | | | | | |
| | | | | |
Expenses before waiver and payments by affiliates | | | 0.73% | | | | 0.72% | | | | 0.59% | | | | 0.58% | | | | 0.57% | |
| | | | | |
Expenses net of waiver and payments by affiliates | | | 0.59% | e | | | 0.59% | e | | | 0.59% | e,f | | | 0.58% | | | | 0.57% | e |
| | | | | | |
Net investment income | | | 1.96% | | | | 2.21% | | | | 2.38% | | | | 2.74% | | | | 3.26% | c |
| | | | | | |
| Supplemental data | | | | | | | | | | | | | | | | | | | | |
| | | | | |
Net assets, end of year (000’s) | | | $31,479 | | | | $35,865 | | | | $29,829 | | | | $144,663 | | | | $168,961 | |
| | | | | |
Portfolio turnover rate | | | 24.29% | | | | 33.91% | | | | 40.59% | g | | | 48.81% | | | | 20.54% | |
aThe amount shown for a share outstanding throughout the period may not correlate with the Statement of Operations for the period due to the timing of sales and repurchases of the Fund’s shares in relation to income earned and/or fluctuating fair value of the investments of the Fund.
bBased on average daily shares outstanding.
cNet investment income per share includes approximately $0.12 per share related to income received in the form of special dividends in connection with certain Fund holdings. Excluding this amount, the ratio of net investment income to average net assets would have been 2.53%.
dTotal return does not include fees, charges or expenses imposed by the variable annuity and life insurance contracts for which Franklin Templeton Variable Insurance Products Trust serves as an underlying investment vehicle.
eBenefit of expense reduction rounds to less than 0.01%.
fBenefit of waiver and payments by affiliates rounds to less than 0.01%.
gExcludes the value of portfolio securities delivered as a result of a redemptionin-kind.
| | | | |
| | | |
| FGI-6 | | Annual Report | The accompanying notes are an integral part of these financial statements. | | |
FRANKLIN TEMPLETON VARIABLE INSURANCE PRODUCTS TRUST
FINANCIAL STATEMENTS
Franklin Growth and Income VIP Fund(continued)
| | | | | | | | | | | | | | | | | | | | |
| |
| | | Year Ended December 31, | |
| | | | | |
| | | 2018 | | | 2017 | | | 2016 | | | 2015 | | | 2014 | |
| Class 2 | | | | | | | | | | | | | | | | | | | | |
| | | | | |
Per share operating performance (for a share outstanding throughout the year) | | | | | | | | | | | | | | | | | | | | |
| | | | | |
Net asset value, beginning of year | | | $16.02 | | | | $15.69 | | | | $15.68 | | | | $16.76 | | | | $15.73 | |
| | | | |
| | | | | |
| Income from investment operationsa: | | | | | | | | | | | | | | | | | | | | |
| | | | | |
Net investment incomeb | | | 0.27 | | | | 0.31 | | | | 0.30 | | | | 0.40 | | | | 0.48 | c |
| | | | | | |
Net realized and unrealized gains (losses) | | | (0.96 | ) | | | 2.00 | | | | 1.37 | | | | (0.54 | ) | | | 0.94 | |
| | | | |
| | | | | |
Total from investment operations | | | (0.69 | ) | | | 2.31 | | | | 1.67 | | | | (0.14 | ) | | | 1.42 | |
| | | | |
| | | | | |
| Less distributions from: | | | | | | | | | | | | | | | | | | | | |
| | | | | |
Net investment income | | | (0.39 | ) | | | (0.97 | ) | | | (0.42 | ) | | | (0.56 | ) | | | (0.39 | ) |
| | | | | |
Net realized gains | | | (0.43 | ) | | | (1.01 | ) | | | (1.24 | ) | | | (0.38 | ) | | | — | |
| | | | |
| | | | | |
Total distributions | | | (0.82 | ) | | | (1.98 | ) | | | (1.66 | ) | | | (0.94 | ) | | | (0.39 | ) |
| | | | |
| | | | | |
Net asset value, end of year | | | $14.51 | | | | $16.02 | | | | $15.69 | | | | $15.68 | | | | $16.76 | |
| | | | |
| | | | | |
Total returnd | | | (4.58)% | | | | 15.85% | | | | 11.62% | | | | (0.91)% | | | | 9.14% | |
| | | | | |
| Ratios to average net assets | | | | | | | | | | | | | | | | | | | | |
| | | | | |
Expenses before waiver and payments by affiliates | | | 0.98% | | | | 0.97% | | | | 0.84% | | | | 0.83% | | | | 0.82% | |
| | | | | |
Expenses net of waiver and payments by affiliates | | | 0.84% | e | | | 0.84% | e | | | 0.84% | e,f | | | 0.83% | | | | 0.82% | e |
| | | | | | |
Net investment income | | | 1.71% | | | | 1.96% | | | | 2.13% | | | | 2.49% | | | | 3.01% | c |
| | | | | | |
| Supplemental data | | | | | | | | | | | | | | | | | | | | |
| | | | | |
Net assets, end of year (000’s) | | | $61,855 | | | | $74,105 | | | | $69,474 | | | | $124,691 | | | | $138,191 | |
| | | | | |
Portfolio turnover rate | | | 24.29% | | | | 33.91% | | | | 40.59% | g | | | 48.81% | | | | 20.54% | |
aThe amount shown for a share outstanding throughout the period may not correlate with the Statement of Operations for the period due to the timing of sales and repurchases of the Fund’s shares in relation to income earned and/or fluctuating fair value of the investments of the Fund.
bBased on average daily shares outstanding.
cNet investment income per share includes approximately $0.12 per share related to income received in the form of special dividends in connection with certain Fund holdings. Excluding this amount, the ratio of net investment income to average net assets would have been 2.28%.
dTotal return does not include fees, charges or expenses imposed by the variable annuity and life insurance contracts for which Franklin Templeton Variable Insurance Products Trust serves as an underlying investment vehicle.
eBenefit of expense reduction rounds to less than 0.01%.
fBenefit of waiver and payments by affiliates rounds to less than 0.01%.
gExcludes the value of portfolio securities delivered as a result of a redemptionin-kind.
| | | | | | |
| | | |
| | The accompanying notes are an integral part of these financial statements. | Annual Report | | | FGI-7 | |
FRANKLIN TEMPLETON VARIABLE INSURANCE PRODUCTS TRUST
Statement of Investments, December 31, 2018
| | | | | | | | | | | | | | |
Franklin Growth and Income VIP Fund | | | | |
| | | | |
| | | | | Country | | | Shares | | | Value | |
| | Common Stocks 87.8% | | | | | | | | | | | | |
| | Communication Services 4.2% | | | | | | | | | | | | |
| | Comcast Corp., A | | | United States | | | | 32,500 | | | $ | 1,106,625 | |
| | Rogers Communications Inc., B | | | Canada | | | | 14,344 | | | | 735,273 | |
| | TELUS Corp. | | | Canada | | | | 21,800 | | | | 722,701 | |
| | Verizon Communications Inc. | | | United States | | | | 24,710 | | | | 1,389,196 | |
| | | | | | | | | | | | | | |
| | | | | | | | | | | | | 3,953,795 | |
| | | | | | | | | | | | | | |
| | Consumer Discretionary 3.4% | | | | | | | | | | | | |
| | Las Vegas Sands Corp. | | | United States | | | | 12,800 | | | | 666,240 | |
| | Lowe’s Cos. Inc. | | | United States | | | | 6,548 | | | | 604,774 | |
| | McDonald’s Corp. | | | United States | | | | 7,000 | | | | 1,242,990 | |
| | Target Corp. | | | United States | | | | 9,580 | | | | 633,142 | |
| | | | | | | | | | | | | | |
| | | | | | | | | | | | | 3,147,146 | |
| | | | | | | | | | | | | | |
| | Consumer Staples 9.0% | | | | | | | | | | | | |
| | The Coca-Cola Co. | | | United States | | | | 40,700 | | | | 1,927,145 | |
| | PepsiCo Inc. | | | United States | | | | 21,298 | | | | 2,353,003 | |
| | The Procter & Gamble Co. | | | United States | | | | 26,100 | | | | 2,399,112 | |
| | Walmart Inc. | | | United States | | | | 18,800 | | | | 1,751,220 | |
| | | | | | | | | | | | | | |
| | | | | | | | | | | | | 8,430,480 | |
| | | | | | | | | | | | | | |
| | Energy 8.8% | | | | | | | | | | | | |
| | Chevron Corp. | | | United States | | | | 22,368 | | | | 2,433,415 | |
| | Exxon Mobil Corp. | | | United States | | | | 20,977 | | | | 1,430,422 | |
| | Occidental Petroleum Corp. | | | United States | | | | 21,900 | | | | 1,344,222 | |
| | ONEOK Inc. | | | United States | | | | 14,500 | | | | 782,275 | |
| | Royal Dutch Shell PLC, A, ADR | | | United Kingdom | | | | 21,213 | | | | 1,236,081 | |
| | Suncor Energy Inc. | | | Canada | | | | 35,682 | | | | 998,025 | |
| | | | | | | | | | | | | | |
| | | | | | | | | | | | | 8,224,440 | |
| | | | | | | | | | | | | | |
| | Financials 18.2% | | | | | | | | | | | | |
| | Arthur J. Gallagher & Co. | | | United States | | | | 9,566 | | | | 705,014 | |
| | Bank of America Corp. | | | United States | | | | 60,000 | | | | 1,478,400 | |
| | BB&T Corp. | | | United States | | | | 33,876 | | | | 1,467,508 | |
| | BlackRock Inc. | | | United States | | | | 2,361 | | | | 927,448 | |
| | The Charles Schwab Corp. | | | United States | | | | 24,742 | | | | 1,027,535 | |
| | JPMorgan Chase & Co. | | | United States | | | | 40,300 | | | | 3,934,086 | |
| | MetLife Inc. | | | United States | | | | 32,000 | | | | 1,313,920 | |
| | Morgan Stanley | | | United States | | | | 46,737 | | | | 1,853,122 | |
| | U.S. Bancorp | | | United States | | | | 40,755 | | | | 1,862,504 | |
| | Wells Fargo & Co. | | | United States | | | | 52,850 | | | | 2,435,328 | |
| | | | | | | | | | | | | | |
| | | | | | | | | | | | | 17,004,865 | |
| | | | | | | | | | | | | | |
| | Health Care 14.1% | | | | | | | | | | | | |
| | Baxter International Inc. | | | United States | | | | 8,500 | | | | 559,470 | |
| | Bristol-Myers Squibb Co. | | | United States | | | | 11,700 | | | | 608,166 | |
| | Eli Lilly & Co. | | | United States | | | | 9,837 | | | | 1,138,338 | |
| | Johnson & Johnson | | | United States | | | | 16,765 | | | | 2,163,523 | |
| | Medtronic PLC | | | United States | | | | 23,781 | | | | 2,163,120 | |
| | Merck & Co. Inc. | | | United States | | | | 31,600 | | | | 2,414,556 | |
| | Pfizer Inc. | | | United States | | | | 54,563 | | | | 2,381,675 | |
| | UnitedHealth Group Inc. | | | United States | | | | 6,900 | | | | 1,718,928 | |
| | | | | | | | | | | | | | |
| | | | | | | | | | | | | 13,147,776 | |
| | | | | | | | | | | | | | |
FRANKLIN TEMPLETON VARIABLE INSURANCE PRODUCTS TRUST
STATEMENT OF INVESTMENTS
Franklin Growth and Income VIP Fund(continued)
| | | | | | | | | | | | | | |
| | | | |
| | | | | Country | | | Shares | | | Value | |
| | Common Stocks(continued) | | | | | | | | | | | | |
| | | Industrials 9.2% | | | | | | | | | |
| | Cummins Inc. | | | United States | | | | 6,069 | | | $ | 811,061 | |
| | Illinois Tool Works Inc. | | | United States | | | | 3,911 | | | | 495,485 | |
| | Lockheed Martin Corp. | | | United States | | | | 4,369 | | | | 1,143,979 | |
| | Norfolk Southern Corp. | | | United States | | | | 7,500 | | | | 1,121,550 | |
| | Raytheon Co. | | | United States | | | | 10,416 | | | | 1,597,294 | |
| | Republic Services Inc. | | | United States | | | | 25,480 | | | | 1,836,853 | |
| | Stanley Black & Decker Inc. | | | United States | | | | 3,832 | | | | 458,844 | |
| | United Technologies Corp. | | | United States | | | | 10,234 | | | | 1,089,716 | |
| | | | | | | | | | | | | | |
| | | | | | | | | | | | | 8,554,782 | |
| | | | | | | | | | | | | | |
| | | Information Technology 9.7% | | | | | | | | | |
| | Apple Inc. | | | United States | | | | 8,232 | | | | 1,298,516 | |
| | Cisco Systems Inc. | | | United States | | | | 40,189 | | | | 1,741,390 | |
| | Intel Corp. | | | United States | | | | 20,657 | | | | 969,433 | |
| | Microsoft Corp. | | | United States | | | | 32,476 | | | | 3,298,587 | |
| | Oracle Corp. | | | United States | | | | 13,829 | | | | 624,379 | |
| | Texas Instruments Inc. | | | United States | | | | 11,996 | | | | 1,133,622 | |
| | | | | | | | | | | | | | |
| | | | | | | | | | | | | 9,065,927 | |
| | | | | | | | | | | | | | |
| | | Materials 4.2% | | | | | | | | | |
| | BASF SE | | | Germany | | | | 12,137 | | | | 845,423 | |
| | DowDuPont Inc. | | | United States | | | | 25,573 | | | | 1,367,644 | |
| | International Paper Co. | | | United States | | | | 21,220 | | | | 856,439 | |
| | Linde PLC | | | United Kingdom | | | | 5,300 | | | | 827,012 | |
| | | | | | | | | | | | | | |
| | | | | | | | | | | | | 3,896,518 | |
| | | | | | | | | | | | | | |
| | | Real Estate 1.7% | | | | | | | | | |
| | Equity Residential | | | United States | | | | 9,800 | | | | 646,898 | |
| | Host Hotels & Resorts Inc. | | | United States | | | | 58,941 | | | | 982,546 | |
| | | | | | | | | | | | | | |
| | | | | | | | | | | | | 1,629,444 | |
| | | | | | | | | | | | | | |
| | | Utilities 5.3% | | | | | | | | | |
| | Duke Energy Corp. | | | United States | | | | 13,700 | | | | 1,182,310 | |
| | NextEra Energy Inc. | | | United States | | | | 11,854 | | | | 2,060,462 | |
| | Xcel Energy Inc. | | | United States | | | | 33,596 | | | | 1,655,275 | |
| | | | | | | | | | | | | | |
| | | | | | | | | | | | | 4,898,047 | |
| | | | | | | | | | | | | | |
| | | | |
| | Total Common Stocks (Cost $60,543,021) | | | | | | | | | | | 81,953,220 | |
| | | | | | | | | | | | | | |
| | | | |
| a | | Equity-Linked Securities 9.0% | | | | | | | | | | | | |
| | | Communication Services 1.3% | | | | | | | | | |
| b | | Goldman Sachs International into Alphabet Inc., 5.00%, A, 144A | | | United States | | | | 1,100 | | | | 1,165,414 | |
| | | | | | | | | | | | | | |
| | Consumer Discretionary 2.3% | | | | | | | | | | | | |
| b | | Wells Fargo Bank National Assn. into Amazon.com Inc., 6.00%, 144A | | | United States | | | | 800 | | | | 1,212,044 | |
| b | | Wells Fargo Bank National Assn. into Dollar General Corp., 6.50%, 144A | | | United States | | | | 9,000 | | | | 957,672 | |
| | | | | | | | | | | | | | |
| | | | | | | | | | | | | 2,169,716 | |
| | | | | | | | | | | | | | |
| | | Energy 0.4% | | | | | | | | | |
| b | | Credit Suisse AG London into Schlumberger Ltd., 6.50%, 144A | | | United States | | | | 10,300 | | | | 385,584 | |
| | | | | | | | | | | | | | |
| | | Financials 1.0% | | | | | | | | | |
| b | | Morgan Stanley BV into Bank of America Corp., 6.50%, 144A | | | United States | | | | 38,000 | | | | 967,943 | |
| | | | | | | | | | | | | | |
FRANKLIN TEMPLETON VARIABLE INSURANCE PRODUCTS TRUST
STATEMENT OF INVESTMENTS
Franklin Growth and Income VIP Fund(continued)
| | | | | | | | | | | | | | |
| | | | |
| | | | | Country | | | Shares | | | Value | |
| a | | Equity-Linked Securities(continued) | | | | | | | | | | | | |
| | | Health Care 1.5% | | | | | | | | | |
| b | | Deutsche Bank AG London into Baxter International Inc., 4.50%, 144A | | | United States | | | | 8,000 | | | $ | 532,015 | |
| b | | Goldman Sachs International into HCA Holdings Inc., 6.00%, 144A | | | United States | | | | 6,400 | | | | 825,358 | |
| | | | | | | | | | | | | | |
| | | | | | | | | | | | | 1,357,373 | |
| | | | | | | | | | | | | | |
| | | Information Technology 2.5% | | | | | | | | | |
| b | | Credit Suisse AG London into Broadcom Inc., 8.50%, 144A | | | United States | | | | 3,500 | | | | 878,753 | |
| b | | Goldman Sachs International into Intel Corp., 8.00%, 144A | | | United States | | | | 10,700 | | | | 508,212 | |
| b | | Merrill Lynch International & Co. CV into Analog Devices Inc., 7.00%, 144A | | | United States | | | | 11,000 | | | | 942,900 | |
| | | | | | | | | | | | | | |
| | | | | | | | | | | | | 2,329,865 | |
| | | | | | | | | | | | | | |
| | | | |
| | Total Equity-Linked Securities (Cost $9,232,070) | | | | | | | | | | | 8,375,895 | |
| | | | | | | | | | | | | | |
| | | | |
| | Convertible Preferred Stocks 2.9% | | | | | | | | | | | | |
| | Health Care 1.8% | | | | | | | | | | | | |
| | Becton Dickinson and Co., 6.125%, cvt. pfd., A | | | United States | | | | 28,800 | | | | 1,660,896 | |
| | | | | | | | | | | | | | |
| | Industrials 0.5% | | | | | | | | | | | | |
| | Fortive Corp., 5.00%, cvt. pfd., A | | | United States | | | | 510 | | | | 462,871 | |
| | | | | | | | | | | | | | |
| | Materials 0.6% | | | | | | | | | | | | |
| | International Flavors & Fragrances Inc., 6.00%, cvt. pfd | | | United States | | | | 11,582 | | | | 587,207 | |
| | | | | | | | | | | | | | |
| | | | |
| | Total Convertible Preferred Stocks (Cost $2,634,492) | | | | | | | | | | | 2,710,974 | |
| | | | | | | | | | | | | | |
| | | | |
| | Total Investments before Short Term Investments (Cost $72,409,583) | | | | | | | | | | | 93,040,089 | |
| | | | | | | | | | | | | | |
| | | | |
| | | | | | | | Principal Amount | | | | |
| | | | |
| | Short Term Investments (Cost $483,219) 0.5% | | | | | | | | | | | | |
| | Repurchase Agreements 0.5% | | | | | | | | | | | | |
| c | | Joint Repurchase Agreement, 2.922%, 1/02/19 (Maturity Value $483,297) | | | | | | | | | | | | |
| | BNP Paribas Securities Corp. (Maturity Value $214,994) | | | | | | | | | | | | |
| | Deutsche Bank Securities Inc. (Maturity Value $80,184) | | | | | | | | | | | | |
| | HSBC Securities (USA) Inc. (Maturity Value $188,119) | | | | | | | | | | | | |
| | Collateralized by U.S. Government Agency Securities, 3.00% - 8.00%, 12/15/25 -12/20/48;dU.S. Treasury Bills, 1/17/19; and U.S. Treasury Notes, 1.25% - 3.50%, 5/31/19 - 9/30/20 (valued at $493,034) | | | United States | | | $ | 483,219 | | | | 483,219 | |
| | | | | | | | | | | | | | |
| | | | |
| | Total Investments (Cost $72,892,802) 100.2% | | | | | | | | | | | 93,523,308 | |
| | | | |
| | Other Assets, less Liabilities (0.2)% | | | | | | | | | | | (188,876 | ) |
| | | | | | | | | | | | | | |
| | | | |
| | Net Assets 100.0% | | | | | | | | | | $ | 93,334,432 | |
| | | | | | | | | | | | | | |
See Abbreviations on page FGI-20.
aSee Note 1(d) regarding equity-linked securities.
bSecurity was purchased pursuant to Rule 144A under the Securities Act of 1933 and may be sold in transactions exempt from registration only to qualified institutional buyers or in a public offering registered under the Securities Act of 1933. These securities have been deemed liquid under guidelines approved by the Trust’s Board of Trustees. At December 31, 2018, the aggregate value of these securities was $8,375,895, representing 9.0% of net assets.
cSee Note 1(c) regarding joint repurchase agreement.
dThe security was issued on a discount basis with no stated coupon rate.
| | | | |
| | |
| FGI-10 | | Annual Report | The accompanying notes are an integral part of these financial statements. |
FRANKLIN TEMPLETON VARIABLE INSURANCE PRODUCTS TRUST
Financial Statements
Statement of Assets and Liabilities
December 31, 2018
| | | | |
| |
| | | Franklin Growth
and Income VIP Fund | |
Assets: | | | | |
Investments in securities: | | | | |
Cost - Unaffiliated issuers | | $ | 72,409,583 | |
Cost - Unaffiliated repurchase agreements | | | 483,219 | |
| | | | |
Value - Unaffiliated issuers | | $ | 93,040,089 | |
Value - Unaffiliated repurchase agreements | | | 483,219 | |
Receivables: | | | | |
Capital shares sold | | | 47,620 | |
Dividends | | | 170,337 | |
Other assets | | | 12 | |
| | | | |
Total assets | | | 93,741,277 | |
| | | | |
Liabilities: | | | | |
Payables: | | | | |
Investment securities purchased | | | 263,199 | |
Capital shares redeemed | | | 16,667 | |
Management fees | | | 25,010 | |
Distribution fees | | | 27,533 | |
Reports to shareholders | | | 38,287 | |
Professional fees | | | 33,021 | |
Accrued expenses and other liabilities | | | 3,128 | |
| | | | |
Total liabilities | | | 406,845 | |
| | | | |
Net assets, at value | | $ | 93,334,432 | |
| | | | |
Net assets consist of: | | | | |
Paid-in capital | | $ | 64,908,912 | |
Total distributable earnings (loss) | | | 28,425,520 | |
| | | | |
Net assets, at value | | $ | 93,334,432 | |
| | | | |
| |
| Class 1: | | | | |
Net assets, at value | | $ | 31,478,954 | |
| | | | |
Shares outstanding | | | 2,127,571 | |
| | | | |
Net asset value and maximum offering price per share | | $ | 14.80 | |
| | | | |
| |
| Class 2: | | | | |
Net assets, at value | | $ | 61,855,478 | |
| | | | |
Shares outstanding | | | 4,263,328 | |
| | | | |
Net asset value and maximum offering price per share | | $ | 14.51 | |
| | | | |
| | | | | | |
| | | |
| | The accompanying notes are an integral part of these financial statements. | Annual Report | | | FGI-11 | |
FRANKLIN TEMPLETON VARIABLE INSURANCE PRODUCTS TRUST
FINANCIAL STATEMENTS
Statement of Operations
for the year ended December 31, 2018
| | | | |
| |
| | | Franklin Growth
and Income VIP Fund | |
Investment income: | | | | |
Dividends: (net of foreign taxes)* | | | | |
Unaffiliated issuers | | $ | 2,674,941 | |
Interest: | | | | |
Unaffiliated issuers | | | 28,249 | |
| | | | |
Total investment income | | | 2,703,190 | |
| | | | |
Expenses: | | | | |
Management fees (Note 3a) | | | 654,250 | |
Distribution fees: (Note 3c) | | | | |
Class 2 | | | 177,196 | |
Custodian fees (Note 4) | | | 1,603 | |
Reports to shareholders | | | 53,791 | |
Professional fees | | | 48,182 | |
Trustees’ fees and expenses | | | 766 | |
Other | | | 16,550 | |
| | | | |
Total expenses | | | 952,338 | |
Expense reductions (Note 4) | | | (331 | ) |
Expenses waived/paid by affiliates (Note 3e) | | | (149,777 | ) |
| | | | |
Net expenses | | | 802,230 | |
| | | | |
Net investment income | | | 1,900,960 | |
| | | | |
Realized and unrealized gains (losses): | | | | |
Net realized gain (loss) from: | | | | |
Investments: | | | | |
Unaffiliated issuers | | | 6,053,469 | |
Realized gain distributions from REITs | | | 6,662 | |
Foreign currency transactions | | | 2,046 | |
| | | | |
Net realized gain (loss) | | | 6,062,177 | |
| | | | |
Net change in unrealized appreciation (depreciation) on: | | | | |
Investments: | | | | |
Unaffiliated issuers | | | (12,184,305 | ) |
Translation of other assets and liabilities denominated in foreign currencies | | | (322 | ) |
| | | | |
Net change in unrealized appreciation (depreciation) | | | (12,184,627 | ) |
| | | | |
Net realized and unrealized gain (loss) | | | (6,122,450 | ) |
| | | | |
Net increase (decrease) in net assets resulting from operations | | $ | (4,221,490 | ) |
| | | | |
| |
*Foreign taxes withheld on dividends | | $ | 35,750 | |
| | | | |
| | | |
| FGI-12 | | Annual Report | The accompanying notes are an integral part of these financial statements. | | |
FRANKLIN TEMPLETON VARIABLE INSURANCE PRODUCTS TRUST
FINANCIAL STATEMENTS
Statements of Changes in Net Assets
| | | | | | | | |
| |
| | | Franklin Growth and Income VIP Fund | |
| |
| | | Year Ended December 31, | |
| | |
| | | 2018 | | | 2017 | |
Increase (decrease) in net assets: | | | | | | | | |
Operations: | | | | | | | | |
Net investment income | | $ | 1,900,960 | | | $ | 2,171,299 | |
Net realized gain (loss) | | | 6,062,177 | | | | 3,278,575 | |
Net change in unrealized appreciation (depreciation) | | | (12,184,627 | ) | | | 10,412,049 | |
| | | | |
Net increase (decrease) in net assets resulting from operations | | | (4,221,490 | ) | | | 15,861,923 | |
| | | | |
Distributions to shareholders: (Note 1f) | | | | | | | | |
Class 1 | | | (1,845,139 | ) | | | (4,057,455 | ) |
Class 2 | | | (3,639,656 | ) | | | (8,741,347 | ) |
| | | | |
Total distributions to shareholders | | | (5,484,795 | ) | | | (12,798,802 | ) |
| | | | |
Capital share transactions: (Note 2) | | | | | | | | |
Class 1 | | | (1,177,234 | ) | | | 5,020,919 | |
Class 2 | | | (5,751,247 | ) | | | 2,582,809 | |
| | | | |
Total capital share transactions | | | (6,928,481 | ) | | | 7,603,728 | |
| | | | |
Net increase (decrease) in net assets | | | (16,634,766 | ) | | | 10,666,849 | |
Net assets: | | | | | | | | |
Beginning of year | | | 109,969,198 | | | | 99,302,349 | |
| | | | |
End of year (Note 1f) | | $ | 93,334,432 | | | $ | 109,969,198 | |
| | | | |
| | | | | | |
| | | |
| | The accompanying notes are an integral part of these financial statements. | Annual Report | | | FGI-13 | |
FRANKLIN TEMPLETON VARIABLE INSURANCE PRODUCTS TRUST
Notes to Financial Statements
Franklin Growth and Income VIP Fund
1. Organization and Significant Accounting Policies
Franklin Templeton Variable Insurance Products Trust (Trust) is registered under the Investment Company Act of 1940 (1940 Act) as anopen-end management investment company, consisting of eighteen separate funds and applies the specialized accounting and reporting guidance in U.S. Generally Accepted Accounting Principles (U.S. GAAP). Franklin Growth and Income VIP Fund (Fund) is included in this report. Shares of the Fund are generally sold only to insurance company separate accounts to fund the benefits of variable life insurance policies or variable annuity contracts. The Fund offers two classes of shares: Class 1 and Class 2. Each class of shares may differ by its distribution fees, voting rights on matters affecting a single class and its exchange privilege.
The following summarizes the Fund’s significant accounting policies.
a. Financial Instrument Valuation
The Fund’s investments in financial instruments are carried at fair value daily. Fair value is the price that would be received to sell an asset or paid to transfer a liability in an orderly transaction between market participants on the measurement date. The Fund calculates the net asset value (NAV) per share each business day as of 4 p.m. Eastern time or the regularly scheduled close of the New York Stock Exchange (NYSE), whichever is earlier. Under compliance policies and procedures approved by the Trust’s Board of Trustees (the Board), the Fund’s administrator has responsibility for oversight of valuation, including leading the cross-functional Valuation Committee (VC). The Fund may utilize independent pricing services, quotations from securities and financial instrument dealers, and other market sources to determine fair value.
Equity securities listed on an exchange or on the NASDAQ National Market System are valued at the last quoted sale price or the official closing price of the day, respectively. Foreign equity securities are valued as of the close of trading on the foreign stock exchange on which the security is primarily traded, or as of 4 p.m. Eastern time. The value is then converted into its U.S. dollar equivalent at the foreign exchange rate in effect at 4 p.m. Eastern time on the day that the value of the security is determined.Over-the-counter (OTC) securities are valued within the range of the most recent quoted bid and ask prices. Securities that trade in multiple markets or on multiple
exchanges are valued according to the broadest and most representative market. Certain equity securities are valued based upon fundamental characteristics or relationships to similar securities.
Investments in repurchase agreements are valued at cost, which approximates fair value.
The Fund has procedures to determine the fair value of financial instruments for which market prices are not reliable or readily available. Under these procedures, the Fund primarily employs a market-based approach which may use related or comparable assets or liabilities, recent transactions, market multiples, book values, and other relevant information for the investment to determine the fair value of the investment. An income-based valuation approach may also be used in which the anticipated future cash flows of the investment are discounted to calculate fair value. Discounts may also be applied due to the nature or duration of any restrictions on the disposition of the investments. Due to the inherent uncertainty of valuations of such investments, the fair values may differ significantly from the values that would have been used had an active market existed.
Trading in securities on foreign securities stock exchanges and OTC markets may be completed before 4 p.m. Eastern time. In addition, trading in certain foreign markets may not take place on every Fund’s business day. Occasionally, events occur between the time at which trading in a foreign security is completed and 4 p.m. Eastern time that might call into question the reliability of the value of a portfolio security held by the Fund. As a result, differences may arise between the value of the Fund’s portfolio securities as determined at the foreign market close and the latest indications of value at 4 p.m. Eastern time. In order to minimize the potential for these differences, the VC monitors price movements following the close of trading in foreign stock markets through a series of country specific market proxies (such as baskets of American Depositary Receipts, futures contracts and exchange traded funds). These price movements are measured against established trigger thresholds for each specific market proxy to assist in determining if an event has occurred that may call into question the reliability of the values of the foreign securities held by the Fund. If such an event occurs, the securities may be valued using fair value procedures, which may include the use of independent pricing services. At December 31, 2018, a market event occured resulting in a portion of the securities held by the Fund being valued using fair value procedures.
FRANKLIN TEMPLETON VARIABLE INSURANCE PRODUCTS TRUST
NOTES TO FINANCIAL STATEMENTS
Franklin Growth and Income VIP Fund(continued)
When the last day of the reporting period is anon-business day, certain foreign markets may be open on those days that the Fund’s NAV is not calculated, which could result in differences between the value of the Fund’s portfolio securities on the last business day and the last calendar day of the reporting period. Any significant security valuation changes due to an open foreign market are adjusted and reflected by the Fund for financial reporting purposes.
b. Foreign Currency Translation
Portfolio securities and other assets and liabilities denominated in foreign currencies are translated into U.S. dollars based on the exchange rate of such currencies against U.S. dollars on the date of valuation. The Fund may enter into foreign currency exchange contracts to facilitate transactions denominated in a foreign currency. Purchases and sales of securities, income and expense items denominated in foreign currencies are translated into U.S. dollars at the exchange rate in effect on the transaction date. Portfolio securities and assets and liabilities denominated in foreign currencies contain risks that those currencies will decline in value relative to the U.S. dollar. Occasionally, events may impact the availability or reliability of foreign exchange rates used to convert the U.S. dollar equivalent value. If such an event occurs, the foreign exchange rate will be valued at fair value using procedures established and approved by the Board.
The Fund does not separately report the effect of changes in foreign exchange rates from changes in market prices on securities held. Such changes are included in net realized and unrealized gain or loss from investments in the Statement of Operations.
Realized foreign exchange gains or losses arise from sales of foreign currencies, currency gains or losses realized between the trade and settlement dates on securities transactions and the difference between the recorded amounts of dividends, interest, and foreign withholding taxes and the U.S. dollar equivalent of the amounts actually received or paid. Net unrealized foreign exchange gains and losses arise from changes in foreign exchange rates on foreign denominated assets and liabilities other than investments in securities held at the end of the reporting period.
c. Joint Repurchase Agreement
The Fund enters into a joint repurchase agreement whereby its uninvested cash balance is deposited into a joint cash account with other funds managed by the investment manager or an
affiliate of the investment manager and is used to invest in one or more repurchase agreements. The value and face amount of the joint repurchase agreement are allocated to the funds based on theirpro-rata interest. A repurchase agreement is accounted for as a loan by the Fund to the seller, collateralized by securities which are delivered to the Fund’s custodian. The fair value, including accrued interest, of the initial collateralization is required to be at least 102% of the dollar amount invested by the funds, with the value of the underlying securities marked to market daily to maintain coverage of at least 100%. Repurchase agreements are subject to the terms of Master Repurchase Agreements (MRAs) with approved counterparties (sellers). The MRAs contain various provisions, including but not limited to events of default and maintenance of collateral for repurchase agreements. In the event of default by either the seller or the Fund, certain MRAs may permit thenon-defaulting party to net andclose-out all transactions, if any, traded under such agreements. The Fund may sell securities it holds as collateral and apply the proceeds towards the repurchase price and any other amounts owed by the seller to the Fund in the event of default by the seller. This could involve costs or delays in addition to a loss on the securities if their value falls below the repurchase price owed by the seller. The joint repurchase agreement held by the Fund at year end, as indicated in the Statement of Investments, had been entered into on December 31, 2018.
d. Equity-Linked Securities
The Fund invests in equity-linked securities. Equity-linked securities are hybrid financial instruments that generally combine both debt and equity characteristics into a single note form. Income received from equity-linked securities is recorded as realized gains in the Statement of Operations and may be based on the performance of an underlying equity security, an equity index, or an option position. The risks of investing in equity-linked securities include unfavorable price movements in the underlying security and the credit risk of the issuing financial institution. There may be no guarantee of a return of principal with equity-linked securities and the appreciation potential may be limited. Equity-linked securities may be more volatile and less liquid than other investments held by the Fund.
e. Income and Deferred Taxes
It is the Fund’s policy to qualify as a regulated investment company under the Internal Revenue Code. The Fund intends to distribute to shareholders substantially all of its taxable income
FRANKLIN TEMPLETON VARIABLE INSURANCE PRODUCTS TRUST
NOTES TO FINANCIAL STATEMENTS
Franklin Growth and Income VIP Fund(Continued)
1. Organization and Significant Accounting
Policies(continued)
e. Income and Deferred Taxes(continued)
and net realized gains to relieve it from federal income and if applicable, excise taxes. As a result, no provision for U.S. federal income taxes is required.
The Fund may be subject to foreign taxation related to income received, capital gains on the sale of securities and certain foreign currency transactions in the foreign jurisdictions in which it invests. Foreign taxes, if any, are recorded based on the tax regulations and rates that exist in the foreign markets in which the Fund invests. When a capital gain tax is determined to apply, the Fund records an estimated deferred tax liability in an amount that would be payable if the securities were disposed of on the valuation date.
The Fund may recognize an income tax liability related to its uncertain tax positions under U.S. GAAP when the uncertain tax position has a less than 50% probability that it will be sustained upon examination by the tax authorities based on its technical merits. As of December 31, 2018, the Fund has determined that no tax liability is required in its financial statements related to uncertain tax positions for any open tax years (or expected to be taken in future tax years). Open tax years are those that remain subject to examination and are based on the statute of limitations in each jurisdiction in which the Fund invests.
f. Security Transactions, Investment Income, Expenses and Distributions
Security transactions are accounted for on trade date. Realized gains and losses on security transactions are determined on a specific identification basis. Interest income and estimated expenses are accrued daily. Dividend income and capital gain distributions are recorded on theex-dividend date except for certain dividends from securities where the dividend rate is not available. In such cases, the dividend is recorded as soon as the information is received by the Fund. Distributions to shareholders are recorded on theex-dividend date. Distributable earnings are determined according to income tax regulations
(tax basis) and may differ from earnings recorded in accordance with U.S. GAAP. These differences may be permanent or temporary. Permanent differences are reclassified among capital accounts to reflect their tax character. These reclassifications have no impact on net assets or the results of operations. Temporary differences are not reclassified, as they may reverse in subsequent periods.*
Common expenses incurred by the Trust are allocated among the Funds based on the ratio of net assets of each Fund to the combined net assets of the Trust or based on the ratio of number of shareholders of each Fund to the combined number of shareholders of the Trust. Fund specific expenses are charged directly to the Fund that incurred the expense.
Realized and unrealized gains and losses and net investment income, excluding class specific expenses, are allocated daily to each class of shares based upon the relative proportion of net assets of each class. Differences in per share distributions by class are generally due to differences in class specific expenses.
g. Accounting Estimates
The preparation of financial statements in accordance with U.S. GAAP requires management to make estimates and assumptions that affect the reported amounts of assets and liabilities at the date of the financial statements and the amounts of income and expenses during the reporting period. Actual results could differ from those estimates.
h. Guarantees and Indemnifications
Under the Trust’s organizational documents, its officers and trustees are indemnified by the Trust against certain liabilities arising out of the performance of their duties to the Trust. Additionally, in the normal course of business, the Trust, on behalf of the Fund, enters into contracts with service providers that contain general indemnification clauses. The Trust’s maximum exposure under these arrangements is unknown as this would involve future claims that may be made against the Trust that have not yet occurred. Currently, the Trust expects the risk of loss to be remote.
*Effective during the current reporting period, it is no longer required to present certain line items in the Statements of Changes in Net Assets. The below prior period amounts affected by this change are shown as they were in the prior year Statements of Changes in Net Assets.
FRANKLIN TEMPLETON VARIABLE INSURANCE PRODUCTS TRUST
NOTES TO FINANCIAL STATEMENTS
Franklin Growth and Income VIP Fund(continued)
For the year ended December 31, 2017, distributions to shareholders were as follows:
| | |
Distributions from net investment income : | | |
Class 1 | | $ (2,052,142) |
Class 2 | | (4,282,950) |
Distributions from net realized gains: | | |
Class 1 | | (2,005,313) |
Class 2 | | (4,458,397) |
For the year ended December 31, 2017, undistributed net investment income included in net assets was $2,575,264.
2. Shares of Beneficial Interest
At December 31, 2018, there were an unlimited number of shares authorized (without par value). Transactions in the Fund’s shares were as follows:
| | | | | | | | | | | | | | | | | | | | |
| |
| | | Year Ended December 31, | |
| | | |
| | | 2018 | | | | | | 2017 | |
| | | | | |
| | | Shares | | | Amount | | | | | | Shares | | | Amount | |
| | | | | |
| Class 1 Shares: | | | | | | | | | | | | | | | | | | | | |
Shares sold | | | 84,856 | | | $ | 1,355,363 | | | | | | | | 273,799 | | | $ | 4,396,906 | |
Shares issued in reinvestment of distributions | | | 117,600 | | | | 1,845,139 | | | | | | | | 272,130 | | | | 4,057,455 | |
Shares redeemed | | | (272,261 | ) | | | (4,377,736 | ) | | | | | | | (216,463 | ) | | | (3,433,442 | ) |
| | | | |
Net increase (decrease) | | | (69,805 | ) | | $ | (1,177,234 | ) | | | | | | | 329,466 | | | $ | 5,020,919 | |
| | | | |
| Class 2 Shares: | | | | | | | | | | | | | | | | | | | | |
Shares sold | | | 100,573 | | | $ | 1,575,307 | | | | | | | | 304,558 | | | $ | 4,865,372 | |
Shares issued in reinvestment of distributions | | | 236,188 | | | | 3,639,656 | | | | | | | | 596,679 | | | | 8,741,347 | |
Shares redeemed | | | (699,174 | ) | | | (10,966,210 | ) | | | | | | | (704,129 | ) | | | (11,023,910 | ) |
| | | | |
Net increase (decrease) | | | (362,413 | ) | | $ | (5,751,247 | ) | | | | | | | 197,108 | | | $ | 2,582,809 | |
| | | | |
3. Transactions with Affiliates
Franklin Resources, Inc. is the holding company for various subsidiaries that together are referred to as Franklin Templeton. Certain officers and trustees of the Fund are also officers and/or directors of the following subsidiaries:
| | |
| |
| Subsidiary | | Affiliation |
Franklin Advisers, Inc. (Advisers) | | Investment manager |
Franklin Templeton Services, LLC (FT Services) | | Administrative manager |
Franklin Templeton Distributors, Inc. (Distributors) | | Principal underwriter |
Franklin Templeton Investor Services, LLC (Investor Services) | | Transfer agent |
FRANKLIN TEMPLETON VARIABLE INSURANCE PRODUCTS TRUST
NOTES TO FINANCIAL STATEMENTS
Franklin Growth and Income VIP Fund(continued)
3. Transactions with Affiliates(continued)
a. Management Fees
The Fund pays an investment management fee to Advisers based on the average daily net assets of the Fund as follows:
| | |
| |
| Annualized Fee Rate | | Net Assets |
0.625% | | Up to and including $100 million |
0.500% | | Over $100 million, up to and including $250 million |
0.450% | | Over $250 million, up to and including $7.5 billion |
0.440% | | Over $7.5 billion, up to and including $10 billion |
0.430% | | Over $10 billion, up to and including $12.5 billion |
0.420% | | Over $12.5 billion, up to and including $15 billion |
0.400% | | In excess of $15 billion |
For the year ended December 31, 2018, the gross effective investment management fee rate was 0.618% of the Fund’s average daily net assets.
b. Administrative Fees
Under an agreement with Advisers, FT Services provides administrative services to the Fund. The fee is paid by Advisers based on the Fund’s average daily net assets, and is not an additional expense of the Fund.
c. Distribution Fees
The Board has adopted a distribution plan for Class 2 shares pursuant to Rule 12b-1 under the 1940 Act. Under the Fund’s compensation distribution plan, the Fund pays Distributors for costs incurred in connection with the servicing, sale and distribution of the Fund’s shares up to 0.35% per year of its average daily net assets. The Board has agreed to limit the current rate to 0.25% per year for Class 2. The plan year, for purposes of monitoring compliance with the maximum annual plan rate, is February 1 through January 31.
d. Transfer Agent Fees
Investor Services, under terms of an agreement, performs shareholder servicing for the Fund and is not paid by the Fund for the services.
e. Waiver and Expense Reimbursements
Advisers has contractually agreed in advance to waive or limit its fees and to assume as its own expense certain expenses otherwise payable by the Fund so that the expenses (excluding distribution fees, acquired fund fees and expenses and certainnon-routine expenses or costs, including those relating to litigation, indemnification, reorganisation and liquidations) for each class of the Fund do not exceed 0.59% based on the average net assets of each class until April 30, 2019. Total expenses waived or paid are not subject to recapture subsequent to the Fund’s fiscal year end.
4. Expense Offset Arrangement
The Fund has entered into an arrangement with its custodian whereby credits realized as a result of uninvested cash balances are used to reduce a portion of the Fund’s custodian expenses. During the year ended December 31, 2018, the custodian fees were reduced as noted in the Statement of Operations.
FRANKLIN TEMPLETON VARIABLE INSURANCE PRODUCTS TRUST
NOTES TO FINANCIAL STATEMENTS
Franklin Growth and Income VIP Fund(continued)
5. Income Taxes
The tax character of distributions paid during the years ended December 31, 2018 and 2017, was as follows:
| | | | | | | | |
| | |
| | | 2018 | | | 2017 | |
Distributions paid from: | | | | | | | | |
Ordinary income | | $ | 2,654,090 | | | $ | 7,912,641 | |
Long term capital gain | | | 2,830,705 | | | | 4,886,161 | |
| | | | |
| | $ | 5,484,795 | | | $ | 12,798,802 | |
| | | | |
At December 31, 2018, the cost of investments, net unrealized appreciation (depreciation), undistributed ordinary income and undistributed long term capital gains for income tax purposes were as follows:
| | | | |
Cost of investments | | $ | 72,835,679 | |
| | | | |
Unrealized appreciation | | $ | 22,919,613 | |
Unrealized depreciation | | | (2,231,984 | ) |
| | | | |
Net unrealized appreciation (depreciation) | | $ | 20,687,629 | |
| | | | |
Distributable earnings: | | | | |
Undistributed ordinary income | | $ | 2,375,761 | |
Undistributed long term capital gains | | | 5,423,192 | |
| | | | |
Total distributable earnings | | $ | 7,798,953 | |
| | | | |
Differences between income and/or capital gains as determined on a book basis and a tax basis are primarily due to differing treatment of equity-linked securities and bond discounts and premiums.
6. Investment Transactions
Purchases and sales of investments (excluding short term securities) for the year ended December 31, 2018, aggregated $25,262,721 and $32,954,133, respectively.
7. Credit Facility
The Fund, together with other U.S. registered and foreign investment funds (collectively, Borrowers), managed by Franklin Templeton, are borrowers in a joint syndicated senior unsecured credit facility totaling $2 billion (Global Credit Facility) which matured on February 8, 2019. This Global Credit Facility provides a source of funds to the Borrowers for temporary and emergency purposes, including the ability to meet future unanticipated or unusually large redemption requests. Effective February 8, 2019, the Borrowers renewed the Global Credit Facility for a one year term, maturing February 7, 2020, for a total of $2 billion.
Under the terms of the Global Credit Facility, the Fund shall, in addition to interest charged on any borrowings made by the Fund and other costs incurred by the Fund, pay its share of fees and expenses incurred in connection with the implementation and maintenance of the Global Credit Facility, based upon its relative share of the aggregate net assets of all of the Borrowers, including an annual commitment fee of 0.15% based upon the unused portion of the Global Credit Facility. These fees are reflected in other expenses in the Statement of Operations. During the year ended December 31, 2018, the Fund did not use the Global Credit Facility.
FRANKLIN TEMPLETON VARIABLE INSURANCE PRODUCTS TRUST
NOTES TO FINANCIAL STATEMENTS
Franklin Growth and Income VIP Fund(continued)
8. Fair Value Measurements
The Fund follows a fair value hierarchy that distinguishes between market data obtained from independent sources (observable inputs) and the Fund’s own market assumptions (unobservable inputs). These inputs are used in determining the value of the Fund’s financial instruments and are summarized in the following fair value hierarchy:
| | • | | Level 1 – quoted prices in active markets for identical financial instruments |
| | • | | Level 2 – other significant observable inputs (including quoted prices for similar financial instruments, interest rates, prepayment speed, credit risk, etc.) |
| | • | | Level 3 – significant unobservable inputs (including the Fund’s own assumptions in determining the fair value of financial instruments) |
The input levels are not necessarily an indication of the risk or liquidity associated with financial instruments at that level.
A summary of inputs used as of December 31, 2018, in valuing the Fund’s assets carried at fair value, is as follows:
| | | | | | | | | | | | | | | | |
| | | | |
| | | Level 1 | | | Level 2 | | | Level 3 | | | Total | |
| | | | |
| Assets: | | | | | | | | | | | | | | | | |
Investments in Securities:a | | | | | | | | | | | | | | | | |
Equity Investments:b | | | | | | | | | | | | | | | | |
Materials . | | $ | 3,638,302 | | | $ | 845,423 | | | $ | — | | | $ | 4,483,725 | |
All Other Equity Investments | | | 80,180,469 | | | | — | | | | — | | | | 80,180,469 | |
Equity-Linked Securities | | | — | | | | 8,375,895 | | | | — | | | | 8,375,895 | |
Short Term Investments | | | — | | | | 483,219 | | | | — | | | | 483,219 | |
| | | | |
Total Investments in Securities | | $ | 83,818,771 | | | $ | 9,704,537 | | | $ | — | | | $ | 93,523,308 | |
| | | | |
aFor detailed categories, see the accompanying Statement of Investments.
bIncludes common and convertible preferred stocks.
9. Subsequent Events
The Fund has evaluated subsequent events through the issuance of the financial statements and determined that no events have occurred that require disclosure other than already disclosed in the financial statements.
Abbreviations
| | | | |
|
| Selected Portfolio |
| | |
| ADR | | American Depositary Receipt | | |
FRANKLIN TEMPLETON VARIABLE INSURANCE PRODUCTS TRUST
Report of Independent Registered Public Accounting Firm
To the Board of Trustees of Franklin Templeton Variable Insurance Products Trust and Shareholders of Franklin Growth and Income VIP Fund
Opinion on the Financial Statements
We have audited the accompanying statement of assets and liabilities, including the statement of investments, of Franklin Growth and Income VIP Fund (the “Fund”) as of December 31, 2018, the related statement of operations for the year ended December 31, 2018, the statement of changes in net assets for each of the two years in the period ended December 31, 2018, including the related notes, and the financial highlights for each of the five years in the period ended December 31, 2018 (collectively referred to as the “financial statements”). In our opinion, the financial statements present fairly, in all material respects, the financial position of the Fund as of December 31, 2018, the results of its operations for the year then ended, the changes in its net assets for each of the two years in the period ended December 31, 2018 and the financial highlights for each of the five years in the period ended December 31, 2018 in conformity with accounting principles generally accepted in the United States of America.
Basis for Opinion
These financial statements are the responsibility of the Fund’s management. Our responsibility is to express an opinion on the Fund’s financial statements based on our audits. We are a public accounting firm registered with the Public Company Accounting Oversight Board (United States) (PCAOB) and are required to be independent with respect to the Fund in accordance with the U.S. federal securities laws and the applicable rules and regulations of the Securities and Exchange Commission and the PCAOB.
We conducted our audits of these financial statements in accordance with the standards of the PCAOB. Those standards require that we plan and perform the audit to obtain reasonable assurance about whether the financial statements are free of material misstatement, whether due to error or fraud.
Our audits included performing procedures to assess the risks of material misstatement of the financial statements, whether due to error or fraud, and performing procedures that respond to those risks. Such procedures included examining, on a test basis, evidence regarding the amounts and disclosures in the financial statements. Our audits also included evaluating the accounting principles used and significant estimates made by management, as well as evaluating the overall presentation of the financial statements. Our procedures included confirmation of securities owned as of December 31, 2018 by correspondence with the custodian and brokers; when replies were not received from brokers, we performed other auditing procedures. We believe that our audits provide a reasonable basis for our opinion.
PricewaterhouseCoopers LLP
San Francisco, California
February 15, 2019
We have served as the auditor of one or more investment companies in the Franklin Templeton Group of Funds since 1948.
FRANKLIN TEMPLETON VARIABLE INSURANCE PRODUCTS TRUST
Tax Information (unaudited)
Franklin Growth and Income VIP Fund
Under Section 852(b)(3)(C) of the Internal Revenue Code, the Fund hereby reports the maximum amount allowable but no less than $2,830,705 as a long term capital gain dividend for the fiscal year ended December 31, 2018.
Under Section 854(b)(1)(A) of the Internal Revenue Code, the Fund hereby reports 85.68% of the ordinary income dividends as income qualifying for the dividends received deduction for the fiscal year ended December 31, 2018.
Franklin Income VIP Fund
This annual report for Franklin Income VIP Fund covers the fiscal year ended December 31, 2018.
Class 1 Performance Summary as of December 31, 2018
Average annual total return of Class 1 shares* represents the average annual change in value, assuming reinvestment of dividends and capital gains. Average returns smooth out variations in returns, which can be significant; they are not the same asyear-by-year results.
| | | | | | | | | | | | |
| | | |
| Periods ended 12/31/18 | | 1-Year | | | 5-Year | | | 10-Year | |
Average Annual Total Return | | | -4.09% | | | | +3.34% | | | | +9.12% | |
* The Fund has a fee waiver associated with any investment it makes in a Franklin Templeton money fund and/or other Franklin Templeton fund, contractually guaranteed through 4/30/19. Fund investment results reflect the fee waiver; without this waiver, the results would have been lower.
Performance reflects the Fund’s Class 1 operating expenses, but doesnot include any contract fees, expenses or sales charges. If they had been included, performance would be lower. These charges and deductions, particularly for variable life policies, can have a significant effect on contract values and insurance benefits. See the contract prospectus for a complete description of these expenses, including sales charges.
Performance data represent past performance, which does not guarantee future results. Investment return and principal value will fluctuate, and you may have a gain or loss when you sell your shares. Current performance may differ from figures shown.
Total Return Index Comparison for a Hypothetical $10,000 Investment (1/1/09–12/31/18)
The graph below shows the change in value of a hypothetical $10,000 investment in the Fund over the indicated period and includes reinvestment of any income or distributions. The Fund’s performance* is compared to the performance of the Standard & Poor’s® 500 Index (S&P 500®) and the Bloomberg Barclays U.S. Aggregate Bond Index. One cannot invest directly in an index, and an index is not representative of the Fund’s portfolio.Please see Important Notes to Performance Information preceding the FundSummaries.
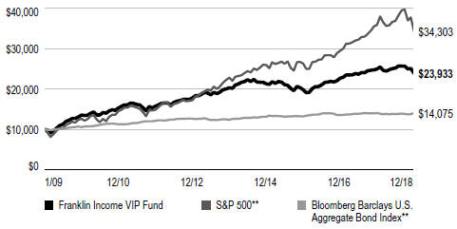
**Source: Morningstar. Please see Index Descriptions following the Fund Summaries.
FRANKLIN INCOME VIP FUND
Fund Goal and Main Investments
The Fund seeks to maximize income, while maintaining prospects for capital appreciation. Under normal market conditions, the Fund invests in a diversified portfolio of debt and equity securities.
Fund Risks
All investments involve risks, including possible loss of principal. Stock prices fluctuate, sometimes rapidly and dramatically, due to factors affecting individual companies, particular industries or sectors, or general market conditions. The Fund’s portfolio includes a substantial portion of higher yielding, lower rated corporate bonds because of the relatively higher yields they offer. The Fund’s share price and yield will be affected by interest rate movements. Bond prices generally move in the opposite direction of interest rates. Thus, as prices of bonds in the Fund adjust to a rise in interest rates, the Fund’s share price may decline. Changes in the financial strength of a bond issuer or in a bond’s credit rating may affect its value. Foreign investing carries additional risks such as currency and market volatility and political or social instability, risks that are heightened in developing countries. The Fund is actively managed but there is no guarantee that the manager’s investment decisions will produce the desired results. The Fund’s prospectus also includes a description of the main investment risks.
Performance Overview
You can find the Fund’sone-year total return in the Performance Summary. For comparison, the Fund’s equity benchmark, the S&P 500, had a-4.38% total return, and its fixed income benchmark, the Bloomberg Barclays U.S. Aggregate Bond Index, posted a +0.01% total return for the same period.1
Economic and Market Overview
The U.S. economy grew during the 12 months under review. After moderating for three consecutive quarters, the economy grew faster in 2018’s second quarter, driven by consumer spending, business investment, exports and government spending. However, growth moderated in the third quarter due to declines in exports and housing investment. The manufacturing and services sectors expanded during the period.
Portfolio Composition
12/31/18
| | | | |
| |
| | | % of Total
Net Assets | |
| Equity* | | | 45.9% | |
| Financials | | | 6.7% | |
| Utilities | | | 6.5% | |
| Energy | | | 6.0% | |
| Health Care | | | 5.2% | |
| Information Technology | | | 4.9% | |
| Materials | | | 3.6% | |
| Consumer Staples | | | 3.4% | |
| Communication Services | | | 3.4% | |
| Consumer Discretionary | | | 3.2% | |
| Industrials | | | 2.5% | |
| Real Estate | | | 0.5% | |
| Fixed Income | | | 50.3% | |
| Health Care | | | 13.1% | |
| Financials | | | 12.9% | |
| Communication Services | | | 6.9% | |
| Energy | | | 6.6% | |
| Consumer Discretionary | | | 3.0% | |
| Materials | | | 1.9% | |
| Utilities | | | 1.7% | |
| Industrials | | | 1.6% | |
| Consumer Staples | | | 1.2% | |
| Information Technology | | | 0.7% | |
| Real Estate | | | 0.7% | |
| Short-Term Investments & Other Net Assets | | | 3.8% | |
*Includes convertible bonds.
The unemployment rate declined from 4.1% in December 2017 to 3.9% at period-end.2 Annual inflation, as measured by the Consumer Price Index, decreased from 2.1% in December 2017 to 1.9% at period-end.2
The U.S. Federal Reserve (Fed) raised its target range for the federal funds rate four times during the period, to 2.25%–2.50%, and continued to reduce its balance sheet as part of its ongoing plan to normalize monetary policy. At its December meeting, the Fed reduced the projected 2019 rate increases to two, compared to three projected previously.
The10-year Treasury yield, which moves inversely to its price, increased during the period. The yield rose to multi-year highs
1. Source: Morningstar. One cannot invest directly in an index, and an index is not representative of the Fund’s portfolio. Please see Index Descriptions following the Fund Summaries.
2. Source: Bureau of Labor Statistics.
The dollar value, number of shares or principal amount, and names of all portfolio holdings are listed in the Fund’s Statement of Investments (SOI).
FRANKLIN INCOME VIP FUND
several times in 2018 amid investor concerns about higher inflation and the Fed’s interest-rate path. Expectations that other central banks might scale back monetary stimulus and better-than-expected U.S. economic reports also pushed the yield higher. However, some factors weighed on the Treasury yield at certain points during the period, including concerns about political turmoil in Italy, political uncertainties in the U.S., tensions between the U.S. and North Korea, the Trump administration’s protectionist trade policies, U.S. trade disputes with its allies and China, economic turmoil in Turkey and Argentina, slowing global economic growth and expectations the Fed would slow its pace of rate increases. Overall, the10-year Treasury yield rose from 2.40% at the beginning of the period to 2.69% atperiod-end.
Investment Strategy
In analyzing debt and equity securities, we consider such factors as a company’s experience and managerial strength; responsiveness to changes in interest rates and business conditions; debt maturity schedules and borrowing requirements; changing financial condition and market recognition of the change; and a security’s relative value based on such factors as anticipated cash flow, interest or dividend coverage, asset coverage and earnings. When choosing investments for the Fund, we apply abottom-up, value oriented, long-term approach, focusing on the market price of a company’s securities relative to the investment manager’s evaluation of the company’s long-term earnings, asset value and cash flow potential.
Manager’s Discussion
In our pursuit of what we considered attractive current income, while maintaining prospects for capital appreciation, we continued to hold a diversified mix of securities in our multi-asset income strategies, including common stocks, preferred stocks, equity-linked securities, government debt securities, corporate bonds (both investment grade and high yield), and floating-rate corporate term loans.
During the year, we increased our fixed income holdings, reflecting heightened uncertainty related to the potential effect of rising interest rates and quantitative tightening (i.e., Fed balance sheet reduction) on economic growth. Adding to these concerns in the latter part of 2018 were increased trade tensions (especially between China and the U.S.), rising political discord in the U.S. (e.g., government shutdown), and weakening global economic growth expectations (e.g., collapse in energy prices).
As a result of the numerous factors listed above, volatility increased during 2018 across a range of asset classes from the
Top Five Equity Holdings
12/31/18
| | | | |
| |
Company Sector/Industry | | % of Total
Net Assets | |
Wells Fargo & Co. Financials | | | 2.0% | |
The Southern Co. Utilities | | | 1.8% | |
Dominion Energy Inc. Utilities | | | 1.7% | |
Sempra Energy Utilities | | | 1.6% | |
Verizon Communications Inc. Communication Services | | | 1.5% | |
very low levels experienced in 2017. Our portfolio shifts were intended to help balance the Fund’s asset mix and reduce the expected risk of the Fund going forward. Key to this was the addition of short- and intermediate-maturity U.S. Treasury securities into the Fund. The rise in interest rates over the last12-18 months also made these securities more attractive to us on a relative value basis compared to the more full valuations across much of the equity and corporate credit markets.
Atperiod-end, the Fund held 50.3% in fixed income securities, including 38.8% in corporate bonds, 7.5% in U.S. Treasury securities, and 3.7% in floating-rate corporate loans. We maintained an emphasis on select opportunities within corporate debt securities, particularly withinnon-investment grade where we prefer to emphasize company-specific factors rather than broad credit and interest-rate risk. (High yield bonds have the added advantage of being a fairly short duration asset class.) Rising interest rates and select widening in corporate credit spreads presented an opportunity to more than double our weighting of investment-grade corporate debt.
Corporate fixed income sector exposures remain fairly diversified, with health care, financials, communication services and energy the largest weightings.
Overall performance among fixed income holdings was slightly negative for the year, with key detractors concentrated in energy and consumer discretionary. Key contributions among fixed income positions came from U.S. Treasury holdings, health care and utilities.
Atperiod-end, the Fund held 45.9% in equity securities.
While the overall performance from equity securities turned negative as equity markets came under significant pressure to end the year, performance was fairly mixed across sectors. Economically sensitive sectors came under the greatest
FRANKLIN INCOME VIP FUND
Top Five Fixed Income Holdings
and Senior Floating Rate Interests*
12/31/18
| | | | |
| |
Company Sector/Industry | | % of Total
Net Assets | |
U.S. Treasury Note Financials | | | 7.5% | |
CHS/Community Health Systems Inc. Health Care | | | 3.9% | |
Chesapeake Energy Corp. Energy | | | 2.4% | |
Tenet Healthcare Corp. Health Care | | | 2.2% | |
Citigroup Inc. Financials | | | 1.8% | |
*Does not include convertible bonds.
pressure atyear-end, with energy, financials, industrials and materials among the leading detractors. Partially offsetting the detractors were contributions from equity holdings in the health care, information technology and utilities sectors.
While markets remain relatively unsettled as we enter 2019, we continue to find what we believe to be attractive opportunities across a wide range of asset classes and securities that are capable of generating attractive income, while also offering the potential for long-term capital appreciation.
Thank you for your participation in Franklin Income VIP Fund.
We look forward to serving your future investment needs.
The foregoing information reflects our analysis, opinions and portfolio holdings as of December 31, 2018, the end of the reporting period. The way we implement our main investment strategies and the resulting portfolio holdings may change depending on factors such as market and economic conditions. These opinions may not be relied upon as investment advice or an offer for a particular security. The information is not a complete analysis of every aspect of any market, country, industry, security or the Fund. Statements of fact are from sources considered reliable, but the investment manager makes no representation or warranty as to their completeness or accuracy. Although historical performance is no guarantee of future results, these insights may help you understand our investment management philosophy.
FRANKLIN INCOME VIP FUND
Class 1 Fund Expenses
As an investor in a variable insurance contract (Contract) that indirectly provides for investment in an underlying mutual fund, you can incur transaction and/or ongoing expenses at both the Fund level and the Contract Level: (1) transaction expenses can include sales charges (loads) on purchases, surrender fees, transfer fees and premium taxes; and (2) ongoing expenses can include management fees, distribution and service (12b-1) fees, contract fees, annual maintenance fees, mortality and expense risk fees and other fees and expenses. All mutual funds and Contracts have some types of ongoing expenses. The table below shows Fund-level ongoing expenses and can help you understand these costs and compare them with those of other mutual funds offered through the Contract. The table assumes a $1,000 investment held for the six months indicated. Please refer to the Fund prospectus for additional information on operating expenses.
Actual Fund Expenses
The table below provides information about the actual account values and actual expenses in the columns under the heading “Actual.” In these columns the Fund’s actual return, which includes the effect of ongoing Fund expenses but does not include the effect of ongoing Contract expenses, is used to calculate the “Ending Account Value.” You can estimate the Fund-level expenses you paid during the period by following these steps (of course, your account value and expenses will differ from those in thisillustration): Divide your account value by $1,000 (if your account had an $8,600 value, then $8,600 ÷ $1,000 = 8.6). Thenmultiply the result by the number under the headings “Actual” and “Fund-Level Expenses Paid During Period” (if Fund-LevelExpenses Paid During Period were $ 7.50, then 8.6 × $7.50 = $64.50). In this illustration, the estimated expenses paid this period atthe Fund level are $64.50.
Hypothetical Example for Comparison with Other Mutual Funds
Under the heading “Hypothetical” in the table, information is provided about hypothetical account values and hypothetical expenses based on the Fund’s actual expense ratio and an assumed rate of return of 5% per year before expenses, which is not the Fund’s actual return. This information may not be used to estimate the actual ending account balance or expenses you paid for the period, but it can help you compare ongoing costs of investing in the Fund with those of other mutual funds offered through the Contract. To do so, compare this 5% hypothetical example with the 5% hypothetical examples that appear in the shareholder reports of other funds offered through the Contract.
Please note that expenses shown in the table are meant to highlight ongoing costs at the Fund level only and do not reflect any ongoing expenses at the Contract level, or transaction expenses at either the Fund or Contract levels. In addition, while the Fund does not have transaction expenses, if the transaction and ongoing expenses at the Contract level were included, the expenses shown below would be higher. You should consult your Contract prospectus or disclosure document for more information.
| | | | | | | | | | | | | | | | | | | | | | | | | | | | |
| | | | | |
| | | | | | Actual (actual return after expenses) | | | | | | Hypothetical (5% annual return before expenses) | | | | |
| | | | | | | |
Share Class | | Beginning Account
Value 7/1/18 | | | Ending Account
Value 12/31/18 | | | Fund-Level Expenses
Paid During Period
7/1/18–12/31/181,2 | | | | | | Ending Account
Value 12/31/18 | | | Fund-Level Expenses
Paid During Period
7/1/18–12/31/181,2 | | | Net
Annualized
Expense
Ratio2 | |
Class 1 | | | $1,000 | | | | $950.80 | | | | $2.21 | | | | | | | | $1,022.94 | | | | $2.29 | | | | 0.45 | % |
1. Expenses are equal to the annualized expense ratio for thesix-month period as indicated above—in the far right column—multiplied by the simple average account value over the period indicated, and then multiplied by 184/365 to reflect theone-half year period.
2. Reflects expenses after fee waivers and expense reimbursements. Does not include any ongoing expenses of the Contract for which the Fund is an investment option or acquired fund fees and expenses.
FI PI 10/18
SUPPLEMENT DATED OCTOBER 30, 2018
TO THE PROSPECTUSES
DATED MAY 1, 2018
OF
FRANKLIN INCOME VIP FUND
(A series of Franklin Templeton Variable Insurance Products Trust)
The prospectuses are amended as follows:
I. The second paragraph in the “Franklin Income VIP Fund – Fund Summaries – Principal Investment Strategies” section of the prospectuses is deleted.
II. The following is added to the “Franklin Income VIP Fund – Fund Summaries – Principal Investment Strategies” section of the prospectuses:
The Fund may, from time to time, use a variety of equity-related derivatives and complex equity securities, which may include purchasing or selling call and put options on equity securities and equity security indices, futures on equity securities and equity indexes, options on equity index futures and equity-linked notes, for various purposes including enhancing Fund returns, increasing liquidity, gaining exposure to particular instruments in more efficient or less expensive ways and/or hedging risks relating to changes in certain equity markets. In addition, the Fund may use interest rate derivatives, including interest rate swaps and interest rate and/or bond futures contracts (including U.S. Treasury futures contracts) for various purposes including enhancing Fund returns, increasing liquidity, gaining exposure to particular instruments in more efficient or less expensive ways and/or hedging risks relating to changes in interest rates. The Fund also may, from time to time, use currency derivatives, such as forward foreign currency exchange contracts, currency futures contracts, currency swaps and currency options to hedge (protect) against currency risks, and credit-related derivatives, such as credit default swaps and options on credit default swaps, to hedge (protect) against credit risks. The use of such derivative transactions may allow the Fund to obtain net long or net short exposures to selected markets, interest rates, countries or durations.
III. The following is added to the “Franklin Income VIP Fund – Fund Summaries – Principal Risks” section of the prospectuses:
Derivative InstrumentsThe performance of derivative instruments depends largely on the performance of an underlyinginstrument, such as a currency, security, interest rate or index, and such instruments often have risks similar to the underlying instrument, in addition to other risks. Derivatives involve costs and can create economic leverage in the Fund’s portfolio which may result in significant volatility and cause the Fund to participate in losses (as well as gains) in an amount that exceeds the Fund’s initial investment. Other risks include illiquidity, mispricing or improper valuation of the derivative instrument, and imperfect correlation between the value of the derivative and the underlying instrument so that the Fund may not realize the intended benefits. When a derivative is used for hedging, the change in value of the derivative may also not correlate specifically with the currency, security, interest rate, index or other risk being hedged. Derivatives also may present the risk that the other party to the transaction will fail to perform.
IV. The following replaces the eighth through eleventh paragraphs in the “Franklin Income VIP Fund – Fund Details – Principal Investment Policies and Practices” section of the prospectuses:
The Fund may, from time to time, use a variety of equity-related derivatives and complex equity securities, which may include purchasing or selling call and put options on equity securities and equity security indices, futures on equity securities and equity indexes, options on equity index futures and equity-linked notes, for various purposes including enhancing Fund returns, increasing liquidity, gaining exposure to particular instruments in more efficient or less expensive ways and/or hedging risks relating to changes in certain equity markets. In addition, the Fund may use interest rate derivatives, including interest rate swaps and interest rate and/or bond futures contracts (including U.S. Treasury futures contracts) for various purposes including enhancing Fund returns, increasing liquidity, gaining exposure to particular instruments in more efficient or less expensive ways and/or hedging risks relating to changes in interest rates. The Fund also may, from time to time, use currency derivatives, such as forward foreign currency exchange contracts, currency futures contracts, currency swaps and currency options to hedge (protect) against currency risks, and credit-related derivatives, such as credit default swaps and
options on credit default swaps, to hedge (protect) against credit risks. The use of such derivative transactions may allow the Fund to obtain net long or net short exposures to selected markets, interest rates, countries or durations. The investment manager considers various factors, such as availability and cost, in deciding whether, when and to what extent to enter into derivative transactions.
A currency forward contract is an obligation to purchase or sell a specific foreign currency at an agreed exchange rate (price) at a future date, which is typically individually negotiated and privately traded by currency traders and their customers in the interbank market. A futures contract is a standard binding agreement to buy or sell a specified quantity of an underlying instrument or asset, such as a specific currency, at a specified price at a specified later date that trade on an exchange.
Swap agreements, such as interest rate, currency, inflation index and credit default swaps, are contracts between the Fund and another party (the swap counterparty) involving the exchange of payments on specified terms over periods ranging from a few days to multiple years. A swap agreement may be negotiated bilaterally and tradedover-the-counter (OTC) between two parties (for an uncleared swap) or, in some instances, must be transacted through a futures commission merchant (FCM) and cleared through a clearinghouse that serves as a central counterparty (for a cleared swap). In a basic swap transaction, the Fund agrees with the swap counterparty to exchange the returns (or differentials in rates of return) and/or cash flows earned or realized on a particular “notional amount” of underlying instruments. The notional amount is the set amount selected by the parties as the basis on which to calculate the obligations that they have agreed to exchange. The parties typically do not actually exchange the notional amount. Instead, they agree to exchange the returns that would be earned or realized if the notional amount were invested in given instruments or at given interest rates.
For credit default swaps, the “buyer” of the credit default swap agreement is obligated to pay the “seller” a periodic stream of payments over the term of the agreement in return for a payment by the seller that is contingent upon the occurrence of a credit event with respect to an underlying reference debt obligation. The buyer of the credit default swap is purchasing the obligation of its counterparty to offset losses the buyer could experience if there was such a credit event. Generally, a credit event means bankruptcy, failure to timely pay interest or principal, obligation acceleration or default, or repudiation or restructuring of the reference debt obligation. The contingent payment by the seller generally is either the face amount of the reference debt obligation in exchange for the physical delivery of the reference debt obligation or a cash payment equal to the decrease in market value of the reference debt obligation following the occurrence of the credit event.
An interest rate swap is an agreement between two parties to exchange interest rate payment obligations. Typically, one rate is based on an interest rate fixed to maturity while the other is based on an interest rate that changes in accordance with changes in a designated benchmark (for example, LIBOR, prime, commercial paper, or other benchmarks).
A currency swap is generally a contract between two parties to exchange one currency for another currency at the start of the contract and then exchange periodic floating or fixed rates during the term of the contract based upon the relative value differential between the two currencies. Unlike other types of swaps, currency swaps typically involve the delivery of the entire principal (notional) amounts of the two currencies at the time the swap is entered into. At the end of the swap contract, the parties receive back the principal amounts of the two currencies.
A call option gives the purchaser of the option, upon payment of a premium, the right to buy, and the seller the obligation to sell, the underlying instrument at the exercise price. Conversely, a put option gives the purchaser of the option, upon payment of a premium, the right to sell, and the seller of the option the obligation to buy, the underlying instrument at the exercise price. For example, when the investment manager expects the price of a stock held by the Fund to decline in value, the Fund may also purchase put options that are expected to increase in value as the market price of the stock declines to hedge against such anticipated decline in value.
Equity-linked notes (ELNs) are hybrid derivative-type instruments that are specially designed to combine the characteristics of one or more reference securities (usually a single stock, a stock index or a basket of stocks (underlying securities)) and a related equity derivative, such as a put or call option, in a single note form. The Fund may engage in all types of ELNs, including those that: (1) provide for protection of the Fund’s principal in exchange for limited participation in the appreciation of the underlying securities, and (2) do not provide for such protection and subject the Fund to the risk of loss of the Fund’s principal investment. ELNs can provide the Fund with an efficient investment tool that may be less expensive than investing directly in the underlying securities and the related equity derivative.
Please keep this supplement with your prospectus for future reference.
FI P1 P2 P4 01/19
SUPPLEMENT DATED JANUARY 31, 2019
TO THE PROSPECTUSES
DATED MAY 1, 2018
OF
FRANKLIN INCOME VIP FUND
(a series of Franklin Templeton Variable Insurance Products Trust)
Effective February 1, 2019, the prospectus is amended as follows:
I. The portfolio management team under the “FUND SUMMARIES – Franklin Income VIP Fund – Portfolio Managers” section on page FI-S5 is replaced with the following:
Portfolio Managers
Edward D. Perks, CFAPresident and Director of Advisers and portfolio manager of the Fund since 2002.
Matthew D. QuinlanVice President of Advisers and portfolio manager of the Fund since 2012.
Richard S. Hsu, CFAVice President of Advisers and portfolio manager of the Fund since 2017.
Todd Brighton, CFAPortfolio Manager of Advisers and portfolio manager of the Fund since 2017.
Brendan Circle, CFAPortfolio Manager of Advisers and portfolio manager of the Fund since February 2019.
II. The portfolio management team under the “Fund Details – Franklin Income VIP Fund – Management” section on page FI-D8 is replaced with the following:
The Fund is managed by a team of dedicated professionals focused on investments in debt and equity securities. The portfolio managers of the team are as follows:
Edward D. Perks, CFA President and Director of Advisers
Mr. Perks has been a portfolio manager of the Fund since 2002. He has final authority over all aspects of the Fund’s investment portfolio, including but not limited to, purchases and sales of individual securities, portfolio risk assessment, and the management of daily cash balances in accordance with anticipated investment management requirements. The degree to which he may perform these functions, and the nature of these functions, may change from time to time. He joined Franklin Templeton Investments in 1992.
Matthew D. Quinlan Vice President of Advisers
Mr. Quinlan has been a portfolio manager of the Fund since 2012, providing research and advice on the purchases and sales of individual securities, and portfolio risk assessment. He joined Franklin Templeton Investments in 2005.
Richard S. Hsu Vice President of Advisers
Mr. Hsu has been a portfolio manager of the Fund since 2017, providing research and advice on the purchases and sales of individual securities, and portfolio risk assessment. He joined Franklin Templeton Investments in 1996.
Todd Brighton, CFA Portfolio Manager of Advisers
Mr. Brighton has been a portfolio manager of the Fund since 2017, providing research and advice on the purchases and sales of individual securities, and portfolio risk assessment. He joined Franklin Templeton Investments in 2000.
Brendan Circle, CFA Portfolio Manager of Advisers
Mr. Circle has been a portfolio manager of the Fund since February 2019, providing research and advice on the purchases and sales of individual securities, and portfolio risk assessment. He joined Franklin Templeton Investments in 2014.
CFA® and Chartered Financial Analyst® are trademarks owned by CFA Institute.
Please keep this supplement with your prospectus for future reference.
VIP SA2 10/18
SUPPLEMENT DATED OCTOBER 30, 2018
TO THE STATEMENT OF ADDITIONAL INFORMATION
DATED MAY 1, 2018
OF
FRANKLIN INCOME VIP FUND
(A series of Franklin Templeton Variable Insurance Products Trust)
The Statement of Additional Information (SAI) is amended as follows:
I. The following replaces the thirteenth through sixteenth and nineteenth bullet points in the list of bullet points under the “The Funds – Goals, Additional Strategies and Risks – Franklin Income VIP Fund (Income Fund)” heading in the SAI:
The Fund also may:
| | • | | engage in currency derivatives, such as currency forwards, currency futures, currency swaps and put and call options on currencies |
| | • | | engage in equity-related derivatives and complex securities, such as buying and writing call and put options on securities and indices that trade on national securities exchanges andover-the-counter (OTC), buying and selling futures on equity securities and indexes and options on equity index futures, engaging in equity total return swaps and using equity-linked notes, including up to 2% of the Fund’s assets in equity-linked notes on commodity-linked ETFs |
| | • | | engage in interest rate derivatives such as interest rate swaps and options thereon, interest rate/bond futures and options thereon, and inflation index swaps |
| | • | | engage in credit-related derivatives and complex securities, including buying and selling single name, loan and index credit default swaps and options thereon, fixed income total return swaps, credit-linked notes, collateralized debt obligations. |
Please keep this supplement with your prospectus for future reference.
FRANKLIN TEMPLETON VARIABLE INSURANCE PRODUCTS TRUST
Financial Highlights
Franklin Income VIP Fund
| | | | | | | | | | | | | | | | | | | | |
| |
| | | Year Ended December 31, | |
| | | | | |
| | | 2018 | | | 2017 | | | 2016 | | | 2015 | | | 2014 | |
| Class 1 | | | | | | | | | | | | | | | | | | | | |
Per share operating performance
(for a share outstanding throughout the year) | | | | | | | | | | | | | | | | | | | | |
| | | | | |
Net asset value, beginning of year | | | $16.72 | | | | $15.87 | | | | $14.64 | | | | $16.48 | | | | $16.53 | |
| | | | |
| | | | | |
| Income from investment operationsa: | | | | | | | | | | | | | | | | | | | | |
| | | | | |
Net investment incomeb | | | 0.71 | | | | 0.69 | | | | 0.67 | | | | 0.71 | | | | 0.72 | |
| | | | | |
Net realized and unrealized gains (losses) | | | (1.35 | ) | | | 0.87 | | | | 1.34 | | | | (1.78 | ) | | | 0.11 | |
| | | | |
Total from investment operations | | | (0.64 | ) | | | 1.56 | | | | 2.01 | | | | (1.07 | ) | | | 0.83 | |
| | | | |
| | | | | |
Less distributions from net investment income | | | (0.82 | ) | | | (0.71 | ) | | | (0.78 | ) | | | (0.77 | ) | | | (0.88 | ) |
| | | | |
| | | | | |
Net asset value, end of year | | | $15.26 | | | | $16.72 | | | | $15.87 | | | | $14.64 | | | | $16.48 | |
| | | | |
| | | | | |
Total returnc | | | (4.09)% | | | | 9.94% | | | | 14.33% | | | | (6.84)% | | | | 4.92% | |
| | | | | |
| Ratios to average net assets | | | | | | | | | | | | | | | | | | | | |
| | | | | |
Expenses before waiver and payments by affiliates | | | 0.47% | | | | 0.47% | | | | 0.47% | | | | 0.46% | | | | 0.47% | |
| | | | | |
Expenses net of waiver and payments by affiliatesd | | | 0.45% | | | | 0.45% | | | | 0.44% | | | | 0.46% | e | | | 0.47% | |
| | | | | |
Net investment income | | | 4.33% | | | | 4.22% | | | | 4.47% | | | | 4.47% | | | | 4.26% | |
| | | | | |
| Supplemental data | | | | | | | | | | | | | | | | | | | | |
| | | | | |
Net assets, end of year (000’s) | | | $612,657 | | | | $735,149 | | | | $696,227 | | | | $604,228 | | | | $714,664 | |
| | | | | |
Portfolio turnover rate | | | 43.22% | | | | 20.96% | | | | 39.03% | | | | 31.53% | | | | 24.77% | |
aThe amount shown for a share outstanding throughout the period may not correlate with the Statement of Operations for the period due to the timing of sales and repurchases of the Fund’s shares in relation to income earned and/or fluctuating fair value of the investments of the Fund.
bBased on average daily shares outstanding.
cTotal return does not include fees, charges or expenses imposed by the variable annuity and life insurance contracts for which Franklin Templeton Variable Insurance Products Trust serves as an underlying investment vehicle.
dBenefit of expense reduction rounds to less than 0.01%.
eBenefit of waiver and payments by affiliates rounds to less than 0.01%.
| | | | | | |
| | | |
| | The accompanying notes are an integral part of these financial statements. | Annual Report | | | FI-11 | |
FRANKLIN TEMPLETON VARIABLE INSURANCE PRODUCTS TRUST
FINANCIAL HIGHLIGHTS
Franklin Income VIP Fund(continued)
| | | | | | | | | | | | | | | | | | | | |
| |
| | | Year Ended December 31, | |
| | | | | |
| | | 2018 | | | 2017 | | | 2016 | | | 2015 | | | 2014 | |
| Class 2 | | | | | | | | | | | | | | | | | | | | |
Per share operating performance (for a share outstanding throughout the year) | | | | | | | | | | | | | | | | | | | | |
| | | | | |
Net asset value, beginning of year | | | $16.17 | | | | $15.38 | | | | $14.20 | | | | $16.00 | | | | $16.07 | |
| | | | |
| | | | | |
| Income from investment operationsa: | | | | | | | | | | | | | | | | | | | | |
| | | | | |
Net investment incomeb | | | 0.65 | | | | 0.63 | | | | 0.61 | | | | 0.65 | | | | 0.66 | |
| | | | | |
Net realized and unrealized gains (losses) | | | (1.30 | ) | | | 0.83 | | | | 1.31 | | | | (1.73 | ) | | | 0.11 | |
| | | | |
Total from investment operations | | | (0.65 | ) | | | 1.46 | | | | 1.92 | | | | (1.08 | ) | | | 0.77 | |
| | | | |
| | | | | |
Less distributions from net investment income | | | (0.78 | ) | | | (0.67 | ) | | | (0.74 | ) | | | (0.72 | ) | | | (0.84 | ) |
| | | | |
| | | | | |
Net asset value, end of year | | | $14.74 | | | | $16.17 | | | | $15.38 | | | | $14.20 | | | | $16.00 | |
| | | | |
| | | | | |
Total returnc | | | (4.30)% | | | | 9.67% | | | | 14.02% | | | | (7.05)% | | | | 4.62% | |
| | | | | |
| Ratios to average net assets | | | | | | | | | | | | | | | | | | | | |
| | | | | |
Expenses before waiver and payments by affiliates | | | 0.72% | | | | 0.72% | | | | 0.72% | | | | 0.71% | | | | 0.72% | |
| | | | | |
Expenses net of waiver and payments by affiliatesd | | | 0.70% | | | | 0.70% | | | | 0.69% | | | | 0.71% | e | | | 0.72% | |
| | | | | |
Net investment income | | | 4.08% | | | | 3.97% | | | | 4.22% | | | | 4.22% | | | | 4.01% | |
| | | | | |
| Supplemental data | | | | | | | | | | | | | | | | | | | | |
| | | | | |
Net assets, end of year (000’s) | | | $4,086,652 | | | | $5,041,498 | | | | $5,088,556 | | | | $4,907,599 | | | | $6,022,804 | |
| | | | | |
Portfolio turnover rate | | | 43.22% | | | | 20.96% | | | | 39.03% | | | | 31.53% | | | | 24.77% | |
aThe amount shown for a share outstanding throughout the period may not correlate with the Statement of Operations for the period due to the timing of sales and repurchases of the Fund’s shares in relation to income earned and/or fluctuating fair value of the investments of the Fund.
bBased on average daily shares outstanding.
cTotal return does not include fees, charges or expenses imposed by the variable annuity and life insurance contracts for which Franklin Templeton Variable Insurance Products Trust serves as an underlying investment vehicle.
dBenefit of expense reduction rounds to less than 0.01%.
eBenefit of waiver and payments by affiliates rounds to less than 0.01%.
| | | | |
| | | |
| FI-12 | | Annual Report | The accompanying notes are an integral part of these financial statements. | | |
FRANKLIN TEMPLETON VARIABLE INSURANCE PRODUCTS TRUST
FINANCIAL HIGHLIGHTS
Franklin Income VIP Fund(continued)
| | | | | | | | | | | | | | | | | | | | |
| |
| | | Year Ended December 31, | |
| | | | | |
| | | 2018 | | | 2017 | | | 2016 | | | 2015 | | | 2014 | |
| Class 4 | | | | | | | | | | | | | | | | | | | | |
Per share operating performance (for a share outstanding throughout the year) | | | | | | | | | | | | | | | | | | | | |
| | | | | |
Net asset value, beginning of year | | | $16.53 | | | | $15.71 | | | | $14.49 | | | | $16.31 | | | | $16.36 | |
| | | | |
| | | | | |
| Income from investment operationsa: | | | | | | | | | | | | | | | | | | | | |
| | | | | |
Net investment incomeb | | | 0.64 | | | | 0.62 | | | | 0.61 | | | | 0.65 | | | | 0.66 | |
| | | | | |
Net realized and unrealized gains (losses) | | | (1.33 | ) | | | 0.85 | | | | 1.33 | | | | (1.76 | ) | | | 0.11 | |
| | | | |
Total from investment operations | | | (0.69 | ) | | | 1.47 | | | | 1.94 | | | | (1.11 | ) | | | 0.77 | |
| | | | |
| | | | | |
Less distributions from net investment income | | | (0.76 | ) | | | (0.65 | ) | | | (0.72 | ) | | | (0.71 | ) | | | (0.82 | ) |
| | | | |
| | | | | |
Net asset value, end of year | | | $15.08 | | | | $16.53 | | | | $15.71 | | | | $14.49 | | | | $16.31 | |
| | | | |
| | | | | |
Total returnc | | | (4.42)% | | | | 9.55% | | | | 13.87% | | | | (7.15)% | | | | 4.52% | |
| | | | | |
| Ratios to average net assets | | | | | | | | | | | | | | | | | | | | |
| | | | | |
Expenses before waiver and payments by affiliates | | | 0.82% | | | | 0.82% | | | | 0.82% | | | | 0.81% | | | | 0.82% | |
| | | | | |
Expenses net of waiver and payments by affiliatesd | | | 0.80% | | | | 0.80% | | | | 0.79% | | | | 0.81% | e | | | 0.82% | |
| | | | | |
Net investment income | | | 3.98% | | | | 3.87% | | | | 4.12% | | | | 4.12% | | | | 3.91% | |
| | | | | |
| Supplemental data | | | | | | | | | | | | | | | | | | | | |
| | | | | |
Net assets, end of year (000’s) | | | $294,700 | | | | $335,217 | | | | $309,935 | | | | $306,023 | | | | $378,545 | |
| | | | | |
Portfolio turnover rate | | | 43.22% | | | | 20.96% | | | | 39.03% | | | | 31.53% | | | | 24.77% | |
aThe amount shown for a share outstanding throughout the period may not correlate with the Statement of Operations for the period due to the timing of sales and repurchases of the Fund’s shares in relation to income earned and/or fluctuating fair value of the investments of the Fund.
bBased on average daily shares outstanding.
cTotal return does not include fees, charges or expenses imposed by the variable annuity and life insurance contracts for which Franklin Templeton Variable Insurance Products Trust serves as an underlying investment vehicle.
dBenefit of expense reduction rounds to less than 0.01%.
eBenefit of waiver and payments by affiliates rounds to less than 0.01%.
| | | | | | |
| | | |
| | The accompanying notes are an integral part of these financial statements. | Annual Report | | | FI-13 | |
FRANKLIN TEMPLETON VARIABLE INSURANCE PRODUCTS TRUST
Statement of Investments, December 31, 2018
| | | | | | | | | | | | | | |
Franklin Income VIP Fund | | | | |
| | | | |
| | | | | Country | | | Shares | | | Value | |
| | Common Stocks 34.9% | | | | | | | | | | | | |
| | Communication Services 2.3% | | | | | | | | | | | | |
| a | | Alphabet Inc., A | | | United States | | | | 20,000 | | | $ | 20,899,200 | |
| | BCE Inc. | | | Canada | | | | 466,000 | | | | 18,411,942 | |
| | Verizon Communications Inc. | | | United States | | | | 1,325,000 | | | | 74,491,500 | |
| | | | | | | | | | | | | | |
| | | | | | | | | | | | | 113,802,642 | |
| | | | | | | | | | | | | | |
| | Consumer Discretionary 1.3% | | | | | | | | | | | | |
| | Ford Motor Co. | | | United States | | | | 3,138,995 | | | | 24,013,312 | |
| | Target Corp. | | | United States | | | | 650,000 | | | | 42,958,500 | |
| | | | | | | | | | | | | | |
| | | | | | | | | | | | | 66,971,812 | |
| | | | | | | | | | | | | | |
| | Consumer Staples 3.4% | | | | | | | | | | | | |
| | Anheuser-Busch InBev SA/NV, ADR | | | Belgium | | | | 412,500 | | | | 27,146,625 | |
| | The Coca-Cola Co. | | | United States | | | | 700,000 | | | | 33,145,000 | |
| | PepsiCo Inc. | | | United States | | | | 384,000 | | | | 42,424,320 | |
| | Philip Morris International Inc. | | | United States | | | | 350,000 | | | | 23,366,000 | |
| | The Procter & Gamble Co. | | | United States | | | | 500,000 | | | | 45,960,000 | |
| | | | | | | | | | | | | | |
| | | | | | | | | | | | | 172,041,945 | |
| | | | | | | | | | | | | | |
| | Energy 5.0% | | | | | | | | | | | | |
| | Anadarko Petroleum Corp. | | | United States | | | | 400,000 | | | | 17,536,000 | |
| | Baker Hughes a GE Co., A | | | United States | | | | 795,000 | | | | 17,092,500 | |
| | BP PLC, ADR | | | United Kingdom | | | | 750,000 | | | | 28,440,000 | |
| | Chevron Corp. | | | United States | | | | 400,000 | | | | 43,516,000 | |
| | Exxon Mobil Corp. | | | United States | | | | 500,000 | | | | 34,095,000 | |
| | Occidental Petroleum Corp. | | | United States | | | | 286,000 | | | | 17,554,680 | |
| | Royal Dutch Shell PLC, A, ADR | | | United Kingdom | | | | 1,000,000 | | | | 58,270,000 | |
| | Schlumberger Ltd. | | | United States | | | | 225,000 | | | | 8,118,000 | |
| | TransCanada Corp. | | | Canada | | | | 350,000 | | | | 12,495,000 | |
| | The Williams Cos. Inc. | | | United States | | | | 600,000 | | | | 13,230,000 | |
| | | | | | | | | | | | | | |
| | | | | | | | | | | | | 250,347,180 | |
| | | | | | | | | | | | | | |
| | Financials 5.6% | | | | | | | | | | | | |
| | Bank of America Corp. | | | United States | | | | 1,200,000 | | | | 29,568,000 | |
| | Barclays PLC | | | United Kingdom | | | | 10,000,000 | | | | 19,195,062 | |
| | HSBC Holdings PLC | | | United Kingdom | | | | 2,194,113 | | | | 18,100,537 | |
| | JPMorgan Chase & Co. | | | United States | | | | 600,000 | | | | 58,572,000 | |
| | MetLife Inc. | | | United States | | | | 1,095,108 | | | | 44,965,134 | |
| | Morgan Stanley | | | United States | | | | 250,000 | | | | 9,912,500 | |
| | Wells Fargo & Co. | | | United States | | | | 2,200,000 | | | | 101,376,000 | |
| | | | | | | | | | | | | | |
| | | | | | | | | | | | | 281,689,233 | |
| | | | | | | | | | | | | | |
| | Health Care 4.8% | | | | | | | | | | | | |
| | AstraZeneca PLC | | | United Kingdom | | | | 900,000 | | | | 67,405,886 | |
| | Johnson & Johnson | | | United States | | | | 230,000 | | | | 29,681,500 | |
| | Medtronic PLC | | | United States | | | | 175,000 | | | | 15,918,000 | |
| | Merck & Co. Inc. | | | United States | | | | 806,100 | | | | 61,594,101 | |
| | Pfizer Inc. | | | United States | | | | 1,499,975 | | | | 65,473,909 | |
| | | | | | | | | | | | | | |
| | | | | | | | | | | | | 240,073,396 | |
| | | | | | | | | | | | | | |
| | Industrials 1.2% | | | | | | | | | | | | |
| | 3M Co. | | | United States | | | | 125,000 | | | | 23,817,500 | |
| a | | CEVA Logistics AG | | | Switzerland | | | | 283,295 | | | | 8,596,495 | |
| | Cummins Inc. | | | United States | | | | 200,000 | | | | 26,728,000 | |
| | | | | | | | | | | | | | |
| | | | | | | | | | | | | 59,141,995 | |
| | | | | | | | | | | | | | |
FRANKLIN TEMPLETON VARIABLE INSURANCE PRODUCTS TRUST
STATEMENT OF INVESTMENTS
Franklin Income VIP Fund(continued)
| | | | | | | | | | | | | | |
| | | | |
| | | | | Country | | | Shares | | | Value | |
| | Common Stocks(continued) | | | | | | | | | | | | |
| | Information Technology 1.6% | | | | | | | | | | | | |
| | Analog Devices Inc. | | | United States | | | | 150,000 | | | $ | 12,874,500 | |
| | Apple Inc. | | | United States | | | | 53,317 | | | | 8,410,224 | |
| | Applied Materials Inc. | | | United States | | | | 286,000 | | | | 9,363,640 | |
| | Lam Research Corp. | | | United States | | | | 70,000 | | | | 9,531,900 | |
| | Microchip Technology Inc. | | | United States | | | | 150,000 | | | | 10,788,000 | |
| | Microsoft Corp. | | | United States | | | | 285,500 | | | | 28,998,235 | |
| | | | | | | | | | | | | | |
| | | | | | | | | | | | | 79,966,499 | |
| | | | | | | | | | | | | | |
| | | Materials 2.7% | | | | | | | | | |
| | BASF SE | | | Germany | | | | 700,000 | | | | 48,759,650 | |
| | DowDuPont Inc. | | | United States | | | | 447,500 | | | | 23,932,300 | |
| | Rio Tinto PLC, ADR | | | Australia | | | | 1,250,000 | | | | 60,600,000 | |
| | | | | | | | | | | | | | |
| | | | | | | | | | | | | 133,291,950 | |
| | | | | | | | | | | | | | |
| | | | |
| | Real Estate 0.5% | | | | | | | | | | | | |
| | Host Hotels & Resorts Inc. | | | United States | | | | 1,500,000 | | | | 25,005,000 | |
| | | | | | | | | | | | | | |
| | Utilities 6.5% | | | | | | | | | | | | |
| | Dominion Energy Inc. | | | United States | | | | 1,201,638 | | | | 85,869,051 | |
| | Duke Energy Corp. | | | United States | | | | 577,500 | | | | 49,838,250 | |
| | Sempra Energy | | | United States | | | | 720,000 | | | | 77,896,800 | |
| | The Southern Co. | | | United States | | | | 2,020,000 | | | | 88,718,400 | |
| | Xcel Energy Inc. | | | United States | | | | 400,000 | | | | 19,708,000 | |
| | | | | | | | | | | | | | |
| | | | | | | | | | | | | 322,030,501 | |
| | | | | | | | | | | | | | |
| | | | |
| | Total Common Stocks (Cost $1,580,699,489) | | | | | | | | | | | 1,744,362,153 | |
| | | | | | | | | | | | | | |
| | | | |
| b | | Equity-Linked Securities 9.0% | | | | | | | | | | | | |
| | | | |
| | Communication Services 1.1% | | | | | | | | | | | | |
| c | | Royal Bank of Canada into Alphabet Inc., 6.00%, A, 144A | | | Belgium | | | | 10,000 | | | | 10,734,758 | |
| c | | Royal Bank of Canada into Comcast Corp., 7.00%, A, 144A | | | United States | | | | 1,270,000 | | | | 43,607,726 | |
| | | | | | | | | | | | | | |
| | | | | | | | | | | | | 54,342,484 | |
| | | | | | | | | | | | | | |
| | | | |
| | Consumer Discretionary 1.9% | | | | | | | | | | | | |
| c | | Merrill Lynch International & Co. CV into General Motor Co., 8.00%, 144A | | | United States | | | | 1,425,000 | | | | 49,014,196 | |
| c | | Wells Fargo Bank National Assn. into Ford Motor Co., 8.50%, 144A | | | United States | | | | 2,500,000 | | | | 19,845,060 | |
| c | | Wells Fargo Bank National Assn. into Target Corp., 8.00%, 144A | | | United States | | | | 400,000 | | | | 27,044,025 | |
| | | | | | | | | | | | | | |
| | | | | | | | | | | | | 95,903,281 | |
| | | | | | | | | | | | | | |
| | | | |
| | Energy 0.5% | | | | | | | | | | | | |
| c | | UBS AG London into Halliburton Co., 7.00%, 144A | | | United States | | | | 840,000 | | | | 23,047,953 | |
| | | | | | | | | | | | | | |
| | | | |
| | Industrials 1.3% | | | | | | | | | | | | |
| c | | Deutsche Bank AG London into Union Pacific Corp., 6.50%, 144A | | | United States | | | | 450,000 | | | | 63,123,325 | |
| | | | | | | | | | | | | | |
| | | | |
| | Information Technology 3.3% | | | | | | | | | | | | |
| c | | Citigroup Global Markets Holdings Inc. into Texas Instruments Inc., 7.00%, 144A | | | United States | | | | 520,000 | | | | 50,268,829 | |
| c | | Credit Suisse AG into International Business Machines Corp., 9.50%, 144A | | | United States | | | | 110,000 | | | | 12,350,855 | |
| c | | Royal Bank of Canada into Apple Inc., 6.50%, 144A | | | United States | | | | 310,000 | | | | 49,636,457 | |
| c | | Wells Fargo Bank National Assn. into Intel Corp., 8.00%, 144A | | | United States | | | | 1,100,000 | | | | 52,865,381 | |
| | | | | | | | | | | | | | |
| | | | | | | | | | | | | 165,121,522 | |
| | | | | | | | | | | | | | |
| | | | |
| | Materials 0.9% | | | | | | | | | | | | |
| c | | UBS AG London into DowDuPont Inc., 6.50%, 144A | | | United States | | | | 850,000 | | | | 47,069,105 | |
| | | | | | | | | | | | | | |
| | | | |
| | Total Equity-Linked Securities (Cost $536,524,698) | | | | | | | | | | | 448,607,670 | |
| | | | | | | | | | | | | | |
FRANKLIN TEMPLETON VARIABLE INSURANCE PRODUCTS TRUST
STATEMENT OF INVESTMENTS
Franklin Income VIP Fund(continued)
| | | | | | | | | | | | | | |
| | | | |
| | | | | Country | | | Shares | | | Value | |
| | Convertible Preferred Stocks 1.1% | | | | | | | | | | | | |
| | | Financials 1.1% | | | | | | | | | |
| | Bank of America Corp., 7.25%, cvt. pfd., L | | | United States | | | | 34,600 | | | $ | 43,336,500 | |
| a | | FNMA, 5.375%, cvt. pfd | | | United States | | | | 475 | | | | 10,093,750 | |
| | | | | | | | | | | | | | |
| | | | |
| | Total Convertible Preferred Stocks
(Cost $65,397,102) | | | | | | | | | | | 53,430,250 | |
| | | | | | | | | | | | | | |
| | | | |
| | | | | | | | Units | | | | |
| | | | |
| d | | Index-Linked Notes (Cost $14,054,540) 0.3% | | | | | | | | | | | | |
| | | Financials 0.3% | | | | | | | | | |
| c,e | | Morgan Stanley Finance LLC, senior note, 144A, 7.43%, 10/03/19 | | | United States | | | | 106,000 | | | | 12,995,484 | |
| | | | | | | | | | | | | | |
| | | | |
| | | | | | | | Principal Amount* | | | | |
| | | | |
| | Convertible Bonds 0.9% | | | | | | | | | | | | |
| | | Energy 0.5% | | | | | | | | | |
| | Chesapeake Energy Corp., cvt., senior note, 5.50%, 9/15/26 | | | United States | | | | 10,000,000 | | | | 8,099,770 | |
| | Weatherford International Ltd., cvt., senior note, 5.875%, 7/01/21 | | | United States | | | | 22,000,000 | | | | 14,012,768 | |
| | | | | | | | | | | | | | |
| | | | | | | | | | | | | 22,112,538 | |
| | | | | | | | | | | | | | |
| | | Health Care 0.4% | | | | | | | | | |
| c | | Bayer Capital Corp BV, cvt., junior sub. note, 144A, 5.625%, 11/22/19 | | | Germany | | | | 25,000,000 | EUR | | | 21,521,704 | |
| | | | | | | | | | | | | | |
| | | | |
| | Total Convertible Bonds (Cost $58,051,219) | | | | | | | | | | | 43,634,242 | |
| | | | | | | | | | | | | | |
| | | | |
| | Corporate Bonds 38.8% | | | | | | | | | | | | |
| | | Communication Services 6.1% | | | | | | | | | |
| | AMC Entertainment Holdings Inc., senior sub. note, 5.875%, 11/15/26 | | | United States | | | | 5,600,000 | | | | 4,816,000 | |
| | AT&T Inc., senior bond, 4.125%, 2/17/26 | | | United States | | | | 12,000,000 | | | | 11,742,289 | |
| | CCO Holdings LLC/CCO Holdings Capital Corp., senior bond, 5.125%, 2/15/23 | | | United States | | | | 10,000,000 | | | | 9,775,000 | |
| | senior bond, 5.75%, 1/15/24 | | | United States | | | | 9,000,000 | | | | 8,977,500 | |
| | c senior bond, 144A, 5.50%, 5/01/26 | | | United States | | | | 10,000,000 | | | | 9,637,500 | |
| | c senior bond, 144A, 5.00%, 2/01/28 | | | United States | | | | 5,000,000 | | | | 4,612,500 | |
| | DISH DBS Corp., | | | | | | | | | | | | |
| | senior bond, 5.875%, 7/15/22 | | | United States | | | | 40,000,000 | | | | 36,950,000 | |
| | senior bond, 5.00%, 3/15/23 | | | United States | | | | 35,000,000 | | | | 29,268,750 | |
| | senior note, 5.875%, 11/15/24 | | | United States | | | | 9,400,000 | | | | 7,602,250 | |
| | Netflix Inc., senior bond, 4.875%, 4/15/28 | | | United States | | | | 24,000,000 | | | | 21,960,000 | |
| c | | Sirius XM Radio Inc., senior bond, 144A, 6.00%, 7/15/24 | | | United States | | | | 7,500,000 | | | | 7,546,875 | |
| | Sprint Capital Corp., senior note, 6.90%, 5/01/19 | | | United States | | | | 13,500,000 | | | | 13,618,125 | |
| | Sprint Communications Inc., senior bond, 11.50%, 11/15/21 | | | United States | | | | 30,000,000 | | | | 34,125,000 | |
| | senior note, 7.00%, 8/15/20 | | | United States | | | | 7,500,000 | | | | 7,697,250 | |
| | senior note, 6.00%, 11/15/22 | | | United States | | | | 6,300,000 | | | | 6,198,129 | |
| | Sprint Corp., | | | | | | | | | | | | |
| | senior bond, 7.875%, 9/15/23 | | | United States | | | | 37,500,000 | | | | 38,578,125 | |
| | senior bond, 7.125%, 6/15/24 | | | United States | | | | 8,200,000 | | | | 8,147,192 | |
| | senior note, 7.625%, 3/01/26 | | | United States | | | | 8,000,000 | | | | 7,920,000 | |
FRANKLIN TEMPLETON VARIABLE INSURANCE PRODUCTS TRUST
STATEMENT OF INVESTMENTS
Franklin Income VIP Fund(continued)
| | | | | | | | | | | | | | |
| | | | |
| | | | | Country | | | Principal Amount* | | | Value | |
| | Corporate Bonds(continued) | | | | | | | | | | | | |
| | Communication Services(continued) | | | | | | | | | | | | |
| c | | Sprint Spectrum Co. LLC, senior secured bond, first lien, 144A, 5.152%, 9/20/29 | | | United States | | | | 16,000,000 | | | $ | 15,760,000 | |
| c | | Univision Communications Inc., | | | | | | | | | | | | |
| | senior secured note, first lien, 144A, 5.125%, 5/15/23 | | | United States | | | | 15,000,000 | | | | 13,500,000 | |
| | senior secured note, first lien, 144A, 5.125%, 2/15/25 | | | United States | | | | 7,140,000 | | | | 6,283,200 | |
| | | | | | | | | | | | | | |
| | | | | | | | | | | | | 304,715,685 | |
| | | | | | | | | | | | | | |
| | | Consumer Discretionary 1.7% | | | | | | | | | |
| c | | 24 Hour Holdings III LLC, senior note, 144A, 8.00%, 6/01/22 | | | United States | | | | 6,300,000 | | | | 5,969,250 | |
| | Fiat Chrysler Automobiles NV, senior note, 5.25%, 4/15/23 | | | United Kingdom | | | | 9,300,000 | | | | 9,169,242 | |
| | Ford Motor Co., senior note, 4.346%, 12/08/26 | | | United States | | | | 18,500,000 | | | | 16,540,812 | |
| | General Motors Co., senior bond, 5.15%, 4/01/38 | | | United States | | | | 16,000,000 | | | | 13,722,274 | |
| c | | Shea Homes LP/Shea Homes Funding Corp., | | | | | | | | | | | | |
| | senior bond, 144A, 6.125%, 4/01/25 | | | United States | | | | 8,000,000 | | | | 7,120,000 | |
| | senior note, 144A, 5.875%, 4/01/23 | | | United States | | | | 5,000,000 | | | | 4,587,500 | |
| c | | Tesla Inc., senior note, 144A, 5.30%, 8/15/25 | | | United States | | | | 7,000,000 | | | | 6,107,500 | |
| c | | Wynn Las Vegas LLC/Wynn Las Vegas Capital Corp., | | | | | | | | | | | | |
| | senior bond, 144A, 5.50%, 3/01/25 | | | United States | | | | 13,200,000 | | | | 12,342,000 | |
| | senior bond, 144A, 5.25%, 5/15/27 | | | United States | | | | 10,000,000 | | | | 8,812,500 | |
| | | | | | | | | | | | | | |
| | | | | | | | | | | | | 84,371,078 | |
| | | | | | | | | | | | | | |
| | | | |
| | Consumer Staples 1.0% | | | | | | | | | | | | |
| | BAT Capital Corp., | | | | | | | | | | | | |
| | senior note, 3.222%, 8/15/24 | | | United Kingdom | | | | 10,000,000 | | | | 9,221,228 | |
| | senior note, 3.557%, 8/15/27 | | | United Kingdom | | | | 20,000,000 | | | | 17,797,098 | |
| | Kraft Heinz Foods Co., senior bond, 4.625%, 1/30/29 | | | United States | | | | 13,000,000 | | | | 12,887,004 | |
| c | | Post Holdings Inc., | | | | | | | | | | | | |
| | senior bond, 144A, 5.00%, 8/15/26 | | | United States | | | | 7,500,000 | | | | 6,862,500 | |
| | senior bond, 144A, 5.625%, 1/15/28 | | | United States | | | | 2,500,000 | | | | 2,309,375 | |
| | | | | | | | | | | | | | |
| | | | | | | | | | | | | 49,077,205 | |
| | | | | | | | | | | | | | |
| | | | |
| | Energy 6.6% | | | | | | | | | | | | |
| c | | Ascent Resources Utica Holdings LLC/ARU Finance Corp., senior note, 144A, 10.00%, 4/01/22 | | | United States | | | | 6,500,000 | | | | 6,680,700 | |
| | Calumet Specialty Products Partners LP/Calumet Finance Corp., senior note, 6.50%, 4/15/21 | | | United States | | | | 30,000,000 | | | | 25,200,000 | |
| | Chesapeake Energy Corp., | | | | | | | | | | | | |
| | senior bond, 6.125%, 2/15/21 | | | United States | | | | 16,000,000 | | | | 15,120,000 | |
| | senior bond, 8.00%, 6/15/27 | | | United States | | | | 26,000,000 | | | | 21,970,000 | |
| | senior note, 5.375%, 6/15/21 | | | United States | | | | 12,875,000 | | | | 11,845,000 | |
| | senior note, 4.875%, 4/15/22 | | | United States | | | | 5,000,000 | | | | 4,387,500 | |
| | senior note, 5.75%, 3/15/23 | | | United States | | | | 5,000,000 | | | | 4,337,500 | |
| | senior note, 7.00%, 10/01/24 | | | United States | | | | 17,500,000 | | | | 15,225,000 | |
| | senior note, 8.00%, 1/15/25 | | | United States | | | | 31,500,000 | | | | 27,956,250 | |
| | senior note, 7.50%, 10/01/26 | | | United States | | | | 10,000,000 | | | | 8,600,000 | |
| | f senior note, FRN, 5.686%,(3-month USD LIBOR + 3.25%), 4/15/19 | | | United States | | | | 9,800,000 | | | | 9,775,500 | |
| | Ferrellgas LP/Ferrellgas Finance Corp., | | | | | | | | | | | | |
| | senior note, 6.50%, 5/01/21 | | | United States | | | | 9,500,000 | | | | 7,837,500 | |
| | senior note, 6.75%, 6/15/23 | | | United States | | | | 5,000,000 | | | | 4,100,000 | |
| | HighPoint Operating Corp., | | | | | | | | | | | | |
| | senior bond, 7.00%, 10/15/22 | | | United States | | | | 17,937,000 | | | | 16,591,725 | |
| | senior note, 8.75%, 6/15/25 | | | United States | | | | 23,400,000 | | | | 22,698,000 | |
| | | | | | | | | | | | | | |
FRANKLIN TEMPLETON VARIABLE INSURANCE PRODUCTS TRUST
STATEMENT OF INVESTMENTS
Franklin Income VIP Fund(continued)
| | | | | | | | | | | | | | |
| | | | |
| | | | | Country | | | Principal Amount* | | | Value | |
| | Corporate Bonds(continued) | | | | | | | | | | | | |
| | | Energy(continued) | | | | | | | | | |
| | Kinder Morgan Inc., | | | | | | | | | | | | |
| | senior bond, 7.75%, 1/15/32 | | | United States | | | | 22,000,000 | | | $ | 26,450,006 | |
| | c senior secured bond, first lien, 144A, 5.625%, 11/15/23 | | | United States | | | | 6,400,000 | | | | 6,779,057 | |
| | Sanchez Energy Corp., senior note, 7.75%, 6/15/21 | | | United States | | | | 27,000,000 | | | | 6,480,000 | |
| | Talos Production LLC/Talos Production Finance Inc., second lien, 11.00%, 4/03/22 | | | United States | | | | 6,452,837 | | | | 6,097,931 | |
| | Weatherford International Ltd., | | | | | | | | | | | | |
| | senior note, 5.125%, 9/15/20 | | | United States | | | | 22,500,000 | | | | 17,662,500 | |
| | senior note, 7.75%, 6/15/21 | | | United States | | | | 47,500,000 | | | | 35,862,500 | |
| | senior note, 4.50%, 4/15/22 | | | United States | | | | 11,900,000 | | | | 7,021,000 | |
| | senior note, 8.25%, 6/15/23 | | | United States | | | | 37,500,000 | | | | 22,781,250 | |
| | | | | | | | | | | | | | |
| | | | | | | | | | | | | 331,458,919 | |
| | | | | | | | | | | | | | |
| | | Financials 5.1% | | | | | | | | | |
| | Bank of America Corp., | | | | | | | | | | | | |
| | g junior sub. bond, AA, 6.10% to 3/17/25, FRN thereafter, Perpetual | | | United States | | | | 8,000,000 | | | | 7,890,000 | |
| | g junior sub. bond, U, 5.20% to 6/01/23, FRN thereafter, Perpetual | | | United States | | | | 5,000,000 | | | | 4,820,750 | |
| | g junior sub. bond, X, 6.25% to 9/05/24, FRN thereafter, Perpetual | | | United States | | | | 6,000,000 | | | | 5,940,000 | |
| | senior bond, 3.419% to 12/20/27, FRN thereafter, 12/20/28 | | | United States | | | | 18,500,000 | | | | 17,311,708 | |
| | Capital One Financial Corp., senior sub. note, 4.20%, 10/29/25 | | | United States | | | | 15,500,000 | | | | 14,999,065 | |
| | Citigroup Inc., | | | | | | | | | | | | |
| | g junior sub. bond, 5.35% to 5/15/23, FRN thereafter, Perpetual | | | United States | | | | 10,000,000 | | | | 9,000,000 | |
| | g junior sub. bond, 5.90% to 2/15/23, FRN thereafter, Perpetual | | | United States | | | | 12,500,000 | | | | 11,681,250 | |
| | g junior sub. bond, 5.95% to 1/30/23, FRN thereafter, Perpetual | | | United States | | | | 4,500,000 | | | | 4,112,325 | |
| | g junior sub. bond, M, 6.30% to 5/15/24, FRN thereafter, Perpetual | | | United States | | | | 15,800,000 | | | | 14,595,250 | |
| | g junior sub. bond, O, 5.875% to 3/27/20, FRN thereafter, Perpetual | | | United States | | | | 25,000,000 | | | | 24,156,250 | |
| | g junior sub. bond, Q, 5.95% to 8/15/20, FRN thereafter, Perpetual | | | United States | | | | 10,000,000 | | | | 9,668,750 | |
| | sub. bond, 4.125%, 7/25/28 | | | United States | | | | 18,500,000 | | | | 17,391,982 | |
| | The Goldman Sachs Group Inc., senior note, 3.272% to 9/29/24, FRN thereafter, 9/29/25 | | | United States | | | | 15,500,000 | | | | 14,539,368 | |
| | HSBC Holdings PLC, senior note, 4.292% to 9/12/25, FRN thereafter, 9/12/26 | | | United Kingdom | | | | 28,500,000 | | | | 28,601,602 | |
| g | | JPMorgan Chase & Co., | | | | | | | | | | | | |
| | f junior sub. bond, FRN, 5.99%,(3-month USD LIBOR + 3.47%), Perpetual | | | United States | | | | 28,692,000 | | | | 28,405,080 | |
| | junior sub. bond, R, 6.00% to 8/01/23, FRN thereafter, Perpetual | | | United States | | | | 3,200,000 | | | | 3,136,000 | |
| | junior sub. bond, V, 5.00% to 7/30/19, FRN thereafter, Perpetual | | | United States | | | | 10,000,000 | | | | 9,662,500 | |
| g | | Morgan Stanley, junior sub. bond, 5.55% to 7/15/20, FRN thereafter, Perpetual | | | United States | | | | 7,300,000 | | | | 7,093,775 | |
| | Prudential Financial Inc., junior sub. bond, 5.70% to 9/15/28, FRN thereafter, 9/15/48 | | | United States | | | | 17,000,000 | | | | 15,852,500 | |
| g | | Wells Fargo & Co., junior sub. bond, S, 5.90% to 6/15/24, FRN thereafter, | | | | | | | | | | | | |
| | Perpetual | | | United States | | | | 6,600,000 | | | | 6,296,400 | |
| | | | | | | | | | | | | | |
| | | | | | | | | | | | | 255,154,555 | |
| | | | | | | | | | | | | | |
| | | Health Care 12.6% | | | | | | | | | |
| | Allergan Funding SCS, senior bond, 3.80%, 3/15/25 | | | United States | | | | 17,000,000 | | | | 16,626,587 | |
| c | | Bausch Health Cos. Inc., senior bond, 144A, 6.125%, 4/15/25 | | | United States | | | | 9,400,000 | | | | 8,225,000 | |
| | senior note, 144A, 5.50%, 3/01/23 | | | United States | | | | 15,000,000 | | | | 13,731,600 | |
| | senior note, 144A, 5.875%, 5/15/23 | | | United States | | | | 14,500,000 | | | | 13,466,875 | |
| | senior note, 144A, 9.00%, 12/15/25 | | | United States | | | | 5,000,000 | | | | 4,993,750 | |
| | senior note, first lien, 144A, 7.00%, 3/15/24 | | | United States | | | | 4,500,000 | | | | 4,556,250 | |
| | senior secured note, first lien, 144A, 6.50%, 3/15/22 | | | United States | | | | 3,000,000 | | | | 3,027,240 | |
| | senior secured note, first lien, 144A, 5.50%, 11/01/25 | | | United States | | | | 35,000,000 | | | | 32,768,750 | |
FRANKLIN TEMPLETON VARIABLE INSURANCE PRODUCTS TRUST
STATEMENT OF INVESTMENTS
Franklin Income VIP Fund(continued)
| | | | | | | | | | | | | | |
| | | | |
| | | | | Country | | | Principal Amount* | | | Value | |
| | Corporate Bonds(continued) | | | | | | | | | | | | |
| | | Health Care(continued) | | | | | | | | | |
| c | | Bayer US Finance II LLC, senior note, 144A, 4.25%, 12/15/25 | | | Germany | | | | 15,000,000 | | | $ | 14,627,398 | |
| | CHS/Community Health Systems Inc., | | | | | | | | | | | | |
| | senior note, 6.875%, 2/01/22 | | | United States | | | | 104,415,000 | | | | 48,030,900 | |
| | c senior note, 144A, 8.125%, 6/30/24 | | | United States | | | | 42,388,000 | | | | 31,155,180 | |
| | c senior note, 144A, 11.00% to 6/22/19, 9.875% thereafter, 6/30/23 | | | United States | | | | 103,596,000 | | | | 80,286,900 | |
| | senior secured note, first lien, 6.25%, 3/31/23 | | | United States | | | | 39,000,000 | | | | 35,589,450 | |
| | CVS Health Corp., | | | | | | | | | | | | |
| | senior bond, 4.30%, 3/25/28 | | | United States | | | | 8,000,000 | | | | 7,848,251 | |
| | senior bond, 5.05%, 3/25/48 | | | United States | | | | 3,900,000 | | | | 3,812,508 | |
| | senior note, 4.10%, 3/25/25 | | | United States | | | | 5,100,000 | | | | 5,062,123 | |
| | DaVita Inc., | | | | | | | | | | | | |
| | senior bond, 5.125%, 7/15/24 | | | United States | | | | 5,000,000 | | | | 4,700,000 | |
| | senior bond, 5.00%, 5/01/25 | | | United States | | | | 4,000,000 | | | | 3,645,000 | |
| c | | Endo DAC/Endo Finance LLC/Endo Finco Inc., | | | | | | | | | | | | |
| | senior bond, 144A, 6.00%, 2/01/25 | | | United States | | | | 10,000,000 | | | | 7,225,000 | |
| | senior note, 144A, 6.00%, 7/15/23 | | | United States | | | | 15,000,000 | | | | 11,512,500 | |
| c | | Endo Finance LLC, senior note, 144A, 5.75%, 1/15/22 | | | United States | | | | 22,500,000 | | | | 18,843,750 | |
| c | | Halfmoon Parent Inc., senior secured note, 144A, 3.75%, 7/15/23 | | | United States | | | | 20,000,000 | | | | 19,952,761 | |
| | HCA Inc., | | | | | | | | | | | | |
| | senior bond, 5.875%, 5/01/23 | | | United States | | | | 7,500,000 | | | | 7,612,500 | |
| | senior note, 7.50%, 2/15/22 | | | United States | | | | 25,000,000 | | | | 26,625,000 | |
| | senior secured note, first lien, 5.00%, 3/15/24 | | | United States | | | | 10,400,000 | | | | 10,322,000 | |
| | Horizon Pharma USA Inc., senior note, 6.625%, 5/01/23 | | | United States | | | | 8,000,000 | | | | 7,760,000 | |
| | Mallinckrodt International Finance SA, senior bond, 4.75%, 4/15/23 | | | United States | | | | 5,000,000 | | | | 3,375,000 | |
| c | | Mallinckrodt International Finance SA/Mallinckrodt CB LLC, | | | | | | | | | | | | |
| | senior note, 144A, 4.875%, 4/15/20 | | | United States | | | | 20,200,000 | | | | 19,594,000 | |
| | h senior note, 144A, 5.75%, 8/01/22 | | | United States | | | | 27,000,000 | | | | 23,220,000 | |
| | senior note, 144A, 5.625%, 10/15/23 | | | United States | | | | 14,300,000 | | | | 10,921,625 | |
| | senior note, 144A, 5.50%, 4/15/25 | | | United States | | | | 10,000,000 | | | | 6,950,000 | |
| | Mylan NV, senior note, 3.95%, 6/15/26 | | | United States | | | | 13,600,000 | | | | 12,325,340 | |
| | Tenet Healthcare Corp., | | | | | | | | | | | | |
| | secured note, second lien, 5.125%, 5/01/25 | | | United States | | | | 2,500,000 | | | | 2,337,500 | |
| | senior note, 8.125%, 4/01/22 | | | United States | | | | 52,600,000 | | | | 52,928,750 | |
| | senior note, 6.75%, 6/15/23 | | | United States | | | | 58,200,000 | | | | 54,853,500 | |
| | | | | | | | | | | | | | |
| | | | | | | | | | | | | 628,512,988 | |
| | | | | | | | | | | | | | |
| | | Industrials 1.0% | | | | | | | | | |
| | United Rentals North America Inc., | | | | | | | | | | | | |
| | senior bond, 5.75%, 11/15/24 | | | United States | | | | 3,000,000 | | | | 2,898,750 | |
| | senior bond, 4.875%, 1/15/28 | | | United States | | | | 20,000,000 | | | | 17,600,000 | |
| | United Technologies Corp., senior note, 3.95%, 8/16/25 | | | United States | | | | 15,000,000 | | | | 14,912,052 | |
| c | | West Corp., senior note, 144A, 8.50%, 10/15/25 | | | United States | | | | 10,000,000 | | | | 7,950,000 | |
| c | | XPO Logistics Inc., senior note, 144A, 6.50%, 6/15/22 | | | United States | | | | 4,134,000 | | | | 4,113,330 | |
| | | | | | | | | | | | | | |
| | | | | | | | | | | | | 47,474,132 | |
| | | | | | | | | | | | | | |
| | | Information Technology 0.7% | | | | | | | | | |
| c | | CommScope Inc., senior bond, 144A, 5.50%, 6/15/24 | | | United States | | | | 10,000,000 | | | | 9,187,500 | |
| c | | Dell International LLC/EMC Corp., senior secured note, first lien, 144A, 5.45%, 6/15/23 | | | United States | | | | 21,100,000 | | | | 21,491,325 | |
| | NCR Corp., senior note, 6.375%, 12/15/23 | | | United States | | | | 4,212,000 | | | | 4,092,843 | |
| | | | | | | | | | | | | | |
| | | | | | | | | | | | | 34,771,668 | |
| | | | | | | | | | | | | | |
FRANKLIN TEMPLETON VARIABLE INSURANCE PRODUCTS TRUST
STATEMENT OF INVESTMENTS
Franklin Income VIP Fund(continued)
| | | | | | | | | | | | | | |
| | | | |
| | | | | Country | | | Principal Amount* | | | Value | |
| | Corporate Bonds(continued) | | | | | | | | | | | | |
| | | Materials 1.9% | | | | | | | | | |
| c | | BWAY Holding Co., | | | | | | | | | | | | |
| | secured note, 144A, 5.50%, 4/15/24 | | | United States | | | | 10,000,000 | | | $ | 9,437,500 | |
| | senior note, 144A, 7.25%, 4/15/25 | | | United States | | | | 23,000,000 | | | | 20,728,750 | |
| c | | Cemex Finance LLC, senior secured note, first lien, 144A, 6.00%, 4/01/24 | | | Mexico | | | | 14,700,000 | | | | 14,676,480 | |
| | DowDuPont Inc., senior note, 4.493%, 11/15/25 | | | United States | | | | 28,500,000 | | | | 29,398,454 | |
| c | | FMG Resources (August 2006) Pty. Ltd., senior note, 144A, 5.125%, 5/15/24 | | | Australia | | | | 6,700,000 | | | | 6,266,577 | |
| c | | Syngenta Finance NV, senior note, 144A, 4.441%, 4/24/23 | | | Switzerland | | | | 16,500,000 | | | | 16,033,380 | |
| | | | | | | | | | | | | | |
| | | | | | | | | | | | | 96,541,141 | |
| | | | | | | | | | | | | | |
| | | | |
| | Real Estate 0.7% | | | | | | | | | | | | |
| | Equinix Inc., senior bond, 5.375%, 5/15/27 | | | United States | | | | 16,500,000 | | | | 16,170,000 | |
| | Iron Mountain Inc., senior sub. bond, 5.75%, 8/15/24 | | | United States | | | | 18,000,000 | | | | 17,145,000 | |
| | | | | | | | | | | | | | |
| | | | | | | | | | | | | 33,315,000 | |
| | | | | | | | | | | | | | |
| | | | |
| | Utilities 1.4% | | | | | | | | | | | | |
| | Calpine Corp., | | | | | | | | | | | | |
| | senior bond, 5.75%, 1/15/25 | | | United States | | | | 10,000,000 | | | | 9,175,000 | |
| | senior note, 5.375%, 1/15/23 | | | United States | | | | 20,000,000 | | | | 18,800,000 | |
| | senior note, 5.50%, 2/01/24 | | | United States | | | | 16,375,000 | | | | 15,044,531 | |
| | Vistra Energy Corp., | | | | | | | | | | | | |
| | senior note, 7.375%, 11/01/22 | | | United States | | | | 20,000,000 | | | | 20,700,000 | |
| | senior note, 5.875%, 6/01/23 | | | United States | | | | 8,000,000 | | | | 8,040,000 | |
| | | | | | | | | | | | | | |
| | | | | | | | | | | | | 71,759,531 | |
| | | | | | | | | | | | | | |
| | | | |
| | Total Corporate Bonds (Cost $2,100,829,871) | | | | | | | | | | | 1,937,151,902 | |
| | | | | | | | | | | | | | |
| | | | |
| f,i | | Senior Floating Rate Interests 3.7% | | | | | | | | | | | | |
| | Communication Services 0.8% | | | | | | | | | | | | |
| j | | iHeartCommunications Inc., Tranche E Term Loan, 9.193%,(3-month USD LIBOR + 7.50%), 7/30/19 | | | United States | | | | 13,142,768 | | | | 8,885,432 | |
| | MH Sub I LLC & Micro Holding Corp., | | | | | | | | | | | | |
| | Amendment No. 2 Initial Term Loan, 6.254%,(1-month USD LIBOR + 3.75%), 9/15/24 | | | United States | | | | 8,897,400 | | | | 8,463,651 | |
| | Second Lien Initial Term Loan, 10.004%,(1-month USD LIBOR + 7.50%), 9/15/25 | | | United States | | | | 5,000,000 | | | | 4,675,000 | |
| | Securus Technologies Holdings Inc., | | | | | | | | | | | | |
| | k,l Delayed Draw Term Loan, TBD, 11/01/24 | | | United States | | | | 8,800,000 | | | | 8,514,000 | |
| | Initial Term Loan B, 7.022%,(1-month USD LIBOR + 4.50%), 11/01/24 | | | United States | | | | 2,183,459 | | | | 2,112,496 | |
| | Second Lien Initial Loan, 10.772%,(1-month USD LIBOR + 8.25%), 11/01/25 | | | United States | | | | 6,000,000 | | | | 5,805,000 | |
| | | | | | | | | | | | | | |
| | | | | | | | | | | | | 38,455,579 | |
| | | | | | | | | | | | | | |
| | | | |
| | Consumer Discretionary 1.3% | | | | | | | | | | | | |
| | 24 Hour Fitness Worldwide Inc., Term Loan, 6.022%,(1-month USD LIBOR + 3.50%), 5/30/25 | | | United States | | | | 13,930,000 | | | | 13,677,519 | |
| | Academy Ltd., Initial Term Loan, 6.349%,(1-month USD LIBOR + 4.00%), 7/02/22 | | | United States | | | | 1,562,373 | | | | 1,051,672 | |
| | Belk Inc., Closing Date Term Loan, 7.365%,(3-month USD LIBOR + 4.75%), 12/12/22 | | | United States | | | | 24,246,330 | | | | 19,673,230 | |
| | PetSmart Inc., TrancheB-2 Loans, 5.38%,(1-month USD LIBOR + 3.00%), 3/11/22 | | | United States | | | | 18,404,639 | | | | 14,605,370 | |
| | Stars Group Holdings BV, Stars Group (US), USD Term Loan, 6.303%,(3-month | | | | | | | | | | | | |
| | USD LIBOR + 3.50%), 7/10/25 | | | United States | | | | 19,900,000 | | | | 19,290,562 | |
| | | | | | | | | | | | | | |
| | | | | | | | | | | | | 68,298,353 | |
| | | | | | | | | | | | | | |
FRANKLIN TEMPLETON VARIABLE INSURANCE PRODUCTS TRUST
STATEMENT OF INVESTMENTS
Franklin Income VIP Fund(continued)
| | | | | | | | | | | | | | |
| | | | |
| | | | | Country | | | Principal Amount* | | | Value | |
| | | | |
| f,i | | Senior Floating Rate Interests(continued) | | | | | | | | | | | | |
| | | Consumer Staples 0.2% | | | | | | | | | |
| | Almonde Inc., Tahoe Canada Bidco Inc. and Misys Europe SA, Dollar Term Loan, 6.303%,(3-month USD LIBOR + 3.50%), 6/13/24 | | | United States | | | | 14,078,196 | | | $ | 13,170,152 | |
| | | | | | | | | | | | | | |
| | | Health Care 0.5% | | | | | | | | | |
| | Amneal Pharmaceuticals LLC, Initial Term Loans, 6.063%,(1-month USD LIBOR + 3.50%), 5/04/25 | | | United States | | | | 24,869,222 | | | | 23,646,402 | |
| | | | | | | | | | | | | | |
| | | Industrials 0.6% | | | | | | | | | |
| | Commercial Barge Line Co., Initial Term Loan, 11.272%,(1-month USD LIBOR + 8.75%), 11/12/20 | | | United States | | | | 8,625,000 | | | | 6,289,065 | |
| | Vertiv Group Corp., Term B Loans, 6.707%,(3-month USD LIBOR + 4.00%), 11/30/23 | | | United States | | | | 8,574,569 | | | | 7,888,603 | |
| | West Corp., Term B Loans, 6.527%,(3-month USD LIBOR + 4.00%), 10/10/24 | | | United States | | | | 17,461,292 | | | | 16,049,844 | |
| | | | | | | | | | | | | | |
| | | | | | | | | | | | | 30,227,512 | |
| | | | | | | | | | | | | | |
| | | | |
| | Utilities 0.3% | | | | | | | | | | | | |
| | Talen Energy Supply LLC, | | | | | | | | | | | | |
| | Initial Term Loan, 6.522%,(1-month USD LIBOR + 4.00%), 4/13/24 | | | United States | | | | 7,820,000 | | | | 7,718,989 | |
| | TermB-1 Loans, 6.522%,(1-month USD LIBOR + 4.00%), 7/15/23 | | | United States | | | | 5,895,000 | | | | 5,824,997 | |
| | | | | | | | | | | | | | |
| | | | | | | | | | | | | 13,543,986 | |
| | | | | | | | | | | | | | |
| | | | |
| | Total Senior Floating Rate Interests
(Cost $202,607,509) | | | | | | | | | | | 187,341,984 | |
| | | | | | | | | | | | | | |
| | | | |
| | U.S. Government and Agency Securities 7.5% | | | | | | | | | | | | |
| | U.S. Treasury Note, 1.00%, 6/30/19 | | | United States | | | | 50,000,000 | | | | 49,627,424 | |
| | 2.25%, 3/31/20 | | | United States | | | | 50,000,000 | | | | 49,799,272 | |
| | 2.50%, 5/31/20 | | | United States | | | | 75,000,000 | | | | 74,938,136 | |
| | 2.50%, 6/30/20 | | | United States | | | | 50,000,000 | | | | 49,963,730 | |
| | 2.375%, 3/15/21 | | | United States | | | | 50,000,000 | | | | 49,868,432 | |
| | 2.75%, 4/30/23 | | | United States | | | | 25,000,000 | | | | 25,263,509 | |
| | 2.75%, 5/31/23 | | | United States | | | | 50,000,000 | | | | 50,553,879 | |
| | 2.875%, 5/31/25 | | | United States | | | | 25,000,000 | | | | 25,443,525 | |
| | | | | | | | | | | | | | |
| | | | |
| | Total U.S. Government and Agency Securities
(Cost $374,249,107) | | | | | | | | | | | 375,457,907 | |
| | | | | | | | | | | | | | |
| | | | |
| | | | | | | | Shares | | | | |
| | | | |
| | Escrows and Litigation Trusts (Cost $62,602) 0.0% | | | | | | | | | | | | |
| a,m | | Motors Liquidation Co., Escrow Account, cvt. pfd., C | | | United States | | | | 1,400,000 | | | | — | |
| | | | | | | | | | | | | | |
| | | | |
| | Total Investments before Short Term Investments
(Cost $4,932,476,137) | | | | | | | | | | | 4,802,981,592 | |
| | | | | | | | | | | | | | |
| | | | |
| | Short Term Investments 3.2% | | | | | | | | | | | | |
| | | | |
| | Money Market Funds (Cost $157,193,174) 3.2% | | | | | | | | | | | | |
| n,o | | Institutional Fiduciary Trust Money Market Portfolio, 1.99% | | | United States | | | | 157,193,174 | | | | 157,193,174 | |
| | | | | | | | | | | | | | |
| | | | |
| p | | Investments from Cash Collateral Received for Loaned Securities 0.0%† | | | | | | | | | | | | |
| | | Money Market Funds (Cost $1,099,000) 0.0%† | | | | | | | | | |
| n,o | | Institutional Fiduciary Trust Money Market Portfolio, 1.99% | | | United States | | | | 1,099,000 | | | | 1,099,000 | |
| | | | | | | | | | | | | | |
FRANKLIN TEMPLETON VARIABLE INSURANCE PRODUCTS TRUST
STATEMENT OF INVESTMENTS
Franklin Income VIP Fund(continued)
| | | | | | | | | | | | | | |
| | | | |
| | | | | Country | | | Principal Amount* | | | Value | |
| | | | |
| | Short Term Investments(continued) | | | | | | | | | | | | |
| | | Investments from Cash Collateral Received for Loaned Securities(continued) | | | | | | | |
| | | | |
| | Repurchase Agreement (Cost $275,043) 0.0%† | | | | | | | | | | | | |
| q | | Joint Repurchase Agreement, 2.95%, 1/02/19 (Maturity Value $275,088) | | | | | | | | | | | | |
| | BNP Paribas Securities Corp. | | | | | | | | | | | | |
| | Collateralized by U.S. Treasury, Strip, 8/15/19 – 11/15/20;rU.S. Treasury Bill, 3/28/19; U.S. Treasury Note, 1.125% – 2.75%, 9/30/19 - 11/15/23 (valued at $280,544) | | | United States | | | | 275,043 | | | $ | 275,043 | |
| | | | | | | | | | | | | | |
| | | | |
| | Total Investments from Cash Collateral Received for Loaned Securities (Cost $1,374,043) | | | | | | | | | | | 1,374,043 | |
| | | | | | | | | | | | | | |
| | | | |
| | Total Investments (Cost $5,091,043,354) 99.4% | | | | | | | | | | | 4,961,548,809 | |
| | | | |
| | Other Assets, less Liabilities 0.6% | | | | | | | | | | | 32,460,826 | |
| | | | | | | | | | | | | | |
| | | | |
| | Net Assets 100.0% | | | | | | | | | | $ | 4,994,009,635 | |
| | | | | | | | | | | | | | |
See Abbreviations on pageFI-35.
†Rounds to less than 0.1% of net assets.
*The principal amount is stated in U.S. dollars unless otherwise indicated.
aNon-income producing.
bSee Note 1(g) regarding equity-linked securities.
cSecurity was purchased pursuant to Rule 144A under the Securities Act of 1933 and may be sold in transactions exempt from registration only to qualified institutional buyers or in a public offering registered under the Securities Act of 1933. These securities have been deemed liquid under guidelines approved by the Trust’s Board of Trustees. At December 31, 2018, the aggregate value of these securities was $1,042,978,736, representing 20.9% of net assets.
dSee Note 1(f) regarding index-linked notes.
eSecurity pays a fixed 2.00% coupon rate and a variable coupon based on the distribution of the Morgan Stanley Custom Enhanced SPX B DT Index 20 Delta. The coupon rate shown represents the combined rate at period end. Cash payment at maturity or upon early redemption is based on the performance of the Morgan Stanley Custom Enhanced SPX B Index 20 Delta.
fThe coupon rate shown represents the rate at period end.
gPerpetual security with no stated maturity date.
hA portion or all of the security is on loan at December 31, 2018. See Note 1(h).
iSee Note 1(i) regarding senior floating rate interests.
jSee Note 7 regarding defaulted securities.
kSecurity purchased on a delayed delivery basis. See Note 1(d).
lA portion or all of the security represents an unsettled loan commitment. The coupon rate is to-be determined (TBD) at the time of settlement and will be based upon a reference index/floor plus a spread.
mFair valued using significant unobservable inputs. See Note 10 regarding fair value measurements.
nSee Note 3(e) regarding investments in affiliated management investment companies.
oThe rate shown is the annualizedseven-day effective yield at period end.
pSee Note 1(h) regarding securities on loan.
qSee Note 1(c) regarding repurchase agreement.
rThe security was issued on a discount basis with no stated coupon rate.
| | | | |
| | |
| FI-22 | | Annual Report | The accompanying notes are an integral part of these financial statements. |
FRANKLIN TEMPLETON VARIABLE INSURANCE PRODUCTS TRUST
Financial Statements
Statement of Assets and Liabilities
December 31, 2018
| | | | |
| |
| | | Franklin Income VIP Fund | |
Assets: | | | | |
Investments in securities: | | | | |
Cost - Unaffiliated issuers | | $ | 4,932,476,137 | |
Cost -Non-controlled affiliates (Note 3e) | | | 158,292,174 | |
Cost - Unaffiliated repurchase agreements | | | 275,043 | |
| | | | |
Value - Unaffiliated issuers+ | | $ | 4,802,981,592 | |
Value -Non-controlled affiliates (Note 3e) | | | 158,292,174 | |
Value - Unaffiliated repurchase agreements | | | 275,043 | |
Cash | | | 6,676,343 | |
Receivables: | | | | |
Investment securities sold | | | 6,098,327 | |
Capital shares sold | | | 887,247 | |
Dividends and interest | | | 37,601,832 | |
Other assets | | | 694 | |
| | | | |
Total assets | | | 5,012,813,252 | |
| | | | |
Liabilities: | | | | |
Payables: | | | | |
Investment securities purchased | | | 8,778,000 | |
Capital shares redeemed | | | 4,337,957 | |
Management fees | | | 1,923,555 | |
Distribution fees | | | 1,970,366 | |
Payable upon return of securities loaned | | | 1,374,043 | |
Accrued expenses and other liabilities | | | 419,696 | |
| | | | |
Total liabilities | | | 18,803,617 | |
| | | | |
Net assets, at value | | $ | 4,994,009,635 | |
| | | | |
Net assets consist of: | | | | |
Paid-in capital | | | $4,778,931,120 | |
Total distributable earnings (loss) | | | 215,078,515 | |
| | | | |
Net assets, at value | | $ | 4,994,009,635 | |
| | | | |
| |
| Class 1: | | | | |
Net assets, at value | | $ | 612,656,977 | |
| | | | |
Shares outstanding | | | 40,141,624 | |
| | | | |
Net asset value and maximum offering price per share | | $ | 15.26 | |
| | | | |
| |
| Class 2: | | | | |
Net assets, at value | | $ | 4,086,652,487 | |
| | | | |
Shares outstanding | | | 277,303,541 | |
| | | | |
Net asset value and maximum offering price per share | | $ | 14.74 | |
| | | | |
| |
| Class 4: | | | | |
Net assets, at value | | $ | 294,700,171 | |
| | | | |
Shares outstanding | | | 19,537,193 | |
| | | | |
Net asset value and maximum offering price per share | | $ | 15.08 | |
| | | | |
| |
+Includes securities loaned | | $ | 1,307,200 | |
| | | | | | |
| | | |
| | The accompanying notes are an integral part of these financial statements. | Annual Report | | | FI-23 | |
FRANKLIN TEMPLETON VARIABLE INSURANCE PRODUCTS TRUST
FINANCIAL STATEMENTS
Statement of Operations
for the year ended December 31, 2018
| | | | |
| |
| | | Franklin Income VIP Fund | |
Investment income: | | | | |
Dividends: (net of foreign taxes)* | | | | |
Unaffiliated issuers | | $ | 90,603,027 | |
Non-controlled affiliates (Note 3e) | | | 3,827,185 | |
Interest: | | | | |
Unaffiliated issuers | | | 179,493,518 | |
Income from securities loaned: | | | | |
Unaffiliated issuers (net of fees and rebates) | | | 33,198 | |
Non-controlled affiliates (Note 3e) | | | 127,105 | |
| | | | |
Total investment income | | | 274,084,033 | |
| | | | |
Expenses: | | | | |
Management fees (Note 3a) | | | 26,034,552 | |
Distribution fees: (Note 3c) | | | | |
Class 2 | | | 11,760,863 | |
Class 4 | | | 1,135,920 | |
Custodian fees (Note 4) | | | 65,560 | |
Reports to shareholders | | | 460,080 | |
Professional fees | | | 151,267 | |
Trustees’ fees and expenses | | | 41,822 | |
Other | | | 121,916 | |
| | | | |
Total expenses | | | 39,771,980 | |
Expense reductions (Note 4) | | | (55,355 | ) |
Expenses waived/paid by affiliates (Note 3e) | | | (971,286 | ) |
| | | | |
Net expenses | | | 38,745,339 | |
| | | | |
Net investment income | | | 235,338,694 | |
| | | | |
Realized and unrealized gains (losses): | | | | |
Net realized gain (loss) from: | | | | |
Investments: | | | | |
Unaffiliated issuers | | | 347,360,552 | |
Written options | | | 3,958,115 | |
Realized gain distributions from REITs | | | 139,700 | |
Foreign currency transactions | | | (317,612 | ) |
| | | | |
Net realized gain (loss) | | | 351,140,755 | |
| | | | |
Net change in unrealized appreciation (depreciation) on: | | | | |
Investments: | | | | |
Unaffiliated issuers | | | (810,146,467 | ) |
Translation of other assets and liabilities denominated in foreign currencies | | | (37,554 | ) |
Written options | | | 575,894 | |
| | | | |
Net change in unrealized appreciation (depreciation) | | | (809,608,127 | ) |
| | | | |
Net realized and unrealized gain (loss) | | | (458,467,372 | ) |
| | | | |
Net increase (decrease) in net assets resulting from operations | | $ | (223,128,678 | ) |
| | | | |
| |
| *Foreign taxes withheld on dividends | | $ | 2,399,880 | |
| | | | |
| | | |
| FI-24 | | Annual Report | The accompanying notes are an integral part of these financial statements. | | |
FRANKLIN TEMPLETON VARIABLE INSURANCE PRODUCTS TRUST
FINANCIAL STATEMENTS
Statements of Changes in Net Assets
| | | | | | | | |
| |
| | | Franklin Income VIP Fund | |
| |
| | | Year Ended December 31, | |
| | |
| | | 2018 | | | 2017 | |
Increase (decrease) in net assets: | | | | | | | | |
Operations: | | | | | | | | |
Net investment income | | $ | 235,338,694 | | | $ | 246,080,825 | |
Net realized gain (loss) | | | 351,140,755 | | | | 161,381,487 | |
Net change in unrealized appreciation (depreciation) | | | (809,608,127 | ) | | | 162,933,235 | |
| | | | |
Net increase (decrease) in net assets resulting from operations | | | (223,128,678 | ) | | | 570,395,547 | |
| | | | |
Distributions to shareholders: (Note 1k) | | | | | | | | |
Class 1 | | | (34,377,723 | ) | | | (30,736,550 | ) |
Class 2 | | | (227,495,537 | ) | | | (212,433,443 | ) |
Class 4 | | | (14,948,805 | ) | | | (12,598,021 | ) |
| | | | |
Total distributions to shareholders | | | (276,822,065 | ) | | | (255,768,014 | ) |
| | | | |
Capital share transactions: (Note 2) | | | | | | | | |
Class 1 | | | (62,663,457 | ) | | | 1,111,670 | |
Class 2 | | | (543,422,123 | ) | | | (307,051,941 | ) |
Class 4 | | | (11,817,756 | ) | | | 8,458,865 | |
| | | | |
Total capital share transactions | | | (617,903,336 | ) | | | (297,481,406 | ) |
| | | | |
Net increase (decrease) in net assets | | | (1,117,854,079 | ) | | | 17,146,127 | |
Net assets: | | | | | | | | |
Beginning of year | | | 6,111,863,714 | | | | 6,094,717,587 | |
| | | | |
End of year (Note 1k) | | $ | 4,994,009,635 | | | $ | 6,111,863,714 | |
| | | | |
| | | | | | |
| | | |
| | The accompanying notes are an integral part of these financial statements. | Annual Report | | | FI-25 | |
FRANKLIN TEMPLETON VARIABLE INSURANCE PRODUCTS TRUST
Notes to Financial Statements
Franklin Income VIP Fund
1. Organization and Significant Accounting Policies
Franklin Templeton Variable Insurance Products Trust (Trust) is registered under the Investment Company Act of 1940 (1940 Act) as anopen-end management investment company, consisting of eighteen separate funds and applies the specialized accounting and reporting guidance in U.S. Generally Accepted Accounting Principles (U.S. GAAP). Franklin Income VIP Fund (Fund) is included in this report. Shares of the Fund are generally sold only to insurance company separate accounts to fund the benefits of variable life insurance policies or variable annuity contracts. The Fund offers three classes of shares: Class 1, Class 2 and Class 4. Each class of shares may differ by its distribution fees, voting rights on matters affecting a single class and its exchange privilege.
The following summarizes the Fund’s significant accounting policies.
a. Financial Instrument Valuation
The Fund’s investments in financial instruments are carried at fair value daily. Fair value is the price that would be received to sell an asset or paid to transfer a liability in an orderly transaction between market participants on the measurement date. The Fund calculates the net asset value (NAV) per share each business day as of 4 p.m. Eastern time or the regularly scheduled close of the New York Stock Exchange (NYSE), whichever is earlier. Under compliance policies and procedures approved by the Trust’s Board of Trustees (the Board), the Fund’s administrator has responsibility for oversight of valuation, including leading the cross-functional Valuation Committee (VC). The Fund may utilize independent pricing services, quotations from securities and financial instrument dealers, and other market sources to determine fair value.
Equity securities listed on an exchange or on the NASDAQ National Market System are valued at the last quoted sale price or the official closing price of the day, respectively. Foreign equity securities are valued as of the close of trading on the foreign stock exchange on which the security is primarily traded, or as of 4 p.m. Eastern time. The value is then converted into its U.S. dollar equivalent at the foreign exchange rate in effect at 4 p.m. Eastern time on the day that the value of the security is determined.Over-the-counter (OTC) securities are valued within the range of the most recent quoted bid and ask prices. Securities that trade in multiple markets or on multiple
exchanges are valued according to the broadest and most representative market. Certain equity securities are valued based upon fundamental characteristics or relationships to similar securities.
Debt securities generally trade in the OTC market rather than on a securities exchange. The Fund’s pricing services use multiple valuation techniques to determine fair value. In instances where sufficient market activity exists, the pricing services may utilize a market-based approach through which quotes from market makers are used to determine fair value. In instances where sufficient market activity may not exist or is limited, the pricing services also utilize proprietary valuation models which may consider market characteristics such as benchmark yield curves, credit spreads, estimated default rates, anticipated market interest rate volatility, coupon rates, anticipated timing of principal repayments, underlying collateral, and other unique security features in order to estimate the relevant cash flows, which are then discounted to calculate the fair value. Securities denominated in a foreign currency are converted into their U.S. dollar equivalent at the foreign exchange rate in effect at 4 p.m. Eastern time on the date that the values of the foreign debt securities are determined.
Investments inopen-end mutual funds are valued at the closing NAV. Investments in repurchase agreements are valued at cost, which approximates fair value.
The Fund has procedures to determine the fair value of financial instruments for which market prices are not reliable or readily available. Under these procedures, the Fund primarily employs a market-based approach which may use related or comparable assets or liabilities, recent transactions, market multiples, book values, and other relevant information for the investment to determine the fair value of the investment. An income-based valuation approach may also be used in which the anticipated future cash flows of the investment are discounted to calculate fair value. Discounts may also be applied due to the nature or duration of any restrictions on the disposition of the investments. Due to the inherent uncertainty of valuations of such investments, the fair values may differ significantly from the values that would have been used had an active market existed.
Trading in securities on foreign securities stock exchanges and OTC markets may be completed before 4 p.m. Eastern time. In addition, trading in certain foreign markets may not take place on every Fund’s business day. Occasionally, events occur
FRANKLIN TEMPLETON VARIABLE INSURANCE PRODUCTS TRUST
NOTES TO FINANCIAL STATEMENTS
Franklin Income VIP Fund(continued)
between the time at which trading in a foreign security is completed and 4 p.m. Eastern time that might call into question the reliability of the value of a portfolio security held by the Fund. As a result, differences may arise between the value of the Fund’s portfolio securities as determined at the foreign market close and the latest indications of value at 4 p.m. Eastern time. In order to minimize the potential for these differences, the VC monitors price movements following the close of trading in foreign stock markets through a series of country specific market proxies (such as baskets of American Depositary Receipts, futures contracts and exchange traded funds). These price movements are measured against established trigger thresholds for each specific market proxy to assist in determining if an event has occurred that may call into question the reliability of the values of the foreign securities held by the Fund. If such an event occurs, the securities may be valued using fair value procedures, which may include the use of independent pricing services. At December 31, 2018, a market event occured resulting in a portion of the securities held by the Fund being valued using fair value procedures.
When the last day of the reporting period is anon-business day, certain foreign markets may be open on those days that the Fund’s NAV is not calculated, which could result in differences between the value of the Fund’s portfolio securities on the last business day and the last calendar day of the reporting period. Any significant security valuation changes due to an open foreign market are adjusted and reflected by the Fund for financial reporting purposes.
b. Foreign Currency Translation
Portfolio securities and other assets and liabilities denominated in foreign currencies are translated into U.S. dollars based on the exchange rate of such currencies against U.S. dollars on the date of valuation. The Fund may enter into foreign currency exchange contracts to facilitate transactions denominated in a foreign currency. Purchases and sales of securities, income and expense items denominated in foreign currencies are translated into U.S. dollars at the exchange rate in effect on the transaction date. Portfolio securities and assets and liabilities denominated in foreign currencies contain risks that those currencies will decline in value relative to the U.S. dollar. Occasionally, events may impact the availability or reliability of foreign exchange rates used to convert the U.S. dollar equivalent value. If such an event occurs, the foreign exchange rate will be valued at fair value using procedures established and approved by the Board.
The Fund does not separately report the effect of changes in foreign exchange rates from changes in market prices on securities held. Such changes are included in net realized and unrealized gain or loss from investments in the Statement of Operations.
Realized foreign exchange gains or losses arise from sales of foreign currencies, currency gains or losses realized between the trade and settlement dates on securities transactions and the difference between the recorded amounts of dividends, interest, and foreign withholding taxes and the U.S. dollar equivalent of the amounts actually received or paid. Net unrealized foreign exchange gains and losses arise from changes in foreign exchange rates on foreign denominated assets and liabilities other than investments in securities held at the end of the reporting period.
c. Joint Repurchase Agreement
The Fund enters into a joint repurchase agreement whereby its uninvested cash balance is deposited into a joint cash account with other funds managed by the investment manager or an affiliate of the investment manager and is used to invest in one or more repurchase agreements. The value and face amount of the joint repurchase agreement are allocated to the funds based on theirpro-rata interest. A repurchase agreement is accounted for as a loan by the Fund to the seller, collateralized by securities which are delivered to the Fund’s custodian. The fair value, including accrued interest, of the initial collateralization is required to be at least 102% of the dollar amount invested by the funds, with the value of the underlying securities marked to market daily to maintain coverage of at least 100%. Repurchase agreements are subject to the terms of Master Repurchase Agreements (MRAs) with approved counterparties (sellers). The MRAs contain various provisions, including but not limited to events of default and maintenance of collateral for repurchase agreements. In the event of default by either the seller or the Fund, certain MRAs may permit thenon-defaulting party to net andclose-out all transactions, if any, traded under such agreements. The Fund may sell securities it holds as collateral and apply the proceeds towards the repurchase price and any other amounts owed by the seller to the Fund in the event of default by the seller. This could involve costs or delays in addition to a loss on the securities if their value falls below the repurchase price owed by the seller. The joint repurchase agreement held by the Fund at year end, as indicated in the Statement of Investments, had been entered into on December 31, 2018.
FRANKLIN TEMPLETON VARIABLE INSURANCE PRODUCTS TRUST
NOTES TO FINANCIAL STATEMENTS
Franklin Income VIP Fund(continued)
1. Organization and Significant Accounting Policies (continued)
d. Securities Purchased on a Delayed Delivery Basis
The Fund purchases securities on a delayed delivery basis, with payment and delivery scheduled for a future date. These transactions are subject to market fluctuations and are subject to the risk that the value at delivery may be more or less than the trade date purchase price. Although the Fund will generally purchase these securities with the intention of holding the securities, it may sell the securities before the settlement date. Sufficient assets have been segregated for these securities.
e. Derivative Financial Instruments
The Fund invested in derivative financial instruments in order to manage risk or gain exposure to various other investments or markets. Derivatives are financial contracts based on an underlying or notional amount, require no initial investment or an initial net investment that is smaller than would normally be required to have a similar response to changes in market factors, and require or permit net settlement. Derivatives contain various risks including the potential inability of the counterparty to fulfill their obligations under the terms of the contract, the potential for an illiquid secondary market, and/or the potential for market movements which expose the Fund to gains or losses in excess of the amounts shown in the Statement of Assets and Liabilities. Realized gain and loss and unrealized appreciation and depreciation on these contracts for the period are included in the Statement of Operations.
The Fund purchased or wrote exchange traded option contracts primarily to gain exposure to equity price risk. An option is a contract entitling the holder to purchase or sell a specific amount of shares or units of an asset or notional amount of a swap (swaption), at a specified price. When an option is purchased or written, an amount equal to the premium paid or received is recorded as an asset or liability, respectively. Upon exercise of an option, the acquisition cost or sales proceeds of the underlying investment is adjusted by any premium received or paid. Upon expiration of an option, any premium received or paid is recorded as a realized gain or loss. Upon closing an option other than through expiration or exercise, the difference between the premium received or paid and the cost to close the position is recorded as a realized gain or loss.
See Note 8 regarding other derivative information.
f. Index-Linked Notes
The Fund invests in index-linked notes. Index-linked notes are senior, unsecured, subordinated debt securities issued by a financial institution, and the value is based on the price movements of the underlying index. Index-linked notes are designed to provide investors access to the returns of various market benchmarks and intended to replicate the economic effects that would apply had the Fund directly purchased the underlying referenced asset or basket of assets. The risks of investing in index-linked notes include unfavorable price movements in the underlying index and the credit risk of the issuing financial institution. There may be no guarantee of a return of principal with index-linked notes and the appreciation potential may be limited. Index-linked notes may be more volatile and less liquid than other investments held by the Fund.
g. Equity-Linked Securities
The Fund invests in equity-linked securities. Equity-linked securities are hybrid financial instruments that generally combine both debt and equity characteristics into a single note form. Income received from equity-linked securities is recorded as realized gains in the Statement of Operations and may be based on the performance of an underlying equity security, an equity index, or an option position. The risks of investing in equity-linked securities include unfavorable price movements in the underlying security and the credit risk of the issuing financial institution. There may be no guarantee of a return of principal with equity-linked securities and the appreciation potential may be limited. Equity-linked securities may be more volatile and less liquid than other investments held by the Fund.
h. Securities Lending
The Fund participates in an agency based securities lending program to earn additional income. The Fund receives cash collateral against the loaned securities in an amount equal to at least 102% of the fair value of the loaned securities. Collateral is maintained over the life of the loan in an amount not less than 100% of the fair value of loaned securities, as determined at the close of Fund business each day; any additional collateral required due to changes in security values is delivered to the Fund on the next business day. The collateral is deposited into a joint cash account with other funds and is used to invest in a money market fund managed by Franklin Advisers, Inc., an affiliate of the Fund, and/or a joint repurchase agreement. The Fund may receive income from the investment of cash collateral, in addition to lending fees and rebates paid by the
FRANKLIN TEMPLETON VARIABLE INSURANCE PRODUCTS TRUST
NOTES TO FINANCIAL STATEMENTS
Franklin Income VIP Fund(continued)
borrower. Income from securities loaned, net of fees paid to the securities lending agent and/or third-party vendor, is reported separately in the Statement of Operations. The Fund bears the market risk with respect to the collateral investment, securities loaned, and the risk that the agent may default on its obligations to the Fund. If the borrower defaults on its obligation to return the securities loaned, the Fund has the right to repurchase the securities in the open market using the collateral received. The securities lending agent has agreed to indemnify the Fund in the event of default by a third party borrower.
i. Senior Floating Rate Interests
The Fund invests in senior secured corporate loans that pay interest at rates which are periodically reset by reference to a base lending rate plus a spread. These base lending rates are generally the prime rate offered by a designated U.S. bank or the London InterBank Offered Rate (LIBOR). Senior secured corporate loans often require prepayment of principal from excess cash flows or at the discretion of the borrower. As a result, actual maturity may be substantially less than the stated maturity. Senior secured corporate loans in which the Fund invests are generally readily marketable, but may be subject to certain restrictions on resale.
j. Income and Deferred Taxes
It is the Fund’s policy to qualify as a regulated investment company under the Internal Revenue Code. The Fund intends to distribute to shareholders substantially all of its taxable income and net realized gains to relieve it from federal income and if applicable, excise taxes. As a result, no provision for U.S. federal income taxes is required.
The Fund may be subject to foreign taxation related to income received, capital gains on the sale of securities and certain foreign currency transactions in the foreign jurisdictions in which it invests. Foreign taxes, if any, are recorded based on the tax regulations and rates that exist in the foreign markets in which the Fund invests. When a capital gain tax is determined to apply, the Fund records an estimated deferred tax liability in an amount that would be payable if the securities were disposed of on the valuation date.
As a result of several court cases, in certain countries across the European Union, the Fund filed additional tax reclaims for previously withheld taxes on dividends earned in those countries (EU reclaims). These additional filings are subject to various administrative proceedings by the local jurisdictions’
tax authorities within the European Union, as well as a number of related judicial proceedings. Income recognized, if any, for EU reclaims is reflected as other income in the Statement of Operations and any related receivable, if any, is reflected as European Union tax reclaims in the Statement of Assets and Liabilities. When uncertainty exists as to the ultimate resolution of these proceedings, the likelihood of receipt of these EU reclaims, and the potential timing of payment, no amounts are reflected in the financial statements. For U.S. income tax purposes, when EU reclaims are received by the Fund and the Fund previously passed foreign tax credit on to its shareholders, the Fund must either amend historic tax reporting to shareholders or enter into a closing agreement with the Internal Revenue Service (IRS) in order to pay the associated tax liability on behalf of the Fund’s shareholders.
The Fund may recognize an income tax liability related to its uncertain tax positions under U.S. GAAP when the uncertain tax position has a less than 50% probability that it will be sustained upon examination by the tax authorities based on its technical merits. As of December 31, 2018, the Fund has determined that no tax liability is required in its financial statements related to uncertain tax positions for any open tax years (or expected to be taken in future tax years). Open tax years are those that remain subject to examination and are based on the statute of limitations in each jurisdiction in which the Fund invests.
k. Security Transactions, Investment Income, Expenses and Distributions
Security transactions are accounted for on trade date. Realized gains and losses on security transactions are determined on a specific identification basis. Interest income and estimated expenses are accrued daily. Amortization of premium and accretion of discount on debt securities are included in interest income. Facility fees are recognized as income over the expected term of the loan. Dividend income is recorded on theex-dividend date except for certain dividends from securities where the dividend rate is not available. In such cases, the dividend is recorded as soon as the information is received by the Fund. Distributions to shareholders are recorded on theex-dividend date. Distributable earnings are determined according to income tax regulations (tax basis) and may differ from earnings recorded in accordance with U.S. GAAP. These differences may be permanent or temporary. Permanent differences are reclassified among capital accounts to reflect
FRANKLIN TEMPLETON VARIABLE INSURANCE PRODUCTS TRUST
NOTES TO FINANCIAL STATEMENTS
Franklin Income VIP Fund(continued)
1. Organization and Significant Accounting Policies(continued)
k. Security Transactions, Investment Income, Expenses and Distributions(continued)
their tax character. These reclassifications have no impact on net assets or the results of operations. Temporary differences are not reclassified, as they may reverse in subsequent periods.*
Common expenses incurred by the Trust are allocated among the Funds based on the ratio of net assets of each Fund to the combined net assets of the Trust or based on the ratio of number of shareholders of each Fund to the combined number of shareholders of the Trust. Fund specific expenses are charged directly to the Fund that incurred the expense.
Realized and unrealized gains and losses and net investment income, excluding class specific expenses, are allocated daily to each class of shares based upon the relative proportion of net assets of each class. Differences in per share distributions by class are generally due to differences in class specific expenses.
l. Accounting Estimates
The preparation of financial statements in accordance with U.S. GAAP requires management to make estimates and assumptions that affect the reported amounts of assets and liabilities at the date of the financial statements and the amounts of income and expenses during the reporting period. Actual results could differ from those estimates.
m. Guarantees and Indemnifications
Under the Trust’s organizational documents, its officers and trustees are indemnified by the Trust against certain liabilities arising out of the performance of their duties to the Trust. Additionally, in the normal course of business, the Trust, on behalf of the Fund enters into contracts with service providers that contain general indemnification clauses. The Trust’s maximum exposure under these arrangements is unknown as this would involve future claims that may be made against the Trust that have not yet occurred. Currently, the Trust expects the risk of loss to be remote.
*Effective during the current reporting period, it is no longer required to present certain line items in the Statements of Changes in Net Assets. The below prior period amounts affected by this change are shown as they were in the prior year Statements of Changes in Net Assets.
For the year ended December 31, 2017, distributions to shareholders were as follows:
| | |
Distributions from net investment income: | | |
Class 1 | | $ (30,736,550) |
Class 2 | | (212,433,443) |
Class 4 | | (12,598,021) |
For the year ended December 31, 2017, undistributed net investment income included in net assets was $269,525,427.
2. Shares of Beneficial Interest
At December 31, 2018, there were an unlimited number of shares authorized (without par value). Transactions in the Fund’s shares were as follows:
| | | | | | | | | | | | | | | | | | | | |
| |
| | | Year Ended December 31, | |
| | | |
| | | 2018 | | | | | | 2017 | |
| | | | | |
| | | Shares | | | Amount | | | | | | Shares | | | Amount | |
| | | | | |
| Class 1 Shares: | | | | | | | | | | | | | | | | | | | | |
Shares sold | | | 1,947,322 | | | $ | 31,806,598 | | | | | | | | 2,556,049 | | | $ | 41,649,315 | |
Shares issued in reinvestment of distributions | | | 2,128,651 | | | | 34,377,723 | | | | | | | | 1,925,849 | | | | 30,736,550 | |
Shares redeemed | | | (7,908,010 | ) | | | (128,847,778 | ) | | | | | | | (4,368,760 | ) | | | (71,274,195 | ) |
| | | | |
Net increase (decrease) | | | (3,832,037 | ) | | $ | (62,663,457 | ) | | | | | | | 113,138 | | | $ | 1,111,670 | |
| | | | |
FRANKLIN TEMPLETON VARIABLE INSURANCE PRODUCTS TRUST
NOTES TO FINANCIAL STATEMENTS
Franklin Income VIP Fund(continued)
| | | | | | | | | | | | | | | | | | | | |
| |
| | | Year Ended December 31, | |
| | | |
| | | 2018 | | | | | | 2017 | |
| | | | | |
| | | Shares | | | Amount | | | | | | Shares | | | Amount | |
| | | | | |
| Class 2 Shares: | | | | | | | | | | | | | | | | | | | | |
Shares sold | | | 11,659,052 | | | $ | 185,115,657 | | | | | | | | 12,063,249 | | | $ | 190,265,472 | |
Shares issued in reinvestment of distributions | | | 14,573,705 | | | | 227,495,537 | | | | | | | | 13,740,843 | | | | 212,433,443 | |
Shares redeemed | | | (60,726,257 | ) | | | (956,033,317 | ) | | | | | | | (44,928,166 | ) | | | (709,750,856 | ) |
| | | | |
Net increase (decrease) | | | (34,493,500 | ) | | $ | (543,422,123 | ) | | | | | | | (19,124,074 | ) | | $ | (307,051,941 | ) |
| | | | |
| Class 4 Shares: | | | | | | | | | | | | | | | | | | | | |
Shares sold | | | 2,953,880 | | | $ | 48,028,259 | | | | | | | | 3,354,488 | | | $ | 54,048,239 | |
Shares issued in reinvestment of distributions | | | 934,885 | | | | 14,948,805 | | | | | | | | 796,839 | | | | 12,598,021 | |
Shares redeemed | | | (4,625,977 | ) | | | (74,794,820 | ) | | | | | | | (3,605,896 | ) | | | (58,187,395 | ) |
| | | | |
Net increase (decrease) | | | (737,212 | ) | | $ | (11,817,756 | ) | | | | | | | 545,431 | | | $ | 8,458,865 | |
| | | | |
3. Transactions with Affiliates
Franklin Resources, Inc. is the holding company for various subsidiaries that together are referred to as Franklin Templeton. Certain officers and trustees of the Fund are also officers and/or directors of the following subsidiaries:
| | |
| |
| Subsidiary | | Affiliation |
Franklin Advisers, Inc. (Advisers) | | Investment manager |
Franklin Templeton Services, LLC (FT Services) | | Administrative manager |
Franklin Templeton Distributors, Inc. (Distributors) | | Principal underwriter |
Franklin Templeton Investor Services, LLC (Investor Services) | | Transfer agent |
a. Management Fees
The Fund pays an investment management fee to Advisers based on the average daily net assets of the Fund as follows:
| | |
| |
| Annualized Fee Rate | | Net Assets |
0.625% | | Up to and including $100 million |
0.500% | | Over $100 million, up to and including $250 million |
0.450% | | Over $250 million, up to and including $7.5 billion |
0.440% | | Over $7.5 billion, up to and including $10 billion |
0.430% | | Over $10 billion, up to and including $12.5 billion |
0.420% | | Over $12.5 billion, up to and including $15 billion |
0.400% | | In excess of $15 billion |
For the year ended December 31, 2018, the gross effective investment management fee rate was 0.455% of the Fund’s average daily net assets.
b. Administrative Fees
Under an agreement with Advisers, FT Services provides administrative services to the Fund. The fee is paid by Advisers based on the Fund’s average daily net assets, and is not an additional expense of the Fund.
FRANKLIN TEMPLETON VARIABLE INSURANCE PRODUCTS TRUST
NOTES TO FINANCIAL STATEMENTS
Franklin Income VIP Fund(continued)
3. Transactions with Affiliates(continued)
c. Distribution Fees
The Board has adopted distribution plans for Class 2 and Class 4 shares pursuant to Rule 12b-1 under the 1940 Act. Under the Fund’s compensation distribution plans, the Fund pays Distributors for costs incurred in connection with the servicing, sale and distribution of the Fund’s shares up to 0.35% per year of its average daily net assets of each class. The Board has agreed to limit the current rate to 0.25% per year for Class 2. The plan year, for purposes of monitoring compliance with the maximum annual plan rates, is February 1 through January 31.
d. Transfer Agent Fees
Investor Services, under terms of an agreement, performs shareholder servicing for the Fund and is not paid by the Fund for the services.
e. Investments in Affiliated Management Investment Companies
The Fund invests in one or more affiliated management investment companies for purposes other than exercising a controlling influence over the management or policies. Management fees paid by the Fund are waived on assets invested in the affiliated management investment companies, as noted in the Statement of Operations, in an amount not to exceed the management and administrative fees paid directly or indirectly by each affiliate. During the year ended December 31, 2018, the Fund held investments in affiliated management investment companies as follows:
| | | | | | | | | | | | | | | | | | | | | | | | | | | | | | | | |
| | | | | | | | |
| | | Number of Shares Held at Beginning
of Year | | | Gross Additions | | | Gross Reductions | | | Number
of Shares Held at End of Year | | | Value at End of Year | | | Investment
Income | | | Realized
Gain
(Loss) | | | Net Change in
Unrealized Appreciation (Depreciation) | |
| Non-Controlled Affiliates | | | | | | | | | | | | | | | | | | | | | | | | | | | | | | | | |
| | | | | | | | |
| | | | | | | | | | | | | | | | | | Dividends | | | | | | | |
Institutional Fiduciary Trust Money Market Portfolio, 1.99% | | | 351,784,455 | | | | 1,767,175,613 | | | | (1,961,766,894 | ) | | | 157,193,174 | | | $ | 157,193,174 | | | $ | 3,827,185 | | | $ | — | | | $ | — | |
| | | | | | | | |
| | | | | | | | | | | | | | | | | | Income from
securities
loaned | | | | | | | |
Institutional Fiduciary Trust Money Market Portfolio, 1.99% | | | 1,040,000 | | | | 105,498,000 | | | | (105,439,000 | ) | | | 1,099,000 | | | | 1,099,000 | | | | 127,105 | | | | — | | | | — | |
| | | | | | | | | | | | | | | | | | | | |
Total Affiliated Securities | | | . | | | | | | | | . | | | | | | | $ | 158,292,174 | | | $ | 3,954,290 | | | $ | — | | | $ | — | |
| | | | | | | | | | | | | | | | | | | | |
f. Other Affiliated Transactions
At December 31, 2018, Franklin Templeton Variable Insurance Products Trust - Franklin Founding Funds Allocation VIP Fund owned 5.1% of the Fund’s outstanding shares.
4. Expense Offset Arrangement
The Fund has entered into an arrangement with its custodian whereby credits realized as a result of uninvested cash balances are used to reduce a portion of the Fund’s custodian expenses. During the year ended December 31, 2018, the custodian fees were reduced as noted in the Statement of Operations.
5. Income Taxes
For tax purposes, capital losses may be carried over to offset future capital gains. Capital loss carryforwards with no expiration, if any, must be fully utilized before those losses with expiration dates.
FRANKLIN TEMPLETON VARIABLE INSURANCE PRODUCTS TRUST
NOTES TO FINANCIAL STATEMENTS
Franklin Income VIP Fund(continued)
During the year ended December 31, 2018, the Fund utilized $230,169,469 of capital loss carryforwards.
The tax character of distributions paid during the years ended December 31, 2018 and 2017, was as follows:
| | | | | | | | |
| | |
| | | 2018 | | | 2017 | |
Distributions paid from ordinary income | | $ | 276,822,065 | | | $ | 255,768,014 | |
| | | | |
At December 31, 2018, the cost of investments, net unrealized appreciation (depreciation), undistributed ordinary income and undistributed long term capital gains for income tax purposes were as follows:
| | | | |
Cost of investments | | $ | 5,094,918,384 | |
| | | | |
Unrealized appreciation | | $ | 387,537,001 | |
Unrealized depreciation | | | (520,906,576 | ) |
| | | | |
Net unrealized appreciation (depreciation) | | $ | (133,369,575 | ) |
| | | | |
Distributable earnings: | | | | |
Undistributed ordinary income | | $ | 268,406,913 | |
Undistributed long term capital gains | | | 80,908,172 | |
| | | | |
Total distributable earnings | | $ | 349,315,085 | |
| | | | |
Differences between income and/or capital gains as determined on a book basis and a tax basis are primarily due to differing treatments of bond discounts and premiums and equity-linked securities.
6. Investment Transactions
Purchases and sales of investments (excluding short term securities) for the year ended December 31, 2018, aggregated $2,339,321,168 and $2,745,193,123, respectively.
At December 31, 2018, in connection with securities lending transactions, the Fund loaned corporate bonds and received $1,374,043 of cash collateral. The gross amount of recognized liability for such transactions is included in payable upon return of securities loaned in the Statement of Assets and Liabilities. The agreements can be terminated at any time.
7. Credit Risk and Defaulted Securities
At December 31, 2018, the Fund had 35.6% of its portfolio invested in high yield, senior secured floating rate loans, or other securities rated below investment grade and unrated securities, if any. These securities may be more sensitive to economic conditions causing greater price volatility and are potentially subject to a greater risk of loss due to default than higher rated securities.
The Fund held defaulted securities and/or other securities for which the income has been deemed uncollectible. At December 31, 2018, the value of this security was $8,885,432, representing 0.2% of the Fund’s net assets. The Fund discontinues accruing income on securities for which income has been deemed uncollectible and provides an estimate for losses on interest receivable. The security has been identified in the accompanying Statement of Investments.
FRANKLIN TEMPLETON VARIABLE INSURANCE PRODUCTS TRUST
NOTES TO FINANCIAL STATEMENTS
Franklin Income VIP Fund(continued)
8. Other Derivative Information
For the year ended December 31, 2018, the effect of derivative contracts in the Fund’s Statement of Operations was as follows:
| | | | | | | | | | | | |
| | | | |
Derivative Contracts
Not Accounted for as Hedging Instruments | | Statement of Operations Location | | Net Realized
Gain (Loss) for
the Year | | | Statement of
Operations Location | | Net Change in
Unrealized
Appreciation
(Depreciation)
for the Year | |
| | Net realized gain (loss) from: | | | | | | Net change in unrealized | | | | |
| | | | | | | | appreciation (depreciation) on: | | | | |
Equity contracts | | Investments | | $ | (1,532,000 | )a | | Investments | | $ | 1,147,000 | a |
| | Written options | | | 3,958,115 | | | Written options | | | 575,894 | |
| | | | | | | | | | | | |
Totals | | | | $ | 2,426,115 | | | | | $ | 1,722,894 | |
| | | | | | | | | | | | |
aPurchased option contracts are included in net realized gain (loss) from investments and net change in unrealized appreciation (depreciation) on investments in the Statement of Operations.
For the year ended December 31, 2018, the average month end notional amount of options represented 582,154 shares.
See Note 1(e) regarding derivative financial instruments.
9. Credit Facility
The Fund, together with other U.S. registered and foreign investment funds (collectively, Borrowers), managed by Franklin Templeton, are borrowers in a joint syndicated senior unsecured credit facility totaling $2 billion (Global Credit Facility) which matured on February 8, 2019. This Global Credit Facility provides a source of funds to the Borrowers for temporary and emergency purposes, including the ability to meet future unanticipated or unusually large redemption requests. Effective February 8, 2019, the Borrowers renewed the Global Credit Facility for a one year term, maturing February 7, 2020, for a total of $2 billion.
Under the terms of the Global Credit Facility, the Fund shall, in addition to interest charged on any borrowings made by the Fund and other costs incurred by the Fund, pay its share of fees and expenses incurred in connection with the implementation and maintenance of the Global Credit Facility, based upon its relative share of the aggregate net assets of all of the Borrowers, including an annual commitment fee of 0.15% based upon the unused portion of the Global Credit Facility. These fees are reflected in other expenses in the Statement of Operations. During the year ended December 31, 2018, the Fund did not use the Global Credit Facility.
10. Fair Value Measurements
The Fund follows a fair value hierarchy that distinguishes between market data obtained from independent sources (observable inputs) and the Fund’s own market assumptions (unobservable inputs). These inputs are used in determining the value of the Fund’s financial instruments and are summarized in the following fair value hierarchy:
| | • | | Level 1 – quoted prices in active markets for identical financial instruments |
| | • | | Level 2 – other significant observable inputs (including quoted prices for similar financial instruments, interest rates, prepayment speed, credit risk, etc.) |
| | • | | Level 3 – significant unobservable inputs (including the Fund’s own assumptions in determining the fair value of financial instruments) |
The input levels are not necessarily an indication of the risk or liquidity associated with financial instruments at that level.
FRANKLIN TEMPLETON VARIABLE INSURANCE PRODUCTS TRUST
NOTES TO FINANCIAL STATEMENTS
Franklin Income VIP Fund(continued)
A summary of inputs used as of December 31, 2018, in valuing the Fund’s assets carried at fair value, is as follows:
| | | | | | | | | | | | | | | | |
| | | | |
| | | Level 1 | | | Level 2 | | | Level 3 | | | Total | |
| | | | |
| Assets: | | | | | | | | | | | | | | | | |
Investments in Securities:a | | | | | | | | | | | | | | | | |
Equity Investments:b | | | | | | | | | | | | | | | | |
Financials | | $ | 325,025,733 | | | $ | 10,093,750 | | | $ | — | | | $ | 335,119,483 | |
Industrials | | | 50,545,500 | | | | 8,596,495 | | | | — | | | | 59,141,995 | |
Materials | | | 84,532,300 | | | | 48,759,650 | | | | — | | | | 133,291,950 | |
All Other Equity Investments | | | 1,270,238,975 | | | | — | | | | — | | | | 1,270,238,975 | |
Equity-Linked Securities | | | — | | | | 448,607,670 | | | | — | | | | 448,607,670 | |
Index-Linked Notes | | | — | | | | 12,995,484 | | | | — | | | | 12,995,484 | |
Convertible Bonds | | | — | | | | 43,634,242 | | | | — | | | | 43,634,242 | |
Corporate Bonds | | | — | | | | 1,937,151,902 | | | | — | | | | 1,937,151,902 | |
Senior Floating Rate Interests | | | — | | | | 187,341,984 | | | | — | | | | 187,341,984 | |
U.S. Government and Agency Securities | | | — | | | | 375,457,907 | | | | — | | | | 375,457,907 | |
Escrows and Litigation Trusts | | | — | | | | — | | | | — | c | | | — | |
Short Term Investments | | | 158,292,174 | | | | 275,043 | | | | — | | | | 158,567,217 | |
| | | | |
Total Investments in Securities | | $ | 1,888,634,682 | | | $ | 3,072,914,127 | | | $ | — | | | $ | 4,961,548,809 | |
| | | | |
aFor detailed categories, see the accompanying Statement of Investments.
bIncludes common and convertible preferred stocks.
cIncludes securities determined to have no value at December 31, 2018.
A reconciliation of assets in which Level 3 inputs are used in determining fair value is presented when there are significant Level 3 financial instruments at the beginning and/or end of the year.
11. Subsequent Events
The Fund has evaluated subsequent events through the issuance of the financial statements and determined that no events have occurred that require disclosure other than those already disclosed in the financial statements.
Abbreviations
| | | | | | | | |
| | |
| Currency | | | | Selected Portfolio |
| | | | |
| EUR | | Euro | | | | ADR | | American Depositary Receipt |
| | | | |
| USD | | United States Dollar | | | | FNMA | | Federal National Mortgage Association |
| | | | |
| | | | | | FRN | | Floating Rate Note |
| | | | |
| | | | | | LIBOR | | London InterBank Offered Rate |
FRANKLIN TEMPLETON VARIABLE INSURANCE PRODUCTS TRUST
Report of Independent Registered Public Accounting Firm
To the Board of Trustees of Franklin Templeton Variable Insurance Products Trust and Shareholders of Franklin Income VIP Fund
Opinion on the Financial Statements
We have audited the accompanying statement of assets and liabilities, including the statement of investments, of Franklin Income VIP Fund (the “Fund”) as of December 31, 2018, the related statement of operations for the year ended December 31, 2018, the statement of changes in net assets for each of the two years in the period ended December 31, 2018, including the related notes, and the financial highlights for each of the five years in the period ended December 31, 2018 (collectively referred to as the “financial statements”). In our opinion, the financial statements present fairly, in all material respects, the financial position of the Fund as of December 31, 2018, the results of its operations for the year then ended, the changes in its net assets for each of the two years in the period ended December 31, 2018 and the financial highlights for each of the five years in the period ended December 31, 2018 in conformity with accounting principles generally accepted in the United States of America.
Basis for Opinion
These financial statements are the responsibility of the Fund’s management. Our responsibility is to express an opinion on the Fund’s financial statements based on our audits. We are a public accounting firm registered with the Public Company Accounting Oversight Board (United States) (PCAOB) and are required to be independent with respect to the Fund in accordance with the U.S. federal securities laws and the applicable rules and regulations of the Securities and Exchange Commission and the PCAOB.
We conducted our audits of these financial statements in accordance with the standards of the PCAOB. Those standards require that we plan and perform the audit to obtain reasonable assurance about whether the financial statements are free of material misstatement, whether due to error or fraud.
Our audits included performing procedures to assess the risks of material misstatement of the financial statements, whether due to error or fraud, and performing procedures that respond to those risks. Such procedures included examining, on a test basis, evidence regarding the amounts and disclosures in the financial statements. Our audits also included evaluating the accounting principles used and significant estimates made by management, as well as evaluating the overall presentation of the financial statements. Our procedures included confirmation of securities owned as of December 31, 2018 by correspondence with the custodian, transfer agent and brokers; when replies were not received from brokers, we performed other auditing procedures. We believe that our audits provide a reasonable basis for our opinion.
PricewaterhouseCoopers LLP
San Francisco, California
February 15, 2019
We have served as the auditor of one or more investment companies in the Franklin Templeton Group of Funds since 1948.
FRANKLIN TEMPLETON VARIABLE INSURANCE PRODUCTS TRUST
Tax Information (unaudited)
Franklin Income VIP Fund
Under Section 854(b)(1)(A) of the Internal Revenue Code, the Fund hereby reports 22.73% of the ordinary income dividends as income qualifying for the dividends received deduction for the fiscal year ended December 31, 2018.
This page intentionally left blank.
Franklin Large Cap Growth VIP Fund
This annual report for Franklin Large Cap Growth VIP Fund covers the fiscal year ended December 31, 2018.
Class 1 Performance Summary as of December 31, 2018
Average annual total return of Class 1 shares represents the average annual change in value, assuming reinvestment of dividends and capital gains. Average returns smooth out variations in returns, which can be significant; they are not the same asyear-by-year results.
| | | | | | | | | | | | |
| | | |
| Periods ended 12/31/18 | | 1-Year | | | 5-Year | | | 10-Year | |
Average Annual Total Return | | | -1.24% | | | | +8.32% | | | | +12.02% | |
Performance reflects the Fund’s Class 1 operating expenses, but doesnot include any contract fees, expenses or sales charges. If they had been included, performance would be lower. These charges and deductions, particularly for variable life policies, can have a significant effect on contract values and insurance benefits. See the contract prospectus for a complete description of these expenses, including sales charges.
Performance data represent past performance, which does not guarantee future results. Investment return and principal value will fluctuate, and you may have a gain or loss when you sell your shares. Current performance may differ from figures shown.
Total Return Index Comparison for a Hypothetical $10,000 Investment (1/1/09–12/31/18)
The graph below shows the change in value of a hypothetical $10,000 investment in the Fund over the indicated period and includes reinvestment of any income or distributions. The Fund’s performance is compared to the performance of the Standard & Poor’s® 500 Index (S&P 500®). One cannot invest directly in an index, and an index is not representative of the Fund’s portfolio.Please see Important Notes toPerformance Information preceding the Fund Summaries.
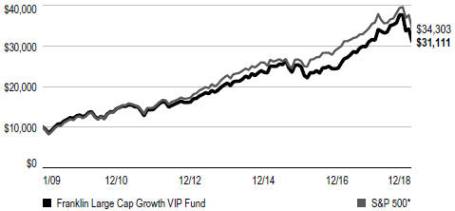
*Source: Morningstar. Please see Index Descriptions following the Fund Summaries.
FRANKLIN LARGE CAP GROWTH VIP FUND
Fund Goal and Main Investments
The Fund seeks capital appreciation. Under normal market conditions, the Fund invests at least 80% of its net assets in investments of large-capitalization companies. For this Fund, large-capitalization companies are those with market capitalization values within those of the top 50% of companies in the Russell 1000® Index at the time of purchase.1
Fund Risks
All investments involve risks, including possible loss of principal. Stock prices fluctuate, sometimes rapidly and dramatically, due to factors affecting individual companies, particular industries or sectors, or general market conditions. Growth stock prices reflect projections of future earnings or revenues, and can, therefore, fall dramatically if the company fails to meet those projections. The Fund may focus on particular sectors of the market from time to time, which can carry greater risks of adverse developments in such sectors. Investments in foreign securities may involve special risks including currency fluctuations and economic and political uncertainty. Smaller or midsized companies can be particularly sensitive to changing economic conditions, and their prospects for growth are less certain than those of larger, more established companies. The Fund is actively managed but there is no guarantee that the manager’s investment decisions will produce the desired results. The Fund’s prospectus also includes a description of the main investment risks.
Performance Overview
You can find the Fund’sone-year total return in the Performance Summary. In comparison, the Fund’s benchmark, the S&P 500, had a-4.38% total return.2
Economic and Market Overview
The U.S. economy grew during the 12 months under review. After moderating for three consecutive quarters, the economy grew faster in 2018’s second quarter, driven by consumer spending, business investment, exports and government spending. However, growth moderated in the third quarter due to declines in exports and housing investment. The manufacturing and services sectors expanded during the period. The unemployment rate declined from 4.1% in December 2017
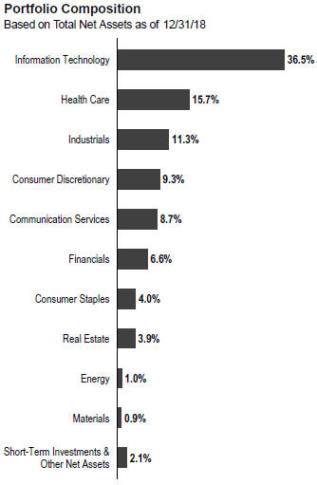
to 3.9% at period-end.3 Annual inflation, as measured by the Consumer Price Index, decreased from 2.1% in December 2017 to 1.9% at period-end.3
The U.S. Federal Reserve (Fed) raised its target range for the federal funds rate four times during the period, to 2.25%–2.50%, and continued to reduce its balance sheet as part of its ongoing plan to normalize monetary policy. At its December meeting, the Fed reduced the projected 2019 rate increases to two, compared to three projected previously.
U.S. equity markets overall declined during the period amid concerns about tighter regulation of technology companies, the pace of the Fed’s rate increases, U.S. political uncertainties, the Trump administration’s protectionist policies, and the potential impact of the U.S.-China trade dispute on U.S. and global
1. Please see Index Descriptions following the Fund Summaries.
2. Source: Morningstar.
One cannot invest directly in an index, and an index is not representative of the Fund’s portfolio. Please see Index Descriptions following the Fund Summaries.
3. Source: U.S. Bureau of Labor Statistics.
The dollar value, number of shares or principal amount, and names of all portfolio holdings are listed in the Fund’s Statement of Investments (SOI).
FRANKLIN LARGE CAP GROWTH VIP FUND
growth and corporate earnings. However, these concerns were partially alleviated by an overall easing of tensions in the Korean peninsula, ongoing trade negotiations between the U.S. and the European Union, and a new trade deal between the U.S., Mexico and Canada (pending ratification by the three countries’ legislatures), and intermittent U.S.-China trade negotiations, including a temporary truce that the two countries reached in December. Markets also benefited from mostly upbeat economic data, better U.S. corporate earnings, results of the U.S.mid-term elections and a potentially slower pace to the Fed’s rate increases. In this environment, the broad U.S. stock market, as measured by the S&P 500, reached a newall-time high in September 2018, but had a-4.38% total return for the12-month period.2
Investment Strategy
We are a research driven, fundamental investor, pursuing a growth strategy. As abottom-up investor focusing primarily on individual securities, we seek companies that have identifiable drivers of future earnings growth and that present, in our opinion, the besttrade-off between that potential earnings growth, business and financial risk, and valuation.
Manager’s Discussion
Looking back on the key factors affecting the Fund’s returns during the 12 months under review, we would like to remind shareholders that our investment strategy is primarilybottom-up and driven by individual stock selection. However, we recognize that a sector-based discussion can be a helpful way to organize a portfolio review of key performance drivers. We employed our long-held strategy:bottom-up, individual company, fundamental research aimed at opportunistically finding what we believed to be outstanding large-capitalization companies across all sectors, at valuations we believed understated their fair worth, with future growth potential being a key driver of estimated worth.
During the period under review, stock selection and an overweighting in the information technology (IT) sector contributed significantly to the Fund’s performance relative to the S&P 500. Stock selection and an underweighted allocation in financials also aided relative results, as did stock selection and an overweighting in the consumer discretionary sector.
Within the IT sector, our investments in payments technology company Mastercard, enterprise IT management software provider ServiceNow, payment services provider Visa, and digital marketing and media solutions provider Adobe benefited relative results. Mastercard continues to perform very well, exceeding expectations and announcing several growth
| | | | |
| Top 10 Holdings | |
| 12/31/18 | |
| |
Company Sector/Industry | | % of Total Net Assets | |
Amazon.com Inc. Consumer Discretionary | | | 7.4% | |
Mastercard Inc. Information Technology | | | 5.5% | |
Microsoft Corp. Information Technology | | | 5.2% | |
Visa Inc. Information Technology | | | 5.0% | |
Alphabet Inc. Communication Services | | | 4.2% | |
UnitedHealth Group Inc. Health Care | | | 3.0% | |
Apple Inc. Information Technology | | | 2.9% | |
SBA Communications Corp. Real Estate | | | 2.8% | |
ServiceNow Inc. Information Technology | | | 2.8% | |
Adobe Inc. Information Technology | | | 2.2% | |
initiatives and partnerships. The company has shown an ability to both invest for the long term while delivering solidquarter-to-quarter execution, which we believe is supported by a strong growth profile, specifically in Europe and total cross-border flows. Shares of ServiceNow rose amid better-than-expected earnings, revenue, operating margin, cash flow and billings, and higher revenue guidance. We believe ServiceNow is a high-qualitySoftware-as-a-Service company that is proving itself as a key partner in business and government enterprise initiatives to drive productivity through digital transformation, while also delivering excellent unit economics.
In the financials sector, online marketplace management company Intercontinental Exchange contributed to relative results.
In the consumer discretionary sector, Amazon.com’s shares rose as the company benefited from growth at its market-leading cloud business Amazon Web Services (AWS), as well as retail strength driven by advertising and its Prime service. The company expanded its profit margin and generated a healthy gross profit, due to slower growth in capital expenditures and solid growth of high-margin advertising, seller services and AWS.
In contrast, key detractors from the Fund’s relative performance included stock selection and an overweighted
FRANKLIN LARGE CAP GROWTH VIP FUND
allocation in the communication services sector, stock selection and an underweighted allocation in the health care sector, and a lack of exposure to the utilities sector.
Within the communication services sector, our position in social media company Facebook hindered relative results. Facebook’s share price faced pressure as a result of headlines and potential regulatory oversight associated with third-party use of data. Disappointing second-quarter 2018 results and forward guidance followed, driving more pressure and concerns. However, the outlook improved throughout the year. We have been monitoring the impact of these events on advertiser behavior and user engagement, while not losing sight of the broader opportunity that continues to exist for the company with Instagram and WhatsApp, as well as the continued migration of advertising dollars to online platforms.
In the health care sector, our positions in biopharmaceutical firm Celgene and medical devices company Nevro hurt relative results as their share prices declined during the period.
Other key individual detractors from relative performance included casino resorts operator Wynn Resorts (not held atperiod-end); beer, wine and spirits producer Constellation Brands; and education technology company 2U. Wynn Resorts’ shares fell amid slowing VIP trends in Macau, concerns about new competition and trade war risks, and a weak third-quarter convention calendar in Las Vegas with relatively weak leisure visitation. Constellation Brands’ share price declined after the company reported weaker-than-expected earnings results for its fiscal-year 2019’s first quarter (ended May 31, 2018), due to weaker gross margins related to supply chain inflation, higher marketing costs related to new product launches and a higher tax rate. However, the company reported better-than-expected earnings growth for its fiscal second quarter (ended August 31, 2018), driven by stronger beer revenue growth, operating profit growth and a favorable tax rate. We believe Constellation remains well positioned with a strong long-term growth profile, especially relative to its peers.
Thank you for your participation in Franklin Large Cap Growth VIP Fund. We look forward to serving your future investment needs.
The foregoing information reflects our analysis, opinions and portfolio holdings as of December 31, 2018, the end of the reporting period. The way we implement our main investment strategies and the resulting portfolio holdings may change depending on factors such as market and economic conditions. These opinions may not be relied upon as investment advice or an offer for a particular security. The information is not a complete analysis of every aspect of any market, country, industry, security or the Fund. Statements of fact are from sources considered reliable, but the investment manager makes no representation or warranty as to their completeness or accuracy. Although historical performance is no guarantee of future results, these insights may help you understand our investment management philosophy.
FRANKLIN LARGE CAP GROWTH VIP FUND
Class 1 Fund Expenses
As an investor in a variable insurance contract (Contract) that indirectly provides for investment in an underlying mutual fund, you can incur transaction and/or ongoing expenses at both the Fund level and the Contract Level: (1) transaction expenses can include sales charges (loads) on purchases, surrender fees, transfer fees and premium taxes; and (2) ongoing expenses can include management fees, distribution and service (12b-1) fees, contract fees, annual maintenance fees, mortality and expense risk fees and other fees and expenses. All mutual funds and Contracts have some types of ongoing expenses. The table below shows Fund-level ongoing expenses and can help you understand these costs and compare them with those of other mutual funds offered through the Contract. The table assumes a $1,000 investment held for the six months indicated. Please refer to the Fund prospectus for additional information on operating expenses.
Actual Fund Expenses
The table below provides information about the actual account values and actual expenses in the columns under the heading “Actual.” In these columns the Fund’s actual return, which includes the effect of ongoing Fund expenses but does not include the effect of ongoing Contract expenses, is used to calculate the “Ending Account Value.” You can estimate the Fund-level expenses you paid during the period by following these steps (of course, your account value and expenses will differ from those in thisillustration): Divide your account value by $1,000 (if your account had an $8,600 value, then $8,600 ÷ $1,000 = 8.6). Thenmultiply the result by the number under the headings “Actual” and “Fund-Level Expenses Paid During Period” (if Fund-LevelExpenses Paid During Period were $ 7.50, then 8.6 × $ 7.50 = $64.50). In this illustration, the estimated expenses paid this period atthe Fund level are $64.50.
Hypothetical Example for Comparison with Other Mutual Funds
Under the heading “Hypothetical” in the table, information is provided about hypothetical account values and hypothetical expenses based on the Fund’s actual expense ratio and an assumed rate of return of 5% per year before expenses, which is not the Fund’s actual return. This information may not be used to estimate the actual ending account balance or expenses you paid for the period, but it can help you compare ongoing costs of investing in the Fund with those of other mutual funds offered through the Contract. To do so, compare this 5% hypothetical example with the 5% hypothetical examples that appear in the shareholder reports of other funds offered through the Contract.
Please note that expenses shown in the table are meant to highlight ongoing costs at the Fund level only and do not reflect any ongoing expenses at the Contract level, or transaction expenses at either the Fund or Contract levels. In addition, while the Fund does not have transaction expenses, if the transaction and ongoing expenses at the Contract level were included, the expenses shown below would be higher. You should consult your Contract prospectus or disclosure document for more information.
| | | | | | | | | | | | | | | | | | | | | | | | | | |
| | | | | |
| | | | | | Actual (actual return after expenses) | | | | | Hypothetical (5% annual return before expenses) | | | Net | |
Share
Class | | Beginning Account Value 7/1/18 | | | Ending Account Value 12/31/18 | | | Fund-Level Expenses Paid During Period 7/1/18–12/31/181,2 | | | | | Ending Account Value 12/31/18 | | | Fund-Level Expenses Paid During Period 7/1/18–12/31/181,2 | | | Annualized Expense Ratio2 | |
Class 1 | | | $1,000 | | | | $881.10 | | | | $4.08 | | | | | | $1,020.87 | | | | $4.38 | | | | 0.86% | |
1. Expenses are equal to the annualized expense ratio for thesix-month period as indicated above — in the far right column — multiplied by the simple average account value over the period indicated, and then multiplied by 184/365 to reflect theone-half year period.
2. Reflects expenses after fee waivers and expense reimbursements. Does not include any ongoing expenses of the Contract for which the Fund is an investment option or acquired fund fees and expenses.
FRANKLIN TEMPLETON VARIABLE INSURANCE PRODUCTS TRUST
Financial Highlights
Franklin Large Cap Growth VIP Fund
| | | | | | | | | | | | | | | | | | | | |
| |
| | | Year Ended December 31, | |
| | | | | |
| | | 2018 | | | 2017 | | | 2016 | | | 2015 | | | 2014 | |
| Class 1 | | | | | | | | | | | | | | | | | | | | |
Per share operating performance (for a share outstanding throughout the year) | | | | | | | | | | | | | | | | | | | | |
| | | | | |
Net asset value, beginning of year | | | $20.93 | | | | $17.85 | | | | $18.42 | | | | $23.26 | | | | $20.91 | |
| | | | |
| | | | | |
| Income from investment operationsa: | | | | | | | | | | | | | | | | | | | | |
| | | | | |
Net investment income (loss)b | | | (0.04 | ) | | | (0.03 | ) | | | (0.04 | ) | | | (0.06 | ) | | | 0.11 | |
| | | | | |
Net realized and unrealized gains (losses) | | | 0.03 | | | | 4.91 | | | | (0.26 | ) | | | 1.56 | | | | 2.54 | |
| | | | |
Total from investment operations | | | (0.01 | ) | | | 4.88 | | | | (0.30 | ) | | | 1.50 | | | | 2.65 | |
| | | | |
| | | | | |
| Less distributions from: | | | | | | | | | | | | | | | | | | | | |
| | | | | |
Net investment income | | | — | | | | (0.20 | ) | | | — | | | | (0.13 | ) | | | (0.30 | ) |
| | | | | |
Net realized gains | | | (1.73 | ) | | | (1.60 | ) | | | (0.27 | ) | | | (6.21 | ) | | | — | |
| | | | |
Total distributions | | | (1.73 | ) | | | (1.80 | ) | | | (0.27 | ) | | | (6.34 | ) | | | (0.30 | ) |
| | | | |
Net asset value, end of year | | | $19.19 | | | | $20.93 | | | | $17.85 | | | | $18.42 | | | | $23.26 | |
| | | | |
| | | | | |
Total returnc | | | (1.24)% | | | | 28.38% | | | | (1.49)% | | | | 5.89% | | | | 12.74% | |
| | | | | |
| Ratios to average net assets | | | | | | | | | | | | | | | | | | | | |
| | | | | |
Expenses | | | 0.85% | d | | | 0.87% | d | | | 0.80% | d | | | 0.78% | | | | 0.79% | |
| | | | | |
Net investment income (loss) | | | (0.17)% | | | | (0.14)% | | | | (0.19)% | | | | (0.27)% | | | | 0.50% | |
| | | | | |
| Supplemental data | | | | | | | | | | | | | | | | | | | | |
| | | | | |
Net assets, end of year (000’s) | | | $1,040 | | | | $1,092 | | | | $883 | | | | $47,864 | | | | $54,971 | |
| | | | | |
Portfolio turnover rate | | | 21.93% | | | | 24.96% | | | | 36.26% | e | | | 23.23% | | | | 93.53% | |
aThe amount shown for a share outstanding throughout the period may not correlate with the Statement of Operations for the period due to the timing of sales and repurchases of the Fund’s shares in relation to income earned and/or fluctuating fair value of the investments of the Fund.
bBased on average daily shares outstanding.
cTotal return does not include fees, charges or expenses imposed by the variable annuity and life insurance contracts for which Franklin Templeton Variable Insurance Products Trust serves as an underlying investment vehicle.
dBenefit of expense reduction rounds to less than 0.01%.
eExcludes the value of portfolio securities delivered as a result of redemptionin-kind.
| | | | |
| | | |
| FLG-6 | | Annual Report | The accompanying notes are an integral part of these financial statements. | | |
FRANKLIN TEMPLETON VARIABLE INSURANCE PRODUCTS TRUST
FINANCIAL HIGHLIGHTS
Franklin Large Cap Growth VIP Fund(continued)
| | | | | | | | | | | | | | | | | | | | |
| |
| | | Year Ended December 31, | |
| | | | | |
| | | 2018 | | | 2017 | | | 2016 | | | 2015 | | | 2014 | |
| Class 2 | | | | | | | | | | | | | | | | | | | | |
Per share operating performance (for a share outstanding throughout the year) | | | | | | | | | | | | | | | | | | | | |
| | | | | |
Net asset value, beginning of year | | | $20.48 | | | | $17.48 | | | | $18.09 | | | | $22.94 | | | | $20.62 | |
| | | | |
| | | | | |
| Income from investment operationsa: | | | | | | | | | | | | | | | | | | | | |
| | | | | |
Net investment income (loss)b | | | (0.09 | ) | | | (0.08 | ) | | | (0.08 | ) | | | (0.11 | ) | | | 0.06 | |
| | | | | |
Net realized and unrealized gains (losses) | | | 0.04 | | | | 4.81 | | | | (0.26 | ) | | | 1.54 | | | | 2.50 | |
| | | | |
Total from investment operations | | | (0.05 | ) | | | 4.73 | | | | (0.34 | ) | | | 1.43 | | | | 2.56 | |
| | | | |
| | | | | |
| Less distributions from: | | | | | | | | | | | | | | | | | | | | |
| | | | | |
Net investment income | | | — | | | | (0.13 | ) | | | — | | | | (0.07 | ) | | | (0.24 | ) |
| | | | | |
Net realized gains | | | (1.73 | ) | | | (1.60 | ) | | | (0.27 | ) | | | (6.21 | ) | | | — | |
| | | | |
Total distributions | | | (1.73 | ) | | | (1.73 | ) | | | (0.27 | ) | | | (6.28 | ) | | | (0.24 | ) |
| | �� | | |
Net asset value, end of year | | | $18.70 | | | | $20.48 | | | | $17.48 | | | | $18.09 | | | | $22.94 | |
| | | | |
| | | | | |
Total returnc | | | (1.47)% | | | | 28.11% | | | | (1.79)% | | | | 5.62% | | | | 12.46% | |
| | | | | |
| Ratios to average net assets | | | | | | | | | | | | | | | | | | | | |
| | | | | |
Expenses | | | 1.10% | d | | | 1.12% | d | | | 1.05% | d | | | 1.03% | | | | 1.04% | |
| | | | | |
Net investment income (loss) | | | (0.42)% | | | | (0.39)% | | | | (0.44)% | | | | (0.52)% | | | | 0.25% | |
| | | | | |
| Supplemental data | | | | | | | | | | | | | | | | | | | | |
| | | | | |
Net assets, end of year (000’s) | | | $100,435 | | | | $118,875 | | | | $113,028 | | | | $223,807 | | | | $256,098 | |
| | | | | |
Portfolio turnover rate | | | 21.93% | | | | 24.96% | | | | 36.26% | e | | | 23.23% | | | | 93.53% | |
aThe amount shown for a share outstanding throughout the period may not correlate with the Statement of Operations for the period due to the timing of sales and repurchases of the Fund’s shares in relation to income earned and/or fluctuating fair value of the investments of the Fund.
bBased on average daily shares outstanding.
cTotal return does not include fees, charges or expenses imposed by the variable annuity and life insurance contracts for which Franklin Templeton Variable Insurance Products Trust serves as an underlying investment vehicle.
dBenefit of expense reduction rounds to less than 0.01%.
eExcludes the value of portfolio securities delivered as a result of redemptionin-kind.
| | | | | | |
| | | |
| | The accompanying notes are an integral part of these financial statements. | Annual Report | | | FLG-7 | |
FRANKLIN TEMPLETON VARIABLE INSURANCE PRODUCTS TRUST
Statement of Investments, December 31, 2018
| | | | | | | | | | |
| Franklin Large Cap Growth VIP Fund | |
| | | |
| | | | | Shares | | | Value | |
| | Common Stocks 97.9% | | | | | | | | |
| | Communication Services 8.7% | | | | | | | | |
| a | | Alphabet Inc., A | | | 3,499 | | | $ | 3,656,315 | |
| a | | Alphabet Inc., C | | | 578 | | | | 598,583 | |
| a | | Electronic Arts Inc. | | | 9,907 | | | | 781,761 | |
| a | | Facebook Inc., A | | | 8,039 | | | | 1,053,832 | |
| a | | Liberty Broadband Corp., C | | | 12,084 | | | | 870,411 | |
| a | | Netflix Inc. | | | 2,978 | | | | 797,091 | |
| | The Walt Disney Co. | | | 9,912 | | | | 1,086,851 | |
| | | | | | | | | | |
| | | | | | | | | 8,844,844 | |
| | | | | | | | | | |
| | Consumer Discretionary 9.3% | | | | | | | | |
| a | | Alibaba Group Holding Ltd., ADR (China) | | | 3,494 | | | | 478,922 | |
| a | | Amazon.com Inc. | | | 4,999 | | | | 7,508,348 | |
| | Aptiv PLC | | | 9,519 | | | | 586,085 | |
| a | | Booking Holdings Inc. | | | 497 | | | | 856,043 | |
| | | | | | | | | | |
| | | | | | | | | 9,429,398 | |
| | | | | | | | | | |
| | Consumer Staples 4.0% | | | | | | | | |
| | Constellation Brands Inc., A | | | 7,485 | | | | 1,203,738 | |
| | Lamb Weston Holdings Inc. | | | 18,753 | | | | 1,379,471 | |
| a | | Monster Beverage Corp. | | | 20,141 | | | | 991,340 | |
| a | | Nomad Foods Ltd. (United Kingdom) | | | 29,410 | | | | 491,735 | |
| | | | | | | | | | |
| | | | | | | | | 4,066,284 | |
| | | | | | | | | | |
| | Energy 1.0% | | | | | | | | |
| | Diamondback Energy Inc. | | | 10,689 | | | | 990,870 | |
| | | | | | | | | | |
| | | |
| | Financials 6.6% | | | | | | | | |
| a | | Athene Holding Ltd., A | | | 10,716 | | | | 426,818 | |
| | The Charles Schwab Corp. | | | 35,352 | | | | 1,468,169 | |
| | Intercontinental Exchange Inc. | | | 17,323 | | | | 1,304,942 | |
| | MarketAxess Holdings Inc. | | | 3,517 | | | | 743,177 | |
| | MSCI Inc. | | | 3,950 | | | | 582,348 | |
| | S&P Global Inc. | | | 6,507 | | | | 1,105,800 | |
| a | | SVB Financial Group | | | 5,322 | | | | 1,010,754 | |
| | | | | | | | | | |
| | | | | | | | | 6,642,008 | |
| | | | | | | | | | |
| | Health Care 15.7% | | | | | | | | |
| a | | ABIOMED Inc. | | | 3,984 | | | | 1,294,959 | |
| a | | Celgene Corp. | | | 7,473 | | | | 478,944 | |
| a | | Centene Corp. | | | 6,566 | | | | 757,060 | |
| a | | Edwards Lifesciences Corp. | | | 10,396 | | | | 1,592,355 | |
| a | | Elanco Animal Health Inc. | | | 11,960 | | | | 377,099 | |
| a | | Guardant Health Inc. | | | 8,825 | | | | 331,732 | |
| a | | Heron Therapeutics Inc. | | | 40,907 | | | | 1,061,128 | |
| a | | IDEXX Laboratories Inc. | | | 2,780 | | | | 517,136 | |
| a | | Illumina Inc. | | | 3,656 | | | | 1,096,544 | |
| a | | Intuitive Surgical Inc. | | | 1,600 | | | | 766,272 | |
| | Medtronic PLC | | | 11,375 | | | | 1,034,670 | |
| a | | Nevro Corp. | | | 15,030 | | | | 584,517 | |
| a | | PTC Therapeutics Inc. | | | 7,975 | | | | 273,702 | |
| a | | Sage Therapeutics Inc. | | | 4,026 | | | | 385,650 | |
| | UnitedHealth Group Inc. | | | 12,222 | | | | 3,044,745 | |
| a | | Veeva Systems Inc. | | | 10,085 | | | | 900,792 | |
FRANKLIN TEMPLETON VARIABLE INSURANCE PRODUCTS TRUST
STATEMENT OF INVESTMENTS
Franklin Large Cap Growth VIP Fund(continued)
| | | | | | | | | | |
| | | |
| | | | | Shares | | | Value | |
| | Common Stocks(continued) | | | | | | | | |
| | Health Care(continued) | | | | | | | | |
| | West Pharmaceutical Services Inc. | | | 14,590 | | | $ | 1,430,258 | |
| | | | | | | | | | |
| | | | | | | | | 15,927,563 | |
| | | | | | | | | | |
| | | |
| | Industrials 11.3% | | | | | | | | |
| | The Boeing Co. | | | 3,609 | | | | 1,163,902 | |
| a | | CoStar Group Inc. | | | 5,916 | | | | 1,995,703 | |
| | Honeywell International Inc. | | | 7,618 | | | | 1,006,490 | |
| a | | IHS Markit Ltd. | | | 21,246 | | | | 1,019,171 | |
| | Raytheon Co. | | | 12,537 | | | | 1,922,549 | |
| | Rockwell Automation Inc. | | | 5,089 | | | | 765,793 | |
| | Roper Technologies Inc. | | | 4,104 | | | | 1,093,798 | |
| | Stanley Black & Decker Inc. | | | 5,975 | | | | 715,447 | |
| a | | Univar Inc. | | | 28,839 | | | | 511,604 | |
| a | | Verisk Analytics Inc. | | | 11,820 | | | | 1,288,853 | |
| | | | | | | | | | |
| | | | | | | | | 11,483,310 | |
| | | | | | | | | | |
| | | |
| | Information Technology 36.5% | | | | | | | | |
| a | | 2U Inc. | | | 14,831 | | | | 737,397 | |
| a | | Adobe Inc. | | | 10,062 | | | | 2,276,427 | |
| | Analog Devices Inc. | | | 9,403 | | | | 807,059 | |
| | Apple Inc. | | | 18,514 | | | | 2,920,398 | |
| a | | Autodesk Inc. | | | 8,431 | | | | 1,084,311 | |
| a | | Elastic NV | | | 1,500 | | | | 107,220 | |
| a | | Fiserv Inc. | | | 13,549 | | | | 995,716 | |
| a | | Guidewire Software Inc. | | | 6,208 | | | | 498,068 | |
| a | | InterXion Holding NV (Netherlands) | | | 18,165 | | | | 983,816 | |
| | Mastercard Inc., A | | | 29,418 | | | | 5,549,706 | |
| | Microsoft Corp. | | | 52,083 | | | | 5,290,070 | |
| | Monolithic Power Systems | | | 7,356 | | | | 855,135 | |
| | NVIDIA Corp. | | | 7,129 | | | | 951,722 | |
| a | | PayPal Holdings Inc. | | | 14,981 | | | | 1,259,752 | |
| a | | Salesforce.com Inc. | | | 15,558 | | | | 2,130,979 | |
| a | | ServiceNow Inc. | | | 15,742 | | | | 2,802,863 | |
| a | | Twilio Inc., A | | | 9,326 | | | | 832,812 | |
| | Visa Inc., A | | | 38,738 | | | | 5,111,092 | |
| | Xilinx Inc. | | | 9,468 | | | | 806,390 | |
| a | | Zendesk Inc. | | | 18,091 | | | | 1,055,972 | |
| | | | | | | | | | |
| | | | | | | | | 37,056,905 | |
| | | | | | | | | | |
| | | |
| | Materials 0.9% | | | | | | | | |
| a | | Axalta Coating Systems Ltd. | | | 12,378 | | | | 289,893 | |
| a | | Ingevity Corp. | | | 7,924 | | | | 663,159 | |
| | | | | | | | | | |
| | | | | | | | | 953,052 | |
| | | | | | | | | | |
| | | Real Estate 3.9% | | | | | | |
| | American Tower Corp. | | | 6,830 | | | | 1,080,438 | |
| a | | SBA Communications Corp., A | | | 17,663 | | | | 2,859,463 | |
| | | | | | | | | | |
| | | | | | | | | 3,939,901 | |
| | | | | | | | | | |
| | | |
| | Total Common Stocks (Cost $59,601,416) | | | | | | | 99,334,135 | |
| | | | | | | | | | |
FRANKLIN TEMPLETON VARIABLE INSURANCE PRODUCTS TRUST
STATEMENT OF INVESTMENTS
Franklin Large Cap Growth VIP Fund(continued)
| | | | | | | | | | |
| | | |
| | | | | Principal Amount | | | Value | |
| | Short Term Investments (Cost $1,426,108) 1.4% | | | | | | | | |
| | | |
| | Repurchase Agreements 1.4% | | | | | | | | |
| b | | Joint Repurchase Agreement, 2.922%, 1/02/19 (Maturity Value $1,426,339) | | | | | | | | |
| | BNP Paribas Securities Corp. (Maturity Value $634,507)
Deutsche Bank Securities Inc. (Maturity Value $236,644)
HSBC Securities (USA) Inc. (Maturity Value $555,188) | | | | | | | | |
| | Collateralized by U.S. Government Agency Securities, 3.00% - 8.00%, 12/15/25 - 12/20/48;
cU.S. Treasury Bill, 1/17/19; and U.S. Treasury Notes, 1.25% - 3.50%, 5/31/19 - 9/30/20 (valued at $1,455,075) | | $ | 1,426,108 | | | $ | 1,426,108 | |
| | | | | | | | | | |
| | | |
| | Total Investments (Cost $61,027,524) 99.3% | | | | | | | 100,760,243 | |
| | | |
| | Other Assets, less Liabilities 0.7% | | | | | | | 715,432 | |
| | | | | | | | | | |
| | Net Assets 100.0% | | | | | | $ | 101,475,675 | |
| | | | | | | | | | |
See Abbreviations on page FLG-19.
aNon-income producing.
bSee Note 1(c) regarding joint repurchase agreement.
cThe security was issued on a discount basis with no stated coupon rate.
| | | | |
| | | |
| FLG-10 | | Annual Report | The accompanying notes are an integral part of these financial statements. | | |
FRANKLIN TEMPLETON VARIABLE INSURANCE PRODUCTS TRUST
Financial Statements
Statement of Assets and Liabilities
December 31, 2018
| | | | |
| |
| | | Franklin Large Cap Growth VIP Fund | |
Assets: | | | | |
Investments in securities: | | | | |
Cost - Unaffiliated issuers | | $ | 59,601,416 | |
Cost - Unaffiliated repurchase agreements | | | 1,426,108 | |
| | | | |
Value - Unaffiliated issuers | | $ | 99,334,135 | |
Value - Unaffiliated repurchase agreements | | | 1,426,108 | |
Receivables: | | | | |
Capital shares sold | | | 904,422 | |
Dividends | | | 31,369 | |
Other assets | | | 14 | |
| | | | |
Total assets | | | 101,696,048 | |
| | | | |
Liabilities: | | | | |
Payables: | | | | |
Capital shares redeemed | | | 34,395 | |
Management fees | | | 66,294 | |
Distribution fees | | | 44,397 | |
Reports to shareholders | | | 43,239 | |
Professional fees | | | 29,585 | |
Accrued expenses and other liabilities | | | 2,463 | |
| | | | |
Total liabilities | | | 220,373 | |
| | | | |
Net assets, at value | | $ | 101,475,675 | |
| | | | |
Net assets consist of: | | | | |
Paid-in capital | | $ | 47,220,025 | |
Total distributable earnings (loss) | | | 54,255,650 | |
| | | | |
Net assets, at value | | $ | 101,475,675 | |
| | | | |
| |
| Class 1: | | | | |
Net assets, at value | | $ | 1,040,205 | |
| | | | |
Shares outstanding | | | 54,202 | |
| | | | |
Net asset value and maximum offering price per share | | $ | 19.19 | |
| | | | |
| |
| Class 2: | | | | |
Net assets, at value | | $ | 100,435,470 | |
| | | | |
Shares outstanding | | | 5,371,589 | |
| | | | |
Net asset value and maximum offering price per share | | $ | 18.70 | |
| | | | |
| | | | | | |
| | | |
| | The accompanying notes are an integral part of these financial statements. | Annual Report | | | FLG-11 | |
FRANKLIN TEMPLETON VARIABLE INSURANCE PRODUCTS TRUST
FINANCIAL STATEMENTS
Statement of Operations
for the year ended December 31, 2018
| | | | |
| |
| | | Franklin Large Cap Growth VIP Fund | |
Investment income: | | | | |
Dividends: | | | | |
Unaffiliated issuers | | $ | 809,963 | |
Interest: | | | | |
Unaffiliated issuers | | | 20,266 | |
| | | | |
Total investment income | | | 830,229 | |
| | | | |
Expenses: | | | | |
Management fees (Note 3a) | | | 918,615 | |
Distribution fees: (Note 3c) | | | | |
Class 2 | | | 303,141 | |
Custodian fees (Note 4) | | | 1,528 | |
Reports to shareholders | | | 60,884 | |
Professional fees | | | 41,401 | |
Trustees’ fees and expenses | | | 887 | |
Other | | | 15,731 | |
| | | | |
Total expenses | | | 1,342,187 | |
Expense reductions (Note 4) | | | (140 | ) |
| | | | |
Net expenses | | | 1,342,047 | |
| | | | |
Net investment income (loss) | | | (511,818 | ) |
| | | | |
Realized and unrealized gains (losses): | | | | |
Net realized gain (loss) from: | | | | |
Investments | | | | |
Unaffiliated issuers | | | 14,549,978 | |
Foreign currency transactions | | | 279 | |
| | | | |
Net realized gain (loss) | | | 14,550,257 | |
| | | | |
Net change in unrealized appreciation (depreciation) on: | | | | |
Investments: | | | | |
Unaffiliated issuers | | | (13,910,632 | ) |
| | | | |
Net realized and unrealized gain (loss) | | | 639,625 | |
| | | | |
Net increase (decrease) in net assets resulting from operations | | $ | 127,807 | |
| | | | |
| | | | |
| | | |
| FLG-12 | | Annual Report | The accompanying notes are an integral part of these financial statements. | | |
FRANKLIN TEMPLETON VARIABLE INSURANCE PRODUCTS TRUST
FINANCIAL STATEMENTS
Statements of Changes in Net Assets
| | | | | | | | |
| |
| | | Franklin Large Cap Growth VIP Fund | |
| |
| | | Year Ended December 31, | |
| | |
| | | 2018 | | | 2017 | |
Increase (decrease) in net assets: | | | | | | | | |
Operations: | | | | | | | | |
Net investment income (loss) | | $ | (511,818 | ) | | $ | (473,904 | ) |
Net realized gain (loss) | | | 14,550,257 | | | | 10,317,956 | |
Net change in unrealized appreciation (depreciation) | | | (13,910,632 | ) | | | 20,237,623 | |
| | | | |
Net increase (decrease) in net assets resulting from operations | | | 127,807 | | | | 30,081,675 | |
| | | | |
Distributions to shareholders: (Note 1e) | | | | | | | | |
Class 1 | | | (89,524 | ) | | | (86,686 | ) |
Class 2 | | | (9,610,684 | ) | | | (10,356,597 | ) |
| | | | |
Total distributions to shareholders | | | (9,700,208 | ) | | | (10,443,283 | ) |
| | | | |
Capital share transactions: (Note 2) | | | | | | | | |
Class 1 | | | 44,632 | | | | 49,428 | |
Class 2 | | | (8,964,036 | ) | | | (13,631,397 | ) |
| | | | |
Total capital share transactions | | | (8,919,404 | ) | | | (13,581,969 | ) |
| | | | |
Net increase (decrease) in net assets | | | (18,491,805 | ) | | | 6,056,423 | |
Net assets: | | | | | | | | |
Beginning of year | | | 119,967,480 | | | | 113,911,057 | |
| | | | |
End of year (Note 1e) | | $ | 101,475,675 | | | $ | 119,967,480 | |
| | | | |
| | | | | | |
| | | |
| | The accompanying notes are an integral part of these financial statements. | Annual Report | | | FLG-13 | |
FRANKLIN TEMPLETON VARIABLE INSURANCE PRODUCTS TRUST
Notes to Financial Statements
Franklin Large Cap Growth VIP Fund
1. Organization and Significant Accounting Policies
Franklin Templeton Variable Insurance Products Trust (Trust) is registered under the Investment Company Act of 1940 (1940 Act) as anopen-end management investment company, consisting of eighteen separate funds and applies the specialized accounting and reporting guidance in U.S. Generally Accepted Accounting Principles (U.S. GAAP). Franklin Large Cap Growth VIP Fund (Fund) is included in this report. Shares of the Fund are generally sold only to insurance company separate accounts to fund the benefits of variable life insurance policies or variable annuity contracts. At December 31, 2018, 69.3% of the Fund’s shares were held through one insurance company. Investment activities of these insurance company separate accounts could have a material impact on the Fund. The Fund offers two classes of shares: Class 1 and Class 2. Each class of shares may differ by its distribution fees, voting rights on matters affecting a single class and its exchange privilege.
The following summarizes the Fund’s significant accounting policies.
a. Financial Instrument Valuation
The Fund’s investments in financial instruments are carried at fair value daily. Fair value is the price that would be received to sell an asset or paid to transfer a liability in an orderly transaction between market participants on the measurement date. The Fund calculates the net asset value (NAV) per share each business day as of 4 p.m. Eastern time or the regularly scheduled close of the New York Stock Exchange (NYSE), whichever is earlier. Under compliance policies and procedures approved by the Trust’s Board of Trustees (the Board), the Fund’s administrator has responsibility for oversight of valuation, including leading the cross-functional Valuation Committee (VC). The Fund may utilize independent pricing services, quotations from securities and financial instrument dealers, and other market sources to determine fair value.
Equity securities listed on an exchange or on the NASDAQ National Market System are valued at the last quoted sale price or the official closing price of the day, respectively. Foreign equity securities are valued as of the close of trading on the foreign stock exchange on which the security is primarily traded, or as of 4 p.m. Eastern time. The value is then converted into its U.S. dollar equivalent at the foreign exchange rate in effect at 4 p.m. Eastern time on the day that the value of the security is determined.Over-the-counter (OTC) securities are
valued within the range of the most recent quoted bid and ask prices. Securities that trade in multiple markets or on multiple exchanges are valued according to the broadest and most representative market. Certain equity securities are valued based upon fundamental characteristics or relationships to similar securities.
Investments in repurchase agreements are valued at cost, which approximates fair value.
The Fund has procedures to determine the fair value of financial instruments for which market prices are not reliable or readily available. Under these procedures, the Fund primarily employs a market-based approach which may use related or comparable assets or liabilities, recent transactions, market multiples, book values, and other relevant information for the investment to determine the fair value of the investment. An income-based valuation approach may also be used in which the anticipated future cash flows of the investment are discounted to calculate fair value. Discounts may also be applied due to the nature or duration of any restrictions on the disposition of the investments. Due to the inherent uncertainty of valuations of such investments, the fair values may differ significantly from the values that would have been used had an active market existed.
Trading in securities on foreign securities stock exchanges and OTC markets may be completed before 4 p.m. Eastern time. In addition, trading in certain foreign markets may not take place on every Fund’s business day. Occasionally, events occur between the time at which trading in a foreign security is completed and 4 p.m. Eastern time that might call into question the reliability of the value of a portfolio security held by the Fund. As a result, differences may arise between the value of the Fund’s portfolio securities as determined at the foreign market close and the latest indications of value at 4 p.m. Eastern time. In order to minimize the potential for these differences, the VC monitors price movements following the close of trading in foreign stock markets through a series of country specific market proxies (such as baskets of American Depositary Receipts, futures contracts and exchange traded funds). These price movements are measured against established trigger thresholds for each specific market proxy to assist in determining if an event has occurred that may call into question the reliability of the values of the foreign securities held by the Fund. If such an event occurs, the securities may be valued using fair value procedures, which may include the use of independent pricing services.
FRANKLIN TEMPLETON VARIABLE INSURANCE PRODUCTS TRUST
NOTES TO FINANCIAL STATEMENTS
Franklin Large Cap Growth VIP Fund(continued)
When the last day of the reporting period is anon-business day, certain foreign markets may be open on those days that the Fund’s NAV is not calculated, which could result in differences between the value of the Fund’s portfolio securities on the last business day and the last calendar day of the reporting period. Any significant security valuation changes due to an open foreign market are adjusted and reflected by the Fund for financial reporting purposes.
b. Foreign Currency Translation
Portfolio securities and other assets and liabilities denominated in foreign currencies are translated into U.S. dollars based on the exchange rate of such currencies against U.S. dollars on the date of valuation. The Fund may enter into foreign currency exchange contracts to facilitate transactions denominated in a foreign currency. Purchases and sales of securities, income and expense items denominated in foreign currencies are translated into U.S. dollars at the exchange rate in effect on the transaction date. Portfolio securities and assets and liabilities denominated in foreign currencies contain risks that those currencies will decline in value relative to the U.S. dollar. Occasionally, events may impact the availability or reliability of foreign exchange rates used to convert the U.S. dollar equivalent value. If such an event occurs, the foreign exchange rate will be valued at fair value using procedures established and approved by the Board.
The Fund does not separately report the effect of changes in foreign exchange rates from changes in market prices on securities held. Such changes are included in net realized and unrealized gain or loss from investments in the Statement of Operations.
Realized foreign exchange gains or losses arise from sales of foreign currencies, currency gains or losses realized between the trade and settlement dates on securities transactions and the difference between the recorded amounts of dividends, interest, and foreign withholding taxes and the U.S. dollar equivalent of the amounts actually received or paid. Net unrealized foreign exchange gains and losses arise from changes in foreign exchange rates on foreign denominated assets and liabilities other than investments in securities held at the end of the reporting period.
c. Joint Repurchase Agreement
The Fund enters into a joint repurchase agreement whereby its uninvested cash balance is deposited into a joint cash account with other funds managed by the investment manager or an
affiliate of the investment manager and is used to invest in one or more repurchase agreements. The value and face amount of the joint repurchase agreement are allocated to the funds based on theirpro-rata interest. A repurchase agreement is accounted for as a loan by the Fund to the seller, collateralized by securities which are delivered to the Fund’s custodian. The fair value, including accrued interest, of the initial collateralization is required to be at least 102% of the dollar amount invested by the funds, with the value of the underlying securities marked to market daily to maintain coverage of at least 100%. Repurchase agreements are subject to the terms of Master Repurchase Agreements (MRAs) with approved counterparties (sellers). The MRAs contain various provisions, including but not limited to events of default and maintenance of collateral for repurchase agreements. In the event of default by either the seller or the Fund, certain MRAs may permit thenon-defaulting party to net andclose-out all transactions, if any, traded under such agreements. The Fund may sell securities it holds as collateral and apply the proceeds towards the repurchase price and any other amounts owed by the seller to the Fund in the event of default by the seller. This could involve costs or delays in addition to a loss on the securities if their value falls below the repurchase price owed by the seller. The joint repurchase agreement held by the Fund at year end, as indicated in the Statement of Investments, had been entered into on December 31, 2018.
d. Income and Deferred Taxes
It is the Fund’s policy to qualify as a regulated investment company under the Internal Revenue Code. The Fund intends to distribute to shareholders substantially all of its taxable income and net realized gains to relieve it from federal income and if applicable, excise taxes. As a result, no provision for U.S. federal income taxes is required.
The Fund may be subject to foreign taxation related to income received, capital gains on the sale of securities and certain foreign currency transactions in the foreign jurisdictions in which it invests. Foreign taxes, if any, are recorded based on the tax regulations and rates that exist in the foreign markets in which the Fund invests. When a capital gain tax is determined to apply, the Fund records an estimated deferred tax liability in an amount that would be payable if the securities were disposed of on the valuation date.
FRANKLIN TEMPLETON VARIABLE INSURANCE PRODUCTS TRUST
NOTES TO FINANCIAL STATEMENTS
Franklin Large Cap Growth VIP Fund(continued)
1. Organization and Significant Accounting Policies(continued)
d. Income and Deferred Taxes(continued)
The Fund may recognize an income tax liability related to its uncertain tax positions under U.S. GAAP when the uncertain tax position has a less than 50% probability that it will be sustained upon examination by the tax authorities based on its technical merits. As of December 31, 2018, the Fund has determined that no tax liability is required in its financial statements related to uncertain tax positions for any open tax years (or expected to be taken in future tax years). Open tax years are those that remain subject to examination and are based on the statute of limitations in each jurisdiction in which the Fund invests.
e. Security Transactions, Investment Income, Expenses and Distributions
Security transactions are accounted for on trade date. Realized gains and losses on security transactions are determined on a specific identification basis. Interest income and estimated expenses are accrued daily. Dividend income is recorded on the ex-dividend date except for certain dividends from securities where the dividend rate is not available. In such cases, the dividend is recorded as soon as the information is received by the Fund. Distributions to shareholders are recorded on the ex-dividend date. Distributable earnings are determined according to income tax regulations (tax basis) and may differ from earnings recorded in accordance with U.S. GAAP. These differences may be permanent or temporary. Permanent differences are reclassified among capital accounts to reflect their tax character. These reclassifications have no impact on net assets or the results of operations. Temporary differences are not reclassified, as they may reverse in subsequent periods.*
Common expenses incurred by the Trust are allocated among the Funds based on the ratio of net assets of each Fund to the combined net assets of the Trust or based on the ratio of number of shareholders of each Fund to the combined number of shareholders of the Trust. Fund specific expenses are charged directly to the Fund that incurred the expense.
Realized and unrealized gains and losses and net investment income, excluding class specific expenses, are allocated daily to each class of shares based upon the relative proportion of net assets of each class. Differences in per share distributions by class are generally due to differences in class specific expenses.
f. Accounting Estimates
The preparation of financial statements in accordance with U.S. GAAP requires management to make estimates and assumptions that affect the reported amounts of assets and liabilities at the date of the financial statements and the amounts of income and expenses during the reporting period. Actual results could differ from those estimates.
g. Guarantees and Indemnifications
Under the Trust’s organizational documents, its officers and trustees are indemnified by the Trust against certain liabilities arising out of the performance of their duties to the Trust. Additionally, in the normal course of business, the Trust, on behalf of the Fund, enters into contracts with service providers that contain general indemnification clauses. The Trust’s maximum exposure under these arrangements is unknown as this would involve future claims that may be made against the Trust that have not yet occurred. Currently, the Trust expects the risk of loss to be remote.
*Effective during the current reporting period, it is no longer required to present certain line items in the Statements of Changes in Net Assets. The below prior period amounts affected by this change are shown as they were in the prior year Statements of Changes in Net Assets.
For the year ended December 31, 2017, distributions to shareholders were as follows:
| | |
Distributions from net investment income: | | |
Class 1 | | $ (9,601) |
Class 2 | | (751,572) |
Distributions from net realized gains: | | |
Class 1 | | (77,085) |
Class 2 | | (9,605,025) |
FRANKLIN TEMPLETON VARIABLE INSURANCE PRODUCTS TRUST
NOTES TO FINANCIAL STATEMENTS
Franklin Large Cap Growth VIP Fund(continued)
2. Shares of Beneficial Interest
At December 31, 2018, there were an unlimited number of shares authorized (without par value). Transactions in the Fund’s shares were as follows:
| | | | | | | | | | | | | | | | | | | | |
| |
| | | Year Ended December 31, | |
| | | |
| | | 2018 | | | | | | 2017 | |
| | | | | |
| | | Shares | | | Amount | | | | | | Shares | | | Amount | |
| | | | | |
| Class 1 Shares: | | | | | | | | | | | | | | | | | | | | |
Shares issued in reinvestment of distributions | | | 3,993 | | | $ | 89,524 | | | | | | | | 4,592 | | | $ | 86,686 | |
Shares redeemed | | | (1,981 | ) | | | (44,892 | ) | | | | | | | (1,833 | ) | | | (37,258 | ) |
| | | | |
Net increase (decrease) | | | 2,012 | | | $ | 44,632 | | | | | | | | 2,759 | | | $ | 49,428 | |
| | | | |
| | | | | |
| Class 2 Shares: | | | | | | | | | | | | | | | | | | | | |
Shares sold | | | 542,097 | | | $ | 11,784,792 | | | | | | | | 325,624 | | | $ | 6,237,303 | |
Shares issued in reinvestment of distributions | | | 439,446 | | | | 9,610,684 | | | | | | | | 559,816 | | | | 10,356,597 | |
Shares redeemed | | | (1,413,745 | ) | | | (30,359,512 | ) | | | | | | | (1,547,426 | ) | | | (30,225,297 | ) |
| | | | |
Net increase (decrease) | | | (432,202 | ) | | $ | (8,964,036 | ) | | | | | | | (661,986 | ) | | $ | (13,631,397 | ) |
| | | | |
3. Transactions with Affiliates
Franklin Resources, Inc. is the holding company for various subsidiaries that together are referred to as Franklin Templeton. Certain officers and trustees of the Fund are also officers and/or directors of the following subsidiaries:
| | |
| |
| Subsidiary | | Affiliation |
Franklin Advisers, Inc. (Advisers) | | Investment manager |
Franklin Templeton Services, LLC (FT Services) | | Administrative manager |
Franklin Templeton Distributors, Inc. (Distributors) | | Principal underwriter |
Franklin Templeton Investor Services, LLC (Investor Services) | | Transfer agent |
a. Management Fees
The Fund pays an investment management fee to Advisers based on the average daily net assets of the Fund as follows:
| | | | |
| | |
| Annualized Fee Rate | | | | Net Assets |
0.750% | | | | Up to and including $500 million |
0.625% | | | | Over $500 million, up to and including $1 billion |
0.500% | | | | In excess of $1 billion |
b. Administrative Fees
Under an agreement with Advisers, FT Services provides administrative services to the Fund. The fee is paid by Advisers based on the Fund’s average daily net assets, and is not an additional expense of the Fund.
c. Distribution Fees
The Board has adopted a distribution plan for Class 2 shares pursuant to Rule 12b-1 under the 1940 Act. Under the Fund’s compensation distribution plan, the Fund pays Distributors for costs incurred in connection with the servicing, sale and distribution of the Fund’s shares up to 0.35% per year of its average daily net assets. The Board has agreed to limit the current rate to 0.25% per year for Class 2. The plan year, for purposes of monitoring compliance with the maximum annual plan rate, is February 1 through January 31.
FRANKLIN TEMPLETON VARIABLE INSURANCE PRODUCTS TRUST
NOTES TO FINANCIAL STATEMENTS
Franklin Large Cap Growth VIP Fund(continued)
3. Transactions with Affiliates(continued)
d. Transfer Agent Fees
Investor Services, under terms of an agreement, performs shareholder servicing for the Fund and is not paid by the Fund for the services.
e. Interfund Transactions
The Fund engaged in purchases and sales of investments with funds or other accounts that have common investment managers (or affiliated investment managers), directors, trustees or officers. During the year ended December 31, 2018, these purchase and sale transactions aggregated $93,292 and $0, respectively.
4. Expense Offset Arrangement
The Fund has entered into an arrangement with its custodian whereby credits realized as a result of uninvested cash balances are used to reduce a portion of the Fund’s custodian expenses. During the year ended December 31, 2018, the custodian fees were reduced as noted in the Statement of Operations.
5. Income Taxes
The tax character of distributions paid during the years ended December 31, 2018 and 2017, was as follows:
| | | | | | | | |
| | |
| | | 2018 | | | 2017 | |
Distributions paid from: | | | | | | | | |
Ordinary income | | $ | 292,435 | | | $ | 761,173 | |
Long term capital gain | | | 9,407,773 | | | | 9,682,110 | |
| | | | |
| | $ | 9,700,208 | | | $ | 10,443,283 | |
| | | | |
At December 31, 2018, the cost of investments, net unrealized appreciation (depreciation) and undistributed long term capital gains for income tax purposes were as follows:
| | | | |
Cost of investments | | $ | 61,066,348 | |
| | | | |
Unrealized appreciation | | $ | 42,883,498 | |
Unrealized depreciation | | | (3,189,603 | ) |
| | | | |
Net unrealized appreciation (depreciation) | | $ | 39,693,895 | |
| | | | |
Distributable earnings: | | | | |
Undistributed long term capital gains | | $ | 14,561,754 | |
| | | | |
Differences between income and/or capital gains as determined on a book basis and a tax basis are primarily due to differing treatment of wash sales.
6. Investment Transactions
Purchases and sales of investments (excluding short term securities) for the year ended December 31, 2018, aggregated $26,444,332 and $46,872,163, respectively.
FRANKLIN TEMPLETON VARIABLE INSURANCE PRODUCTS TRUST
NOTES TO FINANCIAL STATEMENTS
Franklin Large Cap Growth VIP Fund(continued)
7. Credit Facility
The Fund together with other U.S. registered and foreign investment funds (collectively, Borrowers), managed by Franklin Templeton, are borrowers in a joint syndicated senior unsecured credit facility totaling $2 billion (Global Credit Facility) which matured on February 8, 2019. This Global Credit Facility provides a source of funds to the Borrowers for temporary and emergency purposes, including the ability to meet future unanticipated or unusually large redemption requests. Effective February 8, 2019, the Borrowers renewed the Global Credit Facility for a one year term, maturing February 7, 2020, for a total of $2 billion.
Under the terms of the Global Credit Facility, the Fund shall, in addition to interest charged on any borrowings made by the Fund and other costs incurred by the Fund, pay its share of fees and expenses incurred in connection with the implementation and maintenance of the Global Credit Facility, based upon its relative share of the aggregate net assets of all of the Borrowers, including an annual commitment fee of 0.15% based upon the unused portion of the Global Credit Facility. These fees are reflected in other expenses in the Statement of Operations. During the year ended December 31, 2018, the Fund did not use the Global Credit Facility.
8. Fair Value Measurements
The Fund follows a fair value hierarchy that distinguishes between market data obtained from independent sources (observable inputs) and the Fund’s own market assumptions (unobservable inputs). These inputs are used in determining the value of the Fund’s financial instruments and are summarized in the following fair value hierarchy:
| | • | | Level 1 – quoted prices in active markets for identical financial instruments |
| | • | | Level 2 – other significant observable inputs (including quoted prices for similar financial instruments, interest rates, prepayment speed, credit risk, etc.) |
| | • | | Level 3 – significant unobservable inputs (including the Fund’s own assumptions in determining the fair value of financial instruments) |
The input levels are not necessarily an indication of the risk or liquidity associated with financial instruments at that level.
A summary of inputs used as of December 31, 2018, in valuing the Fund’s assets carried at fair value, is as follows:
| | | | | | | | | | | | | | | | |
| | | | |
| | | Level 1 | | | Level 2 | | | Level 3 | | | Total | |
| | | | |
| Assets: | | | | | | | | | | | | | | | | |
Investments in Securities:a | | | | | | | | | | | | | | | | |
Equity Investments | | $ | 99,334,135 | | | $ | — | | | $ | — | | | $ | 99,334,135 | |
Short Term Investments | | | — | | | | 1,426,108 | | | | — | | | | 1,426,108 | |
| | | | |
Total Investments in Securities | | $ | 99,334,135 | | | $ | 1,426,108 | | | $ | — | | | $ | 100,760,243 | |
| | | | |
aFor detailed categories, see the accompanying Statement of Investments.
9. Subsequent Events
The Fund has evaluated subsequent events through the issuance of the financial statements and determined that no events have occurred that require disclosure other than those already disclosed in the financial statements.
Abbreviations
| | |
|
| Selected Portfolio |
| |
| ADR | | American Depositary Receipt |
FRANKLIN TEMPLETON VARIABLE INSURANCE PRODUCTS TRUST
Report of Independent Registered Public Accounting Firm
To the Board of Trustees of Franklin Templeton Variable Insurance Products Trust and Shareholders of Franklin Large Cap Growth VIP Fund
Opinion on the Financial Statements
We have audited the accompanying statement of assets and liabilities, including the statement of investments, of Franklin Large Cap Growth VIP Fund (the “Fund”) as of December 31, 2018, the related statement of operations for the year ended December 31, 2018, the statement of changes in net assets for each of the two years in the period ended December 31, 2018, including the related notes, and the financial highlights for each of the five years in the period ended December 31, 2018 (collectively referred to as the “financial statements”). In our opinion, the financial statements present fairly, in all material respects, the financial position of the Fund as of December 31, 2018, the results of its operations for the year then ended, the changes in its net assets for each of the two years in the period ended December 31, 2018 and the financial highlights for each of the five years in the period ended December 31, 2018 in conformity with accounting principles generally accepted in the United States of America.
Basis for Opinion
These financial statements are the responsibility of the Fund’s management. Our responsibility is to express an opinion on the Fund’s financial statements based on our audits. We are a public accounting firm registered with the Public Company Accounting Oversight Board (United States) (PCAOB) and are required to be independent with respect to the Fund in accordance with the U.S. federal securities laws and the applicable rules and regulations of the Securities and Exchange Commission and the PCAOB.
We conducted our audits of these financial statements in accordance with the standards of the PCAOB. Those standards require that we plan and perform the audit to obtain reasonable assurance about whether the financial statements are free of material misstatement, whether due to error or fraud.
Our audits included performing procedures to assess the risks of material misstatement of the financial statements, whether due to error or fraud, and performing procedures that respond to those risks. Such procedures included examining, on a test basis, evidence regarding the amounts and disclosures in the financial statements. Our audits also included evaluating the accounting principles used and significant estimates made by management, as well as evaluating the overall presentation of the financial statements. Our procedures included confirmation of securities owned as of December 31, 2018 by correspondence with the custodian. We believe that our audits provide a reasonable basis for our opinion.
PricewaterhouseCoopers LLP
San Francisco, California
February 15, 2019
We have served as the auditor of one or more investment companies in the Franklin Templeton Group of Funds since 1948.
FRANKLIN TEMPLETON VARIABLE INSURANCE PRODUCTS TRUST
Tax Information (unaudited)
Franklin Large Cap Growth VIP Fund
Under Section 852(b)(3)(C) of the Internal Revenue Code, the Fund hereby reports the maximum amount allowable but no less than $9,407,773 as a long term capital gain dividend for the fiscal year ended December 31, 2018.
Under Section 854(b)(1)(A) of the Internal Revenue Code, the Fund hereby reports 100.00% of the ordinary income dividends as income qualifying for the dividends received deduction for the fiscal year ended December 31, 2018.
This page intentionally left blank.
Franklin Mutual Global Discovery VIP Fund
This annual report for Franklin Mutual Global Discovery VIP Fund covers the fiscal year ended December 31, 2018.
Class 1 Performance Summary as of December 31, 2018
Average annual total return of Class 1 shares* represents the average annual change in value, assuming reinvestment of dividends and capital gains. Average returns smooth out variations in returns, which can be significant; they are not the same asyear-by-year results.
| | | | | | | | | | | | |
| | | |
| Periods ended 12/31/18 | | 1-Year | | | 5-Year | | | 10-Year | |
Average Annual Total Return | | | -11.01% | | | | +2.21% | | | | +8.15% | |
*The Fund has a fee waiver associated with any investment it makes in a Franklin Templeton money fund and/or other Franklin Templeton fund, contractually guaranteed through 4/30/19. Fund investment results reflect the fee waiver; without this waiver, the results would have been lower.
Performance reflects the Fund’s Class 1 operating expenses, but doesnotinclude any contract fees, expenses or sales charges. If they had been included, performance would be lower. These charges and deductions, particularly for variable life policies, can have a significant effect on contract values and insurance benefits. See the contract prospectus for a complete description of these expenses, including sales charges.
Performance data represent past performance, which does not guarantee future results. Investment return and principal value will fluctuate, and you may have a gain or loss when you sell your shares. Current performance may differ from figures shown.
Total Return Index Comparison for a Hypothetical $10,000 Investment (1/1/09–12/31/18)
The graph below shows the change in value of a hypothetical $10,000 investment in the Fund over the indicated period and includes reinvestment of any income or distributions. The Fund’s performance* is compared to the performance of the MSCI World Index and the Standard & Poor’s® 500 Index (S&P 500®). One cannot invest directly in an index, and an index is not representative of the Fund’s portfolio.Please seeImportant Notes to Performance Information preceding the Fund Summaries.
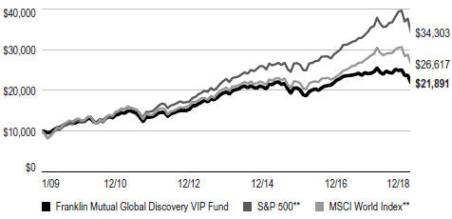
**Source: Morningstar. Please see Index Descriptions following the Fund Summaries.
FRANKLIN MUTUAL GLOBAL DISCOVERY VIP FUND
Fund Goal and Main Investments
The Fund seeks capital appreciation. Under normal market conditions, the Fund invests primarily in U.S. and foreign equity securities that the investment manager believes are available at market prices less than their intrinsic value. The equity securities in which the Fund invests are primarily common stock. To a lesser extent, the Fund also invests in merger arbitrage securities and the debt and equity of distressed companies. The Fund may invest substantially and potentially up to 100% of its assets in foreign securities, which may include sovereign debt and participations in foreign government debt.
Fund Risks
All investments involve risks, including possible loss of principal. Value securities may not increase in price as anticipated, or may decline further in value. The Fund’s investments in foreign securities involve certain risks including currency fluctuations, and economic and political uncertainties. Because the Fund may invest at least a significant portion of its assets in companies in a specific region, including Europe, the Fund is subject to greater risks of adverse developments in that region and/or the surrounding regions than a fund that is more broadly diversified geographically. Securities issued by smaller and midsize companies may be more volatile in price than those of larger companies, involve substantial risks and should be considered speculative. Derivatives involve costs and can create economic leverage in the Fund’s portfolio which may result in significant volatility and cause the Fund to participate in losses (as well as gains) in an amount that exceeds the Fund’s initial investment. The Fund’s investments in companies engaged in mergers, reorganizations or liquidations also involve special risks as pending deals may not be completed on time or on favorable terms. The Fund may invest in lower rated bonds, which entail higher credit risk. The Fund is actively managed but there is no guarantee that the manager’s investment decisions will produce the desired results. The Fund’s prospectus also includes a description of the main investment risks.
Performance Overview
You can find the Fund’sone-year total return in the
Performance Summary. In comparison, the Fund’s benchmark,

*Figures are stated as a percentage of total and may not equal 100% or may be negative due to rounding, use of any derivatives, unsettled trades or other factors.
the S&P 500, had a-4.38% total return and the MSCI World Index had a-8.20% total return for the same period.1
Economic and Market Overview
The global economy expanded during the 12 months under review, despite weakness in certain regions. Global developed and emerging market stocks were aided at certain points during the period by higher crude oil prices, upbeat economic data, easing trade tensions and encouraging corporate earnings reports, as well as indications of a slower pace of interest-rate increases from the U.S. Federal Reserve (Fed).
However, various factors weighed on global markets during the period, including concerns about tighter regulation of technology companies, political uncertainties in the U.S. and the European Union, and major central banks’ interest-rate path and unwinding of monetary stimulus measures. Markets were further pressured by U.S. trade disputes with its allies and China, and their impact on global growth and corporate
.
1. Source: Morningstar.
One cannot invest directly in an index, and an index is not representative of the Fund’s portfolio. Please see Index Descriptions following the Fund Summaries
The dollar value, number of shares or principal amount, and names of all portfolio holdings are listed in the Fund’s Statement of Investments (SOI).
FRANKLIN MUTUAL GLOBAL DISCOVERY VIP FUND
earnings. In this environment, global stocks, as measured by the MSCI All Country World Index, had a-8.93% total return for the 12 months ended December 31, 2018.1
The U.S. economy grew during the12-month period. After moderating for three consecutive quarters, the economy grew faster in 2018’s second quarter, driven by consumer spending, business investment, exports and government spending. However, growth moderated in the third quarter due to declines in exports and housing investment. The unemployment rate declined from 4.1% in December 2017 to 3.9% at period-end.2 Annual inflation, as measured by the Consumer Price Index, decreased from 2.1% in December 2017 to 1.9% at period-end.2 The Fed raised its target range for the federal funds rate four times during the period, to 2.25%–2.50%, and continued reducing its balance sheet as part of an ongoing plan to normalize monetary policy. At its December meeting, the Fed reduced the projected 2019 rate increases to two, compared to three projected previously.
In Europe, the U.K.’s quarterly economic growth moderated in 2018’s first quarter, but accelerated in 2018’s second and third quarters. The Bank of England raised its key policy rate once during the review period. After moderating in 2018’s first quarter, the eurozone’s quarterly growth remained stable in the second quarter, but eased in the third quarter. The bloc’s annual inflation rate ended the period higher than in December 2017. The European Central Bank (ECB) kept its benchmark interest rate unchanged during the period. In December 2018, the ECB confirmed its plan to conclude its bond purchase program at the end of 2018 and reiterated it expects key interest rates to remain unchanged through the summer of 2019.
In Asia, Japan’s quarterly gross domestic product (GDP) grew in 2018’s second quarter, following a contraction in the first quarter, but contracted again in the third quarter. The Bank of Japan left its benchmark interest rate unchanged during the period and continued its monetary stimulus measures.
In emerging markets, Brazil’s quarterly GDP growth remained stable in 2018’s first and second quarters, but accelerated in the third quarter. The Central Bank of Brazil lowered its benchmark interest rate twice during the period. Russia’s annual GDP growth rate accelerated in 2018’s first and second quarters, but moderated in the third quarter. After lowering its key rate twice early in the period, the Bank of Russia raised it twice in the period’s second half to curtail inflation risks. China’s annual GDP grew at a stable rate in 2018’s first
quarter, but it moderated in the second and third quarters. The People’s Bank of China left its benchmark interest rate unchanged during the period, but it took measures to improve financial liquidity to mitigate the negative effects of the U.S.-China trade dispute and support economic growth. Overall, emerging market stocks, as measured by the MSCI Emerging Markets Index, had a-14.25% total return during the period.1
Investment Strategy
At Franklin Mutual Advisors, we are committed to our distinctive value approach to investing. Our major investment strategy is investing in undervalued stocks. When selecting undervalued equities, we are attracted to what we believe are fundamentally strong companies with healthy balance sheets, high-quality assets, substantial free cash flow and shareholder-oriented management teams and whose stocks are trading at discounts to our assessment of the companies’ intrinsic or business value. We also look for asset-rich companies whose shares may be trading at depressed levels due to concerns over short-term earnings disappointments, litigation, management strategy or other perceived negatives. While the vast majority of our undervalued equity investments are made in publicly traded companies globally, we may invest occasionally in privately held companies as well.
We complement this more traditional investment strategy with two others. One is distressed investing, which is complex and can take many forms. The most common distressed investment the Fund undertakes is the purchase of financially troubled or bankrupt companies’ debt at a substantial discount to face value. After the financially distressed company is reorganized, often in bankruptcy court, the old debt is typically replaced with new securities issued by the financially stronger company.
The other piece of our investment strategy is participating in arbitrage situations, another highly specialized field. When companies announce proposed mergers or takeovers, commonly referred to as “deals,” the target company may trade at a discount to the bid it ultimately accepts. One form of arbitrage involves purchasing the target company’s stock when it is trading below the value we believe it would receive in a deal. In keeping with our commitment to a relatively conservative investment approach, we typically focus our arbitrage efforts on announced deals, and eschew rumored deals or other situations we consider relatively risky.
2. Source: U.S. Bureau of Labor Statistics.
FRANKLIN MUTUAL GLOBAL DISCOVERY VIP FUND
In addition, it is our practice to hedge the Fund’s currency exposure when we deem it advantageous for our shareholders.
What is meant by “hedge”?
To hedge an investment is to take a position intended to offset potential losses/gains that may be incurred by a companion financial instrument.
Manager’s Discussion
In 2018, corporate profits in the U.S. and other developed markets continued their impressive year-over-year growth. In addition, labor markets showed further improvement, consumer spending was solid, and U.S. corporate tax reforms encouraged companies to buy back more stock, raise dividends and increase capital expenditures. Those positive fundamentals were periodically overshadowed by political and economic concerns, particularly in the final three months of the year.
As major U.S. equity markets established newall-time highs in 2018, overall U.S. equity market valuations (e.g.,price-to-earnings,price-to-book orprice-to-sales) became increasingly unattractive, in our analysis. The equity marketsell-off in the fourth-quarter helped to return valuations to more reasonable levels. Thesell-off and rise in volatility yielded an opportunity for us to seek out stocks with strong corporate fundamentals and valuations whose risk/reward profiles seemed to us to have become more favorable.
In 2019, policy events may have considerable influence, for better or worse, on economic growth, investor sentiment and financial market performance and volatility. Markets are likely to be particularly sensitive to developments in U.S.-China trade relations, monetary policy moves by the U.S. Federal Reserve and other major central banks, oil production decisions by OPEC (The Organization of the Petroleum Exporting Countries) and other oil producing countries, the outcome of Brexit, China’s response to its slowing economy and potential political discord in Washington, D.C.
Europe’s equity market overall was trading at an attractively lowerprice-to-earnings multiple and higher dividend yield than the U.S. equity market atperiod-end. We also saw an increase in investor activism, which we viewed as encouraging. However, those favorable factors were offset in part by economic data, which showed a greater degree of deceleration in activity across the region. From an investment standpoint, we are hopeful that 2019 will be a year of potential resolution and clarity. The biggest political event will likely be Brexit, as a resolution to the situation remained unclear as ofperiod-end. The uncertainty around the terms and timing of a deal
Top 10 Sectors/Industries
12/31/18
| | | | |
| | | % of Total Net Assets | |
| Banks | | | 11.8% | |
| Oil, Gas & Consumable Fuels | | | 9.8% | |
| Insurance | | | 9.5% | |
| Pharmaceuticals | | | 9.4% | |
| Health Care Equipment & Supplies | | | 4.2% | |
| Technology Hardware, Storage & Peripherals | | | 3.4% | |
| Software | | | 3.4% | |
| Media | | | 3.3% | |
| Automobiles | | | 2.9% | |
| Tobacco | | | 2.8% | |
continued to undermine consumer and corporate confidence. From our perspective, we believe the European Union and the U.K. will ultimately reach an agreement that makes sense for both sides, and we believe the approval of such an agreement would likely have a significantly positive effect on investor, consumer and corporate sentiment in the U.K. We will also pay close attention to structural reform efforts in France and the political transition in Germany. In December, Chancellor Angela Merkel stepped down as leader of the Christian Democratic Union but stated her intention to remain in office for the remaining three years of her term as Chancellor.
In Asia, economic and financial market weakness in China has been brought on by multiple factors. The U.S.-China trade conflict has disrupted manufacturing activity and supply chains. As trade tensions escalated in 2018, manufacturers accelerated production in order to avoid upcoming tariffs. Atyear-end, supply chains were filled with inventory, while manufacturing activity was weak. Entering 2019, the near-term question is how long the inventory overhang will last, while the more significant question is to what extent the trade conflict will alter supply chains in the medium to long term. Amid the trade conflict, China has proven resolute in its attempt to dampen the reliance on leverage, which has weighed on economic activity as well. While the government has enacted some stimulus measures, such as tax cuts, they may be less impactful than prior stimulus through fiscal spending. Meanwhile, government social policies impacting personal freedoms have had a negative effect on consumer sentiment.
Investment Spotlight
In all market environments, we seek to invest prudently in securities that we believe represent good value. We do this by seeking securities that trade at a discount to our intrinsic value estimate, taking into account the quality of the asset, the
FRANKLIN MUTUAL GLOBAL DISCOVERY VIP FUND
sustainability of returns, and the growth potential of the business. We also believe the potential to deliver the best risk-adjusted return over a full market cycle requires us to be focused on applying our cross-asset approach: owning equities and debt—in certain cases multiple securities across the capital structure of a company—across geographies and sectors with an emphasis on corporate actions as catalysts. Our health care sector positions are a good example of our investment process. They have been carefully selected over a number of years, and in 2018, many of our long-standing sector investments appreciated meaningfully. Collectively our sector exposure outperformed the health care sector within the MSCI World Index.3
Within the health care sector, our investment process has generally been focused on finding innovative companies that are market leaders and that invest substantial amounts of capital into research and development (R&D) as a means to sustain and grow market positions. In addition, many of our positions have been in diversified pharmaceutical companies that also have long-duration cash flows through their leading positions in animal health, vaccine, andover-the-counter medicine businesses. These businesses can offer downside protection in years when pharmaceutical R&D is less successful or in years when important products lose patent protection. These businesses are attractive and have been undervalued by the market. This undervaluation allowed us to build positions, and in 2018, some of this undervaluation was reversed.
Eli Lilly and Merck are quintessential examples of our investment process. They are leading innovation-driven pharmaceutical companies that invest substantial amounts of capital into R&D to develop transformative medicines. Both companies have introduced innovative new products in the past many years like Trulicity for diabetes and Keytruda for oncology that we believe will continue to offer substantial long-term revenue growth. The management teams at both companies take a long-term view and focus on enhancing their market positions through both internal and external innovation. Acquiring late stage innovation can be expensive, which is why Lilly and Merck take a prudent approach to generally focusing on early stage assets. Competition is typically less intense for early stage assets, and they can add value through their own development process and pass along that value to shareholders. Shareholder focus also comes through at both companies
through their return of excess capital to shareholders through large dividends and share buybacks.
In our view, both companies also have strong, long-duration assets. Lilly and Merck are the fourth and third largest players in animal health, respectively. In September 2018, Lilly sold some Elanco4 shares to the public in order to create additional shareholder value, while Merck started providing segment level profit disclosures so investors could better appreciate the contribution and value of their animal health business. Merck is also the second largest player in vaccines, a highly attractive business that is underappreciated, in our opinion.
Another common feature between Lilly and Merck is their strong balance sheets. Both companies also generate substantial amounts of free cash flows, with a significant proportion returned to shareholders in the form of dividends and share buybacks. In addition, the two companies are focused on managing their business more efficiently and improving their operating margins, which we believe will lead to additional earnings growth over the next several years.
Mergers and Acquisitions
In health care and elsewhere, merger and acquisition (M&A) activity remained healthy in 2018. The market received some clarity regarding the regulatory environment when a federal judge ruled in favor of AT&T and Time Warner5, and against the U.S. Department of Justice, in its antitrust lawsuit. However, economic, financial market and geopolitical uncertainty that arose in the second half of the year caused the pace of activity to slow. In our view, it was notable that health care has become one of the busier sectors for M&A as it is relatively more insulated from economic uncertainty. The strength and path of M&A activity in 2019 will likely depend in large part on how the uncertainties carrying over from 2018 play out and how they affect equity markets. From our experience, changes in equity market performance and deal activity have tended to move in a similar direction.
Credit Markets
Finding mispriced risk in credit markets was challenging in 2018. Low interest rates kept credit widely available, default rates remained at historically low levels and we continued to witness a deterioration in debt covenant terms, which include restrictions on financial activities by the borrower or parameters for specific financial metrics. Liberal interpretations
3. Please see Index Descriptions following the Fund Summaries.
4. Not a Fund holding.
5. Not held atperiod-end.
FRANKLIN MUTUAL GLOBAL DISCOVERY VIP FUND
of credit agreements and bond indentures in order to shift valuable assets beyond the reach of creditors were an ongoing challenge. In such an environment, we found more opportunities investing in short-term mispriced risk rather than long-term restructurings.
However, we are hopeful that more opportunities may emerge in 2019, especially if we are starting to enter latter stages of the business cycle. U.S. monetary policy is becoming less accommodative, economic growth appears to be downshifting into a slower pace, earnings growth is set to slow, and geopolitical uncertainty is on the rise. These dynamics have already contributed to a general rise in financial market volatility. At the same time, the amount of lower-rated investment-grade credit stands at a historically high level on an absolute basis and relative to corporate debt markets overall. We believe default rates and the pace of corporate downgrades could begin to pick up in 2019. As a result, 2019 could bring a rise in fallen-angel opportunities (bonds downgraded from investment-grade to junk status) and idiosyncratic opportunities inout-of-favor industries. We will continue to look for opportunities across the capital structures of companies with liquidity-enhancing events, such as asset sales, the ability to issue secured debt within existing agreements, and free-cash flow that could buy time for a company to weather its financial storm.
Fund Performance
Turning to Fund performance, top contributors included U.S.-based pharmaceutical company Eli Lilly, global research-driven pharmaceutical company Merck and U.K.-basedpay-TV provider Sky5.
Shares of Eli Lilly were boosted in large part by a series of strong quarterly results during 2018. Attractive corporate fundamentals and fewer investor concerns regarding the direct impact on the pharmaceutical industry from the Trump administration’s efforts to lower prescription drug prices helped push the stock higher. We believe Eli Lilly continues to have a strong product growth story and room for further margin expansion, in addition to having solid research and development capabilities.
Merck is a global research-driven pharmaceutical company with strong market positions in oncology, diabetes, vaccines and animal health. Investors remained upbeat about its future prospects, particularly its Keytruda oncology drug. Merck released clinical trial results, which showed that for the first-line treatment of metastatic nonsquamousnon-small lung cancer patients, Keytruda combined with chemotherapy substantially extended survival of patients compared with
Top 10 Holdings
12/31/18
| | | | |
| |
Company Sector/Industry, Country | | % of Total
Net Assets | |
Medtronic PLC
Health Care Equipment & Supplies, U.S. | | | 3.2% | |
Novartis AG Pharmaceuticals, Switzerland | | | 3.2% | |
The Walt Disney Co. Entertainment, U.S. | | | 2.8% | |
GlaxoSmithKline PLC Pharmaceuticals, U.K. | | | 2.4% | |
Royal Dutch Shell PLC Oil, Gas & Consumable Fuels, U.K. | | | 2.3% | |
NN Group NV Insurance, Netherlands | | | 2.2% | |
Eli Lilly & Co. Pharmaceuticals, U.S. | | | 2.2% | |
Enel SpA Electric Utilities, Italy | | | 2.1% | |
Merck & Co. Inc. Pharmaceuticals, U.S. | | | 2.0% | |
British American Tobacco PLC Tobacco, U.K. | | | 1.8% | |
chemotherapy alone. The Keytruda results set a high bar for competition and appeared to enhance Keytruda’s prospects to gain share in the sizeable market for lung cancer treatment. Results from a competitor, Bristol-Myers Squibb4, were less compelling in a different clinical trial in lung cancer. In October 2018, Merck raised its dividend and authorized a new large share buyback plan.
In February 2018, shares of Sky jumped when U.S.-based cable company Comcast4 made a surprise bid for the company. The Comcast bid was considerably higher than a prior bid by Twenty-First Century Fox4, which already owned a substantial portion of Sky. In July 2018, Twenty-First Century Fox raised its bid for Sky, but Comcast promptly offered a highercounter-bid. The stock rose again in September 2018 when The Panel on Takeovers and Mergers in the U.K. announced that Comcast had won the mandatory auction for Sky, and Twenty-First Century Fox subsequently agreed to sell its stake of Sky to Comcast. The acquisition of Sky was officially completed in October 2018.
During the period under review, Fund investments that detracted from performance included U.K.-based British American Tobacco, U.S.-based industrials company General Electric (GE) and U.S.-based bank Citizens Financial Group.
Shares of British American Tobacco faced downward pressure due to potential additional U.S. regulation and concerns
FRANKLIN MUTUAL GLOBAL DISCOVERY VIP FUND
regarding next generation products. In March 2018, the U.S. Food and Drug Administration (FDA) issued an Advance Notice of Proposed Rulemaking, which started the process of examining the possibility of regulating nicotine levels in combustible cigarettes. The process may not result in regulation, but if it does, many experts believe the review could take seven to 10 years. Meanwhile, JUUL, produced by JUUL Labs4, has emerged as a populare-cigarette for young consumers in the U.S. It is unclear to what degree JUUL is cannibalizing the combustible market, but it has hurt investor sentiment toward the industry. In November, shares of British American Tobacco and industry peers dropped, as the FDA revisited the possibility of banning menthol as a flavor in cigarettes, which would take years with many steps to complete, and in our opinion, an FDA proposal would face litigation from the industry. Industry experts have suggested that it might not survive legal challenges.
GE is a multi-industrial company with a diverse set of businesses in power generation, health care and aviation. During 2018, the stock suffered a number of setbacks starting in January with a greater-than-expected charge related to long-term care policies in its insurance subsidiary. In June, the stock was removed from the Dow Jones Index and in September, GE stated that fan blades in some of its power-plant turbines were experiencing oxidation problems. In October, S&P Global Ratings, a bond rating agency, cut GE’s debt rating, while GE cut its dividend and stated that the Securities and Exchange Commission was expanding an ongoing investigation to include an accounting write-down related to its power-generation division. Amid the negative events in 2018, management took the first steps in what amounts to a breakup of GE, announcing in May 2018 the merger of its transportation operations into Wabtec4 and plans tospin-off its health care division and divest its stake inoil-services firm Baker Hughes. In October 2018, GE unexpectedly replaced chief executive officer (CEO) John Flannery, who spent his entire career at GE, with Larry Culp, a former CEO of Danaher4, an industrial company. We believe Culp made some prudent initial moves, and that his plan to reduce debt and strengthen GE’s balance sheet is a step in the right direction to restoring investor confidence in the company.
Citizens Financial Group is a regional bank focused on the Northeastern U.S. The stock slipped in the second half of the year due to fears of slowing global economic activity negatively affecting the U.S. economy, leading to lower U.S. interest rates, rising credit costs and slower revenue and earnings growth for the industry. In addition, the U.S. Treasury yield curve flattened and inverted in the latter stages of the year
and credit spreads widened. On a long-term basis, we believe Citizens remains well positioned to continue driving improved results through a combination of capital deployment, balance sheet optimization and cost controls.
During the period, the Fund held currency forwards and futures seeking to hedge most of the currency risk of the portfolio’snon-U.S. dollar investments. The hedges had a positive overall impact on the Fund’s performance because of the appreciation of the U.S. dollar versus the hedged currencies.
What is a currency forward?
A currency forward is a direct agreement between the Fund and a counterparty to buy or sell a foreign currency in exchange for another currency at a specific exchange rate on a future date.
What is a future?
A future is an agreement between the Fund and a counterparty made through a U.S. or foreign futures exchange to buy or sell an underlying instrument or asset at a specific price on a future date.
Thank you for your participation in Franklin Mutual Global Discovery VIP Fund. We look forward to serving your future investment needs.
The foregoing information reflects our analysis, opinions and portfolio holdings as of December 31, 2018, the end of the reporting period. The way we implement our main investment strategies and the resulting portfolio holdings may change depending on factors such as market and economic conditions. These opinions may not be relied upon as investment advice or an offer for a particular security. The information is not a complete analysis of every aspect of any market, country, industry, security or the Fund. Statements of fact are from sources considered reliable, but the investment manager makes no representation or warranty as to their completeness or accuracy. Although historical performance is no guarantee of future results, these insights may help you understand our investment management philosophy.
FRANKLIN MUTUAL GLOBAL DISCOVERY VIP FUND
Class 1 Fund Expenses
As an investor in a variable insurance contract (Contract) that indirectly provides for investment in an underlying mutual fund, you can incur transaction and/or ongoing expenses at both the Fund level and the Contract Level: (1) transaction expenses can include sales charges (loads) on purchases, surrender fees, transfer fees and premium taxes; and (2) ongoing expenses can include management fees, distribution and service (12b-1) fees, contract fees, annual maintenance fees, mortality and expense risk fees and other fees and expenses. All mutual funds and Contracts have some types of ongoing expenses. The table below shows Fund-level ongoing expenses and can help you understand these costs and compare them with those of other mutual funds offered through the Contract. The table assumes a $1,000 investment held for the six months indicated. Please refer to the Fund prospectus for additional information on operating expenses.
Actual Fund Expenses
The table below provides information about the actual account values and actual expenses in the columns under the heading “Actual.” In these columns the Fund’s actual return, which includes the effect of ongoing Fund expenses but does not include the effect of ongoing Contract expenses, is used to calculate the “Ending Account Value.” You can estimate the Fund-level expenses you paid during the period by following these steps (ofcourse, your account value and expenses will differ from those in this illustration):Divide your account value by $1,000 (ifyour account had an $8,600 value, then $8,600 ÷ $1,000 = 8.6). Then multiply the result by the number under the headings “Actual” and “Fund-Level Expenses Paid During Period” (ifFund-Level Expenses Paid During Period were $ 7.50, then 8.6 × $7.50 = $64.50). In this illustration, the estimated expenses paid this period at the Fund level are $64.50.
Hypothetical Example for Comparison with Other Mutual Funds
Under the heading “Hypothetical” in the table, information is provided about hypothetical account values and hypothetical expenses based on the Fund’s actual expense ratio and an assumed rate of return of 5% per year before expenses, which is not the Fund’s actual return. This information may not be used to estimate the actual ending account balance or expenses you paid for the period, but it can help you compare ongoing costs of investing in the Fund with those of other mutual funds offered through the Contract. To do so, compare this 5% hypothetical example with the 5% hypothetical examples that appear in the shareholder reports of other funds offered through the Contract.
Please note that expenses shown in the table are meant to highlight ongoing costs at the Fund level only and do not reflect any ongoing expenses at the Contract level, or transaction expenses at either the Fund or Contract levels. In addition, while the Fund does not have transaction expenses, if the transaction and ongoing expenses at the Contract level were included, the expenses shown below would be higher. You should consult your Contract prospectus or disclosure document for more information.
| | | | | | | | | | | | | | | | | | | | | | | | | | | | |
| | | | | | Actual (actual return after expenses) | | | | | | Hypothetical
(5% annual return before expenses) | | | | |
| | | | | | | |
Share Class | | Beginning Account
Value 7/1/18 | | | Ending Account
Value 12/31/18 | | | Fund-Level Expenses Paid During Period
7/1/18–12/31/181,2 | | | | | | Ending Account
Value 12/31/18 | | | Fund-Level Expenses Paid During Period
7/1/18–12/31/181,2 | | | Net
Annualized
Expense
Ratio2 | |
Class 1 | | | $1,000 | | | | $902.30 | | | | $4.46 | | | | | | | | $1,020.52 | | | | $4.74 | | | | 0.93% | |
1. Expenses are equal to the annualized expense ratio for thesix-month period as indicated above — in the far right column — multiplied by the simple average account value over the period indicated, and then multiplied by 184/365 to reflect theone-half year period.
2. Reflects expenses after fee waivers and expense reimbursements. Does not include any ongoing expenses of the Contract for which the Fund is an investment option or acquired fund fees and expenses.
MGD P1 05/18
SUPPLEMENT DATED MAY 1, 2018
TO THE PROSPECTUSES DATED MAY 1, 2018
OF
FRANKLIN TEMPLETON VARIABLE INSURANCE PRODUCTS TRUST
FRANKLIN MUTUAL GLOBAL DISCOVERY VIP FUND
Effective May 1, 2018, the prospectuses are amended as follows:
I. The “Fund Summary – Annual Fund Operating Expenses” table on pageMGD-S1 in the Franklin Mutual Global Discovery VIP Fund’s Class 1 prospectus is replaced with the following:
Annual Fund Operating Expenses
(expenses that you pay each year as a percentage of the value of your investment)
| | | | |
| | | Class 1 | |
| Management fees1 | | | 0.88% | |
| Distribution and service (12b-1) fees | | | None | |
| Other expenses | | | 0.07% | |
| Acquired fund fees and expenses2 | | | 0.01% | |
| Total annual Fund operating expenses1,2 | | | 0.96% | |
| 1. | Management fees in the table above have been restated to reflect a reduction in the management fee of the Fund effective on May 1, 2018. Consequently, the total annual Fund operating expenses differ from the ratio of expenses to average net assets shown in the Financial Highlights due to a different management fee rate paid in the Fund’s most recent fiscal year. If the management fees had not been restated, management fees would have been 0.94% and the Total annual Fund operating expenses would have been 1.02%. |
| 2. | Total annual Fund operating expenses differ from the ratio of expenses to average net assets shown in the Financial Highlights, which reflect the operating expenses of the Fund and do not include acquired fund fees and expenses. |
II. The “Fund Summary – Example” table on pageMGD-S1 in the Franklin Mutual Global Discovery VIP Fund’s Class 1 prospectus is replaced with the following:
| | | | | | | | |
| | | 1 Year | | 3 Years | | 5 Years | | 10 Years |
| Class 1 | | $ 98 | | $ 306 | | $ 531 | | $ 1,178 |
III. The “Fund Summary – Annual Fund Operating Expenses” table on pageMGD-S1 in the Franklin Mutual Global Discovery VIP Fund’s Class 2 prospectus is replaced with the following:
Annual Fund Operating Expenses
(expenses that you pay each year as a percentage of the value of your investment)
| | | | |
| | | Class 2 | |
| Management fees1 | | | 0.88% | |
| Distribution and service (12b-1) fees | | | 0.25% | |
| Other expenses | | | 0.07% | |
| Acquired fund fees and expenses2 | | | 0.01% | |
| Total annual Fund operating expenses1,2 | | | 1.21% | |
| 1. | Management fees in the table above have been restated to reflect a reduction in the management fee of the Fund effective on May 1, 2018. Consequently, the total annual Fund operating expenses differ from the ratio of expenses to average net assets shown in the Financial Highlights due to a different management fee rate paid in the Fund’s most recent fiscal year. If the management fees had not been restated, management fees would have been 0.94% and the Total annual Fund operating expenses would have been 1.27%. |
| 2. | Total annual Fund operating expenses differ from the ratio of expenses to average net assets shown in the Financial Highlights, which reflect the operating expenses of the Fund and do not include acquired fund fees and expenses. |
IV. The “Fund Summary – Example” table on pageMGD-S1 in the Franklin Mutual Global Discovery VIP Fund’s Class 2 prospectus is replaced with the following:
| | | | | | | | |
| | | 1 Year | | 3 Years | | 5 Years | | 10 Years |
| Class 2 | | $ 123 | | $ 384 | | $ 665 | | $ 1,466 |
V. The “Fund Summary – Annual Fund Operating Expenses” table on pageMGD-S1 in the Franklin Mutual Global Discovery VIP Fund’s Class 4 prospectus is replaced with the following:
Annual Fund Operating Expenses
(expenses that you pay each year as a percentage of the value of your investment)
| | | | |
| | | Class 4 | |
| Management fees1 | | | 0.88% | |
| Distribution and service (12b-1) fees | | | 0.35% | |
| Other expenses | | | 0.07% | |
| Acquired fund fees and expenses2 | | | 0.01% | |
| Total annual Fund operating expenses1,2 | | | 1.31% | |
| 1. | Management fees in the table above have been restated to reflect a reduction in the management fee of the Fund effective on May 1, 2018. Consequently, the total annual Fund operating expenses differ from the ratio of expenses to average net assets shown in the Financial Highlights due to a different management fee rate paid in the Fund’s most recent fiscal year. If the management fees had not been restated, management fees would have been 0.94% and the Total annual Fund operating expenses would have been 1.37%. |
| 2. | Total annual Fund operating expenses differ from the ratio of expenses to average net assets shown in the Financial Highlights, which reflect the operating expenses of the Fund and do not include acquired fund fees and expenses. |
VI. The “Fund Summary – Example” table on pageMGD-S1 in the Franklin Mutual Global Discovery VIP Fund’s Class 4 prospectus is replaced with the following:
| | | | | | | | |
| | | 1 Year | | 3 Years | | 5 Years | | 10 Years |
| Class 4 | | $ 133 | | $ 415 | | $ 718 | | $ 1,579 |
VII. The following is added as the second to last paragraph before the “Manager of Managers Structure”sub-section in the “Fund Details – Management” section of each Class’ prospectus on pageMGD-D8:
Effective May 1, 2018, the Fund’s investment management fee was reduced, as approved by the board of trustees. Prior to May 1, 2018, the Fund paid Franklin Mutual an investment management fee equal to an annual rate of:
| | • | | 0.950% of the value of its average daily net assets up to and including $200 million; |
| | • | | 0.935% of the value of its average daily net assets over $200 million, up to and including $700 million; |
| | • | | 0.900% of the value of its average daily net assets over $700 million, up to and including $1.2 billion; |
| | • | | 0.875% of the value of its average daily net assets over $1.2 billion, up to and including $4 billion; |
| | • | | 0.845% of the value of its average daily net assets over $4 billion, up to and including $7 billion; |
| | • | | 0.825% of the value of its average daily net assets over $7 billion, up to and including $10 billion; and |
| | • | | 0.805% of the value of its average daily net assets in excess of $10 billion. |
Effective May 1, 2018, the Fund’s investment management fee was reduced to a fee equal to an annual rate of:
| | • | | 0.875% of the value of its average daily net assets up to and including $4 billion; |
| | • | | 0.845% of the value of its average daily net assets over $4 billion, up to and including $7 billion; |
| | • | | 0.825% of the value of its average daily net assets over $7 billion, up to and including $10 billion; |
| | • | | 0.805% of the value of its average daily net assets over $10 billion, up to and including $13 billion; |
| | • | | 0.785% of the value of its average daily net assets over $13 billion, up to and including $16 billion; |
| | • | | 0.765% of the value of its average daily net assets over $16 billion, up to and including $19 billion; |
| | • | | 0.745% of the value of its average daily net assets over $19 billion, up to and including $22 billion; |
| | • | | 0.725% of the value of its average daily net assets over $22 billion, up to and including $25 billion; |
| | • | | 0.705% of the value of its average daily net assets over $25 billion, up to and including $28 billion; and |
| | • | | 0.685% of the value of its average daily net assets in excess of $28 billion. |
Please keep this supplement with your prospectus for future reference.
FRANKLIN TEMPLETON VARIABLE INSURANCE PRODUCTS TRUST
Financial Highlights
Franklin Mutual Global Discovery VIP Fund
| | | | | | | | | | | | | | | | | | | | |
| |
| | | Year Ended December 31, | |
| | | | | |
| | | 2018 | | | 2017 | | | 2016 | | | 2015 | | | 2014 | |
| Class 1 | | | | | | | | | | | | | | | | | | | | |
| Per share operating performance | | | | | | | | | | | | | | | | | | | | |
(for a share outstanding throughout the year) | | | | | | | | | | | | | | | | | | | | |
| | | | | |
Net asset value, beginning of year | | | $20.38 | | | | $20.22 | | | | $19.85 | | | | $22.61 | | | | $23.31 | |
| | | | |
| | | | | |
Income from investment operationsa: | | | | | | | | | | | | | | | | | | | | |
| | | | | |
Net investment incomeb | | | 0.36 | | | | 0.47 | | | | 0.41 | | | | 0.37 | | | | 0.68 | c |
| | | | | | |
Net realized and unrealized gains (losses) | | | (2.50 | ) | | | 1.29 | | | | 1.92 | | | | (1.17 | ) | | | 0.76 | |
| | | | |
Total from investment operations | | | (2.14 | ) | | | 1.76 | | | | 2.33 | | | | (0.80 | ) | | | 1.44 | |
| | | | |
| | | | | |
| Less distributions from: | | | | | | | | | | | | | | | | | | | | |
| | | | | |
Net investment income | | | (0.52 | ) | | | (0.42 | ) | | | (0.39 | ) | | | (0.69 | ) | | | (0.57 | ) |
| | | | | |
Net realized gains | | | (0.25 | ) | | | (1.18 | ) | | | (1.57 | ) | | | (1.27 | ) | | | (1.57 | ) |
| | | | |
Total distributions | | | (0.77 | ) | | | (1.60 | ) | | | (1.96 | ) | | | (1.96 | ) | | | (2.14 | ) |
| | | | |
Net asset value, end of year | | | $17.47 | | | | $20.38 | | | | $20.22 | | | | $19.85 | | | | $22.61 | |
| | | | |
| | | | | |
Total returnd | | | (11.01)% | | | | 8.99% | | | | 12.32% | | | | (3.39)% | | | | 5.98% | |
| | | | | |
| Ratios to average net assets | | | | | | | | | | | | | | | | | | | | |
| | | | | |
Expensese,f | | | 0.96% | g | | | 1.01% | g | | | 1.01% | g | | | 1.02% | g | | | 1.00% | |
| | | | | |
Expenses incurred in connection with securities sold short | | | 0.01% | | | | —% | | | | 0.01% | | | | 0.02% | | | | 0.03% | |
| | | | | |
Net investment income | | | 1.81% | | | | 2.29% | | | | 2.10% | | | | 1.71% | | | | 2.85% | c |
| | | | | | |
| Supplemental data | | | | | | | | | | | | | | | | | | | | |
| | | | | |
Net assets, end of year (000’s) | | | $3,282 | | | | $3,189 | | | | $3,084 | | | | $2,632 | | | | $2,313 | |
| | | | | |
Portfolio turnover rate | | | 29.84% | | | | 17.49% | | | | 17.54% | | | | 21.88% | | | | 22.18% | |
aThe amount shown for a share outstanding throughout the period may not correlate with the Statement of Operations for the period due to the timing of sales and repurchases of the Fund’s shares in relation to income earned and/or fluctuating fair value of the investments of the Fund.
bBased on average daily shares outstanding.
cNet investment income per share includes approximately $0.34 per share related to income received in the form of special dividends in connection with certain Fund holdings. Excluding this amount, the ratio of net investment income to average net assets would have been 1.40%.
dTotal return does not include fees, charges or expenses imposed by the variable annuity and life insurance contracts for which Franklin Templeton Variable Insurance Products Trust serves as an underlying investment vehicle.
eIncludes dividend and/or interest expense on securities sold short and security borrowing fees, if any. See below for the ratios of such expenses to average net assets for the periods presented. See Note 1(d).
fBenefit of expense reduction rounds to less than 0.01%.
gBenefit of waiver and payments by affiliates rounds to less than 0.01%.
| | | | | | |
| | | |
| | The accompanying notes are an integral part of these financial statements. | Annual Report | | | MGD-13 | |
FRANKLIN TEMPLETON VARIABLE INSURANCE PRODUCTS TRUST
FINANCIAL HIGHLIGHTS
Franklin Mutual Global Discovery VIP Fund(continued)
| | | | | | | | | | | | | | | | | | | | |
| |
| | | Year Ended December 31, | |
| | | | | |
| | | 2018 | | | 2017 | | | 2016 | | | 2015 | | | 2014 | |
| Class 2 | | | | | | | | | | | | | | | | | | | | |
Per share operating performance (for a share outstanding throughout the year) | | | | | | | | | | | | | | | | | | | | |
| | | | | |
Net asset value, beginning of year | | | $19.80 | | | | $19.69 | | | | $19.37 | | | | $22.11 | | | | $22.84 | |
| | | | |
| | | | | |
Income from investment operationsa: | | | | | | | | | | | | | | | | | | | | |
| | | | | |
Net investment incomeb | | | 0.30 | | | | 0.41 | | | | 0.35 | | | | 0.32 | | | | 0.60 | c |
| | | | | | |
Net realized and unrealized gains (losses) | | | (2.42 | ) | | | 1.25 | | | | 1.87 | | | | (1.16 | ) | | | 0.75 | |
| | | | |
Total from investment operations | | | (2.12 | ) | | | 1.66 | | | | 2.22 | | | | (0.84 | ) | | | 1.35 | |
| | | | |
| | | | | |
| Less distributions from: | | | | | | | | | | | | | | | | | | | | |
| | | | | |
Net investment income | | | (0.47 | ) | | | (0.37 | ) | | | (0.33 | ) | | | (0.63 | ) | | | (0.51 | ) |
| | | | | |
Net realized gains | | | (0.25 | ) | | | (1.18 | ) | | | (1.57 | ) | | | (1.27 | ) | | | (1.57 | ) |
| | | | |
Total distributions | | | (0.72 | ) | | | (1.55 | ) | | | (1.90 | ) | | | (1.90 | ) | | | (2.08 | ) |
| | | | |
Net asset value, end of year | | | $16.96 | | | | $19.80 | | | | $19.69 | | | | $19.37 | | | | $22.11 | |
| | | | |
| | | | | |
Total returnd | | | (11.22)% | | | | 8.71% | | | | 12.06% | | | | (3.65)% | | | | 5.71% | |
| | | | | |
| Ratios to average net assets | | | | | | | | | | | | | | | | | | | | |
| | | | | |
Expensese,f | | | 1.21% | g | | | 1.26% | g | | | 1.26% | g | | | 1.27% | g | | | 1.25% | |
| | | | | |
Expenses incurred in connection with securities sold short | | | 0.01% | | | | —% | | | | 0.01% | | | | 0.02% | | | | 0.03% | |
| | | | | |
Net investment income | | | 1.56% | | | | 2.04% | | | | 1.85% | | | | 1.46% | | | | 2.60% | c |
| | | | | | |
| Supplemental data | | | | | | | | | | | | | | | | | | | | |
| | | | | |
Net assets, end of year (000’s) | | | $500,607 | | | | $631,179 | | | | $630,397 | | | | $629,366 | | | | $685,711 | |
| | | | | |
Portfolio turnover rate | | | 29.84% | | | | 17.49% | | | | 17.54% | | | | 21.88% | | | | 22.18% | |
aThe amount shown for a share outstanding throughout the period may not correlate with the Statement of Operations for the period due to the timing of sales and repurchases of the Fund’s shares in relation to income earned and/or fluctuating fair value of the investments of the Fund.
bBased on average daily shares outstanding.
cNet investment income per share includes approximately $0.34 per share related to income received in the form of special dividends in connection with certain Fund holdings. Excluding this amount, the ratio of net investment income to average net assets would have been 1.15%.
dTotal return does not include fees, charges or expenses imposed by the variable annuity and life insurance contracts for which Franklin Templeton Variable Insurance Products Trust serves as an underlying investment vehicle.
eIncludes dividend and/or interest expense on securities sold short and security borrowing fees, if any. See below for the ratios of such expenses to average net assets for the periods presented. See Note 1(d).
fBenefit of expense reduction rounds to less than 0.01%.
gBenefit of waiver and payments by affiliates rounds to less than 0.01%.
| | | | |
| | | |
| MGD-14 | | Annual Report | The accompanying notes are an integral part of these financial statements. | | |
FRANKLIN TEMPLETON VARIABLE INSURANCE PRODUCTS TRUST
FINANCIAL HIGHLIGHTS
Franklin Mutual Global Discovery VIP Fund(continued)
| | | | | | | | | | | | | | | | | | | | |
| |
| | | Year Ended December 31, | |
| | | | | |
| | | 2018 | | | 2017 | | | 2016 | | | 2015 | | | 2014 | |
| Class 4 | | | | | | | | | | | | | | | | | | | | |
| Per share operating performance | | | | | | | | | | | | | | | | | | | | |
(for a share outstanding throughout the year) | | | | | | | | | | | | | | | | | | | | |
| | | | | |
Net asset value, beginning of year | | | $20.17 | | | | $20.02 | | | | $19.66 | | | | $22.39 | | | | $23.10 | |
| | | | |
| | | | | |
| Income from investment operationsa: | | | | | | | | | | | | | | | | | | | | |
| | | | | |
Net investment incomeb | | | 0.29 | | | | 0.40 | | | | 0.34 | | | | 0.30 | | | | 0.61 | c |
| | | | | | |
Net realized and unrealized gains (losses) | | | (2.47 | ) | | | 1.27 | | | | 1.89 | | | | (1.17 | ) | | | 0.73 | |
| | | | |
Total from investment operations | | | (2.18 | ) | | | 1.67 | | | | 2.23 | | | | (0.87 | ) | | | 1.34 | |
| | | | |
| | | | | |
| Less distributions from: | | | | | | | | | | | | | | | | | | | | |
| | | | | |
Net investment income | | | (0.44 | ) | | | (0.34 | ) | | | (0.30 | ) | | | (0.59 | ) | | | (0.48 | ) |
| | | | | |
Net realized gains | | | (0.25 | ) | | | (1.18 | ) | | | (1.57 | ) | | | (1.27 | ) | | | (1.57 | ) |
| | | | |
Total distributions | | | (0.69 | ) | | | (1.52 | ) | | | (1.87 | ) | | | (1.86 | ) | | | (2.05 | ) |
| | | | |
Net asset value, end of year | | | $17.30 | | | | $20.17 | | | | $20.02 | | | | $19.66 | | | | $22.39 | |
| | | | |
| | | | | |
Total returnd | | | (11.31)% | | | | 8.61% | | | | 11.91% | | | | (3.74)% | | | | 5.60% | |
| | | | | |
| Ratios to average net assets | | | | | | | | | | | | | | | | | | | | |
| | | | | |
Expensese,f | | | 1.31% | g | | | 1.36% | g | | | 1.36% | g | | | 1.37% | g | | | 1.35% | |
| | | | | |
Expenses incurred in connection with securities sold short | | | 0.01% | | | | —% | | | | 0.01% | | | | 0.02% | | | | 0.03% | |
| | | | | |
Net investment income | | | 1.46% | | | | 1.94% | | | | 1.75% | | | | 1.36% | | | | 2.50% | c |
| | | | | | |
| Supplemental data | | | | | | | | | | | | | | | | | | | | |
| | | | | |
Net assets, end of year (000’s) | | | $30,094 | | | | $41,713 | | | | $45,262 | | | | $49,054 | | | | $59,961 | |
| | | | | |
Portfolio turnover rate | | | 29.84% | | | | 17.49% | | | | 17.54% | | | | 21.88% | | | | 22.18% | |
aThe amount shown for a share outstanding throughout the period may not correlate with the Statement of Operations for the period due to the timing of sales and repurchases of the Fund’s shares in relation to income earned and/or fluctuating fair value of the investments of the Fund.
bBased on average daily shares outstanding.
cNet investment income per share includes approximately $0.34 per share related to income received in the form of special dividends in connection with certain Fund holdings. Excluding this amount, the ratio of net investment income to average net assets would have been 1.05%.
dTotal return does not include fees, charges or expenses imposed by the variable annuity and life insurance contracts for which Franklin Templeton Variable Insurance Products Trust serves as an underlying investment vehicle.
eIncludes dividend and/or interest expense on securities sold short and security borrowing fees, if any. See below for the ratios of such expenses to average net assets for the periods presented. See Note 1(d).
fBenefit of expense reduction rounds to less than 0.01%.
gBenefit of waiver and payments by affiliates rounds to less than 0.01%.
| | | | | | |
| | | |
| | The accompanying notes are an integral part of these financial statements. | Annual Report | | | MGD-15 | |
FRANKLIN TEMPLETON VARIABLE INSURANCE PRODUCTS TRUST
Statement of Investments, December 31, 2018
Franklin Mutual Global Discovery VIP Fund
| | | | | | | | | | | | | | |
| | | | |
| | | | | Country | | | Shares/
Units/
Warrants | | | Value | |
| | Common Stocks and Other Equity Interests 89.5% | | | | | | | | | | | | |
| | Aerospace & Defense 0.8% | | | | | | | | | | | | |
| | BAE Systems PLC | | | United Kingdom | | | | 755,507 | | | | $4,424,210 | |
| | | | | | | | | | | | | | |
| | Auto Components 0.4% | | | | | | | | | | | | |
| a,b,c | | International Automotive Components Group Brazil LLC | | | Brazil | | | | 424,073 | | | | 17,971 | |
| a,b,c | | International Automotive Components Group North America LLC | | | United States | | | | 4,052,916 | | | | 483,107 | |
| | Toyo Tire Corp. | | | Japan | | | | 138,565 | | | | 1,738,384 | |
| | | | | | | | | | | | | | |
| | | | | | | | | | | | | 2,239,462 | |
| | | | | | | | | | | | | | |
| | Automobiles 1.1% | | | | | | | | | | | | |
| | General Motors Co. | | | United States | | | | 175,900 | | | | 5,883,855 | |
| | | | | | | | | | | | | | |
| | Banks 11.8% | | | | | | | | | | | | |
| | Barclays PLC | | | United Kingdom | | | | 1,564,265 | | | | 3,002,616 | |
| | BNP Paribas SA | | | France | | | | 106,948 | | | | 4,837,306 | |
| | CIT Group Inc. | | | United States | | | | 136,169 | | | | 5,211,188 | |
| | Citigroup Inc. | | | United States | | | | 162,150 | | | | 8,441,529 | |
| | Citizens Financial Group Inc. | | | United States | | | | 320,923 | | | | 9,541,041 | |
| | First Horizon National Corp. | | | United States | | | | 353,473 | | | | 4,651,705 | |
| | HSBC Holdings PLC | | | United Kingdom | | | | 507,847 | | | | 4,189,531 | |
| | JPMorgan Chase & Co. | | | United States | | | | 58,686 | | | | 5,728,927 | |
| | Societe Generale SA | | | France | | | | 157,880 | | | | 5,032,607 | |
| | Standard Chartered PLC | | | United Kingdom | | | | 442,523 | | | | 3,438,447 | |
| | Wells Fargo & Co. | | | United States | | | | 192,020 | | | | 8,848,282 | |
| | | | | | | | | | | | | | |
| | | | | | | | | | | | | 62,923,179 | |
| | | | | | | | | | | | | | |
| | Biotechnology 0.6% | | | | | | | | | | | | |
| | Shire PLC. | | | United Kingdom | | | | 53,445 | | | | 3,114,717 | |
| | | | | | | | | | | | | | |
| | Building Products 1.2% | | | | | | | | | | | | |
| | Johnson Controls International PLC | | | United States | | | | 206,500 | | | | 6,122,725 | |
| | | | | | | | | | | | | | |
| | Capital Markets 1.2% | | | | | | | | | | | | |
| | Credit Suisse Group AG | | | Switzerland | | | | 191,359 | | | | 2,092,884 | |
| | Deutsche Bank AG | | | Germany | | | | 207,029 | | | | 1,651,166 | |
| | Guotai Junan Securities Co. Ltd. | | | China | | | | 1,275,797 | | | | 2,580,758 | |
| | | | | | | | | | | | | | |
| | | | | | | | | | | | | 6,324,808 | |
| | | | | | | | | | | | | | |
| | Chemicals 1.3% | | | | | | | | | | | | |
| | BASF SE | | | Germany | | | | 97,787 | | | | 6,811,514 | |
| | | | | | | | | | | | | | |
| | Communications Equipment 2.5% | | | | | | | | | | | | |
| | Cisco Systems Inc. | | | United States | | | | 169,680 | | | | 7,352,234 | |
| | Nokia OYJ, A | | | Finland | | | | 611,269 | | | | 3,522,972 | |
| | Nokia OYJ, ADR | | | Finland | | | | 426,323 | | | | 2,481,200 | |
| | | | | | | | | | | | | | |
| | | | | | | | | | | | | 13,356,406 | |
| | | | | | | | | | | | | | |
| | Construction Materials 0.9% | | | | | | | | | | | | |
| | LafargeHolcim Ltd., B | | | Switzerland | | | | 121,811 | | | | 5,029,304 | |
| | | | | | | | | | | | | | |
| | Consumer Finance 1.4% | | | | | | | | | | | | |
| | Ally Financial Inc. | | | United States | | | | 93,416 | | | | 2,116,806 | |
| | Capital One Financial Corp. | | | United States | | | | 70,388 | | | | 5,320,629 | |
| | | | | | | | | | | | | | |
| | | | | | | | | | | | | 7,437,435 | |
| | | | | | | | | | | | | | |
| | Containers & Packaging 0.9% | | | | | | | | | | | | |
| | International Paper Co. | | | United States | | | | 123,000 | | | | 4,964,280 | |
| | | | | | | | | | | | | | |
FRANKLIN TEMPLETON VARIABLE INSURANCE PRODUCTS TRUST
STATEMENT OF INVESTMENTS
| | | | | | | | | | | | | | |
Franklin Mutual Global Discovery VIP Fund(continued) | | | | |
| | | | |
| | | | | Country | | | Shares/
Units/
Warrants | | | Value | |
| | Common Stocks and Other Equity Interests (continued) | | | | | | | | | | | | |
| | Diversified Financial Services 0.8% | | | | | | | | | | | | |
| | Voya Financial Inc. | | | United States | | | | 101,650 | | | | $ 4,080,231 | |
| | | | | | | | | | | | | | |
| | Diversified Telecommunication Services 2.5% | | | | | | | | | | | | |
| | AT&T Inc. | | | United States | | | | 159,739 | | | | 4,558,951 | |
| | Koninklijke KPN NV | | | Netherlands | | | | 2,930,976 | | | | 8,597,279 | |
| | | | | | | | | | | | | | |
| | | | | | | | | | | | | 13,156,230 | |
| | | | | | | | | | | | | | |
| | Electric Utilities 2.4% | | | | | | | | | | | | |
| | Enel SpA | | | Italy | | | | 1,929,746 | | | | 11,187,700 | |
| a | | PG&E Corp. | | | United States | | | | 65,170 | | | | 1,547,788 | |
| | | | | | | | | | | | | | |
| | | | | | | | | | | | | 12,735,488 | |
| | | | | | | | | | | | | | |
| | Energy Equipment & Services 1.0% | | | | | | | | | | | | |
| | Baker Hughes a GE Co., A | | | United States | | | | 250,264 | | | | 5,380,676 | |
| | | | | | | | | | | | | | |
| | Entertainment 2.8% | | | | | | | | | | | | |
| | The Walt Disney Co. | | | United States | | | | 137,500 | | | | 15,076,875 | |
| | | | | | | | | | | | | | |
| | Food & Staples Retailing 1.3% | | | | | | | | | | | | |
| | Walgreens Boots Alliance Inc. | | | United States | | | | 102,904 | | | | 7,031,430 | |
| | | | | | | | | | | | | | |
| | Health Care Equipment & Supplies 4.2% | | | | | | | | | | | | |
| | Koninklijke Philips NV | | | Netherlands | | | | 142,110 | | | | 5,036,320 | |
| | Medtronic PLC | | | United States | | | | 190,110 | | | | 17,292,406 | |
| | | | | | | | | | | | | | |
| | | | | | | | | | | | | 22,328,726 | |
| | | | | | | | | | | | | | |
| | Health Care Providers & Services 1.3% | | | | | | | | | | | | |
| | CVS Health Corp. | | | United States | | | | 105,591 | | | | 6,918,322 | |
| | | | | | | | | | | | | | |
| | Hotels, Restaurants & Leisure 2.2% | | | | | | | | | | | | |
| | Accor SA | | | France | | | | 186,049 | | | | 7,910,922 | |
| | Sands China Ltd. | | | Macau | | | | 916,400 | | | | 4,014,114 | |
| | | | | | | | | | | | | | |
| | | | | | | | | | | | | 11,925,036 | |
| | | | | | | | | | | | | | |
| | Independent Power & Renewable Electricity Producers 0.5% | | | | | | | | | | | | |
| a | | Vistra Energy Corp. | | | United States | | | | 117,933 | | | | 2,699,486 | |
| | | | | | | | | | | | | | |
| | Industrial Conglomerates 0.9% | | | | | | | | | | | | |
| | General Electric Co. | | | United States | | | | 624,350 | | | | 4,726,330 | |
| | | | | | | | | | | | | | |
| | Insurance 9.5% | | | | | | | | | | | | |
| | Alleghany Corp. | | | United States | | | | 2,730 | | | | 1,701,664 | |
| | American International Group Inc. | | | United States | | | | 177,333 | | | | 6,988,693 | |
| | China Pacific Insurance Group Co. Ltd., H | | | China | | | | 1,523,508 | | | | 4,932,115 | |
| | Chubb Ltd. | | | United States | | | | 66,066 | | | | 8,534,406 | |
| | The Hartford Financial Services Group Inc. | | | United States | | | | 192,796 | | | | 8,569,782 | |
| | MetLife Inc. | | | United States | | | | 67,226 | | | | 2,760,300 | |
| | NN Group NV | | | Netherlands | | | | 294,248 | | | | 11,732,797 | |
| | RSA Insurance Group PLC | | | United Kingdom | | | | 501,149 | | | | 3,282,367 | |
| | T&D Holdings Inc. | | | Japan | | | | 199,721 | | | | 2,330,686 | |
| | | | | | | | | | | | | | |
| | | | | | | | | | | | | 50,832,810 | |
| | | | | | | | | | | | | | |
| | IT Services 1.4% | | | | | | | | | | | | |
| | Cognizant Technology Solutions Corp., A | | | United States | | | | 117,760 | | | | 7,475,405 | |
| | | | | | | | | | | | | | |
| | Machinery 0.4% | | | | | | | | | | | | |
| | CNH Industrial NV | | | United Kingdom | | | | 239,035 | | | | 2,159,844 | |
| | | | | | | | | | | | | | |
FRANKLIN TEMPLETON VARIABLE INSURANCE PRODUCTS TRUST
STATEMENT OF INVESTMENTS
| | | | | | | | | | | | | | |
| Franklin Mutual Global Discovery VIP Fund(continued) | | | | |
| | | | |
| | | | | Country | | | Shares/
Units/
Warrants | | | Value | |
| | Common Stocks and Other Equity Interests(continued) | | | | | | | | | |
| | Media 3.3% | | | | | | | | | | | | |
| a | | Charter Communications Inc., A | | | United States | | | | 30,386 | | | | $ 8,659,098 | |
| a | | Cumulus Media Inc., A | | | United States | | | | 9,615 | | | | 103,842 | |
| a | | Cumulus Media Inc., B | | | United States | | | | 14,335 | | | | 136,183 | |
| a | | DISH Network Corp., A | | | United States | | | | 139,003 | | | | 3,470,905 | |
| a | | Liberty Global PLC, C | | | United Kingdom | | | | 263,900 | | | | 5,446,896 | |
| | | | | | | | | | | | | | |
| | | | | | | | | | | | | 17,816,924 | |
| | | | | | | | | | | | | | |
| | Metals & Mining 0.4% | | | | | | | | | | | | |
| | thyssenkrupp AG | | | Germany | | | | 62,456 | | | | 1,072,913 | |
| | Warrior Met Coal Inc. | | | United States | | | | 37,173 | | | | 896,241 | |
| | | | | | | | | | | | | | |
| | | | | | | | | | | | | 1,969,154 | |
| | | | | | | | | | | | | | |
| | Oil, Gas & Consumable Fuels 9.8% | | | | | | | | | | | | |
| | Anadarko Petroleum Corp. | | | United States | | | | 60,325 | | | | 2,644,648 | |
| | BP PLC | | | United Kingdom | | | | 797,842 | | | | 5,046,033 | |
| | Canadian Natural Resources Ltd. | | | Canada | | | | 268,300 | | | | 6,474,818 | |
| | Crescent Point Energy Corp. | | | Canada | | | | 670,900 | | | | 2,034,892 | |
| | JXTG Holdings Inc. | | | Japan | | | | 489,339 | | | | 2,574,834 | |
| | Kinder Morgan Inc. | | | United States | | | | 571,770 | | | | 8,793,823 | |
| | Marathon Oil Corp. | | | United States | | | | 232,865 | | | | 3,339,284 | |
| | Plains All American Pipeline LP | | | United States | | | | 195,500 | | | | 3,917,820 | |
| | Royal Dutch Shell PLC, A (EUR Traded) | | | United Kingdom | | | | 237,549 | | | | 6,982,871 | |
| | Royal Dutch Shell PLC, A (GBP Traded) | | | United Kingdom | | | | 179,410 | | | | 5,279,389 | |
| | The Williams Cos. Inc. | | | United States | | | | 234,501 | | | | 5,170,747 | |
| | | | | | | | | | | | | | |
| | | | | | | | | | | | | 52,259,159 | |
| | | | | | | | | | | | | | |
| | Pharmaceuticals 9.7% | | | | | | | | | | | | |
| | Eli Lilly & Co. | | | United States | | | | 100,184 | | | | 11,593,293 | |
| | GlaxoSmithKline PLC | | | United Kingdom | | | | 670,728 | | | | 12,754,917 | |
| | Merck & Co. Inc. | | | United States | | | | 136,718 | | | | 10,446,622 | |
| | Novartis AG, ADR | | | Switzerland | | | | 199,457 | | | | 17,115,405 | |
| | | | | | | | | | | | | | |
| | | | | | | | | | | | | 51,910,237 | |
| | | | | | | | | | | | | | |
| | Semiconductors & Semiconductor Equipment 0.7% | | | | | | | | | | | | |
| a | | Renesas Electronics Corp. | | | Japan | | | | 791,797 | | | | 3,612,213 | |
| | | | | | | | | | | | | | |
| | Software 3.4% | | | | | | | | | | | | |
| a | | Avaya Holdings Corp., wts., 12/15/22 | | | United States | | | | 5,179 | | | | 10,617 | |
| a | | Check Point Software Technologies Ltd. | | | Israel | | | | 86,367 | | | | 8,865,572 | |
| a | | Red Hat Inc. | | | United States | | | | 16,700 | | | | 2,933,188 | |
| | Symantec Corp. | | | United States | | | | 334,461 | | | | 6,319,641 | |
| | | | | | | | | | | | | | |
| | | | | | | | | | | | | 18,129,018 | |
| | | | | | | | | | | | | | |
| | Specialty Retail 0.7% | | | | | | | | | | | | |
| | Dufry AG | | | Switzerland | | | | 38,027 | | | | 3,623,991 | |
| | | | | | | | | | | | | | |
| | Technology Hardware, Storage & Peripherals 3.4% | | | | | | | | | | | | |
| | Hewlett Packard Enterprise Co. | | | United States | | | | 338,480 | | | | 4,471,321 | |
| | Samsung Electronics Co. Ltd. | | | South Korea | | | | 267,805 | | | | 9,305,882 | |
| | Western Digital Corp. | | | United States | | | | 120,412 | | | | 4,451,631 | |
| | | | | | | | | | | | | | |
| | | | | | | | | | | | | 18,228,834 | |
| | | | | | | | | | | | | | |
FRANKLIN TEMPLETON VARIABLE INSURANCE PRODUCTS TRUST
STATEMENT OF INVESTMENTS
| | | | | | | | | | | | | | |
| Franklin Mutual Global Discovery VIP Fund(continued) | | | | | | | | | |
| | | | |
| | | | | Country | | | Shares/ Units/
Warrants | | | Value | |
| | Common Stocks and Other Equity Interests(continued) | | | | | | | | | |
| | Tobacco 2.8% | | | | | | | | | | | | |
| | Altria Group Inc. | | | United States | | | | 107,584 | | | | $ 5,313,574 | |
| | British American Tobacco PLC | | | United Kingdom | | | | 224,633 | | | | 7,161,580 | |
| | British American Tobacco PLC, ADR | | | United Kingdom | | | | 83,985 | | | | 2,675,762 | |
| | | | | | | | | | | | | | |
| | | | | | | | | | | | | 15,150,916 | |
| | | | | | | | | | | | | | |
| | | | |
| | Total Common Stocks and Other Equity Interests
(Cost $463,290,565) | | | | | | | | | | | 477,859,230 | |
| | | | | | | | | | | | | | |
| | Management Investment Companies (Cost $3,414,383) 0.6% | | | | | | | | | | | | |
| | Diversified Financial Services 0.6% | | | | | | | | | | | | |
| a | | Altaba Inc. | | | United States | | | | 52,100 | | | | 3,018,674 | |
| | | | | | | | | | | | | | |
| | Preferred Stocks (Cost $10,975,075) 1.8% | | | | | | | | | | | | |
| | Automobiles 1.8% | | | | | | | | | | | | |
| d | | Volkswagen AG, 2.845%, pfd | | | Germany | | | | 60,547 | | | | 9,654,974 | |
| | | | | | | | | | | | | | |
| | | | |
| | | | | | | | Principal Amount | | | | |
| | Corporate Notes and Senior Floating Rate Interests 1.3% | | | | | | | | | | | | |
| e,f | | Cumulus Media New Holdings Inc., Term Loan, 7.03%,(1-month USD LIBOR + 4.50%), 5/13/22 | | | United States | | | | $1,854,883 | | | | 1,760,207 | |
| | Frontier Communications Corp., | | | | | | | | | | | | |
| | senior note, 10.50%, 9/15/22 | | | United States | | | | 3,610,000 | | | | 2,527,000 | |
| | senior note, 11.00%, 9/15/25 | | | United States | | | | 4,065,000 | | | | 2,550,584 | |
| | | | | | | | | | | | | | |
| | | | |
| | Total Corporate Notes and Senior Floating Rate Interests
(Cost $8,870,420) | | | | | | | | | | | 6,837,791 | |
| | | | | | | | | | | | | | |
| | | | |
| | Corporate Notes and Senior Floating Rate Interests in Reorganization 1.1% | | | | | | | | | | | | |
| b,c,g | | Broadband Ventures III LLC, secured promissory note, 5.00%, 2/01/12 | | | United States | | | | 595 | | | | — | |
| e,f,g | | iHeartCommunications Inc., | | | | | | | | | | | | |
| | Tranche D Term Loan, 8.443%,(3-month USD LIBOR + 6.75%), 1/30/19 | | | United States | | | | 6,889,154 | | | | 4,659,755 | |
| | Tranche E Term Loan, 9.193%,(3-month USD LIBOR + 7.50%), 7/30/19 | | | United States | | | | 2,213,880 | | | | 1,496,738 | |
| | | | | | | | | | | | | | |
| | | | |
| | Total Corporate Notes and Senior Floating Rate Interests in Reorganization (Cost $8,978,061) | | | | | | | | | | | 6,156,493 | |
| | | | | | | | | | | | | | |
| | | | |
| | | | | | | | Shares | | | | |
| | Companies in Liquidation 0.0%† | | | | | | | | | | | | |
| a,b,h | | Avaya Holdings Corp., Contingent Distribution | | | United States | | | | 1,270,000 | | | | — | |
| a,b,h | | Avaya Inc., Contingent Distribution | | | United States | | | | 1,668,000 | | | | — | |
| a,b,h | | NewPage Corp., Litigation Trust | | | United States | | | | 4,854,000 | | | | — | |
| a,b,h | | Tribune Media, Litigation Trust, Contingent Distribution | | | United States | | | | 57,569 | | | | — | |
| a,h | | Vistra Energy Corp., Litigation Trust, Contingent Distribution | | | United States | | | | 5,912,264 | | | | 5,321 | |
| | | | | | | | | | | | | | |
| | | | |
| | Total Companies in Liquidation (Cost $201,953) | | | | | | | | | | | 5,321 | |
| | | | | | | | | | | | | | |
| | | | |
| | Total Investments before Short Term Investments
(Cost $495,730,457) | | | | | | | | | | | 503,532,483 | |
| | | | | | | | | | | | | | |
FRANKLIN TEMPLETON VARIABLE INSURANCE PRODUCTS TRUST
STATEMENT OF INVESTMENTS
| | | | | | | | | | | | | | |
Franklin Mutual Global Discovery VIP Fund(continued) | | | | | |
| | | | |
| | | | | Country | | | Principal Amount | | | Value | |
| | Short Term Investments 6.2% | | | | | | | | | | | | |
| | U.S. Government and Agency Securities 6.2% | | | | | | | | | | | | |
| i | | FHLB, 1/02/19 | | | United States | | | | $8,400,000 | | | | $ 8,400,000 | |
| i | | U.S. Treasury Bill, 1/02/19 | | | United States | | | | 7,000,000 | | | | 7,000,000 | |
| | j1/10/19 - 1/24/19 | | | United States | | | | 9,000,000 | | | | 8,991,813 | |
| | 1/03/19 - 6/06/19 | | | United States | | | | 8,500,000 | | | | 8,470,896 | |
| | | | | | | | | | | | | | |
| | | | |
| | Total U.S. Government and Agency Securities
(Cost $32,860,083) | | | | | | | | | | | 32,862,709 | |
| | | | | | | | | | | | | | |
| | Total Investments (Cost $528,590,540) 100.5% | | | | | | | | | | | 536,395,192 | |
| | Securities Sold Short (0.8)% | | | | | | | | | | | (4,086,690 | ) |
| | Other Assets, less Liabilities 0.3% | | | | | | | | | | | 1,674,510 | |
| | | | | | | | | | | | | | |
| | Net Assets 100.0% | | | | | | | | | | | $533,983,012 | |
| | | | | | | | | | | | | | |
| | | | |
| | | | | | | | Shares | | | | |
k | | Securities Sold Short (0.8)% | | | | | | | | | | | | |
| | Common Stocks (0.8)% | | | | | | | | | | | | |
| | Internet & Direct Marketing Retail (0.5)% | | | | | | | | | | | | |
| | Alibaba Group Holding Ltd., ADR | | | China | | | | 18,756 | | | | (2,570,885 | ) |
| | | | | | | | | | | | | | |
| | Pharmaceuticals (0.3)% | | | | | | | | | | | | |
| | Takeda Pharmaceutical Co. Ltd. | | | Japan | | | | 44,840 | | | | (1,515,805 | ) |
| | | | | | | | | | | | | | |
| | | | |
| | Total Securities Sold Short (Proceeds $5,165,765) | | | | | | | | | | | $ (4,086,690 | ) |
| | | | | | | | | | | | | | |
†Rounds to less than 0.1% of net assets.
aNon-income producing.
bFair valued using significant unobservable inputs. See Note 12 regarding fair value measurements.
cSee Note 9 regarding restricted securities.
dVariable rate security. The rate shown represents the yield at period end.
eThe coupon rate shown represents the rate at period end.
fSee Note 1(f) regarding senior floating rate interests.
gSee Note 7 regarding credit risk and defaulted securities.
hContingent distributions represent the right to receive additional distributions, if any, during the reorganization of the underlying company. Shares represent total underlying principal of debt securities.
iThe security was issued on a discount basis with no stated coupon rate.
jA portion or all of the security has been segregated as collateral for securities sold short and open forward exchange contracts. At December 31, 2018, the aggregate value of these securities pledged amounted to $2,623,271, representing 0.5% of net assets.
kSee Note 1(d) regarding securities sold short.
FRANKLIN TEMPLETON VARIABLE INSURANCE PRODUCTS TRUST
STATEMENT OF INVESTMENTS
Franklin Mutual Global Discovery VIP Fund(continued)
At December 31, 2018, the Fund had the following futures contracts outstanding. See Note 1(c).
| | | | | | | | | | | | | | | | | | | | |
| | | |
| Futures Contracts | | | | | | | | | | |
| | | | | |
| Description | | Type | | | Number of
Contracts | | | Notional
Amount* | | | Expiration
Date | | | Value/
Unrealized
Appreciation
(Depreciation) | |
Currency Contracts | | | | | | | | | | | | | | | | | | | | |
EUR/USD | | | Short | | | | 189 | | | $ | 27,221,906 | | | | 3/18/19 | | | $ | 4,062 | |
GBP/USD | | | Short | | | | 139 | | | | 11,111,313 | | | | 3/18/19 | | | | 22,969 | |
| | | | | | | | | | | | | | | | | | | | |
Total Futures Contracts | | | | | | | | | | | | | | | | | | $ | 27,031 | |
| | | | | | | | | | | | | | | | | | | | |
*As of period end.
At December 31, 2018, the Fund had the following forward exchange contracts outstanding. See Note 1(c).
| | | | | | | | | | | | | | | | | | | | | | | | | | | | |
| Forward Exchange Contracts | | | | | | | | | | |
| | | | | | | |
| Currency | | Counterpartya | | | Type | | | Quantity | | | Contract
Amount | | | Settlement
Date | | | Unrealized
Appreciation | | | Unrealized
Depreciation | |
OTC Forward Exchange Contracts | | | | | | | | | | | | | | | | | | | | | | | | | | | | |
Swiss Franc | | | HSBK | | | | Buy | | | | 53,486 | | | $ | 54,080 | | | | 1/14/19 | | | $ | 448 | | | $ | — | |
Swiss Franc | | | UBSW | | | | Buy | | | | 335,501 | | | | 339,155 | | | | 1/14/19 | | | | 2,886 | | | | — | |
Swiss Franc | | | UBSW | | | | Sell | | | | 2,440,501 | | | | 2,450,180 | | | | 1/14/19 | | | | — | | | | (37,899 | ) |
South Korean Won | | | BONY | | | | Sell | | | | 356,186,851 | | | | 318,138 | | | | 1/18/19 | | | | — | | | | (1,847 | ) |
South Korean Won | | | HSBK | | | | Buy | | | | 1,223,862,649 | | | | 1,084,762 | | | | 1/18/19 | | | | 14,709 | | | | — | |
South Korean Won | | | HSBK | | | | Sell | | | | 11,111,217,048 | | | | 9,923,919 | | | | 1/18/19 | | | | — | | | | (57,976 | ) |
British Pound | | | BOFA | | | | Buy | | | | 155,423 | | | | 197,209 | | | | 2/14/19 | | | | 1,441 | | | | — | |
British Pound | | | HSBK | | | | Buy | | | | 199,987 | | | | 254,213 | | | | 2/14/19 | | | | 1,396 | | | | — | |
British Pound | | | UBSW | | | | Buy | | | | 28,046 | | | | 35,495 | | | | 2/14/19 | | | | 352 | | | | — | |
British Pound | | | UBSW | | | | Sell | | | | 8,817,207 | | | | 11,099,937 | | | | 2/14/19 | | | | — | | | | (169,550 | ) |
Japanese Yen | | | HSBK | | | | Buy | | | | 19,810,935 | | | | 179,259 | | | | 2/19/19 | | | | 2,209 | | | | — | |
Japanese Yen | | | UBSW | | | | Buy | | | | 12,419,732 | | | | 112,672 | | | | 2/19/19 | | | | 1,092 | | | | — | |
Japanese Yen | | | UBSW | | | | Sell | | | | 289,895,031 | | | | 2,581,779 | | | | 2/19/19 | | | | — | | | | (73,635 | ) |
Euro | | | BOFA | | | | Buy | | | | 901,832 | | | | 1,032,922 | | | | 2/20/19 | | | | 4,852 | | | | — | |
Euro | | | BONY | | | | Sell | | | | 55,624,404 | | | | 63,131,918 | | | | 2/20/19 | | | | — | | | | (877,315 | ) |
Euro | | | HSBK | | | | Buy | | | | 918,144 | | | | 1,051,749 | | | | 2/20/19 | | | | 4,796 | | | | — | |
Euro | | | SSBT | | | | Buy | | | | 546,292 | | | | 624,778 | | | | 2/20/19 | | | | 3,862 | | | | — | |
Euro | | | UBSW | | | | Buy | | | | 673,139 | | | | 771,239 | | | | 2/20/19 | | | | 3,368 | | | | — | |
| | | | | | | | | | | | | | | | | | | | | | | | |
Total Forward Exchange Contracts | | | $ | 41,411 | | | $ | (1,218,222 | ) |
| | | | | | | | | | | | | | | | | | | | | | | | |
Net unrealized appreciation (depreciation) | | | $ | (1,176,811 | ) |
| | | | | | | | | | | | | | | | | | | | | | | | | | | | |
aMay be comprised of multiple contracts with the same counterparty, currency and settlement date.
See Note 10 regarding other derivative information.
See Abbreviations on page MGD-36.
| | | | | | |
| | | |
| | The accompanying notes are an integral part of these financial statements. | Annual Report | | | MGD-21 | |
FRANKLIN TEMPLETON VARIABLE INSURANCE PRODUCTS TRUST
Financial Statements
Statement of Assets and Liabilities
December 31, 2018
| | | | |
| |
| | | Franklin Mutual
Global Discovery
VIP Fund | |
Assets: | | | | |
Investments in securities: | | | | |
Cost - Unaffiliated issuers | | $ | 528,590,540 | |
| | | | |
Value - Unaffiliated issuers | | $ | 536,395,192 | |
Cash | | | 85,064 | |
Receivables: | | | | |
Investment securities sold | | | 3,226,432 | |
Capital shares sold | | | 436,233 | |
Dividends and interest | | | 1,599,435 | |
European Union tax reclaims | | | 335,882 | |
Deposits with brokers for: | | | | |
Securities sold short | | | 4,532,420 | |
Futures contracts | | | 809,300 | |
Unrealized appreciation on OTC forward exchange contracts | | | 41,411 | |
Other assets | | | 1,823 | |
| | | | |
Total assets | | | 547,463,192 | |
| | | | |
Liabilities: | | | | |
Payables: | | | | |
Investment securities purchased | | | 7,095,286 | |
Capital shares redeemed | | | 169,175 | |
Management fees | | | 406,749 | |
Distribution fees | | | 240,072 | |
Variation margin on futures contracts | | | 59,975 | |
Securities sold short, at value (proceeds $5,165,765) | | | 4,086,690 | |
Unrealized depreciation on OTC forward exchange contracts | | | 1,218,222 | |
Accrued expenses and other liabilities | | | 204,011 | |
| | | | |
Total liabilities | | | 13,480,180 | |
| | | | |
Net assets, at value | | $ | 533,983,012 | |
| | | | |
Net assets consist of: | | | | |
Paid-in capital | | $ | 462,643,441 | |
Total distributable earnings (loss) | | | 71,339,571 | |
| | | | |
Net assets, at value | | $ | 533,983,012 | |
| | | | |
| |
| Class 1: | | | | |
Net assets, at value | | $ | 3,282,256 | |
| | | | |
Shares outstanding | | | 187,924 | |
| | | | |
Net asset value and maximum offering price per share | | $ | 17.47 | |
| | | | |
| |
| Class 2: | | | | |
Net assets, at value | | $ | 500,606,730 | |
| | | | |
Shares outstanding | | | 29,525,104 | |
| | | | |
Net asset value and maximum offering price per share | | $ | 16.96 | |
| | | | |
| |
| Class 4: | | | | |
Net assets, at value | | $ | 30,094,026 | |
| | | | |
Shares outstanding | | | 1,739,980 | |
| | | | |
Net asset value and maximum offering price per share | | $ | 17.30 | |
| | | | |
| | | | |
| | | |
| MGD-22 | | Annual Report | The accompanying notes are an integral part of these financial statements. | | |
FRANKLIN TEMPLETON VARIABLE INSURANCE PRODUCTS TRUST
FINANCIAL STATEMENTS
Statement of Operations
for the year ended December 31, 2018
| | | | |
| |
| | | Franklin Mutual
Global Discovery
VIP Fund | |
Investment income: | | | | |
Dividends: (net of foreign taxes)* | | | | |
Unaffiliated issuers | | $ | 15,553,069 | |
Interest: | | | | |
Unaffiliated issuers | | | 1,777,977 | |
Income from securities loaned: | | | | |
Unaffiliated issuers (net of fees and rebates) | | | 108,383 | |
Non-controlled affiliates (Note 3e) | | | 19,571 | |
Other income (Note 1g) | | | 53,792 | |
| | | | |
Total investment income | | | 17,512,792 | |
| | | | |
Expenses: | | | | |
Management fees (Note 3a) | | | 5,681,306 | |
Distribution fees: (Note 3c) | | | | |
Class 2 | | | 1,481,403 | |
Class 4 | | | 129,053 | |
Custodian fees (Note 4) | | | 35,867 | |
Reports to shareholders | | | 150,946 | |
Professional fees | | | 112,968 | |
Trustees’ fees and expenses | | | 4,617 | |
Dividends and interest on securities sold short | | | 32,743 | |
Other | | | 43,516 | |
| | | | |
Total expenses | | | 7,672,419 | |
Expense reductions (Note 4) | | | (5,461 | ) |
Expenses waived/paid by affiliates (Note 3e) | | | (5,802 | ) |
| | | | |
Net expenses | | | 7,661,156 | |
| | | | |
Net investment income | | | 9,851,636 | |
| | | | |
Realized and unrealized gains (losses): | | | | |
Net realized gain (loss) from: | | | | |
Investments: | | | | |
Unaffiliated issuers | | | 44,690,916 | |
Foreign currency transactions | | | (256,599 | ) |
Forward exchange contracts | | | 7,559,927 | |
Futures contracts | | | 2,751,641 | |
Securities sold short | | | 132,539 | |
| | | | |
Net realized gain (loss) | | | 54,878,424 | |
| | | | |
Net change in unrealized appreciation (depreciation) on: | | | | |
Investments: | | | | |
Unaffiliated issuers | | | (133,670,602 | ) |
Translation of other assets and liabilities denominated in foreign currencies | | | (38,148 | ) |
Forward exchange contracts | | | (195,746 | ) |
Futures contracts | | | 728,309 | |
Securities sold short | | | 1,037,125 | |
| | | | |
Net change in unrealized appreciation (depreciation) | | | (132,139,062 | ) |
| | | | |
Net realized and unrealized gain (loss) | | | (77,260,638 | ) |
| | | | |
Net increase (decrease) in net assets resulting from operations | | $ | (67,409,002 | ) |
| | | | |
| |
*Foreign taxes withheld on dividends. | | $ | 876,576 | |
| | | | | | |
| | | |
| | The accompanying notes are an integral part of these financial statements. | Annual Report | | | MGD-23 | |
FRANKLIN TEMPLETON VARIABLE INSURANCE PRODUCTS TRUST
FINANCIAL STATEMENTS
Statements of Changes in Net Assets
| | | | | | | | |
| |
| | | Franklin Mutual Global Discovery VIP Fund | |
| |
| | | Year Ended December 31, | |
| | |
| | | 2018 | | | 2017 | |
Increase (decrease) in net assets: | | | | | | | | |
Operations: | | | | | | | | |
Net investment income | | $ | 9,851,636 | | | $ | 13,954,122 | |
Net realized gain (loss) | | | 54,878,424 | | | | 10,878,079 | |
Net change in unrealized appreciation (depreciation) | | | (132,139,062 | ) | | | 32,155,121 | |
| | | | |
Net increase (decrease) in net assets resulting from operations | | | (67,409,002 | ) | | | 56,987,322 | |
| | | | |
Distributions to shareholders: (Note 1h) | | | | | | | | |
Class 1 | | | (139,418 | ) | | | (252,423 | ) |
Class 2 | | | (21,021,401 | ) | | | (47,070,528 | ) |
Class 4 | | | (1,188,087 | ) | | | (3,056,678 | ) |
| | | | |
Total distributions to shareholders | | | (22,348,906 | ) | | | (50,379,629 | ) |
| | | | |
Capital share transactions: (Note 2) | | | | | | | | |
Class 1 | | | 642,511 | | | | 82,438 | |
Class 2 | | | (46,304,313 | ) | | | (5,225,517 | ) |
Class 4 | | | (6,678,610 | ) | | | (4,126,123 | ) |
| | | | |
Total capital share transactions | | | (52,340,412 | ) | | | (9,269,202 | ) |
| | | | |
Net increase (decrease) in net assets | | | (142,098,320 | ) | | | (2,661,509 | ) |
Net assets: | | | | | | | | |
Beginning of year. | | | 676,081,332 | | | | 678,742,841 | |
| | | | |
End of year (Note 1h) | | $ | 533,983,012 | | | $ | 676,081,332 | |
| | | | |
| | | | |
| | | |
| MGD-24 | | Annual Report | The accompanying notes are an integral part of these financial statements. | | |
FRANKLIN TEMPLETON VARIABLE INSURANCE PRODUCTS TRUST
Notes to Financial Statements
Franklin Mutual Global Discovery VIP Fund
1. Organization and Significant Accounting Policies
Franklin Templeton Variable Insurance Products Trust (Trust) is registered under the Investment Company Act of 1940 (1940 Act) as anopen-end management investment company, consisting of eighteen separate funds and applies the specialized accounting and reporting guidance in U.S. Generally Accepted Accounting Principles (U.S. GAAP). Franklin Mutual Global Discovery VIP Fund (Fund) is included in this report. Shares of the Fund are generally sold only to insurance company separate accounts to fund the benefits of variable life insurance policies or variable annuity contracts. The Fund offers three classes of shares: Class 1, Class 2 and Class 4. Each class of shares may differ by its distribution fees, voting rights on matters affecting a single class and its exchange privilege.
The following summarizes the Fund’s significant accounting policies.
a. Financial Instrument Valuation
The Fund’s investments in financial instruments are carried at fair value daily. Fair value is the price that would be received to sell an asset or paid to transfer a liability in an orderly transaction between market participants on the measurement date. The Fund calculates the net asset value (NAV) per share each business day as of 4 p.m. Eastern time or the regularly scheduled close of the New York Stock Exchange (NYSE), whichever is earlier. Under compliance policies and procedures approved by the Trust’s Board of Trustees (the Board), the Fund’s administrator has responsibility for oversight of valuation, including leading the cross-functional Valuation Committee (VC). The Fund may utilize independent pricing services, quotations from securities and financial instrument dealers, and other market sources to determine fair value.
Equity securities and derivative financial instruments listed on an exchange or on the NASDAQ National Market System are valued at the last quoted sale price or the official closing price of the day, respectively. Foreign equity securities are valued as of the close of trading on the foreign stock exchange on which the security is primarily traded, or as of 4 p.m. Eastern time. The value is then converted into its U.S. dollar equivalent at the foreign exchange rate in effect at 4 p.m. Eastern time on the day that the value of the security is determined.Over-the-counter (OTC) securities are valued within the range of the most recent quoted bid and ask prices. Securities that trade in multiple markets or on multiple exchanges are valued according to the
broadest and most representative market. Certain equity securities are valued based upon fundamental characteristics or relationships to similar securities.
Debt securities generally trade in the OTC market rather than on a securities exchange. The Fund’s pricing services use multiple valuation techniques to determine fair value. In instances where sufficient market activity exists, the pricing services may utilize a market-based approach through which quotes from market makers are used to determine fair value. In instances where sufficient market activity may not exist or is limited, the pricing services also utilize proprietary valuation models which may consider market characteristics such as benchmark yield curves, credit spreads, estimated default rates, anticipated market interest rate volatility, coupon rates, anticipated timing of principal repayments, underlying collateral, and other unique security features in order to estimate the relevant cash flows, which are then discounted to calculate the fair value.
Investments inopen-end mutual funds are valued at the closing NAV.
Certain derivative financial instruments trade in the OTC market. The Fund’s pricing services use various techniques including industry standard option pricing models and proprietary discounted cash flow models to determine the fair value of those instruments. The Fund’s net benefit or obligation under the derivative contract, as measured by the fair value of the contract, is included in net assets.
The Fund has procedures to determine the fair value of financial instruments for which market prices are not reliable or readily available. Under these procedures, the Fund primarily employs a market-based approach which may use related or comparable assets or liabilities, recent transactions, market multiples, book values, and other relevant information for the investment to determine the fair value of the investment. An income-based valuation approach may also be used in which the anticipated future cash flows of the investment are discounted to calculate fair value. Discounts may also be applied due to the nature or duration of any restrictions on the disposition of the investments. Due to the inherent uncertainty of valuations of such investments, the fair values may differ significantly from the values that would have been used had an active market existed.
FRANKLIN TEMPLETON VARIABLE INSURANCE PRODUCTS TRUST
NOTES TO FINANCIAL STATEMENTS
Franklin Mutual Global Discovery VIP Fund(continued)
1. Organization and Significant Accounting Policies(continued)
a. Financial Instrument Valuation(continued)
Trading in securities on foreign securities stock exchanges and OTC markets may be completed before 4 p.m. Eastern time. In addition, trading in certain foreign markets may not take place on every Fund’s business day. Occasionally, events occur between the time at which trading in a foreign security is completed and 4 p.m. Eastern time that might call into question the reliability of the value of a portfolio security held by the Fund. As a result, differences may arise between the value of the Fund’s portfolio securities as determined at the foreign market close and the latest indications of value at 4 p.m. Eastern time. In order to minimize the potential for these differences, the VC monitors price movements following the close of trading in foreign stock markets through a series of country specific market proxies (such as baskets of American Depositary Receipts, futures contracts and exchange traded funds). These price movements are measured against established trigger thresholds for each specific market proxy to assist in determining if an event has occurred that may call into question the reliability of the values of the foreign securities held by the Fund. If such an event occurs, the securities may be valued using fair value procedures, which may include the use of independent pricing services. At December 31, 2018, a market event occurred resulting in a portion of the securities held by the Fund being valued using fair value procedures.
When the last day of the reporting period is anon-business day, certain foreign markets may be open on those days that the Fund’s NAV is not calculated, which could result in differences between the value of the Fund’s portfolio securities on the last business day and the last calendar day of the reporting period. Any significant security valuation changes due to an open foreign market are adjusted and reflected by the Fund for financial reporting purposes.
b. Foreign Currency Translation
Portfolio securities and other assets and liabilities denominated in foreign currencies are translated into U.S. dollars based on the exchange rate of such currencies against U.S. dollars on the date of valuation. The Fund may enter into foreign currency exchange contracts to facilitate transactions denominated in a foreign currency. Purchases and sales of securities, income and expense items denominated in foreign currencies are translated into U.S. dollars at the exchange rate in effect on the transaction
date. Portfolio securities and assets and liabilities denominated in foreign currencies contain risks that those currencies will decline in value relative to the U.S. dollar. Occasionally, events may impact the availability or reliability of foreign exchange rates used to convert the U.S. dollar equivalent value. If such an event occurs, the foreign exchange rate will be valued at fair value using procedures established and approved by the Board.
The Fund does not separately report the effect of changes in foreign exchange rates from changes in market prices on securities held. Such changes are included in net realized and unrealized gain or loss from investments in the Statement of Operations.
Realized foreign exchange gains or losses arise from sales of foreign currencies, currency gains or losses realized between the trade and settlement dates on securities transactions and the difference between the recorded amounts of dividends, interest, and foreign withholding taxes and the U.S. dollar equivalent of the amounts actually received or paid. Net unrealized foreign exchange gains and losses arise from changes in foreign exchange rates on foreign denominated assets and liabilities other than investments in securities held at the end of the reporting period.
c. Derivative Financial Instruments
The Fund invested in derivative financial instruments in order to manage risk or gain exposure to various other investments or markets. Derivatives are financial contracts based on an underlying or notional amount, require no initial investment or an initial net investment that is smaller than would normally be required to have a similar response to changes in market factors, and require or permit net settlement. Derivatives contain various risks including the potential inability of the counterparty to fulfill their obligations under the terms of the contract, the potential for an illiquid secondary market, and/or the potential for market movements which expose the Fund to gains or losses in excess of the amounts shown in the Statement of Assets and Liabilities. Realized gain and loss and unrealized appreciation and depreciation on these contracts for the period are included in the Statement of Operations.
Derivative counterparty credit risk is managed through a formal evaluation of the creditworthiness of all potential counter-parties. The Fund attempts to reduce its exposure to counterparty credit risk on OTC derivatives, whenever possible, by entering into International Swaps and Derivatives
FRANKLIN TEMPLETON VARIABLE INSURANCE PRODUCTS TRUST
NOTES TO FINANCIAL STATEMENTS
Franklin Mutual Global Discovery VIP Fund(continued)
Association (ISDA) master agreements with certain counterparties. These agreements contain various provisions, including but not limited to collateral requirements, events of default, or early termination. Termination events applicable to the counterparty include certain deteriorations in the credit quality of the counterparty. Termination events applicable to the Fund include failure of the Fund to maintain certain net asset levels and/or limit the decline in net assets over various periods of time. In the event of default or early termination, the ISDA master agreement gives thenon-defaulting party the right to net andclose-out all transactions traded, whether or not arising under the ISDA agreement, to one net amount payable by one counterparty to the other. However, absent an event of default or early termination, OTC derivative assets and liabilities are presented gross and not offset in the Statement of Assets and Liabilities. Early termination by the counterparty may result in an immediate payment by the Fund of any net liability owed to that counterparty under the ISDA agreement. At December 31, 2018, the Fund had OTC derivatives in a net liability position of $1,186,966 and the aggregate value of collateral pledged for such contracts was $785,871.
Collateral requirements differ by type of derivative. Collateral or initial margin requirements are set by the broker or exchange clearing house for exchange traded and centrally cleared derivatives. Initial margin deposited is held at the exchange and can be in the form of cash and/or securities. For OTC derivatives traded under an ISDA master agreement, posting of collateral is required by either the Fund or the applicable counterparty if the total net exposure of all OTC derivatives with the applicable counterparty exceeds the minimum transfer amount, which typically ranges from $100,000 to $250,000, and can vary depending on the counterparty and the type of the agreement. Generally, collateral is determined at the close of Fund business each day and any additional collateral required due to changes in derivative values may be delivered by the Fund or the counterparty the next business day, or within a few business days. Collateral pledged and/or received by the Fund for OTC derivatives, if any, is held in segregated accounts with the Fund’s custodian/counterparty broker and can be in the form of cash and/or securities. Unrestricted cash may be invested according to the Fund’s investment objectives. To the extent that the amounts due to the Fund from its counterparties are not subject to collateralization or are not fully collateralized, the Fund bears the risk of loss from counterpartynon-performance.
The Fund entered into exchange traded futures contracts primarily to manage exposure to certain foreign currencies. A futures contract is an agreement between the Fund and a counterparty to buy or sell an asset at a specified price on a future date. Required initial margins are pledged by the Fund, and the daily change in fair value is accounted for as a variation margin payable or receivable in the Statement of Assets and Liabilities.
The Fund entered into OTC forward exchange contracts primarily to manage exposure to certain foreign currencies. A forward exchange contract is an agreement between the Fund and a counterparty to buy or sell a foreign currency at a specific exchange rate on a future date.
See Note 10 regarding other derivative information.
d. Securities Sold Short
The Fund is engaged in selling securities short, which obligates the Fund to replace a borrowed security with the same security at current fair value. The Fund incurs a loss if the price of the security increases between the date of the short sale and the date on which the Fund replaces the borrowed security. The Fund realizes a gain if the price of the security declines between those dates. Gains are limited to the price at which the Fund sold the security short, while losses are potentially unlimited in size.
The Fund is required to establish a margin account with the broker lending the security sold short. While the short sale is outstanding, the broker retains the proceeds of the short sale to the extent necessary to meet margin requirements until the short position is closed out. A deposit must also be maintained with the Fund’s custodian/counterparty broker consisting of cash and/or securities having a value equal to a specified percentage of the value of the securities sold short. The Fund is obligated to pay fees for borrowing the securities sold short and is required to pay the counterparty any dividends and/or interest due on securities sold short. Such dividends and/or interest and any security borrowing fees are recorded as an expense to the Fund.
e. Securities Lending
The Fund participates in an agency based securities lending program to earn additional income. The Fund receives cash collateral against the loaned securities in an amount equal to at least 102% of the fair value of the loaned securities. Collateral is maintained over the life of the loan in an amount not less than 100% of the fair value of loaned securities, as determined at the
FRANKLIN TEMPLETON VARIABLE INSURANCE PRODUCTS TRUST
NOTES TO FINANCIAL STATEMENTS
Franklin Mutual Global Discovery VIP Fund(continued)
1. Organization and Significant Accounting Policies(continued)
e. Securities Lending(continued)
close of Fund business each day; any additional collateral required due to changes in security values is delivered to the Fund on the next business day. The collateral is deposited into a joint cash account with other funds and is used to invest in a money market fund managed by Franklin Advisers, Inc., an affiliate of the Fund. The Fund may receive income from the investment of cash collateral, in addition to lending fees and rebates paid by the borrower. Income from securities loaned, net of fees paid to the securities lending agent and/or third-party vendor, is reported separately in the Statement of Operations. The Fund bears the market risk with respect to the collateral investment, securities loaned, and the risk that the agent may default on its obligations to the Fund. If the borrower defaults on its obligation to return the securities loaned, the Fund has the right to repurchase the securities in the open market using the collateral received. The securities lending agent has agreed to indemnify the Fund in the event of default by a third party borrower. At December 31, 2018, the Fund had no securities on loan.
f. Senior Floating Rate Interests
The Fund invests in senior secured corporate loans that pay interest at rates which are periodically reset by reference to a base lending rate plus a spread. These base lending rates are generally the prime rate offered by a designated U.S. bank or the London InterBank Offered Rate (LIBOR). Senior secured corporate loans often require prepayment of principal from excess cash flows or at the discretion of the borrower. As a result, actual maturity may be substantially less than the stated maturity. Senior secured corporate loans in which the Fund invests are generally readily marketable, but may be subject to certain restrictions on resale.
g. Income and Deferred Taxes
It is the Fund’s policy to qualify as a regulated investment company under the Internal Revenue Code. The Fund intends to distribute to shareholders substantially all of its taxable income and net realized gains to relieve it from federal income and if applicable, excise taxes. As a result, no provision for U.S. federal income taxes is required.
The Fund may be subject to foreign taxation related to income received, capital gains on the sale of securities and certain foreign currency transactions in the foreign jurisdictions in which it invests. Foreign taxes, if any, are recorded based on the tax regulations and rates that exist in the foreign markets in which the Fund invests. When a capital gain tax is determined to apply, the Fund records an estimated deferred tax liability in an amount that would be payable if the securities were disposed of on the valuation date.
As a result of several court cases, in certain countries across the European Union, the Fund filed additional tax reclaims for previously withheld taxes on dividends earned in those countries (EU reclaims). These additional filings are subject to various administrative proceedings by the local jurisdictions’ tax authorities within the European Union, as well as a number of related judicial proceedings. Income recognized, if any, for EU reclaims is reflected as other income in the Statement of Operations and any related receivable, if any, is reflected as European Union tax reclaims in the Statement of Assets and Liabilities. When uncertainty exists as to the ultimate resolution of these proceedings, the likelihood of receipt of these EU reclaims, and the potential timing of payment, no amounts are reflected in the financial statements. For U.S. income tax purposes, when EU reclaims are received by the Fund and the Fund previously passed foreign tax credit on to its shareholders, the Fund must either amend historic tax reporting to shareholders or enter into a closing agreement with the Internal Revenue Service (IRS) in order to pay the associated tax liability on behalf of the Fund’s shareholders.
The Fund may recognize an income tax liability related to its uncertain tax positions under U.S. GAAP when the uncertain tax position has a less than 50% probability that it will be sustained upon examination by the tax authorities based on its technical merits. As of December 31, 2018, the Fund has determined that no tax liability is required in its financial statements related to uncertain tax positions for any open tax years (or expected to be taken in future tax years). Open tax years are those that remain subject to examination and are based on the statute of limitations in each jurisdiction in which the Fund invests.
FRANKLIN TEMPLETON VARIABLE INSURANCE PRODUCTS TRUST
NOTES TO FINANCIAL STATEMENTS
Franklin Mutual Global Discovery VIP Fund(continued)
h. Security Transactions, Investment Income, Expenses and Distributions
Security transactions are accounted for on trade date. Realized gains and losses on security transactions are determined on a specific identification basis. Interest income and estimated expenses are accrued daily. Amortization of premium and accretion of discount on debt securities are included in interest income. Dividend income and dividends declared on securities sold short are recorded on theex-dividend date except for certain dividends from securities where the dividend rate is not available. In such cases, the dividend is recorded as soon as the information is received by the Fund. Distributions to shareholders are recorded on theex-dividend date. Distributable earnings are determined according to income tax regulations (tax basis) and may differ from earnings recorded in accordance with U.S. GAAP. These differences may be permanent or temporary. Permanent differences are reclassified among capital accounts to reflect their tax character. These reclassifications have no impact on net assets or the results of operations. Temporary differences are not reclassified, as they may reverse in subsequent periods.*
Common expenses incurred by the Trust are allocated among the Funds based on the ratio of net assets of each Fund to the combined net assets of the Trust or based on the ratio of number of shareholders of each Fund to the combined number of shareholders of the Trust. Fund specific expenses are charged directly to the Fund that incurred the expense.
Realized and unrealized gains and losses and net investment income, excluding class specific expenses, are allocated daily to each class of shares based upon the relative proportion of net assets of each class. Differences in per share distributions by class are generally due to differences in class specific expenses.
i. Accounting Estimates
The preparation of financial statements in accordance with U.S. GAAP requires management to make estimates and assumptions that affect the reported amounts of assets and liabilities at the date of the financial statements and the amounts of income and expenses during the reporting period. Actual results could differ from those estimates.
j. Guarantees and Indemnifications
Under the Trust’s organizational documents, its officers and trustees are indemnified by the Trust against certain liabilities arising out of the performance of their duties to the Trust. Additionally, in the normal course of business, the Trust, on behalf of the Fund, enters into contracts with service providers that contain general indemnification clauses. The Trust’s maximum exposure under these arrangements is unknown as this would involve future claims that may be made against the Trust that have not yet occurred. Currently, the Trust expects the risk of loss to be remote.
*Effective during the current reporting period, it is no longer required to present certain line items in the Statements of Changes in Net Assets. The below prior period amounts affected by this change are shown as they were in the prior year Statements of Changes in Net Assets.
For the year ended December 31, 2017, distributions to shareholders were as follows:
| | | | |
Distributions from net investment income: | | | | |
Class 1 | | $ | (66,311 | ) |
Class 2 | | | (11,249,921 | ) |
Class 4 | | | (685,349 | ) |
Distributions from net realized gains: | | | | |
Class 1 | | | (186,112 | ) |
Class 2 | | | (35,820,607 | ) |
Class 4 | | | (2,371,329 | ) |
For the year ended December 31, 2017, undistributed net investment income included in net assets was $14,092,871.
FRANKLIN TEMPLETON VARIABLE INSURANCE PRODUCTS TRUST
NOTES TO FINANCIAL STATEMENTS
Franklin Mutual Global Discovery VIP Fund(continued)
2. Shares of Beneficial Interest
At December 31, 2018, there were an unlimited number of shares authorized (without par value). Transactions in the Fund’s shares were as follows:
| | | | | | | | | | | | | | | | | | | | | | | | |
| |
| | | Year Ended December 31, | |
| | |
| | | 2018 | | | 2017 | |
| | | | | | |
| | | Shares | | | | | | Amount | | | Shares | | | | | | Amount | |
| | | | | | |
| Class 1 Shares: | | | | | | | | | | | | | | | | | | | | | | | | |
Shares sold | | | 45,098 | | | | | | | $ | 915,165 | | | | 22,957 | | | | | | | $ | 477,994 | |
Shares issued in reinvestment of distributions | | | 6,995 | | | | | | | | 139,418 | | | | 12,814 | | | | | | | | 252,423 | |
Shares redeemed | | | (20,687 | ) | | | | | | | (412,072 | ) | | | (31,768 | ) | | | | | | | (647,979 | ) |
| | | | |
Net increase (decrease) | | | 31,406 | | | | | | | $ | 642,511 | | | | 4,003 | | | | | | | $ | 82,438 | |
| | | | |
| | | | | | |
| Class 2 Shares: | | | | | | | | | | | | | | | | | | | | | | | | |
Shares sold | | | 1,060,981 | | | | | | | $ | 20,521,165 | | | | 1,826,753 | | | | | | | $ | 36,854,231 | |
Shares issued in reinvestment of distributions | | | 1,085,816 | | | | | | | | 21,021,401 | | | | 2,456,708 | | | | | | | | 47,070,528 | |
Shares redeemed | | | (4,500,413 | ) | | | | | | | (87,846,879 | ) | | | (4,417,680 | ) | | | | | | | (89,150,276 | ) |
| | | | |
Net increase (decrease) | | | (2,353,616 | ) | | | | | | $ | (46,304,313 | ) | | | (134,219 | ) | | | | | | $ | (5,225,517 | ) |
| | | | |
| | | | | | |
| Class 4 Shares: | | | | | | | | | | | | | | | | | | | | | | | | |
Shares sold | | | 49,992 | | | | | | | $ | 917,196 | | | | 74,244 | | | | | | | $ | 1,535,006 | |
Shares issued in reinvestment of distributions | | | 60,157 | | | | | | | | 1,188,087 | | | | 156,592 | | | | | | | | 3,056,678 | |
Shares redeemed | | | (438,307 | ) | | | | | | | (8,783,893 | ) | | | (423,086 | ) | | | | | | | (8,717,807 | ) |
| | | | |
Net increase (decrease) | | | (328,158 | ) | | | | | | $ | (6,678,610 | ) | | | (192,250 | ) | | | | | | $ | (4,126,123 | ) |
| | | | |
3. Transactions with Affiliates
Franklin Resources, Inc. is the holding company for various subsidiaries that together are referred to as Franklin Templeton. Certain officers and trustees of the Fund are also officers, and/or directors of the following subsidiaries:
| | |
| |
| Subsidiary | | Affiliation |
Franklin Mutual Advisers, LLC (Franklin Mutual) | | Investment manager |
Franklin Templeton Services, LLC (FT Services) | | Administrative manager |
Franklin Templeton Distributors, Inc. (Distributors) | | Principal underwriter |
Franklin Templeton Investor Services, LLC (Investor Services) | | Transfer agent |
FRANKLIN TEMPLETON VARIABLE INSURANCE PRODUCTS TRUST
NOTES TO FINANCIAL STATEMENTS
Franklin Mutual Global Discovery VIP Fund(continued)
a. Management Fees
Effective May 1, 2018, the Fund pays an investment management fee to Franklin Mutual based on the average daily net assets of the Fund as follows:
| | |
| |
| Annualized Fee Rate | | Net Assets |
| 0.875% | | Up to and including $4 billion |
| 0.845% | | Over $4 billion, up to and including $7 billion |
| 0.825% | | Over $7 billion, up to and including $10 billion |
| 0.805% | | Over $10 billion, up to and including $13 billion |
| 0.785% | | Over $13 billion, up to and including $16 billion |
| 0.765% | | Over $16 billion, up to and including $19 billion |
| 0.745% | | Over $19 billion, up to and including $22 billion |
| 0.725% | | Over $22 billion, up to and including $25 billion |
| 0.705% | | Over $25 billion, up to and including $28 billion |
| 0.685% | | In excess of $28 billion |
Prior to May 1, 2018, the Fund paid fees to Franklin Mutual based on the average daily net assets of the Fund as follows:
| | |
| |
| Annualized Fee Rate | | Net Assets |
| 0.950% | | Up to and including $200 million |
| 0.935% | | Over $200 million, up to and including $700 million |
| 0.900% | | Over $700 million, up to and including $1.2 billion |
| 0.875% | | Over $1.2 billion, up to and including $4 billion |
| 0.845% | | Over $4 billion, up to and including $7 billion |
| 0.825% | | Over $7 billion, up to and including $10 billion |
| 0.805% | | In excess of $10 billion |
For the year ended December 31, 2018, the gross effective investment management fee rate was 0.898% of the Fund’s average daily net assets.
b. Administrative Fees
Under an agreement with Franklin Mutual, FT Services provides administrative services to the Fund. The fee is paid by Franklin Mutual based on the Fund’s average daily net assets, and is not an additional expense of the Fund.
c. Distribution Fees
The Board has adopted distribution plans for Class 2 and Class 4 shares pursuant to Rule 12b-1 under the 1940 Act. Under the Fund’s compensation distribution plans, the Fund pays Distributors for costs incurred in connection with the servicing, sale and distribution of the Fund’s shares up to 0.35% per year of its average daily net assets of each class. The Board has agreed to limit the current rate to 0.25% per year for Class 2. The plan year, for purposes of monitoring compliance with the maximum annual plan rates, is February 1 through January 31.
d. Transfer Agent Fees
Investor Services, under terms of an agreement, performs shareholder servicing for the Fund and is not paid by the Fund for the services.
FRANKLIN TEMPLETON VARIABLE INSURANCE PRODUCTS TRUST
NOTES TO FINANCIAL STATEMENTS
Franklin Mutual Global Discovery VIP Fund(continued)
3. Transactions with Affiliates(continued)
e. Investments in Affiliated Management Investment Companies
The Fund invests in one or more affiliated management investment companies for purposes other than exercising a controlling influence over the management or policies. Management fees paid by the Fund are waived on assets invested in the affiliated management investment companies, as noted in the Statement of Operations, in an amount not to exceed the management and administrative fees paid directly or indirectly by each affiliate. During the year ended December 31, 2018, the Fund held investments in affiliated management investment companies as follows:
| | | | | | | | | | | | | | | | | | | | | | | | | | | | | | | | |
| | | | | | | | |
| | | Number
of Shares
Held at
Beginning
of Year | | | Gross
Additions | | | Gross
Reductions | | | Number
of Shares
Held at
End of
Year | | | Value at
End of
Year | | | Income
from
securities
loaned | | | Realized
Gain
(Loss) | | | Net Change in
Unrealized
Appreciation
(Depreciation) | |
| Non-Controlled Affiliates | | | | | | | | | | | | | | | | | | | | | | | | | | | | | | | | |
Institutional Fiduciary Trust Money Market Portfolio, 1.99% | | | — | | | | 55,880,000 | | | | (55,880,000 | ) | | | — | | | $ | — | | | $ | 19,571 | | | $ | — | | | $ | — | |
| | | | | | | | | | | | | | | | | | | | |
4. Expense Offset Arrangement
The Fund has entered into an arrangement with its custodian whereby credits realized as a result of uninvested cash balances are used to reduce a portion of the Fund’s custodian expenses. During the year ended December 31, 2018, the custodian fees were reduced as noted in the Statement of Operations.
5. Income Taxes
The tax character of distributions paid during the years ended December 31, 2018 and 2017, was as follows:
| | | | | | | | |
| | |
| | | 2018 | | | 2017 | |
Distributions paid from: | | | | | | | | |
Ordinary income | | $ | 14,592,064 | | | $ | 14,213,432 | |
Long term capital gain | | | 7,756,842 | | | | 36,166,197 | |
| | | | |
| | $ | 22,348,906 | | | $ | 50,379,629 | |
| | | | |
At December 31, 2018, the cost of investments, net unrealized appreciation (depreciation), undistributed ordinary income and undistributed long term capital gains for income tax purposes were as follows:
| | | | |
Cost of investments | | $ | 525,003,191 | |
| | | | |
Unrealized appreciation | | $ | 85,436,170 | |
Unrealized depreciation | | | (79,279,489 | ) |
| | | | |
Net unrealized appreciation (depreciation) | | $ | 6,156,681 | |
| | | | |
Distributable earnings: | | | | |
Undistributed ordinary income | | $ | 15,865,306 | |
Undistributed long term capital gains | | | 49,043,278 | |
| | | | |
Total distributable earnings | | $ | 64,908,584 | |
| | | | |
Differences between income and/or capital gains as determined on a book basis and a tax basis are primarily due to differing treatment of foreign currency transactions.
FRANKLIN TEMPLETON VARIABLE INSURANCE PRODUCTS TRUST
NOTES TO FINANCIAL STATEMENTS
Franklin Mutual Global Discovery VIP Fund(continued)
6. Investment Transactions
Purchases and sales of investments (excluding short term securities and securities sold short) for the year ended December 31, 2018, aggregated $178,034,596 and $225,377,187, respectively.
7. Credit Risk and Defaulted Securities
The Fund may purchase thepre-default or defaulted debt of distressed companies. Distressed companies are financially troubled and could be or are already involved in financial restructuring or bankruptcy. Risks associated with purchasing these securities include the possibility that the bankruptcy or other restructuring process takes longer than expected, or that distributions in restructuring are less than anticipated, either or both of which may result in unfavorable consequences to the Fund. If it becomes probable that the income on debt securities, including those of distressed companies, will not be collected, the Fund discontinues accruing income and recognizes an adjustment for uncollectible interest.
At December 31, 2018, the aggregate long value of distressed company securities for which interest recognition has been discontinued was $6,156,493, representing 1.1% of the Fund’s net assets. For information as to specific securities, see the accompanying Statement of Investments.
8. Concentration of Risk
Investing in foreign securities may include certain risks and considerations not typically associated with investing in U.S. securities, such as fluctuating currency values and changing local and regional economic, political and social conditions, which may result in greater market volatility. Current political and financial uncertainty surrounding the European Union may increase market volatility and the economic risk of investing in securities in Europe. In addition, certain foreign securities may not be as liquid as U.S. securities.
9. Restricted Securities
The Fund invests in securities that are restricted under the Securities Act of 1933 (1933 Act). Restricted securities are often purchased in private placement transactions, and cannot be sold without prior registration unless the sale is pursuant to an exemption under the 1933 Act. Disposal of these securities may require greater effort and expense, and prompt sale at an acceptable price may be difficult. The Fund may have registration rights for restricted securities. The issuer generally incurs all registration costs.
At December 31, 2018, investments in restricted securities, excluding securities exempt from registration under the 1933 Act deemed to be liquid, were as follows:
| | | | | | | | | | | | |
| | | | |
Principal Amount/ Shares | | Issuer | | Acquisition Date | | | Cost | | Value | |
595 | | Broadband Ventures III LLC, secured promissory note, 5.00%, 2/01/12 | | | 7/01/10 - 11/30/12 | | | $ 595 | | $ | — | |
424,073 | | International Automotive Components Group Brazil LLC | | | 4/13/06 - 12/26/08 | | | 281,629 | | | 17,971 | |
4,052,916 | | International Automotive Components Group North America LLC | | | 1/12/06 - 3/18/13 | | | 3,247,714 | | | 483,107 | |
| | | | | | | | | |
| | Total Restricted Securities(Value is 0.1% of Net Assets) | | | | | | $3,529,938 | | $ | 501,078 | |
| | | | | | | | | |
FRANKLIN TEMPLETON VARIABLE INSURANCE PRODUCTS TRUST
NOTES TO FINANCIAL STATEMENTS
Franklin Mutual Global Discovery VIP Fund(continued)
10. Other Derivative Information
At December 31, 2018, the Fund’s investments in derivative contracts are reflected in the Statement of Assets and Liabilities as follows:
| | | | | | | | | | | | |
| | |
| | | Asset Derivatives | | | Liability Derivatives | |
| | | | |
Derivative Contracts Not Accounted for as Hedging Instruments | | Statement of Assets and
Liabilities Location | | Fair Value | | | Statement of Assets and
Liabilities Location | | Fair Value | |
Foreign exchange contracts | | Variation margin on futures contracts | | $ | 27,031 | a | | Variation margin on futures contracts | | $ | — | |
| | Unrealized appreciation on OTC forward exchange contracts | | | 41,411 | | | Unrealized depreciation on OTC forward exchange contracts | | | 1,218,222 | |
| | | | | | | | | | | | |
Totals | | | | $ | 68,442 | | | | | $ | 1,218,222 | |
| | | | | | | | | | | | |
aThis amount reflects the cumulative appreciation (depreciation) of futures contracts as reported in the Statement of Investments. Only the variation margin receivable/ payable at year end is separately reported within the Statement of Assets and Liabilities. Prior variation margin movements were recorded to cash upon receipt or payment.
For the year ended December 31, 2018, the effect of derivative contracts in the Fund’s Statement of Operations was as follows:
| | | | | | | | | | | | |
| | | | |
Derivative Contracts Not
Accounted for as
Hedging Instruments | | Statement of Operations Location | | Net Realized
Gain (Loss)
for the Year | | | Statement of Operations Location | | Net Change in
Unrealized
Appreciation
(Depreciation)
for the Year | |
| | Net realized gain (loss) from: | | | | | | Net change in unrealized appreciation (depreciation) on: | | | | |
Foreign exchange contracts | | Forward exchange contracts | | $ | 7,559,927 | | | Forward exchange contracts | | $ | (195,746 | ) |
| | Futures contracts | | | 2,751,641 | | | Futures contracts | | | 728,309 | |
| | | | | | | | | | | | |
Totals | | | | $ | 10,311,568 | | | | | $ | 532,563 | |
| | | | | | | | | | | | |
For the year ended December 31, 2018, the average month end notional amount of futures contracts represented $48,187,996. The average month end contract value of forward exchange contracts was $120,636,495.
See Note 1(c) regarding derivative financial instruments.
11. Credit Facility
The Fund, together with other U.S. registered and foreign investment funds (collectively, Borrowers), managed by Franklin Templeton, are borrowers in a joint syndicated senior unsecured credit facility totaling $2 billion (Global Credit Facility) which matured on February 8, 2019. This Global Credit Facility provides a source of funds to the Borrowers for temporary and emergency purposes, including the ability to meet future unanticipated or unusually large redemption requests. Effective February 8, 2019, the Borrowers renewed the Global Credit Facility for a one year term, maturing February 7, 2020, for a total of $2 billion.
Under the terms of the Global Credit Facility, the Fund shall, in addition to interest charged on any borrowings made by the Fund and other costs incurred by the Fund, pay its share of fees and expenses incurred in connection with the implementation and maintenance of the Global Credit Facility, based upon its relative share of the aggregate net assets of all of the Borrowers, including an annual commitment fee of 0.15% based upon the unused portion of the Global Credit Facility. These fees are reflected in other expenses in the Statement of Operations. During the year ended December 31, 2018, the Fund did not use the Global Credit Facility.
FRANKLIN TEMPLETON VARIABLE INSURANCE PRODUCTS TRUST
NOTES TO FINANCIAL STATEMENTS
Franklin Mutual Global Discovery VIP Fund(continued)
12. Fair Value Measurements
The Fund follows a fair value hierarchy that distinguishes between market data obtained from independent sources (observable inputs) and the Fund’s own market assumptions (unobservable inputs). These inputs are used in determining the value of the Fund’s financial instruments and are summarized in the following fair value hierarchy:
| | • | | Level 1 – quoted prices in active markets for identical financial instruments |
| | • | | Level 2 – other significant observable inputs (including quoted prices for similar financial instruments, interest rates, prepayment speed, credit risk, etc.) |
| | • | | Level 3 – significant unobservable inputs (including the Fund’s own assumptions in determining the fair value of financial instruments) |
The input levels are not necessarily an indication of the risk or liquidity associated with financial instruments at that level.
A summary of inputs used as of December 31, 2018, in valuing the Fund’s assets and liabilities carried at fair value, is as follows:
| | | | | | | | | | | | | | | | |
| | | | |
| | | Level 1 | | | Level 2 | | | Level 3 | | | Total | |
| Assets: | | | | | | | | | | | | | | | | |
Investments in Securities:a | | | | | | | | | | | | | | | | |
Equity Investments:b | | | | | | | | | | | | | | | | |
Auto Components | | $ | 1,738,384 | | | $ | — | | | $ | 501,078 | | | $ | 2,239,462 | |
Automobiles | | | 5,883,855 | | | | 9,654,974 | | | | — | | | | 15,538,829 | |
Capital Markets | | | 2,580,758 | | | | 3,744,050 | | | | — | | | | 6,324,808 | |
Chemicals | | | — | | | | 6,811,514 | | | | — | | | | 6,811,514 | |
Construction Materials | | | — | | | | 5,029,304 | | | | — | | | | 5,029,304 | |
Electric Utilities | | | 1,547,788 | | | | 11,187,700 | | | | — | | | | 12,735,488 | |
Machinery | | | — | | | | 2,159,844 | | | | — | | | | 2,159,844 | |
Media | | | 17,680,741 | | | | 136,183 | | | | — | | | | 17,816,924 | |
Metals & Mining | | | 896,241 | | | | 1,072,913 | | | | — | | | | 1,969,154 | |
Software | | | 18,118,401 | | | | 10,617 | | | | — | | | | 18,129,018 | |
Specialty Retail | | | — | | | | 3,623,991 | | | | — | | | | 3,623,991 | |
All Other Equity Investments | | | 398,154,542 | | | | — | | | | — | | | | 398,154,542 | |
Corporate Notes and Senior Floating Rate Interests | | | — | | | | 6,837,791 | | | | — | | | | 6,837,791 | |
Corporate Notes and Senior Floating Rate Interests in Reorganization | | | — | | | | 6,156,493 | | | | —c | | | | 6,156,493 | |
Companies in Liquidation | | | — | | | | 5,321 | | | | —c | | | | 5,321 | |
Short Term Investments | | | 24,462,709 | | | | 8,400,000 | | | | — | | | | 32,862,709 | |
| | | | |
Total Investments in Securities | | $ | 471,063,419 | | | $ | 64,830,695 | | | $ | 501,078 | | | $ | 536,395,192 | |
| | | | |
Other Financial Instruments: | | | | | | | | | | | | | | | | |
Futures Contracts | | $ | 27,031 | | | $ | — | | | $ | — | | | $ | 27,031 | |
Forward Exchange Contracts | | | — | | | | 41,411 | | | | — | | | | 41,411 | |
| | | | |
Total Other Financial Instruments | | $ | 27,031 | | | $ | 41,411 | | | $ | — | | | $ | 68,442 | |
| | | | |
| | | | |
| Liabilities: | | | | | | | | | | | | | | | | |
Other Financial Instruments: | | | | | | | | | | | | | | | | |
Securities Sold Short | | $ | 4,086,690 | | | $ | — | | | $ | — | | | $ | 4,086,690 | |
Forward Exchange Contracts | | | — | | | | 1,218,222 | | | | — | | | | 1,218,222 | |
| | | | |
Total Other Financial Instruments | | $ | — | | | $ | 1,218,222 | | | $ | — | | | $ | 1,218,222 | |
| | | | |
aFor detailed categories, see the accompanying Statement of Investments.
bIncludes common and preferred stocks, management investment companies as well as other equity interests.
cIncludes securities determined to have no value at December 31, 2018.
FRANKLIN TEMPLETON VARIABLE INSURANCE PRODUCTS TRUST
NOTES TO FINANCIAL STATEMENTS
Franklin Mutual Global Discovery VIP Fund(continued)
12. Fair Value Measurements(continued)
A reconciliation of assets in which Level 3 inputs are used in determining fair value is presented when there are significant Level 3 financial instruments at the beginning and/or end of the year. At December 31, 2018, the reconciliation of assets is as follows:
| | | | | | | | | | | | | | | | | | | | | | | | | | | | | | | | | | | | | | | | |
| | | | | | | | | | |
| | | Balance at
Beginning of
Year | | | Purchases | | | Sales | | | Transfer
Into
Level 3 | | | Transfer
Out of
Level 3a | | | Cost Basis
Adjustments | | | Net Realized Gain
(Loss) | | | Net
Unrealized
Appreciation
(Depreciation) | | | Balance at End of Year | | | Net Change
in Unrealized
Appreciation
(Depreciation)
on Assets
Held at Year End | |
| Assets: | | | | | | | | | | | | | | | | | | | | | | | | | | | | | | | | | | | | | | | | |
Investments in Securities: | | | | | | | | | | | | | | | | | | | | | | | | | | | | | | | | | | | | | | | | |
Equity Investments:b | | | | | | | | | | | | | | | | | | | | | | | | | | | | | | | | | | | | | | | | |
Auto Components | | $ | 2,684,499 | | | $ | — | | | $ | — | | | $ | — | | | $ | — | | | $ | — | | | $ | — | | | $ | (2,183,421 | ) | | $ | 501,078 | | | $ | (2,183,421 | ) |
Diversified Financial Services | | | 4,224,121 | | | | — | | | | (4,153,225 | ) | | | — | | | | — | | | | — | | | | (1,276,775 | ) | | | 1,205,879 | | | | — | | | | — | |
Software | | | 8,810 | | | | — | | | | — | | | | — | | | | (19,836 | ) | | | — | | | | — | | | | 11,026 | | | | — | | | | — | |
Companies in Liquidation | | | 136,964 | c | | | — | | | | (1,162 | ) | | | — | | | | (118,073 | ) | | | — | | | | 1,162 | | | | (18,891 | ) | | | —c | | | | — | |
| | | | |
Total Investments in Securities | | $ | 7,054,394 | | | $ | — | | | $ | (4,154,387 | ) | | $ | — | | | $ | (137,909 | ) | | $ | — | | | $ | (1,275,613 | ) | | $ | (985,407 | ) | | $ | 501,078 | | | $ | (2,183,421 | ) |
| | | | |
aThe investments were transferred out of Level 3 as a result of the availability of other significant observable valuation inputs. May include amounts related to a corporate action.
bIncludes common stocks as well as other equity interests.
cIncludes securities determined to have no value.
13. Subsequent Events
The Fund has evaluated subsequent events through the issuance of the financial statements and determined that no events have occurred that require disclosure other than those already disclosed in the financial statements.
Abbreviations
| | | | | | | | | | |
| | |
| Counterparty | | Currency | | Counterparty |
| BOFA | | Bank of America Corp. | | EUR | | Euro | | ADR | | American Depositary Receipt |
| BONY | | The Bank of New York Mellon Corp. | | GBP | | British Pound | | FHLB | | Federal Home Loan Bank |
| HSBK | | HSBC Bank PLC | | USD | | United States Dollar | | LIBOR | | London InterBank Offered Rate |
| SSBT | | State Street Bank and Trust Co., N.A. | | | | | | | | |
| UBSW | | UBS AG | | | | | | | | |
FRANKLIN TEMPLETON VARIABLE INSURANCE PRODUCTS TRUST
Report of Independent Registered Public Accounting Firm
To the Board of Trustees of Franklin Templeton Variable Insurance Products Trust and Shareholders of Franklin Mutual Global Discovery VIP Fund
Opinion on the Financial Statements
We have audited the accompanying statement of assets and liabilities, including the statement of investments, of Franklin Mutual Global Discovery VIP Fund (the “Fund”) as of December 31, 2018, the related statement of operations for the year ended December 31, 2018, the statement of changes in net assets for each of the two years in the period ended December 31, 2018, including the related notes, and the financial highlights for each of the five years in the period ended December 31, 2018 (collectively referred to as the “financial statements”). In our opinion, the financial statements present fairly, in all material respects, the financial position of the Fund as of December 31, 2018, the results of its operations for the year then ended, the changes in its net assets for each of the two years in the period ended December 31, 2018 and the financial highlights for each of the five years in the period ended December 31, 2018 in conformity with accounting principles generally accepted in the United States of America.
Basis for Opinion
These financial statements are the responsibility of the Fund’s management. Our responsibility is to express an opinion on the Fund’s financial statements based on our audits. We are a public accounting firm registered with the Public Company Accounting Oversight Board (United States) (PCAOB) and are required to be independent with respect to the Fund in accordance with the U.S. federal securities laws and the applicable rules and regulations of the Securities and Exchange Commission and the PCAOB.
We conducted our audits of these financial statements in accordance with the standards of the PCAOB. Those standards require that we plan and perform the audit to obtain reasonable assurance about whether the financial statements are free of material misstatement, whether due to error or fraud.
Our audits included performing procedures to assess the risks of material misstatement of the financial statements, whether due to error or fraud, and performing procedures that respond to those risks. Such procedures included examining, on a test basis, evidence regarding the amounts and disclosures in the financial statements. Our audits also included evaluating the accounting principles used and significant estimates made by management, as well as evaluating the overall presentation of the financial statements. Our procedures included confirmation of securities owned as of December 31, 2018 by correspondence with the custodian and brokers; when replies were not received from brokers, we performed other auditing procedures. We believe that our audits provide a reasonable basis for our opinion.
PricewaterhouseCoopers LLP
San Francisco, California
February 15, 2019
We have served as the auditor of one or more investment companies in the Franklin Templeton Group of Funds since 1948.
FRANKLIN TEMPLETON VARIABLE INSURANCE PRODUCTS TRUST
Tax Information (unaudited)
Franklin Mutual Global Discovery VIP Fund
Under Section 852(b)(3)(C) of the Internal Revenue Code, the Fund hereby reports the maximum amount allowable but no less than $7,756,842 as a long term capital gain dividend for the fiscal year ended December 31, 2018.
Under Section 854(b)(1)(A) of the Internal Revenue Code, the Fund hereby reports 41.18% of the ordinary income dividends as income qualifying for the dividends received deduction for the fiscal year ended December 31, 2018.
Franklin Mutual Shares VIP Fund
This annual report for Franklin Mutual Shares VIP Fund covers the fiscal year ended December 31, 2018.
Class 1 Performance Summary as of December 31, 2018
Average annual total return of Class 1 shares* represents the average annual change in value, assuming reinvestment of dividends and capital gains. Average returns smooth out variations in returns, which can be significant; they are not the same asyear-by-year results.
| | | | | | | | | | | | |
| | | |
| Periods ended 12/31/18 | | 1-Year | | | 5-Year | | | 10-Year | |
Average Annual Total Return | | | -8.86% | | | | +3.35% | | | | +9.27% | |
*The Fund has a fee waiver associated with any investment it makes in a Franklin Templeton money fund and/or other Franklin Templeton fund, contractually guaranteed through 4/30/19. Fund investment results reflect the fee waiver; without this waiver, the results would have been lower.
Performance reflects the Fund’s Class 1 operating expenses, but doesnotinclude any contract fees, expenses or sales charges. If they had been included, performance would be lower. These charges and deductions, particularly for variable life policies, can have a significant effect on contract values and insurance benefits. See the contract prospectus for a complete description of these expenses, including sales charges.
Performance data represent past performance, which does not guarantee future results. Investment return and principal value will fluctuate, and you may have a gain or loss when you sell your shares. Current performance may differ from figures shown.
Total Return Index Comparison for a Hypothetical $10,000 Investment (1/1/09–12/31/18)
The graph below shows the change in value of a hypothetical $10,000 investment in the Fund over the indicated period and includes reinvestment of any income or distributions. The Fund’s performance* is compared to the performance of the Standard & Poor’s® 500 Index (S&P 500®). One cannot invest directly in an index, and an index is not representative of the Fund’s portfolio.Please see Important Notes to Performance Information preceding the Fund Summaries.
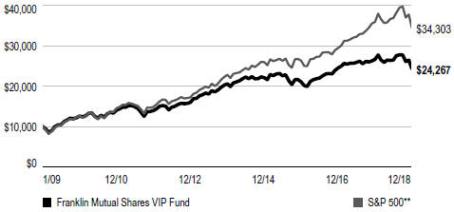
**Source: Morningstar. Please see Index Descriptions following the Fund Summaries.
FRANKLIN MUTUAL SHARES VIP FUND
Fund Goal and Main Investments
The Fund seeks capital appreciation, with income as a secondary goal, by investing primarily in equity securities of companies the Fund’s investment manager believes are available at market prices less than their intrinsic value. The equity securities in which the Fund invests are primarily common stock. To a lesser extent, the Fund also invests in merger arbitrage securities and the debt and equity of distressed companies. The Fund may invest up to 35% of its assets in foreign securities, which may include sovereign debt and participations in foreign debt.
Fund Risks
All investments involve risks, including possible loss of principal. Value securities may not increase in price as anticipated or may decline further in value. The Fund’s investments in foreign securities involve special risks including currency fluctuations, and economic and political uncertainties. Securities issued by smaller and midsize companies may be more volatile in price than those of larger companies, involve substantial risks and should be considered speculative. Derivatives involve costs and can create economic leverage in the Fund’s portfolio which may result in significant volatility and cause the Fund to participate in losses (as well as gains) in an amount that exceeds the Fund’s initial investment. The Fund may also invest in companies engaged in mergers, reorganizations or liquidations, which involve special risks as pending deals may not be completed on time or on favorable terms, as well as lower-rated bonds, which entail higher credit risk. To the extent that the Fund focuses on particular countries, regions, industries, sectors or types of investment from time to time, the Fund may be subject to greater risks of adverse developments in such areas of focus than a fund that invests in a wider variety of countries, regions, industries, sectors or investments. The Fund is actively managed but there is no guarantee that the manager’s investment decisions will produce the desired results. The Fund’s prospectus also includes a description of the main investment risks.
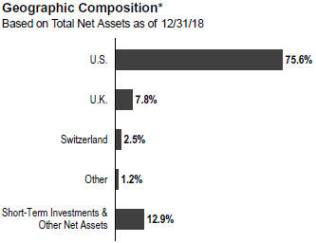
*Figures are stated as a percentage of total and may not equal 100% or may be negative due to rounding, use of any derivatives, unsettled trades or other factors.
Performance Overview
You can find the Fund’sone-year total return in the Performance Summary. In comparison, the Fund’s benchmark, the S&P 500, had a-4.38% total return for the period under review.1
Economic and Market Overview
The global economy expanded during the 12 months under review, despite weakness in certain regions. Global developed and emerging market stocks were aided at certain points during the period by higher crude oil prices, upbeat economic data, easing trade tensions and encouraging corporate earnings reports, as well as indications of a slower pace of interest-rate increases from the U.S. Federal Reserve (Fed).
However, various factors weighed on global markets during the period, including concerns about tighter regulation of technology companies, political uncertainties in the U.S. and the European Union, and major central banks’ interest-rate path and unwinding of monetary stimulus measures. Markets were further pressured by U.S. trade disputes with its allies and China, and their impact on global growth and corporate earnings. In this environment, global stocks, as measured by the MSCI All Country World Index, had a-8.93% total return for the 12 months ended December 31, 2018.1
1. Source: Morningstar.
One cannot invest directly in an index, and an index is not representative of the Fund’s portfolio. Please see Index Descriptions following the Fund Summaries.
The dollar value, number of shares or principal amount, and names of all portfolio holdings are listed in the Fund’s Statement of Investments (SOI).
FRANKLIN MUTUAL SHARES VIP FUND
The U.S. economy grew during the12-month period. After moderating for three consecutive quarters, the economy grew faster in 2018’s second quarter, driven by consumer spending, business investment, exports and government spending. However, growth moderated in the third quarter due to declines in exports and housing investment. The unemployment rate declined from 4.1% in December 2017 to 3.9% at period-end.2 Annual inflation, as measured by the Consumer Price Index, decreased from 2.1% in December 2017 to 1.9% at period-end.2 The Fed raised its target range for the federal funds rate four times during the period, to 2.25%–2.50%, and continued reducing its balance sheet as part of an ongoing plan to normalize monetary policy. At its December meeting, the Fed reduced the projected 2019 rate increases to two, compared to three projected previously.
In Europe, the U.K.’s quarterly economic growth moderated in 2018’s first quarter, but accelerated in 2018’s second and third quarters. The Bank of England raised its key policy rate once during the review period. After moderating in 2018’s first quarter, the eurozone’s quarterly growth remained stable in the second quarter, but eased in the third quarter. The bloc’s annual inflation rate ended the period higher than in December 2017. The European Central Bank (ECB) kept its benchmark interest rate unchanged during the period. In December 2018, the ECB confirmed its plan to conclude its bond purchase program at the end of 2018 and reiterated it expects key interest rates to remain unchanged through the summer of 2019.
In Asia, Japan’s quarterly gross domestic product (GDP) grew in 2018’s second quarter, following a contraction in the first quarter, but contracted again in the third quarter. The Bank of Japan left its benchmark interest rate unchanged during the period and continued its monetary stimulus measures.
In emerging markets, Brazil’s quarterly GDP growth remained stable in 2018’s first and second quarters, but accelerated in the third quarter. The Central Bank of Brazil lowered its benchmark interest rate twice during the period. Russia’s annual GDP growth rate accelerated in 2018’s first and second quarters, but moderated in the third quarter. After lowering its key rate twice early in the period, the Bank of Russia raised it twice in the period’s second half to curtail inflation risks. China’s annual GDP grew at a stable rate in 2018’s first quarter, but it moderated in the second and third quarters. The People’s Bank of China left its benchmark interest rate unchanged during the period, but it took measures to improve financial liquidity to mitigate the negative effects of the
| | | | |
| Top 10 Sectors/Industries | | | |
| 12/31/18 | | | |
| | | % of Total
Net Assets | |
| Banks | | | 9.4% | |
| Insurance | | | 8.0% | |
| Oil, Gas & Consumable Fuels | | | 8.0% | |
| Pharmaceuticals | | | 7.3% | |
| Media | | | 4.8% | |
| Health Care Equipment & Supplies | | | 3.6% | |
| Technology Hardware, Storage & Peripherals | | | 3.2% | |
| Food & Staples Retailing | | | 2.9% | |
| Tobacco | | | 2.8% | |
| Household Durables | | | 2.5% | |
U.S.-China trade dispute and support economic growth. Overall, emerging market stocks, as measured by the MSCI Emerging Markets Index, had a-14.25% total return during the period.1
Investment Strategy
At Franklin Mutual Advisors, we are committed to our distinctive value approach to investing. Our major investment strategy is investing in undervalued stocks. When selecting undervalued equities, we are attracted to what we believe are fundamentally strong companies with healthy balance sheets, high-quality assets, substantial free cash flow and shareholder-oriented management teams and whose stocks are trading at discounts to our assessment of the companies’ intrinsic or business value. We also look for asset-rich companies whose shares may be trading at depressed levels due to concerns over short-term earnings disappointments, litigation, management strategy or other perceived negatives. While the vast majority of our undervalued equity investments are made in publicly traded companies globally, we may invest occasionally in privately held companies as well.
We complement this more traditional investment strategy with two others. One is distressed investing, which is complex and can take many forms. The most common distressed investment the Fund undertakes is the purchase of financially troubled or bankrupt companies’ debt at a substantial discount to face value. After the financially distressed company is reorganized, often in bankruptcy court, the old debt is typically replaced with new securities issued by the financially stronger company.
The other piece of our investment strategy is participating in arbitrage situations, another highly specialized field. When
2. Source: U.S. Bureau of Labor Statistics.
FRANKLIN MUTUAL SHARES VIP FUND
companies announce proposed mergers or takeovers, commonly referred to as “deals,” the target company may trade at a discount to the bid it ultimately accepts. One form of arbitrage involves purchasing the target company’s stock when it is trading below the value we believe it would receive in a deal. In keeping with our commitment to a relatively conservative investment approach, we typically focus our arbitrage efforts on announced deals, and eschew rumored deals or other situations we consider relatively risky.
In addition, it is our practice to hedge the Fund’s currency exposure when we deem it advantageous for our shareholders.
What is meant by “hedge”?
To hedge an investment is to take a position intended to offset potential losses/gains that may be incurred by a companion financial instrument.
Manager’s Discussion
In 2018, corporate profits in the U.S. and other developed markets continued their impressive year-over-year growth. In addition, labor markets showed further improvement, consumer spending was solid, and U.S. corporate tax reforms encouraged companies to buy back stock, raise dividends and increase capital expenditures. Those positive fundamentals were periodically overshadowed by political and economic concerns, particularly in the final three months of the year.
As major U.S. equity markets established newall-time highs in 2018, overall U.S. equity market valuations (e.g.,price-to-earnings,price-to-book orprice-to-sales) became increasingly unattractive, in our analysis. The equity marketsell-off in the fourth-quarter helped to return valuations to more reasonable levels. Thesell-off and rise in volatility yielded an opportunity for us to seek out stocks with strong corporate fundamentals and valuations whose risk/reward profiles seemed to us to have become more favorable.
In 2019, policy events may have considerable influence, for better or worse, on economic growth, investor sentiment and financial market performance and volatility. Markets are likely to be particularly sensitive to developments in U.S.-China trade relations, monetary policy moves by the U.S. Federal Reserve and other major central banks, oil production decisions by OPEC (The Organization of the Petroleum Exporting Countries) and other oil producing countries, the outcome of Brexit, China’s response to its slowing economy and potential political discord in Washington, D.C.
Europe’s equity market overall was trading at an attractively lowerprice-to-earnings multiple and higher dividend yield than the U.S. equity market atperiod-end. We also saw an increase in investor activism, which we viewed as encouraging. However, those favorable factors were offset in part by economic data, which showed a greater degree of deceleration in activity across the region. From an investment standpoint, we are hopeful that 2019 will be a year of potential resolution and clarity. The biggest political event will likely be Brexit, as a resolution to the situation remained unclear as ofperiod-end. The uncertainty around the terms and timing of a deal continued to undermine consumer and corporate confidence. From our perspective, we believe the European Union and the U.K. will ultimately reach an agreement that makes sense for both sides, and we believe the approval of such an agreement would likely have a significantly positive effect on investor, consumer and corporate sentiment. We will also pay close attention to structural reform efforts in France and the political transition in Germany. In December, Chancellor Angela Merkel stepped down as leader of the Christian Democratic Union but stated her intention to remain in office for the remaining three years of her term as Chancellor.
Developments in Asia also weighed on U.S. equity markets, as the U.S.-China trade conflict has disrupted manufacturing activity and supply chains. Amid the trade conflict, China has proven resolute in its attempt to dampen the reliance on leverage, which has weighed on economic activity as well. While the government has enacted some stimulus measures, such as tax cuts, they may be less impactful than prior stimulus through fiscal spending.
Investment Spotlight
In all market environments, we seek to invest prudently in securities that we believe represent good value. We do this by seeking securities that trade at a discount to our intrinsic value estimate, taking into account the quality of the asset, the sustainability of returns, and the growth potential of the business. We also believe the potential to deliver the best risk-adjusted return over a full market cycle requires us to be focused on applying our cross-asset approach: owning equities and debt—in certain cases multiple securities across the capital structure of a company—across geographies and sectors with an emphasis on corporate actions as catalysts. Our health care sector positions are a good example of our investment process. They have been carefully selected over a number of years, and in 2018, many of our long-standing sector investments
FRANKLIN MUTUAL SHARES VIP FUND
appreciated meaningfully. Collectively our sector exposure outperformed the health care sector within the MSCI World Index.3
Within the health care sector, our investment process has generally been focused on finding innovative companies that are market leaders and that invest substantial amounts of capital into research and development (R&D) as a means to sustain and grow market positions. In addition, many of our positions have been in diversified pharmaceutical companies that also have long-duration cash flows through their leading positions in animal health, vaccine, andover-the-counter medicine businesses. These businesses can offer downside protection in years when pharmaceutical R&D is less successful or in years when important products lose patent protection. These businesses are attractive and have been undervalued by the market. This undervaluation allowed us to build positions, and in 2018, some of this undervaluation was reversed.
Eli Lilly and Merck are quintessential examples of our investment process. They are leading innovation-driven pharmaceutical companies that invest substantial amounts of capital into R&D to develop transformative medicines. Both companies have introduced innovative new products in the past many years like Trulicity for diabetes and Keytruda for oncology that we believe will continue to offer substantial long-term revenue growth. The management teams at both companies take a long-term view and focus on enhancing their market positions through both internal and external innovation. Acquiring late stage innovation can be expensive, which is why Lilly and Merck take a prudent approach to generally focusing on early stage assets. Competition is typically less intense for early stage assets, and they can add value through their own development process and pass along that value to shareholders. Shareholder focus also comes through at both companies through their return of excess capital to shareholders through large dividends and share buybacks.
In our view, both companies also have strong, long-duration assets. Lilly and Merck are the fourth and third largest players in animal health, respectively. In September 2018, Lilly sold a portion of its Elanco4 shares to the public in order to create additional shareholder value, while Merck started providing segment level profit disclosures so investors could better appreciate the contribution and value of their animal health
business. Merck is also the second largest player in vaccines, a highly attractive business that is underappreciated, in our opinion.
Another common feature between Lilly and Merck is their strong balance sheets. Both companies also generate substantial amounts of free cash flows, with a significant proportion returned to shareholders in the form of dividends and share buybacks. In addition, the two companies are focused on managing their business more efficiently and improving their operating margins, which we believe will lead to additional earnings growth over the next several years.
Mergers and Acquisitions
In health care and elsewhere, merger and acquisition (M&A) activity remained healthy in 2018. The market received some clarity regarding the regulatory environment when a federal judge ruled in favor of AT&T and Time Warner5, and against the U.S. Department of Justice, in its antitrust lawsuit. However, economic, financial market and geopolitical uncertainty that arose in the second half of the year caused the pace of activity to slow. In our view, it was notable that health care has become one of the busier sectors for M&A as it is relatively more insulated from economic uncertainty. The strength and path of M&A activity in 2019 will likely depend in large part on how the uncertainties carrying over from 2018 play out and how they affect equity markets. From our experience, changes in equity market performance and deal activity have tended to move in a similar direction.
Credit Markets
Finding mispriced risk in credit markets was challenging in 2018. Low interest rates kept credit widely available, default rates remained at historically low levels and we continued to witness a deterioration in debt covenant terms, which include restrictions on financial activities by the borrower or parameters for specific financial metrics. Liberal interpretations of credit agreements and bond indentures in order to shift valuable assets beyond the reach of creditors were an ongoing challenge. In such an environment, we found more opportunities investing in short-term mispriced risk rather than long-term restructurings.
However, we are hopeful that more opportunities may emerge in 2019, especially if we are starting to enter latter stages of the business cycle. U.S. monetary policy is becoming less
3. Please see Index Descriptions following the Fund Summaries.
4. Not a Fund holding.
5. Not held atperiod-end.
FRANKLIN MUTUAL SHARES VIP FUND
accommodative, economic growth appears to be downshifting into a slower pace, earnings growth is set to slow, and geopolitical uncertainty is on the rise. These dynamics have already contributed to a general rise in financial market volatility. At the same time, the amount of lower-rated investment-grade credit stands at a historically high level on an absolute basis and relative to corporate debt markets overall. We believe default rates and the pace of corporate downgrades could begin to pick up in 2019. As a result, 2019 could bring a rise in fallen-angel opportunities (bonds downgraded from investment-grade to junk status) and idiosyncratic opportunities inout-of-favor industries. We will continue to look for opportunities across the capital structures of companies with liquidity-enhancing events, such as asset sales, the ability to issue secured debt within existing agreements, and free-cash flow that could buy time for a company to weather its financial storm.
Fund Performance
Turning to Fund performance, top positive contributors included U.S.-based pharmaceutical company Eli Lilly, global research-driven pharmaceutical company Merck and multinational software company Microsoft.
Shares of Eli Lilly were boosted in large part by a series of strong quarterly results during 2018. Attractive corporate fundamentals and fewer investor concerns regarding the direct impact on the pharmaceutical industry from the Trump administration’s efforts to lower prescription drug prices helped push the stock higher. We believe Eli Lilly continues to have a strong product growth story and room for further margin expansion, in addition to having solid research and development capabilities.
Merck is a global research-driven pharmaceutical company with strong market positions in oncology, diabetes, vaccines and animal health. Investors remained upbeat about its future prospects, particularly its Keytruda oncology drug. Merck released clinical trial results, which showed that for the first-line treatment of metastatic nonsquamousnon-small lung cancer patients, Keytruda combined with chemotherapy substantially extended survival of patients compared with chemotherapy alone. The Keytruda results set a high bar for competition and appeared to enhance Keytruda’s prospects to gain share in the sizeable market for lung cancer treatment. Results from a competitor, Bristol-Myers Squibb4, were less compelling in a different clinical trial in lung cancer. In October 2018, Merck raised its dividend and authorized a new large share buyback plan.
| | | | |
| Top 10 Holdings | | | |
| 12/31/18 | | | |
| |
Company Sector/Industry, Country | | % of Total
Net Assets | |
Medtronic PLC Health Care Equipment & Supplies, U.S. | | | 3.6% | |
Novartis AG Pharmaceuticals, Switzerland | | | 2.5% | |
Merck & Co. Inc. Pharmaceuticals, U.S. | | | 2.4% | |
Eli Lilly & Co. Pharmaceuticals, U.S. | | | 2.3% | |
The Walt Disney Co. Entertainment, U.S. | | | 2.3% | |
JPMorgan Chase & Co. Banks, U.S. | | | 2.2% | |
Cisco Systems Inc. Communications Equipment, U.S. | | | 2.0% | |
Charter Communications Inc. Media, U.S. | | | 1.9% | |
Wells Fargo & Co. Banks, U.S. | | | 1.9% | |
Royal Dutch Shell PLC Oil, Gas & Consumable Fuels, U.K. | | | 1.8% | |
Microsoft continued to reap the rewards of its rapidly growing cloud computing business and its efforts to move Microsoft Office software clients to a subscription-based service. In 2018, Microsoft reported solid quarterly growth in revenues and earnings per share. In April 2018, it also increased its operating margin estimate for the fiscal year ended June 30, 2018. We believe Microsoft’s cloud computing and subscription-based services can continue to grow at a strong pace, which may likely further lift its operating margin. We exited the position as the stock price reached our estimate of fair value.
During the period under review, Fund investments that detracted from performance included U.K.-based British American Tobacco, U.S.-based insurer American International Group (AIG) and U.S.-based industrials company General Electric (GE).
Shares of British American Tobacco faced downward pressure due to potential additional U.S. regulation and concerns regarding next generation products. In March 2018, the U.S. Food and Drug Administration (FDA) issued an Advance Notice of Proposed Rulemaking, which started the process of examining the possibility of regulating nicotine levels in combustible cigarettes. The process may not result in regulation, but if it does, many experts believe the review could take seven to 10 years. Meanwhile, JUUL, produced by JUUL Labs4, has emerged as a populare-cigarette for young
FRANKLIN MUTUAL SHARES VIP FUND
consumers in the U.S. It is unclear to what degree JUUL is cannibalizing the combustible market, but it has hurt investor sentiment toward the industry. In November, shares of British American Tobacco and industry peers dropped, as the FDA revisited the possibility of banning menthol as a flavor in cigarettes, which would take years with many steps to complete, and in our opinion, an FDA proposal would face litigation from the industry. Industry experts have suggested that it might not survive legal challenges.
Shares of AIG slipped in early 2018 as investors reacted negatively to the price AIG paid to acquire Validus Holdings4, a provider of insurance and reinsurance products. The acquisition price represented a significant premium to Validus’ stock price immediately prior to the announcement. However, we believe the acquisition made strategic sense as Validus gives AIG a complementary group of profitable insurance and reinsurance businesses. The stock price slipped further in October 2018, due to larger-than-expected catastrophe-related losses announced ahead of quarterly results. The losses were due to multiple typhoons in Japan, Hurricane Florence and wildfires in California. Investors tend to look beyond uncharacteristic weather-related losses. However, we believe AIG’s series of operating challenges and negative surprises in prior years, such as additional commercial reserves and increases in loss estimates on current business, likely factored into the stock’s meaningful decline.
GE is a multi-industrial company with a diverse set of businesses in power generation, health care and aviation. During 2018, the stock suffered a number of setbacks starting in January with a greater-than-expected charge related to long-term care policies in its insurance subsidiary. In June, the stock was removed from the Dow Jones Index and in September, GE stated that fan blades in some of its power-plant turbines were experiencing oxidation problems. In October, S&P Global Ratings, a bond rating agency, cut GE’s debt rating, while GE cut its dividend and stated that the Securities and Exchange Commission was expanding an ongoing investigation to include an accounting write-down related to its power-generation division. Amid the negative events in 2018, management took the first steps in what amounts to a breakup of GE, announcing in May 2018 the merger of its transportation operations into Wabtec4 and plans tospin-off its health care division and divest its stake inoil-services firm Baker Hughes. In October 2018, GE unexpectedly replaced chief executive officer (CEO) John Flannery, who spent his entire career at GE, with Larry Culp, a former CEO of Danaher4, an industrial company. We believe Culp made some prudent initial moves, and that his plan to reduce debt and strengthen GE’s balance
sheet is a step in the right direction to restoring investor confidence in the company.
During the period, the Fund held currency forwards and futures seeking to hedge most of the currency risk of the portfolio’snon-U.S. dollar investments. The hedges had a positive overall impact on the Fund’s performance because of the appreciation of the U.S. dollar versus the hedged currencies.
What is a currency forward?
A currency forward is a direct agreement between the Fund and a counterparty to buy or sell a foreign currency in exchange for another currency at a specific exchange rate on a future date.
What is a future?
A future is an agreement between the Fund and a counterparty made through a U.S. or foreign futures exchange to buy or sell an underlying instrument or asset at a specific price on a future date.
Thank you for your participation in Franklin Mutual Shares VIP Fund. We look forward to serving your future investment needs.
The foregoing information reflects our analysis, opinions and portfolio holdings as of December 31, 2018, the end of the reporting period. The way we implement our main investment strategies and the resulting portfolio holdings may change depending on factors such as market and economic conditions. These opinions may not be relied upon as investment advice or an offer for a particular security. The information is not a complete analysis of every aspect of any market, country, industry, security or the Fund. Statements of fact are from sources considered reliable, but the investment manager makes no representation or warranty as to their completeness or accuracy. Although historical performance is no guarantee of future results, these insights may help you understand our investment management philosophy.
FRANKLIN MUTUAL SHARES VIP FUND
Class 1 Fund Expenses
As an investor in a variable insurance contract (Contract) that indirectly provides for investment in an underlying mutual fund, you can incur transaction and/or ongoing expenses at both the Fund level and the Contract Level: (1) transaction expenses can include sales charges (loads) on purchases, surrender fees, transfer fees and premium taxes; and (2) ongoing expenses can include management fees, distribution and service (12b-1) fees, contract fees, annual maintenance fees, mortality and expense risk fees and other fees and expenses. All mutual funds and Contracts have some types of ongoing expenses. The table below shows Fund-level ongoing expenses and can help you understand these costs and compare them with those of other mutual funds offered through the Contract. The table assumes a $1,000 investment held for the six months indicated. Please refer to the Fund prospectus for additional information on operating expenses.
Actual Fund Expenses
The table below provides information about the actual account values and actual expenses in the columns under the heading “Actual.” In these columns the Fund’s actual return, which includes the effect of ongoing Fund expenses but does not include the effect of ongoing Contract expenses, is used to calculate the “Ending Account Value.” You can estimate the Fund-level expenses you paid during the period by following these steps (ofcourse, your account value and expenses will differ from those in this illustration):Divide your account value by $1,000 (ifyour account had an $8,600 value, then $8,600 ÷ $1,000 = 8.6). Then multiply the result by the number under the headings “Actual” and “Fund-Level Expenses Paid During Period” (ifFund-Level Expenses Paid During Period were $ 7.50, then 8.6 × $7.50 = $64.50). In this illustration, the estimated expenses paid this period at the Fund level are $64.50.
Hypothetical Example for Comparison with Other Mutual Funds
Under the heading “Hypothetical” in the table, information is provided about hypothetical account values and hypothetical expenses based on the Fund’s actual expense ratio and an assumed rate of return of 5% per year before expenses, which is not the Fund’s actual return. This information may not be used to estimate the actual ending account balance or expenses you paid for the period, but it can help you compare ongoing costs of investing in the Fund with those of other mutual funds offered through the Contract. To do so, compare this 5% hypothetical example with the 5% hypothetical examples that appear in the shareholder reports of other funds offered through the Contract.
Please note that expenses shown in the table are meant to highlight ongoing costs at the Fund level only and do not reflect any ongoing expenses at the Contract level, or transaction expenses at either the Fund or Contract levels. In addition, while the Fund does not have transaction expenses, if the transaction and ongoing expenses at the Contract level were included, the expenses shown below would be higher. You should consult your Contract prospectus or disclosure document for more information.
| | | | | | | | | | | | | | | | | | | | | | | | | | | | |
| | | | | |
| | | | | | Actual (actual return after expenses) | | | | | | Hypothetical (5% annual return before expenses) | | | | |
| | | | | | | |
Share
Class | | Beginning Account
Value 7/1/18 | | | Ending Account
Value 12/31/18 | | | Fund-Level Expenses
Paid During Period
7/1/18–12/31/181,2 | | | | | | Ending Account
Value 12/31/18 | | | Fund-Level Expenses
Paid During Period
7/1/18–12/31/181,2 | | | Net
Annualized
Expense
Ratio2 | |
Class 1 | | | $1,000 | | | | $917.20 | | | | $3.38 | | | | | | | | $1,021.68 | | | | $3.57 | | | | 0.70% | |
1. Expenses are equal to the annualized expense ratio for thesix-month period as indicated above—in the far right column—multiplied by the simple average account value over the period indicated, and then multiplied by 184/365 to reflect theone-half year period.
2. Reflects expenses after fee waivers and expense reimbursements. Does not include any ongoing expenses of the Contract for which the Fund is an investment option or acquired fund fees and expenses.
MS P1 05/18
SUPPLEMENT DATED MAY 1, 2018
TO THE PROSPECTUSES DATED MAY 1, 2018
OF
FRANKLIN TEMPLETON VARIABLE INSURANCE PRODUCTS TRUST FRANKLIN MUTUAL SHARES VIP FUND
Effective May 1, 2018, the prospectuses are amended as follows:
I. The “Fund Summary – Annual Fund Operating Expenses” table on page MS-S1 in the Franklin Mutual Shares VIP Fund’s Class 1 prospectus is replaced with the following:
Annual Fund Operating Expenses
(expenses that you pay each year as a percentage of the value of your investment)
| | | | |
| | | Class 1 | |
| Management fees1 | | | 0.68% | |
| Distribution and service (12b-1) fees | | | None | |
| Other expenses | | | 0.03% | |
| Total annual Fund operating expenses1 | | | 0.71% | |
| 1. | Management fees in the table above have been restated to reflect a reduction in the management fee of the Fund effective on May 1, 2018. Consequently, the total annual Fund operating expenses differ from the ratio of expenses to average net assets shown in the Financial Highlights due to a different management fee rate paid in the Fund’s most recent fiscal year. If the management fees had not been restated, management fees would have been 0.69% and the Total annual Fund operating expenses would have been 0.72%. |
II. The “Fund Summary – Example” table on page MS-S1 in the Franklin Mutual Shares VIP Fund’s Class 1 prospectus is replaced with the following:
| | | | | | | | |
| | | 1 Years | | 3 Years | | 5 Years | | 10 Years |
| Class 1 | | $ 73 | | $ 227 | | $ 395 | | $ 883 |
III. The “Fund Summary – Annual Fund Operating Expenses” table on page MS-S1 in the Franklin Mutual Shares VIP Fund’s Class 2 prospectus is replaced with the following:
Annual Fund Operating Expenses
(expenses that you pay each year as a percentage of the value of your investment)
| | | | |
| | | Class 2 | |
| Management fees1 | | | 0.68% | |
| Distribution and service (12b-1) fees | | | 0.25% | |
| Other expenses | | | 0.03% | |
| Total annual Fund operating expenses1 | | | 0.96% | |
| 1. | Management fees in the table above have been restated to reflect a reduction in the management fee of the Fund effective on May 1, 2018. Consequently, the total annual Fund operating expenses differ from the ratio of expenses to average net assets shown in the Financial Highlights due to a different management fee rate paid in the Fund’s most recent fiscal year. If the management fees had not been restated, management fees would have been 0.69% and the Total annual Fund operating expenses would have been 0.97%. |
IV. The “Fund Summary – Example” table on page MS-S1 in the Franklin Mutual Shares VIPFund’s Class 2 prospectus is replaced with the following:
| | | | | | | | |
| | | 1 Year | | 3 Years | | 5 Years | | 10 Years |
| Class 2 | | $ 98 | | $ 306 | | $ 531 | | $ 1,178 |
V. The “Fund Summary – Annual Fund Operating Expenses” table on page MS-S1 in the Franklin Mutual Shares VIP Fund’s Class 4 prospectus is replaced with the following:
Annual Fund Operating Expenses
(expenses that you pay each year as a percentage of the value of your investment)
| | | | |
| | | Class 4 | |
| Management fees1 | | | 0.68% | |
| Distribution and service (12b-1) fees | | | 0.35% | |
| Other expenses | | | 0.03% | |
| Total annual Fund operating expenses1 | | | 1.06% | |
| 1. | Management fees in the table above have been restated to reflect a reduction in the management fee of the Fund effective on May 1, 2018. Consequently, the total annual Fund operating expenses differ from the ratio of expenses to average net assets shown in the Financial Highlights due to a different management fee rate paid in the Fund’s most recent fiscal year. If the management fees had not been restated, management fees would have been 0.69% and the Total annual Fund operating expenses would have been 1.07%. |
VI. The “Fund Summary – Example” table on page MS-S1 in the Franklin Mutual Shares VIP Fund’s Class 4 prospectus is replaced with the following:
| | | | | | | | |
| | | 1 Year | | 3 Years | | 5 Years | | 10 Years |
| Class 4 | | $ 108 | | $ 337 | | $ 585 | | $ 1,294 |
VII. The following is added as the second to last paragraph before the “Manager of Managers Structure”sub-section in the “Fund Details – Management” section of each Class’ prospectus on page MS-D8:
Effective May 1, 2018, the Fund’s investment management fee was reduced, as approved by the board of trustees. Prior to May 1, 2018, the Fund paid Franklin Mutual an investment management fee equal to an annual rate of:
| | • | | 0.750% of the value of its average daily net assets up to and including $200 million; |
| | • | | 0.735% of the value of its average daily net assets over $200 million, up to and including $700 million; |
| | • | | 0.700% of the value of its average daily net assets over $700 million, up to and including $1.2 billion; |
| | • | | 0.675% of the value of its average daily net assets over $1.2 billion, up to and including $5 billion; |
| | • | | 0.645% of the value of its average daily net assets over $5 billion, up to and including $10 billion; |
| | • | | 0.625% of the value of its average daily net assets over $10 billion, up to and including $15 billion; |
| | • | | 0.605% of the value of its average daily net assets over $15 billion, up to and including $20 billion; and |
| | • | | 0.585% of the value of its average daily net assets in excess of $20 billion. |
Effective May 1, 2018, the Fund’s investment management fee was reduced to a fee equal to an annual rate of:
| | • | | 0.675% of the value of its average daily net assets up to and including $5 billion; |
| | • | | 0.645% of the value of its average daily net assets over $5 billion, up to and including $10 billion; |
| | • | | 0.625% of the value of its average daily net assets over $10 billion, up to and including $15 billion; |
| | • | | 0.595% of the value of its average daily net assets over $15 billion, up to and including $20 billion; |
| | • | | 0.585% of the value of its average daily net assets over $20 billion, up to and including $25 billion; |
| | • | | 0.565% of the value of its average daily net assets over $25 billion, up to and including $30 billion; |
| | • | | 0.555% of the value of its average daily net assets over $30 billion, up to and including $35 billion; and |
| | • | | 0.545% of the value of its average daily net assets in excess of $35 billion. |
Please keep this supplement with your prospectus for future reference.
FRANKLIN TEMPLETON VARIABLE INSURANCE PRODUCTS TRUST
Financial Highlights
Franklin Mutual Shares VIP Fund
| | | | | | | | | | | | | | | | | | | | |
| |
| | | Year Ended December 31, | |
| | | | | |
| | | 2018 | | | 2017 | | | 2016 | | | 2015 | | | 2014 | |
| Class 1 | | | | | | | | | | | | | | | | | | | | |
Per share operating performance (for a share outstanding throughout the year) | | | | | | | | | | | | | | | | | | | | |
| | | | | |
Net asset value, beginning of year | | | $20.71 | | | | $20.40 | | | | $19.48 | | | | $22.91 | | | | $21.92 | |
| | | | |
| | | | | |
| Income from investment operationsa: | | | | | | | | | | | | | | | | | | | | |
| | | | | |
Net investment incomeb | | | 0.36 | | | | 0.49 | | | | 0.50 | | | | 0.44 | | | | 0.62c | |
| | | | | |
Net realized and unrealized gains (losses) | | | (2.04 | ) | | | 1.22 | | | | 2.56 | | | | (1.54 | ) | | | 1.01 | |
| | | | |
| | | | | |
| Total from investment operations | | | (1.68 | ) | | | 1.71 | | | | 3.06 | | | | (1.10 | ) | | | 1.63 | |
| | | | |
| | | | | |
| Less distributions from: | | | | | | | | | | | | | | | | | | | | |
| | | | | |
Net investment income | | | (0.55 | ) | | | (0.53 | ) | | | (0.46 | ) | | | (0.77 | ) | | | (0.52 | ) |
| | | | | |
Net realized gains | | | (0.77 | ) | | | (0.87 | ) | | | (1.68 | ) | | | (1.56 | ) | | | (0.12 | ) |
| | | | |
| | | | | |
| Total distributions | | | (1.32 | ) | | | (1.40 | ) | | | (2.14 | ) | | | (2.33 | ) | | | (0.64 | ) |
| | | | |
| | | | | |
| Net asset value, end of year | | | $17.71 | | | | $20.71 | | | | $20.40 | | | | $19.48 | | | | $22.91 | |
| | | | |
| | | | | |
| Total returnd | | | (8.86)% | | | | 8.64% | | | | 16.35% | | | | (4.69)% | | | | 7.38% | |
| | | | | |
| Ratios to average net assets | | | | | | | | | | | | | | | | | | | | |
| | | | | |
| Expensese,f | | | 0.71% | g | | | 0.72% | g | | | 0.72% | g | | | 0.73% | g | | | 0.73% | |
| | | | | |
| Expenses incurred in connection with securities sold short | | | 0.01% | | | | —% | | | | 0.01% | | | | 0.02% | | | | 0.03% | |
| | | | | |
| Net investment income | | | 1.77% | | | | 2.34% | | | | 2.57% | | | | 2.00% | | | | 2.83%c | |
| | | | | |
| Supplemental data | | | | | | | | | | | | | | | | | | | | |
| | | | | |
| Net assets, end of year (000’s) | | | $537,324 | | | | $653,700 | | | | $610,395 | | | | $643,438 | | | | $656,463 | |
| | | | | |
| Portfolio turnover rate | | | 24.67% | | | | 18.32% | | | | 24.45% | | | | 19.88% | | | | 21.33% | |
aThe amount shown for a share outstanding throughout the period may not correlate with the Statement of Operations for the period due to the timing of sales and repurchases of the Fund’s shares in relation to income earned and/or fluctuating fair value of the investments of the Fund.
bBased on average daily shares outstanding.
cNet investment income per share includes approximately $0.23 per share related to income received in the form of special dividends in connection with certain Fund holdings. Excluding this amount, the ratio of net investment income to average net assets would have been 1.79%.
dTotal return does not include fees, charges or expenses imposed by the variable annuity and life insurance contracts for which Franklin Templeton Variable Insurance Products Trust serves as an underlying investment vehicle.
eIncludes dividend and/or interest expense on securities sold short and security borrowing fees, if any. See below for the ratios of such expenses to average net assets for the periods presented. See Note 1(d).
fBenefit of expense reduction rounds to less than 0.01%.
gBenefit of waiver and payments by affiliates rounds to less than 0.01%.
| | | | |
| | | |
| MS-12 | | Annual Report | The accompanying notes are an integral part of these financial statements. | | |
FRANKLIN TEMPLETON VARIABLE INSURANCE PRODUCTS TRUST
FINANCIAL HIGHLIGHTS
Franklin Mutual Shares VIP Fund(continued)
| | | | | | | | | | | | | | | | | | | | |
| | | Year Ended December 31, | |
| | | 2018 | | | 2017 | | | 2016 | | | 2015 | | | 2014 | |
| Class 2 | | | | | | | | | | | | | | | | | | | | |
Per share operating performance (for a share outstanding throughout the year) | | | | | | | | | | | | | | | | | | | | |
| | | | | |
Net asset value, beginning of year | | | $20.36 | | | | $20.08 | | | | $19.20 | | | | $22.60 | | | | $21.63 | |
| | | | |
| | | | | |
| Income from investment operationsa: | | | | | | | | | | | | | | | | | | | | |
| | | | | |
Net investment incomeb | | | 0.31 | | | | 0.43 | | | | 0.45 | | | | 0.38 | | | | 0.58c | |
| | | | | |
Net realized and unrealized gains (losses) | | | (2.00 | ) | | | 1.20 | | | | 2.52 | | | | (1.51 | ) | | | 0.97 | |
| | | | |
Total from investment operations | | | (1.69 | ) | | | 1.63 | | | | 2.97 | | | | (1.13 | ) | | | 1.55 | |
| | | | |
| | | | | |
| Less distributions from: | | | | | | | | | | | | | | | | | | | | |
| | | | | |
Net investment income | | | (0.50 | ) | | | (0.48 | ) | | | (0.41 | ) | | | (0.71 | ) | | | (0.46 | ) |
| | | | | |
Net realized gains | | | (0.77 | ) | | | (0.87 | ) | | | (1.68 | ) | | | (1.56 | ) | | | (0.12 | ) |
| | | | |
| | | | | |
| Total distributions | | (1.27) | | | (1.35) | | | (2.09) | | | (2.27) | | | (0.58) | |
| |
| | | | |
Net asset value, end of year | | | $17.40 | | | | $20.36 | | | | $20.08 | | | | $19.20 | | | | $22.60 | |
| | | | |
| | | | | |
Total returnd | | | (9.07)% | | | | 8.35% | | | | 16.06% | | | | (4.94)% | | | | 7.12% | |
| | | | | |
| Ratios to average net assets | | | | | | | | | | | | | | | | | | | | |
| | | | | |
Expensese,f | | | 0.96%g | | | | 0.97%g | | | | 0.97%g | | | | 0.98%g | | | | 0.98% | |
| | | | | |
Expenses incurred in connection with securities sold short | | | 0.01% | | | | —% | | | | 0.01% | | | | 0.02% | | | | 0.03% | |
| | | | | |
Net investment income | | | 1.52% | | | | 2.09% | | | | 2.32% | | | | 1.75% | | | | 2.58%c | |
| | | | | |
| Supplemental data | | | | | | | | | | | | | | | | | | | | |
Net assets, end of year (000’s) | | | $2,516,834 | | | | $3,476,913 | | | | $3,621,358 | | | | $3,353,505 | | | | $4,218,342 | |
| | | | | |
Portfolio turnover rate | | | 24.67% | | | | 18.32% | | | | 24.45% | | | | 19.88% | | | | 21.33% | |
aThe amount shown for a share outstanding throughout the period may not correlate with the Statement of Operations for the period due to the timing of sales and repurchases of the Fund’s shares in relation to income earned and/or fluctuating fair value of the investments of the Fund.
bBased on average daily shares outstanding.
cNet investment income per share includes approximately $0.23 per share related to income received in the form of special dividends in connection with certain Fund holdings. Excluding this amount, the ratio of net investment income to average net assets would have been 1.54%.
dTotal return does not include fees, charges or expenses imposed by the variable annuity and life insurance contracts for which Franklin Templeton Variable Insurance Products Trust serves as an underlying investment vehicle.
eIncludes dividend and/or interest expense on securities sold short and security borrowing fees, if any. See below for the ratios of such expenses to average net assets for the periods presented. See Note 1(d).
fBenefit of expense reduction rounds to less than 0.01%.
gBenefit of waiver and payments by affiliates rounds to less than 0.01%.
| | | | | | |
| | | |
| | The accompanying notes are an integral part of these financial statements. | Annual Report | | | MS-13 | |
FRANKLIN TEMPLETON VARIABLE INSURANCE PRODUCTS TRUST
FINANCIAL HIGHLIGHTS
Franklin Mutual Shares VIP Fund(continued)
| | | | | | | | | | | | | | | | | | | | |
| | | Year Ended December 31, | |
| | | 2018 | | | 2017 | | | 2016 | | | 2015 | | | 2014 | |
| Class 4 | | | | | | | | | | | | | | | | | | | | |
Per share operating performance (for a share outstanding throughout the year) | | | | | | | | | | | | | | | | | | | | |
| | | | | |
Net asset value, beginning of year | | $ | 20.53 | | | $ | 20.23 | | | $ | 19.32 | | | $ | 22.72 | | | $ | 21.74 | |
| | | | |
| | | | | |
| Income from investment operationsa: | | | | | | | | | | | | | | | | | | | | |
| | | | | |
Net investment incomeb | | | 0.29 | | | | 0.41 | | | | 0.44 | | | | 0.36 | | | | 0.57c | |
| | | | | |
Net realized and unrealized gains (losses) | | | (2.02) | | | | 1.21 | | | | 2.53 | | | | (1.52) | | | | 0.96 | |
| | | | |
Total from investment operations | | | (1.73) | | | | 1.62 | | | | 2.97 | | | | (1.16) | | | | 1.53 | |
| | | | |
| | | | | |
| Less distributions from: | | | | | | | | | | | | | | | | | | | | |
| | | | | |
Net investment income | | | (0.48) | | | | (0.45) | | | | (0.38) | | | | (0.68) | | | | (0.43) | |
| | | | | |
| Net realized gains | | (0.77) | | | (0.87) | | | (1.68) | | | (1.56) | | | (0.12) | |
| |
| | | | |
Total distributions | | | (1.25) | | | | (1.32) | | | | (2.06) | | | | (2.24) | | | | (0.55) | |
| | | | |
| | | | | |
Net asset value, end of year | | $ | 17.55 | | | $ | 20.53 | | | $ | 20.23 | | | $ | 19.32 | | | $ | 22.72 | |
| | | | |
| | | | | |
Total returnd | | | (9.16)% | | | | 8.25% | | | | 15.94% | | | | (5.05)% | | | | 7.04% | |
| | | | | |
| Ratios to average net assets | | | | | | | | | | | | | | | | | | | | |
| | | | | |
Expensese,f | | | 1.06% | g | | | 1.07% | g | | | 1.07% | g | | | 1.08% | g | | | 1.08% | |
| | | | | |
Expenses incurred in connection with securities sold short | | | 0.01% | | | | —% | | | | 0.01% | | | | 0.02% | | | | 0.03% | |
| | | | | |
Net investment income | | | 1.42% | | | | 1.99% | | | | 2.22% | | | | 1.65% | | | | 2.48% | c |
| | | | | | |
| Supplemental data | | | | | | | | | | | | | | | | | | | | |
| | | | | |
Net assets, end of year (000’s) | | $ | 105,047 | | | $ | 122,942 | | | $ | 122,476 | | | $ | 130,978 | | | $ | 158,020 | |
| | | | | |
Portfolio turnover rate | | | 24.67% | | | | 18.32% | | | | 24.45% | | | | 19.88% | | | | 21.33% | |
aThe amount shown for a share outstanding throughout the period may not correlate with the Statement of Operations for the period due to the timing of sales and repurchases of the Fund’s shares in relation to income earned and/or fluctuating fair value of the investments of the Fund.
bBased on average daily shares outstanding.
cNet investment income per share includes approximately $0.23 per share related to income received in the form of special dividends in connection with certain Fund holdings. Excluding this amount, the ratio of net investment income to average net assets would have been 1.44%.
dTotal return does not include fees, charges or expenses imposed by the variable annuity and life insurance contracts for which Franklin Templeton Variable Insurance Products Trust serves as an underlying investment vehicle.
eIncludes dividend and/or interest expense on securities sold short and security borrowing fees, if any. See below for the ratios of such expenses to average net assets for the periods presented. See Note 1(d).
fBenefit of expense reduction rounds to less than 0.01%.
gBenefit of waiver and payments by affiliates rounds to less than 0.01%.
| | | | |
| | | |
| MS-14 | | Annual Report | The accompanying notes are an integral part of these financial statements. | | |
FRANKLIN TEMPLETON VARIABLE INSURANCE PRODUCTS TRUST
Statement of Investments, December 31, 2018
| | | | | | | | | | | | | | |
| Franklin Mutual Shares VIP Fund | | | | |
| | | | |
| | | | | Country | | | Shares/ Units/ Warrants | | | Value | |
| | Common Stocks and Other Equity Interests 82.2% | | | | | | | | | | | | |
| | | Aerospace & Defense 0.9% | | | | | | | | | |
| | BAE Systems PLC | | | United Kingdom | | | | 4,627,145 | | | $ | 27,096,320 | |
| | Auto Components 0.5% | | | | | | | | | | | | |
| | The Goodyear Tire & Rubber Co. | | | United States | | | | 632,638 | | | | 12,912,142 | |
| a,b,c | | International Automotive Components Group Brazil LLC | | | Brazil | | | | 1,730,515 | | | | 73,334 | |
| a,b,c | | International Automotive Components Group North America LLC | | | United States | | | | 15,382,424 | | | | 1,833,585 | |
| | | | | | | | | | | | | | |
| | | | | | | | | | | | | 14,819,061 | |
| | | | | | | | | | | | | | |
| | | Automobiles 1.2% | | | | | | | | | |
| | General Motors Co. | | | United States | | | | 1,130,130 | | | | 37,802,849 | |
| | | | | | | | | | | | | | |
| | | Banks 9.4% | | | | | | | | | |
| | Barclays PLC | | | United Kingdom | | | | 9,593,272 | | | | 18,414,345 | |
| | CIT Group Inc. | | | United States | | | | 686,226 | | | | 26,261,869 | |
| | Citigroup Inc. | | | United States | | | | 872,519 | | | | 45,423,339 | |
| | Citizens Financial Group Inc. | | | United States | | | | 1,659,766 | | | | 49,344,843 | |
| a | | FCB Financial Holdings Inc., A | | | United States | | | | 493,723 | | | | 16,579,218 | |
| | Guaranty Bancorp | | | United States | | | | 209,583 | | | | 4,348,847 | |
| | JPMorgan Chase & Co. | | | United States | | | | 707,320 | | | | 69,048,579 | |
| | State Bank Financial Corp. | | | United States | | | | 352,200 | | | | 7,603,998 | |
| | Wells Fargo & Co. | | | United States | | | | 1,273,660 | | | | 58,690,253 | |
| | | | | | | | | | | | | | |
| | | | | | | | | | | | | 295,715,291 | |
| | | | | | | | | | | | | | |
| | | Biotechnology 0.6% | | | | | | | | | |
| | Shire PLC | | | United Kingdom | | | | 339,464 | | | | 19,783,596 | |
| | | | | | | | | | | | | | |
| | | Building Products 1.1% | | | | | | | | | |
| | Johnson Controls International PLC | | | United States | | | | 1,158,300 | | | | 34,343,595 | |
| | | | | | | | | | | | | | |
| | | Chemicals 0.0% | | | | | | | | | |
| a,b,d | | Dow Corning Corp., Contingent Distribution | | | United States | | | | 100,000 | | | | — | |
| | | | | | | | | | | | | | |
| | | Communications Equipment 2.0% | | | | | | | | | |
| | Cisco Systems Inc. | | | United States | | | | 1,440,180 | | | | 62,403,000 | |
| | | | | | | | | | | | | | |
| | | Construction & Engineering 0.6% | | | | | | | | | |
| | Fluor Corp. | | | United States | | | | 592,282 | | | | 19,071,480 | |
| | | | | | | | | | | | | | |
| | | Consumer Finance 1.7% | | | | | | | | | |
| | Ally Financial Inc. | | | United States | | | | 763,354 | | | | 17,297,602 | |
| | Capital One Financial Corp. | | | United States | | | | 502,985 | | | | 38,020,636 | |
| | | | | | | | | | | | | | |
| | | | | | | | | | | | | 55,318,238 | |
| | | | | | | | | | | | | | |
| | | Containers & Packaging 1.5% | | | | | | | | | |
| | International Paper Co. | | | United States | | | | 905,775 | | | | 36,557,079 | |
| | WestRock Co. | | | United States | | | | 283,171 | | | | 10,692,537 | |
| | | | | | | | | | | | | | |
| | | | | | | | | | | | | 47,249,616 | |
| | | | | | | | | | | | | | |
| | | Diversified Financial Services 1.1% | | | | | | | | | |
| | Voya Financial Inc. | | | United States | | | | 861,810 | | | | 34,593,053 | |
| | | | | | | | | | | | | | |
| | | Diversified Telecommunication Services 1.8% | | | | | | | | | |
| | AT&T Inc. | | | United States | | | | 1,186,478 | | | | 33,862,082 | |
| | Koninklijke KPN NV | | | Netherlands | | | | 7,561,343 | | | | 22,179,293 | |
| | | | | | | | | | | | | | |
| | | | | | | | | | | | | 56,041,375 | |
| | | | | | | | | | | | | | |
| | | Electric Utilities 0.3% | | | | | | | | | |
| a | | PG&E Corp. | | | United States | | | | 425,751 | | | | 10,111,586 | |
| | | | | | | | | | | | | | |
FRANKLIN TEMPLETON VARIABLE INSURANCE PRODUCTS TRUST
STATEMENT OF INVESTMENTS
Franklin Mutual Shares VIP Fund(continued)
| | | | | | | | | | | | | | |
| | | | |
| | | | | Country | | | Shares/ Units/ Warrants | | | Value | |
| | Common Stocks and Other Equity Interests(continued) | | | | | | | | | | | | |
| | | Electrical Equipment 1.5% | | | | | | | | | |
| a | | Sensata Technologies Holding PLC | | | United States | | | | 1,091,630 | | | $ | 48,948,689 | |
| | | | | | | | | | | | | | |
| | | Energy Equipment & Services 1.2% | | | | | | | | | |
| | Baker Hughes a GE Co., A | | | United States | | | | 1,491,285 | | | | 32,062,627 | |
| a | | McDermott International Inc. | | | United States | | | | 699,157 | | | | 4,572,487 | |
| | | | | | | | | | | | | | |
| | | | | | | | | | | | | 36,635,114 | |
| | | | | | | | | | | | | | |
| | | Entertainment 2.3% | | | | | | | | | |
| | The Walt Disney Co. | | | United States | | | | 659,400 | | | | 72,303,210 | |
| | | | | | | | | | | | | | |
| | | Equity Real Estate Investment Trusts (REITs) 1.4% | | | | | | | | | |
| | Alexander’s Inc. | | | United States | | | | 40,126 | | | | 12,227,997 | |
| | Vornado Realty Trust | | | United States | | | | 494,996 | | | | 30,704,602 | |
| | | | | | | | | | | | | | |
| | | | | | | | | | | | | 42,932,599 | |
| | | | | | | | | | | | | | |
| | | Food & Staples Retailing 2.9% | | | | | | | | | |
| | The Kroger Co. | | | United States | | | | 1,818,160 | | | | 49,999,400 | |
| | Walgreens Boots Alliance Inc. | | | United States | | | | 594,558 | | | | 40,626,148 | |
| | | | | | | | | | | | | | |
| | | | | | | | | | | | | 90,625,548 | |
| | | | | | | | | | | | | | |
| | | Health Care Equipment & Supplies 3.6% | | | | | | | | | |
| | Medtronic PLC | | | United States | | | | 1,257,412 | | | | 114,374,196 | |
| | | | | | | | | | | | | | |
| | | Health Care Providers & Services 1.5% | | | | | | | | | |
| | CVS Health Corp. | | | United States | | | | 732,861 | | | | 48,017,053 | |
| | | | | | | | | | | | | | |
| | | Household Durables 2.5% | | | | | | | | | |
| | Lennar Corp., A | | | United States | | | | 592,100 | | | | 23,180,715 | |
| | Newell Brands Inc. | | | United States | | | | 2,155,117 | | | | 40,063,625 | |
| | Toll Brothers Inc. | | | United States | | | | 480,500 | | | | 15,822,865 | |
| | | | | | | | | | | | | | |
| | | | | | | | | | | | | 79,067,205 | |
| | | | | | | | | | | | | | |
| | | Household Products 0.6% | | | | | | | | | |
| | Energizer Holdings Inc. | | | United States | | | | 458,300 | | | | 20,692,245 | |
| | | | | | | | | | | | | | |
| | | Independent Power & Renewable Electricity Producers 0.6% | | | | | | | | | |
| a | | Vistra Energy Corp. | | | United States | | | | 805,295 | | | | 18,433,203 | |
| | | | | | | | | | | | | | |
| | | Industrial Conglomerates 0.8% | | | | | | | | | |
| | General Electric Co. | | | United States | | | | 3,376,300 | | | | 25,558,591 | |
| | | | | | | | | | | | | | |
| | | Insurance 8.0% | | | | | | | | | |
| | Alleghany Corp. | | | United States | | | | 93,288 | | | | 58,148,276 | |
| | American International Group Inc. | | | United States | | | | 1,394,096 | | | | 54,941,324 | |
| a | | Brighthouse Financial Inc. | | | United States | | | | 582,400 | | | | 17,751,552 | |
| | Chubb Ltd. | | | United States | | | | 351,145 | | | | 45,360,911 | |
| | The Hartford Financial Services Group Inc. | | | United States | | | | 916,278 | | | | 40,728,557 | |
| | MetLife Inc. | | | United States | | | | 892,303 | | | | 36,637,961 | |
| | | | | | | | | | | | | | |
| | | | | | | | | | | | | 253,568,581 | |
| | | | | | | | | | | | | | |
| | | IT Services 1.5% | | | | | | | | | |
| | Cognizant Technology Solutions Corp., A. | | | United States | | | | 729,270 | | | | 46,294,060 | |
| | | | | | | | | | | | | | |
| | | Machinery 0.7% | | | | | | | | | |
| | CNH Industrial NV | | | United Kingdom | | | | 663,594 | | | | 5,996,023 | |
| | CNH Industrial NV, special voting | | | United Kingdom | | | | 1,844,814 | | | | 16,669,148 | |
| | | | | | | | | | | | | | |
| | | | | | | | | | | | | 22,665,171 | |
| | | | | | | | | | | | | | |
FRANKLIN TEMPLETON VARIABLE INSURANCE PRODUCTS TRUST
STATEMENT OF INVESTMENTS
Franklin Mutual Shares VIP Fund(continued)
| | | | | | | | | | | | | | |
| | | | |
| | | | | Country | | | Shares/ Units/ Warrants | | | Value | |
| | | Common Stocks and Other Equity Interests(continued) | | | | | | | | | |
| | | Media 4.8% | | | | | | | | | |
| a | | Charter Communications Inc., A | | | United States | | | | 213,313 | | | $ | 60,787,806 | |
| | Comcast Corp., A | | | United States | | | | 1,255,300 | | | | 42,742,965 | |
| a | | Cumulus Media Inc., A | | | United States | | | | 60,894 | | | | 657,655 | |
| a | | Cumulus Media Inc., B | | | United States | | | | 90,790 | | | | 862,505 | |
| a | | Discovery Inc., C | | | United States | | | | 1,186,600 | | | | 27,386,728 | |
| a | | DISH Network Corp., A | | | United States | | | | 724,283 | | | | 18,085,346 | |
| | | | | | | | | | | | | | |
| | | | | | | | | | | | | 150,523,005 | |
| | | | | | | | | | | | | | |
| | | Metals & Mining 0.4% | | | | | | | | | |
| | thyssenkrupp AG | | | Germany | | | | 419,840 | | | | 7,212,308 | |
| | Warrior Met Coal Inc. | | | United States | | | | 248,815 | | | | 5,998,930 | |
| | | | | | | | | | | | | | |
| | | | | | | | | | | | | 13,211,238 | |
| | | | | | | | | | | | | | |
| | | Oil, Gas & Consumable Fuels 8.0% | | | | | | | | | |
| | Anadarko Petroleum Corp. | | | United States | | | | 776,770 | | | | 34,053,597 | |
| | BP PLC | | | United Kingdom | | | | 3,508,292 | | | | 22,188,551 | |
| | Kinder Morgan Inc. | | | United States | | | | 2,798,340 | | | | 43,038,469 | |
| | Marathon Oil Corp. | | | United States | | | | 2,769,401 | | | | 39,713,210 | |
| | Plains All American Pipeline LP | | | United States | | | | 979,300 | | | | 19,625,172 | |
| | Royal Dutch Shell PLC, A (EUR Traded) | | | United Kingdom | | | | 1,247,949 | | | | 36,684,082 | |
| | Royal Dutch Shell PLC, A (GBP Traded) | | | United Kingdom | | | | 735,364 | | | | 21,639,110 | |
| | The Williams Cos. Inc. | | | United States | | | | 1,583,398 | | | | 34,913,926 | |
| | | | | | | | | | | | | | |
| | | | | | | | | | | | | 251,856,117 | |
| | | | | | | | | | | | | | |
| | | Pharmaceuticals 7.3% | | | | | | | | | |
| | Eli Lilly & Co. | | | United States | | | | 630,886 | | | | 73,006,128 | |
| | Merck & Co. Inc. | | | United States | | | | 1,013,148 | | | | 77,414,639 | |
| | Novartis AG, ADR | | | Switzerland | | | | 937,381 | | | | 80,436,663 | |
| | | | | | | | | | | | | | |
| | | | | | | | | | | | | 230,857,430 | |
| | | | | | | | | | | | | | |
| | | Professional Services 0.5% | | | | | | | | | |
| | RELX PLC | | | United Kingdom | | | | 767,173 | | | | 15,814,823 | |
| | | | | | | | | | | | | | |
| | | Software 2.2% | | | | | | | | | |
| a | | Avaya Holdings Corp., wts., 12/15/22 | | | United States | | | | 91,551 | | | | 187,679 | |
| a | | Red Hat Inc. | | | United States | | | | 155,000 | | | | 27,224,200 | |
| | Symantec Corp. | | | United States | | | | 2,283,061 | | | | 43,138,438 | |
| | | | | | | | | | | | | | |
| | | | | | | | | | | | | 70,550,317 | |
| | | | | | | | | | | | | | |
| | | Technology Hardware, Storage & Peripherals 3.2% | | | | | | | | | |
| | Apple Inc. | | | United States | | | | 21,497 | | | | 3,390,937 | |
| | Hewlett Packard Enterprise Co. | | | United States | | | | 1,843,367 | | | | 24,350,878 | |
| | Samsung Electronics Co. Ltd | | | South Korea | | | | 1,388,076 | | | | 48,233,868 | |
| | Western Digital Corp. | | | United States | | | | 712,700 | | | | 26,348,519 | |
| | | | | | | | | | | | | | |
| | | | | | | | | | | | | 102,324,202 | |
| | | | | | | | | | | | | | |
| | | Tobacco 2.8% | | | | | | | | | |
| | Altria Group Inc. | | | United States | | | | 586,888 | | | | 28,986,398 | |
| | British American Tobacco PLC | | | United Kingdom | | | | 1,099,335 | | | | 35,048,173 | |
| | British American Tobacco PLC, ADR | | | United Kingdom | | | | 376,733 | | | | 12,002,713 | |
| | Imperial Brands PLC | | | United Kingdom | | | | 430,978 | | | | 13,064,103 | |
| | | | | | | | | | | | | | |
| | | | | | | | | | | | | 89,101,387 | |
| | | | | | | | | | | | | | |
FRANKLIN TEMPLETON VARIABLE INSURANCE PRODUCTS TRUST
STATEMENT OF INVESTMENTS
Franklin Mutual Shares VIP Fund(continued)
| | | | | | | | | | | | | | |
| | | | |
| | | | | Country | | | Shares/ Units/ Warrants | | | Value | |
| | Common Stocks and Other Equity Interests (continued) | | | | | | | | | | | | |
| | | Wireless Telecommunication Services 1.2% | | | | | | | | | |
| a | | T-Mobile U.S. Inc. | | | United States | | | | 623,800 | | | $ | 39,679,918 | |
| | | | | | | | | | | | | | |
| | | | |
| | Total Common Stocks and Other Equity Interests
(Cost $2,237,901,769) | | | | | | | | | | | 2,598,382,962 | |
| | | | | | | | | | | | | | |
| | | |
| | Management Investment Companies (Cost $34,970,362) 1.0% | | | | | | | | | |
| | | Diversified Financial Services 1.0% | | | | | | | | | |
| a | | Altaba Inc. | | | United States | | | | 559,700 | | | | 32,429,018 | |
| | | | | | | | | | | | | | |
| | | | |
| | | | | | | | Principal Amount | | | | |
| | | | |
| | Corporate Notes and Senior Floating Rate Interests 3.2% | | | | | | | | | | | | |
| e | | Banff Merger Sub Inc., senior note, 144A, 9.75%, 9/01/26 | | | United States | | | $ | 18,444,000 | | | | 16,922,370 | |
| f,g | | Cumulus Media New Holdings Inc., Term Loan, 7.03%,(1-month USD LIBOR + 4.50%), 5/13/22 | | | United States | | | | 11,747,525 | | | | 11,147,908 | |
| | Frontier Communications Corp., | �� | | | | | | | | | | | |
| | senior note, 10.50%, 9/15/22 | | | United States | | | | 22,633,000 | | | | 15,843,100 | |
| | senior note, 11.00%, 9/15/25 | | | United States | | | | 25,535,000 | | | | 16,021,936 | |
| e | | McDermott Technology Americas Inc., senior note, 144A, 10.625%, 5/01/24 | | | United States | | | | 9,797,000 | | | | 8,302,958 | |
| f,g | | Veritas US Inc., | | | | | | | | | | | | |
| | Term Loan B1, 7.022%,(1-month USD LIBOR + 4.50%), 1/27/23 | | | United States | | | | 13,181,244 | | | | 11,341,366 | |
| | Term Loan B1, 7.303%,(3-month USD LIBOR + 4.50%), 1/27/23 | | | United States | | | | 4,321,334 | | | | 3,718,149 | |
| e | | Veritas US Inc./Veritas Bermuda Ltd., | | | | | | | | | | | | |
| | senior note, 144A, 7.50%, 2/01/23 | | | United States | | | | 2,856,000 | | | | 2,341,920 | |
| | senior note, 144A, 10.50%, 2/01/24 | | | United States | | | | 23,445,000 | | | | 15,532,313 | |
| | | | | | | | | | | | | | |
| | | | |
| | Total Corporate Notes and Senior Floating Rate Interests (Cost $122,570,973) | | | | | | | | | | | 101,172,020 | |
| | | | | | | | | | | | | | |
| | | | |
| | Corporate Notes and Senior Floating Rate Interests in Reorganization 1.9% | | | | | | | | | | | | |
| b,c,h | | Broadband Ventures III LLC, secured promissory note, 5.00%, 2/01/12 | | | United States | | | | 1,754 | | | | — | |
| h | | iHeartCommunications Inc., | | | | | | | | | | | | |
| | senior secured note, first lien, 9.00%, 12/15/19 | | | United States | | | | 26,449,000 | | | | 17,853,075 | |
| | f,gTranche D Term Loan, 8.443%,(3-month USD LIBOR + 6.75%), 1/30/19 | | | United States | | | | 34,746,619 | | | | 23,502,265 | |
| | f,gTranche E Term Loan, 9.193%,(3-month USD LIBOR + 7.50%), 7/30/19 | | | United States | | | | 11,168,253 | | | | 7,550,521 | |
| f,g,h | | Toys RUS-Delaware Inc., TermB-4 Loan, 10.067%,(3-month USD LIBOR + 8.75%), 4/24/20 | | | United States | | | | 20,394,452 | | | | 10,095,254 | |
| | | | | | | | | | | | | | |
| | | | |
| | Total Corporate Notes and Senior Floating Rate Interests in Reorganization (Cost $90,457,765) | | | | | | | | | | | 59,001,115 | |
| | | | | | | | | | | | | | |
| | | | |
| | | | | | | | Shares | | | | |
| | | | |
| | Companies in Liquidation 0.0%† | | | | | | | | | | | | |
| a,b,d | | Avaya Holdings Corp., Contingent Distribution | | | United States | | | | 30,319,000 | | | | — | |
| a,b,d | | Avaya Inc., Contingent Distribution | | | United States | | | | 34,518,267 | | | | — | |
| a,b,d | | Tribune Media, Litigation Trust, Contingent Distribution | | | United States | | | | 398,509 | | | | — | |
FRANKLIN TEMPLETON VARIABLE INSURANCE PRODUCTS TRUST
STATEMENT OF INVESTMENTS
Franklin Mutual Shares VIP Fund(continued)
| | | | | | | | | | | | | | |
| | | | |
| | | | | Country | | | Shares | | | Value | |
| | | | |
| | Companies in Liquidation(continued) | | | | | | | | | | | | |
| a,d | | Vistra Energy Corp., Litigation Trust, Contingent Distribution | | | United States | | | | 90,618,406 | | | $ | 81,557 | |
| | | | | | | | | | | | | | |
| | | | |
| | Total Companies in Liquidation (Cost $3,081,854) | | | | | | | | | | | 81,557 | |
| | | | | | | | | | | | | | |
| | | | |
| | Total Investments before Short Term Investments
(Cost $2,488,982,723) | | | | | | | | | | | 2,791,066,672 | |
| | | | | | | | | | | | | | |
| | | | |
| | | | | | | | Principal Amount | | | | |
| | | | |
| | Short Term Investments 11.3% | | | | | | | | | | | | |
| | | U.S. Government and Agency Securities 11.3% | | | | | | | | | |
| i | | FHLB, 1/02/19 | | | United States | | | $ | 28,200,000 | | | | 28,200,000 | |
| i | | U.S. Treasury Bill, 1/02/19 | | | United States | | | | 35,000,000 | | | | 35,000,000 | |
| | 1/03/19 | | | United States | | | | 50,000,000 | | | | 49,996,838 | |
| | 1/10/19 | | | United States | | | | 50,000,000 | | | | 49,974,654 | |
| | j1/17/19 - 1/24/19 | | | United States | | | | 44,000,000 | | | | 43,946,801 | |
| | 1/29/19 - 6/13/19 | | | United States | | | | 150,000,000 | | | | 149,085,675 | |
| | | | | | | | | | | | | | |
| | | | |
| | Total U.S. Government and Agency Securities
(Cost $356,180,141) | | | | | | | | | | | 356,203,968 | |
| | | | | | | | | | | | | | |
| | | | |
| | Total Investments (Cost $2,845,162,864) 99.6% | | | | | | | | | | | 3,147,270,640 | |
| | | | |
| | Securities Sold Short (1.2)% | | | | | | | | | | | (39,080,983 | ) |
| | | | |
| | Other Assets, less Liabilities 1.6% | | | | | | | | | | | 51,014,860 | |
| | | | | | | | | | | | | | |
| | | | |
| | Net Assets 100.0% | | | | | | | | | | $ | 3,159,204,517 | |
| | | | | | | | | | | | | | |
| | | | |
| | | | | | | | Shares | | | | |
| | | | |
| k | | Securities Sold Short (1.2)% | | | | | | | | | | | | |
| | | Common Stocks (1.2)% | | | | | | | | | |
| | | Internet & Direct Marketing Retail (0.9)% | | | | | | | | | |
| | Alibaba Group Holding Ltd., ADR | | | China | | | | 214,876 | | | | (29,453,054 | ) |
| | | | | | | | | | | | | | |
| | | Pharmaceuticals (0.3)% | | | | | | | | | |
| | Takeda Pharmaceutical Co. Ltd. | | | Japan | | | | 284,810 | | | | (9,627,929 | ) |
| | | | | | | | | | | | | | |
| | | | |
| | Total Securities Sold Short (Proceeds $46,016,113) | | | | | | | | | | $ | (39,080,983 | ) |
| | | | | | | | | | | | | | |
FRANKLIN TEMPLETON VARIABLE INSURANCE PRODUCTS TRUST
STATEMENT OF INVESTMENTS
Franklin Mutual Shares VIP Fund(continued)
†Rounds to less than 0.1% of net assets.
aNon-income producing.
bFair valued using significant unobservable inputs. See Note 12 regarding fair value measurements.
cSee Note 8 regarding restricted securities.
dContingent distributions represent the right to receive additional distributions, if any, during the reorganization of the underlying company. Shares represent total underlying principal of debt securities.
eSecurity was purchased pursuant to Rule 144A under the Securities Act of 1933 and may be sold in transactions exempt from registration only to qualified institutional buyers or in a public offering registered under the Securities Act of 1933. These securities have been deemed liquid under guidelines approved by the Trust’s Board of Trustees. At December 31, 2018, the aggregate value of these securities was $43,099,561, representing 1.4% of net assets.
fThe coupon rate shown represents the rate at period end.
gSee Note 1(f) regarding senior floating rate interests.
hSee Note 7 regarding credit risk and defaulted securities.
iThe security was issued on a discount basis with no stated coupon rate.
jA portion or all of the security has been segregated as collateral for securities sold short and open forward exchange contracts. At December 31, 2018, the aggregate value of these securities pledged amounted to $17,908,984, representing 0.6% of net assets.
kSee Note 1(d) regarding securities sold short.
At December 31, 2018, the Fund had the following futures contracts outstanding. See Note 1(c).
Futures Contracts
| | | | | | | | | | | | | | | | | | | | |
| | | | | |
| Description | | Type | | | Number of
Contracts | | | Notional
Amount* | | | Expiration Date | | | Value/ Unrealized Appreciation (Depreciation) | |
| Currency Contracts | | | | | | | | | | | | | | | | | | | | |
EUR/USD | | | Short | | | | 257 | | | $ | 37,016,031 | | | | 3/18/19 | | | $ | 5,526 | |
GBP/USD | | | Short | | | | 959 | | | | 76,660,063 | | | | 3/18/19 | | | | 158,466 | |
| | | | | | | | | | | | | | | | | | | | |
Total Futures Contracts | | | | | | | | | | | | | | | | | | $ | 163,992 | |
| | | | | | | | | | | | | | | | | | | | |
*As of period end.
FRANKLIN TEMPLETON VARIABLE INSURANCE PRODUCTS TRUST
STATEMENT OF INVESTMENTS
Franklin Mutual Shares VIP Fund(continued)
At December 31, 2018, the Fund had the following forward exchange contracts outstanding. See Note 1(c).
Forward Exchange Contracts
| | | | | | | | | | | | | | | | | | | | | | | | | | | | |
| | | | | | | |
| Currency | | Counterpartya | | | Type | | | Quantity | | | Contract
Amount | | | Settlement
Date | | | Unrealized
Appreciation | | | Unrealized
Depreciation | |
| OTC Forward Exchange Contracts | | | | | | | | | | | | | | | | | | | | | | | | | | | | |
South Korean Won | | | BONY | | | | Sell | | | | 3,860,199,792 | | | $ | 3,447,838 | | | | 1/18/19 | | | $ | — | | | $ | (20,019 | ) |
South Korean Won | | | HSBK | | | | Buy | | | | 6,315,745,800 | | | | 5,597,869 | | | | 1/18/19 | | | | 75,958 | | | | — | |
South Korean Won | | | HSBK | | | | Sell | | | | 33,022,504,444 | | | | 29,493,859 | | | | 1/18/19 | | | | — | | | | (172,305 | ) |
South Korean Won | | | UBSW | | | | Sell | | | | 22,526,948,564 | | | | 20,116,939 | | | | 1/18/19 | | | | — | | | | (120,416 | ) |
British Pound | | | BOFA | | | | Buy | | | | 1,237,567 | | | | 1,569,806 | | | | 2/14/19 | | | | 11,958 | | | | — | |
British Pound | | | HSBK | | | | Buy | | | | 854,173 | | | | 1,087,584 | | | | 2/14/19 | | | | 4,155 | | | | — | |
British Pound | | | UBSW | | | | Sell | | | | 17,984,807 | | | | 22,640,984 | | | | 2/14/19 | | | | — | | | | (345,837 | ) |
Euro | | | BOFA | | | | Buy | | | | 1,660,723 | | | | 1,903,337 | | | | 2/20/19 | | | | 7,724 | | | | — | |
Euro | | | BONY | | | | Sell | | | | 25,861,620 | | | | 29,352,111 | | | | 2/20/19 | | | | — | | | | (407,893 | ) |
Euro | | | HSBK | | | | Buy | | | | 1,399,482 | | | | 1,603,509 | | | | 2/20/19 | | | | 6,932 | | | | — | |
Euro | | | SSBT | | | | Buy | | | | 457,198 | | | | 522,967 | | | | 2/20/19 | | | | 3,149 | | | | — | |
Euro | | | UBSW | | | | Buy | | | | 1,138,481 | | | | 1,304,620 | | | | 2/20/19 | | | | 5,476 | | | | — | |
| | | | | | | | | | | | | | | | | | | | | | | | |
Total Forward Exchange Contracts | | | | | | | | | | | | | | | | | | | | | | $ | 115,352 | | | $ | (1,066,470 | ) |
| | | | | | | | | | | | | | | | | | | | | | | | |
Net unrealized appreciation (depreciation) | | | | | | | | | | | | | | | | | | | | | | | | | | $ | (951,118 | ) |
| | | | | | | | | | | | | | | | | | | | | | | | | | | | |
aMay be comprised of multiple contracts with the same counterparty, currency and settlement date.
See Note 9 regarding other derivative information.
See Abbreviations on pageMS-36.
| | | | | | |
| | | |
| | The accompanying notes are an integral part of these financial statements. | Annual Report | | | MS-21 | |
FRANKLIN TEMPLETON VARIABLE INSURANCE PRODUCTS TRUST
Financial Statements
Statement of Assets and Liabilities
December 31, 2018
| | | | |
| |
| | | Franklin Mutual
Shares VIP Fund | |
| |
| Assets: | | | | |
Investments in securities: | | | | |
Cost - Unaffiliated issuers | | $ | 2,845,162,864 | |
| | | | |
Value - Unaffiliated issuers | | $ | 3,147,270,640 | |
Cash | | | 366,410 | |
Foreign currency, at value (cost $431,882) | | | 432,227 | |
Receivables: | | | | |
Investment securities sold | | | 4,636,697 | |
Capital shares sold | | | 1,608,439 | |
Dividends and interest | | | 8,921,218 | |
European Union tax reclaims | | | 1,629,961 | |
Deposits with brokers for: | | | | |
Securities sold short | | | 39,252,523 | |
Futures contracts | | | 3,049,660 | |
Unrealized appreciation on OTC forward exchange contracts | | | 115,352 | |
Other assets | | | 491 | |
| | | | |
Total assets | | | 3,207,283,618 | |
| | | | |
| |
| Liabilities: | | | | |
Payables: | | | | |
Investment securities purchased | | | 3,019,153 | |
Capital shares redeemed | | | 1,100,385 | |
Management fees | | | 1,863,045 | |
Distribution fees | | | 1,184,188 | |
Variation margin on futures contracts | | | 322,175 | |
Securities sold short, at value (proceeds $46,016,113) | | | 39,080,983 | |
Unrealized depreciation on OTC forward exchange contracts | | | 1,066,470 | |
Accrued expenses and other liabilities | | | 442,702 | |
| | | | |
Total liabilities | | | 48,079,101 | |
| | | | |
Net assets, at value | | $ | 3,159,204,517 | |
| | | | |
Net assets consist of: | | | | |
Paid-in capital | | $ | 2,494,070,790 | |
Total distributable earnings (loss) | | | 665,133,727 | |
| | | | |
Net assets, at value | | $ | 3,159,204,517 | |
| | | | |
| |
| Class 1: | | | | |
Net assets, at value | | $ | 537,323,852 | |
| | | | |
Shares outstanding | | | 30,340,507 | |
| | | | |
Net asset value and maximum offering price per share | | $ | 17.71 | |
| | | | |
| |
| Class 2: | | | | |
Net assets, at value | | $ | 2,516,833,826 | |
| | | | |
Shares outstanding | | | 144,638,819 | |
| | | | |
Net asset value and maximum offering price per share | | $ | 17.40 | |
| | | | |
| |
| Class 4: | | | | |
Net assets, at value | | $ | 105,046,839 | |
| | | | |
Shares outstanding | | | 5,985,399 | |
| | | | |
Net asset value and maximum offering price per share | | $ | 17.55 | |
| | | | |
| | | | |
| | | |
| MS-22 | | Annual Report | The accompanying notes are an integral part of these financial statements. | | |
FRANKLIN TEMPLETON VARIABLE INSURANCE PRODUCTS TRUST
FINANCIAL STATEMENTS
Statement of Operations
for the year ended December 31, 2018
| | | | |
| |
| | | Franklin Mutual
Shares VIP Fund | |
Investment income: | | | | |
Dividends: (net of foreign taxes)* | | | | |
Unaffiliated issuers | | $ | 80,591,074 | |
Interest: | | | | |
Unaffiliated issuers | | | 16,013,718 | |
Income from securities loaned: | | | | |
Unaffiliated issuers (net of fees and rebates) | | | 13,436 | |
Non-controlled affiliates (Note 3e) | | | 27,822 | |
Other income (Note 1g) | | | 339,500 | |
| | | | |
Total investment income | | | 96,985,550 | |
| | | | |
Expenses: | | | | |
Management fees (Note 3a) | | | 26,636,716 | |
Distribution fees: (Note 3c) | | | | |
Class 2 | | | 7,946,604 | |
Class 4 | | | 418,396 | |
Custodian fees (Note 4) | | | 106,904 | |
Reports to shareholders | | | 408,841 | |
Professional fees | | | 186,707 | |
Trustees’ fees and expenses | | | 28,920 | |
Dividends and interest on securities sold short | | | 211,805 | |
Other | | | 97,655 | |
| | | | |
Total expenses | | | 36,042,548 | |
Expense reductions (Note 4) | | | (29,109 | ) |
Expenses waived/paid by affiliates (Note 3e) | | | (9,991 | ) |
| | | | |
Net expenses | | | 36,003,448 | |
| | | | |
Net investment income | | | 60,982,102 | |
| | | | |
Realized and unrealized gains (losses): | | | | |
Net realized gain (loss) from: | | | | |
Investments: | | | | |
Unaffiliated issuers | | | 287,412,097 | |
Non-controlled affiliates (Note 3e and 10) | | | 4,122 | |
Foreign currency transactions | | | (422,929 | ) |
Forward exchange contracts | | | 10,506,122 | |
Futures contracts | | | 10,448,555 | |
Securities sold short | | | 844,435 | |
| | | | |
Net realized gain (loss) | | | 308,792,402 | |
| | | | |
Net change in unrealized appreciation (depreciation) on: | | | | |
Investments: | | | | |
Unaffiliated issuers | | | (703,603,439 | ) |
Translation of other assets and liabilities denominated in foreign currencies | | | (121,203 | ) |
Forward exchange contracts | | | 4,872,642 | |
Futures contracts | | | 2,259,390 | |
Securities sold short | | | 6,672,210 | |
| | | | |
Net change in unrealized appreciation (depreciation) | | | (689,920,400 | ) |
| | | | |
Net realized and unrealized gain (loss) | | | (381,127,998 | ) |
| | | | |
Net increase (decrease) in net assets resulting from operations | | $ | (320,145,896 | ) |
| | | | |
| |
*Foreign taxes withheld on dividends | | $ | 2,323,484 | |
| | | | | | |
| | | |
| | The accompanying notes are an integral part of these financial statements. | Annual Report | | | MS-23 | |
FRANKLIN TEMPLETON VARIABLE INSURANCE PRODUCTS TRUST
FINANCIAL STATEMENTS
Statements of Changes in Net Assets
| | | | | | | | |
| |
| | | Franklin Mutual Shares VIP Fund | |
| |
| | | Year Ended December 31, | |
| | |
| | | 2018 | | | 2017 | |
Increase (decrease) in net assets: | | | | | | | | |
Operations: | | | | | | | | |
Net investment income | | $ | 60,982,102 | | | $ | 91,754,971 | |
Net realized gain (loss) | | | 308,792,402 | | | | 170,010,315 | |
Net change in unrealized appreciation (depreciation) | | | (689,920,400 | ) | | | 86,743,730 | |
| | | | |
Net increase (decrease) in net assets resulting from operations | | | (320,145,896 | ) | | | 348,509,016 | |
| | | | |
Distributions to shareholders: (Note 1h) | | | | | | | | |
Class 1 | | | (37,929,843 | ) | | | (41,482,289 | ) |
Class 2 | | | (194,310,469 | ) | | | (222,945,179 | ) |
Class 4 | | | (7,177,027 | ) | | | (7,418,016 | ) |
| | | | |
Total distributions to shareholders | | | (239,417,339 | ) | | | (271,845,484 | ) |
| | | | |
Capital share transactions: (Note 2) | | | | | | | | |
Class 1 | | | (27,996,947 | ) | | | 32,173,830 | |
Class 2 | | | (506,425,142 | ) | | | (207,728,869 | ) |
Class 4 | | | (365,846 | ) | | | (1,780,903 | ) |
| | | | |
Total capital share transactions | | | (534,787,935 | ) | | | (177,335,942 | ) |
| | | | |
Net increase (decrease) in net assets | | | (1,094,351,170 | ) | | | (100,672,410 | ) |
Net assets: | | | | | | | | |
Beginning of year | | | 4,253,555,687 | | | | 4,354,228,097 | |
| | | | |
End of year (Note 1h) | | $ | 3,159,204,517 | | | $ | 4,253,555,687 | |
| | | | |
| | | | |
| | | |
| MS-24 | | Annual Report | The accompanying notes are an integral part of these financial statements. | | |
FRANKLIN TEMPLETON VARIABLE INSURANCE PRODUCTS TRUST
Notes to Financial Statements
Franklin Mutual Shares VIP Fund
1. Organization and Significant Accounting Policies
Franklin Templeton Variable Insurance Products Trust (Trust) is registered under the Investment Company Act of 1940 (1940 Act) as anopen-end management investment company, consisting of eighteen separate funds and applies the specialized accounting and reporting guidance in U.S. Generally Accepted Accounting Principles (U.S. GAAP). Franklin Mutual Shares VIP Fund (Fund) is included in this report. Shares of the Fund are generally sold only to insurance company separate accounts to fund the benefits of variable life insurance policies or variable annuity contracts. The Fund offers three classes of shares: Class 1, Class 2 and Class 4. Each class of shares may differ by its distribution fees, voting rights on matters affecting a single class and its exchange privilege.
The following summarizes the Fund’s significant accounting policies.
a. Financial Instrument Valuation
The Fund’s investments in financial instruments are carried at fair value daily. Fair value is the price that would be received to sell an asset or paid to transfer a liability in an orderly transaction between market participants on the measurement date. The Fund calculates the net asset value (NAV) per share each business day as of 4 p.m. Eastern time or the regularly scheduled close of the New York Stock Exchange (NYSE), whichever is earlier. Under compliance policies and procedures approved by the Trust’s Board of Trustees (the Board), the Fund’s administrator has responsibility for oversight of valuation, including leading the cross-functional Valuation Committee (VC). The Fund may utilize independent pricing services, quotations from securities and financial instrument dealers, and other market sources to determine fair value.
Equity securities and derivative financial instruments listed on an exchange or on the NASDAQ National Market System are valued at the last quoted sale price or the official closing price of the day, respectively. Foreign equity securities are valued as of the close of trading on the foreign stock exchange on which the security is primarily traded, or as of 4 p.m. Eastern time. The value is then converted into its U.S. dollar equivalent at the foreign exchange rate in effect at 4 p.m. Eastern time on the day that the value of the security is determined.Over-the-counter (OTC) securities are valued within the range of the most recent quoted bid and ask prices. Securities that trade in multiple markets or on multiple exchanges are valued according to the
broadest and most representative market. Certain equity securities are valued based upon fundamental characteristics or relationships to similar securities.
Debt securities generally trade in the OTC market rather than on a securities exchange. The Fund’s pricing services use multiple valuation techniques to determine fair value. In instances where sufficient market activity exists, the pricing services may utilize a market-based approach through which quotes from market makers are used to determine fair value. In instances where sufficient market activity may not exist or is limited, the pricing services also utilize proprietary valuation models which may consider market characteristics such as benchmark yield curves, credit spreads, estimated default rates, anticipated market interest rate volatility, coupon rates, anticipated timing of principal repayments, underlying collateral, and other unique security features in order to estimate the relevant cash flows, which are then discounted to calculate the fair value.
Investments inopen-end mutual funds are valued at the closing NAV.
Certain derivative financial instruments trade in the OTC market. The Fund’s pricing services use various techniques including industry standard option pricing models and proprietary discounted cash flow models to determine the fair value of those instruments. The Fund’s net benefit or obligation under the derivative contract, as measured by the fair value of the contract, is included in net assets.
The Fund has procedures to determine the fair value of financial instruments for which market prices are not reliable or readily available. Under these procedures, the Fund primarily employs a market-based approach which may use related or comparable assets or liabilities, recent transactions, market multiples, book values, and other relevant information for the investment to determine the fair value of the investment. An income-based valuation approach may also be used in which the anticipated future cash flows of the investment are discounted to calculate fair value. Discounts may also be applied due to the nature or duration of any restrictions on the disposition of the investments. Due to the inherent uncertainty of valuations of such investments, the fair values may differ significantly from the values that would have been used had an active market existed.
FRANKLIN TEMPLETON VARIABLE INSURANCE PRODUCTS TRUST
NOTES TO FINANCIAL STATEMENTS
Franklin Mutual Shares VIP Fund(continued)
1. Organization and Significant Accounting Policies(continued)
a. Financial Instrument Valuation(continued)
Trading in securities on foreign securities stock exchanges and OTC markets may be completed before 4 p.m. Eastern time. In addition, trading in certain foreign markets may not take place on every Fund’s business day. Occasionally, events occur between the time at which trading in a foreign security is completed and 4 p.m. Eastern time that might call into question the reliability of the value of a portfolio security held by the Fund. As a result, differences may arise between the value of the Fund’s portfolio securities as determined at the foreign market close and the latest indications of value at 4 p.m. Eastern time. In order to minimize the potential for these differences, the VC monitors price movements following the close of trading in foreign stock markets through a series of country specific market proxies (such as baskets of American Depositary Receipts, futures contracts and exchange traded funds). These price movements are measured against established trigger thresholds for each specific market proxy to assist in determining if an event has occurred that may call into question the reliability of the values of the foreign securities held by the Fund. If such an event occurs, the securities may be valued using fair value procedures, which may include the use of independent pricing services. At December 31, 2018, a market event occurred resulting in a portion of the securities held by the Fund being valued using fair value procedures.
When the last day of the reporting period is anon-business day, certain foreign markets may be open on those days that the Fund’s NAV is not calculated, which could result in differences between the value of the Fund’s portfolio securities on the last business day and the last calendar day of the reporting period. Any significant security valuation changes due to an open foreign market are adjusted and reflected by the Fund for financial reporting purposes.
b. Foreign Currency Translation
Portfolio securities and other assets and liabilities denominated in foreign currencies are translated into U.S. dollars based on the exchange rate of such currencies against U.S. dollars on the date of valuation. The Fund may enter into foreign currency exchange contracts to facilitate transactions denominated in a foreign currency. Purchases and sales of securities, income and expense items denominated in foreign currencies are translated into U.S. dollars at the exchange rate in effect on the transaction
date. Portfolio securities and assets and liabilities denominated in foreign currencies contain risks that those currencies will decline in value relative to the U.S. dollar. Occasionally, events may impact the availability or reliability of foreign exchange rates used to convert the U.S. dollar equivalent value. If such an event occurs, the foreign exchange rate will be valued at fair value using procedures established and approved by the Board.
The Fund does not separately report the effect of changes in foreign exchange rates from changes in market prices on securities held. Such changes are included in net realized and unrealized gain or loss from investments in the Statement of Operations.
Realized foreign exchange gains or losses arise from sales of foreign currencies, currency gains or losses realized between the trade and settlement dates on securities transactions and the difference between the recorded amounts of dividends, interest, and foreign withholding taxes and the U.S. dollar equivalent of the amounts actually received or paid. Net unrealized foreign exchange gains and losses arise from changes in foreign exchange rates on foreign denominated assets and liabilities other than investments in securities held at the end of the reporting period.
c. Derivative Financial Instruments
The Fund invested in derivative financial instruments in order to manage risk or gain exposure to various other investments or markets. Derivatives are financial contracts based on an underlying or notional amount, require no initial investment or an initial net investment that is smaller than would normally be required to have a similar response to changes in market factors, and require or permit net settlement. Derivatives contain various risks including the potential inability of the counterparty to fulfill their obligations under the terms of the contract, the potential for an illiquid secondary market, and/or the potential for market movements which expose the Fund to gains or losses in excess of the amounts shown in the Statement of Assets and Liabilities. Realized gain and loss and unrealized appreciation and depreciation on these contracts for the period are included in the Statement of Operations.
Derivative counterparty credit risk is managed through a formal evaluation of the creditworthiness of all potential counter-parties. The Fund attempts to reduce its exposure to counterparty credit risk on OTC derivatives, whenever possible, by entering into International Swaps and Derivatives
FRANKLIN TEMPLETON VARIABLE INSURANCE PRODUCTS TRUST
NOTES TO FINANCIAL STATEMENTS
Franklin Mutual Shares VIP Fund(continued)
Association (ISDA) master agreements with certain counterparties. These agreements contain various provisions, including but not limited to collateral requirements, events of default, or early termination. Termination events applicable to the counterparty include certain deteriorations in the credit quality of the counterparty. Termination events applicable to the Fund include failure of the Fund to maintain certain net asset levels and/or limit the decline in net assets over various periods of time. In the event of default or early termination, the ISDA master agreement gives thenon-defaulting party the right to net andclose-out all transactions traded, whether or not arising under the ISDA agreement, to one net amount payable by one counterparty to the other. However, absent an event of default or early termination, OTC derivative assets and liabilities are presented gross and not offset in the Statement of Assets and Liabilities. Early termination by the counterparty may result in an immediate payment by the Fund of any net liability owed to that counterparty under the ISDA agreement. At December 31, 2018, the Fund had OTC derivatives in a net liability position of $973,949 and the aggregate value of collateral pledged for such contracts was $723,302.
Collateral requirements differ by type of derivative. Collateral or initial margin requirements are set by the broker or exchange clearing house for exchange traded and centrally cleared derivatives. Initial margin deposited is held at the exchange and can be in the form of cash and/or securities. For OTC derivatives traded under an ISDA master agreement, posting of collateral is required by either the Fund or the applicable counterparty if the total net exposure of all OTC derivatives with the applicable counterparty exceeds the minimum transfer amount, which typically ranges from $100,000 to $250,000, and can vary depending on the counterparty and the type of the agreement. Generally, collateral is determined at the close of Fund business each day and any additional collateral required due to changes in derivative values may be delivered by the Fund or the counterparty the next business day, or within a few business days. Collateral pledged and/or received by the Fund for OTC derivatives, if any, is held in segregated accounts with the Fund’s custodian/counterparty broker and can be in the form of cash and/or securities. Unrestricted cash may be invested according to the Fund’s investment objectives. To the extent that the amounts due to the Fund from its counterparties are not subject to collateralization or are not fully collateralized, the Fund bears the risk of loss from counterpartynon-performance.
The Fund entered into exchange traded futures contracts primarily to manage exposure to certain foreign currencies. A futures contract is an agreement between the Fund and a counterparty to buy or sell an asset at a specified price on a future date. Required initial margins are pledged by the Fund, and the daily change in fair value is accounted for as a variation margin payable or receivable in the Statement of Assets and Liabilities.
The Fund entered into OTC forward exchange contracts primarily to manage exposure to certain foreign currencies. A forward exchange contract is an agreement between the Fund and a counterparty to buy or sell a foreign currency at a specific exchange rate on a future date.
See Note 9 regarding other derivative information.
d. Securities Sold Short
The Fund is engaged in selling securities short, which obligates the Fund to replace a borrowed security with the same security at current fair value. The Fund incurs a loss if the price of the security increases between the date of the short sale and the date on which the Fund replaces the borrowed security. The Fund realizes a gain if the price of the security declines between those dates. Gains are limited to the price at which the Fund sold the security short, while losses are potentially unlimited in size.
The Fund is required to establish a margin account with the broker lending the security sold short. While the short sale is outstanding, the broker retains the proceeds of the short sale to the extent necessary to meet margin requirements until the short position is closed out. A deposit must also be maintained with the Fund’s custodian/counterparty broker consisting of cash and/or securities having a value equal to a specified percentage of the value of the securities sold short. The Fund is obligated to pay fees for borrowing the securities sold short and is required to pay the counterparty any dividends and/or interest due on securities sold short. Such dividends and/or interest and any security borrowing fees are recorded as an expense to the Fund.
e. Securities Lending
The Fund participates in an agency based securities lending program to earn additional income. The Fund receives cash collateral against the loaned securities in an amount equal to at least 102% of the fair value of the loaned securities. Collateral is maintained over the life of the loan in an amount not less than 100% of the fair value of loaned securities, as determined at the
FRANKLIN TEMPLETON VARIABLE INSURANCE PRODUCTS TRUST
NOTES TO FINANCIAL STATEMENTS
Franklin Mutual Shares VIP Fund(continued)
1. Organization and Significant Accounting Policies(continued)
e. Securities Lending(continued)
close of Fund business each day; any additional collateral required due to changes in security values is delivered to the Fund on the next business day. The collateral is deposited into a joint cash account with other funds and is used to invest in a money market fund managed by Franklin Advisers, Inc., an affiliate of the Fund. The Fund may receive income from the investment of cash collateral, in addition to lending fees and rebates paid by the borrower. Income from securities loaned, net of fees paid to the securities lending agent and/or third-party vendor, is reported separately in the Statement of Operations. The Fund bears the market risk with respect to the collateral investment, securities loaned, and the risk that the agent may default on its obligations to the Fund. If the borrower defaults on its obligation to return the securities loaned, the Fund has the right to repurchase the securities in the open market using the collateral received. The securities lending agent has agreed to indemnify the Fund in the event of default by a third party borrower. At December 31, 2018, the Fund had no securities on loan.
f. Senior Floating Rate Interests
The Fund invests in senior secured corporate loans that pay interest at rates which are periodically reset by reference to a base lending rate plus a spread. These base lending rates are generally the prime rate offered by a designated U.S. bank or the London InterBank Offered Rate (LIBOR). Senior secured corporate loans often require prepayment of principal from excess cash flows or at the discretion of the borrower. As a result, actual maturity may be substantially less than the stated maturity. Senior secured corporate loans in which the Fund invests are generally readily marketable, but may be subject to certain restrictions on resale.
g. Income and Deferred Taxes
It is the Fund’s policy to qualify as a regulated investment company under the Internal Revenue Code. The Fund intends to distribute to shareholders substantially all of its taxable income and net realized gains to relieve it from federal income and if applicable, excise taxes. As a result, no provision for U.S. federal income taxes is required.
The Fund may be subject to foreign taxation related to income received, capital gains on the sale of securities and certain foreign currency transactions in the foreign jurisdictions in which it invests. Foreign taxes, if any, are recorded based on the tax regulations and rates that exist in the foreign markets in which the Fund invests. When a capital gain tax is determined to apply, the Fund records an estimated deferred tax liability in an amount that would be payable if the securities were disposed of on the valuation date.
As a result of several court cases, in certain countries across the European Union, the Fund filed additional tax reclaims for previously withheld taxes on dividends earned in those countries (EU reclaims). These additional filings are subject to various administrative proceedings by the local jurisdictions’ tax authorities within the European Union, as well as a number of related judicial proceedings. Income recognized, if any, for EU reclaims is reflected as other income in the Statement of Operations and any related receivable, if any, is reflected as European Union tax reclaims in the Statement of Assets and Liabilities. When uncertainty exists as to the ultimate resolution of these proceedings, the likelihood of receipt of these EU reclaims, and the potential timing of payment, no amounts are reflected in the financial statements. For U.S. income tax purposes, when EU reclaims are received by the Fund and the Fund previously passed foreign tax credit on to its shareholders, the Fund must either amend historic tax reporting to shareholders or enter into a closing agreement with the Internal Revenue Service (IRS) in order to pay the associated tax liability on behalf of the Fund’s shareholders.
The Fund may recognize an income tax liability related to its uncertain tax positions under U.S. GAAP when the uncertain tax position has a less than 50% probability that it will be sustained upon examination by the tax authorities based on its technical merits. As of December 31, 2018, the Fund has determined that no tax liability is required in its financial statements related to uncertain tax positions for any open tax years (or expected to be taken in future tax years). Open tax years are those that remain subject to examination and are based on the statute of limitations in each jurisdiction in which the Fund invests.
FRANKLIN TEMPLETON VARIABLE INSURANCE PRODUCTS TRUST
NOTES TO FINANCIAL STATEMENTS
Franklin Mutual Shares VIP Fund(continued)
h. Security Transactions, Investment Income, Expenses and Distributions
Security transactions are accounted for on trade date. Realized gains and losses on security transactions are determined on a specific identification basis. Interest income and estimated expenses are accrued daily. Amortization of premium and accretion of discount on debt securities are included in interest income. Dividend income and dividends declared on securities sold short are recorded on theex-dividend date except for certain dividends from securities where the dividend rate is not available. In such cases, the dividend is recorded as soon as the information is received by the Fund. Distributions to shareholders are recorded on theex-dividend date. Distributable earnings are determined according to income tax regulations (tax basis) and may differ from earnings recorded in accordance with U.S. GAAP. These differences may be permanent or temporary. Permanent differences are reclassified among capital accounts to reflect their tax character. These reclassifications have no impact on net assets or the results of operations. Temporary differences are not reclassified, as they may reverse in subsequent periods.*
Common expenses incurred by the Trust are allocated among the Funds based on the ratio of net assets of each Fund to the combined net assets of the Trust or based on the ratio of number of shareholders of each Fund to the combined number of shareholders of the Trust. Fund specific expenses are charged directly to the Fund that incurred the expense.
Realized and unrealized gains and losses and net investment income, excluding class specific expenses, are allocated daily to each class of shares based upon the relative proportion of net assets of each class. Differences in per share distributions by class are generally due to differences in class specific expenses.
i. Accounting Estimates
The preparation of financial statements in accordance with U.S. GAAP requires management to make estimates and assumptions that affect the reported amounts of assets and liabilities at the date of the financial statements and the amounts of income and expenses during the reporting period. Actual results could differ from those estimates.
j. Guarantees and Indemnifications
Under the Trust’s organizational documents, its officers and trustees are indemnified by the Trust against certain liabilities arising out of the performance of their duties to the Trust. Additionally, in the normal course of business, the Trust, on behalf of the Fund, enters into contracts with service providers that contain general indemnification clauses. The Trust’s maximum exposure under these arrangements is unknown as this would involve future claims that may be made against the Trust that have not yet occurred. Currently, the Trust expects the risk of loss to be remote.
*Effective during the current reporting period, it is no longer required to present certain line items in the Statements of Changes in Net Assets. The below prior period amounts affected by this change are shown as they were in the prior year Statements of Changes in Net Assets.
For the year ended December 31, 2017, distributions to shareholders were as follows:
| | | | |
Distributions from net investment income : | | | | |
Class 1 | | $ | (15,730,869 | ) |
Class 2 | | | (79,241,750 | ) |
Class 4 | | | (2,544,123 | ) |
Distributions from net realized gains: | | | | |
Class 1 | | | (25,751,420 | ) |
Class 2 | | | (143,703,429 | ) |
Class 4 | | | (4,873,893 | ) |
For the year ended December 31, 2017, undistributed net investment income included in net assets was $89,531,283.
FRANKLIN TEMPLETON VARIABLE INSURANCE PRODUCTS TRUST
NOTES TO FINANCIAL STATEMENTS
Franklin Mutual Shares VIP Fund(continued)
2. Shares of Beneficial Interest
At December 31, 2018, there were an unlimited number of shares authorized (without par value). Transactions in the Fund’s shares were as follows:
| | | | | | | | | | | | | | | | | | | | |
| |
| | | Year Ended December 31, | |
| | | |
| | | 2018 | | | | | | 2017 | |
| | | | | |
| | | Shares | | | Amount | | | | | | Shares | | | Amount | |
| | | | | |
| Class 1 Shares: | | | | | | | | | | | | | | | | | | | | |
Shares sold | | | 1,228,202 | | | $ | 23,646,682 | | | | | | | | 2,282,225 | | | $ | 47,514,985 | |
Shares issued in reinvestment of distributions | | | 1,881,441 | | | | 37,929,843 | | | | | | | | 2,083,490 | | | | 41,482,289 | |
| | | | |
Shares redeemed | | | (4,336,171 | ) | | | (89,573,472 | ) | | | | | | | (2,721,619 | ) | | | (56,823,444 | ) |
| | | | |
Net increase (decrease) | | | (1,226,528 | ) | | $ | (27,996,947 | ) | | | | | | | 1,644,096 | | | $ | 32,173,830 | |
| Class 2 Shares: | | | | | | | | | | | | | | | | | | | | |
Shares sold | | | 14,955,793 | | | $ | 302,887,079 | | | | | | | | 5,279,163 | | | $ | 107,845,830 | |
Shares issued in reinvestment of distributions | | | 9,803,757 | | | | 194,310,469 | | | | | | | | 11,374,754 | | | | 222,945,179 | |
Shares redeemed | | | (50,860,562 | ) | | | (1,003,622,690 | ) | | | | | | | (26,252,304 | ) | | | (538,519,878 | ) |
| | | | |
Net increase (decrease) | | | (26,101,012 | ) | | $ | (506,425,142 | ) | | | | | | | (9,598,387 | ) | | $ | (207,728,869 | ) |
| | | | |
| Class 4 Shares: | | | | | | | | | | | | | | | | | | | | |
Shares sold | | | 743,333 | | | $ | 14,855,135 | | | | | | | | 730,910 | | | $ | 15,136,184 | |
Shares issued in reinvestment of distributions | | | 358,852 | | | | 7,177,027 | | | | | | | | 375,216 | | | | 7,418,016 | |
Shares redeemed | | | (1,104,232 | ) | | | (22,398,008 | ) | | | | | | | (1,172,050 | ) | | | (24,335,103 | ) |
| | | | |
Net increase (decrease) | | | (2,047 | ) | | $ | (365,846 | ) | | | | | | | (65,924 | ) | | $ | (1,780,903 | ) |
| | | | |
3. Transactions with Affiliates
Franklin Resources, Inc. is the holding company for various subsidiaries that together are referred to as Franklin Templeton. Certain officers and trustees of the Fund are also officers and/or directors of the following subsidiaries:
| | |
| |
| Subsidiary | | Affiliation |
Franklin Mutual Advisers, LLC (Franklin Mutual) | | Investment manager |
Franklin Templeton Services, LLC (FT Services) | | Administrative manager |
Franklin Templeton Distributors, Inc. (Distributors) | | Principal underwriter |
Franklin Templeton Investor Services, LLC (Investor Services) | | Transfer agent |
FRANKLIN TEMPLETON VARIABLE INSURANCE PRODUCTS TRUST
NOTES TO FINANCIAL STATEMENTS
Franklin Mutual Shares VIP Fund(continued)
a. Management Fees
Effective May 1, 2018, the Fund pays an investment management fee to Franklin Mutual based on the average daily net assets of the Fund as follows:
| | |
| |
| Annualized Fee Rate | | Net Assets |
0.675% | | Up to and including $5 billion |
0.645% | | Over $5 billion, up to and including $10 billion |
0.625% | | Over $10 billion, up to and including $15 billion |
0.595% | | Over $15 billion, up to and including $20 billion |
0.585% | | Over $20 billion, up to and including $25 billion |
0.565% | | Over $25 billion, up to and including $30 billion |
0.555% | | Over $30 billion, up to and including $35 billion |
0.545% | | In excess of $35 billion |
Prior to May 1, 2018, the Fund paid fees to Franklin Mutual based on the average daily net assets of the Fund as follows:
| | |
| |
| Annualized Fee Rate | | Net Assets |
0.750% | | Up to and including $200 million |
0.735% | | Over $200 million, up to and including $700 million |
0.700% | | Over $700 million, up to and including $1.2 billion |
0.675% | | Over $1.2 billion, up to and including $5 billion |
0.645% | | Over $5 billion, up to and including $10 billion |
0.625% | | Over $10 billion, up to and including $15 billion |
0.605% | | Over $15 billion, up to and including $20 billion |
0.585% | | In excess of $20 billion |
For the year ended December 31, 2018, the gross effective investment management fee rate was 0.680% of the Fund’s average daily net assets.
b. Administrative Fees
Under an agreement with Franklin Mutual, FT Services provides administrative services to the Fund. The fee is paid by Franklin Mutual based on the Fund’s average daily net assets, and is not an additional expense of the Fund.
c. Distribution Fees
The Board has adopted distribution plans for Class 2 and Class 4 shares pursuant to Rule12b-1 under the 1940 Act. Under the Fund’s compensation distribution plans, the Fund pays Distributors for costs incurred in connection with the servicing, sale and distribution of the Fund’s shares up to 0.35% per year of its average daily net assets of each class. The Board has agreed to limit the current rate to 0.25% per year for Class 2. The plan year, for purposes of monitoring compliance with the maximum annual plan rates, is February 1 through January 31.
d. Transfer Agent Fees
Investor Services, under terms of an agreement, performs shareholder servicing for the Fund and is not paid by the Fund for the services.
FRANKLIN TEMPLETON VARIABLE INSURANCE PRODUCTS TRUST
NOTES TO FINANCIAL STATEMENTS
Franklin Mutual Shares VIP Fund(continued)
3. Transactions with Affiliates(continued)
e. Investments in Affiliated Management Investment Companies
The Fund invests in one or more affiliated management investment companies for purposes other than exercising a controlling influence over the management or policies. Management fees paid by the Fund are waived on assets invested in the affiliated management investment companies, as noted in the Statement of Operations, in an amount not to exceed the management and administrative fees paid directly or indirectly by each affiliate. During the year ended December 31, 2018, the Fund held investments in affiliated management investment companies as follows:
| | | | | | | | | | | | | | | | | | | | | | | | | | | | | | | | |
| | | | | | | | |
| | | Number of Shares Held at Beginning of Year | | | Gross Additions | | | Gross Reductions | | | Number of Shares Held at End of Year | | | Value at End of Year | | | Income from securities loaned | | | Realized Gain (Loss) | | | Net Change in Unrealized Appreciation (Depreciation) | |
| Non-Controlled Affiliates | | | | | | | | | | | | | | | | | | | | | | | | | | | | | | | | |
Institutional Fiduciary Trust Money Market Portfolio, 1.99% | | | — | | | | 138,696,000 | | | | (138,696,000 | ) | | | — | | | $ | — | | | $ | 27,822 | | | $ | — | | | $ | — | |
| | | | | | | | | | | | | | | | | | | | |
f. Other Affiliated Transactions
At December 31, 2018, Franklin Templeton Variable Insurance Products Trust – Franklin Founding Funds Allocation VIP Fund owned 8.2% of the Fund’s outstanding shares.
4. Expense Offset Arrangement
The Fund has entered into an arrangement with its custodian whereby credits realized as a result of uninvested cash balances are used to reduce a portion of the Fund’s custodian expenses. During the year ended December 31, 2018, the custodian fees were reduced as noted in the Statement of Operations.
5. Income Taxes
The tax character of distributions paid during the years ended December 31, 2018 and 2017, was as follows:
| | | | | | | | |
| | |
| | | 2018 | | | 2017 | |
Distributions paid from: | | | | | | | | |
Ordinary income | | $ | 94,583,983 | | | $ | 129,070,184 | |
Long term capital gain | | | 144,833,356 | | | | 142,775,300 | |
| | | | |
| | $ | 239,417,339 | | | $ | 271,845,484 | |
| | | | |
At December 31, 2018, the cost of investments, net unrealized appreciation (depreciation), undistributed ordinary income and undistributed long term capital gains for income tax purposes were as follows:
| | | | |
Cost of investments. | | $ | 2,822,459,698 | |
| | | | |
Unrealized appreciation | | $ | 615,205,930 | |
Unrealized depreciation | | | (330,258,834 | ) |
| | | | |
Net unrealized appreciation (depreciation) | | $ | 284,947,096 | |
| | | | |
Distributable earnings: | | | | |
Undistributed ordinary income | | $ | 66,455,561 | |
Undistributed long term capital gains | | | 312,458,357 | |
| | | | |
Total distributable earnings | | $ | 378,913,918 | |
| | | | |
FRANKLIN TEMPLETON VARIABLE INSURANCE PRODUCTS TRUST
NOTES TO FINANCIAL STATEMENTS
Franklin Mutual Shares VIP Fund(continued)
Differences between income and/or capital gains as determined on a book basis and a tax basis are primarily due to differing treatments of defaulted securities, foreign currency transactions and wash sales.
6. Investment Transactions
Purchases and sales of investments (excluding short term securities and securities sold short) for the year ended December 31, 2018, aggregated $893,911,605 and $1,682,086,078, respectively.
7. Credit Risk and Defaulted Securities
The Fund may purchase thepre-default or defaulted debt of distressed companies. Distressed companies are financially troubled and could be or are already involved in financial restructuring or bankruptcy. Risks associated with purchasing these securities include the possibility that the bankruptcy or other restructuring process takes longer than expected, or that distributions in restructuring are less than anticipated, either or both of which may result in unfavorable consequences to the Fund. If it becomes probable that the income on debt securities, including those of distressed companies, will not be collected, the Fund discontinues accruing income and recognizes an adjustment for uncollectible interest.
At December 31, 2018, the aggregate long value of distressed company securities for which interest recognition has been discontinued was $59,001,115, representing 1.9% of the Fund’s net assets. For information as to specific securities, see the accompanying Statement of Investments.
8. Restricted Securities
The Fund invests in securities that are restricted under the Securities Act of 1933 (1933 Act). Restricted securities are often purchased in private placement transactions, and cannot be sold without prior registration unless the sale is pursuant to an exemption under the 1933 Act. Disposal of these securities may require greater effort and expense, and prompt sale at an acceptable price may be difficult. The Fund may have registration rights for restricted securities. The issuer generally incurs all registration costs.
At December 31, 2018, investments in restricted securities, excluding securities exempt from registration under the 1933 Act deemed to be liquid, were as follows:
| | | | | | | | | | | | | | |
| | | | |
Principal
Amount/
Shares | | Issuer | | Acquisition Date | | | Cost | | | Value | |
| 1,754 | | Broadband Ventures III LLC, secured promissory note, 5.00%, 2/01/12 . | | | 7/01/10 - 11/30/12 | | | $ | 1,754 | | | $ | — | |
| 1,730,515 | | International Automotive Components Group Brazil LLC | | | 4/13/06- 12/26/08 | | | | 1,149,241 | | | | 73,334 | |
| 15,382,424 | | International Automotive Components Group North America LLC | | | 1/12/06- 3/18/13 | | | | 12,591,586 | | | | 1,833,585 | |
| | | | | | | | | | |
| | Total Restricted Securities(Value is 0.1% of Net Assets) | | | | | | $ | 13,742,581 | | | $ | 1,906,919 | |
| | | | | | | | | | |
FRANKLIN TEMPLETON VARIABLE INSURANCE PRODUCTS TRUST
NOTES TO FINANCIAL STATEMENTS
Franklin Mutual Shares VIP Fund(continued)
9. Other Derivative Information
At December 31, 2018, the Fund’s investments in derivative contracts are reflected in the Statement of Assets and Liabilities as follows:
| | | | | | | | | | | | |
| | |
| | | Asset Derivatives | | | Liability Derivatives | |
| | | | |
Derivative Contracts
Not Accounted for
as Hedging Instruments | | Statement of Assets and
Liabilities Location | | Fair Value | | | Statement of Assets and
Liabilities Location | | Fair Value | |
Foreign exchange contracts | | Variation margin on futures contracts | | $ | 163,992 | a | | Variation margin on futures contracts | | $ | — | |
| | Unrealized appreciation on OTC forward exchange contracts | | | 115,352 | | | Unrealized depreciation on OTC forward exchange contracts | | | 1,066,470 | |
| | | | | | | | | | | | |
Totals | | | | $ | 279,344 | | | | | $ | 1,066,470 | |
| | | | | | | | | | | | |
aThis amount reflects the cumulative appreciation (depreciation) of futures contracts as reported in the Statement of Investments. Only the variation margin receivable/ payable at year end is separately reported within the Statement of Assets and Liabilities. Prior variation margin movements were recorded to cash upon receipt or payment.
For the year ended December 31, 2018, the effect of derivative contracts in the Fund’s Statement of Operations was as follows:
| | | | | | | | | | | | |
| | | | |
Derivative Contracts Not Accounted for as Hedging Instruments | | Statement of Operations Location | | Net
Realized
Gain (Loss)
for the Year | | | Statement of Operations Location | | Net Change in
Unrealized
Appreciation
(Depreciation)
for the Year | |
| | Net realized gain (loss) from: | | | | | | Net change in unrealized appreciation (depreciation) on: | | | | |
Foreign exchange contracts | | Forward exchange contracts | | $ | 10,506,122 | | | Forward exchange contracts | | $ | 4,872,642 | |
| | Futures contracts | | | 10,448,555 | | | Futures contracts | | | 2,259,390 | |
| | | | | | | | | | | | |
Totals | | | | $ | 20,954,677 | | | | | $ | 7,132,032 | |
| | | | | | | | | | | | |
For the year ended December 31, 2018, the average month end notional amount of futures contracts represented $170,188,836. The average month end contract value of forward exchange contracts was $283,840,852.
See Note 1(c) regarding derivative financial instruments.
10. Holdings of 5% Voting Securities of Portfolio Companies
The 1940 Act defines “affiliated companies” to include investments in portfolio companies in which a fund owns 5% or more of the outstanding voting securities. During the year ended December 31, 2018, investments in “affiliated companies” were as follows:
| | | | | | | | | | | | | | | | | | | | | | | | | | | | | | | | |
| | | | | | | | |
| Name of Issuer | | Number of Shares Held at Beginning of Year | | | Gross Additions | | | Gross Reductions | | | Number of Shares Held at End of Year | | | Value at End of Year | | | Dividend Income | | | Realized
Gain (Loss) | | | Net Change in Unrealized Appreciation (Depreciation) | |
| Non-Controlled Affiliates | | | | | | | | | | | | | | | | | | | | | | | | | | | | | | | | |
CB FIM Coinvestors LLC | | | 6,400,507 | | | | — | | | | (6,400,507 | )a | | | — | | | $ | — | | | $ | — | | | $ | 4,122 | | | $ | — | |
| | | | | | | | | | | | | | | | | | | | |
aGross reduction was the result of a corporate action.
FRANKLIN TEMPLETON VARIABLE INSURANCE PRODUCTS TRUST
NOTES TO FINANCIAL STATEMENTS
Franklin Mutual Shares VIP Fund(continued)
11. Credit Facility
The Fund, together with other U.S. registered and foreign investment funds (collectively, Borrowers), managed by Franklin Templeton, are borrowers in a joint syndicated senior unsecured credit facility totaling $2 billion (Global Credit Facility) which matured on February 8, 2019. This Global Credit Facility provides a source of funds to the Borrowers for temporary and emergency purposes, including the ability to meet future unanticipated or unusually large redemption requests. Effective February 8, 2019, the Borrowers renewed the Global Credit Facility for a one year term, maturing February 7, 2020, for a total of $2 billion.
Under the terms of the Global Credit Facility, the Fund shall, in addition to interest charged on any borrowings made by the Fund and other costs incurred by the Fund, pay its share of fees and expenses incurred in connection with the implementation and maintenance of the Global Credit Facility, based upon its relative share of the aggregate net assets of all of the Borrowers, including an annual commitment fee of 0.15% based upon the unused portion of the Global Credit Facility. These fees are reflected in other expenses in the Statement of Operations. During the year ended December 31, 2018, the Fund did not use the Global Credit Facility.
12. Fair Value Measurements
The Fund follows a fair value hierarchy that distinguishes between market data obtained from independent sources (observable inputs) and the Fund’s own market assumptions (unobservable inputs). These inputs are used in determining the value of the Fund’s financial instruments and are summarized in the following fair value hierarchy:
| | • | | Level 1 – quoted prices in active markets for identical financial instruments |
| | • | | Level 2 – other significant observable inputs (including quoted prices for similar financial instruments, interest rates, prepayment speed, credit risk, etc.) |
| | • | | Level 3 – significant unobservable inputs (including the Fund’s own assumptions in determining the fair value of financial instruments) |
The input levels are not necessarily an indication of the risk or liquidity associated with financial instruments at that level.
FRANKLIN TEMPLETON VARIABLE INSURANCE PRODUCTS TRUST
NOTES TO FINANCIAL STATEMENTS
Franklin Mutual Shares VIP Fund(continued)
12. Fair Value Measurements(continued)
A summary of inputs used as of December 31, 2018, in valuing the Fund’s assets and liabilities carried at fair value, is as follows:
| | | | | | | | | | | | | | | | |
| | | | |
| | | Level 1 | | | Level 2 | | | Level 3 | | | Total | |
| Assets: | | | | | | | | | | | | | | | | |
Investments in Securities:a | | | | | | | | | | | | | | | | |
Equity Investments:b | | | | | | | | | | | | | | | | |
Auto Components | | $ | 12,912,142 | | | $ | — | | | $ | 1,906,919 | | | $ | 14,819,061 | |
Machinery | | | — | | | | 22,665,171 | | | | — | | | | 22,665,171 | |
Media | | | 149,660,500 | | | | 862,505 | | | | — | | | | 150,523,005 | |
Metals & Mining | | | 5,998,930 | | | | 7,212,308 | | | | — | | | | 13,211,238 | |
Software | | | 70,362,638 | | | | 187,679 | | | | — | | | | 70,550,317 | |
All Other Equity Investments | | | 2,359,043,188 | | | | — | | | | — | c | | | 2,359,043,188 | |
Corporate Notes and Senior Floating Rate | | | | | | | | | | | | | | | | |
Interests. | | | — | | | | 101,172,020 | | | | — | | | | 101,172,020 | |
Corporate Notes and Senior Floating Rate | | | | | | | | | | | | | | | | |
Interests in Reorganization | | | — | | | | 59,001,115 | | | | — | c | | | 59,001,115 | |
Companies in Liquidation | | | — | | | | 81,557 | | | | — | c | | | 81,557 | |
Short Term Investments | | | 328,003,968 | | | | 28,200,000 | | | | — | | | | 356,203,968 | |
| | | | |
Total Investments in Securities | | $ | 2,925,981,366 | | | $ | 219,382,355 | | | $ | 1,906,919 | | | $ | 3,147,270,640 | |
| | | | |
Other Financial Instruments: | | | | | | | | | | | | | | | | |
Futures Contracts | | $ | 163,992 | | | $ | — | | | $ | — | | | $ | 163,992 | |
Forward Exchange Contracts | | | — | | | | 115,352 | | | | — | | | | 115,352 | |
| | | | |
Total Other Financial Instruments | | $ | 163,992 | | | $ | 115,352 | | | $ | — | | | $ | 279,344 | |
| | | | |
| | | | |
| Liabilities: | | | | | | | | | | | | | | | | |
Other Financial Instruments: | | | | | | | | | | | | | | | | |
Securities Sold Short | | $ | 39,080,983 | | | $ | — | | | $ | — | | | $ | 39,080,983 | |
Forward Exchange Contracts | | | — | | | | 1,066,470 | | | | — | | | | 1,066,470 | |
| | | | |
Total Other Financial Instruments | | $ | 39,080,983 | | | $ | 1,066,470 | | | $ | — | | | $ | 40,147,453 | |
| | | | |
aFor detailed categories, see the accompanying Statement of Investments.
bIncludes common stocks, management investment companies as well as other equity interests.
cIncludes securities determined to have no value at December 31, 2018.
A reconciliation of assets in which Level 3 inputs are used in determining fair value is presented when there are significant Level 3 financial instruments at the beginning and/or end of the year.
13. Subsequent Events
The Fund has evaluated subsequent events through the issuance of the financial statements and determined that no events have occurred that require disclosure other than those already disclosed in the financial statements.
Abbreviations
| | | | | | | | | | |
| | | | |
| Counterparty | | | | Currency | | | | Selected Portfolio |
| | | | | |
| BOFA | | Bank of America Corp. | | EUR | | Euro | | ADR | | American Depositary Receipt |
| | | | | |
| BONY | | The Bank of New York Mellon Corp. | | GBP | | British Pound | | FHLB | | Federal Home Loan Bank |
| | | | | |
| HSBK | | HSBC Bank PLC | | USD | | United States Dollar | | LIBOR | | London InterBank Offered Rate |
| | | | | |
| SSBT | | State Street Bank and Trust Co., N.A. | | | | | | | | |
| | | | | |
| UBSW | | UBS AG | | | | | | | | |
FRANKLIN TEMPLETON VARIABLE INSURANCE PRODUCTS TRUST
Report of Independent Registered Public Accounting Firm
To the Board of Trustees of Franklin Templeton Variable Insurance Products Trust and Shareholders of Franklin Mutual Shares VIP Fund
Opinion on the Financial Statements
We have audited the accompanying statement of assets and liabilities, including the statement of investments, of Franklin Mutual Shares VIP Fund (the “Fund”) as of December 31, 2018, the related statement of operations for the year ended December 31, 2018, the statement of changes in net assets for each of the two years in the period ended December 31, 2018, including the related notes, and the financial highlights for each of the five years in the period ended December 31, 2018 (collectively referred to as the “financial statements”). In our opinion, the financial statements present fairly, in all material respects, the financial position of the Fund as of December 31, 2018, the results of its operations for the year then ended, the changes in its net assets for each of the two years in the period ended December 31, 2018 and the financial highlights for each of the five years in the period ended December 31, 2018 in conformity with accounting principles generally accepted in the United States of America.
Basis for Opinion
These financial statements are the responsibility of the Fund’s management. Our responsibility is to express an opinion on the Fund’s financial statements based on our audits. We are a public accounting firm registered with the Public Company Accounting Oversight Board (United States) (PCAOB) and are required to be independent with respect to the Fund in accordance with the U.S. federal securities laws and the applicable rules and regulations of the Securities and Exchange Commission and the PCAOB.
We conducted our audits of these financial statements in accordance with the standards of the PCAOB. Those standards require that we plan and perform the audit to obtain reasonable assurance about whether the financial statements are free of material misstatement, whether due to error or fraud.
Our audits included performing procedures to assess the risks of material misstatement of the financial statements, whether due to error or fraud, and performing procedures that respond to those risks. Such procedures included examining, on a test basis, evidence regarding the amounts and disclosures in the financial statements. Our audits also included evaluating the accounting principles used and significant estimates made by management, as well as evaluating the overall presentation of the financial statements. Our procedures included confirmation of securities owned as of December 31, 2018 by correspondence with the custodian and brokers; when replies were not received from brokers, we performed other auditing procedures. We believe that our audits provide a reasonable basis for our opinion.
PricewaterhouseCoopers LLP
San Francisco, California
February 15, 2019
We have served as the auditor of one or more investment companies in the Franklin Templeton Group of Funds since 1948.
FRANKLIN TEMPLETON VARIABLE INSURANCE PRODUCTS TRUST
Tax Information (unaudited)
Franklin Mutual Shares VIP Fund
Under Section 852(b)(3)(C) of the Internal Revenue Code, the Fund hereby reports the maximum amount allowable but no less than $144,833,356 as a long term capital gain dividend for the fiscal year ended December 31, 2018.
Under Section 854(b)(1)(A) of the Internal Revenue Code, the Fund hereby reports 52.06% of the ordinary income dividends as income qualifying for the dividends received deduction for the fiscal year ended December 31, 2018.
Franklin Rising Dividends VIP Fund
This annual report for Franklin Rising Dividends VIP Fund covers the fiscal year ended December 31, 2018.
Class 1 Performance Summary as of December 31, 2018
Average annual total return of Class 1 shares* represents the average annual change in value, assuming reinvestment of dividends and capital gains. Average returns smooth out variations in returns, which can be significant; they are not the same asyear-by-year results.
| | | | | | | | | | | | |
| | | |
| Periods ended 12/31/18 | | 1-Year | | | 5-Year | | | 10-Year | |
Average Annual Total Return | | | -4.84% | | | | +7.09% | | | | +12.01% | |
*The Fund has a fee waiver associated with any investment it makes in a Franklin Templeton money fund and/or other Franklin Templeton fund, contractually guaranteed through 4/30/19. Fund investment results reflect the fee waiver; without this waiver, the results would have been lower.
Performance reflects the Fund’s Class 1 operating expenses, but doesnotinclude any contract fees, expenses or sales charges. If they had been included, performance would be lower. These charges and deductions, particularly for variable life policies, can have a significant effect on contract values and insurance benefits. See the contract prospectus for a complete description of these expenses, including sales charges.
Performance data represent past performance, which does not guarantee future results. Investment return and principal value will fluctuate, and you may have a gain or loss when you sell your shares. Current performance may differ from figures shown.
Total Return Index Comparison for a Hypothetical $10,000 Investment (1/1/09–12/31/18)
The graph below shows the change in value of a hypothetical $10,000 investment in the Fund over the indicated period and includes reinvestment of any income or distributions. The Fund’s performance* is compared to the performance of the Standard & Poor’s® 500 Index (S&P 500®).One cannot invest directly in an index, and an index is not representative of the Fund’s portfolio. Please see Important Notes to Performance Information preceding the Fund Summaries.
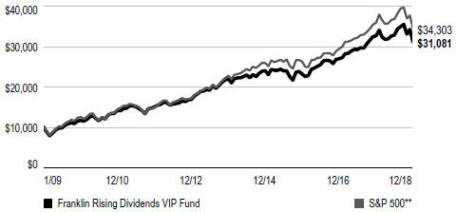
**Source: Morningstar. Please see Index Descriptions following the Fund Summaries.
FRANKLIN RISING DIVIDENDS VIP FUND
Fund Goal and Main Investments
The Fund seeks long-term capital appreciation, with preservation of capital as an important consideration. Under normal market conditions, the Fund invests at least 80% of its net assets in equity securities of financially sound companies that have paid consistently rising dividends.
Fund Risks
All investments involve risks, including possible loss of principal. Value securities may not increase in price as anticipated or may decline further in value. For stocks paying dividends, dividends are not guaranteed, and can increase, decrease or be totally eliminated without notice. Securities issued by smaller and midsize companies may be more volatile in price than those of larger companies, involve substantial risks and should be considered speculative. To the extent that the Fund focuses on particular countries, regions, industries, sectors or types of investment from time to time, the Fund may be subject to greater risks of adverse developments in such areas of focus than a fund that invests in a wider variety of countries, regions, industries, sectors or investments. Foreign investing carries additional risks such as currency and market volatility and political or social instability, risks that are heightened in developing countries. The Fund is actively managed but there is no guarantee that the manager’s investment decisions will produce the desired results. The Fund’s prospectus also includes a description of the main investment risks.
Performance Overview
You can find the Fund’sone-year total return in the Performance Summary. In comparison, the S&P 500 had a-4.38% total return for the same period.1 Please note the Fund employs abottom-up stock selection process, and the managers invest in securities without regard to benchmark comparisons.
Economic and Market Overview
The U.S. economy grew during the 12 months under review. After moderating for three consecutive quarters, the economy grew faster in 2018’s second quarter, driven by consumer spending, business investment, exports and government spending. However, growth moderated in the third quarter due to declines in exports and housing investment. The
manufacturing and services sectors expanded during the period. The unemployment rate declined from 4.1% in December 2017 to 3.9% atperiod-end.2 Annual inflation, as measured by the Consumer Price Index, decreased from 2.1% in December 2017 to 1.9% atperiod-end.2
The U.S. Federal Reserve (Fed) raised its target range for the federal funds rate four times during the period, to 2.25%–2.50%, and continued to reduce its balance sheet as part of its ongoing plan to normalize monetary policy. At its December meeting, the Fed reduced the projected 2019 rate increases to two, compared to three projected previously.
U.S. equity markets overall declined during the period amid concerns about tighter regulation of technology companies, the pace of the Fed’s rate increases, U.S. political uncertainties, the Trump administration’s protectionist policies, and the potential impact of the U.S.-China trade dispute on U.S. and global growth and corporate earnings. However, these concerns were partially alleviated by an overall easing of tensions in the Korean peninsula, ongoing trade negotiations between the U.S. and the European Union, and a new trade deal between the U.S., Mexico and Canada (pending ratification by the three countries’ legislatures), and intermittent U.S.-China trade negotiations, including a temporary truce that the two countries reached in December. Markets also benefited from mostly upbeat economic data, better U.S. corporate earnings, results of the U.S.mid-term elections and a potentially slower pace to the Fed’s rate increases. In this environment, the broad U.S. stock market, as measured by the S&P 500, reached a newall-time high in September 2018, but had a-4.38% total return for the12-month period.1
Investment Strategy
We are a research-driven, fundamental investment adviser, pursuing a disciplined value-oriented strategy. Asbottom-up investors concentrating primarily on individual securities, we seek fundamentally sound companies that we believe meet our screening criteria, which include consistent, substantial dividend increases; reinvested earnings; and strong balance sheets. We attempt to acquire such stocks at attractive prices, often when they are out of favor with other investors. In following these criteria, we do not necessarily focus on
1. Source: Morningstar.
One cannot invest directly in an index, and an index is not representative of the Fund’s portfolio. Please see Index Descriptions following the Fund Summaries.
2. Source: Bureau of Labor Statistics.
The dollar value, number of shares or principal amount, and names of all portfolio holdings are listed in the Fund’s Statement of Investments (SOI).
FRANKLIN RISING DIVIDENDS VIP FUND
companies whose securities pay a high dividend but rather on companies that consistently raise their dividends.
Manager’s Discussion
During the fiscal year ended December 31, 2018, some holdings that contributed to absolute performance included Microsoft, McCormick & Co. and Abbott Laboratories.
Software company Microsoft’s shares were up over the year, driven by the continued successful transition to the cloud. Office 365 and Azure continued to deliver strong results, driving up revenue, margin and earnings per share. In addition, Microsoft’s Windows, gaming and hardware businesses have been performing above expectations, while strict cost control measures have contributed to earnings growth. The company has raised its dividend for 15 consecutive years.
Shares of McCormick & Co., a manufacturer of flavor products, performed well in 2018 based on solid earnings results, with its recently acquired flavor solutions portfolio contributing significantly to growth. We believe McCormick could benefit from continued strong demand for its products, its emerging-market footprint and expanded distribution for its flavor solutions products. The company has raised its dividend for 33 consecutive years.
Abbott Laboratories, a developer of health care products, experienced share price growth due to ongoing solid earnings reports. The company continued to deliver sustained topline growth across its diversified portfolio, bolstered by its investments in emerging markets. The company has raised its dividend for 47 consecutive years.
Conversely, some holdings that detracted from absolute performance included Albemarle, Schlumberger and Perrigo.
Shares of Albemarle, a specialty chemicals producer, declined despite ongoing strong operating performance. Concerns about the possibility of lithium oversupply and pricing implications of that risk continued to weigh on the industry. We believe Albemarle’s long-term contracts, priced below recent lithium spot prices, andlow-cost position could provide insulation from spot price fluctuations. The company has increased its dividend for 24 consecutive years.
Oil and gas services company Schlumberger’s shares declined as concerns mounted around oil production levels and the sustainability of oil prices. The company has struggled as the oil industry has reduced investment in the face of demand uncertainty and higher-than-expected production from both the Organization of the Petroleum Exporting Countries and the
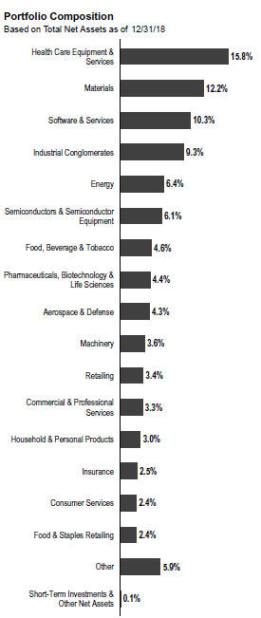
U.S. shale oil regions. In our view, Schlumberger is well positioned to benefit as U.S. shale activity matures and chronic global oil underinvestment yields to the need for new supplies.
Perrigo, a global health care supplier, experienced a sharp fall in its share price towardyear-end on news that Irish tax authorities had filed a tax assessment of $1.86 billion against
FRANKLIN RISING DIVIDENDS VIP FUND
| | | | |
| Top 10 Holdings | | | |
| 12/31/18 | | | |
| |
Company Sector/Industry | | % of Total Net Assets | |
Microsoft Corp. Software & Services | |
| 6.2%
|
|
Roper Technologies Inc. Industrial Conglomerates | |
| 5.5%
|
|
Stryker Corp. Health Care Equipment & Services | |
| 3.8%
|
|
Becton, Dickinson and Co. Health Care Equipment & Services | |
| 3.7%
|
|
Linde PLC (United Kingdom) Materials | |
| 3.6%
|
|
Albemarle Corp. Materials | |
| 3.5%
|
|
Accenture PLC Software & Services | |
| 3.3%
|
|
Medtronic PLC Health Care Equipment & Services | |
| 3.2%
|
|
Honeywell International Inc. Industrial Conglomerates | |
| 3.2%
|
|
Texas Instruments Inc. Semiconductors & Semiconductor Equipment | |
| 3.1%
|
|
the company in relation to its tax treatment of Tysabri, a drug the company acquired. While resolution of this issue could take several years, we anticipate the new chief executive officer will forge ahead with his plans to reshape the company’s strategy and portfolio by tilting toward consumer-oriented segments and divestingnon-core assets. Perrigo has raised its dividend for 16 consecutive years.
During the period, the Fund initiated new positions in Raytheon, a defense contractor (14 consecutive years of dividend increases) and The Boeing Company, an aerospace company (eight consecutive years of dividend increases). We added to existing positions including EOG Resources, a petroleum and natural gas exploration company; Honeywell International, a diversified industrial company (nine consecutive years of dividend increases); and Colgate-Palmolive, a consumer products company focused on household, health care and personal care products (56 consecutive years of dividend increases).
We exited positions in Archer-Daniels-Midland, Leggett & Platt and Comcast. We also reduced several holdings including West Pharmaceutical Services, Arthur J. Gallagher & Co. and the aforementioned Microsoft during the period.
During the period, the Fund liquidated shares of Garrett Motion, which was spun off from existing holding Honeywell International. Additionally, we received shares of nVent
Electric; Apergy Corp and Resideo Technologies after spin-offs from existing portfolio holdings.
Our 10 largest positions on December 31, 2018, represented 39.1% of the Fund’s total net assets. It is interesting to note how these 10 companies would respond to the Fund’s screening criteria based on a simple average of statistical measures. On average, these 10 companies have raised their dividends 22 years in a row and by 304% over the past 10 years. Their most recent year-over-year dividend increases averaged 9.7% with a yield of 1.9% on December 31, 2018, and a dividend payout ratio of 37.4%, based on estimates of calendar year 2018 operating earnings estimates. The average price/earnings ratio was 20.1 times calendar year 2018 estimates versus 17.1 for that of the unmanaged S&P 500.
Thank you for your participation in Franklin Rising Dividends VIP Fund. We look forward to continuing to serve your investment needs.
The foregoing information reflects our analysis, opinions and portfolio holdings as of December 31, 2018, the end of the reporting period. The way we implement our main investment strategies and the resulting portfolio holdings may change depending on factors such as market and economic conditions. These opinions may not be relied upon as investment advice or an offer for a particular security. The information is not a complete analysis of every aspect of any market, country, industry, security or the Fund. Statements of fact are from sources considered reliable, but the investment manager makes no representation or warranty as to their completeness or accuracy. Although historical performance is no guarantee of future results, these insights may help you understand our investment management philosophy.
FRANKLIN RISING DIVIDENDS VIP FUND
Class 1 Fund Expenses
As an investor in a variable insurance contract (Contract) that indirectly provides for investment in an underlying mutual fund, you can incur transaction and/or ongoing expenses at both the Fund level and the Contract Level: (1) transaction expenses can include sales charges (loads) on purchases, surrender fees, transfer fees and premium taxes; and (2) ongoing expenses can include management fees, distribution and service(12b-1) fees, contract fees, annual maintenance fees, mortality and expense risk fees and other fees and expenses. All mutual funds and Contracts have some types of ongoing expenses. The table below shows Fund-level ongoing expenses and can help you understand these costs and compare them with those of other mutual funds offered through the Contract. The table assumes a $1,000 investment held for the six months indicated. Please refer to the Fund prospectus for additional information on operating expenses.
Actual Fund Expenses
The table below provides information about the actual account values and actual expenses in the columns under the heading “Actual.” In these columns the Fund’s actual return, which includes the effect of ongoing Fund expenses but does not include the effect of ongoing Contract expenses, is used to calculate the “Ending Account Value.” You can estimate the Fund-level expenses you paid during the period by following these steps (of course, your account value and expenses will differ from those in thisillustration): Divide your account value by $1,000 (if your account had an $8,600 value, then $8,600 ÷ $1,000 = 8.6). Then multiply the result by the number under the headings “Actual” and “Fund-Level Expenses Paid During Period” (if Fund-LevelExpenses Paid During Period were $7.50, then 8.6 × $7.50 = $64.50). In this illustration, the estimated expenses paid this period at the Fund level are $64.50.
Hypothetical Example for Comparison with Other Mutual Funds
Under the heading “Hypothetical” in the table, information is provided about hypothetical account values and hypothetical expenses based on the Fund’s actual expense ratio and an assumed rate of return of 5% per year before expenses, which is not the Fund’s actual return. This information may not be used to estimate the actual ending account balance or expenses you paid for the period, but it can help you compare ongoing costs of investing in the Fund with those of other mutual funds offered through the Contract. To do so, compare this 5% hypothetical example with the 5% hypothetical examples that appear in the shareholder reports of other funds offered through the Contract.
Please note that expenses shown in the table are meant to highlight ongoing costs at the Fund level only and do not reflect any ongoing expenses at the Contract level, or transaction expenses at either the Fund or Contract levels. In addition, while the Fund does not have transaction expenses, if the transaction and ongoing expenses at the Contract level were included, the expenses shown below would be higher. You should consult your Contract prospectus or disclosure document for more information.
| | | | | | | | | | | | | | | | | | | | | | | | | | | | |
| | | | | |
| | | | | | Actual (actual return after expenses) | | | | | | Hypothetical (5% annual return before expenses) | | | | |
| | | | | | | |
Share Class | | Beginning Account Value 7/1/18 | | | Ending Account Value 12/31/18 | | | Fund-Level Expenses Paid During Period 7/1/18–12/31/181,2 | | | | | | Ending Account Value 12/31/18 | | | Fund-Level Expenses Paid During Period 7/1/18–12/31/181,2 | | | Net Annualized Expense Ratio2 | |
Class 1 | | | $1,000 | | | | $945.60 | | | | $3.09 | | | | | | | | $1,022.03 | | | | $3.21 | | | | 0.63% | |
1. Expenses are equal to the annualized expense ratio for thesix-month period as indicated above — in the far right column — multiplied by the simple average account value over the period indicated, and then multiplied by 184/365 to reflect theone-half year period.
2. Reflects expenses after fee waivers and expense reimbursements. Does not include any ongoing expenses of the Contract for which the Fund is an investment option or acquired fund fees and expenses.
FRANKLIN TEMPLETON VARIABLE INSURANCE PRODUCTS TRUST
Financial Highlights
Franklin Rising Dividends VIP Fund
| | | | | | | | | | | | | | | | | | | | |
| |
| | | Year Ended December 31, | |
| | | | | |
| | | 2018 | | | 2017 | | | 2016 | | | 2015 | | | 2014 | |
| Class 1 | | | | | | | | | | | | | | | | | | | | |
Per share operating performance (for a share outstanding throughout the year) | | | | | | | | | | | | | | | | | | | | |
| | | | | |
Net asset value, beginning of year | | | $29.21 | | | | $25.51 | | | | $25.26 | | | | $29.63 | | | | $28.14 | |
| | | | |
| | | | | |
| Income from investment operationsa: | | | | | | | | | | | | | | | | | | | | |
| | | | | |
Net investment incomeb | | | 0.39 | | | | 0.40 | | | | 0.42 | | | | 0.45 | | | | 0.45 | |
| | | | | |
Net realized and unrealized gains (losses) | | | (1.65 | ) | | | 4.76 | | | | 3.45 | | | | (1.33 | ) | | | 2.03 | |
| | | | |
Total from investment operations | | | (1.26 | ) | | | 5.16 | | | | 3.87 | | | | (0.88 | ) | | | 2.48 | |
| | | | |
| | | | | |
| Less distributions from: | | | | | | | | | | | | | | | | | | | | |
| | | | | |
Net investment income | | | (0.44 | ) | | | (0.48 | ) | | | (0.44 | ) | | | (0.48 | ) | | | (0.44 | ) |
| | | | | |
Net realized gains | | | (1.76 | ) | | | (0.98 | ) | | | (3.18 | ) | | | (3.01 | ) | | | (0.55 | ) |
| | | | |
Total distributions | | | (2.20 | ) | | | (1.46 | ) | | | (3.62 | ) | | | (3.49 | ) | | | (0.99 | ) |
| | | | |
Net asset value, end of year | | | $25.75 | | | | $29.21 | | | | $25.51 | | | | $25.26 | | | | $29.63 | |
| | | | |
| | | | | |
Total returnc | | | (4.84)% | | | | 20.85% | | | | 16.33% | | | | (3.42)% | | | | 9.01% | |
| | | | | |
| Ratios to average net assets | | | | | | | | | | | | | | | | | | | | |
| | | | | |
Expenses before waiver and payments by affiliates | | | 0.62% | | | | 0.62% | | | | 0.63% | | | | 0.63% | | | | 0.62% | |
| | | | | |
Expenses net of waiver and payments by affiliates | | | 0.62% | d,e | | | 0.62% | d,e | | | 0.62% | d | | | 0.63% | e | | | 0.62% | e |
| | | | | | |
Net investment income | | | 1.38% | | | | 1.49% | | | | 1.67% | | | | 1.65% | | | | 1.58% | |
| | | | | |
| Supplemental data | | | | | | | | | | | | | | | | | | | | |
| | | | | |
Net assets, end of year (000’s) | | | $157,838 | | | | $216,015 | | | | $181,072 | | | | $143,376 | | | | $160,480 | |
| | | | | |
Portfolio turnover rate | | | 3.09%f | | | | 3.36% | | | | 6.66% | | | | 4.74% | | | | 8.61% | |
aThe amount shown for a share outstanding throughout the period may not correlate with the Statement of Operations for the period due to the timing of sales and repurchases of the Fund’s shares in relation to income earned and/or fluctuating fair value of the investments of the Fund.
bBased on average daily shares outstanding.
cTotal return does not include fees, charges or expenses imposed by the variable annuity and life insurance contracts for which Franklin Templeton Variable Insurance Products Trust serves as an underlying investment vehicle.
dBenefit of expense reduction rounds to less than 0.01%.
eBenefit of waiver and payments by affiliates rounds to less than 0.01%.
fExcludes the value of portfolio securities delivered as a result of a redemptionin-kind. See Note 8.
| | | | |
| | | |
| FRD-6 | | Annual Report | The accompanying notes are an integral part of these financial statements. | | |
FRANKLIN TEMPLETON VARIABLE INSURANCE PRODUCTS TRUST
FINANCIAL HIGHLIGHTS
|
| Franklin Rising Dividends VIP Fund(continued) |
| | | | | | | | | | | | | | | | | | | | |
| |
| | | Year Ended December 31, | |
| | | | | |
| | | 2018 | | | 2017 | | | 2016 | | | 2015 | | | 2014 | |
| Class 2 | | | | | | | | | | | | | | | | | | | | |
Per share operating performance (for a share outstanding throughout the year) | | | | | | | | | | | | | | | | | | | | |
| | | | | |
Net asset value, beginning of year | | | $28.46 | | | | $24.89 | | | | $24.72 | | | | $29.06 | | | | $27.62 | |
| | | | |
| | | | | |
Income from investment operationsa: | | | | | | | | | | | | | | | | | | | | |
| | | | | |
Net investment incomeb | | | 0.31 | | | | 0.33 | | | | 0.35 | | | | 0.37 | | | | 0.37 | |
| | | | | |
Net realized and unrealized gains (losses) | | | (1.61 | ) | | | 4.63 | | | | 3.37 | | | | (1.29 | ) | | | 1.99 | |
| | | | |
Total from investment operations | | | (1.30 | ) | | | 4.96 | | | | 3.72 | | | | (0.92 | ) | | | 2.36 | |
| | | | |
| | | | | |
Less distributions from: | | | | | | | | | | | | | | | | | | | | |
| | | | | |
Net investment income | | | (0.36 | ) | | | (0.41 | ) | | | (0.37 | ) | | | (0.41 | ) | | | (0.37 | ) |
| | | | | |
Net realized gains | | | (1.76 | ) | | | (0.98 | ) | | | (3.18 | ) | | | (3.01 | ) | | | (0.55 | ) |
| | | | |
Total distributions | | | (2.12 | ) | | | (1.39 | ) | | | (3.55 | ) | | | (3.42 | ) | | | (0.92 | ) |
| | | | |
Net asset value, end of year | | | $25.04 | | | | $28.46 | | | | $24.89 | | | | $24.72 | | | | $29.06 | |
| | | | |
| | | | | |
Total returnc | | | (5.07)% | | | | 20.56% | | | | 16.04% | | | | (3.65)% | | | | 8.72% | |
| | | | | |
| Ratios to average net assets | | | | | | | | | | | | | | | | | | | | |
| | | | | |
Expenses before waiver and payments by affiliates | | | 0.87% | | | | 0.87% | | | | 0.88% | | | | 0.88% | | | | 0.87% | |
| | | | | |
Expenses net of waiver and payments by affiliates | | | 0.87% | d,e | | | 0.87% | d,e | | | 0.87% | d | | | 0.88% | e | | | 0.87% | e |
| | | | | | |
Net investment income | | | 1.13% | | | | 1.24% | | | | 1.42% | | | | 1.40% | | | | 1.33% | |
| | | | | |
| Supplemental data | | | | | | | | | | | | | | | | | | | | |
| | | | | |
Net assets, end of year (000’s) | | | $1,106,334 | | | | $1,640,883 | | | | $1,530,374 | | | | $1,310,783 | | | | $1,667,816 | |
| | | | | |
Portfolio turnover rate | | | 3.09%f | | | | 3.36% | | | | 6.66% | | | | 4.74% | | | | 8.61% | |
aThe amount shown for a share outstanding throughout the period may not correlate with the Statement of Operations for the period due to the timing of sales and repurchases of the Fund’s shares in relation to income earned and/or fluctuating fair value of the investments of the Fund.
bBased on average daily shares outstanding.
cTotal return does not include fees, charges or expenses imposed by the variable annuity and life insurance contracts for which Franklin Templeton Variable Insurance Products Trust serves as an underlying investment vehicle.
dBenefit of expense reduction rounds to less than 0.01%.
eBenefit of waiver and payments by affiliates rounds to less than 0.01%.
fExcludes the value of portfolio securities delivered as a result of a redemptionin-kind. See Note 8.
| | | | | | |
| | | |
| | The accompanying notes are an integral part of these financial statements. | Annual Report | | | FRD-7 | |
FRANKLIN TEMPLETON VARIABLE INSURANCE PRODUCTS TRUST
FINANCIAL HIGHLIGHT
Franklin Rising Dividends VIP Fund(continued)
| | | | | | | | | | | | | | | | | | | | |
| |
| | | Year Ended December 31, | |
| | | | | |
| | | 2018 | | | 2017 | | | 2016 | | | 2015 | | | 2014 | |
| Class 4 | | | | | | | | | | | | | | | | | | | | |
Per share operating performance (for a share outstanding throughout the year) | | | | | | | | | | | | | | | | | | | | |
| | | | | |
Net asset value, beginning of year | | | $28.54 | | | | $24.98 | | | | $24.81 | | | | $29.19 | | | | $27.76 | |
| | | | |
| | | | | |
Income from investment operationsa: | | | | | | | | | | | | | | | | | | | | |
| | | | | |
Net investment incomeb | | | 0.29 | | | | 0.30 | | | | 0.32 | | | | 0.35 | | | | 0.35 | |
| | | | | |
Net realized and unrealized gains (losses) | | | (1.62 | ) | | | 4.65 | | | | 3.39 | | | | (1.31 | ) | | | 2.00 | |
| | | | |
Total from investment operations | | | (1.33 | ) | | | 4.95 | | | | 3.71 | | | | (0.96 | ) | | | 2.35 | |
| | | | |
| | | | | |
Less distributions from: | | | | | | | | | | | | | | | | | | | | |
| | | | | |
Net investment income | | | (0.34 | ) | | | (0.41 | ) | | | (0.36 | ) | | | (0.41 | ) | | | (0.37 | ) |
| | | | | |
Net realized gains | | | (1.76 | ) | | | (0.98 | ) | | | (3.18 | ) | | | (3.01 | ) | | | (0.55 | ) |
| | | | |
| Total distributions | | | (2.10 | ) | | | (1.39 | ) | | | (3.54 | ) | | | (3.42 | ) | | | (0.92 | ) |
| | | | |
| Net asset value, end of year | | | $25.11 | | | | $28.54 | | | | $24.98 | | | | $24.81 | | | | $29.19 | |
| | | | |
| | | | | |
Total returnc | | | (5.16)% | | | | 20.40% | | | | 15.93% | | | | (3.75)% | | | | 8.62% | |
| | | | | |
| Ratios to average net assets | | | | | | | | | | | | | | | | | | | | |
| | | | | |
Expenses before waiver and payments by affiliates | | | 0.97% | | | | 0.97% | | | | 0.98% | | | | 0.98% | | | | 0.97% | |
| | | | | |
Expenses net of waiver and payments by affiliates | | | 0.97% | d,e | | | 0.97% | d,e | | | 0.97% | d | | | 0.98% | e | | | 0.97% | e |
| | | | | | |
Net investment income | | | 1.03% | | | | 1.14% | | | | 1.32% | | | | 1.30% | | | | 1.23% | |
| | | | | |
| Supplemental data | | | | | | | | | | | | | | | | | | | | |
| | | | | |
Net assets, end of year (000’s) | | | $32,825 | | | | $36,407 | | | | $28,579 | | | | $20,453 | | | | $15,503 | |
| | | | | |
Portfolio turnover rate | | | 3.09% | f | | | 3.36% | | | | 6.66% | | | | 4.74% | | | | 8.61% | |
aThe amount shown for a share outstanding throughout the period may not correlate with the Statement of Operations for the period due to the timing of sales and repurchases of the Fund’s shares in relation to income earned and/or fluctuating fair value of the investments of the Fund.
bBased on average daily shares outstanding.
cTotal return does not include fees, charges or expenses imposed by the variable annuity and life insurance contracts for which Franklin Templeton Variable Insurance Products Trust serves as an underlying investment vehicle.
dBenefit of expense reduction rounds to less than 0.01%.
eBenefit of waiver and payments by affiliates rounds to less than 0.01%.
fExcludes the value of portfolio securities delivered as a result of a redemptionin-kind. See Note 8.
| | | | |
| | | |
| FRD-8 | | Annual Report | The accompanying notes are an integral part of these financial statements. | | |
FRANKLIN TEMPLETON VARIABLE INSURANCE PRODUCTS TRUST
Statement of Investments, December 31, 2018
Franklin Rising Dividends VIP Fund
| | | | | | | | | | |
| | | |
| | | | | Shares | | | Value | |
| | Common Stocks 99.9% | | | | | | | | |
| | Aerospace & Defense 4.3% | | | | | | | | |
| | The Boeing Co. | | | 2,952 | | | $ | 952,020 | |
| | General Dynamics Corp. | | | 144,400 | | | | 22,701,124 | |
| | Raytheon Co. | | | 53,228 | | | | 8,162,514 | |
| | United Technologies Corp. | | | 230,597 | | | | 24,553,968 | |
| | | | | | | | | | |
| | | | | | | | | 56,369,626 | |
| | | | | | | | | | |
| | | Building Products 1.5% | | | | | | |
| | Johnson Controls International PLC | | | 612,052 | | | | 18,147,342 | |
| a | | Resideo Technologies Inc. | | | 51,681 | | | | 1,062,044 | |
| | | | | | | | | | |
| | | | | | | | | 19,209,386 | |
| | | | | | | | | | |
| | Commercial & Professional Services 3.3% | | | | | | | | |
| | ABM Industries Inc. | | | 423,736 | | | | 13,606,163 | |
| | Cintas Corp. | | | 124,599 | | | | 20,931,386 | |
| | Matthews International Corp., A | | | 212,992 | | | | 8,651,735 | |
| | | | | | | | | | |
| | | | | | | | | 43,189,284 | |
| | | | | | | | | | |
| | Consumer Durables & Apparel 2.0% | | | | | | | | |
| | NIKE Inc., B | | | 343,799 | | | | 25,489,258 | |
| | Consumer Services 2.4% | | | | | | | | |
| | McDonald’s Corp. | | | 144,712 | | | | 25,696,510 | |
| | Yum! Brands Inc. | | | 58,463 | | | | 5,373,919 | |
| | | | | | | | | | |
| | | | | | | | | 31,070,429 | |
| | | | | | | | | | |
| | Diversified Financials 0.3% | | | | | | | | |
| | State Street Corp. | | | 62,384 | | | | 3,934,559 | |
| | | | | | | | | | |
| | Electrical Equipment 0.7% | | | | | | | | |
| | nVent Electric PLC (United Kingdom) | | | 425,413 | | | | 9,554,776 | |
| | | | | | | | | | |
| | Energy 6.4% | | | | | | | | |
| a | | Apergy Corp. | | | 196,519 | | | | 5,321,734 | |
| | Chevron Corp. | | | 190,052 | | | | 20,675,757 | |
| | EOG Resources Inc. | | | 137,258 | | | | 11,970,270 | |
| | Exxon Mobil Corp. | | | 173,617 | | | | 11,838,943 | |
| | Occidental Petroleum Corp. | | | 323,512 | | | | 19,857,167 | |
| | Schlumberger Ltd. | | | 363,947 | | | | 13,131,208 | |
| | | | | | | | | | |
| | | | | | | | | 82,795,079 | |
| | | | | | | | | | |
| | Food & Staples Retailing 2.4% | | | | | | | | |
| | Walgreens Boots Alliance Inc. | | | 170,088 | | | | 11,622,113 | |
| | Walmart Inc. | | | 203,288 | | | | 18,936,277 | |
| | | | | | | | | | |
| | | | | | | | | 30,558,390 | |
| | | | | | | | | | |
| | Food, Beverage & Tobacco 4.6% | | | | | | | | |
| | Bunge Ltd. | | | 281,373 | | | | 15,036,573 | |
| | McCormick & Co. Inc. | | | 160,099 | | | | 22,292,185 | |
| | PepsiCo Inc. | | | 203,100 | | | | 22,438,488 | |
| | | | | | | | | | |
| | | | | | | | | 59,767,246 | |
| | | | | | | | | | |
| | Health Care Equipment & Services 15.8% | | | | | | | | |
| | Abbott Laboratories | | | 398,979 | | | | 28,858,151 | |
| | Becton, Dickinson and Co. | | | 214,003 | | | | 48,219,156 | |
| | CVS Health Corp. | | | 176,455 | | | | 11,561,332 | |
| | DENTSPLY SIRONA Inc. | | | 60,262 | | | | 2,242,349 | |
| | Medtronic PLC | | | 454,861 | | | | 41,374,156 | |
| | Stryker Corp. | | | 310,881 | | | | 48,730,597 | |
FRANKLIN TEMPLETON VARIABLE INSURANCE PRODUCTS TRUST
STATEMENT OF INVESTMENTS
Franklin Rising Dividends VIP Fund(continued)
| | | | | | | | | | |
| | | |
| | | | | Shares | | | Value | |
| | Common Stocks(continued) | | | | | | | | |
| | | Health Care Equipment & Services(continued) | | | | | | |
| | West Pharmaceutical Services Inc. | | | 237,802 | | | $ | 23,311,730 | |
| | | | | | | | | | |
| | | | | | | | | 204,297,471 | |
| | | | | | | | | | |
| | | |
| | Household & Personal Products 3.0% | | | | | | | | |
| | Colgate-Palmolive Co. | | | 286,062 | | | | 17,026,410 | |
| | The Procter & Gamble Co. | | | 233,165 | | | | 21,432,527 | |
| | | | | | | | | | |
| | | | | | | | | 38,458,937 | |
| | | | | | | | | | |
| | | |
| | Industrial Conglomerates 9.3% | | | | | | | | |
| | Carlisle Cos. Inc. | | | 78,217 | | | | 7,862,372 | |
| | Honeywell International Inc. | | | 310,087 | | | | 40,968,694 | |
| | Roper Technologies Inc. | | | 269,899 | | | | 71,933,482 | |
| | | | | | | | | | |
| | | | | | | | | 120,764,548 | |
| | | | | | | | | | |
| | | |
| | Insurance 2.5% | | | | | | | | |
| | Aflac Inc. | | | 317,571 | | | | 14,468,535 | |
| �� | Arthur J. Gallagher & Co. | | | 55,543 | | | | 4,093,519 | |
| | Erie Indemnity Co., A | | | 102,449 | | | | 13,657,476 | |
| | | | | | | | | | |
| | | | | | | | | 32,219,530 | |
| | | | | | | | | | |
| | | |
| | Machinery 3.6% | | | | | | | | |
| | Donaldson Co. Inc. | | | 219,647 | | | | 9,530,483 | |
| | Dover Corp. | | | 323,449 | | | | 22,948,707 | |
| | Pentair PLC (United Kingdom) | | | 382,150 | | | | 14,437,627 | |
| | | | | | | | | | |
| | | | | | | | | 46,916,817 | |
| | | | | | | | | | |
| | | |
| | Materials 12.2% | | | | | | | | |
| | Air Products and Chemicals Inc. | | | 242,864 | | | | 38,870,383 | |
| | Albemarle Corp. | | | 590,030 | | | | 45,473,612 | |
| | Ecolab Inc. | | | 105,710 | | | | 15,576,369 | |
| | Linde PLC (United Kingdom) | | | 300,728 | | | | 46,925,597 | |
| | Nucor Corp. | | | 208,394 | | | | 10,796,893 | |
| | | | | | | | | | |
| | | | | | | | | 157,642,854 | |
| | | | | | | | | | |
| | | |
| | Media & Entertainment 0.4% | | | | | | | | |
| | John Wiley & Sons Inc., A | | | 100,017 | | | | 4,697,798 | |
| | | | | | | | | | |
| | | |
| | Pharmaceuticals, Biotechnology & Life Sciences 4.4% | | | | | | | | |
| | AbbVie Inc. | | | 140,021 | | | | 12,908,536 | |
| | Johnson & Johnson | | | 234,931 | | | | 30,317,846 | |
| | Perrigo Co. PLC | | | 126,314 | | | | 4,894,668 | |
| | Pfizer Inc. | | | 219,651 | | | | 9,587,766 | |
| | | | | | | | | | |
| | | | | | | | | 57,708,816 | |
| | | | | | | | | | |
| | | |
| | Retailing 3.4% | | | | | | | | |
| | The Gap Inc. | | | 340,196 | | | | 8,763,449 | |
| | Ross Stores Inc. | | | 169,172 | | | | 14,075,110 | |
| | Target Corp. | | | 134,417 | | | | 8,883,620 | |
| | Tiffany & Co. | | | 151,482 | | | | 12,195,816 | |
| | | | | | | | | | |
| | | | | | | | | 43,917,995 | |
| | | | | | | | | | |
| | | |
| | Semiconductors & Semiconductor Equipment 6.1% | | | | | | | | |
| | Analog Devices Inc. | | | 415,904 | | | | 35,697,040 | |
| | Texas Instruments Inc. | | | 423,589 | | | | 40,029,161 | |
| | Versum Materials Inc. | | | 143,528 | | | | 3,978,597 | |
| | | | | | | | | | |
| | | | | | | | | 79,704,798 | |
| | | | | | | | | | |
FRANKLIN TEMPLETON VARIABLE INSURANCE PRODUCTS TRUST
STATEMENT OF INVESTMENTS
Franklin Rising Dividends VIP Fund(continued)
| | | | | | | | | | |
| | | |
| | | | | Shares | | | Value | |
| | Common Stocks(continued) | | | | | | | | |
| | | Software & Services 10.3% | | | | | | |
| | Accenture PLC, A | | | 303,220 | | | $ | 42,757,052 | |
| | Microsoft Corp. | | | 792,240 | | | | 80,467,817 | |
| | Visa Inc., A | | | 81,843 | | | | 10,798,365 | |
| | | | | | | | | | |
| | | | | | | | | 134,023,234 | |
| | | | | | | | | | |
| | | |
| | Trading Companies & Distributors 0.6% | | | | | | | | |
| | W.W. Grainger Inc. | | | 25,696 | | | | 7,255,523 | |
| | | | | | | | | | |
| | | |
| | Transportation 0.4% | | | | | | | | |
| | United Parcel Service Inc., B | | | 59,256 | | | | 5,779,238 | |
| | | | | | | | | | |
| | | |
| | Total Common Stocks (Cost $770,254,633) | | | | | | | 1,295,325,592 | |
| | | | | | | | | | |
| | | |
| | Short Term Investments (Cost $8,504,577) 0.6% | | | | | | | | |
| | | |
| | Money Market Funds 0.6% | | | | | | | | |
| b,c | | Institutional Fiduciary Trust Money Market Portfolio, 1.99% | | | 8,504,577 | | | | 8,504,577 | |
| | | | | | | | | | |
| | Total Investments (Cost $778,759,210) 100.5% | | | | | | | 1,303,830,169 | |
| | Other Assets, less Liabilities (0.5)% | | | | | | | (6,833,396 | ) |
| | | | | | | | | | |
| | Net Assets 100.0% | | | | | | $ | 1,296,996,773 | |
| | | | | | | | | | |
aNon-income producing.
bSee Note 3(e) regarding investments in affiliated management investment companies.
cThe rate shown is the annualizedseven-day effective yield at period end.
| | | | | | |
| | | |
| The accompanying notes are an integral part of these financial statements. | | | Annual Report | |
| FRD-11
|
|
FRANKLIN TEMPLETON VARIABLE INSURANCE PRODUCTS TRUST
Financial Statements
Statement of Assets and Liabilities
December 31, 2018
| | | | |
| |
| | | Franklin Rising Dividends VIP Fund | |
Assets: | | | | |
Investments in securities: | | | | |
Cost - Unaffiliated issuers | | $ | 770,254,633 | |
Cost -Non-controlled affiliates (Note 3e) | | | 8,504,577 | |
| | | | |
Value - Unaffiliated issuers | | $ | 1,295,325,592 | |
Value -Non-controlled affiliates (Note 3e) | | | 8,504,577 | |
Receivables: | | | | |
Investment securities sold | | | 3,700,825 | |
Capital shares sold | | | 342,533 | |
Dividends | | | 2,273,458 | |
Other assets | | | 218 | |
| | | | |
Total assets | | | 1,310,147,203 | |
| | | | |
Liabilities: | | | | |
Payables: | | | | |
Capital shares redeemed | | | 11,701,567 | |
Management fees | | | 745,100 | |
Distribution fees | | | 542,734 | |
Accrued expenses and other liabilities | | | 161,029 | |
| | | | |
Total liabilities | | | 13,150,430 | |
| | | | |
Net assets, at value | | $ | 1,296,996,773 | |
| | | | |
Net assets consist of: | | | | |
Paid-in capital | | $ | 441,338,808 | |
Total distributable earnings (loss) | | | 855,657,965 | |
| | | | |
Net assets, at value | | $ | 1,296,996,773 | |
| | | | |
| |
| Class 1: | | | | |
Net assets, at value | | $ | 157,837,987 | |
| | | | |
Shares outstanding | | | 6,129,428 | |
| | | | |
Net asset value and maximum offering price per share | | $ | 25.75 | |
| | | | |
| |
| Class 2: | | | | |
Net assets, at value | | $ | 1,106,333,952 | |
| | | | |
Shares outstanding | | | 44,184,327 | |
| | | | |
Net asset value and maximum offering price per share | | $ | 25.04 | |
| | | | |
| |
| Class 4: | | | | |
Net assets, at value | | $ | 32,824,834 | |
| | | | |
Shares outstanding | | | 1,307,015 | |
| | | | |
Net asset value and maximum offering price per share | | $ | 25.11 | |
| | | | |
| | | | | | |
| | | |
| | FRD-11 | | | Annual Report | The accompanying notes are an integral part of these financial statements. | | |
FRANKLIN TEMPLETON VARIABLE INSURANCE PRODUCTS TRUST
FINANCIAL STATEMENTS
Statement of Operations
for the year ended December 31, 2018
| | | | |
| |
| | | Franklin Rising Dividends VIP Fund | |
Investment income: | | | | |
Dividends: (net of foreign taxes)* | | | | |
Unaffiliated issuers | | $ | 34,660,534 | |
Non-controlled affiliates (Note 3e) | | | 203,833 | |
| | | | |
Total investment income | | | 34,864,367 | |
| | | | |
Expenses: | | | | |
Management fees (Note 3a) | | | 10,605,089 | |
Distribution fees: (Note 3c) | | | | |
Class 2 | | | 3,808,204 | |
Class 4 | | | 125,022 | |
Custodian fees (Note 4) | | | 15,669 | |
Reports to shareholders | | | 181,511 | |
Professional fees | | | 63,709 | |
Trustees’ fees and expenses | | | 12,934 | |
Other | | | 47,606 | |
| | | | |
Total expenses. | | | 14,859,744 | |
Expense reductions (Note 4) | | | (246 | ) |
Expenses waived/paid by affiliates (Note 3e) | | | (50,732 | ) |
| | | | |
Net expenses | | | 14,808,766 | |
| | | | |
Net investment income | | | 20,055,601 | |
| | | | |
Realized and unrealized gains (losses): | | | | |
Net realized gain (loss) from: | | | | |
Investments:+ | | | | |
Unaffiliated issuers | | | 314,859,085 | |
Foreign currency transactions | | | (653 | ) |
| | | | |
Net realized gain (loss) | | | 314,858,432 | |
| | | | |
Net change in unrealized appreciation (depreciation) on: | | | | |
Investments: | | | | |
Unaffiliated issuers | | | (398,447,639 | ) |
| | | | |
Net realized and unrealized gain (loss) | | | (83,589,207 | ) |
| | | | |
Net increase (decrease) in net assets resulting from operations | | $ | (63,533,606 | ) |
| | | | |
| | | | |
*Foreign taxes withheld on dividends | | $ | 4,873 | |
+Includes gains from a redemptionin-kind (Note 8) | | $ | 70,642,118 | |
| | | | | | |
| | | |
| | The accompanying notes are an integral part of these financial statements. | Annual Report | | | FRD-13 | |
FRANKLIN TEMPLETON VARIABLE INSURANCE PRODUCTS TRUST
FINANCIAL STATEMENTS
Statements of Changes in Net Assets
| | | | | | | | |
| |
| | | Franklin Rising Dividends VIP Fund | |
| |
| | | Year Ended December 31, | |
| | |
| | | 2018 | | | 2017 | |
Increase (decrease) in net assets: | | | | | | | | |
Operations: | | | | | | | | |
Net investment income | | $ | 20,055,601 | | | $ | 22,882,157 | |
Net realized gain (loss) | | | 314,858,432 | | | | 108,533,229 | |
Net change in unrealized appreciation (depreciation) | | | (398,447,639 | ) | | | 207,698,448 | |
| | | | |
Net increase (decrease) in net assets resulting from operations | | | (63,533,606 | ) | | | 339,113,834 | |
| | | | |
Distributions to shareholders: (Note 1d) | | | | | | | | |
Class 1 | | | (13,329,516 | ) | | | (10,399,801 | ) |
Class 2 | | | (115,786,937 | ) | | | (81,344,467 | ) |
Class 4 | | | (2,574,964 | ) | | | (1,635,173 | ) |
| | | | |
Total distributions to shareholders | | | (131,691,417 | ) | | | (93,379,441 | ) |
| | | | |
Capital share transactions: (Note 2) | | | | | | | | |
Class 1 | | | (37,447,873 | ) | | | 7,492,496 | |
Class 2 | | | (364,402,663 | ) | | | (103,411,809 | ) |
Class 4 | | | 766,328 | | | | 3,465,199 | |
| | | | |
Total capital share transactions | | | (401,084,208 | ) | | | (92,454,114 | ) |
| | | | |
Net increase (decrease) in net assets | | | (596,309,231 | ) | | | 153,280,279 | |
Net assets: | | | | | | | | |
Beginning of year | | | 1,893,306,004 | | | | 1,740,025,725 | |
| | | | |
End of year (Note 1d) | | | $1,296,996,773 | | | | $1,893,306,004 | |
| | | | |
| | | | | | |
| | | |
| | FRD-14 | | | Annual Report | The accompanying notes are an integral part of these financial statements. | | |
FRANKLIN TEMPLETON VARIABLE INSURANCE PRODUCTS TRUST
Notes to Financial Statements
Franklin Rising Dividends VIP Fund
1. Organization and Significant Accounting Policies
Franklin Templeton Variable Insurance Products Trust (Trust) is registered under the Investment Company Act of 1940 (1940 Act) as anopen-end management investment company, consisting of eighteen separate funds and applies the specialized accounting and reporting guidance in U.S. Generally Accepted Accounting Principles (U.S. GAAP). Franklin Rising Dividends VIP Fund (Fund) is included in this report. Shares of the Fund are generally sold only to insurance company separate accounts to fund the benefits of variable life insurance policies or variable annuity contracts. The Fund offers three classes of shares: Class 1, Class 2 and Class 4. Each class of shares may differ by its distribution fees, voting rights on matters affecting a single class and its exchange privilege.
The following summarizes the Fund’s significant accounting policies.
a. Financial Instrument Valuation
The Fund’s investments in financial instruments are carried at fair value daily. Fair value is the price that would be received to sell an asset or paid to transfer a liability in an orderly transaction between market participants on the measurement date. The Fund calculates the net asset value (NAV) per share each business day as of 4 p.m. Eastern time or the regularly scheduled close of the New York Stock Exchange (NYSE), whichever is earlier. Under compliance policies and procedures approved by the Trust’s Board of Trustees (the Board), the Fund’s administrator has responsibility for oversight of valuation, including leading the cross-functional Valuation Committee (VC). The Fund may utilize independent pricing services, quotations from securities and financial instrument dealers, and other market sources to determine fair value.
Equity securities listed on an exchange or on the NASDAQ National Market System are valued at the last quoted sale price or the official closing price of the day, respectively. Foreign equity securities are valued as of the close of trading on the foreign stock exchange on which the security is primarily traded, or as of 4 p.m. Eastern time. The value is then converted into its U.S. dollar equivalent at the foreign exchange rate in effect at 4 p.m. Eastern time on the day that the value of the security is determined.Over-the-counter (OTC) securities are valued within the range of the most recent quoted bid and ask prices. Securities that trade in multiple markets or on multiple
exchanges are valued according to the broadest and most representative market. Certain equity securities are valued based upon fundamental characteristics or relationships to similar securities.
Investments inopen-end mutual funds are valued at the closing NAV.
The Fund has procedures to determine the fair value of financial instruments for which market prices are not reliable or readily available. Under these procedures, the Fund primarily employs a market-based approach which may use related or comparable assets or liabilities, recent transactions, market multiples, book values, and other relevant information for the investment to determine the fair value of the investment. An income-based valuation approach may also be used in which the anticipated future cash flows of the investment are discounted to calculate fair value. Discounts may also be applied due to the nature or duration of any restrictions on the disposition of the investments. Due to the inherent uncertainty of valuations of such investments, the fair values may differ significantly from the values that would have been used had an active market existed.
Trading in securities on foreign securities stock exchanges and OTC markets may be completed before 4 p.m. Eastern time. In addition, trading in certain foreign markets may not take place on every Fund’s business day. Occasionally, events occur between the time at which trading in a foreign security is completed and 4 p.m. Eastern time that might call into question the reliability of the value of a portfolio security held by the Fund. As a result, differences may arise between the value of the Fund’s portfolio securities as determined at the foreign market close and the latest indications of value at 4 p.m. Eastern time. In order to minimize the potential for these differences, the VC monitors price movements following the close of trading in foreign stock markets through a series of country specific market proxies (such as baskets of American Depositary Receipts, futures contracts and exchange traded funds). These price movements are measured against established trigger thresholds for each specific market proxy to assist in determining if an event has occurred that may call into question the reliability of the values of the foreign securities held by the Fund. If such an event occurs, the securities may be valued using fair value procedures, which may include the use of independent pricing services.
FRANKLIN TEMPLETON VARIABLE INSURANCE PRODUCTS TRUST
NOTES TO FINANCIAL STATEMENTS
Franklin Rising Dividends VIP Fund(continued)
1. Organization and Significant Accounting
Policies(continued)
a. Financial Instrument Valuation(continued)
When the last day of the reporting period is anon-business day, certain foreign markets may be open on those days that the Fund’s NAV is not calculated, which could result in differences between the value of the Fund’s portfolio securities on the last business day and the last calendar day of the reporting period. Any significant security valuation changes due to an open foreign market are adjusted and reflected by the Fund for financial reporting purposes.
b. Foreign Currency Translation
Portfolio securities and other assets and liabilities denominated in foreign currencies are translated into U.S. dollars based on the exchange rate of such currencies against U.S. dollars on the date of valuation. The Fund may enter into foreign currency exchange contracts to facilitate transactions denominated in a foreign currency. Purchases and sales of securities, income and expense items denominated in foreign currencies are translated into U.S. dollars at the exchange rate in effect on the transaction date. Portfolio securities and assets and liabilities denominated in foreign currencies contain risks that those currencies will decline in value relative to the U.S. dollar. Occasionally, events may impact the availability or reliability of foreign exchange rates used to convert the U.S. dollar equivalent value. If such an event occurs, the foreign exchange rate will be valued at fair value using procedures established and approved by the Board.
The Fund does not separately report the effect of changes in foreign exchange rates from changes in market prices on securities held. Such changes are included in net realized and unrealized gain or loss from investments in the Statement of Operations.
Realized foreign exchange gains or losses arise from sales of foreign currencies, currency gains or losses realized between the trade and settlement dates on securities transactions and the difference between the recorded amounts of dividends, interest, and foreign withholding taxes and the U.S. dollar equivalent of the amounts actually received or paid. Net unrealized foreign exchange gains and losses arise from changes in foreign exchange rates on foreign denominated assets and liabilities other than investments in securities held at the end of the reporting period.
c. Income and Deferred Taxes
It is the Fund’s policy to qualify as a regulated investment company under the Internal Revenue Code. The Fund intends to distribute to shareholders substantially all of its taxable income and net realized gains to relieve it from federal income and if applicable, excise taxes. As a result, no provision for U.S. federal income taxes is required.
The Fund may be subject to foreign taxation related to income received, capital gains on the sale of securities and certain foreign currency transactions in the foreign jurisdictions in which it invests. Foreign taxes, if any, are recorded based on the tax regulations and rates that exist in the foreign markets in which the Fund invests. When a capital gain tax is determined to apply, the Fund records an estimated deferred tax liability in an amount that would be payable if the securities were disposed of on the valuation date.
The Fund may recognize an income tax liability related to its uncertain tax positions under U.S. GAAP when the uncertain tax position has a less than 50% probability that it will be sustained upon examination by the tax authorities based on its technical merits. As of December 31, 2018, the Fund has determined that no tax liability is required in its financial statements related to uncertain tax positions for any open tax years (or expected to be taken in future tax years). Open tax years are those that remain subject to examination and are based on the statute of limitations in each jurisdiction in which the Fund invests.
d. Security Transactions, Investment Income, Expenses and Distributions
Security transactions are accounted for on trade date. Realized gains and losses on security transactions are determined on a specific identification basis. Estimated expenses are accrued daily. Dividend income is recorded on theex-dividend date except for certain dividends from securities where the dividend rate is not available. In such cases, the dividend is recorded as soon as the information is received by the Fund. Distributions to shareholders are recorded on theex-dividend date. Distributable earnings are determined according to income tax regulations (tax basis) and may differ from earnings recorded in accordance with U.S. GAAP. These differences may be permanent or temporary. Permanent differences are reclassified among capital accounts to reflect their tax character. These reclassifications
FRANKLIN TEMPLETON VARIABLE INSURANCE PRODUCTS TRUST
NOTES TO FINANCIAL STATEMENTS
Franklin Rising Dividends VIP Fund(continued)
have no impact on net assets or the results of operations. Temporary differences are not reclassified, as they may reverse in subsequent periods.*
Common expenses incurred by the Trust are allocated among the Funds based on the ratio of net assets of each Fund to the combined net assets of the Trust or based on the ratio of number of shareholders of each Fund to the combined number of shareholders of the Trust. Fund specific expenses are charged directly to the Fund that incurred the expense.
Realized and unrealized gains and losses and net investment income, excluding class specific expenses, are allocated daily to each class of shares based upon the relative proportion of net assets of each class. Differences in per share distributions by class are generally due to differences in class specific expenses.
e. Accounting Estimates
The preparation of financial statements in accordance with U.S. GAAP requires management to make estimates and assumptions that affect the reported amounts of assets and
liabilities at the date of the financial statements and the amounts of income and expenses during the reporting period. Actual results could differ from those estimates.
f. Guarantees and Indemnifications
Under the Trust’s organizational documents, its officers and trustees are indemnified by the Trust against certain liabilities arising out of the performance of their duties to the Trust. Additionally, in the normal course of business, the Trust, on behalf of the Fund, enters into contracts with service providers that contain general indemnification clauses. The Trust’s maximum exposure under these arrangements is unknown as this would involve future claims that may be made against the Trust that have not yet occurred. Currently, the Trust expects the risk of loss to be remote.
*Effective during the current reporting period, it is no longer required to present certain line items in the Statements of Changes in Net Assets. The below prior period amounts affected by this change are shown as they were in the prior year Statements of Changes in Net Assets.
For the year ended December 31, 2017, distributions to shareholders were as follows:
| | | | |
Distributions from net investment income : | | | | |
Class 1 | | $ | (3,388,715 | ) |
Class 2 | | | (24,052,908 | ) |
Class 4 | | | (476,793 | ) |
Distributions from net realized gains: | | | | |
Class 1 | | | (7,011,086 | ) |
Class 2 | | | (57,291,559 | ) |
Class 4 | | | (1,158,380 | ) |
For the year ended December 31, 2017, undistributed net investment income included in net assets was $18,555,375.
FRANKLIN TEMPLETON VARIABLE INSURANCE PRODUCTS TRUST
NOTES TO FINANCIAL STATEMENTS
Franklin Rising Dividends VIP Fund(continued)
2. Shares of Beneficial Interest
At December 31, 2018, there were an unlimited number of shares authorized (without par value). Transactions in the Fund’s shares were as follows:
| | | | | | | | | | | | | | | | | | | | |
| |
| | | Year Ended December 31, | |
| | | |
| | | 2018 | | | | | | 2017 | |
| | | | | |
| | | Shares | | | Amount | | | | | | Shares | | | Amount | |
| | | | | |
| Class 1 Shares: | | | | | | | | | | | | | | | | | | | | |
Shares sold | | | 296,177 | | | $ | 8,482,359 | | | | | | | | 968,022 | | | $ | 25,981,840 | |
Shares issued in reinvestment of distributions | | | 481,211 | | | | 13,329,516 | | | | | | | | 394,680 | | | | 10,399,801 | |
Shares redeemed | | | (2,043,710 | ) | | | (59,259,748 | ) | | | | | | | (1,064,640 | ) | | | (28,889,145 | ) |
| | | | |
Net increase (decrease) | | | (1,266,322 | ) | | $ | (37,447,873 | ) | | | | | | | 298,062 | | | $ | 7,492,496 | |
| | | | |
| Class 2 Shares: | | | | | | | | | | | | | | | | | | | | |
Shares sold | | | 3,479,467 | | | $ | 95,894,196 | | | | | | | | 2,058,817 | | | $ | 54,342,881 | |
Shares issued in reinvestment of distributions | | | 4,293,174 | | | | 115,786,937 | | | | | | | | 3,163,923 | | | | 81,344,467 | |
Shares redeemedin-kind (Note 8) | | | (5,455,397 | ) | | | (147,395,561 | ) | | | | | | | — | | | | — | |
Shares redeemed | | | (15,794,114 | ) | | | (428,688,235 | ) | | | | | | | (9,039,170 | ) | | | (239,099,157 | ) |
| | | | |
Net increase (decrease) | | | (13,476,870 | ) | | $ | (364,402,663 | ) | | | | | | | (3,816,430 | ) | | $ | (103,411,809 | ) |
| | | | |
| Class 4 Shares: | | | | | | | | | | | | | | | | | | | | |
Shares sold | | | 206,879 | | | $ | 5,727,225 | | | | | | | | 269,622 | | | $ | 7,129,389 | |
Shares issued in reinvestment of distributions | | | 95,123 | | | | 2,574,964 | | | | | | | | 63,379 | | | | 1,635,173 | |
Shares redeemed | | | (270,440 | ) | | | (7,535,861 | ) | | | | | | | (201,530 | ) | | | (5,299,363 | ) |
| | | | |
Net increase (decrease) | | | 31,562 | | | $ | 766,328 | | | | | | | | 131,471 | | | $ | 3,465,199 | |
| | | | |
3. Transactions with Affiliates
Franklin Resources, Inc. is the holding company for various subsidiaries that together are referred to as Franklin Templeton. Certain officers and trustees of the Fund are also officers and/or directors of the following subsidiaries:
| | |
| |
| Subsidiary | | Affiliation |
Franklin Advisers, Inc. (Advisers) | | Investment manager |
Franklin Templeton Services, LLC (FT Services) | | Administrative manager |
Franklin Templeton Distributors, Inc. (Distributors) | | Principal underwriter |
Franklin Templeton Investor Services, LLC (Investor Services) | | Transfer agent |
a. Management Fees
The Fund pays an investment management fee to Advisers based on the average daily net assets of the Fund as follows:
| | |
| |
| Annualized Fee Rate | | Net Assets |
0.750% | | Up to and including $500 million |
0.625% | | Over $500 million, up to and including $1 billion |
0.500% | | Over $1 billion, up to and including $5 billion |
0.490% | | In excess of $5 billion |
For the year ended December 31, 2018, the gross effective investment management fee rate was 0.608% of the Fund’s average daily net assets.
FRANKLIN TEMPLETON VARIABLE INSURANCE PRODUCTS TRUST
NOTES TO FINANCIAL STATEMENTS
Franklin Rising Dividends VIP Fund(continued)
b. Administrative Fees
Under an agreement with Advisers, FT Services provides administrative services to the Fund. The fee is paid by Advisers based on the Fund’s average daily net assets, and is not an additional expense of the Fund.
c. Distribution Fees
The Board has adopted distribution plans for Class 2 and Class 4 shares pursuant to Rule12b-1 under the 1940 Act. Under the Fund’s compensation distribution plans, the Fund pays Distributors for costs incurred in connection with the servicing, sale and distribution of the Fund’s shares up to 0.35% per year of its average daily net assets of each class. The Board has agreed to limit the current rate to 0.25% per year for Class 2. The plan year, for purposes of monitoring compliance with the maximum annual plan rates, is February 1 through January 31.
d. Transfer Agent Fees
Investor Services, under terms of an agreement, performs shareholder servicing for the Fund and is not paid by the Fund for the services.
e. Investments in Affiliated Management Investment Companies
The Fund invests in one or more affiliated management investment companies for purposes other than exercising a controlling influence over the management or policies. Management fees paid by the Fund are waived on assets invested in the affiliated management investment companies, as noted in the Statement of Operations, in an amount not to exceed the management and administrative fees paid directly or indirectly by each affiliate. During the year ended December 31, 2018, the Fund held investments in affiliated management investment companies as follows:
| | | | | | | | | | | | | | | | | | | | | | | | | | | | | | | | |
| | | | | | | | |
| | | Number
of Shares
Held at
Beginning
of Year | | | Gross
Additions | | | Gross
Reductions | | | Number
of Shares
Held at
End of
Year | | | Value at
End of
Year | | | Dividend
Income | | | Realized
Gain
(Loss) | | | Net Change in
Unrealized
Appreciation
(Depreciation) | |
| Non-Controlled Affiliates | | | | | | | | | | | | | | | | | | | | | | | | | | | | | | | | |
Institutional Fiduciary Trust Money Market Portfolio, 1.99% | | | 13,833,792 | | | | 242,732,403 | | | | (248,061,618 | ) | | | 8,504,577 | | | $ | 8,504,577 | | | $ | 203,833 | | | $ | — | | | $ | — | |
| | | | | | | | | | | | | | | | | | | | |
4. Expense Offset Arrangement
The Fund has entered into an arrangement with its custodian whereby credits realized as a result of uninvested cash balances are used to reduce a portion of the Fund’s custodian expenses. During the year ended December 31, 2018, the custodian fees were reduced as noted in the Statement of Operations.
5. Income Taxes
The tax character of distributions paid during the years ended December 31, 2018 and 2017, was as follows:
| | | | | | | | |
| | |
| | | 2018 | | | 2017 | |
Distributions paid from: | | | | | | | | |
Ordinary income | | $ | 28,678,971 | | | $ | 27,931,719 | |
Long term capital gain | | | 103,012,446 | | | | 65,447,722 | |
| | | | |
| | $ | 131,691,417 | | | $ | 93,379,441 | |
| | | | |
FRANKLIN TEMPLETON VARIABLE INSURANCE PRODUCTS TRUST
NOTES TO FINANCIAL STATEMENTS
Franklin Rising Dividends VIP Fund(continued)
5. Income Taxes(continued)
At December 31, 2018, the cost of investments, net unrealized appreciation (depreciation), undistributed ordinary income and undistributed long term capital gains for income tax purposes were as follows:
| | | | |
Cost of investments | | $ | 781,893,519 | |
| | | | |
Unrealized appreciation | | $ | 593,494,791 | |
Unrealized depreciation | | | (71,558,141 | ) |
| | | | |
Net unrealized appreciation (depreciation) | | $ | 521,936,650 | |
| | | | |
Distributable earnings: | | | | |
Undistributed ordinary income | | $ | 20,050,477 | |
Undistributed long term capital gains | | | 243,028,718 | |
| | | | |
Total distributable earnings | | $ | 263,079,195 | |
| | | | |
Differences between income and/or capital gains as determined on a book basis and a tax basis are primarily due to differing treatment of corporate actions.
6. Investment Transactions
Purchases and sales of investments (excluding short term securities) for the year ended December 31, 2018, aggregated $53,086,035 and $542,466,468, respectively. Sales of investments excludesin-kind transactions of $146,138,576.
7. Credit Facility
The Fund, together with other U.S. registered and foreign investment funds (collectively, Borrowers), managed by Franklin Templeton, are borrowers in a joint syndicated senior unsecured credit facility totaling $2 billion (Global Credit Facility) which matured on February 8, 2019. This Global Credit Facility provides a source of funds to the Borrowers for temporary and emergency purposes, including the ability to meet future unanticipated or unusually large redemption requests. Effective February 8, 2019, the Borrowers renewed the Global Credit Facility for a one year term, maturing February 7, 2020, for a total of $2 billion.
Under the terms of the Global Credit Facility, the Fund shall, in addition to interest charged on any borrowings made by the Fund and other costs incurred by the Fund, pay its share of fees and expenses incurred in connection with the implementation and maintenance of the Global Credit Facility, based upon its relative share of the aggregate net assets of all of the Borrowers, including an annual commitment fee of 0.15% based upon the unused portion of the Global Credit Facility. These fees are reflected in other expenses in the Statement of Operations. During the year ended December 31, 2018, the Fund did not use the Global Credit Facility.
8. RedemptionIn-Kind
During the year ended December 31, 2018, the Fund realized $70,642,118 of net gains resulting from a redemptionin-kind in which a shareholder redeemed fund shares for cash and securities held by the Fund. Because such gains are not taxable to the Fund, and are not distributed to remaining shareholders, they have been reclassified from accumulated net realized gains topaid-in capital.
FRANKLIN TEMPLETON VARIABLE INSURANCE PRODUCTS TRUST
NOTES TO FINANCIAL STATEMENTS
Franklin Rising Dividends VIP Fund(continued)
9. Fair Value Measurements
The Fund follows a fair value hierarchy that distinguishes between market data obtained from independent sources (observable inputs) and the Fund’s own market assumptions (unobservable inputs). These inputs are used in determining the value of the Fund’s financial instruments and are summarized in the following fair value hierarchy:
| | • | | Level 1 – quoted prices in active markets for identical financial instruments |
| | • | | Level 2 – other significant observable inputs (including quoted prices for similar financial instruments, interest rates, prepayment speed, credit risk, etc.) |
| | • | | Level 3 – significant unobservable inputs (including the Fund’s own assumptions in determining the fair value of financial instruments) |
The input levels are not necessarily an indication of the risk or liquidity associated with financial instruments at that level.
At December 31, 2018, all of the Fund’s investments in financial instruments carried at fair value were valued using Level 1 inputs. For detailed categories, see the accompanying Statement of Investments.
10. Subsequent Events
The Fund has evaluated subsequent events through the issuance of the financial statements and determined that no events have occurred that require disclosure other than those already disclosed in the financial statements.
FRANKLIN TEMPLETON VARIABLE INSURANCE PRODUCTS TRUST
Report of Independent Registered Public Accounting Firm
To the Board of Trustees of Franklin Templeton Variable Insurance Products Trust and Shareholders of Franklin Rising Dividends VIP Fund
Opinion on the Financial Statements
We have audited the accompanying statement of assets and liabilities, including the statement of investments, of Franklin Rising Dividends VIP Fund (the “Fund”) as of December 31, 2018, the related statement of operations for the year ended December 31, 2018, the statement of changes in net assets for each of the two years in the period ended December 31, 2018, including the related notes, and the financial highlights for each of the five years in the period ended December 31, 2018 (collectively referred to as the “financial statements”). In our opinion, the financial statements present fairly, in all material respects, the financial position of the Fund as of December 31, 2018, the results of its operations for the year then ended, the changes in its net assets for each of the two years in the period ended December 31, 2018 and the financial highlights for each of the five years in the period ended December 31, 2018 in conformity with accounting principles generally accepted in the United States of America.
Basis for Opinion
These financial statements are the responsibility of the Fund’s management. Our responsibility is to express an opinion on the Fund’s financial statements based on our audits. We are a public accounting firm registered with the Public Company Accounting Oversight Board (United States) (PCAOB) and are required to be independent with respect to the Fund in accordance with the U.S. federal securities laws and the applicable rules and regulations of the Securities and Exchange Commission and the PCAOB.
We conducted our audits of these financial statements in accordance with the standards of the PCAOB. Those standards require that we plan and perform the audit to obtain reasonable assurance about whether the financial statements are free of material misstatement, whether due to error or fraud.
Our audits included performing procedures to assess the risks of material misstatement of the financial statements, whether due to error or fraud, and performing procedures that respond to those risks. Such procedures included examining, on a test basis, evidence regarding the amounts and disclosures in the financial statements. Our audits also included evaluating the accounting principles used and significant estimates made by management, as well as evaluating the overall presentation of the financial statements. Our procedures included confirmation of securities owned as of December 31, 2018 by correspondence with the custodian and transfer agent. We believe that our audits provide a reasonable basis for our opinion.
PricewaterhouseCoopers LLP
San Francisco, California
February 15, 2019
We have served as the auditor of one or more investment companies in the Franklin Templeton Group of Funds since 1948.
FRANKLIN TEMPLETON VARIABLE INSURANCE PRODUCTS TRUST
Tax Information (unaudited)
Franklin Rising Dividends VIP Fund
Under Section 852(b)(3)(C) of the Internal Revenue Code, the Fund hereby reports the maximum amount allowable but no less than $103,012,446 as a long term capital gain dividend for the fiscal year ended December 31, 2018.
Under Section 854(b)(1)(A) of the Internal Revenue Code, the Fund hereby reports 100% of the ordinary income dividends as income qualifying for the dividends received deduction for the fiscal year ended December 31, 2018.
This page intentionally left blank.
Franklin Small Cap Value VIP Fund
This annual report for Franklin Small Cap Value VIP Fund covers the fiscal year ended December 31, 2018.
Class 1 Performance Summary as of December 31, 2018
Average annual total return of Class 1 shares* represents the average annual change in value, assuming reinvestment of dividends and capital gains. Average returns smooth out variations in returns, which can be significant; they are not the same asyear-by-year results.
| | | | | | | | | | | | |
| | | |
| Periods ended 12/31/18 | | 1-Year | | | 5-Year | | | 10-Year | |
Average Annual Total Return | | | -12.69% | | | | +3.43% | | | | +11.91% | |
*The Fund has a fee waiver associated with any investment it makes in a Franklin Templeton money fund and/or other Franklin Templeton fund, contractually guaranteed through 4/30/19. Fund investment results reflect the fee waiver; without this waiver, the results would have been lower.
Performance reflects the Fund’s Class 1 operating expenses, but doesnotinclude any contract fees, expenses or sales charges. If they had been included, performance would be lower. These charges and deductions, particularly for variable life policies, can have a significant effect on contract values and insurance benefits. See the contract prospectus for a complete description of these expenses, including sales charges.
Performance data represent past performance, which does not guarantee future results. Investment return and principal value will fluctuate, and you may have a gain or loss when you sell your shares. Current performance may differ from figures shown.
Total Return Index Comparison for a Hypothetical $10,000 Investment (1/1/09–12/31/18)
The graph below shows the change in value of a hypothetical $10,000 investment in the Fund over the indicated period and includes reinvestment of any income or distributions. The Fund’s performance* is compared to the performance of the Russell 2000® Value Index. One cannot invest directly in an index, and an index is not representative of the Fund’s portfolio.Please see Important Notes to Performance Information preceding the Fund Summaries.
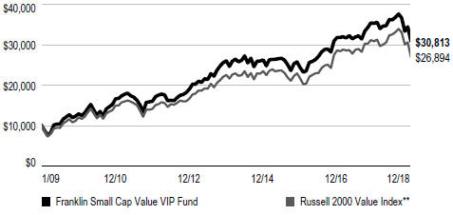
**Source: Morningstar. Please see Index Descriptions following the Fund Summaries.
FRANKLIN SMALL CAP VALUE VIP FUND
Fund Goal and Main Investments
The Fund seeks long-term total return. Under normal market conditions, the Fund invests at least 80% of its net assets in investments of small capitalization companies. For this Fund, small capitalization companies are those with market capitalizations not exceeding either the highest market capitalization in the Russell 2000® Index or the12-month average of the highest market capitalization in the Russell 2000® Index, whichever is greater, at the time of purchase. The Fund generally invests in equity securities of companies that the manager believes are undervalued at the time of purchase and have the potential for capital appreciation.
Fund Risks
All investments involve risks, including possible loss of principal. Value securities may not increase in price as anticipated, or may decline further in value. The Fund’s investments in smaller company stocks carry special risks as such stocks have historically exhibited greater price volatility than large-company stocks, particularly over the short term. Additionally, smaller companies often have relatively small revenues, limited product lines and a small market share. In addition, the Fund may invest up to 25% of its total assets in foreign securities, which involve special risks, including currency fluctuations and economic and political uncertainty. The Fund also may invest in equity real estate investment trusts (REITs). The Fund is actively managed but there is no guarantee that the manager’s investment decisions will produce the desired results. The Fund’s prospectus also includes a description of the main investment risks.
Performance Overview
You can find the Fund’sone-year total return in the Performance Summary. In comparison, the Russell 2000® Value Index had a-12.86% total return for the same period.1 Please note the Fund employs abottom-up stock selection process, and the managers invest in securities without regard to benchmark comparisons.
Economic and Market Overview
The U.S. economy grew during the 12 months under review. After moderating for three consecutive quarters, the economy grew faster in 2018’s second quarter, driven by consumer
spending, business investment, exports and government spending. However, growth moderated in the third quarter due to declines in exports and housing investment. The manufacturing and services sectors expanded during the period. The unemployment rate declined from 4.1% in December 2017 to 3.9% atperiod-end.2 Annual inflation, as measured by the Consumer Price Index, decreased from 2.1% in December 2017 to 1.9% atperiod-end.2
The U.S. Federal Reserve (Fed) raised its target range for the federal funds rate four times during the period, to 2.25%–2.50%, and continued to reduce its balance sheet as part of its ongoing plan to normalize monetary policy. At its December meeting, the Fed reduced the projected 2019 rate increases to two, compared to three projected previously.
U.S. equity markets overall declined during the period amid concerns about tighter regulation of technology companies, the pace of the Fed’s rate increases, U.S. political uncertainties, the Trump administration’s protectionist policies, and the potential impact of the U.S.-China trade dispute on U.S. and global growth and corporate earnings. However, these concerns were partially alleviated by an overall easing of tensions in the Korean peninsula, ongoing trade negotiations between the U.S. and the European Union, and a new trade deal between the U.S., Mexico and Canada (pending ratification by the three countries’ legislatures), and intermittent U.S.-China trade negotiations, including a temporary truce that the two countries reached in December. Markets also benefited from mostly upbeat economic data, better U.S. corporate earnings, results of the U.S.mid-term elections and a potentially slower pace to the Fed’s rate increases. In this environment, the broad U.S. stock market, as measured by the Standard & Poor’s® 500 Index (S&P 500®), reached a newall-time high in September 2018, but had a-4.38% total return for the12-month period.1
Investment Strategy
Our strategy is to invest insmall-cap companies that we believe are undervalued at the time of purchase and have the potential for capital appreciation. A stock is undervalued, or is a “value,” when it trades at less than the price at which the investment manager believes it would trade if the market reflected all factors relating to the company’s worth. Following this strategy, the Fund invests in companies that the investment
1. Source: Morningstar.
One cannot invest directly in an index, and an index is not representative of the Fund’s portfolio. Please see Index Descriptions following the Fund Summaries.
2. Source: Bureau of Labor Statistics.
The dollar value, number of shares or principal amount, and names of all portfolio holdings are listed in the Fund’s Statement of Investments (SOI).
FRANKLIN SMALL CAP VALUE VIP FUND
manager believes have, for example: stock prices that are low relative to current, or historical or future earnings, book value, cash flow or sales; recent sharp price declines but the potential for good long-term earnings prospects; and valuable intangibles not reflected in the stock price. The Fund also may invest in equity real estate investment trusts (REITs).
The Fund may invest up to 25% of its total assets in foreign securities.
Manager’s Discussion
For the fiscal year ended December 31, 2018, some contributors to absolute Fund performance included Esterline Technologies, Zebra Technologies and Brinker.
Shares of Esterline Technologies, an aerospace and defense component supplier, jumped on reports in July 2018 that it was exploring a possible sale. The aerospace industry has been undergoing a consolidation phase fueled by a combination of likely increases in U.S. defense spending, growing passenger air traffic and increased industry competitiveness. In August, the company posted improved results for its fiscal third quarter, including 20% operating margins in its materials business. Ultimately, in October, Esterline announced an agreement to be purchased by Transdigm (not a fund holding) at a nearly 40% premium to the prior closing price.
Zebra Technologies is a leader in the automatic identification and data capture market. Shares of Zebra Technologies rose during the year, as the company reported an acceleration in year-over-year organic revenue growth, improved its gross profit margins, and made substantial progress on reducing and refinancing its debt. These positive developments helped increase the company’s earnings power. Toward the end of 2018, we reduced our investment position in the company as the stock price advanced toward our estimate of intrinsic value.
Casual dining restaurant company Brinker’s shares rose in the first half of 2018 on signs of further improvement in sales as a healthier labor market and U.S. income tax cuts resulted in greater levels of consumer confidence. In the case of Brinker more specifically, a revamped menu and focus on driving increased traffic through quality and value offerings helped to improve same-store sales trends to the highest levels since 2015. In late October, Brinker reported solid quarterly earnings driven in part by menu changes that boosted customer traffic, which helped push its stock price higher in November.
Detractors from absolute Fund performance included First Horizon, Astec Industries and LCI Industries.
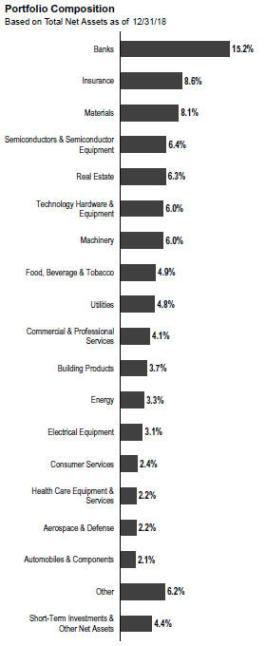
Shares of First Horizon, a regional bank with a footprint in the southeastern U.S., declined due to weaker-than-expected operational results tied to lower interest rate spread income and challenging fixed income capital markets conditions. While
FRANKLIN SMALL CAP VALUE VIP FUND
| | | | |
| Top 10 Holdings | | | |
| 12/31/18 | | | |
| |
Company Sector/Industry | | % of Total
Net Assets | |
The Hanover Insurance Group Inc. Insurance | | | 3.7% | |
OceanaGold Corp. (Australia) Materials | | | 3.0% | |
Columbia Banking System Inc. Banks | | | 2.8% | |
Gibraltar Industries Inc. Building Products | | | 2.8% | |
Regal Beloit Corp. Electrical Equipment | | | 2.7% | |
Old Republic International Corp. Insurance | | | 2.7% | |
First Horizon National Corp. Banks | | | 2.5% | |
Brinker International Inc. Consumer Services | | | 2.3% | |
Maple Leaf Foods Inc. Food, Beverage & Tobacco | | | 2.3% | |
Horace Mann Educators Corp. Insurance | | | 2.2% | |
some of the operational challenges likely resulted from the integration of Capital Bank (not a Fund holding), which it acquired in late 2017, the banking industry is facing a more challenging interest-rate spread outlook. Interest rates for customer deposits and competition between banks have risen, while the yield curve has flattened, hurting net interest margins. Consequently, bank stocks, including First Horizon, have been under pressure from lower earnings growth expectations and a corresponding decline in valuation levels.
Astec Industries, a leading manufacturer of road paving and mining equipment, saw its shares negatively impacted by declining orders and a substantial charge related to its wood pellet business. We continue to see opportunities for Astec to increase earnings and free cash flow generation. It is also taking steps to improve margins and capital allocation, including retaining an outside consulting firm to assist in reducing procurement costs.
LCI Industries (formerly, Drew Industries) is a leading manufacturer of original equipment and replacement components for recreational vehicles (RVs), manufactured homes and watercraft. The stock price declined as an increase in RV dealer inventories was expected to cause a reduction in RV production rates, in order to better match supply and demand. In addition, an increase in interest rates negatively impacted investor sentiment. LCI has spent several years
diversifying its business away from sole reliance on RVs, which has helped to mitigate an otherwise more negative impact. We are hopeful that as consumers remain interested in the RV lifestyle, orders will rebound and investor sentiment will improve.
During the reporting period, we added some new positions with the largest purchases including Synaptics, a developer of human interface hardware and software; Carpenter Technology, a producer of stainless steels and special corrosion-resistant alloys; and laser manufacturer Coherent. We added to existing positions in Regal Beloit, a provider of electric motors; and MKS Instruments, a provider of subsystems solutions and instruments to the semiconductor and other advanced manufacturing industries. Conversely, we exited some positions including Energen, Spirit Airlines and BRP. We also reduced our positions in Simpson Manufacturing, AAR and the aforementioned Zebra Technologies.
Thank you for your participation in Franklin Small Cap Value VIP Fund. We look forward to serving your future investment needs.
The foregoing information reflects our analysis, opinions and portfolio holdings as of December 31, 2018, the end of the reporting period. The way we implement our main investment strategies and the resulting portfolio holdings may change depending on factors such as market and economic conditions. These opinions may not be relied upon as investment advice or an offer for a particular security. The information is not a complete analysis of every aspect of any market, country, industry, security or the Fund. Statements of fact are from sources considered reliable, but the investment manager makes no representation or warranty as to their completeness or accuracy. Although historical performance is no guarantee of future results, these insights may help you understand our investment management philosophy.
FRANKLIN SMALL CAP VALUE VIP FUND
Class 1 Fund Expenses
As an investor in a variable insurance contract (Contract) that indirectly provides for investment in an underlying mutual fund, you can incur transaction and/or ongoing expenses at both the Fund level and the Contract Level: (1) transaction expenses can include sales charges (loads) on purchases, surrender fees, transfer fees and premium taxes; and (2) ongoing expenses can include management fees, distribution and service(12b-1) fees, contract fees, annual maintenance fees, mortality and expense risk fees and other fees and expenses. All mutual funds and Contracts have some types of ongoing expenses. The table below shows Fund-level ongoing expenses and can help you understand these costs and compare them with those of other mutual funds offered through the Contract. The table assumes a $1,000 investment held for the six months indicated. Please refer to the Fund prospectus for additional information on operating expenses.
Actual Fund Expenses
The table below provides information about the actual account values and actual expenses in the columns under the heading “Actual.” In these columns the Fund’s actual return, which includes the effect of ongoing Fund expenses but does not include the effect of ongoing Contract expenses, is used to calculate the “Ending Account Value.” You can estimate the Fund-level expenses you paid during the period by following these steps (ofcourse, your account value and expenses will differ from those in this illustration):Divide your account value by $1,000 (ifyour account had an $8,600 value, then $8,600 ÷ $1,000 = 8.6). Then multiply the result by the number under the headings “Actual” and “Fund-Level Expenses Paid During Period” (ifFund-Level Expenses Paid During Period were $7.50, then 8.6 × $7.50 = $64.50). In this illustration, the estimated expenses paid this period at the Fund level are $64.50.
Hypothetical Example for Comparison with Other Mutual Funds
Under the heading “Hypothetical” in the table, information is provided about hypothetical account values and hypothetical expenses based on the Fund’s actual expense ratio and an assumed rate of return of 5% per year before expenses, which is not the Fund’s actual return. This information may not be used to estimate the actual ending account balance or expenses you paid for the period, but it can help you compare ongoing costs of investing in the Fund with those of other mutual funds offered through the Contract. To do so, compare this 5% hypothetical example with the 5% hypothetical examples that appear in the shareholder reports of other funds offered through the Contract.
Please note that expenses shown in the table are meant to highlight ongoing costs at the Fund level only and do not reflect any ongoing expenses at the Contract level, or transaction expenses at either the Fund or Contract levels. In addition, while the Fund does not have transaction expenses, if the transaction and ongoing expenses at the Contract level were included, the expenses shown below would be higher. You should consult your Contract prospectus or disclosure document for more information.
| | | | | | | | | | | | | | | | | | | | | | | | | | | | |
| | | | | |
| | | | | | Actual (actual return after expenses) | | | | | | Hypothetical (5% annual return before expenses) | | | | |
| | | | | | | |
Share
Class | | Beginning Account Value 7/1/18 | | | Ending Account Value 12/31/18 | | | Fund-Level Expenses
Paid During Period
7/1/18–12/31/181,2 | | | | | | Ending Account Value 12/31/18 | | | Fund-Level Expenses
Paid During Period
7/1/18–12/31/181,2 | | | Net
Annualized
Expense
Ratio2 | |
Class 1 | | | $1,000 | | | | $852.50 | | | | $3.08 | | | | | | | | $1,021.88 | | | | $3.36 | | | | 0.66% | |
1. Expenses are equal to the annualized expense ratio for thesix-month period as indicated above — in the far right column — multiplied by the simple average account value over the period indicated, and then multiplied by 184/365 to reflect theone-half year period.
2. Reflects expenses after fee waivers and expense reimbursements. Does not include any ongoing expenses of the Contract for which the Fund is an investment option or acquired fund fees and expenses.
FSV P1 11/18
SUPPLEMENT DATED NOVEMBER 2, 2018
TO THE PROSPECTUS DATED MAY 1, 2018
OF
FRANKLIN SMALL CAP VALUE VIP FUND
(A series of Franklin Templeton Variable Insurance Products Trust)
The prospectus is amended as follows:
I. On November 1, 2018, the investment management services provided by Franklin Advisory Services, LLC (Advisory Services), a wholly owned subsidiary of Franklin Resources, Inc. (Resources), and the personnel that provide such services to the Fund were restructured into Franklin Mutual Advisers, LLC (Franklin Mutual), also a wholly owned subsidiary of Resources. In particular, Franklin Mutual will assume the duties and obligations of Advisory Services under the investment management agreement between Advisory Services and Franklin Templeton Variable Insurance Products Trust on behalf of the Fund. Employees of Advisory Services that currently provide investment management services to the Fund will become employees of Franklin Mutual and will continue to provide the same investment management services to the Fund under the same investment management fee schedule. This restructuring will not involve a change in actual control or management of the Fund’s investment manager and the same individuals will continue to provide portfolio management services to the Fund. Because there is no actual change in control or management of the investment adviser, this restructuring does not constitute an “assignment” of the investment management agreement for purposes of the Investment Company Act of 1940 and, therefore, a shareholder vote is not required.
II. Therefore, the following replaces the “Investment Manager” and “Portfolio Managers” sections in the “Fund Summaries – Franklin Small Cap Value VIP Fund” section of the prospectus:
Investment Manager
Franklin Mutual Advisers, LLC (Franklin Mutual)
Portfolio Managers
Steven B. Raineri
Portfolio Manager of Franklin Mutual and portfolio manager of the Fund since 2012.
Christopher Meeker, CFA
Portfolio Manager of Franklin Mutual and portfolio manager of the Fund since 2015.
III. The following is added as the first paragraph under the “Fund Details – Management” section of the prospectus:
On November 1, 2018, the investment management services provided by Franklin Advisory Services, LLC (Advisory Services), a wholly owned subsidiary of Franklin Resources, Inc. (Resources), and the personnel that provided such services to the Fund, were restructured into Franklin Mutual Advisers, LLC (Franklin Mutual), also a wholly owned subsidiary of Resources. In particular, Franklin Mutual assumed the duties and obligations of Advisory Services under the investment management agreement between Advisory Services and the Trust on behalf of the Fund. Employees of Advisory Services that provided investment management services to the Fund became employees of Franklin Mutual and continued to provide the same investment management services to the Fund under the same investment management fee schedule.
IV. In the remainder of the prospectus, all references to “Franklin Advisory Services, LLC” and “Advisory Services” as they relate to the investment manager of the Fund are replaced with “Franklin Mutual Advisers, LLC” and “Franklin Mutual,” respectively.
Please keep this supplement with your prospectus for future reference.
VIP SA4 11/18
SUPPLEMENT DATED NOVEMBER 2, 2018
TO THE STATEMENT OF ADDITIONAL INFORMATION
DATED MAY 1, 2018
OF
FRANKLIN SMALL CAP VALUE VIP FUND
(A series of Franklin Templeton Variable Insurance Products Trust)
The statement of additional information (SAI) is amended as follows:
I. On November 1, 2018, the investment management services provided by Franklin Advisory Services, LLC (Advisory Services), a wholly owned subsidiary of Franklin Resources, Inc. (Resources), and the personnel that provide such services to the Fund were restructured into Franklin Mutual Advisers, LLC (Franklin Mutual), also a wholly owned subsidiary of Resources. In particular, Franklin Mutual will assume the duties and obligations of Advisory Services under the investment management agreement between Advisory Services and Franklin Templeton Variable Insurance Products Trust on behalf of the Fund. Employees of Advisory Services that currently provide investment management services to the Fund will become employees of Franklin Mutual and will continue to provide the same investment management services to the Fund under the same investment management fee schedule. This restructuring will not involve a change in actual control or management of the Fund’s investment manager and the same individuals will continue to provide portfolio management services to the Fund. Because there is no actual change in control or management of the investment adviser, this restructuring does not constitute an “assignment” of the investment management agreement for purposes of the Investment Company Act of 1940 and, therefore, a shareholder vote is not required.
II. Therefore, all references to “Franklin Advisory Services, LLC” and “Advisory Services” as they relate to the investment manager of the Fund, are replaced with “Franklin Mutual Advisers, LLC” and “Franklin Mutual,” respectively.
III. In addition, the following is added as the first paragraph under the section “Management and Other Services” in the SAI:
On November 1, 2018, the investment management services provided by Franklin Advisory Services, LLC (Advisory Services), a wholly owned subsidiary of Franklin Resources, Inc. (Resources), and the personnel that provided such services to the Franklin Small Cap Value VIP Fund, were restructured into Franklin Mutual Advisers, LLC (Franklin Mutual), also a wholly owned subsidiary of Resources. In particular, Franklin Mutual assumed the duties and obligations of Advisory Services under the investment management agreement between Advisory Services and the Trust on behalf of the Fund. Employees of Advisory Services that provided investment management services to the Fund became employees of Franklin Mutual and continued to provide the same investment management services to the Fund under the same investment management fee schedule. References to Franklin Mutual as it relates to the investment manager of the Fund in the remainder of this SAI relate to Franklin Mutual and Advisory Services as its predecessor.
Please keep this supplement with your prospectus for future reference.
FRANKLIN TEMPLETON VARIABLE INSURANCE PRODUCTS TRUST
|
Financial Highlights |
| Franklin Small Cap Value VIP Fund |
| | | | | | | | | | | | | | | | | | | | |
| |
| | | Year Ended December 31, | |
| | | | | |
| | | 2018 | | | 2017 | | | 2016 | | | 2015 | | | 2014 | |
| Class 1 | | | | | | | | | | | | | | | | | | | | |
Per share operating performance
(for a share outstanding throughout the year) | | | | | | | | | | | | | | | | | | | | |
| | | | | |
Net asset value, beginning of year | | | $20.43 | | | | $19.93 | | | | $18.12 | | | | $22.81 | | | | $24.54 | |
| | | | |
| | | | | |
| Income from investment operationsa: | | | | | | | | | | | | | | | | | | | | |
| | | | | |
Net investment incomeb | | | 0.21 | | | | 0.21c | | | | 0.15 | | | | 0.21 | | | | 0.19 | |
| | | | | |
Net realized and unrealized gains (losses) | | | (2.29 | ) | | | 1.82 | | | | 4.79 | | | | (1.53 | ) | | | 0.06 | |
| | | | |
Total from investment operations | | | (2.08 | ) | | | 2.03 | | | | 4.94 | | | | (1.32 | ) | | | 0.25 | |
| | | | |
| | | | | |
| Less distributions from: | | | | | | | | | | | | | | | | | | | | |
| | | | | |
Net investment income | | | (0.23 | ) | | | (0.15 | ) | | | (0.21 | ) | | | (0.20 | ) | | | (0.20 | ) |
| | | | | |
Net realized gains | | | (2.98 | ) | | | (1.38 | ) | | | (2.92 | ) | | | (3.17 | ) | | | (1.78 | ) |
| | | | |
| Total distributions | | | (3.21 | ) | | | (1.53 | ) | | | (3.13 | ) | | | (3.37 | ) | | | (1.98 | ) |
| | | | |
| Net asset value, end of year | | | $15.14 | | | | $20.43 | | | | $19.93 | | | | $18.12 | | | | $22.81 | |
| | | | |
| | | | | |
Total returnd | | | (12.69)% | | | | 10.92% | | | | 30.54% | | | | (7.18)% | | | | 0.88% | |
| | | | | |
Ratios to average net assets | | | | | | | | | | | | | | | | | | | | |
| | | | | |
Expenses before waiver and payments by affiliates | | | 0.66% | | | | 0.66% | | | | 0.66% | | | | 0.65% | | | | 0.63% | |
| | | | | |
Expenses net of waiver and payments by affiliates | | | 0.65% | e | | | 0.65% | e | | | 0.64% | e | | | 0.64% | e | | | 0.63% | e,f |
| | | | | | |
Net investment income | | | 1.13% | | | | 1.06% | c | | | 0.84% | | | | 1.04% | | | | 0.82% | |
| | | | | |
Supplemental data | | | | | | | | | | | | | | | | | | | | |
| | | | | |
Net assets, end of year (000’s) | | | $40,644 | | | | $51,245 | | | | $47,831 | | | | $45,897 | | | | $57,843 | |
| | | | | |
Portfolio turnover rate | | | 47.82% | | | | 33.36% | | | | 34.60% | | | | 27.05% | | | | 19.45% | |
aThe amount shown for a share outstanding throughout the period may not correlate with the Statement of Operations for the period due to the timing of sales and repurchases of the Fund’s share in relation to income earned and/or fluctuating fair value of the investments of the Fund.
bBased on average daily shares outstanding.
cNet investment income per share includes approximately $0.06 per share related to income received in the form of special dividends in connection with certain Fund holdings. Excluding this amount, the ratio of net investment income to average net assets would have been 0.75%.
dTotal return does not include fees, charges or expenses imposed by the variable annuity and life insurance contracts for which Franklin Templeton Variable Insurance Products Trust serves as an underlying investment vehicle.
eBenefit of expense reduction rounds to less than 0.01%.
fBenefit of waiver and payments by affiliates rounds to less than 0.01%.
| | | | |
| | | |
| FSV-8 | | Annual Report | The accompanying notes are an integral part of these financial statements. | | |
FRANKLIN TEMPLETON VARIABLE INSURANCE PRODUCTS TRUST
FINANCIAL HIGHLIGHTS
Franklin Small Cap Value VIP Fund(continued)
| | | | | | | | | | | | | | | | | | | | |
| |
| | | Year Ended December 31, | |
| | | | | |
| | | 2018 | | | 2017 | | | 2016 | | | 2015 | | | 2014 | |
| Class 2 | | | | | | | | | | | | | | | | | | | | |
Per share operating performance (for a share outstanding throughout the year) | | | | | | | | | | | | | | | | | | | | |
| | | | | |
Net asset value, beginning of year | | | $19.80 | | | | $19.36 | | | | $17.68 | | | | $22.32 | | | | $24.07 | |
| | | | |
| | | | | |
| Income from investment operationsa: | | | | | | | | | | | | | | | | | | | | |
| | | | | |
Net investment incomeb | | | 0.16 | | | | 0.15c | | | | 0.10 | | | | 0.16 | | | | 0.13 | |
| | | | | |
Net realized and unrealized gains (losses) | | | (2.20 | ) | | | 1.77 | | | | 4.66 | | | | (1.49 | ) | | | 0.05 | |
| | | | |
| Total from investment operations | | | (2.04 | ) | | | 1.92 | | | | 4.76 | | | | (1.33 | ) | | | 0.18 | |
| | | | |
| | | | | |
| Less distributions from: | | | | | | | | | | | | | | | | | | | | |
| | | | | |
Net investment income | | | (0.18 | ) | | | (0.10 | ) | | | (0.16 | ) | | | (0.14 | ) | | | (0.15 | ) |
| | | | | |
Net realized gains | | | (2.98 | ) | | | (1.38 | ) | | | (2.92 | ) | | | (3.17 | ) | | | (1.78 | ) |
| | | | |
| Total distributions | | | (3.16 | ) | | | (1.48 | ) | | | (3.08 | ) | | | (3.31 | ) | | | (1.93 | ) |
| | | | |
| Net asset value, end of year | | | $14.60 | | | | $19.80 | | | | $19.36 | | | | $17.68 | | | | $22.32 | |
| | | | |
| | | | | |
Total returnd | | | (12.88)% | | | | 10.65% | | | | 30.19% | | | | (7.39)% | | | | 0.57% | |
| | | | | |
Ratios to average net assets | | | | | | | | | | | | | | | | | | | | |
| | | | | |
Expenses before waiver and payments by affiliates | | | 0.91% | | | | 0.91% | | | | 0.91% | | | | 0.90% | | | | 0.88% | |
| | | | | |
Expenses net of waiver and payments by affiliates | | | 0.90% | e | | | 0.90% | e | | | 0.89% | e | | | 0.89% | e | | | 0.88% | e,f |
| | | | | | |
Net investment income | | | 0.88% | | | | 0.81%c | | | | 0.59% | | | | 0.79% | | | | 0.57% | |
| | | | | |
Supplemental data | | | | | | | | | | | | | | | | | | | | |
| | | | | |
Net assets, end of year (000’s) | | | $978,675 | | | | $1,302,055 | | | | $1,366,807 | | | | $1,172,173 | | | | $1,445,325 | |
| | | | | |
Portfolio turnover rate | | | 47.82% | | | | 33.36% | | | | 34.60% | | | | 27.05% | | | | 19.45% | |
aThe amount shown for a share outstanding throughout the period may not correlate with the Statement of Operations for the period due to the timing of sales and repurchases of the Fund’s share in relation to income earned and/or fluctuating fair value of the investments of the Fund.
bBased on average daily shares outstanding.
cNet investment income per share includes approximately $0.06 per share related to income received in the form of special dividends in connection with certain Fund holdings. Excluding this amount, the ratio of net investment income to average net assets would have been 0.50%.
dTotal return does not include fees, charges or expenses imposed by the variable annuity and life insurance contracts for which Franklin Templeton Variable Insurance Products Trust serves as an underlying investment vehicle.
eBenefit of expense reduction rounds to less than 0.01%.
fBenefit of waiver and payments by affiliates rounds to less than 0.01%.
| | | | | | |
| | | |
| | The accompanying notes are an integral part of these financial statements. | Annual Report | | | FSV-9 | |
FRANKLIN TEMPLETON VARIABLE INSURANCE PRODUCTS TRUST
FINANCIAL HIGHLIGHTS
Franklin Small Cap Value VIP Fund(continued)
| | | | | | | | | | | | | | | | | | | | |
| |
| | | Year Ended December 31, | |
| | | | | |
| | | 2018 | | | 2017 | | | 2016 | | | 2015 | | | 2014 | |
| Class 4 | | | | | | | | | | | | | | | | | | | | |
Per share operating performance (for a share outstanding throughout the year) | | | | | | | | | | | | | | | | | | | | |
| | | | | |
Net asset value, beginning of year | | | $20.22 | | | | $19.74 | | | | $17.96 | | | | $22.63 | | | | $24.37 | |
| | | | |
| | | | | |
| Income from investment operationsa: | | | | | | | | | | | | | | | | | | | | |
| | | | | |
Net investment incomeb | | | 0.15 | | | | 0.14c | | | | 0.09 | | | | 0.14 | | | | 0.11 | |
| | | | | |
Net realized and unrealized gains (losses) | | | (2.28 | ) | | | 1.81 | | | | 4.75 | | | | (1.52 | ) | | | 0.05 | |
| | | | |
| Total from investment operations | | | (2.13 | ) | | | 1.95 | | | | 4.84 | | | | (1.38 | ) | | | 0.16 | |
| | | | |
| | | | | |
| Less distributions from: | | | | | | | | | | | | | | | | | | | | |
| | | | | |
Net investment income | | | (0.15 | ) | | | (0.09 | ) | | | (0.14 | ) | | | (0.12 | ) | | | (0.12 | ) |
| | | | | |
Net realized gains | | | (2.98 | ) | | | (1.38 | ) | | | (2.92 | ) | | | (3.17 | ) | | | (1.78 | ) |
| | | | |
| Total distributions | | | (3.13 | ) | | | (1.47 | ) | | | (3.06 | ) | | | (3.29 | ) | | | (1.90 | ) |
| | | | |
| Net asset value, end of year | | | $14.96 | | | | $20.22 | | | | $19.74 | | | | $17.96 | | | | $22.63 | |
| | | | |
| | | | | |
Total returnd | | | (13.01)% | | | | 10.56% | | | | 30.12% | | | | (7.52)% | | | | 0.48% | |
| | | | | |
| Ratios to average net assets | | | | | | | | | | | | | | | | | | | | |
| | | | | |
Expenses before waiver and payments by affiliates | | | 1.01% | | | | 1.01% | | | | 1.01% | | | | 1.00% | | | | 0.98% | |
| | | | | |
Expenses net of waiver and payments by affiliates | | | 1.00% | e | | | 1.00% | e | | | 0.99% | e | | | 0.99% | e | | | 0.98% | e,f |
| | | | | | |
Net investment income | | | 0.78% | | | | 0.71%c | | | | 0.49% | | | | 0.69% | | | | 0.47% | |
| | | | | |
| Supplemental data | | | | | | | | | | | | | | | | | | | | |
| | | | | |
Net assets, end of year (000’s) | | | $24,592 | | | | $32,053 | | | | $32,751 | | | | $26,128 | | | | $30,452 | |
| | | | | |
Portfolio turnover rate | | | 47.82% | | | | 33.36% | | | | 34.60% | | | | 27.05% | | | | 19.45% | |
aThe amount shown for a share outstanding throughout the period may not correlate with the Statement of Operations for the period due to the timing of sales and repurchases of the Fund’s share in relation to income earned and/or fluctuating fair value of the investments of the Fund.
bBased on average daily shares outstanding.
cNet investment income per share includes approximately $0.06 per share related to income received in the form of special dividends in connection with certain Fund holdings. Excluding this amount, the ratio of net investment income to average net assets would have been 0.40%.
dTotal return does not include fees, charges or expenses imposed by the variable annuity and life insurance contracts for which Franklin Templeton Variable Insurance Products Trust serves as an underlying investment vehicle.
eBenefit of expense reduction rounds to less than 0.01%.
fBenefit of waiver and payments by affiliates rounds to less than 0.01%.
| | | | |
| | | |
| FSV-10 | | Annual Report | The accompanying notes are an integral part of these financial statements. | | |
FRANKLIN TEMPLETON VARIABLE INSURANCE PRODUCTS TRUST
Statement of Investments, December 31, 2018
Franklin Small Cap Value VIP Fund
| | | | | | | | | | |
| | | |
| | | | | Shares | | | Value | |
| | Common Stocks 94.5% | | | | | | | | |
| | | Aerospace & Defense 2.2% | | | | | | |
| | AAR Corp. | | | 316,870 | | | $ | 11,831,926 | |
| a | | Esterline Technologies Corp. | | | 50,255 | | | | 6,103,470 | |
| a | | Wesco Aircraft Holdings Inc. | | | 657,334 | | | | 5,192,938 | |
| | | | | | | | | | |
| | | | | | | | | 23,128,334 | |
| | | | | | | | | | |
| | Automobiles & Components 2.1% | | | | | | | | |
| | Gentex Corp. | | | 36,000 | | | | 727,560 | |
| | LCI Industries | | | 237,470 | | | | 15,862,996 | |
| | Thor Industries Inc. | | | 108,514 | | | | 5,642,728 | |
| | | | | | | | | | |
| | | | | | | | | 22,233,284 | |
| | | | | | | | | | |
| | Banks 15.2% | | | | | | | | |
| | Access National Corp. | | | 244,865 | | | | 5,222,971 | |
| | Bryn Mawr Bank Corp. | | | 380,483 | | | | 13,088,615 | |
| | Chemical Financial Corp. | | | 548,442 | | | | 20,078,462 | |
| | Columbia Banking System Inc. | | | 795,500 | | | | 28,868,695 | |
| | First Horizon National Corp. | | | 1,971,637 | | | | 25,946,743 | |
| | First of Long Island Corp. | | | 614,355 | | | | 12,256,382 | |
| | German American Bancorp Inc. | | | 137,322 | | | | 3,813,432 | |
| | Glacier Bancorp Inc. | | | 209,600 | | | | 8,304,352 | |
| | Lakeland Financial Corp. | | | 516,362 | | | | 20,737,098 | |
| | Peoples Bancorp Inc. | | | 289,712 | | | | 8,720,331 | |
| | TrustCo Bank Corp. NY | | | 708,200 | | | | 4,858,252 | |
| | Washington Trust Bancorp Inc. | | | 147,491 | | | | 7,010,247 | |
| | | | | | | | | | |
| | | | | | | | | 158,905,580 | |
| | | | | | | | | | |
| | Building Products 3.7% | | | | | | | | |
| a | | Gibraltar Industries Inc. | | | 806,679 | | | | 28,709,706 | |
| | Insteel Industries Inc. | | | 225,239 | | | | 5,468,803 | |
| | Simpson Manufacturing Co. Inc. | | | 17,360 | | | | 939,697 | |
| | Universal Forest Products Inc. | | | 140,640 | | | | 3,651,014 | |
| | | | | | | | | | |
| | | | | | | | | 38,769,220 | |
| | | | | | | | | | |
| | Commercial & Professional Services 4.1% | | | | | | | | |
| a | | Huron Consulting Group Inc. | | | 264,100 | | | | 13,550,971 | |
| | McGrath RentCorp | | | 422,195 | | | | 21,734,599 | |
| a | | Team Inc. | | | 503,600 | | | | 7,377,740 | |
| | | | | | | | | | |
| | | | | | | | | 42,663,310 | |
| | | | | | | | | | |
| | Consumer Durables & Apparel 0.6% | | | | | | | | |
| | Toll Brothers Inc. | | | 91,905 | | | | 3,026,432 | |
| a | | Unifi Inc. | | | 121,800 | | | | 2,781,912 | |
| | | | | | | | | | |
| | | | | | | | | 5,808,344 | |
| | | | | | | | | | |
| | Consumer Services 2.4% | | | | | | | | |
| | Brinker International Inc. | | | 555,540 | | | | 24,432,649 | |
| | | | | | | | | | |
| | Electrical Equipment 3.1% | | | | | | | | |
| | Encore Wire Corp. | | | 75,262 | | | | 3,776,647 | |
| | Regal Beloit Corp. | | | 407,900 | | | | 28,573,395 | |
| | | | | | | | | | |
| | | | | | | | | 32,350,042 | |
| | | | | | | | | | |
| | Energy 2.4% | | | | | | | | |
| | Hunting PLC (United Kingdom) | | | 3,119,124 | | | | 19,092,781 | |
| a | | Natural Gas Services Group Inc. | | | 173,987 | | | | 2,860,346 | |
| a | | Oil States International Inc. | | | 164,323 | | | | 2,346,533 | |
FRANKLIN TEMPLETON VARIABLE INSURANCE PRODUCTS TRUST
STATEMENT OF INVESTMENTS
Franklin Small Cap Value VIPFund(continued)
| | | | | | | | | | |
| | | |
| | | | | Shares | | | Value | |
| | Common Stocks(continued) | | | | | | | | |
| | | Energy (continued) | | | | | | |
| a | | Rowan Cos. PLC | | | 42,157 | | | $ | 353,697 | |
| | | | | | | | | | |
| | | | | | | | | 24,653,357 | |
| | | | | | | | | | |
| | Food, Beverage & Tobacco 4.9% | | | | | | | | |
| | Dairy Crest Group PLC (United Kingdom) | | | 3,182,780 | | | | 17,136,422 | |
| a | | Landec Corp. | | | 848,600 | | | | 10,047,424 | |
| | Maple Leaf Foods Inc. (Canada) | | | 1,213,649 | | | | 24,300,544 | |
| | | | | | | | | | |
| | | | | | | | | 51,484,390 | |
| | | | | | | | | | |
| | Health Care Equipment & Services 2.2% | | | | | | | | |
| a | | AMN Healthcare Services Inc. | | | 154,800 | | | | 8,770,968 | |
| | Hill-Rom Holdings Inc. | | | 90,101 | | | | 7,978,444 | |
| | STERIS PLC | | | 59,750 | | | | 6,384,287 | |
| | | | | | | | | | |
| | | | | | | | | 23,133,699 | |
| | | | | | | | | | |
| | Industrial Conglomerates 0.6% | | | | | | | | |
| | Carlisle Cos. Inc. | | | 66,400 | | | | 6,674,528 | |
| | | | | | | | | | |
| | Insurance 8.6% | | | | | | | | |
| | The Hanover Insurance Group Inc. | | | 329,000 | | | | 38,417,330 | |
| | Horace Mann Educators Corp. | | | 608,478 | | | | 22,787,501 | |
| | Old Republic International Corp. | | | 1,382,600 | | | | 28,440,082 | |
| | | | | | | | | | |
| | | | | | | | | 89,644,913 | |
| | | | | | | | | | |
| | Machinery 5.8% | | | | | | | | |
| | Astec Industries Inc. | | | 149,196 | | | | 4,504,227 | |
| | Federal Signal Corp. | | | 141,700 | | | | 2,819,830 | |
| | The Greenbrier Cos. Inc. | | | 121,600 | | | | 4,808,064 | |
| | Kennametal Inc. | | | 199,136 | | | | 6,627,246 | |
| a | | The Manitowoc Co. Inc. | | | 256,912 | | | | 3,794,590 | |
| | Mueller Industries Inc. | | | 221,300 | | | | 5,169,568 | |
| | Mueller Water Products Inc., A | | | 2,440,700 | | | | 22,210,370 | |
| | Oshkosh Corp. | | | 109,900 | | | | 6,737,969 | |
| | Titan International Inc. | | | 782,153 | | | | 3,644,833 | |
| | | | | | | | | | |
| | | | | | | | | 60,316,697 | |
| | | | | | | | | | |
| | Materials 8.1% | | | | | | | | |
| | Carpenter Technology Corp. | | | 514,324 | | | | 18,315,077 | |
| a | | Ingevity Corp. | | | 12,600 | | | | 1,054,494 | |
| | Minerals Technologies Inc. | | | 364,552 | | | | 18,716,100 | |
| | OceanaGold Corp. (Australia) | | | 8,559,600 | | | | 31,229,575 | |
| | PH Glatfelter Co. | | | 797,300 | | | | 7,781,648 | |
| | Reliance Steel & Aluminum Co. | | | 110,700 | | | | 7,878,519 | |
| | | | | | | | | | |
| | | | | | | | | 84,975,413 | |
| | | | | | | | | | |
| | Pharmaceuticals, Biotechnology & Life Sciences 1.5% | | | | | | | | |
| a | | Cambrex Corp. | | | 218,667 | | | | 8,256,866 | |
| a | | Syneos Health Inc., A | | | 181,000 | | | | 7,122,350 | |
| | | | | | | | | | |
| | | | | | | | | 15,379,216 | |
| | | | | | | | | | |
| | Real Estate 6.3% | | | | | | | | |
| | Brandywine Realty Trust | | | 814,300 | | | | 10,480,041 | |
| | Highwoods Properties Inc. | | | 401,600 | | | | 15,537,904 | |
| | LTC Properties Inc. | | | 319,555 | | | | 13,319,053 | |
| | Retail Properties of America Inc., A | | | 1,668,211 | | | | 18,100,089 | |
FRANKLIN TEMPLETON VARIABLE INSURANCE PRODUCTS TRUST
STATEMENT OF INVESTMENTS (UNAUDITED)
Franklin Small Cap Value VIP Fund(continued)
| | | | | | | | | | |
| | | |
| | | | | Shares | | | Value | |
| | Common Stocks(continued) | | | | | | | | |
| | | Real Estate(continued) | | | | | | |
| | Sunstone Hotel Investors Inc. | | | 672,297 | | | $ | 8,746,584 | |
| | | | | | | | | | |
| | | | | | | | | 66,183,671 | |
| | | | | | | | | | |
| | Retailing 1.4% | | | | | | | | |
| | Caleres Inc. | | | 533,899 | | | | 14,858,409 | |
| | | | | | | | | | |
| | Semiconductors & Semiconductor Equipment 6.4% | | | | | | | | |
| a | | Advanced Energy Industries Inc. | | | 351,776 | | | | 15,101,744 | |
| | Kulicke and Soffa Industries Inc. (Singapore) | | | 138,700 | | | | 2,811,449 | |
| | MKS Instruments Inc. | | | 81,694 | | | | 5,278,249 | |
| a | | Synaptics Inc. | | | 571,114 | | | | 21,251,152 | |
| | Versum Materials Inc. | | | 804,614 | | | | 22,303,900 | |
| | | | | | | | | | |
| | | | | | | | | 66,746,494 | |
| | | | | | | | | | |
| | Software & Services 0.9% | | | | | | | | |
| | LogMeIn Inc. | | | 112,700 | | | | 9,192,939 | |
| | | | | | | | | | |
| | Technology Hardware & Equipment 6.0% | | | | | | | | |
| a | | Coherent Inc. | | | 141,308 | | | | 14,937,668 | |
| a | | Finisar Corp. | | | 992,200 | | | | 21,431,520 | |
| a | | Plexus Corp. | | | 329,174 | | | | 16,814,208 | |
| a | | Zebra Technologies Corp., A | | | 60,200 | | | | 9,585,646 | |
| | | | | | | | | | |
| | | | | | | | | 62,769,042 | |
| | | | | | | | | | |
| | Transportation 1.2% | | | | | | | | |
| | Heartland Express Inc. | | | 701,600 | | | | 12,839,280 | |
| | | | | | | | | | |
| | Utilities 4.8% | | | | | | | | |
| | Black Hills Corp. | | | 333,500 | | | | 20,937,130 | |
| | IDACORP Inc. | | | 117,289 | | | | 10,914,914 | |
| | Spire Inc. | | | 243,155 | | | | 18,012,923 | |
| | | | | | | | | | |
| | | | | | | | | 49,864,967 | |
| | | | | | | | | | |
| | | |
| | Total Common Stocks (Cost $969,951,784) | | | | | | | 987,007,778 | |
| | | | | | | | | | |
| | | |
| | | | | Principal Amount | | | | |
| | | |
| | Corporate Bonds 1.1% | | | | | | | | |
| | Energy 0.9% | | | | | | | | |
| | Unit Corp., senior sub. note, 6.625%, 5/15/21 | | $ | 9,632,000 | | | | 8,813,280 | |
| | | | | | | | | | |
| | Machinery 0.2% | | | | | | | | |
| | Mueller Industries Inc., sub. bond, 6.00%, 3/01/27 | | | 2,378,000 | | | | 2,223,430 | |
| | | | | | | | | | |
| | | |
| | Total Corporate Bonds (Cost $11,723,904) | | | | | | | 11,036,710 | |
| | | | | | | | | | |
| | | |
| | Total Investments before Short Term Investments (Cost $981,675,688) | | | | | | | 998,044,488 | |
| | | | | | | | | | |
FRANKLIN TEMPLETON VARIABLE INSURANCE PRODUCTS TRUST
STATEMENT OF INVESTMENTS (UNAUDITED)
Franklin Small Cap Value VIP Fund(continued)
| | | | | | | | | | |
| | | |
| | | | | Shares | | | Value | |
| | | |
| | Short Term Investments (Cost $45,444,842) 4.4% | | | | | | | | |
| | | Money Market Funds 4.4% | | | | | | |
| b,c | | Institutional Fiduciary Trust Money Market Portfolio, 1.99% | | | 45,444,842 | | | $ | 45,444,842 | |
| | | | | | | | | | |
| | | |
| | Total Investments (Cost $1,027,120,530) 100.0% | | | | | | | 1,043,489,330 | |
| | | |
| | Other Assets, less Liabilities 0.0%† | | | | | | | 421,193 | |
| | | | | | | | | | |
| | | |
| | Net Assets 100.0% | | | | | | $ | 1,043,910,523 | |
| | | | | | | | | | |
†Rounds to less than 0.1% of net assets.
aNon-income producing.
bSee Note 3(e) regarding investments in affiliated management investment companies.
cThe rate shown is the annualizedseven-day effective yield at period end.
| | | | |
| | | |
| FSV-14 | | Annual Report | The accompanying notes are an integral part of these financial statements. | | |
FRANKLIN TEMPLETON VARIABLE INSURANCE PRODUCTS TRUST
Financial Statements
Statement of Assets and Liabilities
December 31, 2018
| | | | |
| |
| | | Franklin Small
Cap Value
VIP Fund | |
Assets: | | | | |
Investments in securities: | | | | |
Cost - Unaffiliated issuers | | $ | 981,675,688 | |
Cost -Non-controlled affiliates (Note 3e) | | | 45,444,842 | |
| | | | |
Value - Unaffiliated issuers | | $ | 998,044,488 | |
Value -Non-controlled affiliates (Note 3e) | | | 45,444,842 | |
Receivables: | | | | |
Investment securities sold | | | 297,448 | |
Capital shares sold | | | 804,266 | |
Dividends and interest | | | 1,492,463 | |
Other assets | | | 154 | |
| | | | |
Total assets | | | 1,046,083,661 | |
| | | | |
Liabilities: | | | | |
Payables: | | | | |
Investment securities purchased | | | 299,643 | |
Capital shares redeemed | | | 633,256 | |
Management fees | | | 575,471 | |
Distribution fees | | | 452,235 | |
Reports to shareholders | | | 156,200 | |
Accrued expenses and other liabilities | | | 56,333 | |
| | | | |
Total liabilities | | | 2,173,138 | |
| | | | |
Net assets, at value | | $ | 1,043,910,523 | |
| | | | |
Net assets consist of: | | | | |
Paid-in capital | | $ | 825,829,262 | |
Total distributable earnings (loss) | | | 218,081,261 | |
| | | | |
Net assets, at value | | $ | 1,043,910,523 | |
| | | | |
| |
| Class 1: | | | | |
Net assets, at value | | $ | 40,644,080 | |
| | | | |
Shares outstanding | | | 2,684,609 | |
| | | | |
Net asset value and maximum offering price per share | | $ | 15.14 | |
| | | | |
| |
| Class 2: | | | | |
Net assets, at value | | $ | 978,674,827 | |
| | | | |
Shares outstanding | | | 67,047,860 | |
| | | | |
Net asset value and maximum offering price per share | | $ | 14.60 | |
| | | | |
| |
| Class 4: | | | | |
Net assets, at value | | $ | 24,591,616 | |
| | | | |
Shares outstanding | | | 1,643,814 | |
| | | | |
Net asset value and maximum offering price per share | | $ | 14.96 | |
| | | | |
| | | | | | |
| | | |
| | The accompanying notes are an integral part of these financial statements. | Annual Report | | | FSV-15 | |
FRANKLIN TEMPLETON VARIABLE INSURANCE PRODUCTS TRUST
FINANCIAL STATEMENTS
Statement of Operations
for the year ended December 31, 2018
| | | | |
| |
| | | Franklin Small
Cap Value
VIP Fund | |
Investment income: | | | | |
Dividends: (net of foreign taxes)* | | | | |
Unaffiliated issuers | | $ | 21,428,933 | |
Non-controlled affiliates (Note 3e) | | | 632,091 | |
Interest: | | | | |
Unaffiliated issuers | | | 883,295 | |
| | | | |
Total investment income | | | 22,944,319 | |
| | | | |
Expenses: | | | | |
Management fees (Note 3a) | | | 8,133,921 | |
Distribution fees: (Note 3c) | | | | |
Class 2 | | | 3,016,126 | |
Class 4 | | | 103,206 | |
Custodian fees (Note 4) | | | 17,465 | |
Reports to shareholders | | | 274,665 | |
Professional fees | | | 61,514 | |
Trustees’ fees and expenses | | | 9,503 | |
Other | | | 53,164 | |
| | | | |
Total expenses | | | 11,669,564 | |
Expense reductions (Note 4) | | | (191 | ) |
Expenses waived/paid by affiliates (Note 3e) | | | (156,940 | ) |
| | | | |
Net expenses | | | 11,512,433 | |
| | | | |
Net investment income | | | 11,431,886 | |
| | | | |
Realized and unrealized gains (losses): | | | | |
Net realized gain (loss) from: | | | | |
Investments: | | | | |
Unaffiliated issuers | | | 191,799,018 | |
Realized gain distributions from REITs | | | 680,677 | |
Foreign currency transactions | | | 39,195 | |
| | | | |
Net realized gain (loss) | | | 192,518,890 | |
| | | | |
Net change in unrealized appreciation (depreciation) on: | | | | |
Investments: | | | | |
Unaffiliated issuers. | | | (356,980,750 | ) |
Translation of other assets and liabilities denominated in foreign currencies | | | (4,741 | ) |
| | | | |
Net change in unrealized appreciation (depreciation) | | | (356,985,491 | ) |
| | | | |
Net realized and unrealized gain (loss) | | | (164,466,601 | ) |
| | | | |
Net increase (decrease) in net assets resulting from operations | | $ | (153,034,715 | ) |
| | | | |
| |
*Foreign taxes withheld on dividends | | $ | 95,525 | |
| | | | |
| | | |
| FSV-16 | | Annual Report | The accompanying notes are an integral part of these financial statements. | | |
FRANKLIN TEMPLETON VARIABLE INSURANCE PRODUCTS TRUST
FINANCIAL STATEMENTS
Statements of Changes in Net Assets
| | | | | | | | |
| |
| | | Franklin Small Cap Value VIP Fund | |
| |
| | | Year Ended December 31, | |
| | |
| | | 2018 | | | 2017 | |
Increase (decrease) in net assets: | | | | | | | | |
Operations: | | | | | | | | |
Net investment income | | $ | 11,431,886 | | | $ | 11,278,129 | |
Net realized gain (loss) | | | 192,518,890 | | | | 193,444,952 | |
Net change in unrealized appreciation (depreciation) | | | (356,985,491 | ) | | | (67,851,820 | ) |
| | | | |
Net increase (decrease) in net assets resulting from operations | | | (153,034,715 | ) | | | 136,871,261 | |
| | | | |
Distributions to shareholders: (Note 1d) | | | | | | | | |
Class 1 | | | (7,555,429 | ) | | | (3,701,401 | ) |
Class 2 | | | (194,090,505 | ) | | | (97,706,351 | ) |
Class 4 | | | (4,574,106 | ) | | | (2,314,166 | ) |
| | | | |
Total distributions to shareholders | | | (206,220,040 | ) | | | (103,721,918 | ) |
| | | | |
Capital share transactions: (Note 2) | | | | | | | | |
Class 1 | | | 2,769,926 | | | | 2,002,869 | |
Class 2 | | | 14,343,221 | | | | (95,665,942 | ) |
Class 4 | | | 698,981 | | | | (1,521,461 | ) |
| | | | |
Total capital share transactions | | | 17,812,128 | | | | (95,184,534 | ) |
| | | | |
Net increase (decrease) in net assets | | | (341,442,627 | ) | | | (62,035,191 | ) |
| | | | |
Net assets: | | | | | | | | |
Beginning of year | | | 1,385,353,150 | | | | 1,447,388,341 | |
| | | | |
End of year (Note 1d) | | $ | 1,043,910,523 | | | $ | 1,385,353,150 | |
| | | | |
| | | | | | |
| | | |
| | The accompanying notes are an integral part of these financial statements. | Annual Report | | | FSV-17 | |
FRANKLIN TEMPLETON VARIABLE INSURANCE PRODUCTS TRUST
Notes to Financial Statements
Franklin Small Cap Value VIP Fund
1. Organization and Significant Accounting Policies
Franklin Templeton Variable Insurance Products Trust (Trust) is registered under the Investment Company Act of 1940 (1940 Act) as anopen-end management investment company, consisting of eighteen separate funds and applies the specialized accounting and reporting guidance in U.S. Generally Accepted Accounting Principles (U.S. GAAP). Franklin Small Cap Value VIP Fund (Fund) is included in this report. Shares of the Fund are generally sold only to insurance company separate accounts to fund the benefits of variable life insurance policies or variable annuity contracts. The Fund offers three classes of shares: Class 1, Class 2 and Class 4. Each class of shares may differ by its distribution fees, voting rights on matters affecting a single class and its exchange privilege.
The following summarizes the Fund’s significant accounting policies.
a. Financial Instrument Valuation
The Fund’s investments in financial instruments are carried at fair value daily. Fair value is the price that would be received to sell an asset or paid to transfer a liability in an orderly transaction between market participants on the measurement date. The Fund calculates the net asset value (NAV) per share each business day as of 4 p.m. Eastern time or the regularly scheduled close of the New York Stock Exchange (NYSE), whichever is earlier. Under compliance policies and procedures approved by the Trust’s Board of Trustees (the Board), the Fund’s administrator has responsibility for oversight of valuation, including leading the cross-functional Valuation Committee (VC). The Fund may utilize independent pricing services, quotations from securities and financial instrument dealers, and other market sources to determine fair value.
Equity securities listed on an exchange or on the NASDAQ National Market System are valued at the last quoted sale price or the official closing price of the day, respectively. Foreign equity securities are valued as of the close of trading on the foreign stock exchange on which the security is primarily traded, or as of 4 p.m. Eastern time. The value is then converted into its U.S. dollar equivalent at the foreign exchange rate in effect at 4 p.m. Eastern time on the day that the value of the security is determined.Over-the-counter (OTC) securities are valued within the range of the most recent quoted bid and ask prices. Securities that trade in multiple markets or on multiple
exchanges are valued according to the broadest and most representative market. Certain equity securities are valued based upon fundamental characteristics or relationships to similar securities.
Debt securities generally trade in the OTC market rather than on a securities exchange. The Fund’s pricing services use multiple valuation techniques to determine fair value. In instances where sufficient market activity exists, the pricing services may utilize a market-based approach through which quotes from market makers are used to determine fair value. In instances where sufficient market activity may not exist or is limited, the pricing services also utilize proprietary valuation models which may consider market characteristics such as benchmark yield curves, credit spreads, estimated default rates, anticipated market interest rate volatility, coupon rates, anticipated timing of principal repayments, underlying collateral, and other unique security features in order to estimate the relevant cash flows, which are then discounted to calculate the fair value.
Investments inopen-end mutual funds are valued at the closing NAV.
The Fund has procedures to determine the fair value of financial instruments for which market prices are not reliable or readily available. Under these procedures, the Fund primarily employs a market-based approach which may use related or comparable assets or liabilities, recent transactions, market multiples, book values, and other relevant information for the investment to determine the fair value of the investment. An income-based valuation approach may also be used in which the anticipated future cash flows of the investment are discounted to calculate fair value. Discounts may also be applied due to the nature or duration of any restrictions on the disposition of the investments. Due to the inherent uncertainty of valuations of such investments, the fair values may differ significantly from the values that would have been used had an active market existed.
Trading in securities on foreign securities stock exchanges and OTC markets may be completed before 4 p.m. Eastern time. In addition, trading in certain foreign markets may not take place on every Fund’s business day. Occasionally, events occur between the time at which trading in a foreign security is completed and 4 p.m. Eastern time that might call into question the reliability of the value of a portfolio security held by the Fund. As a result, differences may arise between the value of the Fund’s portfolio securities as determined at the foreign
FRANKLIN TEMPLETON VARIABLE INSURANCE PRODUCTS TRUST
NOTES TO FINANCIAL STATEMENTS
Franklin Small Cap Value VIP Fund(continued)
market close and the latest indications of value at 4 p.m. Eastern time. In order to minimize the potential for these differences, the VC monitors price movements following the close of trading in foreign stock markets through a series of country specific market proxies (such as baskets of American Depositary Receipts, futures contracts and exchange traded funds). These price movements are measured against established trigger thresholds for each specific market proxy to assist in determining if an event has occurred that may call into question the reliability of the values of the foreign securities held by the Fund. If such an event occurs, the securities may be valued using fair value procedures, which may include the use of independent pricing services.
When the last day of the reporting period is anon-business day, certain foreign markets may be open on those days that the Fund’s NAV is not calculated, which could result in differences between the value of the Fund’s portfolio securities on the last business day and the last calendar day of the reporting period. Any significant security valuation changes due to an open foreign market are adjusted and reflected by the Fund for financial reporting purposes.
b. Foreign Currency Translation
Portfolio securities and other assets and liabilities denominated in foreign currencies are translated into U.S. dollars based on the exchange rate of such currencies against U.S. dollars on the date of valuation. The Fund may enter into foreign currency exchange contracts to facilitate transactions denominated in a foreign currency. Purchases and sales of securities, income and expense items denominated in foreign currencies are translated into U.S. dollars at the exchange rate in effect on the transaction date. Portfolio securities and assets and liabilities denominated in foreign currencies contain risks that those currencies will decline in value relative to the U.S. dollar. Occasionally, events may impact the availability or reliability of foreign exchange rates used to convert the U.S. dollar equivalent value. If such an event occurs, the foreign exchange rate will be valued at fair value using procedures established and approved by the Board.
The Fund does not separately report the effect of changes in foreign exchange rates from changes in market prices on securities held. Such changes are included in net realized and unrealized gain or loss from investments in the Statement of Operations.
Realized foreign exchange gains or losses arise from sales of foreign currencies, currency gains or losses realized between the trade and settlement dates on securities transactions and the difference between the recorded amounts of dividends, interest, and foreign withholding taxes and the U.S. dollar equivalent of the amounts actually received or paid. Net unrealized foreign exchange gains and losses arise from changes in foreign exchange rates on foreign denominated assets and liabilities other than investments in securities held at the end of the reporting period.
c. Income and Deferred Taxes
It is the Fund’s policy to qualify as a regulated investment company under the Internal Revenue Code. The Fund intends to distribute to shareholders substantially all of its taxable income and net realized gains to relieve it from federal income and if applicable, excise taxes. As a result, no provision for U.S. federal income taxes is required.
The Fund may be subject to foreign taxation related to income received, capital gains on the sale of securities and certain foreign currency transactions in the foreign jurisdictions in which it invests. Foreign taxes, if any, are recorded based on the tax regulations and rates that exist in the foreign markets in which the Fund invests. When a capital gain tax is determined to apply, the Fund records an estimated deferred tax liability in an amount that would be payable if the securities were disposed of on the valuation date.
The Fund may recognize an income tax liability related to its uncertain tax positions under U.S. GAAP when the uncertain tax position has a less than 50% probability that it will be sustained upon examination by the tax authorities based on its technical merits. As of December 31, 2018, the Fund has determined that no tax liability is required in its financial statements related to uncertain tax positions for any open tax years (or expected to be taken in future tax years). Open tax years are those that remain subject to examination and are based on the statute of limitations in each jurisdiction in which the Fund invests.
d. Security Transactions, Investment Income, Expenses and Distributions
Security transactions are accounted for on trade date. Realized gains and losses on security transactions are determined on a specific identification basis. Interest income and estimated expenses are accrued daily. Amortization of premium and
FRANKLIN TEMPLETON VARIABLE INSURANCE PRODUCTS TRUST
NOTES TO FINANCIAL STATEMENTS
Franklin Small Cap Value VIP Fund(continued)
1. Organization and Significant Accounting Policies(continued)
d. Security Transactions, Investment Income, Expenses and Distributions(continued)
accretion of discount on debt securities are included in interest income. Dividend income and capital gain distributions are recorded on theex-dividend date except for certain dividends from securities where the dividend rate is not available. In such cases, the dividend is recorded as soon as the information is received by the Fund. Distributions to shareholders are recorded on theex-dividend date. Distributable earnings are determined according to income tax regulations (tax basis) and may differ from earnings recorded in accordance with U.S. GAAP. These differences may be permanent or temporary. Permanent differences are reclassified among capital accounts to reflect their tax character. These reclassifications have no impact on net assets or the results of operations. Temporary differences are not reclassified, as they may reverse in subsequent periods.*
Common expenses incurred by the Trust are allocated among the Funds based on the ratio of net assets of each Fund to the combined net assets of the Trust or based on the ratio of number of shareholders of each Fund to the combined number of shareholders of the Trust. Fund specific expenses are charged directly to the Fund that incurred the expense.
Realized and unrealized gains and losses and net investment income, excluding class specific expenses, are allocated daily to each class of shares based upon the relative proportion of net assets of each class. Differences in per share distributions by class are generally due to differences in class specific expenses.
e. Accounting Estimates
The preparation of financial statements in accordance with U.S. GAAP requires management to make estimates and assumptions that affect the reported amounts of assets and liabilities at the date of the financial statements and the amounts of income and expenses during the reporting period. Actual results could differ from those estimates.
f. Guarantees and Indemnifications
Under the Trust’s organizational documents, its officers and trustees are indemnified by the Trust against certain liabilities arising out of the performance of their duties to the Trust. Additionally, in the normal course of business, the Trust, on behalf of the Fund, enters into contracts with service providers that contain general indemnification clauses. The Trust’s maximum exposure under these arrangements is unknown as this would involve future claims that may be made against the Trust that have not yet occurred. Currently, the Trust expects the risk of loss to be remote.
*Effective during the current reporting period, it is no longer required to present certain line items in the Statements of Changes in Net Assets. The below prior period amounts affected by this change are shown as they were in the prior year Statements of Changes in Net Assets.
For the year ended December 31, 2017, distributions to shareholders were as follows:
| | | | |
Distributions from net investment income : | | | | |
Class 1 | | $ | (357,335 | ) |
Class 2 | | | (6,657,162 | ) |
Class 4 | | | (135,526 | ) |
Distributions from net realized gains: | | | | |
Class 1 | | | (3,344,066 | ) |
Class 2 | | | (91,049,189 | ) |
Class 4 | | | (2,178,640 | ) |
For the year ended December 31, 2017, undistributed net investment income included in net assets was $12,100,998.
FRANKLIN TEMPLETON VARIABLE INSURANCE PRODUCTS TRUST
NOTES TO FINANCIAL STATEMENTS
Franklin Small Cap Value VIP Fund(continued)
2. Shares of Beneficial Interest
At December 31, 2018, there were an unlimited number of shares authorized (without par value). Transactions in the Fund’s shares were as follows:
| | | | | | | | | | | | | | | | | | | | |
| |
| | | Year Ended December 31, | |
| | | |
| | | 2018 | | | | | | 2017 | |
| | | | | |
| | | Shares | | | Amount | | | | | | Shares | | | Amount | |
| | | | | |
| Class 1 Shares: | | | | | | | | | | | | | | | | | | | | |
Shares sold | | | 140,744 | | | $ | 2,624,857 | | | | | | | | 296,526 | | | $ | 5,843,664 | |
Shares issued in reinvestment of distributions | | | 419,746 | | | | 7,555,429 | | | | | | | | 198,148 | | | | 3,701,401 | |
Shares redeemed | | | (384,144 | ) | | | (7,410,360 | ) | | | | | | | (386,641 | ) | | | (7,542,196 | ) |
| | | | |
Net increase (decrease) | | | 176,346 | | | $ | 2,769,926 | | | | | | | | 108,033 | | | $ | 2,002,869 | |
| | | | |
| | | | | |
| Class 2 Shares: | | | | | | | | | | | | | | | | | | | | |
Shares sold | | | 3,241,202 | | | $ | 57,622,650 | | | | | | | | 4,717,681 | | | $ | 89,392,050 | |
Shares issued in reinvestment of distributions | | | 11,167,463 | | | | 194,090,505 | | | | | | | | 5,389,208 | | | | 97,706,351 | |
Shares redeemed | | | (13,111,818 | ) | | | (237,369,934 | ) | | | | | | | (14,948,104 | ) | | | (282,764,343 | ) |
| | | | |
Net increase (decrease) | | | 1,296,847 | | | $ | 14,343,221 | | | | | | | | (4,841,215 | ) | | $ | (95,665,942 | ) |
| | | | |
| | | | | |
| Class 4 Shares: | | | | | | | | | | | | | | | | | | | | |
Shares sold | | | 142,312 | | | $ | 2,499,385 | | | | | | | | 232,357 | | | $ | 4,483,471 | |
Shares issued in reinvestment of distributions | | | 256,684 | | | | 4,574,106 | | | | | | | | 124,955 | | | | 2,314,166 | |
Shares redeemed | | | (340,602 | ) | | | (6,374,510 | ) | | | | | | | (430,938 | ) | | | (8,319,098 | ) |
| | | | |
Net increase (decrease) | | | 58,394 | | | $ | 698,981 | | | | | | | | (73,626 | ) | | $ | (1,521,461 | ) |
| | | | |
3. Transactions with Affiliates
Franklin Resources, Inc. is the holding company for various subsidiaries that together are referred to as Franklin Templeton. Certain officers and trustees of the Fund are also officers and/or directors of the following subsidiaries:
| | |
| |
| Subsidiary | | Affiliation |
Franklin Mutual Advisers, LLC (Franklin Mutual) | | Investment manager |
Franklin Advisory Services, LLC (Advisory Services) | | Investment manager |
Franklin Templeton Services, LLC (FT Services) | | Administrative manager |
Franklin Templeton Distributors, Inc. (Distributors) | | Principal underwriter |
Franklin Templeton Investor Services, LLC (Investor Services) | | Transfer agent |
a. Management Fees
Effective November 1, 2018, Franklin Mutual began serving as the Fund’s investment manager. Prior to November 1, 2018, Advisory Services served as the Fund’s investment manager.
FRANKLIN TEMPLETON VARIABLE INSURANCE PRODUCTS TRUST
NOTES TO FINANCIAL STATEMENTS
Franklin Small Cap Value VIP Fund(continued)
3. Transactions with Affiliates(continued)
a. Management Fees(continued)
The Fund pays an investment management fee to Franklin Mutual based on the average daily net assets of the Fund as follows:
| | |
| |
| Annualized Fee Rate | | Net Assets |
0.750% | | Up to and including $200 million |
0.635% | | Over $200 million, up to and including $700 million |
0.600% | | Over $700 million, up to and including $1.2 billion |
0.575% | | Over $1.2 billion, up to and including $1.3 billion |
0.475% | | In excess of $1.3 billion |
For the year ended December 31, 2018, the gross effective investment management fee rate was 0.633% of the Fund’s average daily net assets.
b. Administrative Fees
Under an agreement with Franklin Mutual, FT Services provides administrative services to the Fund. The fee is paid by Franklin Mutual based on the Fund’s average daily net assets, and is not an additional expense of the Fund.
c. Distribution Fees
The Board has adopted distribution plans for Class 2 and Class 4 shares pursuant to Rule12b-1 under the 1940 Act. Under the Fund’s compensation distribution plans, the Fund pays Distributors for costs incurred in connection with the servicing, sale and distribution of the Fund’s shares up to 0.35% per year of its average daily net assets of each class. The Board has agreed to limit the current rate to 0.25% per year for Class 2. The plan year, for purposes of monitoring compliance with the maximum annual plan rates, is February 1 through January 31.
d. Transfer Agent Fees
Investor Services, under terms of an agreement, performs shareholder servicing for the Fund and is not paid by the Fund for the services.
e. Investments in Affiliated Management Investment Companies
The Fund invests in one or more affiliated management investment companies for purposes other than exercising a controlling influence over the management or policies. Management fees paid by the Fund are waived on assets invested in the affiliated management investment companies, as noted in the Statement of Operations, in an amount not to exceed the management and administrative fees paid directly or indirectly by each affiliate. During the year ended December 31, 2018, the Fund held investments in affiliated management investment companies as follows:
| | | | | | | | | | | | | | | | | | | | | | | | | | | | | | |
| | | | | | | | |
| | | Number
of Shares
Held at
Beginning
of Year | | Gross
Additions | | | Gross
Reductions | | | Number
of Shares
Held at
End of
Year | | | Value at
End of
Year | | | Dividend
Income | | | Realized
Gain
(Loss) | | | Net Change in
Unrealized
Appreciation
(Depreciation) | |
| Non-Controlled Affiliates | | | | | | | | | | | | | | | | | | | | | | | | | | | | | | |
Institutional Fiduciary Trust Money Market Portfolio, 1.99% | | 43,492,005 | | | 298,285,679 | | | | (296,332,842 | ) | | | 45,444,842 | | | $ | 45,444,842 | | | $ | 632,091 | | | $ | — | | | $ | — | |
| | | | | | | | | | | | | | | | | | |
FRANKLIN TEMPLETON VARIABLE INSURANCE PRODUCTS TRUST
NOTES TO FINANCIAL STATEMENTS
Franklin Small Cap Value VIP Fund(continued)
4. Expense Offset Arrangement
The Fund has entered into an arrangement with its custodian whereby credits realized as a result of uninvested cash balances are used to reduce a portion of the Fund’s custodian expenses. During the year ended December 31, 2018, the custodian fees were reduced as noted in the Statement of Operations.
5. Income Taxes
The tax character of distributions paid during the years ended December 31, 2018 and 2017, was as follows:
| | | | | | | | |
| | |
| | | 2018 | | | 2017 | |
Distributions paid from: | | | | | | | | |
Ordinary income | | $ | 23,876,649 | | | $ | 7,150,023 | |
Long term capital gain | | | 182,343,391 | | | | 96,571,895 | |
| | | | |
| | $ | 206,220,040 | | | $ | 103,721,918 | |
| | | | |
At December 31, 2018, the cost of investments, net unrealized appreciation (depreciation), undistributed ordinary income and undistributed long term capital gains for income tax purposes were as follows:
| | | | |
Cost of investments. | | $ | 1,027,953,505 | |
| | | | |
Unrealized appreciation | | $ | 121,511,391 | |
Unrealized depreciation | | | (105,975,566 | ) |
| | | | |
Net unrealized appreciation (depreciation) | | $ | 15,535,825 | |
| | | | |
Distributable earnings: | | | | |
Undistributed ordinary income | | $ | 23,311,531 | |
Undistributed long term capital gains | | | 179,233,907 | |
| | | | |
Total distributable earnings | | $ | 202,545,438 | |
| | | | |
Differences between income and/or capital gains as determined on a book basis and a tax basis are primarily due to differing treatment of wash sales.
6. Investment Transactions
Purchases and sales of investments (excluding short term securities) for the year ended December 31, 2018, aggregated $590,813,666 and $770,203,306, respectively.
7. Credit Facility
The Fund, together with other U.S. registered and foreign investment funds (collectively, Borrowers), managed by Franklin Templeton, are borrowers in a joint syndicated senior unsecured credit facility totaling $2 billion (Global Credit Facility) which matured on February 8, 2019. This Global Credit Facility provides a source of funds to the Borrowers for temporary and emergency purposes, including the ability to meet future unanticipated or unusually large redemption requests. Effective February 8, 2019, the Borrowers renewed the Global Credit Facility for a one year term, maturing February 7, 2020, for a total of $2 billion.
FRANKLIN TEMPLETON VARIABLE INSURANCE PRODUCTS TRUST
NOTES TO FINANCIAL STATEMENTS
Franklin Small Cap Value VIP Fund(continued)
7. Credit Facility(continued)
Under the terms of the Global Credit Facility, the Fund shall, in addition to interest charged on any borrowings made by the Fund and other costs incurred by the Fund, pay its share of fees and expenses incurred in connection with the implementation and maintenance of the Global Credit Facility, based upon its relative share of the aggregate net assets of all of the Borrowers, including an annual commitment fee of 0.15% based upon the unused portion of the Global Credit Facility. These fees are reflected in other expenses in the Statement of Operations. During the year ended December 31, 2018, the Fund did not use the Global Credit Facility.
8. Fair Value Measurements
The Fund follows a fair value hierarchy that distinguishes between market data obtained from independent sources (observable inputs) and the Fund’s own market assumptions (unobservable inputs). These inputs are used in determining the value of the Fund’s financial instruments and are summarized in the following fair value hierarchy:
| | • | | Level 1 – quoted prices in active markets for identical financial instruments |
| | • | | Level 2 – other significant observable inputs (including quoted prices for similar financial instruments, interest rates, prepayment speed, credit risk, etc.) |
| | • | | Level 3 – significant unobservable inputs (including the Fund’s own assumptions in determining the fair value of financial instruments) |
The input levels are not necessarily an indication of the risk or liquidity associated with financial instruments at that level.
A summary of inputs used as of December 31, 2018, in valuing the Fund’s assets carried at fair value, is as follows:
| | | | | | | | | | | | | | | | |
| | | | |
| | | Level 1 | | | Level 2 | | | Level 3 | | | Total | |
| | | | |
| Assets: | | | | | | | | | | | | | | | | |
Investments in Securities:a | | | | | | | | | | | | | | | | |
Equity Investments | | $ | 987,007,778 | | | $ | — | | | $ | — | | | $ | 987,007,778 | |
Corporate Bonds | | | — | | | | 11,036,710 | | | | — | | | | 11,036,710 | |
Short Term Investments | | | 45,444,842 | | | | — | | | | — | | | | 45,444,842 | |
| | | | |
Total Investments in Securities | | $ | 1,032,452,620 | | | $ | 11,036,710 | | | $ | — | | | $ | 1,043,489,330 | |
| | | | |
aFor detailed categories, see the accompanying Statement of Investments.
9. Subsequent Events
The Fund has evaluated subsequent events through the issuance of the financial statements and determined that no events have occurred that require disclosure other than those already disclosed in the financial statements.
FRANKLIN TEMPLETON VARIABLE INSURANCE PRODUCTS TRUST
Report of Independent Registered Public Accounting Firm
To the Board of Trustees of Franklin Templeton Variable Insurance Products Trust and Shareholders of Franklin Small Cap Value VIP Fund
Opinion on the Financial Statements
We have audited the accompanying statement of assets and liabilities, including the statement of investments, of Franklin Small Cap Value VIP Fund (the “Fund”) as of December 31, 2018, the related statement of operations for the year ended December 31, 2018, the statement of changes in net assets for each of the two years in the period ended December 31, 2018, including the related notes, and the financial highlights for each of the five years in the period ended December 31, 2018 (collectively referred to as the “financial statements”). In our opinion, the financial statements present fairly, in all material respects, the financial position of the Fund as of December 31, 2018, the results of its operations for the year then ended, the changes in its net assets for each of the two years in the period ended December 31, 2018 and the financial highlights for each of the five years in the period ended December 31, 2018 in conformity with accounting principles generally accepted in the United States of America.
Basis for Opinion
These financial statements are the responsibility of the Fund’s management. Our responsibility is to express an opinion on the Fund’s financial statements based on our audits. We are a public accounting firm registered with the Public Company Accounting Oversight Board (United States) (PCAOB) and are required to be independent with respect to the Fund in accordance with the U.S. federal securities laws and the applicable rules and regulations of the Securities and Exchange Commission and the PCAOB.
We conducted our audits of these financial statements in accordance with the standards of the PCAOB. Those standards require that we plan and perform the audit to obtain reasonable assurance about whether the financial statements are free of material misstatement, whether due to error or fraud.
Our audits included performing procedures to assess the risks of material misstatement of the financial statements, whether due to error or fraud, and performing procedures that respond to those risks. Such procedures included examining, on a test basis, evidence regarding the amounts and disclosures in the financial statements. Our audits also included evaluating the accounting principles used and significant estimates made by management, as well as evaluating the overall presentation of the financial statements. Our procedures included confirmation of securities owned as of December 31, 2018 by correspondence with the custodian, transfer agent and brokers; when replies were not received from brokers, we performed other auditing procedures. We believe that our audits provide a reasonable basis for our opinion.
PricewaterhouseCoopers LLP
San Francisco, California
February 15, 2019
We have served as the auditor of one or more investment companies in the Franklin Templeton Group of Funds since 1948.
FRANKLIN TEMPLETON VARIABLE INSURANCE PRODUCTS TRUST
Tax Information (unaudited)
Franklin Small Cap Value VIP Fund
Under Section 852(b)(3)(C) of the Internal Revenue Code, the Fund hereby reports the maximum amount allowable but no less than $182,343,391 as a long term capital gain dividend for the fiscal year ended December 31, 2018.
Under Section 854(b)(1)(A) of the Internal Revenue Code, the Fund hereby reports 69.95% of the ordinary income dividends as income qualifying for the dividends received deduction for the fiscal year ended December 31, 2018.
FranklinSmall-Mid Cap Growth VIP Fund
This annual report for FranklinSmall-Mid Cap Growth VIP Fund covers the fiscal year ended December 31, 2018.
Class 1 Performance Summary as of December 31, 2018
Average annual total return of Class 1 shares* represents the average annual change in value, assuming reinvestment of dividends and capital gains. Average returns smooth out variations in returns, which can be significant; they are not the same asyear-by-year results.
| | | | | | | | | | | | |
| | | |
| Periods ended 12/31/18 | | 1-Year | | | 5-Year | | | 10-Year | |
Average Annual Total Return | | | -5.15% | | | | +4.86% | | | | +13.11% | |
*The Fund has a fee waiver associated with any investment it makes in a Franklin Templeton money fund and/or other Franklin Templeton fund, contractually guaranteed through 4/30/19. Fund investment results reflect the fee waiver; without this waiver, the results would have been lower.
Performance reflects the Fund’s Class 1 operating expenses, but doesnotinclude any contract fees, expenses or sales charges. If they had been included, performance would be lower. These charges and deductions, particularly for variable life policies, can have a significant effect on contract values and insurance benefits. See the contract prospectus for a complete description of these expenses, including sales charges.
Performance data represent past performance, which does not guarantee future results. Investment return and principal value will fluctuate, and you may have a gain or loss when you sell your shares. Current performance may differ from figures shown.
Total Return Index Comparison for a Hypothetical $10,000 Investment (1/1/09–12/31/18)
The graph below shows the change in value of a hypothetical $10,000 investment in the Fund over the indicated period and includes reinvestment of any income or distributions. The Fund’s performance* is compared to the performance of the Standard & Poor’s® 500 Index (S&P 500®) and the Russell Midcap® Growth Index. One cannot invest directly in an index, and an index is not representative of the Fund’s portfolio.Please see Important Notes to Performance Information preceding the Fund Summaries.
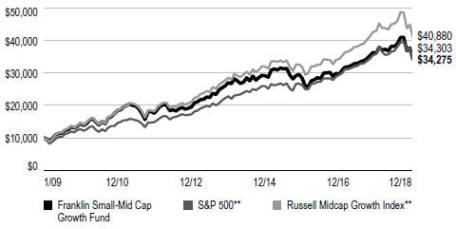
**Source: Morningstar. Please see Index Descriptions following the Fund Summaries.
FRANKLINSMALL-MID CAP GROWTH VIP FUND
Fund Goal and Main Investments
The Fund seeks long-term capital growth. Under normal market conditions, the Fund invests at least 80% of its net assets in equity securities of small-capitalization andmid-capitalization companies. For this Fund,small-cap companies are those within the market capitalization range of companies in the Russell 2500TM Index at the time of purchase, and midcap companies are those within the market capitalization range of companies in the Russell Midcap® Index at the time of purchase.1
Fund Risks
All investments involve risks, including possible loss of principal. Growth stock prices reflect projections of future earnings or revenues, and can, therefore, fall dramatically if the company fails to meet those projections. Smaller, midsized or relatively new or unseasoned companies can be particularly sensitive to changing economic conditions, and their prospects for growth are less certain than those of larger, more established companies. Historically, these securities have experienced more price volatility than larger-company stocks, especially over the short term. To the extent the Fund focuses on particular countries, regions, industries, sectors or types of investment from time to time, it may be subject to greater risk of adverse developments in such areas of focus than a fund that invests in a wider variety of countries, regions, industries, sectors or investments. From time to time, the trading market for a particular security or type of security in which the Fund invests may become less liquid or even illiquid. The Fund is actively managed but there is no guarantee that the manager’s investment decisions will produce the desired results. The Fund’s prospectus also includes a description of the main investment risks.
Performance Overview
You can find the Fund’sone-year total return in the Performance Summary. In comparison, the Fund’s broad benchmark, the S&P 500, had a-4.38% total return, and its narrow benchmark, the Russell Midcap® Growth Index, had a-4.75% total return for the same period.2
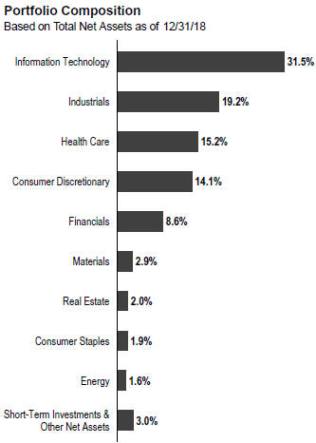
Economic and Market Overview
The U.S. economy grew during the 12 months under review. After moderating for three consecutive quarters, the economy grew faster in 2018’s second quarter, driven by consumer spending, business investment, exports and government spending. However, growth moderated in the third quarter due to declines in exports and housing investment. The manufacturing and services sectors expanded during the period. The unemployment rate declined from 4.1% in December 2017 to 3.9% atperiod-end.3 Annual inflation, as measured by the Consumer Price Index, decreased from 2.1% in December 2017 to 1.9% atperiod-end.3
The U.S. Federal Reserve (Fed) raised its target range for the federal funds rate four times during the period, to 2.25%–2.50%, and continued to reduce its balance sheet as part of its ongoing plan to normalize monetary policy. At its
1. Please see Index Descriptions following the Fund Summaries.
2. Source: Morningstar. One cannot invest directly in an index, and an index is not representative of the Fund’s portfolio. Please see Index Descriptions following the Fund Summaries.
3. Source: U.S. Bureau of Labor Statistics.
The dollar value, number of shares or principal amount, and names of all portfolio holdings are listed in the Fund’s Statement of Investments (SOI).
FRANKLINSMALL-MID CAP GROWTH VIP FUND
December meeting, the Fed reduced the projected 2019 rate increases to two, compared to three projected previously.
U.S. equity markets overall declined during the period amid concerns about tighter regulation of technology companies, the pace of the Fed’s rate increases, U.S. political uncertainties, the Trump administration’s protectionist policies, and the potential impact of the U.S.-China trade dispute on U.S. and global growth and corporate earnings. However, these concerns were partially alleviated by an overall easing of tensions in the Korean peninsula, ongoing trade negotiations between the U.S. and the European Union, and a new trade deal between the U.S., Mexico and Canada (pending ratification by the three countries’ legislatures), and intermittent U.S.-China trade negotiations, including a temporary truce that the two countries reached in December. Markets also benefited from mostly upbeat economic data, better U.S. corporate earnings, results of the U.S.mid-term elections and a potentially slower pace to the Fed’s rate increases. In this environment, the broad U.S. stock market, as measured by the S&P 500, reached a newall-time high in September 2018, but had a-4.38% total return for the12-month period.2
Investment Strategy
We use fundamental,bottom-up research to seek companies meeting our criteria of growth potential, quality and valuation. In seeking sustainable growth characteristics, we look for companies we believe can produce sustainable earnings and cash flow growth, evaluating the long-term market opportunity and competitive structure of an industry to target leaders and emerging leaders. We define quality companies as those with strong and improving competitive positions in attractive markets. We also believe important attributes of quality are experienced and talented management teams as well as financial strength reflected in the capital structure, gross and operating margins, free cash flow generation and returns on capital employed. In assessing value, we consider whether security prices fully reflect the balance of the sustainable growth opportunities relative to business and financial risks.
Manager’s Discussion
During the period under review, key contributors to performance relative to the Fund’s narrow benchmark, the Russell Midcap® Growth Index, included stock selection and an underweighted allocation in the materials sector, stock selection and an overweighted allocation in the information technology (IT) sector, and stock selection in the financials sector.
| | | | |
| Top 10 Holdings | | | |
| 12/31/18 | | | |
| |
Company Sector/Industry | | % of Total
Net Assets | |
Roper Technologies Inc. Industrials | | | 2.8% | |
ServiceNow Inc. Information Technology | | | 2.3% | |
Edwards Lifesciences Corp. Health Care | | | 2.2% | |
Workday Inc. Information Technology | | | 2.1% | |
SBA Communications Corp. Real Estate | | | 2.0% | |
Microchip Technology Inc. Information Technology | | | 1.8% | |
Verisk Analytics Inc. Industrials | | | 1.7% | |
O’Reilly Automotive Inc. Consumer Discretionary | | | 1.6% | |
Amphenol Corp. Information Technology | | | 1.5% | |
Burlington Stores Inc. Consumer Discretionary | | | 1.5% | |
Within materials, ouroff-benchmark investment in specialty chemicals and carbon materials manufacturer Ingevity benefited relative results.
The IT sector accounted for some of the Fund’s top relative contributors, including finance and human resources enterprise cloud applications company Workday, domain name registration and web hosting services provider GoDaddy, and enterprise IT management software provider ServiceNow. Workday’s shares advanced as the company reported generally solid quarterly results and provided a positive outlook during the period. The company saw sustained human resources business activity and strong financials activity, with the Adaptive Insights acquisition potentially enhancing traction in the financials market. GoDaddy reported solid revenue growth for third-quarter 2018 and raised its full-year 2018 revenue guidance. Additionally, the company announced a $500 million share buyback. Shares of ServiceNow rose amid better-than-expected earnings, revenue, operating margin, cash flow and billings, and higher revenue guidance. We believe ServiceNow is a high-qualitySoftware-as-a-Service company that is proving itself as a key partner in business and government enterprise initiatives to drive productivity through digital transformation, while also delivering excellent unit economics.
FRANKLINSMALL-MID CAP GROWTH VIP FUND
In the financials sector, our investment in insurance brokerage and consulting company Arthur J. Gallagher aided relative results.
Other notable individual contributors to relative performance included heart disease and critical care monitoring products company Edwards Lifesciences and apparel and home product retailer Burlington Stores.
In contrast, key detractors from the Fund’s relative performance included stock selection in the energy sector, stock selection and an underweighting in the consumer staples sector, and stock selection in the consumer discretionary sector.
Within the energy sector, our position in oil and natural gas company Concho Resources hindered relative results. In consumer staples, our position in energy drink company Monster Beverage4 hurt relative results, as did homebuilder NVR in the consumer discretionary sector.
Other key individual detractors from relative performance included software solutions firm Red Hat,4 machine vision products provider Cognex, chemical and specialty services company Univar, and power and hand tools and products company Stanley Black & Decker. Red Hat reported slightly better-than-expected revenue and earnings for its fiscal first quarter (ended May) and reduced its revenue outlook for fiscal-year 2019 (ending in February), citing unfavorable currency exchange rates. Furthermore, the company reported slightly weaker-than-expected revenue for its fiscal second quarter (ended August), due to various reasons, including unfavorable currency exchange rates and increased competition in its middleware business. Cognex shares declined as the company provided a flat revenue growth guidance for 2018 due to weak consumer electronics capital expenditures. However, the company’s deep-learning image analysis offering appeared to be gaining commercial traction. Univar reported better-than-expected first-quarter earnings results, but its shares declined after the company reportedin-line second quarter results and weaker-than-expected third-quarter results, largely due to issues that impacted its business in Canada. In our long-term view, however, the company’s pending acquisition of chemical distributor Nexeo (not a Fund holding) could contribute to earnings growth and increase the company’s scale in the U.S., as well as its market share in North America. The deal is expected to be completed in 2019’s first half.
Thank you for your participation in FranklinSmall-Mid Cap Growth VIP Fund. We look forward to serving your future investment needs.
The foregoing information reflects our analysis, opinions and portfolio holdings as of December 31, 2018, the end of the reporting period. The way we implement our main investment strategies and the resulting portfolio holdings may change depending on factors such as market and economic conditions. These opinions may not be relied upon as investment advice or an offer for a particular security. The information is not a complete analysis of every aspect of any market, country, industry, security or the Fund. Statements of fact are from sources considered reliable, but the investment manager makes no representation or warranty as to their completeness or accuracy. Although historical performance is no guarantee of future results, these insights may help you understand our investment management philosophy.
4. Not held at period-end.
FRANKLINSMALL-MID CAP GROWTH VIP FUND
Class 1 Fund Expenses
As an investor in a variable insurance contract (Contract) that indirectly provides for investment in an underlying mutual fund, you can incur transaction and/or ongoing expenses at both the Fund level and the Contract Level: (1) transaction expenses can include sales charges (loads) on purchases, surrender fees, transfer fees and premium taxes; and (2) ongoing expenses can include management fees, distribution and service(12b-1) fees, contract fees, annual maintenance fees, mortality and expense risk fees and other fees and expenses. All mutual funds and Contracts have some types of ongoing expenses. The table below shows Fund-level ongoing expenses and can help you understand these costs and compare them with those of other mutual funds offered through the Contract. The table assumes a $1,000 investment held for the six months indicated. Please refer to the Fund prospectus for additional information on operating expenses.
Actual Fund Expenses
The table below provides information about the actual account values and actual expenses in the columns under the heading “Actual.” In these columns the Fund’s actual return, which includes the effect of ongoing Fund expenses but does not include the effect of ongoing Contract expenses, is used to calculate the “Ending Account Value.” You can estimate the Fund-level expenses you paid during the period by following these steps (ofcourse, your account value and expenses will differ from those in this illustration):Divide your account value by $1,000 (ifyour account had an $8,600 value, then $8,600 ÷ $1,000 = 8.6). Then multiply the result by the number under the headings “Actual” and “Fund-Level Expenses Paid During Period” (ifFund-Level Expenses Paid During Period were $ 7.50, then 8.6 × $7.50 = $64.50). In this illustration, the estimated expenses paid this period at the Fund level are $64.50.
Hypothetical Example for Comparison
with Other Mutual Funds
Under the heading “Hypothetical” in the table, information is provided about hypothetical account values and hypothetical expenses based on the Fund’s actual expense ratio and an assumed rate of return of 5% per year before expenses, which is not the Fund’s actual return. This information may not be used to estimate the actual ending account balance or expenses you paid for the period, but it can help you compare ongoing costs of investing in the Fund with those of other mutual funds offered through the Contract. To do so, compare this 5% hypothetical example with the 5% hypothetical examples that appear in the shareholder reports of other funds offered through the Contract.
Please note that expenses shown in the table are meant to highlight ongoing costs at the Fund level only and do not reflect any ongoing expenses at the Contract level, or transaction expenses at either the Fund or Contract levels. In addition, while the Fund does not have transaction expenses, if the transaction and ongoing expenses at the Contract level were included, the expenses shown below would be higher. You should consult your Contract prospectus or disclosure document for more information.
1. Expenses are equal to the annualized expense ratio for thesix-month period as indicated above—in the far right column—multiplied by the simple average account value over the period indicated, and then multiplied by 184/365 to reflect theone-half year period.
2. Reflects expenses after fee waivers and expense reimbursements. Does not include any ongoing expenses of the Contract for which the Fund is an investment option or acquired fund fees and expenses.
| | | | | | | | | | | | | | | | | | | | | | | | | | |
| | | | | |
| | | | | | Actual (actual return after expenses) | | | | | Hypothetical (5% annual return before expenses) | | | | |
| | | | | | | |
Share
Class | | Beginning Account
Value 7/1/18 | | | Ending Account
Value 12/31/18 | | | Fund-Level Expenses
Paid During Period
7/1/18–12/31/181,2 | | | | | Ending Account Value 12/31/18 | | | Fund-Level Expenses
Paid During Period
7/1/18–12/31/181,2 | | | Net
Annualized
Expense
Ratio2 | |
Class 1 | | | $1,000 | | | | $897.30 | | | | $4.06 | | | | | | $1,020.92 | | | | $4.33 | | | | 0.85 | % |
1. Expenses are equal to the annualized expense ratio for thesix-month period as indicated above—in the far right column—multiplied by the simple average account value over the period indicated, and then multiplied by 184/365 to reflect theone-half year period.
2. Reflects expenses after fee waivers and expense reimbursements. Does not include any ongoing expenses of the Contract for which the Fund is an investment option or acquired fund fees and expenses.
FSC P1 11/18
SUPPLEMENT DATED NOVEMBER 15, 2018
TO THE PROSPECTUSES
DATED MAY 1, 2018
OF
FRANKLINSMALL-MID CAP GROWTH VIP FUND
(a series of Franklin Templeton Variable Insurance Products Trust)
The prospectus is amended as follows:
I. Effective December 31, 2018, the portfolio management team under the “FUND SUMMARIES – FranklinSmall-Mid Cap Growth VIP Fund – Portfolio Managers” section beginning on pageFSC-S4 is replaced with the following:
Portfolio Managers
John P. Scandalios, CFAVice President of Advisers and portfolio manager of the Fund since 2016.
Michael McCarthy, CFAExecutive Vice President of Advisers and Chief Investment Officer of Advisers and portfolio manager of the Fund since 1995.
II. Effective December 31, 2018, the portfolio management team under the “Fund Details – FranklinSmall-Mid Cap Growth VIP Fund – Management” section on pageFSC-D4 is replaced with the following:
The Fund is managed by a team of dedicated professionals focused on investments of small andmid-cap companies demonstrating accelerating growth, increasing profitability, or above average growth or growth potential as compared with the overall economy. The portfolio managers of the team are as follows:
John P. Scandalios, CFA Vice President of Advisers
Mr. Scandalios has been a portfolio manager of the Fund since 2016, providing research and advice on the purchases and sales of individual securities, and portfolio risk assessment. He joined Franklin Templeton Investments in 1996.
Michael McCarthy, CFA Executive Vice President and Chief Investment Officer of Advisers
Mr. McCarthy has been a portfolio manager of the Fund since 1995, providing research and advice on the purchases and sales of individual securities, and portfolio risk assessment. He joined Franklin Templeton Investments in 1992.
CFA® and Chartered Financial Analyst® are trademarks owned by CFA Institute.
Please keep this supplement with your prospectus for future reference.
FRANKLIN TEMPLETON VARIABLE INSURANCE PRODUCTS TRUST
Financial Highlights
FranklinSmall-Mid Cap Growth VIP Fund
| | | | | | | | | | | | | | | | | | | | |
| |
| | | Year Ended December 31, | |
| | | | | |
| | | 2018 | | | 2017 | | | 2016 | | | 2015 | | | 2014 | |
| Class 1 | | | | | | | | | | | | | | | | | | | | |
Per share operating performance (for a share outstanding throughout the year) | | | | | | | | | | | | | | | | | | | | |
| | | | | |
Net asset value, beginning of year | | | $19.71 | | | | $17.77 | | | | $19.09 | | | | $24.95 | | | | $28.38 | |
| | | | |
| | | | | |
| Income from investment operationsa: | | | | | | | | | | | | | | | | | | | | |
| | | | | |
Net investment income (loss)b | | | (0.05 | ) | | | (0.04 | ) | | | (0.03 | ) | | | —c,d | | | | (0.07 | ) |
| | | | | |
Net realized and unrealized gains (losses) | | | (0.70 | ) | | | 3.74 | | | | 0.77 | | | | (0.03 | ) | | | 2.04 | |
| | | | |
Total from investment operations | | | (0.75 | ) | | | 3.70 | | | | 0.74 | | | | (0.03 | ) | | | 1.97 | |
| | | | |
| | | | | |
| Less distributions from net realized gains | | | (1.92 | ) | | | (1.76 | ) | | | (2.06 | ) | | | (5.83 | ) | | | (5.40 | ) |
| | | | |
| | | | | |
Net asset value, end of year | | | $17.04 | | | | $19.71 | | | | $17.77 | | | | $19.09 | | | | $24.95 | |
| | | | |
| | | | | |
Total returne | | | (5.15)% | | | | 21.75% | | | | 4.40% | | | | (2.44)% | | | | 7.78% | |
| | | | | |
| Ratios to average net assets | | | | | | | | | | | | | | | | | | | | |
| | | | | |
Expenses before waiver and payments by affiliates | | | 0.86% | | | | 0.85% | | | | 0.84% | | | | 0.81% | | | | 0.80% | |
| | | | | |
Expenses net of waiver and payments by affiliates | | | 0.85%f | | | | 0.84%f | | | | 0.82%f | | | | 0.81%g | | | | 0.80%g | |
| | | | | |
Net investment income (loss) | | | (0.24)% | | | | (0.24)% | | | | (0.16)% | | | | 0.01%d | | | | (0.29)% | |
| | | | | |
| Supplemental data | | | | | | | | | | | | | | | | | | | | |
| | | | | |
Net assets, end of year (000’s) | | | $33,518 | | | | $36,864 | | | | $31,756 | | | | $87,866 | | | | $99,803 | |
| | | | | |
Portfolio turnover rate | | | 44.78% | | | | 40.49% | | | | 32.23%h | | | | 37.85% | | | | 48.73% | |
aThe amount shown for a share outstanding throughout the period may not correlate with the Statement of Operations for the period due to the timing of sales and repurchases of the Fund’s shares in relation to income earned and/or fluctuating fair value of the investments of the Fund.
bBased on average daily shares outstanding.
cAmount rounds to less than $0.01 per share.
dNet investment income per share includes approximately $0.05 per share related to income received in the form of special dividends in connection with certain Fund holdings. Excluding this amount, the ratio of net investment income to average net assets would have been (0.24)%.
eTotal return does not include fees, charges or expenses imposed by the variable annuity and life insurance contracts for which Franklin Templeton Variable Insurance Products Trust serves as an underlying investment vehicle.
fBenefit of expense reduction rounds to less than 0.01%.
gBenefit of waiver and payments by affiliates rounds to less than 0.01%.
hExcludes the value of portfolio securities delivered as a result of a redemptionin-kind.
| | | | | | |
| | | |
| | The accompanying notes are an integral part of these financial statements. | Annual Report | | | FSC-7 | |
FRANKLIN TEMPLETON VARIABLE INSURANCE PRODUCTS TRUST
FINANCIAL HIGHLIGHTS
Franklin Small-Mid Cap Growth VIP Fund(continued)
| | | | | | | | | | | | | | | | | | | | |
| |
| | | Year Ended December 31, | |
| | | | | |
| | | 2018 | | | 2017 | | | 2016 | | | 2015 | | | 2014 | |
| Class 2 | | | | | | | | | | | | | | | | | | | | |
Per share operating performance (for a share outstanding throughout the year) | | | | | | | | | | | | | | | | | | | | |
| | | | | |
Net asset value, beginning of year | | | $17.83 | | | | $16.27 | | | | $17.69 | | | | $23.56 | | | | $27.16 | |
| | | | |
| | | | | |
| Income from investment operationsa: | | | | | | | | | | | | | | | | | | | | |
| | | | | |
Net investment income (loss)b | | | (0.09 | ) | | | (0.08 | ) | | | (0.07 | ) | | | (0.05 | )c | | | (0.13 | ) |
| | | | | |
Net realized and unrealized gains (losses) | | | (0.60 | ) | | | 3.40 | | | | 0.71 | | | | 0.01 | | | | 1.93 | |
| | | | |
Total from investment operations | | | (0.69 | ) | | | 3.32 | | | | 0.64 | | | | (0.04 | ) | | | 1.80 | |
| | | | |
| | | | | |
| Less distributions from net realized gains | | | (1.92 | ) | | | (1.76 | ) | | | (2.06 | ) | | | (5.83 | ) | | | (5.40 | ) |
| | | | |
| | | | | |
| Net asset value, end of year | | | $15.22 | | | | $17.83 | | | | $16.27 | | | | $17.69 | | | | $23.56 | |
| | | | |
| | | | | |
Total returnd | | | (5.37)% | | | | 21.40% | | | | 4.17% | | | | (2.66)% | | | | 7.47% | |
| | | | | |
| Ratios to average net assets | | | | | | | | | | | | | | | | | | | | |
| | | | | |
Expenses before waiver and payments by affiliates | | | 1.11% | | | | 1.10% | | | | 1.09% | | | | 1.06% | | | | 1.05% | |
| | | | | |
Expenses net of waiver and payments by affiliates | | | 1.10%e | | | | 1.09%e | | | | 1.07%e | | | | 1.06%f | | | | 1.05%f | |
| | | | | |
Net investment income (loss) | | | (0.49)% | | | | (0.49)% | | | | (0.41)% | | | | (0.24)%c | | | | (0.54)% | |
| | | | | |
| Supplemental data | | | | | | | | | | | | | | | | | | | | |
| | | | | |
Net assets, end of year (000’s) | | | $310,300 | | | | $390,094 | | | | $392,777 | | | | $478,649 | | | | $582,772 | |
| | | | | |
Portfolio turnover rate | | | 44.78% | | | | 40.49% | | | | 32.23%g | | | | 37.85% | | | | 48.73% | |
aThe amount shown for a share outstanding throughout the period may not correlate with the Statement of Operations for the period due to the timing of sales and repurchases of the Fund’s shares in relation to income earned and/or fluctuating fair value of the investments of the Fund.
bBased on average daily shares outstanding.
cNet investment income per share includes approximately $0.05 per share related to income received in the form of special dividends in connection with certain Fund holdings. Excluding this amount, the ratio of net investment income to average net assets would have been (0.49)%.
dTotal return does not include fees, charges or expenses imposed by the variable annuity and life insurance contracts for which Franklin Templeton Variable Insurance Products Trust serves as an underlying investment vehicle.
eBenefit of expense reduction rounds to less than 0.01%.
fBenefit of waiver and payments by affiliates rounds to less than 0.01%.
gExcludes the value of portfolio securities delivered as a result of a redemptionin-kind.
| | | | |
| | | |
| FSC-8 | | Annual Report | The accompanying notes are an integral part of these financial statements. | | |
FRANKLIN TEMPLETON VARIABLE INSURANCE PRODUCTS TRUST
FINANCIAL HIGHLIGHTS
FranklinSmall-Mid Cap Growth VIP Fund(continued)
| | | | | | | | | | | | | | | | | | | | |
| |
| | | Year Ended December 31, | |
| | | | | |
| | | 2018 | | | 2017 | | | 2016 | | | 2015 | | | 2014 | |
| Class 4 | | | | | | | | | | | | | | | | | | | | |
Per share operating performance (for a share outstanding throughout the year) | | | | | | | | | | | | | | | | | | | | |
| | | | | |
Net asset value, beginning of year | | | $18.47 | | | | $16.81 | | | | $18.23 | | | | $24.14 | | | | $27.72 | |
| | | | |
| | | | | |
| Income from investment operationsa: | | | | | | | | | | | | | | | | | | | | |
| | | | | |
Net investment income (loss)b | | | (0.11 | ) | | | (0.10 | ) | | | (0.09 | ) | | | (0.07 | )c | | | (0.16 | ) |
| | | | | |
Net realized and unrealized gains (losses) | | | (0.63 | ) | | | 3.52 | | | | 0.73 | | | | (0.01 | ) | | | 1.98 | |
| | | | |
Total from investment operations | | | (0.74 | ) | | | 3.42 | | | | 0.64 | | | | (0.08 | ) | | | 1.82 | |
| | | | |
| | | | | |
| Less distributions from net realized gains | | | (1.92 | ) | | | (1.76 | ) | | | (2.06 | ) | | | (5.83 | ) | | | (5.40 | ) |
| | | | |
| | | | | |
| Net asset value, end of year | | | $15.81 | | | | $18.47 | | | | $16.81 | | | | $18.23 | | | | $24.14 | |
| | | | |
| | | | | |
Total returnd | | | (5.46)% | | | | 21.30% | | | | 4.04% | | | | (2.77)% | | | | 7.39% | |
| | | | | |
| Ratios to average net assets | | | | | �� | | | | | | | | | | | | | | | |
| | | | | |
Expenses before waiver and payments by affiliates | | | 1.21% | | | | 1.20% | | | | 1.19% | | | | 1.16% | | | | 1.15% | |
| | | | | |
Expenses net of waiver and payments by affiliates | | | 1.20%e | | | | 1.19%e | | | | 1.17%e | | | | 1.16%f | | | | 1.15%f | |
| | | | | |
Net investment income (loss) | | | (0.59)% | | | | (0.59)% | | | | (0.51)% | | | | (0.34 | )%c | | | (0.64)% | |
| | | | | |
| Supplemental data | | | | | | | | | | | | | | | | | | | | |
| | | | | |
Net assets, end of year (000’s) | | | $13,759 | | | | $15,829 | | | | $13,825 | | | | $15,105 | | | | $16,384 | |
| | | | | |
Portfolio turnover rate | | | 44.78% | | | | 40.49% | | | | 32.23%g | | | | 37.85% | | | | 48.73% | |
aThe amount shown for a share outstanding throughout the period may not correlate with the Statement of Operations for the period due to the timing of sales and repurchases of the Fund’s shares in relation to income earned and/or fluctuating fair value of the investments of the Fund.
bBased on average daily shares outstanding.
cNet investment income per share includes approximately $0.05 per share related to income received in the form of special dividends in connection with certain Fund holdings. Excluding this amount, the ratio of net investment income to average net assets would have been (0.59)%
dTotal return does not include fees, charges or expenses imposed by the variable annuity and life insurance contracts for which Franklin Templeton Variable Insurance Products Trust serves as an underlying investment vehicle.
eBenefit of expense reduction rounds to less than 0.01%.
fBenefit of waiver and payments by affiliates rounds to less than 0.01%.
gExcludes the value of portfolio securities delivered as a result of a redemptionin-kind.
| | | | | | |
| | | |
| | The accompanying notes are an integral part of these financial statements. | Annual Report | | | FSC-9 | |
FRANKLIN TEMPLETON VARIABLE INSURANCE PRODUCTS TRUST
Statement of Investments, December 31, 2018
| | | | | | | | | | |
| FranklinSmall-Mid Cap Growth VIP Fund | | | | |
| | | |
| | | | | Shares | | | Value | |
| | Common Stocks 96.8% | | | | | | | | |
| | Consumer Discretionary 14.1% | | | | | | | | |
| | Aptiv PLC | | | 44,777 | | | $ | 2,756,920 | |
| a | | Burlington Stores Inc. | | | 32,500 | | | | 5,286,775 | |
| a | | Dollar Tree Inc. | | | 28,911 | | | | 2,611,242 | |
| | Domino’s Pizza Inc. | | | 17,500 | | | | 4,339,825 | |
| a,b,c | | DraftKings Inc. | | | 733,541 | | | | 1,870,090 | |
| | Expedia Group Inc. | | | 30,000 | | | | 3,379,500 | |
| a | | Five Below Inc. | | | 7,000 | | | | 716,240 | |
| a | | Grand Canyon Education Inc. | | | 35,057 | | | | 3,370,380 | |
| | MGM Resorts International | | | 84,500 | | | | 2,049,970 | |
| a | | NVR Inc. | | | 1,482 | | | | 3,611,619 | |
| a | | O’Reilly Automotive Inc. | | | 16,207 | | | | 5,580,556 | |
| | Tapestry Inc. | | | 50,000 | | | | 1,687,500 | |
| | Tractor Supply Co. | | | 30,237 | | | | 2,522,975 | |
| a | | Ulta Beauty Inc. | | | 17,000 | | | | 4,162,280 | |
| a | | Under Armour Inc., A | | | 46,500 | | | | 821,655 | |
| | Vail Resorts Inc. | | | 12,000 | | | | 2,529,840 | |
| | VF Corp. | | | 37,000 | | | | 2,639,580 | |
| | Wingstop Inc. | | | 9,500 | | | | 609,805 | |
| | | | | | | | | | |
| | | | | | | | | 50,546,752 | |
| | | | | | | | | | |
| | | Consumer Staples 1.9% | | | | | | |
| | Brown-Forman Corp., B | | | 63,000 | | | | 2,997,540 | |
| | Lamb Weston Holdings Inc. | | | 34,000 | | | | 2,501,040 | |
| | McCormick & Co. Inc. | | | 8,500 | | | | 1,183,540 | |
| | | | | | | | | | |
| | | | | | | | | 6,682,120 | |
| | | | | | | | | | |
| | | Energy 1.6% | | | | | | |
| | Cabot Oil & Gas Corp., A | | | 93,749 | | | | 2,095,290 | |
| a | | Concho Resources Inc. | | | 20,900 | | | | 2,148,311 | |
| | Diamondback Energy Inc. | | | 15,000 | | | | 1,390,500 | |
| | | | | | | | | | |
| | | | | | | | | 5,634,101 | |
| | | | | | | | | | |
| | | Financials 8.4% | | | | | | |
| | Arthur J. Gallagher & Co. | | | 50,008 | | | | 3,685,590 | |
| | CBOE Global Markets Inc. | | | 41,500 | | | | 4,059,945 | |
| | First Republic Bank | | | 25,000 | | | | 2,172,500 | |
| a | | Focus Financial Partners Inc. | | | 25,000 | | | | 658,250 | |
| | MarketAxess Holdings Inc. | | | 22,396 | | | | 4,732,499 | |
| | Moody’s Corp. | | | 30,909 | | | | 4,328,496 | |
| | MSCI Inc. | | | 26,500 | | | | 3,906,895 | |
| | SEI Investments Co. | | | 49,500 | | | | 2,286,900 | |
| a | | SVB Financial Group | | | 11,878 | | | | 2,255,870 | |
| a | | Western Alliance Bancorp | | | 46,000 | | | | 1,816,540 | |
| | | | | | | | | | |
| | | | | | | | | 29,903,485 | |
| | | | | | | | | | |
| | | Health Care 15.2% | | | | | | |
| a | | ABIOMED Inc. | | | 11,200 | | | | 3,640,448 | |
| a | | Agios Pharmaceuticals Inc. | | | 10,000 | | | | 461,100 | |
| a | | Align Technology Inc. | | | 10,700 | | | | 2,240,901 | |
| a | | Array BioPharma Inc. | | | 57,500 | | | | 819,375 | |
| a | | BioMarin Pharmaceutical Inc. | | | 26,308 | | | | 2,240,126 | |
| a | | Centene Corp. | | | 35,500 | | | | 4,093,150 | |
| a | | DexCom Inc. | | | 19,088 | | | | 2,286,742 | |
| a | | Edwards Lifesciences Corp. | | | 51,321 | | | | 7,860,838 | |
FRANKLIN TEMPLETON VARIABLE INSURANCE PRODUCTS TRUST
STATEMENT OF INVESTMENTS
FranklinSmall-Mid Cap Growth VIP Fund(continued)
| | | | | | | | | | |
| | | |
| | | | | Shares | | | Value | |
| | Common Stocks(continued) | | | | | | | | |
| | Health Care(continued) | | | | | | | | |
| a | | Elanco Animal Health Inc. | | | 27,800 | | | $ | 876,534 | |
| a | | Guardant Health Inc. | | | 9,000 | | | | 338,310 | |
| a | | Heron Therapeutics Inc. | | | 54,500 | | | | 1,413,730 | |
| a | | IDEXX Laboratories Inc. | | | 16,000 | | | | 2,976,320 | |
| a | | Incyte Corp. | | | 25,469 | | | | 1,619,574 | |
| a | | Ionis Pharmaceuticals Inc. | | | 13,500 | | | | 729,810 | |
| a | | iRhythm Technologies Inc. | | | 22,000 | | | | 1,528,560 | |
| a | | Jazz Pharmaceuticals PLC | | | 16,000 | | | | 1,983,360 | |
| a | | Mettler-Toledo International Inc. | | | 8,855 | | | | 5,008,211 | |
| a | | Neurocrine Biosciences Inc. | | | 20,644 | | | | 1,474,188 | |
| a | | Penumbra Inc. | | | 18,648 | | | | 2,278,786 | |
| a | | Revance Therapeutics Inc. | | | 43,801 | | | | 881,714 | |
| a | | Sage Therapeutics Inc. | | | 6,000 | | | | 574,740 | |
| a | | Sarepta Therapeutics Inc. | | | 10,500 | | | | 1,145,865 | |
| a | | Seattle Genetics Inc. | | | 17,500 | | | | 991,550 | |
| a | | Veeva Systems Inc. | | | 18,000 | | | | 1,607,760 | |
| a | | Waters Corp. | | | 19,500 | | | | 3,678,675 | |
| | West Pharmaceutical Services Inc. | | | 17,500 | | | | 1,715,525 | |
| | | | | | | | | | |
| | | | | | | | | 54,465,892 | |
| | | | | | | | | | |
| | | Industrials 19.2% | | | | | | |
| | BWX Technologies Inc. | | | 65,500 | | | | 2,504,065 | |
| a | | CoStar Group Inc. | | | 14,935 | | | | 5,038,173 | |
| | Fortive Corp. | | | 74,500 | | | | 5,040,670 | |
| | Harris Corp. | | | 30,500 | | | | 4,106,825 | |
| | IDEX Corp. | | | 31,500 | | | | 3,977,190 | |
| a | | IHS Markit Ltd. | | | 56,415 | | | | 2,706,228 | |
| | J.B. Hunt Transport Services Inc. | | | 28,146 | | | | 2,618,704 | |
| a | | Mercury Systems Inc. | | | 48,000 | | | | 2,269,920 | |
| | Old Dominion Freight Line Inc. | | | 24,000 | | | | 2,963,760 | |
| | Republic Services Inc. | | | 53,000 | | | | 3,820,770 | |
| | Rockwell Automation Inc. | | | 30,000 | | | | 4,514,400 | |
| | Roper Technologies Inc. | | | 38,043 | | | | 10,139,220 | |
| | Stanley Black & Decker Inc. | | | 30,296 | | | | 3,627,643 | |
| a | | TransDigm Group Inc. | | | 6,000 | | | | 2,040,360 | |
| | TransUnion | | | 32,500 | | | | 1,846,000 | |
| a | | Univar Inc. | | | 130,800 | | | | 2,320,392 | |
| a | | Verisk Analytics Inc. | | | 56,861 | | | | 6,200,123 | |
| a | | WABCO Holdings Inc. | | | 26,800 | | | | 2,876,712 | |
| | | | | | | | | | |
| | | | | | | | | 68,611,155 | |
| | | | | | | | | | |
| | | Information Technology 31.5% | | | | | | |
| a | | 2U Inc. | | | 91,479 | | | | 4,548,336 | |
| a | | Advanced Micro Devices Inc. | | | 93,000 | | | | 1,716,780 | |
| a | | Adyen NV (Netherlands) | | | 5,500 | | | | 2,993,717 | |
| a | | Alarm.com Holdings Inc. | | | 35,596 | | | | 1,846,364 | |
| | Amphenol Corp., A | | | 66,000 | | | | 5,347,320 | |
| a | | Arista Networks Inc. | | | 11,500 | | | | 2,423,050 | |
| a | | Autodesk Inc. | | | 40,000 | | | | 5,144,400 | |
| a | | Black Knight Inc. | | | 62,000 | | | | 2,793,720 | |
| | Cognex Corp. | | | 53,996 | | | | 2,088,025 | |
| a | | Elastic NV | | | 17,500 | | | | 1,250,900 | |
| a | | EPAM Systems Inc. | | | 23,000 | | | | 2,668,230 | |
FRANKLIN TEMPLETON VARIABLE INSURANCE PRODUCTS TRUST
STATEMENT OF INVESTMENTS
FranklinSmall-Mid Cap Growth VIP Fund(continued)
| | | | | | | | | | |
| | | |
| | | | | Shares | | | Value | |
| | Common Stocks (continued) | | | | | | | | |
| | Information Technology(continued) | | | | | | | | |
| | Global Payments Inc. | | | 17,000 | | | $ | 1,753,210 | |
| a | | GoDaddy Inc., A | | | 77,617 | | | | 5,093,227 | |
| a | | Guidewire Software Inc. | | | 38,000 | | | | 3,048,740 | |
| a | | InterXion Holding NV (Netherlands) | | | 32,000 | | | | 1,733,120 | |
| | Jack Henry & Associates Inc. | | | 15,500 | | | | 1,961,060 | |
| | KLA-Tencor Corp. | | | 42,687 | | | | 3,820,060 | |
| | Lam Research Corp. | | | 22,116 | | | | 3,011,536 | |
| | Maxim Integrated Products Inc. | | | 27,000 | | | | 1,372,950 | |
| | Microchip Technology Inc. | | | 91,127 | | | | 6,553,854 | |
| | Monolithic Power Systems | | | 27,000 | | | | 3,138,750 | |
| a | | Pluralsight Inc., A | | | 53,000 | | | | 1,248,150 | |
| a | | PTC Inc. | | | 29,000 | | | | 2,404,100 | |
| a | | Q2 Holdings Inc. | | | 34,196 | | | | 1,694,412 | |
| a | | ServiceNow Inc. | | | 45,437 | | | | 8,090,058 | |
| a | | Shopify Inc., A (Canada) | | | 8,100 | | | | 1,121,445 | |
| a | | Silicon Laboratories Inc. | | | 21,500 | | | | 1,694,415 | |
| a | | Square Inc., A | | | 72,000 | | | | 4,038,480 | |
| a | | Synopsys Inc. | | | 33,000 | | | | 2,779,920 | |
| | Total System Services Inc. | | | 37,000 | | | | 3,007,730 | |
| a | | Trimble Inc. | | | 55,500 | | | | 1,826,505 | |
| a | | Twilio Inc., A | | | 20,500 | | | | 1,830,650 | |
| a | | ViaSat Inc. | | | 49,866 | | | | 2,939,601 | |
| a | | WEX Inc. | | | 15,000 | | | | 2,100,900 | |
| a | | Wix.com Ltd. (Israel) | | | 25,500 | | | | 2,303,670 | |
| a | | Workday Inc., A | | | 46,643 | | | | 7,447,954 | |
| | Xilinx Inc. | | | 31,300 | | | | 2,665,821 | |
| a | | Zscaler Inc. | | | 31,500 | | | | 1,235,115 | |
| | | | | | | | | | |
| | | | | | | | | 112,736,275 | |
| | | | | | | | | | |
| | | Materials 2.9% | | | | | | |
| | Celanese Corp. | | | 26,500 | | | | 2,384,205 | |
| a | | Ingevity Corp. | | | 32,541 | | | | 2,723,356 | |
| | Martin Marietta Materials Inc. | | | 14,000 | | | | 2,406,180 | |
| | Packaging Corp. of America | | | 33,500 | | | | 2,795,910 | |
| | | | | | | | | | |
| | | | | | | | | 10,309,651 | |
| | | | | | | | | | |
| | | Real Estate 2.0% | | | | | | |
| a | | SBA Communications Corp., A | | | 44,357 | | | | 7,180,955 | |
| | | | | | | | | | |
| | Total Common Stocks (Cost $283,636,655) | | | | | | | 346,070,386 | |
| | | | | | | | | | |
| | | |
| | Preferred Stocks (Cost $799,998) 0.2% | | | | | | | | |
| | | Financials 0.2% | | | | | | |
| a,b,c | | Bill.com, pfd., 144A, H | | | 96,296 | | | | 799,998 | |
| | | | | | | | | | |
| | Total Investments before Short Term Investments (Cost $284,436,653) | | | | | | | 346,870,384 | |
| | | | | | | | | | |
FRANKLIN TEMPLETON VARIABLE INSURANCE PRODUCTS TRUST
STATEMENT OF INVESTMENTS
FranklinSmall-Mid Cap Growth VIP Fund(continued)
| | | | | | | | | | |
| | | |
| | | | | Shares | | | Value | |
| | | |
| | Short Term Investments (Cost $12,085,918) 3.4% | | | | | | | | |
| | | |
| | | Money Market Funds 3.4% | | | | | | |
| d,e | | Institutional Fiduciary Trust Money Market Portfolio, 1.99% | | | 12,085,918 | | | $ | 12,085,918 | |
| | | | | | | | | | |
| | | |
| | Total Investments (Cost $296,522,571) 100.4% | | | | | | | 358,956,302 | |
| | | |
| | Other Assets, less Liabilities (0.4)% | | | | | | | (1,379,224 | ) |
| | | | | | | | | | |
| | | |
| | Net Assets 100.0% | | | | | | $ | 357,577,078 | |
| | | | | | | | | | |
aNon-income producing.
bFair valued using significant unobservable inputs. See Note 9 regarding fair value measurements.
cSee Note 7 regarding restricted securities.
dSee Note 3(e) regarding investments in affiliated management investment companies.
eThe rate shown is the annualizedseven-day effective yield at period end.
| | | | | | |
| | | |
| | The accompanying notes are an integral part of these financial statements. | Annual Report | | | FSC-13 | |
FRANKLIN TEMPLETON VARIABLE INSURANCE PRODUCTS TRUST
Financial Statements
Statement of Assets and Liabilities
December 31, 2018
| | | | |
| |
| | | Franklin Small-Mid
Cap Growth VIP
Fund | |
Assets: | | | | |
Investments in securities: | | | | |
Cost - Unaffiliated issuers | | $ | 284,436,653 | |
Cost -Non-controlled affiliates (Note 3e) | | | 12,085,918 | |
| | | | |
Value - Unaffiliated issuers | | $ | 346,870,384 | |
Value -Non-controlled affiliates (Note 3e) | | | 12,085,918 | |
Receivables: | | | | |
Capital shares sold | | | 22,740 | |
Dividends | | | 121,787 | |
Other assets | | | 50 | |
| | | | |
Total assets | | | 359,100,879 | |
| | | | |
Liabilities: | | | | |
Payables: | | | | |
Investment securities purchased | | | 770,106 | |
Capital shares redeemed. | | | 220,911 | |
Management fees | | | 246,365 | |
Distribution fees | | | 145,573 | |
Reports to shareholders | | | 97,819 | |
Accrued expenses and other liabilities | | | 43,027 | |
| | | | |
Total liabilities. | | | 1,523,801 | |
| | | | |
Net assets, at value | | $ | 357,577,078 | |
| | | | |
Net assets consist of: | | | | |
Paid-in capital | | $ | 236,478,750 | |
Total distributable earnings (loss) | | | 121,098,328 | |
| | | | |
Net assets, at value | | $ | 357,577,078 | |
| | | | |
| |
| Class 1: | | | | |
Net assets, at value | | $ | 33,517,565 | |
| | | | |
Shares outstanding | | | 1,966,511 | |
| | | | |
Net asset value and maximum offering price per share | | $ | 17.04 | |
| | | | |
| |
| Class 2: | | | | |
Net assets, at value | | $ | 310,300,304 | |
| | | | |
Shares outstanding | | | 20,387,988 | |
| | | | |
Net asset value and maximum offering price per share | | $ | 15.22 | |
| | | | |
| |
| Class 4: | | | | |
Net assets, at value | | $ | 13,759,209 | |
| | | | |
Shares outstanding | | | 870,362 | |
| | | | |
Net asset value and maximum offering price per share | | $ | 15.81 | |
| | | | |
| | | | |
| | | |
| FSC-14 | | Annual Report | The accompanying notes are an integral part of these financial statements. | | |
FRANKLIN TEMPLETON VARIABLE INSURANCE PRODUCTS TRUST
FINANCIAL STATEMENTS
Statement of Operations
for the year ended December 31, 2018
| | | | |
| |
| | | Franklin Small-Mid
Cap Growth
VIP Fund | |
Investment income: | | | | |
Dividends: (net of foreign taxes)* | | | | |
Unaffiliated issuers | | $ | 2,447,880 | |
Non-controlled affiliates (Note 3e) | | | 153,752 | |
Income from securities loaned: | | | | |
Non-controlled affiliates (Note 3e) | | | 46,844 | |
| | | | |
Total investment income | | | 2,648,476 | |
| | | | |
Expenses: | | | | |
Management fees (Note 3a) | | | 3,477,375 | |
Distribution fees: (Note 3c) | | | | |
Class 2 | | | 952,146 | |
Class 4 | | | 54,340 | |
Custodian fees (Note 4) | | | 3,813 | |
Reports to shareholders | | | 159,529 | |
Professional fees | | | 52,296 | |
Trustees’ fees and expenses | | | 3,210 | |
Other | | | 27,510 | |
| | | | |
Total expenses | | | 4,730,219 | |
Expense reductions (Note 4) | | | (12 | ) |
Expenses waived/paid by affiliates (Note 3e) | | | (51,607 | ) |
| | | | |
Net expenses | | | 4,678,600 | |
| | | | |
Net investment income (loss) | | | (2,030,124 | ) |
| | | | |
Realized and unrealized gains (losses): | | | | |
Net realized gain (loss) from: | | | | |
Investments: | | | | |
Unaffiliated issuers | | | 59,106,093 | |
Foreign currency transactions | | | (4,318 | ) |
| | | | |
Net realized gain (loss) | | | 59,101,775 | |
| | | | |
Net change in unrealized appreciation (depreciation) on: | | | | |
Investments: | | | | |
Unaffiliated issuers | | | (74,199,939 | ) |
| | | | |
Net realized and unrealized gain (loss) | | | (15,098,164 | ) |
| | | | |
Net increase (decrease) in net assets resulting from operations | | $ | (17,128,288 | ) |
| | | | |
| |
*Foreign taxes withheld on dividends | | $ | 42 | |
| | | | | | |
| | | |
| | The accompanying notes are an integral part of these financial statements. | Annual Report | | | FSC-15 | |
FRANKLIN TEMPLETON VARIABLE INSURANCE PRODUCTS TRUST
FINANCIAL STATEMENTS
Statements of Changes in Net Assets
| | | | | | | | |
| |
| | | Franklin Small-Mid Cap Growth VIP Fund | |
| |
| | | Year Ended December 31, | |
| | |
| | | 2018 | | | 2017 | |
Increase (decrease) in net assets: | | | | | | | | |
Operations: | | | | | | | | |
Net investment income (loss) | | $ | (2,030,124 | ) | | $ | (2,151,916 | ) |
Net realized gain (loss) | | | 59,101,775 | | | | 46,758,513 | |
Net change in unrealized appreciation (depreciation) | | | (74,199,939 | ) | | | 44,201,889 | |
| | | | |
Net increase (decrease) in net assets resulting from operations | | | (17,128,288 | ) | | | 88,808,486 | |
| | | | |
Distributions to shareholders: (Note 1e) | | | | | | | | |
Class 1 | | | (3,540,738 | ) | | | (3,085,657 | ) |
Class 2 | | | (39,501,499 | ) | | | (39,960,537 | ) |
Class 4 | | | (1,517,449 | ) | | | (1,450,459 | ) |
| | | | |
Total distributions to shareholders | | | (44,559,686 | ) | | | (44,496,653 | ) |
| | | | |
Capital share transactions: (Note 2) | | | | | | | | |
Class 1 | | | 1,966,782 | | | | 1,442,945 | |
Class 2 | | | (25,664,064 | ) | | | (41,878,699 | ) |
Class 4 | | | 175,962 | | | | 552,508 | |
| | | | |
Total capital share transactions | | | (23,521,320 | ) | | | (39,883,246 | ) |
| | | | |
Net increase (decrease) in net assets | | | (85,209,294 | ) | | | 4,428,587 | |
Net assets: | | | | | | | | |
Beginning of year | | | 442,786,372 | | | | 438,357,785 | |
| | | | |
End of year (Note 1e) | | $ | 357,577,078 | | | $ | 442,786,372 | |
| | | | |
| | | | |
| | | |
| FSC-16 | | Annual Report | The accompanying notes are an integral part of these financial statements. | | |
FRANKLIN TEMPLETON VARIABLE INSURANCE PRODUCTS TRUST
Notes to Financial Statements
FranklinSmall-Mid Cap Growth VIP Fund
1. Organization and Significant Accounting Policies
Franklin Templeton Variable Insurance Products Trust (Trust) is registered under the Investment Company Act of 1940 (1940 Act) as anopen-end management investment company, consisting of eighteen separate funds and applies the specialized accounting and reporting guidance in U.S. Generally Accepted Accounting Principles (U.S. GAAP). FranklinSmall-Mid Cap Growth VIP Fund (Fund) is included in this report. Shares of the Fund are generally sold only to insurance company separate accounts to fund the benefits of variable life insurance policies or variable annuity contracts. At December 31, 2018, 47.2% of the Fund’s shares were held through one insurance company. Investment activities of these insurance company separate accounts could have a material impact on the Fund. The Fund offers three classes of shares: Class 1, Class 2 and Class 4. Each class of shares may differ by its distribution fees, voting rights on matters affecting a single class and its exchange privilege.
The following summarizes the Fund’s significant accounting policies.
a. Financial Instrument Valuation
The Fund’s investments in financial instruments are carried at fair value daily. Fair value is the price that would be received to sell an asset or paid to transfer a liability in an orderly transaction between market participants on the measurement date. The Fund calculates the net asset value (NAV) per share each business day as of 4 p.m. Eastern time or the regularly scheduled close of the New York Stock Exchange (NYSE), whichever is earlier. Under compliance policies and procedures approved by the Trust’s Board of Trustees (the Board), the Fund’s administrator has responsibility for oversight of valuation, including leading the cross-functional Valuation Committee (VC). The Fund may utilize independent pricing services, quotations from securities and financial instrument dealers, and other market sources to determine fair value.
Equity securities listed on an exchange or on the NASDAQ National Market System are valued at the last quoted sale price or the official closing price of the day, respectively. Foreign equity securities are valued as of the close of trading on the foreign stock exchange on which the security is primarily traded, or as of 4 p.m. Eastern time. The value is then converted into its U.S. dollar equivalent at the foreign exchange rate in effect at 4 p.m. Eastern time on the day that the value of the security is determined.Over-the-counter (OTC) securities are
valued within the range of the most recent quoted bid and ask prices. Securities that trade in multiple markets or on multiple exchanges are valued according to the broadest and most representative market. Certain equity securities are valued based upon fundamental characteristics or relationships to similar securities.
Investments inopen-end mutual funds are valued at the closing NAV.
The Fund has procedures to determine the fair value of financial instruments for which market prices are not reliable or readily available. Under these procedures, the Fund primarily employs a market-based approach which may use related or comparable assets or liabilities, recent transactions, market multiples, book values, and other relevant information for the investment to determine the fair value of the investment. An income-based valuation approach may also be used in which the anticipated future cash flows of the investment are discounted to calculate fair value. Discounts may also be applied due to the nature or duration of any restrictions on the disposition of the investments. Due to the inherent uncertainty of valuations of such investments, the fair values may differ significantly from the values that would have been used had an active market existed.
Trading in securities on foreign securities stock exchanges and OTC markets may be completed before 4 p.m. Eastern time. In addition, trading in certain foreign markets may not take place on every Fund’s business day. Occasionally, events occur between the time at which trading in a foreign security is completed and 4 p.m. Eastern time that might call into question the reliability of the value of a portfolio security held by the Fund. As a result, differences may arise between the value of the Fund’s portfolio securities as determined at the foreign market close and the latest indications of value at 4 p.m. Eastern time. In order to minimize the potential for these differences, the VC monitors price movements following the close of trading in foreign stock markets through a series of country specific market proxies (such as baskets of American Depositary Receipts, futures contracts and exchange traded funds). These price movements are measured against established trigger thresholds for each specific market proxy to assist in determining if an event has occurred that may call into question the reliability of the values of the foreign securities held by the Fund. If such an event occurs, the securities may be valued using fair value procedures, which may include the use of independent pricing services.
FRANKLIN TEMPLETON VARIABLE INSURANCE PRODUCTS TRUST
NOTES TO FINANCIAL STATEMENTS
FranklinSmall-Mid Cap Growth VIP Fund(continued)
1. Organization and Significant Accounting
Policies (continued)
a. Financial Instrument Valuation(continued)
When the last day of the reporting period is anon-business day, certain foreign markets may be open on those days that the Fund’s NAV is not calculated, which could result in differences between the value of the Fund’s portfolio securities on the last business day and the last calendar day of the reporting period. Any significant security valuation changes due to an open foreign market are adjusted and reflected by the Fund for financial reporting purposes.
b. Foreign Currency Translation
Portfolio securities and other assets and liabilities denominated in foreign currencies are translated into U.S. dollars based on the exchange rate of such currencies against U.S. dollars on the date of valuation. The Fund may enter into foreign currency exchange contracts to facilitate transactions denominated in a foreign currency. Purchases and sales of securities, income and expense items denominated in foreign currencies are translated into U.S. dollars at the exchange rate in effect on the transaction date. Portfolio securities and assets and liabilities denominated in foreign currencies contain risks that those currencies will decline in value relative to the U.S. dollar. Occasionally, events may impact the availability or reliability of foreign exchange rates used to convert the U.S. dollar equivalent value. If such an event occurs, the foreign exchange rate will be valued at fair value using procedures established and approved by the Board.
The Fund does not separately report the effect of changes in foreign exchange rates from changes in market prices on securities held. Such changes are included in net realized and unrealized gain or loss from investments in the Statement of Operations.
Realized foreign exchange gains or losses arise from sales of foreign currencies, currency gains or losses realized between the trade and settlement dates on securities transactions and the difference between the recorded amounts of dividends, interest, and foreign withholding taxes and the U.S. dollar equivalent of the amounts actually received or paid. Net unrealized foreign exchange gains and losses arise from changes in foreign exchange rates on foreign denominated assets and liabilities other than investments in securities held at the end of the reporting period.
c. Securities Lending
The Fund participates in an agency based securities lending program to earn additional income. The Fund receives cash collateral against the loaned securities in an amount equal to at least 102% of the fair value of the loaned securities. Collateral is maintained over the life of the loan in an amount not less than 100% of the fair value of loaned securities, as determined at the close of Fund business each day; any additional collateral required due to changes in security values is delivered to the Fund on the next business day. The collateral is deposited into a joint cash account with other funds and is used to invest in a money market fund managed by Franklin Advisers, Inc., an affiliate of the Fund. The Fund may receive income from the investment of cash collateral, in addition to lending fees and rebates paid by the borrower. Income from securities loaned, net of fees paid to the securities lending agent and/or third-party vendor, is reported separately in the Statement of Operations. The Fund bears the market risk with respect to the collateral investment, securities loaned, and the risk that the agent may default on its obligations to the Fund. If the borrower defaults on its obligation to return the securities loaned, the Fund has the right to repurchase the securities in the open market using the collateral received. The securities lending agent has agreed to indemnify the Fund in the event of default by a third party borrower. At December 31, 2018, the Fund had no securities on loan.
d. Income and Deferred Taxes
It is the Fund’s policy to qualify as a regulated investment company under the Internal Revenue Code. The Fund intends to distribute to shareholders substantially all of its taxable income and net realized gains to relieve it from federal income and if applicable, excise taxes. As a result, no provision for U.S. federal income taxes is required.
The Fund may be subject to foreign taxation related to income received, capital gains on the sale of securities and certain foreign currency transactions in the foreign jurisdictions in which it invests. Foreign taxes, if any, are recorded based on the tax regulations and rates that exist in the foreign markets in which the Fund invests. When a capital gain tax is determined to apply, the Fund records an estimated deferred tax liability in an amount that would be payable if the securities were disposed of on the valuation date.
FRANKLIN TEMPLETON VARIABLE INSURANCE PRODUCTS TRUST
NOTES TO FINANCIAL STATEMENTS
FranklinSmall-Mid Cap Growth VIP Fund(continued)
The Fund may recognize an income tax liability related to its uncertain tax positions under U.S. GAAP when the uncertain tax position has a less than 50% probability that it will be sustained upon examination by the tax authorities based on its technical merits. As of December 31, 2018, the Fund has determined that no tax liability is required in its financial statements related to uncertain tax positions for any open tax years (or expected to be taken in future tax years). Open tax years are those that remain subject to examination and are based on the statute of limitations in each jurisdiction in which the Fund invests.
e. Security Transactions, Investment Income, Expenses and Distributions
Security transactions are accounted for on trade date. Realized gains and losses on security transactions are determined on a specific identification basis. Estimated expenses are accrued daily. Dividend income is recorded on theex-dividend date except for certain dividends from securities where the dividend rate is not available. In such cases, the dividend is recorded as soon as the information is received by the Fund. Distributions to shareholders are recorded on theex-dividend date. Distributable earnings are determined according to income tax regulations (tax basis) and may differ from earnings recorded in accordance with U.S. GAAP. These differences may be permanent or temporary. Permanent differences are reclassified among capital accounts to reflect their tax character. These reclassifications have no impact on net assets or the results of operations. Temporary differences are not reclassified, as they may reverse in subsequent periods.*
Common expenses incurred by the Trust are allocated among the Funds based on the ratio of net assets of each Fund to the combined net assets of the Trust or based on the ratio of number
of shareholders of each Fund to the combined number of shareholders of the Trust. Fund specific expenses are charged directly to the Fund that incurred the expense.
Realized and unrealized gains and losses and net investment income, excluding class specific expenses, are allocated daily to each class of shares based upon the relative proportion of net assets of each class. Differences in per share distributions by class are generally due to differences in class specific expenses.
f. Accounting Estimates
The preparation of financial statements in accordance with U.S. GAAP requires management to make estimates and assumptions that affect the reported amounts of assets and liabilities at the date of the financial statements and the amounts of income and expenses during the reporting period. Actual results could differ from those estimates.
g. Guarantees and Indemnifications
Under the Trust’s organizational documents, its officers and trustees are indemnified by the Trust against certain liabilities arising out of the performance of their duties to the Trust. Additionally, in the normal course of business, the Trust, on behalf of the Fund, enters into contracts with service providers that contain general indemnification clauses. The Trust’s maximum exposure under these arrangements is unknown as this would involve future claims that may be made against the Trust that have not yet occurred. Currently, the Trust expects the risk of loss to be remote.
*Effective during the current reporting period, it is no longer required to present certain line items in the Statements of Changes in Net Assets. The below prior period amounts affected by this change are shown as they were in the prior year Statements of Changes in Net Assets.
For the year ended December 31, 2017, distributions to shareholders were as follows:
| | | | |
Distributions from net realized gains: | | | | |
Class 1 | | $ | (3,085,657 | ) |
Class 2 | | | (39,960,537 | ) |
Class 4 | | | (1,450,459 | ) |
For the year ended December 31, 2017, undistributed net investment income (loss) included in net assets was $0.
FRANKLIN TEMPLETON VARIABLE INSURANCE PRODUCTS TRUST
NOTES TO FINANCIAL STATEMENTS
FranklinSmall-Mid Cap Growth VIP Fund(continued)
2. Shares of Beneficial Interest
At December 31, 2018, there were an unlimited number of shares authorized (without par value). Transactions in the Fund’s shares were as follows:
| | | | | | | | | | | | | | | | | | | | |
| |
| | | Year Ended December 31, | |
| | | |
| | | 2018 | | | | | | 2017 | |
| | | | | |
| | | Shares | | | Amount | | | | | | Shares | | | Amount | |
| | | | | |
| Class 1 Shares: | | | | | | | | | | | | | | | | | | | | |
Shares sold | | | 148,944 | | | $ | 2,929,602 | | | | | | | | 111,735 | | | $ | 2,131,300 | |
Shares issued in reinvestment of distributions | | | 179,278 | | | | 3,540,738 | | | | | | | | 170,856 | | | | 3,085,657 | |
Shares redeemed | | | (231,919 | ) | | | (4,503,558 | ) | | | | | | | (198,990 | ) | | | (3,774,012 | ) |
| | | | |
Net increase (decrease) | | | 96,303 | | | $ | 1,966,782 | | | | | | | | 83,601 | | | $ | 1,442,945 | |
| | | | |
| Class 2 Shares: | | | | | | | | | | | | | | | | | | | | |
Shares sold | | | 706,305 | | | $ | 12,308,866 | | | | | | | | 683,937 | | | $ | 11,660,672 | |
Shares issued in reinvestment of distributions | | | 2,236,778 | | | | 39,501,499 | | | | | | | | 2,442,575 | | | | 39,960,537 | |
Shares redeemed | | | (4,433,380 | ) | | | (77,474,429 | ) | | | | | | | (5,392,842 | ) | | | (93,499,908 | ) |
| | | | |
Net increase (decrease) | | | (1,490,297 | ) | | $ | (25,664,064 | ) | | | | | | | (2,266,330 | ) | | $ | (41,878,699 | ) |
| | | | |
| Class 4 Shares: | | | | | | | | | | | | | | | | | | | | |
Shares sold | | | 136,649 | | | $ | 2,474,956 | | | | | | | | 145,506 | | | $ | 2,584,438 | |
Shares issued in reinvestment of distributions | | | 82,695 | | | | 1,517,449 | | | | | | | | 85,574 | | | | 1,450,459 | |
Shares redeemed | | | (205,969 | ) | | | (3,816,443 | ) | | | | | | | (196,455 | ) | | | (3,482,389 | ) |
| | | | |
Net increase (decrease) | | | 13,375 | | | $ | 175,962 | | | | | | | | 34,625 | | | $ | 552,508 | |
| | | | |
3. Transactions with Affiliates
Franklin Resources, Inc. is the holding company for various subsidiaries that together are referred to as Franklin Templeton. Certain officers and trustees of the Fund are also officers and/or directors of the following subsidiaries:
| | |
| |
| Subsidiary | | Affiliation |
Franklin Advisers, Inc. (Advisers) | | Investment manager |
Franklin Templeton Services, LLC (FT Services) | | Administrative manager |
Franklin Templeton Distributors, Inc. (Distributors) | | Principal underwriter |
Franklin Templeton Investor Services, LLC (Investor Services) | | Transfer agent |
FRANKLIN TEMPLETON VARIABLE INSURANCE PRODUCTS TRUST
NOTES TO FINANCIAL STATEMENTS
FranklinSmall-Mid Cap Growth VIP Fund(continued)
a. Management Fees
The Fund pays an investment management fee to Advisers based on the average daily net assets of the Fund as follows:
| | |
| |
| Annualized Fee Rate | | Net Assets |
0.800% | | Up to and including $500 million |
0.700% | | Over $500 million, up to and including $1 billion |
0.650% | | Over $1 billion, up to and including $1.5 billion |
0.600% | | Over $1.5 billion, up to and including $6.5 billion |
0.575% | | Over $6.5 billion, up to and including $11.5 billion |
0.550% | | Over $11.5 billion, up to and including $16.5 billion |
0.540% | | Over $16.5 billion, up to and including $19 billion |
0.530% | | Over $19 billion, up to and including $21.5 billion |
0.520% | | In excess of $21.5 billion |
b. Administrative Fees
Under an agreement with Advisers, FT Services provides administrative services to the Fund. The fee is paid by Advisers based on the Fund’s average daily net assets, and is not an additional expense of the Fund.
c. Distribution Fees
The Board has adopted distribution plans for Class 2 and Class 4 shares pursuant to Rule12b-1 under the 1940 Act. Under the Fund’s compensation distribution plans, the Fund pays Distributors for costs incurred in connection with the servicing, sale and distribution of the Fund’s shares up to 0.35% per year of its average daily net assets of each class. The Board has agreed to limit the current rate to 0.25% per year for Class 2. The plan year, for purposes of monitoring compliance with the maximum annual plan rates, is February 1 through January 31.
d. Transfer Agent Fees
Investor Services, under terms of an agreement, performs shareholder servicing for the Fund and is not paid by the Fund for the services.
e. Investments in Affiliated Management Investment Companies
The Fund invests in one or more affiliated management investment companies for purposes other than exercising a controlling influence over the management or policies. Management fees paid by the Fund are waived on assets invested in the affiliated management investment companies, as noted in the Statement of Operations, in an amount not to exceed the management and administrative fees paid directly or indirectly by each affiliate. During the year ended December 31, 2018, the Fund held investments in affiliated management investment companies as follows:
FRANKLIN TEMPLETON VARIABLE INSURANCE PRODUCTS TRUST
NOTES TO FINANCIAL STATEMENTS
FranklinSmall-Mid Cap Growth VIP Fund(continued)
3. Transactions with Affiliates(continued)
e. Investments in Affiliated Management Investment Companies(continued)
| | | | | | | | | | | | | | | | | | | | | | | | | | | | | | | | |
| | | | | | | | |
| | | Number
of Shares
Held at
Beginning
of Year | | | Gross
Additions | | | Gross
Reductions | | | Number of Shares
Held at End of Year | | | Value at End of Year | | | Investment Income | | | Realized
Gain
(Loss) | | | Net Change in
Unrealized
Appreciation
(Depreciation) | |
| Non-Controlled Affiliates | | | | | | | | | | | | | | | | | | | | | | | | | | | | | | | | |
| | | | | | | | | | | | | | | | | | | | | | | Dividends | | | | | | | | | |
| | | | | | | | | | | | | | | | | | | | | | | | | | | | | | | | |
Institutional Fiduciary Trust Money Market Portfolio, 1.99% | | | 7,874,860 | | | | 93,153,570 | | | | (88,942,512 | ) | | | 12,085,918 | | | $ | 12,085,918 | | | $ | 153,752 | | | $ | — | | | $ | — | |
| | | | | | | | | | | | | | | | | | | | | |
| Income
from
securities
loaned |
| | | | | | | | |
| | | | | | | | | | | | | | | | | | | | | | | | | | | | | | | | |
Institutional Fiduciary Trust Money Market Portfolio, 1.99% | | | 7,817,025 | | | | 66,449,782 | | | | (74,266,807 | ) | | | — | | | | — | | | | 46,844 | | | | — | | | | — | |
| | | | | | | | | | | | | | | | | | | | |
Total Affiliated Securities | | | | | | | | | | | | | | | | | | $ | 12,085,918 | | | $ | 200,596 | | | $ | — | | | $ | — | |
| | | | | | | | | | | | | | | | | | | | |
f. Interfund Transactions
The Fund engaged in purchases and sales of investments with funds or other accounts that have common investment managers (or affiliated investment managers), directors, trustees or officers. During the year ended December 31, 2018, these purchase and sale transactions aggregated $0 and $55,780, respectively.
4. Expense Offset Arrangement
The Fund has entered into an arrangement with its custodian whereby credits realized as a result of uninvested cash balances are used to reduce a portion of the Fund’s custodian expenses. During the year ended December 31, 2018, the custodian fees were reduced as noted in the Statements of Operations.
5. Income Taxes
The tax character of distributions paid during the years ended December 31, 2018 and 2017, was as follows:
| | | | | | | | |
| | |
| | | 2018 | | | 2017 | |
Distributions paid from: | | | | | | | | |
Ordinary income | | $ | 4,739,598 | | | $ | — | |
Long term capital gain | | | 39,820,088 | | | | 44,496,653 | |
| | | | |
| | $ | 44,559,686 | | | $ | 44,496,653 | |
| | | | |
FRANKLIN TEMPLETON VARIABLE INSURANCE PRODUCTS TRUST
NOTES TO FINANCIAL STATEMENTS
FranklinSmall-Mid Cap Growth VIP Fund(continued)
At December 31, 2018, the cost of investments, net unrealized appreciation (depreciation), undistributed ordinary income and undistributed long term capital gains for income tax purposes were as follows:
| | | | |
Cost of investments | | $ | 296,965,585 | |
| | | | |
Unrealized appreciation | | $ | 79,740,004 | |
Unrealized depreciation | | | (17,749,287 | ) |
| | | | |
Net unrealized appreciation (depreciation) | | $ | 61,990,717 | |
| | | | |
Distributable earnings: | | | | |
Undistributed long term capital gains | | $ | 59,107,611 | |
| | | | |
Differences between income and/or capital gains as determined on a book basis and a tax basis are primarily due to differing treatment of wash sales.
6. Investment Transactions
Purchases and sales of investments (excluding short term securities) for the year ended December 31, 2018, aggregated $188,716,179 and $262,246,644, respectively.
7. Restricted Securities
The Fund invests in securities that are restricted under the Securities Act of 1933 (1933 Act). Restricted securities are often purchased in private placement transactions, and cannot be sold without prior registration unless the sale is pursuant to an exemption under the 1933 Act. Disposal of these securities may require greater effort and expense, and prompt sale at an acceptable price may be difficult. The Fund may have registration rights for restricted securities. The issuer generally incurs all registration costs.
At December 31, 2018, investments in restricted securities, excluding securities exempt from registration under the 1933 Act deemed to be liquid, were as follows:
| | | | | | | | | | | | | | |
| | | | |
| Shares | | Issuer | | Acquisition
Date | | | Cost | | | Value | |
| 96,296 | | Bill.com, pfd., 144A, H | | | 12/21/18 | | | $ | 799,998 | | | $ | 799,998 | |
| 733,541 | | DraftKings Inc | | | 8/07/15 | | | | 2,800,003 | | | | 1,870,090 | |
| | | | | | | | | | |
| | Total Restricted Securities(Value is 0.7% of Net Assets) | | | | | | $ | 3,600,001 | | | $ | 2,670,088 | |
| | | | | | | | | | |
8. Credit Facility
The Fund, together with other U.S. registered and foreign investment funds (collectively, Borrowers), managed by Franklin Templeton, are borrowers in a joint syndicated senior unsecured credit facility totaling $2 billion (Global Credit Facility) which matured on February 8, 2019. This Global Credit Facility provides a source of funds to the Borrowers for temporary and emergency purposes, including the ability to meet future unanticipated or unusually large redemption requests. Effective February 8, 2019, the Borrowers renewed the Global Credit Facility for a one year term, maturing February 7, 2020, for a total of $2 billion.
Under the terms of the Global Credit Facility, the Fund shall, in addition to interest charged on any borrowings made by the Fund and other costs incurred by the Fund, pay its share of fees and expenses incurred in connection with the implementation and maintenance of the Global Credit Facility, based upon its relative share of the aggregate net assets of all of the Borrowers, including an annual commitment fee of 0.15% based upon the unused portion of the Global Credit Facility. These fees are reflected in other expenses in the Statement of Operations. During the year ended December 31, 2018, the Fund did not use the Global Credit Facility.
FRANKLIN TEMPLETON VARIABLE INSURANCE PRODUCTS TRUST
NOTES TO FINANCIAL STATEMENTS
FranklinSmall-Mid Cap Growth VIP Fund(continued)
9. Fair Value Measurements
The Fund follows a fair value hierarchy that distinguishes between market data obtained from independent sources (observable inputs) and the Fund’s own market assumptions (unobservable inputs). These inputs are used in determining the value of the Fund’s financial instruments and are summarized in the following fair value hierarchy:
| | • | | Level 1 – quoted prices in active markets for identical financial instruments |
| | • | | Level 2 – other significant observable inputs (including quoted prices for similar financial instruments, interest rates, prepayment speed, credit risk, etc.) |
| | • | | Level 3 – significant unobservable inputs (including the Fund’s own assumptions in determining the fair value of financial instruments) |
The input levels are not necessarily an indication of the risk or liquidity associated with financial instruments at that level.
A summary of inputs used as of December 31, 2018, in valuing the Fund’s assets carried at fair value, is as follows:
| | | | | | | | | | | | | | | | |
| | | | |
| | | Level 1 | | | Level 2 | | | Level 3 | | | Total | |
| Assets: | | | | | | | | | | | | | | | | |
Investments in Securities:a | | | | | | | | | | | | | | | | |
Equity Investments:b | | | | | | | | | | | | | | | | |
Consumer Discretionary | | $ | 48,676,662 | | | $ | — | | | $ | 1,870,090 | | | $ | 50,546,752 | |
Financials | | | 29,903,485 | | | | — | | | | 799,998 | | | | 30,703,483 | |
All Other Equity Investments | | | 265,620,149 | | | | — | | | | — | | | | 265,620,149 | |
Short Term Investments | | | 12,085,918 | | | | — | | | | — | | | | 12,085,918 | |
| | | | |
Total Investments in Securities | | $ | 356,286,214 | | | $ | — | | | $ | 2,670,088 | | | $ | 358,956,302 | |
| | | | |
aFor detailed categories, see the accompanying Statement of Investments.
bIncludes common and preferred stocks.
A reconciliation of assets in which Level 3 inputs are used in determining fair value is presented when there are significant Level 3 financial instruments at the beginning and/or end of the year.
10. Subsequent Events
The Fund has evaluated subsequent events through the issuance of the financial statements and determined that no events have occurred that require disclosure other than those already disclosed in the financial statements.
FRANKLIN TEMPLETON VARIABLE INSURANCE PRODUCTS TRUST
Report of Independent Registered Public Accounting Firm
To the Board of Trustees of Franklin Templeton Variable Insurance Products Trust and Shareholders of FranklinSmall-Mid Cap Growth VIP Fund
Opinion on the Financial Statements
We have audited the accompanying statement of assets and liabilities, including the statement of investments, of FranklinSmall-Mid Cap Growth VIP Fund (the “Fund”) as of December 31, 2018, the related statement of operations for the year ended December 31, 2018, the statement of changes in net assets for each of the two years in the period ended December 31, 2018, including the related notes, and the financial highlights for each of the five years in the period ended December 31, 2018 (collectively referred to as the “financial statements”). In our opinion, the financial statements present fairly, in all material respects, the financial position of the Fund as of December 31, 2018, the results of its operations for the year then ended, the changes in its net assets for each of the two years in the period ended December 31, 2018 and the financial highlights for each of the five years in the period ended December 31, 2018 in conformity with accounting principles generally accepted in the United States of America.
Basis for Opinion
These financial statements are the responsibility of the Fund’s management. Our responsibility is to express an opinion on the Fund’s financial statements based on our audits. We are a public accounting firm registered with the Public Company Accounting Oversight Board (United States) (PCAOB) and are required to be independent with respect to the Fund in accordance with the U.S. federal securities laws and the applicable rules and regulations of the Securities and Exchange Commission and the PCAOB.
We conducted our audits of these financial statements in accordance with the standards of the PCAOB. Those standards require that we plan and perform the audit to obtain reasonable assurance about whether the financial statements are free of material misstatement, whether due to error or fraud.
Our audits included performing procedures to assess the risks of material misstatement of the financial statements, whether due to error or fraud, and performing procedures that respond to those risks. Such procedures included examining, on a test basis, evidence regarding the amounts and disclosures in the financial statements. Our audits also included evaluating the accounting principles used and significant estimates made by management, as well as evaluating the overall presentation of the financial statements. Our procedures included confirmation of securities owned as of December 31, 2018 by correspondence with the custodian, transfer agent and brokers; when replies were not received from brokers, we performed other auditing procedures. We believe that our audits provide a reasonable basis for our opinion.
PricewaterhouseCoopers LLP
San Francisco, California
February 15, 2019
We have served as the auditor of one or more investment companies in the Franklin Templeton Group of Funds since 1948.
FRANKLIN TEMPLETON VARIABLE INSURANCE PRODUCTS TRUST
Tax Information (unaudited)
FranklinSmall-Mid Cap Growth VIP Fund
Under Section 852(b)(3)(C) of the Internal Revenue Code, the Fund hereby reports the maximum amount allowable but no less than $39,820,088 as a long term capital gain dividend for the fiscal year ended December 31, 2018.
Under Section 854(b)(1)(A) of the Internal Revenue Code, the Fund hereby reports 49.65% of the ordinary income dividends as income qualifying for the dividends received deduction for the fiscal year ended December 31, 2018.
Franklin Strategic Income VIP Fund
This annual report for Franklin Strategic Income VIP Fund covers the fiscal year ended
December 31, 2018.
Class 1 Performance Summary as of December 31, 2018
Average annual total return of Class 1 shares* represents the average annual change in value, assuming reinvestment of dividends and capital gains. Average returns smooth out variations in returns, which can be significant; they are not the same asyear-by-year results.
| | | | | | | | | | | | |
| | | |
| Periods ended 12/31/18 | | 1-Year | | | 5-Year | | | 10-Year | |
Average Annual Total Return | | | -1.91%** | | | | +1.82% | | | | +6.33% | |
*The Fund has a fee waiver associated with any investment it makes in a Franklin Templeton money fund and/or other Franklin Templeton fund, contractually guaranteed through 4/30/19. Fund investment results reflect the fee waiver; without this waiver, the results would have been lower.
**Total return information is based on asset values calculated for shareholder transactions. Certain adjustments were made to the net assets of the Fund at 12/31/17 for financial reporting purposes, and as a result, the total returns based on those net asset values differ from the adjusted total returns reported in the Financial Highlights.
Performance reflects the Fund’s Class 1 operating expenses, but doesnotinclude any contract fees, expenses or sales charges. If they had been included, performance would be lower. These charges and deductions, particularly for variable life policies, can have a significant effect on contract values and insurance benefits. See the contract prospectus for a complete description of these expenses, including sales charges.
Performance data represent past performance, which does not guarantee future results. Investment return and principal value will fluctuate, and you may have a gain or loss when you sell your shares. Current performance may differ from figures shown.
Total Return Index Comparison for a Hypothetical $10,000 Investment (1/1/09–12/31/18)
The graph below shows the change in value of a hypothetical $10,000 investment in the Fund over the indicated period and includes reinvestment of any income or distributions. The Fund’s performance* is compared to the performance of the Bloomberg Barclays U.S. Aggregate Bond Index and the Lipper Multi-Sector Income Funds Classification Average. One cannot invest directly in an index, and an index is not representative of the Fund’s portfolio.Please see Important Notes to Performance Information precedingthe Fund Summaries.
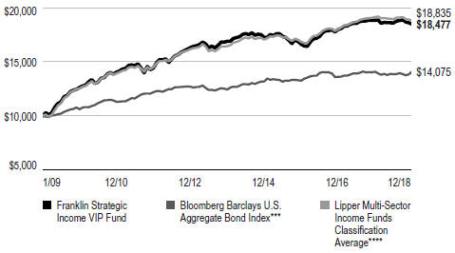
***Source: Morningstar. Please see Index Descriptions following the Fund Summaries.
****Source: Lipper, a Thomson Reuters Company. Please see Index Descriptions following the Fund Summaries.
FRANKLIN STRATEGIC INCOME VIP FUND
Fund Goal and Main Investments
The Fund seeks a high level of current income, with capital appreciation over the long term as a secondary goal. Under normal market conditions, the Fund invests primarily to predominantly in U.S. and foreign debt securities, including those in emerging markets.
Fund Risks
All investments involve risks, including possible loss of principal. Bond prices generally move in the opposite direction of interest rates. Thus, as prices of bonds in the Fund adjust to a rise in interest rates, the Fund’s share price may decline. Changes in the financial strength of a bond issuer or in a bond’s credit rating may affect its value. High yields reflect the higher credit risks associated with certain lower rated securities held in the portfolio. Floating rate loans and high yield corporate bonds are rated below investment grade and are subject to greater risk of default, which could result in loss of principal—a risk that may be heightened in a slowing economy. The risks of foreign securities include currency fluctuations and political uncertainty. Investments in developing markets involve heightened risks related to the same factors, in addition to those associated with their relatively small size and lesser liquidity. Investing in derivative securities and the use of foreign currency techniques involve special risks as such may not achieve the anticipated benefits and/or may result in losses to the Fund. The Fund is actively managed but there is no guarantee that the manager’s investment decisions will produce the desired results. The Fund’s prospectus also includes a description of the main investment risks.
Performance Overview
You can find the Fund’sone-year total return in the Performance Summary. For comparison, the Fund’s benchmark, the Bloomberg Barclays U.S. Aggregate Index, posted a +0.01% total return for the period under review.1 The Fund’s peers, as measured by the Lipper Multi-Sector Income Funds Classification Average, had a-1.60% return.2
Economic and Market Overview
The U.S. economy grew during the 12 months under review. After moderating for three consecutive quarters, the economy
grew faster in 2018’s second quarter, driven by consumer spending, business investment, exports and government spending. However, growth moderated in the third quarter due to declines in exports and housing investment. The manufacturing and services sectors expanded during the period. The unemployment rate declined from 4.1% in December 2017 to 3.9% atperiod-end.3 Annual inflation, as measured by the Consumer Price Index, decreased from 2.1% in December 2017 to 1.9% atperiod-end.3
The U.S. Federal Reserve (Fed) raised its target range for the federal funds rate four times during the period, to 2.25%–2.50%, and continued to reduce its balance sheet as part of its ongoing plan to normalize monetary policy. At its December meeting, the Fed reduced the projected 2019 rate increases to two, compared to three projected previously.
The10-year Treasury yield, which moves inversely to its price, increased during the period. The yield rose to multi-year highs several times in 2018 amid investor concerns about higher inflation and the Fed’s interest-rate path. Expectations that other central banks might scale back monetary stimulus and better-than-expected U.S. economic reports also pushed the yield higher. However, some factors weighed on the Treasury yield at certain points during the period, including concerns about political turmoil in Italy, political uncertainties in the U.S., tensions between the U.S. and North Korea, the Trump administration’s protectionist trade policies, U.S. trade disputes with its allies and China, economic turmoil in Turkey and Argentina, slowing global economic growth and expectations the Fed would slow its pace of rate increases. Overall, the10-year Treasury yield rose from 2.40% at the beginning of the period to 2.69% atperiod-end.
Investment Strategy
We allocate our investments among the various types of debt available based on our assessment of changing economic, global market, industry and issuer conditions. We use atop-down analysis of macroeconomic trends, combined with abottom-up fundamental analysis of market sectors, industries and issuers, seeking to take advantage of varying sector reactions to economic events. For example, we may evaluate business cycles, yield curves, country risk, and the relative
1. Source: Morningstar.
2. Source: Lipper, a Thomson Reuters Company.
One cannot invest directly in an index, and an index is not representative of the Fund’s portfolio. Please see Index Descriptions following the Fund Summaries.
3. Source: Bureau of Labor Statistics.
The dollar value, number of shares or principal amount, and names of all portfolio holdings are listed in the Fund’s Statement of Investments (SOI).
FRANKLIN STRATEGIC INCOME VIP FUND
interest rates among currencies, and values between and within markets. In selecting debt securities, we generally conduct our own analysis of the security’s intrinsic value rather than simply relying on the coupon rate or rating. We may also enter into various transactions involving certain currency-, interestrate-or credit-related derivative instruments.
What is the yield curve?
A yield curve is a line that plots the yield to maturity of bonds having equal credit quality against their maturity dates.
Manager’s Discussion
The Fund allocated assets across the broad fixed income markets. During the period, we maintained large allocations to spread sectors, primarily in high-yield corporate credit, with smaller exposures to senior secured floating rate loans and investment-grade corporate bonds. The Fund also held positions in agency mortgage-backed securities (MBS) and collateralized loan obligations (CLOs). Additionally, the Fund sought to maintain a relatively defensive positioning to U.S. interest rates.
The Fund’s U.S. dollar yield curve positioning was the most significant contributor to performance. The Fund’snon-dollar yield curve positioning boosted returns as well.
In contrast, exposure across corporate credit detracted from performance, including our positions in high-yield corporate credit, investment-grade corporate bonds, senior secured loans and CLOs. Additionally fixed-rate agency MBS and our foreign currency exposure weighed on performance.
The Fund utilized derivatives, including credit default swaps, currency forwards and government bond futures, primarily as a tool for efficient portfolio management and to manage overall portfolio risk. These derivative transactions may provide the same, or similar, net long or short exposure to select currencies, interest rates, countries, duration or credit risks compared to holding securities.
What is a currency forward?
A currency forward is a direct agreement between the Fund and a counterparty to buy or sell a foreign currency in exchange for another currency at a specific exchange rate on a future date.
| | | | | | | | |
| Portfolio Composition* | |
| Based on Consolidated Net Assets | |
| | |
| | | 12/31/18 | | | 12/31/17 | |
| High-Yield Corporate Bonds | | | 25.55% | | | | 29.80% | |
| Floating Rate Loans | | | 19.66% | | | | 16.10% | |
| Investment-Grade Corporate Bonds | | | 15.30% | | | | 17.60% | |
| Agency Mortgage-Backed Securities | | | 10.61% | | | | 9.90% | |
| Collateralized Loan Obligations | | | 8.97% | | | | 4.00% | |
| Residential Mortgage-Backed Securities | | | 8.06% | | | | 3.10% | |
| International Government & Agency Bonds | | | 5.50% | | | | 9.07% | |
| Commercial Mortgage-Backed Securities | | | 2.45% | | | | 2.40% | |
| Treasury Inflation-Protected Securities | | | 2.24% | | | | 2.80% | |
| Asset-Backed Securities | | | 1.86% | | | | 2.10% | |
| U.S. Treasury Securities | | | 1.84% | | | | 4.10% | |
| Municipal Bonds | | | 1.35% | | | | 0.90% | |
| Other | | | 0.62% | | | | 0.90% | |
| Covered Bonds | | | 0.13% | | | | 0.00% | |
| Short-Term Investments & Other Net Assets | | | -4.14% | | | | -2.80% | |
*Figures reflect certain derivatives held in the portfolio (or their underlying reference assets) and may not total 100% or may be negative due to rounding, use of any derivatives, unsettled trades or other factors. The composition may not match the Statement of Investments (SOI).
What is a credit derivative?
A credit derivative is a contract agreement between the Fund and a counterparty that is principally used by the Fund to gain or increase exposure to certain financial assets and/or to hedge against credit risk.
What is meant by “hedge”?
To hedge an investment is to take a position intended to offset potential losses/gains that may be incurred by a companion financial instrument.
Thank you for your participation in Franklin Strategic Income VIP Fund. We look forward to serving your future investment needs.
FRANKLIN STRATEGIC INCOME VIP FUND
The foregoing information reflects our analysis, opinions and portfolio holdings as of December 31, 2018, the end of the reporting period. The way we implement our main investment strategies and the resulting portfolio holdings may change depending on factors such as market and economic conditions. These opinions may not be relied upon as investment advice or an offer for a particular security. The information is not a complete analysis of every aspect of any market, country, industry, security or the Fund. Statements of fact are from sources considered reliable, but the investment manager makes no representation or warranty as to their completeness or accuracy. Although historical performance is no guarantee of future results, these insights may help you understand our investment management philosophy.
FRANKLIN STRATEGIC INCOME VIP FUND
Class 1 Fund Expenses
As an investor in a variable insurance contract (Contract) that indirectly provides for investment in an underlying mutual fund, you can incur transaction and/or ongoing expenses at both the Fund level and the Contract Level: (1) transaction expenses can include sales charges (loads) on purchases, surrender fees, transfer fees and premium taxes; and (2) ongoing expenses can include management fees, distribution and service(12b-1) fees, contract fees, annual maintenance fees, mortality and expense risk fees and other fees and expenses. All mutual funds and Contracts have some types of ongoing expenses. The table below shows Fund-level ongoing expenses and can help you understand these costs and compare them with those of other mutual funds offered through the Contract. The table assumes a $1,000 investment held for the six months indicated. Please refer to the Fund prospectus for additional information on operating expenses.
Actual Fund Expenses
The table below provides information about the actual account values and actual expenses in the columns under the heading “Actual.” In these columns the Fund’s actual return, which includes the effect of ongoing Fund expenses but does not include the effect of ongoing Contract expenses, is used to calculate the “Ending Account Value.” You can estimate the Fund-level expenses you paid during the period by following these steps (ofcourse, your account value and expenses will differ from those in this illustration):Divide your account value by $1,000 (ifyour account had an $8,600 value, then $8,600 ÷ $1,000 = 8.6). Then multiply the result by the number under the headings “Actual” and “Fund-Level Expenses Paid During Period” (ifFund-Level Expenses Paid During Period were $ 7.50, then 8.6x $7.50 = $64.50). In this illustration, the estimated expenses paid this period at the Fund level are $64.50.
Hypothetical Example for Comparison
with Other Mutual Funds
Under the heading “Hypothetical” in the table, information is provided about hypothetical account values and hypothetical expenses based on the Fund’s actual expense ratio and an assumed rate of return of 5% per year before expenses, which is not the Fund’s actual return. This information may not be used to estimate the actual ending account balance or expenses you paid for the period, but it can help you compare ongoing costs of investing in the Fund with those of other mutual funds offered through the Contract. To do so, compare this 5% hypothetical example with the 5% hypothetical examples that appear in the shareholder reports of other funds offered through the Contract.
Please note that expenses shown in the table are meant to highlight ongoing costs at the Fund level only and do not reflect any ongoing expenses at the Contract level, or transaction expenses at either the Fund or Contract levels. In addition, while the Fund does not have transaction expenses, if the transaction and ongoing expenses at the Contract level were included, the expenses shown below would be higher. You should consult your Contract prospectus or disclosure document for more information.
| | | | | | | | | | | | | | | | | | | | | | | | | | | | |
| | | | | |
| | | | | | Actual (actual return after expenses) | | | | | | Hypothetical
(5% annual return before expenses) | | | | |
| | | | | | | |
Share
Class | | Beginning Account
Value 7/1/18 | | | Ending Account
Value 12/31/18 | | | Fund-Level Expenses
Paid During Period
7/1/18–12/31/18 1,2 | | | | | | Ending Account
Value 12/31/18 | | | Fund-Level Expenses
Paid During Period
7/1/18–12/31/18 1,2 | | | Net
Annualized
Expense
Ratio 2 | |
Class 1 | | | $1,000 | | | | $994.40 | | | | $3.22 | | | | | | | | $1,021.98 | | | | $3.26 | | | | 0.64% | |
1. Expenses are equal to the annualized expense ratio for thesix-month period as indicated above—in the far right column—multiplied by the simple average account value over the period indicated, and then multiplied by 184/365 to reflect theone-half year period.
2. Reflects expenses after fee waivers and expense reimbursements. Does not include any ongoing expenses of the Contract for which the Fund is an investment option or acquired fund fees and expenses.
FSI P1 09/18
SUPPLEMENT DATED SEPTEMBER 4, 2018
TO THE PROSPECTUS DATED MAY 1, 2018
OF
FRANKLIN STRATEGIC INCOME VIP FUND
(a series of Franklin Templeton Variable Insurance Products Trust)
The prospectus is amended as follows:
I. The following is added to the “Fund Summaries – Franklin Strategic Income VIP Fund – Principal Investment Strategies” section of the prospectus:
The Fund may invest a small portion of its assets in marketplace loans to consumers and small andmid-sized enterprises or companies (SMEs) originated through online lending platforms.
II. The following is added to the “Fund Summaries – Franklin Strategic Income VIP Fund – Principal Risks” section of the prospectus:
Marketplace Loans Marketplace loans are subject to the risks associated with debt investments generally, including but not limited to, interest rate, credit, liquidity, high yield debt, market and income risks. Marketplace loans generally are not rated by rating agencies, are often unsecured, and are highly risky and speculative investments. Lenders and investors, such as the Fund, assume all of the credit risk on the loans they fund or purchase and there are no assurances that payments due on underlying loans will be made. In addition, investments in marketplace loans may be adversely affected if the platform operator or a third-party service provider becomes unable or unwilling to fulfill its obligations in servicing the loans. Moreover, the Fund may have limited information about the underlying marketplace loans and information provided to the platform regarding the loans and the borrowers’ credit information may be incomplete, inaccurate or outdated. It also may be difficult for the Fund to sell an investment in a marketplace loan before maturity at the price at which the Fund believes the loan should be valued because these loans typically are considered by the Fund to be illiquid securities.
III. The following is added to the “Fund Details – Franklin Strategic Income VIP Fund – Principal Investment Policies and Practices” section of the prospectus:
The Fund may invest a small portion of its assets in marketplace loans to consumers and small andmid-sized enterprises or companies (SMEs). Marketplace loans are loans that are originated through online lending platforms that match consumers, SMEs, and other borrowers seeking loans with investors willing to provide the funding for such loans. These borrowers may seek such loans for a variety of different purposes (e.g., loans for education, loans to fund elective medical procedures or loans for franchise financing). The yield to the lender on a marketplace loan is the fixed interest rate assigned by the platform to the loan net of any fees charged by the platform, including servicing fees, which cover the costs of services such as screening borrowers for their eligibility, managing the supply and demand of the marketplace, and facilitating payments and debt collection, among other things.
IV. The following is added to the “Fund Details – Franklin Strategic Income VIP Fund – Principal Risks” section of the prospectus:
Marketplace Loans
Marketplace Loans are subject to the risks associated with debt investments generally, including but not limited to, interest rate, credit, liquidity, high yield debt, market and income risks. Marketplace loans generally are not rated by rating agencies, are often unsecured, and are highly risky and speculative investments. Lenders and investors, such as the Fund, assume all of the credit risk on the loans they fund or purchase and there are no assurances that payments due on underlying loans will be made. The Fund may not have direct recourse against the borrower or may be otherwise limited in its ability to enforce its rights with respect to its investment in marketplace loans, particularly in the case of unsecured loans. In addition, lenders and investors are not entitled to recover any deficiency of principal or interest from the platform operator if the underlying borrower defaults on its payments due with respect to a loan. Investments in marketplace loans may be adversely affected if the platform operator or a third-party service provider becomes unable or unwilling to fulfill its obligations in servicing the loans. Moreover, the Fund may have limited information about the underlying marketplace loans and the information provided
to the platform regarding the loans and borrowers’ credit information may be incomplete, inaccurate or outdated. Additionally, the terms of certain loans may not restrict the borrowers from incurring additional debt. If a borrower incurs additional debt after obtaining a loan through a platform, the additional debt may adversely affect the borrower’s creditworthiness generally, and could result in the financial distress, insolvency or bankruptcy of the borrower. To the extent borrowers incur other indebtedness that is secured, such as a mortgage, the ability of the secured creditors to exercise collection remedies against the assets of that borrower may impair the borrower’s ability to repay its marketplace loan or it may impair the platform’s ability to collect on the marketplace loan upon default. When a marketplace loan is unsecured, borrowers may choose to repay other loans before repaying a loan facilitated through a platform because the borrowers have no collateral at risk. The Fund will not be made aware of any additional debt incurred by a borrower or whether such debt is secured, which could allow other creditors to move more quickly to claim assets of the borrower. Furthermore, U.S. based marketplace lending platforms are subject to extensive regulation, which could impair the enforcement of marketplace loans, among other things.
Finally, marketplace loans are not listed on any securities exchange and an active secondary market for such loans does not currently exist and may not develop in the future. It may be difficult for the Fund to sell an investment in a loan before its maturity at the price at which the Fund believes the loan should be valued. The Fund typically considers its investments in marketplace loans to be illiquid for purposes of its limitation on illiquid investments.
Please keep this supplement with your prospectus for future reference.
FSI P2 10/18
SUPPLEMENT DATED OCTOBER 30, 2018
TO THE PROSPECTUSES
DATED MAY 1, 2018
OF
FRANKLIN STRATEGIC INCOME VIP FUND
(A series of Franklin Templeton Variable Insurance Products Trust)
The prospectuses are amended as follows:
I. The following is added to the “Franklin Strategic Income VIP Fund – Fund Summaries – Principal Investment Strategies” section of the prospectuses:
The Fund may invest significantly in complex fixed income securities, such as collateralized debt obligations (“CDOs”), which are generally types of asset-backed securities
II. The following is added to the “Franklin Strategic Income VIP Fund – Fund Summaries – Principal Risks” section of the prospectuses:
Collateralized Debt Obligations (CDOs) The risks of an investment in a CDO, a type of asset backed security, depend largely on the type of collateral held by the special purpose entity (SPE) and the tranche of the CDO in which the Fund invests. CDOs may be deemed to be illiquid securities and subject to the Fund’s restrictions on investments in illiquid securities. In addition to the normal risks associated with debt securities and asset backed securities (e.g., interest rate risk, credit risk and default risk), CDOs carry additional risks including, but not limited to: (i) the possibility that distributions from collateral securities will not be adequate to make interest or other payments; (ii) the quality of the collateral may decline in value or quality or go into default or be downgraded; (iii) the Fund may invest in tranches of a CDO that are subordinate to other classes; and (iv) the complex structure of the security may not be fully understood at the time of investment.
Please keep this supplement with your prospectus for future reference.
FSI P3 12/18
SUPPLEMENT DATED DECEMBER 3, 2018
TO THE PROSPECTUSES
DATED MAY 1, 2018
OF
FRANKLIN STRATEGIC INCOME VIP FUND
(a series of Franklin Templeton Variable Insurance Products Trust)
The prospectus is amended as follows:
I. Effective December 31, 2018, the portfolio management team under the “FUND SUMMARIES – Franklin Strategic Income VIP Fund – Portfolio Managers” section on pageFSI-S6 is replaced with the following:
Portfolio Managers
Roger Bayston, CFAExecutive Vice President of Advisers and portfolio manager of the Fund since 2015.
Sonal Desai, Ph.D.Senior Vice President of Advisers and portfolio manager of the Fund since December 2018.
Patricia O’Connor, CFAVice President of Advisers and portfolio manager of the Fund since 2016.
II. Effective December 31, 2018, the portfolio management team under the “Fund Details – Franklin Strategic Income VIP Fund – Management” section on pageFSI-D13 is replaced with the following:
The Fund is managed by a team of dedicated professionals focused on investments in U.S. and foreign debt securities. The portfolio managers of the team are as follows:
Roger Bayston, CFA Executive Vice President of Advisers
Mr. Bayston has been a portfolio manager of the Fund since 2015. He joined Franklin Templeton Investments in 1991.
Sonal Desai, Ph.D. Senior Vice President of Advisers
Dr. Desai has been a portfolio manager of the Fund since December 2018. She joined Franklin Templeton Investments in 2009.
Patricia O’Connor, CFA Vice President of Advisers
Ms. O’Connor has been portfolio manager of the Fund since 2016. She joined Franklin Templeton Investments in 1997.
Asco-lead portfolio managers, Dr. Desai and Mr. Bayston are jointly and primarily responsible for theday-to-day management of the Fund’s portfolio. They have equal authority over all aspects of the Fund’s investment portfolio, including but not limited to, purchases and sales of individual securities, portfolio risk assessment, and the management of daily cash balances in accordance with anticipated investment management requirements. The degree to which each portfolio manager may perform these functions, and the nature of these functions, may change from time to time. Ms. O’Connor provides the Fund with research and advice on the purchases and sales of individual securities, and portfolio risk assessment.
CFA® and Chartered Financial Analyst® are trademarks owned by CFA Institute.
Please keep this supplement with your prospectus for future reference.
VIP SA1 09/18
SUPPLEMENT DATED SEPTEMBER 4, 2018
TO THE STATEMENT OF ADDITIONAL INFORMATION
DATED MAY 1, 2018
OF FRANKLIN STRATEGIC INCOME VIP FUND
(a series of Franklin Templeton Variable Insurance Products Trust)
The Statement of Additional Information (SAI) is amended as follows:
I. The following is added to the bullet point list in “The Funds – Goals, Additional Strategies and Risks – Franklin Strategic Income VIP Fund” section of the SAI:
| | • | | invest in marketplace loans |
II. The following is added to the “Glossary of Investments, Techniques, Strategies and Their Risks” section of the SAI:
Marketplace loansMarketplace loans are originated through online platforms that provide a marketplace for lending and match consumers, small andmid-sized enterprises or companies (“SMEs”), and other borrowers seeking loans with investors willing to provide the funding for such loans (“Marketplace Loans”). These borrowers may seek such loans for a variety of different purposes (e.g., loans for education, loans to fund elective medical procedures or loans for franchise financing). The procedures through which borrowers obtain loans can vary between platforms, and between the types of loans (e.g., consumer versus SME). Marketplace lending is often referred to as “peer to peer” lending because of the industry’s initial focus on individual investors and consumer loan borrowers. However, since its inception, the industry has grown to include substantial involvement by institutional investors.
In the case of consumer platforms, prospective borrowers must disclose or otherwise make available to the platform operator certain financial and other information including, for example, the borrower’s credit score (as determined by a credit reporting agency), income,debt-to-income ratio, credit utilization, employment status, homeownership status, number of existing credit lines, intended use of funds, and the number and/or amount of recent payment defaults and delinquencies, certain of which information is then made available to prospective lenders. The borrower must satisfy the minimum eligibility requirements set by the platform operator. The platform operator uses the information provided by the borrower (along with other relevant data such as the characteristics of the loan) to assign its own credit rating (in the case of most consumer platforms) and the interest rate for the requested loan.
Lenders may select which loans to fund based on such borrower-provided information and platform-assigned credit rating (to the extent one is assigned) and the yield to the lender. The yield to the lender is the fixed interest rate assigned by the platform to the loan net of any fees charged by the platform, including servicing fees. Such servicing fees cover services such as screening borrowers for their eligibility, managing the supply and demand of the marketplace, and facilitating payments and debt collection, among other things. A typical servicing fee charged to the lender is 1% of the outstanding loan balance. Platforms may also charge borrowers an origination fee, which is typically 1% to 5% of the loan balance. The platforms may set limits as to the maximum dollar amount that may be requested by a borrower (whether through one or multiple loans) and the minimum dollar amount that a lender must provide under each loan. The loans originated through the online consumer lending platforms typically have a fixed term ranging between six months and five years in principal amounts with a minimum (e.g., $1,000) and maximum (e.g., $100,000), and typically amortize through equal monthly payments to their maturity dates.
In the United States, platforms are subject to extensive regulation, oversight and examination at the federal, state and local level, and across multiple jurisdictions if they operate their business nationwide. Accordingly, platforms are generally subject to various securities, lending, licensing and consumer protection laws. Most states limit by statute the maximum rate of interest that lenders may charge on consumer loans. A limited number of states also may have interest rate caps for certain commercial loans. The maximum permitted interest rate can vary substantially between states. Some states impose a fixed maximum rate while others link the maximum rate to a floating rate index. Some platforms obtain state lending licenses and lend directly to borrowers. Other platform operators through a contractual relationship with a bank purchase bank originated loans. In this model, an operator of a platform may be able to (through existing law and legal interpretations) be the
beneficiary of the federal preemption available to federally insured banks that preempt the state laws and usury rates applicable under the various state laws where borrowers reside.
Risks of marketplace loans generally.Marketplace Loans are subject to the risks associated with debt investments generally, including but not limited to, interest rate, credit, liquidity, high yield debt, market and income risks. Marketplace Loans generally are not rated by rating agencies and constitute a highly risky and speculative investment. There can be no assurance that payments due on underlying Marketplace Loans will be made. A platform operator is not obligated to make any payments due on a Marketplace Loan except to the extent that the operator actually receives payments from the borrower on the related loan. Accordingly, lenders and investors assume all of the credit risk on the loans they fund or purchase from a platform operator and are not entitled to recover any deficiency of principal or interest from the platform operator if the underlying borrower defaults on its payments due with respect to a loan. A substantial portion of the Marketplace Loans in which the Fund may invest will not be secured by any collateral, will not be guaranteed or insured by a third party and will not be backed by any governmental authority. Accordingly, the platforms and any third-party collection agencies will be limited in their ability to collect on defaulted Marketplace Loans. In addition, a platform operator is generally not required to repurchase Marketplace Loans from a lender or purchaser except under very narrow circumstances, such as in cases of verifiable identity fraud by the borrower or as may otherwise be negotiated by a purchaser of whole loans.
To the extent a Marketplace Loan is secured, there can be no assurance as to the amount of any funds that may be realized from recovering and liquidating any collateral or the timing of such recovery and liquidation and hence there is no assurance that sufficient funds (or, possibly, any funds) will be available to offset any payment defaults that occur under the Marketplace Loan. Marketplace Loans are obligations of the borrowers and the terms of certain loans may not restrict the borrowers from incurring additional debt. If a borrower incurs additional debt after obtaining a loan through a platform, the additional debt may adversely affect the borrower’s creditworthiness generally, and could result in the financial distress, insolvency or bankruptcy of the borrower. To the extent borrowers incur other indebtedness that is secured, such as a mortgage, the ability of the secured creditors to exercise collection remedies against the assets of that borrower may impair the borrower’s ability to repay its Marketplace Loan or it may impair the platform’s ability to collect on the Marketplace Loan upon default. To the extent that a Marketplace Loan is unsecured, borrowers may choose to repay obligations under other indebtedness (such as loans obtained from traditional lending sources) before repaying a loan facilitated through a platform because the borrowers have no collateral at risk. The Fund will not be made aware of any additional debt incurred by a borrower, or whether such debt is secured. The effect of this can be to allow other creditors to move more quickly to claim any assets of the borrower.
Borrower credit risk.Certain of the Marketplace Loans in which the Fund may invest may represent obligations of consumers who would not otherwise qualify for, or would have difficulty qualifying for, credit from traditional sources of lending, or SMEs that are unable to effectively access public equity or debt markets, as a result of, among other things, limited assets, adverse income characteristics, limited credit or operating history or an impaired credit record, which may include, for example in the case of consumers, a history of irregular employment, previous bankruptcy filings, repossessions of property, charged off loans and/or garnishment of wages. The average interest rate charged to, or required of, such obligors generally is higher than that charged by commercial banks and other institutions providing traditional sources of credit or that set by the debt market. As a result of the credit profile of the borrowers and the interest rates on Marketplace Loans, the delinquency and default experience on the Marketplace Loans may be significantly higher than those experienced by financial products arising from traditional sources of lending. The Fund may need to rely on the collection efforts of the platforms and third party collection agencies, which also may be limited in their ability to collect on defaulted loans. The Fund may not have direct recourse against borrowers, may not be able to obtain the identity of the borrowers in order to contact a borrower about a loan and may not be able to pursue borrowers to collect payment under loans. Borrowers may seek protection under federal bankruptcy law or similar laws. In most cases involving the bankruptcy of a borrower with an unsecured Marketplace Loan, unsecured creditors will receive only a fraction of any amount outstanding on their loan, if anything at all.
Fraud risk.The Fund is subject to the risk of fraudulent activity associated with the various parties involved in marketplace lending, including the platforms, banks, borrowers and third parties handling borrower and investor information. For example, a borrower may have supplied false or inaccurate information. A platform’s resources, technologies and fraud prevention tools may be insufficient to accurately detect and prevent fraud. A platform may have the exclusive right and ability to investigate claims of borrower identity theft, which creates a conflict of interest. If a platform determines that verifiable identity theft has occurred, it may be required to repurchase the loan or indemnify the Fund. Alternatively, if the platform denies a claim of identity theft, it would not be required to repurchase the loan or indemnify the Fund.
Platform provided credit information risk.The investment manager is reliant in part on the borrower credit information provided to it or assigned by the platforms when selecting Marketplace Loans for investment. To the extent a credit rating is assigned to each borrower by a platform, such rating may not accurately reflect the borrower’s actual creditworthiness. A platform may be unable, or may not seek, to verify all of the borrower information obtained by it. Borrower information on which platforms and lenders may rely may be outdated. In addition, certain information that the investment manager would otherwise seek may not be available, such as financial statements and other financial information. Furthermore, the investment manager may be unable to perform any independentfollow-up verification with respect to a borrower to the extent the borrower’s name, address and other contact information is required to remain confidential. In addition, the platforms’ credit decisions and scoring models are based on algorithms that could potentially contain programming or other errors or prove to be ineffective or otherwise flawed.
Liquidity risk.Investors that acquire Marketplace Loans directly from platforms must generally hold their loans through maturity in order to recoup their entire principal. No Marketplace Loans currently being offered have been registered with the U.S. Securities and Exchange Commission. In addition, Marketplace Loans are not listed on any securities exchange (although secondary market trading in pass-through notes issued by one platform does occur on one electronic “alternative trading system”). An active secondary market for Marketplace Loans does not currently exist and an active market for the Marketplace Loans may not develop in the future. Accordingly, it may be difficult for the Fund to sell an investment in Marketplace Loans at the price which the Fund believes the loan should be valued. The Fund typically considers its investments in Marketplace Loans to be illiquid for purposes of its limitation on illiquid investments.
Platform risk.To the extent that the Fund invests in Marketplace Loans, it will be dependent on the continued success of the platforms that originate such loans. The Fund materially depends on such platforms for loan data and the origination, sourcing and servicing of Marketplace Loans and on the platform’s ability to collect, verify and provide information to the Fund about each Marketplace Loan and borrower.
Regulatory and judicial risks.The platforms through which Marketplace Loans are originated are subject to various statutes, rules and regulations issued by federal, state and local government authorities. Federal and state consumer protection laws in particular impose requirements and place restrictions on creditors and service providers in connection with extensions of credit and collections on personal loans and protection of sensitive customer data obtained in the origination and servicing thereof. Platforms are also subject to laws relating to electronic commerce and transfer of funds in conducting business electronically. A failure to comply with the applicable rules and regulations may, among other things, subject the platform or its related entities to certain registration requirements with government authorities and the payment of any penalties and fines; result in the revocation of their licenses; cause the loan contracts originated by the platform to be voided or otherwise impair the enforcement of such loans; and subject them to potential civil and criminal liability, class action lawsuits and/or administrative or regulatory enforcement actions.
The federal and state consumer protection laws generally (i) require lenders to provide consumers with specified disclosures regarding the terms of the loans and/or impose substantive restrictions on the terms on which loans are made; (ii) prohibit lenders from discriminating against consumers on the basis of certain protected classes; and (iii) restrict the actions that a lender or debt collector can take to realize on delinquent or defaulted loans. Marketplace lending industry participants, including platforms, may be subject in certain cases to increased risk of litigation alleging violations of federal and state laws and regulations. In addition, courts have recently considered the regulatory environment applicable to marketplace lending platforms and purchasers of Marketplace Loans. In light of recent decisions, if upheld and widely applied, certain marketplace lending platforms could be required to restructure their operations and certain loans previously made by them through funding banks may not be enforceable, whether in whole or in part, by investors holding such loans or such loans could be subject to reduced returns and/or the platform subject to fines and penalties. As a result, Marketplace Loans purchased by the Fund could become unenforceable, thereby causing losses for shareholders.
Please keep this supplement with your prospectus for future reference.
VIP SA3 10/18
SUPPLEMENT DATED OCTOBER 30, 2018
TO THE STATEMENT OF ADDITIONAL INFORMATION
DATED MAY 1, 2018
OF
FRANKLIN STRATEGIC INCOME VIP FUND
(A series of Franklin Templeton Variable Insurance Products Trust)
The Statement of Additional Information (SAI) is amended as follows:
I. The fifth bullet point in the list of bullet points under the “The Funds – Goals, Additional Strategies and Risks – Franklin Strategic Income VIP Fund (Strategic Income Fund)” heading in the SAI is deleted.
Please keep this supplement with your prospectus for future reference.
FRANKLIN TEMPLETON VARIABLE INSURANCE PRODUCTS TRUST
Consolidated Financial Highlights
Franklin Strategic Income VIP Fund
| | | | | | | | | | | | | | | | | | | | |
| |
| | | Year Ended December 31, | |
| | | | | |
| | | 2018 | | | 2017 | | | 2016 | | | 2015 | | | 2014 | |
| Class 1 | | | | | | | | | | | | | | | | | | | | |
Per share operating performance (for a share outstanding throughout the year) | | | | | | | | | | | | | | | | | | | | |
| | | | | |
Net asset value, beginning of year | | | $11.15 | | | | $11.01 | | | | $10.55 | | | | $11.90 | | | | $12.64 | |
| | | | |
| | | | | |
| Income from investment operationsa: | | | | | | | | | | | | | | | | | | | | |
| | | | | |
Net investment incomeb | | | 0.47 | | | | 0.45 | | | | 0.48 | | | | 0.53 | | | | 0.54 | |
| | | | | |
Net realized and unrealized gains (losses) | | | (0.65 | ) | | | 0.04 | | | | 0.37 | | | | (0.91 | ) | | | (0.25 | ) |
| | | | |
Total from investment operations | | | (0.18 | ) | | | 0.49 | | | | 0.85 | | | | (0.38 | ) | | | 0.29 | |
| | | | |
| | | | | |
| Less distributions from: | | | | | | | | | | | | | | | | | | | | |
| | | | | |
Net investment income and net foreign currency gains | | | (0.32 | ) | | | (0.35 | ) | | | (0.39 | ) | | | (0.77 | ) | | | (0.78 | ) |
| | | | | |
Net realized gains | | | — | | | | — | | | | — | | | | (0.20 | ) | | | (0.25 | ) |
| | | | |
Total distributions | | | (0.32 | ) | | | (0.35 | ) | | | (0.39 | ) | | | (0.97 | ) | | | (1.03 | ) |
| | | | |
Net asset value, end of year. | | | $10.65 | | | | $11.15 | | | | $11.01 | | | | $10.55 | | | | $11.90 | |
| | | | |
| | | | | |
Total returnc | | | (1.65)% | | | | 4.46% | | | | 8.25% | | | | (3.62)% | | | | 2.12% | |
| | | | | |
| Ratios to average net assets | | | | | | | | | | | | | | | | | | | | |
| | | | | |
Expenses before waiver and payments by affiliates | | | 0.67% | | | | 0.68% | | | | 0.67% | | | | 0.63% | | | | 0.63% | |
| | | | | |
Expenses net of waiver and payments by affiliatesd | | | 0.63% | | | | 0.63% | | | | 0.60% | | | | 0.62% | | | | 0.62% | |
| | | | | |
Net investment income | | | 4.28% | | | | 4.00% | | | | 4.42% | | | | 4.71% | | | | 4.34% | |
| | | | | |
| Supplemental data | | | | | | | | | | | | | | | | | | | | |
| | | | | |
Net assets, end of year (000’s) | | | $302,610 | | | | $361,465 | | | | $396,170 | | | | $441,658 | | | | $574,850 | |
| | | | | |
Portfolio turnover rate | | | 107.90% | e | | | 108.73% | | | | 128.51% | | | | 85.85% | | | | 55.64% | |
| | | | | |
Portfolio turnover rate excluding mortgage dollar rollsf | | | 40.38% | e | | | 48.11% | | | | 77.93% | | | | 51.47% | | | | 48.86% | |
aThe amount shown for a share outstanding throughout the period may not correlate with the Consolidated Statement of Operations for the period due to the timing of sales and repurchases of the Fund’s shares in relation to income earned and/or fluctuating fair value of the investments of the Fund.
bBased on average daily shares outstanding.
cTotal return does not include fees, charges or expenses imposed by the variable annuity and life insurance contracts for which Franklin Templeton Variable Insurance Products Trust serves as an underlying investment vehicle.
dBenefit of expense reduction rounds to less than 0.01%.
eExcludes the value of portfolio securities delivered as a result of a redemption in-kind. See Note 11.
fSee Note 1(h) regarding mortgage dollar rolls.
| | | | | | |
| | | |
| | The accompanying notes are an integral part of these consolidated financial statements. | Annual Report | | | FSI-15 | |
FRANKLIN TEMPLETON VARIABLE INSURANCE PRODUCTS TRUST
CONSOLIDATED FINANCIAL HIGHLIGHTS
Franklin Strategic Income VIP Fund(continued)
| | | | | | | | | | | | | | | | | | | | |
| |
| | | Year Ended December 31, | |
| | | | | |
| | | 2018 | | | 2017 | | | 2016 | | | 2015 | | | 2014 | |
| Class 2 | | | | | | | | | | | | | | | | | | | | |
Per share operating performance (for a share outstanding throughout the year) | | | | | | | | | | | | | | | | | | | | |
| | | | | |
Net asset value, beginning of year | | | $10.76 | | | | $10.64 | | | | $10.21 | | | | $11.55 | | | | $12.30 | |
| | | | |
| | | | | |
| Income from investment operationsa: | | | | | | | | | | | | | | | | | | | | |
| | | | | |
Net investment incomeb | | | 0.42 | | | | 0.40 | | | | 0.43 | | | | 0.49 | | | | 0.49 | |
| | | | | |
Net realized and unrealized gains (losses) | | | (0.61 | ) | | | 0.04 | | | | 0.36 | | | | (0.89 | ) | | | (0.24 | ) |
| | | | |
Total from investment operations | | | (0.19 | ) | | | 0.44 | | | | 0.79 | | | | (0.40 | ) | | | 0.25 | |
| | | | |
| | | | | |
| Less distributions from: | | | | | | | | | | | | | | | | | | | | |
| | | | | |
Net investment income and net foreign currency gains | | | (0.29 | ) | | | (0.32 | ) | | | (0.36 | ) | | | (0.74 | ) | | | (0.75 | ) |
| | | | | |
Net realized gains | | | — | | | | — | | | | — | | | | (0.20 | ) | | | (0.25 | ) |
| | | | |
Total distributions | | | (0.29 | ) | | | (0.32 | ) | | | (0.36 | ) | | | (0.94 | ) | | | (1.00 | ) |
| | | | |
Net asset value, end of year. | | | $10.28 | | | | $10.76 | | | | $10.64 | | | | $10.21 | | | | $11.55 | |
| | | | |
| | | | | |
Total returnc | | | (1.77)% | | | | 4.17% | | | | 7.94% | | | | (3.87)% | | | | 1.86% | |
| | | | | |
| Ratios to average net assets | | | | | | | | | | | | | | | | | | | | |
| | | | | |
Expenses before waiver and payments by affiliates | | | 0.92% | | | | 0.93% | | | | 0.92% | | | | 0.88% | | | | 0.88% | |
| | | | | |
Expenses net of waiver and payments by affiliatesd | | | 0.88% | | | | 0.88% | | | | 0.85% | | | | 0.87% | | | | 0.87% | |
| | | | | |
Net investment income | | | 4.03% | | | | 3.75% | | | | 4.17% | | | | 4.46% | | | | 4.09% | |
| | | | | |
| Supplemental data | | | | | | | | | | | | | | | | | | | | |
| | | | | |
Net assets, end of year (000’s) | | | $89,264 | | | | $214,271 | | | | $203,418 | | | | $202,192 | | | | $206,571 | |
| | | | | |
Portfolio turnover rate | | | 107.90% | e | | | 108.73% | | | | 128.51% | | | | 85.85% | | | | 55.64% | |
| | | | | |
Portfolio turnover rate excluding mortgage dollar rollsf | | | 40.38% | e | | | 48.11% | | | | 77.93% | | | | 51.47% | | | | 48.86% | |
aThe amount shown for a share outstanding throughout the period may not correlate with the Consolidated Statement of Operations for the period due to the timing of sales and repurchases of the Fund’s shares in relation to income earned and/or fluctuating fair value of the investments of the Fund.
bBased on average daily shares outstanding.
cTotal return does not include fees, charges or expenses imposed by the variable annuity and life insurance contracts for which Franklin Templeton Variable Insurance Products Trust serves as an underlying investment vehicle.
dBenefit of expense reduction rounds to less than 0.01%.
eExcludes the value of portfolio securities delivered as a result of a redemptionin-kind. See Note 11.
.fSee Note 1(h) regarding mortgage dollar rolls.
| | | | |
| | |
| FSI-16 | | Annual Report | The accompanying notes are an integral part of these consolidated financial statements. |
FRANKLIN TEMPLETON VARIABLE INSURANCE PRODUCTS TRUST
CONSOLIDATED FINANCIAL HIGHLIGHTS
Franklin Strategic Income VIP Fund(continued)
| | | | | | | | | | | | | | | | | | | | |
| |
| | | Year Ended December 31, | |
| | | | | |
| | | 2018 | | | 2017 | | | 2016 | | | 2015 | | | 2014 | |
| Class 4 | | | | | | | | | | | | | | | | | | | | |
Per share operating performance (for a share outstanding throughout the year) | | | | | | | | | | | | | | | | | | | | |
| | | | | |
Net asset value, beginning of year | | | $11.04 | | | | $10.90 | | | | $10.44 | | | | $11.78 | | | | $12.51 | |
| | | | |
| | | | | |
| Income from investment operationsa: | | | | | | | | | | | | | | | | | | | | |
| | | | | |
Net investment incomeb | | | 0.43 | | | | 0.40 | | | | 0.43 | | | | 0.49 | | | | 0.49 | |
| | | | | |
Net realized and unrealized gains (losses) | | | (0.64 | ) | | | 0.04 | | | | 0.38 | | | | (0.91 | ) | | | (0.25 | ) |
| | | | |
Total from investment operations | | | (0.21 | ) | | | 0.44 | | | | 0.81 | | | | (0.42 | ) | | | 0.24 | |
| | | | |
| | | | | |
| Less distributions from: | | | | | | | | | | | | | | | | | | | | |
| | | | | |
Net investment income and net foreign currency gains | | | (0.27 | ) | | | (0.30 | ) | | | (0.35 | ) | | | (0.72 | ) | | | (0.72 | ) |
| | | | | |
Net realized gains | | | — | | | | — | | | | — | | | | (0.20 | ) | | | (0.25 | ) |
| | | | |
Total distributions | | | (0.27 | ) | | | (0.30 | ) | | | (0.35 | ) | | | (0.92 | ) | | | (0.97 | ) |
| | | | |
Net asset value, end of year. | | | $10.56 | | | | $11.04 | | | | $10.90 | | | | $10.44 | | | | $11.78 | |
| | | | |
| | | | | |
Total returnc | | | (1.88)% | | | | 4.08% | | | | 7.86% | | | | (3.98)% | | | | 1.75% | |
| | | | | |
| Ratios to average net assets | | | | | | | | | | | | | | | | | | | | |
| | | | | |
Expenses before waiver and payments by affiliates | | | 1.02% | | | | 1.03% | | | | 1.02% | | | | 0.98% | | | | 0.98% | |
| | | | | |
Expenses net of waiver and payments by affiliatesd | | | 0.98% | | | | 0.98% | | | | 0.95% | | | | 0.97% | | | | 0.97% | |
| | | | | |
Net investment income | | | 3.93% | | | | 3.65% | | | | 4.07% | | | | 4.36% | | | | 3.99% | |
| | | | | |
| Supplemental data | | | | | | | | | | | | | | | | | | | | |
| | | | | |
Net assets, end of year (000’s) | | | $60,763 | | | | $74,013 | | | | $80,175 | | | | $92,965 | | | | $113,986 | |
| | | | | |
Portfolio turnover rate | | | 107.90% | e | | | 108.73% | | | | 128.51% | | | | 85.85% | | | | 55.64% | |
| | | | | |
Portfolio turnover rate excluding mortgage dollar rollsf | | | 40.38% | e | | | 48.11% | | | | 77.93% | | | | 51.47% | | | | 48.86% | |
aThe amount shown for a share outstanding throughout the period may not correlate with the Consolidated Statement of Operations for the period due to the timing of sales and repurchases of the Fund’s shares in relation to income earned and/or fluctuating fair value of the investments of the Fund.
bBased on average daily shares outstanding.
cTotal return does not include fees, charges or expenses imposed by the variable annuity and life insurance contracts for which Franklin Templeton Variable Insurance Products Trust serves as an underlying investment vehicle.
dBenefit of expense reduction rounds to less than 0.01%.
eExcludes the value of portfolio securities delivered as a result of a redemptionin-kind. See Note 11.
fSee Note 1(h) regarding mortgage dollar rolls.
| | | | | | |
| | | |
| | The accompanying notes are an integral part of these consolidated financial statements. | Annual Report | | | FSI-17 | |
FRANKLIN TEMPLETON VARIABLE INSURANCE PRODUCTS TRUST
Consolidated Statement of Investments, December 31, 2018
Franklin Strategic Income VIP Fund
| | | | | | | | | | | | | | |
| | | | |
| | | | | Country | | | Shares/ Warrants | | | Value | |
| | | | | | | | | | | | | | |
| | Common Stocks and Other Equity Interests 0.3% | | | | | | | | | | | | |
| | Consumer Services 0.0%† | | | | | | | | | | | | |
| a,b,c | | Turtle Bay Resort | | | United States | | | | 1,901,449 | | | $ | 41,832 | |
| | | | | | | | | | | | | | |
| | Energy 0.3% | | | | | | | | | | | | |
| a | | Birch Permian Holdings Inc. | | | United States | | | | 9,172 | | | | 100,892 | |
| a | | Birch Permian Holdings Inc. | | | United States | | | | 71,492 | | | | 750,666 | |
| a | | Halcon Resources Corp. | | | United States | | | | 78,920 | | | | 134,164 | |
| a | | Halcon Resources Corp., wts., 9/09/20. | | | United States | | | | 6,591 | | | | 338 | |
| a | | Midstates Petroleum Co. Inc. | | | United States | | | | 565 | | | | 4,243 | |
| a,c | | Midstates Petroleum Co. Inc., wts., 4/21/20 | | | United States | | | | 4,005 | | | | 10 | |
| a | | Penn Virginia Corp. | | | United States | | | | 72 | | | | 3,892 | |
| a | | Riviera Resources Inc. | | | United States | | | | 6,922 | | | | 109,368 | |
| a | | Roan Resources Inc. | | | United States | | | | 6,922 | | | | 58,006 | |
| | | | | | | | | | | | | | |
| | | | | | | | | | | | | 1,161,579 | |
| | | | | | | | | | | | | | |
| | | Materials 0.0%† | | | | | | | | | |
| a | | Verso Corp., A | | | United States | | | | 5,620 | | | | 125,888 | |
| a | | Verso Corp., wts., 7/25/23 | | | United States | | | | 592 | | | | 3,078 | |
| | | | | | | | | | | | | | |
| | | | | | | | | | | | | 128,966 | |
| | | | | | | | | | | | | | |
| | | Retailing 0.0%† | | | | | | | | | |
| a,c,d | | K2016470219 South Africa Ltd., A | | | South Africa | | | | 14,792,309 | | | | 10,295 | |
| a,c,d | | K2016470219 South Africa Ltd., B | | | South Africa | | | | 1,472,041 | | | | 1,025 | |
| | | | | | | | | | | | | | |
| | | | | | | | | | | | | 11,320 | |
| | | | | | | | | | | | | | |
| | | Transportation 0.0%† | | | | | | | | | |
| a | | CEVA Logistics AG | | | Switzerland | | | | 7,190 | | | | 218,178 | |
| | | | | | | | | | | | | | |
| | | | |
| | Total Common Stocks and Other Equity Interests
(Cost $7,910,952) | | | | | | | | | | | 1,561,875 | |
| | | | | | | | | | | | | | |
| | | Management Investment Companies 5.6% | | | | | | | | | |
| | | Diversified Financials 5.6% | | | | | | | | | |
| e | | Franklin Lower Tier Floating Rate Fund | | | United States | | | | 1,430,188 | | | | 13,000,405 | |
| e | | Franklin Middle Tier Floating Rate Fund | | | United States | | | | 1,358,951 | | | | 12,230,563 | |
| | | | | | | | | | | | | | |
| | Total Management Investment Companies
(Cost $27,540,113) | | | | | | | | | | | 25,230,968 | |
| | | | | | | | | | | | | | |
| | | | |
| | | | | | | | Principal Amount* | | | | |
| | | | |
| | Corporate Bonds 42.3% | | | | | | | | | | | | |
| | Automobiles & Components 0.2% | | | | | | | | | | | | |
| | Fiat Chrysler Automobiles NV, senior note, 5.25%, 4/15/23 | | | United Kingdom | | | | 970,000 | | | | 956,362 | |
| | | | | | | | | | | | | | |
| | | Banks 3.6% | | | | | | | | | |
| | Bank of America Corp., | | | | | | | | | | | | |
| | senior bond, 3.248%, 10/21/27 | | | United States | | | | 647,000 | | | | 598,986 | |
| | senior note, 3.50%, 4/19/26 | | | United States | | | | 2,480,000 | | | | 2,390,840 | |
| | CIT Group Inc., senior bond, 5.00%, 8/15/22 | | | United States | | | | 809,000 | | | | 799,899 | |
| | Citigroup Inc., | | | | | | | | | | | | |
| | senior note, 3.30%, 4/27/25 | | | United States | | | | 243,000 | | | | 231,193 | |
| | senior note, 3.40%, 5/01/26 | | | United States | | | | 1,106,000 | | | | 1,042,506 | |
| | senior note, 3.20%, 10/21/26 | | | United States | | | | 2,425,000 | | | | 2,241,764 | |
| | sub. bond, 5.50%, 9/13/25 | | | United States | | | | 405,000 | | | | 425,783 | |
| | sub. note, 4.05%, 7/30/22 | | | United States | | | | 243,000 | | | | 244,294 | |
FRANKLIN TEMPLETON VARIABLE INSURANCE PRODUCTS TRUST
CONSOLIDATED STATEMENT OF INVESTMENTS
Franklin Strategic Income VIP Fund(continued)
| | | | | | | | | | | | | | |
| | | | |
| | | | | Country | | | Principal Amount* | | | Value | |
| | | | | | | | | | | | | | |
| | Corporate Bonds(continued) | | | | | | | | | | | | |
| | Banks(continued) | | | | | | | | | | | | |
| f | | ICICI Bank Ltd./Dubai, senior note, 144A, 3.80%, 12/14/27 | | | India | | | | 1,294,000 | | | $ | 1,171,806 | |
| f | | Intesa Sanpaolo SpA, senior note, 144A, 6.50%, 2/24/21 | | | Italy | | | | 200,000 | | | | 205,523 | |
| | JPMorgan Chase & Co., | | | | | | | | | | | | |
| | g junior sub. bond, R, 6.00% to 8/01/23, FRN thereafter, Perpetual | | | United States | | | | 213,000 | | | | 208,740 | |
| | g junior sub. bond, X, 6.10% to 10/01/24, FRN thereafter, Perpetual | | | United States | | | | 405,000 | | | | 402,975 | |
| | senior bond, 3.30%, 4/01/26 | | | United States | | | | 324,000 | | | | 309,004 | |
| | senior bond, 3.20%, 6/15/26 | | | United States | | | | 1,213,000 | | | | 1,144,065 | |
| | sub. note, 3.375%, 5/01/23 | | | United States | | | | 809,000 | | | | 791,734 | |
| | sub. note, 3.875%, 9/10/24. | | | United States | | | | 809,000 | | | | 798,150 | |
| h | | Turkiye Vakiflar Bankasi TAO, secured note, Reg S, 2.375%, 11/04/22 | | | Turkey | | | | 500,000 | EUR | | | 550,534 | |
| | Wells Fargo & Co., | | | | | | | | | | | | |
| | g junior sub. bond, S, 5.90% to 6/15/24, FRN thereafter, Perpetual | | | United States | | | | 713,000 | | | | 680,202 | |
| | senior note, 3.00%, 4/22/26 | | | United States | | | | 2,021,000 | | | | 1,886,022 | |
| | | | | | | | | | | | | | |
| | | | | | | | | | | | | 16,124,020 | |
| | | | | | | | | | | | | | |
| | Capital Goods 1.4% | | | | | | | | | | | | |
| | Aircastle Ltd., senior note, 4.125%, 5/01/24 | | | United States | | | | 1,317,000 | | | | 1,244,161 | |
| f | | Beacon Roofing Supply Inc., senior note, 144A, 4.875%, 11/01/25 | | | United States | | | | 1,294,000 | | | | 1,141,955 | |
| | CNH Industrial NV, senior bond, 3.85%, 11/15/27 | | | United Kingdom | | | | 566,000 | | | | 520,304 | |
| | Legrand France SA, senior bond, 8.50%, 2/15/25 | | | France | | | | 100,000 | | | | 123,520 | |
| | Tennant Co., senior note, 5.625%, 5/01/25 | | | United States | | | | 809,000 | | | | 766,528 | |
| f | | Terex Corp., senior note, 144A, 5.625%, 2/01/25 | | | United States | | | | 1,617,000 | | | | 1,507,852 | |
| f | | Vertiv Group Corp., senior note, 144A, 9.25%, 10/15/24 | | | United States | | | | 1,294,000 | | | | 1,196,950 | |
| | | | | | | | | | | | | | |
| | | | | | | | | | | | | 6,501,270 | |
| | | | | | | | | | | | | | |
| | Commercial & Professional Services 0.8% | | | | | | | | | | | | |
| f | | IHS Markit Ltd., senior note, 144A, 4.00%, 3/01/26 | | | United States | | | | 970,000 | | | | 911,800 | |
| | United Rentals North America Inc., senior bond, 5.875%, 9/15/26 | | | United States | | | | 1,294,000 | | | | 1,224,448 | |
| f | | West Corp., senior note, 144A, 8.50%, 10/15/25 | | | United States | | | | 2,021,000 | | | | 1,606,695 | |
| | | | | | | | | | | | | | |
| | | | | | | | | | | | | 3,742,943 | |
| | | | | | | | | | | | | | |
| | Consumer Durables & Apparel 1.0% | | | | | | | | | | | | |
| f | | Hanesbrands Inc., senior bond, 144A, 4.875%, 5/15/26 | | | United States | | | | 2,182,000 | | | | 1,977,437 | |
| | KB Home, senior note, 7.00%, 12/15/21 | | | United States | | | | 970,000 | | | | 990,613 | |
| | PulteGroup Inc., senior bond, 5.00%, 1/15/27 | | | United States | | | | 809,000 | | | | 735,179 | |
| | Toll Brothers Finance Corp., senior bond, 5.625%, 1/15/24 | | | United States | | | | 889,000 | | | | 875,664 | |
| | | | | | | | | | | | | | |
| | | | | | | | | | | | | 4,578,893 | |
| | | | | | | | | | | | | | |
| | Consumer Services 1.8% | | | | | | | | | | | | |
| f | | 1011778 BC ULC/New Red Finance Inc., | | | | | | | | | | | | |
| | secured note, second lien, 144A, 5.00%, 10/15/25 | | | Canada | | | | 970,000 | | | | 894,825 | |
| | senior secured note, first lien, 144A, 4.25%, 5/15/24 | | | Canada | | | | 728,000 | | | | 672,170 | |
| f | | Golden Nugget Inc., senior note, 144A, 6.75%, 10/15/24 | | | United States | | | | 1,132,000 | | | | 1,069,740 | |
| f | | International Game Technology PLC, senior secured bond, 144A, 6.50%, 2/15/25 | | | United States | | | | 1,051,000 | | | | 1,040,490 | |
| f | | KFC Holding Co./Pizza Hut Holdings LLC/Taco Bell of America LLC, | | | | | | | | | | | | |
| | senior note, 144A, 5.00%, 6/01/24 | | | United States | | | | 728,000 | | | | 704,340 | |
| | senior note, 144A, 5.25%, 6/01/26 | | | United States | | | | 1,051,000 | | | | 1,019,501 | |
| | Marriott International Inc., senior bond, 3.75%, 10/01/25 | | | United States | | | | 1,213,000 | | | | 1,179,690 | |
| f | | Stars Group Holdings BV/Stars Group U.S.Co-Borrower LLC, senior note, 144A, 7.00%, 7/15/26 | | | Canada | | | | 566,000 | | | | 551,850 | |
FRANKLIN TEMPLETON VARIABLE INSURANCE PRODUCTS TRUST
CONSOLIDATED STATEMENT OF INVESTMENTS
Franklin Strategic Income VIP Fund(continued)
| | | | | | | | | | | | | | |
| | | | |
| | | | | Country | | | Principal Amount* | | | Value | |
| | Corporate Bonds(continued) | | | | | | | | | | | | |
| | | Consumer Services(continued) | | | | | | | | | |
| f | | Wynn Las Vegas LLC/Wynn Las Vegas Capital Corp., senior bond, 144A, 5.50%, 3/01/25 | | | United��States | | | | 970,000 | | | $ | 906,950 | |
| | | | | | | | | | | | | | |
| | | | | | | | | | | | | 8,039,556 | |
| | | | | | | | | | | | | | |
| | Diversified Financials 2.2% | | | | | | | | | | | | |
| | Capital One Financial Corp., senior note, 3.20%, 2/05/25 | | | United States | | | | 1,617,000 | | | | 1,512,239 | |
| | The Goldman Sachs Group Inc., | | | | | | | | | | | | |
| | senior note, 3.50%, 1/23/25 | | | United States | | | | 1,725,000 | | | | 1,637,153 | |
| | senior note, 3.75%, 2/25/26 | | | United States | | | | 1,213,000 | | | | 1,149,392 | |
| | Morgan Stanley, | | | | | | | | | | | | |
| | senior bond, 3.591% to 7/22/27, FRN thereafter, 7/22/28 | | | United States | | | | 809,000 | | | | 765,451 | |
| | senior note, 3.875%, 1/27/26 | | | United States | | | | 2,395,000 | | | | 2,339,273 | |
| | Navient Corp., | | | | | | | | | | | | |
| | senior note, 6.625%, 7/26/21 | | | United States | | | | 324,000 | | | | 313,470 | |
| | senior note, 7.25%, 9/25/23 | | | United States | | | | 1,521,000 | | | | 1,401,221 | |
| | senior note, 6.125%, 3/25/24 | | | United States | | | | 905,000 | | | | 780,562 | |
| | | | | | | | | | | | | | |
| | | | | | | | | | | | | 9,898,761 | |
| | | | | | | | | | | | | | |
| | Energy 4.7% | | | | | | | | | | | | |
| f | | California Resources Corp., secured note, second lien, 144A, 8.00%, 12/15/22 | | | United States | | | | 579,000 | | | | 393,720 | |
| | Cheniere Corpus Christi Holdings LLC, | | | | | | | | | | | | |
| | senior secured note, first lien, 7.00%, 6/30/24 | | | United States | | | | 647,000 | | | | 684,203 | |
| | senior secured note, first lien, 5.875%, 3/31/25 | | | United States | | | | 566,000 | | | | 564,585 | |
| | Cheniere Energy Partners LP, senior secured note, first lien, 5.25%, 10/01/25 | | | United States | | | | 970,000 | | | | 908,163 | |
| | CNOOC Finance 2015 USA LLC, senior note, 3.50%, 5/05/25 | | | China | | | | 1,051,000 | | | | 1,023,480 | |
| | CONSOL Energy Inc., senior note, 5.875%, 4/15/22 | | | United States | | | | 2,021,000 | | | | 1,945,212 | |
| | Energy Transfer LP, senior bond, first lien, 7.50%, 10/15/20 | | | United States | | | | 1,536,000 | | | | 1,601,280 | |
| | Energy Transfer Operating LP, | | | | | | | | | | | | |
| | senior bond, 5.20%, 2/01/22. | | | United States | | | | 809,000 | | | | 831,317 | |
| | senior bond, 4.05%, 3/15/25. | | | United States | | | | 200,000 | | | | 189,853 | |
| | Energy Transfer Partners LP/Regency Energy Finance Corp., senior note, 5.00%, 10/01/22 | | | United States | | | | 405,000 | | | | 413,626 | |
| f,i | | EnQuest PLC, senior note, 144A, PIK, 7.00%, 4/15/22 | | | United Kingdom | | | | 1,020,556 | | | | 692,702 | |
| | Exxon Mobil Corp., senior note, 2.222%, 3/01/21 | | | United States | | | | 324,000 | | | | 319,424 | |
| f,j | | Gaz Capital SA, (OJSC Gazprom), loan participation, senior note, 144A, 3.85%, 2/06/20 | | | Russia | | | | 1,213,000 | | | | 1,209,428 | |
| | Kinder Morgan Inc., | | | | | | | | | | | | |
| | senior bond, 4.30%, 6/01/25. | | | United States | | | | 1,617,000 | | | | 1,611,199 | |
| | senior note, 3.15%, 1/15/23 | | | United States | | | | 1,213,000 | | | | 1,177,971 | |
| | Martin Midstream Partners LP/Martin Midstream Finance Corp., senior note, 7.25%, 2/15/21 | | | United States | | | | 1,617,000 | | | | 1,544,235 | |
| | Oceaneering International Inc., senior note, 4.65%, 11/15/24 | | | United States | | | | 200,000 | | | | 158,536 | |
| | Sabine Pass Liquefaction LLC, | | | | | | | | | | | | |
| | senior secured note, first lien, 5.625%, 2/01/21 | | | United States | | | | 1,617,000 | | | | 1,666,370 | |
| | senior secured note, first lien, 5.625%, 4/15/23 | | | United States | | | | 728,000 | | | | 767,656 | |
| | Sanchez Energy Corp., senior note, 6.125%, 1/15/23 | | | United States | | | | 243,000 | | | | 44,955 | |
| f | | Sinopec Group Overseas Development 2016 Ltd., senior note, 144A, 2.75%, 9/29/26 | | | China | | | | 1,051,000 | | | | 957,613 | |
| | Sunoco LP/Sunoco Finance Corp., senior note, 4.875%, 1/15/23 | | | United States | | | | 485,000 | | | | 474,088 | |
FRANKLIN TEMPLETON VARIABLE INSURANCE PRODUCTS TRUST
CONSOLIDATED STATEMENT OF INVESTMENTS
Franklin Strategic Income VIP Fund(continued)
| | | | | | | | | | | | | | |
| | | | |
| | | | | Country | | | Principal Amount* | | | Value | |
| | | Corporate Bonds(continued) | | | | | | | | | |
| | Energy(continued) | | | | | | | | | | | | |
| | Weatherford International Ltd., | | | | | | | | | | | | |
| | senior note, 7.75%, 6/15/21 | | | United States | | | | 647,000 | | | $ | 488,485 | |
| | senior note, 8.25%, 6/15/23 | | | United States | | | | 809,000 | | | | 491,468 | |
| f | | Woodside Finance Ltd., | | | | | | | | | | | | |
| | senior bond, 144A, 3.70%, 3/15/28 | | | Australia | | | | 647,000 | | | | 595,628 | |
| | senior note, 144A, 3.70%, 9/15/26 | | | Australia | | | | 405,000 | | | | 374,006 | |
| | | | | | | | | | | | | | |
| | | | | | | | | | | | | 21,129,203 | |
| | | | | | | | | | | | | | |
| | Food & Staples Retailing 0.8% | | | | | | | | | | | | |
| f | | Aramark Services Inc., senior bond, 144A, 5.00%, 2/01/28 | | | United States | | | | 647,000 | | | | 604,945 | |
| | Kroger Co., senior bond, 2.65%, 10/15/26 | | | United States | | | | 1,132,000 | | | | 1,009,350 | |
| | Walgreens Boots Alliance Inc., senior note, 3.80%, 11/18/24 | | | United States | | | | 2,087,000 | | | | 2,056,372 | |
| | | | | | | | | | | | | | |
| | | | | | | | | | | | | 3,670,667 | |
| | | | | | | | | | | | | | |
| | Food, Beverage & Tobacco 1.4% | | | | | | | | | | | | |
| | Bunge Ltd. Finance Corp., senior note, 3.25%, 8/15/26 | | | United States | | | | 200,000 | | | | 175,612 | |
| f | | Imperial Brands Finance PLC, senior note, 144A, 3.50%, 2/11/23 | | | United Kingdom | | | | 1,698,000 | | | | 1,649,363 | |
| | Kraft Heinz Foods Co., senior bond, 3.00%, 6/01/26 | | | United States | | | | 1,940,000 | | | | 1,734,335 | |
| f | | Lamb Weston Holdings Inc., | | | | | | | | | | | | |
| | senior note, 144A, 4.625%, 11/01/24 | | | United States | | | | 485,000 | | | | 472,875 | |
| | senior note, 144A, 4.875%, 11/01/26 | | | United States | | | | 1,132,000 | | | | 1,092,380 | |
| f | | Post Holdings Inc., | | | | | | | | | | | | |
| | senior bond, 144A, 5.625%, 1/15/28 | | | United States | | | | 405,000 | | | | 374,119 | |
| | senior note, 144A, 5.50%, 3/01/25 | | | United States | | | | 809,000 | | | | 779,520 | |
| | Reynolds American Inc., senior note, 4.45%, 6/12/25 | | | United Kingdom | | | | 200,000 | | | | 193,196 | |
| | | | | | | | | | | | | | |
| | | | | | | | | | | | | 6,471,400 | |
| | | | | | | | | | | | | | |
| | Health Care Equipment & Services 2.7% | | | | | | | | | | | | |
| f | | Avantor Inc., senior secured note, first lien, 144A, 6.00%, 10/01/24 | | | United States | | | | 1,617,000 | | | | 1,592,745 | |
| | Centene Corp., | | | | | | | | | | | | |
| | senior note, 4.75%, 5/15/22 | | | United States | | | | 1,374,000 | | | | 1,361,977 | |
| | f senior note, 144A, 5.375%, 6/01/26. | | | United States | | | | 324,000 | | | | 315,900 | |
| | CHS/Community Health Systems Inc., | | | | | | | | | | | | |
| | senior note, 6.875%, 2/01/22 | | | United States | | | | 283,000 | | | | 130,180 | |
| | f senior note, 144A, 8.125%, 6/30/24. | | | United States | | | | 38,000 | | | | 27,930 | |
| | senior secured note, first lien, 6.25%, 3/31/23 | | | United States | | | | 405,000 | | | | 369,583 | |
| | CVS Health Corp., senior bond, 4.30%, 3/25/28 | | | United States | | | | 809,000 | | | | 793,654 | |
| | DaVita Inc., | | | | | | | | | | | | |
| | senior bond, 5.125%, 7/15/24 | | | United States | | | | 405,000 | | | | 380,700 | |
| | senior bond, 5.00%, 5/01/25 | | | United States | | | | 728,000 | | | | 663,390 | |
| | senior note, 5.75%, 8/15/22 | | | United States | | | | 809,000 | | | | 806,977 | |
| | Edwards Lifesciences Corp., senior note, 4.30%, 6/15/28 | | | United States | | | | 243,000 | | | | 246,291 | |
| | HCA Inc., | | | | | | | | | | | | |
| | senior bond, 5.875%, 5/01/23 | | | United States | | | | 1,213,000 | | | | 1,231,195 | |
| | senior secured bond, first lien, 5.25%, 4/15/25 | | | United States | | | | 485,000 | | | | 483,788 | |
| | senior secured bond, first lien, 5.50%, 6/15/47 | | | United States | | | | 970,000 | | | | 921,500 | |
| f | | MEDNAX Inc., senior note, 144A, 6.25%, 1/15/27 | | | United States | | | | 600,000 | | | | 580,500 | |
| f | | MPH Acquisition Holdings LLC, senior note, 144A, 7.125%, 6/01/24 | | | United States | | | | 728,000 | | | | 680,680 | |
| f,i | | Polaris Intermediate Corp., senior note, 144A, PIK, 8.50%, 12/01/22 | | | United States | | | | 200,000 | | | | 183,174 | |
| | Stryker Corp., senior bond, 3.50%, 3/15/26 | | | United States | | | | 405,000 | | | | 390,250 | |
FRANKLIN TEMPLETON VARIABLE INSURANCE PRODUCTS TRUST
CONSOLIDATED STATEMENT OF INVESTMENTS
Franklin Strategic Income VIP Fund(continued)
| | | | | | | | | | | | | | |
| | | | |
| | | | | Country | | | Principal Amount* | | | Value | |
| | | Corporate Bonds(continued) | | | | | | | | | |
| | Health Care Equipment & Services(continued) | | | | | | | | | | | | |
| | Tenet Healthcare Corp., | | | | | | | | | | | | |
| | senior note, 5.50%, 3/01/19 | | | United States | | | | 243,000 | | | $ | 243,851 | |
| | senior note, 8.125%, 4/01/22 | | | United States | | | | 809,000 | | | | 814,056 | |
| | | | | | | | | | | | | | |
| | | | | | | | | | | | | 12,218,321 | |
| | | | | | | | | | | | | | |
| | Insurance 0.6% | | | | | | | | | | | | |
| f | | Nippon Life Insurance Co., sub. bond, 144A, 5.10% to 10/16/24, FRN thereafter, 10/16/44 | | | Japan | | | | 2,529,000 | | | | 2,537,788 | |
| | | | | | | | | | | | | | |
| | Materials 5.7% | | | | | | | | | | | | |
| | ArcelorMittal, | | | | | | | | | | | | |
| | senior note, 5.50%, 3/01/21 | | | France | | | | 1,455,000 | | | | 1,501,043 | |
| | senior note, 6.125%, 6/01/25 | | | France | | | | 243,000 | | | | 254,163 | |
| f | | Ardagh Packaging Finance PLC/Ardagh MP Holdings USA Inc., senior note, 144A, 6.00%, 2/15/25 | | | Luxembourg | | | | 900,000 | | | | 833,625 | |
| f | | BWAY Holding Co., senior note, 144A, 7.25%, 4/15/25 | | | United States | | | | 1,778,000 | | | | 1,602,422 | |
| f | | Cemex Finance LLC, senior secured note, first lien, 144A, 6.00%, 4/01/24 | | | Mexico | | | | 500,000 | | | | 499,200 | |
| f | | Cemex SAB de CV, senior secured bond, first lien, 144A, 5.70%, 1/11/25 | | | Mexico | | | | 1,213,000 | | | | 1,168,089 | |
| | The Chemours Co., senior note, 6.625%, 5/15/23 | | | United States | | | | 837,000 | | | | 848,509 | |
| f | | Crown Americas LLC/Crown Americas Capital Corp., senior note, 144A, 4.75%, 2/01/26 | | | United States | | | | 566,000 | | | | 538,408 | |
| f | | First Quantum Minerals Ltd., senior note, 144A, 7.25%, 4/01/23 | | | Zambia | | | | 1,294,000 | | | | 1,143,572 | |
| f | | FMG Resources (August 2006) Pty. Ltd., | | | | | | | | | | | | |
| | senior note, 144A, 5.125%, 3/15/23 | | | Australia | | | | 324,000 | | | | 305,978 | |
| | senior note, 144A, 5.125%, 5/15/24 | | | Australia | | | | 647,000 | | | | 605,146 | |
| | Freeport-McMoRan Inc., senior note, 4.55%, 11/14/24 | | | United States | | | | 1,417,000 | | | | 1,312,496 | |
| f | | Glencore Finance Canada Ltd., senior bond, 144A, 4.95%, 11/15/21 | | | Switzerland | | | | 809,000 | | | | 826,854 | |
| f | | Glencore Funding LLC, | | | | | | | | | | | | |
| | senior note, 144A, 4.125%, 5/30/23 | | | Switzerland | | | | 485,000 | | | | 476,662 | |
| | senior note, 144A, 4.625%, 4/29/24 | | | Switzerland | | | | 250,000 | | | | 248,684 | |
| f | | INVISTA Finance LLC, senior secured note, 144A, 4.25%, 10/15/19 | | | United States | | | | 1,536,000 | | | | 1,532,304 | |
| | LYB International Finance BV, senior note, 4.00%, 7/15/23 | | | United States | | | | 1,698,000 | | | | 1,695,852 | |
| f | | New Gold Inc., senior note, 144A, 6.375%, 5/15/25 | | | Canada | | | | 566,000 | | | | 432,990 | |
| f | | Northwest Acquisitions ULC/Dominion Finco Inc., secured note, second lien, 144A, 7.125%, 11/01/22 | | | Canada | | | | 324,000 | | | | 321,094 | |
| f | | Novelis Corp., senior bond, 144A, 5.875%, 9/30/26 | | | United States | | | | 1,859,000 | | | | 1,649,862 | |
| f | | Owens-Brockway Glass Container Inc., | | | | | | | | | | | | |
| | senior note, 144A, 5.00%, 1/15/22 | | | United States | | | | 1,132,000 | | | | 1,124,925 | |
| | senior note, 144A, 5.875%, 8/15/23 | | | United States | | | | 566,000 | | | | 569,537 | |
| | Reynolds Group Issuer Inc./Reynolds Group Issuer LLC/Reynolds | | | | | | | | | | | | |
| | Group Issuer Luxembourg SA, | | | | | | | | | | | | |
| | fsenior note, 144A, 7.00%, 7/15/24 | | | United States | | | | 405,000 | | | | 386,522 | |
| | senior secured note, first lien, 5.75%, 10/15/20 | | | United States | | | | 548,376 | | | | 547,690 | |
| | fsenior secured note, first lien, 144A, 5.125%, 7/15/23 | | | United States | | | | 566,000 | | | | 539,823 | |
| f | | Sealed Air Corp., | | | | | | | | | | | | |
| | senior bond, 144A, 5.125%, 12/01/24 | | | United States | | | | 809,000 | | | | 797,876 | |
| | senior bond, 144A, 5.50%, 9/15/25 | | | United States | | | | 324,000 | | | | 320,760 | |
| | senior note, 144A, 4.875%, 12/01/22 | | | United States | | | | 485,000 | | | | 481,969 | |
| | Steel Dynamics Inc., | | | | | | | | | | | | |
| | senior bond, 5.50%, 10/01/24 | | | United States | | | | 809,000 | | | | 802,932 | |
| | senior note, 5.125%, 10/01/21 | | | United States | | | | 809,000 | | | | 809,000 | |
FRANKLIN TEMPLETON VARIABLE INSURANCE PRODUCTS TRUST
CONSOLIDATED STATEMENT OF INVESTMENTS
Franklin Strategic Income VIP Fund(continued)
| | | | | | | | | | | | | | |
| | | | |
| | | | | Country | | | Principal Amount* | | | Value | |
| | | Corporate Bonds(continued) | | | | | | | | | |
| | Materials(continued) | | | | | | | | | | | | |
| f | | SunCoke Energy Partners LP/SunCoke Energy Partners Finance Corp., senior note, 144A, 7.50%, 6/15/25 | | | United States | | | | 1,617,000 | | | $ | 1,536,150 | |
| | | | | | | | | | | | | | |
| | | | | | | | | | | | | 25,714,137 | |
| | | | | | | | | | | | | | |
| | | Media & Entertainment 4.8% | | | | | | | | | |
| f | | Altice Financing SA, secured bond, 144A, 7.50%, 5/15/26 | | | Luxembourg | | | | 200,000 | | | | 182,500 | |
| | AMC Networks Inc., senior note, 5.00%, 4/01/24 | | | United States | | | | 1,617,000 | | | | 1,536,150 | |
| | CCO Holdings LLC/CCO Holdings Capital Corp., | | | | | | | | | | | | |
| | senior bond, 5.25%, 9/30/22. | | | United States | | | | 889,000 | | | | 882,888 | |
| | f senior bond, 144A, 5.375%, 5/01/25 | | | United States | | | | 728,000 | | | | 699,790 | |
| | Clear Channel Worldwide Holdings Inc., | | | | | | | | | | | | |
| | senior note, 6.50%, 11/15/22 | | | United States | | | | 809,000 | | | | 813,045 | |
| | senior sub. note, 7.625%, 3/15/20 | | | United States | | | | 200,000 | | | | 197,500 | |
| | senior sub. note, 7.625%, 3/15/20 | | | United States | | | | 405,000 | | | | 396,394 | |
| f | | CSC Holdings LLC, senior secured note, first lien, 144A, 5.50%, 5/15/26 | | | United States | | | | 1,778,000 | | | | 1,680,210 | |
| | DISH DBS Corp., | | | | | | | | | | | | |
| | senior bond, 6.75%, 6/01/21. | | | United States | | | | 405,000 | | | | 401,841 | |
| | senior bond, 5.875%, 7/15/22 | | | United States | | | | 243,000 | | | | 224,471 | |
| | senior note, 5.875%, 11/15/24 | | | United States | | | | 970,000 | | | | 784,488 | |
| k | | iHeartCommunications Inc., | | | | | | | | | | | | |
| | senior secured bond, first lien, 9.00%, 3/01/21 | | | United States | | | | 485,000 | | | | 327,375 | |
| | senior secured note, first lien, 9.00%, 9/15/22 | | | United States | | | | 324,000 | | | | 217,080 | |
| | Netflix Inc., senior bond, 5.875%, 2/15/25. | | | United States | | | | 1,600,000 | | | | 1,618,000 | |
| f | | Nexstar Broadcasting Inc., senior note, 144A, 5.625%, 8/01/24 | | | United States | | | | 1,617,000 | | | | 1,515,937 | |
| f | | Sirius XM Radio Inc., | | | | | | | | | | | | |
| | senior bond, 144A, 6.00%, 7/15/24 | | | United States | | | | 889,000 | | | | 894,556 | |
| | senior bond, 144A, 5.375%, 4/15/25 | | | United States | | | | 647,000 | | | | 615,459 | |
| | Tegna Inc., | | | | | | | | | | | | |
| | senior bond, 6.375%, 10/15/23 | | | United States | | | | 809,000 | | | | 814,056 | |
| f | | senior bond, 144A, 5.50%, 9/15/24 | | | United States | | | | 405,000 | | | | 393,863 | |
| | senior note, 5.125%, 7/15/20 | | | United States | | | | 405,000 | | | | 405,089 | |
| | Time Warner Inc., senior bond, 2.95%, 7/15/26 | | | United States | | | | 2,021,000 | | | | 1,810,765 | |
| f | | Unitymedia KabelBW GmbH, senior bond, 144A, 6.125%, 1/15/25 | | | Germany | | | | 1,374,000 | | | | 1,382,588 | |
| f | | Univision Communications Inc., senior secured note, first lien, 144A, 5.125%, 2/15/25 | | | United States | | | | 2,021,000 | | | | 1,778,480 | |
| f | | Virgin Media Secured Finance PLC, senior secured bond, first lien, 144A, 5.50%, 1/15/25 | |
| United
Kingdom |
| | | 1,536,000 | | | | 1,532,160 | |
| f | | Ziggo Secured Finance BV, senior secured bond, 144A, 4.25%, 1/15/27 | | | Netherlands | | | | 566,000 | EUR | | | 639,260 | |
| | | | | | | | | | | | | | |
| | | | | | | | | | | | | 21,743,945 | |
| | | | | | | | | | | | | | |
| | Pharmaceuticals, Biotechnology & Life Sciences 1.8% | | | | | | | | | | | | |
| | Allergan Funding SCS, senior bond, 3.80%, 3/15/25 | | | United States | | | | 1,778,000 | | | | 1,738,945 | |
| | Amgen Inc., senior bond, 4.95%, 10/01/41 | | | United States | | | | 200,000 | | | | 204,688 | |
| f | | Bausch Health Cos. Inc., | | | | | | | | | | | | |
| | senior bond, 144A, 6.125%, 4/15/25 | | | United States | | | | 243,000 | | | | 212,625 | |
| | senior note, 144A, 4.50%, 5/15/23 | | | United States | | | | 400,000 | EUR | | | 434,703 | |
| | senior note, 144A, 8.50%, 1/31/27 | | | United States | | | | 809,000 | | | | 786,753 | |
| | senior note, first lien, 144A, 7.00%, 3/15/24 | | | United States | | | | 200,000 | | | | 202,500 | |
FRANKLIN TEMPLETON VARIABLE INSURANCE PRODUCTS TRUST
CONSOLIDATED STATEMENT OF INVESTMENTS
Franklin Strategic Income VIP Fund(continued)
| | | | | | | | | | | | | | |
| | | | |
| | | | | Country | | | Principal Amount* | | | Value | |
| | | Corporate Bonds(continued) | | | | | | | | | |
| | Pharmaceuticals, Biotechnology & Life Sciences(continued) | | | | | | | | | | | | |
| f | | Bayer US Finance II LLC, senior bond, 144A, 4.375%, 12/15/28 | | | Germany | | | | 889,000 | | | $ | 850,987 | |
| | Celgene Corp., senior bond, 3.45%, 11/15/27 | | | United States | | | | 647,000 | | | | 590,212 | |
| f,i | | Eagle Holdings Co. II LLC, senior note, 144A, PIK, 7.625%, 5/15/22 | | | United States | | | | 566,000 | | | | 541,945 | |
| f | | Endo DAC/Endo Finance LLC/Endo Finco Inc., | | | | | | | | | | | | |
| | senior bond, 144A, 6.00%, 2/01/25 | | | United States | | | | 970,000 | | | | 700,825 | |
| | senior note, 144A, 6.00%, 7/15/23 | | | United States | | | | 400,000 | | | | 307,000 | |
| f | | Jaguar Holding Co. II/Pharmaceutical Product Development LLC, senior note, 144A, 6.375%, 8/01/23 | | | United States | | | | 970,000 | | | | 929,347 | |
| f | | SABIC Capital II BV, senior note, 144A, 4.50%, 10/10/28 | | | Saudi Arabia | | | | 600,000 | | | | 599,265 | |
| | | | | | | | | | | | | | |
| | | | | | | | | | | | | 8,099,795 | |
| | | | | | | | | | | | | | |
| | Real Estate 1.2% | | | | | | | | | | | | |
| | American Homes 4 Rent LP, senior bond, 4.25%, 2/15/28 | | | United States | | | | 647,000 | | | | 626,767 | |
| | American Tower Corp., senior bond, 3.375%, 10/15/26 | | | United States | | | | 1,940,000 | | | | 1,808,802 | |
| | Equinix Inc., | | | | | | | | | | | | |
| | senior bond, 5.375%, 4/01/23 | | | United States | | | | 1,617,000 | | | | 1,614,979 | |
| | senior bond, 5.875%, 1/15/26 | | | United States | | | | 100,000 | | | | 101,000 | |
| | MPT Operating Partnership LP/MPT Finance Corp., | | | | | | | | | | | | |
| | senior bond, 5.25%, 8/01/26. | | | United States | | | | 647,000 | | | | 613,032 | |
| | senior bond, 5.00%, 10/15/27 | | | United States | | | | 889,000 | | | | 815,102 | |
| | | | | | | | | | | | | | |
| | | | | | | | | | | | | 5,579,682 | |
| | | | | | | | | | | | | | |
| | Retailing 0.3% | | | | | | | | | | | | |
| | JD.com Inc., senior note, 3.125%, 4/29/21 | | | China | | | | 200,000 | | | | 193,987 | |
| c,d,i | | K2016470219 South Africa Ltd., senior secured note, 144A, PIK, 3.00%, 12/31/22 | | | South Africa | | | | 933,786 | | | | 1,150 | |
| d,i | | K2016470260 South Africa Ltd., senior secured note, 144A, PIK, 25.00%, 12/31/22 | | | South Africa | | | | 247,597 | | | | 17,607 | |
| f | | Party City Holdings Inc., senior note, 144A, 6.625%, 8/01/26 | | | United States | | | | 485,000 | | | | 442,563 | |
| f | | PetSmart Inc., senior secured note, first lien, 144A, 5.875%, 6/01/25 | | | United States | | | | 809,000 | | | | 588,547 | |
| | | | | | | | | | | | | | |
| | | | | | | | | | | | | 1,243,854 | |
| | | | | | | | | | | | | | |
| | Semiconductors & Semiconductor Equipment 0.0%† | | | | | | | | | | | | |
| | Maxim Integrated Products Inc., senior note, 3.375%, 3/15/23 | | | United States | | | | 100,000 | | | | 99,730 | |
| | | | | | | | | | | | | | |
| | Software & Services 0.8% | | | | | | | | | | | | |
| | Fiserv Inc., senior bond, 3.85%, 6/01/25 | | | United States | | | | 485,000 | | | | 481,569 | |
| | Infor (U.S.) Inc., senior note, 6.50%, 5/15/22 | | | United States | | | | 1,617,000 | | | | 1,569,945 | |
| f | | Symantec Corp., senior note, 144A, 5.00%, 4/15/25 | | | United States | | | | 1,778,000 | | | | 1,663,430 | |
| | | | | | | | | | | | | | |
| | | | | | | | | | | | | 3,714,944 | |
| | | | | | | | | | | | | | |
| | Technology Hardware & Equipment 0.4% | | | | | | | | | | | | |
| f | | CommScope Technologies LLC, | | | | | | | | | | | | |
| | senior bond, 144A, 6.00%, 6/15/25 | | | United States | | | | 324,000 | | | | 296,460 | |
| | senior bond, 144A, 5.00%, 3/15/27 | | | United States | | | | 1,374,000 | | | | 1,116,375 | |
| | Juniper Networks Inc., senior bond, 5.95%, 3/15/41 | | | United States | | | | 100,000 | | | | 99,503 | |
| | Tech Data Corp., senior bond, 4.95%, 2/15/27 | | | United States | | | | 200,000 | | | | 188,136 | |
| | | | | | | | | | | | | | |
| | | | | | | | | | | | | 1,700,474 | |
| | | | | | | | | | | | | | |
| | Telecommunication Services 1.8% | | | | | | | | | | | | |
| f | | Digicel Group Ltd., senior note, 144A, 8.25%, 9/30/20 | | | Bermuda | | | | 1,000,000 | | | | 682,000 | |
| f | | Digicel Ltd., senior note, 144A, 6.00%, 4/15/21 | | | Bermuda | | | | 1,000,000 | | | | 904,290 | |
| | Hughes Satellite Systems Corp., senior bond, 6.625%, 8/01/26 | | | United States | | | | 1,294,000 | | | | 1,188,862 | |
FRANKLIN TEMPLETON VARIABLE INSURANCE PRODUCTS TRUST
CONSOLIDATED STATEMENT OF INVESTMENTS
Franklin Strategic Income VIP Fund(continued)
| | | | | | | | | | | | | | |
| | | | |
| | | | | Country | | | Principal Amount* | | | Value | |
| | | Corporate Bonds(continued) | | | | | | | | | |
| | Telecommunication Services(continued) | | | | | | | | | | | | |
| | Sprint Communications Inc., | | | | | | | | | | | | |
| | senior note, 6.00%, 11/15/22 | | | United States | | | | 405,000 | | | $ | 398,451 | |
| | f senior note, 144A, 7.00%, 3/01/20 | | | United States | | | | 647,000 | | | | 664,793 | |
| | Sprint Corp., senior bond, 7.875%, 9/15/23 | | | United States | | | | 405,000 | | | | 416,644 | |
| f | | Sprint Spectrum Co. LLC, senior secured bond, first lien, 144A, 5.152%, 9/20/29 | | | United States | | | | 594,000 | | | | 585,090 | |
| | T-Mobile USA Inc., | | | | | | | | | | | | |
| | senior bond, 6.50%, 1/15/24 | | | United States | | | | 405,000 | | | | 417,223 | |
| | senior bond, 6.375%, 3/01/25 | | | United States | | | | 1,051,000 | | | | 1,066,723 | |
| | senior note, 6.00%, 4/15/24 | | | United States | | | | 200,000 | | | | 200,500 | |
| | Verizon Communications Inc., senior note, 5.15%, 9/15/23 | | | United States | | | | 1,617,000 | | | | 1,723,745 | |
| | | | | | | | | | | | | | |
| | | | | | | | | | | | | 8,248,321 | |
| | | | | | | | | | | | | | |
| | Transportation 0.9% | | | | | | | | | | | | |
| f | | DAE Funding LLC, | | | | | | | | | | | | |
| | senior note, 144A, 4.50%, 8/01/22 | | | United Arab Emirates | | | | 324,000 | | | | 311,040 | |
| | senior note, 144A, 5.00%, 8/01/24 | | | United Arab Emirates | | | | 1,294,000 | | | | 1,255,180 | |
| f | | Park Aerospace Holdings Ltd., senior note, 144A, 5.25%, 8/15/22 | | | Ireland | | | | 809,000 | | | | 790,894 | |
| f | | Transurban Finance Co. Pty. Ltd., senior secured bond, 144A, 3.375%, 3/22/27 | | | Australia | | | | 889,000 | | | | 828,686 | |
| | United Airlines, senior bond, 3.45%, 1/07/30 | | | United States | | | | 766,236 | | | | 741,829 | |
| | | | | | | | | | | | | | |
| | | | | | | | | | | | | 3,927,629 | |
| | | | | | | | | | | | | | |
| | | Utilities 3.4% | | | | | | | | | |
| | Calpine Corp., | | | | | | | | | | | | |
| | senior bond, 5.75%, 1/15/25 | | | United States | | | | 970,000 | | | | 889,975 | |
| | senior note, 5.375%, 1/15/23 | | | United States | | | | 1,051,000 | | | | 987,940 | |
| f | | Clearway Energy Operating LLC, senior note, 144A, 5.75%, 10/15/25 | | | United States | | | | 1,132,000 | | | | 1,085,305 | |
| f | | Colbun SA, senior note, 144A, 3.95%, 10/11/27 | | | Chile | | | | 700,000 | | | | 649,355 | |
| | Dominion Energy Inc., senior bond, 2.85%, 8/15/26 | | | United States | | | | 889,000 | | | | 821,008 | |
| f,g | | EDF SA, junior sub. note, 144A, 5.25% to 1/29/23, FRN thereafter, Perpetual | | | France | | | | 2,425,000 | | | | 2,299,434 | |
| | Exelon Corp., senior bond, 3.95%, 6/15/25 | | | United States | | | | 1,455,000 | | | | 1,440,979 | |
| f | | InterGen NV, secured bond, 144A, 7.00%, 6/30/23 | | | Netherlands | | | | 700,000 | | | | 602,875 | |
| f | | Israel Electric Corp. Ltd., secured bond, 144A, 4.25%, 8/14/28 | | | Israel | | | | 1,000,000 | | | | 955,985 | |
| | The Southern Co., senior bond, 3.25%, 7/01/26 | | | United States | | | | 2,410,000 | | | | 2,262,429 | |
| f | | State Grid Overseas Investment 2016 Ltd., senior note, 144A, 3.50%, 5/04/27 | | | China | | | | 1,051,000 | | | | 1,013,768 | |
| f | | Talen Energy Supply LLC, senior note, 144A, 9.50%, 7/15/22 | | | United States | | | | 1,374,000 | | | | 1,387,740 | |
| f | | Three Gorges Finance I Cayman Islands Ltd., senior note, 144A, 3.15%, 6/02/26 | | | China | | | | 1,051,000 | | | | 995,118 | |
| | Virginia Electric & Power Co., senior bond, 6.35%, 11/30/37 | | | United States | | | | 85,000 | | | | 104,992 | |
| | | | | | | | | | | | | | |
| | | | | | | | | | | | | 15,496,903 | |
| | | | | | | | | | | | | | |
| | | | |
| | Total Corporate Bonds (Cost $204,312,653) | | | | | | | | | | | 191,438,598 | |
| | | | | | | | | | | | | | |
FRANKLIN TEMPLETON VARIABLE INSURANCE PRODUCTS TRUST
CONSOLIDATED STATEMENT OF INVESTMENTS
Franklin Strategic Income VIP Fund(continued)
| | | | | | | | | | | | | | |
| | | | |
| | | | | Country | | | Principal Amount* | | | Value | |
| | | | |
| l,m | | Senior Floating Rate Interests 13.9% | | | | | | | | | | | | |
| | Automobiles & Components 1.1% | | | | | | | | | | | | |
| | Allison Transmission Inc., New Term Loans, 4.26%,(1-month USD LIBOR + 1.75%), 9/23/22 | | | United States | | | | 828,930 | | | $ | 819,812 | |
| n,o | | Thor Industries Inc., Term Loan B, TBD, 10/30/25 | | | United States | | | | 2,671,233 | | | | 2,537,671 | |
| | TI Group Automotive Systems LLC, Initial US Term Loan, 5.022%,(1-month USD LIBOR + 2.50%), 6/30/22 | | | United States | | | | 1,823,170 | | | | 1,743,406 | |
| | | | | | | | | | | | | | |
| | | | | | | | | | | | | 5,100,889 | |
| | | | | | | | | | | | | | |
| | Capital Goods 0.1% | | | | | | | | | | | | |
| | Altra Industrial Motion Corp., Term Loan, 4.522%,(1-month USD LIBOR + 2.00%), 10/01/25 | | | United States | | | | 248,632 | | | | 238,065 | |
| | Doncasters U.S. Finance LLC, Second Lien Term Loan, 11.053%,(3-month USD LIBOR + 8.25%), 10/09/20 | | | United States | | | | 76,700 | | | | 61,073 | |
| | Harsco Corp., Term LoanB-2, 4.813%,(1-month USD LIBOR + 2.25%), 12/10/24 | | | United States | | | | 230,267 | | | | 226,525 | |
| | | | | | | | | | | | | | |
| | | | | | | | | | | | | 525,663 | |
| | | | | | | | | | | | | | |
| | Commercial & Professional Services 0.4% | | | | | | | | | | | | |
| | KAR Auction Services Inc., TrancheB-5 Term Loans, 5.313%,(3-month USD LIBOR + 2.50%), 3/09/23 | | | United States | | | | 680,856 | | | | 664,969 | |
| | United Rentals North America Inc., Initial Term Loans, 4.272%,(1-month USD LIBOR + 1.75%), 10/30/25 | | | United States | | | | 1,321,324 | | | | 1,294,237 | |
| | | | | | | | | | | | | | |
| | | | | | | | | | | | | 1,959,206 | |
| | | | | | | | | | | | | | |
| | Consumer Services 0.7% | | | | | | | | | | | | |
| | Aristocrat Technologies Inc., TermB-3 Loans, 4.219%,(3-month USD LIBOR + 1.75%), 10/19/24 | | | United States | | | | 880,321 | | | | 844,008 | |
| | Avis Budget Car Rental LLC, Tranche B Term Loans, 4.53%,(1-month USD LIBOR + 2.00%), 2/13/25 | | | United States | | | | 1,019,021 | | | | 985,057 | |
| | Eldorado Resorts Inc., Initial Term Loan, 4.75%,(2-month USD LIBOR + 2.00%), 4/17/24 | | | United States | | | | 345,096 | | | | 330,429 | |
| | Las Vegas Sands LLC, Term B Loans, 4.272%,(1-month USD LIBOR + 1.75%), 3/27/25 | | | United States | | | | 843,625 | | | | 807,244 | |
| | | | | | | | | | | | | | |
| | | | | | | | | | | | | 2,966,738 | |
| | | | | | | | | | | | | | |
| | Diversified Financials 0.2% | | | | | | | | | | | | |
| | Trans Union LLC, 2017 Replacement TermA-2 Loans, 4.272%, | | | | | | | | | | | | |
| | (1-month USD LIBOR + 1.75%), 8/09/22 | | | United States | | | | 807,139 | | | | 781,916 | |
| | | | | | | | | | | | | | |
| | Energy 1.8% | | | | | | | | | | | | |
| | Bowie Resource Holdings LLC, | | | | | | | | | | | | |
| | First Lien Initial Term Loan, 8.457%,(3-month USD LIBOR + 5.75%), 8/14/20 | | | United States | | | | 2,055,747 | | | | 2,001,784 | |
| | Second Lien Initial Term Loan, 13.457%,(3-month USD LIBOR + 10.75%), 2/16/21 | | | United States | | | | 1,248,332 | | | | 1,179,674 | |
| | Fieldwood Energy LLC, Closing Date Loans, 7.772%,(1-month USD LIBOR + 5.25%), 4/11/22 | | | United States | | | | 4,096,974 | | | | 3,856,297 | |
| | Foresight Energy LLC, Term Loans, 8.277%,(3-month USD LIBOR + 5.75%), 3/28/22 | | | United States | | | | 1,147,018 | | | | 1,128,857 | |
| | | | | | | | | | | | | | |
| | | | | | | | | | | | | 8,166,612 | |
| | | | | | | | | | | | | | |
FRANKLIN TEMPLETON VARIABLE INSURANCE PRODUCTS TRUST
CONSOLIDATED STATEMENT OF INVESTMENTS
Franklin Strategic Income VIP Fund(continued)
| | | | | | | | | | | | | | |
| | | | |
| | | | | Country | | | Principal Amount* | | | Value | |
| l,m | | Senior Floating Rate Interests(continued) | | | | | | | | | |
| | | Food & Staples Retailing 0.3% | | | | | | | | | |
| | Aramark Corp., U.S. TermB-3 Loan, 4.272%,(1-month USD LIBOR + 1.75%), 3/11/25 | | | United States | | | | 359,644 | | | $ | 349,451 | |
| | | Smart & Final Stores LLC, First Lien Term Loan, 6.022%,(1-month USD LIBOR + 3.50%), 11/15/22 | | | United States | | | | 1,157,580 | | | | 1,074,620 | |
| | | | | | | | | | | | | | |
| | | | | | | | | | | | | 1,424,071 | |
| | | | | | | | | | | | | | |
| | | Food, Beverage & Tobacco 0.4% | | | | | | | | | |
| | JBS USA Lux S.A., | | | | | | | | | | | | |
| | New Initial Term Loans, 5.022%,(1-month USD LIBOR + 2.50%), 10/30/22 | | | United States | | | | 310,515 | | | | 299,744 | |
| | New Initial Term Loans, 5.301%,(3-month USD LIBOR + 2.50%), 10/30/22 | | | United States | | | | 1,811,294 | | | | 1,748,464 | |
| | | | | | | | | | | | | | |
| | | | | | | | | | | | | 2,048,208 | |
| | | | | | | | | | | | | | |
| | | Health Care Equipment & Services 0.8% | | | | | | | | | |
| | DaVita Healthcare Partners Inc., Tranche B Term Loan, 5.272%,(1-month USD LIBOR + 2.75%), 6/24/21 | | | United States | | | | 1,108,394 | | | | 1,099,041 | |
| | HCA Inc., Term Loan B11, 4.272%,(1-month USD LIBOR + 1.75%), 3/18/23 | | | United States | | | | 488,867 | | | | 478,478 | |
| | IQVIA Inc., TermB-3 Dollar Loans, 4.272%,(1-month USD LIBOR + 1.75%), 6/11/25 | | | United States | | | | 698,564 | | | | 677,171 | |
| | Quintiles IMS Inc., TermB-2 Dollar Loans, 4.522%,(1-month USD LIBOR + 2.00%), 1/20/25 | | | United States | | | | 1,145,123 | | | | 1,111,628 | |
| | U.S. Renal Care Inc., Initial Term Loan, 7.053%,(3-month USD LIBOR + 4.25%), 12/31/22 | | | United States | | | | 466,291 | | | | 445,541 | |
| | | | | | | | | | | | | | |
| | | | | | | | | | | | | 3,811,859 | |
| | | | | | | | | | | | | | |
| | | Household & Personal Products 0.2% | | | | | | | | | |
| | Spectrum Brands, Inc., | | | | | | | | | | | | |
| | USD Term Loans, 4.39% - 4.53%,(1-month USD LIBOR + 2.00%), 6/23/22 | | | United States | | | | 709,336 | | | | 692,933 | |
| | USD Term Loans, 4.59%,(3-month USD LIBOR + 2.00%), 6/23/22 | | | United States | | | | 229,177 | | | | 223,877 | |
| | | | | | | | | | | | | 916,810 | |
| | | Materials 1.6% | | | | | | | | | |
| | Ashland LLC, Term B Loan, 4.254% - 4.272%,(1-month USD LIBOR + 1.75%), 5/17/24 | | | United States | | | | 2,432,859 | | | | 2,377,110 | |
| | Axalta Coating Systems U.S. Holdings Inc., TermB-3 Dollar Loan, 4.553%,(3-month USD LIBOR + 1.75%), 6/01/24 | | | United States | | | | 572,455 | | | | 541,208 | |
| | Chemours Co., TrancheB-2 US$ Term Loan, 4.28%,(1-month USD LIBOR + 1.75%), 4/03/25 | | | United States | | | | 1,336,672 | | | | 1,286,547 | |
| | Crown Americas LLC, Dollar Term B Loan, 4.479%,(1-month USD LIBOR + 2.00%), 4/03/25 | | | United States | | | | 1,143,355 | | | | 1,138,829 | |
| | Oxbow Carbon LLC, | | | | | | | | | | | | |
| | Tranche A Term Loan, 4.772%,(1-month USD LIBOR + 2.25%), 1/04/22 | | | United States | | | | 1,215,000 | | | | 1,202,850 | |
| | Tranche B Term Loan, 6.022%,(1-month USD LIBOR + 3.50%), 1/04/23 | | | United States | | | | 532,000 | | | | 522,690 | |
| | | | | | | | | | | | | | |
| | | | | | | | | | | | | 7,069,234 | |
| | | | | | | | | | | | | | |
FRANKLIN TEMPLETON VARIABLE INSURANCE PRODUCTS TRUST
CONSOLIDATED STATEMENT OF INVESTMENTS
Franklin Strategic Income VIP Fund(continued)
| | | | | | | | | | | | | | |
| | | | |
| | | | | Country | | | Principal Amount* | | | Value | |
l,m | | Senior Floating Rate Interests(continued) | | | | | | | | | | | | |
| | Media & Entertainment 1.6% | | | | | | | | | | | | |
| | AMC Entertainment Holdings Inc., | | | | | | | | | | | | |
| | 2016 Incremental Term Loans, 4.705%,(1-month USD LIBOR + 2.25%), 12/15/23 | | | United States | | | | 732,334 | | | $ | 707,160 | |
| | Initial Term Loans, 4.705%,(1-month USD LIBOR + 2.25%), 12/15/22. | | | United States | | | | 984,044 | | | | 950,832 | |
| | Charter Communications Operating LLC, TermA-2 Loan, 4.03%,(1-month USD LIBOR + 1.50%), 3/31/23 | | | United States | | | | 892,450 | | | | 859,727 | |
| | CSC Holdings LLC, March 2017 Incremental Term Loans, 4.705%,(1-month USD LIBOR + 2.25%), 7/17/25 | | | United States | | | | 1,215,686 | | | | 1,148,824 | |
| | Gray Television Inc., | | | | | | | | | | | | |
| | TermB-2 Loan, 4.599%,(1-month USD LIBOR + 2.25%), 2/07/24 | | | United States | | | | 843,033 | | | | 813,527 | |
| | n,oTerm Loan C, TBD, 1/02/26 | | | United States | | | | 631,269 | | | | 611,769 | |
| | Lions Gate Capital Holdings LLC, Term A Loan, 4.272%,(1-month USD LIBOR + 1.75%), 3/22/23 | | | Canada | | | | 255,898 | | | | 249,500 | |
| | Live Nation Entertainment Inc., TermB-3 Loans, 4.313%,(1-month USD LIBOR + 1.75%), 10/31/23 | | | United States | | | | 574,156 | | | | 563,032 | |
| | Mediacom Illinois LLC, Tranche N Term Loan, 4.17%,(1-week USD LIBOR + 1.75%), 2/15/24 | | | United States | | | | 1,662,147 | | | | 1,583,195 | |
| | | | | | | | | | | | | | |
| | | | | | | | | | | | | 7,487,566 | |
| | | | | | | | | | | | | | |
| | Pharmaceuticals, Biotechnology & Life Sciences 0.8% | | | | | | | | | | | | |
| | Bausch Health Cos. Inc., Initial Term Loans, 5.379%,(1-month USD LIBOR + 3.00%), 6/02/25 | | | United States | | | | 302,583 | | | | 290,480 | |
| | Endo Luxembourg Finance Co. I S.A.R.L. and Endo LLC, Initial Term Loans, 6.813%,(1-month USD LIBOR + 4.25%), 4/29/24 | | | United States | | | | 2,226,417 | | | | 2,103,964 | |
| | Valeant Pharmaceuticals International, First Incremental Term Loan, 5.129%,(1-month USD LIBOR + 2.75%), 11/27/25 | | | United States | | | | 1,481,250 | | | | 1,409,039 | |
| | | | | | | | | | | | | | |
| | | | | | | | | | | | | 3,803,483 | |
| | | | | | | | | | | | | | |
| | Retailing 1.5% | | | | | | | | | | | | |
| | Ascena Retail Group Inc., Tranche B Term Loan, 7.063%,(1-month USD LIBOR + 4.50%), 8/21/22 | | | United States | | | | 2,952,482 | | | | 2,755,300 | |
| | General Nutrition Centers Inc., TrancheB-2 Term Loans, 11.78%,(1-month USD LIBOR + 9.25%), 3/04/21 | | | United States | | | | 872,455 | | | | 813,565 | |
| | Harbor Freight Tools USA Inc., Refinancing Loans, 5.022%,(1-month USD LIBOR + 2.50%), 8/19/23 | | | United States | | | | 1,963,344 | | | | 1,859,449 | |
| | Jo-Ann Stores Inc., Initial Loans, 7.477%,(3-month USD LIBOR + 5.00%), 10/23/23 | | | United States | | | | 1,353,119 | | | | 1,285,463 | |
| | | | | | | | | | | | | | |
| | | | | | | | | | | | | 6,713,777 | |
| | | | | | | | | | | | | | |
| | Semiconductors & Semiconductor Equipment 0.3% | | | | | | | | | | | | |
| | MKS Instruments Inc., TrancheB-4 Term Loan, 4.272%,(1-month USD LIBOR + 1.75%), 4/29/23 | | | United States | | | | 262,472 | | | | 260,176 | |
| | ON Semiconductor Corp., 2018 New Replacement TermB-3 Loans, 4.272%,(1-month USD LIBOR + 1.75%), 3/31/23 | | | United States | | | | 1,139,956 | | | | 1,103,263 | |
| | | | | | | | | | | | | | |
| | | | | | | | | | | | | 1,363,439 | |
| | | | | | | | | | | | | | |
FRANKLIN TEMPLETON VARIABLE INSURANCE PRODUCTS TRUST
CONSOLIDATED STATEMENT OF INVESTMENTS
Franklin Strategic Income VIP Fund(continued)
| | | | | | | | | | | | | | |
| | | | |
| | | | | Country | | | Principal Amount* | | | Value | |
| | | | |
| l,m | | Senior Floating Rate Interests(continued) | | | | | | | | | | | | |
| | Software & Services 0.2% | | | | | | | | | | | | |
| | LegalZoom.com Inc., 2018 Term Loans, 7.004%,(1-month USD LIBOR + 4.50%), 11/21/24 | | | United States | | | | 185,484 | | | $ | 182,701 | |
| | Wex Inc., TermB-2 Loan, 4.772%,(1-month USD LIBOR + 2.25%), 7/01/23 | | | United States | | | | 646,623 | | | | 624,315 | |
| | | | | | | | | | | | | | |
| | | | | | | | | | | | | 807,016 | |
| | | | | | | | | | | | | | |
| | Technology Hardware & Equipment 0.2% | | | | | | | | | | | | |
| | CommScope Inc., Tranche 5 Term Loans, 4.522%,(1-month USD LIBOR + 2.00%), 12/29/22 | | | United States | | | | 833,939 | | | | 792,242 | |
| | | | | | | | | | | | | | |
| | Telecommunication Services 0.1% | | | | | | | | | | | | |
| | Global Tel*Link Corp., First Lien Term Loan, 6.956%,(3-month USD LIBOR + 4.25%), 11/29/25 | | | United States | | | | 271,511 | | | | 264,723 | |
| | | | | | | | | | | | | | |
| | Transportation 0.8% | | | | | | | | | | | | |
| | Hertz Corp., TrancheB-1 Term Loan, 5.28%,(1-month USD LIBOR + 2.75%), 6/30/23 | | | United States | | | | 1,676,347 | | | | 1,619,351 | |
| | International Seaways Operating Corp., Initial Term Loans, 8.53%,(1-month USD LIBOR + 6.00%), 6/22/22 | | | United States | | | | 662,173 | | | | 655,552 | |
| | Navios Maritime Midstream Partners LP, Initial Term Loan, 7.30%,(3-month USD LIBOR + 4.50%), 6/18/20 | | | Marshall Islands | | | | 1,259,456 | | | | 1,215,375 | |
| | | | | | | | | | | | | | |
| | | | | | | | | | | | | 3,490,278 | |
| | | | | | | | | | | | | | |
| | | Utilities 0.8% | | | | | | | | | |
| | EFS Cogen Holdings I LLC (Linden), | | | | | | | | | | | | |
| | Term B Advance, 5.78%,(1-month USD LIBOR + 3.25%), 6/28/23 | | | United States | | | | 717,328 | | | | 701,726 | |
| | Term B Advance, 6.06%,(3-month USD LIBOR + 3.25%), 6/28/23 | | | United States | | | | 2,069,901 | | | | 2,024,881 | |
| | NRG Energy Inc., Term Loan B, 4.272%,(1-month USD LIBOR + 1.75%), 6/30/23 | | | United States | | | | 848,250 | | | | 818,443 | |
| | | | | | | | | | | | | | |
| | | | | | | | | | | | | 3,545,050 | |
| | | | | | | | | | | | | | |
| | | | |
| | Total Senior Floating Rate Interests
(Cost $65,211,363) | | | | | | | | | | | 63,038,780 | |
| | | | | | | | | | | | | | |
| | Foreign Government and Agency Securities 3.2% | | | | | | | | | | | | |
| f | | The Export-Import Bank of India, senior note, 144A, 3.875%, 2/01/28 . | | | India | | | | 1,455,000 | | | | 1,367,184 | |
| | Government of Hungary, senior note, 6.25%, 1/29/20 | | | Hungary | | | | 1,213,000 | | | | 1,249,329 | |
| | Government of Indonesia, | | | | | | | | | | | | |
| | senior bond, FR64, 6.125%, 5/15/28 | | | Indonesia | | | | 26,500,000,000 | IDR | | | 1,625,937 | |
| | senior bond, FR70, 8.375%, 3/15/24 | | | Indonesia | | | | 19,648,000,000 | IDR | | | 1,388,613 | |
| | Government of Mexico, senior bond, M, 6.50%, 6/10/21 | | | Mexico | | | | 293,000 | p MXN | | | 1,425,673 | |
| f | | Government of Serbia, | | | | | | | | | | | | |
| | senior note, 144A, 4.875%, 2/25/20. | | | Serbia | | | | 3,233,000 | | | | 3,262,630 | |
| | senior note, 144A, 7.25%, 9/28/21 | | | Serbia | | | | 200,000 | | | | 215,637 | |
| f | | Government of Ukraine, | | | | | | | | | | | | |
| | 144A, 7.75%, 9/01/22 | | | Ukraine | | | | 200,000 | | | | 184,250 | |
| | 144A, 7.75%, 9/01/23 | | | Ukraine | | | | 369,000 | | | | 333,484 | |
| | 144A, 7.75%, 9/01/24 | | | Ukraine | | | | 369,000 | | | | 325,796 | |
| | 144A, 7.75%, 9/01/25 | | | Ukraine | | | | 369,000 | | | | 320,967 | |
| | 144A, 7.75%, 9/01/26 | | | Ukraine | | | | 369,000 | | | | 315,956 | |
| | 144A, 7.75%, 9/01/27 | | | Ukraine | | | | 369,000 | | | | 313,650 | |
| | a,q 144A, VRI, GDP Linked Security, 5/31/40 | | | Ukraine | | | | 1,378,000 | | | | 793,873 | |
FRANKLIN TEMPLETON VARIABLE INSURANCE PRODUCTS TRUST
CONSOLIDATED STATEMENT OF INVESTMENTS
Franklin Strategic Income VIP Fund(continued)
| | | | | | | | | | | | | | |
| | | | |
| | | | | Country | | | Principal Amount* | | | Value | |
| | Foreign Government and Agency Securities(continued) | | | | | | | | | | | | |
| | Nota Do Tesouro Nacional, | | | | | | | | | | | | |
| | | 10.00%, 1/01/21 | | | Brazil | | | | 2,900r | BRL | | $ | 781,673 | |
| | 10.00%, 1/01/23 | | | Brazil | | | | 2,800r | BRL | | | 756,376 | |
| | | | | | | | | | | | | | |
| | | | |
| | Total Foreign Government and Agency Securities
(Cost $14,654,573) | | | | | | | | | | | 14,661,028 | |
| | | | | | | | | | | | | | |
| | | U.S. Government and Agency Securities 4.0% | | | | | | | | | |
| | U.S. Treasury Bond, | | | | | | | | | | | | |
| | 7.875%, 2/15/21 | | | United States | | | | 728,000 | | | | 808,394 | |
| | 6.50%, 11/15/26 | | | United States | | | | 1,940,000 | | | | 2,474,699 | |
| | 3.00%, 11/15/45 | | | United States | | | | 4,041,000 | | | | 4,041,275 | |
| | s Index Linked, 0.625%, 1/15/24 | | | United States | | | | 2,987,340 | | | | 2,941,674 | |
| | U.S. Treasury Note, 2.75%, 2/15/24 | | | United States | | | | 809,000 | | | | 817,870 | |
| | s Index Linked, 0.125%, 7/15/24 | | | United States | | | | 7,333,107 | | | | 7,034,492 | |
| | | | | | | | | | | | | | |
| | | | |
| | Total U.S. Government and Agency Securities
(Cost $18,553,185) | | | | | | | | | | | 18,118,404 | |
| | | | | | | | | | | | | | |
| | Asset-Backed Securities and Commercial Mortgage- Backed Securities 21.0% | | | | | | | | | | | | |
| | | Banks 0.6% | | | | | | | | | |
| | Citigroup Commercial Mortgage Trust,2006-C5, AJ, 5.482%, 10/15/49 | | | United States | | | | 277,616 | | | | 266,709 | |
| t | | Commercial Mortgage Trust,2006-GG7, AJ, FRN, 5.692%, 7/10/38 | | | United States | | | | 845,000 | | | | 778,542 | |
| | CSAIL Commercial Mortgage Trust,2015-C1, A4, 3.505%, 4/15/50 | | | United States | | | | 740,000 | | | | 743,164 | |
| t | | CWABS Asset-Backed Certificates Trust,2005-11, AF4, FRN, 5.21%, 3/25/34 | | | United States | | | | 893,436 | | | | 899,948 | |
| u | | Merrill Lynch Mortgage Investors Trust,2005-A6, 2A3, FRN, 2.886%,(1-month USD LIBOR + 0.38%), 8/25/35 | | | United States | | | | 102,196 | | | | 102,035 | |
| | | | | | | | | | | | | | |
| | | | | | | | | | | | | 2,790,398 | |
| | | | | | | | | | | | | | |
| | | Diversified Financials 20.4% | | | | | | | | | |
| f,u | | AMMC CLO XI Ltd., | | | | | | | | | | | | |
| | 2012-11A, BR2, 144A, FRN, 4.12%,(3-month USD LIBOR + 1.60%), 4/30/31 | | | United States | | | | 350,000 | | | | 338,632 | |
| | 2012-11A, DR2, 144A, FRN, 5.37%,(3-month USD LIBOR + 2.85%), 4/30/31 | | | United States | | | | 300,000 | | | | 274,701 | |
| f,u | | Antares CLO Ltd.,2018-1A, B, 144A, FRN, 4.119%,(3-month USD LIBOR + 1.65%), 4/20/31 | | | United States | | | | 1,455,000 | | | | 1,369,999 | |
| f,u | | Ares CLO Ltd.,2018-48A, D, 144A, FRN, 5.039%,(3-month USD LIBOR + 2.70%), 7/20/30 | | | United States | | | | 400,000 | | | | 361,988 | |
| f,t | | ARES L CLO Ltd.,2018-50A, B, 144A, FRN, 4.478%, 1/15/32 | | | United States | | | | 500,000 | | | | 496,220 | |
| f,u | | Ares XLIII CLO Ltd.,2017-43A, A, 144A, FRN, 3.656%,(3-month USD LIBOR + 1.22%), 10/15/29 | | | United States | | | | 432,000 | | | | 428,859 | |
| f,u | | Atrium VIII, | | | | | | | | | | | | |
| | 8A, BR, 144A, FRN, 4.377%,(3-month USD LIBOR + 1.90%), 10/23/24 | | | United States | | | | 350,000 | | | | 350,004 | |
| | 8A, CR, 144A, FRN, 4.977%,(3-month USD LIBOR + 2.50%), 10/23/24 | | | United States | | | | 470,000 | | | | 467,048 | |
FRANKLIN TEMPLETON VARIABLE INSURANCE PRODUCTS TRUST
CONSOLIDATED STATEMENT OF INVESTMENTS
Franklin Strategic Income VIP Fund(continued)
| | | | | | | | | | | | | | |
| | | | |
| | | | | Country | | | Principal Amount* | | | Value | |
| | | Asset-Backed Securities and Commercial Mortgage-
Backed Securities(continued) | | | | | | | | | |
| | | Diversified Financials(continued) | | | | | | | | | |
| f,t | | Atrium XIV LLC, 14A, D, 144A, FRN, 5.307%, 8/23/30 | | | United States | | | | 750,000 | | | $ | 694,523 | |
| | Banc of America Commercial Mortgage Trust, | | | | | | | | | | | | |
| | 2015-UBS7, A3, 3.441%, 9/15/48 | | | United States | | | | 849,000 | | | | 847,903 | |
| | 2015-UBS7, A4, 3.705%, 9/15/48 | | | United States | | | | 946,000 | | | | 958,167 | |
| | t2015-UBS7, B, FRN, 4.362%, 9/15/48 | | | United States | | | | 615,000 | | | | 615,151 | |
| f,t | | BBC Middle Market CLO LLC,2018-1A, A2, 144A, FRN, 4.369%, 10/20/30 | | | United States | | | | 700,000 | | | | 676,067 | |
| f,t | | BCAP LLC Trust,2009-RR1, 2A2, 144A, FRN, 4.506%, 5/26/35 | | | United States | | | | 260,914 | | | | 255,998 | |
| f,u | | Betony CLO 2 Ltd.,2018-1A, C, 144A, FRN, 5.42%,(3-month USD LIBOR + 2.90%), 4/30/31 | | | United States | | | | 400,000 | | | | 369,624 | |
| f,t | | BlueMountain CLO Ltd., | | | | | | | | | | | | |
| | 2012-2A, BR2, 144A, FRN, 4.095%, 11/20/28 | | | United States | | | | 510,000 | | | | 504,099 | |
| | 2012-2A, CR2, 144A, FRN, 4.645%, 11/20/28 | | | United States | | | | 270,000 | | | | 260,634 | |
| | 2018-1A, D, 144A, FRN, 5.57%, 7/30/30 | | | United States | | | | 1,000,000 | | | | 948,540 | |
| f,u | | BlueMountain Fuji U.S. CLO II Ltd.,2017-2A, A1A, 144A, FRN, 3.548%,(3-month USD LIBOR + 1.20%), 10/20/30 | | | United States | | | | 1,455,000 | | | | 1,445,455 | |
| f,u | | BlueMountain Fuji U.S. CLO III Ltd.,2017-3A, A2, 144A, FRN, 3.489%,(3-month USD LIBOR + 1.15%), 1/15/30 | | | United States | | | | 200,000 | | | | 197,150 | |
| f | | Burnham Park CLO Ltd., | | | | | | | | | | | | |
| | u2016-1A, A, 144A, FRN, 3.899%,(3-month USD LIBOR + 1.43%), 10/20/29 | | | United States | | | | 350,000 | | | | 349,458 | |
| | t2016-1A, BR, 144A, FRN, 3.969%, 10/20/29 | | | United States | | | | 460,000 | | | | 448,836 | |
| | t2016-1A, CR, 144A, FRN, 4.619%, 10/20/29 | | | United States | | | | 460,000 | | | | 445,354 | |
| f,t | | Buttermilk Park CLO Ltd.,2018-1A, C, 144A, FRN, 4.438%, 10/15/31 | | | United States | | | | 1,408,860 | | | | 1,346,194 | |
| u | | Capital One Multi-Asset Execution Trust, | | | | | | | | | | | | |
| | 2014-A3, A3, FRN, 2.835%,(1-month USD LIBOR + 0.38%), 1/18/22 | | | United States | | | | 300,000 | | | | 300,041 | |
| | 2016-A1, A1, FRN, 2.905%,(1-month USD LIBOR + 0.45%), 2/15/22 | | | United States | | | | 2,385,000 | | | | 2,387,273 | |
| | 2016-A2, A2, FRN, 3.085%,(1-month USD LIBOR + 0.63%), 2/15/24 | | | United States | | | | 3,225,000 | | | | 3,244,482 | |
| f,u | | Carlyle Global Market Strategies CLO Ltd., | | | | | | | | | | | | |
| | 2012-4A, BR, 144A, FRN, 4.369%,(3-month USD LIBOR + 1.90%), 1/20/29 | | | United States | | | | 500,000 | | | | 497,975 | |
| | 2012-4A, C1R, 144A, FRN, 5.069%,(3-month USD LIBOR + 2.60%), 1/20/29 | | | United States | | | | 480,000 | | | | 476,491 | |
| | 2014-4RA, C, 144A, FRN, 5.336%,(3-month USD LIBOR + 2.90%), 7/15/30 | | | United States | | | | 300,000 | | | | 279,231 | |
| f,t | | Carlyle GMS Finance MM CLO LLC,2015-1A, A2R, 144A, FRN, 4.636%, 10/15/31 | | | United States | | | | 1,213,000 | | | | 1,166,312 | |
| f,u | | Carlyle U.S. CLO Ltd.,2017-2A, A1B, 144A, FRN, 3.689%,(3-month USD LIBOR + 1.22%), 7/20/31 | | | United States | | | | 1,150,000 | | | | 1,139,512 | |
| f,u | | Catamaran CLO Ltd.,2014-2A, BR, 144A, FRN, 5.395%,(3-month USD LIBOR + 2.95%), 10/18/26 | | | United States | | | | 1,253,000 | | | | 1,253,388 | |
| f,t | | CGRBS Commercial Mortgage Trust, 2013-VN05, C, 144A, FRN, 3.584%, 3/13/35 | | | United States | | | | 704,000 | | | | 705,157 | |
| f,t | | Cole Park CLO Ltd.,2015-1A, BR, 144A, FRN, 4.075%, 10/20/28 | | | United States | | | | 270,000 | | | | 268,415 | |
| t | | COMM Mortgage Trust, 2014-CR19, B, FRN, 4.703%, 8/10/47 | | | United States | | | | 704,000 | | | | 724,285 | |
| f | | Core Industrial Trust, 2015-CALW, A, 144A, 3.04%, 2/10/34 | | | United States | | | | 1,081,627 | | | | 1,078,534 | |
| u | | Discover Card Execution Note Trust,2016-A2, A2, FRN, 2.995%,(1-month USD LIBOR + 0.54%), 9/15/21 | | | United States | | | | 2,385,000 | | | | 2,386,703 | |
FRANKLIN TEMPLETON VARIABLE INSURANCE PRODUCTS TRUST
CONSOLIDATED STATEMENT OF INVESTMENTS
Franklin Strategic Income VIP Fund(continued)
| | | | | | | | | | | | | | |
| | | | |
| | | | | Country | | | Principal Amount* | | | Value | |
| | | Asset-Backed Securities and Commercial Mortgage-
Backed Securities(continued) | | | | | | | | | |
| | Diversified Financials(continued) | | | | | | | | | | | | |
| f,u | | Dryden 33 Senior Loan Fund, | | | | | | | | | | | | |
| | 2014-33A, BR, 144A, FRN, 4.286%,(3-month USD LIBOR + 1.85%), 10/15/28. | | | United States | | | | 535,000 | | | $ | 533,807 | |
| | 2014-33A, CR, 144A, FRN, 4.936%,(3-month USD LIBOR + 2.50%), 10/15/28 | | | United States | | | | 270,000 | | | | 265,383 | |
| f,t | | Dryden 38 Senior Loan Fund, | | | | | | | | | | | | |
| | 2015-38A, CR, 144A, FRN, 4.436%, 7/15/30 | | | United States | | | | 863,000 | | | | 817,183 | |
| | 2015-38A, DR, 144A, FRN, 5.436%, 7/15/30 | | | United States | | | | 557,000 | | | | 526,181 | |
| f,u | | Dryden 42 Senior Loan Fund,2016-42A, DR, 144A, FRN, 5.366%,(3-month USD LIBOR + 2.93%), 7/15/30 | | | United States | | | | 1,294,000 | | | | 1,206,526 | |
| f,u | | Dryden 55 CLO Ltd., | | | | | | | | | | | | |
| | 2018-55A, A1, 144A, FRN, 3.456%,(3-month USD LIBOR + 1.02%), 4/15/31 | | | United States | | | | 500,000 | | | | 492,225 | |
| | 2018-55A, D, 144A, FRN, 5.286%,(3-month USD LIBOR + 2.85%), 4/15/31 | | | United States | | | | 300,000 | | | | 278,526 | |
| f,u | | Dryden 64 CLO Ltd.,2018-64A, D, 144A, FRN, 5.095%,(3-month USD LIBOR + 2.65%), 4/18/31 | | | United States | | | | 300,000 | | | | 274,797 | |
| f,t | | Eaton Vance CLO Ltd., | | | | | | | | | | | | |
| | 2014-1RA, C, 144A, FRN, 4.257%, 7/15/30 | | | United States | | | | 315,610 | | | | 299,299 | |
| | 2014-1RA, D, 144A, FRN, 5.207%, 7/15/30 | | | United States | | | | 462,825 | | | | 431,510 | |
| f,t | | Eleven Madison Trust Mortgage Trust, 2015-11MD, A, 144A, FRN, 3.555%, 9/10/35 | | | United States | | | | 1,091,000 | | | | 1,099,326 | |
| u | | FHLMC Structured Agency Credit Risk Debt Note,2013-DN2, M2, FRN, 6.756%,(1-month USD LIBOR + 4.25%), 11/25/23 | | | United States | | | | 648,102 | | | | 706,330 | |
| u | | FHLMC Structured Agency Credit Risk Debt Notes, | | | | | | | | | | | | |
| | 2014-DN1, M2, FRN, 4.706%,(1-month USD LIBOR + 2.20%), 2/25/24 | | | United States | | | | 945,219 | | | | 963,012 | |
| | 2014-DN2, M3, FRN, 6.106%,(1-month USD LIBOR + 3.60%), 4/25/24 | | | United States | | | | 1,280,000 | | | | 1,381,501 | |
| | 2014-DN3, M3, FRN, 6.506%,(1-month USD LIBOR + 4.00%), 8/25/24 | | | United States | | | | 198,527 | | | | 213,563 | |
| | 2014-DN4, M3, FRN, 7.056%,(1-month USD LIBOR + 4.55%), 10/25/24 | | | United States | | | | 1,075,382 | | | | 1,177,795 | |
| | 2014-HQ1, M3, FRN, 6.606%,(1-month USD LIBOR + 4.10%), 8/25/24 | | | United States | | | | 380,000 | | | | 408,738 | |
| | 2014-HQ2, M2, FRN, 4.706%,(1-month USD LIBOR + 2.20%), 9/25/24 | | | United States | | | | 680,620 | | | | 695,182 | |
| | 2014-HQ3, M3, FRN, 7.256%,(1-month USD LIBOR + 4.75%), 10/25/24 | | | United States | | | | 787,402 | | | | 863,624 | |
| | 2015-DNA1, M3, FRN, 5.806%,(1-month USD LIBOR + 3.30%), 10/25/27 | | | United States | | | | 250,000 | | | | 271,459 | |
| | 2015-DNA3, M3, FRN, 7.206%,(1-month USD LIBOR + 4.70%), 4/25/28 | | | United States | | | | 1,819,000 | | | | 2,101,359 | |
| | 2015-HQ1, M2, FRN, 4.706%,(1-month USD LIBOR + 2.20%), 3/25/25 | | | United States | | | | 32,370 | | | | 32,428 | |
| | | 2015-HQ1, M3, FRN, 6.306%,(1-month USD LIBOR + 3.80%), 3/25/25 | | | United States | | | | 970,000 | | | | 1,022,396 | |
| | 2015-HQA1, M3, FRN, 7.206%,(1-month USD LIBOR + 4.70%), 3/25/28 | | | United States | | | | 1,835,000 | | | | 2,050,858 | |
| | 2016-DNA2, M3, FRN, 7.156%,(1-month USD LIBOR + 4.65%), 10/25/28 | | | United States | | | | 1,673,000 | | | | 1,882,988 | |
FRANKLIN TEMPLETON VARIABLE INSURANCE PRODUCTS TRUST
CONSOLIDATED STATEMENT OF INVESTMENTS
Franklin Strategic Income VIP Fund(continued)
| | | | | | | | | | | | | | |
| | | | |
| | | | | Country | | | Principal Amount* | | | Value | |
| | | Asset-Backed Securities and Commercial Mortgage-
Backed Securities(continued) | | | | | | | | | |
| | Diversified Financials(continued) | | | | | | | | | | | | |
| f,u | | Flagship CLO VIII Ltd., | | | | | | | | | | | | |
| | 2014-8A, ARR, 144A, FRN, 3.286%,(3-month USD LIBOR + 0.85%), 1/16/26 | | | United States | | | | 540,000 | | | $ | 538,034 | |
| | 2014-8A, DR, 144A, FRN, 5.486%,(3-month USD LIBOR + 3.05%), 1/16/26 | | | United States | | | | 350,000 | | | | 337,614 | |
| | FNMA Connecticut Avenue Securities,u2013-C01, M2, FRN, 7.756%,(1-month USD LIBOR + 5.25%), 10/25/23. | | | United States | | | | 356,254 | | | | 398,921 | |
| | u 2014-C01, M2, FRN, 6.906%,(1-month USD LIBOR + 4.40%), 1/25/24 | | | United States | | | | 498,000 | | | | 550,986 | |
| | u 2014-C02, 1M2, FRN, 5.106%,(1-month USD LIBOR + 2.60%), 5/25/24 | | | United States | | | | 1,415,000 | | | | 1,483,647 | |
| | u 2014-C03, 1M2, FRN, 5.506%,(1-month USD LIBOR + 3.00%), 7/25/24 | | | United States | | | | 3,037,143 | | | | 3,195,923 | |
| | u 2014-C03, 2M2, FRN, 5.406%,(1-month USD LIBOR + 2.90%), 7/25/24 | | | United States | | | | 156,857 | | | | 164,137 | |
| | u 2015-C01, 1M2, FRN, 6.806%,(1-month USD LIBOR + 4.30%), 2/25/25 | | | United States | | | | 1,032,857 | | | | 1,116,306 | |
| | u 2015-C01, 2M2, FRN, 7.056%,(1-month USD LIBOR + 4.55%), 2/25/25 | | | United States | | | | 959,893 | | | | 1,024,617 | |
| | u 2015-C02, 1M2, FRN, 6.506%,(1-month USD LIBOR + 4.00%), 5/25/25 | | | United States | | | | 2,239,667 | | | | 2,400,765 | |
| | u 2015-C02, 2M2, FRN, 6.506%,(1-month USD LIBOR + 4.00%), 5/25/25 | | | United States | | | | 1,124,258 | | | | 1,198,868 | |
| | u 2015-C03, 1M2, FRN, 7.506%,(1-month USD LIBOR + 5.00%), 7/25/25 | | | United States | | | | 2,504,369 | | | | 2,766,948 | |
| | u 2015-C03, 2M2, FRN, 7.506%,(1-month USD LIBOR + 5.00%), 7/25/25 | | | United States | | | | 1,629,051 | | | | 1,779,873 | |
| | t 2016-C04, 1M2, FRN, 6.756%, 1/25/29 | | | United States | | | | 1,590,000 | | | | 1,762,260 | |
| | u 2017-C01, 1M2, FRN, 6.056%,(1-month USD LIBOR + 3.55%), 7/25/29 | | | United States | | | | 1,528,000 | | | | 1,621,158 | |
| | t 2017-C03, 2M2, FRN, 5.356%, 11/25/29 | | | United States | | | | 450,000 | | | | 461,018 | |
| f,u | | Galaxy XVIII CLO Ltd.,2018-28A, C, 144A, FRN, 4.289%,(3-month USD LIBOR + 1.95%), 7/15/31 | | | United States | | | | 250,000 | | | | 235,865 | |
| f,t | | Galaxy XXV CLO Ltd.,2018-25A, D, 144A, FRN, 5.437%, 10/25/31 | | | United States | | | | 852,270 | | | | 810,142 | |
| f,u | | Galaxy XXVII CLO Ltd.,2018-27A, C, 144A, FRN, 5.379%,(3-month USD LIBOR + 2.75%), 5/16/31 | | | United States | | | | 600,000 | | | | 553,158 | |
| | GS Mortgage Securities Trust, | | | | | | | | | | | | |
| | t 2016-GS3, B, FRN, 3.395%, 10/10/49 | | | United States | | | | 728,000 | | | | 699,088 | |
| | 2017-GS6, B, 3.869%, 5/10/50 | | | United States | | | | 704,000 | | | | 696,666 | |
| f,t | | J.P. Morgan Chase Commercial Mortgage Securities Trust, 2016- NINE, B, 144A, FRN, 2.854%, 10/06/38 | | | United States | | | | 970,000 | | | | 894,620 | |
| | JPMCC Commercial Mortgage Securities Trust,2017-JP6, B, 3.946%, 7/15/50 | | | United States | | | | 841,000 | | | | 824,706 | |
| f,u | | LCM 26 Ltd., 26A, B, 144A, FRN, 3.869%,(3-month USD LIBOR + 1.40%), 1/20/31 | | | United States | | | | 250,000 | | | | 241,250 | |
| f,t | | LCM XVI LP, 2016A, BR2, 144A, FRN, 4.155%, 10/15/31 | | | United States | | | | 351,320 | | | | 346,099 | |
| f,t | | LCM XVII LP, | | | | | | | | | | | | |
| | 2017A, BRR, 144A, FRN, 4.026%, 10/15/31 | | | United States | | | | 350,000 | | | | 341,254 | |
| | 2017A, CRR, 144A, FRN, 4.526%, 10/15/31 | | | United States | | | | 320,000 | | | | 303,642 | |
FRANKLIN TEMPLETON VARIABLE INSURANCE PRODUCTS TRUST
CONSOLIDATED STATEMENT OF INVESTMENTS
Franklin Strategic Income VIP Fund(continued)
| | | | | | | | | | | | | | |
| | | | |
| | | | | Country | | | Principal Amount* | | | Value | |
| | | Asset-Backed Securities and Commercial Mortgage-
Backed Securities(continued) | | | | | | | | | |
| | Diversified Financials(continued) | | | | | | | | | | | | |
| f,u | | LCM XVIII LP, 2018A, DR, 144A, FRN, 5.269%,(3-month USD LIBOR + 2.80%), 4/20/31 | | | United States | | | | 770,000 | | | $ | 713,135 | |
| f,u | | LCM XXIV Ltd., 24A, A, 144A, FRN, 3.779%,(3-month USD LIBOR + 1.31%), 3/20/30 | | | United States | | | | 480,000 | | | | 478,282 | |
| f,u | | Madison Park Funding XXIII Ltd., | | | | | | | | | | | | |
| | 2017-23A, B, 144A, FRN, 4.209%,(3-month USD LIBOR + 1.70%), 7/27/30 | | | United States | | | | 400,000 | | | | 394,300 | |
| | 2017-23A, C, 144A, FRN, 4.859%,(3-month USD LIBOR + 2.35%), 7/27/30 | | | United States | | | | 500,000 | | | | 487,785 | |
| u | | MortgageIT Trust,2004-1, A2, FRN, 3.406%,(1-month USD LIBOR + 0.90%), 11/25/34 | | | United States | | | | 162,629 | | | | 159,257 | |
| f,u | | NZCG Funding Ltd.,2015-1A, A2R, 144A, FRN, 4.239%,(3-month USD LIBOR + 1.55%), 2/26/31 | | | United States | | | | 2,182,000 | | | | 2,122,824 | |
| f,t | | Octagon Investment Partners 28 Ltd.,16-1A, BR, 144A, FRN, 4.219%, 10/24/30 | | | United States | | | | 250,000 | | | | 245,873 | |
| f,u | | Octagon Investment Partners 30 Ltd., 144A, FRN, 3.789%,(3-month USD LIBOR + 1.32%), 3/17/30 | | | United States | | | | 480,000 | | | | 479,506 | |
| f,u | | Octagon Investment Partners 37 Ltd.,2018-2A, C, 144A, FRN, 5.21%,(3-month USD LIBOR + 2.85%), 7/25/30 | | | United States | | | | 400,000 | | | | 373,732 | |
| f,t | | Octagon Investment Partners 38 Ltd.,2018-1A, C, 144A, FRN, 5.137%, 7/20/30 | | | United States | | | | 1,000,000 | | | | 941,040 | |
| f,u | | Octagon Investment Partners XVI Ltd.,2013-1A, DR, 144A, FRN, 5.336%,(3-month USD LIBOR + 3.00%), 7/17/30 | | | United States | | | | 400,000 | | | | 374,712 | |
| f,u | | Octagon Investment Partners XX Ltd.,2014-1A, AR, 144A, FRN, 3.748%,(3-month USD LIBOR + 1.13%), 8/12/26 | | | United States | | | | 754,552 | | | | 754,635 | |
| f,u | | Octagon Investment Partners XXIII Ltd., | | | | | | | | | | | | |
| | 2015-1A, BR, 144A, FRN, 3.636%,(3-month USD LIBOR + 1.20%), 7/15/27 | | | United States | | | | 400,000 | | | | 385,444 | |
| | 2015-1A, DR, 144A, FRN, 4.986%,(3-month USD LIBOR + 2.55%), 7/15/27 | | | United States | | | | 800,000 | | | | 746,152 | |
| u | | Opteum Mortgage Acceptance Corp. Trust,2005-4, 1APT, FRN, 2.816%,(1-month USD LIBOR + 0.31%), 11/25/35 | | | United States | | | | 208,774 | | | | 206,696 | |
| f,t | | Strata CLO I Ltd.,2018-1A, B, 144A, FRN, 5.129%, 1/15/31 | | | United States | | | | 1,300,000 | | | | 1,295,932 | |
| u | | Structured Asset Securities Corp.,2005-2XS, 2A2, FRN, 3.849%,(1-month USD LIBOR + 1.50%), 2/25/35 | | | United States | | | | 156,516 | | | | 153,469 | |
| t | | Thornburg Mortgage Securities Trust,2005-1, A3, FRN, 3.718%, 4/25/45 | | | United States | | | | 137,438 | | | | 138,474 | |
| f,t | | Voya CLO2015-2 Ltd., 2A, BR, 144A, FRN, 3.977%, 7/23/27 | | | United States | | | | 820,000 | | | | 815,318 | |
| f,u | | Voya CLO Ltd., | | | | | | | | | | | | |
| | 2013-2A, BR, 144A, FRN, 4.34%,(3-month USD LIBOR + 1.85%), 4/25/31 | | | United States | | | | 780,000 | | | | 741,398 | |
| | 2014-1A, CR2, 144A, FRN, 5.245%,(3-month USD LIBOR + 2.80%), 4/18/31 | | | United States | | | | 1,000,000 | | | | 942,820 | |
| | 2017-2A, B, 144A, FRN, 4.786%,(3-month USD LIBOR + 2.35%), 6/07/30 | | | United States | | | | 1,455,000 | | | | 1,415,846 | |
| | 2018-2A, D, 144A, FRN, 5.124%,(3-month USD LIBOR + 2.75%), 7/15/31 | | | United States | | | | 300,000 | | | | 281,502 | |
FRANKLIN TEMPLETON VARIABLE INSURANCE PRODUCTS TRUST
CONSOLIDATED STATEMENT OF INVESTMENTS
Franklin Strategic Income VIP Fund(continued)
| | | | | | | | | | | | | | |
| | | | |
| | | | | Country | | | Principal Amount* | | | Value | |
| | | Asset-Backed Securities and Commercial Mortgage-
Backed Securities(continued) | | | | | | | | | |
| | Diversified Financials(continued) | | | | | | | | | | | | |
| | Wells Fargo Mortgage Backed Securities Trust, | | | | | | | | | | | | |
| | t2004-W, A9, FRN, 4.848%, 11/25/34 | | | United States | | | | 293,074 | | | $ | 301,004 | |
| | 2007-3, 3A1, 5.50%, 4/25/22 | | | United States | | | | 66,453 | | | | 67,256 | |
| | | | | | | | | | | | | | |
| | | | | | | | | | | | | 92,118,356 | |
| | | | | | | | | | | | | | |
| | | | |
| | Total Asset-Backed Securities and Commercial Mortgage-Backed Securities (Cost $97,136,227) | | | | | | | | | | | 94,908,754 | |
| | | | | | | | | | | | | | |
| | | Mortgage-Backed Securities 10.5% | | | | | | | | | |
| v | | Federal Home Loan Mortgage Corp. (FHLMC) Adjustable Rate0.0%† | | | | | | | | | | | | |
| | FHLMC, 3.679%, (US 1 Year CMTT-Note +/- MBS Margin), 1/01/33 | | | United States | | | | 8,877 | | | | 9,160 | |
| | | | | | | | | | | | | | |
| | | Federal Home Loan Mortgage Corp. (FHLMC) Fixed Rate 6.7% | | | | | | | | | |
| | FHLMC Gold 15 Year, 5.50%, 7/01/19 | | | United States | | | | 2,092 | | | | 2,099 | |
| | FHLMC Gold 30 Year, 3.50%, 12/01/47 | | | United States | | | | 1,997,108 | | | | 1,997,892 | |
| w | | FHLMC Gold 30 Year, 3.50%, 12/01/48 | | | United States | | | | 11,430,000 | | | | 11,427,295 | |
| | FHLMC Gold 30 Year, 4.00%, 5/01/48 | | | United States | | | | 5,328,480 | | | | 5,435,751 | |
| w | | FHLMC Gold 30 Year, 4.00%, 12/01/48 | | | United States | | | | 10,820,000 | | | | 11,031,071 | |
| | FHLMC Gold 30 Year, 5.00%, 4/01/34 - 8/01/35 | | | United States | | | | 201,439 | | | | 213,762 | |
| | FHLMC Gold 30 Year, 5.50%, 3/01/33 -1/01/35 | | | United States | | | | 156,930 | | | | 168,113 | |
| | FHLMC Gold 30 Year, 6.00%, 4/01/33 - 2/01/36 | | | United States | | | | 96,132 | | | | 104,058 | |
| | FHLMC Gold 30 Year, 6.50%, 11/01/27 - 6/01/36 | | | United States | | | | 27,626 | | | | 30,159 | |
| | FHLMC Gold 30 Year, 7.00%, 9/01/21 - 4/01/30 | | | United States | | | | 8,747 | | | | 9,178 | |
| | FHLMC Gold 30 Year, 7.50%, 8/01/30 - 7/01/31 | | | United States | | | | 947 | | | | 994 | |
| | | | | | | | | | | | | | |
| | | | | | | | | | | | | 30,420,372 | |
| | | | | | | | | | | | | | |
| v | | Federal National Mortgage Association (FNMA) Adjustable Rate 0.0%† | | | | | | | | | | | | |
| | FNMA, 4.615%, (US 1 Year CMTT-Note +/- MBS Margin), 12/01/34 | | | United States | | | | 79,426 | | | | 83,480 | |
| | | | | | | | | | | | | | |
| | | Federal National Mortgage Association (FNMA) Fixed Rate 2.7% | | | | | | | | | |
| | FNMA 15 Year, 2.50%, 7/01/22 - 6/01/27 | | | United States | | | | 219,136 | | | | 216,469 | |
| | FNMA 15 Year, 4.50%, 6/01/19 - 3/01/20 | | | United States | | | | 3,581 | | | | 3,646 | |
| | FNMA 30 Year, 3.50%, 11/01/47 | | | United States | | | | 3,493,529 | | | | 3,496,695 | |
| w | | FNMA 30 Year, 3.50%, 1/01/49 | | | United States | | | | 8,080,000 | | | | 8,081,754 | |
| | FNMA 30 Year, 5.00%, 4/01/30 | | | United States | | | | 50,885 | | | | 53,371 | |
| | FNMA 30 Year, 6.50%, 6/01/28 - 10/01/37 | | | United States | | | | 136,207 | | | | 151,970 | |
| | | | | | | | | | | | | | |
| | | | | | | | | | | | | 12,003,905 | |
| | | | | | | | | | | | | | |
| | | Government National Mortgage Association (GNMA) Fixed Rate 1.1% | | | | | | | | | |
| | GNMA I SF 30 Year, 4.50%, 9/20/48 | | | United States | | | | 4,013,987 | | | | 4,158,433 | |
| | GNMA I SF 30 Year, 5.00%, 11/15/33 - 7/15/34 | | | United States | | | | 209,363 | | | | 222,077 | |
| | GNMA I SF 30 Year, 7.00%, 10/15/28 - 6/15/32 | | | United States | | | | 15,171 | | | | 15,320 | |
| | GNMA I SF 30 Year, 7.50%, 9/15/30 | | | United States | | | | 1,198 | | | | 1,360 | |
| w | | GNMA II SF 30 Year, 4.50%, 12/01/48 | | | United States | | | | 200,000 | | | | 206,986 | |
| | GNMA II SF 30 Year, 5.00%, 9/20/33 - 11/20/33 | | | United States | | | | 56,194 | | | | 59,919 | |
| | GNMA II SF 30 Year, 6.00%, 11/20/34 | | | United States | | | | 72,968 | | | | 79,225 | |
| | GNMA II SF 30 Year, 6.50%, 4/20/31 - 2/20/34 | | | United States | | | | 36,698 | | | | 41,566 | |
| | GNMA II SF 30 Year, 7.50%, 1/20/28 - 4/20/32 | | | United States | | | | 9,296 | | | | 10,379 | |
| | | | | | | | | | | | | | |
| | | | | | | | | | | | | 4,795,265 | |
| | | | | | | | | | | | | | |
| | | | |
| | Total Mortgage-Backed Securities
(Cost $47,117,064) | | | | | | | | | | | 47,312,182 | |
| | | | | | | | | | | | | | |
FRANKLIN TEMPLETON VARIABLE INSURANCE PRODUCTS TRUST
CONSOLIDATED STATEMENT OF INVESTMENTS
Franklin Strategic Income VIP Fund(continued)
| | | | | | | | | | | | | | |
| | | | |
| | | | | Country | | | Principal Amount* | | | Value | |
| | Municipal Bonds 1.3% | | | | | | | | | | | | |
| | California State GO, Various Purpose, Refunding, 5.00%, 9/01/29 | | | United States | | | | 1,335,000 | | | $ | 1,574,499 | |
| | New York City HDC Capital Fund Grant Program Revenue, New York City Housing Authority Program, Series B1, 5.00%, 7/01/33 | | | United States | | | | 405,000 | | | | 437,756 | |
| | Orlando Health Obligated Group, 3.777%, 10/01/28 | | | United States | | | | 330,000 | | | | 332,237 | |
| | Port Authority of New York and New Jersey Revenue, Consolidated, One Hundred Ninety-First Series, 4.823%, 6/01/45 | | | United States | | | | 1,205,000 | | | | 1,266,515 | |
| k | | Puerto Rico Electric Power Authority Power Revenue, | | | | | | | | | | | | |
| | Series A, 6.75%, 7/01/36 | | | United States | | | | 2,805,000 | | | | 1,795,200 | |
| | Series XX, 5.25%, 7/01/40 | | | United States | | | | 165,000 | | | | 102,713 | |
| | San Jose RDA Successor Agency Tax Allocation, Senior, Refunding, SeriesA-T, 3.25%, 8/01/29 | | | United States | | | | 440,000 | | | | 424,169 | |
| | | | | | | | | | | | | | |
| | | | |
| | Total Municipal Bonds (Cost $6,668,400) | | | | | | | | | | | 5,933,089 | |
| | | | | | | | | | | | | | |
| | | | |
| | | | | | | | Shares | | | | |
| | | | |
| | Escrows and Litigation Trusts 0.0%† | | | | | | | | | | | | |
| a,c | | Midstates Petroleum Co. Inc./Midstates Petroleum Co. LLC, Escrow Account | | | United States | | | | 1,500,000 | | | | — | |
| a,c | | NewPage Corp., Litigation Trust | | | United States | | | | 2,500,000 | | | | — | |
| a,c | | T-Mobile USA Inc., Escrow Account. | | | United States | | | | 1,654,665 | | | | — | |
| a | | Vistra Energy Corp., Escrow Account. | | | United States | | | | 3,000,000 | | | | 9,000 | |
| | | | | | | | | | | | | | |
| | | | |
| | Total Escrows and Litigation Trusts (Cost $91,006) | | | | | | | | | | | 9,000 | |
| | | | | | | | | | | | | | |
| | | | |
| | Total Investments before Short Term Investments
(Cost $489,195,536) | | | | | | | | | | | 462,212,678 | |
| | | | | | | | | | | | | | |
| | | | |
| | | | | | | | Principal Amount* | | | | |
| | | | |
| | Short Term Investments 2.7% | | | | | | | | | | | | |
| l,m | | Senior Floating Rate Interests (Cost $1,913,412) 0.4% | | | | | | | | | | | | |
| | General Nutrition Centers Inc., Tranche B Term Loans, 5.03%,(3-month USD LIBOR + 2.50%), 3/04/19 | | | United States | | | | 1,927,668 | | | | 1,913,210 | |
| | | | | | | | | | | | | | |
| | | | |
| | Total Investments before Money Market Funds
(Cost $491,108,948) | | | | | | | | | | | 464,125,888 | |
| | | | | | | | | | | | | | |
| | | | |
| | | | | | | | Shares | | | | |
| | Money Market Funds (Cost $10,265,231) 2.3% | | | | | | | | | | | | |
| e,x | | Institutional Fiduciary Trust Money Market Portfolio, 1.99% | | | United States | | | | 10,265,231 | | | | 10,265,231 | |
| | | | | | | | | | | | | | |
| | | | |
| | Total Investments (Cost $501,374,179) 104.8% | | | | | | | | | | | 474,391,119 | |
| | | | |
| | Other Assets, less Liabilities (4.8)% | | | | | | | | | | | (21,754,960 | ) |
| | | | | | | | | | | | | | |
| | | | |
| | Net Assets 100.0% | | | | | | | | | | $ | 452,636,159 | |
| | | | | | | | | | | | | | |
FRANKLIN TEMPLETON VARIABLE INSURANCE PRODUCTS TRUST
CONSOLIDATED STATEMENT OF INVESTMENTS
Franklin Strategic Income VIP Fund(continued)
†Rounds to less than 0.1% of net assets.
*The principal amount is stated in U.S. dollars unless otherwise indicated.
aNon-income producing.
bThe security is owned by FT Holdings Corporation III, a wholly-owned subsidiary of the Fund. See Note 1(g).
cFair valued using significant unobservable inputs. See Note 12 regarding fair value measurements.
dSee Note 8 regarding restricted securities.
eSee Note 3(e) regarding investments in affiliated management investment companies.
fSecurity was purchased pursuant to Rule 144A under the Securities Act of 1933 and may be sold in transactions exempt from registration only to qualified institutional buyers or in a public offering registered under the Securities Act of 1933. These securities have been deemed liquid under guidelines approved by the Trust’s Board of Trustees. At December 31, 2018, the aggregate value of these securities was $136,781,535, representing 30.2% of net assets.
gPerpetual security with no stated maturity date.
hSecurity was purchased pursuant to Regulation S under the Securities Act of 1933, which exempts from registration securities offered and sold outside of the United States. Such a security cannot be sold in the United States without either an effective registration statement filed pursuant to the Securities Act of 1933, or pursuant to an exemption from registration. These securities have been deemed liquid under guidelines approved by the Trust’s Board of Trustees. At December 31, 2018, the aggregate value of these securities was $550,534, representing 0.1% of net assets.
iIncome may be received in additional securities and/or cash.
jSee Note 1(f) regarding loan participation notes.
kSee Note 7 regarding defaulted securities.
lThe coupon rate shown represents the rate at period end.
mSee Note 1(i) regarding senior floating rate interests.
nSecurity purchased on a delayed delivery basis. See Note 1(c).
oA portion or all of the security represents an unsettled loan commitment. The coupon rate isto-be determined (TBD) at the time of settlement and will be based upon a reference index/floor plus a spread.
pPrincipal amount is stated in 100 Mexican Peso Units.
qThe principal represents the notional amount. See Note 1(d) regarding value recovery instruments.
rPrincipal amount is stated in 1,000 Brazilian Real Units.
sPrincipal amount of security is adjusted for inflation. See Note 1(k).
tAdjustable rate security with an interest rate that is not based on a published reference index and spread. The rate is based on the structure of the agreement and current market conditions. The coupon rate shown represents the rate at period end.
uThe coupon rate shown represents the rate inclusive of any caps or floors, if applicable, in effect at period end.
vAdjustable Rate Mortgage-Backed Security (ARM); the rate shown is the effective rate at period end. ARM rates are not based on a published reference rate and spread, but instead pass-through weighted average interest income inclusive of any caps or floors, if applicable, from the underlying mortgage loans in which the majority of mortgages pay interest based on the index shown at their designated reset dates plus a spread, less the applicable servicing and guaranty fee (MBS margin).
wSecurity purchased on ato-be-announced (TBA) basis. See Note 1(c).
xThe rate shown is the annualizedseven-day effective yield at period end.
FRANKLIN TEMPLETON VARIABLE INSURANCE PRODUCTS TRUST
CONSOLIDATED STATEMENT OF INVESTMENTS
Franklin Strategic Income VIP Fund(continued)
At December 31, 2018, the Fund had the following futures contracts outstanding. See Note 1(d).
| | | | | | | | | | | | | | | | | | | | |
| Futures Contracts | | | | | | | | | | | | | | | |
| | | | | |
| Description | | Type | | | Number of Contracts | | | Notional Amount* | | | Expiration Date | | | Value/ Unrealized Appreciation (Depreciation) | |
| Interest Rate Contracts | | | | | | | | | | | | | | | | | | | | |
Euro-Bund | | | Short | | | | 36 | | | $ | 6,745,828 | | | | 3/07/19 | | | $ | (16,169 | ) |
U.S. Treasury 30 Yr. Bond | | | Long | | | | 27 | | | | 3,942,000 | | | | 3/20/19 | | | | 186,601 | |
U.S. Treasury 5 Yr. Note | | | Short | | | | 68 | | | | 7,798,750 | | | | 3/29/19 | | | | (120,444 | ) |
Ultra 10 Yr. U.S. Treasury Note | | | Long | | | | 165 | | | | 21,462,891 | | | | 3/20/19 | | | | 641,693 | |
| | | | | | | | | | | | | | | | | | | | |
Total Futures Contracts | | | | | | | | | | | | | | | | | | $ | 691,681 | |
| | | | | | | | | | | | | | | | | | | | |
*As of period end.
At December 31, 2018, the Fund had the following forward exchange contracts outstanding. See Note 1(d).
| | | | | | | | | | | | | | | | | | | | | | | | | | | | |
| Forward Exchange Contracts | | | | | | | | | | | | | | | | | | | | | |
| | | | | | | |
| Currency | | Counterpartya | | | Type | | | Quantity | | | Contract
Amount | | | Settlement
Date | | | Unrealized
Appreciation | | | Unrealized
Depreciation | |
OTC Forward Exchange Contracts | | | | | | | | | | | | | | | | | | | | | | | | | | | | |
Australian Dollar | | | JPHQ | | | | Sell | | | | 2,000,000 | | | $ | 1,435,970 | | | | 1/14/19 | | | $ | 26,440 | | | $ | — | |
Brazilian Real | | | JPHQ | | | | Buy | | | | 2,300,000 | | | | 606,396 | | | | 1/18/19 | | | | — | | | | (13,588 | ) |
Brazilian Real | | | JPHQ | | | | Sell | | | | 2,300,000 | | | | 544,765 | | | | 1/18/19 | | | | — | | | | (48,042 | ) |
Australian Dollar | | | DBAB | | | | Buy | | | | 1,308,345 | | | | 926,832 | | | | 2/04/19 | | | | — | | | | (4,367 | ) |
Australian Dollar | | | DBAB | | | | Sell | | | | 1,308,345 | | | | 942,270 | | | | 2/04/19 | | | | 19,805 | | | | — | |
Australian Dollar | | | JPHQ | | | | Sell | | | | 3,050,000 | | | | 2,195,588 | | | | 2/04/19 | | | | 45,149 | | | | — | |
Brazilian Real | | | JPHQ | | | | Buy | | | | 6,300,000 | | | | 1,659,074 | | | | 2/04/19 | | | | — | | | | (35,571 | ) |
Brazilian Real | | | JPHQ | | | | Sell | | | | 6,300,000 | | | | 1,571,111 | | | | 2/04/19 | | | | — | | | | (52,391 | ) |
Canadian Dollar | | | JPHQ | | | | Buy | | | | 500,000 | | | | 385,149 | | | | 2/04/19 | | | | — | | | | (18,490 | ) |
Canadian Dollar | | | JPHQ | | | | Sell | | | | 4,500,000 | | | | 3,516,889 | | | | 2/04/19 | | | | 216,964 | | | | — | |
Indian Rupee | | | DBAB | | | | Buy | | | | 136,793,000 | | | | 1,829,028 | | | | 2/04/19 | | | | 131,225 | | | | — | |
Indian Rupee | | | DBAB | | | | Sell | | | | 35,000,000 | | | | 473,293 | | | | 2/04/19 | | | | — | | | | (28,260 | ) |
Indian Rupee | | | JPHQ | | | | Buy | | | | 58,338,000 | | | | 779,763 | | | | 2/04/19 | | | | 56,224 | | | | — | |
Mexican Peso | | | JPHQ | | | | Buy | | | | 47,000,000 | | | | 2,319,761 | | | | 2/05/19 | | | | 57,982 | | | | — | |
Mexican Peso | | | JPHQ | | | | Buy | | | | 78,700,000 | | | | 4,062,512 | | | | 2/05/19 | | | | — | | | | (81,058 | ) |
Mexican Peso | | | JPHQ | | | | Sell | | | | 78,700,000 | | | | 4,106,423 | | | | 2/05/19 | | | | 124,969 | | | | — | |
South Korean Won | | | JPHQ | | | | Sell | | | | 1,600,000,000 | | | | 1,405,605 | | | | 2/07/19 | | | | — | | | | (32,735 | ) |
Indonesian Rupiah | | | JPHQ | | | | Sell | | | | 7,200,000,000 | | | | 480,480 | | | | 2/08/19 | | | | — | | | | (16,819 | ) |
Norwegian Krone | | | JPHQ | | | | Buy | | | | 14,500,000 | | | | 1,785,164 | | | | 2/19/19 | | | | — | | | | (104,542 | ) |
Euro | | | CITI | | | | Buy | | | | 134,100 | | | | 159,717 | | | | 3/14/19 | | | | — | | | | (5,114 | ) |
Euro | | | CITI | | | | Sell | | | | 134,100 | | | | 159,125 | | | | 3/14/19 | | | | 4,522 | | | | — | |
Euro | | | JPHQ | | | | Buy | | | | 380,000 | | | | 452,738 | | | | 3/14/19 | | | | — | | | | (14,637 | ) |
Euro | | | JPHQ | | | | Sell | | | | 2,831,900 | | | | 3,359,772 | | | | 3/14/19 | | | | 94,883 | | | | — | |
Swedish Krona | | | JPHQ | | | | Buy | | | | 13,400,000 | | | | 1,499,622 | | | | 3/14/19 | | | | 21,783 | | | | — | |
Swiss Franc | | | JPHQ | | | | Sell | | | | 250,000 | | | | 252,337 | | | | 3/14/19 | | | | — | | | | (3,957 | ) |
Chinese Yuan Renminbi | | | JPHQ | | | | Sell | | | | 10,000,000 | | | | 1,427,654 | | | | 4/11/19 | | | | — | | | | (27,826 | ) |
FRANKLIN TEMPLETON VARIABLE INSURANCE PRODUCTS TRUST
CONSOLIDATED STATEMENT OF INVESTMENTS
Franklin Strategic Income VIP Fund(continued)
Forward Exchange Contracts(continued)
| | | | | | | | | | | | | | | | | | | | | | | | | | | | |
| | | | | | | |
| Currency | | Counterpartya
| | | Type | | | Quantity | | | Contract
Amount | | | Settlement
Date | | | Unrealized
Appreciation | | | Unrealized
Depreciation | |
OTC Forward Exchange Contracts(continued) | | | | | | | | | | | | | | | | | | | | | | | | | | | | |
Philippine Peso | | | JPHQ | | | | Sell | | | | 65,000,000 | | | $ | 1,181,067 | | | | 4/11/19 | | | $ | — | | | $ | (49,799 | ) |
| | | | | | | | | | | | | | | | | | | | | | | | | | | | |
Total Forward Exchange Contracts | | | | | | | | | | | | | | | | | | | | | | $ | 799,946 | | | $ | (537,196 | ) |
| | | | | | | | | | | | | | | | | | | | | | | | | | | | |
Net unrealized appreciation (depreciation) | | | | | | | | | | | | | | | | | | | | | | $ | 262,750 | | | | | |
| | | | | | | | | | | | | | | | | | | | | | | | | | | | |
aMay be comprised of multiple contracts with the same counterparty, currency and settlement date.
At December 31, 2018, the Fund had the following credit default swap contracts outstanding. See Note 1(d).
Credit Default Swap Contracts
| | | | | | | | | | | | | | | | | | | | | | | | | | | | | | | | | | | | |
| | | | | | | | | |
| Description | | Periodic
Payment
Rate
Received
(Paid) | | | Payment
Frequency | | | Counter-
party | | | Maturity
Date | | | Notional Amounta | | | Value | | | Unamortized
Upfront
Payments
(Receipts) | | | Unrealized
Appreciation
(Depreciation) | | | Ratingb | |
| Centrally Cleared Swap Contracts | | | | | | | | | | | | | | | | | | | | | | | | | | | | | | | | | |
| | | | | | | | | |
| Contracts to Sell Protectionc,d | | | | | | | | | | | | | | | | | | | | | | | | | | | | | | | | | | | | |
| | | | | | | | | |
| Traded Index | | | | | | | | | | | | | | | | | | | | | | | | | | | | | | | | | | | | |
CDX.EM.30 | | | 1.00 | % | | | Quarterly | | | | | | | | 12/20/23 | | | $ | 10,200,000 | | | $ | (474,944 | ) | | $ | (434,647 | ) | | $ | (40,297 | ) | |
| Investment
Grade |
|
| | | | | | | | | |
| OTC Swap Contracts | | | | | | | | | | | | | | | | | | | | | | | | | | | | | | | | | | | | |
| | | | | | | | | |
| Contracts to Buy Protectionc | | | | | | | | | | | | | | | | | | | | | | | | | | | | | | | | | | | | |
| | | | | | | | | |
| Single Name | | | | | | | | | | | | | | | | | | | | | | | | | | | | | | | | | | | | |
Ally Financial Inc. | | | (5.00 | )% | | | Quarterly | | | | CITI | | | | 12/20/22 | | | $ | 750,000 | | | $ | (92,129 | ) | | $ | (108,690 | ) | | $ | 16,561 | | | | | |
Ally Financial Inc. | | | (5.00 | )% | | | Quarterly | | | | JPHQ | | | | 12/20/22 | | | | 1,250,000 | | | | (153,548 | ) | | | (182,399 | ) | | | 28,851 | | | | | |
Government of Italy | | | (1.00 | )% | | | Quarterly | | | | BZWS | | | | 6/20/23 | | | | 1,500,000 | | | | 11,302 | | | | 14,604 | | | | (3,302 | ) | | | | |
Government of Turkey | | | (1.00 | )% | | | Quarterly | | | | BZWS | | | | 12/20/19 | | | | 966,667 | | | | 14,394 | | | | 43,785 | | | | (29,391 | ) | | | | |
Government of Turkey | | | (1.00 | )% | | | Quarterly | | | | BZWS | | | | 12/20/23 | | | | 1,530,000 | | | | 168,130 | | | | 188,290 | | | | (20,160 | ) | | | | |
| | | | | | | | | |
| Contracts to Sell Protectionc,d | | | | | | | | | | | | | | | | | | | | | | | | | | | | | | | | | | | | |
| | | | | | | | | |
| Single Name | | | | | | | | | | | | | | | | | | | | | | | | | | | | | | | | | | | | |
General Electric Co. | | | 1.00 | % | | | Quarterly | | | | GSCO | | | | 12/20/23 | | | | 900,000 | | | | (40,659 | ) | | | (29,325 | ) | | | (11,334 | ) | | | BBB+ | |
General Electric Co. | | | 1.00 | % | | | Quarterly | | | | JPHQ | | | | 12/20/23 | | | | 1,000,000 | | | | (45,176 | ) | | | (22,051 | ) | | | (23,125 | ) | | | BBB+ | |
Government of Argentina | | | 5.00 | % | | | Quarterly | | | | MSCO | | | | 6/20/23 | | | | 4,300,000 | | | | (433,549 | ) | | | 383,817 | | | | (817,366 | ) | | | B | |
Government of Brazil | | | 1.00 | % | | | Quarterly | | | | CITI | | | | 12/20/23 | | | | 2,050,000 | | | | (95,812 | ) | | | (173,395 | ) | | | 77,583 | | | | BB- | |
Government of Colombia | | | 1.00 | % | | | Quarterly | | | | JPHQ | | | | 12/20/23 | | | | 1,700,000 | | | | (43,259 | ) | | | (11,599 | ) | | | (31,660 | ) | | | BBB- | |
Government of Indonesia | | | 1.00 | % | | | Quarterly | | | | BOFA | | | | 12/20/23 | | | | 1,500,000 | | | | (24,552 | ) | | | (22,729 | ) | | | (1,823 | ) | | | BBB- | |
Government of Indonesia | | | 1.00 | % | | | Quarterly | | | | CITI | | | | 12/20/23 | | | | 2,000,000 | | | | (32,736 | ) | | | (43,007 | ) | | | 10,271 | | | | BBB- | |
Government of Italy | | | 1.00 | % | | | Quarterly | | | | BZWS | | | | 6/20/23 | | | | 1,500,000 | | | | (58,710 | ) | | | (64,040 | ) | | | 5,330 | | | | NR | |
Government of Malaysia | | | 1.00 | % | | | Quarterly | | | | BZWS | | | | 12/20/23 | | | | 1,200,000 | | | | (4,752 | ) | | | (4,002 | ) | | | (750 | ) | | | NR | |
Government of Mexico | | | 1.00 | % | | | Quarterly | | | | CITI | | | | 12/20/23 | | | | 3,500,000 | | | | (86,048 | ) | | | (27,462 | ) | | | (58,586 | ) | | | BBB+ | |
Government of Vietnam | | | 1.00 | % | | | Quarterly | | | | BZWS | | | | 12/20/23 | | | | 1,200,000 | | | | (35,329 | ) | | | (30,286 | ) | | | (5,043 | ) | | | BB- | |
| | | | | | | | | |
| Traded Index | | | | | | | | | | | | | | | | | | | | | | | | | | | | | | | | | | | | |
eBNP Paribas Bespoke | | | | | | | | | | | | | | | | | | | | | | | | | | | | | | | | | | | | |
Bordeaux Index, | | | | | | | | | | | | | | | | | | | | | | | | | | | | | | | | | | | | |
Mezzanine Tranche7-10% | | | 2.10 | % | | | Quarterly | | | | BNDP | | | | 6/20/20 | | | | 750,000 | | | | (18,408 | ) | | | — | | | | (18,408 | ) | |
| Non-
Investment
Grade |
|
FRANKLIN TEMPLETON VARIABLE INSURANCE PRODUCTS TRUST
CONSOLIDATED STATEMENT OF INVESTMENTS
Franklin Strategic Income VIP Fund(continued)
Credit Default Swap Contracts(continued)
| | | | | | | | | | | | | | | | | | | | | | | | | | | | | | | | | | | | |
| | | | | | | | | |
| Description | | Periodic
Payment
Rate
Received
(Paid) | | | Payment
Frequency | | | Counter-
party | | | Maturity
Date | | | Notional
Amounta | | | Value | | | Unamortized
Upfront
Payments
(Receipts) | | | Unrealized
Appreciation
(Depreciation) | | | Ratingb | |
| OTC Swap Contracts(continued) | | | | | | | | | | | | | | | | | | | | | | | | | | | | | | | | | | | | |
| | | | | | | | |
| Contracts to Sell Protectionc,d(continued) | | | | | | | | | | | | | | | | | | | | | | | | | | | | | | | | | |
| | | | | | | | | |
| Traded Index(continued)eCitibank BespokeBogota, | | | | | | | | | | | | | | | | | | | | | | | | | | | | | | | | | | | | |
Tranche7-10% | | | 1.35 | % | | | Quarterly | | | | CITI | | | | 6/20/20 | | | $ | 750,000 | | | $ | (8,268 | ) | | $ | — | | | $ | (8,268 | ) | |
| Non-
Investment
Grade |
|
eCitibank Bespoke | | | | | | | | | | | | | | | | | | | | | | | | | | | | | | | | | | | | |
Cambridge Index, Equity | | | | | | | | | | | | | | | | | | | | | | | | | | | | | | | | | | | | |
Tranche0-3% | | | 0.00 | % | | | Quarterly | | | | CITI | | | | 12/20/19 | | | | 2,900,000 | | | | (728,048 | ) | | | (230,225 | ) | | | (497,823 | ) | |
| Non-
Investment
Grade |
|
eCitibank Bespoke Index, | | | | | | | | | | | | | | | | | | | | | | | | | | | | | | | | | | | | |
Tranche3-7% | | | 1.30 | % | | | Quarterly | | | | CITI | | | | 6/20/19 | | | | 1,600,000 | | | | 881 | | | | — | | | | 881 | | |
| Non-
Investment
Grade |
|
eCitibank Bespoke Index, | | | | | | | | | | | | | | | | | | | | | | | | | | | | | | | | | | | | |
Tranche3-7% | | | 1.40 | % | | | Quarterly | | | | CITI | | | | 6/20/19 | | | | 1,300,000 | | | | 1,362 | | | | — | | | | 1,362 | | |
| Non-
Investment
Grade |
|
eCitibank Bespoke Index, | | | | | | | | | | | | | | | | | | | | | | | | | | | | | | | | | | | | |
Tranche Index0-3% | | | 0.00 | % | | | Quarterly | | | | CITI | | | | 6/20/20 | | | | 450,000 | | | | (162,128 | ) | | | (105,463 | ) | | | (56,665 | ) | |
| Non-
Investment
Grade |
|
eCitibank Bespoke Lisbon | | | | | | | | | | | | | | | | | | | | | | | | | | | | | | | | | | | | |
Index, Equity Tranche0-3% | | | 0.00 | % | | | Quarterly | | | | CITI | | | | 6/20/19 | | | | 530,000 | | | | (62,969 | ) | | | (29,376 | ) | | | (33,593 | ) | |
| Non-
Investment
Grade |
|
eCitibank Bespoke Verona | | | | | | | | | | | | | | | | | | | | | | | | | | | | | | | | | | | | |
Index, Equity Tranche0-3% | | | 0.00 | % | | | Quarterly | | | | CITI | | | | 12/20/19 | | | | 1,100,000 | | | | (246,764 | ) | | | (107,195 | ) | | | (139,569 | ) | |
| Non-
Investment
Grade |
|
eCitibank Bespoke Verona | | | | | | | | | | | | | | | | | | | | | | | | | | | | | | | | | | | | |
Index, Mezzanine Tranche7-15% | | | 0.40 | % | | | Quarterly | | | | CITI | | | | 12/20/19 | | | | 3,100,000 | | | | 4,867 | | | | — | | | | 4,867 | | |
| Non-
Investment
Grade |
|
MCDX.NA.30 | | | 1.00 | % | | | Quarterly | | | | CITI | | | | 6/20/23 | | | | 2,270,000 | | | | 53,676 | | | | 47,486 | | | | 6,190 | | | | Investment | |
| | | | | | | | | | | | | | | | | | | | | | | | | | | | |
| | | | | | | | | | | | | | | | | | | | | | | | | | | | | | | | | | | Grade | |
Total OTC Swap Contracts | | | | | | | | | | | | | | | | | | | | | | $ | (2,118,232 | ) | | $ | (513,262 | ) | | $ | (1,604,970 | ) | | | | |
| | | | | | | | | | | | | | | | | | | | | | | | | | | | |
Total Credit Default Swap Contracts. | | | | | | | | | | | | | | | | | | | $ | (2,593,176 | ) | | $ | (947,909 | ) | | $ | (1,645,267 | ) | | | | |
| | | | | | | | | | | | | | | | | | | | | | | | | | | | |
FRANKLIN TEMPLETON VARIABLE INSURANCE PRODUCTS TRUST
CONSOLIDATED STATEMENT OF INVESTMENTS
Franklin Strategic Income VIP Fund(continued)
Credit Default Swap Contracts(continued)
aFor contracts to sell protection, the notional amount is equal to the maximum potential amount of the future payments and no recourse provisions have been entered into in association with the contracts.
bBased on Standard and Poor’s (S&P) Rating for single name swaps and internal ratings for index swaps. Internal ratings based on mapping into equivalent ratings from external vendors.
cPerformance triggers for settlement of contract include default, bankruptcy or restructuring for single name swaps and failure to pay or bankruptcy of the underlying securities for traded index swaps.
dThe fund enters contracts to sell protection to create a long credit position.
eRepresents a custom index comprised of a basket of underlying issuers.
At December 31, 2018, the Fund had the following cross-currency swap contracts outstanding. See Note 1(d).
| | | | | | | | | | | | | | | | | | | | | | | | |
| Cross-Currency Swap Contracts | | | | | | | | | | | | | | | | | | |
| | | | | | |
| Description | | Payment
Frequency | | | Counter party | | | Maturity
Date | | | Notional
Amount | | | | | | Value/
Unrealized
Appreciation
(Depreciation) | |
| | | | | | |
| OTC Swap Contracts | | | | | | | | | | | | | | | | | | | | | | | | |
Receive Floating3-month USD LIBOR + 2.87% | | | Quarterly | | | | | | | | | | | | 464,800 | | | | USD | | | | | |
Pay Fixed 2.50% | | | Annual | | | | CITI | | | | 5/04/21 | | | | 400,000 | | | | EUR | | | $ | 4,052 | |
| | | | | | | | | | | | | | | | | | | | | | | | |
At December 31, 2018, the Fund had the following total return swap contracts outstanding. See Note 1(d).
| | | | | | | | | | | | | | | | | | | | | | |
| Total Return Swap Contracts | | | | | | | | | | | | | | | | | |
| | | | | | |
| Underlying Instruments | | Financing Rate | | Payment
Frequency | | | Counteparty | | | Maturity
Date | | | Notional
Value | | | Value/
Unrealized
Appreciation
(Depreciation) | |
| | | | | | |
| OTC Swap Contracts | | | | | | | | | | | | | | | | | | | | | | |
| Longa | | | | | | | | | | | | | | | | | | | | | | |
iBoxx USD Liquid High Yield Index | | 3-month USD LIBOR | | | Quarterly | | | | BNDP | | | | 3/20/19 | | | $ | 975,000 | | | $ | (25,264 | ) |
iBoxx USD Liquid High Yield Index | | 3-month USD LIBOR | | | Quarterly | | | | FBCO | | | | 3/20/19 | | | | 1,125,000 | | | | (26,897 | ) |
iBoxx USD Liquid High Yield Index | | 3-month USD LIBOR | | | Quarterly | | | | BOFA | | | | 6/20/19 | | | | 6,000,000 | | | | (134,569 | ) |
iBoxx USD Liquid High Yield Index | | 3-month USD LIBOR | | | Quarterly | | | | CITI | | | | 6/20/19 | | | | 4,100,000 | | | | (100,579 | ) |
Markit iBoxx USD Liquid Leveraged Loan Index | | 3-month USD LIBOR | | | Quarterly | | | | GSCO | | | | 6/20/19 | | | | 5,500,000 | | | | (139,267 | ) |
| | | | | | | | | | | | | | | | | | | | | | |
Total Return Swap Contracts | | | | | | | | | | | | | | | | | | | | $ | (426,576 | ) |
| | | | | | | | | | | | | | | | | | | | | | |
aThe Fund receives the total return on the underlying instrument and pays a variable financing rate.
See Note 9 regarding other derivative information.
See Abbreviations on pageFSI-60.
| | | | | | |
| | | |
| | The accompanying notes are an integral part of these consolidated financial statements. | Annual Report | | | FSI-41 | |
FRANKLIN TEMPLETON VARIABLE INSURANCE PRODUCTS TRUST
Consolidated Financial Statements
Consolidated Statement of Assets and Liabilities
December 31, 2018
| | | | |
| |
| | | Franklin Strategic
Income VIP Fund | |
Assets: | | | | |
Investments in securities: | | | | |
Cost - Unaffiliated issuers | | $ | 463,568,835 | |
Cost -Non-controlled affiliates (Note 3e) | | | 37,805,344 | |
| | | | |
Value - Unaffiliated issuers | | $ | 438,894,920 | |
Value -Non-controlled affiliates (Note 3e) | | | 35,496,199 | |
Cash | | | 6,545,486 | |
Restricted cash for OTC derivative contracts (Note 1e) | | | 110,000 | |
Receivables: | | | | |
Investment securities sold | | | 2,759 | |
Capital shares sold. | | | 11,173 | |
Dividends and interest | | | 4,004,625 | |
Deposits with brokers for: | | | | |
OTC derivative contracts | | | 2,530,000 | |
Futures contracts | | | 393,941 | |
Centrally cleared swap contracts | | | 1,603,545 | |
Variation margin on futures contracts | | | 73,031 | |
Variation margin on centrally cleared swap contracts | | | 9,051 | |
OTC swap contracts (upfront payments $782,698) | | | 677,982 | |
Unrealized appreciation on OTC forward exchange contracts | | | 799,946 | |
Unrealized appreciation on OTC swap contracts | | | 155,948 | |
FT Subsidiary deferred tax benefit (Note 1g) | | | 181,226 | |
Other assets | | | 71 | |
| | | | |
Total assets | | | 491,489,903 | |
| | | | |
Liabilities: | | | | |
Payables: | | | | |
Investment securities purchased | | | 33,747,783 | |
Capital shares redeemed | | | 570,211 | |
Management fees | | | 229,496 | |
Distribution fees | | | 74,899 | |
Deposits from brokers for: | | | | |
OTC derivative contracts | | | 110,000 | |
OTC swap contracts (upfront receipts $1,818,234) | | | 1,191,244 | |
Unrealized depreciation on OTC forward exchange contracts | | | 537,196 | |
Unrealized depreciation on OTC swap contracts | | | 2,183,442 | |
Deferred tax | | | 8,361 | |
Accrued expenses and other liabilities | | | 201,112 | |
| | | | |
Total liabilities | | | 38,853,744 | |
| | | | |
Net assets, at value | | $ | 452,636,159 | |
| | | | |
Net assets consist of: | | | | |
Paid-in capital | | $ | 493,375,294 | |
Total distributable earnings (loss) | | | (40,739,135 | ) |
| | | | |
Net assets, at value | | $ | 452,636,159 | |
| | | | |
| | | | |
| | | |
| FSI-42 | | Annual Report | The accompanying notes are an integral part of these consolidated financial statements. | | |
FRANKLIN TEMPLETON VARIABLE INSURANCE PRODUCTS TRUST
CONSOLIDATED FINANCIAL STATEMENTS
Consolidated Statement of Assets and Liabilities(continued)
December 31, 2018
| | | | |
| |
| | | Franklin Strategic
Income VIP Fund | |
| |
| Class 1: | | | | |
Net assets, at value | | $ | 302,609,774 | |
| | | | |
Shares outstanding | | | 28,401,176 | |
| | | | |
Net asset value and maximum offering price per share | | $ | 10.65 | |
| | | | |
| |
| Class 2: | | | | |
Net assets, at value | | $ | 89,263,627 | |
| | | | |
Shares outstanding | | | 8,685,209 | |
| | | | |
Net asset value and maximum offering price per share | | $ | 10.28 | |
| | | | |
| |
| Class 4: | | | | |
Net assets, at value | | $ | 60,762,758 | |
| | | | |
Shares outstanding | | | 5,754,803 | |
| | | | |
Net asset value and maximum offering price per share | | $ | 10.56 | |
| | | | |
| | | | | | |
| | | |
| | The accompanying notes are an integral part of these consolidated financial statements. | Annual Report | | | FSI-43 | |
FRANKLIN TEMPLETON VARIABLE INSURANCE PRODUCTS TRUST
CONSOLIDATED FINANCIAL STATEMENTS
Consolidated Statement of Operations
for the year ended December 31, 2018
| | | | |
| |
| | | Franklin Strategic
Income VIP Fund | |
Investment income: | | | | |
Dividends: | | | | |
Unaffiliated issuers | | $ | 49,029 | |
Non-controlled affiliates (Note 3e) | | | 3,285,601 | |
Interest: (net of foreign taxes)~ | | | | |
Unaffiliated issuers | | | 25,217,893 | |
Other income (Note 1g) | | | 367,900 | |
| | | | |
Total investment income | | | 28,920,423 | |
| | | | |
Expenses: | | | | |
Management fees (Note 3a) | | | 3,592,158 | |
Distribution fees: (Note 3c) | | | | |
Class 2 | | | 466,729 | |
Class 4 | | | 237,580 | |
Custodian fees (Note 4) | | | 22,304 | |
Reports to shareholders | | | 124,770 | |
Professional fees | | | 138,242 | |
Trustees’ fees and expenses | | | 4,469 | |
Other | | | 106,227 | |
| | | | |
Total expenses. | | | 4,692,479 | |
Expense reductions (Note 4) | | | (22,987 | ) |
Expenses waived/paid by affiliates (Note 3e) | | | (257,813 | ) |
| | | | |
Net expenses | | | 4,411,679 | |
| | | | |
Net investment income | | | 24,508,744 | |
| | | | |
Realized and unrealized gains (losses): | | | | |
Net realized gain (loss) from: | | | | |
Investments:#+ | | | | |
Unaffiliated issuers | | | (8,082,974 | ) |
Non-controlled affiliates (Note 3e) | | | (443,068 | ) |
Foreign currency transactions | | | (138,443 | ) |
Forward exchange contracts | | | (1,115,592 | ) |
Futures contracts | | | (515,772 | ) |
Swap contracts | | | 679,311 | |
| | | | |
Net realized gain (loss) | | | (9,616,538 | ) |
| | | | |
Net change in unrealized appreciation (depreciation) on: | | | | |
Investments: | | | | |
Unaffiliated issuers | | | (20,710,340 | ) |
Non-controlled affiliates (Note 3e) | | | (2,042,814 | ) |
Translation of other assets and liabilities denominated in foreign currencies | | | 8,631 | |
Forward exchange contracts | | | 380,763 | |
Futures contracts | | | 663,984 | |
Swap contracts | | | (2,125,187 | ) |
Change in FT Subsidiary deferred tax benefit (Note 1g) | | | 181,226 | |
Change in deferred taxes on unrealized appreciation | | | 82,318 | |
| | | | |
Net change in unrealized appreciation (depreciation) | | | (23,561,419 | ) |
| | | | |
Net realized and unrealized gain (loss) | | | (33,177,957 | ) |
| | | | |
Net increase (decrease) in net assets resulting from operations. | | $ | (8,669,213 | ) |
| | | | |
| |
~Foreign taxes withheld on interest. | | $ | 42,823 | |
#Net of foreign taxes | | $ | 22,514 | |
+Includes losses from a redemptionin-kind (Note 11) | | $ | (2,963,426 | ) |
| | | | |
| | | |
| FSI-44 | | Annual Report | The accompanying notes are an integral part of these consolidated financial statements. | | |
FRANKLIN TEMPLETON VARIABLE INSURANCE PRODUCTS TRUST
CONSOLIDATED FINANCIAL STATEMENTS
Consolidated Statements of Changes in Net Asset
| | | | | | | | |
| |
| | | Franklin Strategic
Income VIP Fund | |
| |
| | | Year Ended December 31, | |
| | | 2018 | | | 2017 | |
Increase (decrease) in net assets: | | | | | | | | |
Operations: | | | | | | | | |
Net investment income | | $ | 24,508,744 | | | $ | 26,009,801 | |
Net realized gain (loss) | | | (9,616,538 | ) | | | (9,146,959 | ) |
Net change in unrealized appreciation (depreciation) | | | (23,561,419 | ) | | | 11,365,697 | |
| | | | |
Net increase (decrease) in net assets resulting from operations | | | (8,669,213 | ) | | | 28,228,539 | |
| | | | |
Distributions to shareholders: (Note 1k) | | | | | | | | |
Class 1 | | | (9,703,924 | ) | | | (11,689,930 | ) |
Class 2 | | | (5,724,625 | ) | | | (6,228,631 | ) |
Class 4 | | | (1,690,861 | ) | | | (2,076,378 | ) |
| | | | |
Total distributions to shareholders | | | (17,119,410 | ) | | | (19,994,939 | ) |
| | | | |
Capital share transactions: (Note 2) | | | | | | | | |
Class 1 | | | (43,986,518 | ) | | | (39,684,506 | ) |
Class 2 | | | (117,066,128 | ) | | | 8,628,689 | |
Class 4 | | | (10,271,574 | ) | | | (7,192,045 | ) |
| | | | |
Total capital share transactions | | | (171,324,220 | ) | | | (38,247,862 | ) |
| | | | |
Net increase (decrease) in net assets | | | (197,112,843 | ) | | | (30,014,262 | ) |
Net assets: | | | | | | | | |
Beginning of year | | | 649,749,002 | | | | 679,763,264 | |
| | | | |
End of year (Note 1k) | | $ | 452,636,159 | | | $ | 649,749,002 | |
| | | | |
| | | | | | |
| | | |
| | The accompanying notes are an integral part of these consolidated financial statements. | Annual Report | | | FSI-45 | |
FRANKLIN TEMPLETON VARIABLE INSURANCE PRODUCTS TRUST
Notes to Consolidated Financial Statements
Franklin Strategic Income VIP Fund
1. Organization and Significant Accounting Policies
Franklin Templeton Variable Insurance Products Trust (Trust) is registered under the Investment Company Act of 1940 (1940 Act) as anopen-end management investment company, consisting of eighteen separate funds and applies the specialized accounting and reporting guidance in U.S. Generally Accepted Accounting Principles (U.S. GAAP). Franklin Strategic Income VIP Fund (Fund) is included in this report. Shares of the Fund are generally sold only to insurance company separate accounts to fund the benefits of variable life insurance policies or variable annuity contracts. At December 31, 2018, 74.7% of the Fund’s shares were held through one insurance company. Investment activities of these insurance company separate accounts could have a material impact on the Fund. The Fund offers three classes of shares: Class 1, Class 2 and Class 4. Each class of shares may differ by its distribution fees, voting rights on matters affecting a single class and its exchange privilege.
The following summarizes the Fund’s significant accounting policies.
a. Financial Instrument Valuation
The Fund’s investments in financial instruments are carried at fair value daily. Fair value is the price that would be received to sell an asset or paid to transfer a liability in an orderly transaction between market participants on the measurement date. The Fund calculates the net asset value (NAV) per share each business day as of 4 p.m. Eastern time or the regularly scheduled close of the New York Stock Exchange (NYSE), whichever is earlier. Under compliance policies and procedures approved by the Trust’s Board of Trustees (the Board), the Fund’s administrator has responsibility for oversight of valuation, including leading the cross-functional Valuation Committee (VC). The Fund may utilize independent pricing services, quotations from securities and financial instrument dealers, and other market sources to determine fair value.
Equity securities and derivative financial instruments listed on an exchange or on the NASDAQ National Market System are valued at the last quoted sale price or the official closing price of the day, respectively. Foreign equity securities are valued as of the close of trading on the foreign stock exchange on which the security is primarily traded, or as of 4 p.m. Eastern time. The value is then converted into its U.S. dollar equivalent at the foreign exchange rate in effect at 4 p.m. Eastern time on the day that the value of the security is determined.Over-the-counter
(OTC) securities are valued within the range of the most recent quoted bid and ask prices. Securities that trade in multiple markets or on multiple exchanges are valued according to the broadest and most representative market. Certain equity securities are valued based upon fundamental characteristics or relationships to similar securities.
Debt securities generally trade in the OTC market rather than on a securities exchange. The Fund’s pricing services use multiple valuation techniques to determine fair value. In instances where sufficient market activity exists, the pricing services may utilize a market-based approach through which quotes from market makers are used to determine fair value. In instances where sufficient market activity may not exist or is limited, the pricing services also utilize proprietary valuation models which may consider market characteristics such as benchmark yield curves, credit spreads, estimated default rates, anticipated market interest rate volatility, coupon rates, anticipated timing of principal repayments, underlying collateral, and other unique security features in order to estimate the relevant cash flows, which are then discounted to calculate the fair value. Securities denominated in a foreign currency are converted into their U.S. dollar equivalent at the foreign exchange rate in effect at 4 p.m. Eastern time on the date that the values of the foreign debt securities are determined.
Investments inopen-end mutual funds are valued at the closing NAV.
Certain derivative financial instruments are centrally cleared or trade in the OTC market. The Fund’s pricing services use various techniques including industry standard option pricing models and proprietary discounted cash flow models to determine the fair value of those instruments. The Fund’s net benefit or obligation under the derivative contract, as measured by the fair value of the contract, is included in net assets.
The Fund has procedures to determine the fair value of financial instruments for which market prices are not reliable or readily available. Under these procedures, the Fund primarily employs a market-based approach which may use related or comparable assets or liabilities, recent transactions, market multiples, book values, and other relevant information for the investment to determine the fair value of the investment. An income-based valuation approach may also be used in which the anticipated future cash flows of the investment are discounted to calculate fair value. Discounts may also be applied due to the nature or duration of any restrictions on the disposition of the
FRANKLIN TEMPLETON VARIABLE INSURANCE PRODUCTS TRUST
NOTES TO CONSOLIDATED FINANCIAL STATEMENTS
Franklin Strategic Income VIP Fund(continued)
investments. Due to the inherent uncertainty of valuations of such investments, the fair values may differ significantly from the values that would have been used had an active market existed.
Trading in securities on foreign securities stock exchanges and OTC markets may be completed before 4 p.m. Eastern time. In addition, trading in certain foreign markets may not take place on every Fund’s business day. Occasionally, events occur between the time at which trading in a foreign security is completed and 4 p.m. Eastern time that might call into question the reliability of the value of a portfolio security held by the Fund. As a result, differences may arise between the value of the Fund’s portfolio securities as determined at the foreign market close and the latest indications of value at 4 p.m. Eastern time. In order to minimize the potential for these differences, the VC monitors price movements following the close of trading in foreign stock markets through a series of country specific market proxies (such as baskets of American Depositary Receipts, futures contracts and exchange traded funds). These price movements are measured against established trigger thresholds for each specific market proxy to assist in determining if an event has occurred that may call into question the reliability of the values of the foreign securities held by the Fund. If such an event occurs, the securities may be valued using fair value procedures, which may include the use of independent pricing services. At December 31, 2018, a market event occurred resulting in a portion of the securities held by the Fund being valued using fair value procedures.
When the last day of the reporting period is anon-business day, certain foreign markets may be open on those days that the Fund’s NAV is not calculated, which could result in differences between the value of the Fund’s portfolio securities on the last business day and the last calendar day of the reporting period. Any significant security valuation changes due to an open foreign market are adjusted and reflected by the Fund for financial reporting purposes.
b. Foreign Currency Translation
Portfolio securities and other assets and liabilities denominated in foreign currencies are translated into U.S. dollars based on the exchange rate of such currencies against U.S. dollars on the date of valuation. The Fund may enter into foreign currency exchange contracts to facilitate transactions denominated in a foreign currency. Purchases and sales of securities, income and expense items denominated in foreign currencies are translated
into U.S. dollars at the exchange rate in effect on the transaction date. Portfolio securities and assets and liabilities denominated in foreign currencies contain risks that those currencies will decline in value relative to the U.S. dollar. Occasionally, events may impact the availability or reliability of foreign exchange rates used to convert the U.S. dollar equivalent value. If such an event occurs, the foreign exchange rate will be valued at fair value using procedures established and approved by the Board.
The Fund does not separately report the effect of changes in foreign exchange rates from changes in market prices on securities held. Such changes are included in net realized and unrealized gain or loss from investments in the Consolidated Statement of Operations.
Realized foreign exchange gains or losses arise from sales of foreign currencies, currency gains or losses realized between the trade and settlement dates on securities transactions and the difference between the recorded amounts of dividends, interest, and foreign withholding taxes and the U.S. dollar equivalent of the amounts actually received or paid. Net unrealized foreign exchange gains and losses arise from changes in foreign exchange rates on foreign denominated assets and liabilities other than investments in securities held at the end of the reporting period.
c. Securities Purchased on a Delayed Delivery and TBA Basis
The Fund purchases securities on a delayed delivery andto-be-announced (TBA) basis, with payment and delivery scheduled for a future date. These transactions are subject to market fluctuations and are subject to the risk that the value at delivery may be more or less than the trade date purchase price. Although the Fund will generally purchase these securities with the intention of holding the securities, it may sell the securities before the settlement date. Sufficient assets have been segregated for these securities.
d. Derivative Financial Instruments
The Fund invested in derivative financial instruments in order to manage risk or gain exposure to various other investments or markets. Derivatives are financial contracts based on an underlying or notional amount, require no initial investment or an initial net investment that is smaller than would normally be required to have a similar response to changes in market factors, and require or permit net settlement. Derivatives contain various risks including the potential inability of the counterparty to
FRANKLIN TEMPLETON VARIABLE INSURANCE PRODUCTS TRUST
NOTES TO CONSOLIDATED FINANCIAL STATEMENTS
Franklin Strategic Income VIP Fund(continued)
1. Organization and Significant Accounting Policies(continued)
d. Derivative Financial Instruments(continued)
fulfill their obligations under the terms of the contract, the potential for an illiquid secondary market, and/or the potential for market movements which expose the Fund to gains or losses in excess of the amounts shown in the Consolidated Statement of Assets and Liabilities. Realized gain and loss and unrealized appreciation and depreciation on these contracts for the period are included in the Consolidated Statement of Operations.
Derivative counterparty credit risk is managed through a formal evaluation of the creditworthiness of all potential counter-parties. The Fund attempts to reduce its exposure to counterparty credit risk on OTC derivatives, whenever possible, by entering into International Swaps and Derivatives Association (ISDA) master agreements with certain counterparties. These agreements contain various provisions, including but not limited to collateral requirements, events of default, or early termination. Termination events applicable to the counterparty include certain deteriorations in the credit quality of the counterparty. Termination events applicable to the Fund include failure of the Fund to maintain certain net asset levels and/or limit the decline in net assets over various periods of time. In the event of default or early termination, the ISDA master agreement gives thenon-defaulting party the right to net andclose-out all transactions traded, whether or not arising under the ISDA agreement, to one net amount payable by one counterparty to the other. However, absent an event of default or early termination, OTC derivative assets and liabilities are presented gross and not offset in the Consolidated Statement of Assets and Liabilities. Early termination by the counterparty may result in an immediate payment by the Fund of any net liability owed to that counterparty under the ISDA agreement.
Collateral requirements differ by type of derivative. Collateral or initial margin requirements are set by the broker or exchange clearing house for exchange traded and centrally cleared derivatives. Initial margin deposited is held at the exchange and can be in the form of cash and/or securities. For OTC derivatives traded under an ISDA master agreement, posting of collateral is required by either the Fund or the applicable counterparty if the total net exposure of all OTC derivatives with the applicable counterparty exceeds the minimum transfer amount, which typically ranges from $100,000 to $250,000, and can vary depending on the counterparty and the type of the
agreement. Generally, collateral is determined at the close of Fund business each day and any additional collateral required due to changes in derivative values may be delivered by the Fund or the counterparty the next business day, or within a few business days. Collateral pledged and/or received by the Fund for OTC derivatives, if any, is held in segregated accounts with the Fund’s custodian/counterparty broker and can be in the form of cash and/or securities. Unrestricted cash may be invested according to the Fund’s investment objectives. To the extent that the amounts due to the Fund from its counterparties are not subject to collateralization or are not fully collateralized, the Fund bears the risk of loss from counterpartynon-performance.
The Fund entered into exchange traded futures contracts primarily to manage and/or gain exposure to interest rate risk. A futures contract is an agreement between the Fund and a counterparty to buy or sell an asset at a specified price on a future date. Required initial margins are pledged by the Fund, and the daily change in fair value is accounted for as a variation margin payable or receivable.
The Fund entered into OTC forward exchange contracts primarily to manage and/or gain exposure to certain foreign currencies. A forward exchange contract is an agreement between the Fund and a counterparty to buy or sell a foreign currency at a specific exchange rate on a future date.
The Fund entered into credit default swap contracts primarily to manage exposure to credit risk. A credit default swap is an agreement between the Fund and a counterparty whereby the buyer of the contract receives credit protection and the seller of the contract guarantees the credit worthiness of a referenced debt obligation. These agreements may be privately negotiated in theover-the-counter market (OTC credit default swaps) or may be executed in a multilateral trade facility platform, such as a registered exchange (centrally cleared credit default swaps). The underlying referenced debt obligation may be a single issuer of corporate or sovereign debt, a credit index, a basket of issuers or indices, or a tranche of a credit index or basket of issuers or indices. In the event of a default of the underlying referenced debt obligation, the buyer is entitled to receive the notional amount of the credit default swap contract from the seller in exchange for the referenced debt obligation, a net settlement amount equal to the notional amount of the credit default swap less the recovery value of the referenced debt obligation, or other agreed upon amount. For centrally cleared credit default swaps, required initial margins are pledged by the Fund, and the daily change in fair value is accounted for as a
FRANKLIN TEMPLETON VARIABLE INSURANCE PRODUCTS TRUST
NOTES TO CONSOLIDATED FINANCIAL STATEMENTS
Franklin Strategic Income VIP Fund(continued)
variation margin payable or receivable in the Consolidated Statement of Assets and Liabilities. Over the term of the contract, the buyer pays the seller a periodic stream of payments, provided that no event of default has occurred. Such periodic payments are accrued daily as an unrealized appreciation or depreciation until the payments are made, at which time they are realized. Upfront payments and receipts are reflected in the Consolidated Statement of Assets and Liabilities and represent compensating factors between stated terms of the credit default swap agreement and prevailing market conditions (credit spreads and other relevant factors). These upfront payments and receipts are amortized over the term of the contract as a realized gain or loss in the Consolidated Statement of Operations.
The Fund entered into OTC cross currency swap contracts primarily to manage and/or gain exposure to interest rate risk and certain foreign currencies. A cross currency swap is an agreement between the Fund and a counterparty to exchange cash flows (determined using either a fixed or floating rate) based on the notional amounts of two different currencies. The notional amounts are typically determined based on the spot exchange rates at the opening of the contract. Cross currency swaps may require the exchange of notional amounts at the opening and/or closing of the contract. Over the term of the contract, contractually required payments to be paid and to be received are accrued daily and recorded as unrealized depreciation and appreciation until the payments are made, at which time they are realized. Upfront payments and receipts are reflected in the Consolidated Statement of Assets and Liabilities and represent compensating factors between stated terms of the cross currency swap contract and prevailing market conditions (interest rate spreads and other relevant factors). These upfront payments and receipts are amortized over the term of the contract as a realized gain or loss in the Consolidated Statement of Operations.
The Fund entered into OTC total return swap contracts primarily to manage and/or gain exposure to interest rate risk of an underlying instrument such as a stock, bond, index or basket of securities or indices. A total return swap is an agreement between the Fund and a counterparty to exchange a return linked to an underlying instrument for a floating or fixed rate payment, both based upon a notional amount. Over the term of the contract, contractually required payments to be paid or
received are accrued daily and recorded as unrealized appreciation or depreciation until the payments are made, at which time they are recognized as realized gain or loss.
The Fund invests in value recovery instruments (VRI) primarily to gain exposure to economic growth. Periodic payments from VRI are dependent on established benchmarks for underlying variables. VRI has a notional amount, which is used to calculate amounts of payments to holders. Payments are recorded upon receipt as realized gains in the Consolidated Statement of Operations. The risks of investing in VRI include growth risk, liquidity, and the potential loss of investment.
See Note 9 regarding other derivative information.
e. Restricted Cash
At December 31, 2018, the Fund held restricted cash in connection with investments in certain derivative securities. Restricted cash is held in a segregated account with the Fund’s custodian and is reflected in the Consolidated Statement of Assets and Liabilities.
f. Loan Participation Notes
The Fund invests in loan participation notes (Participations). Participations are loans originally issued to a borrower by one or more financial institutions (the Lender) and subsequently sold to other investors, such as the Fund. Participations typically result in the Fund having a contractual relationship only with the Lender and not with the borrower. The Fund has the right to receive from the Lender any payments of principal, interest and fees which the Lender received from the borrower. The Fund generally has no rights to either enforce compliance by the borrower with the terms of the loan agreement or to any collateral relating to the original loan. As a result, the Fund assumes the credit risk of both the borrower and the Lender that is selling the Participation. The Participations may also involve interest rate risk and liquidity risk, including the potential default or insolvency of the borrower and/or the Lender.
g. Investments in FT Holdings Corporation III (FT Subsidiary)
The Fund invests in certain financial instruments through its investment in FT Subsidiary. FT Subsidiary is a Delaware Corporation, is a wholly-owned subsidiary of the Fund, and is able to invest in certain financial instruments consistent with the investment objective of the Fund. At December 31, 2018, FT Subsidiary’s investment, Turtle Bay Resort, as well as any other
FRANKLIN TEMPLETON VARIABLE INSURANCE PRODUCTS TRUST
NOTES TO CONSOLIDATED FINANCIAL STATEMENTS
Franklin Strategic Income VIP Fund(continued)
1. Organization and Significant Accounting Policies(continued)
g. Investments in FT Holdings Corporation III (FT Subsidiary)(continued)
assets and liabilities of FT Subsidiary are reflected in the Fund’s Consolidated Statement of Investments and Consolidated Statement of Assets and Liabilities.
During the year ended December 31, 2018, Turtle Bay Resort paid a distribution to FT Subsidiary. The distribution received is reflected as other income in the Consolidated Statement of Operations. At December 31, 2018, the FT Subsidiary, which is a tax paying entity, recognized an unrealized loss on its Turtle Bay investment. An estimated deferred tax asset based on such unrealized loss is reflected as FT Subsidiary deferred tax benefit in the Consolidated Statement of Assets and Liabilities. The estimated benefit was calculated using a federal rate of 21%. When the Turtle Bay investment liquidates, the FT Subsidiary will recognize a capital loss which can be carried-back to offset prior year capital gains, resulting in a tax refund which will relieve the deferred tax asset.
The financial statements have been consolidated and include the accounts of the Fund and FT Subsidiary. All intercompany transactions and balances have been eliminated. At December 31, 2018, the net assets of FT Subsidiary were $6,402,660, representing 1.4% of the Fund’s consolidated net assets. The Fund’s investment in FT Subsidiary is limited to 25% of consolidated assets.
h. Mortgage Dollar Rolls
The Fund enters into mortgage dollar rolls, typically on a TBA basis. Mortgage dollar rolls are agreements between the Fund and a financial institution where the Fund sells (or buys) mortgage-backed securities for delivery on a specified date and simultaneously contracts to repurchase (or sell) substantially similar (same type, coupon, and maturity) securities at a future date and at a predetermined price. Gains or losses are realized on the initial sale, and the difference between the repurchase price and the sale price is recorded as an unrealized gain or loss to the Fund upon entering into the mortgage dollar roll. In addition, the Fund may invest the cash proceeds that are received from the initial sale. During the period between the sale and repurchase, the Fund is not entitled to principal and interest paid on the mortgage backed securities. Transactions in mortgage dollar rolls are accounted for as purchases and sales
and may result in an increase to the Fund’s portfolio turnover rate. The risks of mortgage dollar roll transactions include the potential inability of the counterparty to fulfill its obligations.
i. Senior Floating Rate Interests
The Fund invests in senior secured corporate loans that pay interest at rates which are periodically reset by reference to a base lending rate plus a spread. These base lending rates are generally the prime rate offered by a designated U.S. bank or the London InterBank Offered Rate (LIBOR). Senior secured corporate loans often require prepayment of principal from excess cash flows or at the discretion of the borrower. As a result, actual maturity may be substantially less than the stated maturity. Senior secured corporate loans in which the Fund invests are generally readily marketable, but may be subject to certain restrictions on resale.
j. Income and Deferred Taxes
It is the Fund’s policy to qualify as a regulated investment company under the Internal Revenue Code. The Fund intends to distribute to shareholders substantially all of its taxable income and net realized gains to relieve it from federal income and if applicable, excise taxes. As a result, no provision for U.S. federal income taxes is required.
The Fund may be subject to foreign taxation related to income received, capital gains on the sale of securities and certain foreign currency transactions in the foreign jurisdictions in which it invests. Foreign taxes, if any, are recorded based on the tax regulations and rates that exist in the foreign markets in which the Fund invests. When a capital gain tax is determined to apply, the Fund records an estimated deferred tax liability in an amount that would be payable if the securities were disposed of on the valuation date.
The Fund may recognize an income tax liability related to its uncertain tax positions under U.S. GAAP when the uncertain tax position has a less than 50% probability that it will be sustained upon examination by the tax authorities based on its technical merits. As of December 31, 2018, the Fund has determined that no tax liability is required in its financial statements related to uncertain tax positions for any open tax years (or expected to be taken in future tax years). Open tax years are those that remain subject to examination and are based on the statute of limitations in each jurisdiction in which the Fund invests.
FRANKLIN TEMPLETON VARIABLE INSURANCE PRODUCTS TRUST
NOTES TO CONSOLIDATED FINANCIAL STATEMENTS
Franklin Strategic Income VIP Fund(continued)
k. Security Transactions, Investment Income, Expenses and Distributions
Security transactions are accounted for on trade date. Realized gains and losses on security transactions are determined on a specific identification basis. Interest income and estimated expenses are accrued daily. Amortization of premium and accretion of discount on debt securities are included in interest income. Paydown gains and losses are recorded as an adjustment to interest income. Facility fees are recognized as income over the expected term of the loan. Dividend income is recorded on theex-dividend date except for certain dividends from securities where the dividend rate is not available. In such cases, the dividend is recorded as soon as the information is received by the Fund. Distributions to shareholders are recorded on theex-dividend date. Distributable earnings are determined according to income tax regulations (tax basis) and may differ from earnings recorded in accordance with U.S. GAAP. These differences may be permanent or temporary. Permanent differences are reclassified among capital accounts to reflect their tax character. These reclassifications have no impact on net assets or the results of operations. Temporary differences are not reclassified, as they may reverse in subsequent periods.*
Common expenses incurred by the Trust are allocated among the Funds based on the ratio of net assets of each Fund to the combined net assets of the Trust or based on the ratio of number of shareholders of each Fund to the combined number of shareholders of the Trust. Fund specific expenses are charged directly to the Fund that incurred the expense.
Realized and unrealized gains and losses and net investment income, excluding class specific expenses, are allocated daily to each class of shares based upon the relative proportion of net assets of each class. Differences in per share distributions by class are generally due to differences in class specific expenses.
Inflation-indexed bonds are adjusted for inflation through periodic increases or decreases in the security’s interest accruals, face amount, or principal redemption value, by amounts corresponding to the rate of inflation as measured by an index. Any increase or decrease in the face amount or principal redemption value will be included as interest income in the Consolidated Statement of Operations.
l. Accounting Estimates
The preparation of financial statements in accordance with U.S. GAAP requires management to make estimates and assumptions that affect the reported amounts of assets and liabilities at the date of the financial statements and the amounts of income and expenses during the reporting period. Actual results could differ from those estimates.
m. Guarantees and Indemnifications
Under the Trust’s organizational documents, its officers and trustees are indemnified by the Trust against certain liabilities arising out of the performance of their duties to the Trust. Additionally, in the normal course of business, the Trust, on behalf of the Fund, enters into contracts with service providers that contain general indemnification clauses. The Trust’s maximum exposure under these arrangements is unknown as this would involve future claims that may be made against the Trust that have not yet occurred. Currently, the Trust expects the risk of loss to be remote.
*Effective during the current reporting period, it is no longer required to present certain line items in the Consolidated Statements of Changes in Net Assets. The below prior period amounts affected by this change are shown as they were in the prior year Consolidated Statements of Changes in Net Assets.
For the year ended December 31, 2017, distributions to shareholders were as follows:
| | | | |
Distributions from net investment income : | | | | |
Class 1 | | $ | (11,689,930 | ) |
Class 2 | | | (6,228,631 | ) |
Class 4 | | | (2,076,378 | ) |
For the year ended December 31, 2017, undistributed net investment income included in net assets was $13,385,921.
FRANKLIN TEMPLETON VARIABLE INSURANCE PRODUCTS TRUST
NOTES TO CONSOLIDATED FINANCIAL STATEMENTS
Franklin Strategic Income VIP Fund(continued)
2. Shares of Beneficial Interest
At December 31, 2018, there were an unlimited number of shares authorized (without par value). Transactions in the Fund’s shares were as follows:
| | | | | | | | | | | | | | | | | | | | |
| |
| | | Year Ended December 31, | |
| | | |
| | | 2018 | | | | | | 2017 | |
| | | | | |
| | | Shares | | | Amount | | | | | | Shares | | | Amount | |
| | | | | |
| Class 1 Shares: | | | | | | | | | | | | | | | | | | | | |
Shares sold | | | 529,935 | | | $ | 5,819,800 | | | | | | | | 707,945 | | | $ | 8,170,021 | |
Shares issued in reinvestment of distributions | | | 904,373 | | | | 9,703,924 | | | | | | | | 1,057,912 | | | | 11,689,930 | |
Shares redeemed | | | (5,463,142 | ) | | | (59,510,242 | ) | | | | | | | (5,334,630 | ) | | | (59,544,457 | ) |
| | | | |
Net increase (decrease) | | | (4,028,834 | ) | | $ | (43,986,518 | ) | | | | | | | (3,568,773 | ) | | $ | (39,684,506 | ) |
| | | | |
| Class 2 Shares: | | | | | | | | | | | | | | | | | | | | |
Shares sold | | | 1,939,103 | | | $ | 20,473,500 | | | | | | | | 3,399,404 | | | $ | 36,838,010 | |
Shares issued in reinvestment of distributions | | | 552,570 | | | | 5,724,625 | | | | | | | | 583,205 | | | | 6,228,631 | |
Shares redeemedin-kind (Note 11) | | | (10,844,970 | ) | | | (113,023,023 | ) | | | | | | | — | | | | — | |
Shares redeemed | | | (2,870,064 | ) | | | (30,241,230 | ) | | | | | | | (3,193,383 | ) | | | (34,437,952 | ) |
| | | | |
Net increase (decrease) | | | (11,223,361 | ) | | $ | (117,066,128 | ) | | | | | | | 789,226 | | | $ | 8,628,689 | |
| | | | |
| Class 4 Shares: | | | | | | | | | | | | | | | | | | | | |
Shares sold | | | 351,399 | | | $ | 3,829,733 | | | | | | | | 426,432 | | | $ | 4,757,499 | |
Shares issued in reinvestment of distributions | | | 158,766 | | | | 1,690,861 | | | | | | | | 189,278 | | | | 2,076,378 | |
Shares redeemed | | | (1,457,847 | ) | | | (15,792,168 | ) | | | | | | | (1,268,068 | ) | | | (14,025,922 | ) |
| | | | |
Net increase (decrease) | | | (947,682 | ) | | $ | (10,271,574 | ) | | | | | | | (652,358 | ) | | $ | (7,192,045 | ) |
| | | | |
3. Transactions with Affiliates
Franklin Resources, Inc. is the holding company for various subsidiaries that together are referred to as Franklin Templeton. Certain officers and trustees of the Fund are also officers and/or directors of the following subsidiaries:
| | |
| |
| Subsidiary | | Affiliation |
Franklin Advisers, Inc. (Advisers) | | Investment manager |
Franklin Templeton Services, LLC (FT Services) | | Administrative manager |
Franklin Templeton Distributors, Inc. (Distributors) | | Principal underwriter |
Franklin Templeton Investor Services, LLC (Investor Services) | | Transfer agent |
FRANKLIN TEMPLETON VARIABLE INSURANCE PRODUCTS TRUST
NOTES TO CONSOLIDATED FINANCIAL STATEMENTS
Franklin Strategic Income VIP Fund(continued)
a. Management Fees
The Fund pays an investment management fee to Advisers based on the average daily net assets of the Fund as follows:
| | |
| |
| Annualized Fee Rate | | Net Assets |
0.625% | | Up to and including $500 million |
0.525% | | Over $500 million, up to and including $1 billion |
0.480% | | Over $1 billion, up to and including $1.5 billion |
0.435% | | Over $1.5 billion, up to and including $6.5 billion |
0.415% | | Over $6.5 billion, up to and including $11.5 billion |
0.400% | | Over $11.5 billion, up to and including $16.5 billion |
0.390% | | Over $16.5 billion, up to and including $19 billion |
0.380% | | Over $19 billion, up to and including $21.5 billion |
0.370% | | In excess of $21.5 billion |
For the year ended December 31, 2018, the gross effective investment management fee rate was 0.609% of the Fund’s average daily net assets.
b. Administrative Fees
Under an agreement with Advisers, FT Services provides administrative services to the Fund. The fee is paid by Advisers based on the Fund’s average daily net assets, and is not an additional expense of the Fund.
c. Distribution Fees
The Board has adopted distribution plans for Class 2 and Class 4 shares pursuant to Rule12b-1 under the 1940 Act. Under the Fund’s compensation distribution plans, the Fund pays Distributors for costs incurred in connection with the servicing, sale and distribution of the Fund’s shares up to 0.25% and 0.35% per year of its average daily net assets of Class 2 and Class 4, respectively. The plan year, for purposes of monitoring compliance with the maximum annual plan rates, is February 1 through January 31.
d. Transfer Agent Fees
Investor Services, under terms of an agreement, performs shareholder servicing for the Fund and is not paid by the Fund for the services.
e. Investments in Affiliated Management Investment Companies
The Fund invests in one or more affiliated management investment companies for purposes other than exercising a controlling influence over the management or policies. Management fees paid by the Fund are waived on assets invested in the affiliated management investment companies, as noted in the Consolidated Statement of Operations, in an amount not to exceed the management and administrative fees paid directly or indirectly by each affiliate. During the year ended December 31, 2018, the Fund held investments in affiliated management investment companies as follows:
| | | | | | | | | | | | | | | | | | | | | | | | | | | | | | | | |
| | | | | | | | |
| | | Number
of Shares
Held at
Beginning
of Year | | | Gross
Additions | | | Gross
Reductions | | | Number
of Shares
Held at
End of
Year | | | Value at
End of
Year | | | Dividend
Income | | | Realized
Gain
(Loss) | | | Net Change in
Unrealized
Appreciation
(Depreciation) | |
|
|
|
| Non-Controlled Affiliates | | | | | | | | | | | | | | | | | | | | | | | | | | | | | | | | |
Franklin Lower Tier Floating Rate Fund . | | | 2,081,861 | | | | — | | | | (651,673 | ) | | | 1,430,188 | | | $ | 13,000,405 | | | $ | 1,765,290 | | | $ | (143,368 | ) | | $ | (1,373,155 | ) |
Franklin Middle Tier Floating Rate Fund. | | | 2,024,951 | | | | — | | | | (666,000 | ) | | | 1,358,951 | | | | 12,230,563 | | | | 1,329,556 | | | | (299,700 | ) | | | (669,659 | ) |
FRANKLIN TEMPLETON VARIABLE INSURANCE PRODUCTS TRUST
NOTES TO CONSOLIDATED FINANCIAL STATEMENTS
Franklin Strategic Income VIP Fund(continued)
3. Transactions with Affiliates(continued)
e. Investments in Affiliated Management Investment Companies(continued)
| | | | | | | | | | | | | | | | | | | | | | | | | | | | | | | | |
| | | | | | | | |
| | | Number
of Shares
Held at
Beginning
of Year | | | Gross
Additions | | | Gross
Reductions | | | Number
of Shares
Held at
End of
Year | | | Value at
End of
Year | | | Dividend
Income | | | Realized
Gain
(Loss) | | | Net Change in
Unrealized
Appreciation
(Depreciation) | |
|
|
|
| Non-Controlled Affiliates | | | | | | | | | | | | | | | | | | | | | | | | | | | | | | | | |
Institutional Fiduciary Trust Money Market Portfolio, 1.99% | | | 10,018,679 | | | | 163,271,007 | | | | (163,024,455 | ) | | | 10,265,231 | | | $ | 10,265,231 | | | $ | 190,755 | | | $ | — | | | $ | — | |
| | | | | | | | | | | | | | | | | | | | |
Total Affiliated Securities | | | | | | | | | | | | | | | | | | $ | 35,496,199 | | | $ | 3,285,601 | | | $ | (443,068 | ) | | $ | (2,042,814 | ) |
| | | | | | | | | | | | | | | | | | | | |
f. Other Affiliated Transactions
During the year ended December 31, 2018, Advisers reimbursed the Fund $502,477 of losses resulting from a NAV error. This reimbursement is reflected in capital share transactions in the Consolidated Statements of Changes in Net Assets.
4. Expense Offset Arrangement
The Fund has entered into an arrangement with its custodian whereby credits realized as a result of uninvested cash balances are used to reduce a portion of the Fund’s custodian expenses. During the year ended December 31, 2018, the custodian fees were reduced as noted in the Consolidated Statement of Operations.
5. Income Taxes
For tax purposes, capital losses may be carried over to offset future capital gains. At December 31, 2018, the capital loss carryforwards were as follows:
| | | | |
Capital loss carryforwards not subject to expiration: | | | | |
Short Term. | | $ | 3,186,035 | |
Long Term | | | 36,761,926 | |
| | | | |
Total capital loss carryforwards | | $ | 39,947,961 | a |
| | | | |
aSubject to certain limitations under Internal Revenue Code Section 382.
The tax character of distributions paid during the years ended December 31, 2018 and 2017, was as follows:
| | | | | | | | |
| | |
| | | 2018 | | | 2017 | |
Distributions paid from ordinary income | | $ | 17,119,410 | | | $ | 19,994,939 | |
| | | | |
At December 31, 2018, the cost of investments, net unrealized appreciation (depreciation) and undistributed ordinary income for income tax purposes were as follows:
| | | | |
Cost of investments | | $ | 503,477,485 | |
| | | | |
Unrealized appreciation | | $ | 4,031,803 | |
Unrealized depreciation | | | (35,178,673 | ) |
| | | | |
Net unrealized appreciation (depreciation) | | $ | (31,146,870 | ) |
| | | | |
Distributable earnings-undistributed ordinary income | | $ | 23,632,580 | |
| | | | |
FRANKLIN TEMPLETON VARIABLE INSURANCE PRODUCTS TRUST
NOTES TO CONSOLIDATED FINANCIAL STATEMENTS
Franklin Strategic Income VIP Fund(continued)
Differences between income and/or capital gains as determined on a book basis and a tax basis are primarily due to differing treatments of foreign currency transactions, bond discounts and premiums, swaps and financial futures transactions.
6. Investment Transactions
Purchases and sales of investments (excluding short term securities) for the year ended December 31, 2018, aggregated $655,351,254 and $755,591,203, respectively. Sales of investments excludesin-kind transactions of $74,395,278.
7. Credit Risk and Defaulted Securities
At December 31, 2018, the Fund had 43.1% of its portfolio invested in high yield, senior secured floating rate loans, or other securities rated below investment grade and unrated securities, if any. These securities may be more sensitive to economic conditions causing greater price volatility and are potentially subject to a greater risk of loss due to default than higher rated securities.
The Fund held defaulted securities and/or other securities for which the income has been deemed uncollectible. At December 31, 2018, the aggregate value of these securities was $2,442,368, representing 0.5% of the Fund’s net assets. The Fund discontinues accruing income on securities for which income has been deemed uncollectible and provides an estimate for losses on interest receivable. The securities have been identified in the accompanying Consolidated Statement of Investments.
8. Restricted Securities
The Fund invests in securities that are restricted under the Securities Act of 1933 (1933 Act). Restricted securities are often purchased in private placement transactions, and cannot be sold without prior registration unless the sale is pursuant to an exemption under the 1933 Act. Disposal of these securities may require greater effort and expense, and prompt sale at an acceptable price may be difficult. The Fund may have registration rights for restricted securities. The issuer generally incurs all registration costs.
At December 31, 2018, investments in restricted securities, excluding securities exempt from registration under the 1933 Act deemed to be liquid, were as follows:
| | | | | | | | | | | | |
| | | | |
Principal
Amount/
Shares | | Issuer | | Acquisition Date | | | Cost | | Value | |
|
|
|
14,792,309 | | K2016470219 South Africa Ltd., A | | | 2/08/13 - 2/01/17 | | | $ 114,768 | | $ | 10,295 | |
1,472,041 | | K2016470219 South Africa Ltd., B | | | 2/01/17 | | | 1,093 | | | 1,025 | |
933,786 | | K2016470219 South Africa Ltd., senior secured note, 144A, PIK, 3.00%, 12/31/22 | | | 2/08/13 - 12/31/18 | | | 1,420,595 | | | 1,150 | |
247,597 | | K2016470260 South Africa Ltd., senior secured note, 144A, PIK, 25.00%, 12/31/22 | | | 2/01/17 - 12/31/18 | | | 196,254 | | | 17,607 | |
| | | | | | | | | |
| | Total Restricted Securities(Value is 0.0%†of Net Assets) | | | | | | $1,732,710 | | $ | 30,077 | |
| | | | | | | | | |
|
| †Rounds to less than 0.1% of net assets. |
FRANKLIN TEMPLETON VARIABLE INSURANCE PRODUCTS TRUST
NOTES TO CONSOLIDATED FINANCIAL STATEMENTS
Franklin Strategic Income VIP Fund(continued)
9. Other Derivative Information
At December 31, 2018, the Fund’s investments in derivative contracts are reflected in the Consolidated Statement of Assets and Liabilities as follows:
| | | | | | | | | | | | |
| | |
| | | Asset Derivatives | | | Liability Derivatives | |
| | | | |
Derivative Contracts Not
Accounted for as Hedging
Instruments | | Consolidated Statement of
Assets and Liabilities Location | | Fair Value | | | Consolidated Statement of
Assets and Liabilities Location | | Fair Value | |
|
|
Interest rate contracts | | Variation margin on futures contracts | | $ | 828,294 | a | | Variation margin on futures contracts | | $ | 136,613 | a |
| | Unrealized appreciation on OTC swap contracts | | | 4,052 | | | Unrealized depreciation on OTC swap contracts | | | 426,576 | |
Foreign exchange contracts | | Unrealized appreciation on OTC forward exchange contracts | | | 799,946 | | | Unrealized depreciation on OTC forward exchange contracts | | | 537,196 | |
Credit contracts | | Variation margin on centrally cleared swap contracts | | | — | | | Variation margin on centrally cleared swap contracts | | | 40,297a | |
| | OTC swap contracts (upfront payments) | | | 677,982 | | | OTC swap contracts (upfront receipts) | | | 1,191,244 | |
| | Unrealized appreciation on OTC swap contracts | | | 151,896 | | | Unrealized depreciation on OTC swap contracts | | | 1,756,866 | |
Value recovery instruments | | Investments in securities, at value | | | 793,873 | b | | | | | | |
| | | | | | | | | | | | |
Totals | | | | $ | 3,256,043 | | | | | $ | 4,088,792 | |
| | | | | | | | | | | | |
aThis amount reflects the cumulative appreciation (depreciation) of futures contracts and centrally cleared swap contracts as reported in the Consolidated Statement of Investments. Only the variation margin receivable/payable at year end is separately reported within the Consolidated Statement of Assets and Liabilities. Prior variation margin movements were recorded to cash upon receipt or payment. bVRI are included in investments in securities, at value in the Consolidated Statement of Assets and Liabilities.
For the year ended December 31, 2018, the effect of derivative contracts in the Fund’s Consolidated Statement of Operations was as follows:
| | | | | | | | | | | | |
| | | | |
Derivative Contracts
Not Accounted for as
Hedging Instruments | | Consolidated Statement of
Operations Location | | Net Realized
Gain (Loss)
for the Year | | | Consolidated Statement of
Operations Location | | Net Change in
Unrealized
Appreciation
(Depreciation)
for the Year | |
| | Net realized gain (loss) from: | | | | | | Net change in unrealized appreciation (depreciation) on: | | | | |
Interest rate contracts | | Futures contracts | | $ | (515,772 | ) | | Futures contracts | | $ | 663,984 | |
| | Swap contracts | | | (181,075 | ) | | Swap contracts | | | (422,524 | ) |
Foreign exchange contracts | | Forward exchange contracts | | | (1,115,592 | ) | | Forward exchange contracts | | | 380,763 | |
Credit contracts | | Swap contracts | | | 860,386 | | | Swap contracts | | | (1,702,663 | ) |
Value recovery instruments | | Investments | | | (112,230 | )a | | Investments | | | (67,149 | )a |
| | | | | | | | | | | | |
Totals | | | | $ | (1,064,283 | ) | | | | $ | (1,147,589 | ) |
| | | | | | | | | | | | |
aVRI are included in net realized gain (loss) from investments and net change in unrealized appreciation (depreciation) on investments in the Consolidated Statement of Operations.
For the year ended December 31, 2018, the average month end notional amount of futures contracts and swap contracts and the
average month end contract value for forward exchange contracts, and average month end fair value of VRI, were as follows:
| | |
Futures Contracts | | $24,363,586 |
Swap contracts | | 52,293,764 |
Forward exchange contracts | | 78,423,673 |
VRI | | 1,135,301 |
FRANKLIN TEMPLETON VARIABLE INSURANCE PRODUCTS TRUST
NOTES TO CONSOLIDATED FINANCIAL STATEMENTS
Franklin Strategic Income VIP Fund(continued)
| | | | | | | | |
| |
| | | Gross Amounts of
Assets and Liabilities Presented
in the Consolidated Statement
of Assets and Liabilities | |
| | |
| | | Assetsa | | | Liabilitiesa | |
| Derivatives | | | | | | | | |
Forward exchange contracts | | $ | 799,946 | | | $ | 537,196 | |
Swap contracts | | | 833,930 | | | | 3,374,686 | |
| | | | |
Total | | $ | 1,633,876 | | | $ | 3,911,882 | |
| | | | |
aAbsent an event of default or early termination, OTC derivative assets and liabilities are presented gross and not offset in the Consolidated Statement of Assets and Liabilities.
At December 31, 2018, the Fund’s OTC derivative assets, which may be offset against the Fund’s OTC derivative liabilities and collateral received from the counterparty, are as follows:
| | | | | | | | | | | | | | | | | | | | |
| | | |
| | | | | | Amounts Not Offset in the Consolidated Statement
of Assets and Liabilities | | | | |
| | | | | |
| | | Gross Amounts of
Assets Presented in the Consolidated Statement of
Assets and Liabilities | | | Financial
Instruments
Available for Offset | | | Financial
Instruments
Collateral
Received | | | Cash
Collateral
Receiveda | | | Net Amount (Not less
than zero) | |
| Counterparty | | | | | | | | | | | | | | | | | | | | |
BNDP | | $ | — | | | $ | — | | | $ | — | | | $ | — | | | $ | — | |
BOFA | | | — | | | | — | | | | — | | | | — | | | | — | |
BZWS | | | 252,009 | | | | (156,974 | ) | | | — | | | | — | | | | 95,035 | |
CITI | | | 173,775 | | | | (173,775 | ) | | | — | | | | — | | | | — | |
DBAB | | | 151,030 | | | | (32,627 | ) | | | — | | | | (110,000 | ) | | | 8,403 | |
FBCO | | | — | | | | — | | | | — | | | | — | | | | — | |
GSCO | | | — | | | | — | | | | — | | | | — | | | | — | |
JPHQ | | | 673,245 | | | | (673,245 | ) | | | — | | | | — | | | | — | |
MSCO | | | 383,817 | | | | (383,817 | ) | | | — | | | | — | | | | — | |
| | | | |
Total | | $ | 1,633,876 | | | $ | (1,420,438 | ) | | $ | — | | | $ | (110,000 | ) | | $ | 103,438 | |
| | | | |
FRANKLIN TEMPLETON VARIABLE INSURANCE PRODUCTS TRUST
NOTES TO CONSOLIDATED FINANCIAL STATEMENTS
Franklin Strategic Income VIP Fund(continued)
9. Other Derivative Information(continued)
At December 31, 2018, the Fund’s OTC derivative liabilities, which may be offset against the Fund’s OTC derivative assets and collateral pledged to the counterparty, are as follows:
| | | | | | | | | | | | | | | | | | | | |
| | | |
| | | | | | Amounts Not Offset in the Consolidated Statement of
Assets and Liabilities | | | | |
| | | | | |
| | | Gross Amounts of
Liabilities Presented in
the Consolidated Statement of
Assets and Liabilities | | | Financial
Instruments
Available for Offset | | | Financial
Instruments
Collateral
Pledged | | | Cash Collateral
Pledgeda | | | Net Amount (Not less
than zero) | |
| Counterparty | | | | | | | | | | | | | | | | | | | | |
BNDP | | $ | 43,672 | | | $ | — | | | $ | — | | | $ | — | | | $ | 43,672 | |
BOFA | | | 159,121 | | | | — | | | | — | | | | (159,121 | ) | | | — | |
BZWS | | | 156,974 | | | | (156,974 | ) | | | — | | | | — | | | | — | |
CITI | | | 1,725,011 | | | | (173,775 | ) | | | — | | | | (1,551,236 | ) | | | — | |
DBAB | | | 32,627 | | | | (32,627 | ) | | | — | | | | — | | | | — | |
FBCO | | | 26,897 | | | | — | | | | — | | | | — | | | | 26,897 | |
GSCO | | | 179,925 | | | | — | | | | — | | | | (110,000 | ) | | | 69,925 | |
JPHQ | | | 770,289 | | | | (673,245 | ) | | | — | | | | (97,044 | ) | | | — | |
MSCO | | | 817,366 | | | | (383,817 | ) | | | — | | | | (410,000 | ) | | | 23,549 | |
| | | | |
Total | | $ | 3,911,882 | | | $ | (1,420,438 | ) | | $ | — | | | $ | (2,327,401 | ) | | $ | 164,043 | |
| | | | |
aIn some instances, the collateral amounts disclosed in the table above were adjusted due to the requirement to limit collateral amounts to avoid the effect of overcollateralization. Actual collateral received and/or pledged may be more than the amounts disclosed herein.
See Note 1(d) regarding derivative financial instruments.
See Abbreviations on pageFSI-60.
10. Credit Facility
The Fund, together with other U.S. registered and foreign investment funds (collectively, Borrowers), managed by Franklin Templeton, are borrowers in a joint syndicated senior unsecured credit facility totaling $2 billion (Global Credit Facility) which matured on February 8, 2019. This Global Credit Facility provides a source of funds to the Borrowers for temporary and emergency purposes, including the ability to meet future unanticipated or unusually large redemption requests. Effective February 8, 2019, the Borrowers renewed the Global Credit Facility for a one year term, maturing February 7, 2020, for a total of $2 billion.
Under the terms of the Global Credit Facility, the Fund shall, in addition to interest charged on any borrowings made by the Fund and other costs incurred by the Fund, pay its share of fees and expenses incurred in connection with the implementation and maintenance of the Global Credit Facility, based upon its relative share of the aggregate net assets of all of the Borrowers, including an annual commitment fee of 0.15% based upon the unused portion of the Global Credit Facility. These fees are reflected in other expenses in the Consolidated Statement of Operations. During the year ended December 31, 2018, the Fund did not use the Global Credit Facility.
11. RedemptionIn-Kind
During the year ended December 31, 2018, the Fund realized $2,963,426 of net losses resulting from a redemptionin-kind in which a shareholder redeemed fund shares for cash and securities held by the Fund. Because such losses are not taxable to the Fund, and are not netted with capital gains that are distributed to remaining shareholders, they have been reclassified from accumulated net realized losses topaid-in capital.
FRANKLIN TEMPLETON VARIABLE INSURANCE PRODUCTS TRUST
NOTES TO CONSOLIDATED FINANCIAL STATEMENTS
Franklin Strategic Income VIP Fund(continued)
12. Fair Value Measurements
The Fund follows a fair value hierarchy that distinguishes between market data obtained from independent sources (observable inputs) and the Fund’s own market assumptions (unobservable inputs). These inputs are used in determining the value of the Fund’s financial instruments and are summarized in the following fair value hierarchy:
| | • | | Level 1 – quoted prices in active markets for identical financial instruments |
| | • | | Level 2 – other significant observable inputs (including quoted prices for similar financial instruments, interest rates, prepayment speed, credit risk, etc.) |
| | • | | Level 3 – significant unobservable inputs (including the Fund’s own assumptions in determining the fair value of financial instruments) |
The input levels are not necessarily an indication of the risk or liquidity associated with financial instruments at that level.
A summary of inputs used as of December 31, 2018, in valuing the Fund’s assets and liabilities carried at fair value, is as follows:
| | | | | | | | | | | | | | | | |
| | | | |
| | | Level 1 | | | Level 2 | | | Level 3 | | | Total | |
| Assets: | | | | | | | | | | | | | | | | |
Investments in Securities:a | | | | | | | | | | | | | | | | |
Equity Investments:b | | | | | | | | | | | | | | | | |
Consumer Services | | $ | — | | | $ | — | | | $ | 41,832 | | | $ | 41,832 | |
Energy. | | | 310,011 | | | | 851,558 | | | | 10 | | | | 1,161,579 | |
Retailing | | | — | | | | — | | | | 11,320 | | | | 11,320 | |
Transportation | | | — | | | | 218,178 | | | | — | | | | 218,178 | |
All Other Equity Investments | | | 25,359,934 | | | | — | | | | — | | | | 25,359,934 | |
Corporate Bonds: | | | | | | | | | | | | | | | | |
Retailing | | | — | | | | 1,242,704 | | | | 1,150 | | | | 1,243,854 | |
All Other Corporate Bonds | | | — | | | | 190,194,744 | | | | — | | | | 190,194,744 | |
Senior Floating Rate Interests | | | — | | | | 63,038,780 | | | | — | | | | 63,038,780 | |
Foreign Government and Agency Securities | | | — | | | | 14,661,028 | | | | — | | | | 14,661,028 | |
U.S. Government and Agency Securities | | | — | | | | 18,118,404 | | | | — | | | | 18,118,404 | |
Asset-Backed Securities and Commercial Mortgage-Backed Securities | | | — | | | | 94,908,754 | | | | — | | | | 94,908,754 | |
Mortgage-Backed Securities | | | — | | | | 47,312,182 | | | | — | | | | 47,312,182 | |
Municipal Bonds | | | — | | | | 5,933,089 | | | | — | | | | 5,933,089 | |
Escrows and Litigation Trusts | | | — | | | | 9,000 | | | | —c | | | | 9,000 | |
Short Term Investments | | | 10,265,231 | | | | 1,913,210 | | | | — | | | | 12,178,441 | |
| | | | |
Total Investments in Securities | | $ | 35,935,176 | | | $ | 438,401,631 | | | $ | 54,312 | | | $ | 474,391,119 | |
| | | | |
Other Financial Instruments: | | | | | | | | | | | | | | | | |
Futures Contracts | | $ | 828,294 | | | $ | — | | | $ | — | | | $ | 828,294 | |
Forward Exchange Contracts | | | — | | | | 799,946 | | | | — | | | | 799,946 | |
Swap Contracts. | | | — | | | | 155,948 | | | | — | | | | 155,948 | |
| | | | |
Total Other Financial Instruments | | $ | 828,294 | | | $ | 955,894 | | | $ | — | | | $ | 1,784,188 | |
| | | | |
FRANKLIN TEMPLETON VARIABLE INSURANCE PRODUCTS TRUST
NOTES TO CONSOLIDATED FINANCIAL STATEMENTS
Franklin Strategic Income VIP Fund(continued)
12. Fair Value Measurements(continued)
| | | | | | | | | | | | | | | | |
| | | | |
| | | Level 1 | | | Level 2 | | | Level 3 | | | Total | |
| Liabilities: | | | | | | | | | | | | | | | | |
Other Financial Instruments: | | | | | | | | | | | | | | | | |
Futures Contracts | | $ | 136,613 | | | $ | — | | | $ | — | | | $ | 136,613 | |
Forward Exchange Contracts | | | — | | | | 537,196 | | | | — | | | | 537,196 | |
Swap Contracts. | | | — | | | | 2,223,739 | | | | — | | | | 2,223,739 | |
| | | | |
Total Other Financial Instruments | | $ | 136,613 | | | $ | 2,760,935 | | | $ | — | | | $ | 2,897,548 | |
| | | | |
aFor detailed categories, see the accompanying Consolidated Statement of Investments. bIncludes common stocks and management investment companies as well as other equity interests. cIncludes securities determined to have no value at December 31, 2018.
A reconciliation of assets in which Level 3 inputs are used in determining fair value is presented when there are significant Level 3 financial instruments at the beginning and/or end of the year.
13. Subsequent Events
The Fund has evaluated subsequent events through the issuance of the consolidated financial statements and determined that no events have occurred that require disclosure other than those already disclosed in the consolidated financial statements.
| | | | | | | | | | |
Abbreviations | | | | | | | | |
| | |
| Counterparty | | Currency | | Selected Portfolio |
| | | | | |
| BNDP | | BNP Paribas SA | | BRL | | Brazilian Real | | ARM | | Adjustable Rate Mortgage |
| | | | | |
| BOFA | | Bank of America Corp. | | EUR | | Euro | | CLO | | Collateralized Loan Obligation |
| | | | | |
| BZWS | | Barclays Bank PLC | | IDR | | Indonesian Rupiah | | CMT | | 1 year Constant Maturity Treasury Index |
| | | | | |
| CITI | | Citigroup, Inc. | | MXN | | Mexican Peso | | FRN | | Floating Rate Note |
| | | | | |
| DBAB | | Deutsche Bank AG | | USD | | United States Dollar | | GDP | | Gross Domestic Product |
| | | | | |
| FBCO | | Credit Suisse International | | | | | | HDC | | Housing Development Corp. |
| | | | | |
| GSCO | | The Goldman Sachs Group, Inc. | | | | | | LIBOR | | London InterBank Offered Rate |
| | | | | |
| JPHQ | | JP Morgan Chase & Co. | | | | | | MBS | | Mortgage-Backed Security |
| | | | | |
| MSCO | | Morgan Stanley | | | | | | PIK | | Payment-In-Kind |
| | | | | |
| | | | | | | | RDA | | Redevelopment Agency/Authority |
| | | | | |
| | | | | | | | SF | | Single Family |
| | | | | |
| | | | | | | | T-Note | | Treasury Note |
| | | | | |
| | | | | | | | VRI | | Value Recovery Instrument |
Index Abbreviation
| | |
| CDX.EM.Series number | | CDX Emerging Markets Index |
| MCDX.NA.Series number | | MCDX North America Index |
FRANKLIN TEMPLETON VARIABLE INSURANCE PRODUCTS TRUST
Report of Independent Registered Public Accounting Firm
To the Board of Trustees of Franklin Templeton Variable Insurance Products Trust and Shareholders of Franklin Strategic Income VIP Fund
Opinion on the Financial Statements
We have audited the accompanying consolidated statement of assets and liabilities, including the consolidated statement of investments, of Franklin Strategic Income VIP Fund and its subsidiary (the “Fund”) as of December 31, 2018, the related consolidated statements of operations for the year ended December 31, 2018, the consolidated statement of changes in net assets for each of the two years in the period ended December 31, 2018, including the related notes, and the consolidated financial highlights for each of the five years in the period ended December 31, 2018 (collectively referred to as the “consolidated financial statements”). In our opinion, the consolidated financial statements present fairly, in all material respects, the consolidated financial position of the Fund as of December 31, 2018, the results of its operations for the year then ended, the changes in its net assets for each of the two years in the period ended December 31, 2018 and the consolidated financial highlights for each of the five years in the period ended December 31, 2018 in conformity with accounting principles generally accepted in the United States of America.
Basis for Opinion
These consolidated financial statements are the responsibility of the Fund’s management. Our responsibility is to express an opinion on the Fund’s consolidated financial statements based on our audits. We are a public accounting firm registered with the Public Company Accounting Oversight Board (United States) (PCAOB) and are required to be independent with respect to the Fund in accordance with the U.S. federal securities laws and the applicable rules and regulations of the Securities and Exchange Commission and the PCAOB.
We conducted our audits of these consolidated financial statements in accordance with the standards of the PCAOB. Those standards require that we plan and perform the audit to obtain reasonable assurance about whether the consolidated financial statements are free of material misstatement, whether due to error or fraud.
Our audits included performing procedures to assess the risks of material misstatement of the consolidated financial statements, whether due to error or fraud, and performing procedures that respond to those risks. Such procedures included examining, on a test basis, evidence regarding the amounts and disclosures in the consolidated financial statements. Our audits also included evaluating the accounting principles used and significant estimates made by management, as well as evaluating the overall presentation of the consolidated financial statements. Our procedures included confirmation of securities owned as of December 31, 2018 by correspondence with the custodian, transfer agent and brokers; when replies were not received from brokers, we performed other auditing procedures. We believe that our audits provide a reasonable basis for our opinion.
PricewaterhouseCoopers LLP
San Francisco, California
February 15, 2019
We have served as the auditor of one or more investment companies in the Franklin Templeton Group of Funds since 1948.
This page intentionally left blank.
Franklin U.S. Government Securities VIP Fund
This annual report for Franklin U.S. Government Securities VIP Fund covers the fiscal year ended December 31, 2018.
Class 1 Performance Summary as of December 31, 2018
Average annual total return of Class 1 shares represents the average annual change in value, assuming reinvestment of dividends and capital gains. Average returns smooth out variations in returns, which can be significant; they are not the same asyear-by-year results.
| | | | | | | | | | | | |
| | | |
| Periods ended 12/31/18 | | 1-Year | | | 5-Year | | | 10-Year | |
Average Annual Total Return | | | +0.60% | | | | +1.49% | | | | +2.22% | |
Performance reflects the Fund’s Class 1 operating expenses, but doesnotinclude any contract fees, expenses or sales charges. If they had been included, performance would be lower. These charges and deductions, particularly for variable life policies, can have a significant effect on contract values and insurance benefits. See the contract prospectus for a complete description of these expenses, including sales charges.
Performance data represent past performance, which does not guarantee future results. Investment return and principal value will fluctuate, and you may have a gain or loss when you sell your shares. Current performance may differ from figures shown.
Total Return Index Comparison for a Hypothetical $10,000 Investment (1/1/09–12/31/18)
The graph below shows the change in value of a hypothetical $10,000 investment in the Fund over the indicated period and includes reinvestment of any income or distributions. The Fund’s performance is compared to the performance of the Bloomberg Barclays U.S. Government Index: Intermediate Component, the Lipper VIP General U.S. Government Funds Classification Average and the Consumer Price Index. One cannot invest directly in an index, and an index is not representative of the Fund’s portfolio.Please see Important Notes to Performance Information preceding the Fund Summaries.
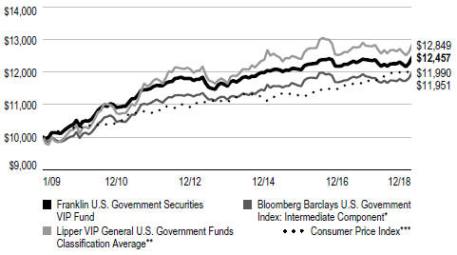
*Source: Morningstar. Please see Index Descriptions following the Fund Summaries.
**Source: Lipper, a Thomson Reuters Company. Please see Index Descriptions following the Fund Summaries.
***Source: Bureau of Labor Statistics, bls.gov/cpi. Please see Index Descriptions following the Fund Summaries.
FRANKLIN U.S. GOVERNMENT SECURITIES VIP FUND
Fund Goal and Main Investments
The Fund seeks income. Under normal market conditions, the Fund invests at least 80% of its net assets in U.S. government securities.
Fund Risks
All investments involve risks, including possible loss of principal. The Fund’s share price and yield will be affected by interest rate movements and mortgage prepayments. Bond prices generally move in the opposite direction of interest rates. Thus, as prices of bonds in the Fund adjust to a rise in interest rates, the Fund’s share price may decline. Changes in the financial strength of a bond issuer or in a bond’s credit rating may affect its value. The Fund is actively managed but there is no guarantee that the manager’s investment decisions will produce the desired results. The Fund’s prospectus also includes a description of the main investment risks.
Performance Overview
You can find the Fund’sone-year total return in the Performance Summary. In comparison, the Fund’s primary benchmark, the Bloomberg Barclays U.S. Government Index: Intermediate Component, posted a +1.43% total return.1 The Fund’s secondary benchmark, the Lipper VIP General U.S. Government Funds Classification Average, posted a +0.03% total return.2 Funds in the Lipper average may allocate as much as 35% of their investments in asset types other than U.S. government and agency mortgage-backed securities.
Economic and Market Overview
The U.S. economy grew during the 12 months under review. After moderating for three consecutive quarters, the economy grew faster in 2018’s second quarter, driven by consumer spending, business investment, exports and government spending. However, growth moderated in the third quarter due to declines in exports and housing investment. The manufacturing and services sectors expanded during the period. The unemployment rate declined from 4.1% in December 2017 to 3.9% atperiod-end.3 Annual inflation, as measured by the Consumer Price Index, decreased from 2.1% in December 2017 to 1.9% atperiod-end.3
Portfolio Composition
Based on Total Net Assets as of 12/31/18
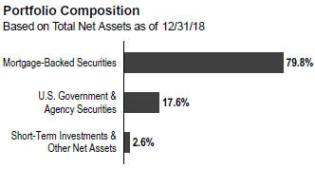
The U.S. Federal Reserve (Fed) raised its target range for the federal funds rate four times during the period, to 2.25%–2.50%, and continued to reduce its balance sheet as part of its ongoing plan to normalize monetary policy. At its December meeting, the Fed reduced the projected 2019 rate increases to two, compared to three projected previously.
The10-year Treasury yield, which moves inversely to its price, increased during the period. The yield rose to multi-year highs several times in 2018 amid investor concerns about higher inflation and the Fed’s interest-rate path. Expectations that other central banks might scale back monetary stimulus and better-than-expected U.S. economic reports also pushed the yield higher. However, some factors weighed on the Treasury yield at certain points during the period, including concerns about political turmoil in Italy, political uncertainties in the U.S., tensions between the U.S. and North Korea, the Trump administration’s protectionist trade policies, U.S. trade disputes with its allies and China, economic turmoil in Turkey and Argentina, slowing global economic growth and expectations the Fed would slow its pace of rate increases. Overall, the10-year Treasury yield rose from 2.40% at the beginning of the period to 2.69% atperiod-end.
1. Source: Morningstar.
2. Source: Lipper, a Thomson Reuters Company.
One cannot invest directly in an index, and an index is not representative of the Fund’s portfolio. Please see Index Descriptions following the Fund Summaries.
3. Source: Bureau of Labor Statistics.
The dollar value, number of shares or principal amount, and names of all portfolio holdings are listed in the Fund’s Statement of Investments (SOI).
FRANKLIN U.S. GOVERNMENT SECURITIES VIP FUND
Investment Strategy
Using our straightforward investment approach, we seek to produce current income with a high degree of credit safety from a conservatively managed portfolio of U.S. government securities. Analyzing securities using proprietary and nonproprietary research, we seek to identify attractive investment opportunities.
Manager’s Discussion
From a perspective of excess returns over Treasuries of similar duration as measured by Bloomberg Barclays indexes, asset-backed securities performed well. All other major fixed income sectors had negative excess returns during the period. U.S. economic indicators were generally encouraging during the reporting period. Growth in the manufacturing sector created new jobs and boosted employment levels. Retail sales grew for most of the period and increased toward period end, while energy prices dropped and inflation slowed. In this environment, home sales slowed due to rising interest rates, low supply levels and increasing home prices.
The Fund maintains a consistent and disciplined approach to our investment strategy. The Fund’s investment process and strategy have not changed, and the team continues to look for strong cash flow fundamentals and valuations seeking to uncover opportunities across the agency mortgage and agency debenture universe. The Fund emphasizes agency pass-throughs and invests in other agency securities for diversification purposes.
Within the agency mortgage pass-through sector, Freddie Mac MBS, Fannie Mae MBS and GNMA MBS had negative excess returns. All had positive total returns during the period.
During the period, we were more weighted toward GNMA IIs (pools of mortgages from multiple issuers) than GNMA Is (pools of mortgages from single issuers). Over the period, we increased exposure to GNMA II 4.0% coupons, while reducing exposure to 3.0%, 3.5% and 4.5% coupons. Atperiod-end, our heaviest exposures were in 3.5% and 4.0% coupons. Based on excess returns over Treasuries, coupon performance was mixed. GN II 5.0% securities were among the best performers, while GN I and II 3.5% and 3.0% securities lagged.
The Fund’s U.S. yield curve positioning was a contributor as yield curve movements had a positive impact relative to the benchmark. The Fund’s exposure to adjustable-rate mortgage-backed securities (MBS) was also a contributor during the period. In contrast, our exposure to fixed-rate agency
MBS was a detractor. The Fund’s exposure to Treasury-Inflation Protected Securities and U.S. agency securities also hurt Fund performance during the period.
Thank you for your participation in Franklin U.S. Government Securities VIP Fund. We look forward to serving your future investment needs.
The foregoing information reflects our analysis, opinions and portfolio holdings as of December 31, 2018, the end of the reporting period. The way we implement our main investment strategies and the resulting portfolio holdings may change depending on factors such as market and economic conditions. These opinions may not be relied upon as investment advice or an offer for a particular security. The information is not a complete analysis of every aspect of any market, country, industry, security or the Fund. Statements of fact are from sources considered reliable, but the investment manager makes no representation or warranty as to their completeness or accuracy.
Although historical performance is no guarantee of future results, these insights may help you understand our investment management philosophy.
FRANKLIN U.S. GOVERNMENT SECURITIES VIP FUND
Class 1 Fund Expenses
As an investor in a variable insurance contract (Contract) that indirectly provides for investment in an underlying mutual fund, you can incur transaction and/or ongoing expenses at both the Fund level and the Contract Level: (1) transaction expenses can include sales charges (loads) on purchases, surrender fees, transfer fees and premium taxes; and (2) ongoing expenses can include management fees, distribution and service(12b-1) fees, contract fees, annual maintenance fees, mortality and expense risk fees and other fees and expenses. All mutual funds and Contracts have some types of ongoing expenses. The table below shows Fund-level ongoing expenses and can help you understand these costs and compare them with those of other mutual funds offered through the Contract. The table assumes a $1,000 investment held for the six months indicated. Please refer to the Fund prospectus for additional information on operating expenses.
Actual Fund Expenses
The table below provides information about the actual account values and actual expenses in the columns under the heading “Actual.” In these columns the Fund’s actual return, which includes the effect of ongoing Fund expenses but does not include the effect of ongoing Contract expenses, is used to calculate the “Ending Account Value.” You can estimate the Fund-level expenses you paid during the period by following these steps (ofcourse, your account value and expenses will differ from those in this illustration):Divide your account value by $1,000 (ifyour account had an $8,600 value, then $8,600 ÷ $1,000 = 8.6). Then multiply the result by the number under the headings “Actual” and “Fund-Level Expenses Paid During Period” (ifFund-Level Expenses Paid During Period were $ 7.50, then 8.6x $ 7.50 = $64.50). In this illustration, the estimated expenses paid this period at the Fund level are $64.50.
Hypothetical Example for Comparison with Other Mutual Funds
Under the heading “Hypothetical” in the table, information is provided about hypothetical account values and hypothetical expenses based on the Fund’s actual expense ratio and an assumed rate of return of 5% per year before expenses, which is not the Fund’s actual return. This information may not be used to estimate the actual ending account balance or expenses you paid for the period, but it can help you compare ongoing costs of investing in the Fund with those of other mutual funds offered through the Contract. To do so, compare this 5% hypothetical example with the 5% hypothetical examples that appear in the shareholder reports of other funds offered through the Contract.
Please note that expenses shown in the table are meant to highlight ongoing costs at the Fund level only and do not reflect any ongoing expenses at the Contract level, or transaction expenses at either the Fund or Contract levels. In addition, while the Fund does not have transaction expenses, if the transaction and ongoing expenses at the Contract level were included, the expenses shown below would be higher. You should consult your Contract prospectus or disclosure document for more information.
| | | | | | | | | | | | |
| | | | | Actual
(actual return after expenses) | | Hypothetical (5%
annual return before expenses) | | |
| | | | | | |
| Share Class | | Beginning Account
Value 7/1/18 | | Ending Account Value 12/31/18 | | Fund-Level
Expenses Paid
During Period
7/1/18–12/31/181,2
| | Ending Account
Value 12/31/18 | | Fund-Level
Expenses Paid
During Period
7/1/18–12/31/181,2
| | Net
Annualized
Expense
Ratio2 |
Class 1 | | $1,000 | | $1,016.00 | | $2.54 | | $1,022.68 | | $2.55 | | 0.50% |
1. Expenses are equal to the annualized expense ratio for thesix-month period as indicated above—in the far right column—multiplied by the simple average account value over the period indicated, and then multiplied by 184/365 to reflect theone-half year period.
2. Does not include any ongoing expenses of the Contract for which the Fund is an investment option or acquired fund fees and expenses.
FRANKLIN TEMPLETON VARIABLE INSURANCE PRODUCTS TRUST
Financial Highlights
Franklin U.S. Government Securities VIP Fund
| | | | | | | | | | | | | | | | | | | | |
| |
| | | Year Ended December 31, | |
| | | | | |
| | | 2018 | | | 2017 | | | 2016 | | | 2015 | | | 2014 | |
| Class 1 | | | | | | | | | | | | | | | | | | | | |
Per share operating performance
(for a share outstanding throughout the year) | | | | | | | | | | | | | | | | | | | | |
| | | | | |
Net asset value, beginning of year | | | $12.36 | | | | $12.51 | | | | $12.74 | | | | $13.00 | | | | $12.91 | |
| | | | |
| | | | | |
| Income from investment operationsa: | | | | | | | | | | | | | | | | | | | | |
| | | | | |
Net investment incomeb | | | 0.29 | | | | 0.25 | | | | 0.22 | | | | 0.21 | | | | 0.24 | |
| | | | | |
Net realized and unrealized gains (losses) | | | (0.22 | ) | | | (0.04 | ) | | | (0.10 | ) | | | (0.12 | ) | | | 0.22 | |
| | | | |
Total from investment operations | | | 0.07 | | | | 0.21 | | | | 0.12 | | | | 0.09 | | | | 0.46 | |
| | | | |
| | | | | |
| Less distributions from net investment income | | | (0.36 | ) | | | (0.36 | ) | | | (0.35 | ) | | | (0.35 | ) | | | (0.37 | ) |
| | | | |
| | | | | |
Net asset value, end of year | | | $12.07 | | | | $12.36 | | | | $12.51 | | | | $12.74 | | | | $13.00 | |
| | | | |
| | | | | |
Total returnc | | | 0.60% | | | | 1.66% | | | | 0.90% | | | | 0.71% | | | | 3.64% | |
| | | | | |
| Ratios to average net assets | | | | | | | | | | | | | | | | | | | | |
| | | | | |
Expensesd | | | 0.50% | | | | 0.50% | | | | 0.50% | | | | 0.50% | | | | 0.49% | |
| | | | | |
Net investment income | | | 2.38% | | | | 2.00% | | | | 1.75% | | | | 1.64% | | | | 1.84% | |
| | | | | |
| Supplemental data | | | | | | | | | | | | | | | | | | | | |
| | | | | |
Net assets, end of year (000’s) | | | $59,213 | | | | $66,404 | | | | $73,695 | | | | $79,620 | | | | $90,656 | |
| | | | | |
Portfolio turnover rate | | | 22.25% | | | | 80.49% | | | | 86.28% | | | | 61.91% | | | | 42.88% | |
aThe amount shown for a share outstanding throughout the period may not correlate with the Statement of Operations for the period due to the timing of sales and repurchases of the Fund’s shares in relation to income earned and/or fluctuating fair value of the investments of the Fund.
bBased on average daily shares outstanding.
cTotal return does not include fees, charges or expenses imposed by the variable annuity and life insurance contracts for which Franklin Templeton Variable Insurance Products Trust serves as an underlying investment vehicle.
dBenefit of expense reduction rounds to less than 0.01%.
| | | | | | |
| | | |
| | The accompanying notes are an integral part of these financial statements. | Annual Report | | | FUS-5 | |
FRANKLIN TEMPLETON VARIABLE INSURANCE PRODUCTS TRUST
FINANCIAL HIGHLIGHTS
Franklin U.S. Government Securities VIP Fund(continued)
| | | | | | | | | | | | | | | | | | | | |
| |
| | | Year Ended December 31, | |
| | | | | |
| | | 2018 | | | 2017 | | | 2016 | | | 2015 | | | 2014 | |
| Class 2 | | | | | | | | | | | | | | | | | | | | |
Per share operating performance
(for a share outstanding throughout the year) | | | | | | | | | | | | | | | | | | | | |
| | | | | |
Net asset value, beginning of year | | | $12.09 | | | | $12.24 | | | | $12.47 | | | | $12.73 | | | | $12.65 | |
| | | | |
| | | | | |
| Income from investment operationsa: | | | | | | | | | | | | | | | | | | | | |
| | | | | |
Net investment incomeb | | | 0.25 | | | | 0.21 | | | | 0.19 | | | | 0.18 | | | | 0.20 | |
| | | | | |
Net realized and unrealized gains (losses) | | | (0.22 | ) | | | (0.04 | ) | | | (0.10 | ) | | | (0.12 | ) | | | 0.22 | |
| | | | |
Total from investment operations | | | 0.03 | | | | 0.17 | | | | 0.09 | | | | 0.06 | | | | 0.42 | |
| | | | |
| | | | | |
| Less distributions from net investment income | | | (0.33 | ) | | | (0.32 | ) | | | (0.32 | ) | | | (0.32 | ) | | | (0.34 | ) |
| | | | |
| | | | | |
Net asset value, end of year | | | $11.79 | | | | $12.09 | | | | $12.24 | | | | $12.47 | | | | $12.73 | |
| | | | |
| | | | | |
Total returnc | | | 0.34% | | | | 1.34% | | | | 0.66% | | | | 0.47% | | | | 3.38% | |
| | | | | |
| Ratios to average net assets | | | | | | | | | | | | | | | | | | | | |
| | | | | |
Expensesd | | | 0.75% | | | | 0.75% | | | | 0.75% | | | | 0.75% | | | | 0.74% | |
| | | | | |
Net investment income | | | 2.13% | | | | 1.75% | | | | 1.50% | | | | 1.39% | | | | 1.59% | |
| | | | | |
| Supplemental data | | | | | | | | | | | | | | | | | | | | |
| | | | | |
Net assets, end of year (000’s) | | | $1,105,627 | | | | $1,223,491 | | | | $1,268,963 | | | | $1,311,974 | | | | $1,369,037 | |
| | | | | |
Portfolio turnover rate | | | 22.25% | | | | 80.49% | | | | 86.28% | | | | 61.91% | | | | 42.88% | |
aThe amount shown for a share outstanding throughout the period may not correlate with the Statement of Operations for the period due to the timing of sales and repurchases of the Fund’s shares in relation to income earned and/or fluctuating fair value of the investments of the Fund.
bBased on average daily shares outstanding.
cTotal return does not include fees, charges or expenses imposed by the variable annuity and life insurance contracts for which Franklin Templeton Variable Insurance Products Trust serves as an underlying investment vehicle.
dBenefit of expense reduction rounds to less than 0.01%.
| | | | |
| | | |
| FUS-6 | | Annual Report | The accompanying notes are an integral part of these financial statements. | | |
FRANKLIN TEMPLETON VARIABLE INSURANCE PRODUCTS TRUST
Statement of Investments, December 31, 2018
| | | | | | | | | | |
Franklin U.S. Government Securities VIP Fund | |
| | | |
| | | | | Principal Amount | | | Value | |
| | Mortgage-Backed Securities 79.8% | | | | | | | | |
| a | | Federal Home Loan Mortgage Corp. (FHLMC) Adjustable Rate 1.2% | | | | | | |
| | FHLMC, 4.002%, (US 1 Year CMTT-Note +/- MBS Margin), 5/01/37 | | $ | 602,240 | | | $ | 634,290 | |
| | FHLMC, 4.171%,(12-month USD LIBOR +/- MBS Margin), 4/01/40. | | | 5,787,635 | | | | 6,071,444 | |
| | FHLMC, 3.92% - 4.41%,(12-month USD LIBOR +/- MBS Margin), 3/01/36 - 5/01/38 | | | 6,522,571 | | | | 6,833,636 | |
| | | | | | | | | | |
| | | | | | | | | 13,539,370 | |
| | | | | | | | | | |
| | Federal Home Loan Mortgage Corp. (FHLMC) Fixed Rate 10.7% | | | | | | | | |
| | FHLMC Gold 15 Year, 4.50%, 3/01/25 - 4/01/25. | | | 900,384 | | | | 923,445 | |
| | FHLMC Gold 30 Year, 3.00%, 5/01/43 | | | 436,234 | | | | 428,959 | |
| | FHLMC Gold 30 Year, 3.00%, 6/01/46 | | | 35,335,616 | | | | 34,499,781 | |
| | FHLMC Gold 30 Year, 3.00%, 10/01/46 | | | 24,985,430 | | | | 24,394,418 | |
| | FHLMC Gold 30 Year, 3.50%, 3/01/32 - 5/01/43. | | | 3,462,648 | | | | 3,526,790 | |
| | FHLMC Gold 30 Year, 3.50%, 12/01/47 | | | 7,444,142 | | | | 7,447,067 | |
| | FHLMC Gold 30 Year, 3.50%, 1/01/48 | | | 14,034,722 | | | | 14,040,101 | |
| | FHLMC Gold 30 Year, 4.00%, 9/01/40 - 1/01/48. | | | 11,349,180 | | | | 11,642,669 | |
| | FHLMC Gold 30 Year, 4.00%, 5/01/48 | | | 3,827,574 | | | | 3,904,630 | |
| | FHLMC Gold 30 Year, 4.00%, 7/01/48 | | | 13,215,003 | | | | 13,481,398 | |
| | FHLMC Gold 30 Year, 4.50%, 5/01/40 - 7/01/41. | | | 2,107,902 | | | | 2,204,812 | |
| | FHLMC Gold 30 Year, 5.00%, 9/01/33 - 4/01/40. | | | 4,574,735 | | | | 4,846,406 | |
| | FHLMC Gold 30 Year, 5.50%, 7/01/33 - 5/01/38. | | | 1,084,671 | | | | 1,169,926 | |
| | FHLMC Gold 30 Year, 6.00%, 1/01/24 - 8/01/35. | | | 754,356 | | | | 817,356 | |
| | FHLMC Gold 30 Year, 6.50%, 12/01/23 - 5/01/35 | | | 385,270 | | | | 419,064 | |
| | FHLMC Gold 30 Year, 7.00%, 4/01/24 - 9/01/31. | | | 124,163 | | | | 134,310 | |
| | FHLMC Gold 30 Year, 7.50%, 12/01/22 | | | 373 | | | | 376 | |
| | FHLMC Gold 30 Year, 8.00%, 9/01/21 - 5/01/22. | | | 2,019 | | | | 2,107 | |
| | FHLMC Gold 30 Year, 8.50%, 7/01/31 | | | 231,201 | | | | 265,890 | |
| | FHLMC PC 30 Year, 8.50%, 9/01/20 | | | 51 | | | | 52 | |
| | | | | | | | | | |
| | | | | | | | | 124,149,557 | |
| | | | | | | | | | |
| a | | Federal National Mortgage Association (FNMA) Adjustable Rate 3.8% | | | | | | | | |
| | FNMA, 3.395% - 4.291%,(12-month USD LIBOR +/- MBS Margin), 1/01/32 - 3/01/47 | | | 7,508,413 | | | | 7,809,267 | |
| | FNMA, 4.504%,(12-month USD LIBOR +/- MBS Margin), 9/01/37. | | | 13,560,322 | | | | 14,273,900 | |
| | FNMA, 3.101% - 4.91%, (US 1 Year CMTT-Note +/- MBS Margin), 10/01/19 - 10/01/44 | | | 11,108,108 | | | | 11,638,785 | |
| | FNMA, 4.302% - 4.915%,(12-month USD LIBOR +/- MBS Margin), 12/01/32 - 9/01/40 | | | 9,384,938 | | | | 9,796,120 | |
| | FNMA, 2.268% - 5.424%, (11th District COF +/- MBS Margin), 6/01/25 - 6/01/38 | | | 149,353 | | | | 151,178 | |
| | FNMA, 3.21% - 5.758%, (US 3 Year CMTT-Note +/- MBS Margin), 3/01/20 - 3/01/29 | | | 31,812 | | | | 32,461 | |
| | FNMA, 3.414% - 6.043%,(6-month USD LIBOR +/- MBS Margin), 6/01/21 - 7/01/37 | | | 1,007,263 | | | | 1,031,081 | |
| | FNMA, 4.942% - 7.22%, (US 1 Year CMTT-Note +/- MBS Margin), 7/01/19 - 1/01/36 | | | 70,533 | | | | 71,723 | |
| | | | | | | | | | |
| | | | | | | | | 44,804,515 | |
| | | | | | | | | | |
| | Federal National Mortgage Association (FNMA) Fixed Rate 12.1% | | | | | | | | |
| | FNMA 15 Year, 2.64%, 7/01/25 | | | 2,482,606 | | | | 2,439,558 | |
| | FNMA 15 Year, 2.77%, 4/01/25 | | | 3,500,000 | | | | 3,464,536 | |
| | FNMA 15 Year, 2.99%, 11/01/24 | | | 2,947,596 | | | | 2,954,573 | |
| | FNMA 15 Year, 3.14%, 10/01/25 | | | 4,000,000 | | | | 4,050,230 | |
| | FNMA 15 Year, 3.28%, 7/01/27 | | | 4,000,000 | | | | 3,973,974 | |
| | FNMA 15 Year, 3.51%, 8/01/23 | | | 3,000,000 | | | | 3,089,195 | |
| | FNMA 15 Year, 5.50%, 1/01/25 | | | 787,991 | | | | 818,343 | |
| | FNMA 30 Year, 3.00%, 12/01/42 | | | 186,917 | | | | 183,570 | |
| | FNMA 30 Year, 3.00%, 9/01/47 | | | 18,783,772 | | | | 18,345,764 | |
| | FNMA 30 Year, 3.50%, 7/01/45 | | | 32,865,849 | | | | 33,002,168 | |
| | FNMA 30 Year, 4.00%, 1/01/41 - 8/01/41 | | | 7,238,793 | | | | 7,449,094 | |
| | FNMA 30 Year, 4.00%, 4/01/48 | | | 42,663,920 | | | | 43,681,087 | |
| | FNMA 30 Year, 4.50%, 8/01/40 - 6/01/41 | | | 7,531,821 | | | | 7,891,447 | |
FRANKLIN TEMPLETON VARIABLE INSURANCE PRODUCTS TRUST
STATEMENT OF INVESTMENTS
Franklin U.S. Government Securities VIP Fund(continued)
| | | | | | | | | | |
| | | |
| | | | | Principal Amount | | | Value | |
| | Mortgage-Backed Securities(continued) | | | | | | | | |
| | | Federal National Mortgage Association (FNMA) Fixed Rate(continued) | | | | | | |
| | FNMA 30 Year, 5.00%, 3/01/34 - 7/01/41 | | $ | 4,022,828 | | | $ | 4,271,761 | |
| | FNMA 30 Year, 5.50%, 12/01/32 - 8/01/35 | | | 1,687,134 | | | | 1,807,642 | |
| | FNMA 30 Year, 6.00%, 1/01/24 - 8/01/38 | | | 1,817,495 | | | | 1,967,540 | |
| | FNMA 30 Year, 6.50%, 1/01/24 - 9/01/36 | | | 332,484 | | | | 363,030 | |
| | FNMA 30 Year, 7.50%, 4/01/23 - 8/01/25 | | | 15,167 | | | | 15,466 | |
| | FNMA 30 Year, 8.00%, 3/01/22 - 12/01/24 | | | 67,536 | | | | 68,315 | |
| | FNMA 30 Year, 8.50%, 3/01/20 - 6/01/21 | | | 201 | | | | 203 | |
| | FNMA 30 Year, 9.00%, 10/01/26 | | | 76,561 | | | | 79,521 | |
| | FNMA PL 30 Year, 5.50%, 4/01/34 | | | 1,107,259 | | | | 1,166,703 | |
| | | | | | | | | | |
| | | | | | | | | 141,083,720 | |
| | | | | | | | | | |
| | Government National Mortgage Association (GNMA) Fixed Rate 52.0% | | | | | | | | |
| | GNMA I SF 30 Year, 3.00%, 7/15/42 | | | 490,219 | | | | 484,818 | |
| | GNMA I SF 30 Year, 4.00%, 10/15/40 - 8/15/46 | | | 10,333,121 | | | | 10,651,778 | |
| | GNMA I SF 30 Year, 4.50%, 1/15/39 - 6/15/40 | | | 10,015,691 | | | | 10,480,979 | |
| | GNMA I SF 30 Year, 4.50%, 7/15/40 - 6/15/41 | | | 4,138,956 | | | | 4,333,166 | |
| | GNMA I SF 30 Year, 5.00%, 6/15/30 - 11/15/39 | | | 10,374,356 | | | | 10,990,630 | |
| | GNMA I SF 30 Year, 5.00%, 11/15/39 - 9/15/40 | | | 10,406,885 | | | | 11,027,499 | |
| | GNMA I SF 30 Year, 5.50%, 12/15/28 - 10/15/39 | | | 5,205,970 | | | | 5,600,253 | |
| | GNMA I SF 30 Year, 6.00%, 11/15/23 - 11/15/38 | | | 2,457,729 | | | | 2,664,456 | |
| | GNMA I SF 30 Year, 6.50%, 6/15/23 - 9/15/38 | | | 1,338,343 | | | | 1,456,388 | |
| | GNMA I SF 30 Year, 7.00%, 9/15/22 - 1/15/32 | | | 324,056 | | | | 336,304 | |
| | GNMA I SF 30 Year, 7.50%, 2/15/22 - 8/15/33 | | | 378,261 | | | | 421,157 | |
| | GNMA I SF 30 Year, 8.00%, 12/15/21 - 7/15/23 | | | 81,419 | | | | 82,705 | |
| | GNMA I SF 30 Year, 8.50%, 6/15/22 - 12/15/24 | | | 31,412 | | | | 31,884 | |
| | GNMA I SF 30 Year, 9.00%, 9/15/19 - 3/15/20 | | | 347 | | | | 348 | |
| | GNMA I SF 30 Year, 9.50%, 1/15/20 - 12/15/20 | | | 8,994 | | | | 9,046 | |
| | GNMA I SF 30 Year, 10.00%, 12/15/19 - 8/15/21 | | | 2,112 | | | | 2,119 | |
| | GNMA II SF 30 Year, 3.00%, 12/20/42 - 2/20/45 | | | 2,335,923 | | | | 2,316,872 | |
| | GNMA II SF 30 Year, 3.00%, 9/20/45 | | | 9,539,686 | | | | 9,419,101 | |
| | GNMA II SF 30 Year, 3.00%, 7/20/47 | | | 21,591,468 | | | | 21,262,957 | |
| | GNMA II SF 30 Year, 3.00%, 9/20/47 | | | 27,562,524 | | | | 27,138,735 | |
| | GNMA II SF 30 Year, 3.50%, 12/20/40 - 8/20/43 | | | 2,360,228 | | | | 2,390,001 | |
| | GNMA II SF 30 Year, 3.50%, 8/20/42 | | | 6,589,831 | | | | 6,671,107 | |
| | GNMA II SF 30 Year, 3.50%, 9/20/42 | | | 19,230,383 | | | | 19,467,801 | |
| | GNMA II SF 30 Year, 3.50%, 10/20/42 | | | 5,841,198 | | | | 5,913,231 | |
| | GNMA II SF 30 Year, 3.50%, 11/20/42 | | | 11,497,622 | | | | 11,639,467 | |
| | GNMA II SF 30 Year, 3.50%, 12/20/42 | | | 8,726,045 | | | | 8,833,830 | |
| | GNMA II SF 30 Year, 3.50%, 1/20/43 | | | 14,634,041 | | | | 14,814,676 | |
| | GNMA II SF 30 Year, 3.50%, 3/20/43 | | | 5,241,143 | | | | 5,328,415 | |
| | GNMA II SF 30 Year, 3.50%, 4/20/43 | | | 6,550,872 | | | | 6,631,663 | |
| | GNMA II SF 30 Year, 3.50%, 5/20/43 | | | 12,069,177 | | | | 12,218,177 | |
| | GNMA II SF 30 Year, 3.50%, 6/20/43 | | | 5,506,444 | | | | 5,574,373 | |
| | GNMA II SF 30 Year, 3.50%, 9/20/47 | | | 89,689,468 | | | | 90,370,995 | |
| | GNMA II SF 30 Year, 3.50%, 10/20/47 | | | 7,358,214 | | | | 7,414,127 | |
| | GNMA II SF 30 Year, 3.50%, 11/20/47 | | | 133,163,220 | | | | 134,175,094 | |
| | GNMA II SF 30 Year, 4.00%, 11/20/39 - 7/20/41 | | | 10,464,608 | | | | 10,824,378 | |
| | GNMA II SF 30 Year, 4.00%, 9/20/41 - 2/20/44 | | | 3,818,566 | | | | 3,932,135 | |
| | GNMA II SF 30 Year, 4.00%, 11/20/41 | | | 6,401,032 | | | | 6,615,265 | |
| | GNMA II SF 30 Year, 4.00%, 4/20/48 | | | 61,467,859 | | | | 63,019,001 | |
| | GNMA II SF 30 Year, 4.00%, 11/20/48 | | | 21,953,634 | | | | 22,507,634 | |
| | GNMA II SF 30 Year, 4.50%, 10/20/39 - 6/20/41 | | | 9,846,355 | | | | 10,336,532 | |
FRANKLIN TEMPLETON VARIABLE INSURANCE PRODUCTS TRUST
STATEMENT OF INVESTMENTS
Franklin U.S. Government Securities VIP Fund(continued)
| | | | | | | | | | |
| | | |
| | | | | Principal Amount | | | Value | |
| | Mortgage-Backed Securities(continued) | | | | | | | | |
| | | Government National Mortgage Association (GNMA) Fixed Rate(continued) | | | | | | |
| | GNMA II SF 30 Year, 4.50%, 7/20/41 - 2/20/44 | | $ | 9,869,255 | | | $ | 10,357,937 | |
| | GNMA II SF 30 Year, 4.50%, 9/20/41 | | | 5,048,629 | | | | 5,299,256 | |
| | GNMA II SF 30 Year, 4.50%, 10/20/44 | | | 2,676,912 | | | | 2,808,200 | |
| | GNMA II SF 30 Year, 5.00%, 9/20/33 - 10/20/42 | | | 8,332,321 | | | | 8,867,857 | |
| | GNMA II SF 30 Year, 5.00%, 6/20/44 | | | 2,654,431 | | | | 2,804,149 | |
| | GNMA II SF 30 Year, 5.50%, 5/20/34 - 6/20/38 | | | 4,228,468 | | | | 4,516,529 | |
| | GNMA II SF 30 Year, 6.00%, 11/20/23 - 7/20/39 | | | 2,687,349 | | | | 2,927,316 | |
| | GNMA II SF 30 Year, 6.50%, 12/20/27 - 4/20/34 | | | 424,853 | | | | 474,805 | |
| | GNMA II SF 30 Year, 7.00%, 5/20/32 | | | 7,801 | | | | 9,068 | |
| | GNMA II SF 30 Year, 7.50%, 9/20/22 - 11/20/26 | | | 64,585 | | | | 70,310 | |
| | GNMA II SF 30 Year, 8.00%, 8/20/26 | | | 4,831 | | | | 5,430 | |
| | GNMA II SF 30 Year, 9.50%, 4/20/25 | | | 1,891 | | | | 1,895 | |
| | | | | | | | | | |
| | | | | | | | | 605,531,849 | |
| | | | | | | | | | |
| | | |
| | Total Mortgage-Backed Securities (Cost $951,868,563) | | | | | | | 929,109,011 | |
| | | | | | | | | | |
| | | |
| | U.S. Government and Agency Securities 17.6% | | | | | | | | |
| | Federal Agricultural Mortgage Corp., | | | | | | | | |
| | 4.30%, 5/13/19 | | | 1,010,000 | | | | 1,016,936 | |
| | 1.41%, 3/06/20 | | | 10,000,000 | | | | 9,886,690 | |
| | 2.66%, 4/12/22 | | | 7,000,000 | | | | 7,031,248 | |
| | FHLB, 2.625%, 9/12/25 | | | 20,000,000 | | | | 19,694,580 | |
| | FICO, | | | | | | | | |
| | 15P, Strip, 3/07/19 | | | 1,798,000 | | | | 1,789,241 | |
| | D-P, Strip, 9/26/19 | | | 7,605,000 | | | | 7,451,019 | |
| | Israel Government Agency for International Development Bond, | | | | | | | | |
| | 5.50%, 9/18/23 | | | 12,000,000 | | | | 13,499,060 | |
| | 7-Z, U.S. Government Guaranteed, Strip, 8/15/22 | | | 5,619,000 | | | | 5,100,678 | |
| | New Valley Generation IV, secured bond, 4.687%, 1/15/22 | | | 1,474,707 | | | | 1,507,842 | |
| | Overseas Private Investment Corp., | | | | | | | | |
| | A, zero cpn., 11/15/20 | | | 2,575,000 | | | | 3,185,418 | |
| | senior bond, 4.01%, 5/15/30 | | | 1,860,000 | | | | 1,958,691 | |
| | Petroleos Mexicanos, 2.378%, 4/15/25 (Mexico) | | | 2,138,500 | | | | 2,108,946 | |
| | Private Export Funding Corp., | | | | | | | | |
| | secured bond, 2.80%, 5/15/22 | | | 9,000,000 | | | | 9,018,711 | |
| | secured note, 4.30%, 12/15/21 | | | 1,865,000 | | | | 1,949,248 | |
| | secured note, LL, 2.25%, 3/15/20 | | | 1,700,000 | | | | 1,691,869 | |
| | senior secured note, MM, 2.30%, 9/15/20. | | | 3,500,000 | | | | 3,473,708 | |
| | Reliance Industries Ltd., senior bond, 2.512%, 1/15/26 (India) | | | 9,843,750 | | | | 9,676,898 | |
| | Tunisia Government Agency for International Development Bonds, 1.686%, 7/16/19 | | | 7,000,000 | | | | 6,989,626 | |
| | TVA, | | | | | | | | |
| | 1.875%, 8/15/22 | | | 6,000,000 | | | | 5,842,980 | |
| | 5.88%, 4/01/36 | | | 5,000,000 | | | | 6,527,775 | |
| | Strip, 6/15/19 | | | 5,973,000 | | | | 5,893,537 | |
| | Strip, 6/15/20 | | | 6,138,000 | | | | 5,892,891 | |
| | U.S. Treasury Bond, | | | | | | | | |
| | 2.50%, 2/15/46 | | | 4,000,000 | | | | 3,619,258 | |
| | bIndex Linked, 2.00%, 1/15/26 | | | 1,911,078 | | | | 2,040,429 | |
| | bIndex Linked, 1.75%, 1/15/28 | | | 9,656,321 | | | | 10,262,249 | |
| | bIndex Linked, 3.625%, 4/15/28 | | | 7,817,195 | | | | 9,601,825 | |
FRANKLIN TEMPLETON VARIABLE INSURANCE PRODUCTS TRUST
STATEMENT OF INVESTMENTS
Franklin U.S. Government Securities VIP Fund(continued)
| | | | | | | | | | |
| | | |
| | | | | Principal Amount | | | Value | |
| | U.S. Government and Agency Securities(continued) | | | | | | | | |
| | U.S. Treasury Note, | | | | | | | | |
| | 2.375%, 8/15/24 | | $ | 22,000,000 | | | $ | 21,805,641 | |
| | 2.25%, 8/15/27 | | | 6,000,000 | | | | 5,812,697 | |
| | bIndex Linked, 0.125%, 7/15/24 | | | 16,506,892 | | | | 15,834,708 | |
| | Ukraine Government Agency for International Development Bonds, 1.844%, 5/16/19 | | | 5,000,000 | | | | 5,001,470 | |
| | | | | | | | | | |
| | | |
| | Total U.S. Government and Agency Securities (Cost $207,352,562) | | | | | | | 205,165,869 | |
| | | | | | | | | | |
| | | |
| | Total Investments before Short Term Investments
(Cost $1,159,221,125) | | | | | | | 1,134,274,880 | |
| | | | | | | | | | |
| | | |
| | Short Term Investments (Cost $28,330,362) 2.4% | | | | | | | | |
| | | |
| | Repurchase Agreements 2.4% | | | | | | | | |
| | cJoint Repurchase Agreement, 2.922%, 1/02/19 (Maturity Value $28,334,961) | | | | | | | | |
| | BNP Paribas Securities Corp. (Maturity Value $12,604,808) Deutsche Bank Securities Inc. (Maturity Value $4,701,053) HSBC Securities (USA) Inc. (Maturity Value $11,029,100) | | | | | | | | |
| | Collateralized by U.S. Government Agency Securities, 3.00% - 8.00%, 12/15/25 - 12/20/48;dU.S. Treasury Bills, 1/17/19; and U.S. Treasury Notes, 1.25% - 3.50%, 5/31/19 - 9/30/20 (valued at $28,905,804) | | | 28,330,362 | | | | 28,330,362 | |
| | | | | | | | | | |
| | | |
| | Total Investments (Cost $1,187,551,487) 99.8% | | | | | | | 1,162,605,242 | |
| | | |
| | Other Assets, less Liabilities 0.2% | | | | | | | 2,234,510 | |
| | | | | | | | | | |
| | | |
| | Net Assets 100.0% | | | | | | $ | 1,164,839,752 | |
| | | | | | | | | | |
See Abbreviations on pageFUS-19.
aAdjustable Rate Mortgage-Backed Security (ARM); the rate shown is the effective rate at period end. ARM rates are not based on a published reference rate and spread, but instead pass-through weighted average interest income inclusive of any caps or floors, if applicable, from the underlying mortgage loans in which the majority of mortgages pay interest based on the index shown at their designated reset dates plus a spread, less the applicable servicing and guaranty fee (MBS margin).
bPrincipal amount of security is adjusted for inflation. See Note 1(d).
cSee Note 1(b) regarding joint repurchase agreement.
dThe security was issued on a discount basis with no stated coupon rate.
| | | | |
| | | |
| FUS-10 | | Annual Report | The accompanying notes are an integral part of these financial statements. | | |
FRANKLIN TEMPLETON VARIABLE INSURANCE PRODUCTS TRUST
Financial Statements
Statement of Assets and Liabilities
December 31, 2018
| | | | |
| |
| | | Franklin U.S. Government Securities VIP Fund | |
Assets: | | | | |
Investments in securities: | | | | |
Cost - Unaffiliated issuers | | $ | 1,159,221,125 | |
Cost - Unaffiliated repurchase agreements | | | 28,330,362 | |
| | | | |
Value - Unaffiliated issuers | | $ | 1,134,274,880 | |
Value - Unaffiliated repurchase agreements | | | 28,330,362 | |
Receivables: | | | | |
Investment securities sold | | | 534,640 | |
Capital shares sold | | | 251,170 | |
Interest | | | 4,110,791 | |
Other assets | | | 144 | |
| | | | |
Total assets | | | 1,167,501,987 | |
| | | | |
Liabilities: | | | | |
Payables: | | | | |
Capital shares redeemed | | | 1,567,151 | |
Management fees | | | 466,920 | |
Distribution fees | | | 461,881 | |
Accrued expenses and other liabilities | | | 166,283 | |
| | | | |
Total liabilities | | | 2,662,235 | |
| | | | |
Net assets, at value | | $ | 1,164,839,752 | |
| | | | |
Net assets consist of: | | | | |
Paid-in capital | | $ | 1,253,883,671 | |
Total distributable earnings (loss) | | | (89,043,919 | ) |
| | | | |
Net assets, at value | | $ | 1,164,839,752 | |
| | | | |
| |
| Class 1: | | | | |
Net assets, at value | | $ | 59,212,765 | |
| | | | |
Shares outstanding | | | 4,906,043 | |
| | | | |
Net asset value and maximum offering price per share | | $ | 12.07 | |
| | | | |
| |
| Class 2: | | | | |
Net assets, at value | | $ | 1,105,626,987 | |
| | | | |
Shares outstanding | | | 93,746,544 | |
| | | | |
Net asset value and maximum offering price per share | | $ | 11.79 | |
| | | | |
| | | | | | |
| | | |
| | The accompanying notes are an integral part of these financial statements. | Annual Report | | | FUS-11 | |
FRANKLIN TEMPLETON VARIABLE INSURANCE PRODUCTS TRUST
FINANCIAL STATEMENTS
Statement of Operations
for the year ended December 31, 2018
| | | | |
| |
| | | Franklin U.S. Government Securities VIP Fund | |
Investment income: | | | | |
Interest: | | | | |
Unaffiliated issuers: | | | | |
Paydown gain (loss) | | $ | (5,828,155 | ) |
Paid in cash | | | 41,034,566 | |
| | | | |
Total investment income | | | 35,206,411 | |
| | | | |
Expenses: | | | | |
Management fees (Note 3a) | | | 5,758,569 | |
Distribution fees: (Note 3c) | | | | |
Class 2 | | | 2,904,198 | |
Custodian fees (Note 4) | | | 11,195 | |
Reports to shareholders | | | 132,887 | |
Professional fees | | | 64,916 | |
Trustees’ fees and expenses | | | 8,871 | |
Other | | | 151,195 | |
| | | | |
Total expenses | | | 9,031,831 | |
Expense reductions (Note 4) | | | (288 | ) |
| | | | |
Net expenses | | | 9,031,543 | |
| | | | |
Net investment income | | | 26,174,868 | |
| | | | |
Realized and unrealized gains (losses): | | | | |
Net realized gain (loss) from: | | | | |
Investments: | | | | |
Unaffiliated issuers | | | (3,111,667 | ) |
| | | | |
Net change in unrealized appreciation (depreciation) on: | | | | |
Investments: | | | | |
Unaffiliated issuers | | | (20,898,185 | ) |
| | | | |
Net realized and unrealized gain (loss) | | | (24,009,852 | ) |
| | | | |
Net increase (decrease) in net assets resulting from operations | | $ | 2,165,016 | |
| | | | |
| | | | |
| | | |
| FUS-12 | | Annual Report | The accompanying notes are an integral part of these financial statements. | | |
FRANKLIN TEMPLETON VARIABLE INSURANCE PRODUCTS TRUST
FINANCIAL STATEMENTS
Statements of Changes in Net Assets
| | | | | | | | |
| |
| | | Franklin U.S. Government Securities VIP Fund | |
| |
| | | Year Ended December 31, | |
| | |
| | | 2018 | | | 2017 | |
Increase (decrease) in net assets: | | | | | | | | |
Operations: | | | | | | | | |
Net investment income | | $ | 26,174,868 | | | $ | 23,425,605 | |
Net realized gain (loss) | | | (3,111,667 | ) | | | (9,244,107 | ) |
Net change in unrealized appreciation (depreciation) | | | (20,898,185 | ) | | | 4,564,648 | |
| | | | |
Net increase (decrease) in net assets resulting from operations | | | 2,165,016 | | | | 18,746,146 | |
| | | | |
Distributions to shareholders: (Note 1d) | | | | | | | | |
Class 1 | | | (1,830,491 | ) | | | (2,011,168 | ) |
Class 2 | | | (31,691,784 | ) | | | (33,122,555 | ) |
| | | | |
Total distributions to shareholders | | | (33,522,275 | ) | | | (35,133,723 | ) |
| | | | |
Capital share transactions: (Note 2) | | | | | | | | |
Class 1 | | | (5,618,467 | ) | | | (6,455,480 | ) |
Class 2 | | | (88,079,314 | ) | | | (29,919,965 | ) |
Total capital share transactions | | | (93,697,781 | ) | | | (36,375,445 | ) |
| | | | |
Net increase (decrease) in net assets | | | (125,055,040 | ) | | | (52,763,022 | ) |
| | | | |
Net assets: | | | | | | | | |
Beginning of year | | | 1,289,894,792 | | | | 1,342,657,814 | |
| | | | |
End of year (Note 1d) | | $ | 1,164,839,752 | | | $ | 1,289,894,792 | |
| | | | |
| | | | | | |
| | | |
| | The accompanying notes are an integral part of these financial statements. | Annual Report | | | FUS-13 | |
FRANKLIN TEMPLETON VARIABLE INSURANCE PRODUCTS TRUST
Notes to Financial Statements
Franklin U.S. Government Securities VIP Fund
1. Organization and Significant Accounting Policies
Franklin Templeton Variable Insurance Products Trust (Trust) is registered under the Investment Company Act of 1940 (1940 Act) as anopen-end management investment company, consisting of eighteen separate funds and applies the specialized accounting and reporting guidance in U.S. Generally Accepted Accounting Principles (U.S. GAAP). Franklin U.S. Government Securities VIP Fund (Fund) is included in this report. Shares of the Fund are generally sold only to insurance company separate accounts to fund the benefits of variable life insurance policies or variable annuity contracts. At December 31, 2018, 43.8% of the Fund’s shares were held through one insurance company. Investment activities of these insurance company separate accounts could have a material impact on the Fund. The Fund offers two classes of shares: Class 1 and Class 2. Each class of shares may differ by its distribution fees, voting rights on matters affecting a single class and its exchange privilege.
The following summarizes the Fund’s significant accounting policies.
a. Financial Instrument Valuation
The Fund’s investments in financial instruments are carried at fair value daily. Fair value is the price that would be received to sell an asset or paid to transfer a liability in an orderly transaction between market participants on the measurement date. The Fund calculates the net asset value (NAV) per share each business day as of 4 p.m. Eastern time or the regularly scheduled close of the New York Stock Exchange (NYSE), whichever is earlier. Under compliance policies and procedures approved by the Trust’s Board of Trustees (the Board), the Fund’s administrator has responsibility for oversight of valuation, including leading the cross-functional Valuation Committee (VC). The Fund may utilize independent pricing services, quotations from securities and financial instrument dealers, and other market sources to determine fair value.
Debt securities generally trade in theover-the-counter market rather than on a securities exchange. The Fund’s pricing services use multiple valuation techniques to determine fair value. In instances where sufficient market activity exists, the pricing services may utilize a market-based approach through which quotes from market makers are used to determine fair value. In instances where sufficient market activity may not exist or is limited, the pricing services also utilize proprietary valuation models which may consider market characteristics
such as benchmark yield curves, credit spreads, estimated default rates, anticipated market interest rate volatility, coupon rates, anticipated timing of principal repayments, underlying collateral, and other unique security features in order to estimate the relevant cash flows, which are then discounted to calculate the fair value.
Investments in repurchase agreements are valued at cost, which approximates fair value.
The Fund has procedures to determine the fair value of financial instruments for which market prices are not reliable or readily available. Under these procedures, the Fund primarily employs a market-based approach which may use related or comparable assets or liabilities, recent transactions, market multiples, book values, and other relevant information for the investment to determine the fair value of the investment. An income-based valuation approach may also be used in which the anticipated future cash flows of the investment are discounted to calculate fair value. Discounts may also be applied due to the nature or duration of any restrictions on the disposition of the investments. Due to the inherent uncertainty of valuations of such investments, the fair values may differ significantly from the values that would have been used had an active market existed.
b. Joint Repurchase Agreement
The Fund enters into a joint repurchase agreement whereby its uninvested cash balance is deposited into a joint cash account with other funds managed by the investment manager or an affiliate of the investment manager and is used to invest in one or more repurchase agreements. The value and face amount of the joint repurchase agreement are allocated to the funds based on theirpro-rata interest. A repurchase agreement is accounted for as a loan by the Fund to the seller, collateralized by securities which are delivered to the Fund’s custodian. The fair value, including accrued interest, of the initial collateralization is required to be at least 102% of the dollar amount invested by the funds, with the value of the underlying securities marked to market daily to maintain coverage of at least 100%. Repurchase agreements are subject to the terms of Master Repurchase Agreements (MRAs) with approved counterparties (sellers). The MRAs contain various provisions, including but not limited to events of default and maintenance of collateral for repurchase agreements. In the event of default by either the seller or the Fund, certain MRAs may permit thenon-defaulting party to net andclose-out all transactions, if any, traded under such
FRANKLIN TEMPLETON VARIABLE INSURANCE PRODUCTS TRUST
NOTES TO FINANCIAL STATEMENTS
Franklin U.S. Government Securities VIP Fund(continued)
agreements. The Fund may sell securities it holds as collateral and apply the proceeds towards the repurchase price and any other amounts owed by the seller to the Fund in the event of default by the seller. This could involve costs or delays in addition to a loss on the securities if their value falls below the repurchase price owed by the seller. The joint repurchase agreement held by the Fund at year end, as indicated in the Statement of Investments, had been entered into on December 31, 2018.
c. Income Taxes
It is the Fund’s policy to qualify as a regulated investment company under the Internal Revenue Code. The Fund intends to distribute to shareholders substantially all of its taxable income and net realized gains to relieve it from federal income and if applicable, excise taxes. As a result, no provision for U.S. federal income taxes is required.
The Fund may recognize an income tax liability related to its uncertain tax positions under U.S. GAAP when the uncertain tax position has a less than 50% probability that it will be sustained upon examination by the tax authorities based on its technical merits. As of December 31, 2018, the Fund has determined that no tax liability is required in its financial statements related to uncertain tax positions for any open tax years (or expected to be taken in future tax years). Open tax years are those that remain subject to examination and are based on the statute of limitations in each jurisdiction in which the Fund invests.
d. Security Transactions, Investment Income, Expenses and Distributions
Security transactions are accounted for on trade date. Realized gains and losses on security transactions are determined on a specific identification basis. Interest income and estimated expenses are accrued daily. Amortization of premium and accretion of discount on debt securities are included in interest income. Paydown gains and losses are recorded separately in the Statement of Operations. Distributions to shareholders are recorded on theex-dividend date. Distributable earnings are determined according to income tax regulations (tax basis) and may differ from earnings recorded in accordance with U.S. GAAP. These differences may be permanent or temporary. Permanent differences are reclassified among capital accounts to reflect their tax character. These reclassifications have no
impact on net assets or the results of operations. Temporary differences are not reclassified, as they may reverse in subsequent periods.*
Common expenses incurred by the Trust are allocated among the Funds based on the ratio of net assets of each Fund to the combined net assets of the Trust or based on the ratio of number of shareholders of each Fund to the combined number of shareholders of the Trust. Fund specific expenses are charged directly to the Fund that incurred the expense.
Realized and unrealized gains and losses and net investment income, excluding class specific expenses, are allocated daily to each class of shares based upon the relative proportion of net assets of each class. Differences in per share distributions by class are generally due to differences in class specific expenses.
Inflation-indexed bonds are adjusted for inflation through periodic increases or decreases in the security’s interest accruals, face amount, or principal redemption value, by amounts corresponding to the rate of inflation as measured by an index. Any increase or decrease in the face amount or principal redemption value will be included as interest income in the Statement of Operations.
e. Accounting Estimates
The preparation of financial statements in accordance with U.S. GAAP requires management to make estimates and assumptions that affect the reported amounts of assets and liabilities at the date of the financial statements and the amounts of income and expenses during the reporting period. Actual results could differ from those estimates.
f. Guarantees and Indemnifications
Under the Trust’s organizational documents, its officers and trustees are indemnified by the Trust against certain liabilities arising out of the performance of their duties to the Trust. Additionally, in the normal course of business, the Trust, on behalf of the Fund, enters into contracts with service providers that contain general indemnification clauses. The Trust’s maximum exposure under these arrangements is unknown as this would involve future claims that may be made against the Trust that have not yet occurred. Currently, the Trust expects the risk of loss to be remote.
FRANKLIN TEMPLETON VARIABLE INSURANCE PRODUCTS TRUST
NOTES TO FINANCIAL STATEMENTS
Franklin U.S. Government Securities VIP Fund(continued)
1. Organization and Significant Accounting Policies(continued)
*Effective during the current reporting period, it is no longer required to present certain line items in the Statements of Changes in Net Assets. The below prior period amounts affected by this change are shown as they were in the prior year Statements of Changes in Net Assets.
For the year ended December 31, 2017, distributions to shareholders were as follows:
| | | | |
Distributions from net investment income: | | | | |
Class 1 | | $ | (2,011,168 | ) |
Class 2 | | | (33,122,555 | ) |
For the year ended December 31, 2017, undistributed net investment income included in net assets was $30,616,923.
2. Shares of Beneficial Interest
At December 31, 2018, there were an unlimited number of shares authorized (without par value). Transactions in the Fund’s shares were as follows:
| | | | | | | | | | | | | | | | | | | | |
| |
| | | Year Ended December 31, | |
| | | |
| | | 2018 | | | | | | 2017 | |
| | | | | |
| | | Shares | | | Amount | | | | | | Shares | | | Amount | |
| | | | | |
| Class 1 Shares: | | | | | | | | | | | | | | | | | | | | |
Shares sold | | | 130,524 | | | $ | 1,575,698 | | | | | | | | 214,758 | | | $ | 2,678,926 | |
Shares issued in reinvestment of distributions | | | 154,472 | | | | 1,830,491 | | | | | | | | 163,377 | | | | 2,011,168 | |
Shares redeemed | | | (750,422 | ) | | | (9,024,656 | ) | | | | | | | (896,031 | ) | | | (11,145,574 | ) |
| | | | |
Net increase (decrease) | | | (465,426 | ) | | $ | (5,618,467 | ) | | | | | | | (517,896 | ) | | $ | (6,455,480 | ) |
| | | | |
| | | | | |
| Class 2 Shares: | | | | | | | | | | | | | | | | | | | | |
Shares sold | | | 5,018,026 | | | $ | 59,241,587 | | | | | | | | 7,795,899 | | | $ | 95,146,101 | |
Shares issued in reinvestment of distributions | | | 2,734,407 | | | | 31,691,784 | | | | | | | | 2,748,760 | | | | 33,122,555 | |
Shares redeemed | | | (15,242,864 | ) | | | (179,012,685 | ) | | | | | | | (12,993,385 | ) | | | (158,188,621 | ) |
| | | | |
Net increase (decrease) | | | (7,490,431 | ) | | $ | (88,079,314 | ) | | | | | | | (2,448,726 | ) | | $ | (29,919,965 | ) |
| | | | |
3. Transactions with Affiliates
Franklin Resources, Inc. is the holding company for various subsidiaries that together are referred to as Franklin Templeton. Certain officers and trustees of the Fund are also officers and/or directors of the following subsidiaries:
| | |
| |
| Subsidiary | | Affiliation |
Franklin Advisers, Inc. (Advisers) | | Investment manager |
Franklin Templeton Services, LLC (FT Services) | | Administrative manager |
Franklin Templeton Distributors, Inc. (Distributors) | | Principal underwriter |
Franklin Templeton Investor Services, LLC (Investor Services) | | Transfer agent |
FRANKLIN TEMPLETON VARIABLE INSURANCE PRODUCTS TRUST
NOTES TO FINANCIAL STATEMENTS
Franklin U.S. Government Securities VIP Fund(continued)
a. Management Fees
The Fund pays an investment management fee to Advisers based on the average daily net assets of the Fund as follows:
| | |
| |
| Annualized Fee Rate | | Net Assets |
0.625% | | Up to and including $100 million |
0.500% | | Over $100 million, up to and including $250 million |
0.450% | | Over $250 million, up to and including $7.5 billion |
0.440% | | Over $7.5 billion, up to and including $10 billion |
0.430% | | Over $10 billion, up to and including $12.5 billion |
0.420% | | Over $12.5 billion, up to and including $15 billion |
0.400% | | In excess of $15 billion |
For the year ended December 31, 2018, the gross effective investment management fee rate was 0.471% of the Fund’s average daily net assets.
b. Administrative Fees
Under an agreement with Advisers, FT Services provides administrative services to the Fund. The fee is paid by Advisers based on the Fund’s average daily net assets, and is not an additional expense of the Fund.
c. Distribution Fees
The Board has adopted a distribution plan for Class 2 shares pursuant to Rule12b-1 under the 1940 Act. Under the Fund’s compensation distribution plan, the Fund pays Distributors for costs incurred in connection with the servicing, sale and distribution of the Fund’s shares up to 0.35% per year of its average daily net assets. The Board has agreed to limit the current rate to 0.25% per year for Class 2. The plan year, for purposes of monitoring compliance with the maximum annual plan rate, is February 1 through January 31.
d. Transfer Agent Fees
Investor Services, under terms of an agreement, performs shareholder servicing for the Fund and is not paid by the Fund for the services.
4. Expense Offset Arrangement
The Fund has entered into an arrangement with its custodian whereby credits realized as a result of uninvested cash balances are used to reduce a portion of the Fund’s custodian expenses. During the year ended December 31, 2018, the custodian fees were reduced as noted in the Statement of Operations.
5. Income Taxes
For tax purposes, capital losses may be carried over to offset future capital gains.
At December 31, 2018, capital loss carryforwards were as follows:
| | | | |
Capital loss carryforwards not subject to expiration: | | | | |
Short Term | | $ | 38,715,602 | |
Long Term | | | 54,934,163 | |
| | | | |
Total capital loss carryforwards | | $ | 93,649,765 | |
| | | | |
On December 31, 2018, the Fund had expired capital loss carryforwards of $426,637, which were reclassified topaid-in capital.
FRANKLIN TEMPLETON VARIABLE INSURANCE PRODUCTS TRUST
NOTES TO FINANCIAL STATEMENTS
Franklin U.S. Government Securities VIP Fund(continued)
5. Income Taxes(continued)
The tax character of distributions paid during the years ended December 31, 2018 and 2017, was as follows:
| | | | | | | | |
| | |
| | | 2018 | | | 2017 | |
Distributions paid from ordinary income | | $ | 33,522,275 | | | $ | 35,133,723 | |
| | | | |
At December 31, 2018, the cost of investments, net unrealized appreciation (depreciation), and undistributed ordinary income for income tax purposes were as follows:
| | | | |
Cost of investments. | | $ | 1,190,960,321 | |
| | | | |
Unrealized appreciation | | $ | 4,594,295 | |
Unrealized depreciation | | | (32,949,374 | ) |
| | | | |
Net unrealized appreciation (depreciation) | | $ | (28,355,079 | ) |
| | | | |
Distributable earnings: | | | | |
Undistributed ordinary income | | $ | 32,960,946 | |
| | | | |
Differences between income and/or capital gains as determined on a book basis and a tax basis are primarily due to differing treatments of paydown losses and bond discounts and premiums.
6. Investment Transactions
Purchases and sales of investments (excluding short term securities) for the year ended December 31, 2018, aggregated $265,527,675 and $363,596,571, respectively.
7. Credit Facility
The Fund, together with other U.S. registered and foreign investment funds (collectively, Borrowers), managed by Franklin Templeton, are borrowers in a joint syndicated senior unsecured credit facility totaling $2 billion (Global Credit Facility) which matured on February 8, 2019. This Global Credit Facility provides a source of funds to the Borrowers for temporary and emergency purposes, including the ability to meet future unanticipated or unusually large redemption requests. Effective February 8, 2019, the Borrowers renewed the Global Credit Facility for a one year term, maturing February 7, 2020, for a total of $2 billion.
Under the terms of the Global Credit Facility, the Fund shall, in addition to interest charged on any borrowings made by the Fund and other costs incurred by the Fund, pay its share of fees and expenses incurred in connection with the implementation and maintenance of the Global Credit Facility, based upon its relative share of the aggregate net assets of all of the Borrowers, including an annual commitment fee of 0.15% based upon the unused portion of the Global Credit Facility. These fees are reflected in other expenses in the Statement of Operations. During the year ended December 31, 2018, the Fund did not use the Global Credit Facility.
8. Fair Value Measurements
The Fund follows a fair value hierarchy that distinguishes between market data obtained from independent sources (observable inputs) and the Fund’s own market assumptions (unobservable inputs). These inputs are used in determining the value of the Fund’s financial instruments and are summarized in the following fair value hierarchy:
| | • | | Level 1 – quoted prices in active markets for identical financial instruments |
| | • | | Level 2 – other significant observable inputs (including quoted prices for similar financial instruments, interest rates, prepayment speed, credit risk, etc.) |
FRANKLIN TEMPLETON VARIABLE INSURANCE PRODUCTS TRUST
NOTES TO FINANCIAL STATEMENTS
Franklin U.S. Government Securities VIP Fund(continued)
| | • | | Level 3 – significant unobservable inputs (including the Fund’s own assumptions in determining the fair value of financial instruments) |
The input levels are not necessarily an indication of the risk or liquidity associated with financial instruments at that level.
At December 31, 2018, all of the Fund’s investments in financial instruments carried at fair value were valued using Level 2 inputs.
9. Subsequent Events
The Fund has evaluated subsequent events through the issuance of the financial statements and determined that no events have occurred that require disclosure other than those already disclosed in the financial statements.
Abbreviations
| | | | | | |
| |
| Currency | | Selected Portfolio |
| | | |
| USD | | United States Dollar | | CMT | | Constant Maturity Treasury Index |
| | | |
| | | | COF | | Cost of Funds |
| | | |
| | | | FHLB | | Federal Home Loan Bank |
| | | |
| | | | FICO | | Financing Corp. |
| | | |
| | | | LIBOR | | London InterBank Offered Rate |
| | | |
| | | | MBS | | Mortgage-Backed Security |
| | | |
| | | | PC | | Participation Certificate |
| | | |
| | | | PL | | Project Loan |
| | | |
| | | | SF | | Single Family |
| | | |
| | | | T-Note | | Treasury Note |
| | | |
| | | | TVA | | Tennessee Valley Authority |
FRANKLIN TEMPLETON VARIABLE INSURANCE PRODUCTS TRUST
Report of Independent Registered Public Accounting Firm
To the Board of Trustees of Franklin Templeton Variable Insurance Products Trust and Shareholders of Franklin U.S. Government Securities VIP Fund
Opinion on the Financial Statements
We have audited the accompanying statement of assets and liabilities, including the statement of investments, of Franklin U.S. Government Securities VIP Fund (the “Fund”) as of December 31, 2018, the related statement of operations for the year ended December 31, 2018, the statement of changes in net assets for each of the two years in the period ended December 31, 2018, including the related notes, and the financial highlights for each of the five years in the period ended December 31, 2018 (collectively referred to as the “financial statements”). In our opinion, the financial statements present fairly, in all material respects, the financial position of the Fund as of December 31, 2018, the results of its operations for the year then ended, the changes in its net assets for each of the two years in the period ended December 31, 2018 and the financial highlights for each of the five years in the period ended December 31, 2018 in conformity with accounting principles generally accepted in the United States of America.
Basis for Opinion
These financial statements are the responsibility of the Fund’s management. Our responsibility is to express an opinion on the Fund’s financial statements based on our audits. We are a public accounting firm registered with the Public Company Accounting Oversight Board (United States) (PCAOB) and are required to be independent with respect to the Fund in accordance with the U.S. federal securities laws and the applicable rules and regulations of the Securities and Exchange Commission and the PCAOB.
We conducted our audits of these financial statements in accordance with the standards of the PCAOB. Those standards require that we plan and perform the audit to obtain reasonable assurance about whether the financial statements are free of material misstatement, whether due to error or fraud.
Our audits included performing procedures to assess the risks of material misstatement of the financial statements, whether due to error or fraud, and performing procedures that respond to those risks. Such procedures included examining, on a test basis, evidence regarding the amounts and disclosures in the financial statements. Our audits also included evaluating the accounting principles used and significant estimates made by management, as well as evaluating the overall presentation of the financial statements. Our procedures included confirmation of securities owned as of December 31, 2018 by correspondence with the custodian. We believe that our audits provide a reasonable basis for our opinion.
PricewaterhouseCoopers LLP
San Francisco, California
February 15, 2019
We have served as the auditor of one or more investment companies in the Franklin Templeton Group of Funds since 1948.
Templeton Developing Markets VIP Fund
This annual report for Templeton Developing Markets VIP Fund covers the fiscal year ended December 31, 2018.
Class 1 Performance Summary as of December 31, 2018
Average annual total return of Class 1 shares* represents the average annual change in value, assuming reinvestment of dividends and capital gains. Average returns smooth out variations in returns, which can be significant; they are not the same asyear-by-year results.
| | | | | | | | | | | | |
| | | |
| Periods ended 12/31/18 | | 1-Year | | | 5-Year | | | 10-Year | |
Average Annual Total Return | | | -15.44% | | | | +0.74% | | | | +7.24% | |
*The Fund has a fee waiver associated with any investment it makes in a Franklin Templeton money fund and/or other Franklin Templeton fund, contractually guaranteed through 4/30/19. Fund investment results reflect the fee waiver; without this waiver, the results would have been lower.
Performance reflects the Fund’s Class 1 operating expenses, but doesnotinclude any contract fees, expenses or sales charges. If they had been included, performance would be lower. These charges and deductions, particularly for variable life policies, can have a significant effect on contract values and insurance benefits. See the contract prospectus for a complete description of these expenses, including sales charges.
Performance data represent past performance, which does not guarantee future results. Investment return and principal value will fluctuate, and you may have a gain or loss when you sell your shares. Current performance may differ from figures shown.
Total Return Index Comparison for a Hypothetical $10,000 Investment (1/1/09–12/31/18)
The graph below shows the change in value of a hypothetical $10,000 investment in the Fund over the indicated period and includes reinvestment of any income or distributions. The Fund’s performance* is compared to the performance of MSCI Emerging Markets (EM) Index and the Standard & Poor’s®/ International Finance Corporation Investable (S&P®/IFCI) Composite Index. One cannot invest directly in an index, and an index is not representative of the Fund’s portfolio.Please see Important Notes to Performance Information preceding the Fund Summaries.

**Source: Morningstar. Please see Index Descriptions following the Fund Summaries.
TEMPLETON DEVELOPING MARKETS VIP FUND
Fund Goal and Main Investments
The Fund seeks long-term capital appreciation. Under normal market conditions, the Fund invests at least 80% of its net assets in emerging market investments.
Fund Risks
All investments involve risks, including possible loss of principal. Special risks are associated with foreign investing, including currency fluctuations, economic instability and political developments. Investments in developing markets, of which frontier markets are a subset, involve heightened risks related to the same factors, in addition to those associated with these markets’ smaller size, lesser liquidity and lack of established legal, political, business and social frameworks to support securities markets. Because these frameworks are typically even less developed in frontier markets, as well as various factors including the increased potential for extreme price volatility, illiquidity, trade barriers and exchange controls, the risks associated with developing markets are magnified in frontier markets. The Fund is designed for the aggressive portion of a well-diversified portfolio. The Fund is actively managed but there is no guarantee that the manager’s investment decisions will produce the desired results. The Fund’s prospectus also includes a description of the main investment risks.
Performance Overview
You can find the Fund’sone-year total return in the Performance Summary. In comparison, the MSCI EM Index had a-14.25% total return, and the S&P/IFCI Composite Index had a-14.22% total return for the same period.1 Please note, index performance numbers are for reference and we do not attempt to track an index but rather undertake investments on the basis of fundamental research.
Economic and Market Overview
Emerging market economies in general continued to grow faster than developed market economies during the 12 months under review. China’s economy continued to grow in 2018’s third quarter, though at its slowest annual rate since 2009. During 2018’s first three quarters, China saw decreased annual growth rates across sectors, including industrial production, services, fixed-asset investment, and exports and imports, amid
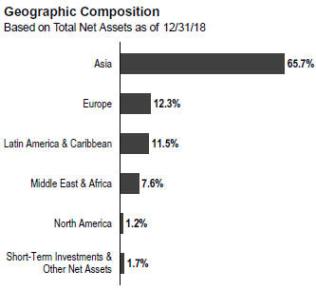
indications that trade tensions with the U.S. negatively affected the economy. India’s annual growth rate in 2018’s third quarter moderated from the prior quarter, as high oil prices and a depreciated rupee hurt consumer spending. Growth in financial services and manufacturing also slowed. Russia’s economy grew in 2018’s third quarter, though at a slower annual growth rate than the prior quarter as the positive effects of the summer World Cup faded. Growth slowed for accommodations and food services, transportation, and information and communication. Brazil’s economy expanded at a faster annual rate in the third quarter. The country’s exports significantly rebounded following a nationwide trucker’s strike in May. Household spending growth slowed, while growth accelerated in the services, transportation and financial services sectors. Among other emerging markets, the economies of Mexico, Poland and Turkey continued to grow.
Monetary policies varied among emerging market central banks. Brazil’s central bank cut its benchmark interest rate twice during the12-month period, while some, including those of India, Turkey and the Czech Republic, raised their benchmark interest rates multiple times. Mexico’s central bank raised its benchmark interest rate four times to a10-year high, citing global economic and domestic political uncertainties. Russia’s central bank changed its benchmark interest rate several times, but atperiod-end the rate was the same as at the beginning of the period. South Korea’s and Chile’s central banks raised their benchmark interest rates during the period,
1. Source: Morningstar.
One cannot invest directly in an index, and an index is not representative of the Fund’s portfolio. Please see Index Descriptions following the Fund Summaries.
The dollar value, number of shares or principal amount, and names of all portfolio holdings are listed in the Fund’s Statement of Investments (SOI).
TEMPLETON DEVELOPING MARKETS VIP FUND
while Taiwan’s central bank left its benchmark interest rate unchanged. The People’s Bank of China left its benchmark interest rate unchanged during the period, but it took measures to improve financial liquidity to mitigate the negative effects of the U.S.-China trade dispute and support economic growth.
Emerging market stocks declined during the 12 months under review due to concerns about global economic growth, rising U.S. interest rates, a strengthening U.S. dollar and heightened international trade tensions, particularly between the U.S. and China. Contagion concerns about economic crises in Turkey and Argentina also weighed on investor sentiment. Emerging market equities reversed some of their losses nearperiod-end, amid a trade truce between the U.S. and China and signals the U.S. Federal Reserve would slow its pace of interest rate increases. European stocks were pressured by political and economic instability in the region, particularly in Italy and Turkey. Asian equities were hurt by declines in technology stocks and increased tensions in the Korean peninsula, though tensions eased later in the year. In this environment, emerging market stocks, as measured by the MSCI EM Index, had a-14.25% total return for the 12 months ended December 31, 2018.1
Investment Strategy
We employ a fundamental research, value-oriented, long-term investment approach. We focus on the market price of a company’s securities relative to our evaluation of its long-term earnings, asset value and cash flow potential. We also consider a company’s profit and loss outlook, balance sheet strength, cash flow trends and asset value in relation to the current price of the company’s securities. Our analysis considers the company’s corporate governance behavior as well as its position in its sector, the economic framework and political environment.
Manager’s Discussion
During the 12 months under review, key performance detractors included Brilliance China Automotive Holdings, Samsung Electronics and Naspers.
Brilliance China Automotive manufactures and sells automobiles for the Chinese domestic market, predominantly through its joint venture with BMW,2 a German luxury car maker. BMW’s plans to increase its joint venture stake to a majority share was poorly received by investors, who expressed concerns about some aspects of the proposed deal terms,
Top 10 Countries
12/31/18
| | | | |
| | |
| % of Total
Net Assets |
|
| China | | | 20.6% | |
| South Korea | | | 16.3% | |
| Taiwan | | | 10.2% | |
| Russia | | | 7.7% | |
| India | | | 7.7% | |
| Brazil | | | 7.4% | |
| South Africa | | | 7.3% | |
| Thailand | | | 3.7% | |
| Indonesia | | | 3.4% | |
| U.K. | | | 3.1% | |
Brilliance China’s reduced stake and the potential impact on earnings. The stock has since corrected, and we believe the increased clarity about the joint venture agreement removes an overhang that had been weighing on the stock price since China’s decision to relax foreign ownership limits earlier in the year. In our opinion, luxury vehicle sales should continue to increase due to ongoing and growing demand for premium brands.
Samsung Electronics is a South Korea-based consumer electronics and semiconductor manufacturer. It is one of the world’s largest smartphone and memory chip producers as well as a key supplier of organic light-emitting diode displays. Shares of the export-focused company were caught in the crosshairs of mounting global trade tensions. While the company reported solid third-quarter earnings, investor sentiment was hurt by a decline in memory chip prices, an increase in inventory levels and a slowdown in smartphone demand.
Naspers is an internet and media group based in South Africa. It is a leading provider ofpay-television services insub-Saharan Africa. It also has sizable investments in some of the world’s leading technology companies, including China-based Tencent Holdings and Russia-based Mail.ru Group. Shares of Tencent retreated due to regulatory uncertainty in China’s online gaming industry, which impacted Naspers’s share price. Naspers’ plan to spin off itspay-television business lent some support to the stock. Information technology (IT) stocks in general corrected during the period as pessimism about future global growth, the U.S.-China trade conflict, rising U.S. interest rates and a strengthening U.S. dollar led investors to switch to more
2. Not a Fund holding.
TEMPLETON DEVELOPING MARKETS VIP FUND
defensive stocks.3 Improving market sentiment late in the year, however, led shares to recover from theiryear-low.
In contrast, key contributors to absolute performance during the reporting period were Fila Korea, LUKOIL and Banco Bradesco.
Fila Korea is one of South Korea’s leading sportswear companies. It also licenses the Fila brand around the world and owns a stake in U.S. golf product manufacturer Acushnet.2 Shares of Fila Korea advanced as the company’s efforts to revitalize its domestic business and expand in China helped improve quarterly earnings. The company also reported significantly better-than-expected second- and third-quarter earnings growth, driven by strong sales growth globally and improved sales in high-margin products. Steady financial results from Acushnet also buoyed the stock.
LUKOIL is a Russian energy company involved primarily in the exploration, production, marketing and refining of oil andoil-related products. The company holds some of the largest oil reserves in the world. Rebounding oil prices benefited company shares, significantly boosting sales and earnings in the second and third quarters. LUKOIL also started a large share buyback program and approved the cancellation of a portion of its treasury shares, with both moves aimed at improving shareholder value and corporate governance. A decline in oil prices late in the period, however, led the company’s share price to finish 2018 below its year-high.
Banco Bradesco is one of Brazil’s largest financial conglomerates. It operates across a wide-range of segments, including asset management, insurance, wholesale banking, full retail operations, credit card and general corporate and personal lending. Banco Bradesco announced strong quarterly results during the period, benefitting from positive loan growth trends and decliningnon-performing loan ratios. Improved sentiment in the Brazilian market in general, driven by the victory of a more market-friendly candidate in the presidential elections and improved economic growth, further lifted investor confidence in the stock.
During the past 12 months, we increased the Fund’s holdings in Mexico, Brazil and Peru due to their solid fundamentals. In terms of sectors, additions were undertaken in financials.4 Key purchases included a new position China Construction Bank,
Top 10 Holdings
12/31/18
| | | | |
Company Sector/Industry, Country | |
| % of Total
Net Assets |
|
Samsung Electronics Co. Ltd. Technology Hardware, Storage & Peripherals, | | | 7.1% | |
South Korea Taiwan Semiconductor Manufacturing Co. Ltd. Semiconductors & Semiconductor Equipment, Taiwan | | | 6.9% | |
Naspers Ltd. Media, South Africa | | | 6.5% | |
Alibaba Group Holding Ltd. Internet & Direct Marketing Retail, China | | | 4.1% | |
ICICI Bank Ltd. Banks, India | | | 3.3% | |
Unilever PLC Personal Products, U.K. | | | 3.1% | |
Tencent Holdings Ltd. Interactive Media & Services, China | | | 3.0% | |
Brilliance China Automotive Holdings Ltd. Automobiles, China | | | 2.9% | |
Itau Unibanco Holding SA Banks, Brazil | | | 2.5% | |
Banco Bradesco SA Banks, Brazil | | | 2.4% | |
one of the largest commercial banks in China, and additional holdings in Naver, a dominant Korean internet search portal, and Grupo Financiero Santander Mexico, a major financial services company in Mexico.
Meanwhile, we reduced the Fund’s holdings in South Korea, Hong Kong and Taiwan in favor of stocks we considered more attractively valued within our investment universe. Sectors which experienced the largest sales were consumer discretionary, IT and consumer staples.5 Key sales included liquidating our holdings in Daelim Industrial, a South Korean construction company, and Anheuser-Busch InBev, a global alcoholic andnon-alcoholic beverages company, while we reduced our holdings in MGM China Holdings, a Hong Kong-listed gaming and entertainment company.
It is important to recognize the effect of currency movements on the Fund’s performance. In general, if the value of the U.S. dollar goes up compared with a foreign currency, an investment traded in that foreign currency will go down in value because it will be worth fewer U.S. dollars. This can have a negative
3. The IT sector comprises electronic equipment, instruments and components; IT services; semiconductors and semiconductor equipment; software; and technology hardware, storage and peripherals in the SOI.
4. The financials sector comprises banks, capital markets, diversified financial services and insurance in the SOI.
5. The consumer discretionary sector comprises auto components; automobiles; distributors; hotels, restaurants and leisure; internet and direct marketing retail; and textiles, apparel and luxury goods in the SOI. The consumer staples sector comprises beverages, food and staples retailing, food products and personal products in the SOI.
TEMPLETON DEVELOPING MARKETS VIP FUND
effect on Fund performance. Conversely, when the U.S. dollar weakens in relation to a foreign currency, an investment traded in that foreign currency will increase in value, which can contribute to Fund performance. For the 12 months ended December 31, 2018, the U.S. dollar rose in value relative to most currencies. As a result, the Fund’s performance was negatively affected by the portfolio’s investment predominantly in securities withnon-U.S. currency exposure.
Thank you for your participation in Templeton Developing Markets VIP Fund. We look forward to serving your future investment needs.
The foregoing information reflects our analysis, opinions and portfolio holdings as of December 31, 2018, the end of the reporting period. The way we implement our main investment strategies and the resulting portfolio holdings may change depending on factors such as market and economic conditions. These opinions may not be relied upon as investment advice or an offer for a particular security. The information is not a complete analysis of every aspect of any market, country, industry, security or the Fund. Statements of fact are from sources considered reliable, but the investment manager makes no representation or warranty as to their completeness or accuracy. Although historical performance is no guarantee of future results, these insights may help you understand our investment management philosophy.
TEMPLETON DEVELOPING MARKETS VIP FUND
Class 1 Fund Expenses
As an investor in a variable insurance contract (Contract) that indirectly provides for investment in an underlying mutual fund, you can incur transaction and/or ongoing expenses at both the Fund level and the Contract Level: (1) transaction expenses can include sales charges (loads) on purchases, surrender fees, transfer fees and premium taxes; and (2) ongoing expenses can include management fees, distribution and service(12b-1) fees, contract fees, annual maintenance fees, mortality and expense risk fees and other fees and expenses. All mutual funds and Contracts have some types of ongoing expenses. The table below shows Fund-level ongoing expenses and can help you understand these costs and compare them with those of other mutual funds offered through the Contract. The table assumes a $1,000 investment held for the six months indicated. Please refer to the Fund prospectus for additional information on operating expenses.
Actual Fund Expenses
The table below provides information about the actual account values and actual expenses in the columns under the heading “Actual.” In these columns the Fund’s actual return, which includes the effect of ongoing Fund expenses but does not include the effect of ongoing Contract expenses, is used to calculate the “Ending Account Value.” You can estimate the Fund-level expenses you paid during the period by following these steps (ofcourse, your account value and expenses will differ from those in this illustration):Divide your account value by $1,000 (ifyour account had an $8,600 value, then $8,600 ÷ $1,000 = 8.6). Then multiply the result by the number under the headings “Actual” and “Fund-Level Expenses Paid During Period” (ifFund-Level Expenses Paid During Period were $7.50, then 8.6 × $7.50 = $64.50). In this illustration, the estimated expenses paid this period at the Fund level are $64.50.
Hypothetical Example for Comparison with Other Mutual Funds
Under the heading “Hypothetical” in the table, information is provided about hypothetical account values and hypothetical expenses based on the Fund’s actual expense ratio and an assumed rate of return of 5% per year before expenses, which is not the Fund’s actual return. This information may not be used to estimate the actual ending account balance or expenses you paid for the period, but it can help you compare ongoing costs of investing in the Fund with those of other mutual funds offered through the Contract. To do so, compare this 5% hypothetical example with the 5% hypothetical examples that appear in the shareholder reports of other funds offered through the Contract.
Please note that expenses shown in the table are meant to highlight ongoing costs at the Fund level only and do not reflect any ongoing expenses at the Contract level, or transaction expenses at either the Fund or Contract levels. In addition, while the Fund does not have transaction expenses, if the transaction and ongoing expenses at the Contract level were included, the expenses shown below would be higher. You should consult your Contract prospectus or disclosure document for more information.
| | | | | | | | | | | | | | | | | | | | | | | | | | | | |
| | | | | |
| | | | | | Actual (actual return after expenses) | | | | | | Hypothetical
(5% annual return before expenses) | | | | |
| | | | | | | |
Share Class | | Beginning Account
Value 7/1/18 | | | Ending Account
Value 12/31/18 | | | Fund-Level Expenses Paid During Period 7/1/18–12/31/181,2 | | | | | | Ending Account
Value 12/31/18 | | | Fund-Level Expenses Paid During Period 7/1/18–12/31/181,2 | | | Net
Annualized
Expense
Ratio2 | |
Class 1 | | $ | 1,000 | | | $ | 916.00 | | | $ | 5.65 | | | | | | | $ | 1,019.31 | | | $ | 5.96 | | | | 1.17 | % |
1. Expenses are equal to the annualized expense ratio for thesix-month period as indicated above—in the far right column—multiplied by the simple average account value over the period indicated, and then multiplied by 184/365 to reflect theone-half year period.
2. Reflects expenses after fee waivers and expense reimbursements. Does not include any ongoing expenses of the Contract for which the Fund is an investment option or acquired fund fees and expenses.
FRANKLIN TEMPLETON VARIABLE INSURANCE PRODUCTS TRUST
Financial Highlights
Templeton Developing Markets VIP Fund
| | | | | | | | | | | | | | | | | | | | |
| |
| | | Year Ended December 31, | |
| | | | | |
| | | 2018 | | | 2017 | | | 2016 | | | 2015 | | | 2014 | |
| Class 1 | | | | | | | | | | | | | | | | | | | | |
Per share operating performance (for a share outstanding throughout the year) | | | | | | | | | | | | | | | | | | | | |
| | | | | |
Net asset value, beginning of year | | | $10.31 | | | | $7.42 | | | | $6.37 | | | | $9.27 | | | | $10.26 | |
| | | | |
| | | | | |
| Income from investment operationsa: | | | | | | | | | | | | | | | | | | | | |
| | | | | |
Net investment incomeb | | | 0.09 | | | | 0.08 | | | | 0.05 | | | | 0.06 | | | | 0.15 | c |
| | | | | | |
Net realized and unrealized gains (losses) | | | (1.67 | ) | | | 2.92 | | | | 1.08 | | | | (1.63 | ) | | | (0.97 | ) |
| | | | |
Total from investment operations | | | (1.58 | ) | | | 3.00 | | | | 1.13 | | | | (1.57 | ) | | | (0.82 | ) |
| | | | |
| | | | | |
Less distributions from: | | | | | | | | | | | | | | | | | | | | |
| | | | | |
Net investment income | | | (0.11 | ) | | | (0.11 | ) | | | (0.08 | ) | | | (0.20 | ) | | | (0.17 | ) |
| | | | | |
Net realized gains | | | — | | | | — | | | | — | | | | (1.13 | ) | | | — | |
| | | | |
Total distributions | | | (0.11 | ) | | | (0.11 | ) | | | (0.08 | ) | | | (1.33 | ) | | | (0.17 | ) |
| | | | |
Redemption fees | | | — | | | | — | | | | — | | | | — | | | | — | d |
| | | | |
Net asset value, end of year | | | $8.62 | | | | $10.31 | | | | $7.42 | | | | $6.37 | | | | $9.27 | |
| | | | |
| | | | | |
Total returne | | | (15.44)% | | | | 40.65% | | | | 17.79% | | | | (19.42)% | | | | (8.09)% | |
| | | | | |
| Ratios to average net assets | | | | | | | | | | | | | | | | | | | | |
| | | | | |
Expenses before waiver and payments by affiliates | | | 1.24% | | | | 1.36% | | | | 1.38% | | | | 1.33% | | | | 1.36% | |
| | | | | |
Expenses net of waiver and payments by affiliates | | | 1.24% | f | | | 1.35% | g | | | 1.36% | | | | 1.32% | | | | 1.36% | f |
| | | | | | |
Net investment income | | | 0.99% | | | | 0.86% | | | | 0.79% | | | | 0.74% | | | | 1.51% | c |
| | | | | | |
| Supplemental data | | | | | | | | | | | | | | | | | | | | |
| | | | | |
Net assets, end of year (000’s) | | | $85,397 | | | | $105,493 | | | | $82,596 | | | | $77,000 | | | | $114,487 | |
| | | | | |
Portfolio turnover rate | | | 9.22% | | | | 10.76% | | | | 26.78% | | | | 71.69% | | | | 82.87% | |
aThe amount shown for a share outstanding throughout the period may not correlate with the Statement of Operations for the period due to the timing of sales and repurchases of the Fund’s shares in relation to income earned and/or fluctuating fair value of the investments of the Fund.
bBased on average daily shares outstanding.
cNet investment income per share includes approximately $0.04 per share related to income received in the form of special dividends in connection with certain Fund holdings. Excluding this amount, the ratio of net investment income to average net assets would have been 1.11%.
dAmount rounds to less than $0.01 per share.
eTotal return does not include fees, charges or expenses imposed by the variable annuity and life insurance contracts for which Franklin Templeton Variable Insurance Products Trust serves as an underlying investment vehicle.
fBenefit of waiver and payments by affiliates rounds to less than 0.01%.
gBenefit of expense reduction rounds to less than 0.01%.
| | | | | | |
| | | |
| | The accompanying notes are an integral part of these financial statements. | Annual Report | | | TD-7 | |
FRANKLIN TEMPLETON VARIABLE INSURANCE PRODUCTS TRUST
FINANCIAL HIGHLIGHTS
Templeton Developing Markets VIP Fund(continued)
| | | | | | | | | | | | | | | | | | | | |
| |
| | | Year Ended December 31, | |
| | | | | |
| | | 2018 | | | 2017 | | | 2016 | | | 2015 | | | 2014 | |
| Class 2 | | | | | | | | | | | | | | | | | | | | |
Per share operating performance (for a share outstanding throughout the year) | | | | | | | | | | | | | | | | | | | | |
| | | | | |
Net asset value, beginning of year | | | $10.23 | | | | $7.36 | | | | $6.32 | | | | $9.20 | | | | $10.19 | |
| | | | |
| | | | | |
Income from investment operationsa: | | | | | | | | | | | | | | | | | | | | |
| | | | | |
Net investment incomeb | | | 0.07 | | | | 0.05 | | | | 0.04 | | | | 0.04 | | | | 0.12 | c |
| | | | | | |
Net realized and unrealized gains (losses) | | | (1.68 | ) | | | 2.91 | | | | 1.06 | | | | (1.61 | ) | | | (0.96 | ) |
| | | | |
| Total from investment operations | | | (1.61 | ) | | | 2.96 | | | | 1.10 | | | | (1.57 | ) | | | (0.84 | ) |
| | | | |
| | | | | |
| Less distributions from: | | | | | | | | | | | | | | | | | | | | |
| | | | | |
Net investment income | | | (0.08 | ) | | | (0.09 | ) | | | (0.06 | ) | | | (0.18 | ) | | | (0.15 | ) |
| | | | | |
Net realized gains | | | — | | | | — | | | | — | | | | (1.13 | ) | | | — | |
| | | | |
Total distributions | | | (0.08 | ) | | | (0.09 | ) | | | (0.06 | ) | | | (1.31 | ) | | | (0.15 | ) |
| | | | |
Redemption fees | | | — | | | | — | | | | — | | | | — | | | | — | d |
| | | | |
Net asset value, end of year | | | $8.54 | | | | $10.23 | | | | $7.36 | | | | $6.32 | | | | $9.20 | |
| | | | |
| | | | | |
Total returne | | | (15.79)% | | | | 40.41% | | | | 17.44% | | | | (19.60)% | | | | (8.39)% | |
| | | | | |
| Ratios to average net assets | | | | | | | | | | | | | | | | | | | | |
| | | | | |
Expenses before waiver and payments by affiliates | | | 1.49% | | | | 1.61% | | | | 1.63% | | | | 1.58% | | | | 1.61% | |
| | | | | |
Expenses net of waiver and payments by affiliates | | | 1.49% | f | | | 1.60% | g | | | 1.61% | | | | 1.57% | | | | 1.61% | f |
| | | | | | |
Net investment income | | | 0.74% | | | | 0.61% | | | | 0.54% | | | | 0.49% | | | | 1.26% | c |
| | | | | | |
| Supplemental data | | | | | | | | | | | | | | | | | | | | |
| | | | | |
Net assets, end of year (000’s) | | | $195,305 | | | $ | 270,433 | | | | $205,151 | | | | $192,120 | | | | $250,813 | |
| | | | | |
Portfolio turnover rate | | | 9.22% | | | | 10.76% | | | | 26.78% | | | | 71.69% | | | | 82.87% | |
aThe amount shown for a share outstanding throughout the period may not correlate with the Statement of Operations for the period due to the timing of sales and repurchases of the Fund’s shares in relation to income earned and/or fluctuating fair value of the investments of the Fund.
bBased on average daily shares outstanding.
cNet investment income per share includes approximately $0.04 per share related to income received in the form of special dividends in connection with certain Fund holdings. Excluding this amount, the ratio of net investment income to average net assets would have been 0.86%.
dAmount rounds to less than $0.01 per share.
eTotal return does not include fees, charges or expenses imposed by the variable annuity and life insurance contracts for which Franklin Templeton Variable Insurance Products Trust serves as an underlying investment vehicle.
fBenefit of waiver and payments by affiliates rounds to less than 0.01%.
gBenefit of expense reduction rounds to less than 0.01%.
| | | | |
| | | |
| TD-8 | | Annual Report | The accompanying notes are an integral part of these financial statements. | | |
FRANKLIN TEMPLETON VARIABLE INSURANCE PRODUCTS TRUST
FINANCIAL HIGHLIGHTS
Templeton Developing Markets VIP Fund(continued)
| | | | | | | | | | | | | | | | | | | | |
| |
| | | Year Ended December 31, | |
| | | | | |
| | | 2018 | | | 2017 | | | 2016 | | | 2015 | | | 2014 | |
| Class 4 | | | | | | | | | | | | | | | | | | | | |
| Per share operating performance | | | | | | | | | | | | | | | | | | | | |
(for a share outstanding throughout the year) | | | | | | | | | | | | | | | | | | | | |
| | | | | |
| Net asset value, beginning of year | | | $10.28 | | | | $7.39 | | | | $6.34 | | | | $9.22 | | | | $10.20 | |
| | | | |
| | | | | |
| Income from investment operationsa: | | | | | | | | | | | | | | | | | | | | |
| | | | | |
Net investment incomeb | | | 0.06 | | | | 0.05 | | | | 0.03 | | | | 0.03 | | | | 0.12 | c |
| | | | | | |
Net realized and unrealized gains (losses) | | | (1.68 | ) | | | 2.92 | | | | 1.06 | | | | (1.62 | ) | | | (0.97 | ) |
| | | | |
| Total from investment operations | | | (1.62 | ) | | | 2.97 | | | | 1.09 | | | | (1.59 | ) | | | (0.85 | ) |
| | | | |
| | | | | |
| Less distributions from: | | | | | | | | | | | | | | | | | | | | |
| | | | | |
Net investment income | | | (0.07 | ) | | | (0.08 | ) | | | (0.04 | ) | | | (0.16 | ) | | | (0.13 | ) |
| | | | | |
Net realized gains | | | — | | | | — | | | | — | | | | (1.13 | ) | | | — | |
| | | | |
| Total distributions | | | (0.07 | ) | | | (0.08 | ) | | | (0.04 | ) | | | (1.29 | ) | | | (0.13 | ) |
| | | | |
| Redemption fees | | | — | | | | — | | | | — | | | | — | | | | — | d |
| | | | |
| Net asset value, end of year | | | $8.59 | | | | $10.28 | | | | $7.39 | | | | $6.34 | | | | $9.22 | |
| | | | |
| | | | | |
Total returne | | | (15.81)% | | | | 40.30% | | | | 17.32% | | | | (19.70)% | | | | (8.48)% | |
| | | | | |
| Ratios to average net assets | | | | | | | | | | | | | | | | | | | | |
| | | | | |
Expenses before waiver and payments by affiliates | | | 1.59% | | | | 1.71% | | | | 1.73% | | | | 1.68% | | | | 1.71% | |
| | | | | |
Expenses net of waiver and payments by affiliates | | | 1.59% | f | | | 1.70% | g | | | 1.71% | | | | 1.67% | | | | 1.71% | f |
| | | | | | |
Net investment income | | | 0.64% | | | | 0.51% | | | | 0.44% | | | | 0.39% | | | | 1.16% | c |
| | | | | | |
| Supplemental data | | | | | | | | | | | | | | | | | | | | |
| | | | | |
Net assets, end of year (000’s) | | | $5,203 | | | | $7,199 | | | | $6,377 | | | | $7,109 | | | | $11,106 | |
| | | | | |
Portfolio turnover rate | | | 9.22% | | | | 10.76% | | | | 26.78% | | | | 71.69% | | | | 82.87% | |
aThe amount shown for a share outstanding throughout the period may not correlate with the Statement of Operations for the period due to the timing of sales and repurchases of the Fund’s shares in relation to income earned and/or fluctuating fair value of the investments of the Fund.
bBased on average daily shares outstanding.
cNet investment income per share includes approximately $0.04 per share related to income received in the form of special dividends in connection with certain Fund holdings. Excluding this amount, the ratio of net investment income to average net assets would have been 0.76%.
dAmount rounds to less than $0.01 per share.
eTotal return does not include fees, charges or expenses imposed by the variable annuity and life insurance contracts for which Franklin Templeton Variable Insurance Products Trust serves as an underlying investment vehicle.
fBenefit of waiver and payments by affiliates rounds to less than 0.01%.
gBenefit of expense reduction rounds to less than 0.01%.
| | | | | | |
| | | |
| | The accompanying notes are an integral part of these financial statements. | Annual Report | | | TD-9 | |
FRANKLIN TEMPLETON VARIABLE INSURANCE PRODUCTS TRUST
Statement of Investments, December 31, 2018
Templeton Developing Markets VIP Fund
| | | | | | | | | | | | | | |
| | | | |
| | | | | Industry | | | Shares | | | Value | |
| | Common Stocks 93.4% | | | | | | | | | | | | |
| | Brazil 2.5% | | | | | | | | | | | | |
| a | | B2W Cia Digital | | | Internet & Direct Marketing Retail | | | | 115,300 | | | $ | 1,248,285 | |
| | B3 SA - Brasil Bolsa Balcao | | | Capital Markets | | | | 307,500 | | | | 2,124,077 | |
| | M. Dias Branco SA | | | Food Products | | | | 136,200 | | | | 1,501,928 | |
| | Mahle-Metal Leve SA | | | Auto Components | | | | 136,600 | | | | 884,095 | |
| | Totvs SA | | | Software | | | | 212,000 | | | | 1,482,976 | |
| | | | | | | | | | | | | | |
| | | | | | | | | | | | | 7,241,361 | |
| | | | | | | | | | | | | | |
| | Cambodia 1.5% | | | | | | | | | | | | |
| | NagaCorp Ltd. | | | Hotels, Restaurants & Leisure | | | | 3,946,000 | | | | 4,243,065 | |
| | | | | | | | | | | | | | |
| | China 20.6% | | | | | | | | | | | | |
| a | | Alibaba Group Holding Ltd., ADR | | | Internet & Direct Marketing Retail | | | | 85,886 | | | | 11,772,394 | |
| | BAIC Motor Corp. Ltd., H | | | Automobiles | | | | 1,686,100 | | | | 889,291 | |
| a | | Baidu Inc., ADR | | | Interactive Media & Services | | | | 9,411 | | | | 1,492,585 | |
| | Brilliance China Automotive Holdings Ltd. | | | Automobiles | | | | 11,171,100 | | | | 8,317,159 | |
| | China Construction Bank Corp., H | | | Banks | | | | 6,631,000 | | | | 5,470,437 | |
| | China Mobile Ltd. | | | Wireless Telecommunication Services | | | | 480,500 | | | | 4,623,673 | |
| | China Petroleum & Chemical Corp., H | | | Oil, Gas & Consumable Fuels | | | | 3,829,900 | | | | 2,734,071 | |
| | China Resources Cement Holdings Ltd. | | | Construction Materials | | | | 364,700 | | | | 328,349 | |
| | CNOOC Ltd. | | | Oil, Gas & Consumable Fuels | | | | 2,000,500 | | | | 3,091,252 | |
| | COSCO Shipping Ports Ltd. | | | Transportation Infrastructure | | | | 847,238 | | | | 833,118 | |
| | Dah Chong Hong Holdings Ltd. | | | Distributors | | | | 1,746,100 | | | | 604,295 | |
| | NetEase Inc., ADR | | | Entertainment | | | | 6,922 | | | | 1,629,231 | |
| | Ping An Bank Co. Ltd., A | | | Banks | | | | 2,337,800 | | | | 3,187,986 | |
| | Ping An Insurance Group Co. of China Ltd., A | | | Insurance | | | | 313,472 | | | | 2,556,630 | |
| | Poly Culture Group Corp. Ltd., H | | | Entertainment | | | | 229,200 | | | | 299,141 | |
| | Tencent Holdings Ltd. | | | Interactive Media & Services | | | | 213,900 | | | | 8,577,307 | |
| a | | Tencent Music Entertainment Group, ADR | | | Entertainment | | | | 54 | | | | 714 | |
| | Uni-President China Holdings Ltd. | | | Food Products | | | | 2,099,700 | | | | 1,823,378 | |
| | Weifu High-Technology Co. Ltd., B | | | Auto Components | | | | 334,339 | | | | 578,118 | |
| | | | | | | | | | | | | | |
| | | | | | | | | | | | | 58,809,129 | |
| | | | | | | | | | | | | | |
| | Czech Republic 0.4% | | | | | | | | | | | | |
| | Moneta Money Bank AS | | | Banks | | | | 390,403 | | | | 1,260,598 | |
| | | | | | | | | | | | | | |
| | Hong Kong 0.7% | | | | | | | | | | | | |
| | Dairy Farm International Holdings Ltd. | | | Food & Staples Retailing | | | | 116,333 | | | | 1,052,814 | |
| | MGM China Holdings Ltd. | | | Hotels, Restaurants & Leisure | | | | 603,200 | | | | 1,012,202 | |
| | | | | | | | | | | | | | |
| | | | | | | | | | | | | 2,065,016 | |
| | | | | | | | | | | | | | |
| | Hungary 1.1% | | | | | | | | | | | | |
| | Richter Gedeon Nyrt | | | Pharmaceuticals | | | | 161,270 | | | | 3,125,365 | |
| | | | | | | | | | | | | | |
| | India 7.7% | | | | | | | | | | | | |
| | Bajaj Holdings & Investment Ltd. | | | Diversified Financial Services | | | | 35,390 | | | | 1,500,654 | |
| | Bharat Petroleum Corp. Ltd. | | | Oil, Gas & Consumable Fuels | | | | 63,000 | | | | 328,493 | |
| | Biocon Ltd. | | | Biotechnology | | | | 314,552 | | | | 2,844,170 | |
| | Coal India Ltd. | | | Oil, Gas & Consumable Fuels | | | | 245,918 | | | | 851,010 | |
| | Glenmark Pharmaceuticals Ltd. | | | Pharmaceuticals | | | | 292,323 | | | | 2,912,095 | |
| | ICICI Bank Ltd. | | | Banks | | | | 1,806,409 | | | | 9,351,419 | |
| | Infosys Ltd. | | | IT Services | | | | 238,536 | | | | 2,259,355 | |
| | Tata Chemicals Ltd. | | | Chemicals | | | | 131,000 | | | | 1,330,713 | |
| a | | Tata Motors Ltd., A | | | Automobiles | | | | 401,271 | | | | 534,393 | |
| | | | | | | | | | | | | | |
| | | | | | | | | | | | | 21,912,302 | |
| | | | | | | | | | | | | | |
FRANKLIN TEMPLETON VARIABLE INSURANCE PRODUCTS TRUST
STATEMENT OF INVESTMENTS
| | | | | | | | | | | | | | |
Templeton Developing Markets VIP Fund(continued) | | | | |
| | | | |
| | | | | Industry | | | Shares | | | Value | |
| | Common Stocks(continued) | | | | | | | | | | | | |
| | Indonesia 3.4% | | | | | | | | | | | | |
| | Astra International Tbk PT | | | Automobiles | | | | 8,085,700 | | | $ | 4,624,818 | |
| | Bank Danamon Indonesia Tbk PT | | | Banks | | | | 5,707,000 | | | | 3,016,217 | |
| | Semen Indonesia (Persero) Tbk PT | | | Construction Materials | | | | 2,764,700 | | | | 2,210,991 | |
| | | | | | | | | | | | | | |
| | | | | | | | | | | | | 9,852,026 | |
| | | | | | | | | | | | | | |
| | Kenya 0.3% | | | | | | | | | | | | |
| | Equity Group Holdings PLC | | | Banks | | | | 2,127,994 | | | | 725,690 | |
| | | | | | | | | | | | | | |
| | Macau 0.7% | | | | | | | | | | | | |
| | Sands China Ltd. | | | Hotels, Restaurants & Leisure | | | | 469,600 | | | | 2,056,992 | |
| | | | | | | | | | | | | | |
| | Mexico 2.2% | | | | | | | | | | | | |
| | Banco Santander Mexico SA Institucion de Banca Multiple | | | | | | | | | | | | |
| | Grupo Financiero Santander, ADR | | | Banks | | | | 869,761 | | | | 5,357,728 | |
| | Nemak SAB de CV | | | Auto Components | | | | 1,403,100 | | | | 1,048,192 | |
| | | | | | | | | | | | | | |
| | | | | | | | | | | | | 6,405,920 | |
| | | | | | | | | | | | | | |
| | Nigeria 0.0%† | | | | | | | | | | | | |
| | Nigerian Breweries PLC | | | Beverages | | | | 170,327 | | | | 40,509 | |
| | | | | | | | | | | | | | |
| | Pakistan 0.4% | | | | | | | | | | | | |
| | Habib Bank Ltd. | | | Banks | | | | 1,460,000 | | | | 1,232,332 | |
| | | | | | | | | | | | | | |
| | Peru 1.9% | | | | | | | | | | | | |
| | Compania de Minas Buenaventura SA, ADR | | | Metals & Mining | | | | 261,500 | | | | 4,241,530 | |
| b | | Intercorp Financial Services Inc., Reg S | | | Banks | | | | 31,950 | | | | 1,341,900 | |
| | | | | | | | | | | | | | |
| | | | | | | | | | | | | 5,583,430 | |
| | | | | | | | | | | | | | |
| | Philippines 0.3% | | | | | | | | | | | | |
| | BDO Unibank Inc. | | | Banks | | | | 327,469 | | | | 815,866 | |
| | | | | | | | | | | | | | |
| | Russia 7.7% | | | | | | | | | | | | |
| | Gazprom PJSC, ADR | | | Oil, Gas & Consumable Fuels | | | | 666,900 | | | | 2,953,700 | |
| | LUKOIL PJSC, ADR | | | Oil, Gas & Consumable Fuels | | | | 95,250 | | | | 6,808,470 | |
| a,b | | Mail.Ru Group Ltd., GDR, Reg S | | | Interactive Media & Services | | | | 112,799 | | | | 2,646,265 | |
| | MMC Norilsk Nickel PJSC, ADR | | | Metals & Mining | | | | 37,800 | | | | 709,128 | |
| | Sberbank of Russia PJSC, ADR | | | Banks | | | | 469,778 | | | | 5,148,767 | |
| a | | Yandex NV, A | | | Interactive Media & Services | | | | 136,818 | | | | 3,741,972 | |
| | | | | | | | | | | | | | |
| | | | | | | | | | | | | 22,008,302 | |
| | | | | | | | | | | | | | |
| | Singapore 0.2% | | | | | | | | | | | | |
| | DBS Group Holdings Ltd. | | | Banks | | | | 25,706 | | | | 446,774 | |
| | | | | | | | | | | | | | |
| | South Africa 7.3% | | | | | | | | | | | | |
| | Massmart Holdings Ltd. | | | Food & Staples Retailing | | | | 293,714 | | | | 2,116,136 | |
| | Naspers Ltd., N | | | Media | | | | 92,697 | | | | 18,659,462 | |
| | | | | | | | | | | | | | |
| | | | | | | | | | | | | 20,775,598 | |
| | | | | | | | | | | | | | |
| | South Korea 16.3% | | | | | | | | | | | | |
| | Fila Korea Ltd. | | | Textiles, Apparel & Luxury Goods | | | | 81,720 | | | | 3,925,636 | |
| | Hankook Tire Co. Ltd. | | | Auto Components | | | | 21,600 | | | | 778,695 | |
| | Hankook Tire Worldwide Co. Ltd. | | | Diversified Financial Services | | | | 37,500 | | | | 558,943 | |
| | Hanon Systems | | | Auto Components | | | | 94,741 | | | | 918,734 | |
| a | | HDC Hyundai DevelopmentCo-Engineering & Construction | | | Construction & Engineering | | | | 56,247 | | | | 2,434,301 | |
| | Hite Jinro Co. Ltd. | | | Beverages | | | | 64,320 | | | | 958,698 | |
| | Interpark Holdings Corp. | | | Internet & Direct Marketing Retail | | | | 142,053 | | | | 299,741 | |
| | KT Skylife Co. Ltd. | | | Media | | | | 166,071 | | | | 1,714,824 | |
| | LG Corp. | | | Industrial Conglomerates | | | | 62,473 | | | | 3,921,005 | |
| | Naver Corp. | | | Interactive Media & Services | | | | 50,610 | | | | 5,544,010 | |
FRANKLIN TEMPLETON VARIABLE INSURANCE PRODUCTS TRUST
STATEMENT OF INVESTMENTS
| | | | | | | | | | | | | | |
| Templeton Developing Markets VIP Fund(continued) | | | | |
| | | | |
| | | | | Industry | | | Shares | | | Value | |
| | Common Stocks(continued) | | | | | | | | | |
| | South Korea(continued) | | | | | | | | | |
| | POSCO | | | Metals & Mining | | | | 13,592 | | | $ | 2,965,634 | |
| | Samsung Electronics Co. Ltd. | | | Technology Hardware, Storage & Peripherals | | | | 588,200 | | | | 20,439,199 | |
| | SK Hynix Inc. | | | Semiconductors & Semiconductor Equipment | | | | 37,980 | | | | 2,063,185 | |
| | | | | | | | | | | | | | |
| | | | | | | | | | | | | 46,522,605 | |
| | | | | | | | | | | | | | |
| | Taiwan 10.2% | | | | | | | | | | | | |
| | Catcher Technology Co. Ltd. | | | Technology Hardware, Storage & Peripherals | | | | 341,000 | | | | 2,507,599 | |
| | CTBC Financial Holding Co. Ltd. | | | Banks | | | | 2,244,000 | | | | 1,481,479 | |
| | FIT Hon Teng Ltd. | | | Electronic Equipment, Instruments & Components | | | | 1,759,800 | | | | 761,857 | |
| | Hon Hai Precision Industry Co. Ltd. | | | Electronic Equipment, Instruments & Components | | | | 1,169,200 | | | | 2,705,473 | |
| | Largan Precision Co. Ltd. | | | Electronic Equipment, Instruments & Components | | | | 11,900 | | | | 1,250,400 | |
| | Pegatron Corp. | | | Technology Hardware, Storage & Peripherals | | | | 444,800 | | | | 747,221 | |
| | Taiwan Semiconductor Manufacturing Co. Ltd. | | | Semiconductors & Semiconductor Equipment | | | | 2,658,000 | | | | 19,589,469 | |
| | | | | | | | | | | | | | |
| | | | | | | | | | | | | 29,043,498 | |
| | | | | | | | | | | | | | |
| | Thailand 3.7% | | | | | | | | | | | | |
| | Kasikornbank PCL, fgn | | | Banks | | | | 619,500 | | | | 3,534,253 | |
| | Kiatnakin Bank PCL, fgn | | | Banks | | | | 1,009,800 | | | | 2,068,622 | |
| | Land and Houses PCL, fgn | | | Real Estate Management & Development | | | | 3,605,200 | | | | 1,103,633 | |
| | PTT Exploration and Production PCL, fgn | | | Oil, Gas & Consumable Fuels | | | | 102,300 | | | | 359,031 | |
| | Siam Commercial Bank PCL, fgn | | | Banks | | | | 306,400 | | | | 1,264,824 | |
| | Thai Beverage PCL, fgn | | | Beverages | | | | 4,816,500 | | | | 2,155,508 | |
| | | | | | | | | | | | | | |
| | | | | | | | | | | | | 10,485,871 | |
| | | | | | | | | | | | | | |
| | United Kingdom 3.1% | | | | | | | | | | | | |
| | Unilever PLC | | | Personal Products | | | | 167,932 | | | | 8,798,569 | |
| | | | | | | | | | | | | | |
| | United States 1.2% | | | | | | | | | | | | |
| | Cognizant Technology Solutions Corp., A | | | IT Services | | | | 18,688 | | | | 1,186,314 | |
| a | | IMAX Corp. | | | Entertainment | | | | 125,255 | | | | 2,356,047 | |
| | | | | | | | | | | | | | |
| | | | | | | | | | | | | 3,542,361 | |
| | | | | | | | | | | | | | |
| | | | |
| | Total Common Stocks (Cost $221,437,922) | | | | | | | | | | | 266,993,179 | |
| | | | | | | | | | | | | | |
| | Preferred Stocks 4.9% | | | | | | | | | | | | |
| | Brazil 4.9% | | | | | | | | | | | | |
| c | | Banco Bradesco SA, 3.078%, ADR, pfd | | | Banks | | | | 690,596 | | | | 6,829,994 | |
| c | | Itau Unibanco Holding SA, 10.117%, ADR, pfd | | | Banks | | | | 776,943 | | | | 7,101,259 | |
| | | | | | | | | | | | | | |
| | Total Preferred Stocks (Cost $5,860,345) | | | | | | | | | | | 13,931,253 | |
| | | | | | | | | | | | | | |
| | | | |
| | Total Investments before Short Term Investments (Cost $227,298,267) | | | | | | | | | | | 280,924,432 | |
| | | | | | | | | | | | | | |
FRANKLIN TEMPLETON VARIABLE INSURANCE PRODUCTS TRUST
STATEMENT OF INVESTMENTS
Templeton Developing Markets VIP Fund(continued)
| | | | | | | | | | | | |
| | | | |
| | | | | | | Shares | | | Value | |
| | Short Term Investments
(Cost $5,427,431) 1.9% | | | | | | | | | | |
| | Money Market Funds 1.9% | | | | | | | | | | |
| | United States 1.9% | | | | | | | �� | | | |
| d,e | | Institutional Fiduciary Trust Money Market Portfolio, 1.99% | | | | | 5,427,431 | | | $ | 5,427,431 | |
| | | | | | | | | | | | |
| | Total Investments (Cost $232,725,698) 100.2% | | | | | | | | | 286,351,863 | |
| | Other Assets, less Liabilities (0.2)% | | | | | | | | | (446,909 | ) |
| | | | | | | | | | | | |
| | Net Assets 100.0% | | | | | | | | $ | 285,904,954 | |
| | | | | | | | | | | | |
See Abbreviations on pageTD-24.
†Rounds to less than 0.1% of net assets.
aNon-income producing.
bSecurity was purchased pursuant to Regulation S under the Securities Act of 1933, which exempts from registration securities offered and sold outside of the United States. Such a security cannot be sold in the United States without either an effective registration statement filed pursuant to the Securities Act of 1933, or pursuant to an exemption from registration. These securities have been deemed liquid under guidelines approved by the Trust’s Board of Trustees. At December 31, 2018, the aggregate value of these securities was $3,988,165, representing 1.3% of net assets.
cVariable rate security. The rate shown represents the yield at period end.
dSee Note 3(e) regarding investments in affiliated management investment companies.
eThe rate shown is the annualizedseven-day effective yield at period end.
| | | | | | |
| | | |
| | The accompanying notes are an integral part of these financial statements. | Annual Report | | | TD-13 | |
FRANKLIN TEMPLETON VARIABLE INSURANCE PRODUCTS TRUST
Financial Statements
Statement of Assets and Liabilities
December 31, 2018
| | | | |
| |
| | | Templeton
Developing Markets
VIP Fund | |
Assets: | | | | |
Investments in securities: | | | | |
Cost - Unaffiliated issuers | | $ | 227,298,267 | |
Cost -Non-controlled affiliates (Note 3e) | | | 5,427,431 | |
| | | | |
Value - Unaffiliated issuers | | $ | 280,924,432 | |
Value -Non-controlled affiliates (Note 3e) | | | 5,427,431 | |
Foreign currency, at value (cost $2,016) | | | 2,017 | |
Receivables: | | | | |
Investment securities sold | | | 200,224 | |
Capital shares sold | | | 55,482 | |
Dividends | | | 949,750 | |
Foreign tax refund | | | 22,046 | |
Other assets | | | 45 | |
| | | | |
Total assets | | | 287,581,427 | |
| | | | |
Liabilities: | | | | |
Payables: | | | | |
Investment securities purchased | | | 347,793 | |
Capital shares redeemed | | | 248,926 | |
Management fees | | | 255,764 | |
Distribution fees | | | 86,361 | |
Reports to shareholders | | | 85,301 | |
Deferred tax | | | 560,483 | |
Accrued expenses and other liabilities | | | 91,845 | |
| | | | |
Total liabilities | | | 1,676,473 | |
| | | | |
Net assets, at value | | $ | 285,904,954 | |
| | | | |
Net assets consist of: | | | | |
Paid-in capital | | $ | 239,929,675 | |
Total distributable earnings (loss) | | | 45,975,279 | |
| | | | |
Net assets, at value | | $ | 285,904,954 | |
| | | | |
| |
| Class 1: | | | | |
Net assets, at value | | $ | 85,397,349 | |
| | | | |
Shares outstanding | | | 9,911,310 | |
| | | | |
Net asset value and maximum offering price per share | | $ | 8.62 | |
| | | | |
| |
| Class 2: | | | | |
Net assets, at value | | $ | 195,304,629 | |
| | | | |
Shares outstanding | | | 22,858,604 | |
| | | | |
Net asset value and maximum offering price per share | | $ | 8.54 | |
| | | | |
| |
| Class 4: | | | | |
Net assets, at value | | $ | 5,202,976 | |
| | | | |
Shares outstanding | | | 605,836 | |
| | | | |
Net asset value and maximum offering price per share | | $ | 8.59 | |
| | | | |
| | | | |
| | | |
| TD-14 | | Annual Report | The accompanying notes are an integral part of these financial statements. | | |
FRANKLIN TEMPLETON VARIABLE INSURANCE PRODUCTS TRUST
FINANCIAL STATEMENTS
Statement of Operations
for the year ended December 31, 2018
| | | | |
| |
| | | Templeton
Developing Markets
VIP Fund | |
Investment income: | | | | |
Dividends: (net of foreign taxes)* | | | | |
Unaffiliated issuers | | $ | 7,351,409 | |
Non-controlled affiliates (Note 3e) | | | 80,201 | |
| | | | |
Total investment income | | | 7,431,610 | |
| | | | |
Expenses: | | | | |
Management fees (Note 3a) | | | 3,750,153 | |
Distribution fees: (Note 3c) | | | | |
Class 2 | | | 581,458 | |
Class 4 | | | 21,971 | |
Custodian fees (Note 4) | | | 110,634 | |
Reports to shareholders | | | 159,309 | |
Professional fees | | | 85,051 | |
Trustees’ fees and expenses | | | 2,514 | |
Other | | | 39,824 | |
| | | | |
Total expenses | | | 4,750,914 | |
Expenses waived/paid by affiliates (Note 3e) | | | (16,974 | ) |
| | | | |
Net expenses | | | 4,733,940 | |
| | | | |
Net investment income | | | 2,697,670 | |
| | | | |
Realized and unrealized gains (losses): | | | | |
Net realized gain (loss) from: | | | | |
Investments: | | | | |
Unaffiliated issuers | | | 19,775,701 | |
Foreign currency transactions | | | (81,443 | ) |
| | | | |
Net realized gain (loss) | | | 19,694,258 | |
| | | | |
Net change in unrealized appreciation (depreciation) on: | | | | |
Investments: | | | | |
Unaffiliated issuers | | | (77,229,739 | ) |
Translation of other assets and liabilities denominated in foreign currencies | | | (8,915 | ) |
Change in deferred taxes on unrealized appreciation | | | 101,555 | |
| | | | |
Net change in unrealized appreciation (depreciation) | | | (77,137,099 | ) |
| | | | |
Net realized and unrealized gain (loss) | | | (57,442,841 | ) |
| | | | |
Net increase (decrease) in net assets resulting from operations | | $ | (54,745,171 | ) |
| | | | |
| |
*Foreign taxes withheld on dividends | | $ | 1,097,281 | |
| | | | | | |
| | | |
| | The accompanying notes are an integral part of these financial statements. | Annual Report | | | TD-15 | |
FRANKLIN TEMPLETON VARIABLE INSURANCE PRODUCTS TRUST
FINANCIAL STATEMENTS
Statements of Changes in Net Assets
| | | | | | | | |
| |
| | | Templeton Developing
Markets VIP Fund | |
| |
| | | Year Ended December 31, | |
| | |
| | | 2018 | | | 2017 | |
Increase (decrease) in net assets: | | | | | | | | |
Operations: | | | | | | | | |
Net investment income | | $ | 2,697,670 | | | $ | 2,374,437 | |
Net realized gain (loss) | | | 19,694,258 | | | | 15,871,903 | |
Net change in unrealized appreciation (depreciation) | | | (77,137,099 | ) | | | 97,762,101 | |
| | | | |
Net increase (decrease) in net assets resulting from operations | | | (54,745,171 | ) | | | 116,008,441 | |
| | | | |
Distributions to shareholders: (Note 1d) | | | | | | | | |
Class 1 | | | (1,013,838 | ) | | | (1,158,124 | ) |
Class 2 | | | (1,947,210 | ) | | | (2,409,152 | ) |
Class 4 | | | (46,243 | ) | | | (56,318 | ) |
| | | | |
Total distributions to shareholders | | | (3,007,291 | ) | | | (3,623,594 | ) |
| | | | |
Capital share transactions: (Note 2) | | | | | | | | |
Class 1 | | | (3,414,259 | ) | | | (8,439,257 | ) |
Class 2 | | | (35,130,020 | ) | | | (13,542,309 | ) |
Class 4 | | | (923,409 | ) | | | (1,401,998 | ) |
| | | | |
Total capital share transactions | | | (39,467,688 | ) | | | (23,383,564 | ) |
| | | | |
Net increase (decrease) in net assets | | | (97,220,150 | ) | | | 89,001,283 | |
Net assets: | | | | | | | | |
Beginning of year | | | 383,125,104 | | | | 294,123,821 | |
| | | | |
End of year (Note 1d) | | $ | 285,904,954 | | | $ | 383,125,104 | |
| | | | |
| | | | |
| | | |
| TD-16 | | Annual Report | The accompanying notes are an integral part of these financial statements. | | |
FRANKLIN TEMPLETON VARIABLE INSURANCE PRODUCTS TRUST
Notes to Financial Statements
Templeton Developing Markets VIP Fund
1. Organization and Significant Accounting Policies
Franklin Templeton Variable Insurance Products Trust (Trust) is registered under the Investment Company Act of 1940 (1940 Act) as anopen-end management investment company, consisting of eighteen separate funds and applies the specialized accounting and reporting guidance in U.S. Generally Accepted Accounting Principles (U.S. GAAP). Templeton Developing Markets VIP Fund (Fund) is included in this report. Shares of the Fund are generally sold only to insurance company separate accounts to fund the benefits of variable life insurance policies or variable annuity contracts. The Fund offers three classes of shares: Class 1, Class 2 and Class 4. Each class of shares may differ by its distribution fees, voting rights on matters affecting a single class and its exchange privilege.
The following summarizes the Fund’s significant accounting policies.
a. Financial Instrument Valuation
The Fund’s investments in financial instruments are carried at fair value daily. Fair value is the price that would be received to sell an asset or paid to transfer a liability in an orderly transaction between market participants on the measurement date. The Fund calculates the net asset value (NAV) per share each business day as of 4 p.m. Eastern time or the regularly scheduled close of the New York Stock Exchange (NYSE), whichever is earlier. Under compliance policies and procedures approved by the Trust’s Board of Trustees (the Board), the Fund’s administrator has responsibility for oversight of valuation, including leading the cross-functional Valuation Committee (VC). The Fund may utilize independent pricing services, quotations from securities and financial instrument dealers, and other market sources to determine fair value.
Equity securities listed on an exchange or on the NASDAQ National Market System are valued at the last quoted sale price or the official closing price of the day, respectively. Foreign equity securities are valued as of the close of trading on the foreign stock exchange on which the security is primarily traded, or as of 4 p.m. Eastern time. The value is then converted into its U.S. dollar equivalent at the foreign exchange rate in effect at 4 p.m. Eastern time on the day that the value of the security is determined.Over-the-counter (OTC) securities are valued within the range of the most recent quoted bid and ask prices. Securities that trade in multiple markets or on multiple
exchanges are valued according to the broadest and most representative market. Certain equity securities are valued based upon fundamental characteristics or relationships to similar securities.
Investments inopen-end mutual funds are valued at the closing NAV.
The Fund has procedures to determine the fair value of financial instruments for which market prices are not reliable or readily available. Under these procedures, the Fund primarily employs a market-based approach which may use related or comparable assets or liabilities, recent transactions, market multiples, book values, and other relevant information for the investment to determine the fair value of the investment. An income-based valuation approach may also be used in which the anticipated future cash flows of the investment are discounted to calculate fair value. Discounts may also be applied due to the nature or duration of any restrictions on the disposition of the investments. Due to the inherent uncertainty of valuations of such investments, the fair values may differ significantly from the values that would have been used had an active market existed.
Trading in securities on foreign securities stock exchanges and OTC markets may be completed before 4 p.m. Eastern time. In addition, trading in certain foreign markets may not take place on every Fund’s business day. Occasionally, events occur between the time at which trading in a foreign security is completed and 4 p.m. Eastern time that might call into question the reliability of the value of a portfolio security held by the Fund. As a result, differences may arise between the value of the Fund’s portfolio securities as determined at the foreign market close and the latest indications of value at 4 p.m. Eastern time. In order to minimize the potential for these differences, the VC monitors price movements following the close of trading in foreign stock markets through a series of country specific market proxies (such as baskets of American Depositary Receipts, futures contracts and exchange traded funds). These price movements are measured against established trigger thresholds for each specific market proxy to assist in determining if an event has occurred that may call into question the reliability of the values of the foreign securities held by the Fund. If such an event occurs, the securities may be valued using fair value procedures, which may include the use of independent pricing services.
FRANKLIN TEMPLETON VARIABLE INSURANCE PRODUCTS TRUST
NOTES TO FINANCIAL STATEMENTS
Templeton Developing Markets VIP Fund(continued)
1. Organization and Significant Accounting Policies(continued)
a. Financial Instrument Valuation(continued)
When the last day of the reporting period is anon-business day, certain foreign markets may be open on those days that the Fund’s NAV is not calculated, which could result in differences between the value of the Fund’s portfolio securities on the last business day and the last calendar day of the reporting period. Any significant security valuation changes due to an open foreign market are adjusted and reflected by the Fund for financial reporting purposes.
b. Foreign Currency Translation
Portfolio securities and other assets and liabilities denominated in foreign currencies are translated into U.S. dollars based on the exchange rate of such currencies against U.S. dollars on the date of valuation. The Fund may enter into foreign currency exchange contracts to facilitate transactions denominated in a foreign currency. Purchases and sales of securities, income and expense items denominated in foreign currencies are translated into U.S. dollars at the exchange rate in effect on the transaction date. Portfolio securities and assets and liabilities denominated in foreign currencies contain risks that those currencies will decline in value relative to the U.S. dollar. Occasionally, events may impact the availability or reliability of foreign exchange rates used to convert the U.S. dollar equivalent value. If such an event occurs, the foreign exchange rate will be valued at fair value using procedures established and approved by the Board.
The Fund does not separately report the effect of changes in foreign exchange rates from changes in market prices on securities held. Such changes are included in net realized and unrealized gain or loss from investments in the Statement of Operations.
Realized foreign exchange gains or losses arise from sales of foreign currencies, currency gains or losses realized between the trade and settlement dates on securities transactions and the difference between the recorded amounts of dividends, interest, and foreign withholding taxes and the U.S. dollar equivalent of the amounts actually received or paid. Net unrealized foreign exchange gains and losses arise from changes in foreign exchange rates on foreign denominated assets and liabilities other than investments in securities held at the end of the reporting period.
c. Income and Deferred Taxes
It is the Fund’s policy to qualify as a regulated investment company under the Internal Revenue Code. The Fund intends to distribute to shareholders substantially all of its taxable income and net realized gains to relieve it from federal income and if applicable, excise taxes. As a result, no provision for U.S. federal income taxes is required.
The Fund may be subject to foreign taxation related to income received, capital gains on the sale of securities and certain foreign currency transactions in the foreign jurisdictions in which it invests. Foreign taxes, if any, are recorded based on the tax regulations and rates that exist in the foreign markets in which the Fund invests. When a capital gain tax is determined to apply, the Fund records an estimated deferred tax liability in an amount that would be payable if the securities were disposed of on the valuation date.
The Fund may recognize an income tax liability related to its uncertain tax positions under U.S. GAAP when the uncertain tax position has a less than 50% probability that it will be sustained upon examination by the tax authorities based on its technical merits. As of December 31, 2018, the Fund has determined that no tax liability is required in its financial statements related to uncertain tax positions for any open tax years (or expected to be taken in future tax years). Open tax years are those that remain subject to examination and are based on the statute of limitations in each jurisdiction in which the Fund invests.
d. Security Transactions, Investment Income, Expenses and Distributions
Security transactions are accounted for on trade date. Realized gains and losses on security transactions are determined on a specific identification basis. Estimated expenses are accrued daily. Dividend income is recorded on theex-dividend date except for certain dividends from securities where the dividend rate is not available. In such cases, the dividend is recorded as soon as the information is received by the Fund. Distributions to shareholders are recorded on theex-dividend date. Distributable earnings are determined according to income tax regulations (tax basis) and may differ from earnings recorded in accordance with U.S. GAAP. These differences may be permanent or temporary. Permanent differences are reclassified among capital accounts to reflect their tax character. These reclassifications
FRANKLIN TEMPLETON VARIABLE INSURANCE PRODUCTS TRUST
NOTES TO FINANCIAL STATEMENTS
Templeton Developing Markets VIP Fund(continued)
have no impact on net assets or the results of operations. Temporary differences are not reclassified, as they may reverse in subsequent periods.*
Common expenses incurred by the Trust are allocated among the Funds based on the ratio of net assets of each Fund to the combined net assets of the Trust or based on the ratio of number of shareholders of each Fund to the combined number of shareholders of the Trust. Fund specific expenses are charged directly to the Fund that incurred the expense.
Realized and unrealized gains and losses and net investment income, excluding class specific expenses, are allocated daily to each class of shares based upon the relative proportion of net assets of each class. Differences in per share distributions by class are generally due to differences in class specific expenses.
e. Accounting Estimates
The preparation of financial statements in accordance with U.S. GAAP requires management to make estimates and assumptions that affect the reported amounts of assets and
liabilities at the date of the financial statements and the amounts of income and expenses during the reporting period. Actual results could differ from those estimates.
f. Guarantees and Indemnifications
Under the Trust’s organizational documents, its officers and trustees are indemnified by the Trust against certain liabilities arising out of the performance of their duties to the Trust. Additionally, in the normal course of business, the Trust, on behalf of the Fund, enters into contracts with service providers that contain general indemnification clauses. The Trust’s maximum exposure under these arrangements is unknown as this would involve future claims that may be made against the Trust that have not yet occurred. Currently, the Trust expects the risk of loss to be remote.
*Effective during the current reporting period, it is no longer required to present certain line items in the Statements of Changes in Net Assets. The below prior period amounts affected by this change are shown as they were in the prior year Statements of Changes in Net Assets.
For the year ended December 31, 2017, distributions to shareholders were as follows:
| | | | |
Distributions from net investment income : | | | | |
Class 1 | | $ | (1,158,124 | ) |
Class 2 | | | (2,409,152 | ) |
Class 4 | | | (56,318 | ) |
For the year ended December 31, 2017, undistributed net investment income included in net assets was $1,595,154.
2. Shares of Beneficial Interest
At December 31, 2018, there were an unlimited number of shares authorized (without par value). Transactions in the Fund’s shares were as follows:
| | | | | | | | | | | | | | | | | | | | | | | | |
| | | | | |
| | | | | | | | | Year Ended December 31, | | | | | | | |
| | | | | | |
| | | | | | 2018 | | | | | | | | | 2017 | | | | |
| | | | | | |
| | | Shares | | | | | | Amount | | | Shares | | | | | | Amount | |
| | | | | | |
| Class 1 Shares: | | | | | | | | | | | | | | | | | | | | | | | | |
Shares sold | | | 1,801,012 | | | | | | | $ | 17,302,432 | | | | 1,136,991 | | | | | | | $ | 10,043,847 | |
Shares issued in reinvestment of distributions | | | 105,170 | | | | | | | | 1,013,838 | | | | 132,055 | | | | | | | | 1,158,124 | |
Shares redeemed | | | (2,222,370 | ) | | | | | | | (21,730,529 | ) | | | (2,176,842 | ) | | | | | | | (19,641,228 | ) |
| | | | |
Net increase (decrease) | | | (316,188 | ) | | | | | | $ | (3,414,259 | ) | | | (907,796 | ) | | | | | | $ | (8,439,257 | ) |
| | | | |
FRANKLIN TEMPLETON VARIABLE INSURANCE PRODUCTS TRUST
NOTES TO FINANCIAL STATEMENTS
Templeton Developing Markets VIP Fund(continued)
2. Shares of Beneficial Interest(continued)
| | | | | | | | | | | | | | | | |
| |
| | | Year Ended December 31, | |
| | |
| | | 2018 | | | 2017 | |
| | | | |
| | | Shares | | | Amount | | | Shares | | | Amount | |
| | | | |
| Class 2 Shares: | | | | | | | | | | | | | | | | |
Shares sold | | | 4,771,227 | | | $ | 45,978,347 | | | | 6,636,331 | | | $ | 58,458,562 | |
Shares issued in reinvestment of distributions | | | 203,470 | | | | 1,947,210 | | | | 276,596 | | | | 2,409,152 | |
Shares redeemed | | | (8,557,714 | ) | | | (83,055,577 | ) | | | (8,351,598 | ) | | | (74,410,023 | ) |
| | | | |
Net increase (decrease) | | | (3,583,017 | ) | | $ | (35,130,020 | ) | | | (1,438,671 | ) | | $ | (13,542,309 | ) |
| | | | |
| Class 4 Shares: | | | | | | | | | | | | | | | | |
Shares sold | | | 48,260 | | | $ | 471,887 | | | | 85,028 | | | $ | 793,112 | |
Shares issued in reinvestment of distributions | | | 4,802 | | | | 46,243 | | | | 6,437 | | | | 56,318 | |
Shares redeemed | | | (147,608 | ) | | | (1,441,539 | ) | | | (253,881 | ) | | | (2,251,428 | ) |
| | | | |
Net increase (decrease) | | | (94,546 | ) | | $ | (923,409 | ) | | | (162,416 | ) | | $ | (1,401,998 | ) |
| | | | |
3. Transactions with Affiliates
Franklin Resources, Inc. is the holding company for various subsidiaries that together are referred to as Franklin Templeton. Certain officers and trustees of the Fund are also officers and/or trustees of the following subsidiaries:
| | |
| |
| Subsidiary | | Affiliation |
Templeton Asset Management Ltd. (Asset Management) | | Investment manager |
Franklin Templeton Services, LLC (FT Services) | | Administrative manager |
Franklin Templeton Distributors, Inc. (Distributors) | | Principal underwriter |
Franklin Templeton Investor Services, LLC (Investor Services) | | Transfer agent |
a. Management Fees
Effective May 1, 2018, the Fund pays an investment management fee to Asset Management based on the average daily net assets of the Fund as follows:
| | |
| |
| Annualized Fee Rate | | Net Assets |
1.050% | | Up to and including $1 billion |
1.000% | | Over $1 billion, up to and including $5 billion |
0.950% | | Over $5 billion, up to and including $10 billion |
0.900% | | Over $10 billion, up to and including $15 billion |
0.850% | | Over $15 billion, up to and including $20 billion |
0.800% | | In excess of $20 billion |
FRANKLIN TEMPLETON VARIABLE INSURANCE PRODUCTS TRUST
NOTES TO FINANCIAL STATEMENTS
Templeton Developing Markets VIP Fund(continued)
Prior to May 1, 2018, the Fund paid fees to Asset Management based on the average daily net assets of the Fund as follows:
| | |
| |
| Annualized Fee Rate | | Net Assets |
1.250% | | Up to and including $200 million |
1.235% | | Over $200 million, up to and including $700 million |
1.200% | | Over $700 million, up to and including $1 billion |
1.150% | | Over $1 billion, up to and including $1.2 billion |
1.125% | | Over $1.2 billion, up to and including $5 billion |
1.075% | | Over $5 billion, up to and including $10 billion |
1.025% | | Over $10 billion, up to and including $15 billion |
0.975% | | Over $15 billion, up to and including $20 billion |
0.925% | | In excess of $20 billion |
For the year ended December 31, 2018, the gross effective investment management fee rate was 1.124% of the Fund’s average daily net assets.
b. Administrative Fees
Under an agreement with Asset Management, FT Services provides administrative services to the Fund. The fee is paid by Asset Management based on the Fund’s average daily net assets, and is not an additional expense of the Fund.
c. Distribution Fees
The Board has adopted distribution plans for Class 2 and Class 4 shares pursuant to Rule12b-1 under the 1940 Act. Under the Fund’s compensation distribution plans, the Fund pays Distributors for costs incurred in connection with the servicing, sale and distribution of the Fund’s shares up to 0.25% and 0.35% per year of its average daily net assets of Class 2 and Class 4 respectively. The plan year, for purposes of monitoring compliance with the maximum annual plan rates, is February 1 through January 31.
d. Transfer Agent Fees
Investor Services, under terms of an agreement, performs shareholder servicing for the Fund and is not paid by the Fund for the services.
e. Investments in Affiliated Management Investment Companies
The Fund invests in one or more affiliated management investment companies for purposes other than exercising a controlling influence over the management or policies. Management fees paid by the Fund are waived on assets invested in the affiliated management investment companies, as noted in the Statement of Operations, in an amount not to exceed the management and administrative fees paid directly or indirectly by each affiliate. During the year ended December 31, 2018, the Fund held investments in affiliated management investment companies as follows:
| | | | | | | | | | | | | | | | | | | | | | | | | | | | | | | | |
| | | | | | | | |
| | | Number of Shares
Held at
Beginning of Year | | | Gross Additions | | | Gross Reductions | | | Number of Shares Held at End of Year | | | Value at End of Year | | | Dividend Income | | | Realized Gain (Loss) | | | Net Change in Unrealized Appreciation (Depreciation) | |
|
|
|
| Non-Controlled Affiliates | | | | | | | | | | | | | | | | | | | | | | | | | | | | | | | | |
Institutional Fiduciary Trust Money Market Portfolio, 1.99% | | | 1,128,203 | | | | 57,320,008 | | | | (53,020,780 | ) | | | 5,427,431 | | | $ | 5,427,431 | | | $ | 80,201 | | | $ | — | | | $ | — | |
| | | | | | | | | | | | | | | | | | | | |
FRANKLIN TEMPLETON VARIABLE INSURANCE PRODUCTS TRUST
NOTES TO FINANCIAL STATEMENTS
Templeton Developing Markets VIP Fund(continued)
4. Expense Offset Arrangement
The Fund has entered into an arrangement with its custodian whereby credits realized as a result of uninvested cash balances are used to reduce a portion of the Fund’s custodian expenses. During the year ended December 31, 2018, there were no credits earned.
5. Income Taxes
For tax purposes, capital losses may be carried over to offset future capital gains.
At December 31, 2018, the capital loss carryforwards were as follows:
| | | | |
Capital loss carryforwards not subject to expiration: | | | | |
Short Term | | $ | 6,657,029 | |
During the year ended December 31, 2018, the Fund utilized $18,533,257 of capital loss carryforwards.
The tax character of distributions paid during the years ended December 31, 2018 and 2017, was as follows:
| | | | | | | | |
| | | 2018 | | | | 2017 | |
| | | | |
Distributions paid from ordinary income | | $ | 3,007,291 | | | $ | 3,623,594 | |
| | | | |
At December 31, 2018, the cost of investments, net unrealized appreciation (depreciation) and undistributed ordinary income for income tax purposes were as follows:
| | | | |
Cost of investments | | $ | 236,429,778 | |
| | | | |
Unrealized appreciation | | $ | 74,390,657 | |
Unrealized depreciation | | | (24,468,572 | ) |
| | | | |
Net unrealized appreciation (depreciation) | | $ | 49,922,085 | |
| | | | |
Distributable earnings: | | | | |
Undistributed ordinary income | | $ | 3,293,793 | |
| | | | |
Differences between income and/or capital gains as determined on a book basis and a tax basis are primarily due to differing treatment of corporate actions.
6. Investment Transactions
Purchases and sales of investments (excluding short term securities) for the year ended December 31, 2018, aggregated $30,489,465 and $74,482,051, respectively.
7. Concentration of Risk
Investing in foreign securities may include certain risks and considerations not typically associated with investing in U.S. securities, such as fluctuating currency values and changing local and regional economic, political and social conditions, which may result in greater market volatility. Current political and financial uncertainty surrounding the European Union may increase market volatility and the economic risk of investing in securities in Europe. In addition, certain foreign securities may not be as liquid as U.S. securities.
The United States and other nations have imposed and could impose additional sanctions on certain issuers in Russia due to regional conflicts. These sanctions could result in the devaluation of Russia’s currency, a downgrade in Russian issuers’ credit ratings, or a decline in the value and liquidity of Russian stocks or other securities. Such sanctions could also adversely affect Russia’s economy,
FRANKLIN TEMPLETON VARIABLE INSURANCE PRODUCTS TRUST
NOTES TO FINANCIAL STATEMENTS
Templeton Developing Markets VIP Fund(continued)
possibly forcing the economy into a recession. The Fund may be prohibited from investing in securities issued by companies subject to such sanctions. In addition, if the Fund holds the securities of an issuer that is subject to such sanctions, an immediate freeze of that issuer’s securities could result, impairing the ability of the Fund to buy, sell, receive or deliver those securities. There is also the risk that countermeasures could be taken by Russia’s government, which could involve the seizure of the Fund’s assets. These risks could affect the value of the Fund’s portfolio. While the Fund holds securities of certain issuers impacted by the sanctions, existing investments do not presently violate the applicable terms and conditions of the sanctions. The sanctions currently do not affect the Fund’s ability to sell these securities. At December 31, 2018, the Fund had 7.7% of its net assets invested in Russia.
8. Credit Facility
The Fund, together with other U.S. registered and foreign investment funds (collectively, Borrowers), managed by Franklin Templeton, are borrowers in a joint syndicated senior unsecured credit facility totaling $2 billion (Global Credit Facility) which matured on February 8, 2019. This Global Credit Facility provides a source of funds to the Borrowers for temporary and emergency purposes, including the ability to meet future unanticipated or unusually large redemption requests. Effective February 8, 2019, the Borrowers renewed the Global Credit Facility for a one year term, maturing February 7, 2020, for a total of $2 billion.
Under the terms of the Global Credit Facility, the Fund shall, in addition to interest charged on any borrowings made by the Fund and other costs incurred by the Fund, pay its share of fees and expenses incurred in connection with the implementation and maintenance of the Global Credit Facility, based upon its relative share of the aggregate net assets of all of the Borrowers, including an annual commitment fee of 0.15% based upon the unused portion of the Global Credit Facility. These fees are reflected in other expenses in the Statement of Operations. During the year ended December 31, 2018, the Fund did not use the Global Credit Facility.
9. Fair Value Measurements
The Fund follows a fair value hierarchy that distinguishes between market data obtained from independent sources (observable inputs) and the Fund’s own market assumptions (unobservable inputs). These inputs are used in determining the value of the Fund’s financial instruments and are summarized in the following fair value hierarchy:
| | • | | Level 1 – quoted prices in active markets for identical financial instruments |
| | • | | Level 2 – other significant observable inputs (including quoted prices for similar financial instruments, interest rates, prepayment speed, credit risk, etc.) |
| | • | | Level 3 – significant unobservable inputs (including the Fund’s own assumptions in determining the fair value of financial instruments) |
The input levels are not necessarily an indication of the risk or liquidity associated with financial instruments at that level.
At December 31, 2018, all of the Fund’s investments in financial instruments carried at fair value were valued using Level 1 inputs. For detailed categories, see the accompanying Statement of Investments.
10. Subsequent Events
The Fund has evaluated subsequent events through the issuance of the financial statements and determined that no events have occurred that require disclosure other than those already disclosed in the financial statements.
FRANKLIN TEMPLETON VARIABLE INSURANCE PRODUCTS TRUST
NOTES TO FINANCIAL STATEMENTS
Templeton Developing Markets VIP Fund(continued)
|
Abbreviations |
|
| Selected Portfolio |
| | |
| |
| ADR | | American Depositary Receipt |
| |
| GDR | | Global Depositary Receipt |
FRANKLIN TEMPLETON VARIABLE INSURANCE PRODUCTS TRUST
Report of Independent Registered Public Accounting Firm
To the Board of Trustees of Franklin Templeton Variable Insurance Products Trust and Shareholders of Templeton Developing Markets VIP Fund
Opinion on the Financial Statements
We have audited the accompanying statement of assets and liabilities, including the statement of investments, of Templeton Developing Markets VIP Fund (the “Fund”) as of December 31, 2018, the related statement of operations for the year ended December 31, 2018, the statement of changes in net assets for each of the two years in the period ended December 31, 2018, including the related notes, and the financial highlights for each of the five years in the period ended December 31, 2018 (collectively referred to as the “financial statements”). In our opinion, the financial statements present fairly, in all material respects, the financial position of the Fund as of December 31, 2018, the results of its operations for the year then ended, the changes in its net assets for each of the two years in the period ended December 31, 2018 and the financial highlights for each of the five years in the period ended December 31, 2018 in conformity with accounting principles generally accepted in the United States of America.
Basis for Opinion
These financial statements are the responsibility of the Fund’s management. Our responsibility is to express an opinion on the Fund’s financial statements based on our audits. We are a public accounting firm registered with the Public Company Accounting Oversight Board (United States) (PCAOB) and are required to be independent with respect to the Fund in accordance with the U.S. federal securities laws and the applicable rules and regulations of the Securities and Exchange Commission and the PCAOB.
We conducted our audits of these financial statements in accordance with the standards of the PCAOB. Those standards require that we plan and perform the audit to obtain reasonable assurance about whether the financial statements are free of material misstatement, whether due to error or fraud.
Our audits included performing procedures to assess the risks of material misstatement of the financial statements, whether due to error or fraud, and performing procedures that respond to those risks. Such procedures included examining, on a test basis, evidence regarding the amounts and disclosures in the financial statements. Our audits also included evaluating the accounting principles used and significant estimates made by management, as well as evaluating the overall presentation of the financial statements. Our procedures included confirmation of securities owned as of December 31, 2018 by correspondence with the custodian, transfer agent and brokers; when replies were not received from brokers, we performed other auditing procedures. We believe that our audits provide a reasonable basis for our opinion.
PricewaterhouseCoopers LLP
San Francisco, California
February 15, 2019
We have served as the auditor of one or more investment companies in the Franklin Templeton Group of Funds since 1948.
FRANKLIN TEMPLETON VARIABLE INSURANCE PRODUCTS TRUST
Tax Information (unaudited)
Templeton Developing Markets VIP Fund
At December 31, 2018, more than 50% of the Fund’s total assets were invested in securities of foreign issuers. In most instances, foreign taxes were withheld from income paid to the Fund on these investments. The Fund elects to treat foreign taxes paid as allowed under Section 853 of the Internal Revenue Code. This election will allow shareholders of record as of the 2019 distribution date, to treat their proportionate share of foreign taxes paid by the Fund as having been paid directly by them. The shareholder shall consider these amounts as foreign taxes paid in the tax year in which they receive the Fund distribution.
Templeton Foreign VIP Fund
This annual report for Templeton Foreign VIP Fund covers the fiscal year ended December 31, 2018.
Class 1 Performance Summary as of December 31, 2018
Average annual total return of Class 1 shares* represents the average annual change in value, assuming reinvestment of dividends and capital gains. Average returns smooth out variations in returns, which can be significant; they are not the same asyear-by-year results.
| | | | | | | | | | | | |
| | | |
| Periods ended 12/31/18 | | 1-Year | | | 5-Year | | | 10-Year | |
Average Annual Total Return | | | -15.27% | | | | -2.31% | | | | +5.69% | |
*The Fund has a fee waiver associated with any investment it makes in a Franklin Templeton money fund and/or other Franklin Templeton fund, contractually guaranteed through 4/30/19. Fund investment results reflect the fee waiver; without this waiver, the results would have been lower.
Performance reflects the Fund’s Class 1 operating expenses, but doesnotinclude any contract fees, expenses or sales charges. If they had been included, performance would be lower. These charges and deductions, particularly for variable life policies, can have a significant effect on contract values and insurance benefits. See the contract prospectus for a complete description of these expenses, including sales charges.
Performance data represent past performance, which does not guarantee future results. Investment return and principal value will fluctuate, and you may have a gain or loss when you sell your shares. Current performance may differ from figures shown.
Total Return Index Comparison for a Hypothetical $10,000 Investment (1/1/09–12/31/18)
The graph below shows the change in value of a hypothetical $10,000 investment in the Fund over the indicated period and includes reinvestment of any income or distributions. The Fund’s performance* is compared to the performance of the MSCI All Country World Index (ACWI) ex USA Index. One cannot invest directly in an index, and an index is not representative of the Fund’s portfolio.Please see Important Notes to Performance Information preceding the Fund Summaries.
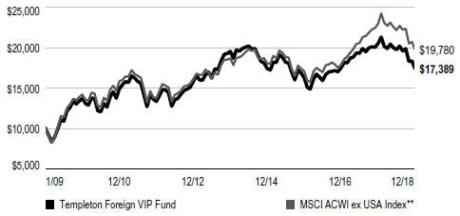
**Source: Morningstar. Please see Index Descriptions following the Fund Summaries.
TEMPLETON FOREIGN VIP FUND
Fund Goal and Main Investments
The Fund seeks long-term capital growth. Under normal market conditions, the Fund invests at least 80% of its net assets in investments of issuers located outside the US, including those in emerging markets.
Fund Risks
All investments involve risks, including possible loss of principal. Special risks are associated with foreign investing, including currency fluctuations, economic instability and political developments; investments in emerging markets involve heightened risks related to the same factors. Currency rates may fluctuate significantly over short periods of time, and can reduce returns. Because the Fund may invest its assets in companies in a specific region, including Europe, it is subject to greater risks of adverse developments in that region and/or the surrounding regions than a fund that is more broadly diversified geographically. Current political and financial uncertainty surrounding the European Union may increase market volatility and the economic risk of investing in companies in Europe. The Fund is actively managed but there is no guarantee that the manager’s investment decisions will produce the desired results. The Fund’s prospectus also includes a description of the main investment risks.
Performance Overview
You can find the Fund’sone-year total return in the Performance Summary. In comparison, the Fund’s benchmark, the MSCI All Country World Index (ACWI) ex USA Index, had a-3.44% total return for the same period.1 Please note, index performance information is provided for reference and we do not attempt to track the index but rather undertake investments on the basis of fundamental research.
Economic and Market Overview
The global economy expanded during the 12 months under review, despite weakness in certain regions. Global developed and emerging market stocks were aided at certain points during the period by higher crude oil prices, upbeat economic data, easing trade tensions and encouraging corporate earnings reports, as well as indications of a slower pace of interest-rate increases from the U.S. Federal Reserve (Fed).
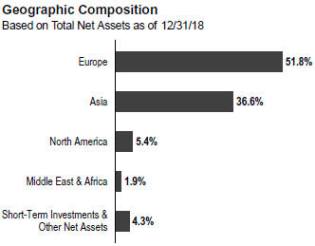
However, various factors weighed on global markets during the period, including concerns about tighter regulation of technology companies, political uncertainties in the U.S. and the European Union, and major central banks’ interest-rate path and unwinding of monetary stimulus measures. Markets were further pressured by U.S. trade disputes with its allies and China, and their impact on global growth and corporate earnings. In this environment, global stocks, as measured by the MSCI ACWI, had a-8.93% total return for the 12 months ended December 31, 2018.1
The U.S. economy grew during the12-month period. After moderating for three consecutive quarters, the economy grew faster in 2018’s second quarter, driven by consumer spending, business investment, exports and government spending. However, growth moderated in the third quarter due to declines in exports and housing investment. The unemployment rate declined from 4.1% in December 2017 to 3.9% atperiod-end.2 Annual inflation, as measured by the Consumer Price Index, decreased from 2.1% in December 2017 to 1.9% atperiod-end.2 The Fed raised its target range for the federal funds rate four times during the period, to 2.25%–2.50%, and continued reducing its balance sheet as part of an ongoing plan to normalize monetary policy. At its December meeting, the Fed reduced the projected 2019 rate increases to two, compared to three projected previously.
In Europe, the U.K.’s quarterly economic growth moderated in 2018’s first quarter, but accelerated in 2018’s second and third quarters. The Bank of England raised its key policy rate once
1. Source: Morningstar.
One cannot invest directly in an index, and an index is not representative of the Fund’s portfolio. Please see Index Descriptions following the Fund Summaries.
2. Source: U.S. Bureau of Labor Statistics.
The dollar value, number of shares or principal amount, and names of all portfolio holdings are listed in the Fund’s Statement of Investments (SOI).
TEMPLETON FOREIGN VIP FUND
during the review period. After moderating in 2018’s first quarter, the eurozone’s quarterly growth remained stable in the second quarter, but eased in the third quarter. The bloc’s annual inflation rate ended the period higher than in December 2017. The European Central Bank (ECB) kept its benchmark interest rate unchanged during the period. In December 2018, the ECB confirmed its plan to conclude its bond purchase program at the end of 2018 and reiterated it expects key interest rates to remain unchanged through the summer of 2019.
In Asia, Japan’s quarterly gross domestic product (GDP) grew in 2018’s second quarter, following a contraction in the first quarter, but contracted again in the third quarter. The Bank of Japan left its benchmark interest rate unchanged during the period and continued its monetary stimulus measures.
In emerging markets, Brazil’s quarterly GDP growth remained stable in 2018’s first and second quarters, but accelerated in the third quarter. The Central Bank of Brazil lowered its benchmark interest rate twice during the period. Russia’s annual GDP growth rate accelerated in 2018’s first and second quarters, but moderated in the third quarter. After lowering its key rate twice early in the period, the Bank of Russia raised it twice in the period’s second half to curtail inflation risks. China’s annual GDP grew at a stable rate in 2018’s first quarter, but it moderated in the second and third quarters. The People’s Bank of China left its benchmark interest rate unchanged during the period, but it took measures to improve financial liquidity to mitigate the negative effects of the U.S.-China trade dispute and support economic growth. Overall, emerging market stocks, as measured by the MSCI Emerging Markets Index, had a-14.25% total return during the period.1
Investment Strategy
Our investment philosophy is bottom up, value oriented and long term. When choosing investments for the Fund, we generally focus on the market price of a company’s securities relative to our evaluation of the company’s potential long-term earnings, asset value and cash flow. We also consider a company’s price/earnings ratio, profit margins and liquidation value.
Top 10 Holdings
12/31/18
| | | | |
Company Sector/Industry, Country | |
| % of Total
Net Assets |
|
Samsung Electronics Co. Ltd. Technology Hardware, Storage & Peripherals, South Korea | | | 4.0% | |
BP PLC Oil, Gas & Consumable Fuels, U.K. | | | 3.2% | |
Royal Dutch Shell PLC Oil, Gas & Consumable Fuels, U.K. | | | 2.9% | |
Standard Chartered PLC Banks, U.K. | | | 2.9% | |
Roche Holding AG Pharmaceuticals, Switzerland | | | 2.7% | |
Sanofi Pharmaceuticals, France | | | 2.5% | |
Wheaton Precious Metals Corp. Metals & Mining, Canada | | | 2.2% | |
BNP Paribas SA Banks, France | | | 2.0% | |
China Telecom Corp. Ltd. Diversified Telecommunication Services, China | | | 2.0% | |
HSBC Holdings PLC Banks, U.K. | | | 1.9% | |
Manager’s Discussion
During the 12 month period under review, an overweighting in the health care sector, particularly in life sciences tools and services, contributed to relative results.3 Biotechology companies MorphoSys4,5 (Germany), QIAGEN (the Netherlands) and Shire (U.K.) contributed to performance, as did pharmaceutical companies Sanofi (France) and Roche Holding (Switzerland).
Stock selection in the communication services sector, especially in media, supported relative performance.6 Luxembourg-based satellite specialist SES was the sector’s top contributor. Recent results have shown stabilization in the firm’s video business, as well as better-than-expected growth in other key segments. Though sentiment remains tepid, recent progress highlights some of the positive changes being delivered by a new management team working to repair the balance sheet and seize long-term growth opportunities. Additionally, share prices advanced after U.S. regulators
3. The health care sector comprises biotechnology, health care equipment and supplies, health care providers and services, life sciences tools and services, and pharmaceuticals in the SOI.
4. Not held atperiod-end.
5. Not part of the index.
6. The communication services sector comprises diversified telecommunication services, entertainment, interactive media and services, media and wireless telecommunication services in the SOI.
TEMPLETON FOREIGN VIP FUND
advanced a proposal to let terrestrial services use airwaves long dedicated to the satellite services. Other significant contributors included Chinese telecommunication services company China Telecom and Japanese telecoms operator and technology conglomerate SoftBank Group4 aided the Fund’s performance.
An overweighting in the energy sector supported relative performance.7 Oil and gas companies Eni (Italy) and BP (U.K.) were the sector’s top contributors. Shares of BP were supported by solid first quarter results, reflecting strong cost control and very strong operational and project delivery performance which led to increased oil and gas production and further improvements to its balance sheet. Additionally, BP stated that a dividend hike will be discussed by the company’s board later in 2019. Rising crude oil prices at certain points during the period also boosted share prices.
Key individual contributors included Japanese beverage firm Suntory Beverage & Food.
In contrast, stock selection in the financials sector, particularly in banks, detracted from relative results.8 Banking firms BNP Paribas (France) and Bank of Ireland Group (Ireland) weighed on the Fund’s performance. Shares of BNP were pressured by concerns about its exposure to Italian sovereign debt after political parties outside the Italian mainstream won the general election and struggled to form a coalition government. Escalating macro fears and a lackluster financial market environment in Europe also hurt the bank’s shares.
Stock selection in the consumer discretionary sector, notably in specialty retail, hampered relative results.9 Specialty retailer Kingfisher (U.K.), household durables company Panasonic (Japan) and auto components firm Sumitomo Rubber Industries (Japan) all weighed on relative performance.
Stock selection in the materials sector, especially in metals and mining, also weighed on relative performance.10 Canadian precious metals firm Alamos Gold5 and Japanese metals and mining company Sumitomo Metal Mining (Japan) were the sector’s largest detractors.
Key individual detractors included consumer electronics and semiconductor manufacturer company Samsung Electronics (South Korea), chemicals and pharmaceuticals firm Bayer (Germany), internet services company Baidu (China), and trading firm SIG4,5 (U.K.).
From a geographic perspective, all regions detracted from relative results. Stock selection in North America, particularly in Canada, detracted from relative results. Stock selection in Europe, notably in the U.K., and in Israel also weighed on performance. In contrast, stock selection in China, Germany, Luxembourg and Italy contributed to relative returns.
It is important to recognize the effect of currency movements on the Fund’s performance. In general, if the value of the U.S. dollar goes up compared with a foreign currency, an investment traded in that foreign currency will go down in value because it will be worth fewer U.S. dollars. This can have a negative effect on Fund performance. Conversely, when the U.S. dollar weakens in relation to a foreign currency, an investment traded in that foreign currency will increase in value, which can contribute to Fund performance. For the 12 months ended December 31, 2018, the U.S. dollar rose in value relative to most currencies. As a result, the Fund’s performance was negatively affected by the portfolio’s investment predominantly in securities withnon-U.S. currency exposure.
Thank you for your participation in Templeton Foreign VIP Fund. We look forward to serving your future investment needs.
The foregoing information reflects our analysis, opinions and portfolio holdings as of December 31, 2018, the end of the reporting period. The way we implement our main investment strategies and the resulting portfolio holdings may change depending on factors such as market and economic conditions. These opinions may not be relied upon as investment advice or an offer for a particular security. The information is not a complete analysis of every aspect of any market, country, industry, security or the Fund. Statements of fact are from sources considered reliable, but the investment manager makes no representation or warranty as to their completeness or accuracy. Although historical performance is no guarantee of future results, these insights may help you understand our investment management philosophy.
7. The energy sector comprises energy equipment and services and oil, gas and consumable fuels in the SOI.
8. The financials sector comprises banks, capital markets and insurance in the SOI.
9. The consumer discretionary sector comprises auto components, automobiles, household durables and specialty retail in the SOI.
10. The materials sector comprises chemicals, construction materials, and metals and mining in the SOI.
TEMPLETON FOREIGN VIP FUND
Class 1 Fund Expenses
As an investor in a variable insurance contract (Contract) that indirectly provides for investment in an underlying mutual fund, you can incur transaction and/or ongoing expenses at both the Fund level and the Contract Level: (1) transaction expenses can include sales charges (loads) on purchases, surrender fees, transfer fees and premium taxes; and (2) ongoing expenses can include management fees, distribution and service(12b-1) fees, contract fees, annual maintenance fees, mortality and expense risk fees and other fees and expenses. All mutual funds and Contracts have some types of ongoing expenses. The table below shows Fund-level ongoing expenses and can help you understand these costs and compare them with those of other mutual funds offered through the Contract. The table assumes a $1,000 investment held for the six months indicated. Please refer to the Fund prospectus for additional information on operating expenses.
Actual Fund Expenses
The table below provides information about the actual account values and actual expenses in the columns under the heading “Actual.” In these columns the Fund’s actual return, which includes the effect of ongoing Fund expenses but does not include the effect of ongoing Contract expenses, is used to calculate the “Ending Account Value.” You can estimate the Fund-level expenses you paid during the period by following these steps (ofcourse, your account value and expenses will differ from those in this illustration):Divide your account value by $1,000 (ifyour account had an $8,600 value, then $8,600 ÷ $1,000 = 8.6). Then multiply the result by the number under the headings “Actual” and “Fund-Level Expenses Paid During Period” (ifFund-Level Expenses Paid During Period were $ 7.50, then 8.6x $ 7.50 = $64.50). In this illustration, the estimated expenses paid this period at the Fund level are $64.50.
Hypothetical Example for Comparison with Other Mutual Funds
Under the heading “Hypothetical” in the table, information is provided about hypothetical account values and hypothetical expenses based on the Fund’s actual expense ratio and an assumed rate of return of 5% per year before expenses, which is not the Fund’s actual return. This information may not be used to estimate the actual ending account balance or expenses you paid for the period, but it can help you compare ongoing costs of investing in the Fund with those of other mutual funds offered through the Contract. To do so, compare this 5% hypothetical example with the 5% hypothetical examples that appear in the shareholder reports of other funds offered through the Contract.
Please note that expenses shown in the table are meant to highlight ongoing costs at the Fund level only and do not reflect any ongoing expenses at the Contract level, or transaction expenses at either the Fund or Contract levels. In addition, while the Fund does not have transaction expenses, if the transaction and ongoing expenses at the Contract level were included, the expenses shown below would be higher. You should consult your Contract prospectus or disclosure document for more information.
| | | | | | | | | | | | | | | | | | | | | | | | | | | | |
| | | | | |
| | | | | | Actual (actual return after expenses) | | | | | | Hypothetical (5% annual return before expenses) | | | | |
| | | | | | | |
Share Class | | Beginning Account
Value 7/1/18 | | | Ending Account
Value 12/31/18 | | | Fund-Level Expenses
Paid During Period
7/1/18–12/31/181,2 | | | | | | Ending Account
Value 12/31/18 | | | Fund-Level Expenses
Paid During Period
7/1/18–12/31/181,2 | | | Net
Annualized
Expense
Ratio2 | |
Class 1 | | | $1,000 | | | | $880.80 | | | | $3.89 | | | | | | | | $1,021.07 | | | | $4.18 | | | | 0.82% | |
1. Expenses are equal to the annualized expense ratio for thesix-month period as indicated above—in the far right column—multiplied by the simple average account value over the period indicated, and then multiplied by 184/365 to reflect theone-half year period.
2. Reflects expenses after fee waivers and expense reimbursements. Does not include any ongoing expenses of the Contract for which the Fund is an investment option or acquired fund fees and expenses.
FRANKLIN TEMPLETON VARIABLE INSURANCE PRODUCTS TRUST
Financial Highlights
Templeton Foreign VIP Fund
| | | | | | | | | | | | | | | | | | | | |
| |
| | | Year Ended December 31, | |
| | | | | |
| | | 2018 | | | 2017 | | | 2016 | | | 2015 | | | 2014 | |
| Class 1 | | | | | | | | | | | | | | | | | | | | |
Per share operating performance (for a share outstanding throughout the year) | | | | | | | | | | | | | | | | | | | | |
| | | | | |
Net asset value, beginning of year | | | $15.80 | | | | $13.89 | | | | $13.46 | | | | $15.34 | | | | $17.56 | |
| | | | |
| | | | | |
Income from investment operationsa: | | | | | | | | | | | | | | | | | | | | |
| | | | | |
Net investment incomeb | | | 0.29 | | | | 0.30 | | | | 0.33 | | | | 0.31 | | | | 0.53 | c |
| | | | | | |
Net realized and unrealized gains (losses) | | | (2.64 | ) | | | 2.03 | | | | 0.62 | | | | (1.16 | ) | | | (2.39 | ) |
| | | | |
| | | | | |
Total from investment operations | | | (2.35 | ) | | | 2.33 | | | | 0.95 | | | | (0.85 | ) | | | (1.86 | ) |
| | | | |
| | | | | |
Less distributions from: | | | | | | | | | | | | | | | | | | | | |
| | | | | |
Net investment income | | | (0.44 | ) | | | (0.42 | ) | | | (0.29 | ) | | | (0.53 | ) | | | (0.36 | ) |
| | | | | |
Net realized gains | | | — | | | | — | | | | (0.23 | ) | | | (0.50 | ) | | | — | |
| | | | |
| | | | | |
Total distributions | | | (0.44 | ) | | | (0.42 | ) | | | (0.52 | ) | | | (1.03 | ) | | | (0.36 | ) |
| | | | |
| | | | | |
Redemption fees | | | — | | | | — | | | | — | | | | — | | | | — | d |
| | | | |
| | | | | |
Net asset value, end of year | | | $13.01 | | | | $15.80 | | | | $13.89 | | | | $13.46 | | | | $15.34 | |
| | | | |
| | | | | |
Total returne | | | (15.27)% | | | | 17.02% | | | | 7.49% | | | | (6.31)% | | | | (10.89)% | |
| | | | | |
| Ratios to average net assets | | | | | | | | | | | | | | | | | | | | |
| | | | | |
Expenses before waiver and payments by affiliates | | | 0.83% | | | | 0.82% | | | | 0.80% | | | | 0.78% | | | | 0.77% | |
| | | | | |
Expenses net of waiver and payments by affiliates | | | 0.81% | | | | 0.81% | f | | | 0.78% | | | | 0.78% | g | | | 0.77% | g |
| | | | | | |
Net investment income | | | 1.96% | | | | 1.99% | | | | 2.38% | | | | 2.05% | | | | 3.11% | c |
| | | | | | |
| Supplemental data | | | | | | | | | | | | | | | | | | | | |
| | | | | |
Net assets, end of year (000’s) | | | $114,784 | | | | $152,684 | | | | $133,218 | | | | $214,172 | | | | $248,355 | |
| | | | | |
Portfolio turnover rate | | | 21.38% | | | | 26.81% | | | | 20.93% | | | | 15.15% | | | | 25.71% | |
aThe amount shown for a share outstanding throughout the period may not correlate with the Statement of Operations for the period due to the timing of sales and repurchases of the Fund’s shares in relation to income earned and/or fluctuating fair value of the investments of the Fund.
bBased on average daily shares outstanding.
cNet investment income per share includes approximately $0.16 per share related to income received in the form of special dividends in connection with certain Fund holdings. Excluding this amount, the ratio of net investment income to average net assets would have been 2.13%.
dAmount rounds to less than $0.01 per share.
eTotal return does not include fees, charges or expenses imposed by the variable annuity and life insurance contracts for which Franklin Templeton Variable Insurance Products Trust serves as an underlying investment vehicle.
fBenefit of expense reduction rounds to less than 0.01%.
gBenefit of waiver and payments by affiliates rounds to less than 0.01%.
| | | | |
| | | |
| TF-6 | | Annual Report | The accompanying notes are an integral part of these financial statements. | | |
FRANKLIN TEMPLETON VARIABLE INSURANCE PRODUCTS TRUST
FINANCIAL HIGHLIGHTS
Templeton Foreign VIP Fund(continued)
| | | | | | | | | | | | | | | | | | | | |
| |
| | | Year Ended December 31, | |
| | | | | |
| | | 2018 | | | 2017 | | | 2016 | | | 2015 | | | 2014 | |
| Class 2 | | | | | | | | | | | | | | | | | | | | |
Per share operating performance (for a share outstanding throughout the year) | | | | | | | | | | | | | | | | | | | | |
| | | | | |
Net asset value, beginning of year | | | $15.47 | | | | $13.61 | | | | $13.20 | | | | $15.05 | | | | $17.24 | |
| | | | |
| | | | | |
Income from investment operationsa: | | | | | | | | | | | | | | | | | | | | |
| | | | | |
Net investment incomeb | | | 0.25 | | | | 0.26 | | | | 0.28 | | | | 0.27 | | | | 0.48 | c |
| | | | | | |
Net realized and unrealized gains (losses) | | | (2.58 | ) | | | 1.98 | | | | 0.62 | | | | (1.13 | ) | | | (2.35 | ) |
| | | | |
| | | | | |
Total from investment operations | | | (2.33 | ) | | | 2.24 | | | | 0.90 | | | | (0.86 | ) | | | (1.87 | ) |
| | | | |
| | | | | |
Less distributions from: | | | | | | | | | | | | | | | | | | | | |
| | | | | |
Net investment income | | | (0.40 | ) | | | (0.38 | ) | | | (0.26 | ) | | | (0.49 | ) | | | (0.32 | ) |
| | | | | |
Net realized gains | | | — | | | | — | | | | (0.23 | ) | | | (0.50 | ) | | | — | |
| | | | |
| | | | | |
Total distributions | | | (0.40 | ) | | | (0.38 | ) | | | (0.49 | ) | | | (0.99 | ) | | | (0.32 | ) |
| | | | |
| | | | | |
Redemption fees | | | — | | | | — | | | | — | | | | — | | | | — | d |
| | | | |
| | | | | |
Net asset value, end of year | | | $12.74 | | | | $15.47 | | | | $13.61 | | | | $13.20 | | | | $15.05 | |
| | | | |
| | | | | |
Total returne | | | (15.44)% | | | | 16.69% | | | | 7.18% | | | | (6.49)% | | | | (11.13)% | |
| | | | | |
| Ratios to average net assets | | | | | | | | | | | | | | | | | | | | |
| | | | | |
Expenses before waiver and payments by affiliates | | | 1.08% | | | | 1.07% | | | | 1.05% | | | | 1.03% | | | | 1.02% | |
| | | | | |
Expenses net of waiver and payments by affiliates | | | 1.06% | | | | 1.06% | f | | | 1.03% | | | | 1.03% | g | | | 1.02% | g |
| | | | | | |
Net investment income | | | 1.71% | | | | 1.74% | | | | 2.13% | | | | 1.80% | | | | 2.86% | c |
| | | | | | |
| Supplemental data | | | | | | | | | | | | | | | | | | | | |
| | | | | |
Net assets, end of year (000’s) | | | $1,060,101 | | | | $1,394,475 | | | | $1,436,518 | | | | $1,456,854 | | | | $1,645,571 | |
| | | | | |
Portfolio turnover rate | | | 21.38% | | | | 26.81% | | | | 20.93% | | | | 15.15% | | | | 25.71% | |
aThe amount shown for a share outstanding throughout the period may not correlate with the Statement of Operations for the period due to the timing of sales and repurchases of the Fund’s shares in relation to income earned and/or fluctuating fair value of the investments of the Fund.
bBased on average daily shares outstanding.
cNet investment income per share includes approximately $0.16 per share related to income received in the form of special dividends in connection with certain Fund holdings. Excluding this amount, the ratio of net investment income to average net assets would have been 1.88%.
dAmount rounds to less than $0.01 per share.
eTotal return does not include fees, charges or expenses imposed by the variable annuity and life insurance contracts for which Franklin Templeton Variable Insurance Products Trust serves as an underlying investment vehicle.
fBenefit of expense reduction rounds to less than 0.01%.
gBenefit of waiver and payments by affiliates rounds to less than 0.01%.
| | | | | | |
| | | |
| | The accompanying notes are an integral part of these financial statements. | Annual Report | | | TF-7 | |
FRANKLIN TEMPLETON VARIABLE INSURANCE PRODUCTS TRUST
FINANCIAL HIGHLIGHTS
Templeton Foreign VIP Fund(continued)
| | | | | | | | | | | | | | | | | | | | |
| |
| | | Year Ended December 31, | |
| | | | | |
| | | 2018 | | | 2017 | | | 2016 | | | 2015 | | | 2014 | |
| Class 4 | | | | | | | | | | | | | | | | | | | | |
Per share operating performance (for a share outstanding throughout the year) | | | | | | | | | | | | | | | | | | | | |
| | | | | |
Net asset value, beginning of year | | | $15.71 | | | | $13.71 | | | | $13.29 | | | | $15.16 | | | | $17.37 | |
| | | | | |
Income from investment operationsa: | | | | | | | | | | | | | | | | | | | | |
| | | | | |
Net investment incomeb | | | 0.24 | | | | 0.23 | | | | 0.26 | | | | 0.25 | | | | 0.46c | |
| | | | | |
Net realized and unrealized gains (losses) | | | (2.63 | ) | | | 2.03 | | | | 0.63 | | | | (1.14 | ) | | | (2.36 | ) |
| | | | | | | | | | | | | | | | | | | | |
| | | | | |
Total from investment operations | | | (2.39 | ) | | | 2.26 | | | | 0.89 | | | | (0.89 | ) | | | (1.90 | ) |
| | | | | | | | | | | | | | | | | | | | |
| | | | | |
Less distributions from: | | | | | | | | | | | | | | | | | | | | |
| | | | | |
Net investment income | | | (0.36 | ) | | | (0.26 | ) | | | (0.24 | ) | | | (0.48 | ) | | | (0.31 | ) |
| | | | | |
Net realized gains | | | — | | | | — | | | | (0.23 | ) | | | (0.50 | ) | | | — | |
| | | | | | | | | | | | | | | | | | | | |
| | | | | |
Total distributions | | | (0.36 | ) | | | (0.26 | ) | | | (0.47 | ) | | | (0.98 | ) | | | (0.31 | ) |
| | | | | | | | | | | | | | | | | | | | |
| | | | | |
Redemption fees | | | — | | | | — | | | | — | | | | — | | | | —d | |
| | | | | | | | | | | | | | | | | | | | |
| | | | | |
Net asset value, end of year | | | $12.96 | | | | $15.71 | | | | $13.71 | | | | $13.29 | | | | $15.16 | |
| | | | | | | | | | | | | | | | | | | | |
| | | | | |
Total returne | | | (15.54)% | | | | 16.62% | | | | 7.09% | | | | (6.65)% | | | | (11.22)% | |
| | | | | |
| Ratios to average net assets | | | | | | | | | | | | | | | | | | | | |
| | | | | |
Expenses before waiver and payments by affiliates | | | 1.18% | | | | 1.17% | | | | 1.15% | | | | 1.13% | | | | 1.12% | |
| | | | | |
Expenses net of waiver and payments by affiliates | | | 1.16% | | | | 1.16%f | | | | 1.13% | | | | 1.13%g | | | | 1.12%g | |
| | | | | |
Net investment income | | | 1.61% | | | | 1.64% | | | | 2.03% | | | | 1.70% | | | | 2.76%c | |
| | | | | |
| Supplemental data | | | | | | | | | | | | | | | | | | | | |
| | | | | |
Net assets, end of year (000’s) | | | $125,265 | | | | $159,944 | | | | $484,763 | | | | $472,189 | | | | $503,143 | |
| | | | | |
Portfolio turnover rate | | | 21.38% | | | | 26.81% | | | | 20.93% | | | | 15.15% | | | | 25.71% | |
aThe amount shown for a share outstanding throughout the period may not correlate with the Statement of Operations for the period due to the timing of sales and repurchases of the Fund’s shares in relation to income earned and/or fluctuating fair value of the investments of the Fund.
bBased on average daily shares outstanding.
cNet investment income per share includes approximately $0.16 per share related to income received in the form of special dividends in connection with certain Fund holdings. Excluding this amount, the ratio of net investment income to average net assets would have been 1.78%.
dAmount rounds to less than $0.01 per share.
eTotal return does not include fees, charges or expenses imposed by the variable annuity and life insurance contracts for which Franklin Templeton Variable Insurance Products Trust serves as an underlying investment vehicle.
fBenefit of expense reduction rounds to less than 0.01%.
gBenefit of waiver and payments by affiliates rounds to less than 0.01%.
| | | | |
| | | |
| TF-8 | | Annual Report | The accompanying notes are an integral part of these financial statements. | | |
FRANKLIN TEMPLETON VARIABLE INSURANCE PRODUCTS TRUST
Statement of Investments, December 31, 2018
Templeton Foreign VIP Fund
| | | | | | | | | | | | | | |
| | | | |
| | | | | Country | | | Shares | | | Value | |
| | | Common Stocks 95.7% | | | | | | | | | |
| | | Aerospace & Defense 1.3% | | | | | | | | | |
| | BAE Systems PLC | | | United Kingdom | | | | 1,854,352 | | | $ | 10,858,988 | |
a | | Cobham PLC | | | United Kingdom | | | | 5,307,199 | | | | 6,613,695 | |
| | | | | | | | | | | | | | |
| | | | | | | | | | | | | 17,472,683 | |
| | | | | | | | | | | | | | |
| | | Auto Components 1.2% | | | | | | | | | |
| | Cie Generale des Etablissements Michelin SCA | | | France | | | | 67,168 | | | | 6,672,526 | |
| | Sumitomo Rubber Industries Ltd. | | | Japan | | | | 712,200 | | | | 8,447,628 | |
| | | | | | | | | | | | | | |
| | | | | | | | | | | | | 15,120,154 | |
| | | | | | | | | | | | | | |
| | | Automobiles 0.5% | | | | | | | | | |
| | Hero Motocorp Ltd. | | | India | | | | 154,059 | | | | 6,874,194 | |
| | | | | | | | | | | | | | |
| | | Banks 15.7% | | | | | | | | | |
| | Bangkok Bank PCL, fgn | | | Thailand | | | | 3,144,600 | | | | 20,127,774 | |
| | Bank of Ireland Group PLC | | | Ireland | | | | 2,346,131 | | | | 13,054,472 | |
| | Barclays PLC | | | United Kingdom | | | | 8,453,430 | | | | 16,226,411 | |
| | BNP Paribas SA | | | France | | | | 584,794 | | | | 26,450,498 | |
| | Hana Financial Group Inc. | | | South Korea | | | | 494,927 | | | | 16,109,314 | |
| | HSBC Holdings PLC | | | United Kingdom | | | | 3,012,800 | | | | 24,931,925 | |
| | ING Groep NV | | | Netherlands | | | | 1,966,362 | | | | 21,201,271 | |
| | Kasikornbank PCL, fgn | | | Thailand | | | | 1,860,000 | | | | 10,611,317 | |
| | KB Financial Group Inc., ADR | | | South Korea | | | | 437,706 | | | | 18,374,898 | |
| | Standard Chartered PLC | | | United Kingdom | | | | 4,786,838 | | | | 37,194,200 | |
| | | | | | | | | | | | | | |
| | | | | | | | | | | | | 204,282,080 | |
| | | | | | | | | | | | | | |
| | | Beverages 1.3% | | | | | | | | | |
| | Suntory Beverage & Food Ltd. | | | Japan | | | | 363,800 | | | | 16,463,942 | |
| | | | | | | | | | | | | | |
| | Biotechnology 1.4% | | | | | | | | | | | | |
| | Shire PLC | | | United Kingdom | | | | 318,110 | | | | 18,539,108 | |
| | | | | | | | | | | | | | |
| | | Capital Markets 1.3% | | | | | | | | | |
| | UBS Group AG | | | Switzerland | | | | 1,326,231 | | | | 16,550,804 | |
| | | | | | | | | | | | | | |
| | | Chemicals 1.9% | | | | | | | | | |
| | Johnson Matthey PLC | | | United Kingdom | | | | 494,842 | | | | 17,663,012 | |
| | Lotte Chemical Corp. | | | South Korea | | | | 29,003 | | | | 7,213,575 | |
| | | | | | | | | | | | | | |
| | | | | | | | | | | | | 24,876,587 | |
| | | | | | | | | | | | | | |
| | | Construction & Engineering 1.1% | | | | | | | | | |
| | Sinopec Engineering Group Co. Ltd. | | | China | | | | 17,492,000 | | | | 14,363,522 | |
| | | | | | | | | | | | | | |
| | | Construction Materials 1.7% | | | | | | | | | |
| | CRH PLC | | | Ireland | | | | 294,271 | | | | 7,794,639 | |
| | Taiheiyo Cement Corp. | | | Japan | | | | 452,700 | | | | 14,022,961 | |
| | | | | | | | | | | | | | |
| | | | | | | | | | | | | 21,817,600 | |
| | | | | | | | | | | | | | |
| | | Diversified Telecommunication Services 4.5% | | | | | | | | | |
| | China Telecom Corp. Ltd., H | | | China | | | | 50,418,357 | | | | 25,754,859 | |
| | Singapore Telecommunications Ltd. | | | Singapore | | | | 8,893,300 | | | | 19,116,958 | |
| | Telefonica Deutschland Holding AG | | | Germany | | | | 3,443,999 | | | | 13,555,892 | |
| | | | | | | | | | | | | | |
| | | | | | | | | | | | | 58,427,709 | |
| | | | | | | | | | | | | | |
| | | Electric Utilities 0.6% | | | | | | | | | |
| | Korea Electric Power Corp. | | | South Korea | | | | 267,802 | | | | 7,959,205 | |
| | | | | | | | | | | | | | |
| | | Electrical Equipment 1.0% | | | | | | | | | |
| | Vestas Wind Systems AS | | | Denmark | | | | 169,868 | | | | 12,859,164 | |
| | | | | | | | | | | | | | |
FRANKLIN TEMPLETON VARIABLE INSURANCE PRODUCTS TRUST
STATEMENT OF INVESTMENTS
Templeton Foreign VIP Fund(continued)
| | | | | | | | | | | | | | |
| | | | |
| | | | | Country | | | Shares | | | Value | |
| | | Common Stocks(continued) | | | | | | | | | |
| | | Electronic Equipment, Instruments & Components 0.5% | | | | | | | | | |
b | | Landis+Gyr Group AG | | | Switzerland | | | | 120,834 | | | $ | 6,812,859 | |
| | | | | | | | | | | | | | |
| | | Energy Equipment & Services 1.3% | | | | | | | | | |
| | SBM Offshore NV | | | Netherlands | | | | 1,147,815 | | | | 16,998,525 | |
| | | | | | | | | | | | | | |
| | | Entertainment 0.9% | | | | | | | | | |
| | NetEase Inc., ADR | | | China | | | | 48,100 | | | | 11,321,297 | |
| | | | | | | | | | | | | | |
| | | Food & Staples Retailing 1.1% | | | | | | | | | |
| | Seven & i Holdings Co. Ltd. | | | Japan | | | | 332,500 | | | | 14,510,470 | |
| | | | | | | | | | | | | | |
| | | Food Products 0.7% | | | | | | | | | |
| | Ezaki Glico Co. Ltd. | | | Japan | | | | 177,800 | | | | 9,052,226 | |
| | | | | | | | | | | | | | |
| | | Health Care Equipment & Supplies 1.1% | | | | | | | | | |
| | Getinge AB, B | | | Sweden | | | | 651,040 | | | | 5,889,276 | |
| | Shandong Weigao Group Medical Polymer Co. Ltd., H | | | China | | | | 9,924,000 | | | | 8,035,012 | |
| | | | | | | | | | | | | | |
| | | | | | | | | | | | | 13,924,288 | |
| | | | | | | | | | | | | | |
| | | Health Care Providers & Services 1.7% | | | | | | | | | |
| | Shanghai Pharmaceuticals Holding Co. Ltd., H | | | China | | | | 5,083,800 | | | | 10,335,751 | |
| | Sinopharm Group Co. Ltd., H | | | China | | | | 2,794,800 | | | | 11,742,407 | |
| | | | | | | | | | | | | | |
| | | | | | | | | | | | | 22,078,158 | |
| | | | | | | | | | | | | | |
| | | Household Durables 1.2% | | | | | | | | | |
| | Panasonic Corp. | | | Japan | | | | 1,770,700 | | | | 16,004,155 | |
| | | | | | | | | | | | | | |
| | | Industrial Conglomerates 2.8% | | | | | | | | | |
| | CK Hutchison Holdings Ltd. | | | Hong Kong | | | | 2,353,000 | | | | 22,596,973 | |
| | Siemens AG | | | Germany | | | | 122,182 | | | | 13,636,300 | |
| | | | | | | | | | | | | | |
| | | | | | | | | | | | | 36,233,273 | |
| | | | | | | | | | | | | | |
| | | Insurance 2.6% | | | | | | | | | |
| | AXA SA | | | France | | | | 722,428 | | | | 15,609,860 | |
| | China Life Insurance Co. Ltd., H | | | China | | | | 8,349,000 | | | | 17,741,825 | |
| | | | | | | | | | | | | | |
| | | | | | | | | | | | | 33,351,685 | |
| | | | | | | | | | | | | | |
| | | Interactive Media & Services 1.7% | | | | | | | | | |
a | | Baidu Inc., ADR | | | China | | | | 138,230 | | | | 21,923,278 | |
| | | | | | | | | | | | | | |
| | | Life Sciences Tools & Services 0.9% | | | | | | | | | |
a | | QIAGEN NV | | | Netherlands | | | | 327,298 | | | | 11,184,507 | |
| | | | | | | | | | | | | | |
| | | Marine 0.5% | | | | | | | | | |
| | A.P. Moeller-Maersk AS, B | | | Denmark | | | | 5,208 | | | | 6,551,506 | |
| | | | | | | | | | | | | | |
| | | Media 1.7% | | | | | | | | | |
| | SES SA, IDR | | | Luxembourg | | | | 1,156,272 | | | | 22,138,350 | |
| | | | | | | | | | | | | | |
| | | Metals & Mining 4.4% | | | | | | | | | |
| | Alamos Gold Inc., A | | | Canada | | | | 3,063,752 | | | | 11,029,507 | |
| | Barrick Gold Corp. | | | Canada | | | | 843,220 | | | | 11,417,199 | |
| | Sumitomo Metal Mining Co. Ltd. | | | Japan | | | | 240,100 | | | | 6,457,069 | |
| | Wheaton Precious Metals Corp. | | | Canada | | | | 1,450,800 | | | | 28,326,180 | |
| | | | | | | | | | | | | | |
| | | | | | | | | | | | | 57,229,955 | |
| | | | | | | | | | | | | | |
| | | Multi-Utilities 2.2% | | | | | | | | | |
| | E.ON SE | | | Germany | | | | 1,516,092 | | | | 14,966,479 | |
| | Veolia Environnement SA | | | France | | | | 671,188 | | | | 13,808,242 | |
| | | | | | | | | | | | | | |
| | | | | | | | | | | | | 28,774,721 | |
| | | | | | | | | | | | | | |
FRANKLIN TEMPLETON VARIABLE INSURANCE PRODUCTS TRUST
STATEMENT OF INVESTMENTS
Templeton Foreign VIP Fund(continued)
| | | | | | | | | | | | | | |
| | | | |
| | | | | Country | | | Shares | | | Value | |
| | | Common Stocks (continued) | | | | | | | | | |
| | | Oil, Gas & Consumable Fuels 11.2% | | | | | | | | | |
| | BP PLC | | | United Kingdom | | | | 6,554,082 | | | $ | 41,451,961 | |
| | Cenovus Energy Inc. | | | Canada | | | | 1,082,702 | | | | 7,614,886 | |
| | Eni SpA | | | Italy | | | | 1,507,144 | | | | 23,809,692 | |
| | Husky Energy Inc. | | | Canada | | | | 1,163,600 | | | | 12,028,569 | |
| | Kunlun Energy Co. Ltd. | | | China | | | | 6,034,600 | | | | 6,396,422 | |
| | Royal Dutch Shell PLC, A | | | United Kingdom | | | | 16,803 | | | | 494,452 | |
| | Royal Dutch Shell PLC, B | | | United Kingdom | | | | 1,253,971 | | | | 37,419,559 | |
| | Total SA | | | France | | | | 306,006 | | | | 16,191,708 | |
| | | | | | | | | | | | | | |
| | | | | | | | | | | | | 145,407,249 | |
| | | | | | | | | | | | | | |
| | | Pharmaceuticals 12.4% | | | | | | | | | |
| | Astellas Pharma Inc. | | | Japan | | | | 1,323,300 | | | | 16,921,578 | |
| | Bayer AG | | | Germany | | | | 215,217 | | | | 14,968,732 | |
| | Merck KGaA | | | Germany | | | | 151,830 | | | | 15,628,926 | |
| | Novartis AG | | | Switzerland | | | | 128,920 | | | | 11,047,803 | |
| | Roche Holding AG | | | Switzerland | | | | 143,560 | | | | 35,661,776 | |
| | Sanofi | | | France | | | | 370,668 | | | | 32,133,663 | |
b | | Takeda Pharmaceutical Co. Ltd. | | | Japan | | | | 298,300 | | | | 10,083,955 | |
a | | Teva Pharmaceutical Industries Ltd., ADR | | | Israel | | | | 1,610,544 | | | | 24,834,588 | |
| | | | | | | | | | | | | | |
| | | | | | | | | | | | | 161,281,021 | |
| | | | | | | | | | | | | | |
| | | Real Estate Management & Development 0.7% | | | | | | | | | |
| | Mitsui Fudosan Co. Ltd. | | | Japan | | | | 396,100 | | | | 8,836,355 | |
| | | | | | | | | | | | | | |
| | | Semiconductors & Semiconductor Equipment 3.6% | | | | | | | | | |
| | Infineon Technologies AG | | | Germany | | | | 590,665 | | | | 11,826,616 | |
| | NXP Semiconductors NV | | | Netherlands | | | | 221,300 | | | | 16,216,864 | |
| | Taiwan Semiconductor Manufacturing Co. Ltd. | | | Taiwan | | | | 2,587,000 | | | | 19,066,199 | |
| | | | | | | | | | | | | | |
| | | | | | | | | | | | | 47,109,679 | |
| | | | | | | | | | | | | | |
| | | Specialty Retail 1.1% | | | | | | | | | |
| | Kingfisher PLC | | | United Kingdom | | | | 5,347,092 | | | | 14,149,175 | |
| | | | | | | | | | | | | | |
| | | Technology Hardware, Storage & Peripherals 4.7% | | | | | | | | | |
| | Quanta Computer Inc. | | | Taiwan | | | | 5,640,000 | | | | 9,714,286 | |
| | Samsung Electronics Co. Ltd. | | | South Korea | | | | 1,488,008 | | | | 51,706,377 | |
| | | | | | | | | | | | | | |
| | | | | | | | | | | | | 61,420,663 | |
| | | | | | | | | | | | | | |
| | | Trading Companies & Distributors 0.9% | | | | | | | | | |
| | Travis Perkins PLC | | | United Kingdom | | | | 856,731 | | | | 11,690,244 | |
| | | | | | | | | | | | | | |
| | | Wireless Telecommunication Services 2.3% | | | | | | | | | |
| | China Mobile Ltd. | | | China | | | | 1,821,000 | | | | 17,522,808 | |
| | Vodafone Group PLC, ADR | | | United Kingdom | | | | 661,603 | | | | 12,755,706 | |
| | | | | | | | | | | | | | |
| | | | | | | | | | | | | 30,278,514 | |
| | | | | | | | | | | | | | |
| | | | |
| | Total Common Stocks (Cost $1,244,449,109) | | | | | | | | | | | 1,243,868,905 | |
| | | | | | | | | | | | | | |
| | | | |
| | Short Term Investments 4.8% | | | | | | | | | | | | |
| | | Money Market Funds (Cost $49,866,794) 3.8% | | | | | | | | | |
c,d | | Institutional Fiduciary Trust Money Market Portfolio, 1.99% | | | United States | | | | 49,866,794 | | | | 49,866,794 | |
| | | | | | | | | | | | | | |
FRANKLIN TEMPLETON VARIABLE INSURANCE PRODUCTS TRUST
STATEMENT OF INVESTMENTS
Templeton Foreign VIP Fund(continued)
| | | | | | | | | | | | | | |
| | | | |
| | | | | Country | | | Shares | | | Value | |
| | | Short Term Investments(continued) | | | | | | | | | |
| e | | Investments from Cash Collateral Received for Loaned Securities (Cost $13,003,937) 1.0% | | | | | | | |
| | | Money Market Funds 1.0% | | | | | | | | | |
c,d | | Institutional Fiduciary Trust Money Market Portfolio, 1.99% | | | United States | | | | 13,003,937 | | | $ | 13,003,937 | |
| | | | | | | | | | | | | | |
| | | | |
| | Total Investments (Cost $1,307,319,840) 100.5% | | | | | | | | | | | 1,306,739,636 | |
| | Other Assets, less Liabilities (0.5)% | | | | | | | | | | | (6,589,831 | ) |
| | | | | | | | | | | | | | |
| | Net Assets 100.0% | | | | | | | | | | $ | 1,300,149,805 | |
| | | | | | | | | | | | | | |
See Abbreviations on pageTF-23.
aNon-income producing.
bA portion or all of the security is on loan at December 31, 2018. See Note 1(c).
cSee Note 3(e) regarding investments in affiliated management investment companies.
dThe rate shown is the annualizedseven-day effective yield at period end.
eSee Note 1(c) regarding securities on loan.
| | | | |
| | |
| TF-12 | | Annual Report | The accompanying notes are an integral part of these financial statements. |
FRANKLIN TEMPLETON VARIABLE INSURANCE PRODUCTS TRUST
Financial Statements
Statement of Assets and Liabilities
December 31, 2018
| | | | |
| |
| | | Templeton Foreign VIP Fund | |
Assets: | | | | |
Investments in securities: | | | | |
Cost - Unaffiliated issuers | | $ | 1,244,449,109 | |
Cost -Non-controlled affiliates (Note 3e) | | | 62,870,731 | |
| | | | |
Value - Unaffiliated issuers+ | | $ | 1,243,868,905 | |
Value -Non-controlled affiliates (Note 3e) | | | 62,870,731 | |
Receivables: | | | | |
Investment securities sold | | | 462,026 | |
Capital shares sold | | | 393,781 | |
Dividends. | | | 7,583,556 | |
European Union tax reclaims | | | 197,514 | |
Due from custodian | | | 15,554 | |
Other assets | | | 198 | |
| | | | |
Total assets | | | 1,315,392,265 | |
| | | | |
Liabilities: | | | | |
Payables: | | | | |
Capital shares redeemed | | | 419,063 | |
Management fees | | | 883,600 | |
Distribution fees | | | 539,223 | |
Payable upon return of securities loaned | | | 13,019,491 | |
Accrued expenses and other liabilities | | | 381,083 | |
| | | | |
Total liabilities | | | 15,242,460 | |
| | | | |
Net assets, at value | | $ | 1,300,149,805 | |
| | | | |
Net assets consist of: | | | | |
Paid-in capital | | $ | 1,267,740,757 | |
Total distributable earnings (loss) | | | 32,409,048 | |
| | | | |
Net assets, at value | | $ | 1,300,149,805 | |
| | | | |
| |
| Class 1: | | | | |
Net assets, at value | | $ | 114,783,691 | |
| | | | |
Shares outstanding | | | 8,823,300 | |
| | | | |
Net asset value and maximum offering price per share | | $ | 13.01 | |
| | | | |
| |
| Class 2: | | | | |
Net assets, at value | | $ | 1,060,101,111 | |
| | | | |
Shares outstanding | | | 83,220,336 | |
| | | | |
Net asset value and maximum offering price per share | | $ | 12.74 | |
| | | | |
| |
| Class 4: | | | | |
Net assets, at value | | $ | 125,265,003 | |
| | | | |
Shares outstanding | | | 9,666,081 | |
| | | | |
Net asset value and maximum offering price per share | | $ | 12.96 | |
| | | | |
| | | | |
| |
+Includes securities loaned | | $ | 12,482,451 | |
| | | | | | |
| | | |
| | The accompanying notes are an integral part of these financial statements. | Annual Report | | | TF-13 | |
FRANKLIN TEMPLETON VARIABLE INSURANCE PRODUCTS TRUST
FINANCIAL STATEMENTS
Statement of Operations
for the year ended December 31, 2018
| | | | |
| |
| | | Templeton Foreign VIP Fund | |
Investment income: | | | | |
Dividends: (net of foreign taxes)* | | | | |
Unaffiliated issuers | | $ | 41,948,958 | |
Non-controlled affiliates (Note 3e) | | | 734,954 | |
Interest: | | | | |
Unaffiliated issuers | | | 794 | |
Income from securities loaned: | | | | |
Unaffiliated issuers (net of fees and rebates) | | | 260,475 | |
Non-controlled affiliates (Note 3e) | | | 86,463 | |
| | | | |
Total investment income | | | 43,031,644 | |
| | | | |
Expenses: | | | | |
Management fees (Note 3a) | | | 12,166,862 | |
Distribution fees: (Note 3c) | | | | |
Class 2 | | | 3,154,607 | |
Class 4 | | | 522,991 | |
Custodian fees (Note 4) | | | 170,899 | |
Reports to shareholders | | | 297,645 | |
Professional fees | | | 121,164 | |
Trustees’ fees and expenses | | | 11,468 | |
Other | | | 77,565 | |
| | | | |
Total expenses | | | 16,523,201 | |
Expenses waived/paid by affiliates (Note 3e) | | | (231,514 | ) |
| | | | |
Net expenses | | | 16,291,687 | |
| | | | |
Net investment income | | | 26,739,957 | |
| | | | |
Realized and unrealized gains (losses): | | | | |
Net realized gain (loss) from: | | | | |
Investments: | | | | |
Unaffiliated issuers | | | 98,272,702 | |
Foreign currency transactions | | | (503,966 | ) |
| | | | |
Net realized gain (loss) | | | 97,768,736 | |
| | | | |
Net change in unrealized appreciation (depreciation) on: | | | | |
Investments: | | | | |
Unaffiliated issuers | | | (367,715,204 | ) |
Translation of other assets and liabilities denominated in foreign currencies | | | (209,138 | ) |
| | | | |
Net change in unrealized appreciation (depreciation) | | | (367,924,342 | ) |
| | | | |
Net realized and unrealized gain (loss) | | | (270,155,606 | ) |
| | | | |
Net increase (decrease) in net assets resulting from operations | | $ | (243,415,649 | ) |
| | | | |
| | | | |
| |
*Foreign taxes withheld on dividends | | $ | 4,078,798 | |
| | | | |
| | | |
| TF-14 | | Annual Report | The accompanying notes are an integral part of these financial statements. | | |
FRANKLIN TEMPLETON VARIABLE INSURANCE PRODUCTS TRUST
FINANCIAL STATEMENTS
| | | | | | | | |
Statements of Changes in Net Assets | | | | | | |
| |
| | | Templeton Foreign VIP Fund | |
| |
| | | Year Ended December 31, | |
| | |
| | | 2018 | | | 2017 | |
Increase (decrease) in net assets: | | | | | | | | |
Operations: | | | | | | | | |
Net investment income | | $ | 26,739,957 | | | $ | 31,019,303 | |
Net realized gain (loss) | | | 97,768,736 | | | | (10,184,192 | ) |
Net change in unrealized appreciation (depreciation) | | | (367,924,342 | ) | | | 263,520,898 | |
| | | | | | | | |
Net increase (decrease) in net assets resulting from operations | | | (243,415,649 | ) | | | 284,356,009 | |
| | | | | | | | |
Distributions to shareholders: (Note 1e) | | | | | | | | |
Class 1 | | | (3,961,619 | ) | | | (3,928,195 | ) |
Class 2 | | | (33,465,356 | ) | | | (35,708,156 | ) |
Class 4 | | | (3,521,973 | ) | | | (2,623,801 | ) |
| | | | | | | | |
Total distributions to shareholders | | | (40,948,948 | ) | | | (42,260,152 | ) |
| | | | | | | | |
Capital share transactions: (Note 2) | | | | | | | | |
Class 1 | | | (12,722,479 | ) | | | 1,154,617 | |
Class 2 | | | (102,793,664 | ) | | | (225,298,981 | ) |
Class 4 | | | (7,072,417 | ) | �� | | (365,347,762 | ) |
| | | | | | | | |
Total capital share transactions | | | (122,588,560 | ) | | | (589,492,126 | ) |
| | | | | | | | |
Net increase (decrease) in net assets | | | (406,953,157 | ) | | | (347,396,269 | ) |
Net assets: | | | | | | | | |
Beginning of year | | | 1,707,102,962 | | | | 2,054,499,231 | |
| | | | | | | | |
End of year (Note 1e) | | $ | 1,300,149,805 | | | $ | 1,707,102,962 | |
| | | | | | | | |
| | | | | | |
| | | |
| | The accompanying notes are an integral part of these financial statements. | Annual Report | | | TF-15 | |
FRANKLIN TEMPLETON VARIABLE INSURANCE PRODUCTS TRUST
Notes to Financial Statements
Templeton Foreign VIP Fund
1. Organization and Significant Accounting Policies
Franklin Templeton Variable Insurance Products Trust (Trust) is registered under the Investment Company Act of 1940 (1940 Act) as anopen-end management investment company, consisting of eighteen separate funds and applies the specialized accounting and reporting guidance in U.S. Generally Accepted Accounting Principles (U.S. GAAP). Templeton Foreign VIP Fund (Fund) is included in this report. Shares of the Fund are generally sold only to insurance company separate accounts to fund the benefits of variable life insurance policies or variable annuity contracts. The Fund offers three classes of shares: Class 1, Class 2, and Class 4. Each class of shares may differ by its distribution fees, voting rights on matters affecting a single class and its exchange privilege.
The following summarizes the Fund’s significant accounting policies.
a. Financial Instrument Valuation
The Fund’s investments in financial instruments are carried at fair value daily. Fair value is the price that would be received to sell an asset or paid to transfer a liability in an orderly transaction between market participants on the measurement date. The Fund calculates the net asset value (NAV) per share each business day as of 4 p.m. Eastern time or the regularly scheduled close of the New York Stock Exchange (NYSE), whichever is earlier. Under compliance policies and procedures approved by the Trust’s Board of Trustees (the Board), the Fund’s administrator has responsibility for oversight of valuation, including leading the cross-functional Valuation Committee (VC). The Fund may utilize independent pricing services, quotations from securities and financial instrument dealers, and other market sources to determine fair value.
Equity securities listed on an exchange or on the NASDAQ National Market System are valued at the last quoted sale price or the official closing price of the day, respectively. Foreign equity securities are valued as of the close of trading on the foreign stock exchange on which the security is primarily traded, or as of 4 p.m. Eastern time. The value is then converted into its U.S. dollar equivalent at the foreign exchange rate in effect at 4 p.m. Eastern time on the day that the value of the security is determined.Over-the-counter (OTC) securities are valued within the range of the most recent quoted bid and ask prices. Securities that trade in multiple markets or on multiple
exchanges are valued according to the broadest and most representative market. Certain equity securities are valued based upon fundamental characteristics or relationships to similar securities.
Investments inopen-end mutual funds are valued at the closing NAV.
The Fund has procedures to determine the fair value of financial instruments for which market prices are not reliable or readily available. Under these procedures, the Fund primarily employs a market-based approach which may use related or comparable assets or liabilities, recent transactions, market multiples, book values, and other relevant information for the investment to determine the fair value of the investment. An income-based valuation approach may also be used in which the anticipated future cash flows of the investment are discounted to calculate fair value. Discounts may also be applied due to the nature or duration of any restrictions on the disposition of the investments. Due to the inherent uncertainty of valuations of such investments, the fair values may differ significantly from the values that would have been used had an active market existed.
Trading in securities on foreign securities stock exchanges and OTC markets may be completed before 4 p.m. Eastern time. In addition, trading in certain foreign markets may not take place on every Fund’s business day. Occasionally, events occur between the time at which trading in a foreign security is completed and 4 p.m. Eastern time that might call into question the reliability of the value of a portfolio security held by the Fund. As a result, differences may arise between the value of the Fund’s portfolio securities as determined at the foreign market close and the latest indications of value at 4 p.m. Eastern time. In order to minimize the potential for these differences, the VC monitors price movements following the close of trading in foreign stock markets through a series of country specific market proxies (such as baskets of American Depositary Receipts, futures contracts and exchange traded funds). These price movements are measured against established trigger thresholds for each specific market proxy to assist in determining if an event has occurred that may call into question the reliability of the values of the foreign securities held by the Fund. If such an event occurs, the securities may be valued using fair value procedures, which may include the use of independent pricing services. At December 31, 2018, a market event occurred resulting in a portion of the securities held by the Fund being valued using fair value procedures.
FRANKLIN TEMPLETON VARIABLE INSURANCE PRODUCTS TRUST
NOTES TO FINANCIAL STATEMENTS
Templeton Foreign VIP Fund(continued)
When the last day of the reporting period is anon-business day, certain foreign markets may be open on those days that the Fund’s NAV is not calculated, which could result in differences between the value of the Fund’s portfolio securities on the last business day and the last calendar day of the reporting period. Any significant security valuation changes due to an open foreign market are adjusted and reflected by the Fund for financial reporting purposes.
b. Foreign Currency Translation
Portfolio securities and other assets and liabilities denominated in foreign currencies are translated into U.S. dollars based on the exchange rate of such currencies against U.S. dollars on the date of valuation. The Fund may enter into foreign currency exchange contracts to facilitate transactions denominated in a foreign currency. Purchases and sales of securities, income and expense items denominated in foreign currencies are translated into U.S. dollars at the exchange rate in effect on the transaction date. Portfolio securities and assets and liabilities denominated in foreign currencies contain risks that those currencies will decline in value relative to the U.S. dollar. Occasionally, events may impact the availability or reliability of foreign exchange rates used to convert the U.S. dollar equivalent value. If such an event occurs, the foreign exchange rate will be valued at fair value using procedures established and approved by the Board.
The Fund does not separately report the effect of changes in foreign exchange rates from changes in market prices on securities held. Such changes are included in net realized and unrealized gain or loss from investments in the Statement of Operations.
Realized foreign exchange gains or losses arise from sales of foreign currencies, currency gains or losses realized between the trade and settlement dates on securities transactions and the difference between the recorded amounts of dividends, interest, and foreign withholding taxes and the U.S. dollar equivalent of the amounts actually received or paid. Net unrealized foreign exchange gains and losses arise from changes in foreign exchange rates on foreign denominated assets and liabilities other than investments in securities held at the end of the reporting period.
c. Securities Lending
The Fund participates in an agency based securities lending program to earn additional income. The Fund receives cash collateral against the loaned securities in an amount equal to at
least 102% of the fair value of the loaned securities. Collateral is maintained over the life of the loan in an amount not less than 100% of the fair value of loaned securities, as determined at the close of Fund business each day; any additional collateral required due to changes in security values is delivered to the Fund on the next business day. The collateral is deposited into a joint cash account with other funds and is used to invest in a money market fund managed by Franklin Advisers, Inc., an affiliate of the Fund. The Fund may receive income from the investment of cash collateral, in addition to lending fees and rebates paid by the borrower. Income from securities loaned, net of fees paid to the securities lending agent and/or third-party vendor, is reported separately in the Statement of Operations. The Fund bears the market risk with respect to the collateral investment, securities loaned, and the risk that the agent may default on its obligations to the Fund. If the borrower defaults on its obligation to return the securities loaned, the Fund has the right to repurchase the securities in the open market using the collateral received. The securities lending agent has agreed to indemnify the Fund in the event of default by a third party borrower.
d. Income and Deferred Taxes
It is the Fund’s policy to qualify as a regulated investment company under the Internal Revenue Code. The Fund intends to distribute to shareholders substantially all of its taxable income and net realized gains to relieve it from federal income and if applicable, excise taxes. As a result, no provision for U.S. federal income taxes is required.
The Fund may be subject to foreign taxation related to income received, capital gains on the sale of securities and certain foreign currency transactions in the foreign jurisdictions in which it invests. Foreign taxes, if any, are recorded based on the tax regulations and rates that exist in the foreign markets in which the Fund invests. When a capital gain tax is determined to apply, the Fund records an estimated deferred tax liability in an amount that would be payable if the securities were disposed of on the valuation date.
As a result of several court cases, in certain countries across the European Union, the Fund filed additional tax reclaims for previously withheld taxes on dividends earned in those countries (EU reclaims). These additional filings are subject to various administrative proceedings by the local jurisdictions’ tax authorities within the European Union, as well as a number of related judicial proceedings. Income recognized, if any, for
FRANKLIN TEMPLETON VARIABLE INSURANCE PRODUCTS TRUST
NOTES TO FINANCIAL STATEMENTS
Templeton Foreign VIP Fund(continued)
1. Organization and Significant Accounting Policies(continued)
d. Income and Deferred Taxes(continued)
EU reclaims is reflected as other income in the Statement of Operations and any related receivable, if any, is reflected as European Union tax reclaims in the Statement of Assets and Liabilities. When uncertainty exists as to the ultimate resolution of these proceedings, the likelihood of receipt of these EU reclaims, and the potential timing of payment, no amounts are reflected in the financial statements. For U.S. income tax purposes, when EU reclaims are received by the Fund and the Fund previously passed foreign tax credit on to its shareholders, the Fund must either amend historic tax reporting to shareholders or enter into a closing agreement with the Internal Revenue Service (IRS) in order to pay the associated tax liability on behalf of the Fund’s shareholders.
The Fund may recognize an income tax liability related to its uncertain tax positions under U.S. GAAP when the uncertain tax position has a less than 50% probability that it will be sustained upon examination by the tax authorities based on its technical merits. As of December 31, 2018, the Fund has determined that no tax liability is required in its financial statements related to uncertain tax positions for any open tax years (or expected to be taken in future tax years). Open tax years are those that remain subject to examination and are based on the statute of limitations in each jurisdiction in which the Fund invests.
e. Security Transactions, Investment Income, Expenses and Distributions
Security transactions are accounted for on trade date. Realized gains and losses on security transactions are determined on a specific identification basis. Interest income and estimated expenses are accrued daily. Dividend income is recorded on theex-dividend date except for certain dividends from securities where the dividend rate is not available. In such cases, the dividend is recorded as soon as the information is received by the Fund. Distributions to shareholders are recorded on theex-dividend date. Distributable earnings are determined
according to income tax regulations (tax basis) and may differ from earnings recorded in accordance with U.S. GAAP. These differences may be permanent or temporary. Permanent
differences are reclassified among capital accounts to reflect their tax character. These reclassifications have no impact on net assets or the results of operations. Temporary differences are not reclassified, as they may reverse in subsequent periods.*
Common expenses incurred by the Trust are allocated among the Funds based on the ratio of net assets of each Fund to the combined net assets of the Trust or based on the ratio of number of shareholders of each Fund to the combined number of shareholders of the Trust. Fund specific expenses are charged directly to the Fund that incurred the expense.
Realized and unrealized gains and losses and net investment income, excluding class specific expenses, are allocated daily to each class of shares based upon the relative proportion of net assets of each class. Differences in per share distributions by class are generally due to differences in class specific expenses.
f. Accounting Estimates
The preparation of financial statements in accordance with U.S. GAAP requires management to make estimates and assumptions that affect the reported amounts of assets and liabilities at the date of the financial statements and the amounts of income and expenses during the reporting period. Actual results could differ from those estimates.
g. Guarantees and Indemnifications
Under the Trust’s organizational documents, its officers and trustees are indemnified by the Trust against certain liabilities arising out of the performance of their duties to the Trust. Additionally, in the normal course of business, the Trust, on behalf of the Fund, enters into contracts with service providers that contain general indemnification clauses. The Trust’s maximum exposure under these arrangements is unknown as this would involve future claims that may be made against the Trust that have not yet occurred. Currently, the Trust expects the risk of loss to be remote.
*Effective during the current reporting period, it is no longer required to present certain line items in the Statements of Changes in Net Assets. The below prior period amounts affected by this change are shown as they were in the prior year Statements of Changes in Net Assets.
FRANKLIN TEMPLETON VARIABLE INSURANCE PRODUCTS TRUST
NOTES TO FINANCIAL STATEMENTS
Templeton Foreign VIP Fund(continued)
For the year ended December 31, 2017, distributions to shareholders were as follows:
| | | | |
Distributions from net investment income : | | | | |
Class 1 | | $ | (3,928,195 | ) |
Class 2 | | | (35,708,156 | ) |
Class 4 | | | (2,623,801 | ) |
For the year ended December 31, 2017, undistributed net investment income included in net assets was $35,287,355.
2. Shares of Beneficial Interest
At December 31, 2018, there were an unlimited number of shares authorized (without par value). Transactions in the Fund’s shares were as follows:
| | | | | | | | | | | | | | | | | | | | | | | | |
| |
| | | Year Ended December 31, | |
| | |
| | | 2018 | | | 2017 | |
| | | | | | |
| | | Shares | | | | | | Amount | | | Shares | | | | | | Amount | |
| | | | | | |
| Class 1 Shares: | | | | | | | | | | | | | | | | | | | | | | | | |
Shares sold | | | 438,905 | | | | | | | $ | 6,719,723 | | | | 769,055 | | | | | | | $ | 11,623,740 | |
Shares issued in reinvestment of distributions | | | 263,056 | | | | | | | | 3,961,619 | | | | 267,406 | | | | | | | | 3,928,195 | |
Shares redeemed | | | (1,543,257 | ) | | | | | | | (23,403,821 | ) | | | (965,539 | ) | | | | | | | (14,397,318 | ) |
| | | | |
Net increase (decrease) | | | (841,296 | ) | | | | | | $ | (12,722,479 | ) | | | 70,922 | | | | | | | $ | 1,154,617 | |
| | | | |
| Class 2 Shares: | | | | | | | | | | | | | | | | | | | | | | | | |
Shares sold | | | 7,214,702 | | | | | | | $ | 104,866,589 | | | | 4,540,875 | | | | | | | $ | 66,812,334 | |
Shares issued in reinvestment of distributions | | | 2,265,765 | | | | | | | | 33,465,356 | | | | 2,478,012 | | | | | | | | 35,708,156 | |
Shares redeemed | | | (16,372,436 | ) | | | | | | | (241,125,609 | ) | | | (22,468,600 | ) | | | | | | | (327,819,471 | ) |
| | | | |
Net increase (decrease) | | | (6,891,969 | ) | | | | | | $ | (102,793,664 | ) | | | (15,449,713 | ) | | | | | | $ | (225,298,981 | ) |
| | | | |
| Class 4 Shares: | | | | | | | | | | | | | | | | | | | | | | | | |
Shares sold | | | 1,564,942 | | | | | | | $ | 23,205,250 | | | | 1,442,499 | | | | | | | $ | 21,238,967 | |
Shares issued in reinvestment of distributions | | | 234,330 | | | | | | | | 3,521,973 | | | | 179,222 | | | | | | | | 2,623,801 | |
Shares redeemed | | | (2,311,503 | ) | | | | | | | (33,799,640 | ) | | | (26,802,238 | ) | | | | | | | (389,210,530 | ) |
| | | | |
Net increase (decrease) | | | (512,231 | ) | | | | | | $ | (7,072,417 | ) | | | (25,180,517 | ) | | | | | | $ | (365,347,762 | ) |
| | | | |
3. Transactions with Affiliates
Franklin Resources, Inc. is the holding company for various subsidiaries that together are referred to as Franklin Templeton. Certain officers and trustees of the Fund are also officers and/or directors of the following subsidiaries:
| | |
| |
| Subsidiary | | Affiliation |
Templeton Investment Counsel, LLC (TIC) | | Investment manager |
Franklin Templeton Services, LLC (FT Services) | | Administrative manager |
Franklin Templeton Distributors, Inc. (Distributors) | | Principal underwriter |
Franklin Templeton Investor Services, LLC (Investor Services) | | Transfer agent |
FRANKLIN TEMPLETON VARIABLE INSURANCE PRODUCTS TRUST
NOTES TO FINANCIAL STATEMENTS
Templeton Foreign VIP Fund(continued)
3. Transactions with Affiliates(continued)
a. Management Fees
The Fund pays an investment management fee to TIC based on the average daily net assets of the Fund as follows:
| | |
| |
| Annualized Fee Rate | | Net Assets |
0.900% | | Up to and including $200 million |
0.810% | | Over $200 million, up to and including $700 million |
0.775% | | Over $700 million, up to and including $1.2 billion |
0.750% | | Over $1.2 billion, up to and including $1.3 billion |
0.675% | | Over $1.3 billion, up to and including $10 billion |
0.655% | | Over $10 billion, up to and including $15 billion |
0.635% | | Over $15 billion, up to and including $20 billion |
0.615% | | In excess of $20 billion |
For the year ended December 31, 2018, the gross effective investment management fee rate was 0.785% of the Fund’s average daily net assets.
b. Administrative Fees
Under an agreement with TIC, FT Services provides administrative services to the Fund. The fee is paid by TIC based on the Fund’s average daily net assets, and is not an additional expense of the Fund.
c. Distribution Fees
The Board has adopted distribution plans for Class 2 and Class 4 shares pursuant to Rule12b-1 under the 1940 Act. Under the Fund’s compensation distribution plans, the Fund pays Distributors for costs incurred in connection with the servicing, sale and distribution of the Fund’s shares up to 0.25% and 0.35% per year of its average daily net assets of Class 2 and Class 4, respectively. The plan year, for purposes of monitoring compliance with the maximum annual plan rates, is February 1 through January 31.
d. Transfer Agent Fees
Investor Services, under terms of an agreement, performs shareholder servicing for the Fund and is not paid by the Fund for the services.
e. Investments in Affiliated Management Investment Companies
The Fund invests in one or more affiliated management investment companies for purposes other than exercising a controlling influence over the management or policies. Management fees paid by the Fund are waived on assets invested in the affiliated management investment companies, as noted in the Statement of Operations, in an amount not to exceed the management and administrative fees paid directly or indirectly by each affiliate. During the year ended December 31, 2018, the Fund held investments in affiliated management investment companies as follows:
| | | | | | | | | | | | | | | | | | | | | | | | | | | | | | | | |
| | | | | | | | |
| | | Number
of Shares
Held at
Beginning
of Year | | | Gross
Additions | | | Gross
Reductions | | | Number
of Shares Held at
End of
Year | | | Value at End of Year | | | Investment Income | | | Realized
Gain
(Loss) | | | Net Change in
Unrealized
Appreciation
(Depreciation) | |
| Non-Controlled Affiliates | | | | | | | | | | | | | | | | | | | | | | | | | | | | | | | | |
| | | | | | | | | | | | | | | | | | | | | | | Dividends | | | | | | | | | |
| | | | | | | | | | | | | | | | | | | | | | | | | | | | | | | | |
Institutional Fiduciary Trust Money Market Portfolio, 1.99% | | | 25,636,178 | | | | 316,370,754 | | | | (292,140,138 | ) | | | 49,866,794 | | | $ | 49,866,794 | | | $ | 734,954 | | | $ | — | | | $ | — | |
| | | | | | | | | | | | | | | | | | | | |
FRANKLIN TEMPLETON VARIABLE INSURANCE PRODUCTS TRUST
NOTES TO FINANCIAL STATEMENTS
Templeton Foreign VIP Fund(continued)
| | | | | | | | | | | | | | | | | | | | | | | | | | | | | | | | |
| | | | | | | | |
| | | Number
of Shares
Held at
Beginning
of Year | | | Gross
Additions | | | Gross
Reductions | | | Number
of Shares
Held at
End of
Year | | | Value at End
of Year | | | Investment
Income | | | Realized
Gain
(Loss) | | | Net Change in
Unrealized
Appreciation
(Depreciation) | |
| Non-Controlled Affiliates | | | | | | | | | | | | | | | | | | | | | | | | | | | | | | | | |
| | | | | | | | | | | | | | | | | | | | | |
| Income from
securities
loaned |
| | | | | | | | |
| | | | | | | | | | | | | | | | | | | | | | | | | | | | | | | | |
Institutional Fiduciary Trust Money Market Portfolio, 1.99% | | | — | | | | 382,465,375 | | | | (369,461,438 | ) | | | 13,003,937 | | | $ | 13,003,937 | | | $ | 86,463 | | | $ | — | | | $ | — | |
| | | | | | | | | | | | | | | | | | | | |
Total Affiliated Securities | | | | | | | | | | | | | | | | | | $ | 62,870,731 | | | $ | 821,417 | | | $ | — | | | $ | — | |
| | | | | | | | | | | | | | | | | | | | |
4. Expense Offset Arrangement
The Fund has entered into an arrangement with its custodian whereby credits realized as a result of uninvested cash balances are used to reduce a portion of the Fund’s custodian expenses. During the year ended December 31, 2018, there were no credits earned.
5. Income Taxes
During the year ended December 31, 2018, the Fund utilized $79,259,651 of capital loss carryforwards.
The tax character of distributions paid during the years ended December 31, 2018 and 2017, was as follows:
| | | | | | | | |
| | |
| | | 2018 | | | 2017 | |
Distributions paid from ordinary income | | $ | 40,948,948 | | | $ | 42,260,152 | |
| | | | | | | | |
At December 31, 2018, the cost of investments and net unrealized appreciation (depreciation), undistributed ordinary income and undistributed long term capital gains for income tax purposes were as follows:
| | | | |
Cost of investments | | $ | 1,311,349,818 | |
| | | | |
Unrealized appreciation | | $ | 171,756,588 | |
Unrealized depreciation | | | (176,366,770 | ) |
| | | | |
Net unrealized appreciation (depreciation) | | $ | (4,610,182 | ) |
| | | | |
Distributable earnings: | | | | |
Undistributed ordinary income | | $ | 24,571,148 | |
Undistributed long term capital gains | | | 11,505,161 | |
| | | | |
Total distributable earnings | | $ | 36,076,309 | |
| | | | |
Differences between income and/or capital gains as determined on a book basis and a tax basis are primarily due to differing treatment of passive foreign investment company shares.
6. Investment Transactions
Purchases and sales of investments (excluding short term securities) for the year ended December 31, 2018, aggregated $319,755,652 and $482,495,898, respectively.
At December 31, 2018, in connection with securities lending transactions, the Fund loaned equity investments and received $13,019,491 of cash collateral. The gross amount of recognized liability for such transactions is included in payable upon return of securities loaned in the Statement of Assets and Liabilities. The agreements can be terminated at any time.
FRANKLIN TEMPLETON VARIABLE INSURANCE PRODUCTS TRUST
NOTES TO FINANCIAL STATEMENTS
Templeton Foreign VIP Fund(continued)
7. Concentration of Risk
Investing in foreign securities may include certain risks and considerations not typically associated with investing in U.S. securities, such as fluctuating currency values and changing local and regional economic, political and social conditions, which may result in greater market volatility. Current political and financial uncertainty surrounding the European Union may increase market volatility and the economic risk of investing in securities in Europe. In addition, certain foreign securities may not be as liquid as U.S. securities.
8. Credit Facility
The Fund, together with other U.S. registered and foreign investment funds (collectively, Borrowers), managed by Franklin Templeton, are borrowers in a joint syndicated senior unsecured credit facility totaling $2 billion (Global Credit Facility) which matured on February 8, 2019. This Global Credit Facility provides a source of funds to the Borrowers for temporary and emergency purposes, including the ability to meet future unanticipated or unusually large redemption requests. Effective February 8, 2019, the Borrowers renewed the Global Credit Facility for a one year term, maturing February 7, 2020, for a total of $2 billion.
Under the terms of the Global Credit Facility, the Fund shall, in addition to interest charged on any borrowings made by the Fund and other costs incurred by the Fund, pay its share of fees and expenses incurred in connection with the implementation and maintenance of the Global Credit Facility, based upon its relative share of the aggregate net assets of all of the Borrowers, including an annual commitment fee of 0.15% based upon the unused portion of the Global Credit Facility. These fees are reflected in other expenses in the Statement of Operations. During the year ended December 31, 2018, the Fund did not use the Global Credit Facility.
9. Fair Value Measurements
The Fund follows a fair value hierarchy that distinguishes between market data obtained from independent sources (observable inputs) and the Fund’s own market assumptions (unobservable inputs). These inputs are used in determining the value of the Fund’s financial instruments and are summarized in the following fair value hierarchy:
| | • | | Level 1 – quoted prices in active markets for identical financial instruments |
| | • | | Level 2 – other significant observable inputs (including quoted prices for similar financial instruments, interest rates, prepayment speed, credit risk, etc.) |
| | • | | Level 3 – significant unobservable inputs (including the Fund’s own assumptions in determining the fair value of financial instruments) |
The input levels are not necessarily an indication of the risk or liquidity associated with financial instruments at that level.
FRANKLIN TEMPLETON VARIABLE INSURANCE PRODUCTS TRUST
NOTES TO FINANCIAL STATEMENTS
Templeton Foreign VIP Fund(continued)
A summary of inputs used as of December 31, 2018, in valuing the Fund’s assets carried at fair value, is as follows:
| | | | | | | | | | | | | | | | |
| | | | |
| | | Level 1 | | | Level 2 | | | Level 3 | | | Total | |
| Assets: | | | | | | | | | | | | | | | | |
Investments in Securities:a | | | | | | | | | | | | | | | | |
Equity Investments:b | | | | | | | | | | | | | | | | |
Banks | | $ | 191,227,608 | | | $ | 13,054,472 | | | $ | — | | | $ | 204,282,080 | |
Capital Markets | | | — | | | | 16,550,804 | | | | — | | | | 16,550,804 | |
Construction Materials | | | 14,022,961 | | | | 7,794,639 | | | | — | | | | 21,817,600 | |
Diversified Telecommunication Services | | | 44,871,817 | | | | 13,555,892 | | | | — | | | | 58,427,709 | |
Electrical Equipment | | | — | | | | 12,859,164 | | | | — | | | | 12,859,164 | |
Electronic Equipment, Instruments & Components | | | — | | | | 6,812,859 | | | | — | | | | 6,812,859 | |
Health Care Equipment & Supplies | | | 8,035,012 | | | | 5,889,276 | | | | — | | | | 13,924,288 | |
Industrial Conglomerates | | | 22,596,973 | | | | 13,636,300 | | | | — | | | | 36,233,273 | |
Life Sciences Tools & Services | | | — | | | | 11,184,507 | | | | — | | | | 11,184,507 | |
Marine | | | — | | | | 6,551,506 | | | | — | | | | 6,551,506 | |
Multi-Utilities | | | 13,808,242 | | | | 14,966,479 | | | | — | | | | 28,774,721 | |
Oil, Gas & Consumable Fuels | | | 121,597,557 | | | | 23,809,692 | | | | — | | | | 145,407,249 | |
Pharmaceuticals | | | 83,973,784 | | | | 77,307,237 | | | | — | | | | 161,281,021 | |
Semiconductors & Semiconductor Equipment . | | | 35,283,063 | | | | 11,826,616 | | | | — | | | | 47,109,679 | |
All Other Equity Investments | | | 472,652,445 | | | | — | | | | — | | | | 472,652,445 | |
Short Term Investments | | | 62,870,731 | | | | — | | | | — | | | | 62,870,731 | |
| | | | |
Total Investments in Securities | | $ | 1,070,940,193 | | | $ | 235,799,443 | | | $ | — | | | $ | 1,306,739,636 | |
| | | | |
aFor detailed categories, see the accompanying Statement of Investments.
bIncludes common stocks.
10. Subsequent Events
The Fund has evaluated subsequent events through the issuance of the financial statements and determined that no events have occurred that require disclosure other than those already disclosed in the financial statements.
Abbreviations
Selected Portfolio
ADRAmerican Depositary Receipt
IDRInternational Depositary Receipt
FRANKLIN TEMPLETON VARIABLE INSURANCE PRODUCTS TRUST
Report of Independent Registered Public Accounting Firm
To the Board of Trustees of Franklin Templeton Variable Insurance Products Trust and Shareholders of Templeton Foreign VIP Fund
Opinion on the Financial Statements
We have audited the accompanying statement of assets and liabilities, including the statement of investments, of Templeton Foreign VIP Fund (the “Fund”) as of December 31, 2018, the related statement of operations for the year ended December 31, 2018, the statement of changes in net assets for each of the two years in the period ended December 31, 2018, including the related notes, and the financial highlights for each of the five years in the period ended December 31, 2018 (collectively referred to as the “financial statements”). In our opinion, the financial statements present fairly, in all material respects, the financial position of the Fund as of December 31, 2018, the results of its operations for the year then ended, the changes in its net assets for each of the two years in the period ended December 31, 2018 and the financial highlights for each of the five years in the period ended December 31, 2018 in conformity with accounting principles generally accepted in the United States of America.
Basis for Opinion
These financial statements are the responsibility of the Fund’s management. Our responsibility is to express an opinion on the Fund’s financial statements based on our audits. We are a public accounting firm registered with the Public Company Accounting Oversight Board (United States) (PCAOB) and are required to be independent with respect to the Fund in accordance with the U.S. federal securities laws and the applicable rules and regulations of the Securities and Exchange Commission and the PCAOB.
We conducted our audits of these financial statements in accordance with the standards of the PCAOB. Those standards require that we plan and perform the audit to obtain reasonable assurance about whether the financial statements are free of material misstatement, whether due to error or fraud.
Our audits included performing procedures to assess the risks of material misstatement of the financial statements, whether due to error or fraud, and performing procedures that respond to those risks. Such procedures included examining, on a test basis, evidence regarding the amounts and disclosures in the financial statements. Our audits also included evaluating the accounting principles used and significant estimates made by management, as well as evaluating the overall presentation of the financial statements. Our procedures included confirmation of securities owned as of December 31, 2018 by correspondence with the custodian and transfer agent. We believe that our audits provide a reasonable basis for our opinion.
PricewaterhouseCoopers LLP
San Francisco, California
February 15, 2019
We have served as the auditor of one or more investment companies in the Franklin Templeton Group of Funds since 1948.
FRANKLIN TEMPLETON VARIABLE INSURANCE PRODUCTS TRUST
Tax Information (unaudited)
Templeton Foreign VIP Fund
At December 31, 2018, more than 50% of the Fund’s total assets were invested in securities of foreign issuers. In most instances, foreign taxes were withheld from income paid to the Fund on these investments. The Fund elects to treat foreign taxes paid as allowed under Section 853 of the Internal Revenue Code. This election will allow shareholders of record as of the 2019 distribution date, to treat their proportionate share of foreign taxes paid by the Fund as having been paid directly by them. The shareholder shall consider these amounts as foreign taxes paid in the tax year in which they receive the Fund distribution.
This page intentionally left blank.
Templeton Global Bond VIP Fund
We are pleased to bring you Templeton Global Bond VIP Fund’s annual report for the fiscal year ended December 31, 2018.
Class 1 Performance Summary as of December 31, 2018
Average annual total return of Class 1 shares* represents the average annual change in value, assuming reinvestment of dividends and capital gains. Average returns smooth out variations in returns, which can be significant; they are not the same asyear-by-year results.
| | | | | | | | | | | | |
| | | |
| Periods ended 12/31/18 | | 1-Year | | | 5-Year | | | 10-Year | |
Average Annual Total Return | | | +2.15% | | | | +1.08% | | | | +5.34% | |
*The Fund has a fee waiver associated with any investment it makes in a Franklin Templeton money fund and/or other Franklin Templeton fund, contractually guaranteed through 4/30/19. Fund investment results reflect the fee waiver; without this waiver, the results would have been lower.
Performance reflects the Fund’s Class 1 operating expenses, but doesnotinclude any contract fees, expenses or sales charges. If they had been included, performance would be lower. These charges and deductions, particularly for variable life policies, can have a significant effect on contract values and insurance benefits. See the contract prospectus for a complete description of these expenses, including sales charges.
Performance data represent past performance, which does not guarantee future results. Investment return and principal value will fluctuate, and you may have a gain or loss when you sell your shares. Current performance may differ from figures shown.
Total Return Index Comparison for a Hypothetical $10,000 Investment (1/1/09–12/31/18)
The graph below shows the change in value of a hypothetical $10,000 investment in the Fund over the indicated period and includes reinvestment of any income or distributions. The Fund’s performance* is compared to the performance of the J.P. Morgan (JPM) Global Government Bond Index (GGBI), the FTSE World Government Bond Index (WGBI) and the Consumer Price Index. One cannot invest directly in an index, and an index is not representative of the Fund’s portfolio.Please see Important Notes to Performance Information preceding the Fund Summaries.
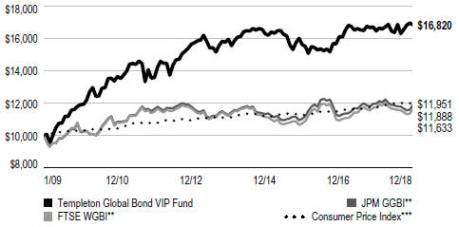
**Source: Morningstar. Please see Index Descriptions following the Fund Summaries.
***Source: Bureau of Labor Statistics, bls.gov/cpi. Please see Index Descriptions following the Fund Summaries.
TEMPLETON GLOBAL BOND VIP FUND
Fund Goal and Main Investments
The Fund seeks high current income, consistent with preservation of capital, with capital appreciation as a secondary consideration. Under normal market conditions, the Fund invests at least 80% of its net assets in bonds, which include debt securities of any maturity, such as bonds, notes, bills and debentures.
Fund Risks
All investments involve risks, including possible loss of principal. Foreign securities involve special risks, including currency fluctuations and economic and political uncertainties. Currency rates may fluctuate significantly over short periods of time, and can reduce returns. Sovereign debt securities are subject to various risks in addition to those relating to debt securities and foreign securities generally, including, but not limited to, the risk that a governmental entity may be unwilling or unable to pay interest and repay principal on its sovereign debt, or otherwise meet its obligations when due. Adverse conditions in a certain region or country can adversely affect securities of issuers in other countries whose economies appear to be unrelated. Investments in developing markets involve heightened risks related to the same factors, in addition to those associated with these markets’ smaller size, lesser liquidity and lack of established legal, political, business and social frameworks to support securities market. The Fund is actively managed but there is no guarantee that the manager’s investment decisions will produce the desired results. The Fund’s prospectus also includes a description of the main investment risks.
Performance Overview
You can find the Fund’sone-year total return in the Performance Summary. For comparison, the JPM GGBI had a-0.66% total return and the FTSE WGBI, the new name for the Citigroup WGBI, had a-0.84% total return for the same period.1
Economic and Market Overview
The year began with sharply rising yields in the U.S. and Europe as reflation sentiments returned to markets. Deregulation efforts and tax cuts in the U.S. were expected to add stimulus to an already strong U.S. economy. The10-year
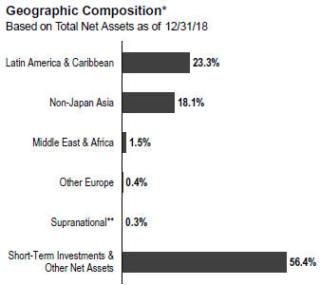
*Figures represent the net Fund exposure and include certain derivatives held in the portfolio (or their underlying reference assets) and may not total 100% or may be negative due to rounding, use of any derivatives or other factors.
**The Fund’s supranational investment was denominated in the Mexican peso.
U.S. Treasury (UST) yield rose 0.45% during the first two months of 2018, finishing February at 2.86%. In Europe, the10-year German Bund yield rose 0.27% during the first month of the year, reaching its peak yield for the period at 0.77% on February 2, its highest level since 2015. Markets appeared to initially anticipate upcoming rate adjustments from the European Central Bank (ECB), but those expectations would largely disappear by the summer.
In February, Jerome Powell took over as U.S. Federal Reserve (Fed) Chair, replacing Janet Yellen. Powell indicated his intentions to continue the glide path of rate hikes and balance sheet unwinding. However, by March, the rising yield trends in the U.S. and Europe stalled and moderately reversed. U.S. protectionist policies in the form of steel and aluminum tariffs, as well as sector-specific tariffs on China, appeared to amplify risk aversion across global financial markets. Credit spreads widened across investment-grade and high-yield credit tiers in the U.S. and Europe during the month, ultimately widening even further over the rest of the year. In April, reflation sentiments briefly resurfaced, driving the10-year UST yield above 3.00% for the first time in more than four years. However, risk aversion returned to global bond markets in the second half of May, as political turmoil in Italy raised concerns over Italian debt sustainability and the viability of the euro.
1. Source: Morningstar. One cannot invest directly in an index, and an index is not representative of the Fund’s portfolio. Please see Index Descriptions following the Fund Summaries.
The dollar value, number of shares or principal amount, and names of all portfolio holdings are listed in the Fund’s Statement of Investments (SOI).
TEMPLETON GLOBAL BOND VIP FUND
Yields in Italy, Spain and much of peripheral Europe rose sharply, while yields in Germany, France and the U.S. declined on flights to quality. Several Latin American countries concurrently saw rising yields and sharp depreciations of their exchange rates on regional volatility.
Inmid-June, ECB President Mario Draghi announced the net asset purchase program would be reduced to 15 billion euros per month for October, November and December, and would conclude at the end of 2018. Draghi also indicated rates would likely remain unchanged until at least the summer of 2019, quelling any remaining expectations for a 2018 rate hike. In the U.S., yields briefly rose in July as economic activity continued to strengthen. Annualized second-quarter U.S. gross domestic product came in at 4.2%, its highest level since 2014.
However, a wave of broad-based risk aversion across emerging markets arrived in late August, driving exchange rates lower against the U.S. dollar. Several perceived safe-haven assets rallied, including USTs. We viewed much of the late summer selloffs as fear-driven overreactions that often exceeded the fundamental risks in individual countries. As an asset category, emerging markets showed the highest level of undervaluation across the global fixed income markets, in our assessment, and we expected select countries with healthier or improving underlying fundamentals to rebound from the heightened volatility.
Bymid-September, risk aversion across emerging markets began to diminish, as several security valuations incrementally stabilized and improved. UST yields rose sharply during the month, on expectations the Fed would hike rates at its September 26 meeting. Those trends continued through October, with the10-year UST reaching its highest yield of the year on November 8, at 3.24%. However, market volatility escalated in December as global growth uncertainties and trade policy concerns led to rallies in perceived safe-haven assets. The10-year UST yield dropped sharply to finish the year at 2.69%, despite the Fed’s fourth rate hike of the year on December 19.
On the whole, duration exposures in the U.S. and in several parts of the world faced headwinds from rising rates during much of the period, before those trends sharply reversed in December. Select local-currency bond markets fared better than others, as valuations strengthened in places like Brazil but weakened in places like Indonesia. On the currency front, the U.S. dollar started the period weaker before significantly strengthening against global currencies over the remainder of the year. On the whole, avoiding UST duration proved important to performance during much of the period, as did
long exposure to the U.S. dollar and select positioning in emerging markets.
| | | | |
Currency Composition* | | | |
| 12/31/18 | | | |
| | |
| % of Total
Net Assets |
|
| Americas | | | 160.7% | |
| United States Dollar | | | 120.7% | |
| Mexican Peso | | | 20.5% | |
| Brazilian Real | | | 11.4% | |
| Argentine Peso | | | 4.4% | |
| Colombian Peso | | | 3.7% | |
| Canadian Dollar | | | 0.0%** | |
| Middle East & Africa | | | 1.5% | |
| Ghanaian Cedi | | | 1.5% | |
| Asia Pacific | | | -21.9% | |
| Indian Rupee | | | 10.6% | |
| Indonesian Rupiah | | | 9.2% | |
| Philippine Peso | | | 1.7% | |
| South Korean Won | | | 0.0%** | |
| New Zealand Dollar | | | 0.0%** | |
| Australian Dollar | | | -7.7% | |
| Japanese Yen | | | -35.7% | |
| Europe | | | -40.3% | |
| Euro | | | -40.3% | |
*Figures represent the net Fund exposure and include certain derivatives held in the portfolio (or their underlying reference assets) and may not total 100% or may be negative due to rounding, use of any derivatives or other factors.
**Rounds to less than 0.1%.
Investment Strategy
We invest selectively in bonds around the world based upon our assessment of changing market, political and economic conditions. While seeking opportunities, we monitor various factors including changes in interest rates, currency exchange rates and credit risks. We seek to manage the Fund’s exposure to various currencies and regularly utilize currency and cross currency forward contracts and may also use currency and currency index futures contracts and other derivative instruments.
Manager’s Discussion
During the reporting period, the strategy was positioned for rising rates in the U.S. by maintaining low portfolio duration
TEMPLETON GLOBAL BOND VIP FUND
What is a currency forward contract?
A currency forward contract is an agreement between the Fund and a counterparty to buy or sell a foreign currency in exchange for another currency at a specific exchange rate on a future date. Currency forward contracts are privately traded in the interbank market, not on a centralized exchange.
What is a futures contract?
A futures contract is an agreement between the Fund and a counterparty made through a U.S. or foreign futures exchange to buy or sell an underlying instrument or asset at a specific price on a future date.
and using interest-rate swaps to gain negative duration exposure to USTs. The strategy also continued to seek duration exposures in select emerging markets that offered positive real yields without taking undue interest-rate risk, favoring countries that have solid underlying fundamentals and prudent fiscal and monetary policies. Several emerging markets continued to offer significantly higher yields than those available in the developed markets. The strategy also held long currency exposures in a number of emerging markets andnet-negative exposures to the Japanese yen, euro and Australian dollar, as directional views on the currencies and as hedges against a broadly strengthening U.S. dollar. During the period, we used currency forward contracts to actively manage currencies. We also used interest-rate swaps to tactically manage duration exposures.
What is duration?
Duration is a measure of a bond’s price sensitivity to interest-rate changes. In general, a portfolio of securities with a lower duration can be expected to be less sensitive to interest-rate changes than a portfolio with a higher duration.
What is an interest-rate swap?
An interest-rate swap is an agreement between two parties to exchange interest-rate payment obligations, generally one based on an interest rate fixed to maturity and the other based on an interest rate that changes in accordance with changes in a designated benchmark (for example, LIBOR, prime, commercial paper or other benchmarks).
During the period, the strategy’s positive absolute performance was primarily attributable to currency positions, followed by interest-rate strategies. Sovereign credit exposures had a largely neutral effect on absolute results. Among currencies, the Fund’snet-negative positions in the euro and the Australian dollar, achieved through the use of currency forward contracts,
contributed to absolute performance, while itsnet-negative position in the Japanese yen, also through currency forward contracts, moderately detracted. Currency positions in Latin America and Asiaex-Japan detracted from absolute results (the Brazilian real, Argentine peso and Indian rupee detracted, while the Mexican peso contributed). The Fund maintained a defensive approach regarding interest rates in developed markets, while holding duration exposures in select emerging markets. Negative duration exposure to U.S. Treasuries contributed to absolute performance, as did duration exposure in Brazil. However, duration exposure in Argentina detracted from absolute return.
The strategy’s relative outperformance during the period was primarily attributable to currency positions. Interest-rate strategies detracted from relative results, while sovereign credit exposures had a largely neutral effect. Among currencies, the Fund’s underweighted positions in the euro, the Australian dollar and the British pound contributed to relative performance, while its underweighted position in the Japanese yen detracted. Overweighted currency positions in Latin America and Asiaex-Japan detracted from relative results (the Brazilian real, Argentine peso and Indian rupee detracted, while the Mexican peso contributed). Select underweighted duration exposures in Europe detracted from relative performance, as did overweighted duration exposure in Argentina. However, overweighted duration exposure in Brazil contributed.
Thank you for your participation in Templeton Global Bond VIP Fund. We look forward to serving your future investment needs.
The foregoing information reflects our analysis, opinions and portfolio holdings as of December 31, 2018, the end of the reporting period. The way we implement our main investment strategies and the resulting portfolio holdings may change depending on factors such as market and economic conditions. These opinions may not be relied upon as investment advice or an offer for a particular security. The information is not a complete analysis of every aspect of any market, country, industry, security or the Fund. Statements of fact are from sources considered reliable, but the investment manager makes no representation or warranty as to their completeness or accuracy. Although historical performance is no guarantee of future results, these insights may help you understand our investment management philosophy.
TEMPLETON GLOBAL BOND VIP FUND
Class 1 Fund Expenses
As an investor in a variable insurance contract (Contract) that indirectly provides for investment in an underlying mutual fund, you can incur transaction and/or ongoing expenses at both the Fund level and the Contract Level: (1) transaction expenses can include sales charges (loads) on purchases, surrender fees, transfer fees and premium taxes; and (2) ongoing expenses can include management fees, distribution and service(12b-1) fees, contract fees, annual maintenance fees, mortality and expense risk fees and other fees and expenses. All mutual funds and Contracts have some types of ongoing expenses. The table below shows Fund-level ongoing expenses and can help you understand these costs and compare them with those of other mutual funds offered through the Contract. The table assumes a $1,000 investment held for the six months indicated. Please refer to the Fund prospectus for additional information on operating expenses.
Actual Fund Expenses
The table below provides information about the actual account values and actual expenses in the columns under the heading “Actual.” In these columns the Fund’s actual return, which includes the effect of ongoing Fund expenses but does not include the effect of ongoing Contract expenses, is used to calculate the “Ending Account Value.” You can estimate the Fund-level expenses you paid during the period by following these steps (ofcourse, your account value and expenses will differ from those in this illustration):Divide your account value by $1,000 (ifyour account had an $8,600 value, then $8,600 ÷ $1,000 = 8.6). Then multiply the result by the number under the headings “Actual” and “Fund-Level Expenses Paid During Period” (ifFund-Level Expenses Paid During Period were $ 7.50, then 8.6 x $7.50 = $64.50). In this illustration, the estimated expenses paid this period at the Fund level are $64.50.
Hypothetical Example for Comparison with Other Mutual Funds
Under the heading “Hypothetical” in the table, information is provided about hypothetical account values and hypothetical expenses based on the Fund’s actual expense ratio and an assumed rate of return of 5% per year before expenses, which is not the Fund’s actual return. This information may not be used to estimate the actual ending account balance or expenses you paid for the period, but it can help you compare ongoing costs of investing in the Fund with those of other mutual funds offered through the Contract. To do so, compare this 5% hypothetical example with the 5% hypothetical examples that appear in the shareholder reports of other funds offered through the Contract.
Please note that expenses shown in the table are meant to highlight ongoing costs at the Fund level only and do not reflect any ongoing expenses at the Contract level, or transaction expenses at either the Fund or Contract levels. In addition, while the Fund does not have transaction expenses, if the transaction and ongoing expenses at the Contract level were included, the expenses shown below would be higher. You should consult your Contract prospectus or disclosure document for more information.
| | | | | | | | | | | | |
| | | | | Actual
(actual return after expenses) | | Hypothetical
(5% annual return before expenses) | | |
| | | | | | |
Share Class | | Beginning Account
Value 7/1/18 | | Ending Account
Value 12/31/18 | | Fund-Level Expenses Paid During Period
7/1/18–12/31/181,2 | | Ending Account
Value 12/31/18 | | Fund-Level Expenses
Paid During Period
7/1/18–12/31/181,2 | | Net
Annualized
Expense
Ratio2 |
Class 1 | | $1,000 | | $1,028.10 | | $2.30 | | $1,022.94 | | $2.29 | | 0.45% |
1. Expenses are equal to the annualized expense ratio for thesix-month period as indicated above—in the far right column—multiplied by the simple average account value over the period indicated, and then multiplied by 184/365 to reflect theone-half year period.
2. Reflects expenses after fee waivers and expense reimbursements. Does not include any ongoing expenses of the Contract for which the Fund is an investment option or acquired fund fees and expenses.
TGB P1 12/18
SUPPLEMENT DATED DECEMBER 3, 2018
TO THE PROSPECTUSES
DATED MAY 1, 2018
OF
TEMPLETON GLOBAL BOND VIP FUND
(a series of Franklin Templeton Variable Insurance Products Trust)
The prospectus is amended as follows:
I. Effective December 31, 2018, the portfolio management team under the “FUND SUMMARIES – Templeton Global Bond VIP Fund – Portfolio Managers” section on pageTGB-S6 is replaced with the following:
Portfolio Managers
Michael Hasenstab, Ph.D. Executive Vice President of Advisers and portfolio manager of the Fund since 2001.
Calvin Ho, Ph.D.Portfolio Manager of Advisers and portfolio manager of the Fund since December 2018.
II. Effective December 31, 2018, the portfolio management team under the “Fund Details – Templeton Global Bond VIP Fund –Management” section on pageTGB-D10 is replaced with the following:
The Fund is managed by the following dedicated professionals focused on investments of bonds issued by government and government agencies around the world:
Michael Hasenstab, Ph.D. Executive Vice President of Advisers
Dr. Hasenstab has been a lead portfolio manager of the Fund since 2001. He has primary responsibility for the investments of the Fund. Dr. Hasenstab has final authority over all aspects of the Fund’s investment portfolio, including but not limited to, purchases and sales of individual securities, portfolio risk assessment, and the management of daily cash balances in accordance with anticipated investment management requirements. The degree to which he may perform these functions, and the nature of these functions, may change from time to time. Dr. Hasenstab first joined Franklin Templeton Investments in 1995, rejoining again in 2001 after a three-year leave to obtain his Ph.D.
Calvin Ho, Ph.D. Portfolio Manager of Advisers
Dr. Ho has been has been a portfolio manager of the Fund since December 2018, providing research and advice on the purchases and sales of individual securities and portfolio risk assessment. He joined Franklin Templeton Investments in 2005.
Please keep this supplement with your prospectus for future reference.
FRANKLIN TEMPLETON VARIABLE INSURANCE PRODUCTS TRUST
Financial Highlights
Templeton Global Bond VIP Fund
| | | | | | | | | | | | | | | | | | | | |
| |
| | | Year Ended December 31, | |
| | | | | |
| | | 2018 | | | 2017 | | | 2016 | | | 2015 | | | 2014 | |
| Class 1 | | | | | | | | | | | | | | | | | | | | |
Per share operating performance (for a share outstanding throughout the year) | | | | | | | | | | | | | | | | | | | | |
| | | | | |
Net asset value, beginning of year | | | $17.17 | | | | $16.85 | | | | $16.34 | | | | $18.56 | | | | $19.15 | |
| | | | |
| | | | | |
| Income from investment operationsa: | | | | | | | | | | | | | | | | | | | | |
| | | | | |
Net investment incomeb | | | 0.88 | | | | 0.83 | | | | 0.62 | | | | 0.52 | | | | 0.58 | |
| | | | | |
Net realized and unrealized gains (losses) | | | (0.51 | ) | | | (0.46 | ) | | | (0.10 | ) | | | (1.22 | ) | | | (0.16 | ) |
| | | | |
Total from investment operations | | | 0.37 | | | | 0.37 | | | | 0.52 | | | | (0.70 | ) | | | 0.42 | |
| | | | |
| | | | | |
| Less distributions from: | | | | | | | | | | | | | | | | | | | | |
| | | | | |
Net investment income and net foreign currency gains | | | — | | | | — | | | | — | | | | (1.43 | ) | | | (1.01 | ) |
| | | | | |
Net realized gains | | | — | | | | (0.05 | ) | | | (0.01 | ) | | | (0.09 | ) | | | — | |
| | | | |
Total distributions | | | — | | | | (0.05 | ) | | | (0.01 | ) | | | (1.52 | ) | | | (1.01 | ) |
| | | | |
Redemption fees | | | — | | | | — | | | | — | | | | — | | | | — | c |
| | | | |
Net asset value, end of year | | | $17.54 | | | | $17.17 | | | | $16.85 | | | | $16.34 | | | | $18.56 | |
| | | | |
| | | | | |
Total returnd | | | 2.15% | | | | 2.15% | | | | 3.21% | | | | (4.10)% | | | | 2.12% | |
| | | | | |
| Ratios to average net assets | | | | | | | | | | | | | | | | | | | | |
| | | | | |
Expenses before waiver and payments by affiliates and expense reduction | | | 0.56% | | | | 0.53% | | | | 0.53% | | | | 0.52% | | | | 0.51% | |
| | | | | |
Expenses net of waiver and payments by affiliates | | | 0.47% | | | | 0.46% | | | | 0.48% | | | | 0.52%e | | | | 0.51% | |
| | | | | |
Expenses net of waiver and payments by affiliates and expense reduction | | | 0.45% | | | | 0.46%f | | | | 0.48%f | | | | 0.52%e,f | | | | 0.51% | f |
| | | | | | |
Net investment income | | | 5.09% | | | | 4.81% | | | | 3.88% | | | | 2.99% | | | | 3.08% | |
| | | | | |
| Supplemental data | | | | | | | | | | | | | | | | | | | | |
| | | | | |
Net assets, end of year (000’s) | | | $285,046 | | | | $286,502 | | | | $241,792 | | | | $292,802 | | | | $323,491 | |
| | | | | |
Portfolio turnover rate | | | 18.22% | | | | 37.97% | | | | 59.00% | | | | 51.58% | | | | 39.14% | |
aThe amount shown for a share outstanding throughout the period may not correlate with the Statement of Operations for the period due to the timing of sales and repurchases of the Fund’s shares in relation to income earned and/or fluctuating fair value of the investments of the Fund.
bBased on average daily shares outstanding.
cAmount rounds to less than $0.01 per share.
dTotal return does not include fees, charges or expenses imposed by the variable annuity and life insurance contracts for which Franklin Templeton Variable Insurance Products Trust serves as an underlying investment vehicle.
eBenefit of waiver and payments by affiliates rounds to less than 0.01%.
fBenefit of expense reduction rounds to less than 0.01%.
| | | | | | |
| | | |
| | The accompanying notes are an integral part of these financial statements. | Annual Report | | | TGB-7 | |
FRANKLIN TEMPLETON VARIABLE INSURANCE PRODUCTS TRUST
FINANCIAL HIGHLIGHTS
Templeton Global Bond VIP Fund(continued)
| | | | | | | | | | | | | | | | | | | | |
| |
| | | Year Ended December 31, | |
| | | | | |
| | | 2018 | | | 2017 | | | 2016 | | | 2015 | | | 2014 | |
| Class 2 | | | | | | | | | | | | | | | | | | | | |
Per share operating performance (for a share outstanding throughout the year) | | | | | | | | | | | | | | | | | | | | |
| | | | | |
Net asset value, beginning of year | | | $16.51 | | | | $16.25 | | | | $15.80 | | | | $17.99 | | | | $18.60 | |
| | | | |
| | | | | |
| Income from investment operationsa: | | | | | | | | | | | | | | | | | | | | |
| | | | | |
Net investment incomeb | | | 0.81 | | | | 0.76 | | | | 0.56 | | | | 0.46 | | | | 0.52 | |
| | | | | |
Net realized and unrealized gains (losses) | | | (0.49 | ) | | | (0.45 | ) | | | (0.10 | ) | | | (1.17 | ) | | | (0.17 | ) |
| | | | |
Total from investment operations | | | 0.32 | | | | 0.31 | | | | 0.46 | | | | (0.71 | ) | | | 0.35 | |
| | | | |
| | | | | |
| Less distributions from: | | | | | | | | | | | | | | | | | | | | |
| | | | | |
Net investment income and net foreign currency gains | | | — | | | | — | | | | — | | | | (1.39 | ) | | | (0.96 | ) |
| | | | | |
Net realized gains | | | — | | | | (0.05 | ) | | | (0.01 | ) | | | (0.09 | ) | | | — | |
| | | | |
Total distributions | | | — | | | | (0.05 | ) | | | (0.01 | ) | | | (1.48 | ) | | | (0.96 | ) |
| | | | |
Redemption fees | | | — | | | | — | | | | — | | | | — | | | | —c | |
| | | | |
Net asset value, end of year | | | $16.83 | | | | $16.51 | | | | $16.25 | | | | $15.80 | | | | $17.99 | |
| | | | |
| | | | | |
Total returnd | | | 1.94% | | | | 1.93% | | | | 2.94% | | | | (4.30)% | | | | 1.83% | |
| | | | | |
| Ratios to average net assets | | | | | | | | | | | | | | | | | | | | |
| | | | | |
Expenses before waiver and payments by affiliates and expense reduction | | | 0.81% | | | | 0.78% | | | | 0.78% | | | | 0.77% | | | | 0.76% | |
| | | | | |
Expenses net of waiver and payments by affiliates | | | 0.72% | | | | 0.71% | | | | 0.73% | | | | 0.77%e | | | | 0.76% | |
| | | | | |
Expenses net of waiver and payments by affiliates and expense reduction | | | 0.70% | | | | 0.71%f | | | | 0.73%f | | | | 0.77%e,f | | | | 0.76% | f |
| | | | | | |
Net investment income | | | 4.84% | | | | 4.56% | | | | 3.63% | | | | 2.74% | | | | 2.83% | |
| | | | | |
| Supplemental data | | | | | | | | | | | | | | | | | | | | |
| | | | | |
Net assets, end of year (000’s) | | | $2,544,900 | | | | $2,730,081 | | | | $2,812,535 | | | | $2,971,667 | | | | $3,177,638 | |
| | | | | |
Portfolio turnover rate | | | 18.22% | | | | 37.97% | | | | 59.00% | | | | 51.58% | | | | 39.14% | |
aThe amount shown for a share outstanding throughout the period may not correlate with the Statement of Operations for the period due to the timing of sales and repurchases of the Fund’s shares in relation to income earned and/or fluctuating fair value of the investments of the Fund.
bBased on average daily shares outstanding.
cAmount rounds to less than $0.01 per share.
dTotal return does not include fees, charges or expenses imposed by the variable annuity and life insurance contracts for which Franklin Templeton Variable Insurance Products Trust serves as an underlying investment vehicle.
eBenefit of waiver and payments by affiliates rounds to less than 0.01%.
fBenefit of expense reduction rounds to less than 0.01%.
| | | | |
| | | |
| TGB-8 | | Annual Report | The accompanying notes are an integral part of these financial statements. | | |
FRANKLIN TEMPLETON VARIABLE INSURANCE PRODUCTS TRUST
FINANCIAL HIGHLIGHTS
Templeton Global Bond VIP Fund(continued)
| | | | | | | | | | | | | | | | | | | | |
| |
| | | Year Ended December 31, | |
| | | | | |
| | | 2018 | | | 2017 | | | 2016 | | | 2015 | | | 2014 | |
| Class 4 | | | | | | | | | | | | | | | | | | | | |
Per share operating performance (for a share outstanding throughout the year) | | | | | | | | | | | | | | | | | | | | |
| | | | | |
Net asset value, beginning of year | | | $16.88 | | | | $16.62 | | | | $16.18 | | | | $18.38 | | | | $18.97 | |
| | | | |
| | | | | |
| Income from investment operationsa: | | | | | | | | | | | | | | | | | | | | |
| | | | | |
Net investment incomeb | | | 0.81 | | | | 0.76 | | | | 0.56 | | | | 0.46 | | | | 0.51 | |
| | | | | |
Net realized and unrealized gains (losses) | | | (0.50 | ) | | | (0.45 | ) | | | (0.11 | ) | | | (1.21 | ) | | | (0.18 | ) |
| | | | |
| | | | | |
Total from investment operations | | | 0.31 | | | | 0.31 | | | | 0.45 | | | | (0.75 | ) | | | 0.33 | |
| | | | |
| | | | | |
| Less distributions from: | | | | | | | | | | | | | | | | | | | | |
| | | | | |
Net investment income and net foreign currency gains | | | — | | | | — | | | | — | | | | (1.36 | ) | | | (0.92 | ) |
| | | | | |
Net realized gains | | | — | | | | (0.05 | ) | | | (0.01 | ) | | | (0.09 | ) | | | — | |
| | | | |
Total distributions | | | — | | | | (0.05 | ) | | | (0.01 | ) | | | (1.45 | ) | | | (0.92 | ) |
| | | | |
Redemption fees | | | — | | | | — | | | | — | | | | — | | | | —c | |
| | | | |
Net asset value, end of year | | | $17.19 | | | | $16.88 | | | | $16.62 | | | | $16.18 | | | | $18.38 | |
| | | | |
| | | | | |
Total returnd | | | 1.84% | | | | 1.76% | | | | 2.87% | | | | (4.39)% | | | | 1.69% | |
| | | | | |
| Ratios to average net assets | | | | | | | | | | | | | | | | | | | | |
| | | | | |
Expenses before waiver and payments by affiliates and expense reduction | | | 0.91% | | | | 0.88% | | | | 0.88% | | | | 0.87% | | | | 0.86% | |
| | | | | |
Expenses net of waiver and payments by affiliates | | | 0.82% | | | | 0.81% | | | | 0.83% | | | | 0.87%e | | | | 0.86% | |
| | | | | |
Expenses net of waiver and payments by affiliates and expense reduction | | | 0.80% | | | | 0.81%f | | | | 0.83%f | | | | 0.87%e,f | | | | 0.86%f | |
| | | | | |
Net investment income | | | 4.74% | | | | 4.46% | | | | 3.53% | | | | 2.64% | | | | 2.73% | |
| | | | | |
| Supplemental data | | | | | | | | | | | | | | | | | | | | |
| | | | | |
Net assets, end of year (000’s) | | | $94,312 | | | | $98,934 | | | | $96,798 | | | | $103,045 | | | | $111,199 | |
| | | | | |
Portfolio turnover rate | | | 18.22% | | | | 37.97% | | | | 59.00% | | | | 51.58% | | | | 39.14% | |
aThe amount shown for a share outstanding throughout the period may not correlate with the Statement of Operations for the period due to the timing of sales and repurchases of the Fund’s shares in relation to income earned and/or fluctuating fair value of the investments of the Fund.
bBased on average daily shares outstanding.
cAmount rounds to less than $0.01 per share.
dTotal return does not include fees, charges or expenses imposed by the variable annuity and life insurance contracts for which Franklin Templeton Variable Insurance Products Trust serves as an underlying investment vehicle.
eBenefit of waiver and payments by affiliates rounds to less than 0.01%.
fBenefit of expense reduction rounds to less than 0.01%.
| | | | | | |
| | | |
| | The accompanying notes are an integral part of these financial statements. | Annual Report | | | TGB-9 | |
FRANKLIN TEMPLETON VARIABLE INSURANCE PRODUCTS TRUST
Statement of Investments, December 31, 2018
| | | | | | | | | | |
Templeton Global Bond VIP Fund | |
| | | |
| | | | | Principal Amount* | | | Value | |
| | | Foreign Government and Agency Securities 43.6% | | | | | | |
| | | Argentina 2.9% | | | | | | |
| | Argentina Treasury Bill, Strip, 4/30/20 | | | 202,415,000 | ARS | | $ | 5,913,520 | |
| | Argentine Bonos del Tesoro, | | | | | | | | |
| | 18.20%, 10/03/21 | | | 820,823,000 | ARS | | | 16,851,908 | |
| | 16.00%, 10/17/23 | | | 844,288,000 | ARS | | | 18,964,292 | |
| | senior note, 15.50%, 10/17/26 | | | 1,668,306,000 | ARS | | | 33,331,472 | |
| | Government of Argentina, | | | | | | | | |
| | aFRN, 65.509%, (ARPP7DRR), 6/21/20 | | | 10,990,000 | ARS | | | 316,360 | |
| | aFRN, 51.542%, (ARS Badlar + 2.00%), 4/03/22 | | | 24,036,000 | ARS | | | 614,417 | |
| | bIndex Linked, 3.75%, 2/08/19 | | | 44,145,000 | ARS | | | 1,664,144 | |
| | bIndex Linked, 4.00%, 3/06/20 | | | 4,138,000 | ARS | | | 133,128 | |
| | senior note, 4.50%, 2/13/20 | | | 9,351,000 | | | | 8,496,552 | |
| | | | | | | | | | |
| | | | | | | | | 86,285,793 | |
| | | | | | | | | | |
| | | Brazil 9.6% | | | | | | |
| | Letra Tesouro Nacional, | | | | | | | | |
| | Strip, 1/01/19 | | | 33,250c | BRL | | | 8,564,706 | |
| | Strip, 7/01/19 | | | 102,840c | BRL | | | 25,705,464 | |
| | Strip, 7/01/20 | | | 118,041c | BRL | | | 27,517,727 | |
| | Strip, 7/01/21 | | | 24,360c | BRL | | | 5,209,520 | |
| | Nota Do Tesouro Nacional, | | | | | | | | |
| | 10.00%, 1/01/21 | | | 38,520c | BRL | | | 10,382,776 | |
| | 10.00%, 1/01/23 | | | 522,145c | BRL | | | 141,049,173 | |
| | 10.00%, 1/01/25 | | | 69,029c | BRL | | | 18,594,130 | |
| | 10.00%, 1/01/27 | | | 153,303c | BRL | | | 41,275,938 | |
| | senior note, 10.00%, 1/01/19 | | | 10,290c | BRL | | | 2,651,546 | |
| | | | | | | | | | |
| | | | | | | | | 280,950,980 | |
| | | | | | | | | | |
| | | Colombia 3.7% | | | | | | |
| | Government of Colombia, | | | | | | | | |
| | senior bond, 7.75%, 4/14/21 | | | 2,386,000,000 | COP | | | 765,853 | |
| | senior bond, 4.375%, 3/21/23 | | | 362,000,000 | COP | | | 105,954 | |
| | senior bond, 9.85%, 6/28/27 | | | 576,000,000 | COP | | | 218,016 | |
| | Titulos de Tesoreria, | | | | | | | | |
| | B, 7.75%, 9/18/30 | | | 140,945,200,000 | COP | | | 46,275,213 | |
| | B, 7.00%, 6/30/32 | | | 5,967,000,000 | COP | | | 1,813,922 | |
| | senior bond, B, 11.00%, 7/24/20 | | | 9,167,000,000 | COP | | | 3,066,111 | |
| | senior bond, B, 7.00%, 5/04/22 | | | 10,237,000,000 | COP | | | 3,292,985 | |
| | senior bond, B, 10.00%, 7/24/24 | | | 40,977,000,000 | COP | | | 14,859,227 | |
| | senior bond, B, 7.50%, 8/26/26 | | | 77,594,200,000 | COP | | | 25,234,782 | |
| | senior bond, B, 6.00%, 4/28/28 | | | 42,303,600,000 | COP | | | 12,377,949 | |
| | senior note, B, 7.00%, 9/11/19 | | | 4,056,000,000 | COP | | | 1,267,970 | |
| | | | | | | | | | |
| | | | | | | | | 109,277,982 | |
| | | | | | | | | | |
| | | Ghana 1.5% | | | | | | |
| | Government of Ghana, | | | | | | | | |
| | 24.75%, 3/01/21 | | | 690,000 | GHS | | | 153,055 | |
| | 16.25%, 5/17/21 | | | 7,250,000 | GHS | | | 1,387,626 | |
| | 24.50%, 6/21/21 | | | 80,000 | GHS | | | 17,827 | |
| | 24.75%, 7/19/21 | | | 1,190,000 | GHS | | | 266,329 | |
| | 18.75%, 1/24/22 | | | 26,840,000 | GHS | | | 5,349,184 | |
| | 17.60%, 11/28/22 | | | 370,000 | GHS | | | 70,291 | |
| | 19.75%, 3/25/24 | | | 26,840,000 | GHS | | | 5,284,055 | |
| | 19.00%, 11/02/26 | | | 80,510,000 | GHS | | | 15,231,633 | |
FRANKLIN TEMPLETON VARIABLE INSURANCE PRODUCTS TRUST
STATEMENT OF INVESTMENTS
Templeton Global Bond VIP Fund(continued)
| | | | | | | | | | |
| | | |
| | | | | Principal Amount* | | | Value | |
| | | Foreign Government and Agency Securities(continued) | | | | | | |
| | | Ghana (continued) | | | | | | |
| | Government of Ghana, (continued) | | | | | | | | |
| | senior bond, 19.75%, 3/15/32 | | | 80,510,000 | GHS | | $ | 15,885,293 | |
| | senior note, 21.50%, 3/09/20 | | | 1,270,000 | GHS | | | 263,990 | |
| | senior note, 18.50%, 6/01/20 | | | 500,000 | GHS | | | 100,798 | |
| | senior note, 18.25%, 9/21/20 | | | 480,000 | GHS | | | 96,141 | |
| | senior note, 16.50%, 3/22/21 | | | 1,730,000 | GHS | | | 333,945 | |
| | | | | | | | | | |
| | | | | | | | | 44,440,167 | |
| | | | | | | | | | |
| | | India 8.2% | | | | | | |
| | Government of India, | | | | | | | | |
| | senior bond, 8.20%, 2/15/22 | | | 500,000,000 | INR | | | 7,398,304 | |
| | senior bond, 8.35%, 5/14/22 | | | 212,700,000 | INR | | | 3,166,500 | |
| | senior bond, 8.08%, 8/02/22 | | | 1,783,000,000 | INR | | | 26,351,853 | |
| | senior bond, 8.13%, 9/21/22 | | | 28,000,000 | INR | | | 414,832 | |
| | senior bond, 9.15%, 11/14/24 | | | 2,409,000,000 | INR | | | 37,636,080 | |
| | senior note, 8.27%, 6/09/20 | | | 1,222,000,000 | INR | | | 17,875,944 | |
| | senior note, 7.80%, 4/11/21 | | | 1,980,300,000 | INR | | | 28,894,675 | |
| | senior note, 8.79%, 11/08/21 | | | 653,000,000 | INR | | | 9,791,621 | |
| | senior note, 8.15%, 6/11/22 | | | 1,621,000,000 | INR | | | 24,015,591 | |
| | senior note, 6.84%, 12/19/22 | | | 98,000,000 | INR | | | 1,393,581 | |
| | senior note, 7.16%, 5/20/23 | | | 133,700,000 | INR | | | 1,915,041 | |
| | senior note, 8.83%, 11/25/23 | | | 2,983,900,000 | INR | | | 45,571,706 | |
| | senior note, 7.68%, 12/15/23 | | | 1,376,000,000 | INR | | | 20,144,149 | |
| | senior note, 6.79%, 5/15/27 | | | 1,142,800,000 | INR | | | 15,799,124 | |
| | | | | | | | | | |
| | | | | | | | | 240,369,001 | |
| | | | | | | | | | |
| | | Indonesia 4.2% | | | | | | |
| | Government of Indonesia, | | | | | | | | |
| | senior bond, FR34, 12.80%, 6/15/21 | | | 324,406,000,000 | IDR | | | 25,257,635 | |
| | senior bond, FR35, 12.90%, 6/15/22 | | | 71,229,000,000 | IDR | | | 5,704,260 | |
| | senior bond, FR39, 11.75%, 8/15/23 | | | 5,491,000,000 | IDR | | | 437,543 | |
| | senior bond, FR40, 11.00%, 9/15/25 | | | 46,856,000,000 | IDR | | | 3,749,459 | |
| | senior bond, FR43, 10.25%, 7/15/22 | | | 147,832,000,000 | IDR | | | 11,047,825 | |
| | senior bond, FR44, 10.00%, 9/15/24 | | | 4,454,000,000 | IDR | | | 337,550 | |
| | senior bond, FR46, 9.50%, 7/15/23 | | | 226,780,000,000 | IDR | | | 16,704,139 | |
| | senior bond, FR47, 10.00%, 2/15/28 | | | 12,000,000 | IDR | | | 936 | |
| | senior bond, FR52, 10.50%, 8/15/30 | | | 6,960,000,000 | IDR | | | 565,367 | |
| | senior bond, FR59, 7.00%, 5/15/27 | | | 47,752,000,000 | IDR | | | 3,102,720 | |
| | senior bond, FR61, 7.00%, 5/15/22 | | | 244,849,000,000 | IDR | | | 16,660,114 | |
| | senior bond, FR63, 5.625%, 5/15/23 | | | 258,951,000,000 | IDR | | | 16,657,152 | |
| | senior bond, FR64, 6.125%, 5/15/28 | | | 37,000,000 | IDR | | | 2,270 | |
| | senior bond, FR68, 8.375%, 3/15/34 | | | 81,180,000,000 | IDR | | | 5,682,884 | |
| | senior bond, FR70, 8.375%, 3/15/24 | | | 78,915,000,000 | IDR | | | 5,577,278 | |
| | senior bond, FR71, 9.00%, 3/15/29 | | | 51,222,000,000 | IDR | | | 3,760,612 | |
| | senior bond, FR73, 8.75%, 5/15/31 | | | 85,845,000,000 | IDR | | | 6,231,523 | |
| | | | | | | | | | |
| | | | | | | | | 121,479,267 | |
| | | | | | | | | | |
| | | Mexico 7.1% | | | | | | |
| | Government of Mexico, | | | | | | | | |
| | senior bond, M, 8.00%, 6/11/20 | | | 3,814,000d | MXN | | | 19,282,628 | |
| | senior bond, M, 6.50%, 6/10/21 | | | 18,568,200d | MXN | | | 90,348,767 | |
| | senior note, M, 5.00%, 12/11/19 | | | 18,742,300d | MXN | | | 92,347,305 | |
FRANKLIN TEMPLETON VARIABLE INSURANCE PRODUCTS TRUST
STATEMENT OF INVESTMENTS
Templeton Global Bond VIP Fund(continued)
| | | | | | | | | | |
| | | |
| | | | | Principal
Amount* | | | Value | |
| | Foreign Government and Agency Securities (continued) | | | | | | | | |
| | | Mexico (continued) | | | | | | |
| e | | Mexican Udibonos, | | | | | | | | |
| | Index Linked, 4.00%, 6/13/19 | | | 482,128f | MXN | | $ | 2,428,379 | |
| | Index Linked, 2.50%, 12/10/20 | | | 379,700f | MXN | | | 1,866,608 | |
| | | | | | | | | | |
| | | | | | | | | 206,273,687 | |
| | | | | | | | | | |
| | | Philippines 1.2% | | | | | | |
| | Government of the Philippines, | | | | | | | | |
| | senior note, 3.375%, 8/20/20 | | | 1,102,110,000 | PHP | | | 20,104,690 | |
| | senior note,7-56, 3.875%, 11/22/19 | | | 813,510,000 | PHP | | | 15,200,241 | |
| | | | | | | | | | |
| | | | | | | | | 35,304,931 | |
| | | | | | | | | | |
| | | South Korea 4.5% | | | | | | |
| | Korea Monetary Stabilization Bond, | | | | | | | | |
| | senior note, 2.06%, 12/02/19 | | | 91,389,000,000 | KRW | | | 82,224,666 | |
| | senior note, 2.05%, 10/05/20 | | | 31,280,000,000 | KRW | | | 28,177,362 | |
| | Korea Treasury Bond, | | | | | | | | |
| | senior note, 1.25%, 12/10/19 | | | 18,280,000,000 | KRW | | | 16,337,547 | |
| | senior note, 3.00%, 3/10/23 | | | 3,919,000,000 | KRW | | | 3,671,472 | |
| | | | | | | | | | |
| | | | | | | | | 130,411,047 | |
| | | | | | | | | | |
| g | | Supranational 0.3% | | | | | | |
| | Inter-American Development Bank, senior bond, 7.50%, 12/05/24 | | | 200,000,000 | MXN | | | 9,526,424 | |
| | | | | | | | | | |
| | | Ukraine 0.4% | | | | | | |
| h,i,j | | Government of Ukraine, 144A, VRI, GDP Linked Security, 5/31/40 | | | 18,866,000 | | | | 10,868,797 | |
| | | | | | | | | | |
| | | |
| | Total Foreign Government and Agency Securities (Cost $1,432,793,536) | | | | | | | 1,275,188,076 | |
| | | | | | | | | | |
| | | |
| | Short Term Investments 54.3% | | | | | | | | |
| | | Foreign Government and Agency Securities 19.5% | | | | | | |
| | | Argentina 1.7% | | | | | | |
| k | | Argentina Treasury Bill, 3/29/19 - 10/31/19 | | | 1,683,879,000 | ARS | | | 50,037,660 | |
| | | | | | | | | | |
| | Mexico 13.2% | | | | | | | | |
| k | | Mexico Treasury Bill, | | | | | | | | |
| | 1/31/19 - 11/07/19 | | | 89,813,130l | MXN | | | 44,347,625 | |
| | 5/23/19 | | | 328,255,360l | MXN | | | 161,691,303 | |
| | 7/04/19 | | | 366,093,817l | MXN | | | 178,312,030 | |
| | | | | | | | | | |
| | | | | | | | | 384,350,958 | |
| | | | | | | | | | |
| | | Philippines 0.4% | | | | | | |
| | Government of the Philippines, senior note, 7.875%, 2/19/19 | | | 129,560,000 | PHP | | | 2,477,446 | |
| k | | Philippine Treasury Bill, 3/06/19 - 3/20/19 | | | 547,070,000 | PHP | | | 10,332,823 | |
| | | | | | | | | | |
| | | | | | | | | 12,810,269 | |
| | | | | | | | | | |
FRANKLIN TEMPLETON VARIABLE INSURANCE PRODUCTS TRUST
STATEMENT OF INVESTMENTS
Templeton Global Bond VIP Fund(continued)
| | | | | | | | | | |
| | | |
| | | | | Principal Amount* | | | Value | |
| | Short Term Investments (continued) | | | | | | | | |
| | Foreign Government and Agency Securities(continued) | | | | | | | | |
| | | South Korea 4.2% | | | | | | |
| | Korea Monetary Stabilization Bond, | | | | | | | | |
| k | | 3/12/19 | | | 30,260,000,000 | KRW | | $ | 27,080,243 | |
| | senior note, 1.85%, 10/02/19 | | | 59,950,000,000 | KRW | | | 53,962,751 | |
| | senior note, 1.87%, 11/09/19 | | | 45,390,000,000 | KRW | | | 40,767,328 | |
| | | | | | | | | | |
| | | | | | | | | 121,810,322 | |
| | | | | | | | | | |
| | | |
| | Total Foreign Government and Agency Securities (Cost $578,364,389) | | | | | | | 569,009,209 | |
| | | | | | | | | | |
| | | |
| | U.S. Government and Agency Securities 12.1% | | | | | | | | |
| | | United States 12.1% | | | | | | |
| k | | U.S. Treasury Bill, | | | | | | | | |
| | 1/24/19 | | | 303,000,000 | | | | 302,571,816 | |
| | 1/31/19 - 2/28/19 | | | 43,723,000 | | | | 43,590,208 | |
| | U.S. Treasury Note, 2.75%, 2/15/19 | | | 8,339,000 | | | | 8,342,632 | |
| | | | | | | | | | |
| | | |
| | Total U.S. Government and Agency Securities (Cost $354,491,732) | | | | | | | 354,504,656 | |
| | | | | | | | | | |
| | | |
| | Total Investments before Money Market Funds (Cost $2,365,649,657) | | | | | | | 2,198,701,941 | |
| | | | | | | | | | |
| | | |
| | | | | Shares | | | | |
| | | |
| | Money Market Funds (Cost $663,563,266) 22.7% | | | | | | | | |
| | | United States 22.7% | | | | | | |
| m,n | | Institutional Fiduciary Trust Money Market Portfolio, 1.99% | | | 663,563,266 | | | | 663,563,266 | |
| | | | | | | | | | |
| | | |
| | Total Investments (Cost $3,029,212,923) 97.9% | | | | | | | 2,862,265,207 | |
| | | |
| | Other Assets, less Liabilities 2.1% | | | | | | | 61,992,615 | |
| | | | | | | | | | |
| | | |
| | Net Assets 100.0% | | | | | | $ | 2,924,257,822 | |
| | | | | | | | | | |
*The principal amount is stated in U.S. dollars unless otherwise indicated.
aThe coupon rate shown represents the rate at period end.
bRedemption price at maturity and coupon payment are adjusted for inflation. See Note 1(f).
cPrincipal amount is stated in 1,000 Brazilian Real Units.
dPrincipal amount is stated in 100 Mexican Peso Units.
ePrincipal amount of security is adjusted for inflation. See Note 1(f).
fPrincipal amount is stated in 100 Unidad de Inversion Units.
gA supranational organization is an entity formed by two or more central governments through international treaties.
hNon-income producing.
iSecurity was purchased pursuant to Rule 144A under the Securities Act of 1933 and may be sold in transactions exempt from registration only to qualified institutional buyers or in a public offering registered under the Securities Act of 1933. This security has been deemed liquid under guidelines approved by the Trust’s Board of Trustees. At December 31, 2018, the value of this security was $10,868,797, representing 0.4% of net assets.
jThe principal represents the notional amount. See Note 1(c) regarding value recovery instruments.
kThe security was issued on a discount basis with no stated coupon rate.
lPrincipal amount is stated in 10 Mexican Peso Units.
mSee Note 3(e) regarding investments in affiliated management investment companies.
nThe rate shown is the annualizedseven-day effective yield at period end.
FRANKLIN TEMPLETON VARIABLE INSURANCE PRODUCTS TRUST
STATEMENT OF INVESTMENTS
Templeton Global Bond VIP Fund(continued)
At December 31, 2018, the Fund had the following forward exchange contracts outstanding. See Note 1(c).
| | | | | | | | | | | | | | | | | | | | | | | | | | | | |
| Forward Exchange Contracts | |
| | | | | | | |
| Currency | | Counterpartya | | | Type | | | Quantity | | | Contract
Amount* | | | Settlement
Date | | | Unrealized
Appreciation | | | Unrealized
Depreciation | |
OTC Forward Exchange Contracts | | | | | | | | | | | | | | | | | | | | | | | | | |
Euro | | | GSCO | | | | Sell | | | | 17,044,025 | | | | 19,825,780 | | | | 1/04/19 | | | $ | 289,811 | | | $ | — | |
Japanese Yen | | | DBAB | | | | Sell | | | | 114,245,484 | | | | 1,015,344 | | | | 1/04/19 | | | | — | | | | (27,384 | ) |
Japanese Yen | | | JPHQ | | | | Sell | | | | 424,150,000 | | | | 3,756,465 | | | | 1/04/19 | | | | — | | | | (114,786 | ) |
Euro | | | DBAB | | | | Sell | | | | 8,136,104 | | | | 9,470,058 | | | | 1/07/19 | | | | 141,924 | | | | — | |
Euro | | | GSCO | | | | Sell | | | | 2,045,000 | | | | 2,336,331 | | | | 1/07/19 | | | | — | | | | (8,285 | ) |
Japanese Yen | | | SCNY | | | | Sell | | | | 415,980,000 | | | | 3,670,633 | | | | 1/07/19 | | | | — | | | | (126,984 | ) |
Euro | | | UBSW | | | | Sell | | | | 8,311,299 | | | | 9,662,301 | | | | 1/09/19 | | | | 131,612 | | | | — | |
Japanese Yen | | | HSBK | | | | Sell | | | | 400,800,000 | | | | 3,550,044 | | | | 1/09/19 | | | | — | | | | (109,590 | ) |
Japanese Yen | | | JPHQ | | | | Sell | | | | 2,831,950,000 | | | | 25,017,889 | | | | 1/09/19 | | | | — | | | | (840,146 | ) |
South Korean Won | | | HSBK | | | | Sell | | | | 42,561,000,000 | | | | 38,450,628 | | | | 1/10/19 | | | | 224,188 | | | | — | |
Australian Dollar | | | JPHQ | | | | Sell | | | | 5,243,250 | | | | 3,703,664 | | | | 1/11/19 | | | | 8,646 | | | | — | |
Euro | | | HSBK | | | | Sell | | | | 33,800,018 | | | | 39,106,621 | | | | 1/11/19 | | | | 340,764 | | | | — | |
Euro | | | JPHQ | | | | Sell | | | | 14,342,996 | | | | 16,538,551 | | | | 1/11/19 | | | | 88,307 | | | | — | |
Indian Rupee | | | JPHQ | | | | Buy | | | | 82,107,000 | | | | 1,101,812 | | | | 1/11/19 | | | | 77,339 | | | | — | |
Japanese Yen | | | BZWS | | | | Sell | | | | 1,689,110,000 | | | | 15,356,662 | | | | 1/11/19 | | | | — | | | | (68,833 | ) |
Japanese Yen | | | DBAB | | | | Sell | | | | 770,370,000 | | | | 6,868,491 | | | | 1/11/19 | | | | — | | | | (166,775 | ) |
Japanese Yen | | | GSCO | | | | Sell | | | | 329,010,000 | | | | 2,990,185 | | | | 1/11/19 | | | | — | | | | (14,441 | ) |
Japanese Yen | | | HSBK | | | | Sell | | | | 2,816,800,000 | | | | 25,074,218 | | | | 1/11/19 | | | | — | | | | (649,705 | ) |
Japanese Yen | | | JPHQ | | | | Sell | | | | 2,831,950,000 | | | | 25,730,614 | | | | 1/11/19 | | | | — | | | | (131,663 | ) |
Australian Dollar | | | JPHQ | | | | Sell | | | | 10,486,500 | | | | 7,448,666 | | | | 1/14/19 | | | | 58,147 | | | | — | |
Indian Rupee | | | JPHQ | | | | Buy | | | | 179,045,721 | | | | 2,395,100 | | | | 1/14/19 | | | | 175,574 | | | | — | |
Australian Dollar | | | CITI | | | | Sell | | | | 19,311,633 | | | | 13,736,461 | | | | 1/15/19 | | | | 126,000 | | | | — | |
Australian Dollar | | | JPHQ | | | | Sell | | | | 50,143,500 | | | | 35,716,463 | | | | 1/15/19 | | | | 376,306 | | | | — | |
Euro | | | BOFA | | | | Sell | | | | 17,769,000 | | | | 20,724,873 | | | | 1/15/19 | | | | 338,048 | | | | — | |
Euro | | | CITI | | | | Sell | | | | 37,063,039 | | | | 43,238,112 | | | | 1/15/19 | | | | 714,745 | | | | — | |
Euro | | | DBAB | | | | Sell | | | | 25,440,500 | | | | 29,684,230 | | | | 1/15/19 | | | | 495,698 | | | | — | |
Euro | | | GSCO | | | | Sell | | | | 1,789,884 | | | | 2,085,841 | | | | 1/15/19 | | | | 32,262 | | | | — | |
Indian Rupee | | | JPHQ | | | | Buy | | | | 179,029,279 | | | | 2,378,494 | | | | 1/15/19 | | | | 191,734 | | | | — | |
Japanese Yen | | | CITI | | | | Sell | | | | 138,680,000 | | | | 1,238,336 | | | | 1/15/19 | | | | — | | | | (28,550 | ) |
Japanese Yen | | | HSBK | | | | Sell | | | | 1,798,900,000 | | | | 15,987,948 | | | | 1/15/19 | | | | — | | | | (445,577 | ) |
Japanese Yen | | | JPHQ | | | | Sell | | | | 1,666,680,000 | | | | 14,885,856 | | | | 1/15/19 | | | | — | | | | (339,798 | ) |
Euro | | | BOFA | | | | Sell | | | | 5,251,819 | | | | 6,113,800 | | | | 1/16/19 | | | | 87,720 | | | | — | |
Euro | | | HSBK | | | | Sell | | | | 8,692,000 | | | | 10,117,749 | | | | 1/16/19 | | | | 144,311 | | | | — | |
Indian Rupee | | | HSBK | | | | Buy | | | | 402,232,000 | | | | 5,327,576 | | | | 1/16/19 | | | | 446,586 | | | | — | |
Japanese Yen | | | JPHQ | | | | Sell | | | | 708,450,000 | | | | 6,511,489 | | | | 1/16/19 | | | | 39,041 | | | | — | |
Euro | | | SCNY | | | | Sell | | | | 657,000 | | | | 767,609 | | | | 1/17/19 | | | | 13,683 | | | | — | |
Japanese Yen | | | BZWS | | | | Sell | | | | 2,516,120,000 | | | | 22,691,973 | | | | 1/17/19 | | | | — | | | | (297,360 | ) |
Indian Rupee | | | DBAB | | | | Buy | | | | 1,307,630,494 | | | | 18,650,462 | | | | 1/18/19 | | | | 117,917 | | | | — | |
Japanese Yen | | | HSBK | | | | Sell | | | | 1,245,390,000 | | | | 10,997,210 | | | | 1/18/19 | | | | — | | | | (382,627 | ) |
Euro | | �� | DBAB | | | | Sell | | | | 8,405,717 | | | | 9,742,310 | | | | 1/22/19 | | | | 92,222 | | | | — | |
Euro | | | GSCO | | | | Sell | | | | 1,231,111 | | | | 1,426,254 | | | | 1/22/19 | | | | 12,891 | | | | — | |
Euro | | | MSCO | | | | Sell | | | | 15,372,250 | | | | 17,814,132 | | | | 1/22/19 | | | | 166,194 | | | | — | |
Euro | | | UBSW | | | | Sell | | | | 1,922,305 | | | | 2,228,663 | | | | 1/22/19 | | | | 21,782 | | | | — | |
Japanese Yen | | | BZWS | | | | Sell | | | | 490,853,752 | | | | 4,406,188 | | | | 1/22/19 | | | | — | | | | (80,495 | ) |
Japanese Yen | | | SCNY | | | | Sell | | | | 707,660,000 | | | | 6,540,296 | | | | 1/22/19 | | | | 71,880 | | | | — | |
Euro | | | JPHQ | | | | Sell | | | | 28,236,000 | | | | 32,632,628 | | | | 1/23/19 | | | | 213,728 | | | | — | |
Euro | | | MSCO | | | | Sell | | | | 15,372,250 | | | | 17,761,098 | | | | 1/23/19 | | | | 111,592 | | | | — | |
Euro | | | DBAB | | | | Sell | | | | 14,940,282 | | | | 17,286,130 | | | | 1/24/19 | | | | 131,061 | | | | — | |
FRANKLIN TEMPLETON VARIABLE INSURANCE PRODUCTS TRUST
STATEMENT OF INVESTMENTS
Templeton Global Bond VIP Fund(continued)
| | | | | | | | | | | | | | | | | | | | | | | | | | | | |
| Forward Exchange Contracts(continued) | |
| | | | | | | |
| Currency | | Counterpartya | | | Type | | | Quantity | | | Contract
Amount* | | | Settlement
Date | | | Unrealized
Appreciation | | | Unrealized
Depreciation | |
OTC Forward Exchange Contracts(continued) | | | | | | | | | | | | | | | | | | | | | | | | | |
Euro | | | UBSW | | | | Sell | | | | 11,641,500 | | | | 13,478,296 | | | | 1/24/19 | | | $ | 111,029 | | | $ | — | |
Indian Rupee | | | JPHQ | | | | Buy | | | | 200,268,000 | | | | 2,689,786 | | | | 1/24/19 | | | | 183,252 | | | | — | |
Japanese Yen | | | BZWS | | | | Sell | | | | 735,200,000 | | | | 6,802,746 | | | | 1/24/19 | | | | 81,495 | | | | — | |
Japanese Yen | | | DBAB | | | | Sell | | | | 858,140,000 | | | | 7,912,844 | | | | 1/24/19 | | | | 67,667 | | | | — | |
Japanese Yen | | | JPHQ | | | | Sell | | | | 7,105,349,700 | | | | 65,733,367 | | | | 1/24/19 | | | | 775,752 | | | | — | |
South Korean Won | | | HSBK | | | | Sell | | | | 18,482,000,000 | | | | 16,370,964 | | | | 1/24/19 | | | | — | | | | (235,412 | ) |
Euro | | | DBAB | | | | Sell | | | | 4,518,681 | | | | 5,220,071 | | | | 1/25/19 | | | | 31,068 | | | | — | |
Euro | | | HSBK | | | | Sell | | | | 19,488,000 | | | | 22,498,116 | | | | 1/25/19 | | | | 119,176 | | | | — | |
Euro | | | JPHQ | | | | Sell | | | | 14,818,028 | | | | 17,124,528 | | | | 1/25/19 | | | | 108,325 | | | | — | |
Indian Rupee | | | DBAB | | | | Buy | | | | 838,950,988 | | | | 11,218,922 | | | | 1/25/19 | | | | 815,663 | | | | — | |
Japanese Yen | | | CITI | | | | Sell | | | | 913,412,000 | | | | 8,480,447 | | | | 1/25/19 | | | | 129,284 | | | | — | |
Japanese Yen | | | JPHQ | | | | Sell | | | | 1,407,000,000 | | | | 13,052,069 | | | | 1/25/19 | | | | 188,118 | | | | — | |
Euro | | | BOFA | | | | Sell | | | | 33,910,663 | | | | 38,983,698 | | | | 1/28/19 | | | | 32,189 | | | | — | |
Indonesian Rupiah | | | HSBK | | | | Buy | | | | 424,000,000,000 | | | | 28,234,667 | | | | 1/28/19 | | | | 1,094,632 | | | | — | |
Euro | | | CITI | | | | Sell | | | | 77,832,770 | | | | 89,656,346 | | | | 1/29/19 | | | | 245,729 | | | | — | |
Euro | | | GSCO | | | | Sell | | | | 2,855,793 | | | | 3,285,019 | | | | 1/29/19 | | | | 4,418 | | | | — | |
Euro | | | BOFA | | | | Sell | | | | 33,910,663 | | | | 38,790,848 | | | | 1/30/19 | | | | — | | | | (167,585 | ) |
Euro | | | SCNY | | | | Sell | | | | 12,300,264 | | | | 14,069,042 | | | | 1/30/19 | | | | — | | | | (62,177 | ) |
Indian Rupee | | | HSBK | | | | Buy | | | | 919,562,500 | | | | 12,383,846 | | | | 1/30/19 | | | | 801,736 | | | | — | |
South Korean Won | | | HSBK | | | | Sell | | | | 15,755,000,000 | | | | 13,891,461 | | | | 1/30/19 | | | | — | | | | (267,092 | ) |
Euro | | | BZWS | | | | Sell | | | | 22,495,166 | | | | 25,830,411 | | | | 1/31/19 | | | | — | | | | (15,287 | ) |
Euro | | | DBAB | | | | Sell | | | | 14,776,109 | | | | 16,957,063 | | | | 1/31/19 | | | | — | | | | (19,868 | ) |
Euro | | | GSCO | | | | Sell | | | | 13,037,050 | | | | 14,959,493 | | | | 1/31/19 | | | | — | | | | (19,355 | ) |
Euro | | | HSBK | | | | Sell | | | | 25,974,891 | | | | 29,820,681 | | | | 1/31/19 | | | | — | | | | (23,029 | ) |
Euro | | | JPHQ | | | | Sell | | | | 11,263,000 | | | | 12,915,203 | | | | 1/31/19 | | | | — | | | | (25,360 | ) |
Japanese Yen | | | BZWS | | | | Sell | | | | 1,079,470,000 | | | | 9,688,923 | | | | 1/31/19 | | | | — | | | | (185,253 | ) |
Japanese Yen | | | HSBK | | | | Sell | | | | 1,162,462,488 | | | | 10,918,216 | | | | 1/31/19 | | | | 284,888 | | | | — | |
Japanese Yen | | | MSCO | | | | Sell | | | | 287,615,000 | | | | 2,596,764 | | | | 1/31/19 | | | | — | | | | (34,121 | ) |
Euro | | | JPHQ | | | | Sell | | | | 32,859,900 | | | | 37,592,711 | | | | 2/01/19 | | | | — | | | | (164,438 | ) |
Japanese Yen | | | JPHQ | | | | Sell | | | | 1,719,500,000 | | | | 15,361,457 | | | | 2/01/19 | | | | — | | | | (368,375 | ) |
Japanese Yen | | | SCNY | | | | Sell | | | | 1,720,000,000 | | | | 15,370,867 | | | | 2/01/19 | | | | — | | | | (363,539 | ) |
Indian Rupee | | | JPHQ | | | | Buy | | | | 378,455,000 | | | | 5,051,725 | | | | 2/04/19 | | | | 371,562 | | | | — | |
Euro | | | JPHQ | | | | Sell | | | | 6,775,311 | | | | 7,781,377 | | | | 2/05/19 | | | | — | | | | (6,118 | ) |
Euro | | | JPHQ | | | | Sell | | | | 9,220,500 | | | | 10,553,894 | | | | 2/08/19 | | | | — | | | | (46,566 | ) |
Euro | | | JPHQ | | | | Sell | | | | 6,147,005 | | | | 7,039,953 | | | | 2/11/19 | | | | — | | | | (28,682 | ) |
Japanese Yen | | | JPHQ | | | | Sell | | | | 1,723,960,000 | | | | 16,157,682 | | | | 2/12/19 | | | | 374,411 | | | | — | |
Australian Dollar | | | CITI | | | | Sell | | | | 19,311,633 | | | | 13,688,626 | | | | 2/13/19 | | | | 70,947 | | | | — | |
Australian Dollar | | | JPHQ | | | | Sell | | | | 5,243,250 | | | | 3,718,775 | | | | 2/13/19 | | | | 21,475 | | | | — | |
Japanese Yen | | | BZWS | | | | Sell | | | | 1,712,605,900 | | | | 15,303,996 | | | | 2/13/19 | | | | — | | | | (376,468 | ) |
Japanese Yen | | | CITI | | | | Sell | | | | 1,245,045,665 | | | | 11,089,202 | | | | 2/13/19 | | | | — | | | | (310,323 | ) |
Euro | | | HSBK | | | | Sell | | | | 1,800,000 | | | | 2,072,061 | | | | 2/14/19 | | | | 1,699 | | | | — | |
Japanese Yen | | | CITI | | | | Sell | | | | 1,182,704,670 | | | | 11,163,647 | | | | 2/14/19 | | | | 334,121 | | | | — | |
Australian Dollar | | | JPHQ | | | | Sell | | | | 50,143,500 | | | | 36,589,587 | | | | 2/15/19 | | | | 1,229,659 | | | | — | |
Euro | | | JPHQ | | | | Sell | | | | 6,894,178 | | | | 7,836,406 | | | | 2/15/19 | | | | — | | | | (93,904 | ) |
Japanese Yen | | | CITI | | | | Sell | | | | 183,340,000 | | | | 1,623,081 | | | | 2/15/19 | | | | — | | | | (55,808 | ) |
Japanese Yen | | | CITI | | | | Sell | | | | 683,420,000 | | | | 6,520,250 | | | | 2/15/19 | | | | 262,007 | | | | — | |
Japanese Yen | | | JPHQ | | | | Sell | | | | 2,553,380,000 | | | | 23,346,256 | | | | 2/15/19 | | | | — | | | | (35,667 | ) |
Euro | | | BOFA | | | | Sell | | | | 10,878,191 | | | | 12,397,656 | | | | 2/19/19 | | | | — | | | | (119,336 | ) |
Euro | | | DBAB | | | | Sell | | | | 5,008,730 | | | | 5,702,990 | | | | 2/19/19 | | | | — | | | | (60,306 | ) |
FRANKLIN TEMPLETON VARIABLE INSURANCE PRODUCTS TRUST
STATEMENT OF INVESTMENTS
Templeton Global Bond VIP Fund(continued)
| | | | | | | | | | | | | | | | | | | | | | | | | | | | |
| Forward Exchange Contracts(continued) | |
| | | | | | | |
| Currency | | Counterpartya | | | Type | | | Quantity | | | Contract
Amount* | | | Settlement
Date | | | Unrealized
Appreciation | | | Unrealized
Depreciation | |
OTC Forward Exchange Contracts(continued) | | | | | | | | | | | | | | | | | | | | | |
Euro | | | GSCO | | | | Sell | | | | 1,898,500 | | | | 2,164,670 | | | | 2/19/19 | | | $ | — | | | $ | (19,840 | ) |
Euro | | | JPHQ | | | | Sell | | | | 30,863,836 | | | | 35,098,200 | | | | 2/19/19 | | | | — | | | | (415,280 | ) |
Japanese Yen | | | GSCO | | | | Sell | | | | 565,234,451 | | | | 5,028,374 | | | | 2/19/19 | | | | — | | | | (149,125 | ) |
Japanese Yen | | | HSBK | | | | Sell | | | | 413,563,000 | | | | 3,783,534 | | | | 2/19/19 | | | | — | | | | (4,667 | ) |
Japanese Yen | | | JPHQ | | | | Sell | | | | 709,066,000 | | | | 6,491,317 | | | | 2/19/19 | | | | — | | | | (3,667 | ) |
Japanese Yen | | | SCNY | | | | Sell | | | | 340,600,700 | | | | 3,102,575 | | | | 2/19/19 | | | | — | | | | (17,298 | ) |
South Korean Won | | | HSBK | | | | Sell | | | | 75,818,000,000 | | | | 67,852,157 | | | | 2/19/19 | | | | — | | | | (338,594 | ) |
Euro | | | JPHQ | | | | Sell | | | | 32,873,792 | | | | 37,820,640 | | | | 2/20/19 | | | | — | | | | (8,552 | ) |
Japanese Yen | | | BOFA | | | | Sell | | | | 903,250,850 | | | | 8,079,311 | | | | 2/20/19 | | | | — | | | | (194,992 | ) |
Australian Dollar | | | CITI | | | | Sell | | | | 13,307,000 | | | | 9,717,038 | | | | 2/21/19 | | | | 332,461 | | | | — | |
Euro | | | BOFA | | | | Sell | | | | 7,066,000 | | | | 8,141,233 | | | | 2/21/19 | | | | 9,468 | | | | — | |
Euro | | | GSCO | | | | Sell | | | | 1,230,811 | | | | 1,420,860 | | | | 2/21/19 | | | | 4,406 | | | | — | |
Euro | | | JPHQ | | | | Sell | | | | 19,848,799 | | | | 22,884,266 | | | | 2/21/19 | | | | 41,672 | | | | — | |
Euro | | | SCNY | | | | Sell | | | | 4,975,000 | | | | 5,746,623 | | | | 2/21/19 | | | | 21,243 | | | | — | |
Euro | | | UBSW | | | | Sell | | | | 2,600,555 | | | | 2,997,647 | | | | 2/21/19 | | | | 4,850 | | | | — | |
Japanese Yen | | | BOFA | | | | Sell | | | | 1,102,846,375 | | | | 9,846,843 | | | | 2/21/19 | | | | — | | | | (256,608 | ) |
Japanese Yen | | | CITI | | | | Sell | | | | 1,975,555,500 | | | | 18,141,172 | | | | 2/21/19 | | | | 42,615 | | | | — | |
Japanese Yen | | | DBAB | | | | Sell | | | | 1,635,382,000 | | | | 15,022,386 | | | | 2/21/19 | | | | 40,244 | | | | — | |
Euro | | | BZWS | | | | Sell | | | | 11,247,583 | | | | 12,894,229 | | | | 2/28/19 | | | | — | | | | (56,912 | ) |
Euro | | | DBAB | | | | Sell | | | | 14,781,916 | | | | 16,844,954 | | | | 2/28/19 | | | | — | | | | (175,830 | ) |
Euro | | | GSCO | | | | Sell | | | | 6,309,207 | | | | 7,206,416 | | | | 2/28/19 | | | | — | | | | (58,384 | ) |
Euro | | | SCNY | | | | Sell | | | | 12,544,218 | | | | 14,322,988 | | | | 2/28/19 | | | | — | | | | (121,176 | ) |
Japanese Yen | | | BNDP | | | | Sell | | | | 287,615,000 | | | | 2,545,383 | | | | 2/28/19 | | | | — | | | | (90,876 | ) |
Japanese Yen | | | BZWS | | | | Sell | | | | 1,920,010,000 | | | | 17,018,574 | | | | 2/28/19 | | | | — | | | | (580,098 | ) |
Japanese Yen | | | DBAB | | | | Sell | | | | 9,952,316,552 | | | | 88,017,981 | | | | 2/28/19 | | | | — | | | | (3,204,230 | ) |
Japanese Yen | | | HSBK | | | | Sell | | | | 1,339,587,000 | | | | 11,890,793 | | | | 2/28/19 | | | | — | | | | (387,764 | ) |
Japanese Yen | | | JPHQ | | | | Sell | | | | 1,375,249,000 | | | | 12,219,758 | | | | 2/28/19 | | | | — | | | | (385,675 | ) |
South Korean Won | | | HSBK | | | | Sell | | | | 35,277,000,000 | | | | 31,351,760 | | | | 2/28/19 | | | | — | | | | (387,998 | ) |
Australian Dollar | | | GSCO | | | | Sell | | | | 127,700,540 | | | | 93,467,856 | | | | 3/04/19 | | | | 3,394,384 | | | | — | |
Euro | | | BOFA | | | | Sell | | | | 27,627,938 | | | | 31,678,423 | | | | 3/04/19 | | | | — | | | | (145,107 | ) |
Euro | | | GSCO | | | | Sell | | | | 17,044,025 | | | | 19,546,258 | | | | 3/04/19 | | | | — | | | | (86,081 | ) |
Japanese Yen | | | HSBK | | | | Sell | | | | 1,247,125,000 | | | | 11,077,186 | | | | 3/04/19 | | | | — | | | | (357,973 | ) |
Japanese Yen | | | JPHQ | | | | Sell | | | | 424,150,000 | | | | 3,774,601 | | | | 3/04/19 | | | | — | | | | (114,522 | ) |
Euro | | | GSCO | | | | Sell | | | | 8,105,300 | | | | 9,262,899 | | | | 3/05/19 | | | | — | | | | (74,115 | ) |
Euro | | | SCNY | | | | Sell | | | | 17,972,751 | | | | 20,547,348 | | | | 3/05/19 | | | | — | | | | (156,616 | ) |
Euro | | | BOFA | | | | Sell | | | | 34,170,296 | | | | 39,223,229 | | | | 3/06/19 | | | | — | | | | (143,263 | ) |
Euro | | | DBAB | | | | Sell | | | | 8,136,104 | | | | 9,312,844 | | | | 3/06/19 | | | | — | | | | (60,497 | ) |
Euro | | | UBSW | | | | Sell | | | | 6,231,299 | | | | 7,159,171 | | | | 3/06/19 | | | | — | | | | (19,707 | ) |
Euro | | | BZWS | | | | Sell | | | | 7,003,000 | | | | 8,022,112 | | | | 3/11/19 | | | | — | | | | (49,446 | ) |
Euro | | | DBAB | | | | Sell | | | | 13,483,000 | | | | 15,494,124 | | | | 3/11/19 | | | | — | | | | (46,189 | ) |
Japanese Yen | | | BZWS | | | | Sell | | | | 1,720,220,000 | | | | 15,392,090 | | | | 3/11/19 | | | | — | | | | (391,509 | ) |
Japanese Yen | | | CITI | | | | Sell | | | | 3,966,300,000 | | | | 35,476,341 | | | | 3/11/19 | | | | — | | | | (915,800 | ) |
Japanese Yen | | | HSBK | | | | Sell | | | | 2,052,400,000 | | | | 18,338,181 | | | | 3/11/19 | | | | — | | | | (493,282 | ) |
Euro | | | DBAB | | | | Sell | | | | 25,440,500 | | | | 29,251,105 | | | | 3/12/19 | | | | — | | | | (73,890 | ) |
Japanese Yen | | | DBAB | | | | Sell | | | | 595,700,000 | | | | 5,317,919 | | | | 3/12/19 | | | | — | | | | (148,351 | ) |
Australian Dollar | | | CITI | | | | Sell | | | | 19,379,733 | | | | 14,001,567 | | | | 3/13/19 | | | | 330,274 | | | | — | |
Indian Rupee | | | DBAB | | | | Buy | | | | 258,123,000 | | | | 3,533,511 | | | | 3/13/19 | | | | 148,490 | | | | — | |
Japanese Yen | | | CITI | | | | Sell | | | | 310,702,000 | | | | 2,767,638 | | | | 3/13/19 | | | | — | | | | (83,701 | ) |
Euro | | | JPHQ | | | | Sell | | | | 6,775,311 | | | | 7,753,395 | | | | 3/14/19 | | | | — | | | | (57,840 | ) |
FRANKLIN TEMPLETON VARIABLE INSURANCE PRODUCTS TRUST
STATEMENT OF INVESTMENTS
Templeton Global Bond VIP Fund(continued)
Forward Exchange Contracts(continued)
| | | | | | | | | | | | | | | | | | | | | | | | | | | | |
| | | | | | | |
| Currency | | Counterpartya | | | Type | | | Quantity | | | Contract
Amount* | | | Settlement
Date | | | Unrealized
Appreciation | | | Unrealized
Depreciation | |
OTC Forward Exchange Contracts(continued) | | | | | | | | | | | | | | | | | |
Japanese Yen | | | JPHQ | | | | Sell | | | | 335,950,000 | | | | 2,987,072 | | | | 3/14/19 | | | $ | — | | | $ | (96,265 | ) |
Japanese Yen | | | SCNY | | | | Sell | | | | 366,681,000 | | | | 3,264,494 | | | | 3/14/19 | | | | — | | | | (100,891 | ) |
Euro | | | BOFA | | | | Sell | | | | 5,439,095 | | | | 6,181,314 | | | | 3/18/19 | | | | — | | | | (91,659 | ) |
Euro | | | GSCO | | | | Sell | | | | 1,789,884 | | | | 2,050,222 | | | | 3/18/19 | | | | — | | | | (14,072 | ) |
Japanese Yen | | | BOFA | | | | Sell | | | | 903,250,850 | | | | 8,007,756 | | | | 3/18/19 | | | | — | | | | (285,411 | ) |
Japanese Yen | | | CITI | | | | Sell | | | | 1,782,638,500 | | | | 15,819,029 | | | | 3/18/19 | | | | — | | | | (548,206 | ) |
Japanese Yen | | | DBAB | | | | Sell | | | | 1,453,310,000 | | | | 12,892,000 | | | | 3/18/19 | | | | — | | | | (451,517 | ) |
Japanese Yen | | | GSCO | | | | Sell | | | | 565,336,378 | | | | 5,017,051 | | | | 3/18/19 | | | | — | | | | (173,566 | ) |
Japanese Yen | | | HSBK | | | | Sell | | | | 1,245,390,000 | | | | 11,047,008 | | | | 3/18/19 | | | | — | | | | (387,498 | ) |
Japanese Yen | | | JPHQ | | | | Sell | | | | 702,800,000 | | | | 6,238,333 | | | | 3/18/19 | | | | — | | | | (214,402 | ) |
Japanese Yen | | | MSCO | | | | Sell | | | | 300,000,000 | | | | 2,660,848 | | | | 3/18/19 | | | | — | | | | (93,592 | ) |
Japanese Yen | | | DBAB | | | | Sell | | | | 371,821,000 | | | | 3,317,490 | | | | 3/19/19 | | | | — | | | | (96,697 | ) |
Indian Rupee | | | CITI | | | | Buy | | | | 69,318,000 | | | | 949,887 | | | | 3/20/19 | | | | 38,046 | | | | — | |
Japanese Yen | | | CITI | | | | Sell | | | | 1,372,892,008 | | | | 12,403,596 | | | | 3/20/19 | | | | — | | | | (203,972 | ) |
South Korean Won | | | CITI | | | | Sell | | | | 4,215,000,000 | | | | 3,752,003 | | | | 3/20/19 | | | | — | | | | (43,431 | ) |
South Korean Won | | | HSBK | | | | Sell | | | | 7,007,000,000 | | | | 6,538,515 | | | | 3/20/19 | | | | 229,001 | | | | — | |
Euro | | | GSCO | | | | Sell | | | | 1,230,811 | | | | 1,417,709 | | | | 3/21/19 | | | | — | | | | (2,183 | ) |
Japanese Yen | | | JPHQ | | | | Sell | | | | 1,547,456,000 | | | | 13,885,005 | | | | 3/22/19 | | | | — | | | | (328,336 | ) |
Japanese Yen | | | JPHQ | | | | Sell | | | | 1,203,160,329 | | | | 10,855,810 | | | | 3/25/19 | | | | — | | | | (198,350 | ) |
Japanese Yen | | | SCNY | | | | Sell | | | | 937,086,000 | | | | 8,445,868 | | | | 3/25/19 | | | | — | | | | (163,706 | ) |
Japanese Yen | | | CITI | | | | Sell | | | | 1,866,452,000 | | | | 16,816,731 | | | | 3/26/19 | | | | — | | | | (333,128 | ) |
Japanese Yen | | | DBAB | | | | Sell | | | | 2,181,107,000 | | | | 19,655,456 | | | | 3/26/19 | | | | — | | | | (385,604 | ) |
Japanese Yen | | | HSBK | | | | Sell | | | | 1,621,372,000 | | | | 14,592,494 | | | | 3/26/19 | | | | — | | | | (305,452 | ) |
Euro | | | BZWS | | | | Sell | | | | 11,247,583 | | | | 12,859,755 | | | | 3/28/19 | | | | — | | | | (123,902 | ) |
Brazilian Real | | | CITI | | | | Buy | | | | 206,375,000 | | | | 42,453,509 | EUR | | | 4/01/19 | | | | 3,915,772 | | | | — | |
Japanese Yen | | | CITI | | | | Sell | | | | 755,114,665 | | | | 6,822,349 | | | | 4/15/19 | | | | — | | | | (128,054 | ) |
Japanese Yen | | | DBAB | | | | Sell | | | | 1,406,600,000 | | | | 12,699,015 | | | | 4/15/19 | | | | — | | | | (247,942 | ) |
Japanese Yen | | | HSBK | | | | Sell | | | | 536,380,000 | | | | 4,874,033 | | | | 4/17/19 | | | | — | | | | (63,870 | ) |
Japanese Yen | | | GSCO | | | | Sell | | | | 565,234,451 | | | | 5,115,383 | | | | 4/18/19 | | | | — | | | | (88,590 | ) |
Japanese Yen | | | HSBK | | | | Sell | | | | 1,106,730,400 | | | | 10,022,825 | | | | 4/22/19 | | | | — | | | | (169,985 | ) |
Japanese Yen | | | JPHQ | | | | Sell | | | | 1,886,055,000 | | | | 17,026,229 | | | | 4/22/19 | | | | — | | | | (344,036 | ) |
Japanese Yen | | | JPHQ | | | | Sell | | | | 2,504,432,000 | | | | 22,627,990 | | | | 4/23/19 | | | | — | | | | (439,364 | ) |
Indonesian Rupiah | | | JPHQ | | | | Buy | | | | 1,721,000,000,000 | | | | 109,778,657 | | | | 4/26/19 | | | | 7,835,438 | | | | — | |
Japanese Yen | | | BZWS | | | | Sell | | | | 983,714,840 | | | | 8,916,356 | | | | 4/26/19 | | | | — | | | | (146,542 | ) |
South Korean Won | | | HSBK | | | | Sell | | | | 8,274,880,977 | | | | 7,371,503 | | | | 4/29/19 | | | | — | | | | (92,216 | ) |
Japanese Yen | | | DBAB | | | | Sell | | | | 115,414,516 | | | | 1,043,479 | | | | 4/30/19 | | | | — | | | | (20,184 | ) |
Japanese Yen | | | GSCO | | | | Sell | | | | 944,420,000 | | | | 8,540,681 | | | | 4/30/19 | | | | — | | | | (163,118 | ) |
Japanese Yen | | | CITI | | | | Sell | | | | 708,852,119 | | | | 6,383,927 | | | | 5/07/19 | | | | — | | | | (152,715 | ) |
South Korean Won | | | DBAB | | | | Sell | | | | 13,920,000,000 | | | | 12,358,503 | | | | 5/16/19 | | | | — | | | | (206,060 | ) |
Japanese Yen | | | BZWS | | | | Sell | | | | 490,853,752 | | | | 4,380,335 | | | | 5/20/19 | | | | — | | | | (150,996 | ) |
Japanese Yen | | | BOFA | | | | Sell | | | | 2,190,917,500 | | | | 19,701,964 | | | | 5/21/19 | | | | — | | | | (525,255 | ) |
South Korean Won | | | GSCO | | | | Sell | | | | 44,346,000,000 | | | | 40,059,621 | | | | 6/07/19 | | | | — | | | | (5,831 | ) |
South Korean Won | | | DBAB | | | | Sell | | | | 13,919,000,000 | | | | 12,521,590 | | | | 6/10/19 | | | | — | | | | (55,472 | ) |
| | | | | | | | | | | | | | | | | | | | | | | | |
Total Forward Exchange Contracts | | | $ | 29,610,379 | | | $ | (24,834,593 | ) |
| | | | | | | | | | | | | | | | | | | | | | | | |
Net unrealized appreciation (depreciation) | | | $ | 4,775,786 | | | | | |
| | | | | | | | | | | | | | | | | | | | | | | | | | | | |
*In U.S. dollars unless otherwise indicated. aMay be comprised of multiple contracts with the same counterparty, currency and settlement date.
FRANKLIN TEMPLETON VARIABLE INSURANCE PRODUCTS TRUST
STATEMENT OF INVESTMENTS
Templeton Global Bond VIP Fund(continued)
At December 31, 2018, the Fund had the following interest rate swap contracts outstanding. See Note 1(c).
| | | | | | | | | | | | | | | | | | | | |
| Interest Rate Swap Contracts | | | | | | | | | | | | | | | |
| | | | | |
| Description | | Payment
Frequency | | | Counterparty | | | Maturity
Date | | | Notional
Amount | | | Value/
Unrealized
Appreciation
(Depreciation) | |
| Centrally Cleared Swap Contracts | | | | | | | | | | | | | | | | | | | | |
Receive Floating3-month USD LIBOR
Pay Fixed 3.558% | |
| Quarterly
Semi-Annual |
| | | | | | | 3/04/21 | | | $ | 3,240,000 | | | $ | (92,542 | ) |
Receive Floating3-month USD LIBOR
Pay Fixed 2.775% | |
| Quarterly
Semi-Annual |
| | | | | | | 10/04/23 | | | | 13,090,000 | | | | (126,674 | ) |
Receive Floating3-month USD LIBOR
Pay Fixed 2.795% | |
| Quarterly
Semi-Annual |
| | | | | | | 10/04/23 | | | | 13,090,000 | | | | (139,019 | ) |
Receive Floating3-month USD LIBOR
Pay Fixed 2.765% | |
| Quarterly
Semi-Annual |
| | | | | | | 10/07/23 | | | | 13,090,000 | | | | (120,200 | ) |
Receive Floating3-month USD LIBOR
Pay Fixed 2.731% | |
| Quarterly
Semi-Annual |
| | | | | | | 7/07/24 | | | | 34,000,000 | | | | (507,038 | ) |
Receive Floating3-month USD LIBOR
Pay Fixed 1.914% | |
| Quarterly
Semi-Annual |
| | | | | | | 1/22/25 | | | | 114,670,000 | | | | 3,976,864 | |
Receive Floating3-month USD LIBOR
Pay Fixed 1.970% | |
| Quarterly
Semi-Annual |
| | | | | | | 1/23/25 | | | | 143,340,000 | | | | 4,482,612 | |
Receive Floating3-month USD LIBOR
Pay Fixed 1.973% | |
| Quarterly
Semi-Annual |
| | | | | | | 1/27/25 | | | | 84,590,000 | | | | 2,621,575 | |
Receive Floating3-month USD LIBOR
Pay Fixed 1.937% | |
| Quarterly
Semi-Annual |
| | | | | | | 1/29/25 | | | | 21,150,000 | | | | 703,939 | |
Receive Floating3-month USD LIBOR
Pay Fixed 1.942% | |
| Quarterly
Semi-Annual |
| | | | | | | 1/30/25 | | | | 17,910,000 | | | | 591,214 | |
Receive Floating3-month USD LIBOR
Pay Fixed 1.817% | |
| Quarterly
Semi-Annual |
| | | | | | | 2/03/25 | | | | 28,210,000 | | | | 1,146,162 | |
Receive Floating3-month USD LIBOR
Pay Fixed 4.349% | |
| Quarterly
Semi-Annual |
| | | | | | | 2/25/41 | | | | 7,460,000 | | | | (2,013,516 | ) |
Receive Floating3-month USD LIBOR
Pay Fixed 4.320% | |
| Quarterly
Semi-Annual |
| | | | | | | 2/28/41 | | | | 5,600,000 | | | | (1,470,281 | ) |
Receive Floating3-month USD LIBOR
Pay Fixed 4.299% | |
| Quarterly
Semi-Annual |
| | | | | | | 3/01/41 | | | | 1,870,000 | | | | (483,711 | ) |
Receive Floating3-month USD LIBOR
Pay Fixed 3.668% | |
| Quarterly
Semi-Annual |
| | | | | | | 10/04/43 | | | | 6,370,000 | | | | (981,901 | ) |
Receive Floating3-month USD LIBOR
Pay Fixed 3.687% | |
| Quarterly
Semi-Annual |
| | | | | | | 10/04/43 | | | | 6,370,000 | | | | (1,003,864 | ) |
Receive Floating3-month USD LIBOR
Pay Fixed 3.675% | |
| Quarterly
Semi-Annual |
| | | | | | | 10/07/43 | | | | 6,370,000 | | | | (989,276 | ) |
Receive Floating3-month USD LIBOR
Pay Fixed 2.378% | |
| Quarterly
Semi-Annual |
| | | | | | | 11/18/46 | | | | 122,400,000 | | | | 11,340,664 | |
Receive Floating3-month USD LIBOR
Pay Fixed 2.537% | |
| Quarterly
Semi-Annual |
| | | | | | | 4/13/47 | | | | 72,700,000 | | | | 4,438,588 | |
Receive Floating3-month USD LIBOR
Pay Fixed 2.587% | |
| Quarterly
Semi-Annual |
| | | | | | | 7/27/47 | | | | 36,700,000 | | | | 1,635,337 | |
Receive Floating3-month USD LIBOR
Pay Fixed 2.980% | |
| Quarterly
Semi-Annual |
| | | | | | | 2/20/48 | | | | 15,638,000 | | | | (603,682 | ) |
Receive Floating3-month USD LIBOR
Pay Fixed 3.002% | |
| Quarterly
Semi-Annual |
| | | | | | | 2/22/48 | | | | 15,638,000 | | | | (627,831 | ) |
FRANKLIN TEMPLETON VARIABLE INSURANCE PRODUCTS TRUST
STATEMENT OF INVESTMENTS
Templeton Global Bond VIP Fund(continued)
Interest Rate Swap Contracts(continued)
| | | | | | | | | | | | | | | | | | | | |
| | | | | |
| Description | | Payment
Frequency | | | Counterparty | | | Maturity
Date | | | Notional
Amount | | | Value/ Unrealized
Appreciation
(Depreciation) | |
Centrally Cleared Swap Contracts(continued) | | | | | | | | | | | | | | | | | | | | |
Receive Floating3-month USD LIBOR
Pay Fixed 3.019% | |
| Quarterly
Semi-Annual |
| | | | | | | 2/23/48 | | | $ | 15,638,000 | | | $ | (682,219 | ) |
| | | | | | | | | | | | | | | | | | | | |
Total Centrally Cleared Swap Contracts | | | | | | | | | | | | | | | | | | $ | 21,095,201 | |
| | | | | | | | | | | | | | | | | | | | |
| OTC Swap Contracts | | | | | | | | | | | | | | | | | | | | |
Receive Floating3-month USD LIBOR
Pay Fixed 3.523% | |
| Quarterly
Semi-Annual |
| | | DBAB | | | | 3/28/21 | | | $ | 14,630,000 | | | $ | (406,137 | ) |
Receive Floating3-month USD LIBOR
Pay Fixed 4.347% | |
| Quarterly
Semi-Annual |
| | | CITI | | | | 2/25/41 | | | | 7,460,000 | | | | (1,992,395 | ) |
| | | | | | | | | | | | | | | | | | | | |
Total OTC Swap Contracts | | | | | | | | | | | | | | | | | | $ | (2,398,532 | ) |
| | | | | | | | | | | | | | | | | | | | |
Total Interest Rate Swap Contracts | | | | | | | | | | | | | | | | | | $ | 18,696,669 | |
| | | | | | | | | | | | | | | | | | | | |
See Note 9 regarding other derivative information.
See Abbreviations on pageTGB-34.
| | | | | | |
| | | |
| | The accompanying notes are an integral part of these financial statements. | Annual Report | | | TGB-19 | |
FRANKLIN TEMPLETON VARIABLE INSURANCE PRODUCTS TRUST
Financial Statements
Statement of Assets and Liabilities
December 31, 2018
| | | | |
| |
| | | Templeton
Global Bond
VIP Fund | |
Assets: | | | | |
Investments in securities: | | | | |
Cost - Unaffiliated issuers | | $ | 2,365,649,657 | |
Cost -Non-controlled affiliates (Note 3e) | | | 663,563,266 | |
| | | | |
Value - Unaffiliated issuers | | $ | 2,198,701,941 | |
Value -Non-controlled affiliates (Note 3e) | | | 663,563,266 | |
Cash | | | 4,066 | |
Restricted cash for OTC derivative contracts (Note 1d) | | | 7,370,000 | |
Foreign currency, at value (cost $2,685,864) | | | 2,706,326 | |
Receivables: | | | | |
Capital shares sold | | | 126,152 | |
Interest | | | 25,549,665 | |
Deposits with brokers for: | | | | |
OTC derivative contracts | | | 4,900,000 | |
Centrally cleared swap contracts | | | 39,568,636 | |
Unrealized appreciation on OTC forward exchange contracts | | | 29,610,379 | |
Other assets | | | 1,656 | |
| | | | |
Total assets | | | 2,972,102,087 | |
| | | | |
Liabilities: | | | | |
Payables: | | | | |
Capital shares redeemed | | | 4,750,816 | |
Management fees | | | 949,151 | |
Distribution fees | | | 1,145,887 | |
Variation margin on centrally cleared swap contracts | | | 3,205,735 | |
Deposits from brokers for: | | | | |
OTC derivative contracts | | | 7,370,000 | |
Unrealized depreciation on OTC forward exchange contracts | | | 24,834,593 | |
Unrealized depreciation on OTC swap contracts | | | 2,398,532 | |
Deferred tax. | | | 1,878,111 | |
Accrued expenses and other liabilities | | | 1,311,440 | |
| | | | |
Total liabilities | | | 47,844,265 | |
| | | | |
Net assets, at value | | $ | 2,924,257,822 | |
| | | | |
Net assets consist of: | | | | |
Paid-in capital | | $ | 2,901,979,238 | |
Total distributable earnings (loss) | | | 22,278,584 | |
| | | | |
Net assets, at value | | $ | 2,924,257,822 | |
| | | | |
| | | | |
| | | |
| TGB-20 | | Annual Report | The accompanying notes are an integral part of these financial statements. | | |
FRANKLIN TEMPLETON VARIABLE INSURANCE PRODUCTS TRUST
FINANCIAL STATEMENTS
Statement of Assets and Liabilities(continued)
December 31, 2018
| | | | |
| |
| | | Templeton
Global Bond
VIP Fund | |
| |
| Class 1: | | | | |
Net assets, at value | | $ | 285,046,352 | |
| | | | |
Shares outstanding | | | 16,247,983 | |
| | | | |
Net asset value and maximum offering price per share | | $ | 17.54 | |
| | | | |
| |
| Class 2: | | | | |
Net assets, at value | | $ | 2,544,899,899 | |
| | | | |
Shares outstanding | | | 151,216,065 | |
| | | | |
Net asset value and maximum offering price per share | | $ | 16.83 | |
| | | | |
| |
| Class 4: | | | | |
Net assets, at value | | $ | 94,311,571 | |
| | | | |
Shares outstanding | | | 5,487,633 | |
| | | | |
Net asset value and maximum offering price per share | | $ | 17.19 | |
| | | | |
| | | | | | |
| | | |
| | The accompanying notes are an integral part of these financial statements. | Annual Report | | | TGB-21 | |
FRANKLIN TEMPLETON VARIABLE INSURANCE PRODUCTS TRUST
FINANCIAL STATEMENTS
Statement of Operations
for the year ended December 31, 2018
| | | | |
| |
| | | Templeton
Global Bond
VIP Fund | |
Investment income: | | | | |
Dividends: | | | | |
Non-controlled affiliates (Note 3e) | | $ | 11,696,733 | |
Interest: (net of foreign taxes)~ | | | | |
Unaffiliated issuers | | | 158,127,480 | |
| | | | |
Total investment income | | | 169,824,213 | |
| | | | |
Expenses: | | | | |
Management fees (Note 3a) | | | 14,050,169 | |
Distribution fees: (Note 3c) | | | | |
Class 2 | | | 6,709,440 | |
Class 4 | | | 338,750 | |
Custodian fees (Note 4) | | | 1,456,264 | |
Reports to shareholders | | | 399,898 | |
Professional fees | | | 111,570 | |
Trustees’ fees and expenses | | | 21,724 | |
Other | | | 1,077,705 | |
| | | | |
Total expenses | | | 24,165,520 | |
Expense reductions (Note 4) | | | (469,657 | ) |
Expenses waived/paid by affiliates (Note 3e) | | | (2,797,583 | ) |
| | | | |
Net expenses | | | 20,898,280 | |
| | | | |
Net investment income | | | 148,925,933 | |
| | | | |
Realized and unrealized gains (losses): | | | | |
Net realized gain (loss) from: | | | | |
Investments:# | | | | |
Unaffiliated issuers | | | (29,938,288 | ) |
Foreign currency transactions | | | (7,220,227 | ) |
Forward exchange contracts | | | 69,036,333 | |
Swap contracts | | | (2,482,814 | ) |
| | | | |
Net realized gain (loss) | | | 29,395,004 | |
| | | | |
Net change in unrealized appreciation (depreciation) on: | | | | |
Investments: | | | | |
Unaffiliated issuers | | | (184,542,575 | ) |
Translation of other assets and liabilities denominated in foreign currencies | | | (444,386 | ) |
Forward exchange contracts | | | 41,776,037 | |
Swap contracts | | | 23,456,839 | |
Change in deferred taxes on unrealized appreciation | | | 1,371,393 | |
| | | | |
Net change in unrealized appreciation (depreciation) | | | (118,382,692 | ) |
| | | | |
Net realized and unrealized gain (loss) | | | (88,987,688 | ) |
| | | | |
Net increase (decrease) in net assets resulting from operations | | $ | 59,938,245 | |
| | | | |
| |
~Foreign taxes withheld on interest | | $ | 4,550,208 | |
#Net of foreign taxes | | $ | 133,955 | |
| | | | |
| | | |
| TGB-22 | | Annual Report | The accompanying notes are an integral part of these financial statements. | | |
FRANKLIN TEMPLETON VARIABLE INSURANCE PRODUCTS TRUST
FINANCIAL STATEMENTS
Statements of Changes in Net Assets
| | | | | | | | |
| |
| | | Templeton Global
Bond VIP Fund | |
| |
| | | Year Ended December 31, | |
| | |
| | | 2018 | | | 2017 | |
Increase (decrease) in net assets: | | | | | | | | |
Operations: | | | | | | | | |
Net investment income | | $ | 148,925,933 | | | $ | 144,457,894 | |
Net realized gain (loss) | | | 29,395,004 | | | | (84,441,214 | ) |
Net change in unrealized appreciation (depreciation) | | | (118,382,692 | ) | | | 1,318,770 | |
| | | | |
Net increase (decrease) in net assets resulting from operations | | | 59,938,245 | | | | 61,335,450 | |
| | | | |
Distributions to shareholders: (Note 1f) | | | | | | | | |
Class 1 | | | — | | | | (806,829 | ) |
Class 2 | | | — | | | | (8,999,053 | ) |
Class 4 | | | — | | | | (307,109 | ) |
| | | | |
Total distributions to shareholders | | | — | | | | (10,112,991 | ) |
| | | | |
Capital share transactions: (Note 2) | | | | | | | | |
Class 1 | | | (7,760,972 | ) | | | 40,791,975 | |
Class 2 | | | (237,044,140 | ) | | | (128,337,512 | ) |
Class 4 | | | (6,392,585 | ) | | | 715,746 | |
| | | | |
Total capital share transactions | | | (251,197,697 | ) | | | (86,829,791 | ) |
| | | | |
Net increase (decrease) in net assets | | | (191,259,452 | ) | | | (35,607,332 | ) |
Net assets: | | | | | | | | |
Beginning of year | | | 3,115,517,274 | | | | 3,151,124,606 | |
| | | | |
End of year (Note 1f) | | $ | 2,924,257,822 | | | $ | 3,115,517,274 | |
| | | | |
| | | | | | |
| | | |
| | The accompanying notes are an integral part of these financial statements. | Annual Report | | | TGB-23 | |
FRANKLIN TEMPLETON VARIABLE INSURANCE PRODUCTS TRUST
Notes to Financial Statements
Templeton Global Bond VIP Fund
1. Organization and Significant Accounting Policies
Franklin Templeton Variable Insurance Products Trust (Trust) is registered under the Investment Company Act of 1940 (1940 Act) as anopen-end management investment company, consisting of eighteen separate funds and applies the specialized accounting and reporting guidance in U.S. Generally Accepted Accounting Principles (U.S. GAAP). Templeton Global Bond VIP Fund (Fund) is included in this report. Shares of the Fund are generally sold only to insurance company separate accounts to fund the benefits of variable life insurance policies or variable annuity contracts. The Fund offers three classes of shares: Class 1, Class 2 and Class 4. Each class of shares may differ by its distribution fees, voting rights on matters affecting a single class and its exchange privilege.
The following summarizes the Fund’s significant accounting policies.
a. Financial Instrument Valuation
The Fund’s investments in financial instruments are carried at fair value daily. Fair value is the price that would be received to sell an asset or paid to transfer a liability in an orderly transaction between market participants on the measurement date. The Fund calculates the net asset value (NAV) per share each business day as of 4 p.m. Eastern time or the regularly scheduled close of the New York Stock Exchange (NYSE), whichever is earlier. Under compliance policies and procedures approved by the Trust’s Board of Trustees (the Board), the Fund’s administrator has responsibility for oversight of valuation, including leading the cross-functional Valuation Committee (VC). The Fund may utilize independent pricing services, quotations from securities and financial instrument dealers, and other market sources to determine fair value.
Debt securities generally trade in theover-the-counter (OTC) market rather than on a securities exchange. The Fund’s pricing services use multiple valuation techniques to determine fair value. In instances where sufficient market activity exists, the pricing services may utilize a market-based approach through which quotes from market makers are used to determine fair value. In instances where sufficient market activity may not exist or is limited, the pricing services also utilize proprietary valuation models which may consider market characteristics such as benchmark yield curves, credit spreads, estimated default rates, anticipated market interest rate volatility, coupon rates, anticipated timing of principal repayments, underlying
collateral, and other unique security features in order to estimate the relevant cash flows, which are then discounted to calculate the fair value. Securities denominated in a foreign currency are converted into their U.S. dollar equivalent at the foreign exchange rate in effect at 4 p.m. Eastern time on the date that the values of the foreign debt securities are determined.
Investments inopen-end mutual funds are valued at the closing NAV.
Derivative financial instruments listed on an exchange are valued at the official closing price of the day. Certain derivative financial instruments are centrally cleared or trade in the OTC market. The Fund’s pricing services use various techniques including industry standard option pricing models and proprietary discounted cash flow models to determine the fair value of those instruments. The Fund’s net benefit or obligation under the derivative contract, as measured by the fair value of the contract, is included in net assets.
The Fund has procedures to determine the fair value of financial instruments for which market prices are not reliable or readily available. Under these procedures, the Fund primarily employs a market-based approach which may use related or comparable assets or liabilities, recent transactions, market multiples, book values, and other relevant information for the investment to determine the fair value of the investment. An income-based valuation approach may also be used in which the anticipated future cash flows of the investment are discounted to calculate fair value. Discounts may also be applied due to the nature or duration of any restrictions on the disposition of the investments. Due to the inherent uncertainty of valuations of such investments, the fair values may differ significantly from the values that would have been used had an active market existed.
b. Foreign Currency Translation
Portfolio securities and other assets and liabilities denominated in foreign currencies are translated into U.S. dollars based on the exchange rate of such currencies against U.S. dollars on the date of valuation. The Fund may enter into foreign currency exchange contracts to facilitate transactions denominated in a foreign currency. Purchases and sales of securities, income and expense items denominated in foreign currencies are translated into U.S. dollars at the exchange rate in effect on the transaction date. Portfolio securities and assets and liabilities denominated in foreign currencies contain risks that those currencies will
FRANKLIN TEMPLETON VARIABLE INSURANCE PRODUCTS TRUST
NOTES TO FINANCIAL STATEMENTS
Templeton Global Bond VIP Fund(continued)
decline in value relative to the U.S. dollar. Occasionally, events may impact the availability or reliability of foreign exchange rates used to convert the U.S. dollar equivalent value. If such an event occurs, the foreign exchange rate will be valued at fair value using procedures established and approved by the Board.
The Fund does not separately report the effect of changes in foreign exchange rates from changes in market prices on securities held. Such changes are included in net realized and unrealized gain or loss from investments in the Statement of Operations.
Realized foreign exchange gains or losses arise from sales of foreign currencies, currency gains or losses realized between the trade and settlement dates on securities transactions and the difference between the recorded amounts of dividends, interest, and foreign withholding taxes and the U.S. dollar equivalent of the amounts actually received or paid. Net unrealized foreign exchange gains and losses arise from changes in foreign exchange rates on foreign denominated assets and liabilities other than investments in securities held at the end of the reporting period.
c. Derivative Financial Instruments
The Fund invested in derivative financial instruments in order to manage risk or gain exposure to various other investments or markets. Derivatives are financial contracts based on an underlying or notional amount, require no initial investment or an initial net investment that is smaller than would normally be required to have a similar response to changes in market factors, and require or permit net settlement. Derivatives contain various risks including the potential inability of the counterparty to fulfill their obligations under the terms of the contract, the potential for an illiquid secondary market, and/or the potential for market movements which expose the Fund to gains or losses in excess of the amounts shown in the Statement of Assets and Liabilities. Realized gain and loss and unrealized appreciation and depreciation on these contracts for the period are included in the Statement of Operations.
Derivative counterparty credit risk is managed through a formal evaluation of the creditworthiness of all potential counterparties. The Fund attempts to reduce its exposure to counterparty credit risk on OTC derivatives, whenever possible, by entering into International Swaps and Derivatives Association (ISDA) master agreements with certain counterparties. These agreements contain various provisions,
including but not limited to collateral requirements, events of default, or early termination. Termination events applicable to the counterparty include certain deteriorations in the credit quality of the counterparty. Termination events applicable to the Fund include failure of the Fund to maintain certain net asset levels and/or limit the decline in net assets over various periods of time. In the event of default or early termination, the ISDA master agreement gives thenon-defaulting party the right to net andclose-out all transactions traded, whether or not arising under the ISDA agreement, to one net amount payable by one counterparty to the other. However, absent an event of default or early termination, OTC derivative assets and liabilities are presented gross and not offset in the Statement of Assets and Liabilities. Early termination by the counterparty may result in an immediate payment by the Fund of any net liability owed to that counterparty under the ISDA agreement.
Collateral requirements differ by type of derivative. Collateral or initial margin requirements are set by the broker or exchange clearing house for exchange traded and centrally cleared derivatives. Initial margin deposited is held at the exchange and can be in the form of cash and/or securities. For OTC derivatives traded under an ISDA master agreement, posting of collateral is required by either the Fund or the applicable counterparty if the total net exposure of all OTC derivatives with the applicable counterparty exceeds the minimum transfer amount, which typically ranges from $100,000 to $250,000, and can vary depending on the counterparty and the type of the agreement. Generally, collateral is determined at the close of Fund business each day and any additional collateral required due to changes in derivative values may be delivered by the Fund or the counterparty the next business day, or within a few business days. Collateral pledged and/or received by the Fund for OTC derivatives, if any, is held in segregated accounts with the Fund’s custodian/counterparty broker and can be in the form of cash and/or securities. Unrestricted cash may be invested according to the Fund’s investment objectives. To the extent that the amounts due to the Fund from its counterparties are not subject to collateralization or are not fully collateralized, the Fund bears the risk of loss from counterpartynon-performance.
The Fund entered into OTC forward exchange contracts primarily to manage and/or gain exposure to certain foreign currencies. A forward exchange contract is an agreement between the Fund and a counterparty to buy or sell a foreign currency at a specific exchange rate on a future date.
FRANKLIN TEMPLETON VARIABLE INSURANCE PRODUCTS TRUST
NOTES TO FINANCIAL STATEMENTS
Templeton Global Bond VIP Fund(continued)
1. Organization and Significant Accounting
Policies(continued)
c. Derivative Financial Instruments(continued)
The Fund entered into interest rate swap contracts primarily to manage interest rate risk. An interest rate swap is an agreement between the Fund and a counterparty to exchange cash flows based on the difference between two interest rates, applied to a notional amount. These agreements may be privately negotiated in theover-the-counter market (OTC interest rate swaps) or may be executed on a registered exchange (centrally cleared interest rate swaps). For centrally cleared interest rate swaps, required initial margins are pledged by the Fund, and the daily change in fair value is accounted for as a variation margin payable or receivable in the Statement of Assets and Liabilities. Over the term of the contract, contractually required payments to be paid and to be received are accrued daily and recorded as unrealized depreciation and appreciation until the payments are made, at which time they are realized.
The Fund invests in value recovery instruments (VRI) primarily to gain exposure to economic growth. Periodic payments from VRI are dependent on established benchmarks for underlying variables. VRI has a notional amount, which is used to calculate amounts of payments to holders. Payments are recorded upon receipt as realized gains in the Statement of Operations. The risks of investing in VRI include growth risk, liquidity, and the potential loss of investment.
See Note 9 regarding other derivative information.
d. Restricted Cash
At December 31, 2018, the Fund held restricted cash in connection with investments in certain derivative securities. Restricted cash is held in a segregated account with the Fund’s counterparty broker and is reflected in the Statement of Assets and Liabilities.
e. Income and Deferred Taxes
It is the Fund’s policy to qualify as a regulated investment company under the Internal Revenue Code. The Fund intends to distribute to shareholders substantially all of its taxable income and net realized gains to relieve it from federal income and if applicable, excise taxes. As a result, no provision for U.S. federal income taxes is required.
The Fund may be subject to foreign taxation related to income received, capital gains on the sale of securities and certain foreign currency transactions in the foreign jurisdictions in which it invests. Foreign taxes, if any, are recorded based on the tax regulations and rates that exist in the foreign markets in which the Fund invests. When a capital gain tax is determined to apply, the Fund records an estimated deferred tax liability in an amount that would be payable if the securities were disposed of on the valuation date.
The Fund may recognize an income tax liability related to its uncertain tax positions under U.S. GAAP when the uncertain tax position has a less than 50% probability that it will be sustained upon examination by the tax authorities based on its technical merits. As of December 31, 2018, the Fund has determined that no tax liability is required in its financial statements related to uncertain tax positions for any open tax years (or expected to be taken in future tax years). Open tax years are those that remain subject to examination and are based on the statute of limitations in each jurisdiction in which the Fund invests.
f. Security Transactions, Investment Income, Expenses and Distributions
Security transactions are accounted for on trade date. Realized gains and losses on security transactions are determined on a specific identification basis. Interest income and estimated expenses are accrued daily. Amortization of premium and accretion of discount on debt securities are included in interest income. Dividend income is recorded on theex-dividend date. Distributions to shareholders are recorded on theex-dividend date. Distributable earnings are determined according to income tax regulations (tax basis) and may differ from earnings recorded in accordance with U.S. GAAP. These differences may be permanent or temporary. Permanent differences are reclassified among capital accounts to reflect their tax character. These reclassifications have no impact on net assets or the results of operations. Temporary differences are not reclassified, as they may reverse in subsequent periods.*
Common expenses incurred by the Trust are allocated among the Funds based on the ratio of net assets of each Fund to the combined net assets of the Trust or based on the ratio of number of shareholders of each Fund to the combined number of shareholders of the Trust. Fund specific expenses are charged directly to the Fund that incurred the expense.
FRANKLIN TEMPLETON VARIABLE INSURANCE PRODUCTS TRUST
NOTES TO FINANCIAL STATEMENTS
Templeton Global Bond VIP Fund(continued)
Realized and unrealized gains and losses and net investment income, excluding class specific expenses, are allocated daily to each class of shares based upon the relative proportion of net assets of each class. Differences in per share distributions by class are generally due to differences in class specific expenses.
Inflation-indexed bonds are adjusted for inflation through periodic increases or decreases in the security’s interest accruals, face amount, or principal redemption value, by amounts corresponding to the rate of inflation as measured by an index. Any increase or decrease in the face amount or principal redemption value will be included as interest income in the Statement of Operations.
g. Accounting Estimates
The preparation of financial statements in accordance with U.S. GAAP requires management to make estimates and assumptions that affect the reported amounts of assets and
liabilities at the date of the financial statements and the amounts of income and expenses during the reporting period. Actual results could differ from those estimates.
h. Guarantees and Indemnifications
Under the Trust’s organizational documents, its officers and trustees are indemnified by the Trust against certain liabilities arising out of the performance of their duties to the Trust. Additionally, in the normal course of business, the Trust, on behalf of the Fund, enters into contracts with service providers that contain general indemnification clauses. The Trust’s maximum exposure under these arrangements is unknown as this would involve future claims that may be made against the Trust that have not yet occurred. Currently, the Trust expects the risk of loss to be remote.
*Effective during the current reporting period, it is no longer required to present certain line items in the Statements of Changes in Net Assets. The below prior period amounts affected by this change are shown as they were in the prior year Statements of Changes in Net Assets.
For the year ended December 31, 2017, distributions to shareholders were as follows:
| | | | |
Distributions from net realized gains: | | | | |
Class 1 | | $ | (806,829 | ) |
Class 2 | | | (8,999,053 | ) |
Class 4 | | | (307,109 | ) |
For the year ended December 31, 2017, accumulated net investment loss included in net assets was $(7,265,628).
2. Shares of Beneficial Interest
At December 31, 2018, there were an unlimited number of shares authorized (without par value). Transactions in the Fund’s shares were as follows:
| | | | | | | | | | | | | | | | | | | | |
| |
| | | Year Ended December 31, | |
| | | |
| | | 2018 | | | | | | 2017 | |
| | | | | |
| | | Shares | | | Amount | | | | | | Shares | | | Amount | |
| | | | | |
| Class 1 Shares: | | | | | | | | | | | | | | | | | | | | |
Shares sold | | | 3,298,930 | | | $ | 57,215,991 | | | | | | | | 4,567,479 | | | $ | 79,103,441 | |
Shares issued in reinvestment of distributions | | | — | | | | — | | | | | | | | 46,290 | | | | 806,829 | |
Shares redeemed | | | (3,741,198 | ) | | | (64,976,963 | ) | | | | | | | (2,272,230 | ) | | | (39,118,295 | ) |
| | | | |
Net increase (decrease) | | | (442,268 | ) | | $ | (7,760,972 | ) | | | | | | | 2,341,539 | | | $ | 40,791,975 | |
| | | | |
FRANKLIN TEMPLETON VARIABLE INSURANCE PRODUCTS TRUST
NOTES TO FINANCIAL STATEMENTS
Templeton Global Bond VIP Fund(continued)
2. Shares of Beneficial Interest(continued)
| | | | | | | | | | | | | | | | | | | | |
| |
| | | Year Ended December 31, | |
| | | |
| | | 2018 | | | | | | 2017 | |
| | | | | |
| | | Shares | | | Amount | | | | | | Shares | | | Amount | |
| | | | | |
| Class 2 Shares: | | | | | | | | | | | | | | | | | | | | |
Shares sold | | | 10,132,393 | | | $ | 169,096,447 | | | | | | | | 10,419,624 | | | $ | 173,987,516 | |
Shares issued in reinvestment of distributions | | | — | | | | — | | | | | | | | 535,977 | | | | 8,999,053 | |
Shares redeemed | | | (24,289,543 | ) | | | (406,140,587 | ) | | | | | | | (18,675,809 | ) | | | (311,324,081 | ) |
| | | | |
Net increase (decrease) | | | (14,157,150 | ) | | $ | (237,044,140 | ) | | | | | | | (7,720,208 | ) | | $ | (128,337,512 | ) |
| | | | |
| | | | | |
| Class 4 Shares: | | | | | | | | | | | | | | | | | | | | |
Shares sold | | | 816,409 | | | $ | 13,930,984 | | | | | | | | 1,027,651 | | | $ | 17,546,285 | |
Shares issued in reinvestment of distributions | | | — | | | | — | | | | | | | | 17,886 | | | | 307,109 | |
Shares redeemed | | | (1,191,456 | ) | | | (20,323,569 | ) | | | | | | | (1,005,305 | ) | | | (17,137,648 | ) |
| | | | |
Net increase (decrease) | | | (375,047 | ) | | $ | (6,392,585 | ) | | | | | | | 40,232 | | | $ | 715,746 | |
| | | | |
3. Transactions with Affiliates
Franklin Resources, Inc. is the holding company for various subsidiaries that together are referred to as Franklin Templeton. Certain officers and trustees of the Fund are also officers and/or directors of the following subsidiaries:
| | |
| |
| Subsidiary | | Affiliation |
Franklin Advisers, Inc. (Advisers) | | Investment manager |
Franklin Templeton Services, LLC (FT Services) | | Administrative manager |
Franklin Templeton Distributors, Inc. (Distributors) | | Principal underwriter |
Franklin Templeton Investor Services, LLC (Investor Services) | | Transfer agent |
a. Management Fees
The Fund pays an investment management fee to Advisers based on the average daily net assets of the Fund as follows:
| | |
| |
| Annualized Fee Rate | | Net Assets |
0.625% | | Up to and including $100 million |
0.500% | | Over $100 million, up to and including $250 million |
0.450% | | Over $250 million, up to and including $7.5 billion |
0.440% | | Over $7.5 billion, up to and including $10 billion |
0.430% | | Over $10 billion, up to and including $12.5 billion |
0.420% | | Over $12.5 billion, up to and including $15 billion |
0.400% | | In excess of $15 billion |
For the year ended December 31, 2018, the gross effective investment management fee rate was 0.458% of the Fund’s average daily net assets.
b. Administrative Fees
Under an agreement with Advisers, FT Services provides administrative services to the Fund. The fee is paid by Advisers based on the Fund’s average daily net assets, and is not an additional expense of the Fund.
FRANKLIN TEMPLETON VARIABLE INSURANCE PRODUCTS TRUST
NOTES TO FINANCIAL STATEMENTS
Templeton Global Bond VIP Fund(continued)
c. Distribution Fees
The Board has adopted distribution plans for Class 2 and Class 4 shares pursuant to Rule12b-1 under the 1940 Act. Under the Fund’s compensation distribution plans, the Fund pays Distributors for costs incurred in connection with the servicing, sale and distribution of the Fund’s shares up to 0.25% and 0.35% per year of its average daily net assets of Class 2 and Class 4, respectively. The plan year, for purposes of monitoring compliance with the maximum annual plan rates, is February 1 through January 31.
d. Transfer Agent Fees
Investor Services, under terms of an agreement, performs shareholder servicing for the Fund and is not paid by the Fund for the services.
e. Investments in Affiliated Management Investment Companies
The Fund invests in one or more affiliated management investment companies for purposes other than exercising a controlling influence over the management or policies. Management fees paid by the Fund are waived on assets invested in the affiliated management investment companies, as noted in the Statement of Operations, in an amount not to exceed the management and administrative fees paid directly or indirectly by each affiliate. During the year ended December 31, 2018, the Fund held investments in affiliated management investment companies as follows:
| | | | | | | | | | | | | | | | | | | | | | | | | | | | | | |
| | | | | | | | |
| | | Number of Shares Held at Beginning
of Year | | Gross
Additions | | | Gross
Reductions | | | Number of Shares
Held at End of Year | | | Value at End of Year | | | Dividend
Income | | | Realized
Gain
(Loss) | | | Net Change in
Unrealized
Appreciation
(Depreciation) | |
| Non-Controlled Affiliates | | | | | | | | | | | | | | | | | | | | | | | | | | | | | | |
Institutional Fiduciary Trust Money Market Portfolio, 1.99% | | 664,514,279 | | | 787,975,800 | | | | (788,926,813 | ) | | | 663,563,266 | | | $ | 663,563,266 | | | $ | 11,696,733 | | | $ | — | | | $ | — | |
| | | | | | | | | | | | | | | | | | |
4. Expense Offset Arrangement
The Fund has entered into an arrangement with its custodian whereby credits realized as a result of uninvested cash balances are used to reduce a portion of the Fund’s custodian expenses. During the year ended December 31, 2018, the custodian fees were reduced as noted in the Statement of Operations.
5. Income Taxes
For tax purposes, capital losses may be carried over to offset future capital gains.
At December 31, 2018, the capital loss carryforwards were as follows:
| | | | |
Capital loss carryforwards not subject to expiration: | | | | |
Short Term | | $ | 1,830,066 | |
Long Term | | | 23,760,579 | |
| | | | |
Total capital loss carryforwards | | $ | 25,590,645 | |
| | | | |
The tax character of distributions paid during the years ended December 31, 2018 and 2017, was as follows:
| | | | | | | | |
| | |
| | | 2018 | | | 2017 | |
Distributions paid from: | | | | | | | | |
Long term capital gain | | | — | | | | 10,104,459 | |
| | | | |
FRANKLIN TEMPLETON VARIABLE INSURANCE PRODUCTS TRUST
NOTES TO FINANCIAL STATEMENTS
Templeton Global Bond VIP Fund(continued)
5. Income Taxes(continued)
At December 31, 2018, the cost of investments, net unrealized appreciation (depreciation) and undistributed ordinary income for income tax purposes were as follows:
| | | | |
Cost of investments | | $ | 3,042,317,202 | |
| | | | |
Unrealized appreciation | | $ | 105,836,230 | |
Unrealized depreciation | | | (259,541,972 | ) |
| | | | |
Net unrealized appreciation (depreciation) | | $ | (153,705,742 | ) |
| | | | |
Distributable earnings-undistributed ordinary income | | $ | 204,245,475 | |
| | | | |
Differences between income and/or capital gains as determined on a book basis and a tax basis are primarily due to differing treatment of bond discounts and premiums.
6. Investment Transactions
Purchases and sales of investments (excluding short term securities) for the year ended December 31, 2018, aggregated $310,869,546 and $723,082,602, respectively.
7. Credit Risk
At December 31, 2018, the Fund had 16.5% of its portfolio invested in high yield or other securities rated below investment grade and unrated securities, if any. These securities may be more sensitive to economic conditions causing greater price volatility and are potentially subject to a greater risk of loss due to default than higher rated securities.
8. Concentration of Risk
Investing in foreign securities may include certain risks and considerations not typically associated with investing in U.S. securities, such as fluctuating currency values and changing local and regional economic, political and social conditions, which may result in greater market volatility. Current political and financial uncertainty surrounding the European Union may increase market volatility and the economic risk of investing in securities in Europe. In addition, certain foreign securities may not be as liquid as U.S. securities.
9. Other Derivative Information
At December 31, 2018, the Fund’s investments in derivative contracts are reflected in the Statement of Assets and Liabilities as follows:
| | | | | | | | | | | | |
| | |
| | | Asset Derivatives | | | Liability Derivatives | |
| | | | |
Derivative Contracts
Not Accounted for
as Hedging Instruments | | Statement of Assets and Liabilities Location | | Fair Value | | | Statement of Assets and
Liabilities Location | | Fair Value | |
Interest rate contracts | | Variation margin on centrally cleared swap contracts | | $
| 30,936,955a
|
| | Variation margin on centrally cleared swap contracts | | $
| 9,841,754a
|
|
| | Unrealized appreciation on OTC swap contracts | | | — | | | Unrealized depreciation on OTC swap contracts | | | 2,398,532 | |
Foreign exchange contracts | | Unrealized appreciation on OTC forward exchange contracts | | | 29,610,379 | | | Unrealized depreciation on OTC forward exchange contracts | | | 24,834,593 | |
FRANKLIN TEMPLETON VARIABLE INSURANCE PRODUCTS TRUST
NOTES TO FINANCIAL STATEMENTS
Templeton Global Bond VIP Fund(continued)
| | | | | | | | | | | | |
| | |
| | | Asset Derivatives | | | Liability Derivatives | |
| | | | |
Derivative Contracts
Not Accounted for
as Hedging Instruments | | Statement of Assets and
Liabilities Location | | Fair Value | | | Statement of Assets and
Liabilities Location | | Fair Value | |
Value recovery instruments | | Investments in securities, at value | | $
| 10,868,797b
|
| | | | | | |
| | | | | | | | | | | | |
Totals | | | | $ | 71,416,131 | | | | | $ | 37,074,879 | |
| | | | | | | | | | | | |
aThis amount reflects the cumulative appreciation (depreciation) of centrally cleared swap contracts as reported in the Statement of Investments. Only the variation margin receivable/payable at year end is separately reported within the Statement of Assets and Liabilities. Prior variation margin movements were recorded to cash upon receipt or payment.
bVRI are included in investments in securities, at value in the Statement of Assets and Liabilities.
For the year ended December 31, 2018, the effect of derivative contracts in the Fund’s Statement of Operations was as follows:
| | | | | | | | | | | | |
| | | | |
Derivative Contracts
Not Accounted for as
Hedging Instruments | | Statement of Operations Location | | Net Realized
Gain (Loss) for
the Year | | | Statement of Operations Location | | Net Change in
Unrealized
Appreciation
(Depreciation)
for the Year | |
| | Net realized gain (loss) from: | | | | | | Net change in unrealized appreciation (depreciation) on: | | | | |
Interest rate contracts | | Swap contracts | | $ | (2,482,814 | ) | | Swap contracts | | $ | 23,456,839 | |
Foreign exchange contracts | | Forward exchange contracts | | | 69,036,333 | | | Forward exchange contracts | | | 41,776,037 | |
Value recovery instruments | | Investments | | | 1,517,139a | | | Investments | |
| (1,446,885
| )a
|
| | | | | | | | | | | | |
Totals | | | | $ | 68,070,658 | | | | | $ | 63,785,991 | |
| | | | | | | | | | | | |
aVRI are included in net realized gain (loss) from investments and net change in unrealized appreciation (depreciation) on investments in the Statement of Operations.
For the year ended December 31, 2018, the average month end notional amount of swap contracts represented $814,006,462. The average month end contract value and fair value of forward exchange contracts and VRI, was $3,257,769,303 and $16,900,982, respectively.
See Note 1(c) regarding derivative financial instruments.
At December 31, 2018, the Fund’s OTC derivative assets and liabilities are as follows:
| | | | | | | | |
| |
| | | Gross Amounts of
Assets and Liabilities Presented
in the Statement of Assets and Liabilities | |
| | |
| | | Assetsa | | | Liabilitiesa | |
| Derivatives | | | | | | | | |
Forward exchange contracts | | $ | 29,610,379 | | | $ | 24,834,593 | |
Swap contracts | | | — | | | | 2,398,532 | |
| | | | |
Total | | $ | 29,610,379 | | | $ | 27,233,125 | |
| | | | |
aAbsent an event of default or early termination, OTC derivative assets and liabilities are presented gross and not offset in the Statement of Assets and Liabilities.
FRANKLIN TEMPLETON VARIABLE INSURANCE PRODUCTS TRUST
NOTES TO FINANCIAL STATEMENTS
Templeton Global Bond VIP Fund(continued)
9. Other Derivative Information(continued)
At December 31, 2018, the Fund’s OTC derivative assets, which may be offset against the Fund’s OTC derivative liabilities and collateral received from the counterparty, are as follows:
| | | | | | | | | | | | | | | | | | | | |
| | | |
| | | | | | Amounts Not Offset in the Statement of
Assets and Liabilities | | | | |
| | | | | |
| | | Gross Amounts of Assets Presented in the
Statement of
Assets and Liabilities | | | Financial
Instruments
Available for Offset | | | Financial
Instruments
Collateral
Receiveda,b | | | Cash Collateral
Receivedb | | | Net Amount (Not
less than zero) | |
| Counterparty | | | | | | | | | | | | | | | | | | | | |
BNDP | | | $ — | | | | $ — | | | | $ — | | | | $ — | | | | $ — | |
BOFA | | | 467,425 | | | | (467,425 | ) | | | — | | | | — | | | | — | |
BZWS | | | 81,495 | | | | (81,495 | ) | | | — | | | | — | | | | — | |
CITI | | | 6,542,001 | | | | (4,796,083 | ) | | | — | | | | (1,745,918 | ) | | | — | |
DBAB | | | 2,081,954 | | | | (2,081,954 | ) | | | — | | | | — | | | | — | |
GSCO | | | 3,738,172 | | | | (876,986 | ) | | | — | | | | (2,861,186 | ) | | | — | |
HSBK | | | 3,686,981 | | | | (3,686,981 | ) | | | — | | | | — | | | | — | |
JPHQ | | | 12,358,486 | | | | (4,801,792 | ) | | | (7,556,694 | ) | | | — | | | | — | |
MSCO | | | 277,786 | | | | (127,713 | ) | | | — | | | | (150,073 | ) | | | — | |
SCNY | | | 106,806 | | | | (106,806 | ) | | | — | | | | — | | | | — | |
UBSW | | | 269,273 | | | | (19,707 | ) | | | (249,566 | ) | | | — | | | | — | |
| | | | |
Total | | | $29,610,379 | | | | $(17,046,942 | ) | | | $(7,806,260) | | | | $(4,757,177) | | | | $ — | |
| | | | |
At December 31, 2018, the Fund’s OTC derivative liabilities, which may be offset against the Fund’s OTC derivative assets and collateral pledged to the counterparty, are as follows:
| | | | | | | | | | | | | | | | | | | | |
| | | |
| | | | | | Amounts Not Offset in the Statement of
Assets and Liabilities | | | | |
| | | | | |
| | | Gross Amounts of Liabilities Presented in the
Statement of
Assets and Liabilities | | | Financial
Instruments
Available for Offset | | | Financial
Instruments
Collateral
Pledged | | | Cash Collateral
Pledged | | | Net Amount (Not
less than zero) | |
| Counterparty | | | | | | | | | | | | | | | | | | | | |
BNDP | | | $ 90,876 | | | | $ — | | | | $ — | | | | $ — | | | | $ 90,876 | |
BOFA | | | 1,929,216 | | | | (467,425 | ) | | | — | | | | (810,000 | ) | | | 651,791 | |
BZWS | | | 2,523,101 | | | | (81,495 | ) | | | — | | | | (1,410,000 | ) | | | 1,031,606 | |
CITI | | | 4,796,083 | | | | (4,796,083 | ) | | | — | | | | — | | | | — | |
DBAB | | | 5,852,933 | | | | (2,081,954 | ) | | | — | | | | (2,290,000 | ) | | | 1,480,979 | |
GSCO | | | 876,986 | | | | (876,986 | ) | | | — | | | | — | | | | — | |
HSBK | | | 5,102,331 | | | | (3,686,981 | ) | | | — | | | | — | | | | 1,415,350 | |
JPHQ | | | 4,801,792 | | | | (4,801,792 | ) | | | — | | | | — | | | | — | |
MSCO | | | 127,713 | | | | (127,713 | ) | | | — | | | | — | | | | — | |
SCNY | | | 1,112,387 | | | | (106,806 | ) | | | — | | | | (390,000 | ) | | | 615,581 | |
UBSW | | | 19,707 | | | | (19,707 | ) | | | — | | | | — | | | | — | |
| | | | |
Total | | | $27,233,125 | | | | $(17,046,942 | ) | | | $ — | | | | $(4,900,000) | | | | $5,286,183 | |
| | | | |
aAt December 31, 2018, the Fund received United Kingdom Treasury Bonds and U.S. Treasury Bills, Bonds and Notes as collateral for derivatives. bIn some instances, the collateral amounts disclosed in the table above were adjusted due to the requirement to limit collateral amounts to avoid the effect of overcollateralization. Actual collateral received and/or pledged may be more than the amounts disclosed herein.
See Abbreviations on pageTGB-34.
FRANKLIN TEMPLETON VARIABLE INSURANCE PRODUCTS TRUST
NOTES TO FINANCIAL STATEMENTS
Templeton Global Bond VIP Fund(continued)
10. Credit Facility
The Fund, together with other U.S. registered and foreign investment funds (collectively, Borrowers), managed by Franklin Templeton, are borrowers in a joint syndicated senior unsecured credit facility totaling $2 billion (Global Credit Facility) which matured on February 8, 2019. This Global Credit Facility provides a source of funds to the Borrowers for temporary and emergency purposes, including the ability to meet future unanticipated or unusually large redemption requests. Effective February 8, 2019, the Funds renewed the Global Credit Facility for a one year term, maturing February 7, 2020, for a total of $2 billion.
Under the terms of the Global Credit Facility, the Fund shall, in addition to interest charged on any borrowings made by the Fund and other costs incurred by the Fund, pay its share of fees and expenses incurred in connection with the implementation and maintenance of the Global Credit Facility, based upon its relative share of the aggregate net assets of all of the Borrowers, including an annual commitment fee of 0.15% based upon the unused portion of the Global Credit Facility. These fees are reflected in other expenses in the Statement of Operations. During the year ended December 31, 2018, the Fund did not use the Global Credit Facility.
11. Fair Value Measurements
The Fund follows a fair value hierarchy that distinguishes between market data obtained from independent sources (observable inputs) and the Fund’s own market assumptions (unobservable inputs). These inputs are used in determining the value of the Fund’s financial instruments and are summarized in the following fair value hierarchy:
| | • | | Level 1 – quoted prices in active markets for identical financial instruments |
| | • | | Level 2 – other significant observable inputs (including quoted prices for similar financial instruments, interest rates, prepayment speed, credit risk, etc.) |
| | • | | Level 3 – significant unobservable inputs (including the Fund’s own assumptions in determining the fair value of financial instruments) |
The input levels are not necessarily an indication of the risk or liquidity associated with financial instruments at that level.
A summary of inputs used as of December 31, 2018, in valuing the Fund’s assets and liabilities carried at fair value, is as follows:
| | | | | | | | | | | | | | | | |
| | | | |
| | | Level 1 | | | Level 2 | | | Level 3 | | | Total | |
| Assets: | | | | | | | | | | | | | | | | |
Investments in Securities:a | | | | | | | | | | | | | | | | |
Foreign Government and Agency Securities | | $ | — | | | $ | 1,275,188,076 | | | $ | — | | | $ | 1,275,188,076 | |
Short Term Investments | | | 1,009,725,290 | | | | 577,351,841 | | | | — | | | | 1,587,077,131 | |
| | | | |
Total Investments in Securities | | $ | 1,009,725,290 | | | $ | 1,852,539,917 | | | $ | — | | | $ | 2,862,265,207 | |
| | | | |
Other Financial Instruments: | | | | | | | | | | | | | | | | |
Forward Exchange Contracts | | $ | — | | | $ | 29,610,379 | | | $ | — | | | $ | 29,610,379 | |
Swap Contracts | | | — | | | | 30,936,955 | | | | — | | | | 30,936,955 | |
| | | | |
Total Other Financial Instruments | | $ | — | | | $ | 60,547,334 | | | $ | — | | | $ | 60,547,334 | |
| | | | |
| Liabilities: | | | | | | | | | | | | | | | | |
Other Financial Instruments: | | | | | | | | | | | | | | | | |
Forward Exchange Contracts | | $ | — | | | $ | 24,834,593 | | | $ | — | | | $ | 24,834,593 | |
Swap Contracts | | | — | | | | 12,240,286 | | | | — | | | | 12,240,286 | |
| | | | |
Total Other Financial Instruments | | $ | — | | | $ | 37,074,879 | | | $ | — | | | $ | 37,074,879 | |
| | | | |
aFor detailed categories, see the accompanying Statement of Investments.
FRANKLIN TEMPLETON VARIABLE INSURANCE PRODUCTS TRUST
NOTES TO FINANCIAL STATEMENTS
Templeton Global Bond VIP Fund(continued)
12. Subsequent Events
The Fund has evaluated subsequent events through the issuance of the financial statements and determined that no events have occurred that require disclosure other than those already disclosed in the financial statements.
| | | | | | | | | | |
Abbreviations | | | | | | | | |
| | |
| Counterparty/Exchange | | Currency | | Selected Portfolio |
| | | | | |
| BOFA | | Bank of America Corp. | | ARS | | Argentine Peso | | BADLAR | | Argentina Deposit Rates Badlar Private Banks ARS |
| | | | | |
| BNDP | | BNP Paribas SA | | BRL | | Brazilian Real | | | | |
| | | | | |
| BZWS | | Barclays Bank PLC | | COP | | Colombian Peso | | FRN | | Floating Rate Note |
| | | | | |
| CITI | | Citigroup, Inc. | | EUR | | Euro | | GDP | | Gross Domestic Product |
| | | | | |
| DBAB | | Deutsche Bank AG | | GHS | | Ghanaian Cedi | | LIBOR | | London InterBank Offered Rate |
| | | | | |
| GSCO | | The Goldman Sachs Group, Inc. | | IDR | | Indonesian Rupiah | | VRI | | Value Recovery Instrument |
| | | | | |
| HSBK | | HSBC Bank PLC | | INR | | Indian Rupee | | | | |
| | | | | |
| JPHQ | | JP Morgan Chase & Co. | | KRW | | South Korean Won | | | | |
| | | | | |
| MSCO | | Morgan Stanley | | MXN | | Mexican Peso | | | | |
| | | | | |
| SCNY | | Standard Chartered Bank | | PHP | | Philippine Peso | | | | |
| | | | | |
| UBSW | | UBS AG | | USD | | United States Dollar | | | | |
FRANKLIN TEMPLETON VARIABLE INSURANCE PRODUCTS TRUST
Report of Independent Registered Public Accounting Firm
To the Board of Trustees of Franklin Templeton Variable Insurance Products Trust and Shareholders of Templeton Global Bond VIP Fund
Opinion on the Financial Statements
We have audited the accompanying statement of assets and liabilities, including the statement of investments, of Templeton Global Bond VIP Fund (the “Fund”) as of December 31, 2018, the related statement of operations for the year ended December 31, 2018, the statement of changes in net assets for each of the two years in the period ended December 31, 2018, including the related notes, and the financial highlights for each of the five years in the period ended December 31, 2018 (collectively referred to as the “financial statements”). In our opinion, the financial statements present fairly, in all material respects, the financial position of the Fund as of December 31, 2018, the results of its operations for the year then ended, the changes in its net assets for each of the two years in the period ended December 31, 2018 and the financial highlights for each of the five years in the period ended December 31, 2018 in conformity with accounting principles generally accepted in the United States of America.
Basis for Opinion
These financial statements are the responsibility of the Fund’s management. Our responsibility is to express an opinion on the Fund’s financial statements based on our audits. We are a public accounting firm registered with the Public Company Accounting Oversight Board (United States) (PCAOB) and are required to be independent with respect to the Fund in accordance with the U.S. federal securities laws and the applicable rules and regulations of the Securities and Exchange Commission and the PCAOB.
We conducted our audits of these financial statements in accordance with the standards of the PCAOB. Those standards require that we plan and perform the audit to obtain reasonable assurance about whether the financial statements are free of material misstatement, whether due to error or fraud.
Our audits included performing procedures to assess the risks of material misstatement of the financial statements, whether due to error or fraud, and performing procedures that respond to those risks. Such procedures included examining, on a test basis, evidence regarding the amounts and disclosures in the financial statements. Our audits also included evaluating the accounting principles used and significant estimates made by management, as well as evaluating the overall presentation of the financial statements. Our procedures included confirmation of securities owned as of December 31, 2018 by correspondence with the custodian, transfer agent and brokers; when replies were not received from brokers, we performed other auditing procedures. We believe that our audits provide a reasonable basis for our opinion.
PricewaterhouseCoopers LLP
San Francisco, California February 15, 2019
We have served as the auditor of one or more investment companies in the Franklin Templeton Group of Funds since 1948.
FRANKLIN TEMPLETON VARIABLE INSURANCE PRODUCTS TRUST
Tax Information (unaudited)
Templeton Global Bond VIP Fund
At December 31, 2018, more than 50% of the Fund’s total assets were invested in securities of foreign issuers. In most instances, foreign taxes were withheld from income paid to the Fund on these investments. The Fund elects to treat foreign taxes paid as allowed under Section 853 of the Internal Revenue Code. This election will allow shareholders of record as of the 2019 distribution date, to treat their proportionate share of foreign taxes paid by the Fund as having been paid directly by them. The shareholder shall consider these amounts as foreign taxes paid in the tax year in which they receive the Fund distribution.
Templeton Growth VIP Fund
This annual report for Templeton Growth VIP Fund covers the fiscal year ended December 31, 2018.
Class 1 Performance Summary as of December 31, 2018
Average annual total return of Class 1 shares* represents the average annual change in value, assuming reinvestment of dividends and capital gains. Average returns smooth out variations in returns, which can be significant; they are not the same asyear-by-year results.
| | | | | | | | | | | | |
| | | |
| Periods ended 12/31/18 | | 1-Year | | | 5-Year | | | 10-Year | |
Average Annual Total Return | | | -14.61% | | | | +0.37% | | | | +7.89% | |
*The Fund has a fee waiver associated with any investment it makes in a Franklin Templeton money fund and/or other Franklin Templeton fund, contractually guaranteed through 4/30/19. Fund investment results reflect the fee waiver; without this waiver, the results would have been lower.
Performance reflects the Fund’s Class 1 operating expenses, but doesnotinclude any contract fees, expenses or sales charges. If they had been included, performance would be lower. These charges and deductions, particularly for variable life policies, can have a significant effect on contract values and insurance benefits. See the contract prospectus for a complete description of these expenses, including sales charges.
Performance data represent past performance, which does not guarantee future results. Investment return and principal value will fluctuate, and you may have a gain or loss when you sell your shares. Current performance may differ from figures shown.
Total Return Index Comparison for a Hypothetical $10,000 Investment (1/1/09–12/31/18)
The graph below shows the change in value of a hypothetical $10,000 investment in the Fund over the indicated period and includes reinvestment of any income or distributions. The Fund’s performance* is compared to the performance of the MSCI All Country World Index (ACWI). One cannot invest directly in an index, and an index is not representative of the Fund’s portfolio.Please see Important Notes to Performance Information preceding the Fund Summaries.
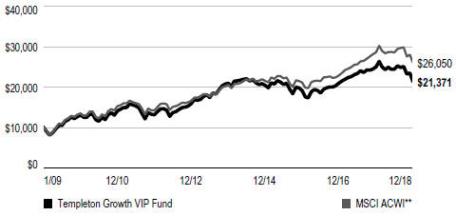
**Source: Morningstar. Please see Index Descriptions following the Fund Summaries.
TEMPLETON GROWTH VIP FUND
Fund Goal and Main Investments
The Fund seeks long-term capital growth. Under normal market conditions, the Fund invests predominantly in equity securities (primarily common stocks) of companies located anywhere in the world, including developing markets.
Fund Risks
All investments involve risks, including possible loss of principal. Special risks are associated with foreign investing, including currency fluctuations, economic instability and political developments; investments in emerging markets involve heightened risks related to the same factors. Because the Fund may invest its assets in companies in a specific region, including Europe, it is subject to greater risks of adverse developments in that region and/or the surrounding regions than a fund that is more broadly diversified geographically. Political, social or economic disruptions in the region, even in countries in which the Fund is not invested, may adversely affect the value of securities held by the Fund. Current political and financial uncertainty surrounding the European Union (EU) and the financial instability of some countries in the EU may increase market volatility and the economic risk of investing in companies in Europe. In addition, smaller company stocks have historically experienced more price volatility than larger company stocks, especially over the short term. The Fund is actively managed but there is no guarantee that the manager’s investment decisions will produce the desired results. The Fund’s prospectus also includes a description of the main investment risks.
Performance Overview
You can find the Fund’sone-year total return in the Performance Summary. For comparison, the Fund’s benchmark, the MSCI ACWI, had a-8.93% total return for the period under review.1
Economic and Market Overview
The global economy expanded during the 12 months under review, despite weakness in certain regions. Global developed and emerging market stocks were aided at certain points during the period by higher crude oil prices, upbeat economic data, easing trade tensions and encouraging corporate earnings
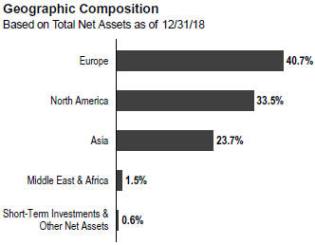
reports, as well as indications of a slower pace of interest-rate increases from the U.S. Federal Reserve (Fed).
However, various factors weighed on global markets during the period, including concerns about tighter regulation of technology companies, political uncertainties in the U.S. and the European Union, and major central banks’ interest-rate path and unwinding of monetary stimulus measures. Markets were further pressured by U.S. trade disputes with its allies and China, and their impact on global growth and corporate earnings. In this environment, global stocks, as measured by the MSCI ACWI, had a-8.93% total return for the 12 months ended December 31, 2018.1
The U.S. economy grew during the12-month period. After moderating for three consecutive quarters, the economy grew faster in 2018’s second quarter, driven by consumer spending, business investment, exports and government spending. However, growth moderated in the third quarter due to declines in exports and housing investment. The unemployment rate declined from 4.1% in December 2017 to 3.9% atperiod-end.2 Annual inflation, as measured by the Consumer Price Index, decreased from 2.1% in December 2017 to 1.9% atperiod-end.2 The Fed raised its target range for the federal funds rate four times during the period, to 2.25%–2.50%, and continued reducing its balance sheet as part of an ongoing plan to normalize monetary policy. At its December meeting, the Fed reduced the projected 2019 rate increases to two, compared to three projected previously.
1. Source: Morningstar. One cannot invest directly in an index, and an index is not representative of the Fund’s portfolio. Please see Index Descriptions following the Fund Summaries.
2. Source: U.S. Bureau of Labor Statistics.
The dollar value, number of shares or principal amount, and names of all portfolio holdings are listed in the Fund’s Statement of Investments (SOI).
TEMPLETON GROWTH VIP FUND
In Europe, the U.K.’s quarterly economic growth moderated in 2018’s first quarter, but accelerated in 2018’s second and third quarters. The Bank of England raised its key policy rate once during the review period. After moderating in 2018’s first quarter, the eurozone’s quarterly growth remained stable in the second quarter, but eased in the third quarter. The bloc’s annual inflation rate ended the period higher than in December 2017. The European Central Bank (ECB) kept its benchmark interest rate unchanged during the period. In December 2018, the ECB confirmed its plan to conclude its bond purchase program at the end of 2018 and reiterated it expects key interest rates to remain unchanged through the summer of 2019.
In Asia, Japan’s quarterly gross domestic product (GDP) grew in 2018’s second quarter, following a contraction in the first quarter, but contracted again in the third quarter. The Bank of Japan left its benchmark interest rate unchanged during the period and continued its monetary stimulus measures.
In emerging markets, Brazil’s quarterly GDP growth remained stable in 2018’s first and second quarters, but accelerated in the third quarter. The Central Bank of Brazil lowered its benchmark interest rate twice during the period. Russia’s annual GDP growth rate accelerated in 2018’s first and second quarters, but moderated in the third quarter. After lowering its key rate twice early in the period, the Bank of Russia raised it twice in the period’s second half to curtail inflation risks. China’s annual GDP grew at a stable rate in 2018’s first quarter, but it moderated in the second and third quarters. The People’s Bank of China left its benchmark interest rate unchanged during the period, but it took measures to improve financial liquidity to mitigate the negative effects of the U.S.-China trade dispute and support economic growth. Overall, emerging market stocks, as measured by the MSCI Emerging Markets Index, had a-14.25% total return during the period.1
Investment Strategy
Our investment philosophy is bottom up, value oriented and long term. When choosing equity investments for the Fund, we focus on the market price of a company’s securities relative to our evaluation of the company’s potential long-term earnings, asset value and cash flow. We also consider a company’s
price/earnings ratio, price/cash flow ratio, profit margins and liquidation value.
Manager’s Discussion
The Fund’s stock selection and overweighting in the financials sector, particularly in banks, detracted significantly from relative results.3 Banking firms Citigroup (U.S.) and BNP Paribas (France) weighed on the Fund’s performance. Shares of BNP were pressured by concerns about its exposure to Italian sovereign debt after political parties outside the Italian mainstream won the general election and struggled to form a coalition government. Escalating macro fears and a lackluster financial market environment in Europe also hurt the bank’s shares.
Stock selection in the health care sector hampered relative results.4 U.S. pharmaceuticals firm Perrigo and German chemicals and pharmaceuticals company Bayer were the sector’s largest detractors.
Stock selection and an underweighting in the information technology (IT) sector also weighed on relative performance.5 Telecommunications equipment firm CommScope Holding (U.S.) hampered results as pricing pressures hurt the company’s margins and share price. Investors also reacted negatively to an announcement by the company that it had agreed to acquire U.S.-based communications firm ARRIS International (not a Fund holding).
Elsewhere, key individual detractors included U.S. cosmetics maker Coty, British specialty retailer Kingfisher, and U.S. energy exploration and production firm Apache.
Conversely, stock selection in the communication services sector, especially in media, contributed to relative results.6 Luxembourg-based satellite specialist SES was the sector’s top contributor. Recent results have shown stabilization in the firm’s video business, as well as better-than-expected growth in other key segments. Though sentiment remains tepid, recent progress highlights some of the positive changes being delivered by a new management team working to repair the balance sheet and seize long-term growth opportunities. Additionally, share prices increased after U.S. regulators advanced a proposal to let terrestrial services use airwaves long dedicated to the satellite services. Other significant contributors
3. The financials sector comprises banks, capital markets, consumer finance, diversified financial services and insurance in the SOI.
4. The health care sector comprises biotechnology, health care equipment and supplies, health care providers and services, and pharmaceuticals in the SOI.
5. The IT sector comprises communications equipment; software; and technology hardware, storage and peripherals in the SOI.
6. The communication services sector comprises diversified telecommunication services, interactive media and services, media and wireless telecommunication services in the SOI.
TEMPLETON GROWTH VIP FUND
included U.S. diversified global media and entertainment firm Twenty First Century Fox7 and Chinese telecommunication services company China Telecom.
Stock selection in the energy and materials sectors boosted relative performance.8 In the energy sector, exploration and production firm ConocoPhillips7 (U.S.) and natural gas distributor KunLun Energy (Hong Kong) contributed. Shares of KunLun gained after the company reported strong first-half earnings growth marked by improved volumes and expanded margins. In the materials sector, anoff-benchmark holding in Canadian gold and copper miner Barrick Gold contributed to relative performance.
Elsewhere, key individual contributors included automotive retailer Advance Auto Parts (U.S.), pharmaceuticals company Eli Lilly (U.S.) and wind turbine manufacturer Vestas Wind Systems (Denmark).
From a geographic perspective, stock selection in the U.S. and an overweighting in Europe, particularly the U.K. and France, weighed on relative results. Stock selection in Asia also hurt relative results, especially investments in South Korea, India and Hong Kong.
Conversely, while no region as a whole contributed to relative performance, stock selection in Luxembourg, China, Denmark and Japan boosted results.
It is important to recognize the effect of currency movements on the Fund’s performance. In general, if the value of the U.S. dollar goes up compared with a foreign currency, an investment traded in that foreign currency will go down in value because it will be worth fewer U.S. dollars. This can have a negative effect on Fund performance. Conversely, when the U.S. dollar weakens in relation to a foreign currency, an investment traded in that foreign currency will increase in value, which can contribute to Fund performance. For the 12 months ended December 31, 2018, the U.S. dollar rose in value relative to most currencies. As a result, the Fund’s performance was negatively affected by the portfolio’s investment primarily in securities withnon-U.S. currency exposure.
Thank you for your participation in Templeton Growth VIP Fund. We look forward to serving your future investment needs.
| | | | |
| Top 10 Holdings | | | |
| 12/31/18 | | | |
| Company | | % of Total | |
| |
| Sector/Industry, Country | | Net Assets | |
| Oracle Corp. | | | 2.6% | |
| Software, U.S. | | | | |
| Royal Dutch Shell PLC | | | 2.4% | |
| Oil, Gas & Consumable Fuels, U.K. | | | | |
| SES SA | | | 2.3% | |
| Media, Luxembourg | | | | |
| Singapore Telecommunications Ltd. | | | 2.3% | |
| Diversified Telecommunication Services, Singapore | | | | |
| BP PLC | | | 2.2% | |
| Oil, Gas & Consumable Fuels, U.K. | | | | |
| Eni SpA | | | 2.1% | |
| Oil, Gas & Consumable Fuels, Italy | | | | |
| Citigroup Inc. | | | 2.0% | |
| Banks, U.S. | | | | |
| Allergan PLC | | | 1.9% | |
| Pharmaceuticals, U.S. | | | | |
| Standard Chartered PLC | | | 1.9% | |
| Banks, U.K. | | | | |
| Sanofi | | | 1.9% | |
| Pharmaceuticals, France | | | | |
The foregoing information reflects our analysis, opinions and portfolio holdings as of December 31, 2018, the end of the reporting period. The way we implement our main investment strategies and the resulting portfolio holdings may change depending on factors such as market and economic conditions. These opinions may not be relied upon as investment advice or an offer for a particular security. The information is not a complete analysis of every aspect of any market, country, industry, security or the Fund. Statements of fact are from sources considered reliable, but the investment manager makes no representation or warranty as to their completeness or accuracy. Although historical performance is no guarantee of future results, these insights may help you understand our investment management philosophy.
7. Not held atperiod-end.
8. The energy sector comprises oil, gas and consumable fuels in the SOI. The materials sector comprises chemicals, construction materials, and metals and mining in the SOI.
TEMPLETON GROWTH VIP FUND
Class 1 Fund Expenses
As an investor in a variable insurance contract (Contract) that indirectly provides for investment in an underlying mutual fund, you can incur transaction and/or ongoing expenses at both the Fund level and the Contract Level: (1) transaction expenses can include sales charges (loads) on purchases, surrender fees, transfer fees and premium taxes; and (2) ongoing expenses can include management fees, distribution and service(12b-1) fees, contract fees, annual maintenance fees, mortality and expense risk fees and other fees and expenses. All mutual funds and Contracts have some types of ongoing expenses. The table below shows Fund-level ongoing expenses and can help you understand these costs and compare them with those of other mutual funds offered through the Contract. The table assumes a $1,000 investment held for the six months indicated. Please refer to the Fund prospectus for additional information on operating expenses.
Actual Fund Expenses
The table below provides information about the actual account values and actual expenses in the columns under the heading “Actual.” In these columns the Fund’s actual return, which includes the effect of ongoing Fund expenses but does not include the effect of ongoing Contract expenses, is used to calculate the “Ending Account Value.” You can estimate the Fund-level expenses you paid during the period by following these steps (ofcourse, your account value and expenses will differ from those in this illustration):Divide your account value by $1,000 (ifyour account had an $8,600 value, then $8,600 ÷ $1,000 = 8.6). Then multiply the result by the number under the headings “Actual” and “Fund-Level Expenses Paid During Period” (ifFund-Level Expenses Paid During Period were $ 7.50, then 8.6 x $7.50 = $64.50). In this illustration, the estimated expenses paid this period at the Fund level are $64.50.
Hypothetical Example for Comparison
with Other Mutual Funds
Under the heading “Hypothetical” in the table, information is provided about hypothetical account values and hypothetical expenses based on the Fund’s actual expense ratio and an assumed rate of return of 5% per year before expenses, which is not the Fund’s actual return. This information may not be used to estimate the actual ending account balance or expenses you paid for the period, but it can help you compare ongoing costs of investing in the Fund with those of other mutual funds offered through the Contract. To do so, compare this 5% hypothetical example with the 5% hypothetical examples that appear in the shareholder reports of other funds offered through the Contract.
Please note that expenses shown in the table are meant to highlight ongoing costs at the Fund level only and do not reflect any ongoing expenses at the Contract level, or transaction expenses at either the Fund or Contract levels. In addition, while the Fund does not have transaction expenses, if the transaction and ongoing expenses at the Contract level were included, the expenses shown below would be higher. You should consult your Contract prospectus or disclosure document for more information.
| | | | | | | | | | | | | | | | | | | | | | | | |
| | | | | | Actual
(actual return after expenses) | | | Hypothetical
(5% annual return before expenses) | | | | |
| | | | | | |
Share Class | | Beginning Account
Value 7/1/18 | | | Ending Account
Value 12/31/18 | | | Fund-Level Expenses Paid During Period
7/1/18–12/31/181,2 | | | Ending Account
Value 12/31/18 | | | Fund-Level Expenses
Paid During Period
7/1/18–12/31/181,2 | | | Net
Annualized
Expense
Ratio2 | |
Class 1 | | | $1,000 | | | | $874.80 | | | | $3.92 | | | | $1,021.02 | | | | $4.23 | | | | 0.83 | % |
1. Expenses are equal to the annualized expense ratio for thesix-month period as indicated above—in the far right column—multiplied by the simple average account value over the period indicated, and then multiplied by 184/365 to reflect theone-half year period.
2. Reflects expenses after fee waivers and expense reimbursements. Does not include any ongoing expenses of the Contract for which the Fund is an investment option or acquired fund fees and expenses.
TG P1 P2 P4 01/19
SUPPLEMENT DATED JANUARY 31, 2019
TO THE PROSPECTUSES
DATED MAY 1, 2018
OF
TEMPLETON GROWTH VIP FUND
(a series of Franklin Templeton Variable Insurance Products Trust)
Effective February 1, 2019, the prospectus is amended as follows:
I. The portfolio management team under the “FUND SUMMARIES – Templeton Growth VIP Fund – Portfolio Managers” section on pageTG-S5 is replaced with the following:
Portfolio Managers
Norman J. Boersma, CFAPresident, Chief Executive Officer and Director of Global Advisors and portfolio manager of the Fund since 2011.
Herbert J. Arnett, Jr.Vice President of Global Advisors and portfolio manager of the Fund since 2017.
Heather Arnold, CFAExecutive Vice President, Director of Research and Portfolio Manager of Global Advisors and portfolio manager of the Fund since 2014.
Christopher James Peel, CFAVice President of Global Advisors and portfolio manager of the Fund since 2017.
Peter M. Moeschter, CFAExecutive Vice President and Portfolio Manager of Global Advisors and portfolio manager of the Fund since February 2019.
II. The portfolio management team under the “Fund Details – Templeton Growth VIP Fund – Management” section on pageTG-D7 is replaced with the following:
The Fund is managed by a team of dedicated professionals focused on investments in equity securities of companies anywhere in the world. The portfolio managers of the team are as follows:
Norman J. Boersma, CFA President, Chief Executive Officer and Director of Global Advisors
Mr. Boersma has been lead portfolio manager of the Fund since 2011. He has primary responsibility for the investments of the Fund. He has final authority over all aspects of the Fund’s investment portfolio, including but not limited to, purchases and sales of individual securities, portfolio risk assessment, and the management of daily cash balances in accordance with anticipated investment management requirements. The degree to which he may perform these functions, and the nature of these functions, may change from time to time. He joined Franklin Templeton Investments in 1991.
Herbert J. Arnett, Jr. Vice President of Global Advisors
Mr. Arnett has been a portfolio manager of the Fund since 2017, providing research and advice on the purchases and sales of individual securities, and portfolio risk assessment. He joined Franklin Templeton Investments in 1996.
Heather Arnold, CFA Executive Vice President, Director of Research and Portfolio Manager of Global Advisors
Ms. Arnold has been a portfolio manager of the Fund since 2014, providing research and advice on the purchases and sales of individual securities, and portfolio risk assessment. She first joined Franklin Templeton Investments in 1997, left in 2001 to start her own company and rejoined again in 2008.
Christopher James Peel, CFA Vice President of Global Advisors
Mr. Peel has been a portfolio manager of the Fund since 2017, providing research and advice on the purchases and sales of individual securities, and portfolio risk assessment. He joined Franklin Templeton Investments in 2007.
Peter M. Moeschter, CFA Executive Vice President and Portfolio Manager of Global Advisors
Mr. Moeschter has been a portfolio manager of the Fund since February 2019, providing research and advice on the purchases and sales of individual securities, and portfolio risk assessment. He joined Franklin Templeton Investments in 1997.
CFA® and Chartered Financial Analyst® are trademarks owned by CFA Institute.
Please keep this supplement with your prospectus for future reference.
FRANKLIN TEMPLETON VARIABLE INSURANCE PRODUCTS TRUST
Financial Highlights
Templeton Growth VIP Fund
| | | | | | | | | | | | | | | | | | | | |
| |
| | | Year Ended December 31, | |
| | | | | |
| | | 2018 | | | 2017 | | | 2016 | | | 2015 | | | 2014 | |
| Class 1 | | | | | | | | | | | | | | | | | | | | |
| Per share operating performance | | | | | | | | | | | | | | | | | | | | |
(for a share outstanding throughout the year) | | | | | | | | | | | | | | | | | | | | |
| | | | | |
Net asset value, beginning of year | | | $16.24 | | | | $13.93 | | | | $13.54 | | | | $14.85 | | | | $15.47 | |
| | | | |
| | | | | |
| Income from investment operationsa: | | | | | | | | | | | | | | | | | | | | |
| | | | | |
Net investment incomeb | | | 0.28 | | | | 0.29 | | | | 0.26 | | | | 0.28 | | | | 0.38 | c |
| | | | | | |
Net realized and unrealized gains (losses) | | | (2.42 | ) | | | 2.30 | | | | 0.96 | | | | (1.17 | ) | | | (0.75 | ) |
| | | | |
Total from investment operations | | | (2.14 | ) | | | 2.59 | | | | 1.22 | | | | (0.89 | ) | | | (0.37 | ) |
| | | | |
| | | | | |
| Less distributions from: | | | | | | | | | | | | | | | | | | | | |
| | | | | |
Net investment income | | | (0.35 | ) | | | (0.28 | ) | | | (0.31 | ) | | | (0.42 | ) | | | (0.25 | ) |
| | | | | |
Net realized gains | | | (1.31 | ) | | | — | | | | (0.52 | ) | | | — | | | | — | |
| | | | |
Total distributions | | | (1.66 | ) | | | (0.28 | ) | | | (0.83 | ) | | | (0.42 | ) | | | (0.25 | ) |
| | | | |
Net asset value, end of year | | | $12.44 | | | | $16.24 | | | | $13.93 | | | | $13.54 | | | | $14.85 | |
| | | | |
| | | | | |
Total returnd | | | (14.61)% | | | | 18.77% | | | | 9.90% | | | | (6.24)% | | | | (2.53)% | |
| | | | | |
| Ratios to average net assets | | | | | | | | | | | | | | | | | | | | |
| | | | | |
Expenses | | | 0.83% | e | | | 0.82% | e,f | | | 0.82% | e | | | 0.80% | e | | | 0.78% | |
| | | | | |
Net investment income | | | 1.90% | | | | 1.94% | | | | 2.01% | | | | 1.96% | | | | 2.46% | c |
| | | | | | |
| Supplemental data | | | | | | | | | | | | | | | | | | | | |
| | | | | |
Net assets, end of year (000’s) | | | $354,164 | | | $ | 466,207 | | | $ | 453,997 | | | $ | 468,548 | | | $ | 572,860 | |
| | | | | |
Portfolio turnover rate | | | 29.25% | | | | 26.46% | | | | 22.88% | | | | 20.92% | | | | 17.46% | |
aThe amount shown for a share outstanding throughout the period may not correlate with the Statement of Operations for the period due to the timing of sales and repurchases of the Fund’s shares in relation to income earned and/or fluctuating fair value of the investments of the Fund.
bBased on average daily shares outstanding.
cNet investment income per share includes approximately $0.09 per share related to income received in the form of special dividends in connection with certain Fund holdings. Excluding this amount, the ratio of net investment income to average net assets would have been 1.88%.
dTotal return does not include fees, charges or expenses imposed by the variable annuity and life insurance contracts for which Franklin Templeton Variable Insurance Products Trust serves as an underlying investment vehicle.
eBenefit of waiver and payments by affiliates rounds to less than 0.01%.
fBenefit of expense reduction rounds to less than 0.01%.
| | | | |
| | | |
| TG-8 | | Annual Report | The accompanying notes are an integral part of these financial statements. | | |
FRANKLIN TEMPLETON VARIABLE INSURANCE PRODUCTS TRUST
FINANCIAL HIGHLIGHTS
Templeton Growth VIP Fund(continued)
| | | | | | | | | | | | | | | | | | | | |
| |
| | | Year Ended December 31, | |
| | | | | |
| | | 2018 | | | 2017 | | | 2016 | | | 2015 | | | 2014 | |
| Class 2 | | | | | | | | | | | | | | | | | | | | |
Per share operating performance (for a share outstanding throughout the year) | | | | | | | | | | | | | | | | | | | | |
| | | | | |
Net asset value, beginning of year | | | $15.97 | | | | $13.70 | | | | $13.32 | | | | $14.61 | | | | $15.23 | |
| | | | |
| | | | | |
| Income from investment operationsa: | | | | | | | | | | | | | | | | | | | | |
| | | | | |
Net investment incomeb | | | 0.24 | | | | 0.25 | | | | 0.23 | | | | 0.25 | | | | 0.34 | c |
| | | | | | |
Net realized and unrealized gains (losses) | | | (2.38 | ) | | | 2.26 | | | | 0.94 | | | | (1.16 | ) | | | (0.75 | ) |
| | | | |
Total from investment operations | | | (2.14 | ) | | | 2.51 | | | | 1.17 | | | | (0.91 | ) | | | (0.41 | ) |
| | | | |
| | | | | |
| Less distributions from: | | | | | | | | | | | | | | | | | | | | |
| | | | | |
Net investment income | | | (0.31 | ) | | | (0.24 | ) | | | (0.27 | ) | | | (0.38 | ) | | | (0.21 | ) |
| | | | | |
Net realized gains | | | (1.31 | ) | | | — | | | | (0.52 | ) | | | — | | | | — | |
| | | | |
Total distributions | | | (1.62 | ) | | | (0.24 | ) | | | (0.79 | ) | | | (0.38 | ) | | | (0.21 | ) |
| | | | |
Net asset value, end of year | | | $12.21 | | | | $15.97 | | | | $13.70 | | | | $13.32 | | | | $14.61 | |
| | | | |
| | | | | |
Total returnd | | | (14.85)% | | | | 18.50% | | | | 9.62% | | | | (6.49)% | | | | (2.81)% | |
| | | | | |
| Ratios to average net assets | | | | | | | | | | | | | | | | | | | | |
| | | | | |
Expenses | | | 1.08% | e | | | 1.07% | e,f | | | 1.07% | e | | | 1.05% | e | | | 1.03% | |
| | | | | |
Net investment income | | | 1.65% | | | | 1.69% | | | | 1.76% | | | | 1.71% | | | | 2.21% | c |
| | |
| Supplemental data | | | | |
| | | | | |
Net assets, end of year (000’s) | | | $625,311 | | | $ | 879,521 | | | $ | 876,128 | | | $ | 921,895 | | | $ | 1,171,896 | |
| | | | | |
Portfolio turnover rate | | | 29.25% | | | | 26.46% | | | | 22.88% | | | | 20.92% | | | | 17.46% | |
aThe amount shown for a share outstanding throughout the period may not correlate with the Statement of Operations for the period due to the timing of sales and repurchases of the Fund’s shares in relation to income earned and/or fluctuating fair value of the investments of the Fund.
bBased on average daily shares outstanding.
cNet investment income per share includes approximately $0.09 per share related to income received in the form of special dividends in connection with certain Fund holdings. Excluding this amount, the ratio of net investment income to average net assets would have been 1.63%.
dTotal return does not include fees, charges or expenses imposed by the variable annuity and life insurance contracts for which Franklin Templeton Variable Insurance Products Trust serves as an underlying investment vehicle.
eBenefit of waiver and payments by affiliates rounds to less than 0.01%.
fBenefit of expense reduction rounds to less than 0.01%.
| | | | | | |
| | | |
| | The accompanying notes are an integral part of these financial statements. | Annual Report | | | TG-9 | |
FRANKLIN TEMPLETON VARIABLE INSURANCE PRODUCTS TRUST
FINANCIAL HIGHLIGHTS
Templeton Growth VIP Fund(continued)
| | | | | | | | | | | | | | | | | | | | |
| |
| | | Year Ended December 31, | |
| | | | | |
| | | 2018 | | | 2017 | | | 2016 | | | 2015 | | | 2014 | |
| Class 4 | | | | | | | | | | | | | | | | | | | | |
| Per share operating performance | | | | | | | | | | | | | | | | | | | | |
(for a share outstanding throughout the year) | | | | | | | | | | | | | | | | | | | | |
| | | | | |
| Net asset value, beginning of year | | | $16.13 | | | | $13.83 | | | | $13.44 | | | | $14.73 | | | | $15.35 | |
| | | | |
| | | | | |
| Income from investment operationsa: | | | | | | | | | | | | | | | | | | | | |
| | | | | |
Net investment incomeb | | | 0.23 | | | | 0.24 | | | | 0.22 | | | | 0.23 | | | | 0.33 | c |
| | | | | | |
Net realized and unrealized gains (losses) | | | (2.40 | ) | | | 2.28 | | | | 0.94 | | | | (1.16 | ) | | | (0.76 | ) |
| | | | |
| Total from investment operations | | | (2.17 | ) | | | 2.52 | | | | 1.16 | | | | (0.93 | ) | | | (0.43 | ) |
| | | | |
| | | | | |
| Less distributions from: | | | | | | | | | | | | | | | | | | | | |
| | | | | |
Net investment income | | | (0.29 | ) | | | (0.22 | ) | | | (0.25 | ) | | | (0.36 | ) | | | (0.19 | ) |
| | | | | |
Net realized gains | | | (1.31 | ) | | | — | | | | (0.52 | ) | | | — | | | | — | |
| | | | |
Total distributions | | | (1.60 | ) | | | (0.22 | ) | | | (0.77 | ) | | | (0.36 | ) | | | (0.19 | ) |
| | | | |
Net asset value, end of year | | | $12.36 | | | | $16.13 | | | | $13.83 | | | | $13.44 | | | | $14.73 | |
| | | | |
| | | | | |
Total returnd | | | (14.88)% | | | | 18.38% | | | | 9.47% | | | | (6.54)% | | | | (2.88)% | |
| | | | | |
Ratios to average net assets | | | | | | | | | | | | | | | | | | | | |
| | | | | |
Expenses | | | 1.18% | e | | | 1.17% | e,f | | | 1.17% | e | | | 1.15% | e | | | 1.13% | |
| | | | | |
Net investment income | | | 1.55% | | | | 1.59% | | | | 1.66% | | | | 1.61% | | | | 2.11% | c |
| | | | | | |
| Supplemental data | | | | | | | | | | | | | | | | | | | | |
| | | | | |
Net assets, end of year (000’s) | | | $28,238 | | | | $38,798 | | | | $43,286 | | | | $47,777 | | | | $59,989 | |
| | | | | |
Portfolio turnover rate | | | 29.25% | | | | 26.46% | | | | 22.88% | | | | 20.92% | | | | 17.46% | |
aThe amount shown for a share outstanding throughout the period may not correlate with the Statement of Operations for the period due to the timing of sales and repurchases of the Fund’s shares in relation to income earned and/or fluctuating fair value of the investments of the Fund.
bBased on average daily shares outstanding.
cNet investment income per share includes approximately $0.09 per share related to income received in the form of special dividends in connection with certain Fund holdings. Excluding this amount, the ratio of net investment income to average net assets would have been 1.53%.
dTotal return does not include fees, charges or expenses imposed by the variable annuity and life insurance contracts for which Franklin Templeton Variable Insurance Products Trust serves as an underlying investment vehicle.
eBenefit of waiver and payments by affiliates rounds to less than 0.01%.
fBenefit of expense reduction rounds to less than 0.01%.
| | | | |
| | | |
| TG-10 | | Annual Report | The accompanying notes are an integral part of these financial statements. | | |
FRANKLIN TEMPLETON VARIABLE INSURANCE PRODUCTS TRUST
Statement of Investments, December 31, 2018
Templeton Growth VIP Fund
| | | | | | | | | | | | | | |
| | | | |
| | | | | Country | | | Shares | | | Value | |
| | Common Stocks 99.4% | | | | | | | | | | | | |
| | | Air Freight & Logistics 1.2% | | | | | | | | | |
| | United Parcel Service Inc., B | | | United States | | | | 127,570 | | | $ | 12,441,902 | |
| | | | | | | | | | | | | | |
| | | Automobiles 0.9% | | | | | | | | | |
| | Hero Motocorp Ltd. | | | India | | | | 199,170 | | | | 8,887,071 | |
| | | | | | | | | | | | | | |
| | | Banks 13.7% | | | | | | | | | |
| | Bangkok Bank PCL, fgn | | | Thailand | | | | 1,704,150 | | | | 10,907,825 | |
| | Bangkok Bank PCL, NVDR | | | Thailand | | | | 913,600 | | | | 5,734,719 | |
| | Bank of Ireland Group PLC | | | Ireland | | | | 792,800 | | | | 4,411,342 | |
| | BNP Paribas SA | | | France | | | | 294,017 | | | | 13,298,522 | |
| | Citigroup Inc. | | | United States | | | | 384,990 | | | | 20,042,579 | |
| | Credit Agricole SA | | | France | | | | 925,466 | | | | 9,999,562 | |
| | HSBC Holdings PLC | | | United Kingdom | | | | 2,038,474 | | | | 16,869,052 | |
| | ING Groep NV | | | Netherlands | | | | 1,288,606 | | | | 13,893,721 | |
| | JPMorgan Chase & Co. | | | United States | | | | 103,550 | | | | 10,108,551 | |
| | KB Financial Group Inc. | | | South Korea | | | | 328,964 | | | | 13,735,017 | |
| | Standard Chartered PLC | | | United Kingdom | | | | 2,473,643 | | | | 19,220,448 | |
| | | | | | | | | | | | | | |
| | | | | | | | | | | | | 138,221,338 | |
| | | | | | | | | | | | | | |
| | Beverages 1.0% | | | | | | | | | | | | |
| | Suntory Beverage & Food Ltd. | | | Japan | | | | 232,900 | | | | 10,540,000 | |
| | | | | | | | | | | | | | |
| | Biotechnology 3.2% | | | | | | | | | | | | |
| | Amgen Inc. | | | United States | | | | 35,375 | | | | 6,886,451 | |
| a | | Celgene Corp. | | | United States | | | | 116,240 | | | | 7,449,822 | |
| | Gilead Sciences Inc. | | | United States | | | | 283,260 | | | | 17,717,913 | |
| | | | | | | | | | | | | | |
| | | | | | | | | | | | | 32,054,186 | |
| | | | | | | | | | | | | | |
| | Building Products 0.6% | | | | | | | | | | | | |
| | Compagnie de Saint-Gobain | | | France | | | | 187,590 | | | | 6,268,743 | |
| | | | | | | | | | | | | | |
| | Capital Markets 1.9% | | | | | | | | | | | | |
| | Man Group PLC | | | United Kingdom | | | | 2,385,372 | | | | 4,045,788 | |
| | UBS Group AG | | | Switzerland | | | | 1,096,280 | | | | 13,681,112 | |
| | Value Partners Group Ltd. | | | Hong Kong | | | | 2,079,300 | | | | 1,441,875 | |
| | | | | | | | | | | | | | |
| | | | | | | | | | | | | 19,168,775 | |
| | | | | | | | | | | | | | |
| | Chemicals 1.1% | | | | | | | | | | | | |
| | Akzo Nobel NV | | | Netherlands | | | | 133,115 | | | | 10,737,630 | |
| | | | | | | | | | | | | | |
| | Communications Equipment 0.7% | | | | | | | | | | | | |
| a | | CommScope Holding Co. Inc. | | | United States | | | | 407,140 | | | | 6,673,025 | |
| | | | | | | | | | | | | | |
| | Construction Materials 0.6% | | | | | | | | | | | | |
| | Taiheiyo Cement Corp. | | | Japan | | | | 191,970 | | | | 5,946,516 | |
| | | | | | | | | | | | | | |
| | Consumer Finance 1.4% | | | | | | | | | | | | |
| | Capital One Financial Corp. | | | United States | | | | 187,470 | | | | 14,170,857 | |
| | | | | | | | | | | | | | |
| | Diversified Financial Services 0.3% | | | | | | | | | | | | |
| | Voya Financial Inc. | | | United States | | | | 77,701 | | | | 3,118,918 | |
| | | | | | | | | | | | | | |
| | Diversified Telecommunication Services 4.7% | | | | | | | | | | | | |
| | China Telecom Corp. Ltd., ADR | | | China | | | | 269,865 | | | | 13,690,251 | |
| | China Telecom Corp. Ltd., H | | | China | | | | 2,006,000 | | | | 1,024,711 | |
| | Singapore Telecommunications Ltd. | | | Singapore | | | | 10,574,900 | | | | 22,731,710 | |
| | Telefonica SA | | | Spain | | | | 1,228,275 | | | | 10,328,596 | |
| | | | | | | | | | | | | | |
| | | | | | | | | | | | | 47,775,268 | |
| | | | | | | | | | | | | | |
| | Electrical Equipment 1.5% | | | | | | | | | | | | |
| | Vestas Wind Systems AS | | | Denmark | | | | 193,200 | | | | 14,625,418 | |
| | | | | | | | | | | | | | |
FRANKLIN TEMPLETON VARIABLE INSURANCE PRODUCTS TRUST
STATEMENT OF INVESTMENTS
Templeton Growth VIP Fund(continued)
| | | | | | | | | | | | | | |
| | | | |
| | | | | Country | | | Shares | | | Value | |
| | Common Stocks(continued) | | | | | | | | | | | | |
| | Food & Staples Retailing 4.0% | | | | | | | | | | | | |
| | The Kroger Co. | | | United States | | | | 427,740 | | | $ | 11,762,850 | |
| | Seven & i Holdings Co. Ltd. | | | Japan | | | | 227,400 | | | | 9,923,852 | |
| | Walgreens Boots Alliance Inc. | | | United States | | | | 267,649 | | | | 18,288,456 | |
| | | | | | | | | | | | | | |
| | | | | | | | | | | | | 39,975,158 | |
| | | | | | | | | | | | | | |
| | Food Products 1.4% | | | | | | | | | | | | |
| | Kellogg Co. | | | United States | | | | 245,540 | | | | 13,998,235 | |
| | | | | | | | | | | | | | |
| | Health Care Equipment & Supplies 0.9% | | | | | | | | | | | | |
| | Getinge AB, B | | | Sweden | | | | 1,057,200 | | | | 9,563,380 | |
| | | | | | | | | | | | | | |
| | Health Care Providers & Services 2.2% | | | | | | | | | | | | |
| | AmerisourceBergen Corp. | | | United States | | | | 168,500 | | | | 12,536,400 | |
| | Cardinal Health Inc. | | | United States | | | | 207,060 | | | | 9,234,876 | |
| | | | | | | | | | | | | | |
| | | | | | | | | | | | | 21,771,276 | |
| | | | | | | | | | | | | | |
| | Household Durables 1.2% | | | | | | | | | | | | |
| | Panasonic Corp. | | | Japan | | | | 1,369,190 | | | | 12,375,179 | |
| | | | | | | | | | | | | | |
| | Industrial Conglomerates 3.0% | | | | | | | | | | | | |
| | CK Hutchison Holdings Ltd. | | | Hong Kong | | | | 1,409,010 | | | | 13,531,390 | |
| | Siemens AG | | | Germany | | | | 150,912 | | | | 16,842,753 | |
| | | | | | | | | | | | | | |
| | | | | | | | | | | | | 30,374,143 | |
| | | | | | | | | | | | | | |
| | Insurance 3.6% | | | | | | | | | | | | |
| | Aegon NV | | | Netherlands | | | | 2,187,466 | | | | 10,223,599 | |
| | AXA SA | | | France | | | | 481,648 | | | | 10,407,207 | |
| | China Life Insurance Co. Ltd., H | | | China | | | | 7,459,230 | | | | 15,851,043 | |
| | | | | | | | | | | | | | |
| | | | | | | | | | | | | 36,481,849 | |
| | | | | | | | | | | | | | |
| | Interactive Media & Services 2.3% | | | | | | | | | | | | |
| a | | Alphabet Inc., A | | | United States | | | | 10,550 | | | | 11,024,328 | |
| a | | Baidu Inc., ADR | | | China | | | | 76,100 | | | | 12,069,460 | |
| | | | | | | | | | | | | | |
| | | | | | | | | | | | | 23,093,788 | |
| | | | | | | | | | | | | | |
| | Leisure Products 0.9% | | | | | | | | | | | | |
| a | | Mattel Inc. | | | United States | | | | 900,250 | | | | 8,993,497 | |
| | | | | | | | | | | | | | |
| | Machinery 0.8% | | | | | | | | | | | | |
| a | | Navistar International Corp. | | | United States | | | | 323,630 | | | | 8,398,199 | |
| | | | | | | | | | | | | | |
| | Marine 1.1% | | | | | | | | | | | | |
| | A.P. Moeller-Maersk AS, B | | | Denmark | | | | 8,500 | | | | 10,692,741 | |
| | | | | | | | | | | | | | |
| | Media 3.9% | | | | | | | | | | | | |
| | Comcast Corp., A | | | United States | | | | 455,054 | | | | 15,494,589 | |
| | SES SA, IDR | | | Luxembourg | | | | 1,233,520 | | | | 23,617,365 | |
| | | | | | | | | | | | | | |
| | | | | | | | | | | | | 39,111,954 | |
| | | | | | | | | | | | | | |
| | Metals & Mining 1.9% | | | | | | | | | | | | |
| | Barrick Gold Corp. | | | Canada | | | | 382,120 | | | | 5,173,905 | |
| | Wheaton Precious Metals Corp. | | | Canada | | | | 689,844 | | | | 13,468,876 | |
| | | | | | | | | | | | | | |
| | | | | | | | | | | | | 18,642,781 | |
| | | | | | | | | | | | | | |
| | Multi-Utilities 2.8% | | | | | | | | | | | | |
| | E.ON SE | | | Germany | | | | 1,149,310 | | | | 11,345,699 | |
| | Veolia Environnement SA | | | France | | | | 840,310 | | | | 17,287,562 | |
| | | | | | | | | | | | | | |
| | | | | | | | | | | | | 28,633,261 | |
| | | | | | | | | | | | | | |
FRANKLIN TEMPLETON VARIABLE INSURANCE PRODUCTS TRUST
STATEMENT OF INVESTMENTS
Templeton Growth VIP Fund(continued)
| | | | | | | | | | | | | | |
| | | | |
| | | | | Country | | | Shares | | | Value | |
| | Common Stocks(continued) | | | | | | | | | | | | |
| | | Oil, Gas & Consumable Fuels 11.0% | | | | | | | | | |
| | Apache Corp. | | | United States | | | | 413,010 | | | $ | 10,841,512 | |
| | BP PLC | | | United Kingdom | | | | 3,525,201 | | | | 22,295,494 | |
| | Eni SpA | | | Italy | | | | 1,331,279 | | | | 21,031,396 | |
| | Exxon Mobil Corp. | | | United States | | | | 178,770 | | | | 12,190,326 | |
| | Husky Energy Inc. | | | Canada | | | | 719,150 | | | | 7,434,123 | |
| | Kunlun Energy Co. Ltd. | | | China | | | | 12,188,570 | | | | 12,919,371 | |
| | Royal Dutch Shell PLC, B | | | United Kingdom | | | | 810,999 | | | | 24,200,899 | |
| | | | | | | | | | | | | | |
| | | | | | | | | | | | | 110,913,121 | |
| | | | | | | | | | | | | | |
| | Personal Products 1.0% | | | | | | | | | | | | |
| | Coty Inc., A | | | United States | | | | 1,516,950 | | | | 9,951,192 | |
| | | | | | | | | | | | | | |
| | Pharmaceuticals 13.8% | | | | | | | | | | | | |
| | Allergan PLC | | | United States | | | | 144,924 | | | | 19,370,542 | |
| | Bayer AG | | | Germany | | | | 230,116 | | | | 16,004,984 | |
| | Eli Lilly & Co. | | | United States | | | | 92,250 | | | | 10,675,170 | |
| | Merck KGaA | | | Germany | | | | 163,224 | | | | 16,801,790 | |
| | Novartis AG | | | Switzerland | | | | 41,900 | | | | 3,590,622 | |
| | Perrigo Co. PLC | | | United States | | | | 192,570 | | | | 7,462,087 | |
| | Roche Holding AG | | | Switzerland | | | | 58,373 | | | | 14,500,451 | |
| | Sanofi | | | France | | | | 218,787 | | | | 18,966,913 | |
| b | | Takeda Pharmaceutical Co. Ltd. | | | Japan | | | | 464,300 | | | | 15,695,543 | |
| a | | Teva Pharmaceutical Industries Ltd., ADR | | | Israel | | | | 1,010,640 | | | | 15,584,069 | |
| | | | | | | | | | | | | | |
| | | | | | | | | | | | | 138,652,171 | |
| | | | | | | | | | | | | | |
| | Real Estate Management & Development 1.1% | | | | | | | | | | | | |
| | Mitsui Fudosan Co. Ltd. | | | Japan | | | | 513,520 | | | | 11,455,807 | |
| | | | | | | | | | | | | | |
| | Software 2.6% | | | | | | | | | | | | |
| | Oracle Corp. | | | United States | | | | 581,700 | | | | 26,263,755 | |
| | | | | | | | | | | | | | |
| | Specialty Retail 1.7% | | | | | | | | | | | | |
| | Advance Auto Parts Inc. | | | United States | | | | 38,835 | | | | 6,114,959 | |
| | Kingfisher PLC | | | United Kingdom | | | | 4,291,927 | | | | 11,357,055 | |
| | | | | | | | | | | | | | |
| | | | | | | | | | | | | 17,472,014 | |
| | | | | | | | | | | | | | |
| | Technology Hardware, Storage & Peripherals 1.8% | | | | | | | | | | | | |
| | Samsung Electronics Co. Ltd. | | | South Korea | | | | 509,220 | | | | 17,694,745 | |
| | | | | | | | | | | | | | |
| | Wireless Telecommunication Services 3.6% | | | | | | | | | | | | |
| | Bharti Airtel Ltd. | | | India | | | | 2,320,100 | | | | 10,421,608 | |
| | China Mobile Ltd. | | | China | | | | 1,390,300 | | | | 13,378,342 | |
| | Vodafone Group PLC | | | United Kingdom | | | | 6,507,182 | | | | 12,688,075 | |
| | | | | | | | | | | | | | |
| | | | | | | | | | | | | 36,488,025 | |
| | | | | | | | | | | | | | |
| | | | |
| | Total Common Stocks (Cost $1,054,338,868) | | | | | | | | | | | 1,001,625,918 | |
| | | | | | | | | | | | | | |
| | | | |
| | | | | | | | | Principal Amount | | | | | |
| | Short Term Investments 1.5% | | | | | | | | | | | | |
| | | Time Deposits (Cost $2,900,000) 0.3% | | | | | | | | | |
| | Royal Bank of Canada, 2.35%, 1/02/19 | | | United States | | | $ | 2,900,000 | | | | 2,900,000 | |
| | | | | | | | | | | | | | |
FRANKLIN TEMPLETON VARIABLE INSURANCE PRODUCTS TRUST
STATEMENT OF INVESTMENTS
Templeton Growth VIP Fund(continued)
| | | | | | | | | | | | | | |
| | | | |
| | | | | Country | | | Shares | | | Value | |
| | Short Term Investments(continued) | | | | | | | | | | | | |
| c | | Investments from Cash Collateral Received for Loaned Securities
(Cost $12,394,593) 1.2% | | | | | | | | | | | | |
| | Money Market Funds 1.2% | | | | | | | | | | | | |
| d,e | | Institutional Fiduciary Trust Money Market Portfolio, 1.99% | | | United States | | | | 12,394,593 | | | $ | 12,394,593 | |
| | | | | | | | | | | | | | |
| | | | |
| | Total Investments (Cost $1,069,633,461) 100.9% | | | | | | | | | | | 1,016,920,511 | |
| | | | |
| | Other Assets, less Liabilities (0.9)% | | | | | | | | | | | (9,207,085 | ) |
| | | | | | | | | | | | | | |
| | | | |
| | Net Assets 100.0% | | | | | | | | | | $ | 1,007,713,426 | |
| | | | | | | | | | | | | | |
See Abbreviations on pageTG-25.
aNon-income producing.
bA portion or all of the security is on loan at December 31, 2018. See Note
1(c). cSee Note 1(c) regarding securities on loan.
dSee Note
3(e) regarding investments in affiliated management investment companies.
eThe rate shown is the annualizedseven-day effective yield at period end.
| | | | |
| | |
| TG-14 | | Annual Report | The accompanying notes are an integral part of these financial statements. |
FRANKLIN TEMPLETON VARIABLE INSURANCE PRODUCTS TRUST
Financial Statements
Statement of Assets and Liabilities
December 31, 2018
| | | | |
| |
| | | Templeton Growth VIP Fund | |
Assets: | | | | |
Investments in securities: | | | | |
Cost - Unaffiliated issuers | | $ | 1,057,238,868 | |
Cost -Non-controlled affiliates (Note 3e) | | | 12,394,593 | |
| | | | |
Value - Unaffiliated issuers+ | | $ | 1,004,525,918 | |
Value -Non-controlled affiliates (Note 3e) | | | 12,394,593 | |
Cash | | | 125,684 | |
Receivables: | | | | |
Investment securities sold | | | 114,266 | |
Capital shares sold | | | 475,818 | |
Dividends and interest | | | 3,218,898 | |
European Union tax reclaims | | | 828,723 | |
Due from custodian | | | 35,262 | |
Other assets | | | 159 | |
| | | | |
Total assets | | | 1,021,719,321 | |
| | | | |
Liabilities: | | | | |
Payables: | | | | |
Capital shares redeemed | | | 257,674 | |
Management fees | | | 714,256 | |
Distribution fees | | | 299,679 | |
Payable upon return of securities loaned | | | 12,429,855 | |
Accrued expenses and other liabilities | | | 304,431 | |
| | | | |
Total liabilities | | | 14,005,895 | |
| | | | |
Net assets, at value | | $ | 1,007,713,426 | |
| | | | |
Net assets consist of: | | | | |
Paid-in capital | | $ | 899,073,559 | |
Total distributable earnings (loss) | | | 108,639,867 | |
| | | | |
Net assets, at value | | $ | 1,007,713,426 | |
| | | | |
| |
| Class 1: | | | | |
Net assets, at value | | $ | 354,164,415 | |
| | | | |
Shares outstanding | | | 28,470,384 | |
| | | | |
Net asset value and maximum offering price per share | | $ | 12.44 | |
| | | | |
| |
| Class 2: | | | | |
Net assets, at value | | $ | 625,310,832 | |
| | | | |
Shares outstanding | | | 51,195,295 | |
| | | | |
Net asset value and maximum offering price per share | | $ | 12.21 | |
| | | | |
| |
| Class 4: | | | | |
Net assets, at value | | $ | 28,238,179 | |
| | | | |
Shares outstanding | | | 2,285,473 | |
| | | | |
Net asset value and maximum offering price per share | | $ | 12.36 | |
| | | | |
| |
+Includes securities loaned | | $ | 11,920,229 | |
| | | | | | |
| | | |
| | The accompanying notes are an integral part of these financial statements. | Annual Report | | | TG-15 | |
FRANKLIN TEMPLETON VARIABLE INSURANCE PRODUCTS TRUST
FINANCIAL STATEMENTS
Statement of Operations
for the year ended December 31, 2018
| | | | |
| |
| | | Templeton Growth VIP Fund | |
Investment income: | | | | |
Dividends: (net of foreign taxes)* | | | | |
Unaffiliated issuers | | $ | 32,977,404 | |
Interest: | | | | |
Unaffiliated issuers | | | 854,358 | |
Income from securities loaned: | | | | |
Unaffiliated issuers (net of fees and rebates) | | | 146,797 | |
Non-controlled affiliates (Note 3e) | | | 19,875 | |
| | | | |
Total investment income | | | 33,998,434 | |
| | | | |
Expenses: | | | | |
Management fees (Note 3a) | | | 9,851,248 | |
Distribution fees: (Note 3c) | | | | |
Class 2 | | | 1,971,964 | |
Class 4 | | | 120,999 | |
Custodian fees (Note 4) | | | 109,809 | |
Reports to shareholders | | | 173,604 | |
Professional fees | | | 123,729 | |
Trustees’ fees and expenses | | | 9,287 | |
Other | | | 57,382 | |
| | | | |
Total expenses | | | 12,418,022 | |
Expenses waived/paid by affiliates (Note 3e) | | | (18,237 | ) |
| | | | |
Net expenses | | | 12,399,785 | |
| | | | |
Net investment income | | | 21,598,649 | |
| | | | |
Realized and unrealized gains (losses): | | | | |
Net realized gain (loss) from: | | | | |
Investments: | | | | |
Unaffiliated issuers | | | 145,280,041 | |
Foreign currency transactions | | | (243,837 | ) |
| | | | |
Net realized gain (loss) | | | 145,036,204 | |
| | | | |
Net change in unrealized appreciation (depreciation) on: | | | | |
Investments: | | | | |
Unaffiliated issuers | | | (344,079,074 | ) |
Translation of other assets and liabilities denominated in foreign currencies | | | (165,187 | ) |
Change in deferred taxes on unrealized appreciation | | | 61,785 | |
| | | | |
Net change in unrealized appreciation (depreciation) | | | (344,182,476 | ) |
| | | | |
Net realized and unrealized gain (loss) | | | (199,146,272 | ) |
| | | | |
Net increase (decrease) in net assets resulting from operations | | $ | (177,547,623 | ) |
| | | | |
| |
*Foreign taxes withheld on dividends | | $ | 2,562,076 | |
| | | | |
| | | |
| TG-16 | | Annual Report | The accompanying notes are an integral part of these financial statements. | | |
FRANKLIN TEMPLETON VARIABLE INSURANCE PRODUCTS TRUST
FINANCIAL STATEMENTS
Statements of Changes in Net Assets
| | | | | | | | |
| |
| | | Templeton Growth VIP Fund | |
| |
| | | Year Ended December 31, | |
| | |
| | | 2018 | | | 2017 | |
Increase (decrease) in net assets: | | | | | | | | |
Operations: | | | | | | | | |
Net investment income | | $ | 21,598,649 | | | $ | 24,695,547 | |
Net realized gain (loss) | | | 145,036,204 | | | | 117,077,131 | |
Net change in unrealized appreciation (depreciation) | | | (344,182,476 | ) | | | 96,156,461 | |
| | | | |
Net increase (decrease) in net assets resulting from operations | | | (177,547,623 | ) | | | 237,929,139 | |
| | | | |
Distributions to shareholders: (Note 1e) | | | | | | | | |
Class 1 | | | (44,508,681 | ) | | | (8,645,537 | ) |
Class 2 | | | (82,384,314 | ) | | | (14,420,565 | ) |
Class 4 | | | (3,542,055 | ) | | | (607,359 | ) |
| | | | |
Total distributions to shareholders | | | (130,435,050 | ) | | | (23,673,461 | ) |
| | | | |
Capital share transactions: (Note 2) | | | | | | | | |
Class 1 | | | (7,474,527 | ) | | | (59,747,929 | ) |
Class 2 | | | (59,234,414 | ) | | | (132,483,391 | ) |
Class 4 | | | (2,120,747 | ) | | | (10,910,240 | ) |
| | | | |
Total capital share transactions | | | (68,829,688 | ) | | | (203,141,560 | ) |
| | | | |
Net increase (decrease) in net assets | | | (376,812,361 | ) | | | 11,114,118 | |
Net assets: | | | | | | | | |
Beginning of year | | | 1,384,525,787 | | | | 1,373,411,669 | |
| | | | |
End of year (Note 1e) | | $ | 1,007,713,426 | | | $ | 1,384,525,787 | |
| | | | |
| | | | | | |
| | | |
| | The accompanying notes are an integral part of these financial statements. | Annual Report | | | TG-17 | |
FRANKLIN TEMPLETON VARIABLE INSURANCE PRODUCTS TRUST
Notes to Financial Statements
Templeton Growth VIP Fund
1. Organization and Significant Accounting Policies
Franklin Templeton Variable Insurance Products Trust (Trust) is registered under the Investment Company Act of 1940 (1940 Act) as anopen-end management investment company, consisting of eighteen separate funds and applies the specialized accounting and reporting guidance in U.S. Generally Accepted Accounting Principles (U.S. GAAP). Templeton Growth VIP Fund (Fund) is included in this report. Shares of the Fund are generally sold only to insurance company separate accounts to fund the benefits of variable life insurance policies or variable annuity contracts. The Fund offers three classes of shares: Class 1, Class 2 and Class 4. Each class of shares may differ by its distribution fees, voting rights on matters affecting a single class and its exchange privilege.
The following summarizes the Fund’s significant accounting policies.
a. Financial Instrument Valuation
The Fund’s investments in financial instruments are carried at fair value daily. Fair value is the price that would be received to sell an asset or paid to transfer a liability in an orderly transaction between market participants on the measurement date. The Fund calculates the net asset value (NAV) per share each business day as of 4 p.m. Eastern time or the regularly scheduled close of the New York Stock Exchange (NYSE), whichever is earlier. Under compliance policies and procedures approved by the Trust’s Board of Trustees (the Board), the Fund’s administrator has responsibility for oversight of valuation, including leading the cross-functional Valuation Committee (VC). The Fund may utilize independent pricing services, quotations from securities and financial instrument dealers, and other market sources to determine fair value.
Equity securities listed on an exchange or on the NASDAQ National Market System are valued at the last quoted sale price or the official closing price of the day, respectively. Foreign equity securities are valued as of the close of trading on the foreign stock exchange on which the security is primarily traded, or as of 4 p.m. Eastern time. The value is then converted into its U.S. dollar equivalent at the foreign exchange rate in effect at 4 p.m. Eastern time on the day that the value of the security is determined.Over-the-counter (OTC) securities are valued within the range of the most recent quoted bid and ask prices. Securities that trade in multiple markets or on multiple
exchanges are valued according to the broadest and most representative market. Certain equity securities are valued based upon fundamental characteristics or relationships to similar securities.
Investments inopen-end mutual funds are valued at the closing NAV. Investments in time deposits are valued at cost, which approximates fair value.
The Fund has procedures to determine the fair value of financial instruments for which market prices are not reliable or readily available. Under these procedures, the Fund primarily employs a market-based approach which may use related or comparable assets or liabilities, recent transactions, market multiples, book values, and other relevant information for the investment to determine the fair value of the investment. An income-based valuation approach may also be used in which the anticipated future cash flows of the investment are discounted to calculate fair value. Discounts may also be applied due to the nature or duration of any restrictions on the disposition of the investments. Due to the inherent uncertainty of valuations of such investments, the fair values may differ significantly from the values that would have been used had an active market existed.
Trading in securities on foreign securities stock exchanges and OTC markets may be completed before 4 p.m. Eastern time. In addition, trading in certain foreign markets may not take place on every Fund’s business day. Occasionally, events occur between the time at which trading in a foreign security is completed and 4 p.m. Eastern time that might call into question the reliability of the value of a portfolio security held by the Fund. As a result, differences may arise between the value of the Fund’s portfolio securities as determined at the foreign market close and the latest indications of value at 4 p.m. Eastern time. In order to minimize the potential for these differences, the VC monitors price movements following the close of trading in foreign stock markets through a series of country specific market proxies (such as baskets of American Depositary Receipts, futures contracts and exchange traded funds). These price movements are measured against established trigger thresholds for each specific market proxy to assist in determining if an event has occurred that may call into question the reliability of the values of the foreign securities held by the Fund. If such an event occurs, the securities may be valued using fair value procedures, which may include the use
FRANKLIN TEMPLETON VARIABLE INSURANCE PRODUCTS TRUST
NOTES TO FINANCIAL STATEMENTS
Templeton Growth VIP Fund(continued)
of independent pricing services. At December 31, 2018, a market event occurred resulting in a portion of the securities held by the Fund being valued using fair value procedures.
When the last day of the reporting period is anon-business day, certain foreign markets may be open on those days that the Fund’s NAV is not calculated, which could result in differences between the value of the Fund’s portfolio securities on the last business day and the last calendar day of the reporting period. Any significant security valuation changes due to an open foreign market are adjusted and reflected by the Fund for financial reporting purposes.
b. Foreign Currency Translation
Portfolio securities and other assets and liabilities denominated in foreign currencies are translated into U.S. dollars based on the exchange rate of such currencies against U.S. dollars on the date of valuation. The Fund may enter into foreign currency exchange contracts to facilitate transactions denominated in a foreign currency. Purchases and sales of securities, income and expense items denominated in foreign currencies are translated into U.S. dollars at the exchange rate in effect on the transaction date. Portfolio securities and assets and liabilities denominated in foreign currencies contain risks that those currencies will decline in value relative to the U.S. dollar. Occasionally, events may impact the availability or reliability of foreign exchange rates used to convert the U.S. dollar equivalent value. If such an event occurs, the foreign exchange rate will be valued at fair value using procedures established and approved by the Board.
The Fund does not separately report the effect of changes in foreign exchange rates from changes in market prices on securities held. Such changes are included in net realized and unrealized gain or loss from investments in the Statement of Operations.
Realized foreign exchange gains or losses arise from sales of foreign currencies, currency gains or losses realized between the trade and settlement dates on securities transactions and the difference between the recorded amounts of dividends, interest, and foreign withholding taxes and the U.S. dollar equivalent of the amounts actually received or paid. Net unrealized foreign exchange gains and losses arise from changes in foreign exchange rates on foreign denominated assets and liabilities other than investments in securities held at the end of the reporting period.
c. Securities Lending
The Fund participates in an agency based securities lending program to earn additional income. The Fund receives cash collateral against the loaned securities in an amount equal to at least 102% of the fair value of the loaned securities. Collateral is maintained over the life of the loan in an amount not less than 100% of the fair value of loaned securities, as determined at the close of Fund business each day; any additional collateral required due to changes in security values is delivered to the Fund on the next business day. The collateral is deposited into a joint cash account with other funds and is used to invest in a money market fund managed by Franklin Advisers, Inc., an affiliate of the Fund. The Fund may receive income from the investment of cash collateral, in addition to lending fees and rebates paid by the borrower. Income from securities loaned, net of fees paid to the securities lending agent and/or third-party vendor, is reported separately in the Statement of Operations. The Fund bears the market risk with respect to the collateral investment, securities loaned, and the risk that the agent may default on its obligations to the Fund. If the borrower defaults on its obligation to return the securities loaned, the Fund has the right to repurchase the securities in the open market using the collateral received. The securities lending agent has agreed to indemnify the Fund in the event of default by a third party borrower.
d. Income and Deferred Taxes
It is the Fund’s policy to qualify as a regulated investment company under the Internal Revenue Code. The Fund intends to distribute to shareholders substantially all of its taxable income and net realized gains to relieve it from federal income and if applicable, excise taxes. As a result, no provision for U.S. federal income taxes is required.
The Fund may be subject to foreign taxation related to income received, capital gains on the sale of securities and certain foreign currency transactions in the foreign jurisdictions in which it invests. Foreign taxes, if any, are recorded based on the tax regulations and rates that exist in the foreign markets in which the Fund invests. When a capital gain tax is determined to apply, the Fund records an estimated deferred tax liability in an amount that would be payable if the securities were disposed of on the valuation date.
As a result of several court cases, in certain countries across the European Union, the Fund filed additional tax reclaims for previously withheld taxes on dividends earned in those
FRANKLIN TEMPLETON VARIABLE INSURANCE PRODUCTS TRUST
NOTES TO FINANCIAL STATEMENTS
Templeton Growth VIP Fund(continued)
1. Organization and Significant Accounting Policies (continued)
d. Income and Deferred Taxes(continued)
countries (EU reclaims). These additional filings are subject to various administrative proceedings by the local jurisdictions’ tax authorities within the European Union, as well as a number of related judicial proceedings. Income recognized, if any, for EU reclaims is reflected as other income in the Statement of Operations and any related receivable, if any, is reflected as European Union tax reclaims in the Statement of Assets and Liabilities. When uncertainty exists as to the ultimate resolution of these proceedings, the likelihood of receipt of these EU reclaims, and the potential timing of payment, no amounts are reflected in the financial statements. For U.S. income tax purposes, when EU reclaims are received by the Fund and the Fund previously passed foreign tax credit on to its shareholders, the Fund must either amend historic tax reporting to shareholders or enter into a closing agreement with the Internal Revenue Service (IRS) in order to pay the associated tax liability on behalf of the Fund’s shareholders.
The Fund may recognize an income tax liability related to its uncertain tax positions under U.S. GAAP when the uncertain tax position has a less than 50% probability that it will be sustained upon examination by the tax authorities based on its technical merits. As of December 31, 2018, the Fund has determined that no tax liability is required in its financial statements related to uncertain tax positions for any open tax years (or expected to be taken in future tax years). Open tax years are those that remain subject to examination and are based on the statute of limitations in each jurisdiction in which the Fund invests.
e. Security Transactions, Investment Income, Expenses and Distributions
Security transactions are accounted for on trade date. Realized gains and losses on security transactions are determined on a specific identification basis. Interest income and estimated expenses are accrued daily. Amortization of premium and accretion of discount on debt securities are included in interest income. Dividend income and capital gain distributions are recorded on theex-dividend date except for certain dividends from securities where the dividend rate is not available. In such
cases, the dividend is recorded as soon as the information is received by the Fund. Distributions to shareholders are recorded on theex-dividend date. Distributable earnings are determined according to income tax regulations (tax basis) and may differ from earnings recorded in accordance with U.S. GAAP. These differences may be permanent or temporary. Permanent differences are reclassified among capital accounts to reflect their tax character. These reclassifications have no impact on net assets or the results of operations. Temporary differences are not reclassified, as they may reverse in subsequent periods.*
Common expenses incurred by the Trust are allocated among the Funds based on the ratio of net assets of each Fund to the combined net assets of the Trust or based on the ratio of number of shareholders of each Fund to the combined number of shareholders of the Trust. Fund specific expenses are charged directly to the Fund that incurred the expense.
Realized and unrealized gains and losses and net investment income, excluding class specific expenses, are allocated daily to each class of shares based upon the relative proportion of net assets of each class. Differences in per share distributions by class are generally due to differences in class specific expenses.
f. Accounting Estimates
The preparation of financial statements in accordance with U.S. GAAP requires management to make estimates and assumptions that affect the reported amounts of assets and liabilities at the date of the financial statements and the amounts of income and expenses during the reporting period. Actual results could differ from those estimates.
g. Guarantees and Indemnifications
Under the Trust’s organizational documents, its officers and trustees are indemnified by the Trust against certain liabilities arising out of the performance of their duties to the Trust. Additionally, in the normal course of business, the Trust, on behalf of the Fund, enters into contracts with service providers that contain general indemnification clauses. The Trust’s maximum exposure under these arrangements is unknown as this would involve future claims that may be made against the Trust that have not yet occurred. Currently, the Trust expects the risk of loss to be remote.
FRANKLIN TEMPLETON VARIABLE INSURANCE PRODUCTS TRUST
NOTES TO FINANCIAL STATEMENTS
Templeton Growth VIP Fund(continued)
*Effective during the current reporting period, it is no longer required to present certain line items in the Statements of Changes in Net Assets. The below prior period amounts affected by this change are shown as they were in the prior year Statements of Changes in Net Assets.
For the year ended December 31, 2017, distributions to shareholders were as follows:
| | | | |
Distributions from net investment income: | | | | |
Class 1 | | $ | (8,645,537 | ) |
Class 2 | | | (14,420,565 | ) |
Class 4 | | | (607,359 | ) |
For the year ended December 31, 2017, undistributed net investment income included in net assets was $26,603,305.
2. Shares of Beneficial Interest
At December 31, 2018, there were an unlimited number of shares authorized (without par value). Transactions in the Fund’s shares were as follows:
| | | | | | | | | | | | | | | | |
| |
| | | Year Ended December 31, | |
| | |
| | | 2018 | | | 2017 | |
| | | | |
| | | Shares | | | Amount | | | Shares | | | Amount | |
| | | | |
| Class 1 Shares: | | | | | | | | | | | | | | | | |
Shares sold | | | 751,581 | | | $ | 10,285,009 | | | | 276,995 | | | $ | 4,131,560 | |
Shares issued in reinvestment of distributions | | | 3,065,336 | | | | 44,508,681 | | | | 578,684 | | | | 8,645,537 | |
Shares redeemed | | | (4,049,692 | ) | | | (62,268,217 | ) | | | (4,745,568 | ) | | | (72,525,026 | ) |
| | | | |
Net increase (decrease) | | | (232,775 | ) | | $ | (7,474,527 | ) | | | (3,889,889 | ) | | $ | (59,747,929 | ) |
| | | | |
| Class 2 Shares: | | | | | | | | | | | | | | | | |
Shares sold | | | 2,342,753 | | | $ | 33,884,634 | | | | 1,016,363 | | | $ | 15,049,406 | |
Shares issued in reinvestment of distributions | | | 5,773,252 | | | | 82,384,314 | | | | 980,324 | | | | 14,420,565 | |
Shares redeemed | | | (11,984,334 | ) | | | (175,503,362 | ) | | | (10,869,278 | ) | | | (161,953,362 | ) |
| | | | |
Net increase (decrease) | | | (3,868,329 | ) | | $ | (59,234,414 | ) | | | (8,872,591 | ) | | $ | (132,483,391 | ) |
| | | | |
| Class 4 Shares: | | | | | | | | | | | | | | | | |
Shares sold | | | 154,144 | | | $ | 2,180,515 | | | | 26,043 | | | $ | 392,232 | |
Shares issued in reinvestment of distributions | | | 245,125 | | | | 3,542,055 | | | | 40,845 | | | | 607,359 | |
Shares redeemed | | | (518,871 | ) | | | (7,843,317 | ) | | | (791,302 | ) | | | (11,909,831 | ) |
| | | | |
Net increase (decrease) | | | (119,602 | ) | | $ | (2,120,747 | ) | | | (724,414 | ) | | $ | (10,910,240 | ) |
| | | | |
3. Transactions with Affiliates
Franklin Resources, Inc. is the holding company for various subsidiaries that together are referred to as Franklin Templeton. Certain officers and trustees of the Fund are also officers and/or directors of the following subsidiaries:
| | |
| |
| Subsidiary | | Affiliation |
Templeton Global Advisors Limited (TGAL) | | Investment manager |
Franklin Templeton Services, LLC (FT Services) | | Administrative manager |
Franklin Templeton Distributors, Inc. (Distributors) | | Principal underwriter |
Franklin Templeton Investor Services, LLC (Investor Services) | | Transfer agent |
FRANKLIN TEMPLETON VARIABLE INSURANCE PRODUCTS TRUST
NOTES TO FINANCIAL STATEMENTS
Templeton Growth VIP Fund(continued)
3. Transactions with Affiliates(continued)
a. Management Fees
The Fund pays an investment management fee to TGAL based on the average daily net assets of the Fund as follows:
| | |
| |
| Annualized Fee Rate | | Net Assets |
1.000% | | Up to and including $100 million |
0.900% | | Over $100 million, up to and including $250 million |
0.800% | | Over $250 million, up to and including $500 million |
0.750% | | Over $500 million, up to and including $1 billion |
0.700% | | Over $1 billion, up to and including $5 billion |
0.675% | | Over $5 billion, up to and including $10 billion |
0.655% | | Over $10 billion, up to and including $15 billion |
0.635% | | Over $15 billion, up to and including $20 billion |
0.615% | | In excess of $20 billion |
For the year ended December 31, 2018, the gross effective investment management fee rate was 0.789% of the Fund’s average daily net assets.
b. Administrative Fees
Under an agreement with TGAL, FT Services provides administrative services to the Fund. The fee is paid by TGAL based on the Fund’s average daily net assets, and is not an additional expense of the Fund.
c. Distribution Fees
The Board has adopted distribution plans for Class 2 and Class 4 shares pursuant to Rule12b-1 under the 1940 Act. Under the Fund’s compensation distribution plans, the Fund pays Distributors for costs incurred in connection with the servicing, sale and distribution of the Fund’s shares up to 0.35% per year of its average daily net assets of each class. The Board has agreed to limit the current rate to 0.25% per year for Class 2. The plan year, for purposes of monitoring compliance with the maximum annual plan rates, is February 1 through January 31.
d. Transfer Agent Fees
Investor Services, under terms of an agreement, performs shareholder servicing for the Fund and is not paid by the Fund for the services.
FRANKLIN TEMPLETON VARIABLE INSURANCE PRODUCTS TRUST
NOTES TO FINANCIAL STATEMENTS
Templeton Growth VIP Fund(continued)
e. Investments in Affiliated Management Investment Companies
The Fund invests in one or more affiliated management investment companies for purposes other than exercising a controlling influence over the management or policies. Management fees paid by the Fund are waived on assets invested in the affiliated management investment companies, as noted in the Statement of Operations, in an amount not to exceed the management and administrative fees paid directly or indirectly by each affiliate. During the year ended December 31, 2018, the Fund held investments in affiliated management investment companies as follows:
| | | | | | | | | | | | | | | | | | | | | | | | | | | | | | | | |
| | | | | | | | |
| | | Number
of Shares
Held at
Beginning of Year | | | Gross Additions | | | Gross Reductions | | | Number
of Shares Held at
End of
Year | | | Value at
End of
Year | | | Income from securities loaned | | | Realized Gain (Loss) | | | Net Change in Unrealized Appreciation (Depreciation) | |
|
|
|
| Non-Controlled Affiliates | |
Institutional Fiduciary Trust Money Market Portfolio, 1.99% | | | — | | | | 251,767,001 | | | | (239,372,408 | ) | | | 12,394,593 | | | $ | 12,394,593 | | | $ | 19,875 | | | $ | — | | | $ | — | |
| | | | | | | | | | | | | | | | | | | | |
f. Other Affiliated Transactions
At December 31, 2018, Franklin Templeton Variable Insurance Products Trust - Franklin Founding Funds Allocation VIP Fund owned 25.5% of the Fund’s outstanding shares.
4. Expense Offset Arrangement
The Fund has entered into an arrangement with its custodian whereby credits realized as a result of uninvested cash balances are used to reduce a portion of the Fund’s custodian expenses. During the year ended December 31, 2018, there were no credits earned.
5. Income Taxes
The tax character of distributions paid during the years ended December 31, 2018 and 2017, was as follows:
| | | | | | | | |
| | |
| | | 2018 | | | 2017 | |
Distributions paid from: | | | | | | | | |
Ordinary income | | $ | 33,715,376 | | | $ | 23,673,461 | |
Long term capital gain | | | 96,719,674 | | | | — | |
| | | | |
| | $ | 130,435,050 | | | $ | 23,673,461 | |
| | | | |
At December 31, 2018, the cost of investments, net unrealized appreciation (depreciation), undistributed ordinary income and undistributed long term capital gains for income tax purposes were as follows:
| | | | |
Cost of investments | | $ | 1,075,369,768 | |
| | | | |
Unrealized appreciation | | $ | 113,671,931 | |
Unrealized depreciation | | | (172,121,188 | ) |
| | | | |
Net unrealized appreciation (depreciation) | | $ | (58,449,257 | ) |
| | | | |
Distributable earnings: | | | | |
Undistributed ordinary income | | $ | 35,131,358 | |
Undistributed long term capital gains | | | 131,169,001 | |
| | | | |
Total distributable earnings | | $ | 166,300,359 | |
| | | | |
Differences between income and/or capital gains as determined on a book basis and a tax basis are primarily due to differing treatment of bond discounts and premiums.
FRANKLIN TEMPLETON VARIABLE INSURANCE PRODUCTS TRUST
NOTES TO FINANCIAL STATEMENTS
Templeton Growth VIP Fund(continued)
6. Investment Transactions
Purchases and sales of investments (excluding short term securities) for the year ended December 31, 2018, aggregated $359,061,265 and $530,793,957, respectively.
At December 31, 2018, in connection with securities lending transactions, the Fund loaned equity investments and received $12,429,855 of cash collateral. The gross amount of recognized liability for such transactions is included in payable upon return of securities loaned in the Statement of Assets and Liabilities. The agreements can be terminated at any time.
7. Concentration of Risk
Investing in foreign securities may include certain risks and considerations not typically associated with investing in U.S. securities, such as fluctuating currency values and changing local and regional economic, political and social conditions, which may result in greater market volatility. Current political and financial uncertainty surrounding the European Union may increase market volatility and the economic risk of investing in securities in Europe. In addition, certain foreign securities may not be as liquid as U.S. securities.
8. Credit Facility
The Fund, together with other U.S. registered and foreign investment funds (collectively, Borrowers), managed by Franklin Templeton, are borrowers in a joint syndicated senior unsecured credit facility totaling $2 billion (Global Credit Facility) which matured on February 8, 2019. This Global Credit Facility provides a source of funds to the Borrowers for temporary and emergency purposes, including the ability to meet future unanticipated or unusually large redemption requests. Effective February 8, 2019, the Borrowers renewed the Global Credit Facility for a one year term, maturing February 7, 2020, for a total of $2 billion.
Under the terms of the Global Credit Facility, the Fund shall, in addition to interest charged on any borrowings made by the Fund and other costs incurred by the Fund, pay its share of fees and expenses incurred in connection with the implementation and maintenance of the Global Credit Facility, based upon its relative share of the aggregate net assets of all of the Borrowers, including an annual commitment fee of 0.15% based upon the unused portion of the Global Credit Facility. These fees are reflected in other expenses in the Statement of Operations. During the year ended December 31, 2018, the Fund did not use the Global Credit Facility.
9. Fair Value Measurements
The Fund follows a fair value hierarchy that distinguishes between market data obtained from independent sources (observable inputs) and the Fund’s own market assumptions (unobservable inputs). These inputs are used in determining the value of the Fund’s financial instruments and are summarized in the following fair value hierarchy:
| | • | | Level 1 – quoted prices in active markets for identical financial instruments |
| | • | | Level 2 – other significant observable inputs (including quoted prices for similar financial instruments, interest rates, prepayment speed, credit risk, etc.) |
| | • | | Level 3 – significant unobservable inputs (including the Fund’s own assumptions in determining the fair value of financial instruments) |
The input levels are not necessarily an indication of the risk or liquidity associated with financial instruments at that level.
FRANKLIN TEMPLETON VARIABLE INSURANCE PRODUCTS TRUST
NOTES TO FINANCIAL STATEMENTS
Templeton Growth VIP Fund(continued)
A summary of inputs used as of December 31, 2018, in valuing the Fund’s assets carried at fair value, is as follows:
| | | | | | | | | | | | | | | | |
| | | | |
| | | Level 1 | | | Level 2 | | | Level 3 | | | Total | |
| | | | |
| Assets: | | | | | | | | | | | | | | | | |
Investments in Securities:a | | | | | | | | | | | | | | | | |
Equity Investments:b | | | | | | | | | | | | | | | | |
Banks | | $ | 133,809,996 | | | $ | 4,411,342 | | | $ | — | | | $ | 138,221,338 | |
Capital Markets | | | 5,487,663 | | | | 13,681,112 | | | | — | | | | 19,168,775 | |
Electrical Equipment | | | — | | | | 14,625,418 | | | | — | | | | 14,625,418 | |
Health Care Equipment & Supplies | | | — | | | | 9,563,380 | | | | — | | | | 9,563,380 | |
Industrial Conglomerates | | | 13,531,390 | | | | 16,842,753 | | | | — | | | | 30,374,143 | |
Marine | | | — | | | | 10,692,741 | | | | — | | | | 10,692,741 | |
Multi-Utilities | | | 17,287,562 | | | | 11,345,699 | | | | — | | | | 28,633,261 | |
Oil, Gas & Consumable Fuels | | | 89,881,725 | | | | 21,031,396 | | | | — | | | | 110,913,121 | |
Pharmaceuticals | | | 87,754,324 | | | | 50,897,847 | | | | — | | | | 138,652,171 | |
All Other Equity Investments | | | 500,781,570 | | | | — | | | | — | | | | 500,781,570 | |
Short Term Investments | | | 12,394,593 | | | | 2,900,000 | | | | — | | | | 15,294,593 | |
| | | | |
Total Investments in Securities | | $ | 860,928,823 | | | $ | 155,991,688 | | | $ | — | | | $ | 1,016,920,511 | |
| | | | |
aFor detailed categories, see the accompanying Statement of Investments.
bIncludes common stocks.
10. Subsequent Events
The Fund has evaluated subsequent events through the issuance of the financial statements and determined that no events have occurred that require disclosure other than those already disclosed in the financial statements.
Abbreviations
| | |
|
| Selected Portfolio |
| |
| ADR | | American Depositary Receipt |
| |
| IDR | | International Depositary Receipt |
| |
| NVDR | | Non-Voting Depositary Receipt |
FRANKLIN TEMPLETON VARIABLE INSURANCE PRODUCTS TRUST
Report of Independent Registered Public Accounting Firm
To the Board of Trustees of Franklin Templeton Variable Insurance Products Trust and Shareholders of Templeton Growth VIP Fund
Opinion on the Financial Statements
We have audited the accompanying statement of assets and liabilities, including the statement of investments, of Templeton Growth VIP Fund (the “Fund”) as of December 31, 2018, the related statement of operations for the year ended December 31, 2018, the statement of changes in net assets for each of the two years in the period ended December 31, 2018, including the related notes, and the financial highlights for each of the five years in the period ended December 31, 2018 (collectively referred to as the “financial statements”). In our opinion, the financial statements present fairly, in all material respects, the financial position of the Fund as of December 31, 2018, the results of its operations for the year then ended, the changes in its net assets for each of the two years in the period ended December 31, 2018 and the financial highlights for each of the five years in the period ended December 31, 2018 in conformity with accounting principles generally accepted in the United States of America.
Basis for Opinion
These financial statements are the responsibility of the Fund’s management. Our responsibility is to express an opinion on the Fund’s financial statements based on our audits. We are a public accounting firm registered with the Public Company Accounting Oversight Board (United States) (PCAOB) and are required to be independent with respect to the Fund in accordance with the U.S. federal securities laws and the applicable rules and regulations of the Securities and Exchange Commission and the PCAOB.
We conducted our audits of these financial statements in accordance with the standards of the PCAOB. Those standards require that we plan and perform the audit to obtain reasonable assurance about whether the financial statements are free of material misstatement, whether due to error or fraud.
Our audits included performing procedures to assess the risks of material misstatement of the financial statements, whether due to error or fraud, and performing procedures that respond to those risks. Such procedures included examining, on a test basis, evidence regarding the amounts and disclosures in the financial statements. Our audits also included evaluating the accounting principles used and significant estimates made by management, as well as evaluating the overall presentation of the financial statements. Our procedures included confirmation of securities owned as of December 31, 2018 by correspondence with the custodian and transfer agent. We believe that our audits provide a reasonable basis for our opinion.
PricewaterhouseCoopers LLP
San Francisco, California
February 15, 2019
We have served as the auditor of one or more investment companies in the Franklin Templeton Group of Funds since 1948.
FRANKLIN TEMPLETON VARIABLE INSURANCE PRODUCTS TRUST
Tax Information (unaudited)
Templeton Growth VIP Fund
Under Section 852(b)(3)(C) of the Internal Revenue Code, the Fund hereby reports the maximum amount allowable but no less than $96,719,674 as a long term capital gain dividend for the fiscal year ended December 31, 2018.
Under Section 854(b)(1)(A) of the Internal Revenue Code, the Fund hereby reports 19.88% of the ordinary income dividends as income qualifying for the dividends received deduction for the fiscal year ended December 31, 2018.
At December 31, 2018, more than 50% of the Fund’s total assets were invested in securities of foreign issuers. In most instances, foreign taxes were withheld from income paid to the Fund on these investments. The Fund elects to treat foreign taxes paid as allowed under Section 853 of the Internal Revenue Code. This election will allow shareholders of record as of the 2019 distribution date, to treat their proportionate share of foreign taxes paid by the Fund as having been paid directly by them. The shareholder shall consider these amounts as foreign taxes paid in the tax year in which they receive the Fund distribution.
This page intentionally left blank.
FRANKLIN TEMPLETON VARIABLE INSURANCE PRODUCTS TRUST
Index Descriptions
The indexes are unmanaged and include reinvestment of any income or distributions. They do not reflect any fees, expenses or sales charges.
For Russell Indexes: Frank Russell Company is the source and owner of the trademarks, service marks and copyrights related to the Russell Indexes. Russell® is a trademark of Frank Russell Company.
See www.franklintempletondatasources.com for additional data provider information.
Bloomberg Barclays U.S. Aggregate Bond Indexis a market capitalization-weighted index representing the U.S. investment-grade, fixed-rate, taxable bond market with index components for government and corporate, mortgage pass-through and asset-backed securities. All issues included are SEC registered, taxable, dollar denominated and nonconvertible, must have at least one year to final maturity and must be rated investment grade(Baa3/BBB-/BBB- or higher) using the middle rating of Moody’s, Standard & Poor’s and Fitch, respectively.
Bloomberg Barclays U.S. Government Index: Intermediate Componentis the intermediate component of the Barclays U.S. Government Index, which includes public obligations of the U.S. Treasury with at least one year to final maturity and publicly issued debt of U.S. government agencies, quasi-federal corporations, and corporate or foreign debt guaranteed by the U.S. government.
Consumer Price Index (CPI)is a commonly used measure of the inflation rate.
FTSE® EPRA®/NAREIT® Developed Indexis a free float-adjusted index designed to measure the performance of publicly traded real estate securities in the North American, European and Asian real estate markets.
FTSE World Government Bond Indexis a market capitalization-weighted index consisting of investment-grade world government bond markets.
J.P. Morgan (JPM) Global Government Bond Index (GGBI)tracks total returns for liquid, fixed-rate, domestic government bonds with maturities greater than one year issued by developed countries globally.
Lipper Multi-Sector Income Funds Classification Averageis calculated by averaging the total returns of all funds within the Lipper Multi-Sector Income Funds Classification in the LipperOpen-End underlying funds universe. Lipper Multi-Sector Income Funds are defined as funds that seek current income by allocation of assets among different fixed income securities sectors (not primarily in one sector except for defensive purposes), including U.S. and foreign governments, with a significant portion rated below investment grade. For the12-month period ended 12/31/18, there were 320 funds in this category. Lipper calculations do not include contract fees, expenses or sales charges, and may have been different if such charges had been considered.
Lipper VIP Equity Income Funds Classification Averageis an equally weighted average calculation of performance figures for all funds within the Lipper Equity Income Funds classification in the Lipper VIP underlying funds universe. Lipper Equity Income Funds seek relatively high current income and growth of income through investing 60% or more of their portfolios in equities. For the12-month period ended 12/31/18, there were 81 funds in this category. Lipper calculations do not include contract fees, expenses or sales charges, and may have been different if such charges had been considered.
Lipper VIP General U.S. Government Funds Classification Averageis an equally weighted average calculation of performance figures for all funds within the Lipper General U.S. Government Funds classification in the Lipper VIP underlying funds universe. Lipper General U.S. Government Funds invest primarily in U.S. government and agency issues. For the12-month period ended 12/31/18, there were 56 funds in this category. Lipper calculations do not include contract fees, expenses or sales charges, and may have been different if such charges had been considered.
MSCI All Country World Index (ACWI)is a free float-adjusted, market capitalization-weighted index designed to measure equity market performance in global developed and emerging markets.
MSCI All Country World Index (ACWI) ex USA Indexcaptures large- andmid-capitalization representation across 22 of 23 developed markets countries (excluding the U.S.) and 23 emerging markets countries. The index covers approximately 85% of the global equity opportunity set outside the U.S.
FRANKLIN TEMPLETON VARIABLE INSURANCE PRODUCTS TRUST
Index descriptions
MSCI Emerging Markets (EM) Indexis a free float-adjusted, market capitalization-weighted index designed to measure equity market performance in global emerging markets.
MSCI World Indexis a free float-adjusted, market capitalization-weighted index designed to measure equity market performance in global developed markets.
Russell 1000® Growth Indexis market capitalization weighted and measures performance of those Russell 1000® Index companies with higherprice-to-book ratios and higher forecasted growth values.
Russell 1000® Indexis market capitalization weighted and measures performance of the largest companies in the Russell 3000® Index, which represents the majority of the U.S. market’s total capitalization.
Russell 2000® Indexis market capitalization weighted and measures performance of the 2,000 smallest companies in the Russell 3000® Index, which represent a small amount of the total market capitalization of the Russell 3000® Index.
Russell 2000® Value Indexis market capitalization weighted and measures performance of those Russell 2000® Index companies with lowerprice-to-book ratios and lower forecasted growth values.
Russell 2500TM Indexis market capitalization weighted and measures performance of the smallest companies in the Russell 3000® Index, which represent a modest amount of the Russell 3000® Index’s total market capitalization.
Russell 3000® Growth Indexis market capitalization weighted and measures performance of those Russell 3000® Index companies with higherprice-to-book ratios and higher forecasted growth values.
Russell Midcap® Growth Indexis market capitalization weighted and measures performance of those Russell Midcap® Index companies with higherprice-to-book ratios and higher forecasted growth values.
Russell Midcap® Indexis market capitalization weighted and measures performance of the smallest companies in the Russell 1000® Index, which represents a modest amount of the Russell 1000® Index’s total market capitalization.
Standard & Poor’s® 500 Index (S&P 500®)is a market capitalization-weighted index of 500 stocks designed to measure total U.S. equity market performance.
Standard & Poor’s®/International Finance Corporation Investable (S&P/IFCI) Composite Indexis a free float-adjusted, market capitalization-weighted index designed to measure equity performance in global emerging markets.
Board Members and Officers
The name, year of birth and address of the officers and board members, as well as their affiliations, positions held with the Trust, principal occupations during at least the past five years and number of U.S. registered portfolios overseen in the Franklin Templeton Investments fund complex, are shown below. Generally, each board member serves until that person’s successor is elected and qualified.
Independent Board Members
| | | | | | | | |
| | | | |
Name, Year of Birth and Address | | Position | | Length of Time Served | | Number of Portfolios in Fund Complex Overseen by Board Member* | | Other Directorships Held During at Least the Past 5 Years |
| | | | | | | | | |
| | | | |
| Harris J. Ashton (1932) | | Trustee | | Since 1988 | | 136 | | Bar-S Foods (meat packing company) |
One Franklin Parkway | | | | | | | | (1981-2010). |
San Mateo, CA 94403-1906 | | | | | | | | |
|
| Principal Occupation During at Least the Past 5 Years: |
| Director of various companies; andformerly, Director, RBC Holdings, Inc. (bank holding company) (until 2002); and President,Chief Executive Officer and Chairman of the Board, General Host Corporation (nursery and craft centers) (until 1998). |
| | | | |
| Terrence J. Checki (1945) | | Trustee | | Since 2017 | | 112 | | Hess Corporation (exploration of oil |
One Franklin Parkway | | | | | | | | and gas) (2014-present). |
San Mateo, CA 94403-1906 | | | | | | | | |
|
| Principal Occupation During at Least the Past 5 Years: |
| Member of the Council on Foreign Relations (1996-present); Member of the National Committee on U.S.-China Relations (1999-present); member of the Board of Trustees of the Economic Club of New York (2013-present); member of the Board of Trustees of the Foreign Policy Association (2005-present) and member of various other boards of trustees and advisory boards; andformerly, Executive Vice President of the Federal Reserve Bank of New York and Head of its Emerging Markets and Internal Affairs Group and Member of Management Committee (1995-2014); and Visiting Fellow at the Council on Foreign Relations (2014). |
| | | | |
Mary C. Choksi (1950) One Franklin Parkway San Mateo, CA 94403-1906 | | Trustee | | Since 2014 | | 136 | | Avis Budget Group Inc. (car rental) (2007-present),Omnicom Group Inc. (advertising and marketing communications services) (2011-present) and White Mountains Insurance Group, Ltd. (holding company) (2017-present) |
| | | | | | |
| | | | | | |
| | | | | | |
| | | | | | |
|
| Principal Occupation During at Least the Past 5 Years: |
| Director of various companies; andformerly, Founder and Senior Advisor, Strategic Investment Group (investment management group) (2015-2017); Founding Partner and Senior Managing Director, Strategic Investment Group (1987-2015); Founding Partner and Managing Director, Emerging Markets Management LLC (investment management firm) (1987-2011); and Loan Officer/Senior Loan Officer/Senior Pension Investment Officer, World Bank Group (international financial institution) (1977-1987). |
| | | | |
Edith E. Holiday (1952) One Franklin Parkway San Mateo, CA 94403-1906 | | Trustee | | Since 2005 | | 136 | | Hess Corporation (exploration of oil and gas) (1993-present), Canadian National Railway (railroad) (2001-present), White Mountains Insurance Group, Ltd. (holding company) (2004-present), Santander Consumer USA Holdings, Inc. (consumer finance) (2016-present), RTI International Metals, Inc. (manufacture and distribution of titanium) (1999-2015) and H.J. Heinz Company (processed foods and allied products) (1994-2013). |
|
| Principal Occupation During at Least the Past 5 Years: |
| Director or Trustee of various companies and trusts; andformerly, Assistant to the President of the United States and Secretary of the Cabinet (1990-1993); General Counsel to the United States Treasury Department (1989-1990); and Counselor to the Secretary and Assistant Secretary for Public Affairs and Public Liaison–United States Treasury Department (1988-1989). |
| | | | |
| J. Michael Luttig (1954) | | Trustee | | Since 2009 | | 136 | | Boeing Capital Corporation (aircraft |
| One Franklin Parkway | | | | | | | | financing) (2006-2013). |
| San Mateo, CA 94403-1906 | | | | | | | | |
|
| Principal Occupation During at Least the Past 5 Years: |
| Executive Vice President, General Counsel and member of the Executive Council, The Boeing Company (aerospace company) (2006-present); andformerly, Federal Appeals Court Judge, U.S. Court of Appeals for the Fourth Circuit (1991-2006). |
Independent Board Members(continued)
| | | | | | | | |
| | | | |
Name, Year of Birth and Address | | Position | | Length of Time Served | | Number of Portfolios in
Fund Complex Overseen
by Board Member* | | Other Directorships Held During
at Least the Past 5 Years |
| | | | |
Larry D. Thompson (1945) One Franklin Parkway San Mateo, CA 94403-1906 | | Trustee | | Since 2007 | | 136 | | The Southern Company (energy company) (2014-present; previously 2010-2012), Graham Holdings Company (education and media organization) (2011-present) and Cbeyond, Inc. (business communications provider) (2010-2012). |
|
| Principal Occupation During at Least the Past 5 Years: |
| Director of various companies; Counsel, Finch McCranie, LLP (law firm) (2015-present); Independent Compliance Monitor and Auditor, Volkswagen AG (manufacturer of automobiles and commercial vehicles) (2017-present); John A. Sibley Professor of Corporate and Business Law, University of Georgia School of Law (2015; previously 2011-2012); andformerly,Executive Vice President – Government Affairs, General Counsel and Corporate Secretary, PepsiCo, Inc. (consumer products) (2012-2014); Senior Vice President – Government Affairs, General Counsel and Secretary, PepsiCo, Inc. (2004-2011); Senior Fellow of The Brookings Institution (2003-2004); Visiting Professor, (2003-2004); Visiting Professor, University of Georgia School of Law (2004); and Deputy Attorney General, U.S. Department of Justice (2001-2003). |
| | | | |
John B. Wilson (1959) One Franklin Parkway San Mateo, CA 94403-1906 | | Lead Independent Trustee | | Trustee since 2007 and Lead Independent Trustee since 2008 | | 112 | | None |
|
| Principal Occupation During at Least the Past 5 Years: |
| President and Founder, Hyannis Port Capital, Inc. (real estate and private equity investing) (2002-present); Senior Advisor, McKinsey & Co. (consulting) (2017-present); serves on private andnon-profit boards; andformerly,President, Staples International and Head of Global Transformation (office supplies) (2012-2016); Chief Operating Officer and Executive Vice President, Gap, Inc. (retail) (1996-2000); Chief Financial Officer and Executive Vice President – Finance and Strategy, Staples, Inc. (1992-1996); Senior Vice President – Corporate Planning, Northwest Airlines, Inc. (airlines) (1990-1992); and Vice President and Partner, Bain & Company (consulting firm) (1986-1990). |
Interested Board Members and Officers
| | | | | | | | |
| | | | |
Name, Year of Birth and Address | | Position | | Length of Time Served | | Number of Portfolios in
Fund Complex Overseen
by Board Member* | | Other Directorships Held During at Least the Past 5 Years |
| | | | |
**Gregory E. Johnson (1961) One Franklin Parkway San Mateo, CA 94403-1906 | | Trustee | | Since 2013 | | 150 | | None |
|
| Principal Occupation During at Least the Past 5 Years: |
| Chairman of the Board, Member – Office of the Chairman, Director and Chief Executive Officer, Franklin Resources, Inc.; officer and/or director or trustee, as the case may be, of some of the other subsidiaries of Franklin Resources, Inc. and of 42 of the investment companies in Franklin Templeton Investments; Vice Chairman, Investment Company Institute; andformerly,President, Franklin Resources, Inc. (1994-2015). |
| | | | |
**Rupert H. Johnson, Jr. (1940) One Franklin Parkway San Mateo, CA 94403-1906 | | Chairman of the Board, and Trustee | | Chairman of the Board since 2013, and Trustee since 1988 | | 136 | | None |
|
| Principal Occupation During at Least the Past 5 Years: |
| Vice Chairman, Member – Office of the Chairman and Director, Franklin Resources, Inc.; Director, Franklin Advisers, Inc.; Senior Vice President, Franklin Advisory Services, LLC; and officer and/or director or trustee, as the case may be, of some of the other subsidiaries of Franklin Resources, Inc. and of 40 of the investment companies in Franklin Templeton Investments. |
| | | | |
Alison E. Baur (1964) One Franklin Parkway San Mateo, CA 94403-1906 | | Vice President | | Since 2012 | | Not Applicable | | Not Applicable |
|
| Principal Occupation During at Least the Past 5 Years: |
| Deputy General Counsel, Franklin Templeton Investments; and officer of some of the other subsidiaries of Franklin Resources, Inc. and of 44 of the investment companies in Franklin Templeton Investments. |
Interested Board Members and Officers(continued)
| | | | | | | | |
| | | | |
Name,Year of Birth and Address | | Position | | Length of Time Served | | Number of Portfolios in
Fund Complex Overseen by Board Member* | | Other Directorships Held During at Least the Past 5 Years |
| | | | |
Gaston Gardey (1967)
One Franklin Parkway
San Mateo, CA 94403-1906 | | Treasurer, Chief Financial Officer and Chief Accounting Officer | | Since 2009 | | Not Applicable | | Not Applicable |
|
| Principal Occupation During at Least the Past 5 Years: |
| Treasurer, U.S. Fund Administration & Reporting, Franklin Templeton Investments; and officer of 28 of the investment companies in Franklin Templeton Investments. |
| | | | |
Aliya S. Gordon (1973)
One Franklin Parkway
San Mateo, CA 94403-1906 | | Vice President | | Since 2009 | | Not Applicable | | Not Applicable |
|
| Principal Occupation During at Least the Past 5 Years: |
| Senior Associate General Counsel, Franklin Templeton Investments; and officer of 44 of the investment companies in Franklin Templeton Investments. |
| | | | |
Steven J. Gray (1955)
One Franklin Parkway
San Mateo, CA 94403-1906 | | Vice President
and
Co-Secretary | | Vice President
since 2009
and Co-Secretary
since January
2019 | | Not Applicable | | Not Applicable |
|
| Principal Occupation During at Least the Past 5 Years: |
| Senior Associate General Counsel, Franklin Templeton Investments; Vice President, Franklin Templeton Distributors, Inc. and FASA, LLC; and officer of 44 of the investment companies in Franklin Templeton Investments. |
| | | | |
Matthew T. Hinkle (1971)
One Franklin Parkway
San Mateo, CA 94403-1906 | | Chief Executive
Officer –
Finance and
Administration | | Since 2017 | | Not Applicable | | Not Applicable |
|
| Principal Occupation During at Least the Past 5 Years: |
| Senior Vice President, Franklin Templeton Services, LLC; officer of 44 of the investment companies in Franklin Templeton Investments; andformerly,Vice President, Global Tax (2012-April 2017) and Treasurer/Assistant Treasurer, Franklin Templeton Investments (2009-2017). |
| | | | |
Robert Lim (1948)
One Franklin Parkway
San Mateo, CA 94403-1906 | | Vice President
– AML
Compliance | | Since 2016 | | Not Applicable | | Not Applicable |
|
| Principal Occupation During at Least the Past 5 Years: |
| Vice President, Franklin Templeton Companies, LLC; Chief Compliance Officer, Franklin Templeton Distributors, Inc. and Franklin Templeton Investor Services, LLC; and officer of 44 of the investment companies in Franklin Templeton Investments. |
| | | | |
Kimberly H. Novotny (1972)
300 S.E. 2nd Street
Fort Lauderdale, FL 33301-1923 | | Vice President | | Since 2013 | | Not Applicable | | Not Applicable |
|
| Principal Occupation During at Least the Past 5 Years: |
| Associate General Counsel, Franklin Templeton Investments; Vice President and Corporate Secretary, Fiduciary Trust International of the South; Vice President, Templeton Investment Counsel, LLC; Assistant Secretary, Franklin Resources, Inc.; and officer of 44 of the investment companies in Franklin Templeton Investments. |
| | | | |
Edward D. Perks (1970)
One Franklin Parkway
San Mateo, CA 94403-1906 | | President and
Chief Executive
Officer –
Investment
Management | | Since December
2018 | | Not Applicable | | Not Applicable |
|
| Principal Occupation During at Least the Past 5 Years: |
| President and Director, Franklin Advisers, Inc.; and officer of nine of the investment companies in Franklin Templeton Investments (since December 2018). |
Interested Board Members and Officers(continued)
| | | | | | | | |
| | | | |
Name,Year of Birth and Address | | Position | | Length of Time Served | | Number of Portfolios in
Fund Complex Overseen
by Board Member* | | Other Directorships Held During at Least the Past 5 Years |
| | | | |
Robert C. Rosselot (1960)
300 S.E. 2nd Street
Fort Lauderdale, FL 33301-1923 | | Chief
Compliance
Officer | | Since 2013 | | Not Applicable | | Not Applicable |
|
| Principal Occupation During at Least the Past 5 Years: |
| Director, Global Compliance, Franklin Templeton Investments; Vice President, Franklin Templeton Companies, LLC; officer of 44 of the investment companies in Franklin Templeton Investments; andformerly, Senior Associate General Counsel, Franklin Templeton Investments (2007-2013); and Secretary and Vice President, Templeton Group of Funds (2004-2013). |
| | | | |
Navid J. Tofigh (1972)
One Franklin Parkway
San Mateo, CA 94403-1906 | | Vice President | | Since 2015 | | Not Applicable | | Not Applicable |
|
| Principal Occupation During at Least the Past 5 Years: |
| Associate General Counsel, Franklin Templeton Investments; and officer of 44 of the investment companies in Franklin Templeton Investments. |
| | | | |
Craig S. Tyle (1960)
One Franklin Parkway
San Mateo, CA 94403-1906 | | Vice President | | Since 2005 | | Not Applicable | | Not Applicable |
|
| Principal Occupation During at Least the Past 5 Years: |
| General Counsel and Executive Vice President, Franklin Resources, Inc.; and officer of some of the other subsidiaries of Franklin Resources, Inc. and of 44 of the investment companies in Franklin Templeton Investments. |
| | | | |
Lori A. Weber (1964)
300 S.E. 2nd Street
Fort Lauderdale, FL 33301-1923 | | Vice President
and
Co-Secretary | | Vice President
since 2011 and
Co-Secretary
since
January 2019 | | Not Applicable | | Not Applicable |
|
| Principal Occupation During at Least the Past 5 Years: |
| Senior Associate General Counsel, Franklin Templeton Investments; Assistant Secretary, Franklin Resources, Inc.; Vice President and Secretary, Templeton Investment Counsel, LLC; and officer of 44 of the investment companies in Franklin Templeton Investments. |
*We base the number of portfolios on each separate series of the U.S. registered investment companies within the Franklin Templeton Investments fund complex. These portfolios have a common investment manager or affiliated investment managers.
**Gregory E. Johnson is considered to be an interested person of the Fund under the federal securities laws due to his position as an officer and director of Franklin Resources, Inc. (Resources), which is the parent company of the Fund’s investment manager and distributor. Rupert H. Johnson, Jr. is considered to be an interested person of the Fund under the federal securities laws due to his position as an officer and director and major shareholder of Resources.
Note 1: Rupert H. Johnson, Jr. is the uncle of Gregory E. Johnson.
Note 2: Officer information is current as of the date of this report. It is possible that after this date, information about officers may change.
The Sarbanes-Oxley Act of 2002 and Rules adopted by the Securities and Exchange Commission require the Fund to disclose whether the Fund’s Audit Committee includes at least one member who is an audit committee financial expert within the meaning of such Act and Rules. The Fund’s Board has determined that there is at least one such financial expert on the Audit Committee and has designated John B. Wilson as its audit committee financial expert. The Board believes that Mr. Wilson qualifies as such an expert in view of his extensive business background and experience, including service as chief financial officer of Staples, Inc. from 1992 to 1996. Mr. Wilson has been a Member and Chairman of the Fund’s Audit Committee since 2007. As a result of such background and experience, the Board believes that Mr. Wilson has acquired an understanding of generally accepted accounting principles and financial statements, the general application of such principles in connection with the accounting estimates, accruals and reserves, and analyzing and evaluating financial statements that present a breadth and level of complexity of accounting issues generally comparable to those of the Fund, as well as an understanding of internal controls and procedures for financial reporting and an understanding of audit committee functions. Mr. Wilson is an independent Board member as that term is defined under the relevant Securities and Exchange Commission Rules and Releases.
The Statement of Additional Information (SAI) includes additional information about the board members and is available, without charge, upon request. Shareholders may call (800) DIALBEN/342-5236 to request the SAI.
FRANKLIN TEMPLETON VARIABLE INSURANCE PRODUCTS TRUST
Shareholder Information
Board Approval of Investment Management Agreements
FRANKLIN TEMPLETON VARIABLE INSURANCE PRODUCTS TRUST
Franklin Founding Funds Allocation VIP Fund
(Fund)
At a meeting held on October 23, 2018 (Meeting), the Board of Trustees (Board) of Franklin Templeton Variable Insurance Products Trust (Trust), including a majority of the trustees who are not “interested persons” as defined in the Investment Company Act of 1940 (Independent Trustees), reviewed and approved (i) a new investment management agreement between Franklin Advisers, Inc. (FAV) and the Trust, on behalf of the Fund, and (ii) new investmentsub-advisory agreements (each aSub-Advisory Agreement) between FAV and each of Franklin Templeton Institutional, LLC and Templeton Global Advisors Limited (each aSub-Adviser), affiliates of FAV, on behalf of the Fund (each a Management Agreement) for an initial two year period effective on or about May 1, 2019, subject to prior approval of the shareholders of the Fund. The Independent Trustees received advice from and met separately with Independent Trustee counsel in considering whether to approve each new Management Agreement. FAV and theSub-Advisers are each referred to herein as a Manager.
The Board reviewed and considered information provided by each Manager at the Meeting. The Board also considered a form of Management Agreement andSub-Advisory Agreement, which have terms that are consistent with the current investment management agreements and investmentsub-advisory agreements used for other funds in the Franklin Templeton Investments (FTI) fund complex. The Board further considered the code of ethics applied to the employees of each Manager and compliance policies and procedures applied to the employees of each Manager. The Board noted that the Fund currently maintains a static allocation to underlying funds and so does not currently have an investment manager, nor pay investment management fees. The Board discussed with FAV the reasons for its request that the Board approve the new Management Agreements, including the proposed repositioning of the Fund from afund-of-funds with a static allocation strategy to a direct investment fund with an actively managed dynamic allocation strategy. The Board noted FAV’s explanation that, as currently structured, the Fund generally does not meet the eligibility criteria for insurance companies’ living benefits products. The Board also noted that the Fund’s assets have declined substantially, from $4.2 billion as of
August 31, 2012, to $923 million as of August 31, 2018. The Board further noted management’s belief that the proposed repositioning will enable the Fund to be more widely distributed across insurance company platforms, reduce the volatility of the Fund’s returns and reduce the Fund’s overall expenses.
The Board reviewed and considered all of the factors it deemed relevant in approving each new Management Agreement, including, but not limited to: (i) the nature, extent and quality of the services to be provided by each Manager; (ii) the investment performance of the Fund; (iii) the costs of the services to be provided to the Fund; and (iv) the extent to which economies of scale are expected to be realized. The Board noted management’s proposal to request shareholder approval to allow the Fund to use amanager-of-manager structure as many other funds in the FTI fund complex have in place. The Board also noted that the Fund’s name would be changed to the “Franklin Allocation VIP Fund” to better reflect the repositioned strategy and structure of the Fund. In determining that the terms of each Management Agreement are fair and reasonable, the Board noted the level of services to be provided under each Management Agreement and the anticipated decrease in the overall fees and expenses of the Fund.
Nature, Extent and Quality of Services
The Board considered information regarding the nature, extent and quality of investment management services to be provided by each Manager and its affiliates to the Fund and its shareholders. In particular, the Board took into account management’s belief that the proposed repositioning, including the change from a static allocationfund-of-funds to a direct investment allocation fund, will enable the Fund to be more widely distributed across insurance company platforms and reduce the Fund’s overall expenses. The Board noted each Manager’s experience as manager of other funds and accounts, including those within the FTI organization; the personnel, operations, financial condition, and investment management capabilities, methodologies and resources of each Manager and each Manager’s capabilities, as demonstrated by, among other things, their policies and procedures designed to prevent violations of the Federal securities laws, which had previously been approved by the Board in connection with its oversight of other funds in the FTI organization.
Following consideration of such information, the Board was satisfied with the nature, extent and quality of services to be
FRANKLIN TEMPLETON VARIABLE INSURANCE PRODUCTS TRUST
SHAREHOLDER INFORMATION
provided by each Manager and its affiliates to the Fund and its shareholders.
Fund Performance
The Board reviewed and considered the performance results of the Fund over various time periods ended August 31, 2018. The Board considered the performance returns for the Fund in comparison to the performance returns of mutual funds deemed comparable to the Fund included in a universe (Performance Universe) selected by Broadridge Financial Solutions, Inc. (Broadridge), an independent provider of investment company data. The Board received a description of the methodology used by Broadridge to select the mutual funds included in the Performance Universe. The Board also considered Fund performance reports provided and discussions that occurred with portfolio managers at Board meetings throughout the year. A summary of the Fund’s performance results is below.
The Performance Universe for the Fund included the Fund and all mixed-asset target allocation growth funds underlying variable insurance products (VIPs). The Board noted that the Fund’s annualized income return for theone-, three-, five- and10-year periods was above the median of its Performance Universe. The Board also noted that the Fund’s annualized total return for theone-, three-, five- and10-year periods was below the median of its Performance Universe. Given the Fund’s income-oriented focus, the Board concluded that the Fund’s performance was satisfactory, but noted that it did not consider the current performance of the Fund to be a material factor in its consideration of the Management Agreements given the proposed repositioning and restructuring of the Fund.
Comparative Fees and Expenses
The Board reviewed and considered information regarding the Fund’s proposed total expense ratio and its various components, including, as applicable, management fees; transfer agent expenses; underlying fund expenses; Rule12b-1 andnon-Rule12b-1 service fees; and othernon-management fees. The Board considered the proposed total expense ratio and, separately, the proposed contractual management fee rate, without the effect of fee waivers (Management Rate), if any, of the Fund in comparison to the median expense ratio and median Management Rate, respectively, of other mutual funds deemed comparable to and with a similar expense structure as proposed for the Fund selected by Broadridge (Expense Group). Broadridge fee and expense data is based upon information taken from each fund’s most recent annual report, which reflects historical asset levels that may be quite different from those currently existing, particularly in a period of market
volatility. While recognizing such inherent limitation and the fact that expense ratios and Management Rates generally increase as assets decline and decrease as assets grow, the Board believed the independent analysis conducted by Broadridge to be an appropriate measure of comparative fees and expenses. The Broadridge Management Rate includes administrative charges, and the proposed total expense ratio was shown for Class 4 of the Fund and an actual total expense ratio was shown for Class B, Class 2, Class II, Service Class and Class S of the other funds in the Expense Group. The Board received a description of the methodology used by Broadridge to select the mutual funds included in the Expense Group.
The Expense Group for the Fund included the Fund and seven other mixed-asset target allocation growth funds underlying VIPs. The Board noted that the Management Rate and proposed total expense ratio were below the medians of its Expense Group. The Board concluded that the Management Rate to be charged to the Fund is reasonable. In doing so, the Board noted that the Fund’s proposed total expense ratio reflected a fee waiver from management and that theSub-Advisers would be paid by FAV out of the management fee FAV would receive from the Fund.
Profitability
The Board then noted that FAV and its affiliates could not report any financial results from their relationships with the Fund because the Fund does not currently have an investment manager, nor pay investment management fees, and thus, the Board could not evaluate FAV’s or its affiliates’ profitability with respect to the Fund. The Board noted that investment management fees are currently paid by the underlying funds in which the Fund invests.
Economies of Scale
The Board considered the extent to which FAV and its affiliates may realize economies of scale, if any, and whether the Fund’s proposed management fee structure reflects any economies of scale for the benefit of shareholders. The Board noted that FAV (and its affiliates) could not report on any potential economies of scale at this time given the repositioning and restructuring of the Fund, but would be able to do so in connection with the Fund’s annual contract renewal process.
Conclusion
Based on its review, consideration and evaluation of all factors it believed relevant, including the above-described factors and conclusions, the Board unanimously approved each Management Agreement for an initial two year period effective
FRANKLIN TEMPLETON VARIABLE INSURANCE PRODUCTS TRUST
SHAREHOLDER INFORMATION
on or about May 1, 2019, subject to prior approval of the shareholders of the Fund.
Proxy Voting Policies and Procedures
The Trust’s investment manager has established Proxy Voting Policies and Procedures (Policies) that the Trust uses to determine how to vote proxies relating to portfolio securities. Shareholders may view the Trust’s complete Policies online at franklintempleton.com. Alternatively, shareholders may request copies of the Policies free of charge by calling the Proxy Group collect at (954)527-7678 or by sending a written request to: Franklin Templeton Companies, LLC, 300 S.E. 2nd Street, Fort Lauderdale, FL 33301, Attention: Proxy Group. Copies of the Trust’s proxy voting records are also made available online at franklintempleton.com and posted on the U.S. Securities and Exchange Commission’s website at sec.gov and reflect the most recent12-month period ended June 30.
Quarterly Statement of Investments
The Trust files a complete statement of investments with the U.S. Securities and Exchange Commission for the first and third quarters for each fiscal year on FormN-Q. Shareholders may view the filed FormN-Q by visiting the Commission’s website at sec.gov. The filed form may also be viewed and copied at the Commission’s Public Reference Room in Washington, DC. Information regarding the operations of the Public Reference Room may be obtained by calling(800) SEC-0330.
This page intentionally left blank.
This page intentionally left blank.
This page intentionally left blank.
Annual Report
Franklin Templeton
Variable Insurance Products Trust
Investment Managers
Franklin Advisers, Inc.
Franklin Advisory Services, LLC
Franklin Mutual Advisers, LLC
Franklin Templeton Institutional, LLC
Templeton Asset Management Ltd.
Templeton Global Advisors Limited
Templeton Investment Counsel, LLC
Fund Administrator
Franklin Templeton Services, LLC
Distributor
Franklin Templeton Distributors, Inc.
Franklin Templeton Variable Insurance Products Trust (FTVIP) shares are not offered to the public; they are offered and sold only to:
(1) insurance company separate accounts (Separate Account) to serve as the underlying investment vehicle for variable contracts;
(2) certain qualified plans; and (3) other mutual funds (funds of funds).
Authorized for distribution to investors in Separate Accounts only when accompanied or preceded by the current prospectus for the applicable contract, which includes the Separate Account and the FTVIP prospectuses. Investors should carefully consider a fund’s investment goals, risks, charges and expenses before investing. The prospectus contains this and other information; please read it carefully before investing.
To help ensure we provide you with quality service, all calls to and from our service areas are monitored and/or recorded.
| | |
| ©2019 Franklin Templeton Investments. All rights reserved. | | VIP1 A 02/19 |
| (a) | The Registrant has adopted a code of ethics that applies to its principal executive officers and principal financial and accounting officer. |
| (f) | Pursuant to Item 12(a)(1), the Registrant is attaching as an exhibit a copy of its code of ethics that applies to its principal executive officers and principal financial and accounting officer. |
| Item 3. | Audit Committee Financial Expert. |
| (a)(1) | The Registrant has an audit committee financial expert serving on its audit committee. |
| | (2) | The audit committee financial expert is John B. Wilson and he is “independent” as defined under the relevant Securities and Exchange Commission Rules and Releases. |
| Item 4. | Principal Accountant Fees and Services. |
(a) Audit Fees
The aggregate fees paid to the principal accountant for professional services rendered by the principal accountant for the audit of the registrant’s annual financial statements or for services that are normally provided by the principal accountant in connection with statutory and regulatory filings or engagements were $824,512 for the fiscal year ended December 31, 2018 and $833,799 for the fiscal year ended December 31, 2017.
(b) Audit-Related Fees
There were no fees paid to the principal accountant for assurance and related services rendered by the principal accountant to the registrant that are reasonably related to the performance of the audit of the registrant’s financial statements and are not reported under paragraph (a) of Item 4.
There were no fees paid to the principal accountant for assurance and related services rendered by the principal accountant to the registrant’s investment adviser and any entity controlling, controlled by or under common control with the investment adviser that provides ongoing services to the registrant that are reasonably related to the performance of the audit of their financial statements.
(c) Tax Fees
There were no fees paid to the principal accountant for professional services rendered by the principal accountant to the registrant for tax compliance, tax advice and tax planning.
The aggregate fees paid to the principal accountant for professional services rendered by the principal accountant to the registrant’s investment adviser and any entity controlling, controlled by or under common control with the investment adviser that provides ongoing services to the registrant for tax compliance, tax advice and tax planning were $194,500 for the fiscal year ended December 31, 2018 and $32,500 for the fiscal year ended December 31, 2017. The services for which these fees were paid included tax consulting services related to the operating agreement and term sheet for the launch of a new fund and tax compliance services related toyear-end.
(d) All Other Fees
The aggregate fees paid to the principal accountant for products and services rendered by the principal accountant to the registrant not reported in paragraphs (a)-(c) of Item 4 were $8,838 for the fiscal year ended December 31, 2018 and $0 for the fiscal year ended December 31, 2017. The services for which these fees were paid included review of materials provided to the fund Board in connection with the investment management contract renewal process.
The aggregate fees paid to the principal accountant for products and services rendered by the principal accountant to the registrant’s investment adviser and any entity controlling, controlled by or under common control with the investment adviser that provides ongoing services to the registrant not reported in paragraphs (a)-(c) of Item 4 were $95,000 for the fiscal year ended December 31, 2018 and $40,225 for the fiscal year ended December 31, 2017. The services for which these fees were paid included compliance examination for Investment Advisor Act rule204-2 and206-4(2), account maintenance project, training on partnership tax accounting and capital account maintenance, benchmarking services in connection with the ICI TA survey, assets under management certification, and the issuance of an Auditors’ Certificate for South Korean regulatory shareholder disclosures.
(e) (1) The registrant’s audit committee is directly responsible for approving the services to be provided by the auditors, including:
(i)pre-approval of all audit and audit related services;
(ii)pre-approval of allnon-audit related services to be provided to the Fund by the auditors;
(iii)pre-approval of allnon-audit related services to be provided to the registrant by the auditors to the registrant’s investment adviser or to any entity that controls, is controlled by or is under common control with the registrant’s investment adviser and that provides ongoing services to the registrant where thenon-audit services relate directly to the operations or financial reporting of the registrant; and
(iv) establishment by the audit committee, if deemed necessary or appropriate, as an alternative to committeepre-approval of services to be provided by the auditors, as required by paragraphs (ii) and (iii) above, of policies and procedures to permit such services to bepre-approved by other means, such as through establishment of guidelines or by action of a designated member or members of the committee; provided the policies and procedures are detailed as to the particular service and the committee is informed of each service and such policies and procedures do not include delegation of audit
committee responsibilities, as contemplated under the Securities Exchange Act of 1934, to management; subject, in the case of (ii) through (iv), to any waivers, exceptions or exemptions that may be available under applicable law or rules.
(e) (2) None of the services provided to the registrant described in paragraphs (b)-(d) of Item 4 were approved by the audit committee pursuant to paragraph (c)(7)(i)(C) of Rule2-01 of regulationS-X.
(f) No disclosures are required by this Item 4(f).
(g) The aggregatenon-audit fees paid to the principal accountant for services rendered by the principal accountant to the registrant and the registrant’s investment adviser and any entity controlling, controlled by or under common control with the investment adviser that provides ongoing services to the registrant were $298,338 for the fiscal year ended December 31, 2018 and $72,725 for the fiscal year ended December 31, 2017.
(h) The registrant’s audit committee of the board has considered whether the provision ofnon-audit services that were rendered to the registrant’s investment adviser (not including anysub-adviser whose role is primarily portfolio management and is subcontracted with or overseen by another investment adviser), and any entity controlling, controlled by, or under common control with the investment adviser that provides ongoing services to the registrant that were notpre-approved pursuant to paragraph (c)(7)(ii) of Rule2-01 of RegulationS-X is compatible with maintaining the principal accountant’s independence.
| Item 5. | Audit Committee of Listed Registrants. N/A |
| Item 6. | Schedule of Investments. N/A |
| Item 7. | Disclosure of Proxy Voting Policies and Procedures forClosed-End Management Investment Companies. N/A |
| Item 8. | Portfolio Managers ofClosed-End Management Investment Companies. N/A |
| Item 9. | Purchases of Equity Securities byClosed-End Management Investment Company and Affiliated Purchasers. N/A |
| Item 10. | Submission of Matters to a Vote of Security Holders. |
There have been no changes to the procedures by which shareholders may recommend nominees to the Registrant’s Board of Trustees that would require disclosure herein.
| Item 11. | Controls and Procedures. |
(a) Evaluation of Disclosure Controls and Procedures. The Registrant maintains disclosure controls and procedures that are designed to provide reasonable assurance that information required to be disclosed in the Registrant’s filings under the Securities Exchange Act of 1934, as amended, and the Investment Company Act of 1940 is recorded, processed, summarized and reported within the periods specified in the rules and forms of the Securities and Exchange Commission. Such information is accumulated and communicated to the Registrant’s management, including its principal executive officer and principal financial officer, as appropriate, to allow timely decisions regarding required disclosure. The Registrant’s management, including the principal executive officer and the principal financial officer, recognizes that any set of controls and procedures, no matter how well designed and operated, can provide only reasonable assurance of achieving the desired control objectives.
Within 90 days prior to the filing date of this Shareholder Report on FormN-CSR, the Registrant had carried out an evaluation, under the supervision and with the participation of the Registrant’s management, including the Registrant’s principal executive officer and the Registrant’s principal financial officer, of the effectiveness of the design and operation of the Registrant’s disclosure controls and procedures. Based on such evaluation, the Registrant’s principal executive officer and principal financial officer concluded that the Registrant’s disclosure controls and procedures were not effective related to internal control over financial reporting specific to the monitoring of market events following the close of trading in foreign stock markets that assist in determining the reliability of the values of the foreign securities held by the Funds and which may require the use of fair valuation factors to account for changes in the values of those securities subsequent to the local close of the foreign market but prior to the net asset calculation of the Funds. As a result, a material weakness exists at period end for the Franklin Global Real Estate VIP Fund, Franklin Mutual Global Discovery VIP Fund, Franklin Mutual Shares VIP Fund, Templeton Developing Markets VIP Fund, Templeton Foreign VIP Fund, and Templeton Growth VIP Fund. There are no misstatements to current and previously issued financial statements. However, this material weakness could result in misstatements of security values and unrealized gains or losses and associated disclosures that would result in a material misstatement of the interim or annual financial statements that would not be prevented or detected.
Effective November 1, 2018, the Registrant’s controls were enhanced through the implementation of a daily secondary review of market events following the close of trading on foreign stock markets to ensure the appropriate application of market level fair value. Registrant’s management believes this will facilitate the remediation of the control deficiency we have identified and strengthen the internal control over financial reporting. This material weakness will not be considered remediated until the applicable controls operate for a sufficient period of time and management has concluded, through testing, that these controls are operating effectively.
(b) Changes in Internal Controls. As described above, there have been changes in the Registrant’s internal control over financial reporting that occurred during the period covered by this report that have materially affected, or is reasonably likely to materially affect, the internal control over financial reporting.
| Item 12. | Disclosure of Securities Lending Activities forClosed-End Management Investment Company. N/A |
(a)(1) Code of Ethics
(a)(2) Certifications pursuant to Section 302 of the Sarbanes-Oxley Act of 2002 of Matthew T. Hinkle, Chief Executive Officer—Finance and Administration, and Gaston Gardey, Chief Financial Officer and Chief Accounting Officer
(b)Certifications pursuant to Section 906 of the Sarbanes-Oxley Act of 2002 of Matthew T. Hinkle, Chief Executive Officer—Finance and Administration, and Gaston Gardey, Chief Financial Officer and Chief Accounting Officer
SIGNATURES
Pursuant to the requirements of the Securities Exchange Act of 1934 and the Investment Company Act of 1940, the registrant has duly caused this report to be signed on its behalf by the undersigned, thereunto duly authorized.
Franklin Templeton Variable Insurance Products Trust
| | |
| By | | /s/ MATTHEW T. HINKLE |
| | Matthew T. Hinkle |
| | Chief Executive Officer – Finance and Administration |
|
| Date February 26, 2019 |
Pursuant to the requirements of the Securities Exchange Act of 1934 and the Investment Company Act of 1940, this report has been signed below by the following persons on behalf of the registrant and in the capacities and on the dates indicated.
| | |
| By | | /s/ MATTHEW T. HINKLE |
| | Matthew T. Hinkle |
| | Chief Executive Officer – Finance and Administration |
|
| Date February 26, 2019 |
| | |
| By | | /s/ GASTON GARDEY |
| | Gaston Gardey |
| | Chief Financial Officer and Chief Accounting Officer |
|
| Date February 26, 2019 |