UNITED STATES
SECURITIES AND EXCHANGE COMMISSION
Washington, DC 20549
FORM N-CSR
CERTIFIED SHAREHOLDER REPORT OF REGISTERED
MANAGEMENT INVESTMENT COMPANIES
Investment Company Act file number 811-05583
Franklin Templeton Variable Insurance Products Trust
(Exact name of registrant as specified in charter)
One Franklin Parkway, San Mateo, CA 94403-1906
(Address of principal executive offices) (Zip code)
Craig S. Tyle, One Franklin Parkway, San Mateo, CA 94403-1906
(Name and address of agent for service)
Registrant’s telephone number, including area code: (650) 312-2000
Date of fiscal year end: 12/31
Date of reporting period: 12/31/17
| Item 1. | Reports to Stockholders. |
| | |
 | | Annual Report December 31, 2017 |
Franklin Templeton
Variable Insurance Products Trust

Franklin Templeton Variable Insurance
Products Trust Annual Report
*Not part of the annual report. Retain for your records.
|
| Not FDIC Insured | May Lose Value | No Bank Guarantee |
MASTER CLASS – 2
FRANKLIN TEMPLETON VARIABLE INSURANCE PRODUCTS TRUST
Important Notes to
Performance Information
Performance data is historical and cannot predict or guarantee future results. Principal value and investment return will fluctuate with market conditions, and you may have a gain or loss when you withdraw your money. Inception dates of the funds may have preceded the effective dates of the subaccounts, contracts or their availability in all states.
When reviewing the index comparisons, please keep in mind that indexes have a number of inherent performance differentials over the funds. First, unlike the funds, which must hold a minimum amount of cash to maintain liquidity, indexes do not
have a cash component. Second, the funds are actively managed and, thus, are subject to management fees to cover salaries of securities analysts or portfolio managers in addition to other expenses. Indexes are unmanaged and do not include any commissions or other expenses typically associated with investing in securities. Third, indexes often contain a different mix of securities than the fund to which they are compared. Additionally, please remember that indexes are simply a measure of performance and cannot be invested in directly.
Franklin Flex Cap Growth VIP Fund
This annual report for Franklin Flex Cap Growth VIP Fund covers the fiscal year ended December 31, 2017.
Class 2 Performance Summary as of December 31, 2017
Average annual total return of Class 2 shares* represents the average annual change in value, assuming reinvestment of dividends and capital gains. Average returns smooth out variations in returns, which can be significant; they are not the same as year-by-year results.
| | | | | | | | | | | | |
| Periods ended 12/31/17 | | 1-Year | | | 5-Year | | | 10-Year | |
Average Annual Total Return | | | +26.94% | | | | +13.42% | | | | +6.91% | |
*The Fund has an expense reduction and a fee waiver associated with any investments it makes in a Franklin Templeton money fund and/or other Franklin Templeton fund, contractually guaranteed through 4/30/18. Fund investment results reflect the expense reduction and fee waiver; without these reductions, the results would have been lower.
Performance reflects the Fund’s Class 2 operating expenses, but does not include any contract fees, expenses or sales charges. If they had been included, performance would be lower. These charges and deductions, particularly for variable life policies, can have a significant effect on contract values and insurance benefits. See the contract prospectus for a complete description of these expenses, including sales charges.
Performance data represent past performance, which does not guarantee future results. Investment return and principal value will fluctuate, and you may have a gain or loss when you sell your shares. Current performance may differ from figures shown.
Total Return Index Comparison for a Hypothetical $10,000 Investment (1/1/08–12/31/17)
The graph below shows the change in value of a hypothetical $10,000 investment in the Fund over the indicated period and includes reinvestment of any income or distributions. The Fund’s performance* is compared to the performance of the Russell 3000® Growth Index, the Russell 1000® Growth Index and the Standard & Poors® 500 Index (S&P 500®). One cannot invest directly in an index, and an index is not representative of the Fund’s portfolio. Please see Important Notes to Performance Information preceding the Fund Summaries.
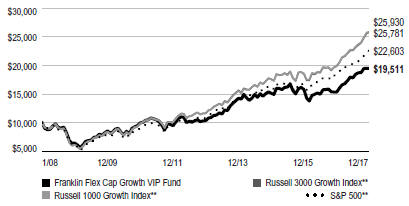
**Source: Morningstar. Please see Index Descriptions following the Fund Summaries.
FRANKLIN FLEX CAP GROWTH VIP FUND
Fund Goal and Main Investments
The Fund seeks capital appreciation. Under normal market conditions, the Fund invests predominantly in equity securities of companies that the investment manager believes have the potential for capital appreciation.
Fund Risks
All investments involve risks, including possible loss of principal. Growth stock prices reflect projections of future earnings or revenues, and can, therefore, fall dramatically if the company fails to meet those projections. To the extent the Fund focuses on particular countries, regions, industries, sectors or types of investment from time to time, it may be subject to greater risk of adverse developments in such areas of focus than a fund that invests in a wider variety of countries, regions, industries, sectors or investments. Smaller, midsized and relatively new or unseasoned companies can be particularly sensitive to changing economic conditions, and their prospects for growth are less certain than those of larger, more established companies. Historically, these securities have experienced more price volatility than larger company stocks, especially over the short term. Foreign securities involve special risks, including currency fluctuations and economic and political uncertainties. The Fund is actively managed but there is no guarantee that the manager’s investment decisions will produce the desired results. The Fund’s prospectus also includes a description of the main investment risks.
Performance Overview
You can find the Fund’s one-year total return in the Performance Summary. In comparison, the Russell 3000® Growth Index generated a +29.59% total return, the Russell 1000® Growth Index produced a +30.21% total return, and the S&P 500 posted a +21.83% total return for the same period.1
Economic and Market Overview
The US economy grew during the 12 months under review. After strengthening in 2017’s second and third quarters, the economy moderated in the fourth quarter. The economy grew faster in 2017 than in 2016, however, largely due to growth in consumer spending, business investment and exports. The manufacturing and services sectors expanded during the period. The unemployment rate declined from 4.7% in December 2016
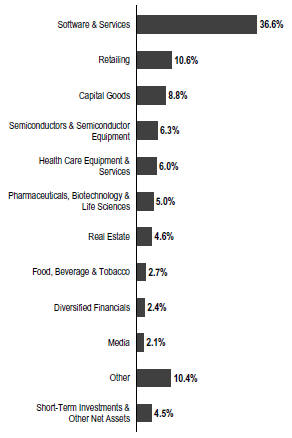
Portfolio Composition
Based on Total Net Assets as of 12/31/17
to 4.1% at period-end.2 Monthly retail sales were volatile but positive on average during the period. Annual inflation, as measured by the Consumer Price Index, was 2.1% in December 2016, and while it varied over the 12-month period, remained unchanged at period-end.2
The US Federal Reserve (Fed) raised its target range for the federal funds rate 0.25% at its March and June 2017 meetings, amid signs of a growing US economy, strengthening labor market and improving business spending. At its December meeting, the Fed raised its target range for the federal funds rate 0.25% to 1.25%–1.50%, as widely anticipated by the market. The Fed also confirmed that the monthly balance sheet
1. Source: Morningstar. One cannot invest directly in an index, and an index is not representative of the Fund’s portfolio. Please see Index Descriptions following the Fund Summaries.
2. Source: Bureau of Labor Statistics.
The dollar value, number of shares or principal amount, and names of all portfolio holdings are listed in the Fund’s Statement of Investments (SOI).
FRANKLIN FLEX CAP GROWTH VIP FUND
reduction would increase from $10 billion to $20 billion beginning in January 2018.
US equity markets rose during the 12-month period, benefiting from mostly upbeat economic data, better US corporate earnings and improving global economic growth. Concerns about the terms of the UK’s exit from the European Union (EU), political uncertainty in the US, tensions between the US and North Korea, and the progress of US health care and tax reform plans curbed market sentiment at times. However, the markets were also supported by investor optimism arising from pro-growth and pro-business policy plans in the US, the prospect for reforms in the EU with Emmanuel Macron’s election as France’s president, and the US Fed chair’s comments indicating optimism about the US economy and the likelihood of gradual rate hikes. Furthermore, the Senate’s approval of a budget plan in October and subsequent passage of a tax reform bill near period-end drove many US equity indexes to end 2017 near record highs. In this environment, the broad US stock market, as measured by the S&P 500, generated a +21.83% total return for the period.1
Investment Strategy
We use fundamental, bottom-up research to seek companies meeting our criteria of growth potential, quality and valuation. In seeking sustainable growth characteristics, we look for companies we believe can produce sustainable earnings and cash flow growth, evaluating the long-term market opportunity and competitive structure of an industry to target leaders and emerging leaders. We define quality companies as those with strong and improving competitive positions in attractive markets. We also believe important attributes of quality are experienced and talented management teams as well as financial strength reflected in the capital structure, gross and operating margins, free cash flow generation and returns on capital employed. Our valuation analysis includes a range of potential outcomes based on an assessment of multiple scenarios. In assessing value, we consider whether security prices fully reflect the balance of the sustainable growth opportunities relative to business and financial risks.
Manager’s Discussion
During the 12 months ended December 31, 2017, all sectors represented in the Fund’s portfolio delivered positive returns and contributed to absolute performance. Relative to the
| | | | |
| Top 10 Holdings | | | |
12/31/17 | | | |
Company
Sector/Industry | | % of Total
Net Assets | |
Amazon.com Inc.
Retailing | | | 7.3% | |
Alphabet Inc.
Software & Services | | | 5.6% | |
Microsoft Corp.
Software & Services | | | 5.4% | |
Facebook Inc.
Software & Services | | | 4.8% | |
Mastercard Inc.
Software & Services | | | 4.8% | |
ServiceNow Inc.
Software & Services | | | 3.5% | |
Raytheon Co.
Capital Goods | | | 3.4% | |
Salesforce.com Inc.
Software & Services | | | 2.9% | |
Visa Inc.
Software & Services | | | 2.7% | |
Constellation Brands Inc.
Food, Beverage & Tobacco | | | 2.7% | |
Russell 3000® Growth Index, the information technology (IT) sector contributed to relative results due to stock selection and overweighting in that sector, while stock selection and underweighted positions in consumer staples and consumer discretionary drove those sectors’ contributions.3
IT companies ServiceNow and Facebook were the largest relative contributors in the sector and the Fund as a whole. ServiceNow, a workflow platform company, expanded into new product categories during the period under review. The company operates in a large market, and we believe it has the potential for high operating margin and growth opportunities beyond servicing IT departments. Facebook improved monetization due to improvements in advertising formats, targeting capabilities and measurement tools. Instagram, a subsidiary, is early in monetization, but it saw accelerating user growth and has the ability to leverage Facebook’s data and advertising technology. Facebook is also benefiting from advertisers shifting more of their budgets toward the social media platform.
In consumer staples, alcoholic-beverage company Constellation Brands was the sector’s top relative contributor.
3. The information technology sector comprises semiconductors and semiconductor equipment, and software and services in the SOI. The consumer staples sector comprises food and staples retailing; food, beverage and tobacco; and household and personal products in the SOI. The consumer discretionary sector comprises automobiles and components, consumer durables and apparel, consumer services, media and retailing in the SOI.
FRANKLIN FLEX CAP GROWTH VIP FUND
In consumer discretionary, Amazon.com’s growth in retail and Amazon Web Services were signs that investments in those areas had proved beneficial. We believe the online retailer’s expansion into grocery and consumer packaged goods, aided by their acquisition of Whole Foods Markets, improves the company’s long-term prospects.
In contrast, health care, financials and materials detracted from relative performance, with stock selection being the primary factor for their poor results.4
In health care, Celgene was hurt by failure of Revlimid, currently used as a treatment for multiple myeloma, in a lymphoma treatment trial. Growing awareness that the company’s revenue is increasingly reliant on Revlimid and Pomalyst, both of which will lose market exclusivity no later than 2026 and as early as 2020, also dampened investor sentiment. In October, management reduced their long-term revenue projections. Incyte, a biopharmaceutical company, also hurt relative results. After reaching an all-time high in March, the company’s stock fell by one-third by the end of the period.
In financials, First Republic Bank hurt relative results, largely due to pressure from weak net interest margins and high management expenses.
Thank you for your participation in Franklin Flex Cap Growth VIP Fund. We look forward to serving your future investment needs.
The foregoing information reflects our analysis, opinions and portfolio holdings as of December 31, 2017, the end of the reporting period. The way we implement our main investment strategies and the resulting portfolio holdings may change depending on factors such as market and economic conditions. These opinions may not be relied upon as investment advice or an offer for a particular security. The information is not a complete analysis of every aspect of any market, state, industry, security or the Fund. Statements of fact are from sources considered reliable, but the investment manager makes no representation or warranty as to their completeness or accuracy. Although historical performance is no guarantee of future results, these insights may help you understand our investment management philosophy.
4. The health care sector comprises health care equipment and services; and pharmaceuticals, biotechnology and life sciences in the SOI. The financials sector comprises banks and diversified financials in the SOI.
FRANKLIN FLEX CAP GROWTH VIP FUND
Class 2 Fund Expenses
As an investor in a variable insurance contract (Contract) that indirectly provides for investment in an underlying mutual fund, you can incur transaction and/or ongoing expenses at both the Fund level and the Contract Level: (1) transaction expenses can include sales charges (loads) on purchases, surrender fees, transfer fees and premium taxes; and (2) ongoing expenses can include management fees, distribution and service (12b-1) fees, contract fees, annual maintenance fees, mortality and expense risk fees and other fees and expenses. All mutual funds and Contracts have some types of ongoing expenses. The table below shows Fund-level ongoing expenses and can help you understand these costs and compare them with those of other mutual funds offered through the Contract. The table assumes a $1,000 investment held for the six months indicated. Please refer to the Fund prospectus for additional information on operating expenses.
Actual Fund Expenses
The table below provides information about the actual account values and actual expenses in the columns under the heading “Actual.” In these columns the Fund’s actual return, which includes the effect of ongoing Fund expenses but does not include the effect of ongoing Contract expenses, is used to calculate the “Ending Account Value.” You can estimate the Fund-level expenses you paid during the period by following these steps (of course, your account value and expenses will differ from those in this illustration): Divide your account value by $1,000 (if your account had an $8,600 value, then $8,600 ÷ $1,000 = 8.6). Then multiply the result by the number under the headings “Actual” and “Fund-Level Expenses Paid During Period” (if Fund-Level Expenses Paid During Period were $ 7.50, then 8.6 x $7.50 = $64.50). In this illustration, the estimated expenses paid this period at the Fund level are $64.50.
Hypothetical Example for Comparison with Other Mutual Funds
Under the heading “Hypothetical” in the table, information is provided about hypothetical account values and hypothetical expenses based on the Fund’s actual expense ratio and an assumed rate of return of 5% per year before expenses, which is not the Fund’s actual return. This information may not be used to estimate the actual ending account balance or expenses you paid for the period, but it can help you compare ongoing costs of investing in the Fund with those of other mutual funds offered through the Contract. To do so, compare this 5% hypothetical example with the 5% hypothetical examples that appear in the shareholder reports of other funds offered through the Contract.
Please note that expenses shown in the table are meant to highlight ongoing costs at the Fund level only and do not reflect any ongoing expenses at the Contract level, or transaction expenses at either the Fund or Contract levels. In addition, while the Fund does not have transaction expenses, if the transaction and ongoing expenses at the Contract level were included, the expenses shown below would be higher. You should consult your Contract prospectus or disclosure document for more information.
| | | | | | | | | | | | | | | | | | | | | | | | | | |
| | | | | | Actual (actual return after expenses) | | | | | Hypothetical (5% annual return before expenses) | | | | |
Share Class | |
| Beginning Account
Value 7/1/17 |
| |
| Ending Account
Value 12/31/17 |
| |
| Fund-Level Expenses
Paid During Period
7/1/17–12/31/171,2 |
| | | |
| Ending Account
Value 12/31/17 |
| |
| Fund-Level Expenses
Paid During Period
7/1/17–12/31/171,2 |
| |
| Net
Annualized
Expense
Ratio2 |
|
Class 2 | | | $1,000 | | | | $1,093.80 | | | | $5.07 | | | | | | $1,020.37 | | | | $4.89 | | | | 0.96% | |
1. Expenses are equal to the annualized expense ratio for the six-month period as indicated above—in the far right column—multiplied by the simple average account value over the period indicated, and then multiplied by 184/365 to reflect the one-half year period.
2. Reflects expenses after fee waivers and expense reimbursements. Does not include any ongoing expenses of the Contract for which the Fund is an investment option or acquired fund fees and expenses.
FRANKLIN TEMPLETON VARIABLE INSURANCE PRODUCTS TRUST
Financial Highlights
Franklin Flex Cap Growth VIP Fund
| | | | | | | | | | | | | | | | | | | | |
| | | Year Ended December 31, | |
| | | 2017 | | | 2016 | | | 2015 | | | 2014 | | | 2013 | |
| Class 2 | | | | | | | | | | | | | | | | | | | | |
Per share operating performance
(for a share outstanding throughout the year) | | | | | | | | | | | | | | | | | | | | |
| | | | | |
Net asset value, beginning of year | | | $5.89 | | | | $7.09 | | | | $16.61 | | | | $18.11 | | | | $13.21 | |
| | | | |
| | | | | |
| Income from investment operationsa: | | | | | | | | | | | | | | | | | | | | |
| | | | | |
Net investment income (loss)b | | | (0.01 | ) | | | (0.03 | ) | | | (0.06 | ) | | | (0.08 | ) | | | (0.01 | ) |
| | | | | |
Net realized and unrealized gains (losses) | | | 1.60 | | | | (0.20 | ) | | | 1.00 | | | | 1.09 | | | | 4.95 | |
| | | | |
Total from investment operations | | | 1.59 | | | | (0.23 | ) | | | 0.94 | | | | 1.01 | | | | 4.94 | |
| | | | |
| | | | | |
| Less distributions from: | | | | | | | | | | | | | | | | | | | | |
| | | | | |
Net investment income | | | — | | | | — | | | | — | | | | — | | | | (—) | c |
| | | | | |
Net realized gains | | | (0.02 | ) | | | (0.97 | ) | | | (10.46 | ) | | | (2.51 | ) | | | (0.04 | ) |
| | | | |
Total distributions | | | (0.02 | ) | | | (0.97 | ) | | | (10.46 | ) | | | (2.51 | ) | | | (0.04 | ) |
| | | | |
Net asset value, end of year | | | $7.46 | | | | $5.89 | | | | $7.09 | | | | $16.61 | | | | $18.11 | |
| | | | |
| | | | | |
Total returnd | | | 26.94% | | | | (2.89)% | | | | 4.37% | | | | 6.11% | | | | 37.48% | |
| | | | | |
| Ratios to average net assets | | | | | | | | | | | | | | | | | | | | |
| | | | | |
Expenses before waiver and payments by affiliates | | | 1.35% | | | | 1.36% | | | | 1.33% | | | | 1.20% | | | | 1.18% | |
| | | | | |
Expenses net of waiver and payments by affiliates | | | 0.96% | | | | 0.96% | | | | 0.96% | | | | 0.95% | | | | 0.93% | |
| | | | | |
Net investment income (loss) | | | (0.20)% | | | | (0.44)% | | | | (0.62)% | | | | (0.46)% | | | | (0.09)% | |
| | | | | |
| Supplemental data | | | | | | | | | | | | | | | | | | | | |
| | | | | |
Net assets, end of year (000’s) | | | $81,084 | | | | $73,337 | | | | $82,901 | | | | $93,354 | | | | $169,123 | |
| | | | | |
Portfolio turnover rate | | | 52.12% | | | | 17.76% | | | | 88.15% | | | | 52.83% | | | | 52.15% | |
aThe amount shown for a share outstanding throughout the period may not correlate with the Statement of Operations for the period due to the timing of sales and repurchases of the Fund’s shares in relation to income earned and/or fluctuating fair value of the investments of the Fund.
bBased on average daily shares outstanding.
cAmount rounds to less than $0.01 per share.
dTotal return does not include fees, charges or expenses imposed by the variable annuity and life insurance contracts for which Franklin Templeton Variable Insurance Products Trust serves as an underlying investment vehicle.
| | | | |
| FFC-6 | | Annual Report | The accompanying notes are an integral part of these financial statements. | | |
FRANKLIN TEMPLETON VARIABLE INSURANCE PRODUCTS TRUST
FINANCIAL HIGHLIGHTS
Franklin Flex Cap Growth VIP Fund (continued)
| | | | | | | | | | | | | | | | | | | | |
| | | Year Ended December 31, | |
| | | 2017 | | | 2016 | | | 2015 | | | 2014 | | | 2013 | |
| Class 4 | | | | | | | | | | | | | | | | | | | | |
Per share operating performance
(for a share outstanding throughout the year) | | | | | | | | | | | | | | | | | | | | |
| | | | | |
Net asset value, beginning of year | | | $5.70 | | | | $6.90 | | | | $16.44 | | | | $17.96 | | | | $13.12 | |
| | | | |
| | | | | |
| Income from investment operationsa: | | | | | | | | | | | | | | | | | | | | |
| | | | | |
Net investment income (loss)b | | | (0.02) | | | | (0.03) | | | | (0.07) | | | | (0.10) | | | | (0.03) | |
| | | | | |
Net realized and unrealized gains (losses) | | | 1.55 | | | | (0.20) | | | | 0.99 | | | | 1.09 | | | | 4.91 | |
| | | | |
Total from investment operations | | | 1.53 | | | | (0.23) | | | | 0.92 | | | | 0.99 | | | | 4.88 | |
| | | | |
| Less distributions from net realized gains | | | (0.02) | | | | (0.97) | | | | (10.46) | | | | (2.51) | | | | (0.04) | |
| | | | |
| Net asset value, end of year | | | $7.21 | | | | $5.70 | | | | $6.90 | | | | $16.44 | | | | $17.96 | |
| | | | |
| | | | | |
Total returnc | | | 26.78% | | | | (2.98)% | | | | 4.32% | | | | 5.98% | | | | 37.28% | |
| | | | | |
| Ratios to average net assets | | | | | | | | | | | | | | | | | | | | |
| | | | | |
Expenses before waiver and payments by affiliates | | | 1.45% | | | | 1.46% | | | | 1.43% | | | | 1.30% | | | | 1.28% | |
| | | | | |
Expenses net of waiver and payments by affiliates | | | 1.06% | | | | 1.06% | | | | 1.06% | | | | 1.05% | | | | 1.03% | |
| | | | | |
Net investment income (loss) | | | (0.30)% | | | | (0.54)% | | | | (0.72)% | | | | (0.56)% | | | | (0.19)% | |
| | | | | |
| Supplemental data | | | | | | | | | | | | | | | | | | | | |
| | | | | |
Net assets, end of year (000’s) | | | $30,112 | | | | $27,163 | | | | $34,479 | | | | $31,355 | | | | $251,339 | |
| | | | | |
Portfolio turnover rate | | | 52.12% | | | | 17.76% | | | | 88.15% | | | | 52.83% | | | | 52.15% | |
aThe amount shown for a share outstanding throughout the period may not correlate with the Statement of Operations for the period due to the timing of sales and repurchases of the Fund’s shares in relation to income earned and/or fluctuating fair value of the investments of the Fund.
bBased on average daily shares outstanding.
cTotal return does not include fees, charges or expenses imposed by the variable annuity and life insurance contracts for which Franklin Templeton Variable Insurance Products Trust serves as an underlying investment vehicle.
| | | | | | |
| | | The accompanying notes are an integral part of these financial statements. | Annual Report | | | FFC-7 | |
FRANKLIN TEMPLETON VARIABLE INSURANCE PRODUCTS TRUST
Statement of Investments, December 31, 2017
Franklin Flex Cap Growth VIP Fund
| | | | | | | | | | |
| | | | | Shares | | | Value | |
| | Common Stocks 95.5% | | | | | | | | |
| | Automobiles & Components 0.6% | | | | | | | | |
| a | | Tesla Inc. | | | 2,000 | | | $ | 622,700 | |
| | | | | | | | | | |
| | Banks 1.6% | | | | | | | | |
| | First Republic Bank/CA | | | 19,980 | | | | 1,731,067 | |
| | | | | | | | | | |
| | Capital Goods 8.8% | | | | | | | | |
| | 3M Co. | | | 7,500 | | | | 1,765,275 | |
| | The Boeing Co. | | | 5,500 | | | | 1,622,005 | |
| | Fortive Corp. | | | 20,000 | | | | 1,447,000 | |
| | Raytheon Co. | | | 20,000 | | | | 3,757,000 | |
| | Rockwell Automation Inc. | | | 6,000 | | | | 1,178,100 | |
| | | | | | | | | | |
| | | | | | | | | 9,769,380 | |
| | | | | | | | | | |
| | Consumer Durables & Apparel 1.1% | | | | | | | | |
| | NIKE Inc., B | | | 20,000 | | | | 1,251,000 | |
| | | | | | | | | | |
| | Consumer Services 2.0% | | | | | | | | |
| | Starbucks Corp. | | | 20,000 | | | | 1,148,600 | |
| | Vail Resorts Inc. | | | 5,000 | | | | 1,062,350 | |
| | | | | | | | | | |
| | | | | | | | | 2,210,950 | |
| | | | | | | | | | |
| | Diversified Financials 2.4% | | | | | | | | |
| | CBOE Global Markets Inc. | | | 10,000 | | | | 1,245,900 | |
| | Intercontinental Exchange Inc. | | | 20,000 | | | | 1,411,200 | |
| a | | Lexinfintech Holdings Ltd., ADR (China) | | | 4,800 | | | | 66,720 | |
| | | | | | | | | | |
| | | | | | | | | 2,723,820 | |
| | | | | | | | | | |
| | Energy 1.4% | | | | | | | | |
| a | | Concho Resources Inc. | | | 10,000 | | | | 1,502,200 | |
| | | | | | | | | | |
| | Food & Staples Retailing 1.7% | | | | | | | | |
| | Costco Wholesale Corp. | | | 10,000 | | | | 1,861,200 | |
| | | | | | | | | | |
| | Food, Beverage & Tobacco 2.7% | | | | | | | | |
| | Constellation Brands Inc., A | | | 13,000 | | | | 2,971,410 | |
| | | | | | | | | | |
| | Health Care Equipment & Services 6.0% | | | | | | | | |
| | Becton, Dickinson and Co. | | | 5,000 | | | | 1,070,300 | |
| | Danaher Corp. | | | 12,490 | | | | 1,159,322 | |
| a | | IDEXX Laboratories Inc. | | | 9,990 | | | | 1,562,236 | |
| a | | Intuitive Surgical Inc. | | | 2,000 | | | | 729,880 | |
| | UnitedHealth Group Inc. | | | 10,000 | | | | 2,204,600 | |
| | | | | | | | | | |
| | | | | | | | | 6,726,338 | |
| | | | | | | | | | |
| | Household & Personal Products 1.1% | | | | | | | | |
| | Estee Lauder Cos. Inc., A | | | 10,000 | | | | 1,272,400 | |
| | | | | | | | | | |
| | Materials 0.9% | | | | | | | | |
| | Albemarle Corp. | | | 8,000 | | | | 1,023,120 | |
| | | | | | | | | | |
| | Media 2.1% | | | | | | | | |
| a | | Charter Communications Inc., A | | | 6,986 | | | | 2,347,017 | |
| | | | | | | | | | |
| | Pharmaceuticals, Biotechnology & Life Sciences 5.0% | | | | | | | | |
| a | | Celgene Corp. | | | 20,000 | | | | 2,087,200 | |
| a | | Incyte Corp. | | | 7,990 | | | | 756,733 | |
| a | | Mettler-Toledo International Inc. | | | 2,500 | | | | 1,548,800 | |
| a | | Regeneron Pharmaceuticals Inc. | | | 3,000 | | | | 1,127,880 | |
| | | | | | | | | | |
| | | | | | | | | 5,520,613 | |
| | | | | | | | | | |
FRANKLIN TEMPLETON VARIABLE INSURANCE PRODUCTS TRUST
STATEMENT OF INVESTMENTS
Franklin Flex Cap Growth VIP Fund (continued)
| | | | | | | | | | |
| | | | | Shares | | | Value | |
| | Common Stocks (continued) | | | | | | | | |
| | Real Estate 4.6% | | | | | | | | |
| | American Tower Corp. | | | 20,000 | | | $ | 2,853,400 | |
| | Equinix Inc. | | | 5,000 | | | | 2,266,100 | |
| | | | | | | | | | |
| | | | | | | | | 5,119,500 | |
| | | | | | | | | | |
| | Retailing 10.6% | | | | | | | | |
| a | | Amazon.com Inc. | | | 7,000 | | | | 8,186,290 | |
| a | | Netflix Inc. | | | 9,990 | | | | 1,917,680 | |
| a | | The Priceline Group Inc. | | | 1,000 | | | | 1,737,740 | |
| | | | | | | | | | |
| | | | | | | | | 11,841,710 | |
| | | | | | | | | | |
| | Semiconductors & Semiconductor Equipment 6.3% | | | | | | | | |
| | Analog Devices Inc. | | | 30,000 | | | | 2,670,900 | |
| | NVIDIA Corp. | | | 10,000 | | | | 1,935,000 | |
| | Xilinx Inc. | | | 35,000 | | | | 2,359,700 | |
| | | | | | | | | | |
| | | | | | | | | 6,965,600 | |
| | | | | | | | | | |
| | Software & Services 36.6% | | | | | | | | |
| | Activision Blizzard Inc. | | | 40,000 | | | | 2,532,800 | |
| a | | Adobe Systems Inc. | | | 10,000 | | | | 1,752,400 | |
| a | | Alibaba Group Holding Ltd., ADR (China) | | | 10,000 | | | | 1,724,300 | |
| a | | Alphabet Inc., C | | | 6,000 | | | | 6,278,400 | |
| a | | Electronic Arts Inc. | | | 16,000 | | | | 1,680,960 | |
| a | | Facebook Inc., A | | | 30,000 | | | | 5,293,800 | |
| | Mastercard Inc., A | | | 34,960 | | | | 5,291,546 | |
| | Microsoft Corp. | | | 70,000 | | | | 5,987,800 | |
| a | | Salesforce.com Inc. | | | 32,000 | | | | 3,271,360 | |
| a | | ServiceNow Inc. | | | 30,000 | | | | 3,911,700 | |
| | Visa Inc., A | | | 26,470 | | | | 3,018,109 | |
| | | | | | | | | | |
| | | | | | | | | 40,743,175 | |
| | | | | | | | | | |
| | |
| | Total Common Stocks (Cost $66,044,541) | | | | 106,203,200 | |
| | | | | | | | | | |
| | |
| | Short Term Investments (Cost $5,166,088) 4.7% | | | | | |
| | Money Market Funds 4.7% | | | | | | | | |
| b,c | | Institutional Fiduciary Trust Money Market Portfolio, 0.89% | | | 5,166,088 | | | | 5,166,088 | |
| | | | | | | | | | |
| | |
| | Total Investments (Cost $71,210,629) 100.2% | | | | 111,369,288 | |
| | Other Assets, less Liabilities (0.2)% | | | | | | | (173,732 | ) |
| | | | | | | | | | |
| | Net Assets 100.0% | | | | | | $ | 111,195,556 | |
| | | | | | | | | | |
See Abbreviations on page FFC-18.
aNon-income producing.
bSee Note 3(e) regarding investments in affiliated management investment companies.
cThe rate shown is the annualized seven-day yield at period end.
| | | | | | |
| | | The accompanying notes are an integral part of these financial statements. | Annual Report | | | FFC-9 | |
FRANKLIN TEMPLETON VARIABLE INSURANCE PRODUCTS TRUST
Financial Statements
Statement of Assets and Liabilities
December 31, 2017
| | | | |
| | | Franklin Flex
Cap Growth VIP Fund | |
Assets: | | | | |
Investments in securities: | | | | |
Cost - Unaffiliated issuers | | $ | 66,044,541 | |
Cost - Non-controlled affiliates (Note 3e) | | | 5,166,088 | |
| | | | |
Value - Unaffiliated issuers | | $ | 106,203,200 | |
Value - Non-controlled affiliates (Note 3e) | | | 5,166,088 | |
Receivables: | | | | |
Capital shares sold | | | 19,115 | |
Dividends and interest | | | 24,189 | |
Other assets | | | 13 | |
| | | | |
Total assets | | | 111,412,605 | |
| | | | |
Liabilities: | | | | |
Payables: | | | | |
Capital shares redeemed | | | 37,076 | |
Management fees | | | 49,772 | |
Distribution fees | | | 52,014 | |
Reports to shareholders | | | 44,417 | |
Professional fees | | | 32,395 | |
Accrued expenses and other liabilities | | | 1,375 | |
| | | | |
Total liabilities | | | 217,049 | |
| | | | |
Net assets, at value | | $ | 111,195,556 | |
| | | | |
Net assets consist of: | | | | |
Paid-in capital | | $ | 50,140,203 | |
Undistributed net investment income (loss) | | | (23,520 | ) |
Net unrealized appreciation (depreciation) | | | 40,158,659 | |
Accumulated net realized gain (loss) | | | 20,920,214 | |
| | | | |
Net assets, at value | | $ | 111,195,556 | |
| | | | |
| |
| Class 2: | | | | |
Net assets, at value | | $ | 81,083,950 | |
| | | | |
Shares outstanding | | | 10,863,705 | |
| | | | |
Net asset value and maximum offering price per share | | $ | 7.46 | |
| | | | |
| |
| Class 4: | | | | |
Net assets, at value | | $ | 30,111,606 | |
| | | | |
Shares outstanding | | | 4,173,765 | |
| | | | |
Net asset value and maximum offering price per share | | $ | 7.21 | |
| | | | |
| | | | |
| FFC-10 | | Annual Report | The accompanying notes are an integral part of these financial statements. | | |
FRANKLIN TEMPLETON VARIABLE INSURANCE PRODUCTS TRUST
FINANCIAL STATEMENTS
Statement of Operations
for the year ended December 31, 2017
| | | | |
| | | Franklin Flex Cap Growth VIP Fund | |
Investment income: | | | | |
Dividends: | | | | |
Unaffiliated issuers | | $ | 805,973 | |
Non-controlled affiliates (Note 3e) | | | 18,989 | |
Income from securities loaned (net of fees and rebates) | | | 2,459 | |
| | | | |
Total investment income | | | 827,421 | |
| | | | |
Expenses: | | | | |
Management fees (Note 3a) | | | 1,083,172 | |
Distribution fees: (Note 3c) | | | | |
Class 2 | | | 200,712 | |
Class 4 | | | 101,299 | |
Custodian fees (Note 4) | | | 905 | |
Reports to shareholders | | | 73,560 | |
Professional fees | | | 36,456 | |
Trustees’ fees and expenses | | | 460 | |
Other | | | 9,403 | |
| | | | |
Total expenses | | | 1,505,967 | |
Expenses waived/paid by affiliates (Note 3e and 3f) | | | (428,341 | ) |
| | | | |
Net expenses | | | 1,077,626 | |
| | | | |
Net investment income (loss) | | | (250,205 | ) |
| | | | |
Realized and unrealized gains (losses): | | | | |
Net realized gain (loss) from: | | | | |
Investments: | | | | |
Unaffiliated issuers | | | 21,313,192 | |
| | | | |
Net change in unrealized appreciation (depreciation) on: | | | | |
Investments: | | | | |
Unaffiliated issuers | | | 4,655,097 | |
| | | | |
Net realized and unrealized gain (loss) | | | 25,968,289 | |
| | | | |
Net increase (decrease) in net assets resulting from operations | | $ | 25,718,084 | |
| | | | |
| | | | | | |
| | | The accompanying notes are an integral part of these financial statements. | Annual Report | | | FFC-11 | |
FRANKLIN TEMPLETON VARIABLE INSURANCE PRODUCTS TRUST
FINANCIAL STATEMENTS
Statements of Changes in Net Assets
| | | | | | | | |
| | | Franklin Flex Cap Growth VIP Fund | |
| | | Year Ended December 31, | |
| | | 2017 | | | 2016 | |
Increase (decrease) in net assets: | | | | | | | | |
Operations: | | | | | | | | |
Net investment income (loss) | | $ | (250,205 | ) | | $ | (487,848 | ) |
Net realized gain (loss) | | | 21,313,192 | | | | 383,295 | |
Net change in unrealized appreciation (depreciation) | | | 4,655,097 | | | | (3,840,892 | ) |
| | | | |
Net increase (decrease) in net assets resulting from operations | | | 25,718,084 | | | | (3,945,445 | ) |
| | | | |
Distributions to shareholders from: | | | | | | | | |
Net realized gains: | | | | | | | | |
Class 2 | | | (181,740 | ) | | | (9,849,775 | ) |
Class 4 | | | (67,426 | ) | | | (4,640,994 | ) |
| | | | |
Total distributions to shareholders | | | (249,166 | ) | | | (14,490,769 | ) |
| | | | |
Capital share transactions: (Note 2) | | | | | | | | |
Class 2 | | | (10,989,226 | ) | | | 3,213,957 | |
Class 4 | | | (3,783,730 | ) | | | (1,658,082 | ) |
| | | | |
Total capital share transactions | | | (14,772,956 | ) | | | 1,555,875 | |
| | | | |
Net increase (decrease) in net assets | | | 10,695,962 | | | | (16,880,339 | ) |
Net assets: | | | | | | | | |
Beginning of year | | | 100,499,594 | | | | 117,379,933 | |
| | | | |
End of year | | $ | 111,195,556 | | | $ | 100,499,594 | |
| | | | |
Undistributed net investment income (loss) included in net assets: | | | | | | | | |
End of year | | $ | (23,520 | ) | | $ | — | |
| | | | |
| | | | |
| FFC-12 | | Annual Report | The accompanying notes are an integral part of these financial statements. | | |
FRANKLIN TEMPLETON VARIABLE INSURANCE PRODUCTS TRUST
Notes to Financial Statements
Franklin Flex Cap Growth VIP Fund
1. Organization and Significant Accounting Policies
Franklin Templeton Variable Insurance Products Trust (Trust) is registered under the Investment Company Act of 1940 (1940 Act) as an open-end management investment company, consisting of eighteen separate funds and applies the specialized accounting and reporting guidance in U.S. Generally Accepted Accounting Principles (U.S. GAAP). Franklin Flex Cap Growth VIP Fund (Fund) is included in this report. Shares of the Fund are generally sold only to insurance company separate accounts to fund the benefits of variable life insurance policies or variable annuity contracts. The Fund offers two classes of shares: Class 2 and Class 4. Each class of shares may differ by its distribution fees, voting rights on matters affecting a single class and its exchange privilege.
The following summarizes the Fund’s significant accounting policies.
a. Financial Instrument Valuation
The Fund’s investments in financial instruments are carried at fair value daily. Fair value is the price that would be received to sell an asset or paid to transfer a liability in an orderly transaction between market participants on the measurement date. The Fund calculates the net asset value (NAV) per share as of 4 p.m. Eastern time each day the New York Stock Exchange (NYSE) is open for trading. Under compliance policies and procedures approved by the Trust’s Board of Trustees (the Board), the Fund’s administrator has responsibility for oversight of valuation, including leading the cross-functional Valuation Committee (VC). The VC provides administration and oversight of the Fund’s valuation policies and procedures, which are approved annually by the Board. Among other things, these procedures allow the Fund to utilize independent pricing services, quotations from securities and financial instrument dealers, and other market sources to determine fair value.
Equity securities listed on an exchange or on the NASDAQ National Market System are valued at the last quoted sale price or the official closing price of the day, respectively. Foreign equity securities are valued as of the close of trading on the foreign stock exchange on which the security is primarily traded, or as of 4 p.m. Eastern time. The value is then converted into its U.S. dollar equivalent at the foreign exchange rate in effect at 4 p.m. Eastern time on the day that the value of the security is determined. Over-the-counter (OTC) securities are
valued within the range of the most recent quoted bid and ask prices. Securities that trade in multiple markets or on multiple exchanges are valued according to the broadest and most representative market. Certain equity securities are valued based upon fundamental characteristics or relationships to similar securities.
Investments in open-end mutual funds are valued at the closing NAV.
The Fund has procedures to determine the fair value of financial instruments for which market prices are not reliable or readily available. Under these procedures, the VC convenes on a regular basis to review such financial instruments and considers a number of factors, including significant unobservable valuation inputs, when arriving at fair value. The VC primarily employs a market-based approach which may use related or comparable assets or liabilities, recent transactions, market multiples, book values, and other relevant information for the investment to determine the fair value of the investment. An income-based valuation approach may also be used in which the anticipated future cash flows of the investment are discounted to calculate fair value. Discounts may also be applied due to the nature or duration of any restrictions on the disposition of the investments. Due to the inherent uncertainty of valuations of such investments, the fair values may differ significantly from the values that would have been used had an active market existed. The VC employs various methods for calibrating these valuation approaches including a regular review of key inputs and assumptions, transactional back-testing or disposition analysis, and reviews of any related market activity.
Trading in securities on foreign securities stock exchanges and OTC markets may be completed before 4 p.m. Eastern time. In addition, trading in certain foreign markets may not take place on every Fund’s business day. Occasionally, events occur between the time at which trading in a foreign security is completed and 4 p.m. Eastern time that might call into question the reliability of the value of a portfolio security held by the Fund. As a result, differences may arise between the value of the Fund’s portfolio securities as determined at the foreign market close and the latest indications of value at 4 p.m. Eastern time. In order to minimize the potential for these differences, the VC monitors price movements following the close of trading in foreign stock markets through a series of country specific market proxies (such as baskets of American Depositary Receipts, futures contracts and exchange traded funds). These price movements are measured against
FRANKLIN TEMPLETON VARIABLE INSURANCE PRODUCTS TRUST
NOTES TO FINANCIAL STATEMENTS
Franklin Flex Cap Growth VIP Fund (continued)
1. Organization and Significant Accounting
Policies (continued)
a. Financial Instrument Valuation (continued)
established trigger thresholds for each specific market proxy to assist in determining if an event has occurred that may call into question the reliability of the values of the foreign securities held by the Fund. If such an event occurs, the securities may be valued using fair value procedures, which may include the use of independent pricing services.
When the last day of the reporting period is a non-business day, certain foreign markets may be open on those days that the Fund’s NAV is not calculated, which could result in differences between the value of the Fund’s portfolio securities on the last business day and the last calendar day of the reporting period. Any significant security valuation changes due to an open foreign market are adjusted and reflected by the Fund for financial reporting purposes.
b. Securities Lending
The Fund participates in an agency based securities lending program to earn additional income. The Fund receives cash collateral against the loaned securities in an amount equal to at least 102% of the fair value of the loaned securities. Collateral is maintained over the life of the loan in an amount not less than 100% of the fair value of loaned securities, as determined at the close of Fund business each day; any additional collateral required due to changes in security values is delivered to the Fund on the next business day. The collateral is deposited into a joint cash account with other funds and is used to invest in a money market fund managed by Franklin Advisers, Inc., an affiliate of the Fund. The Fund may receive income from the investment of cash collateral, in addition to lending fees and rebates paid by the borrower. Income from securities loaned, net of fees paid to the securities lending agent and/or third-party vendor, is reported separately in the Statement of Operations. The Fund bears the market risk with respect to the collateral investment, securities loaned, and the risk that the agent may default on its obligations to the Fund. If the borrower defaults on its obligation to return the securities loaned, the Fund has the right to repurchase the securities in the open market using the collateral received. The securities lending agent has agreed to indemnify the Fund in the event of default by a third party borrower. At December 31, 2017, the Fund had no securities on loan.
c. Income and Deferred Taxes
It is the Fund’s policy to qualify as a regulated investment company under the Internal Revenue Code. The Fund intends to distribute to shareholders substantially all of its taxable income and net realized gains to relieve it from federal income and if applicable, excise taxes. As a result, no provision for U.S. federal income taxes is required.
The Fund may be subject to foreign taxation related to income received, capital gains on the sale of securities and certain foreign currency transactions in the foreign jurisdictions in which it invests. Foreign taxes, if any, are recorded based on the tax regulations and rates that exist in the foreign markets in which the Fund invests. When a capital gain tax is determined to apply, the Fund records an estimated deferred tax liability in an amount that would be payable if the securities were disposed of on the valuation date.
The Fund may recognize an income tax liability related to its uncertain tax positions under U.S. GAAP when the uncertain tax position has a less than 50% probability that it will be sustained upon examination by the tax authorities based on its technical merits. As of December 31, 2017, the Fund has determined that no tax liability is required in its financial statements related to uncertain tax positions for any open tax years (or expected to be taken in future tax years). Open tax years are those that remain subject to examination and are based on the statute of limitations in each jurisdiction in which the Fund invests.
d. Security Transactions, Investment Income, Expenses and Distributions
Security transactions are accounted for on trade date. Realized gains and losses on security transactions are determined on a specific identification basis. Estimated expenses are accrued daily. Dividend income is recorded on the ex-dividend date except for certain dividends from securities where the dividend rate is not available. In such cases, the dividend is recorded as soon as the information is received by the Fund. Distributions to shareholders are recorded on the ex-dividend date. Distributable earnings are determined according to income tax regulations (tax basis) and may differ from earnings recorded in accordance with U.S. GAAP. These differences may be permanent or temporary. Permanent differences are reclassified among capital accounts to reflect their tax character. These reclassifications
FRANKLIN TEMPLETON VARIABLE INSURANCE PRODUCTS TRUST
NOTES TO FINANCIAL STATEMENTS
Franklin Flex Cap Growth VIP Fund (continued)
have no impact on net assets or the results of operations. Temporary differences are not reclassified, as they may reverse in subsequent periods.
Common expenses incurred by the Trust are allocated among the Funds based on the ratio of net assets of each Fund to the combined net assets of the Trust. Fund specific expenses are charged directly to the Fund that incurred the expense.
Realized and unrealized gains and losses and net investment income, excluding class specific expenses, are allocated daily to each class of shares based upon the relative proportion of net assets of each class. Differences in per share distributions by class are generally due to differences in class specific expenses.
e. Accounting Estimates
The preparation of financial statements in accordance with U.S. GAAP requires management to make estimates and assumptions that affect the reported amounts of assets and
liabilities at the date of the financial statements and the amounts of income and expenses during the reporting period. Actual results could differ from those estimates.
f. Guarantees and Indemnifications
Under the Trust’s organizational documents, its officers and trustees are indemnified by the Trust against certain liabilities arising out of the performance of their duties to the Trust. Additionally, in the normal course of business, the Trust, on behalf of the Fund, enters into contracts with service providers that contain general indemnification clauses. The Trust’s maximum exposure under these arrangements is unknown as this would involve future claims that may be made against the Trust that have not yet occurred. Currently, the Trust expects the risk of loss to be remote.
2. Shares of Beneficial Interest
At December 31, 2017, there were an unlimited number of shares authorized (without par value). Transactions in the Fund’s shares were as follows:
| | | | | | | | | | | | | | | | | | | | |
| | | Year Ended December 31, | |
| | | 2017 | | | | | | 2016 | |
| | | Shares | | | Amount | | | | | | Shares | | | Amount | |
| | | | | |
| Class 2 Shares: | | | | | | | | | | | | | | | | | | | | |
Shares sold | | | 554,774 | | | $ | 3,650,922 | | | | | | | | 2,595,394 | | | $ | 15,855,206 | |
Shares issued in reinvestment of distributions | | | 26,648 | | | | 181,740 | | | | | | | | 1,710,030 | | | | 9,849,775 | |
Shares redeemed | | | (2,166,834 | ) | | | (14,821,888 | ) | | | | | | | (3,555,838 | ) | | | (22,491,024 | ) |
| | | | |
Net increase (decrease) | | | (1,585,412 | ) | | $ | (10,989,226 | ) | | | | | | | 749,586 | | | $ | 3,213,957 | |
| | | | |
| Class 4 Shares: | | | | | | | | | | | | | | | | | | | | |
Shares sold | | | 508,100 | | | $ | 3,340,274 | | | | | | | | 593,508 | | | $ | 3,606,248 | |
Shares issued in reinvestment of distributions | | | 10,232 | | | | 67,426 | | | | | | | | 831,720 | | | | 4,640,994 | |
Shares redeemed | | | (1,109,757 | ) | | | (7,191,430 | ) | | | | | | | (1,660,346 | ) | | | (9,905,324 | ) |
| | | | |
Net increase (decrease) | | | (591,425 | ) | | $ | (3,783,730 | ) | | | | | | | (235,118 | ) | | $ | (1,658,082 | ) |
| | | | |
FRANKLIN TEMPLETON VARIABLE INSURANCE PRODUCTS TRUST
NOTES TO FINANCIAL STATEMENTS
Franklin Flex Cap Growth VIP Fund (continued)
3. Transactions with Affiliates
Franklin Resources, Inc. is the holding company for various subsidiaries that together are referred to as Franklin Templeton Investments. Certain officers and trustees of the Fund are also officers and/or directors of the following subsidiaries:
| | |
| Subsidiary | | Affiliation |
Franklin Advisers, Inc. (Advisers) | | Investment manager |
Franklin Templeton Services, LLC (FT Services) | | Administrative manager |
Franklin Templeton Distributors, Inc. (Distributors) | | Principal underwriter |
Franklin Templeton Investor Services, LLC (Investor Services) | | Transfer agent |
a. Management Fees
The Fund pays an investment management fee to Advisers based on the average daily net assets of the Fund as follows:
| | |
| Annualized Fee Rate | | Net Assets |
1.000% | | Up to and including $100 million |
0.900% | | Over $100 million, up to and including $250 million |
0.850% | | Over $250 million, up to and including $10 billion |
0.800% | | Over $10 billion, up to and including $12.5 billion |
0.775% | | Over $12.5 billion, up to and including $15 billion |
0.750% | | In excess of $15 billion |
For the year ended December 31, 2017, the gross effective investment management fee rate was 0.991% of the Fund’s average daily net assets.
b. Administrative Fees
Under an agreement with Advisers, FT Services provides administrative services to the Fund. The fee is paid by Advisers based on the Fund’s average daily net assets, and is not an additional expense of the Fund.
c. Distribution Fees
The Board has adopted distribution plans for Class 2 and Class 4 shares pursuant to Rule 12b-1 under the 1940 Act. Under the Fund’s compensation distribution plans, the Fund pays Distributors for costs incurred in connection with the servicing, sale and distribution of the Fund’s shares up to 0.35% per year of its average daily net assets of each class. The Board has agreed to limit the current rate to 0.25% per year for Class 2. The plan year, for purposes of monitoring compliance with the maximum annual plan rates, is February 1 through January 31.
d. Transfer Agent Fees
Investor Services, under terms of an agreement, performs shareholder servicing for the Fund and is not paid by the Fund for the services.
FRANKLIN TEMPLETON VARIABLE INSURANCE PRODUCTS TRUST
NOTES TO FINANCIAL STATEMENTS
Franklin Flex Cap Growth VIP Fund (continued)
e. Investments in Affiliated Management Investment Companies
The Fund invests in one or more affiliated management investment companies for purposes other than exercising a controlling influence over the management or policies. Management fees paid by the Fund are waived on assets invested in the affiliated management investment companies, as noted in the Statement of Operations, in an amount not to exceed the management and administrative fees paid directly or indirectly by each affiliate. Prior to January 1, 2014, the waiver was accounted for as a reduction to management fees. During the year ended December 31, 2017, the Fund held investments in affiliated management investment companies as follows:
| | | | | | | | | | | | | | | | | | | | | | | | | | | | | | | | |
| | | Number
of Shares
Held at
Beginning
of Year | | | Gross
Additions | | | Gross
Reductions | | | Number
of Shares
Held at
End of
Year | | | Value at
End of
Year | | | Dividend
Income | | | Realized
Gain
(Loss) | | | Net Change in
Unrealized
Appreciation
(Depreciation) | |
| Non-Controlled Affiliates | | | | | | | | | | | | | | | | | | | | | | | | | | | | | | | | |
Institutional Fiduciary Trust Money Market Portfolio, 0.89% | | | 6,045,419 | | | | 88,448,332 | | | | (89,327,663 | ) | | | 5,166,088 | | | $ | 5,166,088 | | | $ | 18,989 | | | $ | — | | | $ | — | |
| | | | | | | | | | | | | | | | | | | | |
f. Waiver and Expense Reimbursements
Advisers have contractually agreed in advance to waive or limit its fees and to assume as its own expense certain expenses otherwise payable by the Fund so that the expenses (excluding distribution fees and acquired fund fees and expenses) for each class of the Fund does not exceed 0.71% based on the average net assets of each class (other than certain non-routine expenses or costs, including those relating to litigation, indemnification, reorganizations, and liquidations) until April 30, 2018. Total expenses waived or paid are not subject to recapture subsequent to the Fund’s fiscal year end.
4. Expense Offset Arrangement
The Fund has entered into an arrangement with its custodian whereby credits realized as a result of uninvested cash balances are used to reduce a portion of the Fund’s custodian expenses. During the year ended December 31, 2017, there were no credits earned.
5. Income Taxes
The tax character of distributions paid during the years ended December 31, 2017 and 2016, was as follows:
| | | | | | | | |
| | | 2017 | | | 2016 | |
Distributions paid from long term capital gain | | $ | 249,166 | | | $ | 14,490,769 | |
| | | | |
At December 31, 2017, the cost of investments, net unrealized appreciation (depreciation) and undistributed long term capital gains for income tax purposes were as follows:
| | | | |
Cost of investments | | $ | 71,275,690 | |
| | | | |
Unrealized appreciation | | $ | 41,270,202 | |
Unrealized depreciation | | | (1,176,604 | ) |
| | | | |
Net unrealized appreciation (depreciation) | | $ | 40,093,598 | |
| | | | |
Distributable earnings - undistributed long term capital gains | | $ | 20,961,757 | |
| | | | |
Differences between income and/or capital gains as determined on a book basis and a tax basis are primarily due to differing treatment of passive foreign investment company shares.
FRANKLIN TEMPLETON VARIABLE INSURANCE PRODUCTS TRUST
NOTES TO FINANCIAL STATEMENTS
Franklin Flex Cap Growth VIP Fund (continued)
6. Investment Transactions
Purchases and sales of investments (excluding short term securities) for the year ended December 31, 2017, aggregated $54,557,086 and $69,465,879, respectively.
7. Credit Facility
The Fund, together with other U.S. registered and foreign investment funds (collectively, Borrowers), managed by Franklin Templeton Investments, are borrowers in a joint syndicated senior unsecured credit facility totaling $2 billion (Global Credit Facility) which matured on February 9, 2018. This Global Credit Facility provides a source of funds to the Borrowers for temporary and emergency purposes, including the ability to meet future unanticipated or unusually large redemption requests. Effective February 9, 2018, the Borrowers renewed the Global Credit Facility for a one year term, maturing February 8, 2019, for a total of $2 billion.
Under the terms of the Global Credit Facility, the Fund shall, in addition to interest charged on any borrowings made by the Fund and other costs incurred by the Fund, pay its share of fees and expenses incurred in connection with the implementation and maintenance of the Global Credit Facility, based upon its relative share of the aggregate net assets of all of the Borrowers, including an annual commitment fee of 0.15% based upon the unused portion of the Global Credit Facility. These fees are reflected in other expenses in the Statement of Operations. During the year ended December 31, 2017, the Fund did not use the Global Credit Facility.
8. Fair Value Measurements
The Fund follows a fair value hierarchy that distinguishes between market data obtained from independent sources (observable inputs) and the Fund’s own market assumptions (unobservable inputs). These inputs are used in determining the value of the Fund’s financial instruments and are summarized in the following fair value hierarchy:
| | • | | Level 1 – quoted prices in active markets for identical financial instruments |
| | • | | Level 2 – other significant observable inputs (including quoted prices for similar financial instruments, interest rates, prepayment speed, credit risk, etc.) |
| | • | | Level 3 – significant unobservable inputs (including the Fund’s own assumptions in determining the fair value of financial instruments) |
The input levels are not necessarily an indication of the risk or liquidity associated with financial instruments at that level.
For movements between the levels within the fair value hierarchy, the Fund has adopted a policy of recognizing the transfers as of the date of the underlying event which caused the movement.
At December 31, 2017, all of the Fund’s investments in financial instruments carried at fair value were valued using Level 1 inputs. For detailed categories, see the accompanying Statement of Investments.
9. Subsequent Events
The Fund has evaluated subsequent events through the issuance of the financial statements and determined that no events have occurred that require disclosure other than those already disclosed in the financial statements.
Abbreviations
| | | | |
| Selected Portfolio | | |
| | | |
| ADR | | American Depositary Receipt | | |
FRANKLIN TEMPLETON VARIABLE INSURANCE PRODUCTS TRUST
Report of Independent Registered Public Accounting Firm
To the Board of Trustees of Franklin Templeton Variable Insurance Products Trust and Shareholders of Franklin Flex Cap Growth VIP Fund
Opinion on the Financial Statements
We have audited the accompanying statement of assets and liabilities, including the statement of investments, of Franklin Flex Cap Growth VIP Fund (the “Fund”) as of December 31, 2017, the related statement of operations for the year ended December 31, 2017, the statement of changes in net assets for each of the two years in the period ended December 31, 2017, including the related notes, and the financial highlights for each of the five years in the period ended December 31, 2017 (collectively referred to as the “financial statements”). In our opinion, the financial statements present fairly, in all material respects, the financial position of the Fund as of December 31, 2017, the results of its operations for the year then ended, the changes in its net assets for each of the two years in the period ended December 31, 2017 and the financial highlights for each of the five years in the period ended December 31, 2017 in conformity with accounting principles generally accepted in the United States of America.
Basis for Opinion
These financial statements are the responsibility of the Fund’s management. Our responsibility is to express an opinion on the Fund’s financial statements based on our audits. We are a public accounting firm registered with the Public Company Accounting Oversight Board (United States) (“PCAOB”) and are required to be independent with respect to the Fund in accordance with the U.S. federal securities laws and the applicable rules and regulations of the Securities and Exchange Commission and the PCAOB.
We conducted our audits of these financial statements in accordance with the standards of the PCAOB. Those standards require that we plan and perform the audit to obtain reasonable assurance about whether the financial statements are free of material misstatement, whether due to error or fraud.
Our audits included performing procedures to assess the risks of material misstatement of the financial statements, whether due to error or fraud, and performing procedures that respond to those risks. Such procedures included examining, on a test basis, evidence regarding the amounts and disclosures in the financial statements. Our audits also included evaluating the accounting principles used and significant estimates made by management, as well as evaluating the overall presentation of the financial statements. Our procedures included confirmation of securities owned as of December 31, 2017 by correspondence with the custodian and transfer agent. We believe that our audits provide a reasonable basis for our opinion.
PricewaterhouseCoopers LLP
San Francisco, California
February 15, 2018
We have served as the auditor of one or more investment companies in the Franklin Templeton Group of Funds since 1948.
FRANKLIN TEMPLETON VARIABLE INSURANCE PRODUCTS TRUST
Tax Information (unaudited)
Franklin Flex Cap Growth VIP Fund
Under Section 852(b)(3)(C) of the Internal Revenue Code, the Fund hereby reports the maximum amount allowable but no less than $249,166 as a long term capital gain dividend for the fiscal year ended December 31, 2017.
Franklin Founding Funds Allocation VIP Fund
This annual report for Franklin Founding Funds Allocation VIP Fund covers the fiscal year ended December 31, 2017.
Class 2 Performance Summary as of December 31, 2017
Average annual total return of Class 2 shares* represents the average annual change in value, assuming reinvestment of dividends and capital gains. Average returns smooth out variations in returns, which can be significant; they are not the same as year-by-year results.
| | | | | | | | | | | | |
| Periods ended 12/31/17 | | 1-Year | | | 5-Year | | | 10-Year | |
Average Annual Total Return | | | +11.98% | | | | +8.64% | | | | +4.70% | |
*The Fund has an expense reduction contractually guaranteed through 4/30/18. Fund investment results reflect the expense reduction; without this reduction, the results would have been lower.
Performance reflects the Fund’s Class 2 operating expenses, but does not include any contract fees, expenses or sales charges. If they had been included, performance would be lower. These charges and deductions, particularly for variable life policies, can have a significant effect on contract values and insurance benefits. See the contract prospectus for a complete description of these expenses, including sales charges.
Performance data represent past performance, which does not guarantee future results. Investment return and principal value will fluctuate, and you may have a gain or loss when you sell your shares. Current performance may differ from figures shown.
Total Return Index Comparison for a Hypothetical $10,000 Investment (1/1/08-12/31/17)
The graph below shows the change in value of a hypothetical $10,000 investment in the Fund over the indicated period and includes reinvestment of any income or distributions. The Fund’s performance* is compared to the performance of the Standard & Poor’s® 500 Index (S&P 500®) and the MSCI World Index. One cannot invest directly in an index, and an index is not representative of the Fund’s portfolio. Please see Important Notes to Performance Information preceding the Fund Summaries.
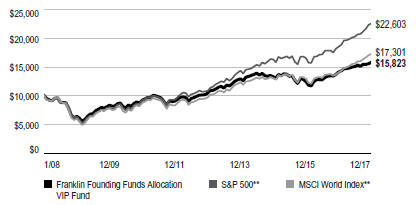
**Source: Morningstar. Please see Index Descriptions following the Fund Summaries.
FRANKLIN FOUNDING FUNDS ALLOCATION VIP FUND
Fund Goal and Main Investments
The Fund seeks capital appreciation, with income as a secondary goal. Under normal market conditions, the Fund invests equal portions in Class 1 shares of Franklin Income VIP Fund, Franklin Mutual Shares VIP Fund and Templeton Growth VIP Fund.
Fund Risks
All investments involve risks, including possible loss of principal. Because the Fund invests in underlying funds that may engage in a variety of investment strategies involving certain risks, the Fund may be subject to these same risks. Stock prices fluctuate, sometimes rapidly and dramatically, due to factors affecting individual companies, particular industries or sectors, or general market conditions. Bonds are affected by changes in interest rates and the creditworthiness of their issuers. Bond prices generally move in the opposite direction of interest rates. Thus, as prices of bonds adjust to a rise in interest rates, the Fund’s share price may decline. Higher yielding, lower rated corporate bonds entail a greater degree of credit risk compared to investment-grade securities. Foreign investing carries additional risks such as currency and market volatility and political or social instability, risks that are heightened in developing countries. Value securities may not increase in price as anticipated or may decline further in value. The Fund’s prospectus also includes a description of the main investment risks.
Performance Overview
You can find the Fund’s six-month total return in the Performance Summary. In comparison, the S&P 500 generated a +21.83% total return and the MSCI World Index produced a +23.07% total return for the same period.1
Economic and Market Overview
The global economy grew moderately during the 12-month period under review. In this environment, global developed and emerging market stocks generated a +24.62% total return, as measured by the MSCI All Country World Index.1 Global markets were aided by price gains in oil and other commodities, generally upbeat economic data across regions, the European Central Bank’s (ECB’s) extension of its monetary easing program, and investor optimism about pro-growth and
Asset Allocation*
Based on Total Net Assets as of 12/31/17
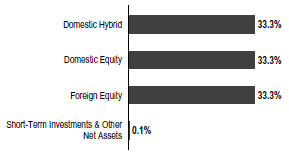
*The asset allocation is based on the Statement of Investments (SOI), which classifies each underlying fund into a broad asset class.
pro-business policies in the US. The prospect for reforms in the European Union (EU) with Emmanuel Macron’s election as France’s president, encouraging corporate earnings reports and the passage of the US tax reform bill also supported global stocks.
However, global markets reflected investor concerns about the terms of the UK’s exit from the EU, political uncertainty in the US and the EU, and geopolitical tensions in the Korean peninsula and other regions. Other concerns included the health of European banks, global oil oversupply despite a pact by major oil-producing countries to extend production cuts, and comments from key central bankers around the world about potentially raising interest rates.
After strengthening in 2017’s second and third quarters, the US economy moderated in the fourth quarter. The economy grew faster in 2017 than in 2016, however, largely due to growth in consumer spending, business investment and exports. The unemployment rate decreased from 4.7% in December 2016 to 4.1% at period-end.2 Annual inflation, as measured by the Consumer Price Index, was 2.1% in December 2016, and while it varied over the 12-month period, remained unchanged at period-end.2 The US Federal Reserve (Fed) raised its target range for the federal funds rate 0.25% three times during the period, amid signs of a growing US economy, strengthening labor market and improving business spending. At its December meeting, the Fed confirmed that the monthly balance sheet reduction would increase from US$10 billion to US$20 billion beginning in January 2018.
1. Source: Morningstar. One cannot invest directly in an index, and an index is not representative of the Fund’s portfolio. Please see Index Descriptions following the Fund Summaries.
2. Source: Bureau of Labor Statistics.
The dollar value, number of shares or principal amount, and names of all portfolio holdings are listed in the Fund’s Statement of Investments (SOI).
FRANKLIN FOUNDING FUNDS ALLOCATION VIP FUND
In Europe, the UK’s economic growth moderated in 2017 compared to 2016, largely due to slower growth in the services sector. In November, the Bank of England raised its key policy rate 0.25%, its first increase in a decade. The eurozone’s growth accelerated in 2017’s second and third quarters, but moderated in the fourth quarter. However, the eurozone’s 2017 economic growth rate was the fastest in a decade. The bloc’s annual inflation rate, while low, ended higher than in December 2016. The European Central Bank (ECB) kept its benchmark interest rate unchanged during the period. However, at its October meeting, the ECB extended the time frame for its massive bond-buying program from December 2017 to at least September 2018, while reducing the amount of monthly bond purchases in half beginning in January 2018.
In Asia, Japan’s quarterly gross domestic product (GDP) grew for the seventh consecutive quarter, although third-quarter 2017 growth was lower than the previous quarter. The Bank of Japan left its benchmark interest rate unchanged during the period and continued its monetary stimulus measures.
In emerging markets, Brazil’s quarterly GDP grew for the third consecutive quarter, although third-quarter 2017 growth slowed from the previous quarter. The country’s central bank cut its benchmark interest rate several times during the period to spur economic growth. Russia’s GDP grew in 2017’s first three quarters compared to the prior-year periods, amid the Bank of Russia’s continued policy support. China’s GDP grew faster in 2017 than in 2016, supported by solid growth in industrial production, services, fixed-asset investment, retail sales, and imports and exports. The People’s Bank of China left its benchmark interest rate unchanged during the period. Overall, emerging market stocks, as measured by the MSCI Emerging Markets Index, rose substantially during the period.
Investment Strategy
The Fund normally invests its assets in an equally weighted combination of Class 1 shares of Franklin Income VIP Fund, Franklin Mutual Shares VIP Fund and Templeton Growth VIP Fund. These underlying funds, in turn, invest in a variety of U.S. and foreign equity securities and, to a lesser extent, fixed income and money market securities. As market conditions affect the underlying funds, we rebalance the Fund’s allocations seeking to maintain equal weightings of approximately 33 1⁄3% of total net assets in each underlying fund whenever the actual allocations exceed plus or minus 3% of the fixed allocation percentages.
Manager’s Discussion
The Fund’s performance can be attributed largely to its allocation among the underlying funds and their investments in domestic and foreign equities, fixed income securities, and short-term investments and other net assets.
During the 12 months under review, Franklin Income VIP Fund – Class 1 and Franklin Mutual Shares VIP Fund – Class 1 underperformed the S&P 500. Templeton Growth VIP Fund –Class 1 underperformed the MSCI World Index.
Thank you for your participation in Franklin Founding Funds Allocation VIP Fund. We look forward to serving your future investment needs.
The foregoing information reflects our analysis, opinions and portfolio holdings as of December 31, 2017, the end of the reporting period. The way we implement our main investment strategies and the resulting portfolio holdings may change depending on factors such as market and economic conditions. These opinions may not be relied upon as investment advice or an offer for a particular security. The information is not a complete analysis of every aspect of any market, country, industry, security or the Fund. Statements of fact are from sources considered reliable, but the investment manager makes no representation or warranty as to their completeness or accuracy. Although historical performance is no guarantee of future results, these insights may help you understand our investment management philosophy.
FRANKLIN FOUNDING FUNDS ALLOCATION VIP FUND
Class 2 Fund Expenses
As an investor in a variable insurance contract (Contract) that indirectly provides for investment in an underlying mutual fund, you can incur transaction and/or ongoing expenses at both the Fund level and the Contract Level: (1) transaction expenses can include sales charges (loads) on purchases, surrender fees, transfer fees and premium taxes; and (2) ongoing expenses can include management fees, distribution and service (12b-1) fees, contract fees, annual maintenance fees, mortality and expense risk fees and other fees and expenses. All mutual funds and Contracts have some types of ongoing expenses. The table below shows Fund-level ongoing expenses and can help you understand these costs and compare them with those of other mutual funds offered through the Contract. The table assumes a $1,000 investment held for the six months indicated. Please refer to the Fund prospectus for additional information on operating expenses.
Actual Fund Expenses
The table below provides information about the actual account values and actual expenses in the columns under the heading “Actual.” In these columns the Fund’s actual return, which includes the effect of ongoing Fund expenses but does not include the effect of ongoing Contract expenses, is used to calculate the “Ending Account Value.” You can estimate the Fund-level expenses you paid during the period by following these steps (of course, your account value and expenses will differ from those in this illustration): Divide your account value by $1,000 (if your account had an $8,600 value, then $8,600 ÷ $1,000 = 8.6). Then multiply the result by the number under the headings “Actual” and “Fund-Level Expenses Paid During Period” (if Fund-Level Expenses Paid During Period were $ 7.50, then 8.6 x $ 7.50 = $64.50). In this illustration, the estimated expenses paid this period at the Fund level are $64.50.
Hypothetical Example for Comparison with Other Mutual Funds
Under the heading “Hypothetical” in the table, information is provided about hypothetical account values and hypothetical expenses based on the Fund’s actual expense ratio and an assumed rate of return of 5% per year before expenses, which is not the Fund’s actual return. This information may not be used to estimate the actual ending account balance or expenses you paid for the period, but it can help you compare ongoing costs of investing in the Fund with those of other mutual funds offered through the Contract. To do so, compare this 5% hypothetical example with the 5% hypothetical examples that appear in the shareholder reports of other funds offered through the Contract.
Please note that expenses shown in the table are meant to highlight ongoing costs at the Fund level only and do not reflect any ongoing expenses at the Contract level, or transaction expenses at either the Fund or Contract levels. In addition, while the Fund does not have transaction expenses, if the transaction and ongoing expenses at the Contract level were included, the expenses shown below would be higher. You should consult your Contract prospectus or disclosure document for more information.
| | | | | | | | | | | | | | | | | | | | | | | | | | | | |
| | | | | | Actual | | | | | | Hypothetical | | | | |
| | | | | | (actual return after expenses) | | | | | | (5% annual return before expenses) | | | | |
Share Class | | Beginning Account
Value 7/1/17 | | | Ending Account
Value 12/31/17 | | | Fund-Level Expenses
Paid During Period
7/1/17–12/31/171,2 | | | | | | Ending Account Value 12/31/17 | | | Fund-Level Expenses Paid During Period 7/1/17–12/31/171,2 | | | Net
Annualized
Expense
Ratio2 | |
Class 2 | | | $1,000 | | | | $1,049.70 | | | | $1.81 | | | | | | | | $1,023.44 | | | | $1.79 | | | | 0.35% | |
1. Expenses are equal to the annualized expense ratio for the six-month period as indicated above—in the far right column—multiplied by the simple average account value over the period indicated, and then multiplied by 184/365 to reflect the one-half year period.
2. Reflects expenses after fee waivers and expense reimbursements. Does not include any ongoing expenses of the Contract for which the Fund is an investment option or acquired fund fees and expenses.
FRANKLIN TEMPLETON VARIABLE INSURANCE PRODUCTS TRUST
Financial Highlights
Franklin Founding Funds Allocation VIP Fund
| | | | | | | | | | | | | | | | | | | | |
| | | Year Ended December 31, | |
| | | 2017 | | | 2016 | | | 2015 | | | 2014 | | | 2013 | |
| Class 1 | | | | | | | | | | | | | | | | | | | | |
Per share operating performance
(for a share outstanding throughout the year) | | | | | | | | | | | | | | | | | | | | |
| | | | | |
Net asset value, beginning of year | | | $7.13 | | | | $6.80 | | | | $7.47 | | | | $7.47 | | | | $8.55 | |
| | | | |
| | | | | |
| Income from investment operationsa: | | | | | | | | | | | | | | | | | | | | |
| | | | | |
Net investment incomeb,c | | | 0.21 | | | | 0.21 | | | | 0.26 | | | | 0.22 | | | | 0.30 | |
| | | | | |
Net realized and unrealized gains (losses) | | | 0.63 | | | | 0.64 | | | | (0.68 | ) | | | 0.02 | | | | 1.42 | |
| | | | |
Total from investment operations | | | 0.84 | | | | 0.85 | | | | (0.42 | ) | | | 0.24 | | | | 1.72 | |
| | | | | |
| Less distributions from: | | | | | | | | | | | | | | | | | | | | |
| | | | | |
Net investment income | | | (0.22 | ) | | | (0.29 | ) | | | (0.24 | ) | | | (0.23 | ) | | | (1.15 | ) |
| | | | | |
Net realized gains | | | (0.31 | ) | | | (0.23 | ) | | | (0.01 | ) | | | (0.01 | ) | | | (1.65 | ) |
| | | | |
Total distributions | | | (0.53 | ) | | | (0.52 | ) | | | (0.25 | ) | | | (0.24 | ) | | | (2.80 | ) |
| | | | |
Net asset value, end of year | | | $7.44 | | | | $7.13 | | | | $6.80 | | | | $7.47 | | | | $7.47 | |
| | | | |
| | | | | |
Total returnd | | | 12.17% | | | | 13.43% | | | | (5.93)% | | | | 3.05% | | | | 24.14% | |
| | | | | |
| Ratios to average net assets | | | | | | | | | | | | | | | | | | | | |
| | | | | |
Expenses before waiver and payments by affiliatese | | | 0.12% | | | | 0.11% | | | | 0.11% | | | | 0.11% | | | | 0.11% | |
| | | | | |
Expenses net of waiver and payments by affiliatese | | | 0.10% | | | | 0.10% | | | | 0.10% | | | | 0.10% | | | | 0.10% | |
| | | | | |
Net investment incomec | | | 2.75% | | | | 3.09% | | | | 3.51% | | | | 2.88% | | | | 3.67% | |
| | | | | |
| Supplemental data | | | | | | | | | | | | | | | | | | | | |
| | | | | |
Net assets, end of year (000’s) | | | $1,047 | | | | $1,025 | | | | $1,083 | | | | $1,114 | | | | $952 | |
| | | | | |
Portfolio turnover rate | | | 1.28% | | | | 0.10% | | | | 0.26% | | | | 4.80% | | | | 3.91% | |
aThe amount shown for a share outstanding throughout the period may not correlate with the Statement of Operations for the period due to the timing of sales and repurchases of the Fund’s shares in relation to income earned and/or fluctuating fair value of the investments of the Fund.
bBased on average daily shares outstanding.
cRecognition of net investment income by the Fund is affected by the timing of declaration of dividends by the Underlying Funds in which the Fund invests.
dTotal return does not include fees, charges or expenses imposed by the variable annuity and life insurance contracts for which Franklin Templeton Variable Insurance Products Trust serves as an underlying investment vehicle.
eDoes not include expenses of the Underlying Funds in which the Fund invests. The weighted average indirect expenses of the Underlying Funds was 0.66% for the year ended December 31, 2017.
| | | | | | |
| | | The accompanying notes are an integral part of these financial statements. | Annual Report | | | FFA-5 | |
FRANKLIN TEMPLETON VARIABLE INSURANCE PRODUCTS TRUST
FINANCIAL HIGHLIGHTS
Franklin Founding Funds Allocation VIP Fund (continued)
| | | | | | | | | | | | | | | | | | | | |
| | | Year Ended December 31, | |
| | | 2017 | | | 2016 | | | 2015 | | | 2014 | | | 2013 | |
| Class 2 | | | | | | | | | | | | | | | | | | | | |
Per share operating performance
(for a share outstanding throughout the year) | | | | | | | | | | | | | | | | | | | | |
| | | | | |
Net asset value, beginning of year | | | $7.08 | | | | $6.75 | | | | $7.42 | | | | $7.42 | | | | $8.51 | |
| | | | |
| | | | | |
| Income from investment operationsa: | | | | | | | | | | | | | | | | | | | | |
| | | | | |
Net investment incomeb,c | | | 0.18 | | | | 0.19 | | | | 0.24 | | | | 0.20 | | | | 0.27 | |
| | | | | |
Net realized and unrealized gains (losses) | | | 0.64 | | | | 0.64 | | | | (0.68 | ) | | | 0.02 | | | | 1.42 | |
| | | | |
Total from investment operations | | | 0.82 | | | | 0.83 | | | | (0.44 | ) | | | 0.22 | | | | 1.69 | |
| | | | |
| | | | | |
| Less distributions from: | | | | | | | | | | | | | | | | | | | | |
| | | | | |
Net investment income | | | (0.20 | ) | | | (0.27 | ) | | | (0.22 | ) | | | (0.21 | ) | | | (1.13 | ) |
| | | | | |
Net realized gains | | | (0.31 | ) | | | (0.23 | ) | | | (0.01 | ) | | | (0.01 | ) | | | (1.65 | ) |
| | | | |
Total distributions | | | (0.51 | ) | | | (0.50 | ) | | | (0.23 | ) | | | (0.22 | ) | | | (2.78 | ) |
| | | | |
Net asset value, end of year | | | $7.39 | | | | $7.08 | | | | $6.75 | | | | $7.42 | | | | $7.42 | |
| | | | |
| | | | | |
Total returnd | | | 11.98% | | | | 13.18% | | | | (6.21)% | | | | 2.85% | | | | 23.77% | |
| | | | | |
| Ratios to average net assets | | | | | | | | | | | | | | | | | | | | |
| | | | | |
Expenses before waiver and payments by affiliatese | | | 0.37% | | | | 0.36% | | | | 0.36% | | | | 0.36% | | | | 0.36% | |
| | | | | |
Expenses net of waiver and payments by affiliatese | | | 0.35% | | | | 0.35% | | | | 0.35% | | | | 0.35% | | | | 0.35% | |
| | | | | |
Net investment incomec | | | 2.50% | | | | 2.84% | | | | 3.26% | | | | 2.63% | | | | 3.42% | |
| | | | | |
| Supplemental data | | | | | | | | | | | | | | | | | | | | |
| | | | | |
Net assets, end of year (000’s) | | | $480,402 | | | | $474,669 | | | | $480,715 | | | | $557,704 | | | | $547,506 | |
| | | | | |
Portfolio turnover rate | | | 1.28% | | | | 0.10% | | | | 0.26% | | | | 4.80% | | | | 3.91% | |
aThe amount shown for a share outstanding throughout the period may not correlate with the Statement of Operations for the period due to the timing of sales and repurchases of the Fund’s shares in relation to income earned and/or fluctuating fair value of the investments of the Fund.
bBased on average daily shares outstanding.
cRecognition of net investment income by the Fund is affected by the timing of declaration of dividends by the Underlying Funds in which the Fund invests.
dTotal return does not include fees, charges or expenses imposed by the variable annuity and life insurance contracts for which Franklin Templeton Variable Insurance Products Trust serves as an underlying investment vehicle.
eDoes not include expenses of the Underlying Funds in which the Fund invests. The weighted average indirect expenses of the Underlying Funds was 0.66% for the year ended December 31, 2017.
| | | | |
| FFA-6 | | Annual Report | The accompanying notes are an integral part of these financial statements. | | |
FRANKLIN TEMPLETON VARIABLE INSURANCE PRODUCTS TRUST
FINANCIAL HIGHLIGHTS
Franklin Founding Funds Allocation VIP Fund (continued)
| | | | | | | | | | | | | | | | | | | | |
| | | Year Ended December 31, | |
| | | 2017 | | | 2016 | | | 2015 | | | 2014 | | | 2013 | |
| Class 4 | | | | | | | | | | | | | | | | | | | | |
Per share operating performance
(for a share outstanding throughout the year) | | | | | | | | | | | | | | | | | | | | |
| | | | | |
Net asset value, beginning of year | | | $7.21 | | | | $6.87 | | | | $7.54 | | | | $7.54 | | | | $8.49 | |
| | | | |
| | | | | |
Income from investment operationsa: | | | | | | | | | | | | | | | | | | | | |
| | | | | |
Net investment incomeb,c | | | 0.18 | | | | 0.19 | | | | 0.23 | | | | 0.20 | | | | 0.26 | |
| | | | | |
Net realized and unrealized gains (losses) | | | 0.64 | | | | 0.64 | | | | (0.68 | ) | | | 0.02 | | | | 1.43 | |
| | | | |
Total from investment operations | | | 0.82 | | | | 0.83 | | | | (0.45 | ) | | | 0.22 | | | | 1.69 | |
| | | | |
| | | | | |
| Less distributions from: | | | | | | | | | | | | | | | | | | | | |
| | | | | |
Net investment income | | | (0.19 | ) | | | (0.26 | ) | | | (0.21 | ) | | | (0.21 | ) | | | (0.99 | ) |
| | | | | |
Net realized gains | | | (0.31 | ) | | | (0.23 | ) | | | (0.01 | ) | | | (0.01 | ) | | | (1.65 | ) |
| | | | |
Total distributions | | | (0.50 | ) | | | (0.49 | ) | | | (0.22 | ) | | | (0.22 | ) | | | (2.64 | ) |
| | | | |
Net asset value, end of year | | | $7.53 | | | | $7.21 | | | | $6.87 | | | | $7.54 | | | | $7.54 | |
| | | | |
| | | | | |
Total returnd | | | 11.78% | | | | 12.92% | | | | (6.24)% | | | | 2.75% | | | | 23.68% | |
| | | | | |
| Ratios to average net assets | | | | | | | | | | | | | | | | | | | | |
| | | | | |
Expenses before waiver and payments by affiliatese | | | 0.47% | | | | 0.46% | | | | 0.46% | | | | 0.46% | | | | 0.46% | |
| | | | | |
Expenses net of waiver and payments by affiliatese | | | 0.45% | | | | 0.45% | | | | 0.45% | | | | 0.45% | | | | 0.45% | |
| | | | | |
Net investment incomec | | | 2.40% | | | | 2.74% | | | | 3.16% | | | | 2.53% | | | | 3.32% | |
| | | | | |
| Supplemental data | | | | | | | | | | | | | | | | | | | | |
| | | | | |
Net assets, end of year (000’s) | | | $528,862 | | | | $530,403 | | | | $550,825 | | | | $702,324 | | | | $676,781 | |
| | | | | |
Portfolio turnover rate | | | 1.28% | | | | 0.10% | | | | 0.26% | | | | 4.80% | | | | 3.91% | |
aThe amount shown for a share outstanding throughout the period may not correlate with the Statement of Operations for the period due to the timing of sales and repurchases of the Fund’s shares in relation to income earned and/or fluctuating fair value of the investments of the Fund.
bBased on average daily shares outstanding.
cRecognition of net investment income by the Fund is affected by the timing of declaration of dividends by the Underlying Funds in which the Fund invests.
dTotal return does not include fees, charges or expenses imposed by the variable annuity and life insurance contracts for which Franklin Templeton Variable Insurance Products Trust serves as an underlying investment vehicle.
eDoes not include expenses of the Underlying Funds in which the Fund invests. The weighted average indirect expenses of the Underlying Funds was 0.66% for the year ended December 31, 2017.
| | | | | | |
| | | The accompanying notes are an integral part of these financial statements. | Annual Report | | | FFA-7 | |
FRANKLIN TEMPLETON VARIABLE INSURANCE PRODUCTS TRUST
Statement of Investments, December 31, 2017
Franklin Founding Funds Allocation VIP Fund
| | | | | | | | | | |
| | | | | Shares | | | Value | |
| | Investments in Underlying Funds 99.9% | | | | | | | | |
| | | Domestic Equity 33.3% | | | | | | |
| a | | Franklin Mutual Shares VIP Fund, Class 1 | | | 16,254,912 | | | $ | 336,639,240 | |
| | | | | | | | | | |
| | | Domestic Hybrid 33.3% | | | | | | |
| a | | Franklin Income VIP Fund, Class 1 | | | 20,134,973 | | | | 336,656,745 | |
| | | | | | | | | | |
| | | Foreign Equity 33.3% | | | | | | |
| a | | Templeton Growth VIP Fund, Class 1 | | | 20,714,775 | | | | 336,407,940 | |
| | | | | | | | | | |
| | | |
| | Total Investments in Underlying Funds (Cost $699,400,047) | | | | | | | 1,009,703,925 | |
| | Other Assets, less Liabilities 0.1% | | | | | | | 606,889 | |
| | | | | | | | | | |
| | Net Assets 100.0% | | | | | | $ | 1,010,310,814 | |
| | | | | | | | | | |
a See Note 3(d) regarding investments in Underlying Funds.
| | | | |
| FFA-8 | | Annual Report | The accompanying notes are an integral part of these financial statements. | | |
FRANKLIN TEMPLETON VARIABLE INSURANCE PRODUCTS TRUST
Financial Statements
Statement of Assets and Liabilities
December 31, 2017
| | | | |
| | | Franklin Founding
Funds Allocation
VIP Fund | |
Assets: | | | | |
Investments in securities: | | | | |
Cost - Non-controlled affiliates (Note 3d) | | $ | 699,400,047 | |
| | | | |
Value - Non-controlled affiliates (Note 3d) | | $ | 1,009,703,925 | |
Cash | | | 1,598,221 | |
Receivables: | | | | |
Capital shares sold | | | 627,063 | |
Other assets | | | 118 | |
| | | | |
Total assets | | | 1,011,929,327 | |
| | | | |
Liabilities: | | | | |
Payables: | | | | |
Capital shares redeemed | | | 962,682 | |
Administrative fees | | | 51,455 | |
Distribution fees | | | 506,288 | |
Accrued expenses and other liabilities | | | 98,088 | |
Total liabilities | | | 1,618,513 | |
| | | | |
Net assets, at value | | $ | 1,010,310,814 | |
| | | | |
Net assets consist of: | | | | |
Paid-in capital | | $ | 692,276,850 | |
Undistributed net investment income | | | 27,465,052 | |
Net unrealized appreciation (depreciation) | | | 310,303,878 | |
Accumulated net realized gain (loss) | | | (19,734,966 | ) |
| | | | |
Net assets, at value | | $ | 1,010,310,814 | |
| | | | |
| |
| Class 1: | | | | |
Net assets, at value | | $ | 1,046,678 | |
| | | | |
Shares outstanding | | | 140,653 | |
| | | | |
Net asset value and maximum offering price per share | | $ | 7.44 | |
| | | | |
| |
| Class 2: | | | | |
Net assets, at value | | $ | 480,401,765 | |
| | | | |
Shares outstanding | | | 65,044,247 | |
| | | | |
Net asset value and maximum offering price per share | | $ | 7.39 | |
| | | | |
| |
| Class 4: | | | | |
Net assets, at value | | $ | 528,862,371 | |
| | | | |
Shares outstanding | | | 70,213,642 | |
| | | | |
Net asset value and maximum offering price per share | | $ | 7.53 | |
| | | | |
| | | | | | |
| | | The accompanying notes are an integral part of these financial statements. | Annual Report | | | FFA-9 | |
FRANKLIN TEMPLETON VARIABLE INSURANCE PRODUCTS TRUST
FINANCIAL STATEMENTS
Statement of Operations
for the year ended December 31, 2017
| | | | |
| | | Franklin Founding
Funds Allocation
VIP Fund | |
Investment income: | | | | |
Dividends: | | | | |
Non-controlled affiliates (Note 3d) | | $ | 29,113,345 | |
| | | | |
Expenses: | | | | |
Administrative fees (Note 3a) | | | 1,018,274 | |
Distribution fees: (Note 3b) | | | | |
Class 2 | | | 1,206,639 | |
Class 4 | | | 1,878,711 | |
Custodian fees (Note 4) | | | 342 | |
Reports to shareholders | | | 86,506 | |
Professional fees | | | 52,019 | |
Trustees’ fees and expenses | | | 4,352 | |
Other | | | 32,311 | |
| | | | |
Total expenses | | | 4,279,154 | |
Expenses waived/paid by affiliates (Note 3e) | | | (172,741 | ) |
| | | | |
Net expenses | | | 4,106,413 | |
| | | | |
Net investment income | | | 25,006,932 | |
| | | | |
Realized and unrealized gains (losses): | | | | |
Net realized gain (loss) from: | | | | |
Investments: | | | | |
Non-controlled affiliates (Note 3d) | | | 18,606,734 | |
Capital gain distributions from Underlying Funds: | | | | |
Non-controlled affiliates (Note 3d) | | | 13,602,007 | |
| | | | |
Net realized gain (loss) | | | 32,208,741 | |
| | | | |
Net change in unrealized appreciation (depreciation) on: | | | | |
Investments: | | | | |
Non-controlled affiliates (Note 3d) | | | 57,408,783 | |
| | | | |
Net realized and unrealized gain (loss) | | | 89,617,524 | |
| | | | |
Net increase (decrease) in net assets resulting from operations | | $ | 114,624,456 | |
| | | | |
| | | | |
| FFA-10 | | Annual Report | The accompanying notes are an integral part of these financial statements. | | |
FRANKLIN TEMPLETON VARIABLE INSURANCE PRODUCTS TRUST
FINANCIAL STATEMENTS
Statements of Changes in Net Assets
| | | | | | | | |
| | | Franklin Founding Funds Allocation VIP Fund | |
| | | Year Ended December 31, | |
| | | 2017 | | | 2016 | |
Increase (decrease) in net assets: | | | | | | | | |
Operations: | | | | | | | | |
Net investment income | | $ | 25,006,932 | | | $ | 27,575,819 | |
Net realized gain (loss) | | | 32,208,741 | | | | 45,677,726 | |
Net change in unrealized appreciation (depreciation) | | | 57,408,783 | | | | 46,468,720 | |
| | | | |
Net increase (decrease) in net assets resulting from operations | | | 114,624,456 | | | | 119,722,265 | |
| | | | |
Distributions to shareholders from: | | | | | | | | |
Net investment income: | | | | | | | | |
Class 1 | | | (32,261 | ) | | | (42,944 | ) |
Class 2 | | | (12,990,591 | ) | | | (18,199,650 | ) |
Class 4 | | | (13,655,260 | ) | | | (19,362,702 | ) |
Net realized gains: | | | | | | | | |
Class 1 | | | (45,646 | ) | | | (33,890 | ) |
Class 2 | | | (20,025,278 | ) | | | (15,405,932 | ) |
Class 4 | | | (21,899,278 | ) | | | (17,041,267 | ) |
| | | | |
Total distributions to shareholders | | | (68,648,314 | ) | | | (70,086,385 | ) |
| | | | |
Capital share transactions: (Note 2) | | | | | | | | |
Class 1 | | | (23,477 | ) | | | (111,375 | ) |
Class 2 | | | (15,665,134 | ) | | | (29,371,071 | ) |
Class 4 | | | (26,073,212 | ) | | | (46,679,895 | ) |
| | | | |
Total capital share transactions | | | (41,761,823 | ) | | | (76,162,341 | ) |
| | | | |
Net increase (decrease) in net assets | | | 4,214,319 | | | | (26,526,461 | ) |
Net assets: | | | | | | | | |
Beginning of year | | | 1,006,096,495 | | | | 1,032,622,956 | |
| | | | |
End of year | | $ | 1,010,310,814 | | | $ | 1,006,096,495 | |
| | | | |
Undistributed net investment income included in net assets: | | | | | | | | |
End of year | | $ | 27,465,052 | | | $ | 26,674,273 | |
| | | | |
| | | | | | |
| | | The accompanying notes are an integral part of these financial statements. | Annual Report | | | FFA-11 | |
FRANKLIN TEMPLETON VARIABLE INSURANCE PRODUCTS TRUST
Notes to Financial Statements
Franklin Founding Funds Allocation VIP Fund
1. Organization and Significant Accounting Policies
Franklin Templeton Variable Insurance Products Trust (Trust) is registered under the Investment Company Act of 1940 (1940 Act) as an open-end management investment company, consisting of eighteen separate funds and applies the specialized accounting and reporting guidance in U.S. Generally Accepted Accounting Principles (U.S. GAAP). Franklin Founding Funds Allocation VIP Fund (Fund) is included in this report. The Fund invests primarily in other funds of the Trust (Underlying Funds). Shares of the Fund are generally sold only to insurance company separate accounts to fund the benefits of variable life insurance policies or variable annuity contracts. The Fund offers three classes of shares: Class 1, Class 2 and Class 4. Each class of shares may differ by its distribution fees, voting rights on matters affecting a single class and its exchange privilege.
The accounting policies of the Underlying Funds are outlined in their respective shareholder reports. A copy of the Underlying Funds’ shareholder reports is available on the U.S. Securities and Exchange Commission (SEC) website at sec.gov or at the SEC’s Public Reference Room in Washington, D.C. The Underlying Funds’ shareholder reports are not covered by this report.
The following summarizes the Fund’s significant accounting policies.
a. Financial Instrument Valuation
The Fund’s investments in financial instruments are carried at fair value daily. Fair value is the price that would be received to sell an asset or paid to transfer a liability in an orderly transaction between market participants on the measurement date. The Fund calculates the net asset value (NAV) per share as of 4 p.m. Eastern time each day the New York Stock Exchange (NYSE) is open for trading. Under compliance policies and procedures approved by the Trust’s Board of Trustees (the Board), the Fund’s administrator has responsibility for oversight of valuation, including leading the cross-functional Valuation Committee (VC). The VC provides administration and oversight of the Fund’s valuation policies and procedures, which are approved annually by the Board. Investments in the Underlying Funds are valued at their closing NAV each trading day.
b. Income Taxes
It is the Fund’s policy to qualify as a regulated investment company under the Internal Revenue Code. The Fund intends to distribute to shareholders substantially all of its taxable income and net realized gains to relieve it from federal income and if applicable, excise taxes. As a result, no provision for U.S. federal income taxes is required.
The Fund may recognize an income tax liability related to its uncertain tax positions under U.S. GAAP when the uncertain tax position has a less than 50% probability that it will be sustained upon examination by the tax authorities based on its technical merits. As of December 31, 2017, the Fund has determined that no tax liability is required in its financial statements related to uncertain tax positions for any open tax years (or expected to be taken in future tax years). Open tax years are those that remain subject to examination and are based on the statute of limitations in each jurisdiction in which the Fund invests.
c. Security Transactions, Investment Income, Expenses and Distributions
Security transactions are accounted for on trade date. Realized gains and losses on security transactions are determined on a specific identification basis. Estimated expenses are accrued daily. Dividend income and realized gain distributions by Underlying Funds are recorded on the ex-dividend date. Distributions to shareholders are recorded on the ex-dividend date. Distributable earnings are determined according to income tax regulations (tax basis) and may differ from earnings recorded in accordance with U.S. GAAP. These differences may be permanent or temporary. Permanent differences are reclassified among capital accounts to reflect their tax character. These reclassifications have no impact on net assets or the results of operations. Temporary differences are not reclassified, as they may reverse in subsequent periods.
Common expenses incurred by the Trust are allocated among the Funds based on the ratio of net assets of each Fund to the combined net assets of the Trust. Fund specific expenses are charged directly to the Fund that incurred the expense.
The Fund indirectly bears its proportionate share of expenses from the Underlying Funds. Since the Underlying Funds have varied expense levels and the Fund may own different proportions of the Underlying Funds at different times, the amount of expenses incurred indirectly by the Fund will vary.
FRANKLIN TEMPLETON VARIABLE INSURANCE PRODUCTS TRUST
NOTES TO FINANCIAL STATEMENTS
Franklin Founding Funds Allocation VIP Fund (continued)
Realized and unrealized gains and losses and net investment income, excluding class specific expenses, are allocated daily to each class of shares based upon the relative proportion of net assets of each class. Differences in per share distributions by class are generally due to differences in class specific expenses.
d. Accounting Estimates
The preparation of financial statements in accordance with U.S. GAAP requires management to make estimates and assumptions that affect the reported amounts of assets and liabilities at the date of the financial statements and the amounts of income and expenses during the reporting period. Actual results could differ from those estimates.
e. Guarantees and Indemnifications
Under the Trust’s organizational documents, its officers and trustees are indemnified by the Trust against certain liabilities arising out of the performance of their duties to the Trust. Additionally, in the normal course of business, the Trust, on behalf of the Fund, enters into contracts with service providers that contain general indemnification clauses. The Trust’s maximum exposure under these arrangements is unknown as this would involve future claims that may be made against the Trust that have not yet occurred. Currently, the Trust expects the risk of loss to be remote.
2. Shares of Beneficial Interest
At December 31, 2017, there were an unlimited number of shares authorized (without par value). Transactions in the Fund’s shares were as follows:
| | | | | | | | | | | | | | | | | | | | |
| | | Year Ended December 31, | |
| | | 2017 | | | | | | 2016 | |
| | | Shares | | | Amount | | | | | | Shares | | | Amount | |
| | | | | |
| Class 1 Shares: | | | | | | | | | | | | | | | | | | | | |
Shares sold | | | 15,386 | | | $ | 112,506 | | | | | | | | 16,848 | | | $ | 112,841 | |
Shares issued in reinvestment of distributions | | | 11,035 | | | | 77,907 | | | | | | | | 12,138 | | | | 76,834 | |
Shares redeemed | | | (29,626 | ) | | | (213,890 | ) | | | | | | | (44,358 | ) | | | (301,050 | ) |
| | | | |
Net increase (decrease) | | | (3,205 | ) | | $ | (23,477 | ) | | | | | | | (15,372 | ) | | $ | (111,375 | ) |
| | | | |
| Class 2 Shares: | | | | | | | | | | | | | | | | | | | | |
Shares sold | | | 3,596,772 | | | $ | 26,184,474 | | | | | | | | 5,277,050 | | | $ | 35,702,809 | |
Shares issued in reinvestment of distributions | | | 4,703,115 | | | | 33,015,869 | | | | | | | | 5,334,220 | | | | 33,605,582 | |
Shares redeemed | | | (10,329,852 | ) | | | (74,865,477 | ) | | | | | | | (14,716,105 | ) | | | (98,679,462 | ) |
| | | | |
Net increase (decrease) | | | (2,029,965 | ) | | $ | (15,665,134 | ) | | | | | | | (4,104,835 | ) | | $ | (29,371,071 | ) |
| | | | |
| Class 4 Shares: | | | | | | | | | | | | | | | | | | | | |
Shares sold | | | 2,459,253 | | | $ | 18,233,389 | | | | | | | | 1,664,792 | | | $ | 11,425,501 | |
Shares issued in reinvestment of distributions | | | 4,965,718 | | | | 35,554,538 | | | | | | | | 5,670,400 | | | | 36,403,969 | |
Shares redeemed | | | (10,802,755 | ) | | | (79,861,139 | ) | | | | | | | (13,975,336 | ) | | | (94,509,365 | ) |
| | | | |
Net increase (decrease) | | | (3,377,784 | ) | | $ | (26,073,212 | ) | | | | | | | (6,640,144 | ) | | $ | (46,679,895 | ) |
| | | | |
3. Transactions with Affiliates
Franklin Resources, Inc. is the holding company for various subsidiaries that together are referred to as Franklin Templeton Investments. Certain officers and trustees of the Fund are also officers and/or directors of the following subsidiaries:
| | |
| Subsidiary | | Affiliation |
Franklin Templeton Services, LLC (FT Services) | | Administrative manager |
Franklin Templeton Distributors, Inc. (Distributors) | | Principal underwriter |
Franklin Templeton Investor Services, LLC (Investor Services) | | Transfer agent |
FRANKLIN TEMPLETON VARIABLE INSURANCE PRODUCTS TRUST
NOTES TO FINANCIAL STATEMENTS
Franklin Founding Funds Allocation VIP Fund (continued)
3. Transactions with Affiliates (continued)
a. Administrative Fees
The Fund pays an administrative fee to FT Services of 0.10% per year of the average daily net assets of the Fund for administrative services including monitoring and rebalancing the percentage of the Fund’s investments in the Underlying Funds.
b. Distribution Fees
The Board has adopted distribution plans for Class 2 and Class 4 shares pursuant to Rule 12b-1 under the 1940 Act. Under the Fund’s compensation distribution plans, the Fund pays Distributors for costs incurred in connection with the servicing, sale and distribution of the Fund’s shares up to 0.35% per year of its average daily net assets of each class. The Board has agreed to limit the current rate to 0.25% per year for Class 2. The plan year, for purposes of monitoring compliance with the maximum annual plan rates, is February 1 through January 31.
c. Transfer Agent Fees
Investor Services, under terms of an agreement, performs shareholder servicing for the Fund and is not paid by the Fund for the services.
d. Investments in Underlying Funds
The Fund invests in Underlying Funds which are managed by affiliates of the Fund’s administrative manager, FT Services. The Fund does not invest in Underlying Funds for the purpose of exercising a controlling influence over the management or policies.
Investments in Underlying Funds for the year ended December 31, 2017, were as follows:
| | | | | | | | | | | | | | | | | | | | | | | | | | | | | | | | |
| Underlying Funds | | Number of Shares Held at Beginning
of Year | | | Gross
Additions | | | Gross
Reductions | | | Number of Shares
Held at End of
Year | | | Value at End of Year | | | Dividend
Income | | | Realized
Gain (Loss) | | | Net Change in
Unrealized
Appreciation
(Depreciation) | |
| Non-Controlled Affiliates | | | | | | | | | | | | | | | | | | | | | |
Franklin Income VIP Fund, Class 1 | | | 21,065,303 | | | | 1,063,387 | | | | (1,993,717 | ) | | | 20,134,973 | | | $ | 336,656,745 | | | $ | 14,527,616 | | | $ | 1,586,010 | | | $ | 16,034,109 | |
Franklin Mutual Shares VIP Fund, Class 1 | | | 16,336,774 | | | | 1,508,532 | | | | (1,590,394 | ) | | | 16,254,912 | | | | 336,639,240 | | | | 8,309,110 | | | | 15,126,892a | | | | 4,590,443 | |
Templeton Growth VIP Fund, Class 1 | | | 23,748,961 | | | | 559,107 | | | | (3,593,293 | ) | | | 20,714,775 | | | | 336,407,940 | | | | 6,276,619 | | | | 15,495,839 | | | | 36,784,231 | |
| | | | | | | | | | | | | | | | | | | | |
Total Affiliated Securities | | | | | | | | | | | | | | | | | | $ | 1,009,703,925 | | | $ | 29,113,345 | | | $ | 32,208,741 | | | $ | 57,408,783 | |
| | | | | | | | | | | | | | | | | | | | |
aIncludes realized gain distributions received.
e. Waiver and Expense Reimbursements
FT Services has contractually agreed in advance to waive or limit its fees and to assume as its own expense certain expenses otherwise payable by the Fund so that the expenses (excluding distribution fees, and acquired fund fees and expenses) for each class of the Fund do not exceed 0.10%, based on the average net assets of each class (other than certain non-routine expenses or costs, including those relating to litigation, indemnification, reorganizations, and liquidations) until April 30, 2018. Total expenses waived or paid are not subject to recapture subsequent to the Fund’s fiscal year end.
4. Expense Offset Arrangement
The Fund has entered into an arrangement with its custodian whereby credits realized as a result of uninvested cash balances are used to reduce a portion of the Fund’s custodian expenses. During the year ended December 31, 2017, there were no credits earned.
FRANKLIN TEMPLETON VARIABLE INSURANCE PRODUCTS TRUST
NOTES TO FINANCIAL STATEMENTS
Franklin Founding Funds Allocation VIP Fund (continued)
5. Income Taxes
The tax character of distributions paid during the years ended December 31, 2017 and 2016, was as follows:
| | | | | | | | |
| | | 2017 | | | 2016 | |
Distributions paid from: | | | | | | | | |
Ordinary income | | $ | 28,262,149 | | | $ | 37,605,296 | |
Long term capital gain | | | 40,386,165 | | | | 32,481,089 | |
| | | | |
| | $ | 68,648,314 | | | $ | 70,086,385 | |
| | | | |
At December 31, 2017, the cost of investments, net unrealized appreciation (depreciation), undistributed ordinary income and undistributed long term capital gains for income tax purposes were as follows:
| | | | |
Cost of investments | | $ | 741,115,882 | |
| | | | |
Unrealized appreciation | | $ | 310,303,878 | |
Unrealized depreciation | | | (41,715,835 | ) |
| | | | |
Net unrealized appreciation (depreciation) | | $ | 268,588,043 | |
| | | | |
Undistributed ordinary income | | $ | 29,272,402 | |
Undistributed long term capital gains | | | 20,173,515 | |
| | | | |
Distributable earnings | | $ | 49,445,917 | |
| | | | |
Differences between income and/or capital gains as determined on a book basis and a tax basis are primarily due to differing treatment of wash sales.
6. Investment Transactions
Purchases and sales of Underlying Funds (excluding short term securities) for the year ended December 31, 2017, aggregated $13,000,000 and $120,637,180, respectively.
7. Credit Facility
The Fund, together with other U.S. registered and foreign investment funds (collectively, Borrowers), managed by Franklin Templeton Investments, are borrowers in a joint syndicated senior unsecured credit facility totaling $2 billion (Global Credit Facility) which matured on February 9, 2018. This Global Credit Facility provides a source of funds to the Borrowers for temporary and emergency purposes, including the ability to meet future unanticipated or unusually large redemption requests. Effective February 9, 2018, the Borrowers renewed the Global Credit Facility for a one year term, maturing February 8, 2019, for a total of $2 billion.
Under the terms of the Global Credit Facility, the Fund shall, in addition to interest charged on any borrowings made by the Fund and other costs incurred by the Fund, pay its share of fees and expenses incurred in connection with the implementation and maintenance of the Global Credit Facility, based upon its relative share of the aggregate net assets of all of the Borrowers, including an annual commitment fee of 0.15% based upon the unused portion of the Global Credit Facility. These fees are reflected in other expenses in the Statement of Operations. During the year ended December 31, 2017, the Fund did not use the Global Credit Facility.
FRANKLIN TEMPLETON VARIABLE INSURANCE PRODUCTS TRUST
NOTES TO FINANCIAL STATEMENTS
Franklin Founding Funds Allocation VIP Fund (continued)
8. Fair Value Measurements
The Fund follows a fair value hierarchy that distinguishes between market data obtained from independent sources (observable inputs) and the Fund’s own market assumptions (unobservable inputs). These inputs are used in determining the value of the Fund’s financial instruments and are summarized in the following fair value hierarchy:
| | • | | Level 1 – quoted prices in active markets for identical financial instruments |
| | • | | Level 2 – other significant observable inputs (including quoted prices for similar financial instruments, interest rates, prepayment speed, credit risk, etc.) |
| | • | | Level 3 – significant unobservable inputs (including the Fund’s own assumptions in determining the fair value of financial instruments) |
The input levels are not necessarily an indication of the risk or liquidity associated with financial instruments at that level.
For movements between the levels within the fair value hierarchy, the Fund has adopted a policy of recognizing the transfers as of the date of the underlying event which caused the movement.
At December 31, 2017, all of the Fund’s investments in financial instruments carried at fair value were valued using Level 1 inputs. For detailed categories, see the accompanying Statement of Investments.
9. Subsequent Events
The Fund has evaluated subsequent events through the issuance of the financial statements and determined that no events have occurred that require disclosure other than those already disclosed in the financial statements.
FRANKLIN TEMPLETON VARIABLE INSURANCE PRODUCTS TRUST
Report of Independent Registered Public Accounting Firm
To the Board of Trustees of Franklin Templeton Variable Insurance Products Trust and Shareholders of Franklin Founding Funds Allocation VIP Fund
Opinion on the Financial Statements
We have audited the accompanying statement of assets and liabilities, including the statement of investments, of Franklin Founding Funds Allocation VIP Fund (the “Fund”) as of December 31, 2017, the related statement of operations for the year ended December 31, 2017, the statement of changes in net assets for each of the two years in the period ended December 31, 2017, including the related notes, and the financial highlights for each of the five years in the period ended December 31, 2017 (collectively referred to as the “financial statements”). In our opinion, the financial statements present fairly, in all material respects, the financial position of the Fund as of December 31, 2017, the results of its operations for the year then ended, the changes in its net assets for each of the two years in the period ended December 31, 2017 and the financial highlights for each of the five years in the period ended December 31, 2017 in conformity with accounting principles generally accepted in the United States of America.
Basis for Opinion
These financial statements are the responsibility of the Fund’s management. Our responsibility is to express an opinion on the Fund’s financial statements based on our audits. We are a public accounting firm registered with the Public Company Accounting Oversight Board (United States) (“PCAOB”) and are required to be independent with respect to the Fund in accordance with the U.S. federal securities laws and the applicable rules and regulations of the Securities and Exchange Commission and the PCAOB.
We conducted our audits of these financial statements in accordance with the standards of the PCAOB. Those standards require that we plan and perform the audit to obtain reasonable assurance about whether the financial statements are free of material misstatement, whether due to error or fraud.
Our audits included performing procedures to assess the risks of material misstatement of the financial statements, whether due to error or fraud, and performing procedures that respond to those risks. Such procedures included examining, on a test basis, evidence regarding the amounts and disclosures in the financial statements. Our audits also included evaluating the accounting principles used and significant estimates made by management, as well as evaluating the overall presentation of the financial statements. Our procedures included confirmation of securities owned as of December 31, 2017 by correspondence with the transfer agent. We believe that our audits provide a reasonable basis for our opinion.
PricewaterhouseCoopers LLP
San Francisco, California
February 15, 2018
We have served as the auditor of one or more investment companies in the Franklin Templeton Group of Funds since 1948.
FRANKLIN TEMPLETON VARIABLE INSURANCE PRODUCTS TRUST
Tax Information (unaudited)
Franklin Founding Funds Allocation VIP Fund
Under Section 852(b)(3)(C) of the Internal Revenue Code (Code), the Fund hereby reports the maximum amount allowable but no less than $40,386,165 as a long term capital gain dividend for the fiscal year ended December 31, 2017.
Under Section 854(b)(1)(A) of the Code, the Fund hereby reports 42.90% of the ordinary income dividends as income qualifying for the dividends received deduction for the fiscal year ended December 31, 2017.
At December 31, 2017, the Fund, a qualified fund of funds under Section 852(g)(2) of the Code, received an allocation of foreign taxes paid from one or more of its underlying funds. The Fund elects to treat foreign taxes paid as allowed under Section 853 of the Code. This election will allow shareholders of record as of the 2018 distribution date, to treat their proportionate share of foreign taxes paid by the underlying funds as having been paid directly by them. The shareholder shall consider these amounts as foreign taxes paid in the tax year in which they receive the Fund distribution.
Franklin Global Real Estate VIP Fund
This annual report for Franklin Global Real Estate VIP Fund covers the fiscal year ended December 31, 2017.
Class 2 Performance Summary as of December 31, 2017
Average annual total return of Class 2 shares* represents the average annual change in value, assuming reinvestment of dividends and capital gains. Average returns smooth out variations in returns, which can be significant; they are not the same as year-by-year results.
| | | | | | | | | | | | |
| Periods ended 12/31/17 | | 1-Year | | | 5-Year | | | 10-Year | |
Average Annual Total Return | | | +10.47% | | | | +5.62% | | | | +2.75% | |
*The Fund has a fee waiver associated with any investment it makes in a Franklin Templeton money fund and/or other Franklin Templeton fund, contractually guaranteed through 4/30/18. Fund investment results reflect the fee waiver; without this waiver, the results would have been lower.
Performance reflects the Fund’s Class 2 operating expenses, but does not include any contract fees, expenses or sales charges. If they had been included, performance would be lower. These charges and deductions, particularly for variable life policies, can have a significant effect on contract values and insurance benefits. See the contract prospectus for a complete description of these expenses, including sales charges.
Performance data represent past performance, which does not guarantee future results. Investment return and principal value will fluctuate, and you may have a gain or loss when you sell your shares. Current performance may differ from figures shown.
Total Return Index Comparison for a Hypothetical $10,000 Investment (1/1/08–12/31/17)
The graph below shows the change in value of a hypothetical $10,000 investment in the Fund over the indicated period and includes reinvestment of any income or distributions. The Fund’s performance is compared to the performance of the FTSE® EPRA®/NAREIT® Developed Index. One cannot invest directly in an index, and an index is not representative of the Fund’s portfolio. Please see Important Notes to Performance Information preceding the Fund Summaries.
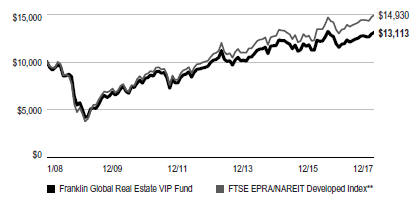
**Source: Morningstar. Please see Index Descriptions following the Fund Summaries.
FRANKLIN GLOBAL REAL ESTATE VIP FUND
Fund Goal and Main Investments
The Fund seeks high total return. Under normal market conditions, the Fund invests at least 80% of its net assets in investments of companies located anywhere in the world that operate in the real estate sector, including: real estate investment trusts (REITs) and similar REIT-like entities domiciled outside the US; companies qualifying under US federal tax law as REITs; and companies that derive at least half of their assets or revenues from the ownership, management development or sale of residential or commercial real estate (such as real estate operating or service companies).
What is a REIT?
A REIT is a type of real estate company that is dedicated to owning and usually operating income-producing real estate properties such as apartments, hotels, industrial properties, office buildings or shopping centers. Equity REITs generally receive income from rents received, are generally operated by experienced property management teams and typically concentrate on a specific geographic region or property type.
Fund Risks
All investments involve risks, including possible loss of principal. The Fund concentrates in real estate securities, which involve special risks, such as declines in the value of real estate and increased susceptibility to adverse economic or regulatory developments affecting the sector. The Fund’s investments in REITs involve additional risks; since REITs typically are invested in a limited number of projects or in a particular market segment, they are more susceptible to adverse developments affecting a single project or market segment than more broadly diversified investments. Foreign investing, especially in emerging markets, involves additional risks such as currency and market volatility, as well as political and social instability. The Fund is actively managed but there is no guarantee that the manager’s investment decisions will produce the desired results. The Fund’s prospectus also includes a description of the main investment risks.
Performance Overview
You can find the Fund’s one-year total return in the Performance Summary. In comparison, the FTSE EPRA/NAREIT Developed Index posted a +11.42% total return for the same period.1
Portfolio Composition
Based on Total Net Assets as of 12/31/17

Economic and Market Overview
The global economy grew moderately during the 12-month period under review. In this environment, global developed and emerging market stocks generated a +24.62% total return, as measured by the MSCI All Country World Index.1 Global markets were aided by price gains in oil and other commodities, generally upbeat economic data across regions, the European Central Bank’s (ECB’s) extension of its monetary easing program, and investor optimism about pro-growth and pro-business policies in the US. The prospect for reforms in the European Union (EU) with Emmanuel Macron’s election as
1. Source: Morningstar. One cannot invest directly in an index, and an index is not representative of the Fund’s portfolio. Please see Index Descriptions following the Fund Summaries.
The dollar value, number of shares or principal amount, and names of all portfolio holdings are listed in the Fund’s Statement of Investments (SOI).
FRANKLIN GLOBAL REAL ESTATE VIP FUND
France’s president, encouraging corporate earnings reports and the passage of the US tax reform bill also supported global stocks.
However, global markets reflected investor concerns about the terms of the UK’s exit from the EU, political uncertainty in the US and the EU, and geopolitical tensions in the Korean peninsula and other regions. Other concerns included the health of European banks, global oil oversupply despite a pact by major oil-producing countries to extend production cuts, and comments from key central bankers around the world about potentially raising interest rates.
After strengthening in 2017’s second and third quarters, the US economy moderated in the fourth quarter. The economy grew faster in 2017 than in 2016, however, largely due to growth in consumer spending, business investment and exports. The unemployment rate decreased from 4.7% in December 2016 to 4.1% at period-end.2 Annual inflation, as measured by the Consumer Price Index, was 2.1% in December 2016, and while it varied over the 12-month period, remained unchanged at period-end.2 The US Federal Reserve (Fed) raised its target range for the federal funds rate 0.25% three times during the period, amid signs of a growing US economy, strengthening labor market and improving business spending. At its December meeting, the Fed confirmed that the monthly balance sheet reduction would increase from US$10 billion to US$20 billion beginning in January 2018.
In Europe, the UK’s economic growth moderated in 2017 compared to 2016, largely due to slower growth in the services sector. In November, the Bank of England raised its key policy rate 0.25%, its first increase in a decade. The eurozone’s growth accelerated in 2017’s second and third quarters, but moderated in the fourth quarter. However, the eurozone’s 2017 economic growth rate was the fastest in a decade. The bloc’s annual inflation rate, while low, ended higher than in December 2016. The ECB kept its benchmark interest rate unchanged during the period. However, at its October meeting, the ECB extended the time frame for its massive bond-buying program from December 2017 to at least September 2018, while reducing the amount of monthly bond purchases in half beginning in January 2018.
In Asia, Japan’s quarterly gross domestic product (GDP) grew for the seventh consecutive quarter, although third-quarter 2017 growth was lower than the previous quarter. The Bank of Japan
| | | | |
| Top 10 Countries | | | |
| 12/31/17 | | | |
| |
| | | % of Total
Net Assets | |
| US | | | 52.1% | |
| Japan | | | 9.9% | |
| Hong Kong | | | 8.4% | |
| Australia | | | 5.9% | |
| UK | | | 5.2% | |
| Germany | | | 4.3% | |
| France | | | 3.4% | |
| Singapore | | | 3.3% | |
| Sweden | | | 2.2% | |
| Canada | | | 2.0% | |
left its benchmark interest rate unchanged during the period and continued its monetary stimulus measures.
In emerging markets, Brazil’s quarterly GDP grew for the third consecutive quarter, although third-quarter 2017 growth slowed from the previous quarter. The country’s central bank cut its benchmark interest rate several times during the period to spur economic growth. Russia’s GDP grew in 2017’s first three quarters compared to the prior-year periods, amid the Bank of Russia’s continued policy support. China’s GDP grew faster in 2017 than in 2016, supported by solid growth in industrial production, services, fixed-asset investment, retail sales, and imports and exports. The People’s Bank of China left its benchmark interest rate unchanged during the period. Overall, emerging market stocks, as measured by the MSCI Emerging Markets Index, rose substantially during the period.3
According to the FTSE EPRA/NAREIT Developed Index, in US dollar terms, most countries outpaced the index. Among the leaders were Hong Kong, the US, Germany and the UK. Singapore, Australia and France also performed well. In contrast, Japan lost value and New Zealand underperformed the index. At period-end, the US was the index’s largest country weighting.
Investment Strategy
We seek to limit price volatility by investing across markets and property types and seek to provide a consistently high level of income in our pursuit of high total return. When selecting investments for the Fund’s portfolio, we apply a “bottom-up” stock selection process that incorporates macro-level views in the evaluation process. Our portfolio construction process
2. Source: US Bureau of Labor Statistics.
3. Please see Index Descriptions following the Fund Summaries.
FRANKLIN GLOBAL REAL ESTATE VIP FUND
combines bottom-up analysis of individual stock and real estate market fundamentals and top-down macro overlays to provide country/regional, property type, and company size perspectives in identifying international/local cyclical and thematic trends that highlight investment opportunities.
Manager’s Discussion
During the 12 months under review, key detractors from the Fund’s performance relative to the FTSE EPRA/NAREIT Developed Index included security selection in the diversified sector.4 Shares of Japanese REIT Mitsubishi Estate underperformed the benchmark during the reporting period. The firm has continued to ramp up office redevelopment in the Marunouchi district and has largely secured prospective tenants for its upcoming projects with higher market rent despite greater office supply in 2018 and 2019. However, investors seemed more interested in initiatives to improve return on equity and shareholder returns from Mitsubishi Estate and other large real estate developers. Signs have emerged that the company has been gradually responding to investors’ concerns by raising its dividend payout ratio after its second quarter result. A better inflation outlook in Japan and more proactive capital management to enhance shareholder returns should help Mitsubishi Estate to narrow its discount to net asset value going forward.
Stock selection in the triple-net leasing sector also weighed on results.5 Shares of Gramercy Property Trust, an owner and asset manager of single-tenant, net-lease industrial and office properties in the US, underperformed over the reporting period. Gramercy currently has the largest exposure to industrial properties among its net-lease peers, at a time when the industrial property category exhibited among the most favorable of fundamental outlooks across US property types.
Within the office space sector, Vornado Realty Trust, a US-based large-capitalization REIT that generates most of its revenues from Manhattan office and street retail assets, underperformed during the reporting period.6 We believe the stock’s underperformance was largely due to the prevailing pessimistic investor sentiment toward New York City REITs given a belief that there is a negative outlook for Manhattan market fundamentals for the next few years. We feel Vornado has made significant progress on its simplification strategy laid out a few years ago as it exited most of its non-core assets.
| | | | |
| Top 10 Holdings | | | |
12/31/17 | | | |
Company
Sector/Industry | | % of Total
Net Assets | |
Simon Property Group Inc. Retail REITs, US | | | 3.9% | |
Prologis Inc. Industrial REITs, US | | | 3.2% | |
Mitsui Fudosan Co. Ltd. Diversified Real Estate Activities, Japan | | | 2.7% | |
CK Asset Holdings Ltd. Real Estate Development, Hong Kong | | | 2.4% | |
Unibail-Rodamco SE Retail REITs, France | | | 2.3% | |
Equity Residential Residential REITs, US | | | 2.2% | |
Mitsubishi Estate Co. Ltd. Diversified Real Estate Activities, Japan | | | 2.2% | |
AvalonBay Communities Inc. Residential REITs, US | | | 2.1% | |
Sun Hung Kai Properties Ltd. Diversified Real Estate Activities, Hong Kong | | | 2.0% | |
Deutsche Wohnen SE
Real Estate Operating Companies, Germany | | | 2.0% | |
Nevertheless, the company has yet to announce details about its highly anticipated development and re-development plans for New York City’s Penn Plaza district. We think management’s lack of capital allocation toward growth, despite ample cash in its balance sheet, and the slow pace of investment decisions have been disappointing to us and have also contributed to the company’s recent underperformance.
Conversely, security selection and an overweighting in the industrials sector contributed to relative Fund performance.7 Shares of Segro outperformed in 2017, as the UK industrial-property company benefited from strong ecommerce growth. The lack of good quality industrial space, given limited new supply and scarcity of industrial zoned land, drove rental growth in the UK and also helped Segro. Operationally, the company continued to report robust and improving rental growth in its third quarter update, with higher income from new leases on existing properties in the UK. Segro also looked favorable to us based on our internal momentum model together with its solid development pipeline.
4. Diversified holdings are in diversified real estate activities, diversified REITs, real estate development and real estate operating companies in the SOI.
5. Triple-net leasing holdings are in hotel and resort REITs, retail REITs and diversified REITs in the SOI.
6. Office holdings are in office REITs in the SOI.
7. Industrial property holdings are in industrial REITs in the SOI.
FRANKLIN GLOBAL REAL ESTATE VIP FUND
Stock selection and an overweighting in the residential sector also boosted results.8 Shares of German residential REIT ADO Properties surged in 2017, as the German residential sector outperformed the overall index. The company, with its Berlin-concentrated portfolio, outperformed its peer group operationally with stronger-than-average like-for-like rental growth and reported strong third-quarter results and expected earnings for the full year 2017. Fundamentally, the Berlin residential market looked attractive, in our view, with its supply and demand mismatch, which continued to put upward pressure on rents, as vacancy in the market has decreased sharply. ADO Properties also looks favorable to us based on our internal momentum model and on the anticipation of further valuation uplifts for companies in the Berlin residential market, as indicated by transactions in the market.
Within the specialty sector, off-benchmark Coresite Realty outperformed in 2017, contributing to Fund performance.9 Shares of Coresite significantly outperformed the US property benchmark and the global real estate benchmark. The company continued its track record of strong revenue and profit growth. In its third quarter financial statement, Coresite reported increased revenues and funds-from-operations per share over the prior-year period. The company also announced a quarterly dividend distribution significantly above the prior-year quarterly dividend. We regard the management team highly in terms of capital allocation and they maintain one of the most conservative leverage strategies among US REITs with a relatively low ratio of debt-to-earnings before interest, taxes, depreciation and amortization.
It is important to recognize the effect of currency movements on the Fund’s performance. In general, if the value of the US dollar goes up compared with a foreign currency, an investment traded in that foreign currency will go down in value because it will be worth fewer US dollars. This can have a negative effect on Fund performance. Conversely, when the US dollar weakens in relation to a foreign currency, an investment traded in that foreign currency will increase in value, which can contribute to Fund performance. For the 12 months ended December 31, 2017, the US dollar declined in value relative to most currencies. As a result, the Fund’s performance was positively affected by the portfolio’s significant investment in securities with non-US currency exposure. However, one cannot expect the same result in future periods.
Thank you for your participation in Franklin Global Real Estate VIP Fund. We look forward to serving your future investment needs.
The foregoing information reflects our analysis, opinions and portfolio holdings as of December 31, 2017, the end of the reporting period. The way we implement our main investment strategies and the resulting portfolio holdings may change depending on factors such as market and economic conditions. These opinions may not be relied upon as investment advice or an offer for a particular security. The information is not a complete analysis of every aspect of any market, country, industry, security or the Fund. Statements of fact are from sources considered reliable, but the investment manager makes no representation or warranty as to their completeness or accuracy. Although historical performance is no guarantee of future results, these insights may help you understand our investment management philosophy.
8. Residential property holdings are in real estate operating companies and residential REITs in the SOI.
9. Specialty holdings are in office REITs and specialized REITs in the SOI.
FRANKLIN GLOBAL REAL ESTATE VIP FUND
Class 2 Fund Expenses
As an investor in a variable insurance contract (Contract) that indirectly provides for investment in an underlying mutual fund, you can incur transaction and/or ongoing expenses at both the Fund level and the Contract Level: (1) transaction expenses can include sales charges (loads) on purchases, surrender fees, transfer fees and premium taxes; and (2) ongoing expenses can include management fees, distribution and service (12b-1) fees, contract fees, annual maintenance fees, mortality and expense risk fees and other fees and expenses. All mutual funds and Contracts have some types of ongoing expenses. The table below shows Fund-level ongoing expenses and can help you understand these costs and compare them with those of other mutual funds offered through the Contract. The table assumes a $1,000 investment held for the six months indicated. Please refer to the Fund prospectus for additional information on operating expenses.
Actual Fund Expenses
The table below provides information about the actual account values and actual expenses in the columns under the heading “Actual.” In these columns the Fund’s actual return, which includes the effect of ongoing Fund expenses but does not include the effect of ongoing Contract expenses, is used to calculate the “Ending Account Value.” You can estimate the Fund-level expenses you paid during the period by following these steps (of course, your account value and expenses will differ from those in this illustration): Divide your account value by $1,000 (if your account had an $8,600 value, then $8,600 ÷ $1,000 = 8.6). Then multiply the result by the number under the headings “Actual” and “Fund-Level Expenses Paid During Period” (if Fund-Level Expenses Paid During Period were $ 7.50, then 8.6 x $7.50 = $64.50). In this illustration, the estimated expenses paid this period at the Fund level are $64.50.
Hypothetical Example for Comparison with Other Mutual Funds
Under the heading “Hypothetical” in the table, information is provided about hypothetical account values and hypothetical expenses based on the Fund’s actual expense ratio and an assumed rate of return of 5% per year before expenses, which is not the Fund’s actual return. This information may not be used to estimate the actual ending account balance or expenses you paid for the period, but it can help you compare ongoing costs of investing in the Fund with those of other mutual funds offered through the Contract. To do so, compare this 5% hypothetical example with the 5% hypothetical examples that appear in the shareholder reports of other funds offered through the Contract.
Please note that expenses shown in the table are meant to highlight ongoing costs at the Fund level only and do not reflect any ongoing expenses at the Contract level, or transaction expenses at either the Fund or Contract levels. In addition, while the Fund does not have transaction expenses, if the transaction and ongoing expenses at the Contract level were included, the expenses shown below would be higher. You should consult your Contract prospectus or disclosure document for more information.
| | | | | | | | | | | | | | | | | | | | | | | | | | |
| | | | | | Actual (actual return after expenses) | | | | | Hypothetical (5% annual return before expenses) | | | | |
Share Class | |
| Beginning Account
Value 7/1/17 |
| |
| Ending Account
Value 12/31/17 |
| |
| Fund-Level Expenses
Paid During Period
7/1/17–12/31/171,2 |
| | | |
| Ending Account
Value 12/31/17 |
| |
| Fund-Level Expenses
Paid During Period
7/1/17–12/31/171,2 |
| |
| Net
Annualized
Expense
Ratio2 |
|
Class 2 | | | $1,000 | | | | $1,050.20 | | | | $7.18 | | | | | | $1,018.20 | | | | $7.07 | | | | 1.39 | % |
1. Expenses are equal to the annualized expense ratio for the six-month period as indicated above—in the far right column—multiplied by the simple average account value over the period indicated, and then multiplied by 184/365 to reflect the one-half year period.
2. Reflects expenses after fee waivers and expense reimbursements. Does not include any ongoing expenses of the Contract for which the Fund is an investment option or acquired fund fees and expenses.
FRANKLIN TEMPLETON VARIABLE INSURANCE PRODUCTS TRUST
Financial Highlights
Franklin Global Real Estate VIP Fund
| | | | | | | | | | | | | | | | | | | | |
| | | Year Ended December 31, | |
| | | 2017 | | | 2016 | | | 2015 | | | 2014 | | | 2013 | |
| Class 1 | | | | | | | | | | | | | | | | | | | | |
Per share operating performance (for a share outstanding throughout the year) | | | | | | | | | | | | | | | | | | | | |
| | | | | |
Net asset value, beginning of year | | | $15.83 | | | | $15.93 | | | | $16.36 | | | | $14.29 | | | | $14.66 | |
| | | | |
| | | | | |
Income from investment operationsa: | | | | | | | | | | | | | | | | | | | | |
| | | | | |
Net investment incomeb | | | 0.17 | | | | 0.30 | c | | | 0.24 | | | | 0.26 | | | | 0.24 | |
| | | | | |
Net realized and unrealized gains (losses) | | | 1.52 | | | | (0.16 | ) | | | (0.12 | ) | | | 1.92 | | | | 0.13 | |
| | | | |
Total from investment operations | | | 1.69 | | | | 0.14 | | | | 0.12 | | | | 2.18 | | | | 0.37 | |
| | | | |
Less distributions from net investment income and net foreign currency gains | | | (0.56 | ) | | | (0.24 | ) | | | (0.55 | ) | | | (0.11 | ) | | | (0.74 | ) |
| | | | |
Net asset value, end of year | | | $16.96 | | | | $15.83 | | | | $15.93 | | | | $16.36 | | | | $14.29 | |
| | | | |
| | | | | |
Total returnd | | | 10.76% | | | | 0.81% | | | | 0.83% | | | | 15.27% | | | | 2.61% | |
| | | | | |
| Ratios to average net assets | | | | | | | | | | | | | | | | | | | | |
| | | | | |
Expenses | | | 1.14%e | | | | 1.11%e | | | | 1.11% | | | | 1.10%f | | | | 1.10% | |
| | | | | |
Net investment income | | | 1.04% | | | | 1.99%c | | | | 1.49% | | | | 1.66% | | | | 1.62% | |
| | | | | |
| Supplemental data | | | | | | | | | | | | | | | | | | | | |
| | | | | |
Net assets, end of year (000’s) | | | $819 | | | | $821 | | | | $32,161 | | | | $35,686 | | | | $34,276 | |
| | | | | |
Portfolio turnover rate | | | 22.18% | | | | 28.53% | g | | | 23.35% | | | | 16.67% | | | | 21.29% | |
aThe amount shown for a share outstanding throughout the period may not correlate with the Statement of Operations for the period due to the timing of sales and repurchases of the Fund’s shares in relation to income earned and/or fluctuating fair value of the investments of the Fund.
bBased on average daily shares outstanding.
cNet investment income per share includes approximately $0.06 per share related to income received in the form of special dividends in connection with certain Fund holdings. Excluding this amount, the ratio of net investment income to average net assets would have been 1.59%.
dTotal return does not include fees, charges or expenses imposed by the variable annuity and life insurance contracts for which Franklin Templeton Variable Insurance Products Trust serves as an underlying investment vehicle.
eBenefit of waiver and payments by affiliates rounds to less than 0.01%.
fBenefit of expense reduction rounds to less than 0.01%.
gExcludes the value of portfolio securities delivered as a result of a redemption in-kind. See Note 9.
| | | | | | |
| | | The accompanying notes are an integral part of these financial statements. | Annual Report | | | FGR-7 | |
FRANKLIN TEMPLETON VARIABLE INSURANCE PRODUCTS TRUST
FINANCIAL HIGHLIGHTS
Franklin Global Real Estate VIP Fund (continued)
| | | | | | | | | | | | | | | | | | | | |
| | | Year Ended December 31, | |
| | | 2017 | | | 2016 | | | 2015 | | | 2014 | | | 2013 | |
| Class 2 | | | | | | | | | | | | | | | | | | | | |
Per share operating performance (for a share outstanding throughout the year) | | | | | | | | | | | | | | | | | | | | |
| | | | | |
Net asset value, beginning of year | | | $15.42 | | | | $15.52 | | | | $15.95 | | | | $13.93 | | | | $14.27 | |
| | | | |
| | | | | |
Income from investment operationsa: | | | | | | | | | | | | | | | | | | | | |
| | | | | |
Net investment incomeb | | | 0.13 | | | | 0.28 | c | | | 0.20 | | | | 0.21 | | | | 0.20 | |
| | | | | |
Net realized and unrealized gains (losses) | | | 1.47 | | | | (0.19 | ) | | | (0.12 | ) | | | 1.88 | | | | 0.13 | |
| | | | |
Total from investment operations | | | 1.60 | | | | 0.09 | | | | 0.08 | | | | 2.09 | | | | 0.33 | |
| | | | |
Less distributions from net investment income and net foreign currency gains | | | (0.50 | ) | | | (0.19 | ) | | | (0.51 | ) | | | (0.07 | ) | | | (0.67 | ) |
| | | | |
Net asset value, end of year | | | $16.52 | | | | $15.42 | | | | $15.52 | | | | $15.95 | | | | $13.93 | |
| | | | |
Total returnd | | | 10.47% | | | | 0.54% | | | | 0.57% | | | | 15.01% | | | | 2.32% | |
| | | | | |
| Ratios to average net assets | | | | | | | | | | | | | | | | | | | | |
| | | | | |
Expenses | | | 1.39%e | | | | 1.36%e | | | | 1.36% | | | | 1.35%f | | | | 1.35% | |
| | | | | |
Net investment income | | | 0.79% | | | | 1.74%c | | | | 1.24% | | | | 1.41% | | | | 1.37% | |
| | | | | |
| Supplemental data | | | | | | | | | | | | | | | | | | | | |
| | | | | |
Net assets, end of year (000’s) | | | $183,532 | | | | $193,707 | | | | $287,473 | | | | $333,554 | | | | $328,825 | |
| | | | | |
Portfolio turnover rate | | | 22.18% | | | | 28.53%g | | | | 23.35% | | | | 16.67% | | | | 21.29% | |
aThe amount shown for a share outstanding throughout the period may not correlate with the Statement of Operations for the period due to the timing of sales and repurchases of the Fund’s shares in relation to income earned and/or fluctuating fair value of the investments of the Fund.
bBased on average daily shares outstanding.
cNet investment income per share includes approximately $0.06 per share related to income received in the form of special dividends in connection with certain Fund holdings. Excluding this amount, the ratio of net investment income to average net assets would have been 1.34%.
dTotal return does not include fees, charges or expenses imposed by the variable annuity and life insurance contracts for which Franklin Templeton Variable Insurance Products Trust serves as an underlying investment vehicle.
eBenefit of waiver and payments by affiliates rounds to less than 0.01%.
fBenefit of expense reduction rounds to less than 0.01%.
gExcludes the value of portfolio securities delivered as a result of a redemption in-kind. See Note 9.
| | | | |
| FGR-8 | | Annual Report | The accompanying notes are an integral part of these financial statements. | | |
FRANKLIN TEMPLETON VARIABLE INSURANCE PRODUCTS TRUST
Statement of Investments, December 31, 2017
Franklin Global Real Estate VIP Fund
| | | | | | | | | | | | |
| | | | | Country | | Shares | | | Value | |
| | Common Stocks 99.3% | | | | | | | | | | |
| | Diversified Real Estate Activities 11.3% | | | | | | | | | | |
| | CapitaLand Ltd. | | Singapore | | | 743,195 | | | $ | 1,961,479 | |
| | City Developments Ltd. | | Singapore | | | 222,347 | | | | 2,076,347 | |
| | Mitsubishi Estate Co. Ltd. | | Japan | | | 232,056 | | | | 4,036,294 | |
| | Mitsui Fudosan Co. Ltd. | | Japan | | | 219,278 | | | | 4,913,493 | |
| | New World Development Co. Ltd. | | Hong Kong | | | 1,620,585 | | | | 2,435,176 | |
| | Sun Hung Kai Properties Ltd. | | Hong Kong | | | 221,171 | | | | 3,691,444 | |
| | Tokyo Tatemono Co. Ltd. | | Japan | | | 125,032 | | | | 1,688,767 | |
| | | | | | | | | | | | |
| | | | | | | | | | | 20,803,000 | |
| | | | | | | | | | | | |
| | Diversified REITs 9.6% | | | | | | | | | | |
| | Activia Properties Inc. | | Japan | | | 346 | | | | 1,449,279 | |
| | Gecina SA | | France | | | 11,819 | | | | 2,182,369 | |
| | GPT Group | | Australia | | | 413,683 | | | | 1,649,281 | |
| | Gramercy Property Trust | | United States | | | 33,100 | | | | 882,446 | |
| | Hispania Activos Inmobiliarios SOCIMI SA | | Spain | | | 105,580 | | | | 1,988,796 | |
| | Hulic REIT Inc. | | Japan | | | 791 | | | | 1,151,209 | |
| | Kenedix Office Investment Corp. | | Japan | | | 277 | | | | 1,573,235 | |
| | Land Securities Group PLC | | United Kingdom | | | 157,778 | | | | 2,147,759 | |
| | Stockland | | Australia | | | 514,055 | | | | 1,796,774 | |
| | VEREIT Inc. | | United States | | | 175,770 | | | | 1,369,248 | |
| | Washington REIT | | United States | | | 46,300 | | | | 1,440,855 | |
| | | | | | | | | | | | |
| | | | | | | | | | | 17,631,251 | |
| | | | | | | | | | | | |
| | Health Care REITs 5.6% | | | | | | | | | | |
| | CareTrust REIT Inc. | | United States | | | 61,800 | | | | 1,035,768 | |
| | HCP Inc. | | United States | | | 78,589 | | | | 2,049,601 | |
| | Physicians Realty Trust | | United States | | | 52,181 | | | | 938,737 | |
| | Ventas Inc. | | United States | | | 46,517 | | | | 2,791,485 | |
| | Welltower Inc. | | United States | | | 56,576 | | | | 3,607,850 | |
| | | | | | | | | | | | |
| | | | | | | | | | | 10,423,441 | |
| | | | | | | | | | | | |
| | Hotel & Resort REITs 2.7% | | | | | | | | | | |
| | Hoshino Resorts REIT Inc. | | Japan | | | 117 | | | | 567,946 | |
| | Host Hotels & Resorts Inc. | | United States | | | 125,706 | | | | 2,495,264 | |
| | MGM Growth Properties LLC, A | | United States | | | 24,600 | | | | 717,090 | |
| | Sunstone Hotel Investors Inc. | | United States | | | 76,609 | | | | 1,266,347 | |
| | | | | | | | | | | | |
| | | | | | | | | | | 5,046,647 | |
| | | | | | | | | | | | |
| | Hotels, Resorts & Cruise Lines 0.6% | | | | | | | | | | |
| | Hilton Worldwide Holdings Inc. | | United States | | | 14,114 | | | | 1,127,144 | |
| | | | | | | | | | | | |
| | Industrial REITs 10.6% | | | | | | | | | | |
| | First Industrial Realty Trust Inc. | | United States | | | 65,153 | | | | 2,050,365 | |
| | Frasers Logistics & Industrial Trust | | Singapore | | | 984,866 | | | | 854,164 | |
| | Goodman Group | | Australia | | | 393,054 | | | | 2,582,084 | |
| | Mapletree Logistics Trust | | Singapore | | | 1,133,871 | | | | 1,119,035 | |
| | Nippon Prologis REIT Inc. | | Japan | | | 623 | | | | 1,317,486 | |
| | PLA Administradora Industrial S de RL de CV | | Mexico | | | 550,907 | | | | 835,222 | |
| | Prologis Inc. | | United States | | | 91,569 | | | | 5,907,116 | |
| | Rexford Industrial Realty Inc. | | United States | | | 63,074 | | | | 1,839,238 | |
| | Segro PLC | | United Kingdom | | | 386,474 | | | | 3,063,637 | |
| | | | | | | | | | | | |
| | | | | | | | | | | 19,568,347 | |
| | | | | | | | | | | | |
FRANKLIN TEMPLETON VARIABLE INSURANCE PRODUCTS TRUST
STATEMENT OF INVESTMENTS
Franklin Global Real Estate VIP Fund (continued)
| | | | | | | | | | | | | | |
| | | | | Country | | | Shares | | | Value | |
| | Common Stocks (continued) | | | | | | | | | | | | |
| | Office REITs 11.4% | | | | | | | | | | | | |
| | Alexandria Real Estate Equities Inc. | | | United States | | | | 24,121 | | | $ | 3,149,961 | |
| | Boston Properties Inc. | | | United States | | | | 23,685 | | | | 3,079,761 | |
| | Brandywine Realty Trust | | | United States | | | | 86,495 | | | | 1,573,344 | |
| | Cousins Properties Inc. | | | United States | | | | 29,700 | | | | 274,725 | |
| | Derwent London PLC | | | United Kingdom | | | | 38,171 | | | | 1,607,268 | |
| | Dexus | | | Australia | | | | 288,639 | | | | 2,195,662 | |
| | Highwoods Properties Inc. | | | United States | | | | 26,610 | | | | 1,354,715 | |
| | Japan Real Estate Investment Corp. | | | Japan | | | | 328 | | | | 1,557,261 | |
| | Kilroy Realty Corp. | | | United States | | | | 30,144 | | | | 2,250,250 | |
| | SL Green Realty Corp. | | | United States | | | | 19,822 | | | | 2,000,634 | |
| | Vornado Realty Trust | | | United States | | | | 24,227 | | | | 1,894,067 | |
| | | | | | | | | | | | | | |
| | | | | | | | | | | | | 20,937,648 | |
| | | | | | | | | | | | | | |
| | Real Estate Development 2.8% | | | | | | | | | | | | |
| | CK Asset Holdings Ltd. | | | Hong Kong | | | | 497,127 | | | | 4,345,888 | |
a | | Howard Hughes Corp. | | | United States | | | | 6,740 | | | | 884,760 | |
| | | | | | | | | | | | | | |
| | | | | | | | | | | | | 5,230,648 | |
| | | | | | | | | | | | | | |
| | Real Estate Operating Companies 9.1% | | | | | | | | | | | | |
| | ADO Properties SA | | | Germany | | | | 13,097 | | | | 664,379 | |
b | | ADO Properties SA, 144A | | | Germany | | | | 33,247 | | | | 1,686,539 | |
| | BUWOG AG | | | Austria | | | | 61,179 | | | | 2,110,324 | |
| | Deutsche Wohnen SE | | | Germany | | | | 83,267 | | | | 3,642,491 | |
| | Fabege AB | | | Sweden | | | | 70,882 | | | | 1,508,679 | |
| | First Capital Realty Inc. | | | Canada | | | | 54,664 | | | | 900,993 | |
| | Hemfosa Fastigheter AB | | | Sweden | | | | 97,118 | | | | 1,301,110 | |
| | Hufvudstaden AB, A | | | Sweden | | | | 76,267 | | | | 1,221,655 | |
| | Hysan Development Co. Ltd. | | | Hong Kong | | | | 256,065 | | | | 1,358,518 | |
| | Vonovia SE | | | Germany | | | | 40,607 | | | | 2,016,532 | |
a | | Wharf Real Estate Investment Co. Ltd. | | | Hong Kong | | | | 48,818 | | | | 324,918 | |
| | | | | | | | | | | | | | |
| | | | | | | | | | | | | 16,736,138 | |
| | | | | | | | | | | | | | |
| | Residential REITs 10.3% | | | | | | | | | | | | |
| | American Homes 4 Rent, A | | | United States | | | | 13,213 | | | | 288,572 | |
| | AvalonBay Communities Inc. | | | United States | | | | 22,089 | | | | 3,940,899 | |
| | Camden Property Trust | | | United States | | | | 24,300 | | | | 2,237,058 | |
| | Canadian Apartment Properties REIT | | | Canada | | | | 63,375 | | | | 1,881,438 | |
| | Equity Lifestyle Properties Inc. | | | United States | | | | 26,258 | | | | 2,337,487 | |
| | Equity Residential | | | United States | | | | 65,033 | | | | 4,147,154 | |
| | Essex Property Trust Inc. | | | United States | | | | 5,352 | | | | 1,291,812 | |
| | Mid-America Apartment Communities Inc. | | | United States | | | | 9,600 | | | | 965,376 | |
| | Unite Group PLC | | | United Kingdom | | | | 170,108 | | | | 1,849,265 | |
| | | | | | | | | | | | | | |
| | | | | | | | | | | | | 18,939,061 | |
| | | | | | | | | | | | | | |
| | Retail REITs 18.0% | | | | | | | | | | | | |
| | Agree Realty Corp. | | | United States | | | | 20,221 | | | | 1,040,168 | |
| | GGP Inc. | | | United States | | | | 92,474 | | | | 2,162,967 | |
| | Hammerson PLC | | | United Kingdom | | | | 112,256 | | | | 829,231 | |
| | Kimco Realty Corp. | | | United States | | | | 32,549 | | | | 590,764 | |
| | Link REIT | | | Hong Kong | | | | 358,737 | | | | 3,326,634 | |
| | The Macerich Co. | | | United States | | | | 17,400 | | | | 1,142,832 | |
| | Realty Income Corp. | | | United States | | | | 43,717 | | | | 2,492,743 | |
| | Regency Centers Corp. | | | United States | | | | 37,639 | | | | 2,603,866 | |
| | Retail Properties of America Inc., A | | | United States | | | | 118,100 | | | | 1,587,264 | |
FRANKLIN TEMPLETON VARIABLE INSURANCE PRODUCTS TRUST
STATEMENT OF INVESTMENTS
Franklin Global Real Estate VIP Fund (continued)
| | | | | | | | | | | | | | |
| | | | | Country | | | Shares | | | Value | |
| | Common Stocks (continued) | | | | | | | | | | | | |
| | Retail REITs (continued) | | | | | | | | | | | | |
| | Scentre Group | | | Australia | | | | 470,067 | | | $ | 1,536,667 | |
| | Simon Property Group Inc. | | | United States | | | | 42,126 | | | | 7,234,719 | |
| | SmartCentres REIT | | | Canada | | | | 39,130 | | | | 962,142 | |
| | Taubman Centers Inc. | | | United States | | | | 10,300 | | | | 673,929 | |
| | Unibail-Rodamco SE | | | France | | | | 16,558 | | | | 4,171,921 | |
| | Weingarten Realty Investors | | | United States | | | | 52,729 | | | | 1,733,202 | |
| | Westfield Corp. | | | Australia | | | | 140,957 | | | | 1,043,660 | |
| | | | | | | | | | | | | | |
| | | | | | | | | | | | | 33,132,709 | |
| | | | | | | | | | | | | | |
| | Specialized REITs 7.3% | | | | | | | | | | | | |
| | American Tower Corp. | | | United States | | | | 10,800 | | | | 1,540,836 | |
| | Coresite Realty Corp. | | | United States | | | | 15,769 | | | | 1,796,089 | |
| | CubeSmart | | | United States | | | | 50,893 | | | | 1,471,826 | |
| | CyrusOne Inc. | | | United States | | | | 19,967 | | | | 1,188,635 | |
| | Digital Realty Trust Inc. | | | United States | | | | 26,168 | | | | 2,980,535 | |
| | Iron Mountain Inc. | | | United States | | | | 24,300 | | | | 916,839 | |
| | Public Storage | | | United States | | | | 13,744 | | | | 2,872,496 | |
| | Weyerhaeuser Co. | | | United States | | | | 20,700 | | | | 729,881 | |
| | | | | | | | | | | | | | |
| | | | | | | | | | | | | 13,497,137 | |
| | | | | | | | | | | | | | |
| | | | |
| | Total Common Stocks (Cost $119,337,879) | | | | | | | | | | | 183,073,171 | |
| | | | | | | | | | | | | | |
| | | | |
| | | | | | | | Principal Amount | | | | |
| | Short Term Investments (Cost $853,442) 0.5% | | | | | | | | | | | | |
| | Repurchase Agreements 0.5% | | | | | | | | | | | | |
c | | Joint Repurchase Agreement, 1.377%, 1/02/18 (Maturity Value $853,573) | | | | | | | | | | | | |
| | BNP Paribas Securities Corp. (Maturity Value $139,140) | | | | | | | | | | | | |
| | Deutsche Bank Securities Inc. (Maturity Value $155,086) | | | | | | | | | | | | |
| | HSBC Securities (USA) Inc. (Maturity Value $556,564) | | | | | | | | | | | | |
| | Merrill Lynch, Pierce, Fenner & Smith Inc. (Maturity Value $2,783) | | | | | | | | | | | | |
| | Collateralized by U.S. Government Agency Securities, 0.00% - 1.98%, 7/27/18 -11/22/21; U.S. Treasury Note, 1.25% - 2.00%, 12/31/18 - 4/30/22; and U.S. Treasury Note, Index Linked, 0.125%, 4/15/18 (valued at $870,578) | | | United States | | | $ | 853,442 | | | | 853,442 | |
| | | | | | | | | | | | | | |
| | Total Investments (Cost $120,191,321) 99.8% | | | | | | | | | | | 183,926,613 | |
| | Other Assets, less Liabilities 0.2% | | | | | | | | | | | 424,820 | |
| | | | | | | | | | | | | | |
| | Net Assets 100.0% | | | | | | | | | | $ | 184,351,433 | |
| | | | | | | | | | | | | | |
See Abbreviations on page FGR-22.
aNon-income producing.
bSecurity was purchased pursuant to Rule 144A under the Securities Act of 1933 and may be sold in transactions exempt from registration only to qualified institutional buyers or in a public offering registered under the Securities Act of 1933. This security has been deemed liquid under guidelines approved by the Trust’s Board of Trustees. At December 31, 2017, the value of this security was $1,686,539, representing 0.9% of net assets.
cSee Note 1(c) regarding joint repurchase agreement.
| | | | | | |
| The accompanying notes are an integral part of these financial statements. | | Annual Report | | | FGR-11 | |
FRANKLIN TEMPLETON VARIABLE INSURANCE PRODUCTS TRUST
Financial Statements
Statement of Assets and Liabilities
December 31, 2017
| | | | |
| | | Franklin Global
Real Estate VIP Fund | |
Assets: | | | | |
Investments in securities: | | | | |
Cost - Unaffiliated issuers | | $ | 119,337,879 | |
Cost - Unaffiliated repurchase agreements | | | 853,442 | |
| | | | |
Value - Unaffiliated issuers | | $ | 183,073,171 | |
Value - Unaffiliated repurchase agreements | | | 853,442 | |
Receivables: | | | | |
Investment securities sold | | | 83,190 | |
Capital shares sold | | | 3,496 | |
Dividends | | | 846,599 | |
European Union tax reclaims | | | 115,619 | |
Other assets | | | 23 | |
| | | | |
Total assets | | | 184,975,540 | |
| | | | |
Liabilities: | | | | |
Payables: | | | | |
Investment securities purchased | | | 153,034 | |
Capital shares redeemed | | | 133,346 | |
Management fees | | | 163,852 | |
Distribution fees | | | 76,686 | |
Reports to shareholders | | | 44,369 | |
Professional fees | | | 44,246 | |
Accrued expenses and other liabilities | | | 8,574 | |
| | | | |
Total liabilities | | | 624,107 | |
| | | | |
Net assets, at value | | $ | 184,351,433 | |
| | | | |
Net assets consist of: | | | | |
Paid-in capital | | | $127,114,552 | |
Distributions in excess of net investment income | | | (259,145 | ) |
Net unrealized appreciation (depreciation) | | | 63,739,247 | |
Accumulated net realized gain (loss) | | | (6,243,221 | ) |
| | | | |
Net assets, at value | | $ | 184,351,433 | |
| | | | |
| |
| Class 1: | | | | |
Net assets, at value | | | $819,172 | |
| | | | |
Shares outstanding | | | 48,314 | |
| | | | |
Net asset value and maximum offering price per share | | | $16.96 | |
| | | | |
| |
| Class 2: | | | | |
Net assets, at value | | | $183,532,261 | |
| | | | |
Shares outstanding | | | 11,111,669 | |
| | | | |
Net asset value and maximum offering price per share | | | $16.52 | |
| | | | |
| | | | |
| FGR12 | | Annual Report | The accompanying notes are an integral part of these financial statements. | | |
FRANKLIN TEMPLETON VARIABLE INSURANCE PRODUCTS TRUST
FINANCIAL STATEMENTS
Statement of Operations
for the year ended December 31, 2017
| | | | |
| | | Franklin Global Real Estate VIP Fund | |
Investment income: | | | | |
Dividends: (net of foreign taxes)* | | | | |
Unaffiliated issuers | | $ | 4,093,156 | |
Interest: | | | | |
Unaffiliated issuers | | | 4,400 | |
Income from securities loaned (net of fees and rebates) | | | 9,550 | |
Other income (Note 1e) | | | 30,761 | |
| | | | |
Total investment income | | | 4,137,867 | |
| | | | |
Expenses: | | | | |
Management fees (Note 3a) | | | 1,993,927 | |
Distribution fees - Class 2 (Note 3c) | | | 471,776 | |
Custodian fees (Note 4) | | | 22,733 | |
Reports to shareholders | | | 56,448 | |
Professional fees | | | 67,035 | |
Trustees’ fees and expenses | | | 838 | |
Other | | | 16,104 | |
| | | | |
Total expenses | | | 2,628,861 | |
Expenses waived/paid by affiliates (Note 3e) | | | (590 | ) |
| | | | |
Net expenses | | | 2,628,271 | |
| | | | |
Net investment income | | | 1,509,596 | |
| | | | |
Realized and unrealized gains (losses): | | | | |
Net realized gain (loss) from: | | | | |
Investments: | | | | |
Unaffiliated issuers | | | 9,077,009 | |
Realized gain distributions from REITs | | | 2,007,987 | |
Foreign currency transactions | | | 20,786 | |
| | | | |
Net realized gain (loss) | | | 11,105,782 | |
| | | | |
Net change in unrealized appreciation (depreciation) on: | | | | |
Investments: | | | | |
Unaffiliated issuers | | | 6,211,890 | |
Translation of other assets and liabilities denominated in foreign currencies | | | 18,873 | |
| | | | |
Net change in unrealized appreciation (depreciation) | | | 6,230,763 | |
| | | | |
Net realized and unrealized gain (loss) | | | 17,336,545 | |
| | | | |
Net increase (decrease) in net assets resulting from operations | | $ | 18,846,141 | |
| | | | |
| |
*Foreign taxes withheld on dividends | | $ | 248,819 | |
| | | | | | |
| | | The accompanying notes are an integral part of these financial statements. | Annual Report | | | FGR-13 | |
FRANKLIN TEMPLETON VARIABLE INSURANCE PRODUCTS TRUST
FINANCIAL STATEMENTS
Statements of Changes in Net Assets
| | | | | | | | |
| | | Franklin Global Real Estate VIP Fund | |
| | | Year Ended December 31, | |
| | | 2017 | | | 2016 | |
Increase (decrease) in net assets: | | | | | | | | |
Operations: | | | | | | | | |
Net investment income | | $ | 1,509,596 | | | $ | 5,028,687 | |
Net realized gain (loss) | | | 11,105,782 | | | | 52,315,717 | |
Net change in unrealized appreciation (depreciation) | | | 6,230,763 | | | | (53,945,685 | ) |
| | | | |
Net increase (decrease) in net assets resulting from operations | | | 18,846,141 | | | | 3,398,719 | |
| | | | |
Distributions to shareholders from: | | | | | | | | |
Net investment income: | | | | | | | | |
Class 1 | | | (26,726 | ) | | | (442,226 | ) |
Class 2 | | | (5,862,949 | ) | | | (3,274,922 | ) |
| | | | |
Total distributions to shareholders | | | (5,889,675 | ) | | | (3,717,148 | ) |
| | | | |
Capital share transactions: (Note 2) | | | | | | | | |
Class 1 | | | (57,079 | ) | | | (31,539,337 | ) |
Class 2 | | | (23,075,937 | ) | | | (93,248,371 | ) |
| | | | |
Total capital share transactions | | | (23,133,016 | ) | | | (124,787,708 | ) |
| | | | |
Net increase (decrease) in net assets | | | (10,176,550 | ) | | | (125,106,137 | ) |
Net assets: | | | | | | | | |
Beginning of year | | | 194,527,983 | | | | 319,634,120 | |
| | | | |
End of year | | $ | 184,351,433 | | | $ | 194,527,983 | |
| | | | |
Undistributed net investment income included in net assets: | | | | | | | | |
End of year | | $ | — | | | $ | 3,322,944 | |
| | | | |
Distributions in excess of net investment income included in net assets: | | | | | | | | |
End of year | | $ | (259,145 | ) | | $ | — | |
| | | | |
| | | | |
| FGR-14 | | Annual Report | The accompanying notes are an integral part of these financial statements. | | |
FRANKLIN TEMPLETON VARIABLE INSURANCE PRODUCTS TRUST
Notes to Financial Statements
Franklin Global Real Estate VIP Fund
1. Organization and Significant Accounting Policies
Franklin Templeton Variable Insurance Products Trust (Trust) is registered under the Investment Company Act of 1940 (1940 Act) as an open-end management investment company, consisting of eighteen separate funds and applies the specialized accounting and reporting guidance in U.S. Generally Accepted Accounting Principles (U.S. GAAP). Franklin Global Real Estate VIP Fund (Fund) is included in this report. Shares of the Fund are generally sold only to insurance company separate accounts to fund the benefits of variable life insurance policies or variable annuity contracts. At December 31, 2017, 85.2% of the Fund’s shares were held through one insurance company. Investment activities of these insurance company separate accounts could have a material impact on the Fund. The Fund offers two classes of shares: Class 1 and Class 2. Each class of shares may differ by its distribution fees, voting rights on matters affecting a single class and its exchange privilege.
The following summarizes the Fund’s significant accounting policies.
a. Financial Instrument Valuation
The Fund’s investments in financial instruments are carried at fair value daily. Fair value is the price that would be received to sell an asset or paid to transfer a liability in an orderly transaction between market participants on the measurement date. The Fund calculates the net asset value (NAV) per share as of 4 p.m. Eastern time each day the New York Stock Exchange (NYSE) is open for trading. Under compliance policies and procedures approved by the Trust’s Board of Trustees (the Board), the Fund’s administrator has responsibility for oversight of valuation, including leading the cross-functional Valuation Committee (VC). The VC provides administration and oversight of the Fund’s valuation policies and procedures, which are approved annually by the Board. Among other things, these procedures allow the Fund to utilize independent pricing services, quotations from securities and financial instrument dealers, and other market sources to determine fair value.
Equity securities listed on an exchange or on the NASDAQ National Market System are valued at the last quoted sale price or the official closing price of the day, respectively. Foreign equity securities are valued as of the close of trading on the foreign stock exchange on which the security is primarily traded, or as of 4 p.m. Eastern time. The value is then converted
into its U.S. dollar equivalent at the foreign exchange rate in effect at 4 p.m. Eastern time on the day that the value of the security is determined. Over-the-counter (OTC) securities are valued within the range of the most recent quoted bid and ask prices. Securities that trade in multiple markets or on multiple exchanges are valued according to the broadest and most representative market. Certain equity securities are valued based upon fundamental characteristics or relationships to similar securities.
Investments in open-end mutual funds are valued at the closing NAV. Investments in repurchase agreements are valued at cost, which approximates fair value.
The Fund has procedures to determine the fair value of financial instruments for which market prices are not reliable or readily available. Under these procedures, the VC convenes on a regular basis to review such financial instruments and considers a number of factors, including significant unobservable valuation inputs, when arriving at fair value. The VC primarily employs a market-based approach which may use related or comparable assets or liabilities, recent transactions, market multiples, book values, and other relevant information for the investment to determine the fair value of the investment. An income-based valuation approach may also be used in which the anticipated future cash flows of the investment are discounted to calculate fair value. Discounts may also be applied due to the nature or duration of any restrictions on the disposition of the investments. Due to the inherent uncertainty of valuations of such investments, the fair values may differ significantly from the values that would have been used had an active market existed. The VC employs various methods for calibrating these valuation approaches including a regular review of key inputs and assumptions, transactional back-testing or disposition analysis, and reviews of any related market activity.
Trading in securities on foreign securities stock exchanges and OTC markets may be completed before 4 p.m. Eastern time. In addition, trading in certain foreign markets may not take place on every Fund’s business day. Occasionally, events occur between the time at which trading in a foreign security is completed and 4 p.m. Eastern time that might call into question the reliability of the value of a portfolio security held by the Fund. As a result, differences may arise between the value of the Fund’s portfolio securities as determined at the foreign market close and the latest indications of value at 4 p.m. Eastern time. In order to minimize the potential for these differences, the VC monitors price movements following the close of
FRANKLIN TEMPLETON VARIABLE INSURANCE PRODUCTS TRUST
NOTES TO FINANCIAL STATEMENTS
Franklin Global Real Estate VIP Fund (continued)
1. Organization and Significant Accounting Policies (continued)
a. Financial Instrument Valuation (continued)
trading in foreign stock markets through a series of country specific market proxies (such as baskets of American Depositary Receipts, futures contracts and exchange traded funds). These price movements are measured against established trigger thresholds for each specific market proxy to assist in determining if an event has occurred that may call into question the reliability of the values of the foreign securities held by the Fund. If such an event occurs, the securities may be valued using fair value procedures, which may include the use of independent pricing services.
When the last day of the reporting period is a non-business day, certain foreign markets may be open on those days that the Fund’s NAV is not calculated, which could result in differences between the value of the Fund’s portfolio securities on the last business day and the last calendar day of the reporting period. Any significant security valuation changes due to an open foreign market are adjusted and reflected by the Fund for financial reporting purposes.
b. Foreign Currency Translation
Portfolio securities and other assets and liabilities denominated in foreign currencies are translated into U.S. dollars based on the exchange rate of such currencies against U.S. dollars on the date of valuation. The Fund may enter into foreign currency exchange contracts to facilitate transactions denominated in a foreign currency. Purchases and sales of securities, income and expense items denominated in foreign currencies are translated into U.S. dollars at the exchange rate in effect on the transaction date. Portfolio securities and assets and liabilities denominated in foreign currencies contain risks that those currencies will decline in value relative to the U.S. dollar. Occasionally, events may impact the availability or reliability of foreign exchange rates used to convert the U.S. dollar equivalent value. If such an event occurs, the foreign exchange rate will be valued at fair value using procedures established and approved by the Board.
The Fund does not separately report the effect of changes in foreign exchange rates from changes in market prices on securities held. Such changes are included in net realized and unrealized gain or loss from investments in the Statement of Operations.
Realized foreign exchange gains or losses arise from sales of foreign currencies, currency gains or losses realized between the trade and settlement dates on securities transactions and the difference between the recorded amounts of dividends, interest, and foreign withholding taxes and the U.S. dollar equivalent of the amounts actually received or paid. Net unrealized foreign exchange gains and losses arise from changes in foreign exchange rates on foreign denominated assets and liabilities other than investments in securities held at the end of the reporting period.
c. Joint Repurchase Agreement
The Fund enters into a joint repurchase agreement whereby its uninvested cash balance is deposited into a joint cash account with other funds managed by the investment manager or an affiliate of the investment manager and is used to invest in one or more repurchase agreements. The value and face amount of the joint repurchase agreement are allocated to the funds based on their pro-rata interest. A repurchase agreement is accounted for as a loan by the Fund to the seller, collateralized by securities which are delivered to the Fund’s custodian. The fair value, including accrued interest, of the initial collateralization is required to be at least 102% of the dollar amount invested by the funds, with the value of the underlying securities marked to market daily to maintain coverage of at least 100%. Repurchase agreements are subject to the terms of Master Repurchase Agreements (MRAs) with approved counterparties (sellers). The MRAs contain various provisions, including but not limited to events of default and maintenance of collateral for repurchase agreements. In the event of default by either the seller or the Fund, certain MRAs may permit the non-defaulting party to net and close-out all transactions, if any, traded under such agreements. The Fund may sell securities it holds as collateral and apply the proceeds towards the repurchase price and any other amounts owed by the seller to the Fund in the event of default by the seller. This could involve costs or delays in addition to a loss on the securities if their value falls below the repurchase price owed by the seller. The joint repurchase agreement held by the Fund at year end, as indicated in the Statement of Investments, had been entered into on December 29, 2017.
d. Securities Lending
The Fund participates in an agency based securities lending program to earn additional income. The Fund receives cash collateral against the loaned securities in an amount equal to at
FRANKLIN TEMPLETON VARIABLE INSURANCE PRODUCTS TRUST
NOTES TO FINANCIAL STATEMENTS
Franklin Global Real Estate VIP Fund (continued)
least 102% of the fair value of the loaned securities. Collateral is maintained over the life of the loan in an amount not less than 100% of the fair value of loaned securities, as determined at the close of Fund business each day; any additional collateral required due to changes in security values is delivered to the Fund on the next business day. The collateral is deposited into a joint cash account with other funds and is used to invest in a money market fund managed by Franklin Advisers, Inc., an affiliate of the Fund. The Fund may receive income from the investment of cash collateral, in addition to lending fees and rebates paid by the borrower. Income from securities loaned, net of fees paid to the securities lending agent and/or third-party vendor, is reported separately in the Statement of Operations. The Fund bears the market risk with respect to the collateral investment, securities loaned, and the risk that the agent may default on its obligations to the Fund. If the borrower defaults on its obligation to return the securities loaned, the Fund has the right to repurchase the securities in the open market using the collateral received. The securities lending agent has agreed to indemnify the Fund in the event of default by a third party borrower. At December 31, 2017, the Fund had no securities on loan.
e. Income and Deferred Taxes
It is the Fund’s policy to qualify as a regulated investment company under the Internal Revenue Code. The Fund intends to distribute to shareholders substantially all of its taxable income and net realized gains to relieve it from federal income and if applicable, excise taxes. As a result, no provision for U.S. federal income taxes is required.
The Fund may be subject to foreign taxation related to income received, capital gains on the sale of securities and certain foreign currency transactions in the foreign jurisdictions in which it invests. Foreign taxes, if any, are recorded based on the tax regulations and rates that exist in the foreign markets in which the Fund invests. When a capital gain tax is determined to apply, the Fund records an estimated deferred tax liability in an amount that would be payable if the securities were disposed of on the valuation date.
As a result of several court cases, in certain countries across the European Union, the Fund filed additional tax reclaims for previously withheld taxes on dividends earned in those countries (EU reclaims). These additional filings are subject to various administrative proceedings by the local jurisdictions’ tax authorities within the European Union, as well as a number
of related judicial proceedings. Income recognized, if any, for EU reclaims is reflected as other income in the Statement of Operations and any related receivable, if any, is reflected as European Union tax reclaims in the Statement of Assets and Liabilities. When uncertainty exists as to the ultimate resolution of these proceedings, the likelihood of receipt of these EU reclaims, and the potential timing of payment, no amounts are reflected in the financial statements. For U.S. income tax purposes, when EU reclaims are received by the Fund and the Fund previously passed foreign tax credit on to its shareholders, the Fund must either amend historic tax reporting to shareholders or enter into a closing agreement with the Internal Revenue Service (IRS) in order to pay the associated tax liability on behalf of the Fund’s shareholders.
The Fund may recognize an income tax liability related to its uncertain tax positions under U.S. GAAP when the uncertain tax position has a less than 50% probability that it will be sustained upon examination by the tax authorities based on its technical merits. As of December 31, 2017, the Fund has determined that no tax liability is required in its financial statements related to uncertain tax positions for any open tax years (or expected to be taken in future tax years). Open tax years are those that remain subject to examination and are based on the statute of limitations in each jurisdiction in which the Fund invests.
f. Security Transactions, Investment Income, Expenses and Distributions
Security transactions are accounted for on trade date. Realized gains and losses on security transactions are determined on a specific identification basis. Interest income and estimated expenses are accrued daily. Dividend income and realized gain distributions are recorded on the ex-dividend date except for certain dividends from securities where the dividend rate is not available. In such cases, the dividend is recorded as soon as the information is received by the Fund. Distributions to shareholders are recorded on the ex-dividend date. Distributable earnings are determined according to income tax regulations (tax basis) and may differ from earnings recorded in accordance with U.S. GAAP. These differences may be permanent or temporary. Permanent differences are reclassified among capital accounts to reflect their tax character. These reclassifications have no impact on net assets or the results of operations. Temporary differences are not reclassified, as they may reverse in subsequent periods.
FRANKLIN TEMPLETON VARIABLE INSURANCE PRODUCTS TRUST
NOTES TO FINANCIAL STATEMENTS
Franklin Global Real Estate VIP Fund (continued)
1. Organization and Significant Accounting Policies (continued)
f. Security Transactions, Investment Income, Expenses and Distributions (continued)
Common expenses incurred by the Trust are allocated among the Funds based on the ratio of net assets of each Fund to the combined net assets of the Trust. Fund specific expenses are charged directly to the Fund that incurred the expense.
Realized and unrealized gains and losses and net investment income, excluding class specific expenses, are allocated daily to each class of shares based upon the relative proportion of net assets of each class. Differences in per share distributions by class are generally due to differences in class specific expenses.
Distributions received by the Fund from certain securities may be a return of capital (ROC). Such distributions reduce the cost basis of the securities, and any distributions in excess of the cost basis are recognized as capital gains. For Real Estate Investment Trust (REIT) securities, the Fund records ROC estimates, if any, on the ex-dividend date and are adjusted once actual tax designations are known.
g. Accounting Estimates
The preparation of financial statements in accordance with U.S. GAAP requires management to make estimates and assumptions that affect the reported amounts of assets and liabilities at the date of the financial statements and the amounts of income and expenses during the reporting period. Actual results could differ from those estimates.
h. Guarantees and Indemnifications
Under the Trust’s organizational documents, its officers and trustees are indemnified by the Trust against certain liabilities arising out of the performance of their duties to the Trust. Additionally, in the normal course of business, the Trust, on behalf of the Fund, enters into contracts with service providers that contain general indemnification clauses. The Trust’s maximum exposure under these arrangements is unknown as this would involve future claims that may be made against the Trust that have not yet occurred. Currently, the Trust expects the risk of loss to be remote.
2. Shares of Beneficial Interest
At December 31, 2017, there were an unlimited number of shares authorized (without par value). Transactions in the Fund’s shares were as follows:
| | | | | | | | | | | | | | | | | | | | |
| | | Year Ended December 31, | |
| | | 2017 | | | | | | 2016 | |
| | | Shares | | | Amount | | | | | | Shares | | | Amount | |
| | | | | |
| Class 1 Shares: | | | | | | | | | | | | | | | | | | | | |
Shares sold | | | 1,644 | | | $ | 26,478 | | | | | | | | 8,244 | | | $ | 135,524 | |
Shares issued in reinvestment of distributions | | | 1,626 | | | | 26,726 | | | | | | | | 27,081 | | | | 442,226 | |
Shares redeemed in-kind (Note 9) | | | — | | | | — | | | | | | | | (1,772,621 | ) | | | (28,376,646 | ) |
Shares redeemed | | | (6,836 | ) | | | (110,283 | ) | | | | | | | (230,198 | ) | | | (3,740,441 | ) |
| | | | |
Net increase (decrease) | | | (3,566 | ) | | $ | (57,079 | ) | | | | | | | (1,967,494 | ) | | $ | (31,539,337 | ) |
| | | | |
| | | | | |
| Class 2 Shares: | | | | | | | | | | | | | | | | | | | | |
Shares sold | | | 147,438 | | | $ | 2,348,274 | | | | | | | | 397,098 | | | $ | 6,351,063 | |
Shares issued in reinvestment of distributions | | | 365,520 | | | | 5,862,949 | | | | | | | | 205,582 | | | | 3,274,922 | |
Shares redeemed in-kind (Note 9) | | | — | | | | — | | | | | | | | (3,806,704 | ) | | | (59,402,467 | ) |
Shares redeemed | | | (1,961,819 | ) | | | (31,287,160 | ) | | | | | | | (2,762,366 | ) | | | (43,471,889 | ) |
| | | | |
Net increase (decrease) | | | (1,448,861 | ) | | $ | (23,075,937 | ) | | | | | | | (5,966,390 | ) | | $ | (93,248,371 | ) |
| | | | |
FRANKLIN TEMPLETON VARIABLE INSURANCE PRODUCTS TRUST
NOTES TO FINANCIAL STATEMENTS
Franklin Global Real Estate VIP Fund (continued)
3. Transactions with Affiliates
Franklin Resources, Inc. is the holding company for various subsidiaries that together are referred to as Franklin Templeton Investments. Certain officers and trustees of the Fund are also officers and/or directors of the following subsidiaries:
| | |
| Subsidiary | | Affiliation |
Franklin Templeton Institutional, LLC (FT Institutional) | | Investment manager |
Franklin Templeton Services, LLC (FT Services) | | Administrative manager |
Franklin Templeton Distributors, Inc. (Distributors) | | Principal underwriter |
Franklin Templeton Investor Services, LLC (Investor Services) | | Transfer agent |
a. Management Fees
The Fund pays an investment management fee to FT Institutional based on the average daily net assets of the Fund as follows:
| | |
| Annualized Fee Rate | | Net Assets |
1.050% | | Up to and including $500 million |
0.950% | | Over $500 million, up to and including $1 billion |
0.900% | | Over $1 billion, up to and including $1.5 billion |
0.850% | | Over $1.5 billion, up to and including $6.5 billion |
0.830% | | Over $6.5 billion, up to and including $11.5 billion |
0.810% | | Over $11.5 billion, up to and including $16.5 billion |
0.790% | | Over $16.5 billion, up to and including $19 billion |
0.780% | | Over $19 billion, up to and including $21.5 billion |
0.770% | | In excess of $21.5 billion |
For the year ended December 31, 2017, the gross effective investment management fee rate was 1.050% of the Fund’s average daily net assets.
b. Administrative Fees
Under an agreement with FT Institutional, FT Services provides administrative services to the Fund. The fee is paid by FT Institutional based on Fund’s average daily net assets, and is not an additional expense of the Fund.
c. Distribution Fees
The Board has adopted a distribution plan for Class 2 shares pursuant to Rule 12b-1 under the 1940 Act. Under the Fund’s compensation distribution plan, the Fund pays Distributors for costs incurred in connection with the servicing, sale and distribution of the Fund’s shares up to 0.35% per year of its average daily net assets. The Board has agreed to limit the current rate to 0.25% per year for Class 2. The plan year, for purposes of monitoring compliance with the maximum annual plan rate, is February 1 through January 31.
d. Transfer Agent Fees
Investor Services, under terms of an agreement, performs shareholder servicing for the Fund and is not paid by the Fund for the services.
FRANKLIN TEMPLETON VARIABLE INSURANCE PRODUCTS TRUST
NOTES TO FINANCIAL STATEMENTS
Franklin Global Real Estate VIP Fund (continued)
3. Transactions with Affiliates (continued)
e. Investments in Affiliated Management Investment Companies
The Fund invests in one or more affiliated management investment companies for purposes other than exercising a controlling influence over the management or policies. Management fees paid by the Fund are waived on assets invested in the affiliated management investment companies, as noted in the Statement of Operations, in an amount not to exceed the management and administrative fees paid directly or indirectly by each affiliate. During the year ended December 31, 2017, the Fund held investments in affiliated management investment companies as follows:
| | | | | | | | | | | | | | | | | | | | | | | | | | | | | | | | |
| | | Number
of Shares
Held at
Beginning
of Year | | | Gross
Additions | | | Gross
Reductions | | | Number
of Shares
Held at
End of
Year | | | Value at
End of
Year | | | Dividend
Income | | | Realized
Gain
(Loss) | | | Net Change in
Unrealized
Appreciation
(Depreciation) | |
| Non-Controlled Affiliates | | | | | | | | | | | | | | | | | | | | | | | | | | | | | | | | |
Institutional Fiduciary Trust Money Market Portfolio, 0.89% | | | — | | | | 5,292,000 | | | | (5,292,000 | ) | | | — | | | $ | — | | | $ | — | | | $ | — | | | $ | — | |
| | | | | | | | | | | | | | | | | | | | |
4. Expense Offset Arrangement
The Fund has entered into an arrangement with its custodian whereby credits realized as a result of uninvested cash balances are used to reduce a portion of the Fund’s custodian expenses. During the year ended December 31, 2017, there were no credits earned.
5. Income Taxes
For tax purposes, capital losses may be carried over to offset future capital gains. Capital loss carryforwards with no expiration, if any, must be fully utilized before those losses with expiration dates.
At December 31, 2017, the Fund had capital loss carryforwards of $2,192,369 expiring in 2018.
During the year ended December 31, 2017, the Fund utilized $6,484,859 of capital loss carryforwards.
On December 31, 2017, the Fund had expired capital loss carryforwards of $200,963,750, which were reclassified to paid-in capital.
The tax character of distributions paid during the years ended December 31, 2017 and 2016, was as follows:
| | | | | | | | |
| | | 2017 | | | 2016 | |
Distributions paid from ordinary income | | $ | 5,889,675 | | | $ | 3,717,148 | |
| | | | |
At December 31, 2017, the cost of investments, net unrealized appreciation (depreciation) and undistributed ordinary income for income tax purposes were as follows:
| | | | |
Cost of investments | | $ | 129,546,944 | |
| | | | |
Unrealized appreciation | | $ | 65,131,903 | |
Unrealized depreciation | | | (10,752,234 | ) |
| | | | |
Net unrealized appreciation (depreciation) | | $ | 54,379,669 | |
| | | | |
Distributable earnings - undistributed ordinary income | | $ | 4,932,825 | |
| | | | |
Differences between income and/or capital gains as determined on a book basis and a tax basis are primarily due to differing treatment of passive foreign investment company shares.
FRANKLIN TEMPLETON VARIABLE INSURANCE PRODUCTS TRUST
NOTES TO FINANCIAL STATEMENTS
Franklin Global Real Estate VIP Fund (continued)
In accordance with U.S. GAAP permanent differences are reclassified among capital accounts to reflect their tax character. At the year ended December 31, 2017, such reclassifications were as follows:
| | | | |
Paid-in capital | | $ | (198,754,648 | ) |
Undistributed net investment income | | $ | 797,990 | |
Accumulated net realized gain (loss) | | $ | 197,956,658 | |
6. Investment Transactions
Purchases and sales of investments (excluding short term securities) for the year ended December 31, 2017, aggregated $41,819,488 and $66,537,147, respectively.
7. Concentration of Risk
Investing in foreign securities may include certain risks and considerations not typically associated with investing in U.S. securities, such as fluctuating currency values and changing local and regional economic, political and social conditions, which may result in greater market volatility. In addition, certain foreign securities may not be as liquid as U.S. securities.
The Fund invests a large percentage of its total assets in REIT securities. Such concentration may subject the Fund to special risks associated with real estate securities. These securities may be more sensitive to economic or regulatory developments due to a variety of factors such as local, regional, national and global economic conditions, interest rates and tax considerations.
8. Credit Facility
The Fund, together with other U.S. registered and foreign investment funds (collectively, Borrowers), managed by Franklin Templeton Investments, are borrowers in a joint syndicated senior unsecured credit facility totaling $2 billion (Global Credit Facility) which matured on February 9, 2018. This Global Credit Facility provides a source of funds to the Borrowers for temporary and emergency purposes, including the ability to meet future unanticipated or unusually large redemption requests. Effective February 9, 2018, the Borrowers renewed the Global Credit Facility for a one year term, maturing February 8, 2019, for a total of $2 billion.
Under the terms of the Global Credit Facility, the Fund shall, in addition to interest charged on any borrowings made by the Fund and other costs incurred by the Fund, pay its share of fees and expenses incurred in connection with the implementation and maintenance of the Global Credit Facility, based upon its relative share of the aggregate net assets of all of the Borrowers, including an annual commitment fee of 0.15% based upon the unused portion of the Global Credit Facility. These fees are reflected in other expenses in the Statement of Operations. During the year ended December 31, 2017, the Fund did not use the Global Credit Facility.
9. Redemption In-Kind
During the year ended December 31, 2016, the Fund realized $27,545,389 of net gains resulting from a redemption in-kind in which a shareholder redeemed fund shares for cash and securities held by the Fund. Because such gains are not taxable to the Fund, and are not distributed to remaining shareholders, they have been reclassified from accumulated net realized gains to paid-in capital.
FRANKLIN TEMPLETON VARIABLE INSURANCE PRODUCTS TRUST
NOTES TO FINANCIAL STATEMENTS
Franklin Global Real Estate VIP Fund (continued)
10. Fair Value Measurements
The Fund follows a fair value hierarchy that distinguishes between market data obtained from independent sources (observable inputs) and the Fund’s own market assumptions (unobservable inputs). These inputs are used in determining the value of the Fund’s financial instruments and are summarized in the following fair value hierarchy:
| | • | | Level 1 – quoted prices in active markets for identical financial instruments |
| | • | | Level 2 – other significant observable inputs (including quoted prices for similar financial instruments, interest rates, prepayment speed, credit risk, etc.) |
| | • | | Level 3 – significant unobservable inputs (including the Fund’s own assumptions in determining the fair value of financial instruments) |
The input levels are not necessarily an indication of the risk or liquidity associated with financial instruments at that level.
For movements between the levels within the fair value hierarchy, the Fund has adopted a policy of recognizing the transfers as of the date of the underlying event which caused the movement.
A summary of inputs used as of December 31, 2017, in valuing the Fund’s assets carried at fair value, is as follows:
| | | | | | | | | | | | | | | | |
| | | Level 1 | | | Level 2 | | | Level 3 | | | Total | |
| | | | |
| Assets: | | | | | | | | | | | | | | | | |
Investments in Securities:a | | | | | | | | | | | | | | | | |
Equity Investments | | $ | 183,073,171 | | | $ | — | | | $ | — | | | $ | 183,073,171 | |
Short Term Investments | | | — | | | | 853,442 | | | | — | | | | 853,442 | |
| | | | |
Total Investments in Securities | | $ | 183,073,171 | | | $ | 853,442 | | | $ | — | | | $ | 183,926,613 | |
| | | | |
aFor detailed categories, see the accompanying Statement of Investments.
11. Subsequent Events
The Fund has evaluated subsequent events through the issuance of the financial statements and determined that no events have occurred that require disclosure other than those already disclosed in the financial statements.
| | |
| Abbreviations | | |
| |
| Selected Portfolio | | |
| |
REIT Real Estate Investment Trust | | |
FRANKLIN TEMPLETON VARIABLE INSURANCE PRODUCTS TRUST
Report of Independent Registered Public Accounting Firm
To the Board of Trustees of Franklin Templeton Variable Insurance Products Trust and Shareholders of Franklin Global Real Estate VIP Fund
Opinion on the Financial Statements
We have audited the accompanying statement of assets and liabilities, including the statement of investments, of Franklin Global Real Estate VIP Fund (the “Fund”) as of December 31, 2017, the related statement of operations for the year ended December 31, 2017, the statement of changes in net assets for each of the two years in the period ended December 31, 2017, including the related notes, and the financial highlights for each of the five years in the period ended December 31, 2017 (collectively referred to as the “financial statements”). In our opinion, the financial statements present fairly, in all material respects, the financial position of the Fund as of December 31, 2017, the results of its operations for the year then ended, the changes in its net assets for each of the two years in the period ended December 31, 2017 and the financial highlights for each of the five years in the period ended December 31, 2017 in conformity with accounting principles generally accepted in the United States of America.
Basis for Opinion
These financial statements are the responsibility of the Fund’s management. Our responsibility is to express an opinion on the Fund’s financial statements based on our audits. We are a public accounting firm registered with the Public Company Accounting Oversight Board (United States) (“PCAOB”) and are required to be independent with respect to the Fund in accordance with the U.S. federal securities laws and the applicable rules and regulations of the Securities and Exchange Commission and the PCAOB.
We conducted our audits of these financial statements in accordance with the standards of the PCAOB. Those standards require that we plan and perform the audit to obtain reasonable assurance about whether the financial statements are free of material misstatement, whether due to error or fraud.
Our audits included performing procedures to assess the risks of material misstatement of the financial statements, whether due to error or fraud, and performing procedures that respond to those risks. Such procedures included examining, on a test basis, evidence regarding the amounts and disclosures in the financial statements. Our audits also included evaluating the accounting principles used and significant estimates made by management, as well as evaluating the overall presentation of the financial statements. Our procedures included confirmation of securities owned as of December 31, 2017 by correspondence with the custodian and brokers; when replies were not received from brokers, we performed other auditing procedures. We believe that our audits provide a reasonable basis for our opinion.
PricewaterhouseCoopers LLP
San Francisco, California February 15, 2018
We have served as the auditor of one or more investment companies in the Franklin Templeton Group of Funds since 1948.
This page intentionally left blank.
Franklin Growth and Income VIP Fund
This annual report for Franklin Growth and Income VIP Fund covers the fiscal year ended December 31, 2017.
Class 2 Performance Summary as of December 31, 2017
Average annual total return of Class 2 shares* represents the average annual change in value, assuming reinvestment of dividends and capital gains. Average returns smooth out variations in returns, which can be significant; they are not the same as year-by-year results.
| | | | | | | | | | | | |
| Periods ended 12/31/17 | | 1-Year | | | 5-Year | | | 10-Year | |
Average Annual Total Return | | | +15.85% | | | | +12.63% | | | | +7.15% | |
*The Fund has an expense reduction contractually guaranteed through 4/30/18. Fund investment results reflect the expense reduction; without this reduction, the results would have been lower.
Performance reflects the Fund’s Class 2 operating expenses, but does not include any contract fees, expenses or sales charges. If they had been included, performance would be lower. These charges and deductions, particularly for variable life policies, can have a significant effect on contract values and insurance benefits. See the contract prospectus for a complete description of these expenses, including sales charges.
Performance data represent past performance, which does not guarantee future results. Investment return and principal value will fluctuate, and you may have a gain or loss when you sell your shares. Current performance may differ from figures shown.
Total Return Index Comparison for a Hypothetical $10,000 Investment (1/1/08-12/31/17)
The graph below shows the change in value of a hypothetical $10,000 investment in the Fund over the indicated period and includes reinvestment of any income or distributions. The Fund’s performance is compared to the performance of the Standard & Poor’s® 500 Index (S&P 500®), the Lipper VIP Equity Income Funds Classification Average and the Consumer Price Index. One cannot invest directly in an index, and an index is not representative of the Fund’s portfolio. Please see Important Notes to Performance Information preceding the Fund Summaries.
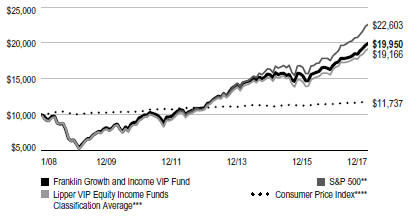
**Source: Morningstar. Please see Index Descriptions following the Fund Summaries.
***Source: Lipper, a Thomson Reuters Company. Please see Index Descriptions following the Fund Summaries.
****Source: Bureau of Labor Statistics, bls.gov/cpi. Please see Index Descriptions following the Fund Summaries.
FRANKLIN GROWTH AND INCOME VIP FUND
Fund Goal and Main Investments
The Fund seeks capital appreciation with current income as a secondary goal. Under normal market conditions, the Fund invests predominantly in equity securities, including securities convertible into common stock.
Fund Risks
All investments involve risks, including possible loss of principal. Stock prices fluctuate, sometimes rapidly and dramatically, due to factors affecting individual companies, particular industries or sectors, or general market conditions. Growth stock prices reflect projections of future earnings or revenues, and can, therefore, fall dramatically if the company fails to meet those projections. Value securities may not increase in price as anticipated or may decline further in value. Because the Fund can only distribute what it earns, the Fund’s distributions to shareholders may decline when prevailing interest rates fall, when dividend income from investments in stocks decline, or when the Fund experiences defaults on debt securities it holds. To the extent the Fund focuses on particular countries, regions, industries, sectors or types of investment from time to time, it may be subject to greater risks of adverse developments in such areas of focus than a fund that invests in a wider variety of countries, regions, industries, sectors or investments. The Fund’s investment in foreign securities also involves special risks, including currency fluctuations and economic as well as political uncertainty. The Fund is actively managed but there is no guarantee that the manager’s investment decisions will produce the desired results. The Fund’s prospectus also includes a description of the main investment risks.
Performance Overview
You can find the Fund’s one-year total return in the Performance Summary. In comparison, the Fund’s benchmark, the S&P 500, produced a +21.83% total return.1 The Fund’s peers, as measured by the Lipper VIP Equity Income Funds Classification Average, had a +15.23% total return for the same period.2
Portfolio Composition
Based on Total Net Assets as of 12/31/17
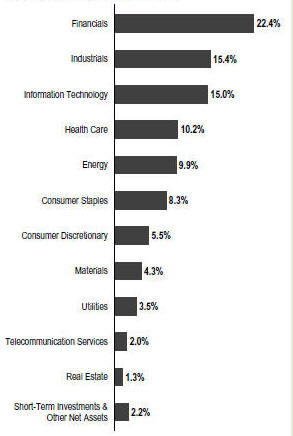
Economic and Market Overview
The US economy grew during the 12 months under review. After strengthening in 2017’s second and third quarters, the economy moderated in the fourth quarter. The economy grew faster in 2017 than in 2016, however, largely due to growth in consumer spending, business investment and exports. The manufacturing and services sectors expanded during the period. The unemployment rate declined from 4.7% in December 2016 to 4.1% at period-end.3 Monthly retail sales were volatile but positive on average during the period. Annual inflation, as measured by the Consumer Price Index, was 2.1% in December 2016, and while it varied over the 12-month period, remained unchanged at period-end.3
1. Source: Morningstar.
2. Source: Lipper, a Thomson Reuters Company.
One cannot invest directly in an index, and an index is not representative of the Fund’s portfolio. Please see Index Descriptions following the Fund Summaries.
3. Source: Bureau of Labor Statistics.
The dollar value, number of shares or principal amount, and names of all portfolio holdings are listed in the Fund’s Statement of Investments (SOI).
FRANKLIN GROWTH AND INCOME VIP FUND
The US Federal Reserve (Fed) raised its target range for the federal funds rate 0.25% at its March and June 2017 meetings, amid signs of a growing US economy, strengthening labor market and improving business spending. At its December meeting, the Fed raised its target range for the federal funds rate 0.25% to 1.25%–1.50%, as widely anticipated by the market. The Fed also confirmed that the monthly balance sheet reduction would increase from $10 billion to $20 billion beginning in January 2018.
US equity markets rose during the 12-month period, benefiting from mostly upbeat economic data, better US corporate earnings and improving global economic growth. Concerns about the terms of the UK’s exit from the European Union (EU), political uncertainty in the US, tensions between the US and North Korea, and the progress of US health care and tax reform plans curbed market sentiment at times. However, the markets were also supported by investor optimism arising from pro-growth and pro-business policy plans in the US, the prospect for reforms in the EU with Emmanuel Macron’s election as France’s president, and the US Fed chair’s comments indicating optimism about the US economy and the likelihood of gradual rate hikes. Furthermore, the Senate’s approval of a budget plan in October and subsequent passage of a tax reform bill near period-end drove many US equity indexes to end 2017 near record highs. In this environment, the broad US stock market, as measured by the S&P 500, generated a +21.83% total return for the period.1
Investment Strategy
We seek to invest in a broadly diversified portfolio of equity securities that we consider to be financially strong, with a focus on “blue chip” companies. We apply a bottom-up approach to investing in individual securities. We will assess the market price of a company’s securities relative to our evaluation of the company’s long-term earnings, returns on capital, asset value and cash flow potential. We also consider a company’s price/earnings ratio, profit margins and balance sheet strength. We consider dividend yield in selecting stocks for the Fund because we believe that, over time, dividend income can contribute significantly to total return and can be a more consistent source of investment return than capital appreciation. We seek to take advantage of price dislocations that result from the market’s short-term focus and choose to invest in those companies that, in our opinion, offer the best trade-off between growth opportunity, business and financial risk, and valuation.
Manager’s Discussion
During the period under review, nearly all of the Fund’s sector allocations added to absolute returns, led by information
technology (IT), financials and industrials. In contrast, the Fund’s consumer discretionary allocation was the only sector detractor during the period.
In the IT sector, software company Microsoft’s shares rose in 2017 as the company’s cloud-based initiatives continued to deliver strong results, led by Office 365 subscriber growth and Azure revenue growth. Additionally, prudent expense management and higher margins in the hardware business led to better operating results and earnings-per-share growth that exceeded consensus expectations. Consumer electronics company Apple reported robust earnings and cash flow generation from a strong product cycle, with many customers pleased with the new iPhone features. Also, the company’s high-margin services business continued to grow.
| | | | |
| |
| Top 10 Holdings | | | |
| 12/31/17 | | | |
| |
Company Sector/Industry | | % of Total
Net Assets | |
JPMorgan Chase & Co.
Financials | | | 4.2% | |
Microsoft Corp.
Information Technology | | | 3.4% | |
Wells Fargo & Co.
Financials | | | 3.2% | |
Bank of America Corp.
Financials | | | 2.9% | |
Apple Inc.
Information Technology | | | 2.7% | |
Intel Corp.
Information Technology | | | 2.7% | |
Chevron Corp.
Energy | | | 2.6% | |
PepsiCo Inc.
Consumer Staples | | | 2.5% | |
BlackRock Inc.
Financials | | | 2.5% | |
Morgan Stanley
Financials | | | 2.3% | |
In the financials sector, financial and investment banking services firm JPMorgan Chase and investment management firm BlackRock contributed to Fund performance. In a year of mostly positive credit trends, JPMorgan Chase’s loan-loss provision increased, while its nonperforming assets decreased. The company continues to post strong operating results as revenue, which rose amid strong growth in net interest income. We believe it should see additional benefits going forward from potential deregulation and the recently passed tax reform.
FRANKLIN GROWTH AND INCOME VIP FUND
In the industrials sector, aerospace and defense company Raytheon and machinery firm Stanley Black & Decker contributed to Fund performance.
In contrast, in the consumer discretionary sector, consumer and commercial products manufacturer Newell Brands and specialty retailer L Brands (not held at period-end) detracted from performance. Newell Brands reported a weak third-quarter 2017 earnings and lowered guidance after some retail customers looked to lower inventory and reduced replenishment orders. General Electric’s shares were negatively impacted by the company’s weaker-than-expected cash flow generation, which culminated in a dividend reduction in late 2017. The company’s health care and aviation segments continued to perform well, while its oil and gas segment and power segment remained under pressure. Schlumberger’s share price declined for the period due to ongoing industry uncertainty around oil inventory surpluses and the prospect of a sustainable recovery in oil prices. Activity in the oil and gas services industry typically lags that of oil and gas producers and the current concerns around the sustainability of production activity has led to cautious sentiment around services companies. Schlumberger has continued to perform relatively well despite a challenging environment and we believe that it is uniquely well-positioned to benefit from the nascent oil price recovery.
Thank you for your participation in Franklin Growth and Income VIP Fund. We look forward to serving your future investment needs.
The foregoing information reflects our analysis, opinions and portfolio holdings as of December 31, 2017, the end of the reporting period. The way we implement our main investment strategies and the resulting portfolio holdings may change depending on factors such as market and economic conditions. These opinions may not be relied upon as investment advice or an offer for a particular security. The information is not a complete analysis of every aspect of any market, country, industry, security or the Fund. Statements of fact are from sources considered reliable, but the investment manager makes no representation or warranty as to their completeness or accuracy. Although historical performance is no guarantee of future results, these insights may help you understand our investment management philosophy.
FRANKLIN GROWTH AND INCOME VIP FUND
Class 2 Fund Expenses
As an investor in a variable insurance contract (Contract) that indirectly provides for investment in an underlying mutual fund, you can incur transaction and/or ongoing expenses at both the Fund level and the Contract Level: (1) transaction expenses can include sales charges (loads) on purchases, surrender fees, transfer fees and premium taxes; and (2) ongoing expenses can include management fees, distribution and service (12b-1) fees, contract fees, annual maintenance fees, mortality and expense risk fees and other fees and expenses. All mutual funds and Contracts have some types of ongoing expenses. The table below shows Fund-level ongoing expenses and can help you understand these costs and compare them with those of other mutual funds offered through the Contract. The table assumes a $1,000 investment held for the six months indicated. Please refer to the Fund prospectus for additional information on operating expenses.
Actual Fund Expenses
The table below provides information about the actual account values and actual expenses in the columns under the heading “Actual.” In these columns the Fund’s actual return, which includes the effect of ongoing Fund expenses but does not include the effect of ongoing Contract expenses, is used to calculate the “Ending Account Value.” You can estimate the Fund-level expenses you paid during the period by following these steps (of course, your account value and expenses will differ from those in this illustration): Divide your account value by $1,000 (if your account had an $8,600 value, then $8,600 ÷ $1,000 = 8.6). Then multiply the result by the number under the headings “Actual” and “Fund-Level Expenses Paid During Period” (if Fund-Level Expenses Paid During Period were $ 7.50, then 8.6 x $7.50 = $64.50). In this illustration, the estimated expenses paid this period at the Fund level are $64.50.
Hypothetical Example for Comparison with Other Mutual Funds
Under the heading “Hypothetical” in the table, information is provided about hypothetical account values and hypothetical expenses based on the Fund’s actual expense ratio and an assumed rate of return of 5% per year before expenses, which is not the Fund’s actual return. This information may not be used to estimate the actual ending account balance or expenses you paid for the period, but it can help you compare ongoing costs of investing in the Fund with those of other mutual funds offered through the Contract. To do so, compare this 5% hypothetical example with the 5% hypothetical examples that appear in the shareholder reports of other funds offered through the Contract.
Please note that expenses shown in the table are meant to highlight ongoing costs at the Fund level only and do not reflect any ongoing expenses at the Contract level, or transaction expenses at either the Fund or Contract levels. In addition, while the Fund does not have transaction expenses, if the transaction and ongoing expenses at the Contract level were included, the expenses shown below would be higher. You should consult your Contract prospectus or disclosure document for more information.
| | | | | | | | | | | | | | | | | | | | | | | | | | | | |
| | | | | | Actual (actual return after expenses) | | | | | | Hypothetical (5% annual return before expenses) | | | | |
| Share Class | | Beginning Account
Value 7/1/17 | | | Ending Account
Value 12/31/17 | | | Fund-Level
Expenses Paid
During Period
7/1/17–12/31/171,2 | | | | | | Ending Account
Value 12/31/17 | | | Fund-Level
Expenses Paid
During Period
7/1/17–12/31/171,2 | | | Net
Annualized
Expense
Ratio2 | |
Class 2 | | | $1,000 | | | | $1,098.80 | | | | $4.44 | | | | | | | | $1,020.97 | | | | $4.28 | | | | 0.84% | |
1. Expenses are equal to the annualized expense ratio for the six-month period as indicated above—in the far right column—multiplied by the simple average account value over the period indicated, and then multiplied by 184/365 to reflect the one-half year period.
2. Reflects expenses after fee waivers and expense reimbursements. Does not include any ongoing expenses of the Contract for which the Fund is an investment option or acquired fund fees and expenses.
FRANKLIN TEMPLETON VARIABLE INSURANCE PRODUCTS TRUST
Financial Highlights
Franklin Growth and Income VIP Fund
| | | | | | | | | | | | | | | | | | | | |
| | | Year Ended December 31, | |
| | | 2017 | | | 2016 | | | 2015 | | | 2014 | | | 2013 | |
| Class 1 | | | | | | | | | | | | | | | | | | | | |
Per share operating performance
(for a share outstanding throughout the year) | | | | | | | | | | | | | | | | | | | | |
| | | | | |
Net asset value, beginning of year | | | $15.97 | | | | $15.94 | | | | $17.02 | | | | $15.97 | | | | $12.64 | |
| | | | |
| | | | | |
Income from investment operationsa: | | | | | | | | | | | | | | | | | | | | |
| | | | | |
Net investment incomeb | | | 0.35 | | | | 0.40 | | | | 0.45 | | | | 0.53 | c | | | 0.33 | |
| | | | | |
Net realized and unrealized gains (losses) | | | 2.04 | | | | 1.33 | | | | (0.54 | ) | | | 0.95 | | | | 3.40 | |
| | | | |
Total from investment operations | | | 2.39 | | | | 1.73 | | | | (0.09 | ) | | | 1.48 | | | | 3.73 | |
| | | | | |
| Less distributions from: | | | | | | | | | | | | | | | | | | | | |
| | | | | |
Net investment income | | | (1.03 | ) | | | (0.46 | ) | | | (0.61 | ) | | | (0.43 | ) | | | (0.40 | ) |
| | | | | |
Net realized gains | | | (1.01 | ) | | | (1.24 | ) | | | (0.38 | ) | | | — | | | | — | |
| | | | |
Total distributions | | | (2.04 | ) | | | (1.70 | ) | | | (0.99 | ) | | | (0.43 | ) | | | (0.40 | ) |
| | | | |
Net asset value, end of year | | | $16.32 | | | | $15.97 | | | | $15.94 | | | | $17.02 | | | | $15.97 | |
| | | | |
| | | | | |
Total returnd | | | 16.15% | | | | 11.86% | | | | (0.62)% | | | | 9.40% | | | | 29.96% | |
| | | | | |
| Ratios to average net assets | | | | | | | | | | | | | | | | | | | | |
| | | | | |
Expenses before waiver and payments by affiliates | | | 0.72% | | | | 0.59% | | | | 0.58% | | | | 0.57% | | | | 0.58% | |
| | | | | |
Expenses net of waiver and payments by affiliates | | | 0.59% | e | | | 0.59% | e,f | | | 0.58% | | | | 0.57% | e | | | 0.58% | e |
| | | | | |
Net investment income | | | 2.21% | | | | 2.38% | | | | 2.74% | | | | 3.26%c | | | | 2.29% | |
| | | | | |
| Supplemental data | | | | | | | | | | | | | | | | | | | | |
| | | | | |
Net assets, end of year (000’s) | | | $35,865 | | | | $29,829 | | | | $144,663 | | | | $168,961 | | | | $175,860 | |
| | | | | |
Portfolio turnover rate | | | 33.91% | | | | 40.59%g | | | | 48.81% | | | | 20.54% | | | | 35.16% | |
aThe amount shown for a share outstanding throughout the period may not correlate with the Statement of Operations for the period due to the timing of sales and repurchases of the Fund’s shares in relation to income earned and/or fluctuating fair value of the investments of the Fund.
bBased on average daily shares outstanding.
cNet investment income per share includes approximately $0.12 per share related to income received in the form of special dividends in connection with certain Fund holdings. Excluding this amount, the ratio of net investment income to average net assets would have been 2.53%.
dTotal return does not include fees, charges or expenses imposed by the variable annuity and life insurance contracts for which Franklin Templeton Variable Insurance Products Trust serves as an underlying investment vehicle.
eBenefit of expense reduction rounds to less than 0.01%.
fBenefit of waiver and payments by affiliates rounds to less than 0.01%.
gExcludes the value of portfolio securities delivered as a result of a redemption in-kind. See Note 8.
| | | | |
| FGI-6 | | Annual Report | The accompanying notes are an integral part of these financial statements. | | |
FRANKLIN TEMPLETON VARIABLE INSURANCE PRODUCTS TRUST
FINANCIAL HIGHLIGHTS
Franklin Growth and Income VIP Fund (continued)
| | | | | | | | | | | | | | | | | | | | |
| | | Year Ended December 31, | |
| | | 2017 | | | 2016 | | | 2015 | | | 2014 | | | 2013 | |
Class 2 | | | | | | | | | | | | | | | | | | | | |
Per share operating performance
(for a share outstanding throughout the year) | | | | | | | | | | | | | | | | | | | | |
| | | | | |
Net asset value, beginning of year | | | $15.69 | | | | $15.68 | | | | $16.76 | | | | $15.73 | | | | $12.46 | |
| | | | |
| | | | | |
Income from investment operationsa: | | | | | | | | | | | | | | | | | | | | |
| | | | | |
Net investment incomeb | | | 0.31 | | | | 0.30 | | | | 0.40 | | | | 0.48 | c | | | 0.29 | |
| | | | | |
Net realized and unrealized gains (losses) | | | 2.00 | | | | 1.37 | | | | (0.54 | ) | | | 0.94 | | | | 3.35 | |
| | | | |
Total from investment operations | | | 2.31 | | | | 1.67 | | | | (0.14 | ) | | | 1.42 | | | | 3.64 | |
| | | | |
| | | | | |
| Less distributions from: | | | | | | | | | | | | | | | | | | | | |
| | | | | |
Net investment income | | | (0.97 | ) | | | (0.42 | ) | | | (0.56 | ) | | | (0.39 | ) | | | (0.37 | ) |
| | | | | |
Net realized gains | | | (1.01 | ) | | | (1.24 | ) | | | (0.38 | ) | | | — | | | | — | |
| | | | |
Total distributions | | | (1.98 | ) | | | (1.66 | ) | | | (0.94 | ) | | | (0.39 | ) | | | (0.37 | ) |
| | | | |
Net asset value, end of year | | | $16.02 | | | | $15.69 | | | | $15.68 | | | | $16.76 | | | | $15.73 | |
| | | | |
| | | | | |
Total returnd | | | 15.85% | | | | 11.62% | | | | (0.91)% | | | | 9.14% | | | | 29.60% | |
| | | | | |
| Ratios to average net assets | | | | | | | | | | | | | | | | | | | | |
| | | | | |
Expenses before waiver and payments by affiliates | | | 0.97% | | | | 0.84% | | | | 0.83% | | | | 0.82% | | | | 0.83% | |
| | | | | |
Expenses net of waiver and payments by affiliates | | | 0.84% | e | | | 0.84% | e,f | | | 0.83% | | | | 0.82% | e | | | 0.83% | e |
| | | | | |
Net investment income | | | 1.96% | | | | 2.13% | | | | 2.49% | | | | 3.01%c | | | | 2.04% | |
| | | | | |
| Supplemental data | | | | | | | | | | | | | | | | | | | | |
| | | | | |
Net assets, end of year (000’s) | | | $74,105 | | | | $69,474 | | | | $124,691 | | | | $138,191 | | | | $150,966 | |
| | | | | |
Portfolio turnover rate | | | 33.91% | | | | 40.59% | g | | | 48.81% | | | | 20.54% | | | | 35.16% | |
aThe amount shown for a share outstanding throughout the period may not correlate with the Statement of Operations for the period due to the timing of sales and repurchases of the Fund’s shares in relation to income earned and/or fluctuating fair value of the investments of the Fund.
bBased on average daily shares outstanding.
cNet investment income per share includes approximately $0.12 per share related to income received in the form of special dividends in connection with certain Fund holdings. Excluding this amount, the ratio of net investment income to average net assets would have been 2.28%.
dTotal return does not include fees, charges or expenses imposed by the variable annuity and life insurance contracts for which Franklin Templeton Variable Insurance Products Trust serves as an underlying investment vehicle.
eBenefit of expense reduction rounds to less than 0.01%.
fBenefit of waiver and payments by affiliates rounds to less than 0.01%.
gExcludes the value of portfolio securities delivered as a result of a redemption in-kind. See Note 8.
| | | | | | |
| | | The accompanying notes are an integral part of these financial statements. | Annual Report | | | FGI-7 | |
FRANKLIN TEMPLETON VARIABLE INSURANCE PRODUCTS TRUST
Statement of Investments, December 31, 2017
| | | | | | | | | | | | | | |
| Franklin Growth and Income VIP Fund | | | | | | | | | |
| | | | | Country | | | Shares | | | Value | |
| | Common Stocks 86.9% | | | | | | | | | | | | |
| | Consumer Discretionary 4.3% | | | | | | | | | | | | |
| | Comcast Corp., A | | | United States | | | | 22,000 | | | $ | 881,100 | |
| | Las Vegas Sands Corp. | | | United States | | | | 12,700 | | | | 882,523 | |
| | Lowe’s Cos. Inc. | | | United States | | | | 11,748 | | | | 1,091,859 | |
| | Newell Brands Inc. | | | United States | | | | 30,919 | | | | 955,397 | |
| | Target Corp. | | | United States | | | | 13,380 | | | | 873,045 | |
| | | | | | | | | | | | | | |
| | | | | | | | | | | | | 4,683,924 | |
| | | | | | | | | | | | | | |
| | Consumer Staples 8.3% | | | | | | | | | | | | |
| | Anheuser-Busch InBev SA/NV, ADR | | | Belgium | | | | 10,137 | | | | 1,130,884 | |
| | The Kraft Heinz Co. | | | United States | | | | 19,481 | | | | 1,514,843 | |
| | PepsiCo Inc. | | | United States | | | | 22,998 | | | | 2,757,920 | |
| | The Procter & Gamble Co. | | | United States | | | | 27,100 | | | | 2,489,948 | |
| | Wal-Mart Stores Inc. | | | United States | | | | 12,900 | | | | 1,273,875 | |
| | | | | | | | | | | | | | |
| | | | | | | | | | | | | 9,167,470 | |
| | | | | | | | | | | | | | |
| | Energy 8.7% | | | | | | | | | | | | |
| | Anadarko Petroleum Corp. | | | United States | | | | 8,218 | | | | 440,814 | |
| | Chevron Corp. | | | United States | | | | 22,868 | | | | 2,862,845 | |
| | Exxon Mobil Corp. | | | United States | | | | 18,277 | | | | 1,528,688 | |
| | Occidental Petroleum Corp. | | | United States | | | | 15,500 | | | | 1,141,730 | |
| | Royal Dutch Shell PLC, A, ADR | | | United Kingdom | | | | 19,113 | | | | 1,275,028 | |
| | Schlumberger Ltd. | | | United States | | | | 16,957 | | | | 1,142,732 | |
| | Suncor Energy Inc. | | | Canada | | | | 31,882 | | | | 1,170,707 | |
| | | | | | | | | | | | | | |
| | | | | | | | | | | | | 9,562,544 | |
| | | | | | | | | | | | | | |
| | Financials 20.4% | | | | | | | | | | | | |
| | Arthur J. Gallagher & Co. | | | United States | | | | 17,166 | | | | 1,086,264 | |
| | Bank of America Corp. | | | United States | | | | 66,300 | | | | 1,957,176 | |
| | BB&T Corp. | | | United States | | | | 36,176 | | | | 1,798,671 | |
| | BlackRock Inc. | | | United States | | | | 5,361 | | | | 2,753,999 | |
| | The Charles Schwab Corp. | | | United States | | | | 4,703 | | | | 241,593 | |
| | JPMorgan Chase & Co. | | | United States | | | | 43,000 | | | | 4,598,420 | |
| | MetLife Inc. | | | United States | | | | 32,500 | | | | 1,643,200 | |
| | Morgan Stanley | | | United States | | | | 47,937 | | | | 2,515,254 | |
| | U.S. Bancorp | | | United States | | | | 43,355 | | | | 2,322,961 | |
| | Wells Fargo & Co. | | | United States | | | | 57,250 | | | | 3,473,358 | |
| | | | | | | | | | | | | | |
| | | | | | | | | | | | | 22,390,896 | |
| | | | | | | | | | | | | | |
| | Health Care 9.1% | | | | | | | | | | | | |
| | Eli Lilly & Co. | | | United States | | | | 16,137 | | | | 1,362,931 | |
| | Johnson & Johnson | | | United States | | | | 7,265 | | | | 1,015,066 | |
| | Medtronic PLC | | | United States | | | | 26,181 | | | | 2,114,115 | |
| | Merck & Co. Inc. | | | United States | | | | 27,400 | | | | 1,541,798 | |
| | Pfizer Inc. | | | United States | | | | 60,963 | | | | 2,208,080 | |
| | UnitedHealth Group Inc. | | | United States | | | | 8,100 | | | | 1,785,726 | |
| | | | | | | | | | | | | | |
| | | | | | | | | | | | | 10,027,716 | |
| | | | | | | | | | | | | | |
| | Industrials 15.4% | | | | | | | | | | | | |
| | Cummins Inc. | | | United States | | | | 10,969 | | | | 1,937,564 | |
| | Deere & Co. | | | United States | | | | 5,242 | | | | 820,425 | |
| | General Electric Co. | | | United States | | | | 112,332 | | | | 1,960,193 | |
| | Illinois Tool Works Inc. | | | United States | | | | 10,411 | | | | 1,737,075 | |
| | Lockheed Martin Corp. | | | United States | | | | 5,969 | | | | 1,916,348 | |
| | Norfolk Southern Corp. | | | United States | | | | 7,500 | | | | 1,086,750 | |
| | Raytheon Co. | | | United States | | | | 12,016 | | | | 2,257,206 | |
FRANKLIN TEMPLETON VARIABLE INSURANCE PRODUCTS TRUST
STATEMENT OF INVESTMENTS
Franklin Growth and Income VIP Fund (continued)
| | | | | | | | | | | | | | |
| | | | | Country | | | Shares | | | Value | |
| | Common Stocks (continued) | | | | | | | | | | | | |
| | Industrials (continued) | | | | | | | | | | | | |
| | Republic Services Inc. | | | United States | | | | 27,180 | | | $ | 1,837,640 | |
| | Stanley Black & Decker Inc. | | | United States | | | | 7,432 | | | | 1,261,136 | |
| | United Parcel Service Inc., B | | | United States | | | | 6,917 | | | | 824,161 | |
| | United Technologies Corp. | | | United States | | | | 10,134 | | | | 1,292,794 | |
| | | | | | | | | | | | | | |
| | | | | | | | | | | | | 16,931,292 | |
| | | | | | | | | | | | | | |
| | Information Technology 11.4% | | | | | | | | | | | | |
| | Apple Inc. | | | United States | | | | 10,532 | | | | 1,782,331 | |
| | Broadcom Ltd. | | | United States | | | | 2,241 | | | | 575,713 | |
| | Cisco Systems Inc. | | | United States | | | | 45,289 | | | | 1,734,569 | |
| | Intel Corp. | | | United States | | | | 26,157 | | | | 1,207,407 | |
| | Microsoft Corp. | | | United States | | | | 43,876 | | | | 3,753,153 | |
| | Oracle Corp. | | | United States | | | | 27,629 | | | | 1,306,299 | |
| | Texas Instruments Inc. | | | United States | | | | 20,796 | | | | 2,171,934 | |
| | | | | | | | | | | | | | |
| | | | | | | | | | | | | 12,531,406 | |
| | | | | | | | | | | | | | |
| | Materials 4.3% | | | | | | | | | | | | |
| | BASF SE | | | Germany | | | | 12,837 | | | | 1,412,964 | |
| | DowDuPont Inc. | | | United States | | | | 24,573 | | | | 1,750,089 | |
| | International Paper Co. | | | United States | | | | 26,620 | | | | 1,542,363 | |
| | | | | | | | | | | | | | |
| | | | | | | | | | | | | 4,705,416 | |
| | | | | | | | | | | | | | |
| | Real Estate 1.3% | | | | | | | | | | | | |
| | Host Hotels & Resorts Inc. | | | United States | | | | 74,141 | | | | 1,471,699 | |
| | | | | | | | | | | | | | |
| | Telecommunication Services 2.0% | | | | | | | | | | | | |
| | Rogers Communications Inc., B | | | Canada | | | | 8,544 | | | | 435,146 | |
| | TELUS Corp. | | | Canada | | | | 15,000 | | | | 568,213 | |
| | Verizon Communications Inc. | | | United States | | | | 23,610 | | | | 1,249,677 | |
| | | | | | | | | | | | | | |
| | | | | | | | | | | | | 2,253,036 | |
| | | | | | | | | | | | | | |
| | Utilities 1.7% | | | | | | | | | | | | |
| | Dominion Energy Inc. | | | United States | | | | 3,004 | | | | 243,504 | |
| | Xcel Energy Inc. | | | United States | | | | 33,496 | | | | 1,611,493 | |
| | | | | | | | | | | | | 1,854,997 | |
| | | | | | | | | | | | | | |
| | | | |
| | Total Common Stocks (Cost $63,812,518) | | | | | | | | | | | 95,580,396 | |
| | | | | | | | | | | | | | |
| a | | Equity-Linked Securities 8.0% | | | | | | | | | | | | |
| | Consumer Discretionary 1.2% | | | | | | | | | | | | |
| b | | Deutsche Bank AG into Amazon.com Inc., 5.00%, 144A | | | United States | | | | 1,100 | | | | 1,289,821 | |
| | | | | | | | | | | | | | |
| | Energy 1.2% | | | | | | | | | | | | |
| b | | Citigroup Global Markets Holdings Inc. into Anadarko Petroleum Corp. , 6.00%, 144A | | | United States | | | | 17,000 | | | | 897,202 | |
| b | | Merrill Lynch International & Co. CV into Schlumberger Ltd., 7.00%, 144A | | | United States | | | | 6,000 | | | | 413,258 | |
| | | | | | | | | | | | | | |
| | | | | | | | | | | | | 1,310,460 | |
| | | | | | | | | | | | | | |
| | Financials 2.0% | | | | | | | | | | | | |
| b | | Deutsche Bank AG into Bank of America Corp., 6.50%, 144A | | | United States | | | | 44,000 | | | | 1,193,896 | |
| b | | UBS AG London into The Charles Schwab Corp., 6.50%, 144A | | | United States | | | | 20,000 | | | | 1,028,997 | |
| | | | | | | | | | | | | | |
| | | | | | | | | | | | | 2,222,893 | |
| | | | | | | | | | | | | | |
FRANKLIN TEMPLETON VARIABLE INSURANCE PRODUCTS TRUST
STATEMENT OF INVESTMENTS
Franklin Growth and Income VIP Fund (continued)
| | | | | | | | | | | | | | |
| | | | | Country | | | Shares | | | Value | |
| a | | Equity-Linked Securities (continued) | | | | | | | | | | | | |
| | | Information Technology 3.6% | | | | | | | | | |
| b | | Barclays Bank PLC into Broadcom Ltd., 7.50%, 144A | | | United States | | | | 4,500 | | | $ | 1,104,345 | |
| b | | Goldman Sachs International into Apple Inc., 6.00%, 144A | | | United States | | | | 7,000 | | | | 1,151,571 | |
| b | | UBS AG London into Intel Corp., 7.00%, 144A | | | United States | | | | 40,000 | | | | 1,713,380 | |
| | | | | | | | | | | | | | |
| | | | |
| | | | | | | | | | | | | 3,969,296 | |
| | | | | | | | | | | | | | |
| | | | |
| | Total Equity-Linked Securities (Cost $8,401,041) | | | | | | | | | | | 8,792,470 | |
| | | | | | | | | | | | | | |
| | Convertible Preferred Stocks 2.9% | | | | | | | | | | | | |
| | Health Care 1.1% | | | | | | | | | | | | |
| | Becton Dickinson and Co., 6.125%, cvt. pfd., A | | | United States | | | | 22,000 | | | | 1,273,800 | |
| | | | | | | | | | | | | | |
| | Utilities 1.8% | | | | | | | | | | | | |
| | NextEra Energy Inc., 6.371%, cvt. pfd | | | United States | | | | 28,277 | | | | 1,967,513 | |
| | | | | | | | | | | | | | |
| | | | |
| | Total Convertible Preferred Stocks (Cost $2,585,809) | | | | | | | | | | | 3,241,313 | |
| | | | | | | | | | | | | | |
| | | | |
| | Total Investments before Short Term Investments
(Cost $74,799,368) | | | | | | | | | | | 107,614,179 | |
| | | | | | | | | | | | | | |
| | | | |
| | | | | | | | Principal Amount | | | | |
| | Short Term Investments (Cost $2,277,825) 2.1% | | | | | | | | | | | | |
| | | Repurchase Agreements 2.1% | | | | | | | | | |
| c | | Joint Repurchase Agreement, 1.377%, 1/02/18 (Maturity Value $2,278,173) | | | | | | | | | | | | |
| | BNP Paribas Securities Corp. (Maturity Value $371,365) | | | | | | | | | | | | |
| | Deutsche Bank Securities Inc. (Maturity Value $413,921) | | | | | | | | | | | | |
| | HSBC Securities (USA) Inc. (Maturity Value $1,485,460) | | | | | | | | | | | | |
| | Merrill Lynch, Pierce, Fenner & Smith Inc. (Maturity Value $7,427) | | | | | | | | | | | | |
| | Collateralized by U.S. Government Agency Securities, 0.00% - 1.98%, 7/27/18 -11/22/21; U.S. Treasury Note, 1.25% - 2.00%, 12/31/18 - 4/30/22; and U.S. Treasury Note, Index Linked, 0.125%, 4/15/18 (valued at $2,323,560) | | | United States | | | $ | 2,277,825 | | | | 2,277,825 | |
| | | | | | | | | | | | | | |
| | Total Investments (Cost $77,077,193) 99.9% | | | | | | | | | | | 109,892,004 | |
| | Other Assets, less Liabilities 0.1% | | | | | | | | | | | 77,194 | |
| | | | | | | | | | | | | | |
| | Net Assets 100.0% | | | | | | | | | | $ | 109,969,198 | |
| | | | | | | | | | | | | | |
See Abbreviations on page FGI-21.
aSee Note 1(d) regarding equity-linked securities.
bSecurity was purchased pursuant to Rule 144A under the Securities Act of 1933 and may be sold in transactions exempt from registration only to qualified institutional buyers or in a public offering registered under the Securities Act of 1933. These securities have been deemed liquid under guidelines approved by the Trust’s Board of Trustees. At December 31, 2017, the aggregate value of these securities was $8,792,470, representing 8.0% of net assets.
cSee Note 1(c) regarding joint repurchase agreement.
| | | | |
| FGI-10 | | Annual Report | | The accompanying notes are an integral part of these financial statements. |
FRANKLIN TEMPLETON VARIABLE INSURANCE PRODUCTS TRUST
Financial Statements
Statement of Assets and Liabilities
December 31, 2017
| | | | |
| | | Franklin Growth
and Income VIP Fund | |
Assets: | | | | |
Investments in securities: | | | | |
Cost - Unaffiliated issuers | | $ | 74,799,368 | |
| | | | |
Cost - Unaffiliated repurchase agreements | | | 2,277,825 | |
Value - Unaffiliated issuers | | $ | 107,614,179 | |
Value - Unaffiliated repurchase agreements | | | 2,277,825 | |
Cash | | | 3,922 | |
Receivables: | | | | |
Investment securities sold | | | 167,583 | |
Capital shares sold | | | 13,188 | |
Dividends | | | 186,102 | |
Other assets | | | 12 | |
| | | | |
Total assets | | | 110,262,811 | |
| | | | |
Liabilities: | | | | |
Payables: | | | | |
Capital shares redeemed | | | 155,514 | |
Management fees | | | 45,817 | |
Distribution fees | | | 31,327 | |
Reports to shareholders | | | 28,755 | |
Professional fees | | | 30,443 | |
Accrued expenses and other liabilities | | | 1,757 | |
| | | | |
Total liabilities | | | 293,613 | |
| | | | |
Net assets, at value | | $ | 109,969,198 | |
| | | | |
Net assets consist of: | | | | |
Paid-in capital | | | $71,837,393 | |
Undistributed net investment income | | | 2,575,264 | |
Net unrealized appreciation (depreciation) | | | 32,814,935 | |
Accumulated net realized gain (loss) | | | 2,741,606 | |
| | | | |
Net assets, at value | | $ | 109,969,198 | |
| | | | |
| |
| Class 1: | | | | |
Net assets, at value | | $ | 35,864,582 | |
| | | | |
Shares outstanding | | | 2,197,376 | |
| | | | |
Net asset value and maximum offering price per share | | $ | 16.32 | |
| | | | |
| |
| Class 2: | | | | |
Net assets, at value | | $ | 74,104,616 | |
| | | | |
Shares outstanding | | | 4,625,741 | |
| | | | |
Net asset value and maximum offering price per share | | $ | 16.02 | |
| | | | |
| | | | | | |
| | | The accompanying notes are an integral part of these financial statements. | Annual Report | | | FGI-11 | |
FRANKLIN TEMPLETON VARIABLE INSURANCE PRODUCTS TRUST
FINANCIAL STATEMENTS
Statement of Operations
for the year ended December 31, 2017
| | | | |
| | | Franklin Growth
and Income
VIP Fund | |
Investment income: | | | | |
Dividends: (net of foreign taxes)* | | | | |
Unaffiliated issuers | | $ | 2,956,889 | |
Interest: | | | | |
Unaffiliated issuers | | | 28,935 | |
| | | | |
Total investment income | | | 2,985,824 | |
| | | | |
Expenses: | | | | |
Management fees (Note 3a) | | | 657,370 | |
Distribution fees: (Note 3c) | | | | |
Class 2 | | | 181,948 | |
Custodian fees (Note 4) | | | 1,256 | |
Reports to shareholders | | | 54,096 | |
Professional fees | | | 41,388 | |
Trustees’ fees and expenses | | | 457 | |
Other | | | 15,817 | |
| | | | |
Total expenses | | | 952,332 | |
Expense reductions (Note 4) | | | (25 | ) |
Expenses waived/paid by affiliates (Note 3e) | | | (137,782 | ) |
| | | | |
Net expenses | | | 814,525 | |
| | | | |
Net investment income | | | 2,171,299 | |
| | | | |
Realized and unrealized gains (losses): | | | | |
Net realized gain (loss) from: | | | | |
Investments: | | | | |
Unaffiliated issuers | | | 3,241,910 | |
Realized gain distributions from REITs | | | 30,229 | |
Foreign currency transactions | | | 6,436 | |
| | | | |
Net realized gain (loss) | | | 3,278,575 | |
| | | | |
Net change in unrealized appreciation (depreciation) on: | | | | |
Investments: | | | | |
Unaffiliated issuers | | | 10,407,960 | |
Translation of other assets and liabilities denominated in foreign currencies | | | 4,089 | |
| | | | |
Net change in unrealized appreciation (depreciation) | | | 10,412,049 | |
| | | | |
Net realized and unrealized gain (loss) | | | 13,690,624 | |
| | | | |
Net increase (decrease) in net assets resulting from operations | | $ | 15,861,923 | |
| | | | |
| |
*Foreign taxes withheld on dividends | | $ | 35,986 | |
| | | | |
| FGI-12 | | Annual Report | | The accompanying notes are an integral part of these financial statements. |
FRANKLIN TEMPLETON VARIABLE INSURANCE PRODUCTS TRUST
FINANCIAL STATEMENTS
Statements of Changes in Net Assets
| | | | | | | | |
| | | Franklin Growth and Income VIP Fund | |
| | | Year Ended December 31, | |
| | | 2017 | | | 2016 | |
Increase (decrease) in net assets: | | | | | | | | |
Operations: | | | | | | | | |
Net investment income | | $ | 2,171,299 | | | $ | 5,508,394 | |
Net realized gain (loss) | | | 3,278,575 | | | | 45,171,232 | |
Net change in unrealized appreciation (depreciation) | | | 10,412,049 | | | | (27,857,712 | ) |
| | | | | | | | |
Net increase (decrease) in net assets resulting from operations | | | 15,861,923 | | | | 22,821,914 | |
| | | | | | | | |
Distributions to shareholders from: | | | | | | | | |
Net investment income: | | | | | | | | |
Class 1 | | | (2,052,142 | ) | | | (4,525,425 | ) |
Class 2 | | | (4,282,950 | ) | | | (3,230,836 | ) |
Net realized gains: | | | | | | | | |
Class 1 | | | (2,005,313 | ) | | | (12,121,008 | ) |
Class 2 | | | (4,458,397 | ) | | | (9,525,503 | ) |
| | | | | | | | |
Total distributions to shareholders | | | (12,798,802 | ) | | | (29,402,772 | ) |
| | | | | | | | |
Capital share transactions: (Note 2) | | | | | | | | |
Class 1 | | | 5,020,919 | | | | (110,461,648 | ) |
Class 2 | | | 2,582,809 | | | | (53,009,745 | ) |
| | | | | | | | |
Total capital share transactions | | | 7,603,728 | | | | (163,471,393 | ) |
| | | | | | | | |
Net increase (decrease) in net assets | | | 10,666,849 | | | | (170,052,251 | ) |
Net assets: | | | | | | | | |
Beginning of year | | | 99,302,349 | | | | 269,354,600 | |
| | | | | | | | |
End of year | | $ | 109,969,198 | | | $ | 99,302,349 | |
| | | | | | | | |
Undistributed net investment income included in net assets: | | | | | | | | |
End of year | | $ | 2,575,264 | | | $ | 6,282,159 | |
| | | | | | | | |
| | | | | | |
| | | The accompanying notes are an integral part of these financial statements. | Annual Report | | | FGI-13 | |
FRANKLIN TEMPLETON VARIABLE INSURANCE PRODUCTS TRUST
Notes to Financial Statements
Franklin Growth and Income VIP Fund
1. Organization and Significant Accounting Policies
Franklin Templeton Variable Insurance Products Trust (Trust) is registered under the Investment Company Act of 1940 (1940 Act) as an open-end management investment company, consisting of eighteen separate funds and applies the specialized accounting and reporting guidance in U.S. Generally Accepted Accounting Principles (U.S. GAAP). Franklin Growth and Income VIP Fund (Fund) is included in this report. Shares of the Fund are generally sold only to insurance company separate accounts to fund the benefits of variable life insurance policies or variable annuity contracts. The Fund offers two classes of shares: Class 1 and Class 2. Each class of shares may differ by its distribution fees, voting rights on matters affecting a single class and its exchange privilege.
The following summarizes the Fund’s significant accounting policies.
a. Financial Instrument Valuation
The Fund’s investments in financial instruments are carried at fair value daily. Fair value is the price that would be received to sell an asset or paid to transfer a liability in an orderly transaction between market participants on the measurement date. The Fund calculates the net asset value (NAV) per share as of 4 p.m. Eastern time each day the New York Stock Exchange (NYSE) is open for trading. Under compliance policies and procedures approved by the Trust’s Board of Trustees (the Board), the Fund’s administrator has responsibility for oversight of valuation, including leading the cross-functional Valuation Committee (VC). The VC provides administration and oversight of the Fund’s valuation policies and procedures, which are approved annually by the Board. Among other things, these procedures allow the Fund to utilize independent pricing services, quotations from securities and financial instrument dealers, and other market sources to determine fair value.
Equity securities listed on an exchange or on the NASDAQ National Market System are valued at the last quoted sale price or the official closing price of the day, respectively. Foreign equity securities are valued as of the close of trading on the foreign stock exchange on which the security is primarily traded, or as of 4 p.m. Eastern time. The value is then converted into its U.S. dollar equivalent at the foreign exchange rate in effect at 4 p.m. Eastern time on the day that the value of the security is determined. Over-the-counter (OTC) securities are
valued within the range of the most recent quoted bid and ask prices. Securities that trade in multiple markets or on multiple exchanges are valued according to the broadest and most representative market. Certain equity securities are valued based upon fundamental characteristics or relationships to similar securities.
Investments in repurchase agreements are valued at cost, which approximates fair value.
The Fund has procedures to determine the fair value of financial instruments for which market prices are not reliable or readily available. Under these procedures, the VC convenes on a regular basis to review such financial instruments and considers a number of factors, including significant unobservable valuation inputs, when arriving at fair value. The VC primarily employs a market-based approach which may use related or comparable assets or liabilities, recent transactions, market multiples, book values, and other relevant information for the investment to determine the fair value of the investment. An income-based valuation approach may also be used in which the anticipated future cash flows of the investment are discounted to calculate fair value. Discounts may also be applied due to the nature or duration of any restrictions on the disposition of the investments. Due to the inherent uncertainty of valuations of such investments, the fair values may differ significantly from the values that would have been used had an active market existed. The VC employs various methods for calibrating these valuation approaches including a regular review of key inputs and assumptions, transactional back-testing or disposition analysis, and reviews of any related market activity.
Trading in securities on foreign securities stock exchanges and OTC markets may be completed before 4 p.m. Eastern time. In addition, trading in certain foreign markets may not take place on every Fund’s business day. Occasionally, events occur between the time at which trading in a foreign security is completed and 4 p.m. Eastern time that might call into question the reliability of the value of a portfolio security held by the Fund. As a result, differences may arise between the value of the Fund’s portfolio securities as determined at the foreign market close and the latest indications of value at 4 p.m. Eastern time. In order to minimize the potential for these differences, the VC monitors price movements following the close of trading in foreign stock markets through a series of country specific market proxies (such as baskets of American Depositary Receipts, futures contracts and exchange traded funds). These price movements are measured against
FRANKLIN TEMPLETON VARIABLE INSURANCE PRODUCTS TRUST
NOTES TO FINANCIAL STATEMENTS
Franklin Growth and Income VIP Fund (continued)
established trigger thresholds for each specific market proxy to assist in determining if an event has occurred that may call into question the reliability of the values of the foreign securities held by the Fund. If such an event occurs, the securities may be valued using fair value procedures, which may include the use of independent pricing services.
When the last day of the reporting period is a non-business day, certain foreign markets may be open on those days that the Fund’s NAV is not calculated, which could result in differences between the value of the Fund’s portfolio securities on the last business day and the last calendar day of the reporting period. Any significant security valuation changes due to an open foreign market are adjusted and reflected by the Fund for financial reporting purposes.
b. Foreign Currency Translation
Portfolio securities and other assets and liabilities denominated in foreign currencies are translated into U.S. dollars based on the exchange rate of such currencies against U.S. dollars on the date of valuation. The Fund may enter into foreign currency exchange contracts to facilitate transactions denominated in a foreign currency. Purchases and sales of securities, income and expense items denominated in foreign currencies are translated into U.S. dollars at the exchange rate in effect on the transaction date. Portfolio securities and assets and liabilities denominated in foreign currencies contain risks that those currencies will decline in value relative to the U.S. dollar. Occasionally, events may impact the availability or reliability of foreign exchange rates used to convert the U.S. dollar equivalent value. If such an event occurs, the foreign exchange rate will be valued at fair value using procedures established and approved by the Board.
The Fund does not separately report the effect of changes in foreign exchange rates from changes in market prices on securities held. Such changes are included in net realized and unrealized gain or loss from investments in the Statement of Operations.
Realized foreign exchange gains or losses arise from sales of foreign currencies, currency gains or losses realized between the trade and settlement dates on securities transactions and the difference between the recorded amounts of dividends, interest, and foreign withholding taxes and the U.S. dollar equivalent of the amounts actually received or paid. Net unrealized foreign exchange gains and losses arise from changes in foreign
exchange rates on foreign denominated assets and liabilities other than investments in securities held at the end of the reporting period.
c. Joint Repurchase Agreement
The Fund enters into a joint repurchase agreement whereby its uninvested cash balance is deposited into a joint cash account with other funds managed by the investment manager or an affiliate of the investment manager and is used to invest in one or more repurchase agreements. The value and face amount of the joint repurchase agreement are allocated to the funds based on their pro-rata interest. A repurchase agreement is accounted for as a loan by the Fund to the seller, collateralized by securities which are delivered to the Fund’s custodian. The fair value, including accrued interest, of the initial collateralization is required to be at least 102% of the dollar amount invested by the funds, with the value of the underlying securities marked to market daily to maintain coverage of at least 100%. Repurchase agreements are subject to the terms of Master Repurchase Agreements (MRAs) with approved counterparties (sellers). The MRAs contain various provisions, including but not limited to events of default and maintenance of collateral for repurchase agreements. In the event of default by either the seller or the Fund, certain MRAs may permit the non-defaulting party to net and close-out all transactions, if any, traded under such agreements. The Fund may sell securities it holds as collateral and apply the proceeds towards the repurchase price and any other amounts owed by the seller to the Fund in the event of default by the seller. This could involve costs or delays in addition to a loss on the securities if their value falls below the repurchase price owed by the seller. The joint repurchase agreement held by the Fund at year end, as indicated in the Statement of Investments, had been entered into on December 29, 2017.
d. Equity-Linked Securities
The Fund invests in equity-linked securities. Equity-linked securities are hybrid financial instruments that generally combine both debt and equity characteristics into a single note form. Income received from equity-linked securities is recorded as realized gains in the Statement of Operations and may be based on the performance of an underlying equity security, an equity index, or an option position. The risks of investing in equity-linked securities include unfavorable price movements in the underlying security and the credit risk of the issuing financial institution. There may be no guarantee of a return of
FRANKLIN TEMPLETON VARIABLE INSURANCE PRODUCTS TRUST
NOTES TO FINANCIAL STATEMENTS
Franklin Growth and Income VIP Fund (continued)
1. Organization and Significant Accounting Policies
(continued)
d. Equity-Linked Securities (continued)
principal with equity-linked securities and the appreciation potential may be limited. Equity-linked securities may be more volatile and less liquid than other investments held by the Fund.
e. Income and Deferred Taxes
It is the Fund’s policy to qualify as a regulated investment company under the Internal Revenue Code. The Fund intends to distribute to shareholders substantially all of its taxable income and net realized gains to relieve it from federal income and if applicable, excise taxes. As a result, no provision for U.S. federal income taxes is required.
The Fund may be subject to foreign taxation related to income received, capital gains on the sale of securities and certain foreign currency transactions in the foreign jurisdictions in which it invests. Foreign taxes, if any, are recorded based on the tax regulations and rates that exist in the foreign markets in which the Fund invests. When a capital gain tax is determined to apply, the Fund records an estimated deferred tax liability in an amount that would be payable if the securities were disposed of on the valuation date.
As a result of several court cases, in certain countries across the European Union, the Fund filed additional tax reclaims for previously withheld taxes on dividends earned in those countries (EU reclaims). These additional filings are subject to various administrative proceedings by the local jurisdictions’ tax authorities within the European Union, as well as a number of related judicial proceedings. Income recognized, if any, for EU reclaims is reflected as other income in the Statement of Operations and any related receivable, if any, is reflected as European Union tax reclaims in the Statement of Assets and Liabilities. When uncertainty exists as to the ultimate resolution of these proceedings, the likelihood of receipt of these EU reclaims, and the potential timing of payment, no amounts are reflected in the financial statements. For U.S. income tax purposes, when EU reclaims are received by the Fund and the Fund previously passed foreign tax credit on to its shareholders, the Fund must either amend historic tax reporting to shareholders or enter into a closing agreement with the Internal Revenue Service (IRS) in order to pay the associated tax liability on behalf of the Fund’s shareholders.
The Fund may recognize an income tax liability related to its uncertain tax positions under U.S. GAAP when the uncertain tax position has a less than 50% probability that it will be sustained upon examination by the tax authorities based on its technical merits. As of December 31, 2017, the Fund has determined that no tax liability is required in its financial statements related to uncertain tax positions for any open tax years (or expected to be taken in future tax years). Open tax years are those that remain subject to examination and are based on the statute of limitations in each jurisdiction in which the Fund invests.
f. Security Transactions, Investment Income, Expenses and Distributions
Security transactions are accounted for on trade date. Realized gains and losses on security transactions are determined on a specific identification basis. Interest income and estimated expenses are accrued daily. Dividend income and realized gain distributions are recorded on the ex-dividend date except for certain dividends from securities where the dividend rate is not available. In such cases, the dividend is recorded as soon as the information is received by the Fund. Distributions to shareholders are recorded on the ex-dividend date. Distributable earnings are determined according to income tax regulations (tax basis) and may differ from earnings recorded in accordance with U.S. GAAP. These differences may be permanent or temporary. Permanent differences are reclassified among capital accounts to reflect their tax character. These reclassifications have no impact on net assets or the results of operations. Temporary differences are not reclassified, as they may reverse in subsequent periods.
Common expenses incurred by the Trust are allocated among the Funds based on the ratio of net assets of each Fund to the combined net assets of the Trust. Fund specific expenses are charged directly to the Fund that incurred the expense.
Realized and unrealized gains and losses and net investment income, excluding class specific expenses, are allocated daily to each class of shares based upon the relative proportion of net assets of each class. Differences in per share distributions by class are generally due to differences in class specific expenses.
g. Accounting Estimates
The preparation of financial statements in accordance with U.S. GAAP requires management to make estimates and assumptions that affect the reported amounts of assets and
FRANKLIN TEMPLETON VARIABLE INSURANCE PRODUCTS TRUST
NOTES TO FINANCIAL STATEMENTS
Franklin Growth and Income VIP Fund (continued)
liabilities at the date of the financial statements and the amounts of income and expenses during the reporting period. Actual results could differ from those estimates.
h. Guarantees and Indemnifications
Under the Trust’s organizational documents, its officers and trustees are indemnified by the Trust against certain liabilities arising out of the performance of their duties to the Trust.
Additionally, in the normal course of business, the Trust, on behalf of the Fund, enters into contracts with service providers that contain general indemnification clauses. The Trust’s maximum exposure under these arrangements is unknown as this would involve future claims that may be made against the Trust that have not yet occurred. Currently, the Trust expects the risk of loss to be remote.
2. Shares of Beneficial Interest
At December 31, 2017, there were an unlimited number of shares authorized (without par value). Transactions in the Fund’s shares were as follows:
| | | | | | | | | | | | | | | | | | | | |
| | | Year Ended December 31, | |
| | | 2017 | | | | | | 2016 | |
| | | Shares | | | Amount | | | | | | Shares | | | Amount | |
| | | | | |
| Class 1 Shares: | | | | | | | | | | | | | | | | | | | | |
Shares sold | | | 273,799 | | | $ | 4,396,906 | | | | | | | | 1,575,501 | | | $ | 23,479,446 | |
Shares issued in reinvestment of distributions | | | 272,130 | | | | 4,057,455 | | | | | | | | 1,140,948 | | | | 16,646,433 | |
Shares redeemed in-kind (Note 8) | | | — | | | | — | | | | | | | | (8,891,023 | ) | | | (134,564,738 | ) |
Shares redeemed | | | (216,463 | ) | | | (3,433,442 | ) | | | | | | | (1,034,562 | ) | | | (16,022,789 | ) |
| | | | |
Net increase (decrease) | | | 329,466 | | | $ | 5,020,919 | | | | | | | | (7,209,136 | ) | | $ | (110,461,648 | ) |
| | | | |
| Class 2 Shares: | | | | | | | | | | | | | | | | | | | | |
Shares sold | | | 304,558 | | | $ | 4,865,372 | | | | | | | | 781,106 | | | $ | 11,854,554 | |
Shares issued in reinvestment of distributions | | | 596,679 | | | | 8,741,347 | | | | | | | | 888,944 | | | | 12,756,339 | |
Shares redeemed in-kind (Note 8) | | | — | | | | — | | | | | | | | (4,019,533 | ) | | | (59,794,978 | ) |
Shares redeemed | | | (704,129 | ) | | | (11,023,910 | ) | | | | | | | (1,173,608 | ) | | | (17,825,660 | ) |
| | | | |
Net increase (decrease) | | | 197,108 | | | $ | 2,582,809 | | | | | | | | (3,523,091 | ) | | $ | (53,009,745 | ) |
| | | | |
3. Transactions with Affiliates
Franklin Resources, Inc. is the holding company for various subsidiaries that together are referred to as Franklin Templeton Investments. Certain officers and trustees of the Fund are also officers and/or directors of the following subsidiaries:
| | |
| Subsidiary | | Affiliation |
Franklin Advisers, Inc. (Advisers) | | Investment manager |
Franklin Templeton Services, LLC (FT Services) | | Administrative manager |
Franklin Templeton Distributors, Inc. (Distributors) | | Principal underwriter |
Franklin Templeton Investor Services, LLC (Investor Services) | | Transfer agent |
FRANKLIN TEMPLETON VARIABLE INSURANCE PRODUCTS TRUST
NOTES TO FINANCIAL STATEMENTS
Franklin Growth and Income VIP Fund (continued)
3. Transactions with Affiliates (continued)
a. Management Fees
The Fund pays an investment management fee to Advisers based on the average daily net assets of the Fund as follows:
| | |
| Annualized Fee Rate | | Net Assets |
0.625% | | Up to and including $100 million |
0.500% | | Over $100 million, up to and including $250 million |
0.450% | | Over $250 million, up to and including $7.5 billion |
0.440% | | Over $7.5 billion, up to and including $10 billion |
0.430% | | Over $10 billion, up to and including $12.5 billion |
0.420% | | Over $12.5 billion, up to and including $15 billion |
0.400% | | In excess of $15 billion |
For the year ended December 31, 2017, the gross effective investment management fee rate was 0.617% of the Fund’s average daily net assets.
b. Administrative Fees
Under an agreement with Advisers, FT Services provides administrative services to the Fund. The fee is paid by Advisers based on the Fund’s average daily net assets, and is not an additional expense of the Fund.
c. Distribution Fees
The Board has adopted a distribution plan for Class 2 shares pursuant to Rule 12b-1 under the 1940 Act. Under the Fund’s compensation distribution plan, the Fund pays Distributors for costs incurred in connection with the servicing, sale and distribution of the Fund’s shares up to 0.35% per year of its average daily net assets. The Board has agreed to limit the current rate to 0.25% per year for Class 2. The plan year, for purposes of monitoring compliance with the maximum annual plan rate, is February 1 through January 31.
d. Transfer Agent Fees
Investor Services, under terms of an agreement, performs shareholder servicing for the Fund and is not paid by the Fund for the services.
e. Waiver and Expense Reimbursements
Advisers has contractually agreed in advance to waive or limit its fees and to assume as its own expense certain expenses otherwise payable by the Fund so that the expenses (excluding distribution fees and acquired fund fees and expenses) for each class of the Fund do not exceed 0.64% based on the average net assets of each class (other than certain non-routine expenses or costs, including those relating to litigation, indemnification, reorganizations, and liquidations) until April 30, 2018. Total expenses waived or paid are not subject to recapture subsequent to the Fund’s fiscal year end.
In addition, Advisers has voluntarily agreed to waive or limit its fees and to assume as its own expense certain expenses otherwise payable by the Fund so that the expenses (excluding distribution fees and acquired fund fees and expenses) for each class of the Fund do not exceed 0.59% based on the average net assets of each class (other than certain non-routine expenses or costs, including those relating to litigation, indemnification, reorganizations, and liquidations). This waiver is voluntary and may be modified or discontinued by Advisers at any time, and without further notice.
FRANKLIN TEMPLETON VARIABLE INSURANCE PRODUCTS TRUST
NOTES TO FINANCIAL STATEMENTS
Franklin Growth and Income VIP Fund (continued)
4. Expense Offset Arrangement
The Fund has entered into an arrangement with its custodian whereby credits realized as a result of uninvested cash balances are used to reduce a portion of the Fund’s custodian expenses. During the year ended December 31, 2017, the custodian fees were reduced as noted in the Statement of Operations.
5. Income Taxes
The tax character of distributions paid during the years ended December 31, 2017 and 2016, was as follows:
| | | | | | | | |
| | | 2017 | | | 2016 | |
Distributions paid from: | | | | | | | | |
Ordinary income | | $ | 7,912,641 | | | $ | 7,756,261 | |
Long term capital gain | | | 4,886,161 | | | | 21,646,511 | |
| | | | |
| | $ | 12,798,802 | | | $ | 29,402,772 | |
| | | | |
At December 31, 2017, the cost of investments, net unrealized appreciation (depreciation), undistributed ordinary income and undistributed long term capital gains for income tax purposes were as follows:
| | | | |
Cost of investments | | $ | 77,184,218 | |
| | | | |
Unrealized appreciation | | $ | 33,958,240 | |
Unrealized depreciation | | | (1,250,454 | ) |
| | | | |
Net unrealized appreciation (depreciation) | | $ | 32,707,786 | |
| | | | |
Undistributed ordinary income | | $ | 2,653,517 | |
Undistributed long term capital gains | | | 2,830,418 | |
| | | | |
Distributable earnings | | $ | 5,483,935 | |
| | | | |
Differences between income and/or capital gains as determined on a book basis and a tax basis are primarily due to differing treatment of equity-linked securities and bond discounts and premiums.
6. Investment Transactions
Purchases and sales of investments (excluding short term securities) for the year ended December 31, 2017, aggregated $34,926,744 and $36,166,788, respectively.
7. Credit Facility
The Fund together with other U.S. registered and foreign investment funds (collectively, Borrowers), managed by Franklin Templeton Investments, are borrowers in a joint syndicated senior unsecured credit facility totaling $2 billion (Global Credit Facility) which matured on February 9, 2018. This Global Credit Facility provides a source of funds to the Borrowers for temporary and emergency purposes, including the ability to meet future unanticipated or unusually large redemption requests. Effective February 9, 2018, the Borrowers renewed the Global Credit Facility for a one year term, maturing February 8, 2019, for a total of $2 billion.
FRANKLIN TEMPLETON VARIABLE INSURANCE PRODUCTS TRUST
NOTES TO FINANCIAL STATEMENTS
Franklin Growth and Income VIP Fund (continued)
7. Credit Facility (continued)
Under the terms of the Global Credit Facility, the Fund shall, in addition to interest charged on any borrowings made by the Fund and other costs incurred by the Fund, pay its share of fees and expenses incurred in connection with the implementation and maintenance of the Global Credit Facility, based upon its relative share of the aggregate net assets of all of the Borrowers, including an annual commitment fee of 0.15% based upon the unused portion of the Global Credit Facility. These fees are reflected in other expenses in the Statement of Operations. During the year ended December 31, 2017, the Fund did not use the Global Credit Facility.
8. Redemption In-Kind
During the year ended December 31, 2016, the Fund realized $38,040,305 of net gains resulting from a redemption in-kind in which a shareholder redeemed fund shares for cash and securities held by the Fund. Because such gains are not taxable to the Fund, and are not distributed to remaining shareholders, they have been reclassified from accumulated net realized gains to paid-in capital.
9. Fair Value Measurements
The Fund follows a fair value hierarchy that distinguishes between market data obtained from independent sources (observable inputs) and the Fund’s own market assumptions (unobservable inputs). These inputs are used in determining the value of the Fund’s financial instruments and are summarized in the following fair value hierarchy:
| | • | | Level 1 – quoted prices in active markets for identical financial instruments |
| | • | | Level 2 – other significant observable inputs (including quoted prices for similar financial instruments, interest rates, prepayment speed, credit risk, etc.) |
| | • | | Level 3 – significant unobservable inputs (including the Fund’s own assumptions in determining the fair value of financial instruments) |
The input levels are not necessarily an indication of the risk or liquidity associated with financial instruments at that level.
For movements between the levels within the fair value hierarchy, the Fund has adopted a policy of recognizing the transfers as of the date of the underlying event which caused the movement.
A summary of inputs used as of December 31, 2017, in valuing the Fund’s assets carried at fair value, is as follows:
| | | | | | | | | | | | | | | | |
| | | Level 1 | | | Level 2 | | | Level 3 | | | Total | |
| | | | |
| Assets: | | | | | | | | | | | | | | | | |
Investments in Securities:a | | | | | | | | | | | | | | | | |
Equity Investmentsb | | $ | 98,821,709 | | | $ | — | | | $ | — | | | $ | 98,821,709 | |
Equity-Linked Securities | | | — | | | | 8,792,470 | | | | — | | | | 8,792,470 | |
Short Term Investments | | | — | | | | 2,277,825 | | | | — | | | | 2,277,825 | |
| | | | |
Total Investments in Securities | | $ | 98,821,709 | | | $ | 11,070,295 | | | $ | — | | | $ | 109,892,004 | |
| | | | |
aFor detailed categories, see the accompanying Statement of Investments. bIncludes common and convertible preferred stocks.
10. Subsequent Events
The Fund has evaluated subsequent events through the issuance of the financial statements and determined that no events have occurred that require disclosure other than those already disclosed in the financial statements.
FRANKLIN TEMPLETON VARIABLE INSURANCE PRODUCTS TRUST
NOTES TO FINANCIAL STATEMENTS
Franklin Growth and Income VIP Fund (continued)
Abbreviations
| | | | |
| Selected Portfolio | | |
| |
| ADR | | American Depositary Receipt |
FRANKLIN TEMPLETON VARIABLE INSURANCE PRODUCTS TRUST
Report of Independent Registered Public Accounting Firm
To the Board of Trustees of Franklin Templeton Variable Insurance Products Trust and Shareholders of Franklin Growth and Income VIP Fund
Opinion on the Financial Statements
We have audited the accompanying statement of assets and liabilities, including the statement of investments, of Franklin Growth and Income VIP Fund (the “Fund”) as of December 31, 2017, the related statement of operations for the year ended December 31, 2017, the statement of changes in net assets for each of the two years in the period ended December 31, 2017, including the related notes, and the financial highlights for each of the five years in the period ended December 31, 2017 (collectively referred to as the “financial statements”). In our opinion, the financial statements present fairly, in all material respects, the financial position of the Fund as of December 31, 2017, the results of its operations for the year then ended, the changes in its net assets for each of the two years in the period ended December 31, 2017 and the financial highlights for each of the five years in the period ended December 31, 2017 in conformity with accounting principles generally accepted in the United States of America.
Basis for Opinion
These financial statements are the responsibility of the Fund’s management. Our responsibility is to express an opinion on the Fund’s financial statements based on our audits. We are a public accounting firm registered with the Public Company Accounting Oversight Board (United States) (“PCAOB”) and are required to be independent with respect to the Fund in accordance with the U.S. federal securities laws and the applicable rules and regulations of the Securities and Exchange Commission and the PCAOB.
We conducted our audits of these financial statements in accordance with the standards of the PCAOB. Those standards require that we plan and perform the audit to obtain reasonable assurance about whether the financial statements are free of material misstatement, whether due to error or fraud.
Our audits included performing procedures to assess the risks of material misstatement of the financial statements, whether due to error or fraud, and performing procedures that respond to those risks. Such procedures included examining, on a test basis, evidence regarding the amounts and disclosures in the financial statements. Our audits also included evaluating the accounting principles used and significant estimates made by management, as well as evaluating the overall presentation of the financial statements. Our procedures included confirmation of securities owned as of December 31, 2017 by correspondence with the custodian and brokers; when replies were not received from brokers, we performed other auditing procedures. We believe that our audits provide a reasonable basis for our opinion.
PricewaterhouseCoopers LLP
San Francisco, California
February 15, 2018
We have served as the auditor of one or more investment companies in the Franklin Templeton Group of Funds since 1948.
FRANKLIN TEMPLETON VARIABLE INSURANCE PRODUCTS TRUST
Tax Information (unaudited)
Franklin Growth and Income VIP Fund
Under Section 852(b)(3)(C) of the Internal Revenue Code (Code), the Fund hereby reports the maximum amount allowable but no less than $4,886,161 as a long term capital gain dividend for the fiscal year ended December 31, 2017.
Under Section 854(b)(1)(A) of the Code, the Fund hereby reports 30.41% of the ordinary income dividends as income qualifying for the dividends received deduction for the fiscal year ended December 31, 2017.
This page intentionally left blank.
Franklin Income VIP Fund
This annual report for Franklin Income VIP Fund covers the fiscal year ended December 31, 2017.
Class 2 Performance Summary as of December 31, 2017
Average annual total return of Class 2 shares* represents the average annual change in value, assuming reinvestment of dividends and capital gains. Average returns smooth out variations in returns, which can be significant; they are not the same as year-by-year results.
| | | | | | | | | | | | |
| Periods ended 12/31/17 | | 1-Year | | | 5-Year | | | 10-Year | |
Average Annual Total Return | | | +9.67% | | | | +6.74% | | | | +5.56% | |
*The Fund has a fee waiver associated with any investment it makes in a Franklin Templeton money fund and/or other Franklin Templeton fund, contractually guaranteed through 4/30/18. Fund investment results reflect the fee waiver; without this waiver, the results would have been lower.
Performance reflects the Fund’s Class 2 operating expenses, but does not include any contract fees, expenses or sales charges. If they had been included, performance would be lower. These charges and deductions, particularly for variable life policies, can have a significant effect on contract values and insurance benefits. See the contract prospectus for a complete description of these expenses, including sales charges.
Performance data represent past performance, which does not guarantee future results. Investment return and principal value will fluctuate, and you may have a gain or loss when you sell your shares. Current performance may differ from figures shown.
Total Return Index Comparison for a Hypothetical $10,000 Investment (1/1/08–12/31/17)
The graph below shows the change in value of a hypothetical $10,000 investment in the Fund over the indicated period and includes reinvestment of any income or distributions. The Fund’s performance* is compared to the performance of the Standard & Poor’s® 500 Index (S&P 500®) and the Bloomberg Barclays US Aggregate Bond Index. One cannot invest directly in an index, and an index is not representative of the Fund’s portfolio. Please see Important Notes to Performance Information preceding the Fund Summaries.
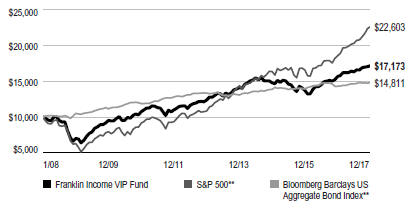
**Source: Morningstar. Please see Index Descriptions following the Fund Summaries.
FRANKLIN INCOME VIP FUND
Fund Goal and Main Investments
The Fund seeks to maximize income while maintaining prospects for capital appreciation. Under normal market conditions, the Fund invests in both equity and debt securities.
Fund Risks
All investments involve risks, including possible loss of principal. Stock prices fluctuate, sometimes rapidly and dramatically, due to factors affecting individual companies, particular industries or sectors, or general market conditions. The Fund’s portfolio includes a substantial portion of higher yielding, lower rated corporate bonds because of the relatively higher yields they offer. The Fund’s share price and yield will be affected by interest rate movements. Bond prices generally move in the opposite direction of interest rates. Thus, as prices of bonds in the Fund adjust to a rise in interest rates, the Fund’s share price may decline. Changes in the financial strength of a bond issuer or in a bond’s credit rating may affect its value. Foreign investing carries additional risks such as currency and market volatility and political or social instability, risks that are heightened in developing countries. The Fund is actively managed but there is no guarantee that the manager’s investment decisions will produce the desired results. The Fund’s prospectus also includes a description of the main investment risks.
Performance Overview
You can find the Fund’s one-year total return in the Performance Summary. For comparison, the Fund’s equity benchmark, the S&P 500, posted a +21.83% total return, and its fixed income benchmark, the Bloomberg Barclays US Aggregate Bond Index, produced a +3.54% total return for the same period.1
Economic and Market Overview
The US economy grew during the 12 months under review. After strengthening in 2017’s second and third quarters, the economy moderated in the fourth quarter. The economy grew faster in 2017 than in 2016, however, largely due to growth in consumer spending, business investment and exports. The manufacturing and services sectors expanded during the period. The unemployment rate declined from 4.7% in December 2016 to 4.1% at period-end.2 Monthly retail sales were volatile but
Portfolio Composition
12/31/17
| | | | |
| | | % of Total Net Assets | |
| Equity* | | | 56.6% | |
| Energy | | | 9.9% | |
| Information Technology | | | 7.6% | |
| Financials | | | 7.6% | |
| Health Care | | | 6.6% | |
| Industrials | | | 5.7% | |
| Utilities | | | 5.4% | |
| Materials | | | 4.2% | |
| Consumer Discretionary | | | 4.1% | |
| Consumer Staples | | | 3.7% | |
| Telecommunication Services | | | 1.3% | |
| Real Estate | | | 0.5% | |
| Fixed Income | | | 36.4% | |
| Health Care | | | 9.1% | |
| Energy | | | 7.0% | |
| Consumer Discretionary | | | 5.3% | |
| Financials | | | 3.1% | |
| Utilities | | | 2.8% | |
| Information Technology | | | 2.7% | |
| Telecommunication Services | | | 2.1% | |
| Industrials | | | 1.9% | |
| Materials | | | 1.6% | |
| Consumer Staples | | | 0.4% | |
| Real Estate | | | 0.4% | |
| Short-Term Investments & Other Net Assets | | | 7.0% | |
*Includes convertible bonds.
positive on average during the period. Annual inflation, as measured by the Consumer Price Index, was 2.1% in December 2016, and while it varied over the 12-month period, remained unchanged at period-end.2
The US Federal Reserve (Fed) raised its target range for the federal funds rate 0.25% at its March and June 2017 meetings, amid signs of a growing US economy, strengthening labor market and improving business spending. At its December meeting, the Fed raised its target range for the federal funds rate 0.25% to 1.25%–1.50%, as widely anticipated by the market. The Fed also confirmed that the monthly balance sheet
.
1. Source: Morningstar. One cannot invest directly in an index, and an index is not representative of the Fund’s portfolio. Please see Index Descriptions following the Fund Summaries.
2. Source: Bureau of Labor Statistics.
The dollar value, number of shares or principal amount, and names of all portfolio holdings are listed in the Fund’s Statement of Investments (SOI).
FRANKLIN INCOME VIP FUND
reduction would increase from $10 billion to $20 billion beginning in January 2018.
The 10-year Treasury yield, which moves inversely to its price, shifted throughout the period. The yield rose in June amid renewed optimism for improvement in economic growth and was supported in July by hawkish comments from key central bankers around the world. Easing concerns about Hurricane Irma’s economic impact, the Fed’s balance sheet normalization beginning in October and strong economic data also pushed the yield higher. However, several factors weighed on the Treasury yield at certain points during the period, including tensions between the US and North Korea; uncertainty on whether the Fed would raise rates in December 2017; and the appointment of Jerome Powell, viewed as more dovish than other contenders, as the next Fed chair. Near period-end, the Senate’s approval of a budget plan and the subsequent passage of the tax bill drove the yield higher. Overall, the 10-year Treasury yield declined from 2.45% at the beginning of the period to 2.40% at period-end.
Investment Strategy
We search for undervalued or out-of-favor securities we believe offer opportunities for income today and growth tomorrow. We generally perform independent analysis of the debt securities being considered for the Fund’s portfolio, rather than relying principally on ratings assigned by rating agencies. In analyzing debt and equity securities, we consider a variety of factors, including: a security’s relative value based on such factors as anticipated cash flow, interest or dividend coverage, asset coverage, and earnings prospects; the experience and strength of a company’s management; a company’s sensitivity to changes in interest rates and business conditions; a company’s debt maturity schedules and borrowing requirements; and a company’s changing financial condition and market recognition of the change.
Manager’s Discussion
During the 12 months under review, as we actively continued to manage the Fund’s multi-asset strategy, our portfolio decisions were made in relation to other opportunities available to us, with a focus on individual security selection. Our view has been that the investment performance of securities within the Fund should be driven primarily by company-specific initiatives and opportunities, and secondarily by broader market or interest-rate movements. We strategically reduced our equity weighting from 59.1% to 56.6% and increased our fixed income weighting from 35.2% to 36.4%. The Fund’s cash position increased from 5.7% to 7.0% of total net assets.
Top Five Equity Holdings
12/31/17
| | | | |
Company Sector/Industry | | % of Total
Net Assets | |
Royal Dutch Shell PLC Energy | | | 3.3% | |
Apple Inc. Information Technology | | | 2.9% | |
Wells Fargo & Co. Financials | | | 2.5% | |
Chevron Corp. Energy | | | 2.2% | |
General Electric Co. Industrials | | | 2.0% | |
Within equity, all sectors represented in the Fund’s portfolio delivered positive returns, with the largest contributions to absolute performance coming from information technology (IT), materials and financials.
In the IT sector, consumer electronics company Apple, software firm Microsoft and semiconductor manufacturer Intel drove performance. Microsoft continued to show positive results as it capitalized on many companies’ growing IT budgets. Apple reported robust earnings and cash flow generation from a strong product cycle, with many customers pleased with the new iPhone features. Additionally, the company’s high-margin services business continues to grow. Intel benefited from investments and acquisitions in growth areas outside of its core personal computer (PC) segment, while PC data improved in the latter part of 2017. Furthermore, in our assessment, the company has a relatively inexpensive valuation, strong free cash flow generation and a greater focus on cost reduction.
In materials, DowDuPont and Rio Tinto were meaningful contributors. DowDuPont, a developer of specialty materials, chemicals and agricultural products, benefited from its plan to split the recently combined Dow Chemical and DuPont businesses into three segments, each well positioned in our view and focused on specific markets. The split is projected to occur in 2019, with the expected greater efficiency and cash flow expected to create value for shareholders. Shares of Rio Tinto, a mining and mineral processing firm, benefited from higher prices in iron ore, copper and aluminum, while cost reductions and reduced working capital demands significantly improved cash flow.
In the financials sector, large banks JPMorgan Chase, Bank of America and Wells Fargo significantly contributed to Fund performance. These companies reported accelerating earnings amid an improving economy and higher interest rates, and their
FRANKLIN INCOME VIP FUND
strong capital positions enabled compelling share repurchases and buybacks.
Other sectors that delivered strong results included health care and energy. The Fund’s health care holdings generally benefited from positive drug pipeline results and modestly higher drug prices. The energy sector, specifically the Fund’s holdings in large integrated oil companies, benefited from lower capital spending and growing oil demand, which improved their cash flow outlook and reduced many investors’ prior concerns about potential dividend cuts. In the energy sector, UK-listed Royal Dutch Shell reported positive earnings results following the successful acquisition and integration of BG Group. The acquisition diversified its business and provided additional growth prospects, while efforts to reduce costs and sell non-core assets resulted in higher cash generation.
Another key individual contributor was equipment manufacturer Deere. After a multi-year decline in demand for agriculture equipment, Deere’s earnings improved in 2017. Channel inventory improved and pricing became attractive as end-market demand grew. Deere also made an acquisition that could potentially provide the company with new capabilities and growth opportunities in infrastructure and roadbuilding, in our view.
In contrast, several companies detracted from the Fund’s performance during the period under review. Shares of industrial conglomerate General Electric were significantly impacted by the company’s weaker-than-expected free cash flow profile, which culminated in a dividend reduction in late 2017. The company’s health care and aviation segments continue to perform well, while its oil and gas segment and power segment remained under pressure. Utility company PG&E’s shares were negatively affected by investor concerns that the company would be required to pay damages stemming from the tragic fires in Northern California. Shares of independent oil and gas explorer and producer Anadarko Petroleum and oilfield services provider Baker Hughes were impacted by low oil prices for most of 2017, which hurt energy production and the need for oilfield services. Separately, Anadarko Petroleum was also impacted by an accident in Colorado. Israel-based generic drug manufacturer Teva Pharmaceutical Industries was negatively impacted by softer sales volume and pricing, while its heavy debt load added to investor concerns.3 Multiline retailer Target reduced its
Top Five Fixed Income Holdings
and Senior Floating Rate Interests*
12/31/17
| | | | |
Company Sector/Industry | | % of Total Net Assets | |
CHS/Community Health Systems Inc. Health Care | | | 3.3% | |
Chesapeake Energy Corp. Energy | | | 2.3% | |
Tenet Healthcare Corp. Health Care | | | 1.9% | |
Weatherford International Ltd. Energy | | | 1.8% | |
DISH DBS Corp. Consumer Discretionary | | | 1.4% | |
*Does not include convertible bonds.
earnings outlook as a result of its decisions to invest more heavily in lower prices and additional e-commerce capabilities.
Smaller detractors from Fund performance included semiconductor manufacturer QUALCOMM,3 the IT sector’s lone detractor, as well as consumer goods manufacturer Newell Brands, oilfield services provider Schlumberger3 and specialty pharmaceuticals manufacturer Allergan.
Within fixed income, energy was our strongest performing sector during the period, as the price of oil increased with a meaningful move over the last three months of the year. We added to our exposure to both Chesapeake Energy and Weatherford International, as we shifted our overall energy exposure from equities to fixed income. Both names were meaningful positions that contributed to performance. During the period, both Chesapeake and Weatherford benefited from their ability to access the capital markets to pay down debt with Chesapeake also selling some non-core assets to address near-term maturities while improving its overall credit profile during the period. Bonds for one of our top performing energy companies in the fixed income sector, Bill Barrett, rallied after the company entered a strategic combination with Fifth Creek Energy,4 while reducing some of its debt by converting it to equity and also tapping the equity market for additional capital to bolster its liquidity profile for potential future spending.
3. Not held at period-end.
4. Not a Fund holding.
FRANKLIN INCOME VIP FUND
The banking industry was also a top performer for us within fixed income.5 Banks benefited from strong credit quality and excess capital, as well as elevated confidence levels from their management teams that pointed to the very favorable credit environment. The Fund focused on large liquid banks that we believe would continue to benefit from the benign credit environment with a focus on securities down in the capital structure, as we continued to view the fundamental backdrop for the banking industry in a positive light. Positions in JPMorgan, Citigroup and Bank of America all continued to benefit from excess capital levels, solid credit quality, and improving net interest margins as interest rates began to move higher. Citigroup was a top contributor overall to the Fund, as the debt was undervalued during the beginning of the period and rallied.
The electric utility industry also performed well during the period, due to expectations of better pricing that might come from regulatory changes.6 Mergers and acquisitions, as well as consolidation, also shifted sentiment during the period and seemed to give investors more confidence regarding valuations and the longer term outlook.
Consumer non-cyclicals were also a contributor to performance due to meaningful exposure to both Valeant Pharmaceuticals and Tenet Healthcare.7 Valeant’s financial results were strong throughout the entire year, beating expectations in each of the four quarters. Market sentiment continued to improve as some of its core business segments, such as Salix and Bausch & Lomb, displayed stability and potential for future growth, in our view. The company also redeemed some of its bonds at premiums to par. Tenet performed well as it became clear that a large portion of the Affordable Care Act would remain in place, a positive for hospitals and other health care facilities. It also took steps toward becoming the premier operator of surgery centers, a sub-segment of healthcare positioned to benefit from the shift to lower cost care settings. The strong performance from both Valeant and Tenet were offset by weaker performance from CHS/Community Health Systems, which was our biggest detractor for the Fund during the period. Community Health posted two quarters of weak results while in the process of divesting hospitals to focus on a more core set of facilities. Investors also became concerned about some of the company’s near-term maturities. We remained confident during the period that the company has a path to refinancing those maturities and were encouraged by the company’s success in
selling facilities at robust valuations and using the proceeds to reduce debt.
Thank you for your participation in Franklin Income VIP Fund. We look forward to serving your future investment needs.
The foregoing information reflects our analysis, opinions and portfolio holdings as of December 31, 2017, the end of the reporting period. The way we implement our main investment strategies and the resulting portfolio holdings may change depending on factors such as market and economic conditions. These opinions may not be relied upon as investment advice or an offer for a particular security. The information is not a complete analysis of every aspect of any market, country, industry, security or the Fund. Statements of fact are from sources considered reliable, but the investment manager makes no representation or warranty as to their completeness or accuracy. Although historical performance is no guarantee of future results, these insights may help you understand our investment management philosophy.
5. Banking holdings are in financials in the fixed income section of the SOI.
6. Electric utility holdings are in utilities in the fixed income section of the SOI.
7. Consumer non-cyclical holdings are in consumer staples and health care in the fixed income section of the SOI.
FRANKLIN INCOME VIP FUND
Class 2 Fund Expenses
As an investor in a variable insurance contract (Contract) that indirectly provides for investment in an underlying mutual fund, you can incur transaction and/or ongoing expenses at both the Fund level and the Contract Level: (1) transaction expenses can include sales charges (loads) on purchases, surrender fees, transfer fees and premium taxes; and (2) ongoing expenses can include management fees, distribution and service (12b-1) fees, contract fees, annual maintenance fees, mortality and expense risk fees and other fees and expenses. All mutual funds and Contracts have some types of ongoing expenses. The table below shows Fund-level ongoing expenses and can help you understand these costs and compare them with those of other mutual funds offered through the Contract. The table assumes a $1,000 investment held for the six months indicated. Please refer to the Fund prospectus for additional information on operating expenses.
Actual Fund Expenses
The table below provides information about the actual account values and actual expenses in the columns under the heading “Actual.” In these columns the Fund’s actual return, which includes the effect of ongoing Fund expenses but does not include the effect of ongoing Contract expenses, is used to calculate the “Ending Account Value.” You can estimate the Fund-level expenses you paid during the period by following these steps (of course, your account value and expenses will differ from those in this illustration): Divide your account value by $1,000 (if your account had an $8,600 value, then $8,600 ÷ $1,000 = 8.6). Then multiply the result by the number under the headings “Actual” and “Fund-Level Expenses Paid During Period” (if Fund-Level Expenses Paid During Period were $ 7.50, then 8.6 x $7.50 = $64.50). In this illustration, the estimated expenses paid this period at the Fund level are $64.50.
Hypothetical Example for Comparison with Other Mutual Funds
Under the heading “Hypothetical” in the table, information is provided about hypothetical account values and hypothetical expenses based on the Fund’s actual expense ratio and an assumed rate of return of 5% per year before expenses, which is not the Fund’s actual return. This information may not be used to estimate the actual ending account balance or expenses you paid for the period, but it can help you compare ongoing costs of investing in the Fund with those of other mutual funds offered through the Contract. To do so, compare this 5% hypothetical example with the 5% hypothetical examples that appear in the shareholder reports of other funds offered through the Contract.
Please note that expenses shown in the table are meant to highlight ongoing costs at the Fund level only and do not reflect any ongoing expenses at the Contract level, or transaction expenses at either the Fund or Contract levels. In addition, while the Fund does not have transaction expenses, if the transaction and ongoing expenses at the Contract level were included, the expenses shown below would be higher. You should consult your Contract prospectus or disclosure document for more information.
| | | | | | | | | | | | | | | | | | | | | | | | | | |
| | | | | | Actual (actual return after expenses) | | | | | Hypothetical (5% annual return before
expenses) | | | | |
| Share Class | | Beginning Account Value 7/1/17 | | | Ending Account Value 12/31/17 | | | Fund-Level Expenses Paid
During Period 7/1/17–12/31/171,2 | | | | | Ending Account Value 12/31/17 | | | Fund-Level Expenses Paid During Period 7/1/17–12/31/171,2 | | | Net Annualized Expense Ratio2 | |
Class 2 | | | $1,000 | | | | $1,052.70 | | | | $3.62 | | | | | | $1,021.68 | | | | $3.57 | | | | 0.70% | |
1. Expenses are equal to the annualized expense ratio for the six-month period as indicated above—in the far right column—multiplied by the simple average account value over the period indicated, and then multiplied by 184/365 to reflect the one-half year period.
2. Reflects expenses after fee waivers and expense reimbursements. Does not include any ongoing expenses of the Contract for which the Fund is an investment option or acquired fund fees and expenses.
FI SA1 07/17
SUPPLEMENT DATED JULY 18, 2017
TO THE STATEMENT OF ADDITIONAL INFORMATION
DATED MAY 1, 2017
OF
FRANKLIN INCOME VIP FUND
(A series of Franklin Templeton Variable Insurance Products Trust)
The Statement of Additional Information is amended as follows:
The following bullet point is added as the last bullet point under the heading “The Funds – Goals, Additional Strategies and Risks – Franklin Income VIP Fund:”
| | • | | buy and sell exchange-traded options on indexes that measure stock volatility, such as the Chicago Board Options Exchange (CBOE) Volatility Index® (VIX®) |
Please keep this supplement with your Statement of Additional Information for future reference.
VIP SAI-1 12/17
SUPPLEMENT DATED DECEMBER 7, 2017
TO THE STATEMENT OF ADDITIONAL INFORMATION
DATED MAY 1, 2017
OF
FRANKLIN INCOME VIP FUND
(A series Franklin Templeton Variable Insurance Products Trust)
The Statement of Additional Information (SAI) is amended as follows:
I. The following replaces the thirteenth bullet in the list of bullet points under the “The Funds – Goals, Additional Strategies and Risks – Additional Strategies – Franklin Income VIP Fund” heading in the SAI:
| | • | | invest in equity-linked notes, including up to 2% of the Fund’s assets in equity-linked notes on commodity-linked ETFs |
II. The following is added to the list of bullet points under the “The Funds – Goals, Additional Strategies and Risks – Additional Strategies – Franklin Income VIP Fund” heading in the SAI:
| | • | | buy and sell ETFs and options on ETFs |
III. The following is added to the “Glossary of Investments, Techniques, Strategies and Their Risks” section of the SAI:
Commodity-linked instruments Commodity-linked instruments are designed to provide exposure to the price movements of real assets that trade in the commodity markets without direct investment in physical commodities. Real assets are assets such as oil, gas, industrial and precious metals, livestock, and agricultural or meat products, or other items that have tangible properties, as compared to stocks or bonds, which are financial instruments.
Obtaining exposure to the price movements of physical commodities through commodity-linked instruments presents unique risks, is speculative and can be extremely volatile. Market prices of commodities may fluctuate rapidly based on numerous factors, including: changes in supply and demand relationships (whether actual, perceived, anticipated, unanticipated or unrealized); weather; agriculture; trade; domestic and foreign political and economic events and policies; diseases; pestilence; technological developments; and monetary and other governmental policies, action and inaction. The current or “spot” prices of physical commodities may also affect, in a volatile and inconsistent manner, the prices of futures contracts in respect of the relevant commodity. Certain commodities are used primarily in one industry, and fluctuations in levels of activity in (or the availability of alternative resources to) one industry may have a disproportionate effect on global demand for a particular commodity. Moreover, recent growth in industrial production and gross domestic product has made China and other developing nations oversized users of commodities and has increased the extent to which certain commodities prices are influenced by those markets.
Commodity-linked notes The value of a commodity-linked note is primarily linked to the price movements of physical commodity (such as heating oil, livestock, or agricultural products), a commodity futures or option contract, a commodity index (such as the S&P GSCI), a commodity-based ETF or some other readily measurable variable that reflects changes in the value of particular commodities or the commodities markets. The notes in which the Fund invests are typically issued by a bank or other financial institution or a commodity producer, and the Fund negotiates with the issuer to obtain specific terms and features that are tailored to the Fund’s investment needs. A typical note may have the following characteristics:
| | • | | Issuer: A bank, other financial institution or commodity producer with respect to commodity-linked notes. |
| | • | | Maturity: Commodity-Linked Notes (12-18 months) |
| | • | | Purchase Price: The Fund purchases a note at a specified face value, for example $100 or $1,000. |
| | • | | Payment Characteristics: The Fund receives an interest payment at a fixed coupon rate determined at the time of purchase. With respect to commodity-linked notes, the Fund also receives a payment at maturity that is based on the price movement of the |
| | underlying commodity, for example heating oil, a commodity index (e.g., the S&P GSCI) or commodity-linked ETF (e.g., the SPDR® Gold Shares ETF). |
| | • | | “Put” and Automatic Redemption Features: The Fund typically has the right to “put” (or sell) a commodity-linked note to the issuer at any time, at a price based on the commodity-linked note’s face value as adjusted to reflect the price movement of the underlying commodity, commodity futures or option contract, commodity index, or other economic variable. A typical note also provides that the issuer will automatically repurchase the note from the Fund if the value of the note decreases to a specified level, which would occur if the price of the underlying commodity, commodity futures or option contract, or commodity index, which ever the case may be, reached a level specified under the terms of the note. The Fund can negotiate with the issuer to modify any of the typical characteristics described above. For example, the Fund can negotiate to extend or shorten the maturity of a note, or to receive interest payments at a variable interest rate instead of at a fixed interest rate. |
Please keep this supplement with your Statement of Additional Information for future reference.
FRANKLIN TEMPLETON VARIABLE INSURANCE PRODUCTS TRUST
Financial Highlights
Franklin Income VIP Fund
| | | | | | | | | | | | | | | | | | | | |
| | | Year Ended December 31, | |
| | | 2017 | | | 2016 | | | 2015 | | | 2014 | | | 2013 | |
| Class 1 | | | | | | | | | | | | | | | | | | | | |
Per share operating performance (for a share outstanding throughout the year) | | | | | | | | | | | | | | | | | | | | |
Net asset value, beginning of year | | $ | 15.87 | | | $ | 14.64 | | | $ | 16.48 | | | $ | 16.53 | | | $ | 15.47 | |
| | | | |
Income from investment operationsa: | | | | | | | | | | | | | | | | | | | | |
| | | | | |
Net investment incomeb | | | 0.69 | | | | 0.67 | | | | 0.71 | | | | 0.72 | | | | 0.81 | |
| | | | | |
Net realized and unrealized gains (losses) | | | 0.87 | | | | 1.34 | | | | (1.78 | ) | | | 0.11 | | | | 1.31 | |
| | | | |
Total from investment operations | | | 1.56 | | | | 2.01 | | | | (1.07) | | | | 0.83 | | | | 2.12 | |
| | | | |
Less distributions from net investment income | | | (0.71 | ) | | | (0.78 | ) | | | (0.77 | ) | | | (0.88 | ) | | | (1.06 | ) |
Net asset value, end of year | | $ | 16.72 | | | $ | 15.87 | | | $ | 14.64 | | | $ | 16.48 | | | $ | 16.53 | |
| | | | |
| | | | | |
Total returnc | | | 9.94% | | | | 14.33% | | | | (6.84)% | | | | 4.92% | | | | 14.18% | |
| | | | |
| | | | | |
| Ratios to average net assets | | | | | | | | | | | | | | | | | | | | |
| | | | | |
Expenses before waiver and payments by affiliates | | | 0.47% | | | | 0.47% | | | | 0.46% | | | | 0.47% | | | | 0.47% | |
| | | | | |
Expenses net of waiver and payments by affiliatesd | | | 0.45% | | | | 0.44% | | | | 0.46% | e | | | 0.47% | | | | 0.47% | |
| | | | | |
Net investment income | | | 4.22% | | | | 4.47% | | | | 4.47% | | | | 4.26% | | | | 5.07% | |
| | | | | |
| Supplemental data | | | | | | | | | | | | | | | | | | | | |
| | | | | |
Net assets, end of year (000’s) | | $ | 735,149 | | | $ | 696,227 | | | $ | 604,228 | | | $ | 714,664 | | | $ | 695,004 | |
| | | | | |
Portfolio turnover rate | | | 20.96% | | | | 39.03% | | | | 31.53% | | | | 24.77% | | | | 21.71% | |
aThe amount shown for a share outstanding throughout the period may not correlate with the Statement of Operations for the period due to the timing of sales and repurchases of the Fund’s shares in relation to income earned and/or fluctuating fair value of the investments of the Fund.
bBased on average daily shares outstanding.
cTotal return does not include fees, charges or expenses imposed by the variable annuity and life insurance contracts for which Franklin Templeton Variable Insurance Products Trust serves as an underlying investment vehicle.
dBenefit of expense reduction rounds to less than 0.01%.
eBenefit of waiver and payments by affiliates rounds to less than 0.01%.
| | | | |
| FI-10 | | Annual Report | The accompanying notes are an integral part of these financial statements. | | |
FRANKLIN TEMPLETON VARIABLE INSURANCE PRODUCTS TRUST
FINANCIAL HIGHLIGHTS
Franklin Income VIP Fund (continued)
| | | | | | | | | | | | | | | | | | | | |
| | | Year Ended December 31, | |
| | | 2017 | | | 2016 | | | 2015 | | | 2014 | | | 2013 | |
| Class 2 | | | | | | | | | | | | | | | | | | | | |
Per share operating performance (for a share outstanding throughout the year) | | | | | | | | | | | | | | | | | | | | |
Net asset value, beginning of year | | | $15.38 | | | | $14.20 | | | | $16.00 | | | | $16.07 | | | | $15.07 | |
| | | | |
Income from investment operationsa: | | | | | | | | | | | | | | | | | | | | |
| | | | | |
Net investment incomeb | | | 0.63 | | | | 0.61 | | | | 0.65 | | | | 0.66 | | | | 0.75 | |
| | | | | |
Net realized and unrealized gains (losses) | | | 0.83 | | | | 1.31 | | | | (1.73 | ) | | | 0.11 | | | | 1.27 | |
| | | | |
Total from investment operations | | | 1.46 | | | | 1.92 | | | | (1.08 | ) | | | 0.77 | | | | 2.02 | |
| | | | |
Less distributions from net investment income | | | (0.67 | ) | | | (0.74 | ) | | | (0.72 | ) | | | (0.84 | ) | | | (1.02 | ) |
| | | | |
Net asset value, end of year | | | $16.17 | | | | $15.38 | | | | $14.20 | | | | $16.00 | | | | $16.07 | |
| | | | |
| | | | | |
Total returnc | | | 9.67% | | | | 14.02% | | | | (7.05)% | | | | 4.62% | | | | 13.94% | |
| | | | | |
| Ratios to average net assets | | | | | | | | | | | | | | | | | | | | |
| | | | | |
Expenses before waiver and payments by affiliates | | | 0.72% | | | | 0.72% | | | | 0.71% | | | | 0.72% | | | | 0.72% | |
| | | | | |
Expenses net of waiver and payments by affiliatesd | | | 0.70% | | | | 0.69% | | | | 0.71% | e | | | 0.72% | | | | 0.72% | |
| | | | | |
Net investment income | | | 3.97% | | | | 4.22% | | | | 4.22% | | | | 4.01% | | | | 4.82% | |
| | | | | |
| Supplemental data | | | | | | | | | | | | | | | | | | | | |
| | | | | |
Net assets, end of year (000’s) | | | $5,041,498 | | | | $5,088,556 | | | | $4,907,599 | | | | $6,022,804 | | | | $6,188,045 | |
| | | | | |
Portfolio turnover rate | | | 20.96% | | | | 39.03% | | | | 31.53% | | | | 24.77% | | | | 21.71% | |
aThe amount shown for a share outstanding throughout the period may not correlate with the Statement of Operations for the period due to the timing of sales and repurchases of the Fund’s shares in relation to income earned and/or fluctuating fair value of the investments of the Fund.
bBased on average daily shares outstanding.
cTotal return does not include fees, charges or expenses imposed by the variable annuity and life insurance contracts for which Franklin Templeton Variable Insurance Products Trust serves as an underlying investment vehicle.
dBenefit of expense reduction rounds to less than 0.01%.
eBenefit of waiver and payments by affiliates rounds to less than 0.01%.
| | | | | | |
| | | The accompanying notes are an integral part of these financial statements. | Annual Report | | | FI-11 | |
FRANKLIN TEMPLETON VARIABLE INSURANCE PRODUCTS TRUST
FINANCIAL HIGHLIGHTS
Franklin Income VIP Fund (continued)
| | | | | | | | | | | | | | | | | | | | |
| | | Year Ended December 31, | |
| | | 2017 | | | 2016 | | | 2015 | | | 2014 | | | 2013 | |
| Class 4 | | | | | | | | | | | | | | | | | | | | |
Per share operating performance (for a share outstanding throughout the year) | | | | | | | | | | | | | | | | | | | | |
Net asset value, beginning of year | | $ | 15.71 | | | $ | 14.49 | | | $ | 16.31 | | | $ | 16.36 | | | $ | 15.32 | |
| | | | |
Income from investment operationsa: | | | | | | | | | | | | | | | | | | | | |
| | | | | |
Net investment incomeb | | | 0.62 | | | | 0.61 | | | | 0.65 | | | | 0.66 | | | | 0.75 | |
| | | | | |
Net realized and unrealized gains (losses) | | | 0.85 | | | | 1.33 | | | | (1.76 | ) | | | 0.11 | | | | 1.30 | |
| | | | |
Total from investment operations | | | 1.47 | | | | 1.94 | | | | (1.11 | ) | | | 0.77 | | | | 2.05 | |
| | | | |
Less distributions from net investment income | | | (0.65 | ) | | | (0.72 | ) | | | (0.71 | ) | | | (0.82 | ) | | | (1.01 | ) |
| | | | |
Net asset value, end of year | | $ | 16.53 | | | $ | 15.71 | | | $ | 14.49 | | | $ | 16.31 | | | $ | 16.36 | |
| | | | |
| | | | | |
Total returnc | | | 9.55% | | | | 13.87% | | | | (7.15)% | | | | 4.52% | | | | 13.85% | |
| | | | | |
| Ratios to average net assets | | | | | | | | | | | | | | | | | | | | |
| | | | | |
Expenses before waiver and payments by affiliates | | | 0.82% | | | | 0.82% | | | | 0.81% | | | | 0.82% | | | | 0.82% | |
| | | | | |
Expenses net of waiver and payments by affiliatesd | | | 0.80% | | | | 0.79% | | | | 0.81% | e | | | 0.82% | | | | 0.82% | |
| | | | | |
Net investment income | | | 3.87% | | | | 4.12% | | | | 4.12% | | | | 3.91% | | | | 4.72% | |
| | | | | |
| Supplemental data | | | | | | | | | | | | | | | | | | | | |
| | | | | |
Net assets, end of year (000’s) | | $ | 335,217 | | | $ | 309,935 | | | $ | 306,023 | | | $ | 378,545 | | | $ | 397,652 | |
| | | | | |
Portfolio turnover rate | | | 20.96% | | | | 39.03% | | | | 31.53% | | | | 24.77% | | | | 21.71% | |
aThe amount shown for a share outstanding throughout the period may not correlate with the Statement of Operations for the period due to the timing of sales and repurchases of the Fund’s shares in relation to income earned and/or fluctuating fair value of the investments of the Fund.
bBased on average daily shares outstanding.
cTotal return does not include fees, charges or expenses imposed by the variable annuity and life insurance contracts for which Franklin Templeton Variable Insurance Products Trust serves as an underlying investment vehicle.
dBenefit of expense reduction rounds to less than 0.01%.
eBenefit of waiver and payments by affiliates rounds to less than 0.01%.
| | | | |
| FI-12 | | Annual Report | The accompanying notes are an integral part of these financial statements. | | |
FRANKLIN TEMPLETON VARIABLE INSURANCE PRODUCTS TRUST
Statement of Investments, December 31, 2017
| | | | | | | | | | | | | | |
Franklin Income VIP Fund | | | | | | | | | |
| | | | | Country | | | Shares | | | Value | |
| | Common Stocks 49.2% | | | | | | | | | | | | |
| | Consumer Discretionary 4.0% | | | | | | | | | | | | |
| | Ford Motor Co. | | | United States | | | | 7,138,995 | | | $ | 89,166,048 | |
| | General Motors Co. | | | United States | | | | 1,000,000 | | | | 40,990,000 | |
| | Newell Brands Inc. | | | United States | | | | 300,000 | | | | 9,270,000 | |
| | Target Corp. | | | United States | | | | 1,639,100 | | | | 106,951,275 | |
| | | | | | | | | | | | | | |
| | | | | | | | | | | | | 246,377,323 | |
| | | | | | | | | | | | | | |
| | | Consumer Staples 3.7% | | | | | | | | | |
| a | | Anheuser-Busch InBev SA/NV, ADR | | | Belgium | | | | 505,000 | | | | 56,337,800 | |
| a | | The Coca-Cola Co. | | | United States | | | | 1,325,000 | | | | 60,791,000 | |
| | PepsiCo Inc. | | | United States | | | | 584,000 | | | | 70,033,280 | |
| | Philip Morris International Inc. | | | United States | | | | 350,000 | | | | 36,977,500 | |
| | | | | | | | | | | | | | |
| | | | | | | | | | | | | 224,139,580 | |
| | | | | | | | | | | | | | |
| | | Energy 9.4% | | | | | | | | | |
| | Anadarko Petroleum Corp. | | | United States | | | | 600,000 | | | | 32,184,000 | |
| | Baker Hughes a GE Co., A | | | United States | | | | 725,000 | | | | 22,939,000 | |
| | BP PLC, ADR | | | United Kingdom | | | | 1,800,000 | | | | 75,654,000 | |
| a | | Chevron Corp. | | | United States | | | | 1,055,000 | | | | 132,075,450 | |
| b | | Energy XXI Gulf Coast Inc. | | | United States | | | | 215,000 | | | | 1,234,100 | |
| | Exxon Mobil Corp. | | | United States | | | | 300,000 | | | | 25,092,000 | |
| | Halliburton Co. | | | United States | | | | 500,000 | | | | 24,435,000 | |
| | Occidental Petroleum Corp. | | | United States | | | | 436,000 | | | | 32,115,760 | |
| | Royal Dutch Shell PLC, A, ADR | | | United Kingdom | | | | 3,021,748 | | | | 201,580,809 | |
| b | | Stone Energy Corp. | | | United States | | | | 544,906 | | | | 17,524,177 | |
| b | | Weatherford International PLC | | | United States | | | | 2,500,000 | | | | 10,425,000 | |
| | | | | | | | | | | | | | |
| | | | | | | | | | | | | 575,259,296 | |
| | | | | | | | | | | | | | |
| | | Financials 6.3% | | | | | | | | | |
| | Bank of America Corp. | | | United States | | | | 800,000 | | | | 23,616,000 | |
| | HSBC Holdings PLC | | | United Kingdom | | | | 3,500,000 | | | | 36,248,104 | |
| | JPMorgan Chase & Co. | | | United States | | | | 690,100 | | | | 73,799,294 | |
| | MetLife Inc. | | | United States | | | | 1,245,108 | | | | 62,952,661 | |
| | U.S. Bancorp. | | | United States | | | | 1,000,000 | | | | 53,580,000 | |
| | Wells Fargo & Co. | | | United States | | | | 2,200,000 | | | | 133,474,000 | |
| | | | | | | | | | | | | | |
| | | | | | | | | | | | | 383,670,059 | |
| | | | | | | | | | | | | | |
| | | Health Care 6.0% | | | | | | | | | |
| | AstraZeneca PLC | | | United Kingdom | | | | 750,000 | | | | 51,867,409 | |
| | Eli Lilly & Co. | | | United States | | | | 300,000 | | | | 25,338,000 | |
| | Medtronic PLC | | | United States | | | | 400,000 | | | | 32,300,000 | |
| | Merck & Co. Inc. | | | United States | | | | 806,100 | | | | 45,359,247 | |
| b | | Mylan NV | | | United States | | | | 628,000 | | | | 26,570,680 | |
| | Pfizer Inc. | | | United States | | | | 2,638,975 | | | | 95,583,675 | |
| | Roche Holding AG | | | Switzerland | | | | 136,500 | | | | 34,533,022 | |
| | Sanofi, ADR | | | France | | | | 1,208,292 | | | | 51,956,556 | |
| | | | | | | | | | | | | | |
| | | | | | | | | | | | | 363,508,589 | |
| | | | | | | | | | | | | | |
| | | Industrials 4.4% | | | | | | | | | |
| b | | CEVA Holdings LLC | | | United States | | | | 13,012 | | | | 5,855,517 | |
| | Deere & Co. | | | United States | | | | 240,000 | | | | 37,562,400 | |
| | General Electric Co. | | | United States | | | | 7,100,000 | | | | 123,895,000 | |
| | Republic Services Inc. | | | United States | | | | 527,300 | | | | 35,650,753 | |
| | Union Pacific Corp. | | | United States | | | | 500,000 | | | | 67,050,000 | |
| | | | | | | | | | | | | | |
| | | | | | | | | | | | | 270,013,670 | |
| | | | | | | | | | | | | | |
FRANKLIN TEMPLETON VARIABLE INSURANCE PRODUCTS TRUST
STATEMENT OF INVESTMENTS
Franklin Income VIP Fund (continued)
| | | | | | | | | | | | | | |
| | | | | Country | | | Shares | | | Value | |
| | Common Stocks (continued) | | | | | | | | | | | | |
| | Information Technology 4.6% | | | | | | | | | | | | |
| a | | Apple Inc. | | | United States | | | | 645,317 | | | $ | 109,206,996 | |
| a | | Intel Corp. | | | United States | | | | 1,207,000 | | | | 55,715,120 | |
| | Microsoft Corp. | | | United States | | | | 1,000,000 | | | | 85,540,000 | |
| | Oracle Corp. | | | United States | | | | 700,632 | | | | 33,125,881 | |
| | | | | | | | | | | | | | |
| | | | | | | | | | | | | 283,587,997 | |
| | | | | | | | | | | | | | |
| | | Materials 4.2% | | | | | | | | | |
| | BASF SE | | | Germany | | | | 387,500 | | | | 42,651,992 | |
| | DowDuPont Inc. | | | United States | | | | 1,700,000 | | | | 121,074,000 | |
| | Rio Tinto PLC, ADR | | | United Kingdom | | | | 1,800,000 | | | | 95,274,000 | |
| | | | | | | | | | | | | | |
| | | | | | | | | | | | | 258,999,992 | |
| | | | | | | | | | | | | | |
| | | Real Estate 0.5% | | | | | | | | | |
| | Host Hotels & Resorts Inc. | | | United States | | | | 1,500,000 | | | | 29,775,000 | |
| | | | | | | | | | | | | | |
| | | Telecommunication Services 1.3% | | | | | | | | | |
| | BCE Inc. | | | Canada | | | | 466,000 | | | | 22,382,531 | |
| | Verizon Communications Inc. | | | United States | | | | 1,075,000 | | | | 56,899,750 | |
| | | | | | | | | | | | | | |
| | | | | | | | | | | | | 79,282,281 | |
| | | | | | | | | | | | | | |
| | | Utilities 4.8% | | | | | | | | | |
| | Dominion Energy Inc. | | | United States | | | | 1,101,638 | | | | 89,298,776 | |
| | Duke Energy Corp. | | | United States | | | | 702,500 | | | | 59,087,275 | |
| | Great Plains Energy Inc. | | | United States | | | | 777,900 | | | | 25,079,496 | |
| | PG&E Corp. | | | United States | | | | 650,000 | | | | 29,139,500 | |
| | Sempra Energy | | | United States | | | | 368,300 | | | | 39,378,636 | |
| | The Southern Co. | | | United States | | | | 1,062,100 | | | | 51,076,389 | |
| | | | | | | | | | | | | | |
| | | | | | | | | | | | | 293,060,072 | |
| | | | | | | | | | | | | | |
| | | | |
| | Total Common Stocks (Cost $2,386,400,967) | | | | | | | | | | | 3,007,673,859 | |
| | | | | | | | | | | | | | |
| c | | Equity-Linked Securities 4.2% | | | | | | | | | | | | |
| | | Industrials 1.2% | | | | | | | | | |
| d | | Morgan Stanley into Deere & Co., 6.00%, 144A | | | United States | | | | 550,000 | | | | 69,023,294 | |
| | | | | | | | | | | | | | |
| | | Information Technology 3.0% | | | | | | | | | |
| d | | Deutsche Bank AG/London into Apple Inc., 6.00%, 144A | | | United States | | | | 410,000 | | | | 67,130,864 | |
| d | | Goldman Sachs International into Analog Devices Inc., 6.50%, 144A | | | United States | | | | 570,000 | | | | 49,833,286 | |
| d | | Goldman Sachs International into Intel Corp., 6.00%, 144A | | | United States | | | | 1,700,000 | | | | 67,509,674 | |
| | | | | | | | | | | | | | |
| | | | | | | | | | | | | 184,473,824 | |
| | | | | | | | | | | | | | |
| | | | |
| | Total Equity-Linked Securities (Cost $231,228,000) | | | | | | | | | | | 253,497,118 | |
| | | | | | | | | | | | | | |
| | | Convertible Preferred Stocks 2.1% | | | | | | | | | |
| | | Financials 1.3% | | | | | | | | | |
| | Bank of America Corp., 7.25%, cvt. pfd., L | | | United States | | | | 34,600 | | | | 45,637,400 | |
| b | | FNMA, 5.375%, cvt. pfd | | | United States | | | | 475 | | | | 12,824,050 | |
| | Wells Fargo & Co., 7.50%, cvt. pfd., A | | | United States | | | | 15,000 | | | | 19,649,850 | |
| | | | | | | | | | | | | | |
| | | | | | | | | | | | | 78,111,300 | |
| | | Health Care 0.1% | | | | | | | | | |
| | Allergan PLC, 5.50%, cvt. pfd | | | United States | | | | 9,500 | | | | 5,569,375 | |
| | | | | | | | | | | | | | |
| | | Industrials 0.1% | | | | | | | | | |
| b | | CEVA Holdings LLC, cvt. pfd., A-1 | | | United States | | | | 397 | | | | 242,170 | |
| b | | CEVA Holdings LLC, cvt. pfd., A-2 | | | United States | | | | 14,711 | | | | 6,619,905 | |
| | | | | | | | | | | | | | |
| | | | | | | | | | | | | 6,862,075 | |
| | | | | | | | | | | | | | |
FRANKLIN TEMPLETON VARIABLE INSURANCE PRODUCTS TRUST
STATEMENT OF INVESTMENTS
Franklin Income VIP Fund (continued)
| | | | | | | | | | | | | | |
| | | | | Country | | | Shares | | | Value | |
| | Convertible Preferred Stocks (continued) | | | | | | | | | | | | |
| | Utilities 0.6% | | | | | | | | | | | | |
| | NextEra Energy Inc., 6.371%, cvt. pfd | | | United States | | | | 500,000 | | | $ | 34,790,000 | |
| | | | | | | | | | | | | | |
| | | |
| | Total Convertible Preferred Stocks (Cost $131,976,419) | | | | | | | | 125,332,750 | |
| | | | | | | | | | | | | | |
| | | | |
| | | | | | | | | Principal Amount | * | | | | |
| | Convertible Bonds 1.1% | | | | | | | | | | | | |
| | | Energy 0.5% | | | | | | | | | |
| d | | Chesapeake Energy Corp., cvt., senior note, 144A, 5.50%, 9/15/26 | | | United States | | | | 10,000,000 | | | | 9,156,250 | |
| | Weatherford International Ltd., cvt., senior note, 5.875%, 7/01/21 | | | United States | | | | 22,000,000 | | | | 23,897,500 | |
| | | | | | | | | | | | | | |
| | | | | | | | | | | | | 33,053,750 | |
| | | | | | | | | | | | | | |
| | | Health Care 0.6% | | | | | | | | | |
| d | | Bayer Capital Corp BV, cvt., junior sub. note, 144A, 5.625%, 11/22/19 | | | Germany | | | | 25,000,000 | EUR | | | 34,044,627 | |
| | Impax Laboratories Inc., cvt., senior note, 2.00%, 6/15/22 | | | United States | | | | 2,500,000 | | | | 2,437,500 | |
| | | | | | | | | | | | | | |
| | | | | | | | | | | | | 36,482,127 | |
| | | | | | | | | | | | | | |
| | | |
| | Total Convertible Bonds (Cost $59,917,314) | | | | | | | | 69,535,877 | |
| | | | | | | | | | | | | | |
| | Corporate Bonds 32.7% | | | | | | | | | | | | |
| | | Consumer Discretionary 3.9% | | | | | | | | | |
| d | | 24 Hour Holdings III LLC, senior note, 144A, 8.00%, 6/01/22 | | | United States | | | | 6,300,000 | | | | 6,189,750 | |
| | CCO Holdings LLC/CCO Holdings Capital Corp., | | | | | | | | | | | | |
| | senior bond, 5.125%, 2/15/23 | | | United States | | | | 10,000,000 | | | | 10,250,000 | |
| | senior bond, 5.75%, 1/15/24 | | | United States | | | | 9,000,000 | | | | 9,292,500 | |
| | d senior bond, 144A, 5.00%, 2/01/28 | | | United States | | | | 5,000,000 | | | | 4,887,500 | |
| | DISH DBS Corp., | | | | | | | | | | | | |
| | senior bond, 5.00%, 3/15/23 | | | United States | | | | 35,000,000 | | | | 33,381,250 | |
| | senior note, 5.875%, 7/15/22 | | | United States | | | | 40,000,000 | | | | 40,350,000 | |
| | senior note, 5.875%, 11/15/24 | | | United States | | | | 9,400,000 | | | | 9,176,750 | |
| | Fiat Chrysler Automobiles NV, senior note, 5.25%, 4/15/23 | | | United Kingdom | | | | 11,300,000 | | | | 11,854,717 | |
| | iHeartCommunications Inc., senior secured note, first lien, 9.00%, 12/15/19 | | | United States | | | | 23,000,000 | | | | 17,192,500 | |
| d | | International Game Technology PLC, senior secured note, 144A, 6.25%, 2/15/22 | | | United States | | | | 8,500,000 | | | | 9,190,625 | |
| | KB Home, senior bond, 7.50%, 9/15/22 | | | United States | | | | 6,500,000 | | | | 7,426,250 | |
| d | | PetSmart Inc., senior note, 144A, 7.125%, 3/15/23 | | | United States | | | | 3,000,000 | | | | 1,792,500 | |
| d | | Shea Homes LP/Shea Homes Funding Corp., | | | | | | | | | | | | |
| | senior bond, 144A, 6.125%, 4/01/25 | | | United States | | | | 10,000,000 | | | | 10,450,000 | |
| | senior note, 144A, 5.875%, 4/01/23 | | | United States | | | | 5,000,000 | | | | 5,212,500 | |
| d | | Sirius XM Radio Inc., senior bond, 144A, 6.00%, 7/15/24 | | | United States | | | | 7,500,000 | | | | 7,950,000 | |
| d | | Tesla Inc., senior note, 144A, 5.30%, 8/15/25 | | | United States | | | | 10,000,000 | | | | 9,587,500 | |
| | United Rentals North America Inc., senior bond, 5.75%, 11/15/24 | | | United States | | | | 3,000,000 | | | | 3,168,750 | |
| d | | Univision Communications Inc., | | | | | | | | | | | | |
| | senior secured note, first lien, 144A, 5.125%, 5/15/23 | | | United States | | | | 10,000,000 | | | | 10,000,000 | |
| | senior secured note, first lien, 144A, 5.125%, 2/15/25 | | | United States | | | | 7,140,000 | | | | 6,979,350 | |
| d | | Virgin Media Secured Finance PLC, senior secured bond, first lien, 144A, 5.50%, 1/15/25 | | | United Kingdom | | | | 7,000,000 | | | | 7,210,000 | |
| d | | Wynn Las Vegas LLC/Wynn Las Vegas Capital Corp., senior bond, 144A, 5.50%, 3/01/25 | | | United States | | | | 7,500,000 | | | | 7,743,750 | |
| d | | Ziggo Secured Finance BV, secured bond, 144A, 5.50%, 1/15/27 | | | Netherlands | | | | 7,500,000 | | | | 7,509,375 | |
| | | | | | | | | | | | | | |
| | | | | | | | | | | | | 236,795,567 | |
| | | | | | | | | | | | | | |
| | | Consumer Staples 0.2% | | | | | | | | | |
| d | | JBS USA LLC/Finance Inc., senior note, 144A, 7.25%, 6/01/21 | | | United States | | | | 12,500,000 | | | | 12,765,625 | |
| | | | | | | | | | | | | | |
FRANKLIN TEMPLETON VARIABLE INSURANCE PRODUCTS TRUST
STATEMENT OF INVESTMENTS
Franklin Income VIP Fund (continued)
| | | | | | | | | | | | | | |
| | | | | Country | | | Principal Amount* | | | Value | |
| | Corporate Bonds (continued) | | | | | | | | | | | | |
| | Energy 6.8% | | | | | | | | | | | | |
| d | | Ascent Resources Utica Holdings LLC/ARU Finance Corp., senior note, 144A, 10.00%, 4/01/22 | | | United States | | | | 25,000,000 | | | $ | 26,937,500 | |
| | Bill Barrett Corp., | | | | | | | | | | | | |
| | senior bond, 7.00%, 10/15/22 | | | United States | | | | 17,937,000 | | | | 18,363,004 | |
| | senior note, 8.75%, 6/15/25 | | | United States | | | | 23,400,000 | | | | 25,974,000 | |
| | Calumet Specialty Products Partners LP/Calumet Finance Corp., senior note, 6.50%, 4/15/21 | | | United States | | | | 13,500,000 | | | | 13,500,000 | |
| | Chesapeake Energy Corp., | | | | | | | | | | | | |
| | d secured note, second lien, 144A, 8.00%, 12/15/22 | | | United States | | | | 29,388,000 | | | | 31,812,510 | |
| | senior bond, 6.125%, 2/15/21 | | | United States | | | | 16,000,000 | | | | 16,280,000 | |
| | d senior bond, 144A, 8.00%, 6/15/27 | | | United States | | | | 26,000,000 | | | | 25,025,000 | |
| | senior note, 5.375%, 6/15/21 | | | United States | | | | 11,045,000 | | | | 10,713,650 | |
| | senior note, 4.875%, 4/15/22 | | | United States | | | | 5,000,000 | | | | 4,762,500 | |
| | senior note, 5.75%, 3/15/23 | | | United States | | | | 5,000,000 | | | | 4,650,000 | |
| | d senior note, 144A, 8.00%, 1/15/25 | | | United States | | | | 21,500,000 | | | | 21,741,875 | |
| | e senior note, FRN, 4.609%, (3-month USD LIBOR + 3.25%), 4/15/19 | | | United States | | | | 14,000,000 | | | | 14,000,000 | |
| | Ferrellgas LP/Ferrellgas Finance Corp., senior note, 6.50%, 5/01/21 | | | United States | | | | 9,500,000 | | | | 8,941,875 | |
| | Kinder Morgan Inc., | | | | | | | | | | | | |
| | senior bond, 7.75%, 1/15/32 | | | United States | | | | 22,000,000 | | | | 28,465,821 | |
| | d senior secured bond, first lien, 144A, 5.625%, 11/15/23 | | | United States | | | | 7,000,000 | | | | 7,736,961 | |
| d | | McDermott International Inc., secured note, second lien, 144A, 8.00%, 5/01/21 | | | United States | | | | 17,592,000 | | | | 18,169,897 | |
| f | | Petroquest Energy Inc., secured note, second lien, PIK, 10.00%, 2/15/21 | | | United States | | | | 1,582,920 | | | | 1,210,934 | |
| | Rex Energy Corp., second lien, 8.00%, 10/01/20 | | | United States | | | | 5,000,000 | | | | 1,950,000 | |
| | Sanchez Energy Corp., senior note, 7.75%, 6/15/21 | | | United States | | | | 27,000,000 | | | | 25,515,000 | |
| | Stone Energy Corp., senior note, 7.50%, 5/31/22 | | | United States | | | | 6,452,837 | | | | 6,565,762 | |
| d,f | | W&T Offshore Inc., | | | | | | | | | | | | |
| | secured note, second lien, 144A, PIK, 9.00%, 5/15/20 | | | United States | | | | 10,885,862 | | | | 10,423,213 | |
| | senior secured note, third lien, 144A, PIK, 10.00%, 6/15/21 | | | United States | | | | 9,707,248 | | | | 7,542,322 | |
| | Weatherford International Ltd., | | | | | | | | | | | | |
| | senior note, 5.125%, 9/15/20 | | | United States | | | | 17,500,000 | | | | 17,521,000 | |
| | senior note, 7.75%, 6/15/21 | | | United States | | | | 30,000,000 | | | | 30,693,750 | |
| | senior note, 4.50%, 4/15/22 | | | United States | | | | 11,900,000 | | | | 10,829,000 | |
| | senior note, 8.25%, 6/15/23 | | | United States | | | | 27,500,000 | | | | 27,843,750 | |
| | | | | | | | | | | | | | |
| | | | | | | | | | | | | 417,169,324 | |
| | | | | | | | | | | | | | |
| | | Financials 3.1% | | | | | | | | | |
| g | | Bank of America Corp., | | | | | | | | | | | | |
| | junior sub. bond, AA, 6.10% to 3/17/25, FRN thereafter, Perpetual | | | United States | | | | 8,000,000 | | | | 8,790,000 | |
| | junior sub. bond, M, 8.125% to 5/15/18, FRN thereafter, Perpetual | | | United States | | | | 5,000,000 | | | | 5,068,750 | |
| | junior sub. bond, U, 5.20% to 6/01/23, FRN thereafter, Perpetual | | | United States | | | | 6,000,000 | | | | 6,106,500 | |
| | junior sub. bond, X, 6.25% to 9/05/24, FRN thereafter, Perpetual | | | United States | | | | 6,000,000 | | | | 6,637,800 | |
| g | | Citigroup Inc., | | | | | | | | | | | | |
| | junior sub. bond, 5.35% to 5/15/23, FRN thereafter, Perpetual | | | United States | | | | 10,000,000 | | | | 10,237,500 | |
| | junior sub. bond, 5.90% to 2/15/23, FRN thereafter, Perpetual | | | United States | | | | 12,500,000 | | | | 13,343,750 | |
| | junior sub. bond, 5.95% to 1/30/23, FRN thereafter, Perpetual | | | United States | | | | 4,500,000 | | | | 4,792,500 | |
| | junior sub. bond, M, 6.30% to 5/15/24, FRN thereafter, Perpetual | | | United States | | | | 16,800,000 | | | | 18,018,000 | |
| | junior sub. bond, O, 5.875% to 3/27/20, FRN thereafter, Perpetual | | | United States | | | | 25,000,000 | | | | 25,968,750 | |
| | junior sub. bond, Q, 5.95% to 8/15/20, FRN thereafter, Perpetual | | | United States | | | | 10,000,000 | | | | 10,468,750 | |
| g | | JPMorgan Chase & Co., | | | | | | | | | | | | |
| | junior sub. bond, I, 7.90% to 4/30/19, FRN thereafter, Perpetual | | | United States | | | | 40,000,000 | | | | 40,550,000 | |
| | junior sub. bond, R, 6.00% to 8/01/23, FRN thereafter, Perpetual | | | United States | | | | 3,200,000 | | | | 3,448,160 | |
| | junior sub. bond, V, 5.00% to 7/30/19, FRN thereafter, Perpetual | | | United States | | | | 10,000,000 | | | | 10,186,300 | |
FRANKLIN TEMPLETON VARIABLE INSURANCE PRODUCTS TRUST
STATEMENT OF INVESTMENTS
Franklin Income VIP Fund (continued)
| | | | | | | | | | | | | | |
| | | | | Country | | | Principal Amount* | | | Value | |
| | Corporate Bonds (continued) | | | | | | | | | | | | |
| | Financials (continued) | | | | | | | | | | | | |
| g | | Morgan Stanley, junior sub. bond, 5.55% to 7/15/20, FRN thereafter, Perpetual | | | United States | | | | 7,300,000 | | | $ | 7,592,000 | |
| d | | OneMain Financial Holdings Inc., | | | | | | | | | | | | |
| | senior note, 144A, 6.75%, 12/15/19 | | | United States | | | | 6,000,000 | | | | 6,199,800 | |
| | senior note, 144A, 7.25%, 12/15/21 | | | United States | | | | 5,000,000 | | | | 5,199,125 | |
| | g Wells Fargo & Co., junior sub. bond, S, 5.90% to 6/15/24, FRN thereafter, Perpetual | | | United States | | | | 7,600,000 | | | | 8,139,220 | |
| | | | | | | | | | | | | | |
| | | | | | | | | | | | | 190,746,905 | |
| | | | | | | | | | | | | | |
| | | Health Care 8.7% | | | | | | | | | |
| | CHS/Community Health Systems Inc., | | | | | | | | | | | | |
| | senior note, 8.00%, 11/15/19 | | | United States | | | | 91,695,000 | | | | 78,169,987 | |
| | senior note, 7.125%, 7/15/20 | | | United States | | | | 35,000,000 | | | | 26,337,500 | |
| | senior note, 6.875%, 2/01/22 | | | United States | | | | 107,900,000 | | | | 62,582,000 | |
| | senior secured note, 5.125%, 8/01/21 | | | United States | | | | 3,000,000 | | | | 2,715,000 | |
| | senior secured note, first lien, 6.25%, 3/31/23 | | | United States | | | | 35,000,000 | | | | 31,675,000 | |
| | DaVita Inc., | | | | | | | | | | | | |
| | senior bond, 5.125%, 7/15/24 | | | United States | | | | 5,000,000 | | | | 5,059,375 | |
| | senior bond, 5.00%, 5/01/25 | | | United States | | | | 4,000,000 | | | | 4,008,800 | |
| d | | Endo DAC/Endo Finance LLC/Endo Finco Inc., | | | | | | | | | | | | |
| | senior bond, 144A, 6.00%, 2/01/25 | | | United States | | | | 10,000,000 | | | | 7,800,000 | |
| | senior note, 144A, 6.00%, 7/15/23 | | | United States | | | | 15,000,000 | | | | 11,850,000 | |
| d | | Endo Finance LLC, senior note, 144A, 5.75%, 1/15/22 | | | United States | | | | 22,500,000 | | | | 18,843,750 | |
| | HCA Inc., | | | | | �� | | | | | | | |
| | senior bond, 5.875%, 5/01/23 | | | United States | | | | 7,500,000 | | | | 8,025,000 | |
| | senior note, 7.50%, 2/15/22 | | | United States | | | | 25,000,000 | | | | 28,187,500 | |
| | senior secured note, first lien, 5.00%, 3/15/24 | | | United States | | | | 10,400,000 | | | | 10,842,000 | |
| | Horizon Pharma Inc., senior note, 6.625%, 5/01/23 | | | United States | | | | 9,000,000 | | | | 9,000,000 | |
| | Mallinckrodt International Finance SA, senior bond, 4.75%, 4/15/23 | | | United States | | | | 5,000,000 | | | | 3,950,000 | |
| d | | Mallinckrodt International Finance SA/Mallinckrodt CB LLC, | | | | | | | | | | | | |
| | senior note, 144A, 5.75%, 8/01/22 | | | United States | | | | 24,200,000 | | | | 22,082,500 | |
| | senior note, 144A, 5.625%, 10/15/23 | | | United States | | | | 14,300,000 | | | | 12,226,500 | |
| | senior note, 144A, 5.50%, 4/15/25 | | | United States | | | | 10,000,000 | | | | 8,200,000 | |
| | Tenet Healthcare Corp., | | | | | | | | | | | | |
| | d secured note, second lien, 144A, 5.125%, 5/01/25 | | | United States | | | | 2,500,000 | | | | 2,446,875 | |
| | senior note, 8.125%, 4/01/22 | | | United States | | | | 56,000,000 | | | | 57,190,000 | |
| | h senior note, 6.75%, 6/15/23 | | | United States | | | | 58,200,000 | | | | 56,672,250 | |
| d | | Valeant Pharmaceuticals International, senior note, 144A, 6.375%, 10/15/20 | | | United States | | | | 4,589,000 | | | | 4,646,363 | |
| d | | Valeant Pharmaceuticals International Inc., | | | | | | | | | | | | |
| | senior bond, 144A, 6.125%, 4/15/25 | | | United States | | | | 9,400,000 | | | | 8,636,250 | |
| | senior note, 144A, 5.375%, 3/15/20 | | | United States | | | | 23,559,000 | | | | 23,706,244 | |
| | senior note, 144A, 5.875%, 5/15/23 | | | United States | | | | 12,500,000 | | | | 11,609,375 | |
| | senior note, 144A, 9.00%, 12/15/25 | | | United States | | | | 5,000,000 | | | | 5,223,500 | |
| | senior note, first lien, 144A, 7.00%, 3/15/24 | | | United States | | | | 4,500,000 | | | | 4,826,250 | |
| | senior secured note, first lien, 144A, 6.50%, 3/15/22 | | | United States | | | | 3,000,000 | | | | 3,157,500 | |
| | | | | | | | | | | | | | |
| | | | | | | | | | | | | 529,669,519 | |
| | | | | | | | | | | | | | |
| | | Industrials 1.1% | | | | | | | | | |
| d | | Bombardier Inc., senior bond, 144A, 6.125%, 1/15/23 | | | Canada | | | | 5,000,000 | | | | 4,925,000 | |
| d,f | | CEVA Group PLC, senior secured note, first lien, PIK, 144A, 9.00%, 9/01/20 | | | United Kingdom | | | | 13,230,336 | | | | 13,495,864 | |
| d | | Cloud Crane LLC, secured note, second lien, 144A, 10.125%, 8/01/24 | | | United States | | | | 4,400,000 | | | | 4,972,000 | |
| | TransDigm Inc., senior sub. note, 6.00%, 7/15/22 | | | United States | | | | 7,200,000 | | | | 7,380,000 | |
| d | | West Corp., senior note, 144A, 8.50%, 10/15/25 | | | United States | | | | 11,000,000 | | | | 10,917,500 | |
FRANKLIN TEMPLETON VARIABLE INSURANCE PRODUCTS TRUST
STATEMENT OF INVESTMENTS
Franklin Income VIP Fund (continued)
| | | | | | | | | | | | | | |
| | | | | Country | | | Principal Amount* | | | Value | |
| | Corporate Bonds (continued) | | | | | | | | | | | | |
| | Industrials (continued) | | | | | | | | | | | | |
| d | | XPO Logistics Inc., senior note, 144A, 6.50%, 6/15/22 | | | United States | | | | 22,980,000 | | | $ | 24,071,550 | |
| | | | | | | | | | | | | | |
| | | | | | | | | | | | | 65,761,914 | |
| | | | | | | | | | | | | | |
| | | Information Technology 2.5% | | | | | | | | | |
| d | | BMC Software Finance Inc., senior note, 144A, 8.125%, 7/15/21 | | | United States | | | | 16,500,000 | | | | 16,685,625 | |
| d | | CommScope Inc., senior bond, 144A, 5.50%, 6/15/24 | | | United States | | | | 10,000,000 | | | | 10,437,500 | |
| d | | Dell International LLC/EMC Corp., | | | | | | | | | | | | |
| | senior secured note, first lien, 144A, 4.42%, 6/15/21 | | | United States | | | | 12,500,000 | | | | 13,034,163 | |
| | senior secured note, first lien, 144A, 5.45%, 6/15/23 | | | United States | | | | 21,100,000 | | | | 22,824,523 | |
| d | | First Data Corp., | | | | | | | | | | | | |
| | secured note, second lien, 144A, 5.75%, 1/15/24 | | | United States | | | | 5,000,000 | | | | 5,211,250 | |
| | senior note, 144A, 7.00%, 12/01/23 | | | United States | | | | 25,000,000 | | | | 26,500,000 | |
| | NCR Corp., | | | | | | | | | | | | |
| | senior note, 5.00%, 7/15/22 | | | United States | | | | 5,500,000 | | | | 5,623,750 | |
| | senior note, 6.375%, 12/15/23 | | | United States | | | | 7,000,000 | | | | 7,350,000 | |
| | Western Digital Corp., | | | | | | | | | | | | |
| | senior note, 10.50%, 4/01/24 | | | United States | | | | 30,000,000 | | | | 34,837,500 | |
| | d senior secured note, 144A, 7.375%, 4/01/23 | | | United States | | | | 10,000,000 | | | | 10,812,500 | |
| | | | | | | | | | | | | | |
| | | | | | | | | | | | | 153,316,811 | |
| | | | | | | | | | | | | | |
| | | Materials 1.6% | | | | | | | | | |
| d | | Ardagh Packaging Finance PLC/Ardagh MP Holdings USA Inc., senior note, 144A, 7.25%, 5/15/24 | | | Luxembourg | | | | 8,300,000 | | | | 9,067,750 | |
| d | | BWAY Holding Co., | | | | | | | | | | | | |
| | secured note, 144A, 5.50%, 4/15/24 | | | United States | | | | 10,000,000 | | | | 10,425,000 | |
| | senior note, 144A, 7.25%, 4/15/25 | | | United States | | | | 23,000,000 | | | | 23,805,000 | |
| d | | Cemex Finance LLC, senior secured note, first lien, 144A, 6.00%, 4/01/24 | | | Mexico | | | | 14,700,000 | | | | 15,569,799 | |
| d | | FMG Resources (August 2006) Pty. Ltd., | | | | | | | | | | | | |
| | senior note, 144A, 4.75%, 5/15/22 | | | Australia | | | | 3,600,000 | | | | 3,651,012 | |
| | senior note, 144A, 5.125%, 5/15/24 | | | Australia | | | | 6,700,000 | | | | 6,855,641 | |
| | senior secured note, 144A, 9.75%, 3/01/22 | | | Australia | | | | 27,000,000 | | | | 30,037,500 | |
| | | | | | | | | | | | | | |
| | | | | | | | | | | | | 99,411,702 | |
| | | | | | | | | | | | | | |
| | | Real Estate 0.4% | | | | | | | | | |
| | Equinix Inc., senior bond, 5.375%, 5/15/27 | | | United States | | | | 16,500,000 | | | | 17,696,250 | |
| | Iron Mountain Inc., senior sub. bond, 5.75%, 8/15/24 | | | United States | | | | 3,000,000 | | | | 3,052,500 | |
| | iStar Inc., senior note, 5.00%, 7/01/19 | | | United States | | | | 3,500,000 | | | | 3,519,687 | |
| | | | | | | | | | | | | | |
| | | | | | | | | | | | | 24,268,437 | |
| | | | | | | | | | | | | | |
| | | Telecommunication Services 2.0% | | | | | | | | | |
| | Sprint Capital Corp., senior note, 6.90%, 5/01/19 | | | United States | | | | 13,500,000 | | | | 14,158,125 | |
| | Sprint Communications Inc., | | | | | | | | | | | | |
| | senior bond, 11.50%, 11/15/21 | | | United States | | | | 30,000,000 | | | | 36,375,000 | |
| | senior note, 7.00%, 8/15/20 | | | United States | | | | 7,500,000 | | | | 7,968,750 | |
| | d senior note, 144A, 9.00%, 11/15/18 | | | United States | | | | 11,900,000 | | | | 12,540,815 | |
| | Sprint Corp., | | | | | | | | | | | | |
| | senior bond, 7.875%, 9/15/23 | | | United States | | | | 37,500,000 | | | | 40,031,250 | |
| | senior bond, 7.125%, 6/15/24 | | | United States | | | | 8,200,000 | | | | 8,364,000 | |
| | | | | | | | | | | | | | |
| | | | | | | | | | | | | 119,437,940 | |
| | | | | | | | | | | | | | |
FRANKLIN TEMPLETON VARIABLE INSURANCE PRODUCTS TRUST
STATEMENT OF INVESTMENTS
Franklin Income VIP Fund (continued)
| | | | | | | | | | | | | | |
| | | | | Country | | | Principal Amount* | | | Value | |
| | Corporate Bonds (continued) | | | | | | | | | | | | |
| | Utilities 2.4% | | | | | | | | | | | | |
| | Calpine Corp., | | | | | | | | | | | | |
| | senior bond, 5.75%, 1/15/25 | | | United States | | | | 22,000,000 | | | $ | 20,982,500 | |
| | senior note, 5.375%, 1/15/23 | | | United States | | | | 20,000,000 | | | | 19,550,000 | |
| | senior note, 5.50%, 2/01/24 | | | United States | | | | 16,375,000 | | | | 15,720,000 | |
| | Dynegy Inc., | | | | | | | | | | | | |
| | senior note, 6.75%, 11/01/19 | | | United States | | | | 32,494,000 | | | | 33,468,820 | |
| | senior note, 7.375%, 11/01/22 | | | United States | | | | 20,000,000 | | | | 21,150,000 | |
| | senior note, 5.875%, 6/01/23 | | | United States | | | | 8,000,000 | | | | 8,140,000 | |
| | Ferrellgas Partners LP/Ferrellgas Partners Finance Corp., senior note, 8.625%, 6/15/20 | | | United States | | | | 6,600,000 | | | | 5,659,500 | |
| d | | InterGen NV, secured bond, 144A, 7.00%, 6/30/23 | | | Netherlands | | | | 25,000,000 | | | | 24,349,125 | |
| | | | | | | | | | | | | | |
| | | | | | | | | | | | | 149,019,945 | |
| | | | | | | | | | | | | | |
| | | | |
| | Total Corporate Bonds (Cost $1,945,753,606) | | | | | | | | | | | 1,998,363,689 | |
| | | | | | | | | | | | | | |
| e,i | | Senior Floating Rate Interests 3.7% | | | | | | | | | | | | |
| | | Consumer Discretionary 1.4% | | | | | | | | | |
| | 24 Hour Fitness Worldwide Inc., Term Loan, 5.443%, (LIBOR + 3.75%), 5/28/21. | | | United States | | | | 4,476,804 | | | | 4,483,331 | |
| | Academy Ltd., Initial Term Loan, 5.495% - 5.569%, (LIBOR + 4.00%), 7/02/22 | | | United States | | | | 1,579,812 | | | | 1,248,052 | |
| | Belk Inc., Closing Date Term Loan, 6.099%, (LIBOR + 4.75%), 12/12/22 | | | United States | | | | 24,545,775 | | | | 20,153,112 | |
| | BJ’s Wholesale Club Inc., | | | | | | | | | | | | |
| | Second Lien Initial Term Loans, 8.953%, (LIBOR + 7.50%), 3/24/25 | | | United States | | | | 6,000,000 | | | | 5,871,252 | |
| | Tranche B Term Loans, 4.953%, (LIBOR + 3.50%), 3/27/24 | | | United States | | | | 10,972,431 | | | | 10,810,961 | |
| | iHeartCommunications Inc., | | | | | | | | | | | | |
| | Tranche D Term Loan, 8.443%, (LIBOR + 6.75%), 1/30/19 | | | United States | | | | 45,864,664 | | | | 34,608,695 | |
| | Tranche E Term Loan, 9.193%, (LIBOR + 7.50%), 7/30/19 | | | United States | | | | 13,142,769 | | | | 9,884,453 | |
| | | | | | | | | | | | | | |
| | | | | | | | | | | | | 87,059,856 | |
| | | | | | | | | | | | | | |
| | | Consumer Staples 0.2% | | | | | | | | | |
| | Almonde Inc., Dollar Term Loan, 4.979%, (LIBOR + 3.50%), 6/13/24 | | | United States | | | | 14,962,500 | | | | 15,021,767 | |
| | | | | | | | | | | | | | |
| | | Energy 0.2% | | | | | | | | | |
| | W&T Offshore Inc., Second Lien Term Loan, 9.00%, 5/15/20 | | | United States | | | | 11,000,000 | | | | 10,752,500 | |
| | | | | | | | | | | | | | |
| | | Health Care 0.4% | | | | | | | | | |
| | Community Health Systems Inc., 2021 Term H Loans, 4.479%, (LIBOR + 3.00%), 1/15/21 | | | United States | | | | 6,570,898 | | | | 6,276,574 | |
| | Vizient Inc., Term B-3 Loans, 5.069%, (LIBOR + 3.50%), 5/02/24 | | | United States | | | | 16,420,588 | | | | 16,504,399 | |
| | | | | | | | | | | | | | |
| | | | | | | | | | | | | 22,780,973 | |
| | | | | | | | | | | | | | |
| | | Industrials 0.8% | | | | | | | | | |
| | CEVA Group PLC, Pre-Funded L/C, 6.50%, (LIBOR + 5.50%), 3/19/21 | | | United Kingdom | | | | 4,865,761 | | | | 4,649,843 | |
| | CEVA Intercompany BV, Dutch BV Term Loan, 6.878%, (LIBOR + 5.50%), 3/19/21 | | | United Kingdom | | | | 4,938,748 | | | | 4,719,590 | |
| | CEVA Logistics Canada ULC, Canadian Term Loan, 6.878%, (LIBOR + 5.50%), 3/19/21 | | | Canada | | | | 851,508 | | | | 813,723 | |
| | CEVA Logistics U.S. Holdings Inc., U.S. Term Loan, 6.878%, (LIBOR + 5.50%), 3/19/21 | | | United Kingdom | | | | 6,812,065 | | | | 6,509,780 | |
| | Commercial Barge Line Co., Initial Term Loan, 10.319%, (LIBOR + 8.75%), 11/12/20 | | | United States | | | | 9,125,000 | | | | 5,218,359 | |
| | Navistar Inc., Tranche B Term Loan, 4.90%, (LIBOR + 3.50%), 11/06/24 | | | United States | | | | 1,000,000 | | | | 1,005,938 | |
| | Vertiv Group Corp., Term B Loans, 5.35%, (LIBOR + 4.00%), 11/30/23 | | | United States | | | | 8,574,569 | | | | 8,587,963 | |
| | West Corp., Term B Loans, 5.35%, (LIBOR + 4.00%), 10/10/24 | | | United States | | | | 17,637,669 | | | | 17,724,640 | |
| | | | | | | | | | | | | | |
| | | | | | | | | | | | | 49,229,836 | |
| | | | | | | | | | | | | | |
FRANKLIN TEMPLETON VARIABLE INSURANCE PRODUCTS TRUST
STATEMENT OF INVESTMENTS
Franklin Income VIP Fund (continued)
| | | | | | | | | | | | | | |
| | | | | Country | | | Principal Amount* | | | Value | |
e,i | | Senior Floating Rate Interests (continued) | | | | | | | | | | | | |
| | | Information Technology 0.2% | | | | | | | | | |
| | MH Sub I LLC and Micro Holding Corp., | | | | | | | | | | | | |
| | Amendment No. 2 Initial Term Loan, 5.338%, (LIBOR + 3.75%), 9/15/24 | | | United States | | | | 4,987,500 | | | $ | 5,006,647 | |
| | Second Lien Initial Term Loan, 9.088%, (LIBOR + 7.50%), 9/15/25 | | | United States | | | | 5,000,000 | | | | 5,034,375 | |
| | | | | | | | | | | | | | |
| | | | | | | | | | | | | 10,041,022 | |
| | | | | | | | | | | | | | |
| | | Telecommunication Services 0.1% | | | | | | | | | |
| j | | Securus Technologies Holdings Inc., Second Lien Initial Loan, 9.873%, (LIBOR + 8.25%), 11/01/25 | | | United States | | | | 6,000,000 | | | | 6,072,498 | |
| | | | | | | | | | | | | | |
| | | Utilities 0.4% | | | | | | | | | |
| j | | Intergen NV, Term Advance, 6.07%, (LIBOR + 4.50%), 6/13/20 | | | Netherlands | | | | 12,068,131 | | | | 12,090,759 | |
| | Talen Energy Supply LLC, | | | | | | | | | | | | |
| | Term B-1 Loans, 5.569%, (LIBOR + 4.00%), 7/15/23 | | | United States | | | | 5,955,000 | | | | 6,013,311 | |
| | Tranche B-2 Term Loan, 5.569%, (LIBOR + 4.00%), 4/13/24 | | | United States | | | | 7,928,000 | | | | 7,975,077 | |
| | | | | | | | | | | | | | |
| | | | | | | | | | | | | 26,079,147 | |
| | | | | | | | | | | | | | |
| | | | |
| | Total Senior Floating Rate Interests (Cost $244,303,063) | | | | | | | | | | | 227,037,599 | |
| | | | | | | | | | | | | | |
| | | | |
| | | | | | | | Shares | | | | |
| | Escrows and Litigation Trusts 0.0% | | | | | | | | | | | | |
| b,k | | Impax Laboratories Inc., Escrow Account | | | United States | | | | 2,500,000 | | | | — | |
| b,k | | Motors Liquidation Co., Escrow Account, cvt. pfd., C | | | United States | | | | 1,400,000 | | | | — | |
| | | | | | | | | | | | | | |
| | | | |
| | Total Escrows and Litigation Trusts (Cost $62,602) | | | | | | | | | | | — | |
| | | | | | | | | | | | | | |
| | | | |
| | | | | Number of
Contracts | | | Notional Amount* | | | | |
| | Options Purchased (Cost $2,247,000) 0.0%† | | | | | | | | | | | | |
| | | Calls - Exchange-Traded | | | | | | | | | |
| | CBOE SPX Volatility Index, February Strike Price $15, Expires 2/14/18 | | | 10,000 | | | | 1,000,000 | | | | 1,100,000 | |
| | | | | | | | | | | | | | |
| | | | |
| | Total Investments before Short Term Investments
(Cost $5,001,888,971) | | | | | | | | | | | 5,682,540,892 | |
| | | | | | | | | | | | | | |
| | | | | Country | | | Shares | | | | |
| | Short Term Investments 5.8% | | | | | | | | | | | | |
| | Money Market Funds (Cost $351,784,455) 5.8% | | | | | | | | | | | | |
| l,m | | Institutional Fiduciary Trust Money Market Portfolio, 0.89% | | | United States | | | | 351,784,455 | | | | 351,784,455 | |
| | | | | | | | | | | | | | |
| n | | Investments from Cash Collateral Received for Loaned Securities 0.0%† | | | | | | | | | | | | |
| | | Money Market Funds (Cost $1,040,000) 0.0%† | | | | | | | | | |
| l,m | | Institutional Fiduciary Trust Money Market Portfolio, 0.89% | | | United States | | �� | | 1,040,000 | | | | 1,040,000 | |
| | | | | | | | | | | | | | |
FRANKLIN TEMPLETON VARIABLE INSURANCE PRODUCTS TRUST
STATEMENT OF INVESTMENTS
Franklin Income VIP Fund (continued)
| | | | | | | | | | | | | | |
| | | | | Country | | | Principal Amount* | | | Value | |
| | Repurchase Agreement (Cost $260,765) 0.0%† | | | | | | | | | | | | |
| o | | Joint Repurchase Agreement, 1.38%, 1/02/18 (Maturity Value $260,805) | | | | | | | | | | | | |
| | BNP Paribas Securities Corp. | | | | | | | | | | | | |
| | Collateralized by U.S. Treasury Bond, 8.13%, 5/15/21; U.S. Treasury Note, 1.13%, 8/31/21; eU.S. Treasury Note, FRN, 1.51%, 7/31/19; U.S. Treasury, Strip, 2/15/18 - 5/15/22 (Valued at $265,981) | | | United States | | | | 260,765 | | | $ | 260,765 | |
| | | | | | | | | | | | | | |
| | | | |
| | Total Investments from Cash Collateral Received for Loaned Securities (Cost $1,300,765) | | | | | | | | | | | 1,300,765 | |
| | | | | | | | | | | | | | |
| | | | |
| | Total Investments (Cost $5,354,974,191) 98.8% | | | | | | | | | | | 6,035,626,112 | |
| | Options Written (0.0)%† | | | | | | | | | | | (1,934,000 | ) |
| | Other Assets, less Liabilities 1.2% | | | | | | | | | | | 78,171,602 | |
| | | | | | | | | | | | | | |
| | Net Assets 100.0% | | | | | | | | | | $ | 6,111,863,714 | |
| | | | | | | | | | | | | | |
| | | | |
| | | | | Number of
Contracts | | | Notional Amount* | | | | |
| p | | Options Written (0.0)%† | | | | | | | | | | | | |
| | | Calls - Exchange-Traded | | | | | | | | | |
| | Anheuser-Busch InBev SA/NV, January Strike Price $125, Expires 1/19/18 | | | 2,500 | | | | 250,000 | | | | (7,500 | ) |
| | Apple Inc., January Strike Price $190, Expires 1/19/18 | | | 3,000 | | | | 300,000 | | | | (21,000 | ) |
| | Chevron Corp., Febraury Strike Price $125, Expires 2/16/18 | | | 2,500 | | | | 250,000 | | | | (792,500 | ) |
| | The Coca-Cola Co., February Strike Price $47, Expires 2/16/18 | | | 3,250 | | | | 325,000 | | | | (123,500 | ) |
| | Intel Corp., January Strike Price $47, Expires 1/19/18 | | | 2,000 | | | | 200,000 | | | | (102,000 | ) |
| | | | | | | | | | | | | | |
| | | | | | | | | | | | | (1,046,500 | ) |
| | | | | | | | | | | | | | |
| | | Puts - Exchange-Traded | | | | | | | | | |
| | Anheuser-Busch InBev SA/NV, January Strike Price $115, Expires 1/19/18 | | | 2,500 | | | | 250,000 | | | | (887,500 | ) |
| | Cummins Inc., January Strike Price $150, Expires 1/19/18 | | | 1,650 | | | | 165,000 | | | | — | |
| | | | | | | | | | | | | | |
| | | | | | | | | | | | | (887,500 | ) |
| | | | | | | | | | | | | | |
| | | |
| | Total Options Written (Premiums received $1,358,106) | | | | | | | $ | (1,934,000 | ) |
| | | | | | | | | | | | | | |
FRANKLIN TEMPLETON VARIABLE INSURANCE PRODUCTS TRUST
STATEMENT OF INVESTMENTS
Franklin Income VIP Fund (continued)
See Abbreviations on page FI-37.
†Rounds to less than 0.1% of net assets.
*The principal/notional amount is stated in U.S. dollars unless otherwise indicated.
aA portion or all of the security is held in connection with written option contracts open at year end.
bNon-income producing.
cSee Note 1(f) regarding equity-linked securities.
dSecurity was purchased pursuant to Rule 144A under the Securities Act of 1933 and may be sold in transactions exempt from registration only to qualified institutional buyers or in a public offering registered under the Securities Act of 1933. These securities have been deemed liquid under guidelines approved by the Trust’s Board of Trustees. At December 31, 2017, the aggregate value of these securities was $1,010,398,896, representing 16.5% of net assets.
eThe coupon rate shown represents the rate at period end.
fIncome may be received in additional securities and/or cash.
gPerpetual security with no stated maturity date.
hA portion or all of the security is on loan at December 31, 2017. See Note 1(g).
iSee Note 1(h) regarding senior floating rate interests.
jSecurity purchased on a delayed delivery basis. See Note 1(d).
kFair valued using significant unobservable inputs. See Note 10 regarding fair value measurements.
lSee Note 3(e) regarding investments in affiliated management investment companies.
mThe rate shown is the annualized seven-day yield at period end.
nSee Note 1(g) regarding securities on loan.
oSee Note 1(c) regarding joint repurchase agreement.
pSee Note 1(e) regarding written options.
| | | | |
| FI-22 | | Annual Report | The accompanying notes are an integral part of these financial statements. |
FRANKLIN TEMPLETON VARIABLE INSURANCE PRODUCTS TRUST
Financial Statements
Statement of Assets and Liabilities
December 31, 2017
| | | | |
| | | Franklin Income VIP Fund | |
Assets: | | | | |
+Investments in securities: | | | | |
Cost - Unaffiliated issuers | | $ | 5,001,888,971 | |
Cost - Non-controlled affiliates (Note 3e) | | | 352,824,455 | |
Cost - Unaffiliated repurchase agreements | | | 260,765 | |
| | | | |
Value - Unaffiliated issuers | | $ | 5,682,540,892 | |
Value - Non-controlled affiliates (Note 3e) | | | 352,824,455 | |
Value - Unaffiliated repurchase agreements | | | 260,765 | |
Cash | | | 2,481,648 | |
Receivables: | | | | |
Investment securities sold | | | 6,246,355 | |
Capital shares sold | | | 2,861,235 | |
Dividends and interest | | | 40,485,265 | |
Deposits with brokers for: | | | | |
Exchange traded options written | | | 53,500,000 | |
Other assets | | | 708 | |
| | | | |
Total assets | | | 6,141,201,323 | |
| | | | |
Liabilities: | | | | |
Payables: | | | | |
Investment securities purchased | | | 18,101,882 | |
Capital shares redeemed | | | 2,883,631 | |
Management fees | | | 2,259,984 | |
Distribution fees | | | 2,297,686 | |
Options written, at value (premiums received $1,358,106) | | | 1,934,000 | |
Payable upon return of securities loaned | | | 1,300,765 | |
Accrued expenses and other liabilities | | | 559,661 | |
Total liabilities | | | 29,337,609 | |
| | | | |
Net assets, at value | | $ | 6,111,863,714 | |
| | | | |
Net assets consist of: | | | | |
Paid-in capital | | $ | 5,396,834,455 | |
Undistributed net investment income | | | 269,525,427 | |
Net unrealized appreciation (depreciation) | | | 680,117,668 | |
Accumulated net realized gain (loss) | | | (234,613,836 | ) |
| | | | |
Net assets, at value | | $ | 6,111,863,714 | |
| | | | |
| |
+Includes securities loaned | | $ | 1,273,665 | |
| | | | | | |
| | | The accompanying notes are an integral part of these financial statements. | Annual Report | | | FI-23 | |
FRANKLIN TEMPLETON VARIABLE INSURANCE PRODUCTS TRUST
FINANCIAL STATEMENTS
Statement of Assets and Liabilities (continued)
December 31, 2017
| | | | |
| | | Franklin Income VIP Fund | |
| |
| Class 1: | | | | |
Net assets, at value | | $ | 735,149,204 | |
| | | | |
Shares outstanding | | | 43,973,661 | |
| | | | |
Net asset value and maximum offering price per share | | $ | 16.72 | |
| | | | |
| |
| Class 2: | | | | |
Net assets, at value | | $ | 5,041,497,597 | |
| | | | |
Shares outstanding | | | 311,797,041 | |
| | | | |
Net asset value and maximum offering price per share | | $ | 16.17 | |
| | | | |
| |
| Class 4: | | | | |
Net assets, at value | | $ | 335,216,913 | |
| | | | |
Shares outstanding | | | 20,274,405 | |
| | | | |
Net asset value and maximum offering price per share | | $ | 16.53 | |
| | | | |
| | | | |
| FI-24 | | Annual Report | The accompanying notes are an integral part of these financial statements. | | |
FRANKLIN TEMPLETON VARIABLE INSURANCE PRODUCTS TRUST
FINANCIAL STATEMENTS
Statement of Operations
for the year ended December 31, 2017
| | | | |
| | | Franklin Income VIP Fund | |
Investment income: | | | | |
Dividends: (net of foreign taxes)* | | | | |
Unaffiliated issuers | | $ | 123,644,185 | |
Non-controlled affiliates (Note 3e) | | | 2,145,830 | |
Interest: | | | | |
Unaffiliated issuers | | | 160,153,136 | |
Income from securities loaned (net of fees and rebates) | | | 1,601,618 | |
| | | | |
Total investment income | | | 287,544,769 | |
| | | | |
Expenses: | | | | |
Management fees (Note 3a) | | | 27,949,823 | |
Distribution fees: (Note 3c) | | | | |
Class 2 | | | 12,768,659 | |
Class 4 | | | 1,126,331 | |
Custodian fees (Note 4) | | | 74,246 | |
Reports to shareholders | | | 442,696 | |
Professional fees | | | 327,437 | |
Trustees’ fees and expenses | | | 26,275 | |
Other | | | 246,383 | |
| | | | |
Total expenses | | | 42,961,850 | |
Expense reductions (Note 4) | | | (4,592 | ) |
Expenses waived/paid by affiliates (Note 3e) | | | (1,493,314 | ) |
| | | | |
Net expenses | | | 41,463,944 | |
| | | | |
Net investment income | | | 246,080,825 | |
| | | | |
Realized and unrealized gains (losses): | | | | |
Net realized gain (loss) from: | | | | |
Investments: | | | | |
Unaffiliated issuers | | | 160,238,716 | |
Written options | | | 803,328 | |
Realized gain distributions from REITs | | | 307,701 | |
Foreign currency transactions | | | 31,742 | |
| | | | |
Net realized gain (loss) | | | 161,381,487 | |
| | | | |
Net change in unrealized appreciation (depreciation) on: | | | | |
Investments: | | | | |
Unaffiliated issuers | | | 163,439,787 | |
Translation of other assets and liabilities denominated in foreign currencies | | | 69,342 | |
Written options | | | (575,894 | ) |
| | | | |
Net change in unrealized appreciation (depreciation) | | | 162,933,235 | |
| | | | |
Net realized and unrealized gain (loss) | | | 324,314,722 | |
| | | | |
Net increase (decrease) in net assets resulting from operations | | $ | 570,395,547 | |
| | | | |
| |
*Foreign taxes withheld on dividends | | $ | 3,293,736 | |
| | | | | | |
| | | The accompanying notes are an integral part of these financial statements. | Annual Report | | | FI-25 | |
FRANKLIN TEMPLETON VARIABLE INSURANCE PRODUCTS TRUST
FINANCIAL STATEMENTS
Statements of Changes in Net Assets
| | | | | | | | |
| | | Franklin Income VIP Fund | |
| | | Year Ended December 31, | |
| | | 2017 | | | 2016 | |
Increase (decrease) in net assets: | | | | | | | | |
Operations: | | | | | | | | |
Net investment income | | $ | 246,080,825 | | | $ | 247,868,765 | |
Net realized gain (loss) | | | 161,381,487 | | | | 23,444,659 | |
Net change in unrealized appreciation (depreciation) | | | 162,933,235 | | | | 499,690,603 | |
| | | | |
Net increase (decrease) in net assets resulting from operations | | | 570,395,547 | | | | 771,004,027 | |
| | | | |
Distributions to shareholders from: | | | | | | | | |
Net investment income: | | | | | | | | |
Class 1 | | | (30,736,550 | ) | | | (33,648,017 | ) |
Class 2 | | | (212,433,443 | ) | | | (243,664,392 | ) |
Class 4 | | | (12,598,021 | ) | | | (14,419,491 | ) |
| | | | |
Total distributions to shareholders | | | (255,768,014 | ) | | | (291,731,900 | ) |
| | | | |
Capital share transactions: (Note 2) | | | | | | | | |
Class 1 | | | 1,111,670 | | | | 34,616,416 | |
Class 2 | | | (307,051,941 | ) | | | (215,782,069 | ) |
Class 4 | | | 8,458,865 | | | | (21,239,696 | ) |
| | | | |
Total capital share transactions | | | (297,481,406 | ) | | | (202,405,349 | ) |
| | | | |
Net increase (decrease) in net assets | | | 17,146,127 | | | | 276,866,778 | |
Net assets: | | | | | | | | |
Beginning of year | | | 6,094,717,587 | | | | 5,817,850,809 | |
| | | | |
End of year | | $ | 6,111,863,714 | | | $ | 6,094,717,587 | |
| | | | |
Undistributed net investment income included in net assets: | | | | | | | | |
End of year | | $ | 269,525,427 | | | $ | 258,365,808 | |
| | | | |
| | | | |
| FI-26 | | Annual Report | The accompanying notes are an integral part of these financial statements. | | |
FRANKLIN TEMPLETON VARIABLE INSURANCE PRODUCTS TRUST
Notes to Financial Statements
Franklin Income VIP Fund
1. Organization and Significant Accounting Policies
Franklin Templeton Variable Insurance Products Trust (Trust) is registered under the Investment Company Act of 1940 (1940 Act) as an open-end management investment company, consisting of eighteen separate funds and applies the specialized accounting and reporting guidance in U.S. Generally Accepted Accounting Principles (U.S. GAAP). Franklin Income VIP Fund (Fund) is included in this report. Shares of the Fund are generally sold only to insurance company separate accounts to fund the benefits of variable life insurance policies or variable annuity contracts. The Fund offers three classes of shares: Class 1, Class 2 and Class 4. Each class of shares may differ by its distribution fees, voting rights on matters affecting a single class and its exchange privilege.
The following summarizes the Fund’s significant accounting policies.
a. Financial Instrument Valuation
The Fund’s investments in financial instruments are carried at fair value daily. Fair value is the price that would be received to sell an asset or paid to transfer a liability in an orderly transaction between market participants on the measurement date. The Fund calculates the net asset value (NAV) per share as of 4 p.m. Eastern time each day the New York Stock Exchange (NYSE) is open for trading. Under compliance policies and procedures approved by the Trust’s Board of Trustees (the Board), the Fund’s administrator has responsibility for oversight of valuation, including leading the cross-functional Valuation Committee (VC). The VC provides administration and oversight of the Fund’s valuation policies and procedures, which are approved annually by the Board. Among other things, these procedures allow the Fund to utilize independent pricing services, quotations from securities and financial instrument dealers, and other market sources to determine fair value.
Equity securities and derivative financial instruments listed on an exchange or on the NASDAQ National Market System are valued at the last quoted sale price or the official closing price of the day, respectively. Foreign equity securities are valued as of the close of trading on the foreign stock exchange on which the security is primarily traded, or as of 4 p.m. Eastern time. The value is then converted into its U.S. dollar equivalent at the foreign exchange rate in effect at 4 p.m. Eastern time on the day that the value of the security is determined. Over-the-counter
(OTC) securities are valued within the range of the most recent quoted bid and ask prices. Securities that trade in multiple markets or on multiple exchanges are valued according to the broadest and most representative market. Certain equity securities are valued based upon fundamental characteristics or relationships to similar securities.
Debt securities generally trade in the OTC market rather than on a securities exchange. The Fund’s pricing services use multiple valuation techniques to determine fair value. In instances where sufficient market activity exists, the pricing services may utilize a market-based approach through which quotes from market makers are used to determine fair value. In instances where sufficient market activity may not exist or is limited, the pricing services also utilize proprietary valuation models which may consider market characteristics such as benchmark yield curves, credit spreads, estimated default rates, anticipated market interest rate volatility, coupon rates, anticipated timing of principal repayments, underlying collateral, and other unique security features in order to estimate the relevant cash flows, which are then discounted to calculate the fair value. Securities denominated in a foreign currency are converted into their U.S. dollar equivalent at the foreign exchange rate in effect at 4 p.m. Eastern time on the date that the values of the foreign debt securities are determined.
Investments in open-end mutual funds are valued at the closing NAV. Investments in repurchase agreements are valued at cost, which approximates fair value.
The Fund has procedures to determine the fair value of financial instruments for which market prices are not reliable or readily available. Under these procedures, the VC convenes on a regular basis to review such financial instruments and considers a number of factors, including significant unobservable valuation inputs, when arriving at fair value. The VC primarily employs a market-based approach which may use related or comparable assets or liabilities, recent transactions, market multiples, book values, and other relevant information for the investment to determine the fair value of the investment. An income-based valuation approach may also be used in which the anticipated future cash flows of the investment are discounted to calculate fair value. Discounts may also be applied due to the nature or duration of any restrictions on the disposition of the investments. Due to the inherent uncertainty of valuations of such investments, the fair values may differ significantly from the values that would have been used had an active market existed. The VC employs various methods for calibrating these
FRANKLIN TEMPLETON VARIABLE INSURANCE PRODUCTS TRUST
NOTES TO FINANCIAL STATEMENTS
Franklin Income VIP Fund (continued)
1. Organization and Significant Accounting Policies (continued)
a. Financial Instrument Valuation (continued)
valuation approaches including a regular review of key inputs and assumptions, transactional back-testing or disposition analysis, and reviews of any related market activity.
Trading in securities on foreign securities stock exchanges and OTC markets may be completed before 4 p.m. Eastern time. In addition, trading in certain foreign markets may not take place on every Fund’s business day. Occasionally, events occur between the time at which trading in a foreign security is completed and 4 p.m. Eastern time that might call into question the reliability of the value of a portfolio security held by the Fund. As a result, differences may arise between the value of the Fund’s portfolio securities as determined at the foreign market close and the latest indications of value at 4 p.m. Eastern time. In order to minimize the potential for these differences, the VC monitors price movements following the close of trading in foreign stock markets through a series of country specific market proxies (such as baskets of American Depositary Receipts, futures contracts and exchange traded funds). These price movements are measured against established trigger thresholds for each specific market proxy to assist in determining if an event has occurred that may call into question the reliability of the values of the foreign securities held by the Fund. If such an event occurs, the securities may be valued using fair value procedures, which may include the use of independent pricing services.
When the last day of the reporting period is a non-business day, certain foreign markets may be open on those days that the Fund’s NAV is not calculated, which could result in differences between the value of the Fund’s portfolio securities on the last business day and the last calendar day of the reporting period. Any significant security valuation changes due to an open foreign market are adjusted and reflected by the Fund for financial reporting purposes.
b. Foreign Currency Translation
Portfolio securities and other assets and liabilities denominated in foreign currencies are translated into U.S. dollars based on the exchange rate of such currencies against U.S. dollars on the date of valuation. The Fund may enter into foreign currency exchange contracts to facilitate transactions denominated in a foreign currency. Purchases and sales of securities, income and
expense items denominated in foreign currencies are translated into U.S. dollars at the exchange rate in effect on the transaction date. Portfolio securities and assets and liabilities denominated in foreign currencies contain risks that those currencies will decline in value relative to the U.S. dollar. Occasionally, events may impact the availability or reliability of foreign exchange rates used to convert the U.S. dollar equivalent value. If such an event occurs, the foreign exchange rate will be valued at fair value using procedures established and approved by the Board.
The Fund does not separately report the effect of changes in foreign exchange rates from changes in market prices on securities held. Such changes are included in net realized and unrealized gain or loss from investments in the Statement of Operations.
Realized foreign exchange gains or losses arise from sales of foreign currencies, currency gains or losses realized between the trade and settlement dates on securities transactions and the difference between the recorded amounts of dividends, interest, and foreign withholding taxes and the U.S. dollar equivalent of the amounts actually received or paid. Net unrealized foreign exchange gains and losses arise from changes in foreign exchange rates on foreign denominated assets and liabilities other than investments in securities held at the end of the reporting period.
c. Joint Repurchase Agreement
The Fund enters into a joint repurchase agreement whereby its uninvested cash balance is deposited into a joint cash account with other funds managed by the investment manager or an affiliate of the investment manager and is used to invest in one or more repurchase agreements. The value and face amount of the joint repurchase agreement are allocated to the funds based on their pro-rata interest. A repurchase agreement is accounted for as a loan by the Fund to the seller, collateralized by securities which are delivered to the Fund’s custodian. The fair value, including accrued interest, of the initial collateralization is required to be at least 102% of the dollar amount invested by the funds, with the value of the underlying securities marked to market daily to maintain coverage of at least 100%. Repurchase agreements are subject to the terms of Master Repurchase Agreements (MRAs) with approved counterparties (sellers). The MRAs contain various provisions, including but not limited to events of default and maintenance of collateral for repurchase agreements. In the event of default by either the seller or the Fund, certain MRAs may permit the non-defaulting party to net
FRANKLIN TEMPLETON VARIABLE INSURANCE PRODUCTS TRUST
NOTES TO FINANCIAL STATEMENTS
Franklin Income VIP Fund (continued)
and close-out all transactions, if any, traded under such agreements. The Fund may sell securities it holds as collateral and apply the proceeds towards the repurchase price and any other amounts owed by the seller to the Fund in the event of default by the seller. This could involve costs or delays in addition to a loss on the securities if their value falls below the repurchase price owed by the seller. The joint repurchase agreement held by the Fund at year end, as indicated in the Statement of Investments, had been entered into on December 29, 2017.
d. Securities Purchased on a Delayed Delivery Basis
The Fund purchases securities on a delayed delivery basis, with payment and delivery scheduled for a future date. These transactions are subject to market fluctuations and are subject to the risk that the value at delivery may be more or less than the trade date purchase price. Although the Fund will generally purchase these securities with the intention of holding the securities, it may sell the securities before the settlement date. Sufficient assets have been segregated for these securities.
e. Derivative Financial Instruments
The Fund invested in derivative financial instruments in order to manage risk or gain exposure to various other investments or markets. Derivatives are financial contracts based on an underlying or notional amount, require no initial investment or an initial net investment that is smaller than would normally be required to have a similar response to changes in market factors, and require or permit net settlement. Derivatives contain various risks including the potential inability of the counterparty to fulfill their obligations under the terms of the contract, the potential for an illiquid secondary market, and/or the potential for market movements which expose the Fund to gains or losses in excess of the amounts shown in the Statement of Assets and Liabilities. Realized gain and loss and unrealized appreciation and depreciation on these contracts for the period are included in the Statement of Operations.
Collateral requirements differ by type of derivative. Collateral or initial margin requirements are set by the broker or exchange clearing house for exchange traded and centrally cleared derivatives. Initial margin deposited is held at the exchange and can be in the form of cash and/or securities.
The Fund purchased or wrote exchange traded option contracts primarily to gain exposure to equity price risk. An option is a contract entitling the holder to purchase or sell a specific
amount of shares or units of an asset or notional amount of a swap (swaption), at a specified price. When an option is purchased or written, an amount equal to the premium paid or received is recorded as an asset or liability, respectively. Upon exercise of an option, the acquisition cost or sales proceeds of the underlying investment is adjusted by any premium received or paid. Upon expiration of an option, any premium received or paid is recorded as a realized gain or loss. Upon closing an option other than through expiration or exercise, the difference between the premium received or paid and the cost to close the position is recorded as a realized gain or loss.
See Note 8 regarding other derivative information.
f. Equity-Linked Securities
The Fund invests in equity-linked securities. Equity-linked securities are hybrid financial instruments that generally combine both debt and equity characteristics into a single note form. Income received from equity-linked securities is recorded as realized gains in the Statement of Operations and may be based on the performance of an underlying equity security, an equity index, or an option position. The risks of investing in equity-linked securities include unfavorable price movements in the underlying security and the credit risk of the issuing financial institution. There may be no guarantee of a return of principal with equity-linked securities and the appreciation potential may be limited. Equity-linked securities may be more volatile and less liquid than other investments held by the Fund.
g. Securities Lending
The Fund participates in an agency based securities lending program to earn additional income. The Fund receives cash collateral against the loaned securities in an amount equal to at least 102% of the fair value of the loaned securities. Collateral is maintained over the life of the loan in an amount not less than 100% of the fair value of loaned securities, as determined at the close of Fund business each day; any additional collateral required due to changes in security values is delivered to the Fund on the next business day. The collateral is deposited into a joint cash account with other funds and is used to invest in a money market fund managed by Franklin Advisers, Inc., an affiliate of the Fund, and/or a joint repurchase agreement. The Fund may receive income from the investment of cash collateral, in addition to lending fees and rebates paid by the borrower. Income from securities loaned, net of fees paid to the securities lending agent and/or third-party vendor, is reported separately in the Statement of Operations. The Fund bears the
FRANKLIN TEMPLETON VARIABLE INSURANCE PRODUCTS TRUST
NOTES TO FINANCIAL STATEMENTS
Franklin Income VIP Fund (continued)
1. Organization and Significant Accounting
Policies (continued)
g. Securities Lending (continued)
market risk with respect to the collateral investment, securities loaned, and the risk that the agent may default on its obligations to the Fund. If the borrower defaults on its obligation to return the securities loaned, the Fund has the right to repurchase the securities in the open market using the collateral received. The securities lending agent has agreed to indemnify the Fund in the event of default by a third party borrower.
h. Senior Floating Rate Interests
The Fund invests in senior secured corporate loans that pay interest at rates which are periodically reset by reference to a base lending rate plus a spread. These base lending rates are generally the prime rate offered by a designated U.S. bank or the London InterBank Offered Rate (LIBOR). Senior secured corporate loans often require prepayment of principal from excess cash flows or at the discretion of the borrower. As a result, actual maturity may be substantially less than the stated maturity. Senior secured corporate loans in which the Fund invests are generally readily marketable, but may be subject to certain restrictions on resale.
i. Income and Deferred Taxes
It is the Fund’s policy to qualify as a regulated investment company under the Internal Revenue Code. The Fund intends to distribute to shareholders substantially all of its taxable income and net realized gains to relieve it from federal income and if applicable, excise taxes. As a result, no provision for U.S. federal income taxes is required.
The Fund may be subject to foreign taxation related to income received, capital gains on the sale of securities and certain foreign currency transactions in the foreign jurisdictions in which it invests. Foreign taxes, if any, are recorded based on the tax regulations and rates that exist in the foreign markets in which the Fund invests. When a capital gain tax is determined to apply, the Fund records an estimated deferred tax liability in an amount that would be payable if the securities were disposed of on the valuation date.
As a result of several court cases, in certain countries across the European Union, the Fund filed additional tax reclaims for previously withheld taxes on dividends earned in those countries (EU reclaims). These additional filings are subject to
various administrative proceedings by the local jurisdictions’ tax authorities within the European Union, as well as a number of related judicial proceedings. Income recognized, if any, for EU reclaims is reflected as other income in the Statement of Operations and any related receivable, if any, is reflected as European Union tax reclaims in the Statement of Assets and Liabilities. When uncertainty exists as to the ultimate resolution of these proceedings, the likelihood of receipt of these EU reclaims, and the potential timing of payment, no amounts are reflected in the financial statements. For U.S. income tax purposes, when EU reclaims are received by the Fund and the Fund previously passed foreign tax credit on to its shareholders, the Fund must either amend historic tax reporting to shareholders or enter into a closing agreement with the Internal Revenue Service (IRS) in order to pay the associated tax liability on behalf of the Fund’s shareholders.
The Fund may recognize an income tax liability related to its uncertain tax positions under U.S. GAAP when the uncertain tax position has a less than 50% probability that it will be sustained upon examination by the tax authorities based on its technical merits. As of December 31, 2017, the Fund has determined that no tax liability is required in its financial statements related to uncertain tax positions for any open tax years (or expected to be taken in future tax years). Open tax years are those that remain subject to examination and are based on the statute of limitations in each jurisdiction in which the Fund invests.
j. Security Transactions, Investment Income, Expenses and Distributions
Security transactions are accounted for on trade date. Realized gains and losses on security transactions are determined on a specific identification basis. Interest income and estimated expenses are accrued daily. Amortization of premium and accretion of discount on debt securities are included in interest income. Facility fees are recognized as income over the expected term of the loan. Dividend income is recorded on the ex-dividend date except for certain dividends from securities where the dividend rate is not available. In such cases, the dividend is recorded as soon as the information is received by the Fund. Distributions to shareholders are recorded on the ex-dividend date. Distributable earnings are determined according to income tax regulations (tax basis) and may differ from earnings recorded in accordance with U.S. GAAP. These differences may be permanent or temporary. Permanent differences are reclassified among capital accounts to reflect
FRANKLIN TEMPLETON VARIABLE INSURANCE PRODUCTS TRUST
NOTES TO FINANCIAL STATEMENTS
Franklin Income VIP Fund (continued)
their tax character. These reclassifications have no impact on net assets or the results of operations. Temporary differences are not reclassified, as they may reverse in subsequent periods.
Common expenses incurred by the Trust are allocated among the Funds based on the ratio of net assets of each Fund to the combined net assets of the Trust. Fund specific expenses are charged directly to the Fund that incurred the expense.
Realized and unrealized gains and losses and net investment income, excluding class specific expenses, are allocated daily to each class of shares based upon the relative proportion of net assets of each class. Differences in per share distributions by class are generally due to differences in class specific expenses.
k. Accounting Estimates
The preparation of financial statements in accordance with U.S. GAAP requires management to make estimates and assumptions that affect the reported amounts of assets and
liabilities at the date of the financial statements and the amounts of income and expenses during the reporting period. Actual results could differ from those estimates.
l. Guarantees and Indemnifications
Under the Trust’s organizational documents, its officers and trustees are indemnified by the Trust against certain liabilities arising out of the performance of their duties to the Trust. Additionally, in the normal course of business, the Trust, on behalf of the Fund, enters into contracts with service providers that contain general indemnification clauses. The Trust’s maximum exposure under these arrangements is unknown as this would involve future claims that may be made against the Trust that have not yet occurred. Currently, the Trust expects the risk of loss to be remote.
2. Shares of Beneficial Interest
At December 31, 2017, there were an unlimited number of shares authorized (without par value). Transactions in the Fund’s shares were as follows:
| | | | | | | | | | | | | | | | | | | | |
| | | Year Ended December 31, | |
| | | 2017 | | | | | | 2016 | |
| | | Shares | | | Amount | | | | | | Shares | | | Amount | |
| | | | | |
| Class 1 Shares: | | | | | | | | | | | | | | | | | | | | |
Shares sold | | | 2,556,049 | | | $ | 41,649,315 | | | | | | | | 6,134,123 | | | $ | 87,911,597 | |
Shares issued in reinvestment of distributions | | | 1,925,849 | | | | 30,736,550 | | | | | | | | 2,331,810 | | | | 33,648,017 | |
Shares redeemed | | | (4,368,760 | ) | | | (71,274,195 | ) | | | | | | | (5,877,695 | ) | | | (86,943,198 | ) |
| | | | |
Net increase (decrease) | | | 113,138 | | | $ | 1,111,670 | | | | | | | | 2,588,238 | | | $ | 34,616,416 | |
| | | | |
| Class 2 Shares: | | | | | | | | | | | | | | | | | | | | |
Shares sold | | | 12,063,249 | | | $ | 190,265,472 | | | | | | | | 25,914,952 | | | $ | 378,696,453 | |
Shares issued in reinvestment of distributions | | | 13,740,843 | | | | 212,433,443 | | | | | | | | 17,417,040 | | | | 243,664,392 | |
Shares redeemed | | | (44,928,166 | ) | | | (709,750,856 | ) | | | | | | | (58,055,463 | ) | | | (838,142,914 | ) |
| | | | |
Net increase (decrease) | | | (19,124,074 | ) | | $ | (307,051,941 | ) | | | | | | | (14,723,471 | ) | | $ | (215,782,069 | ) |
| | | | |
| Class 4 Shares: | | | | | | | | | | | | | | | | | | | | |
Shares sold | | | 3,354,488 | | | $ | 54,048,239 | | | | | | | | 1,804,015 | | | $ | 26,579,870 | |
Shares issued in reinvestment of distributions | | | 796,839 | | | | 12,598,021 | | | | | | | | 1,008,356 | | | | 14,419,491 | |
Shares redeemed | | | (3,605,896 | ) | | | (58,187,395 | ) | | | | | | | (4,209,003 | ) | | | (62,239,057 | ) |
| | | | |
Net increase (decrease) | | | 545,431 | | | $ | 8,458,865 | | | | | | | | (1,396,632 | ) | | $ | (21,239,696 | ) |
| | | | |
FRANKLIN TEMPLETON VARIABLE INSURANCE PRODUCTS TRUST
NOTES TO FINANCIAL STATEMENTS
Franklin Income VIP Fund (continued)
3. Transactions with Affiliates
Franklin Resources, Inc. is the holding company for various subsidiaries that together are referred to as Franklin Templeton Investments. Certain officers and trustees of the Fund are also officers and/or directors of the following subsidiaries:
| | |
| Subsidiary | | Affiliation |
Franklin Advisers, Inc. (Advisers) | | Investment manager |
Franklin Templeton Services, LLC (FT Services) | | Administrative manager |
Franklin Templeton Distributors, Inc. (Distributors) | | Principal underwriter |
Franklin Templeton Investor Services, LLC (Investor Services) | | Transfer agent |
a. Management Fees
The Fund pays an investment management fee to Advisers based on the average daily net assets of the Fund as follows:
| | |
| Annualized Fee Rate | | Net Assets |
0.625% | | Up to and including $100 million |
0.500% | | Over $100 million, up to and including $250 million |
0.450% | | Over $250 million, up to and including $7.5 billion |
0.440% | | Over $7.5 billion, up to and including $10 billion |
0.430% | | Over $10 billion, up to and including $12.5 billion |
0.420% | | Over $12.5 billion, up to and including $15 billion |
0.400% | | In excess of $15 billion |
For the year ended December 31, 2017, the gross effective investment management fee rate was 0.454% of the Fund’s average daily net assets.
b. Administrative Fees
Under an agreement with Advisers, FT Services provides administrative services to the Fund. The fee is paid by Advisers based on the Fund’s average daily net assets, and is not an additional expense of the Fund.
c. Distribution Fees
The Board has adopted distribution plans for Class 2 and Class 4 shares pursuant to Rule 12b-1 under the 1940 Act. Under the Fund’s compensation distribution plans, the Fund pays Distributors for costs incurred in connection with the servicing, sale and distribution of the Fund’s shares up to 0.35% per year of its average daily net assets of each class. The Board has agreed to limit the current rate to 0.25% per year for Class 2. The plan year, for purposes of monitoring compliance with the maximum annual plan rates, is February 1 through January 31.
d. Transfer Agent Fees
Investor Services, under terms of an agreement, performs shareholder servicing for the Fund and is not paid by the Fund for the services.
FRANKLIN TEMPLETON VARIABLE INSURANCE PRODUCTS TRUST
NOTES TO FINANCIAL STATEMENTS
Franklin Income VIP Fund (continued)
e. Investments in Affiliated Management Investment Companies
The Fund invests in one or more affiliated management investment companies for purposes other than exercising a controlling influence over the management or policies. Management fees paid by the Fund are waived on assets invested in the affiliated management investment companies, as noted in the Statement of Operations, in an amount not to exceed the management and administrative fees paid directly or indirectly by each affiliate. During the year ended December 31, 2017, the Fund held investments in affiliated management investment companies as follows:
| | | | | | | | | | | | | | | | | | | | | | | | | | | | | | | | |
| | | Number of Shares Held at Beginning of Year | | | Gross Additions | | | Gross Reductions | | | Number of Shares Held at End of Year | | | Value at End of Year | | | Dividend Income | | | Realized Gain (Loss) | | | Net Change in Unrealized Appreciation (Depreciation) | |
| Non-Controlled Affiliates | | | | | | | | | | | | | | | | | | | | | | | | | | | | | | | | |
Institutional Fiduciary Trust Money Market Portfolio, 0.89% | | | 310,250,028 | | | | 1,922,283,782 | | | | (1,879,709,355 | ) | | | 352,824,455 | | | $ | 352,824,455 | | | $ | 2,145,830 | | | $ | — | | | $ | — | |
| | | | | | | | | | | | | | | | | | | | |
f. Other Affiliated Transactions
At December 31, 2017, Franklin Templeton Variable Insurance Products Trust—Franklin Founding Funds Allocation VIP Fund owned 5.4% of the Fund’s outstanding shares.
4. Expense Offset Arrangement
The Fund has entered into an arrangement with its custodian whereby credits realized as a result of uninvested cash balances are used to reduce a portion of the Fund’s custodian expenses. During the year ended December 31, 2017, the custodian fees were reduced as noted in the Statement of Operations.
5. Income Taxes
For tax purposes, capital losses may be carried over to offset future capital gains. Capital loss carryforwards with no expiration, if any, must be fully utilized before those losses with expiration dates.
At December 31, 2017, the Fund had capital loss carryforwards of $157,561,044 expiring in 2018 and short-term capital loss carryforwards of $72,609,502 not subject to expiration.
During the year ended December 31, 2017, the Fund utilized $139,463,205 of capital loss carryforwards.
On December 31, 2017, the Fund had expired capital loss carryforwards of $521,405,875, which were reclassified to paid-in capital.
The tax character of distributions paid during the years ended December 31, 2017 and 2016, was as follows:
| | | | | | | | |
| | | 2017 | | | 2016 | |
| | |
Distributions paid from ordinary income | | $ | 255,768,014 | | | $ | 291,731,900 | |
| | | | |
FRANKLIN TEMPLETON VARIABLE INSURANCE PRODUCTS TRUST
NOTES TO FINANCIAL STATEMENTS
Franklin Income VIP Fund (continued)
5. Income Taxes (continued)
At December 31, 2017, the cost of investments, net unrealized appreciation (depreciation) and undistributed ordinary income for income tax purposes were as follows:
| | | | |
Cost of investments. | | $ | 5,367,359,984 | |
| | | | |
Unrealized appreciation | | $ | 909,245,913 | |
Unrealized depreciation | | | (242,913,785 | ) |
| | | | |
Net unrealized appreciation (depreciation) | | $ | 666,332,128 | |
| | | | |
Distributable earnings - undistributed ordinary income | | $ | 276,751,619 | |
| | | | |
Differences between income and/or capital gains as determined on a book basis and a tax basis are primarily due to differing treatments of bond discounts and premiums and equity-linked securities.
6. Investment Transactions
Purchases and sales of investments (excluding short term securities) for the year ended December 31, 2017, aggregated $1,198,386,985 and $1,575,800,569, respectively.
At December 31, 2017, in connection with securities lending transactions, the Fund loaned corporate bonds and received $1,300,765 of cash collateral. The gross amount of recognized liability for such transactions is included in payable upon return of securities loaned in the Statement of Assets and Liabilities. The agreements can be terminated at any time.
7. Credit Risk
At December 31, 2017, the Fund had 34.0% of its portfolio invested in high yield, senior secured floating rate notes, or other securities rated below investment grade and unrated securities, if any. These securities may be more sensitive to economic conditions causing greater price volatility and are potentially subject to a greater risk of loss due to default than higher rated securities.
8. Other Derivative Information
At December 31, 2017, the Fund’s investments in derivative contracts are reflected in the Statement of Assets and Liabilities as follows:
| | | | | | | | | | | | |
| | | Asset Derivatives | | | Liability Derivatives | |
Derivative Contracts Not Accounted for as Hedging Instruments | | Statement of Assets and Liabilities Location | | Fair Value | | | Statement of Assets and Liabilities Location | | Fair Value | |
Equity contracts | | Investments in securities, at value | | $ | 1,100,000a | | | Options written, at value | | $ | 1,934,000 | |
| | | | | | | | | | | | |
aPurchased option contracts are included in investments in securities, at value in the Statement of Assets and Liabilities.
FRANKLIN TEMPLETON VARIABLE INSURANCE PRODUCTS TRUST
NOTES TO FINANCIAL STATEMENTS
Franklin Income VIP Fund (continued)
For the year ended December 31, 2017, the effect of derivative contracts in the Fund’s Statement of Operations was as follows:
| | | | | | | | | | | | |
Derivative Contracts Not Accounted for as Hedging Instruments | | Statement of Operations Location | | Net
Realized
Gain (Loss)
for the year | | | Statement of Operations Location | | Net Change in
Unrealized
Appreciation
(Depreciation)
for the year | |
| | Net realized gain (loss) from: | | | | | | Net change in unrealized appreciation (depreciation) on: | | | | |
Equity contracts | | Investments | | $ | (1,330,000 | )a | | Investments | | $ | (1,147,000 | )a |
| | Written options | | | 803,328 | | | Written options | | | (575,894 | ) |
| | | | | | | | | | | | |
Totals | | | | $ | (526,672 | ) | | | | $ | (1,722,894 | ) |
| | | | | | | | | | | | |
aPurchased option contracts are included in net realized gain (loss) from investments and net change in unrealized appreciation (depreciation) on investments in the Statement of Operations.
For the year ended December 31, 2017, the average month end notional amount of options represented $748,462.
See Note 1(e) regarding derivative financial instruments.
9. Credit Facility
The Fund together with other U.S. registered and foreign investment funds (collectively, Borrowers), managed by Franklin Templeton Investments, are borrowers in a joint syndicated senior unsecured credit facility totaling $2 billion (Global Credit Facility) which matured on February 9, 2018. This Global Credit Facility provides a source of funds to the Borrowers for temporary and emergency purposes, including the ability to meet future unanticipated or unusually large redemption requests. Effective February 9, 2018, the Borrowers renewed the Global Credit Facility for a one year term, maturing February 8, 2019, for a total of $2 billion.
Under the terms of the Global Credit Facility, the Fund shall, in addition to interest charged on any borrowings made by the Fund and other costs incurred by the Fund, pay its share of fees and expenses incurred in connection with the implementation and maintenance of the Global Credit Facility, based upon its relative share of the aggregate net assets of all of the Borrowers, including an annual commitment fee of 0.15% based upon the unused portion of the Global Credit Facility. These fees are reflected in other expenses in the Statement of Operations. During the year ended December 31, 2017, the Fund did not use the Global Credit Facility.
10. Fair Value Measurements
The Fund follows a fair value hierarchy that distinguishes between market data obtained from independent sources (observable inputs) and the Fund’s own market assumptions (unobservable inputs). These inputs are used in determining the value of the Fund’s financial instruments and are summarized in the following fair value hierarchy:
| | • | | Level 1 – quoted prices in active markets for identical financial instruments |
| | • | | Level 2 – other significant observable inputs (including quoted prices for similar financial instruments, interest rates, prepayment speed, credit risk, etc.) |
| | • | | Level 3 – significant unobservable inputs (including the Fund’s own assumptions in determining the fair value of financial instruments) |
The input levels are not necessarily an indication of the risk or liquidity associated with financial instruments at that level.
For movements between the levels within the fair value hierarchy, the Fund has adopted a policy of recognizing the transfers as of the date of the underlying event which caused the movement.
FRANKLIN TEMPLETON VARIABLE INSURANCE PRODUCTS TRUST
NOTES TO FINANCIAL STATEMENTS
Franklin Income VIP Fund (continued)
10. Fair Value Measurements (continued)
A summary of inputs used as of December 31, 2017, in valuing the Fund’s assets and liabilities carried at fair value, is as follows:
| | | | | | | | | | | | | | | | |
| | | Level 1 | | | Level 2 | | | Level 3 | | | Total | |
| | | | |
| Assets: | | | | | | | | | | | | | | | | |
Investments in Securities:a | | | | | | | | | | | | | | | | |
Equity Investments:b | | | | | | | | | | | | | | | | |
Financials | | $ | 448,957,309 | | | $ | 12,824,050 | | | $ | — | | | $ | 461,781,359 | |
Industrials | | | 264,158,153 | | | | 12,717,592 | | | | — | | | | 276,875,745 | |
All Other Equity Investments | | | 2,394,349,505 | | | | — | | | | — | | | | 2,394,349,505 | |
Equity-Linked Securities | | | — | | | | 253,497,118 | | | | — | | | | 253,497,118 | |
Convertible Bonds | | | — | | | | 69,535,877 | | | | — | | | | 69,535,877 | |
Corporate Bonds | | | — | | | | 1,998,363,689 | | | | — | | | | 1,998,363,689 | |
Senior Floating Rate Interests | | | — | | | | 227,037,599 | | | | — | | | | 227,037,599 | |
Escrows and Litigation Trusts | | | — | | | | — | | | | ��� | c | | | — | |
Options Purchased | | | 1,100,000 | | | | — | | | | — | | | | 1,100,000 | |
Short Term Investments | | | 352,824,455 | | | | 260,765 | | | | — | | | | 353,085,220 | |
| | | | |
Total Investments in Securities | | $ | 3,461,389,422 | | | $ | 2,574,236,690 | | | $ | — | | | $ | 6,035,626,112 | |
| | | | |
| | | | |
| Liabilities: | | | | | | | | | | | | | | | | |
Other Financial Instruments: | | | | | | | | | | | | | | | | |
Options Written | | $ | 1,934,000 | | | $ | — | | | $ | — | | | $ | 1,934,000 | |
| | | | |
aFor detailed categories, see the accompanying Statement of Investments.
bIncludes common and convertible preferred stocks.
cIncludes securities determined to have no value at December 31, 2017.
A reconciliation of assets in which Level 3 inputs are used in determining fair value is presented when there are significant Level 3 financial instruments at the beginning and/or end of the year.
11. New Accounting Pronouncements
In March 2017, the Financial Accounting Standards Board issued Accounting Standards Update (ASU) No. 2017-08, Receivables—Nonrefundable Fees and Other Costs (Subtopic 310-20): Premium Amortization on Purchased Callable Debt Securities. The amendments in the ASU shorten the amortization period for certain callable debt securities acquired at a premium, to be amortized to the earliest call date. The ASU does not require an accounting change for securities acquired at a discount, which continues to be amortized to maturity. The ASU is effective for fiscal years and interim periods within those fiscal years beginning after December 15, 2018. Management has reviewed the requirements and believes the adoption of this ASU will not have a material impact on the financial statements.
12. Subsequent Events
The Fund has evaluated subsequent events through the issuance of the financial statements and determined that no events have occurred that require disclosure other than those already disclosed in the financial statements.
FRANKLIN TEMPLETON VARIABLE INSURANCE PRODUCTS TRUST
NOTES TO FINANCIAL STATEMENTS
Franklin Income VIP Fund (continued)
Abbreviations
| | | | | | | | | | |
| Exchange | | Currency | | Selected Portfolio |
| | | | | |
| CBOE | | Chicago Board Options Exchange | | EUR | | Euro | | ADR | | American Depositary Receipt |
| | | | | |
| | | | USD | | United States Dollar | | FNMA | | Federal National Mortgage Association |
| | | | | |
| | | | | | | | FRN | | Floating Rate Note |
| | | | | |
| | | | | | | | L/C | | Letter of Credit |
| | | | | |
| | | | | | | | LIBOR | | London InterBank Offered Rate |
| | | | | |
| | | | | | | | PIK | | Payment-In-Kind |
| | | | |
Index | | | | | | | | |
| | | | | |
| SPX | | S&P 500 Index | | | | | | | | |
FRANKLIN TEMPLETON VARIABLE INSURANCE PRODUCTS TRUST
Report of Independent Registered Public Accounting Firm
To the Board of Trustees of Franklin Templeton Variable Insurance Products Trust and Shareholders of Franklin Income VIP Fund
Opinion on the Financial Statements
We have audited the accompanying statement of assets and liabilities, including the statement of investments, of Franklin Income VIP Fund (the “Fund”) as of December 31, 2017, the related statement of operations for the year ended December 31, 2017, the statement of changes in net assets for each of the two years in the period ended December 31, 2017, including the related notes, and the financial highlights for each of the five years in the period ended December 31, 2017 (collectively referred to as the “financial statements”). In our opinion, the financial statements present fairly, in all material respects, the financial position of the Fund as of December 31, 2017, the results of its operations for the year then ended, the changes in its net assets for each of the two years in the period ended December 31, 2017 and the financial highlights for each of the five years in the period ended December 31, 2017 in conformity with accounting principles generally accepted in the United States of America.
Basis for Opinion
These financial statements are the responsibility of the Fund’s management. Our responsibility is to express an opinion on the Fund’s financial statements based on our audits. We are a public accounting firm registered with the Public Company Accounting Oversight Board (United States) (“PCAOB”) and are required to be independent with respect to the Fund in accordance with the U.S. federal securities laws and the applicable rules and regulations of the Securities and Exchange Commission and the PCAOB.
We conducted our audits of these financial statements in accordance with the standards of the PCAOB. Those standards require that we plan and perform the audit to obtain reasonable assurance about whether the financial statements are free of material misstatement, whether due to error or fraud.
Our audits included performing procedures to assess the risks of material misstatement of the financial statements, whether due to error or fraud, and performing procedures that respond to those risks. Such procedures included examining, on a test basis, evidence regarding the amounts and disclosures in the financial statements. Our audits also included evaluating the accounting principles used and significant estimates made by management, as well as evaluating the overall presentation of the financial statements. Our procedures included confirmation of securities owned as of December 31, 2017 by correspondence with the custodian, transfer agent, and brokers; when replies were not received from brokers, we performed other auditing procedures. We believe that our audits provide a reasonable basis for our opinion.
PricewaterhouseCoopers LLP
San Francisco, California
February 15, 2018
We have served as the auditor of one or more investment companies in the Franklin Templeton Group of Funds since 1948.
FRANKLIN TEMPLETON VARIABLE INSURANCE PRODUCTS TRUST
Tax Information (unaudited)
Franklin Income VIP Fund
Under Section 854(b)(1)(A) of the Internal Revenue Code, the Fund hereby reports 34.16% of the ordinary income dividends as income qualifying for the dividends received deduction for the fiscal year ended December 31, 2017.
This page intentionally left blank.
Franklin Large Cap Growth VIP Fund
We are pleased to bring you Franklin Large Cap Growth VIP Fund’s annual report for the fiscal year ended December 31, 2017.
Class 2 Performance Summary as of December 31, 2017
Average annual total return of Class 2 shares represents the average annual change in value, assuming reinvestment of dividends and capital gains. Average returns smooth out variations in returns, which can be significant; they are not the same as year-by-year results.
| | | | | | | | | | | | |
| Periods ended 12/31/17 | | 1-Year | | | 5-Year | | | 10-Year | |
Average Annual Total Return | | | +28.11% | | | | +13.96% | | | | +7.27% | |
Performance reflects the Fund’s Class 2 operating expenses, but does not include any contract fees, expenses or sales charges. If they had been included, performance would be lower. These charges and deductions, particularly for variable life policies, can have a significant effect on contract values and insurance benefits. See the contract prospectus for a complete description of these expenses, including sales charges.
Performance data represent past performance, which does not guarantee future results. Investment return and principal value will fluctuate, and you may have a gain or loss when you sell your shares. Current performance may differ from figures shown.
Total Return Index Comparison for a Hypothetical $10,000 Investment (1/1/08–12/31/17)
The graph below shows the change in value of a hypothetical $10,000 investment in the Fund over the indicated period and includes reinvestment of any income or distributions. The Fund’s performance is compared to the performance of the Standard & Poor’s® 500 Index (S&P 500®). One cannot invest directly in an index, and an index is not representative of the Fund’s portfolio. Please see Important Notes to Performance Information preceding the Fund Summaries.
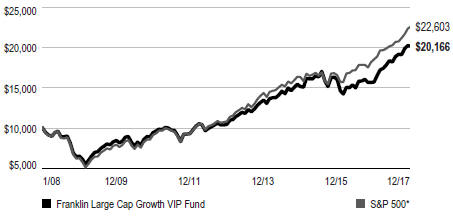
**Source: Morningstar. Please see Index Descriptions following the Fund Summaries.
FRANKLIN LARGE CAP GROWTH VIP FUND
Fund Goal and Main Investments
The Fund seeks capital appreciation. Under normal market conditions, the Fund invests at least 80% of its net assets in investments of large capitalization companies. For this Fund, large capitalization companies are those with market capitalization values within those of the top 50% of companies in the Russell 1000® Index at the time of purchase.1
Fund Risks
All investments involve risks, including possible loss of principal. Stock prices fluctuate, sometimes rapidly and dramatically, due to factors affecting individual companies, particular industries or sectors, or general market conditions. Growth stock prices reflect projections of future earnings or revenues, and can, therefore, fall dramatically if the company fails to meet those projections. The Fund may focus on particular sectors of the market from time to time, which can carry greater risks of adverse developments in such sectors. Investments in foreign securities may involve special risks including currency fluctuations and economic and political uncertainty. Smaller or midsized companies can be particularly sensitive to changing economic conditions, and their prospects for growth are less certain than those of larger, more established companies. The Fund is actively managed but there is no guarantee that the manager’s investment decisions will produce the desired results. The Fund’s prospectus also includes a description of the main investment risks.
Performance Overview
You can find the Fund’s one-year total return in the Performance Summary. In comparison, the Fund’s benchmark, the S&P 500, generated a +21.83% total return.2
Economic and Market Overview
The US economy grew during the 12 months under review. After strengthening in 2017’s second and third quarters, the economy moderated in the fourth quarter. The economy grew faster in 2017 than in 2016, however, largely due to growth in consumer spending, business investment and exports. The manufacturing and services sectors expanded during the period. The unemployment rate declined from 4.7% in December 2016 to 4.1% at period-end.3 Monthly retail sales were volatile but
Portfolio Composition
Based on Total Net Assets as of 12/31/17
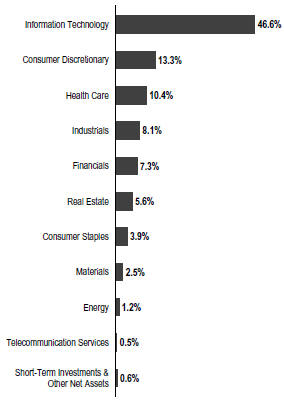
positive on average during the period. Annual inflation, as measured by the Consumer Price Index, was 2.1% in December 2016, and while it varied over the 12-month period, remained unchanged at period-end.3
The US Federal Reserve (Fed) raised its target range for the federal funds rate 0.25% at its March and June 2017 meetings, amid signs of a growing US economy, strengthening labor market and improving business spending. At its December meeting, the Fed raised its target range for the federal funds rate 0.25% to 1.25%–1.50%, as widely anticipated by the market. The Fed also confirmed that the monthly balance sheet reduction would increase from $10 billion to $20 billion beginning in January 2018.
1. Please see Index Descriptions following the Fund Summaries.
2. Source: Morningstar. One cannot invest directly in an index, and an index is not representative of the Fund’s portfolio. Please see Index Descriptions following the Fund Summaries.
3. Source: Bureau of Labor Statistics.
The dollar value, number of shares or principal amount, and names of all portfolio holdings are listed in the Fund’s Statement of Investments (SOI).
FRANKLIN LARGE CAP GROWTH VIP FUND
US equity markets rose during the 12-month period, benefiting from mostly upbeat economic data, better US corporate earnings and improving global economic growth. Concerns about the terms of the UK’s exit from the European Union (EU), political uncertainty in the US, tensions between the US and North Korea, and the progress of US health care and tax reform plans curbed market sentiment at times. However, the markets were also supported by investor optimism arising from pro-growth and pro-business policy plans in the US, the prospect for reforms in the EU with Emmanuel Macron’s election as France’s president, and the US Fed chair’s comments indicating optimism about the US economy and the likelihood of gradual rate hikes. Furthermore, the Senate’s approval of a budget plan in October and subsequent passage of a tax reform bill near period-end drove many US equity indexes to end 2017 near record highs. In this environment, the broad US stock market, as measured by the S&P 500, generated a +21.83% total return for the period.2
Investment Strategy
We are a research driven, fundamental investor, pursuing a growth strategy. As a “bottom-up” investor focusing primarily on individual securities, we seek companies that have identifiable drivers of future earnings growth and that present, in our opinion, the best trade-off between that potential earnings growth, business and financial risk, and valuation.
Manager’s Discussion
Looking back on the key factors impacting the Fund’s returns during the 12 months under review, we would like to remind shareholders that our investment strategy is primarily bottom-up and driven by individual stock selection. However, we recognize that a sector-based discussion can be a helpful way to organize a portfolio review of key performance drivers. We employed our long-held strategy: bottom-up, individual company, fundamental research aimed at opportunistically finding what we believed to be outstanding large-cap companies across all sectors, at valuations we believed understated their fair worth, with future growth potential being a key driver of estimated worth.
During the period under review, most sectors represented in the Fund’s portfolio contributed to absolute performance. Relative to the S&P 500, the information technology (IT) sector contributed significantly to performance due to an overweighted position and stock selection. Real estate and
| | | | |
| Top 10 Holdings | | | |
12/31/17 | | | |
Company Sector/Industry | | % of Total Net Assets | |
Amazon.com Inc.
Consumer Discretionary | | | 6.6% | |
Facebook Inc.
Information Technology | | | 5.5% | |
Apple Inc.
Information Technology | | | 5.4% | |
Mastercard Inc.
Information Technology | | | 4.4% | |
Visa Inc.
Information Technology | | | 4.1% | |
Alphabet Inc.
Information Technology | | | 4.1% | |
Microsoft Corp.
Information Technology | | | 3.9% | |
SBA Communications Corp.
Real Estate | | | 2.7% | |
UnitedHealth Group Inc.
Health Care | | | 2.3% | |
Adobe Systems Inc.
Information Technology | | | 2.2% | |
consumer staples, buoyed by stock selection, also helped relative results.
In IT, Facebook was the sector’s largest contributor to relative returns. The company increased monetization due to improvements in advertising formats, targeting capabilities and measurement tools. Instagram, a subsidiary, is early in monetization, but it saw accelerating user growth and has the ability to leverage Facebook’s data and advertising technology. Facebook is also benefiting from advertisers shifting more of their budgets toward the social media platform.
In real estate, SBA Communications helped relative results. The wireless communications infrastructure provider, which is structured as a real estate investment trust, benefited from ongoing growth of wireless voice and data usage by consumers. SBA could also benefit from potential business growth with two other companies: AT&T,4 which is building a new network dedicated to first responders; and Sprint,4 which could be considering increased investment in their network.
Other individual relative contributors include Amazon.com, whose growth in retail and Amazon Web Services were signs that investments in those areas had proved beneficial. We believe the online retailer’s expansion into grocery and
4. Not a Fund holding.
FRANKLIN LARGE CAP GROWTH VIP FUND
consumer packaged goods, aided by their acquisition of Whole Foods Market, improves the company’s long-term prospects.
In contrast, health care was a major detractor from the Fund’s relative performance, largely due to stock selection. Within the sector, Celgene was hurt by failure of Revlimid, currently used as a treatment for multiple myeloma, in a lymphoma treatment trial. Growing awareness of the company’s increasing reliance on Revlimid and Pomalyst, whose generic versions may be available as early as 2020, also dampened investor sentiment. In October, management reduced their long-term revenue projections.
Materials also hurt relative performance, largely due to stock selection, with Martin Marietta Materials being the biggest detractor in the sector.5
In other sectors, two energy companies were among the biggest relative detractors. Anadarko Petroleum, an exploration and production company, was hurt by several factors: fears of increased state regulations following the Firestone house explosion accident in Colorado; worries about the potential for large expensive acquisitions; and several disappointing quarterly oil production numbers.5
Oilfield services company Halliburton outperformed peers in its industry, but was hurt by oil price volatility and uncertainty about US and global spending trends.5 Although the company had significant revenue and earnings growth, analysts decreased earnings expectations for 2018.
Thank you for your participation in Franklin Large Cap Growth VIP Fund. We look forward to serving your future investment needs.
The foregoing information reflects our analysis, opinions and portfolio holdings as of December 31, 2017, the end of the reporting period. The way we implement our main investment strategies and the resulting portfolio holdings may change depending on factors such as market and economic conditions. These opinions may not be relied upon as investment advice or an offer for a particular security. The information is not a complete analysis of every aspect of any market, country, industry, security or the Fund. Statements of fact are from sources considered reliable, but the investment manager makes no representation or warranty as to their completeness or accuracy. Although historical performance is no guarantee of future results, these insights may help you understand our investment management philosophy.
5. No longer held at period-end.
FRANKLIN LARGE CAP GROWTH VIP FUND
Class 2 Fund Expenses
As an investor in a variable insurance contract (Contract) that indirectly provides for investment in an underlying mutual fund, you can incur transaction and/or ongoing expenses at both the Fund level and the Contract Level: (1) transaction expenses can include sales charges (loads) on purchases, surrender fees, transfer fees and premium taxes; and (2) ongoing expenses can include management fees, distribution and service (12b-1) fees, contract fees, annual maintenance fees, mortality and expense risk fees and other fees and expenses. All mutual funds and Contracts have some types of ongoing expenses. The table below shows Fund-level ongoing expenses and can help you understand these costs and compare them with those of other mutual funds offered through the Contract. The table assumes a $1,000 investment held for the six months indicated. Please refer to the Fund prospectus for additional information on operating expenses.
Actual Fund Expenses
The table below provides information about the actual account values and actual expenses in the columns under the heading “Actual.” In these columns the Fund’s actual return, which includes the effect of ongoing Fund expenses but does not include the effect of ongoing Contract expenses, is used to calculate the “Ending Account Value.” You can estimate the Fund-level expenses you paid during the period by following these steps (of course, your account value and expenses will differ from those in this illustration): Divide your account value by $1,000 (if your account had an $8,600 value, then $8,600 ÷ $1,000 = 8.6). Then multiply the result by the number under the headings “Actual” and “Fund-Level Expenses Paid During Period” (if Fund-Level Expenses Paid During Period were $ 7.50, then 8.6 x $7.50 = $64.50). In this illustration, the estimated expenses paid this period at the Fund level are $64.50.
Hypothetical Example for Comparison with Other Mutual Funds
Under the heading “Hypothetical” in the table, information is provided about hypothetical account values and hypothetical expenses based on the Fund’s actual expense ratio and an assumed rate of return of 5% per year before expenses, which is not the Fund’s actual return. This information may not be used to estimate the actual ending account balance or expenses you paid for the period, but it can help you compare ongoing costs of investing in the Fund with those of other mutual funds offered through the Contract. To do so, compare this 5% hypothetical example with the 5% hypothetical examples that appear in the shareholder reports of other funds offered through the Contract.
Please note that expenses shown in the table are meant to highlight ongoing costs at the Fund level only and do not reflect any ongoing expenses at the Contract level, or transaction expenses at either the Fund or Contract levels. In addition, while the Fund does not have transaction expenses, if the transaction and ongoing expenses at the Contract level were included, the expenses shown below would be higher. You should consult your Contract prospectus or disclosure document for more information.
| | | | | | | | | | | | | | | | | | | | | | | | | | |
| | | | | | Actual (actual return after expenses) | | | | | Hypothetical (5% annual return before expenses) | | | | |
| Share Class | | Beginning Account
Value 7/1/17 | | | Ending Account
Value 12/31/17 | | | Fund-Level
Expenses Paid
During Period
7/1/17–12/31/171,2 | | | | | Ending Account
Value 12/31/17 | | | Fund-Level
Expenses Paid
During Period
7/1/17–12/31/171,2 | | | Annualized
Expense
Ratio2 | |
Class 2 | | | $1,000 | | | | $1,107.60 | | | | $6.11 | | | | | | $1,019.41 | | | | $5.85 | | | | 1.15 | % |
1. Expenses are equal to the annualized expense ratio for the six-month period as indicated above—in the far right column—multiplied by the simple average account value over the period indicated, and then multiplied by 184/365 to reflect the one-half year period.
2. Does not include any ongoing expenses of the Contract for which the Fund is an investment option or acquired fund fees and expenses.
FRANKLIN TEMPLETON VARIABLE INSURANCE PRODUCTS TRUST
Financial Highlights
Franklin Large Cap Growth VIP Fund
| | | | | | | | | | | | | | | | | | | | |
| | | Year Ended December 31, | |
| | | 2017 | | | 2016 | | | 2015 | | | 2014 | | | 2013 | |
| Class 1 | | | | | | | | | | | | | | | | | | | | |
Per share operating performance
(for a share outstanding throughout the year) | | | | | | | | | | | | | | | | | | | | |
| | | | | |
Net asset value, beginning of year | | | $17.85 | | | | $18.42 | | | | $23.26 | | | | $20.91 | | | | $16.43 | |
| | | | |
| | | | | |
| Income from investment operationsa: | | | | | | | | | | | | | | | | | | | | |
| | | | | |
Net investment income (loss)b | | | (0.03 | ) | | | (0.04 | ) | | | (0.06 | ) | | | 0.11 | | | | 0.24 | |
| | | | | |
Net realized and unrealized gains (losses) | | | 4.91 | | | | (0.26 | ) | | | 1.56 | | | | 2.54 | | | | 4.48 | |
| | | | |
Total from investment operations | | | 4.88 | | | | (0.30 | ) | | | 1.50 | | | | 2.65 | | | | 4.72 | |
| | | | |
| | | | | |
| Less distributions from: | | | | | | | | | | | | | | | | | | | | |
| | | | | |
Net investment income | | | (0.20 | ) | | | — | | | | (0.13 | ) | | | (0.30 | ) | | | (0.24 | ) |
| | | | | |
Net realized gains | | | (1.60 | ) | | | (0.27 | ) | | | (6.21 | ) | | | — | | | | — | |
| | | | |
Total distributions | | | (1.80 | ) | | | (0.27 | ) | | | (6.34 | ) | | | (0.30 | ) | | | (0.24 | ) |
| | | | |
Net asset value, end of year. | | | $20.93 | | | | $17.85 | | | | $18.42 | | | | $23.26 | | | | $20.91 | |
| | | | |
| | | | | |
Total returnc | | | 28.38% | | | | (1.49)% | | | | 5.89% | | | | 12.74% | | | | 28.92% | |
| | | | | |
| Ratios to average net assets | | | | | | | | | | | | | | | | | | | | |
| | | | | |
Expenses | | | 0.87% | d | | | 0.80% | d | | | 0.78% | | | | 0.79% | | | | 0.79% | |
| | | | | |
Net investment income (loss) | | | (0.14)% | | | | (0.19)% | | | | (0.27)% | | | | 0.50% | | | | 1.27% | |
| | | | | |
| Supplemental data | | | | | | | | | | | | | | | | | | | | |
| | | | | |
Net assets, end of year (000’s) | | | $1,092 | | | | $883 | | | | $47,864 | | | | $54,971 | | | | $54,291 | |
| | | | | |
Portfolio turnover rate | | | 24.96% | | | | 36.26% | e | | | 23.23% | | | | 93.53% | | | | 28.27% | |
aThe amount shown for a share outstanding throughout the period may not correlate with the Statement of Operations for the period due to the timing of sales and repurchases of the Fund’s shares in relation to income earned and/or fluctuating fair value of the investments of the Fund.
bBased on average daily shares outstanding.
cTotal return does not include fees, charges or expenses imposed by the variable annuity and life insurance contracts for which Franklin Templeton Variable Insurance Products Trust serves as an underlying investment vehicle.
dBenefit of expense reduction rounds to less than 0.01%.
eExcludes the value of portfolio securities delivered as a result of redemption in-kind. See Note 8.
| | | | |
| FLG-6 | | Annual Report | The accompanying notes are an integral part of these financial statements. | | |
FRANKLIN TEMPLETON VARIABLE INSURANCE PRODUCTS TRUST
FINANCIAL HIGHLIGHTS
Franklin Large Cap Growth VIP Fund (continued)
| | | | | | | | | | | | | | | | | | | | |
| | | Year Ended December 31, | |
| | | 2017 | | | 2016 | | | 2015 | | | 2014 | | | 2013 | |
| Class 2 | | | | | | | | | | | | | | | | | | | | |
Per share operating performance (for a share outstanding throughout the year) | | | | | | | | | | | | | | | | | | | | |
| | | | | |
Net asset value, beginning of year | | | $17.48 | | | | $18.09 | | | | $22.94 | | | | $20.62 | | | | $16.20 | |
| | | | |
| | | | | |
| Income from investment operationsa: | | | | | | | | | | | | | | | | | | | | |
| | | | | |
Net investment income (loss)b | | | (0.08 | ) | | | (0.08 | ) | | | (0.11 | ) | | | 0.06 | | | | 0.19 | |
| | | | | |
Net realized and unrealized gains (losses) | | | 4.81 | | | | (0.26 | ) | | | 1.54 | | | | 2.50 | | | | 4.42 | |
| | | | |
Total from investment operations | | | 4.73 | | | | (0.34 | ) | | | 1.43 | | | | 2.56 | | | | 4.61 | |
| | | | |
| | | | | |
| Less distributions from: | | | | | | | | | | | | | | | | | | | | |
| | | | | |
Net investment income | | | (0.13 | ) | | | — | | | | (0.07 | ) | | | (0.24 | ) | | | (0.19 | ) |
| | | | | |
Net realized gains | | | (1.60 | ) | | | (0.27 | ) | | | (6.21 | ) | | | — | | | | — | |
| | | | |
Total distributions | | | (1.73 | ) | | | (0.27 | ) | | | (6.28 | ) | | | (0.24 | ) | | | (0.19 | ) |
| | | | |
Net asset value, end of year. | | | $20.48 | | | | $17.48 | | | | $18.09 | | | | $22.94 | | | | $20.62 | |
| | | | |
| | | | | |
Total returnc | | | 28.11% | | | | (1.79)% | | | | 5.62% | | | | 12.46% | | | | 28.63% | |
| | | | | |
| Ratios to average net assets | | | | | | | | | | | | | | | | | | | | |
| | | | | |
Expenses | | | 1.12% | d | | | 1.05% | d | | | 1.03% | | | | 1.04% | | | | 1.04% | |
| | | | | |
Net investment income (loss) | | | (0.39)% | | | | (0.44)% | | | | (0.52)% | | | | 0.25% | | | | 1.02% | |
| | | | | |
| Supplemental data | | | | | | | | | | | | | | | | | | | | |
| | | | | |
Net assets, end of year (000’s) | | | $118,875 | | | | $113,028 | | | | $223,807 | | | | $256,098 | | | | $285,477 | |
| | | | | |
Portfolio turnover rate | | | 24.96% | | | | 36.26% | e | | | 23.23% | | | | 93.53% | | | | 28.27% | |
aThe amount shown for a share outstanding throughout the period may not correlate with the Statement of Operations for the period due to the timing of sales and repurchases of the Fund’s shares in relation to income earned and/or fluctuating fair value of the investments of the Fund.
bBased on average daily shares outstanding.
cTotal return does not include fees, charges or expenses imposed by the variable annuity and life insurance contracts for which Franklin Templeton Variable Insurance Products Trust serves as an underlying investment vehicle.
dBenefit of expense reduction rounds to less than 0.01%.
eExcludes the value of portfolio securities delivered as a result of redemption in-kind. See Note 8.
| | | | | | |
| | | The accompanying notes are an integral part of these financial statements. | Annual Report | | | FLG-7 | |
FRANKLIN TEMPLETON VARIABLE INSURANCE PRODUCTS TRUST
Statement of Investments, December 31, 2017
| | | | | | | | | | |
Franklin Large Cap Growth VIP Fund | | | | | | |
| | | | | Shares | | | Value | |
| | Common Stocks 99.4% | | | | | | | | |
| | Consumer Discretionary 13.3% | | | | | | | | |
| a | | Amazon.com Inc. | | | 6,757 | | | $ | 7,902,109 | |
| | Aptiv PLC | | | 5,904 | | | | 500,836 | |
| a | | Charter Communications Inc., A | | | 5,185 | | | | 1,741,953 | |
| | Comcast Corp., A | | | 32,778 | | | | 1,312,759 | |
| | Las Vegas Sands Corp. | | | 20,291 | | | | 1,410,021 | |
| a | | The Priceline Group Inc. | | | 820 | | | | 1,424,947 | |
| | Starbucks Corp. | | | 14,821 | | | | 851,170 | |
| | The Walt Disney Co. | | | 7,761 | | | | 834,385 | |
| | | | | | | | | | |
| | | | | | | | | 15,978,180 | |
| | | | | | | | | | |
| | Consumer Staples 3.9% | | | | | | | | |
| | Constellation Brands Inc., A | | | 8,647 | | | | 1,976,445 | |
| a | | Hostess Brands Inc., A | | | 20,481 | | | | 303,323 | |
| a | | Monster Beverage Corp. | | | 20,889 | | | | 1,322,065 | |
| | Pinnacle Foods Inc. | | | 18,666 | | | | 1,110,067 | |
| | | | | | | | | | |
| | | | | | | | | 4,711,900 | |
| | | | | | | | | | |
| | Energy 1.2% | | | | | | | | |
| a | | Diamondback Energy Inc. | | | 11,086 | | | | 1,399,607 | |
| | | | | | | | | | |
| | Financials 7.3% | | | | | | | | |
| a | | Athene Holding Ltd., A | | | 23,435 | | | | 1,211,824 | |
| | The Charles Schwab Corp. | | | 45,008 | | | | 2,312,061 | |
| | Intercontinental Exchange Inc. | | | 17,225 | | | | 1,215,396 | |
| | MarketAxess Holdings Inc. | | | 7,813 | | | | 1,576,273 | |
| | S&P Global Inc. | | | 6,385 | | | | 1,081,619 | |
| a | | SVB Financial Group | | | 5,520 | | | | 1,290,410 | |
| | | | | | | | | | |
| | | | | | | | | 8,687,583 | |
| | | | | | | | | | |
| | Health Care 10.4% | | | | | | | | |
| a | | ABIOMED Inc. | | | 4,132 | | | | 774,378 | |
| a | | Biogen Inc. | | | 2,049 | | | | 652,750 | |
| | Bristol-Myers Squibb Co. | | | 19,770 | | | | 1,211,506 | |
| a | | Celgene Corp. | | | 19,137 | | | | 1,997,137 | |
| a | | Clovis Oncology Inc. | | | 7,799 | | | | 530,332 | |
| a | | Edwards Lifesciences Corp. | | | 12,371 | | | | 1,394,335 | |
| a | | Heron Therapeutics Inc. | | | 27,758 | | | | 502,420 | |
| a | | Incyte Corp. | | | 8,510 | | | | 805,982 | |
| a | | Intuitive Surgical Inc. | | | 1,659 | | | | 605,436 | |
| | Medtronic PLC | | | 8,071 | | | | 651,733 | |
| a | | Nevro Corp. | | | 7,966 | | | | 549,973 | |
| | UnitedHealth Group Inc. | | | 12,676 | | | | 2,794,551 | |
| | | | | | | | | | |
| | | | | | | | | 12,470,533 | |
| | | | | | | | | | |
| | Industrials 8.1% | | | | | | | | |
| | Allegiant Travel Co. | | | 2,893 | | | | 447,692 | |
| | The Boeing Co. | | | 3,063 | | | | 903,309 | |
| | Honeywell International Inc. | | | 9,065 | | | | 1,390,208 | |
| a | | IHS Markit Ltd. | | | 27,459 | | | | 1,239,774 | |
| | Raytheon Co. | | | 13,114 | | | | 2,463,465 | |
| | Rockwell Automation Inc. | | | 3,754 | | | | 737,098 | |
| | Roper Technologies Inc. | | | 3,261 | | | | 844,599 | |
| | Stanley Black & Decker Inc. | | | 5,450 | | | | 924,811 | |
FRANKLIN TEMPLETON VARIABLE INSURANCE PRODUCTS TRUST
STATEMENT OF INVESTMENTS
Franklin Large Cap Growth VIP Fund (continued)
| | | | | | | | | | |
| | | | | Shares | | | Value | |
| | Common Stocks (continued) | | | | | | | | |
| | Industrials (continued) | | | | | | | | |
| a | | Univar Inc. | | | 26,142 | | | $ | 809,356 | |
| | | | | | | | | | |
| | | | | | | | | 9,760,312 | |
| | | | | | | | | | |
| | Information Technology 46.6% | | | | | | | | |
| a | | Adobe Systems Inc. | | | 14,910 | | | | 2,612,828 | |
| a | | Alibaba Group Holding Ltd., ADR (China) | | | 5,331 | | | | 919,224 | |
| a | | Alphabet Inc., A | | | 3,629 | | | | 3,822,789 | |
| a | | Alphabet Inc., C | | | 1,014 | | | | 1,061,050 | |
| | Amphenol Corp., A | | | 3,513 | | | | 308,441 | |
| | Analog Devices Inc. | | | 9,752 | | | | 868,221 | |
| | Apple Inc. | | | 38,473 | | | | 6,510,786 | |
| | Applied Materials Inc. | | | 25,043 | | | | 1,280,198 | |
| a | | Autodesk Inc. | | | 16,263 | | | | 1,704,850 | |
| | Broadcom Ltd. | | | 9,110 | | | | 2,340,359 | |
| a | | CoStar Group Inc. | | | 4,418 | | | | 1,311,925 | |
| a | | Electronic Arts Inc. | | | 10,275 | | | | 1,079,492 | |
| a | | Facebook Inc., A | | | 37,180 | | | | 6,560,783 | |
| a | | Fiserv Inc. | | | 7,026 | | | | 921,319 | |
| a | | InterXion Holding NV (Netherlands) | | | 17,193 | | | | 1,013,184 | |
| | Mastercard Inc., A | | | 34,743 | | | | 5,258,700 | |
| | Microsoft Corp. | | | 54,017 | | | | 4,620,614 | |
| | Monolithic Power Systems | | | 5,946 | | | | 668,093 | |
| | NVIDIA Corp. | | | 10,644 | | | | 2,059,614 | |
| a | | PayPal Holdings Inc. | | | 11,738 | | | | 864,152 | |
| a | | Q2 Holdings Inc. | | | 6,306 | | | | 232,376 | |
| a | | Salesforce.com Inc. | | | 16,134 | | | | 1,649,379 | |
| a | | ServiceNow Inc. | | | 18,178 | | | | 2,370,229 | |
| | Visa Inc., A | | | 43,318 | | | | 4,939,118 | |
| | Xilinx Inc. | | | 13,713 | | | | 924,530 | |
| | | | | | | | | | |
| | | | | | | | | 55,902,254 | |
| | | | | | | | | | |
| | Materials 2.5% | | | | | | | | |
| | Albemarle Corp. | | | 4,395 | | | | 562,077 | |
| a | | Axalta Coating Systems Ltd. | | | 23,209 | | | | 751,043 | |
| | Ecolab Inc. | | | 5,701 | | | | 764,960 | |
| a | | Ingevity Corp. | | | 13,161 | | | | 927,456 | |
| | | | | | | | | | |
| | | | | | | | | 3,005,536 | |
| | | | | | | | | | |
| | Real Estate 5.6% | | | | | | | | |
| | American Tower Corp. | | | 12,719 | | | | 1,814,620 | |
| | Equinix Inc. | | | 3,669 | | | | 1,662,864 | |
| a | | SBA Communications Corp., A | | | 19,802 | | | | 3,234,855 | |
| | | | | | | | | | |
| | | | | | | | | 6,712,339 | |
| | | | | | | | | | |
| | Telecommunication Services 0.5% | | | | | | | | |
| a | | T-Mobile U.S. Inc. | | | 9,603 | | | | 609,887 | |
| | | | | | | | | | |
| | | |
| | Total Common Stocks (Cost $65,594,780) | | | | | | | 119,238,131 | |
| | | | | | | | | | |
FRANKLIN TEMPLETON VARIABLE INSURANCE PRODUCTS TRUST
STATEMENT OF INVESTMENTS
Franklin Large Cap Growth VIP Fund (continued)
| | | | | | | | | | |
| | | | | Principal Amount | | | Value | |
| | Short Term Investments (Cost $1,211,132) 1.0% | | | | | | | | |
| | | Repurchase Agreements 1.0% | | | | | | |
| b | | Joint Repurchase Agreement, 1.377%, 1/02/18 (Maturity Value $1,211,318) | | | | | | | | |
| | BNP Paribas Securities Corp. (Maturity Value $197,457) | | | | | | | | |
| | Deutsche Bank Securities Inc. (Maturity Value $220,084) | | | | | | | | |
| | HSBC Securities (USA) Inc. (Maturity Value $789,828) | | | | | | | | |
| | Merrill Lynch, Pierce, Fenner & Smith Inc. (Maturity Value $3,949) | | | | | | | | |
| | Collateralized by U.S. Government Agency Securities, 0.00% - 1.98%, 7/27/18 - 11/22/21; U.S. Treasury Note, 1.25% - 2.00%, 12/31/18 - 4/30/22; and U.S. Treasury Note, Index Linked, 0.125%, 4/15/18 (valued at $1,235,450) | | $ | 1,211,132 | | | $ | 1,211,132 | |
| | | | | | | | | | |
| | Total Investments (Cost $66,805,912) 100.4% | | | | | | | 120,449,263 | |
| | Other Assets, less Liabilities (0.4)% | | | | | | | (481,783 | ) |
| | | | | | | | | | |
| | Net Assets 100.0% | | | | | | $ | 119,967,480 | |
| | | | | | | | | | |
See Abbreviations on page FLG-20.
aNon-income producing.
bSee Note 1(c) regarding joint repurchase agreement.
| | | | |
| FLG-10 | | Annual Report | The accompanying notes are an integral part of these financial statements. | | |
FRANKLIN TEMPLETON VARIABLE INSURANCE PRODUCTS TRUST
Financial Statements
Statement of Assets and Liabilities
December 31, 2017
| | | | |
| | | Franklin Large Cap Growth VIP Fund | |
Assets: | | | | |
Investments in securities: | | | | |
Cost - Unaffiliated issuers | | $ | 65,594,780 | |
Cost - Unaffiliated repurchase agreements | | | 1,211,132 | |
| | | | |
Value - Unaffiliated issuers | | $ | 119,238,131 | |
Value - Unaffiliated repurchase agreements | | | 1,211,132 | |
Cash | | | 17,824 | |
Receivables: | | | | |
Capital shares sold | | | 15,120 | |
Dividends | | | 30,802 | |
Other assets | | | 9 | |
| | | | |
Total assets | | | 120,513,018 | |
| | | | |
Liabilities: | | | | |
Payables: | | | | |
Capital shares redeemed | | | 349,241 | |
Management fees | | | 77,812 | |
Distribution fees | | | 51,322 | |
Reports to shareholders | | | 34,327 | |
Professional fees | | | 30,835 | |
Accrued expenses and other liabilities | | | 2,001 | |
| | | | |
Total liabilities | | | 545,538 | |
| | | | |
Net assets, at value | | $ | 119,967,480 | |
| | | | |
Net assets consist of: | | | | |
Paid-in capital | | $ | 56,650,968 | |
Net unrealized appreciation (depreciation) | | | 53,643,351 | |
Accumulated net realized gain (loss) | | | 9,673,161 | |
| | | | |
Net assets, at value | | $ | 119,967,480 | |
| | | | |
| |
| Class 1: | | | | |
Net assets, at value | | $ | 1,092,483 | |
| | | | |
Shares outstanding | | | 52,190 | |
| | | | |
Net asset value and maximum offering price per share | | $ | 20.93 | |
| | | | |
| |
| Class 2: | | | | |
Net assets, at value | | $ | 118,874,997 | |
| | | | |
Shares outstanding | | | 5,803,791 | |
| | | | |
Net asset value and maximum offering price per share | | $ | 20.48 | |
| | | | |
| | | | | | |
| | | The accompanying notes are an integral part of these financial statements. | Annual Report | | | FLG-11 | |
FRANKLIN TEMPLETON VARIABLE INSURANCE PRODUCTS TRUST
FINANCIAL STATEMENTS
Statement of Operations
for the year ended December 31, 2017
| | | | |
| | | Franklin Large Cap Growth VIP Fund | |
Investment income: | | | | |
Dividends: | | | | |
Unaffiliated issuers | | $ | 886,770 | |
Interest: | | | | |
Unaffiliated issuers | | | 12,126 | |
| | | | |
Total investment income | | | 898,896 | |
| | | | |
Expenses: | | | | |
Management fees (Note 3a) | | | 918,952 | |
Distribution fees: (Note 3c) | | | | |
Class 2. | | | 303,291 | |
Custodian fees (Note 4) | | | 1,473 | |
Reports to shareholders | | | 58,308 | |
Professional fees | | | 47,625 | |
Trustees’ fees and expenses | | | 528 | |
Other | | | 42,663 | |
| | | | |
Total expenses | | | 1,372,840 | |
Expense reductions (Note 4) | | | (40 | ) |
| | | | |
Net expenses | | | 1,372,800 | |
| | | | |
Net investment income (loss) | | | (473,904 | ) |
| | | | |
Realized and unrealized gains (losses): | | | | |
Net realized gain (loss) from: | | | | |
Investments: | | | | |
Unaffiliated issuers | | | 10,317,956 | |
| | | | |
Net change in unrealized appreciation (depreciation) on: | | | | |
Investments: | | | | |
Unaffiliated issuers | | | 20,209,141 | |
Translation of other assets and liabilities denominated in foreign currencies | | | 28,482 | |
| | | | |
Net change in unrealized appreciation (depreciation) | | | 20,237,623 | |
| | | | |
Net realized and unrealized gain (loss) | | | 30,555,579 | |
| | | | |
Net increase (decrease) in net assets resulting from operations | | $ | 30,081,675 | |
| | | | |
| | | | |
| FLG-12 | | Annual Report | The accompanying notes are an integral part of these financial statements. | | |
FRANKLIN TEMPLETON VARIABLE INSURANCE PRODUCTS TRUST
FINANCIAL STATEMENTS
Statements of Changes in Net Assets
| | | | | | | | |
| | | Franklin Large Cap Growth VIP Fund | |
| | | Year Ended December 31, | |
| | | 2017 | | | 2016 | |
Increase (decrease) in net assets: | | | | | | | | |
Operations: | | | | | | | | |
Net investment income (loss) | | $ | (473,904 | ) | | $ | (854,138 | ) |
Net realized gain (loss) | | | 10,317,956 | | | | 45,675,157 | |
Net change in unrealized appreciation (depreciation) | | | 20,237,623 | | | | (50,315,678 | ) |
| | | | |
Net increase (decrease) in net assets resulting from operations | | | 30,081,675 | | | | (5,494,659 | ) |
| | | | |
Distributions to shareholders from: | | | | | | | | |
Net investment income: | | | | | | | | |
Class 1 | | | (9,601 | ) | | | — | |
Class 2 | | | (751,572 | ) | | | — | |
Net realized gains: | | | | | | | | |
Class 1 | | | (77,085 | ) | | | (673,017 | ) |
Class 2 | | | (9,605,025 | ) | | | (3,070,097 | ) |
| | | | |
Total distributions to shareholders | | | (10,443,283 | ) | | | (3,743,114 | ) |
| | | | |
Capital share transactions: (Note 2) | | | | | | | | |
Class 1 | | | 49,428 | | | | (45,655,781 | ) |
Class 2 | | | (13,631,397 | ) | | | (102,866,036 | ) |
| | | | |
Total capital share transactions | | | (13,581,969 | ) | | | (148,521,817 | ) |
| | | | |
Net increase (decrease) in net assets | | | 6,056,423 | | | | (157,759,590 | ) |
Net assets: | | | | | | | | |
Beginning of year | | | 113,911,057 | | | | 271,670,647 | |
| | | | |
End of year | | $ | 119,967,480 | | | $ | 113,911,057 | |
| | | | |
Undistributed net investment income included in net assets: | | | | | | | | |
End of year | | $ | — | | | $ | 760,767 | |
| | | | |
| | | | | | |
| | | The accompanying notes are an integral part of these financial statements. | Annual Report | | | FLG-13 | |
FRANKLIN TEMPLETON VARIABLE INSURANCE PRODUCTS TRUST
Notes to Financial Statements
Franklin Large Cap Growth VIP Fund
1. Organization and Significant Accounting Policies
Franklin Templeton Variable Insurance Products Trust (Trust) is registered under the Investment Company Act of 1940 (1940 Act) as an open-end management investment company, consisting of eighteen separate funds and applies the specialized accounting and reporting guidance in U.S. Generally Accepted Accounting Principles (U.S. GAAP). Franklin Large Cap Growth VIP Fund (Fund) is included in this report. Shares of the Fund are generally sold only to insurance company separate accounts to fund the benefits of variable life insurance policies or variable annuity contracts. At December 31, 2017, 69.9% of the Fund’s shares were held through one insurance company. Investment activities of these insurance company separate accounts could have a material impact on the Fund. The Fund offers two classes of shares: Class 1 and Class 2. Each class of shares may differ by its distribution fees, voting rights on matters affecting a single class and its exchange privilege.
The following summarizes the Fund’s significant accounting policies.
a. Financial Instrument Valuation
The Fund’s investments in financial instruments are carried at fair value daily. Fair value is the price that would be received to sell an asset or paid to transfer a liability in an orderly transaction between market participants on the measurement date. The Fund calculates the net asset value (NAV) per share as of 4 p.m. Eastern time each day the New York Stock Exchange (NYSE) is open for trading. Under compliance policies and procedures approved by the Trust’s Board of Trustees (the Board), the Fund’s administrator has responsibility for oversight of valuation, including leading the cross-functional Valuation Committee (VC). The VC provides administration and oversight of the Fund’s valuation policies and procedures, which are approved annually by the Board. Among other things, these procedures allow the Fund to utilize independent pricing services, quotations from securities and financial instrument dealers, and other market sources to determine fair value.
Equity securities listed on an exchange or on the NASDAQ National Market System are valued at the last quoted sale price or the official closing price of the day, respectively. Foreign equity securities are valued as of the close of trading on the foreign stock exchange on which the security is primarily traded, or as of 4 p.m. Eastern time. The value is then converted
into its U.S. dollar equivalent at the foreign exchange rate in effect at 4 p.m. Eastern time on the day that the value of the security is determined. Over-the-counter (OTC) securities are valued within the range of the most recent quoted bid and ask prices. Securities that trade in multiple markets or on multiple exchanges are valued according to the broadest and most representative market. Certain equity securities are valued based upon fundamental characteristics or relationships to similar securities.
Investments in repurchase agreements are valued at cost, which approximates fair value.
The Fund has procedures to determine the fair value of financial instruments for which market prices are not reliable or readily available. Under these procedures, the VC convenes on a regular basis to review such financial instruments and considers a number of factors, including significant unobservable valuation inputs, when arriving at fair value. The VC primarily employs a market-based approach which may use related or comparable assets or liabilities, recent transactions, market multiples, book values, and other relevant information for the investment to determine the fair value of the investment. An income-based valuation approach may also be used in which the anticipated future cash flows of the investment are discounted to calculate fair value. Discounts may also be applied due to the nature or duration of any restrictions on the disposition of the investments. Due to the inherent uncertainty of valuations of such investments, the fair values may differ significantly from the values that would have been used had an active market existed. The VC employs various methods for calibrating these valuation approaches including a regular review of key inputs and assumptions, transactional back-testing or disposition analysis, and reviews of any related market activity.
Trading in securities on foreign securities stock exchanges and OTC markets may be completed before 4 p.m. Eastern time. In addition, trading in certain foreign markets may not take place on every Fund’s business day. Occasionally, events occur between the time at which trading in a foreign security is completed and 4 p.m. Eastern time that might call into question the reliability of the value of a portfolio security held by the Fund. As a result, differences may arise between the value of the Fund’s portfolio securities as determined at the foreign market close and the latest indications of value at 4 p.m. Eastern time. In order to minimize the potential for these differences, the VC monitors price movements following the close of trading in foreign stock markets through a series of country
FRANKLIN TEMPLETON VARIABLE INSURANCE PRODUCTS TRUST
NOTES TO FINANCIAL STATEMENTS
Franklin Large Cap Growth VIP Fund (continued)
specific market proxies (such as baskets of American Depositary Receipts, futures contracts and exchange traded funds). These price movements are measured against established trigger thresholds for each specific market proxy to assist in determining if an event has occurred that may call into question the reliability of the values of the foreign securities held by the Fund. If such an event occurs, the securities may be valued using fair value procedures, which may include the use of independent pricing services.
When the last day of the reporting period is a non-business day, certain foreign markets may be open on those days that the Fund’s NAV is not calculated, which could result in differences between the value of the Fund’s portfolio securities on the last business day and the last calendar day of the reporting period. Any significant security valuation changes due to an open foreign market are adjusted and reflected by the Fund for financial reporting purposes.
b. Foreign Currency Translation
Portfolio securities and other assets and liabilities denominated in foreign currencies are translated into U.S. dollars based on the exchange rate of such currencies against U.S. dollars on the date of valuation. The Fund may enter into foreign currency exchange contracts to facilitate transactions denominated in a foreign currency. Purchases and sales of securities, income and expense items denominated in foreign currencies are translated into U.S. dollars at the exchange rate in effect on the transaction date. Portfolio securities and assets and liabilities denominated in foreign currencies contain risks that those currencies will decline in value relative to the U.S. dollar. Occasionally, events may impact the availability or reliability of foreign exchange rates used to convert the U.S. dollar equivalent value. If such an event occurs, the foreign exchange rate will be valued at fair value using procedures established and approved by the Board.
The Fund does not separately report the effect of changes in foreign exchange rates from changes in market prices on securities held. Such changes are included in net realized and unrealized gain or loss from investments in the Statement of Operations.
Realized foreign exchange gains or losses arise from sales of foreign currencies, currency gains or losses realized between the trade and settlement dates on securities transactions and the difference between the recorded amounts of dividends, interest, and foreign withholding taxes and the U.S. dollar equivalent of
the amounts actually received or paid. Net unrealized foreign exchange gains and losses arise from changes in foreign exchange rates on foreign denominated assets and liabilities other than investments in securities held at the end of the reporting period.
c. Joint Repurchase Agreement
The Fund enters into a joint repurchase agreement whereby its uninvested cash balance is deposited into a joint cash account with other funds managed by the investment manager or an affiliate of the investment manager and is used to invest in one or more repurchase agreements. The value and face amount of the joint repurchase agreement are allocated to the funds based on their pro-rata interest. A repurchase agreement is accounted for as a loan by the Fund to the seller, collateralized by securities which are delivered to the Fund’s custodian. The fair value, including accrued interest, of the initial collateralization is required to be at least 102% of the dollar amount invested by the funds, with the value of the underlying securities marked to market daily to maintain coverage of at least 100%. Repurchase agreements are subject to the terms of Master Repurchase Agreements (MRAs) with approved counterparties (sellers). The MRAs contain various provisions, including but not limited to events of default and maintenance of collateral for repurchase agreements. In the event of default by either the seller or the Fund, certain MRAs may permit the non-defaulting party to net and close-out all transactions, if any, traded under such agreements. The Fund may sell securities it holds as collateral and apply the proceeds towards the repurchase price and any other amounts owed by the seller to the Fund in the event of default by the seller. This could involve costs or delays in addition to a loss on the securities if their value falls below the repurchase price owed by the seller. The joint repurchase agreement held by the Fund at year end, as indicated in the Statement of Investments, had been entered into on December 29, 2017.
d. Income and Deferred Taxes
It is the Fund’s policy to qualify as a regulated investment company under the Internal Revenue Code. The Fund intends to distribute to shareholders substantially all of its taxable income and net realized gains to relieve it from federal income and if applicable, excise taxes. As a result, no provision for U.S. federal income taxes is required.
FRANKLIN TEMPLETON VARIABLE INSURANCE PRODUCTS TRUST
NOTES TO FINANCIAL STATEMENTS
Franklin Large Cap Growth VIP Fund (continued)
1. Organization and Significant Accounting Policies (continued)
d. Income and Deferred Taxes (continued)
The Fund may be subject to foreign taxation related to income received, capital gains on the sale of securities and certain foreign currency transactions in the foreign jurisdictions in which it invests. Foreign taxes, if any, are recorded based on the tax regulations and rates that exist in the foreign markets in which the Fund invests. When a capital gain tax is determined to apply, the Fund records an estimated deferred tax liability in an amount that would be payable if the securities were disposed of on the valuation date.
The Fund may recognize an income tax liability related to its uncertain tax positions under U.S. GAAP when the uncertain tax position has a less than 50% probability that it will be sustained upon examination by the tax authorities based on its technical merits. As of December 31, 2017, the Fund has determined that no tax liability is required in its financial statements related to uncertain tax positions for any open tax years (or expected to be taken in future tax years). Open tax years are those that remain subject to examination and are based on the statute of limitations in each jurisdiction in which the Fund invests.
e. Security Transactions, Investment Income, Expenses and Distributions
Security transactions are accounted for on trade date. Realized gains and losses on security transactions are determined on a specific identification basis. Interest income and estimated expenses are accrued daily. Dividend income is recorded on the ex-dividend date except for certain dividends from securities where the dividend rate is not available. In such cases, the dividend is recorded as soon as the information is received by the Fund. Distributions to shareholders are recorded on the ex-dividend date. Distributable earnings are determined according to income tax regulations (tax basis) and may differ
from earnings recorded in accordance with U.S. GAAP. These differences may be permanent or temporary. Permanent differences are reclassified among capital accounts to reflect their tax character. These reclassifications have no impact on net assets or the results of operations. Temporary differences are not reclassified, as they may reverse in subsequent periods.
Common expenses incurred by the Trust are allocated among the Funds based on the ratio of net assets of each Fund to the combined net assets of the Trust. Fund specific expenses are charged directly to the Fund that incurred the expense.
Realized and unrealized gains and losses and net investment income, excluding class specific expenses, are allocated daily to each class of shares based upon the relative proportion of net assets of each class. Differences in per share distributions by class are generally due to differences in class specific expenses.
f. Accounting Estimates
The preparation of financial statements in accordance with U.S. GAAP requires management to make estimates and assumptions that affect the reported amounts of assets and liabilities at the date of the financial statements and the amounts of income and expenses during the reporting period. Actual results could differ from those estimates.
g. Guarantees and Indemnifications
Under the Trust’s organizational documents, its officers and trustees are indemnified by the Trust against certain liabilities arising out of the performance of their duties to the Trust. Additionally, in the normal course of business, the Trust, on behalf of the Fund, enters into contracts with service providers that contain general indemnification clauses. The Trust’s maximum exposure under these arrangements is unknown as this would involve future claims that may be made against the Trust that have not yet occurred. Currently, the Trust expects the risk of loss to be remote.
FRANKLIN TEMPLETON VARIABLE INSURANCE PRODUCTS TRUST
NOTES TO FINANCIAL STATEMENTS
Franklin Large Cap Growth VIP Fund (continued)
2. Shares of Beneficial Interest
At December 31, 2017, there were an unlimited number of shares authorized (without par value). Transactions in the Fund’s shares were as follows:
| | | | | | | | | | | | | | | | | | | | |
| | | Year Ended December 31, | |
| | | 2017 | | | | | | 2016 | |
| | | Shares | | | Amount | | | | | | Shares | | | Amount | |
| | | | | |
| Class 1 Shares: | | | | | | | | | | | | | | | | | | | | |
Shares sold | | | — | | | $ | — | | | | | | | | 5,179 | | | $ | 86,575 | |
Shares issued in reinvestment of distributions | | | 4,592 | | | | 86,686 | | | | | | | | 39,404 | | | | 673,017 | |
Shares redeemed in-kind (Note 8) | | | — | | | | — | | | | | | | | (2,315,969 | ) | | | (41,560,066 | ) |
Shares redeemed | | | (1,833 | ) | | | (37,258 | ) | | | | | | | (277,582 | ) | | | (4,855,307 | ) |
| | | | |
Net increase (decrease) | | | 2,759 | | | $ | 49,428 | | | | | | | | (2,548,968 | ) | | $ | (45,655,781 | ) |
| | | | |
| | | | | |
| Class 2 Shares: | | | | | | | | | | | | | | | | | | | | |
Shares sold | | | 325,624 | | | $ | 6,237,303 | | | | | | | | 490,428 | | | $ | 8,312,649 | |
Shares issued in reinvestment of distributions | | | 559,816 | | | | 10,356,597 | | | | | | | | 183,399 | | | | 3,070,097 | |
Shares redeemed in-kind (Note 8) | | | — | | | | — | | | | | | | | (3,930,777 | ) | | | (69,101,102 | ) |
Shares redeemed | | | (1,547,426 | ) | | | (30,225,297 | ) | | | | | | | (2,651,505 | ) | | | (45,147,680 | ) |
| | | | |
Net increase (decrease) | | | (661,986 | ) | | $ | (13,631,397 | ) | | | | | | | (5,908,455 | ) | | $ | (102,866,036 | ) |
| | | | |
3. Transactions with Affiliates
Franklin Resources, Inc. is the holding company for various subsidiaries that together are referred to as Franklin Templeton Investments. Certain officers and trustees of the Fund are also officers and/or directors of the following subsidiaries:
| | |
| Subsidiary | | Affiliation |
Franklin Advisers, Inc. (Advisers) | | Investment manager |
Franklin Templeton Services, LLC (FT Services) | | Administrative manager |
Franklin Templeton Distributors, Inc. (Distributors) | | Principal underwriter |
Franklin Templeton Investor Services, LLC (Investor Services) | | Transfer agent |
a. Management Fees
The Fund pays an investment management fee to Advisers based on the average daily net assets of the Fund as follows:
| | |
| Annualized Fee Rate | | Net Assets |
0.750% | | Up to and including $500 million |
0.625% | | Over $500 million, up to and including $1 billion |
0.500% | | In excess of $1 billion |
For the year ended December 31, 2017, the gross effective investment management fee rate was 0.750% of the Fund’s average daily net assets.
b. Administrative Fees
Under an agreement with Advisers, FT Services provides administrative services to the Fund. The fee is paid by Advisers based on the Fund’s average daily net assets, and is not an additional expense of the Fund.
FRANKLIN TEMPLETON VARIABLE INSURANCE PRODUCTS TRUST
NOTES TO FINANCIAL STATEMENTS
Franklin Large Cap Growth VIP Fund (continued)
3. Transactions with Affiliates (continued)
c. Distribution Fees
The Board has adopted a distribution plan for Class 2 shares pursuant to Rule 12b-1 under the 1940 Act. Under the Fund’s compensation distribution plan, the Fund pays Distributors for costs incurred in connection with the servicing, sale and distribution of the Fund’s shares up to 0.35% per year of its average daily net assets. The Board has agreed to limit the current rate to 0.25% per year for Class 2. The plan year, for purposes of monitoring compliance with the maximum annual plan rate, is February 1 through January 31.
d. Transfer Agent Fees
Investor Services, under terms of an agreement, performs shareholder servicing for the Fund and is not paid by the Fund for the services.
4. Expense Offset Arrangement
The Fund has entered into an arrangement with its custodian whereby credits realized as a result of uninvested cash balances are used to reduce a portion of the Fund’s custodian expenses. During the year ended December 31, 2017, the custodian fees were reduced as noted in the Statement of Operations.
5. Income Taxes
The tax character of distributions paid during the years ended December 31, 2017 and 2016, was as follows:
| | | | | | | | |
| | | 2017 | | | 2016 | |
Distributions paid from: | | | | | | | | |
Ordinary income. | | $ | 761,173 | | | $ | — | |
Long term capital gain. | | | 9,682,110 | | | | 3,743,114 | |
| | | | |
| | $ | 10,443,283 | | | $ | 3,743,114 | |
| | | | |
At December 31, 2017, the cost of investments, net unrealized appreciation (depreciation), undistributed ordinary income and undistributed long term capital gains for income tax purposes were as follows:
| | | | |
Cost of investments | | $ | 66,832,445 | |
| | | | |
Unrealized appreciation | | $ | 54,119,711 | |
Unrealized depreciation | | | (502,893 | ) |
| | | | |
Net unrealized appreciation (depreciation) | | $ | 53,616,818 | |
| | | | |
Undistributed ordinary income | | $ | 292,435 | |
Undistributed long term capital gains | | | 9,407,259 | |
| | | | |
Distributable earnings | | $ | 9,699,694 | |
| | | | |
Differences between income and/or capital gains as determined on a book basis and a tax basis are primarily due to differing treatments of foreign currency transactions, passive foreign investment company shares and wash sales.
6. Investment Transactions
Purchases and sales of investments (excluding short term securities) for the year ended December 31, 2017, aggregated $30,088,993 and $53,182,198, respectively.
FRANKLIN TEMPLETON VARIABLE INSURANCE PRODUCTS TRUST
NOTES TO FINANCIAL STATEMENTS
Franklin Large Cap Growth VIP Fund (continued)
7. Credit Facility
The Fund, together with other U.S. registered and foreign investment funds (collectively, Borrowers), managed by Franklin Templeton Investments, are borrowers in a joint syndicated senior unsecured credit facility totaling $2 billion (Global Credit Facility) which matured on February 9, 2018. This Global Credit Facility provides a source of funds to the Borrowers for temporary and emergency purposes, including the ability to meet future unanticipated or unusually large redemption requests. Effective February 9, 2018, the Borrowers renewed the Global Credit Facility for a one year term, maturing February 8, 2019, for a total of $2 billion.
Under the terms of the Global Credit Facility, the Fund shall, in addition to interest charged on any borrowings made by the Fund and other costs incurred by the Fund, pay its share of fees and expenses incurred in connection with the implementation and maintenance of the Global Credit Facility, based upon its relative share of the aggregate net assets of all of the Borrowers, including an annual commitment fee of 0.15% based upon the unused portion of the Global Credit Facility. These fees are reflected in other expenses in the Statement of Operations. During the year ended December 31, 2017, the Fund did not use the Global Credit Facility.
8. Redemption In-Kind
During the year ended December 31, 2016, the Fund realized $34,226,067 of net gains resulting from a redemption in-kind in which a shareholder redeemed fund shares for cash and securities held by the Fund. Because such gains are not taxable to the Fund and are not distributed to remaining shareholders, they have been reclassified from accumulated net realized gains to paid-in capital.
9. Fair Value Measurements
The Fund follows a fair value hierarchy that distinguishes between market data obtained from independent sources (observable inputs) and the Fund’s own market assumptions (unobservable inputs). These inputs are used in determining the value of the Fund’s financial instruments and are summarized in the following fair value hierarchy:
| | • | | Level 1 – quoted prices in active markets for identical financial instruments |
| | • | | Level 2 – other significant observable inputs (including quoted prices for similar financial instruments, interest rates, prepayment speed, credit risk, etc.) |
| | • | | Level 3 – significant unobservable inputs (including the Fund’s own assumptions in determining the fair value of financial instruments) |
The input levels are not necessarily an indication of the risk or liquidity associated with financial instruments at that level.
For movements between the levels within the fair value hierarchy, the Fund has adopted a policy of recognizing the transfers as of the date of the underlying event which caused the movement.
A summary of inputs used as of December 31, 2017, in valuing the Fund’s assets carried at fair value, is as follows:
| | | | | | | | | | | | | | | | |
| | | Level 1 | | | Level 2 | | | Level 3 | | | Total | |
| | | | |
| Assets: | | | | | | | | | | | | | | | | |
Investments in Securities:a | | | | | | | | | | | | | | | | |
Equity Investments | | $ | 119,238,131 | | | $ | — | | | $ | — | | | $ | 119,238,131 | |
Short Term Investments | | | — | | | | 1,211,132 | | | | — | | | | 1,211,132 | |
| | | | |
Total Investments in Securities | | $ | 119,238,131 | | | $ | 1,211,132 | | | $ | — | | | $ | 120,449,263 | |
| | | | |
aFor detailed categories, see the accompanying Statement of Investments.
FRANKLIN TEMPLETON VARIABLE INSURANCE PRODUCTS TRUST
NOTES TO FINANCIAL STATEMENTS
Franklin Large Cap Growth VIP Fund (continued)
9. Fair Value Measurements (continued)
A reconciliation of assets in which Level 3 inputs are used in determining fair value is presented when there are significant Level 3 financial instruments at the beginning and/or end of the year. At December 31, 2017, the reconciliation of assets, is as follows:
| | | | | | | | | | | | | | | | | | | | | | | | | | | | | | | | | | | | |
| | | Balance at Beginning of Year | | | Purchases | | | Sales | | | Transfers Into (Out of) Level 3 | | | Cost Basis Adjustments | | | Net Realized Gain (Loss) | | | Net Unrealized Appreciation (Depreciation) | | | Balance at End
of Year | | | Net Change in Unrealized Appreciation (Depreciation) on Assets Held at Year End | |
| Assets: | | | | | | | | | | | | | | | | | | | | | | | | | | | | | | | | | | | | |
Investments in Securities: | | | | | | | | | | | | | | | | | | | | | | | | | | | | | | | | | | | | |
Equity Investments: | | | | | | | | | | | | | | | | | | | | | | | | | | | | | | | | | | | | |
Health Care | | $ | 364,322 | | | $ | — | | | $ | (326,401 | ) | | $ | — | | | $ | — | | | $ | (236,282 | ) | | $ | 198,361 | | | $ | — | | | $ | — | |
| | | | |
| Receivables: | | | | | | | | | | | | | | | | | | | | | | | | | | | | | | | | | | | | |
Investment Securities Sold | | $ | 826,648 | | | $ | — | | | $ | (855,227 | ) | | $ | — | | | $ | — | | | $ | — | | | $ | 28,579 | | | $ | — | | | $ | — | |
| | | | |
10. Subsequent Events
The Fund has evaluated subsequent events through the issuance of the financial statements and determined that no events have occurred that require disclosure other than those already disclosed in the financial statements.
Abbreviations
| | |
| Selected Portfolio |
|
| ADR American Depositary Receipt |
FRANKLIN TEMPLETON VARIABLE INSURANCE PRODUCTS TRUST
Report of Independent Registered Public Accounting Firm
To the Board of Trustees of Franklin Templeton Variable Insurance Products Trust and Shareholders of Franklin Large Cap Growth VIP Fund
Opinion on the Financial Statements
We have audited the accompanying statement of assets and liabilities, including the statement of investments, of Franklin Large Cap Growth VIP Fund (the “Fund”) as of December 31, 2017, the related statement of operations for the year ended December 31, 2017, the statement of changes in net assets for each of the two years in the period ended December 31, 2017, including the related notes, and the financial highlights for each of the five years in the period ended December 31, 2017 (collectively referred to as the “financial statements”). In our opinion, the financial statements present fairly, in all material respects, the financial position of the Fund as of December 31, 2017, the results of its operations for the year then ended, the changes in its net assets for each of the two years in the period ended December 31, 2017 and the financial highlights for each of the five years in the period ended December 31, 2017, in conformity with accounting principles generally accepted in the United States of America.
Basis for Opinion
These financial statements are the responsibility of the Fund’s management. Our responsibility is to express an opinion on the Fund’s financial statements based on our audits. We are a public accounting firm registered with the Public Company Accounting Oversight Board (United States) (“PCAOB”) and are required to be independent with respect to the Fund in accordance with the U.S. federal securities laws and the applicable rules and regulations of the Securities and Exchange Commission and the PCAOB.
We conducted our audits of these financial statements in accordance with the standards of the PCAOB. Those standards require that we plan and perform the audit to obtain reasonable assurance about whether the financial statements are free of material misstatement, whether due to error or fraud.
Our audits included performing procedures to assess the risks of material misstatement of the financial statements, whether due to error or fraud, and performing procedures that respond to those risks. Such procedures included examining, on a test basis, evidence regarding the amounts and disclosures in the financial statements. Our audits also included evaluating the accounting principles used and significant estimates made by management, as well as evaluating the overall presentation of the financial statements. Our procedures included confirmation of securities owned as of December 31, 2017 by correspondence with the custodian and brokers; when replies were not received from brokers, we performed other auditing procedures. We believe that our audits provide a reasonable basis for our opinion.
PricewaterhouseCoopers LLP
San Francisco, California
February 15, 2018
We have served as the auditor of one or more investment companies in the Franklin Templeton Group of Funds since 1948.
FRANKLIN TEMPLETON VARIABLE INSURANCE PRODUCTS TRUST
Tax Information (unaudited)
Franklin Large Cap Growth VIP Fund
Under Section 852(b)(3)(C) of the Internal Revenue Code (Code), the Fund hereby reports the maximum amount allowable but no less than $9,682,110 as a long term capital gain dividend for the fiscal year ended December 31, 2017.
Under Section 854(b)(1)(A) of the Code, the Fund hereby reports 94.19% of the ordinary income dividends as income qualifying for the dividends received deduction for the fiscal year ended December 31, 2017.
Franklin Mutual Global Discovery VIP Fund
This annual report for Franklin Mutual Global Discovery VIP Fund covers the fiscal year ended December 31, 2017.
Class 2 Performance Summary as of December 31, 2017
Average annual total return of Class 1 shares* represents the average annual change in value, assuming reinvestment of dividends and capital gains. Average returns smooth out variations in returns, which can be significant; they are not the same as year-by-year results.
| | | | | | | | | | | | |
| Periods ended 12/31/17 | | 1-Year** | | | 5-Year | | | 10-Year | |
Average Annual Total Return | | | +8.60% | | | | +9.63% | | | | +5.58% | |
*The Fund has a fee waiver associated with any investment it makes in a Franklin Templeton money fund and/or other Franklin Templeton fund, contractually guaranteed through 4/30/18. Fund investment results reflect the fee waiver; without this waiver, the results would have been lower.
**Return information is based on net asset values calculated for shareholder transactions. Certain adjustments were made to the net assets of the Fund at 12/31/16 for financial reporting purposes, and as a result, the total returns based on those net asset values differ from the adjusted total returns reported in the Financial Highlights.
Performance reflects the Fund’s Class 2 operating expenses, but does not include any contract fees, expenses or sales charges. If they had been included, performance would be lower. These charges and deductions, particularly for variable life policies, can have a significant effect on contract values and insurance benefits. See the contract prospectus for a complete description of these expenses, including sales charges.
Performance data represent past performance, which does not guarantee future results. Investment return and principal value will fluctuate, and you may have a gain or loss when you sell your shares. Current performance may differ from figures shown.
Total Return Index Comparison for a Hypothetical $10,000 Investment (1/1/08–12/31/17)
The graph below shows the change in value of a hypothetical $10,000 investment in the Fund over the indicated period and includes reinvestment of any income or distributions. The Fund’s performance* is compared to the performance of the MSCI World Index and the Standard & Poor’s® 500 Index (S&P 500®). One cannot invest directly in an index, and an index is not representative of the Fund’s portfolio. Please see Important Notes to Performance Information preceding the Fund Summaries.
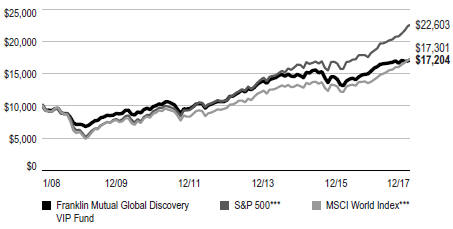
***Source: Morningstar. Please see Index Descriptions following the Fund Summaries.
FRANKLIN MUTUAL GLOBAL DISCOVERY VIP FUND
Fund Goal and Main Investments
The Fund seeks capital appreciation. Under normal market conditions, the Fund invests primarily in US and foreign equity securities that the investment manager believes are available at market prices less than their intrinsic value. The equity securities in which the Fund invests are primarily common stock. To a lesser extent, the Fund also invests in merger arbitrage securities and the debt and equity of distressed companies. The Fund may invest substantially and potentially up to 100% of its assets in foreign securities, which may include sovereign debt and participations in foreign government debt.
Fund Risks
All investments involve risks, including possible loss of principal. Value securities may not increase in price as anticipated, or may decline further in value. The Fund’s investments in foreign securities involve certain risks including currency fluctuations, and economic and political uncertainties. Because the Fund may invest at least a significant portion of its assets in companies in a specific region, including Europe, the Fund is subject to greater risks of adverse developments in that region and/or the surrounding regions than a fund that is more broadly diversified geographically. Securities issued by smaller and midsize companies may be more volatile in price than those of larger companies, involve substantial risks and should be considered speculative. Derivatives involve costs and can create economic leverage in the Fund’s portfolio which may result in significant volatility and cause the Fund to participate in losses (as well as gains) in an amount that exceeds the Fund’s initial investment. The Fund’s investments in companies engaged in mergers, reorganizations or liquidations also involve special risks as pending deals may not be completed on time or on favorable terms. The Fund may invest in lower rated bonds, which entail higher credit risk. The Fund is actively managed but there is no guarantee that the manager’s investment decisions will produce the desired results. The Fund’s prospectus also includes a description of the main investment risks.
Performance Overview
You can find the Fund’s one-year total return in the Performance Summary. In comparison, the Fund’s benchmark,
Geographic Composition*
Based on Total Net Assets as of 12/31/17
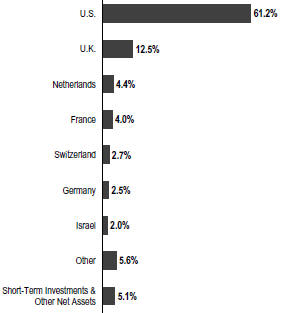
*Figures are stated as a percentage of total and may not equal 100% or may be negative due to rounding, use of any derivatives, unsettled trades or other factors.
the MSCI World Index, generated a +23.07% total return and the S&P 500 posted a +21.83% total return for the same period.1
Economic and Market Overview
The global economy grew moderately during the 12-month period under review. In this environment, global developed and emerging market stocks generated a +24.62% total return, as measured by the MSCI All Country World Index.1 Global markets were aided by price gains in oil and other commodities, generally upbeat economic data across regions, the European Central Bank’s (ECB’s) extension of its monetary easing program, and investor optimism about pro-growth and pro-business policies in the US. The prospect for reforms in the European Union (EU) with Emmanuel Macron’s election as France’s president, encouraging corporate earnings reports and the passage of the US tax reform bill also supported global stocks.
1. Source: Morningstar. One cannot invest directly in an index, and an index is not representative of the Fund’s portfolio. Please see Index Descriptions following the Fund Summaries
The dollar value, number of shares or principal amount, and names of all portfolio holdings are listed in the Fund’s Statement of Investments (SOI).
FRANKLIN MUTUAL GLOBAL DISCOVERY VIP FUND
However, global markets reflected investor concerns about the terms of the UK’s exit from the EU, political uncertainty in the US and the EU, and geopolitical tensions in the Korean peninsula and other regions. Other concerns included the health of European banks, global oil oversupply despite a pact by major oil-producing countries to extend production cuts, and comments from key central bankers around the world about potentially raising interest rates.
After strengthening in 2017’s second and third quarters, the US economy moderated in the fourth quarter. The economy grew faster in 2017 than in 2016, however, largely due to growth in consumer spending, business investment and exports. The unemployment rate decreased from 4.7% in December 2016 to 4.1% at period-end.2 Annual inflation, as measured by the Consumer Price Index, was 2.1% in December 2016, and while it varied over the 12-month period, remained unchanged at period-end.2 The US Federal Reserve (Fed) raised its target range for the federal funds rate 0.25% three times during the period, amid signs of a growing US economy, strengthening labor market and improving business spending. At its December meeting, the Fed confirmed that the monthly balance sheet reduction would increase from US$10 billion to US$20 billion beginning in January 2018.
In Europe, the UK’s economic growth moderated in 2017 compared to 2016, largely due to slower growth in the services sector. In November, the Bank of England raised its key policy rate 0.25%, its first increase in a decade. The eurozone’s growth accelerated in 2017’s second and third quarters, but moderated in the fourth quarter. However, the eurozone’s 2017 economic growth rate was the fastest in a decade. The bloc’s annual inflation rate, while low, ended higher than in December 2016. The ECB kept its benchmark interest rate unchanged during the period. However, at its October meeting, the ECB extended the time frame for its massive bond-buying program from December 2017 to at least September 2018, while reducing the amount of monthly bond purchases in half beginning in January 2018.
In Asia, Japan’s quarterly gross domestic product (GDP) grew for the seventh consecutive quarter, although third-quarter 2017 growth was lower than the previous quarter. The Bank of Japan left its benchmark interest rate unchanged during the period and continued its monetary stimulus measures.
In emerging markets, Brazil’s quarterly GDP grew for the third consecutive quarter, although third-quarter 2017 growth slowed from the previous quarter. The country’s central bank cut its benchmark interest rate several times during the period to spur economic growth. Russia’s GDP grew in 2017’s first three quarters compared to the prior-year periods, amid the Bank of Russia’s continued policy support. China’s GDP grew faster in 2017 than in 2016, supported by solid growth in industrial production, services, fixed-asset investment, retail sales, and imports and exports. The People’s Bank of China left its benchmark interest rate unchanged during the period. Overall, emerging market stocks, as measured by the MSCI Emerging Markets Index, rose substantially during the period.3
Investment Strategy
At Franklin Mutual Advisors, we are committed to our distinctive value approach to investing. Our major investment strategy is investing in undervalued stocks. When selecting undervalued equities, we are attracted to what we believe are fundamentally strong companies with healthy balance sheets, high-quality assets, substantial free cash flow and shareholder-oriented management teams and whose stocks are trading at discounts to our assessment of the companies’ intrinsic or business value. We also look for asset-rich companies whose shares may be trading at depressed levels due to concerns over short-term earnings disappointments, litigation, management strategy or other perceived negatives. While the vast majority of our undervalued equity investments are made in publicly traded companies globally, we may invest occasionally in privately held companies as well.
We complement this more traditional investment strategy with two others. One is distressed investing, which is complex and can take many forms. The most common distressed investment the Fund undertakes is the purchase of financially troubled or bankrupt companies’ debt at a substantial discount to face value. After the financially distressed company is reorganized, often in bankruptcy court, the old debt is typically replaced with new securities issued by the financially stronger company.
The other piece of our investment strategy is participating in arbitrage situations, another highly specialized field. When companies announce proposed mergers or takeovers, commonly referred to as “deals,” the target company may trade at a discount to the bid it ultimately accepts. One form of arbitrage involves purchasing the target company’s stock when it is trading below the value we believe it would receive in a
2. Source: Bureau of Labor Statistics.
3. Please see Index Descriptions following the Fund Summaries.
FRANKLIN MUTUAL GLOBAL DISCOVERY VIP FUND
deal. In keeping with our commitment to a relatively conservative investment approach, we typically focus our arbitrage efforts on announced deals, and eschew rumored deals or other situations we consider relatively risky.
In addition, it is our practice to hedge the Fund’s currency exposure when we deem it advantageous for our shareholders.
What is meant by “hedge”?
To hedge an investment is to take a position intended to offset potential losses/gains that may be incurred by a companion financial instrument.
Manager’s Discussion
In 2017, an improving economic and political backdrop helped drive most equity markets higher. The positive performances were broad based, spanning across most regions and sectors, and complemented by minimal volatility. Global markets were aided by generally upbeat economic data, improved corporate earnings in the US, Europe and Japan, as well as improved industrial commodity prices, most notably crude oil. In addition, the most significant political risks identified by investors heading into 2017 failed to materialize.
In the US, markets began 2017 rallying as investors hoped that a Republican sweep of US elections in November 2016 would lead to a general loosening in regulations and tax reform, including lower corporate tax rates. Although the Trump administration’s policy agenda was hindered by political gridlock, efforts to loosen federal regulations yielded some results and tax reform legislation was finally passed in late December. Improving economic activity and corporate earnings appeared to be the most meaningful equity market catalysts during much of 2017. However, the modest level of economic growth and low interest rates pushed investors to keep favoring growth stocks. During the period, the Russell 1000® Growth Index generated a total return of +30.21%, while the Russell 1000® Value Index posted a total return of +13.66%.1 Within the Russell 1000® Growth Index, stocks with the largest weightings were technology firms that dominated the headlines: Apple,4 Alphabet (a.k.a. Google),4 Microsoft, Amazon.com4 and Facebook.4
European equity markets started 2017 slowly, but positive political events and improved economic data fueled strong performances during the period. Elections in Europe produced outcomes generally regarded as positive economically as
| | | | |
| Top 10 Sectors/Industries | | | |
| 12/31/17 | | | |
| | | % of Total
Net Assets | |
| Banks | | | 15.6% | |
| Insurance | | | 9.1% | |
| Oil, Gas & Consumable Fuels | | | 8.5% | |
| Pharmaceuticals | | | 7.7% | |
| Media | | | 7.6% | |
| Software | | | 5.4% | |
| Health Care Equipment & Supplies | | | 5.2% | |
| Tobacco | | | 3.9% | |
| Communications Equipment | | | 2.8% | |
| Hotels, Restaurants & Leisure | | | 2.5% | |
far-right parties largely failed to gain political power in national elections. Investors were particularly encouraged by the presidential election outcome in France. The reform-minded, centrist candidate, Emmanuel Macron, won the French presidential election in May and quickly began to push his agenda, most notably labor decrees giving employers in France more say in negotiating contracts directly with workers. Amid all the positive events, the UK remained the most significant outlier. In the UK, a June 2017 snap election resulting in no party having a majority in Parliament appeared to make a “hard Brexit,” in which the UK leaves the European Union (EU) in March 2019 without a negotiated deal, even more likely than before. Although the UK and EU appeared to make some progress late in the year, the snap election results left the Conservative Party in a precarious position and with the risk of another election in the near future.
As value investors, we managed to benefit from steady economic growth despite underlying market turbulence. In all market environments, we seek to invest prudently in securities that we believe represent good value, and then we adjust our views as the world around us changes.
After reducing our exposure to the media industry in 2016 and staying on the sidelines for much of 2017, the industry became a significant area of investment interest in the latter stages of the year due to significant structural changes. Since the 1980s, most Americans received their TV entertainment as part of a bundle from a cable provider. Disparate networks were combined and sold as packages, with annual price increases justified by the inclusion of more networks. Consumers rarely had the option to unbundle cable packages and most markets had no direct competition. However, the growth of fixed and
4. Not a Fund holding.
FRANKLIN MUTUAL GLOBAL DISCOVERY VIP FUND
mobile broadband connectivity ushered in the opportunity to bypass traditional distributors through the delivery of film and TV content over the internet and the launch of direct-to-consumer offerings by TV networks. The growing popularity of new digital options has driven cable providers to roll out lower-priced packages with fewer channels. This evolution has begun to create winners and losers among networks and new opportunities for investors.
Pay TV subscription among US households peaked in 2009 at close to 100 million homes. Initially, the decline in subscribers was moderate, but has accelerated since 2015, reaching a pace of more than 2% per year in 2017. At first, media companies benefited from digital distribution by using it as an additional outlet for selling content. With the cannibalization of traditional platforms accelerating, media companies have begun to respond. The necessity for greater scale in content development and direct access to consumers is driving investment and merger decisions in the industry. From our standpoint, we are looking for networks with the most attractive content relative to the price they have been charging and may be able to charge in the future.
The Fund initiated a position in Walt Disney in the latter half of 2017. We believe Disney is well positioned to benefit from the evolution toward a more direct-to-consumer distribution model. In our view, Disney has one of the best intellectual property (IP) portfolios in all of media with a stable of globally recognized proprietary characters upon which to build a strong direct-to-consumer franchise. If Disney is successful in its bid to acquire the bulk of Twenty-First Century Fox’s4 content assets, the deal would further strengthen its IP portfolio and its content development scale. As it has done with its own IP, Disney would likely be able to leverage Fox’s content into attractions at its theme parks as well as consumer products. The acquisition would offer potential cost synergies that would likely offset some of the investments in the direct-to-consumer service. Under the leadership of chief executive officer Bob Iger, Disney has been effective in integrating acquired companies and navigating through a changing media landscape. Iger’s commitment to remain at the helm through 2021 strengthens our belief that the company should be able to execute on this opportunity.
Merger and acquisition activity remained healthy in 2017, although the pace of activity appeared to decelerate slightly due to less favorable political and regulatory conditions in the US, the UK and China. In the US, several key regulatory agencies remain short of members, including the Federal Communications Commission and the Federal Trade Commission. Many large deals continued to wind their way through prolonged
| | | | |
| Top 10 Holdings | | | |
12/31/17 | | | |
Company Sector/Industry, Country | | % of Total
Net Assets | |
British American Tobacco PLC
Tobacco, UK | | | 2.7% | |
Royal Dutch Shell PLC
Oil, Gas & Consumable Fuels, UK | | | 2.5% | |
Medtronic PLC
Health Care Equipment & Supplies, US | | | 2.3% | |
Merck & Co. Inc.
Pharmaceuticals, US | | | 2.3% | |
Wells Fargo & Co.
Banks, US | | | 2.3% | |
Time Warner Inc.
Media, US | | | 2.2% | |
Citigroup Inc.
Banks, US | | | 2.1% | |
NN Group NV
Insurance, Netherlands | | | 2.1% | |
Eli Lilly & Co.
Pharmaceuticals, US | | | 2.1% | |
Cisco Systems Inc.
Communications Equipment, US | | | 2.0% | |
regulatory reviews, including Bayer’s4 acquisition of Monsanto, AT&T’s acquisition of Time Warner, and Twenty-First Century Fox’s offer for Sky.
Credit spreads narrowed in 2017 for higher quality and high yield credit, albeit with some minor bouts of volatility. The broad-based decrease in yield differentials between bonds with the same maturity but different credit quality provided the Fund with the opportunity to exit a number of opportunities that presented themselves in early 2016, including several bond offerings related to leveraged acquisitions, as prices improved, spreads shrank, and the risk-adjusted returns were no longer mispriced. As the year progressed and investors became more willing buyers of credit, mispriced risk became more difficult to find, in our opinion. In times when the credit markets fluctuate and value is difficult to easily identify, we believe our industry specific expertise, deep fundamental analysis with a focus on cash flow, and intensive credit and covenant review combine seamlessly and provide us with different ways of looking at the same ideas others may disregard.
Turning to Fund performance, top contributors included multinational software company Microsoft, US-based bank Citigroup and France-based hotel operator Accor.
Microsoft continued to reap the rewards of its rapidly growing cloud business and from shifting Microsoft Office software clients to its subscription-based services. Microsoft reported
FRANKLIN MUTUAL GLOBAL DISCOVERY VIP FUND
solid quarterly results, including an improvement in operating margins and upward guidance to 2018 operating margins. Microsoft also announced a reorganization of its commercial field sales teams in July 2017 as part of its increased focus on cloud computing.
Shares of Citigroup rallied in June in response to the US Federal Reserve’s (Fed’s) latest Comprehensive Capital Analysis and Review (CCAR) results. As part of CCAR, the Fed evaluates banks’ capital distribution plans, including dividends and stock repurchases. Citigroup was approved to distribute nearly $19 billion of capital in 2017, which was greater than expected and roughly 10 percent of the company’s market capitalization when approved. The favorable CCAR outcome was particularly important for Citigroup as it holds significant excess capital that needs to be returned in order for the company to improve its returns. Citigroup’s July investor day provided a further boost to the stock price; management provided a detailed plan to materially increase earnings and returns by 2020, which included a commitment to return $60 billion of capital over the next three years, including 2017’s approved amount. Reports of progress on a major US tax reform bill and the passage of the bill in December positively impacted bank stocks.
Accor benefited from an improving European economy. The company reported generally solid demand in France and the rest of Europe, as well as improvement in revenue per available room, a key performance metric for the industry. In October, Accor agreed to acquire Mantra Group, an Australian hotel operator. In our view, the acquisition was financially and strategically attractive as it consolidated Accor’s leadership in the Australia/New Zealand market, which has seen strong tourism growth. In December, Accor’s management stated it was close to selling a stake in AccorInvest, its hotel property company. The planned sale is part of Accor’s restructuring efforts to become a predominantly assetlight hotel management company.
During the period under review, Fund investments that detracted from performance included US-based energy services company Baker Hughes, Israel-based pharmaceutical services provider Teva Pharmaceuticals and US-based industrials company General Electric (GE).
Baker Hughes is a US-based energy services company, majority owned by GE following the completed merger between Baker Hughes and GE’s oil-and-gas business in July 2017. Baker Hughes’ stock price slid lower in 2017 as the environment for long-cycle oil field service projects remained challenging and the newly combined company posted
weaker-than-expected operating results. Toward year-end, we saw reasons for optimism as oil prices gained and Baker Hughes announced a $3 billion share repurchase program.
Teva Pharmaceutical Industries experienced a challenging year. In January 2017, Teva provided lower earnings guidance and a US federal court invalidated four patents for the company’s top-selling multiple sclerosis drug Copaxone. The resignations of Teva’s chief executive officer (CEO) and chief financial officer in the first half of 2017 further hindered Teva’s stock price. In the second half of the year, weak operating results, a dividend cut and a debt rating downgrade escalated investor concerns. The company managed to ease investor anxiety later in 2017, in our view, with the appointment of Kare Schultz, a well-regarded industry veteran as the new CEO, as well as the divestiture of certain non-core assets and amendment to certain debt instruments. We were also encouraged by the details of a restructuring plan announced by the new CEO in December.
The stock price of GE, a US-based industrials company with a wide range of business units, declined as investors became more discouraged about the company’s poor cash flow generation, significantly underfunded pension liability, bloated cost structure, and increased competition and overcapacity in the power market. Intensifying pressure by activist investors led to chief executive officer (CEO) Jeffrey Immelt’s resignation in June 2017 and the promotion of John Flannery to CEO. However, GE’s stock price continued to slide after the company lowered its 2017 earnings guidance in October, which heightened investor concerns about a potential dividend cut. A dividend cut of 50%, larger than most investors had speculated, was announced in November, along with the incoming CEO’s plan for portfolio optimization and significant cost reductions. These negative events have not altered our view that GE has well-positioned businesses. If GE delivers on its plan to improve free cash flow generation and reduce overhead expenses, we believe there is upside potential for its stock price.
During the period, the Fund held currency forwards and futures seeking to hedge most of the currency risk of the portfolio’s non-US dollar investments. The currency forwards had a negative impact on the Fund’s performance because of the depreciation of the US dollar versus the hedged currencies, while currency futures had a negligible impact.
What is a currency forward?
A currency forward is an agreement between the Fund and a counterparty to buy or sell a foreign currency in exchange for another currency at a specific exchange rate on a future date.
FRANKLIN MUTUAL GLOBAL DISCOVERY VIP FUND
What is a future?
A future is an agreement between the Fund and a counterparty made through a US or foreign futures exchange to buy or sell an underlying instrument or asset at a specific price on a future date.
Thank you for your participation in Franklin Mutual Global Discovery VIP Fund. We look forward to serving your future investment needs.
The foregoing information reflects our analysis, opinions and portfolio holdings as of December 31, 2017, the end of the reporting period. The way we implement our main investment strategies and the resulting portfolio holdings may change depending on factors such as market and economic conditions. These opinions may not be relied upon as investment advice or an offer for a particular security. The information is not a complete analysis of every aspect of any market, country, industry, security or the Fund. Statements of fact are from sources considered reliable, but the investment manager makes no representation or warranty as to their completeness or accuracy. Although historical performance is no guarantee of future results, these insights may help you understand our investment management philosophy.
FRANKLIN MUTUAL GLOBAL DISCOVERY VIP FUND
Class 2 Fund Expenses
As an investor in a variable insurance contract (Contract) that indirectly provides for investment in an underlying mutual fund, you can incur transaction and/or ongoing expenses at both the Fund level and the Contract Level: (1) transaction expenses can include sales charges (loads) on purchases, surrender fees, transfer fees and premium taxes; and (2) ongoing expenses can include management fees, distribution and service (12b-1) fees, contract fees, annual maintenance fees, mortality and expense risk fees and other fees and expenses. All mutual funds and Contracts have some types of ongoing expenses. The table below shows Fund-level ongoing expenses and can help you understand these costs and compare them with those of other mutual funds offered through the Contract. The table assumes a $1,000 investment held for the six months indicated. Please refer to the Fund prospectus for additional information on operating expenses.
Actual Fund Expenses
The table below provides information about the actual account values and actual expenses in the columns under the heading “Actual.” In these columns the Fund’s actual return, which includes the effect of ongoing Fund expenses but does not include the effect of ongoing Contract expenses, is used to calculate the “Ending Account Value.” You can estimate the Fund-level expenses you paid during the period by following these steps (of course, your account value and expenses will differ from those in this illustration): Divide your account value by $1,000 (if your account had an $8,600 value, then $8,600 ÷ $1,000 = 8.6). Then multiply the result by the number under the headings “Actual” and “Fund-Level Expenses Paid During Period” (if Fund-Level Expenses Paid During Period were $ 7.50, then 8.6 x $7.50 = $64.50). In this illustration, the estimated expenses paid this period at the Fund level are $64.50.
Hypothetical Example for Comparison with Other Mutual Funds
Under the heading “Hypothetical” in the table, information is provided about hypothetical account values and hypothetical expenses based on the Fund’s actual expense ratio and an assumed rate of return of 5% per year before expenses, which is not the Fund’s actual return. This information may not be used to estimate the actual ending account balance or expenses you paid for the period, but it can help you compare ongoing costs of investing in the Fund with those of other mutual funds offered through the Contract. To do so, compare this 5% hypothetical example with the 5% hypothetical examples that appear in the shareholder reports of other funds offered through the Contract.
Please note that expenses shown in the table are meant to highlight ongoing costs at the Fund level only and do not reflect any ongoing expenses at the Contract level, or transaction expenses at either the Fund or Contract levels. In addition, while the Fund does not have transaction expenses, if the transaction and ongoing expenses at the Contract level were included, the expenses shown below would be higher. You should consult your Contract prospectus or disclosure document for more information.
| | | | | | | | | | | | | | | | | | | | | | | | | | |
| | | | | | Actual (actual return after expenses) | | | | | Hypothetical (5% annual return before expenses) | | | | |
| Share Class | |
| Beginning Account
Value 7/1/17 |
| |
| Ending Account
Value 12/31/17 |
| |
| Fund-Level
Expenses Paid
During Period
7/1/17–12/31/171,2 |
| | | |
| Ending Account
Value 12/31/17 |
| |
| Fund-Level
Expenses Paid
During Period 7/1/17–12/31/171,2 |
| |
| Net
Annualized
Expense
Ratio2 |
|
Class 2 | | | $1,000 | | | | $1,027.10 | | | | $6.54 | | | | | | $1,018.75 | | | | $6.51 | | | | 1.28 | % |
1. Expenses are equal to the annualized expense ratio for the six-month period as indicated above—in the far right column—multiplied by the simple average account value over the period indicated, and then multiplied by 184/365 to reflect the one-half year period.
2. Reflects expenses after fee waivers and expense reimbursements. Does not include any ongoing expenses of the Contract for which the Fund is an investment option or acquired fund fees and expenses.
FRANKLIN TEMPLETON VARIABLE INSURANCE PRODUCTS TRUST
Financial Highlights
Franklin Mutual Global Discovery VIP Fund
| | | | | | | | | | | | | | | | | | | | |
| | | Year Ended December 31, | |
| | | 2017 | | | 2016 | | | 2015 | | | 2014 | | | 2013 | |
| Class 1 | | | | | | | | | | | | | | | | | | | | |
Per share operating performance
(for a share outstanding throughout the year) | | | | | | | | | | | | | | | | | | | | |
| | | | | |
Net asset value, beginning of year | | | $20.22 | | | | $19.85 | | | | $22.61 | | | | $23.31 | | | | $20.55 | |
| | | | |
| | | | | |
| Income from investment operationsa: | | | | | | | | | | | | | | | | | | | | |
| | | | | |
Net investment incomeb | | | 0.47 | | | | 0.41 | | | | 0.37 | | | | 0.68 | c | | | 0.46 | |
| | | | | |
Net realized and unrealized gains (losses) | | | 1.29 | | | | 1.92 | | | | (1.17) | | | | 0.76 | | | | 5.03 | |
| | | | |
Total from investment operations | | | 1.76 | | | | 2.33 | | | | (0.80) | | | | 1.44 | | | | 5.49 | |
| | | | |
| | | | | |
| Less distributions from: | | | | | | | | | | | | | | | | | | | | |
| | | | | |
Net investment income | | | (0.42 | ) | | | (0.39 | ) | | | (0.69 | ) | | | (0.57 | ) | | | (0.58 | ) |
| | | | | |
Net realized gains | | | (1.18 | ) | | | (1.57 | ) | | | (1.27 | ) | | | (1.57 | ) | | | (2.15 | ) |
| | | | |
Total distributions | | | (1.60 | ) | | | (1.96 | ) | | | (1.96 | ) | | | (2.14 | ) | | | (2.73 | ) |
| | | | |
Net asset value, end of year | | | $20.38 | | | | $20.22 | | | | $19.85 | | | | $22.61 | | | | $23.31 | |
| | | | |
| | | | | |
Total returnd | | | 8.99% | | | | 12.32% | | | | (3.39)% | | | | 5.98% | | | | 27.95% | |
| | | | | |
| Ratios to average net assets | | | | | | | | | | | | | | | | | | | | |
| | | | | |
Expensese,f | | | 1.01% | g | | | 1.01% | g | | | 1.02% | g | | | 1.00% | | | | 0.97% | |
| | | | | |
Expenses incurred in connection with securities sold short | | | —% | | | | 0.01% | | | | 0.02% | | | | 0.03% | | | | —% | h |
| | | | | |
Net investment income | | | 2.29% | | | | 2.10% | | | | 1.71% | | | | 2.85%c | | | | 2.13% | |
| | | | | |
| Supplemental data | | | | | | | | | | | | | | | | | | | | |
| | | | | |
Net assets, end of year (000’s) | | | $3,189 | | | | $3,084 | | | | $2,632 | | | | $2,313 | | | | $2,465 | |
| | | | | |
Portfolio turnover rate | | | 17.49% | | | | 17.54% | | | | 21.88% | | | | 22.18% | | | | 15.58% | |
aThe amount shown for a share outstanding throughout the period may not correlate with the Statement of Operations for the period due to the timing of sales and repurchases of the Fund’s shares in relation to income earned and/or fluctuating fair value of the investments of the Fund.
bBased on average daily shares outstanding.
cNet investment income per share includes approximately $0.34 per share related to income received in the form of special dividends in connection with certain Fund holdings. Excluding this amount, the ratio of net investment income to average net assets would have been 1.40%.
dTotal return does not include fees, charges or expenses imposed by the variable annuity and life insurance contracts for which Franklin Templeton Variable Insurance Products Trust serves as an underlying investment vehicle.
eIncludes dividend and/or interest expense on securities sold short and security borrowing fees, if any. See below for the ratios of such expenses to average net assets for the periods presented. See Note 1(d).
fBenefit of expense reduction rounds to less than 0.01%.
gBenefit of waiver and payments by affiliates rounds to less than 0.01%.
hRounds to less than 0.01%.
| | | | | | |
| | | The accompanying notes are an integral part of these financial statements. | Annual Report | | | MGD-9 | |
FRANKLIN TEMPLETON VARIABLE INSURANCE PRODUCTS TRUST
FINANCIAL HIGHLIGHTS
Franklin Mutual Global Discovery VIP Fund (continued)
| | | | | | | | | | | | | | | | | | | | |
| | | Year Ended December 31, | |
| | | 2017 | | | 2016 | | | 2015 | | | 2014 | | | 2013 | |
| Class 2 | | | | | | | | | | | | | | | | | | | | |
Per share operating performance
(for a share outstanding throughout the year) | | | | | | | | | | | | | | | | | | | | |
| | | | | |
Net asset value, beginning of year | | | $19.69 | | | | $19.37 | | | | $22.11 | | | | $22.84 | | | | $20.17 | |
| | | | |
| | | | | |
| Income from investment operationsa: | | | | | | | | | | | | | | | | | | | | |
| | | | | |
Net investment incomeb | | | 0.41 | | | | 0.35 | | | | 0.32 | | | | 0.60 | c | | | 0.42 | |
| | | | | |
Net realized and unrealized gains (losses) | | | 1.25 | | | | 1.87 | | | | (1.16) | | | | 0.75 | | | | 4.92 | |
| | | | |
Total from investment operations | | | 1.66 | | | | 2.22 | | | | (0.84) | | | | 1.35 | | | | 5.34 | |
| | | | |
| | | | | |
| Less distributions from: | | | | | | | | | | | | | | | | | | | | |
| | | | | |
Net investment income | | | (0.37 | ) | | | (0.33 | ) | | | (0.63 | ) | | | (0.51 | ) | | | (0.52 | ) |
| | | | | |
Net realized gains | | | (1.18 | ) | | | (1.57 | ) | | | (1.27 | ) | | | (1.57 | ) | | | (2.15 | ) |
| | | | |
Total distributions | | | (1.55 | ) | | | (1.90 | ) | | | (1.90 | ) | | | (2.08 | ) | | | (2.67 | ) |
| | | | |
Net asset value, end of year | | | $19.80 | | | | $19.69 | | | | $19.37 | | | | $22.11 | | | | $22.84 | |
| | | | |
| | | | | |
Total returnd | | | 8.71% | | | | 12.06% | | | | (3.65)% | | | | 5.71% | | | | 27.61% | |
| | | | | |
| Ratios to average net assets | | | | | | | | | | | | | | | | | | | | |
| | | | | |
Expensese,f | | | 1.26% | g | | | 1.26% | g | | | 1.27% | g | | | 1.25% | | | | 1.22% | |
| | | | | |
Expenses incurred in connection with securities sold short | | | —% | | | | 0.01% | | | | 0.02% | | | | 0.03% | | | | —% | h |
| | | | | |
Net investment income | | | 2.04% | | | | 1.85% | | | | 1.46% | | | | 2.60% | c | | | 1.88% | |
| | | | | |
| Supplemental data | | | | | | | | | | | | | | | | | | | | |
| | | | | |
Net assets, end of year (000’s) | | | $631,179 | | | | $630,397 | | | | $629,366 | | | | $685,711 | | | | $684,780 | |
| | | | | |
Portfolio turnover rate | | | 17.49% | | | | 17.54% | | | | 21.88% | | | | 22.18% | | | | 15.58% | |
aThe amount shown for a share outstanding throughout the period may not correlate with the Statement of Operations for the period due to the timing of sales and repurchases of the Fund’s shares in relation to income earned and/or fluctuating fair value of the investments of the Fund.
bBased on average daily shares outstanding.
cNet investment income per share includes approximately $0.34 per share related to income received in the form of special dividends in connection with certain Fund holdings. Excluding this amount, the ratio of net investment income to average net assets would have been 1.15%.
dTotal return does not include fees, charges or expenses imposed by the variable annuity and life insurance contracts for which Franklin Templeton Variable Insurance Products Trust serves as an underlying investment vehicle.
eIncludes dividend and/or interest expense on securities sold short and security borrowing fees, if any. See below for the ratios of such expenses to average net assets for the periods presented. See Note 1(d).
fBenefit of expense reduction rounds to less than 0.01%.
gBenefit of waiver and payments by affiliates rounds to less than 0.01%.
hRounds to less than 0.01%.
| | | | |
| MGD-10 | | Annual Report | The accompanying notes are an integral part of these financial statements. | | |
FRANKLIN TEMPLETON VARIABLE INSURANCE PRODUCTS TRUST
FINANCIAL HIGHLIGHTS
Franklin Mutual Global Discovery VIP Fund (continued)
| | | | | | | | | | | | | | | | | | | | |
| | | Year Ended December 31, | |
| | | 2017 | | | 2016 | | | 2015 | | | 2014 | | | 2013 | |
| Class 4 | | | | | | | | | | | | | | | | | | | | |
Per share operating performance
(for a share outstanding throughout the year) | | | | | | | | | | | | | | | | | | | | |
| | | | | |
Net asset value, beginning of year | | | $20.02 | | | | $19.66 | | | | $22.39 | | | | $23.10 | | | | $20.38 | |
| | | | |
| | | | | |
| Income from investment operationsa: | | | | | | | | | | | | | | | | | | | | |
| | | | | |
Net investment incomeb | | | 0.40 | | | | 0.34 | | | | 0.30 | | | | 0.61 | c | | | 0.40 | |
| | | | | |
Net realized and unrealized gains (losses) | | | 1.27 | | | | 1.89 | | | | (1.17) | | | | 0.73 | | | | 4.97 | |
| | | | |
Total from investment operations | | | 1.67 | | | | 2.23 | | | | (0.87) | | | | 1.34 | | | | 5.37 | |
| | | | |
| | | | | |
| Less distributions from: | | | | | | | | | | | | | | | | | | | | |
| | | | | |
Net investment income | | | (0.34 | ) | | | (0.30 | ) | | | (0.59 | ) | | | (0.48 | ) | | | (0.50 | ) |
| | | | | |
Net realized gains | | | (1.18 | ) | | | (1.57 | ) | | | (1.27 | ) | | | (1.57 | ) | | | (2.15 | ) |
| | | | |
Total distributions | | | (1.52 | ) | | | (1.87 | ) | | | (1.86 | ) | | | (2.05 | ) | | | (2.65 | ) |
| | | | |
Net asset value, end of year | | | $20.17 | | | | $20.02 | | | | $19.66 | | | | $22.39 | | | | $23.10 | |
| | | | |
| | | | | |
Total returnd | | | 8.61% | | | | 11.91% | | | | (3.74)% | | | | 5.60% | | | | 27.52% | |
| | | | | |
| Ratios to average net assets | | | | | | | | | | | | | | | | | | | | |
| | | | | |
Expensese,f | | | 1.36% | g | | | 1.36% | g | | | 1.37% | g | | | 1.35% | | | | 1.32% | |
| | | | | |
Expenses incurred in connection with securities sold short | | | —% | | | | 0.01% | | | | 0.02% | | | | 0.03% | | | | —% | h |
| | | | | |
Net investment income | | | 1.94% | | | | 1.75% | | | | 1.36% | | | | 2.50% | c | | | 1.78% | |
| | | | | |
| Supplemental data | | | | | | | | | | | | | | | | | | | | |
| | | | | |
Net assets, end of year (000’s) | | | $41,713 | | | | $45,262 | | | | $49,054 | | | | $59,961 | | | | $70,354 | |
| | | | | |
Portfolio turnover rate | | | 17.49% | | | | 17.54% | | | | 21.88% | | | | 22.18% | | | | 15.58% | |
aThe amount shown for a share outstanding throughout the period may not correlate with the Statement of Operations for the period due to the timing of sales and repurchases of the Fund’s shares in relation to income earned and/or fluctuating fair value of the investments of the Fund.
bBased on average daily shares outstanding.
cNet investment income per share includes approximately $0.34 per share related to income received in the form of special dividends in connection with certain Fund holdings. Excluding this amount, the ratio of net investment income to average net assets would have been 1.05%.
dTotal return does not include fees, charges or expenses imposed by the variable annuity and life insurance contracts for which Franklin Templeton Variable Insurance Products Trust serves as an underlying investment vehicle.
eIncludes dividend and/or interest expense on securities sold short and security borrowing fees, if any. See below for the ratios of such expenses to average net assets for the periods presented. See Note 1(d).
fBenefit of expense reduction rounds to less than 0.01%.
gBenefit of waiver and payments by affiliates rounds to less than 0.01%.
hRounds to less than 0.01%.
| | | | | | |
| | | The accompanying notes are an integral part of these financial statements. | Annual Report | | | MGD-11 | |
FRANKLIN TEMPLETON VARIABLE INSURANCE PRODUCTS TRUST
Statement of Investments, December 31, 2017
Franklin Mutual Global Discovery VIP Fund
| | | | | | | | | | | | | | |
| | | | | Country | | | Shares/
Units/
Warrants | | | Value | |
| | Common Stocks and Other Equity Interests 90.2% | | | | | | | | | | | | |
| | Aerospace & Defense 0.1% | | | | | | | | | | | | |
| | BAE Systems PLC | | | United Kingdom | | | | 48,804 | | | $ | 377,649 | |
| | | | | | | | | | | | | | |
| | Auto Components 0.4% | | | | | | | | | | | | |
| a,b,c | | International Automotive Components Group Brazil LLC | | | Brazil | | | | 424,073 | | | | 14,539 | |
| a,b,c | | International Automotive Components Group North America LLC | | | United States | | | | 4,052,916 | | | | 2,669,960 | |
| | | | | | | | | | | | | | |
| | | | | | | | | | | | | 2,684,499 | |
| | | | | | | | | | | | | | |
| | | Automobiles 1.2% | | | | | | | | | |
| | General Motors Co. | | | United States | | | | 192,700 | | | | 7,898,773 | |
| | | | | | | | | | | | | | |
| | | Banks 15.6% | | | | | | | | | |
| | Barclays PLC | | | United Kingdom | | | | 2,052,511 | | | | 5,629,553 | |
| | BNP Paribas SA | | | France | | | | 70,714 | | | | 5,281,456 | |
| | CIT Group Inc. | | | United States | | | | 136,169 | | | | 6,703,600 | |
| | Citigroup Inc. | | | United States | | | | 189,850 | | | | 14,126,738 | |
| | Citizens Financial Group Inc. | | | United States | | | | 310,923 | | | | 13,052,548 | |
| | First Horizon National Corp. | | | United States | | | | 522,873 | | | | 10,452,231 | |
| | HSBC Holdings PLC | | | United Kingdom | | | | 438,755 | | | | 4,544,011 | |
| | JPMorgan Chase & Co. | | | United States | | | | 96,110 | | | | 10,278,003 | |
| | PNC Financial Services Group Inc. | | | United States | | | | 42,131 | | | | 6,079,082 | |
| | Societe Generale SA | | | France | | | | 157,880 | | | | 8,154,722 | |
| a | | Standard Chartered PLC | | | United Kingdom | | | | 374,211 | | | | 3,942,261 | |
| a | | Unicaja Banco SA | | | Spain | | | | 990,267 | | | | 1,561,193 | |
| | Wells Fargo & Co. | | | United States | | | | 256,320 | | | | 15,550,934 | |
| | | | | | | | | | | | | | |
| | | | | | | | | | | | | 105,356,332 | |
| | | | | | | | | | | | | | |
| | | Beverages 0.8% | | | | | | | | | |
| | PepsiCo Inc. | | | United States | | | | 46,497 | | | | 5,575,920 | |
| | | | | | | | | | | | | | |
| | | Building Products 0.7% | | | | | | | | | |
| | Johnson Controls International PLC | | | United States | | | | 125,900 | | | | 4,798,049 | |
| | | | | | | | | | | | | | |
| | | Capital Markets 0.4% | | | | | | | | | |
| a | | Guotai Junan Securities Co. Ltd. | | | China | | | | 1,275,797 | | | | 2,841,328 | |
| | | | | | | | | | | | | | |
| | | Chemicals 1.1% | | | | | | | | | |
| | Monsanto Co. | | | United States | | | | 64,910 | | | | 7,580,190 | |
| | | | | | | | | | | | | | |
| | | Communications Equipment 2.8% | | | | | | | | | |
| | Cisco Systems Inc. | | | United States | | | | 359,180 | | | | 13,756,594 | |
| | Nokia OYJ, A | | | Finland | | | | 611,269 | | | | 2,855,862 | |
| | Nokia OYJ, ADR | | | Finland | | | | 519,486 | | | | 2,420,805 | |
| | | | | | | | | | | | | | |
| | | | | | | | | | | | | 19,033,261 | |
| | | | | | | | | | | | | | |
| | | Construction Materials 0.7% | | | | | | | | | |
| | LafargeHolcim Ltd., B | | | Switzerland | | | | 78,676 | | | | 4,437,057 | |
| | | | | | | | | | | | | | |
| | | Consumer Finance 1.6% | | | | | | | | | |
| | Ally Financial Inc. | | | United States | | | | 151,600 | | | | 4,420,656 | |
| | Capital One Financial Corp. | | | United States | | | | 60,788 | | | | 6,053,269 | |
| | | | | | | | | | | | | | |
| | | | | | | | | | | | | 10,473,925 | |
| | | | | | | | | | | | | | |
| | | Diversified Financial Services 1.4% | | | | | | | | | |
| a,b,c | | Hightower Holding LLC, B, Series II | | | United States | | | | 1,775,736 | | | | 4,224,121 | |
| | Voya Financial Inc. | | | United States | | | | 101,650 | | | | 5,028,625 | |
| | | | | | | | | | | | | | |
| | | | | | | | | | | | | 9,252,746 | |
| | | | | | | | | | | | | | |
| | | Diversified Telecommunication Services 1.0% | | | | | | | | | |
| | China Telecom Corp. Ltd., H | | | China | | | | 6,974,862 | | | | 3,321,001 | |
| | Koninklijke KPN NV | | | Netherlands | | | | 979,670 | | | | 3,418,087 | |
| | | | | | | | | | | | | | |
| | | | | | | | | | | | | 6,739,088 | |
| | | | | | | | | | | | | | |
FRANKLIN TEMPLETON VARIABLE INSURANCE PRODUCTS TRUST
STATEMENT OF INVESTMENTS
Franklin Mutual Global Discovery VIP Fund (continued)
| | | | | | | | | | | | | | |
| | | | | Country | | | Shares/
Units/
Warrants | | | Value | |
| | Common Stocks and Other Equity Interests (continued) | | | | | | | | | | | | |
| | | Electric Utilities 0.5% | | | | | | | | | |
| | PG&E Corp. | | | United States | | | | 79,082 | | | $ | 3,545,246 | |
| | | | | | | | | | | | | | |
| | Energy Equipment & Services 0.8% | | | | | | | | | | | | |
| | Baker Hughes a GE Co., A | | | United States | | | | 178,964 | | | | 5,662,421 | |
| | | | | | | | | | | | | | |
| | Food & Staples Retailing 2.3% | | | | | | | | | | | | |
| | CVS Health Corp. | | | United States | | | | 84,991 | | | | 6,161,848 | |
| a | | METRO AG | | | Germany | | | | 69,167 | | | | 1,381,726 | |
| a | | Rite Aid Corp. | | | United States | | | | 391,098 | | | | 770,463 | |
| | Walgreens Boots Alliance Inc. | | | United States | | | | 102,904 | | | | 7,472,888 | |
| | | | | | | | | | | | | | |
| | | | | | | | | | | | | 15,786,925 | |
| | | | | | | | | | | | | | |
| | Health Care Equipment & Supplies 5.2% | | | | | | | | | | | | |
| | Koninklijke Philips NV | | | Netherlands | | | | 328,294 | | | | 12,423,201 | |
| | Medtronic PLC | | | United States | | | | 197,510 | | | | 15,948,933 | |
| | Stryker Corp. | | | United States | | | | 41,468 | | | | 6,420,905 | |
| | | | | | | | | | | | | | |
| | | | | | | | | | | | | 34,793,039 | |
| | | | | | | | | | | | | | |
| | Hotels, Restaurants & Leisure 2.5% | | | | | | | | | | | | |
| | Accor SA | | | France | | | | 265,211 | | | | 13,682,608 | |
| a | | Caesars Entertainment Corp. | | | United States | | | | 8,668 | | | | 109,650 | |
| | Sands China Ltd. | | | Hong Kong | | | | 648,800 | | | | 3,350,772 | |
| | | | | | | | | | | | | | |
| | | | | | | | | | | | | 17,143,030 | |
| | | | | | | | | | | | | | |
| | Independent Power & Renewable Electricity Producers 0.5% | | | | | | | | | | | | |
| a | | Vistra Energy Corp. | | | United States | | | | 199,533 | | | | 3,655,445 | |
| | | | | | | | | | | | | | |
| | Industrial Conglomerates 1.4% | | | | | | | | | | | | |
| | General Electric Co. | | | United States | | | | 558,700 | | | | 9,749,315 | |
| | | | | | | | | | | | | | |
| | Insurance 9.1% | | | | | | | | | | | | |
| a | | Alleghany Corp. | | | United States | | | | 2,730 | | | | 1,627,326 | |
| | American International Group Inc. | | | United States | | | | 204,833 | | | | 12,203,950 | |
| a | | Brighthouse Financial Inc. | | | United States | | | | 9,138 | | | | 535,852 | |
| | China Pacific Insurance Group Co. Ltd., H | | | China | | | | 845,908 | | | | 4,065,590 | |
| | Chubb Ltd. | | | United States | | | | 53,066 | | | | 7,754,535 | |
| | The Hartford Financial Services Group Inc. | | | United States | | | | 99,896 | | | | 5,622,147 | |
| | MetLife Inc. | | | United States | | | | 100,526 | | | | 5,082,595 | |
| | NN Group NV | | | Netherlands | | | | 323,882 | | | | 14,036,002 | |
| | T&D Holdings Inc. | | | Japan | | | | 199,721 | | | | 3,415,382 | |
| | XL Group Ltd. | | | Bermuda | | | | 199,966 | | | | 7,030,805 | |
| | | | | | | | | | | | | | |
| | | | | | | | | | | | | 61,374,184 | |
| | | | | | | | | | | | | | |
| | IT Services 1.7% | | | | | | | | | | | | |
| | Cognizant Technology Solutions Corp., A | | | United States | | | | 130,860 | | | | 9,293,677 | |
| | DXC Technology Co. | | | United States | | | | 25,657 | | | | 2,434,849 | |
| | | | | | | | | | | | | | |
| | | | | | | | | | | | | 11,728,526 | |
| | | | | | | | | | | | | | |
| | Machinery 0.6% | | | | | | | | | | | | |
| | Caterpillar Inc. | | | United States | | | | 27,020 | | | | 4,257,812 | |
| | | | | | | | | | | | | | |
| | Media 7.6% | | | | | | | | | | | | |
| a | | Charter Communications Inc., A | | | United States | | | | 30,386 | | | | 10,208,481 | |
| a | | DISH Network Corp., A | | | United States | | | | 124,103 | | | | 5,925,918 | |
| | Sky PLC | | | United Kingdom | | | | 538,425 | | | | 7,358,414 | |
| | Time Warner Inc. | | | United States | | | | 161,382 | | | | 14,761,612 | |
| | The Walt Disney Co. | | | United States | | | | 118,700 | | | | 12,761,437 | |
| | | | | | | | | | | | | | |
| | | | | | | | | | | | | 51,015,862 | |
| | | | | | | | | | | | | | |
FRANKLIN TEMPLETON VARIABLE INSURANCE PRODUCTS TRUST
STATEMENT OF INVESTMENTS
Franklin Mutual Global Discovery VIP Fund (continued)
| | | | | | | | | | | | | | |
| | | | | Country | | | Shares/
Units/
Warrants | | | Value | |
| | Common Stocks and Other Equity Interests (continued) | | | | | | | | | | | | |
| | | Metals & Mining 1.4% | | | | | | | | | |
| a | | Freeport-McMoRan Inc. | | | United States | | | | 186,260 | | | $ | 3,531,489 | |
| | thyssenkrupp AG | | | Germany | | | | 159,357 | | | | 4,629,824 | |
| | Warrior Met Coal Inc. | | | United States | | | | 54,024 | | | | 1,358,704 | |
| | | | | | | | | | | | | | |
| | | | | | | | | | | | | 9,520,017 | |
| | | | | | | | | | | | | | |
| | Multi-Utilities 0.4% | | | | | | | | | | | | |
| | innogy SE | | | Germany | | | | 63,784 | | | | 2,500,554 | |
| | | | | | | | | | | | | | |
| | Oil, Gas & Consumable Fuels 8.5% | | | | | | | | | | | | |
| | Anadarko Petroleum Corp. | | | United States | | | | 63,500 | | | | 3,406,140 | |
| | BP PLC | | | United Kingdom | | | | 1,028,014 | | | | 7,256,548 | |
| | Crescent Point Energy Corp. | | | Canada | | | | 506,700 | | | | 3,861,416 | |
| | JXTG Holdings Inc. | | | Japan | | | | 401,432 | | | | 2,589,884 | |
| | Kinder Morgan Inc. | | | United States | | | | 391,270 | | | | 7,070,249 | |
| | Marathon Oil Corp. | | | United States | | | | 438,465 | | | | 7,423,212 | |
| | Plains All American Pipeline LP | | | United States | | | | 169,000 | | | | 3,488,160 | |
| | Royal Dutch Shell PLC, A (EUR Traded) | | | United Kingdom | | | | 316,530 | | | | 10,551,985 | |
| | Royal Dutch Shell PLC, A (GBP Traded) | | | United Kingdom | | | | 179,410 | | | | 6,008,649 | |
| | The Williams Cos. Inc. | | | United States | | | | 196,601 | | | | 5,994,364 | |
| | | | | | | | | | | | | | |
| | | | | | | | | | | | | 57,650,607 | |
| | | | | | | | | | | | | | |
| | Pharmaceuticals 7.7% | | | | | | | | | | | | |
| | Eli Lilly & Co. | | | United States | | | | 165,580 | | | | 13,984,887 | |
| | GlaxoSmithKline PLC | | | United Kingdom | | | | 348,639 | | | | 6,226,588 | |
| | Merck & Co. Inc. | | | United States | | | | 279,118 | | | | 15,705,970 | |
| | Novartis AG, ADR | | | Switzerland | | | | 160,121 | | | | 13,443,759 | |
| | Teva Pharmaceutical Industries Ltd., ADR | | | Israel | | | | 146,723 | | | | 2,780,401 | |
| | | | | | | | | | | | | | |
| | | | | | | | | | | | | 52,141,605 | |
| | | | | | | | | | | | | | |
| | Real Estate Management & Development 0.0%† | | | | | | | | | | | | |
| a | | VICI Properties Inc. | | | United States | | | | 10,549 | | | | 216,255 | |
| | | | | | | | | | | | | | |
| | Software 5.4% | | | | | | | | | | | | |
| a | | Avaya Holdings Corp. | | | United States | | | | 40,495 | | | | 710,687 | |
| a,b | | Avaya Holdings Corp., wts., 12/15/22 | | | United States | | | | 5,179 | | | | 8,810 | |
| a | | Check Point Software Technologies Ltd. | | | Israel | | | | 101,567 | | | | 10,524,373 | |
| a | | Dell Technologies Inc., V | | | United States | | | | 33,415 | | | | 2,715,971 | |
| | Microsoft Corp. | | | United States | | | | 158,936 | | | | 13,595,385 | |
| | Symantec Corp. | | | United States | | | | 305,861 | | | | 8,582,460 | |
| | | | | | | | | | | | | | |
| | | | | | | | | | | | | 36,137,686 | |
| | | | | | | | | | | | | | |
| | Specialty Retail 0.4% | | | | | | | | | | | | |
| | Kingfisher PLC | | | United Kingdom | | | | 648,953 | | | | 2,959,530 | |
| | | | | | | | | | | | | | |
| | Technology Hardware, Storage & Peripherals 0.8% | | | | | | | | | | | | |
| | Hewlett Packard Enterprise Co. | | | United States | | | | 298,680 | | | | 4,289,045 | |
| | Lenovo Group Ltd. | | | China | | | | 1,500,454 | | | | 846,938 | |
| | | | | | | | | | | | | | |
| | | | | | | | | | | | | 5,135,983 | |
| | | | | | | | | | | | | | |
| | Tobacco 3.9% | | | | | | | | | | | | |
| | Altria Group Inc. | | | United States | | | | 107,584 | | | | 7,682,573 | |
| | British American Tobacco PLC | | | United Kingdom | | | | 188,332 | | | | 12,762,428 | |
| | British American Tobacco PLC, ADR | | | United Kingdom | | | | 83,985 | | | | 5,626,155 | |
| | | | | | | | | | | | | | |
| | | | | | | | | | | | | 26,071,156 | |
| | | | | | | | | | | | | | |
| | Wireless Telecommunication Services 1.7% | | | | | | | | | | | | |
| | Vodafone Group PLC | | | United Kingdom | | | | 3,618,505 | | | | 11,483,534 | |
| | | | | | | | | | | | | | |
| | | |
| | Total Common Stocks and Other Equity Interests
(Cost $463,043,870) | | | | | | | | 609,577,549 | |
| | | | | | | | | | | | | | |
FRANKLIN TEMPLETON VARIABLE INSURANCE PRODUCTS TRUST
STATEMENT OF INVESTMENTS
Franklin Mutual Global Discovery VIP Fund (continued)
| | | | | | | | | | | | | | |
| | | | | Country | | | Shares | | | Value | |
| | Management Investment Companies
(Cost $3,414,383) 0.5% | | | | | | | | | | | | |
| | Diversified Financial Services 0.5% | | | | | | | | | | | | |
| a | | Altaba Inc. | | | United States | | | | 52,100 | | | $ | 3,639,185 | |
| | | | | | | | | | | | | | |
| | Preferred Stocks (Cost $7,441,859) 1.2% | | | | | | | | | | | | |
| | Automobiles 1.2% | | | | | | | | | | | | |
| d | | Volkswagen AG, 1.238%, pfd | | | Germany | | | | 40,296 | | | | 8,047,382 | |
| | | | | | | | | | | | | | |
| | | | |
| | | | | | | | Principal Amount | | | | |
| | Corporate Notes and Senior Floating Rate Interests 2.9% | | | | | | | | | | | | |
| e,f | | Belk Inc., Closing Date Term Loan, 6.099%, (LIBOR + 4.75%), 12/12/22 | | | United States | | | $ | 938,907 | | | | 770,882 | |
| e,f | | Cumulus Media Holdings Inc., Term Loans, 4.82%, (LIBOR + 3.25%), 12/23/20 | | | United States | | | | 2,479,089 | | | | 2,141,313 | |
| | Frontier Communications Corp., | | | | | | | | | | | | |
| | senior note, 10.50%, 9/15/22 | | | United States | | | | 3,610,000 | | | | 2,739,088 | |
| | senior note, 11.00%, 9/15/25 | | | United States | | | | 4,065,000 | | | | 3,008,100 | |
| | iHeartCommunications Inc., | | | | | | | | | | | | |
| | senior secured note, first lien, 9.00%, 12/15/19 | | | United States | | | | 5,184,000 | | | | 3,875,040 | |
| | e,f Tranche D Term Loan, 8.443%, (LIBOR + 6.75%), 1/30/19 | | | United States | | | | 6,889,154 | | | | 5,198,438 | |
| | e,f Tranche E Term Loan, 9.193%, (LIBOR + 7.50%), 7/30/19 | | | United States | | | | 2,213,880 | | | | 1,665,022 | |
| | | | | | | | | | | | | | |
| | | |
| | Total Corporate Notes and Senior Floating Rate Interests
(Cost $23,740,266) | | | | | | | | 19,397,883 | |
| | | | | | | | | | | | | | |
| | | |
| | Corporate Notes in Reorganization (Cost $595) 0.0% | | | | | | | | | |
| b,c,g | | Broadband Ventures III LLC, secured promissory note, 5.00%, 2/01/12 | | | United States | | | | 595 | | | | — | |
| | | | | | | | | | | | | | |
| | | | |
| | | | | | | | Shares | | | | |
| | Companies in Liquidation 0.1% | | | | | | | | | | | | |
| a,b,h | | Avaya Holdings Corp., Contingent Distribution | | | United States | | | | 1,270,000 | | | | — | |
| a,b,h | | Avaya Inc., Contingent Distribution | | | United States | | | | 1,668,000 | | | | — | |
| a,b,c | | FIM Coinvestor Holdings I, LLC | | | United States | | | | 2,077,368 | | | | — | |
| a,i | | Lehman Brothers Holdings Inc., Bankruptcy Claim | | | United States | | | | 17,348,669 | | | | 385,141 | |
| a,b | | NewPage Corp., Litigation Trust | | | United States | | | | 4,854,000 | | | | — | |
| a,b,h | | Tribune Media, Litigation Trust, Contingent Distribution | | | United States | | | | 56,997 | | | | — | |
| a,b,h | | Vistra Energy Corp., Litigation Trust, Contingent Distribution | | | United States | | | | 11,807,264 | | | | 136,964 | |
| a | | Vistra Energy Corp., Litigation Trust, TRA | | | United States | | | | 199,534 | | | | 174,592 | |
| | | | | | | | | | | | | | |
| | | |
| | Total Companies in Liquidation
(Cost $2,240,363) | | | | | | | | 696,697 | |
| | | | | | | | | | | | | | |
| | | |
| | Total Investments before Short Term Investments
(Cost $499,881,336) | | | | | | | | 641,358,696 | |
| | | | | | | | | | | | | | |
FRANKLIN TEMPLETON VARIABLE INSURANCE PRODUCTS TRUST
STATEMENT OF INVESTMENTS
Franklin Mutual Global Discovery VIP Fund (continued)
| | | | | | | | | | | | | | |
| | | | | Country | | | Principal Amount | | | Value | |
| | Short Term Investments 4.8% | | | | | | | | | | | | |
| | | U.S. Government and Agency Securities 4.8% | | | | | | | | | |
| j | | FHLB, 1/02/18 | | | United States | | | $ | 5,100,000 | | | $ | 5,100,000 | |
| j | | U.S. Treasury Bill, | | | | | | | | | | | | |
| | k1/25/18 | | | United States | | | | 7,500,000 | | | | 7,494,130 | |
| | k2/01/18 | | | United States | | | | 2,000,000 | | | | 1,997,899 | |
| | 1/02/18 - 4/19/18 | | | United States | | | | 17,870,000 | | | | 17,841,853 | |
| | | | | | | | | | | | | | |
| | | | |
| | Total U.S. Government and Agency Securities
(Cost $32,435,988) | | | | | | | | | | | 32,433,882 | |
| | | | |
| | Total Investments (Cost $532,317,324) 99.7% | | | | | | | | | | | 673,792,578 | |
| | Securities Sold Short (0.6)% | | | | | | | | | | | (4,169,783 | ) |
| | Other Assets, less Liabilities 0.9% | | | | | | | | | | | 6,458,537 | |
| | | | | | | | | | | | | | |
| | Net Assets 100.0% | | | | | | | | | | $ | 676,081,332 | |
| | | | | | | | | | | | | | |
| | | | |
| | | | | | | | Shares | | | | |
| l | | Securities Sold Short (0.6)% | | | | | | | | | | | | |
| | | Common Stocks (0.6)% | | | | | | | | | |
| | Diversified Telecommunication Services (0.1)% | | | | | | | | | | | | |
| | AT&T Inc. | | | United States | | | | 24,066 | | | | (935,686 | ) |
| | | | | | | | | | | | | | |
| | | Internet Software & Services (0.5)% | | | | | | | | | |
| | Alibaba Group Holding Ltd., ADR | | | China | | | | 18,756 | | | | (3,234,097 | ) |
| | | | | | | | | | | | | | |
| | | | |
| | Total Securities Sold Short (Proceeds $4,211,733) | | | | | | | | | | $ | (4,169,783 | ) |
| | | | | | | | | | | | | | |
†Rounds to less than 0.1% of net assets.
aNon-income producing.
bFair valued using significant unobservable inputs. See Note 11 regarding fair value measurements.
cSee Note 8 regarding restricted securities.
dVariable rate security. The rate shown represents the yield at period end.
eThe coupon rate shown represents the rate at period end.
fSee Note 1(f) regarding senior floating rate interests.
gSee Note 7 regarding credit risk and defaulted securities.
hContingent distributions represent the right to receive additional distributions, if any, during the reorganization of the underlying company. Shares represent total underlying principal of debt securities.
iBankruptcy claims represent the right to receive distributions, if any, during the liquidation of the underlying pool of assets. Shares represent amount of allowed unsecured claims.
jThe security was issued on a discount basis with no stated coupon rate.
kA portion or all of the security has been segregated as collateral for securities sold short and open forward exchange contracts. At December 31, 2017, the aggregate value of these securities and/or cash pledged amounted to $7,021,070, representing 1.0% of net assets.
lSee Note 1(d) regarding securities sold short.
FRANKLIN TEMPLETON VARIABLE INSURANCE PRODUCTS TRUST
STATEMENT OF INVESTMENTS
Franklin Mutual Global Discovery VIP Fund (continued)
At December 31, 2017, the Fund had the following futures contracts outstanding. See Note 1(c).
| | | | | | | | | | | | | | | | | | | | |
| Futures Contracts | | | | | | | | | | | | | | | |
| Description | | Type | | | Number of
Contracts | | | Notional
Amount* | | | Expiration
Date | | | Value/
Unrealized
Appreciation
(Depreciation) | |
| Currency Contracts | | | | | | | | | | | | | | | | | | | | |
EUR/USD | | | Short | | | | 208 | | | $ | 31,396,300 | | | | 3/19/18 | | | $ | (559,803 | ) |
GBP/USD | | | Short | | | | 256 | | | | 21,691,200 | | | | 3/19/18 | | | | (141,475 | ) |
| | | | | | | | | | | | | | | | | | | | |
Total Futures Contracts | | | | | | | | | | | | | | | | | | $ | (701,278 | ) |
| | | | | | | | | | | | | | | | | | | | |
*As of period end.
At December 31, 2017, the Fund had the following forward exchange contracts outstanding. See Note 1(c).
| | | | | | | | | | | | | | | | | | | | | | | | |
| Forward Exchange Contracts | | | | | | | | | | | | | | | |
| Currency | | Counterpartya | | Type | | Quantity | | | Contract
Amount | | | Settlement
Date | | | Unrealized
Appreciation | | | Unrealized
Depreciation | |
| OTC Forward Exchange Contracts | | | | | | | | | | | | | | | | | | | | | | | | |
British Pound | | BOFA | | Sell | | | 119,351 | | | $ | 160,253 | | | | 2/14/18 | | | $ | — | | | $ | (1,175 | ) |
British Pound | | HSBK | | Sell | | | 407,180 | | | | 545,789 | | | | 2/14/18 | | | | — | | | | (4,937 | ) |
British Pound | | UBSW | | Sell | | | 21,919,969 | | | | 29,500,771 | | | | 2/14/18 | | | | — | | | | (146,841 | ) |
Euro | | HSBK | | Buy | | | 68,120 | | | | 82,111 | | | | 2/20/18 | | | | — | | | | (123 | ) |
Euro | | HSBK | | Buy | | | 392,406 | | | | 467,379 | | | | 2/20/18 | | | | 4,917 | | | | — | |
Euro | | HSBK | | Sell | | | 49,185,717 | | | | 58,339,425 | | | | 2/20/18 | | | | — | | | | (859,958 | ) |
Euro | | SSBT | | Buy | | | 848,149 | | | | 1,007,024 | | | | 2/20/18 | | | | 13,797 | | | | — | |
Euro | | UBSW | | Buy | | | 298,533 | | | | 356,236 | | | | 2/20/18 | | | | 3,075 | | | | — | |
Japanese Yen | | UBSW | | Sell | | | 2,922,498 | | | | 25,907 | | | | 2/20/18 | | | | — | | | | (94 | ) |
Japanese Yen | | UBSW | | Sell | | | 375,897,156 | | | | 3,354,628 | | | | 2/20/18 | | | | 10,274 | | | | — | |
| | | | | | | | | | | | | | | | | | | | |
Total Forward Exchange Contracts | | | | | | | | | | | | | | | | $ | 32,063 | | | $ | (1,013,128 | ) |
| | | | | | | | | | | | | | | | | | | | |
Net unrealized appreciation (depreciation) | | | | | | | | | | | | | | | | | | | | $ | (981,065 | ) |
| | | | | | | | | | | | | | | | | | | | | | | | |
aMay be comprised of multiple contracts with the same counterparty, currency and settlement date.
See Note 9 regarding other derivative information.
See Abbreviations on page MGD-32.
| | | | | | |
| | | The accompanying notes are an integral part of these financial statements. | Annual Report | | | MGD-17 | |
FRANKLIN TEMPLETON VARIABLE INSURANCE PRODUCTS TRUST
Financial Statements
Statement of Assets and Liabilities
December 31, 2017
| | | | |
| | | Franklin Mutual
Global Discovery
VIP Fund | |
Assets: | | | | |
Investments in securities: | | | | |
Cost - Unaffiliated issuers | | $ | 532,317,324 | |
| | | | |
Value - Unaffiliated issuers | | $ | 673,792,578 | |
Cash | | | 255,969 | |
Foreign currency, at value (cost $652,227) | | | 654,210 | |
Receivables: | | | | |
Investment securities sold | | | 603,756 | |
Capital shares sold | | | 464,193 | |
Dividends and interest | | | 1,543,192 | |
European Union tax reclaims | | | 301,641 | |
Deposits with brokers for: | | | | |
Securities sold short | | | 4,339,287 | |
Futures contracts | | | 938,580 | |
Unrealized appreciation on OTC forward exchange contracts | | | 32,063 | |
Other assets | | | 96,839 | |
| | | | |
Total assets | | | 683,022,308 | |
| | | | |
Liabilities: | | | | |
Payables: | | | | |
Capital shares redeemed | | | 414,921 | |
Management fees | | | 537,224 | |
Distribution fees | | | 284,266 | |
Variation margin on futures contracts | | | 301,600 | |
Securities sold short, at value (proceeds $4,211,733) | | | 4,169,783 | |
Unrealized depreciation on OTC forward exchange contracts | | | 1,013,128 | |
Accrued expenses and other liabilities | | | 220,054 | |
| | | | |
Total liabilities | | | 6,940,976 | |
| | | | |
Net assets, at value | | $ | 676,081,332 | |
| | | | |
Net assets consist of: | | | | |
Paid-in capital | | $ | 515,009,737 | |
Undistributed net investment income | | | 14,092,871 | |
Net unrealized appreciation (depreciation) | | | 139,858,215 | |
Accumulated net realized gain (loss) | | | 7,120,509 | |
| | | | |
Net assets, at value | | $ | 676,081,332 | |
| | | | |
| |
| Class 1: | | | | |
Net assets, at value | | $ | 3,189,335 | |
| | | | |
Shares outstanding | | | 156,518 | |
| | | | |
Net asset value and maximum offering price per share | | $ | 20.38 | |
| | | | |
| |
| Class 2: | | | | |
Net assets, at value | | $ | 631,178,657 | |
| | | | |
Shares outstanding | | | 31,878,720 | |
| | | | |
Net asset value and maximum offering price per share | | $ | 19.80 | |
| | | | |
| |
| Class 4: | | | | |
Net assets, at value | | $ | 41,713,340 | |
| | | | |
Shares outstanding | | | 2,068,138 | |
| | | | |
Net asset value and maximum offering price per share | | $ | 20.17 | |
| | | | |
| | | | |
| MGD-18 | | Annual Report | The accompanying notes are an integral part of these financial statements. | | |
FRANKLIN TEMPLETON VARIABLE INSURANCE PRODUCTS TRUST
FINANCIAL STATEMENTS
Statement of Operations
for the year ended December 31, 2017
| | | | |
| | | Franklin Mutual
Global Discovery
VIP Fund | |
Investment income: | | | | |
Dividends: (net of foreign taxes)* | | | | |
Unaffiliated issuers | | $ | 19,233,813 | |
Interest: | | | | |
Unaffiliated issuers | | | 3,086,559 | |
Income from securities loaned (net of fees and rebates) | | | 269,334 | |
| | | | |
Total investment income | | | 22,589,706 | |
| | | | |
Expenses: | | | | |
Management fees (Note 3a) | | | 6,428,225 | |
Distribution fees: (Note 3c) | | | | |
Class 2 | | | 1,593,159 | |
Class 4 | | | 152,810 | |
Custodian fees (Note 4) | | | 26,434 | |
Reports to shareholders | | | 164,288 | |
Professional fees | | | 204,290 | |
Trustees’ fees and expenses | | | 2,920 | |
Other | | | 72,000 | |
| | | | |
Total expenses | | | 8,644,126 | |
Expense reductions (Note 4) | | | (1,112 | ) |
Expenses waived/paid by affiliates (Note 3e) | | | (7,430 | ) |
| | | | |
Net expenses | | | 8,635,584 | |
| | | | |
Net investment income | | | 13,954,122 | |
| | | | |
Realized and unrealized gains (losses): | | | | |
Net realized gain (loss) from: | | | | |
Investments: | | | | |
Unaffiliated issuers | | | 23,413,440 | |
Foreign currency transactions | | | 99,205 | |
Forward exchange contracts | | | (8,773,871 | ) |
Futures contracts | | | (3,805,712 | ) |
Securities sold short | | | (54,983 | ) |
| | | | |
Net realized gain (loss) | | | 10,878,079 | |
| | | | |
Net change in unrealized appreciation (depreciation) on: | | | | |
Investments: | | | | |
Unaffiliated issuers | | | 34,329,500 | |
Translation of other assets and liabilities denominated in foreign currencies | | | 58,396 | |
Forward exchange contracts | | | (985,093 | ) |
Futures contracts | | | (1,276,722 | ) |
Securities sold short | | | 29,040 | |
| | | | |
Net change in unrealized appreciation (depreciation) | | | 32,155,121 | |
| | | | |
Net realized and unrealized gain (loss) | | | 43,033,200 | |
| | | | |
Net increase (decrease) in net assets resulting from operations | | $ | 56,987,322 | |
| | | | |
| |
*Foreign taxes withheld on dividends | | $ | 756,611 | |
| | | | | | |
| The accompanying notes are an integral part of these financial statements. | Annual Report | | | MGD-19 | |
FRANKLIN TEMPLETON VARIABLE INSURANCE PRODUCTS TRUST
FINANCIAL STATEMENTS
Statements of Changes in Net Assets
| | | | | | | | |
| | | Franklin Mutual Global Discovery VIP Fund | |
| | | Year Ended December 31, | |
| | | 2017 | | | 2016 | |
Increase (decrease) in net assets: | | | | | | | | |
Operations: | | | | | | | | |
Net investment income | | $ | 13,954,122 | | | $ | 12,072,848 | |
Net realized gain (loss) | | | 10,878,079 | | | | 38,874,630 | |
Net change in unrealized appreciation (depreciation) | | | 32,155,121 | | | | 23,661,183 | |
| | | | |
Net increase (decrease) in net assets resulting from operations | | | 56,987,322 | | | | 74,608,661 | |
| | | | |
Distributions to shareholders from: | | | | | | | | |
Net investment income: | | | | | | | | |
Class 1 | | | (66,311 | ) | | | (54,304 | ) |
Class 2 | | | (11,249,921 | ) | | | (10,085,440 | ) |
Class 4 | | | (685,349 | ) | | | (662,593 | ) |
Net realized gains: | | | | | | | | |
Class 1 | | | (186,112 | ) | | | (220,428 | ) |
Class 2 | | | (35,820,607 | ) | | | (47,823,620 | ) |
Class 4 | | | (2,371,329 | ) | | | (3,482,606 | ) |
| | | | |
Total distributions to shareholders | | | (50,379,629 | ) | | | (62,328,991 | ) |
| | | | |
Capital share transactions: (Note 2) | | | | | | | | |
Class 1 | | | 82,438 | | | | 377,199 | |
Class 2 | | | (5,225,517 | ) | | | (10,255,413 | ) |
Class 4 | | | (4,126,123 | ) | | | (4,711,238 | ) |
| | | | |
Total capital share transactions | | | (9,269,202 | ) | | | (14,589,452 | ) |
| | | | |
Net increase (decrease) in net assets | | | (2,661,509 | ) | | | (2,309,782 | ) |
Net assets: | | | | | | | | |
Beginning of year | | | 678,742,841 | | | | 681,052,623 | |
| | | | |
End of year | | $ | 676,081,332 | | | $ | 678,742,841 | |
| | | | |
Undistributed net investment income included in net assets: | | | | | | | | |
End of year | | $ | 14,092,871 | | | $ | 11,343,159 | |
| | | | |
| | | | |
| MGD-20 | | Annual Report | The accompanying notes are an integral part of these financial statements. | | |
FRANKLIN TEMPLETON VARIABLE INSURANCE PRODUCTS TRUST
Notes to Financial Statements
Franklin Mutual Global Discovery VIP Fund
1. Organization and Significant Accounting Policies
Franklin Templeton Variable Insurance Products Trust (Trust) is registered under the Investment Company Act of 1940 (1940 Act) as an open-end management investment company, consisting of eighteen separate funds and applies the specialized accounting and reporting guidance in U.S. Generally Accepted Accounting Principles (U.S. GAAP). Franklin Mutual Global Discovery VIP Fund (Fund) is included in this report. Shares of the Fund are generally sold only to insurance company separate accounts to fund the benefits of variable life insurance policies or variable annuity contracts. At December 31, 2017, 48.1% of the Fund’s shares were held through one insurance company. Investment activities of these insurance company separate accounts could have a material impact on the Fund. The Fund offers three classes of shares: Class 1, Class 2 and Class 4. Each class of shares may differ by its distribution fees, voting rights on matters affecting a single class and its exchange privilege.
The following summarizes the Fund’s significant accounting policies.
a. Financial Instrument Valuation
The Fund’s investments in financial instruments are carried at fair value daily. Fair value is the price that would be received to sell an asset or paid to transfer a liability in an orderly transaction between market participants on the measurement date. The Fund calculates the net asset value (NAV) per share as of 4 p.m. Eastern time each day the New York Stock Exchange (NYSE) is open for trading. Under compliance policies and procedures approved by the Trust’s Board of Trustees (the Board), the Fund’s administrator has responsibility for oversight of valuation, including leading the cross-functional Valuation Committee (VC). The VC provides administration and oversight of the Fund’s valuation policies and procedures, which are approved annually by the Board. Among other things, these procedures allow the Fund to utilize independent pricing services, quotations from securities and financial instrument dealers, and other market sources to determine fair value.
Equity securities and derivative financial instruments listed on an exchange or on the NASDAQ National Market System are valued at the last quoted sale price or the official closing price of the day, respectively. Foreign equity securities are valued as of the close of trading on the foreign stock exchange on which the security is primarily traded, or as of 4 p.m. Eastern time.
The value is then converted into its U.S. dollar equivalent at the foreign exchange rate in effect at 4 p.m. Eastern time on the day that the value of the security is determined. Over-the-counter (OTC) securities are valued within the range of the most recent quoted bid and ask prices. Securities that trade in multiple markets or on multiple exchanges are valued according to the broadest and most representative market. Certain equity securities are valued based upon fundamental characteristics or relationships to similar securities.
Debt securities generally trade in the OTC market rather than on a securities exchange. The Fund’s pricing services use multiple valuation techniques to determine fair value. In instances where sufficient market activity exists, the pricing services may utilize a market-based approach through which quotes from market makers are used to determine fair value. In instances where sufficient market activity may not exist or is limited, the pricing services also utilize proprietary valuation models which may consider market characteristics such as benchmark yield curves, credit spreads, estimated default rates, anticipated market interest rate volatility, coupon rates, anticipated timing of principal repayments, underlying collateral, and other unique security features in order to estimate the relevant cash flows, which are then discounted to calculate the fair value.
Investments in open-end mutual funds are valued at the closing NAV.
Certain derivative financial instruments trade in the OTC market. The Fund’s pricing services use various techniques including industry standard option pricing models and proprietary discounted cash flow models to determine the fair value of those instruments. The Fund’s net benefit or obligation under the derivative contract, as measured by the fair value of the contract, is included in net assets.
The Fund has procedures to determine the fair value of financial instruments for which market prices are not reliable or readily available. Under these procedures, the VC convenes on a regular basis to review such financial instruments and considers a number of factors, including significant unobservable valuation inputs, when arriving at fair value. The VC primarily employs a market-based approach which may use related or comparable assets or liabilities, recent transactions, market multiples, book values, and other relevant information for the investment to determine the fair value of the investment. An income-based valuation approach may also be used in which the anticipated future cash flows of the investment are discounted to
FRANKLIN TEMPLETON VARIABLE INSURANCE PRODUCTS TRUST
NOTES TO FINANCIAL STATEMENTS
Franklin Mutual Global Discovery VIP Fund (continued)
1. Organization and Significant Accounting Policies (continued)
a. Financial Instrument Valuation (continued)
calculate fair value. Discounts may also be applied due to the nature or duration of any restrictions on the disposition of the investments. Due to the inherent uncertainty of valuations of such investments, the fair values may differ significantly from the values that would have been used had an active market existed. The VC employs various methods for calibrating these valuation approaches including a regular review of key inputs and assumptions, transactional back-testing or disposition analysis, and reviews of any related market activity.
Trading in securities on foreign securities stock exchanges and OTC markets may be completed before 4 p.m. Eastern time. In addition, trading in certain foreign markets may not take place on every Fund’s business day. Occasionally, events occur between the time at which trading in a foreign security is completed and 4 p.m. Eastern time that might call into question the reliability of the value of a portfolio security held by the Fund. As a result, differences may arise between the value of the Fund’s portfolio securities as determined at the foreign market close and the latest indications of value at 4 p.m. Eastern time. In order to minimize the potential for these differences, the VC monitors price movements following the close of trading in foreign stock markets through a series of country specific market proxies (such as baskets of American Depositary Receipts, futures contracts and exchange traded funds). These price movements are measured against established trigger thresholds for each specific market proxy to assist in determining if an event has occurred that may call into question the reliability of the values of the foreign securities held by the Fund. If such an event occurs, the securities may be valued using fair value procedures, which may include the use of independent pricing services.
When the last day of the reporting period is a non-business day, certain foreign markets may be open on those days that the Fund’s NAV is not calculated, which could result in differences between the value of the Fund’s portfolio securities on the last business day and the last calendar day of the reporting period. Any significant security valuation changes due to an open foreign market are adjusted and reflected by the Fund for financial reporting purposes.
b. Foreign Currency Translation
Portfolio securities and other assets and liabilities denominated in foreign currencies are translated into U.S. dollars based on the exchange rate of such currencies against U.S. dollars on the date of valuation. The Fund may enter into foreign currency exchange contracts to facilitate transactions denominated in a foreign currency. Purchases and sales of securities, income and expense items denominated in foreign currencies are translated into U.S. dollars at the exchange rate in effect on the transaction date. Portfolio securities and assets and liabilities denominated in foreign currencies contain risks that those currencies will decline in value relative to the U.S. dollar. Occasionally, events may impact the availability or reliability of foreign exchange rates used to convert the U.S. dollar equivalent value. If such an event occurs, the foreign exchange rate will be valued at fair value using procedures established and approved by the Board.
The Fund does not separately report the effect of changes in foreign exchange rates from changes in market prices on securities held. Such changes are included in net realized and unrealized gain or loss from investments in the Statement of Operations.
Realized foreign exchange gains or losses arise from sales of foreign currencies, currency gains or losses realized between the trade and settlement dates on securities transactions and the difference between the recorded amounts of dividends, interest, and foreign withholding taxes and the U.S. dollar equivalent of the amounts actually received or paid. Net unrealized foreign exchange gains and losses arise from changes in foreign exchange rates on foreign denominated assets and liabilities other than investments in securities held at the end of the reporting period.
c. Derivative Financial Instruments
The Fund invested in derivative financial instruments in order to manage risk or gain exposure to various other investments or markets. Derivatives are financial contracts based on an underlying or notional amount, require no initial investment or an initial net investment that is smaller than would normally be required to have a similar response to changes in market factors, and require or permit net settlement. Derivatives contain various risks including the potential inability of the counterparty to fulfill their obligations under the terms of the contract, the potential for an illiquid secondary market, and/or the potential for market movements which expose the Fund to gains or losses in excess of the amounts shown in the Statement of Assets and
FRANKLIN TEMPLETON VARIABLE INSURANCE PRODUCTS TRUST
NOTES TO FINANCIAL STATEMENTS
Franklin Mutual Global Discovery VIP Fund (continued)
Liabilities. Realized gain and loss and unrealized appreciation and depreciation on these contracts for the period are included in the Statement of Operations.
Derivative counterparty credit risk is managed through a formal evaluation of the creditworthiness of all potential counter parties. The Fund attempts to reduce its exposure to counterparty credit risk on OTC derivatives, whenever possible, by entering into International Swaps and Derivatives Association (ISDA) master agreements with certain counterparties. These agreements contain various provisions, including but not limited to collateral requirements, events of default, or early termination. Termination events applicable to the counterparty include certain deteriorations in the credit quality of the counterparty. Termination events applicable to the Fund include failure of the Fund to maintain certain net asset levels and/or limit the decline in net assets over various periods of time. In the event of default or early termination, the ISDA master agreement gives the non-defaulting party the right to net and close-out all transactions traded, whether or not arising under the ISDA agreement, to one net amount payable by one counterparty to the other. However, absent an event of default or early termination, OTC derivative assets and liabilities are presented gross and not offset in the Statement of Assets and Liabilities. Early termination by the counterparty may result in an immediate payment by the Fund of any net liability owed to that counterparty under the ISDA agreement. At December 31, 2017, the Fund had OTC derivatives in a net liability position of $994,862 and the aggregate value of collateral pledged for such contracts was $373,607.
Collateral requirements differ by type of derivative. Collateral or initial margin requirements are set by the broker or exchange clearing house for exchange traded and centrally cleared derivatives. Initial margin deposited is held at the exchange and can be in the form of cash and/or securities. For OTC derivatives traded under an ISDA master agreement, posting of collateral is required by either the Fund or the applicable counterparty if the total net exposure of all OTC derivatives with the applicable counterparty exceeds the minimum transfer amount, which typically ranges from $100,000 to $250,000, and can vary depending on the counterparty and the type of the agreement. Generally, collateral is determined at the close of Fund business each day and any additional collateral required due to changes in derivative values may be delivered by the Fund or the counterparty the next business day, or within a few business days. Collateral pledged and/or received by the Fund
for OTC derivatives, if any, is held in segregated accounts with the Fund’s custodian/counterparty broker and can be in the form of cash and/or securities. Unrestricted cash may be invested according to the Fund’s investment objectives. To the extent that the amounts due to the Fund from its counterparties are not subject to collateralization or are not fully collateralized, the Fund bears the risk of loss from counterparty non-performance.
The Fund entered into exchange traded futures contracts primarily to manage exposure to certain foreign currencies. A futures contract is an agreement between the Fund and a counterparty to buy or sell an asset at a specified price on a future date. Required initial margins are pledged by the Fund, and the daily change in fair value is accounted for as a variation margin payable or receivable in the Statement of Assets and Liabilities.
The Fund entered into OTC forward exchange contracts primarily to manage exposure to certain foreign currencies. A forward exchange contract is an agreement between the Fund and a counterparty to buy or sell a foreign currency at a specific exchange rate on a future date.
See Note 9 regarding other derivative information.
d. Securities Sold Short
The Fund is engaged in selling securities short, which obligates the Fund to replace a borrowed security with the same security at current fair value. The Fund incurs a loss if the price of the security increases between the date of the short sale and the date on which the Fund replaces the borrowed security. The Fund realizes a gain if the price of the security declines between those dates. Gains are limited to the price at which the Fund sold the security short, while losses are potentially unlimited in size.
The Fund is required to establish a margin account with the broker lending the security sold short. While the short sale is outstanding, the broker retains the proceeds of the short sale to the extent necessary to meet margin requirements until the short position is closed out. A deposit must also be maintained with the Fund’s custodian/counterparty broker consisting of cash and/or securities having a value equal to a specified percentage of the value of the securities sold short. The Fund is obligated to pay fees for borrowing the securities sold short and is required to pay the counterparty any dividends and/or interest due on securities sold short. Such dividends and/or interest and any security borrowing fees are recorded as an expense to the Fund.
FRANKLIN TEMPLETON VARIABLE INSURANCE PRODUCTS TRUST
NOTES TO FINANCIAL STATEMENTS
Franklin Mutual Global Discovery VIP Fund (continued)
1. Organization and Significant Accounting Policies (continued)
e. Securities Lending
The Fund participates in an agency based securities lending program to earn additional income. The Fund receives cash collateral against the loaned securities in an amount equal to at least 102% of the fair value of the loaned securities. Collateral is maintained over the life of the loan in an amount not less than 100% of the fair value of loaned securities, as determined at the close of Fund business each day; any additional collateral required due to changes in security values is delivered to the Fund on the next business day. The collateral is deposited into a joint cash account with other funds and is used to invest in a money market fund managed by Franklin Advisers, Inc., an affiliate of the Fund, and/or a joint repurchase agreement. The Fund may receive income from the investment of cash collateral, in addition to lending fees and rebates paid by the borrower. Income from securities loaned, net of fees paid to the securities lending agent and/or third-party vendor, is reported separately in the Statement of Operations. The Fund bears the market risk with respect to the collateral investment, securities loaned, and the risk that the agent may default on its obligations to the Fund. If the borrower defaults on its obligation to return the securities loaned, the Fund has the right to repurchase the securities in the open market using the collateral received. The securities lending agent has agreed to indemnify the Fund in the event of default by a third party borrower. At December 31, 2017, the Fund had no securities on loan.
f. Senior Floating Rate Interests
The Fund invests in senior secured corporate loans that pay interest at rates which are periodically reset by reference to a base lending rate plus a spread. These base lending rates are generally the prime rate offered by a designated U.S. bank or the London InterBank Offered Rate (LIBOR). Senior secured corporate loans often require prepayment of principal from excess cash flows or at the discretion of the borrower. As a result, actual maturity may be substantially less than the stated maturity. Senior secured corporate loans in which the Fund invests are generally readily marketable, but may be subject to certain restrictions on resale.
g. Income and Deferred Taxes
It is the Fund’s policy to qualify as a regulated investment company under the Internal Revenue Code. The Fund intends to distribute to shareholders substantially all of its taxable income
and net realized gains to relieve it from federal income and if applicable, excise taxes. As a result, no provision for U.S. federal income taxes is required.
The Fund may be subject to foreign taxation related to income received, capital gains on the sale of securities and certain foreign currency transactions in the foreign jurisdictions in which it invests. Foreign taxes, if any, are recorded based on the tax regulations and rates that exist in the foreign markets in which the Fund invests. When a capital gain tax is determined to apply, the Fund records an estimated deferred tax liability in an amount that would be payable if the securities were disposed of on the valuation date.
As a result of several court cases, in certain countries across the European Union, the Fund filed additional tax reclaims for previously withheld taxes on dividends earned in those countries (EU reclaims). These additional filings are subject to various administrative proceedings by the local jurisdictions’ tax authorities within the European Union, as well as a number of related judicial proceedings. Income recognized, if any, for EU reclaims is reflected as other income in the Statement of Operations and any related receivable, if any, is reflected as European Union tax reclaims in the Statement of Assets and Liabilities. When uncertainty exists as to the ultimate resolution of these proceedings, the likelihood of receipt of these EU reclaims, and the potential timing of payment, no amounts are reflected in the financial statements. For U.S. income tax purposes, when EU reclaims are received by the Fund and the Fund previously passed foreign tax credit on to its shareholders, the Fund must either amend historic tax reporting to shareholders or enter into a closing agreement with the Internal Revenue Service (IRS) in order to pay the associated tax liability on behalf of the Fund’s shareholders.
The Fund may recognize an income tax liability related to its uncertain tax positions under U.S. GAAP when the uncertain tax position has a less than 50% probability that it will be sustained upon examination by the tax authorities based on its technical merits. As of December 31, 2017, the Fund has determined that no tax liability is required in its financial statements related to uncertain tax positions for any open tax years (or expected to be taken in future tax years). Open tax years are those that remain subject to examination and are based on the statute of limitations in each jurisdiction in which the Fund invests.
FRANKLIN TEMPLETON VARIABLE INSURANCE PRODUCTS TRUST
NOTES TO FINANCIAL STATEMENTS
Franklin Mutual Global Discovery VIP Fund (continued)
h. Security Transactions, Investment Income, Expenses and Distributions
Security transactions are accounted for on trade date. Realized gains and losses on security transactions are determined on a specific identification basis. Interest income and estimated expenses are accrued daily. Amortization of premium and accretion of discount on debt securities are included in interest income. Dividend income is recorded on the ex-dividend date except for certain dividends from securities where the dividend rate is not available. In such cases, the dividend is recorded as soon as the information is received by the Fund. Distributions to shareholders are recorded on the ex-dividend date. Distributable earnings are determined according to income tax regulations (tax basis) and may differ from earnings recorded in accordance with U.S. GAAP. These differences may be permanent or temporary. Permanent differences are reclassified among capital accounts to reflect their tax character. These reclassifications have no impact on net assets or the results of operations. Temporary differences are not reclassified, as they may reverse in subsequent periods.
Common expenses incurred by the Trust are allocated among the Funds based on the ratio of net assets of each Fund to the combined net assets of the Trust. Fund specific expenses are charged directly to the Fund that incurred the expense.
Realized and unrealized gains and losses and net investment income, excluding class specific expenses, are allocated daily to each class of shares based upon the relative proportion of net assets of each class. Differences in per share distributions by class are generally due to differences in class specific expenses.
i. Accounting Estimates
The preparation of financial statements in accordance with U.S. GAAP requires management to make estimates and assumptions that affect the reported amounts of assets and liabilities at the date of the financial statements and the amounts of income and expenses during the reporting period. Actual results could differ from those estimates.
j. Guarantees and Indemnifications
Under the Trust’s organizational documents, its officers and trustees are indemnified by the Trust against certain liabilities arising out of the performance of their duties to the Trust. Additionally, in the normal course of business, the Trust, on behalf of the Fund, enters into contracts with service providers that contain general indemnification clauses. The Trust’s maximum exposure under these arrangements is unknown as this would involve future claims that may be made against the Trust that have not yet occurred. Currently, the Trust expects the risk of loss to be remote.
2. Shares of Beneficial Interest
At December 31, 2017, there were an unlimited number of shares authorized (without par value). Transactions in the Fund’s shares were as follows:
| | | | | | | | | | | | | | | | | | | | |
| | | Year Ended December 31, | |
| | | 2017 | | | | | | 2016 | |
| | | Shares | | | Amount | | | | | | Shares | | | Amount | |
| | | | | |
| Class 1 Shares: | | | | | | | | | | | | | | | | | | | | |
Shares sold | | | 22,957 | | | $ | 477,994 | | | | | | | | 23,387 | | | $ | 453,227 | |
Shares issued in reinvestment of distributions | | | 12,814 | | | | 252,423 | | | | | | | | 14,414 | | | | 274,732 | |
Shares redeemed | | | (31,768 | ) | | | (647,979 | ) | | | | | | | (17,886 | ) | | | (350,760 | ) |
| | | | |
Net increase (decrease) | | | 4,003 | | | $ | 82,438 | | | | | | | | 19,915 | | | $ | 377,199 | |
| | | | |
FRANKLIN TEMPLETON VARIABLE INSURANCE PRODUCTS TRUST
NOTES TO FINANCIAL STATEMENTS
Franklin Mutual Global Discovery VIP Fund (continued)
2. Shares of Beneficial Interest (continued)
| | | | | | | | | | | | | | | | | | | | |
| | | Year Ended December 31, | |
| | | 2017 | | | | | | 2016 | |
| | | Shares | | | Amount | | | | | | Shares | | | Amount | |
| | | | | |
| Class 2 Shares: | | | | | | | | | | | | | | | | | | | | |
Shares sold | | | 1,826,753 | | | $ | 36,854,231 | | | | | | | | 1,329,879 | | | $ | 25,305,228 | |
Shares issued in reinvestment of distributions | | | 2,456,708 | | | | 47,070,528 | | | | | | | | 3,118,420 | | | | 57,909,060 | |
Shares redeemed | | | (4,417,680 | ) | | | (89,150,276 | ) | | | | | | | (4,923,922 | ) | | | (93,469,701 | ) |
| | | | |
Net increase (decrease) | | | (134,219 | ) | | $ | (5,225,517 | ) | | | | | | | (475,623 | ) | | $ | (10,255,413 | ) |
| | | | |
| | | | | |
| Class 4 Shares: | | | | | | | | | | | | | | | | | | | | |
Shares sold | | | 74,244 | | | $ | 1,535,006 | | | | | | | | 108,847 | | | $ | 2,055,482 | |
Shares issued in reinvestment of distributions | | | 156,592 | | | | 3,056,678 | | | | | | | | 219,439 | | | | 4,145,199 | |
Shares redeemed | | | (423,086 | ) | | | (8,717,807 | ) | | | | | | | (563,526 | ) | | | (10,911,919 | ) |
| | | | |
Net increase (decrease) | | | (192,250 | ) | | $ | (4,126,123 | ) | | | | | | | (235,240 | ) | | $ | (4,711,238 | ) |
| | | | |
3. Transactions with Affiliates
Franklin Resources, Inc. is the holding company for various subsidiaries that together are referred to as Franklin Templeton Investments. Certain officers and trustees of the Fund are also officers, and/or directors of the following subsidiaries:
| | |
| Subsidiary | | Affiliation |
Franklin Mutual Advisers, LLC (Franklin Mutual) | | Investment manager |
Franklin Templeton Services, LLC (FT Services) | | Administrative manager |
Franklin Templeton Distributors, Inc. (Distributors) | | Principal underwriter |
Franklin Templeton Investor Services, LLC (Investor Services) | | Transfer agent |
a. Management Fees
The Fund pays an investment management fee to Franklin Mutual based on the average daily net assets of the Fund as follows:
| | |
| Annualized Fee Rate | | Net Assets |
0.950% | | Up to and including $200 million |
0.935% | | Over $200 million, up to and including $700 million |
0.900% | | Over $700 million, up to and including $1.2 billion |
0.875% | | Over $1.2 billion, up to and including $4 billion |
0.845% | | Over $4 billion, up to and including $7 billion |
0.825% | | Over $7 billion, up to and including $10 billion |
0.805% | | In excess of $10 billion |
For the year ended December 31, 2017, the gross effective investment management fee rate was 0.939% of the Fund’s average daily net assets.
b. Administrative Fees
Under an agreement with Franklin Mutual, FT Services provides administrative services to the Fund. The fee is paid by Franklin Mutual based on the Fund’s average daily net assets, and is not an additional expense of the Fund.
FRANKLIN TEMPLETON VARIABLE INSURANCE PRODUCTS TRUST
NOTES TO FINANCIAL STATEMENTS
Franklin Mutual Global Discovery VIP Fund (continued)
c. Distribution Fees
The Board has adopted distribution plans for Class 2 and Class 4 shares pursuant to Rule 12b-1 under the 1940 Act. Under the Fund’s compensation distribution plans, the Fund pays Distributors for costs incurred in connection with the servicing, sale and distribution of the Fund’s shares up to 0.35% per year of its average daily net assets of each class. The Board has agreed to limit the current rate to 0.25% per year for Class 2. The plan year, for purposes of monitoring compliance with the maximum annual plan rates, is February 1 through January 31.
d. Transfer Agent Fees
Investor Services, under terms of an agreement, performs shareholder servicing for the Fund and is not paid by the Fund for the services.
e. Investments in Affiliated Management Investment Companies
The Fund invests in one or more affiliated management investment companies for purposes other than exercising a controlling influence over the management or policies. Management fees paid by the Fund are waived on assets invested in the affiliated management investment companies, as noted in the Statement of Operations, in an amount not to exceed the management and administrative fees paid directly or indirectly by each affiliate. During the year ended December 31, 2017, the Fund held investments in affiliated management investment companies as follows:
| | | | | | | | | | | | | | | | | | | | | | | | | | | | | | | | |
| | | Number of Shares Held at Beginning of Year | | | Gross Additions | | | Gross Reductions | | | Number of Shares Held at End of Year | | | Value at End of Year | | | Dividend Income | | | Realized Gain (Loss) | | | Net Change in Unrealized Appreciation (Depreciation) | |
| Non-Controlled Affiliates | | | | | | | | | | | | | | | | | | | | | | | | | | | | | | | | |
Institutional Fiduciary Trust Money Market Portfolio, 0.89% | | | — | | | | 75,743,000 | | | | (75,743,000 | ) | | | — | | | $ | — | | | $ | — | | | $ | — | | | $ | — | |
| | | | | | | | | | | | | | | | | | | | |
4. Expense Offset Arrangement
The Fund has entered into an arrangement with its custodian whereby credits realized as a result of uninvested cash balances are used to reduce a portion of the Fund’s custodian expenses. During the year ended December 31, 2017, the custodian fees were reduced as noted in the Statement of Operations.
5. Income Taxes
The tax character of distributions paid during the years ended December 31, 2017 and 2016, was as follows:
| | | | | | | | |
| | | 2017 | | | 2016 | |
Distributions paid from: | | | | | | | | |
Ordinary income | | $ | 14,213,432 | | | $ | 16,793,274 | |
Long term capital gain | | | 36,166,197 | | | | 45,535,717 | |
| | | | |
| | $ | 50,379,629 | | | $ | 62,328,991 | |
| | | | |
FRANKLIN TEMPLETON VARIABLE INSURANCE PRODUCTS TRUST
NOTES TO FINANCIAL STATEMENTS
Franklin Mutual Global Discovery VIP Fund (continued)
5. Income Taxes (continued)
At December 31, 2017, the cost of investments, net unrealized appreciation (depreciation), undistributed ordinary income and undistributed long term capital gains for income tax purposes were as follows:
| | | | |
Cost of investments | | $ | 529,112,187 | |
| | | | |
Unrealized appreciation | | $ | 183,894,981 | |
Unrealized depreciation | | | (45,065,088 | ) |
| | | | |
Net unrealized appreciation (depreciation) | | $ | 138,829,893 | |
| | | | |
Undistributed ordinary income | | $ | 14,464,013 | |
Undistributed long term capital gains | | | 7,754,191 | |
| | | | |
Distributable earnings | | $ | 22,218,204 | |
| | | | |
Differences between income and/or capital gains as determined on a book basis and a tax basis are primarily due to differing treatments of foreign currency transactions.
6. Investment Transactions
Purchases and sales of investments and securities sold short (excluding short term securities) for the year ended December 31, 2017, aggregated $113,780,273 and $154,345,941, respectively.
7. Credit Risk and Defaulted Securities
The Fund may purchase the pre-default or defaulted debt of distressed companies. Distressed companies are financially troubled and could be or are already involved in financial restructuring or bankruptcy. Risks associated with purchasing these securities include the possibility that the bankruptcy or other restructuring process takes longer than expected, or that distributions in restructuring are less than anticipated, either or both of which may result in unfavorable consequences to the Fund. If it becomes probable that the income on debt securities, including those of distressed companies, will not be collected, the Fund discontinues accruing income and recognizes an adjustment for uncollectible interest.
At December 31, 2017, the aggregate long value of distressed company securities for which interest recognition has been discontinued represents $0. For information as to specific securities, see the accompanying Statement of Investments.
8. Restricted Securities
The Fund invests in securities that are restricted under the Securities Act of 1933 (1933 Act). Restricted securities are often purchased in private placement transactions, and cannot be sold without prior registration unless the sale is pursuant to an exemption under the 1933 Act. Disposal of these securities may require greater effort and expense, and prompt sale at an acceptable price may be difficult. The Fund may have registration rights for restricted securities. The issuer generally incurs all registration costs.
FRANKLIN TEMPLETON VARIABLE INSURANCE PRODUCTS TRUST
NOTES TO FINANCIAL STATEMENTS
Franklin Mutual Global Discovery VIP Fund (continued)
At December 31, 2017, investments in restricted securities, excluding securities exempt from registration under the 1933 Act deemed to be liquid, were as follows:
| | | | | | | | | | | | | | |
Principal
Amount/
Shares/ Units | | Issuer | | Acquisition Date | | | Cost | | | Value | |
| 595 | | Broadband Ventures III LLC, secured promissory note, 5.00%, 2/01/12 | | | 7/01/10 - 11/30/12 | | | $ | 595 | | | $ | — | |
| 2,077,368 | | FIM Coinvestor Holdings I, LLC | | | 11/20/06 - 6/02/09 | | | | — | | | | — | |
| 1,775,736 | | Hightower Holding LLC, B, Series II | | | 6/10/10 - 5/10/12 | | | | 5,430,000 | | | | 4,224,121 | |
| 424,073 | | International Automotive Components Group Brazil LLC | | | 4/13/06 - 12/26/08 | | | | 281,629 | | | | 14,539 | |
| 4,052,916 | | International Automotive Components Group North America LLC | | | 1/12/06 - 3/18/13 | | | | 3,247,714 | | | | 2,669,960 | |
| | | | | | | | | | |
| | Total Restricted Securities (Value is 1.0% of Net Assets) | | | | | | $ | 8,959,938 | | | $ | 6,908,620 | |
| | | | | | | | | | |
9. Other Derivative Information
At December 31, 2017, the Fund’s investments in derivative contracts are reflected in the Statement of Assets and Liabilities as follows:
| | | | | | | | | | | | |
| | | Asset Derivatives | | | Liability Derivatives | |
Derivative Contracts Not Accounted for as Hedging Instruments | | Statement of Assets and Liabilities Location | | Fair Value | | | Statement of Assets and Liabilities Location | | Fair Value | |
Foreign exchange contracts | | Variation margin on futures contracts | | $ | — | | | Variation margin on futures contracts | | $ | 701,278 | a |
| | Unrealized appreciation on OTC forward exchange contracts | | $ | 32,063 | | | Unrealized depreciation on OTC forward exchange contracts | | | 1,013,128 | |
| | | | | | | | | | | | |
Totals | | | | $ | 32,063 | | | | | $ | 1,714,406 | |
| | | | | | | | | | | | |
aThis amount reflects the cumulative appreciation (depreciation) of futures contracts as reported in the Statement of Investments. Only the variation margin receivable/ payable at year end is separately reported within the Statement of Assets and Liabilities. Prior variation margin movements were recorded to cash upon receipt or payment.
For the year ended December 31, 2017, the effect of derivative contracts in the Fund’s Statement of Operations was as follows:
| | | | | | | | | | | | |
Derivative Contracts Not Accounted for as Hedging Instruments | | Statement of Operations Location | | Net
Realized
Gain (Loss)
for the Year | | | Statement of Operations Location | | Net Change in
Unrealized
Appreciation
(Depreciation)
for the Year | |
| | Net realized gain (loss) from: | | | | | | Net change in unrealized appreciation (depreciation) on: | | | | |
Foreign exchange contracts | | Forward exchange contracts | | $ | (8,773,871 | ) | | Forward exchange contracts | | $ | (985,093 | ) |
| | Futures contracts | | | (3,805,712 | ) | | Futures contracts | | | (1,276,722 | ) |
| | | | | | | | | | | | |
Totals | | | | $ | (12,579,583 | ) | | | | $ | (2,261,815 | ) |
| | | | | | | | | | | | |
For the year ended December 31, 2017, the average month end notional amount of futures contracts, represented $51,502,899. The average month end contract value of forward exchange contracts was $103,659,264.
See Note 1(c) regarding derivative financial instruments.
FRANKLIN TEMPLETON VARIABLE INSURANCE PRODUCTS TRUST
NOTES TO FINANCIAL STATEMENTS
Franklin Mutual Global Discovery VIP Fund (continued)
10. Credit Facility
The Fund, together with other U.S. registered and foreign investment funds (collectively, Borrowers), managed by Franklin Templeton Investments, are borrowers in a joint syndicated senior unsecured credit facility totaling $2 billion (Global Credit Facility) which matured on February 9, 2018. This Global Credit Facility provides a source of funds to the Borrowers for temporary and emergency purposes, including the ability to meet future unanticipated or unusually large redemption requests. Effective February 9, 2018, the Borrowers renewed the Global Credit Facility for a one year term, maturing February 8, 2019, for a total of $2 billion.
Under the terms of the Global Credit Facility, the Fund shall, in addition to interest charged on any borrowings made by the Fund and other costs incurred by the Fund, pay its share of fees and expenses incurred in connection with the implementation and maintenance of the Global Credit Facility, based upon its relative share of the aggregate net assets of all of the Borrowers, including an annual commitment fee of 0.15% based upon the unused portion of the Global Credit Facility. These fees are reflected in other expenses in the Statement of Operations. During the year ended December 31, 2017, the Fund did not use the Global Credit Facility.
11. Fair Value Measurements
The Fund follows a fair value hierarchy that distinguishes between market data obtained from independent sources (observable inputs) and the Fund’s own market assumptions (unobservable inputs). These inputs are used in determining the value of the Fund’s financial instruments and are summarized in the following fair value hierarchy:
| | • | | Level 1 – quoted prices in active markets for identical financial instruments |
| | • | | Level 2 – other significant observable inputs (including quoted prices for similar financial instruments, interest rates, prepayment speed, credit risk, etc.) |
| | • | | Level 3 – significant unobservable inputs (including the Fund’s own assumptions in determining the fair value of financial instruments) |
The input levels are not necessarily an indication of the risk or liquidity associated with financial instruments at that level.
For movements between the levels within the fair value hierarchy, the Fund has adopted a policy of recognizing the transfers as of the date of the underlying event which caused the movement.
FRANKLIN TEMPLETON VARIABLE INSURANCE PRODUCTS TRUST
NOTES TO FINANCIAL STATEMENTS
Franklin Mutual Global Discovery VIP Fund (continued)
A summary of inputs used as of December 31, 2017, in valuing the Fund’s assets and liabilities carried at fair value, is as follows:
| | | | | | | | | | | | | | | | |
| | | Level 1 | | | Level 2 | | | Level 3 | | | Total | |
| | | | |
| Assets: | | | | | | | | | | | | | | | | |
Investments in Securities:a | | | | | | | | | | | | | | | | |
Equity Investments:b | | | | | | | | | | | | | | | | |
Auto Components | | $ | — | | | $ | — | | | $ | 2,684,499 | | | $ | 2,684,499 | |
Diversified Financial Services | | | 8,667,810 | | | | — | | | | 4,224,121 | | | | 12,891,931 | |
Software | | | 36,128,876 | | | | — | | | | 8,810 | | | | 36,137,686 | |
All Other Equity Investments | | | 569,550,000 | | | | — | | | | — | | | | 569,550,000 | |
Corporate Notes and Senior Floating Rate | | | | | | | | | | | | | | | | |
Interests | | | — | | | | 19,397,883 | | | | — | | | | 19,397,883 | |
Corporate Notes in Reorganization | | | — | | | | — | | | | — | c | | | — | |
Companies in Liquidation | | | — | | | | 559,733 | | | | 136,964 | c | | | 696,697 | |
Short Term Investments | | | 27,333,882 | | | | 5,100,000 | | | | — | | | | 32,433,882 | |
| | | | |
Total Investments in Securities | | $ | 641,680,568 | | | $ | 25,057,616 | | | $ | 7,054,394 | | | $ | 673,792,578 | |
| | | | |
Other Financial Instruments: | | | | | | | | | | | | | | | | |
Forward Exchange Contracts | | $ | — | | | $ | 32,063 | | | $ | — | | | $ | 32,063 | |
| | | | |
| | | | |
| Liabilities: | | | | | | | | | | | | | | | | |
Other Financial Instruments: | | | | | | | | | | | | | | | | |
Securities Sold Short | | $ | 4,169,783 | | | $ | — | | | $ | — | | | $ | 4,169,783 | |
Futures Contracts | | | 701,278 | | | | — | | | | — | | | | 701,278 | |
Forward Exchange Contracts | | | — | | | | 1,013,128 | | | | — | | | | 1,013,128 | |
| | | | |
Total Other Financial Instruments | | $ | 4,871,061 | | | $ | 1,013,128 | | | $ | — | | | $ | 5,884,189 | |
| | | | |
aFor detailed categories, see the accompanying Statement of Investments.
bIncludes common and preferred stocks, management investments companies as well as other equity investments.
cIncludes securities determined to have no value at December 31, 2017.
A reconciliation of assets in which Level 3 inputs are used in determining fair value is presented when there are significant Level 3 financial instruments at the beginning and/or end of the year. At December 31, 2017, the reconciliation of assets is as follows:
| | | | | | | | | | | | | | | | | | | | | | | | | | | | | | | | | | | | | | | | |
| | |
| Balance at
Beginning of Year |
| | | Purchases | | | | Sales | | |
| Transfer
Into Level 3a |
| |
| Transfer
Out of Level 3b |
| |
| Cost Basis
Adjustmentsc |
| |
| Net
Realized
Gain
(Loss) |
| |
| Net Unrealized
Appreciation
(Depreciation) |
| |
| Balance at
End of Year |
| |
| Net Change in
Unrealized
Appreciation
(Depreciation)
on Assets Held
at Year End |
|
| | | | | | | | | | |
| Assets: | | | | | | | | | | | | | | | | | | | | | | | | | | | | | | | | | | | | | | | | |
Investments in Securities: | | | | | | | | | | | | | | | | | | | | | | | | | | | | | | | | | | | | | | | | |
Equity Investments:d | | | | | | | | | | | | | | | | | | | | | | | | | | | | | | | | | | | | | | | | |
Auto Components | | $ | 3,025,399 | | | $ | – | | | $ | – | | | $ | – | | | $ | – | | | $ | – | | | $ | – | | | $ | (340,900 | ) | | $ | 2,684,499 | | | $ | (340,900 | ) |
Diversified Financial Services | | | 5,466,782 | | | | – | | | | – | | | | – | | | | – | | | | – | | | | – | | | | (1,242,661 | ) | | | 4,224,121 | | | | (1,242,661 | ) |
Oil, Gas & Consumable Fuels | | | 1,997,775 | | | | – | | | | – | | | | – | | | | (1,844,100 | ) | | | – | | | | – | | | | (153,675 | ) | | | – | | | | – | |
Software | | | – | | | | – | | | | – | | | | 9,399 | | | | – | | | | – | | | | – | | | | (589 | ) | | | 8,810 | | | | (589 | ) |
Companies in Liquidation | | | 136,964 | e | | | – | | | | – | | | | – | | | | – | | | | (41,276 | ) | | | 41,276 | | | | – | | | | 136,964 | e | | | – | |
| | | | |
Total | | $ | 10,626,920 | | | $ | – | | | $ | – | | | $ | 9,399 | | | $ | (1,844,100 | ) | | $ | (41,276 | ) | | $ | 41,276 | | | $ | (1,737,825 | ) | | $ | 7,054,394 | | | $ | (1,584,150 | ) |
| | | | |
aThe investments were transferred into Level 3 as a result of the unavailability of other significant observable valuation inputs. May include amounts related to a corporate action.
bThe investments were transferred out of Level 3 as a result of the availability of other significant observable valuation inputs. May include amounts related to a corporate action.
cMay include accretion, amortization, partnership adjustments, and/or other cost basis adjustments.
dIncludes common stocks as well as other equity investments.
eIncludes securities determined to have no value.
FRANKLIN TEMPLETON VARIABLE INSURANCE PRODUCTS TRUST
NOTES TO FINANCIAL STATEMENTS
Franklin Mutual Global Discovery VIP Fund (continued)
11. Fair Value Measurements (continued)
Significant unobservable valuation inputs for material Level 3 financial instruments and impact to fair value as a result of changes in unobservable valuation inputs as of December 31, 2017, are as follows:
| | | | | | | | | | | | | | | | | | | | |
| Description | |
| Fair Value at
End of Year |
| |
| Valuation
Technique |
| | | Unobservable Input | | | | Amount | | |
| Impact to Fair
Value if InputIncreases |
a |
| | | | | |
| Assets: | | | | | | | | | | | | | | | | | | | | |
Investments in Securities: | | | | | | | | | | | | | | | | | | | | |
Equity Investments: | | | | | | | | | | | | | | | | | | | | |
Auto Components | | $ | 2,669,960 | | |
| Market comparables/
Discounted cash
flow |
| | | EV / EBITDA multiple | | | | 4.1x | | | | Increase | |
| |
| | | | | | | | | |
| 3 Yr Forward EBITDA
Growth Rate |
| | | 1.01x | | | | Increase | |
| |
| | | | | | | | | | | Discount Rate | | | | 10% | | | | Decrease | |
| |
| | | | | | | | | |
| Discount for lack of
marketability |
| | | 10% | | | | Decrease | b |
| |
Diversified Financial Services | | | 4,224,121 | | | | Market transaction | | |
| Transaction price
weighting |
| | | 100% | | | | Increase | |
| |
| | | | | | | | | |
| Discount for deal
uncertainty |
| | | 5.0% | | | | Decrease | b |
| |
All Other Investmentsc | | | 160,313 | d | | | | | | | | | | | | | | | | |
| |
Total | | $ | 7,054,394 | | | | | | | | | | | | | | | | | |
| |
aRepresents the directional change in the fair value of the Level 3 financial instruments that would result from a significant and reasonable increase in the corresponding input. A significant and reasonable decrease in the input would have the opposite effect. Significant impacts, if any, to fair value and/or net assets have been indicated.
bRepresents a significant impact to fair value but not net assets.
cIncludes fair value of immaterial investments developed using various valuation techniques and unobservable inputs. May also include investments with values derived using prior transaction prices or third party pricing information without adjustment for which such inputs are also unobservable.
dIncludes securities determined to have no value at December 31, 2017.
Abbreviations List
EBITDA - Earnings before interest, taxes, depreciation and amortization
EV - Enterprise value
12. Subsequent Events
The Fund has evaluated subsequent events through the issuance of the financial statements and determined that no events have occurred that require disclosure other than those already disclosed in the financial statements.
Abbreviations
| | | | | | | | | | |
| Counterparty | | Currency | | Selected Portfolio |
| | | | | |
| BOFA | | Bank of America Corp. | | EUR | | Euro | | ADR | | American Depositary Receipt |
| | | | | |
| HSBK | | HSBC Bank PLC | | GBP | | British Pound | | FHLB | | Federal Home Loan Bank |
| | | | | |
| SSBT | | State Street Bank | | USD | | United States Dollar | | LIBOR | | London InterBank Offered Rate |
| | | | | |
| UBSW | | UBS AG | | | | | | TRA | | Tax Receivable Agreement Right |
FRANKLIN TEMPLETON VARIABLE INSURANCE PRODUCTS TRUST
Report of Independent Registered Public Accounting Firm
To the Board of Trustees of Franklin Templeton Variable Insurance Products Trust and Shareholders of Franklin Mutual Global Discovery VIP Fund
Opinion on the Financial Statements
We have audited the accompanying statement of assets and liabilities, including the statement of investments, of Franklin Mutual Global Discovery VIP Fund (the “Fund”) as of December 31, 2017, the related statement of operations for the year ended December 31, 2017, the statement of changes in net assets for each of the two years in the period ended December 31, 2017, including the related notes, and the financial highlights for each of the five years in the period ended December 31, 2017 (collectively referred to as the “financial statements”). In our opinion, the financial statements present fairly, in all material respects, the financial position of the Fund as of December 31, 2017, the results of its operations for the year then ended, the changes in its net assets for each of the two years in the period ended December 31, 2017 and the financial highlights for each of the five years in the period ended December 31, 2017, in conformity with accounting principles generally accepted in the United States of America.
Basis for Opinion
These financial statements are the responsibility of the Fund’s management. Our responsibility is to express an opinion on the Fund’s financial statements based on our audits. We are a public accounting firm registered with the Public Company Accounting Oversight Board (United States) (“PCAOB”) and are required to be independent with respect to the Fund in accordance with the U.S. federal securities laws and the applicable rules and regulations of the Securities and Exchange Commission and the PCAOB.
We conducted our audits of these financial statements in accordance with the standards of the PCAOB. Those standards require that we plan and perform the audit to obtain reasonable assurance about whether the financial statements are free of material misstatement, whether due to error or fraud.
Our audits included performing procedures to assess the risks of material misstatement of the financial statements, whether due to error or fraud, and performing procedures that respond to those risks. Such procedures included examining, on a test basis, evidence regarding the amounts and disclosures in the financial statements. Our audits also included evaluating the accounting principles used and significant estimates made by management, as well as evaluating the overall presentation of the financial statements. Our procedures included confirmation of securities owned as of December 31, 2017 by correspondence with the custodian and brokers; when replies were not received from brokers, we performed other auditing procedures. We believe that our audits provide a reasonable basis for our opinion.
PricewaterhouseCoopers LLP
San Francisco, California
February 15, 2018
We have served as the auditor of one or more investment companies in the Franklin Templeton Group of Funds since 1948.
FRANKLIN TEMPLETON VARIABLE INSURANCE PRODUCTS TRUST
Tax Information (unaudited)
Franklin Mutual Global Discovery VIP Fund
Under Section 852(b)(3)(C) of the Internal Revenue Code (Code), the Fund hereby reports the maximum amount allowable but no less than $36,166,197 as a long term capital gain dividend for the fiscal year ended December 31, 2017.
Under Section 854(b)(1)(A) of the Code, the Fund hereby reports 77.48% of the ordinary income dividends as income qualifying for the dividends received deduction for the fiscal year ended December 31, 2017.
Franklin Mutual Shares VIP Fund
This annual report for Franklin Mutual Shares VIP Fund covers the fiscal year ended December 31, 2017.
Class 2 Performance Summary as of December 31, 2017
Average annual total return of Class 2 shares* represents the average annual change in value, assuming reinvestment of dividends and capital gains. Average returns smooth out variations in returns, which can be significant; they are not the same as year-by-year results.
| | | | | | | | | | | | |
| Periods ended 12/31/17 | | 1-Year | | | 5-Year | | | 10-Year | |
Average Annual Total Return | | | +8.35% | | | | +10.43% | | | | +5.05% | |
*The Fund has a fee waiver associated with any investment it makes in a Franklin Templeton money fund and/or other Franklin Templeton fund, contractually guaranteed through 4/30/18. Fund investment results reflect the fee waiver; without this waiver, the results would have been lower.
Performance reflects the Fund’s Class 2 operating expenses, but does not include any contract fees, expenses or sales charges. If they had been included, performance would be lower. These charges and deductions, particularly for variable life policies, can have a significant effect on contract values and insurance benefits. See the contract prospectus for a complete description of these expenses, including sales charges.
Performance data represent past performance, which does not guarantee future results. Investment return and principal value will fluctuate, and you may have a gain or loss when you sell your shares. Current performance may differ from figures shown.
Total Return Index Comparison for a Hypothetical $10,000 Investment (1/1/08–12/31/17)
The graph below shows the change in value of a hypothetical $10,000 investment in the Fund over the indicated period and includes reinvestment of any income or distributions. The Fund’s performance* is compared to the performance of the Standard & Poor’s® 500 Index (S&P 500®). One cannot invest directly in an index, and an index is not representative of the Fund’s portfolio. Please see Important Notes to Performance Information preceding the Fund Summaries.
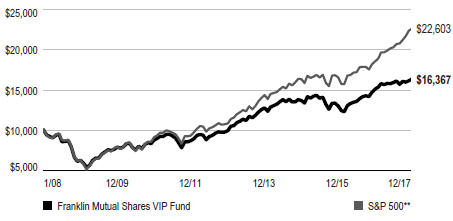
**Source: Morningstar. Please see Index Descriptions following the Fund Summaries.
FRANKLIN MUTUAL SHARES VIP FUND
Fund Goal and Main Investments
The Fund seeks capital appreciation, with income as a secondary goal, by investing primarily in equity securities of companies the Fund’s investment manager believes are available at market prices less than their intrinsic value. The equity securities in which the Fund invests are primarily common stock. To a lesser extent, the Fund also invests in merger arbitrage securities and the debt and equity of distressed companies. The Fund may invest up to 35% of its assets in foreign securities, which may include sovereign debt and participations in foreign debt.
Fund Risks
All investments involve risks, including possible loss of principal. Value securities may not increase in price as anticipated or may decline further in value. The Fund’s investments in foreign securities involve special risks including currency fluctuations, and economic and political uncertainties. Securities issued by smaller and midsize companies may be more volatile in price than those of larger companies, involve substantial risks and should be considered speculative. Derivatives involve costs and can create economic leverage in the Fund’s portfolio which may result in significant volatility and cause the Fund to participate in losses (as well as gains) in an amount that exceeds the Fund’s initial investment. The Fund may also invest in companies engaged in mergers, reorganizations or liquidations, which involve special risks as pending deals may not be completed on time or on favorable terms, as well as lower rated bonds, which entail higher credit risk. To the extent that the Fund focuses on particular countries, regions, industries, sectors or types of investment from time to time, the Fund may be subject to greater risks of adverse developments in such areas of focus than a fund that invests in a wider variety of countries, regions, industries, sectors or investments. The Fund is actively managed but there is no guarantee that the manager’s investment decisions will produce the desired results. The Fund’s prospectus also includes a description of the main investment risks.
Performance Overview
You can find the Fund’s one-year total return in the Performance Summary. In comparison, the Fund’s benchmark, the S&P 500, generated a +21.83% total return for the period under review.1
Geographic Composition*
Based on Total Net Assets as of 12/31/17
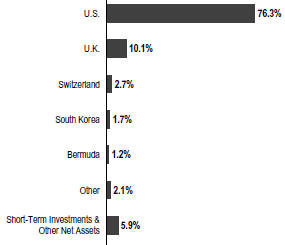
*Figures are stated as a percentage of total and may not equal 100% or may be negative due to rounding, use of any derivatives, unsettled trades or other factors.
Economic and Market Overview
The global economy grew moderately during the 12-month period under review. In this environment, global developed and emerging market stocks generated a +24.62% total return, as measured by the MSCI All Country World Index.1 Global markets were aided by price gains in oil and other commodities, generally upbeat economic data across regions, the European Central Bank’s (ECB’s) extension of its monetary easing program, and investor optimism about pro-growth and pro-business policies in the US. The prospect for reforms in the European Union (EU) with Emmanuel Macron’s election as France’s president, encouraging corporate earnings reports and the passage of the US tax reform bill also supported global stocks.
However, global markets reflected investor concerns about the terms of the UK’s exit from the EU, political uncertainty in the US and the EU, and geopolitical tensions in the Korean peninsula and other regions. Other concerns included the health of European banks, global oil oversupply despite a pact by major oil-producing countries to extend production cuts, and comments from key central bankers around the world about potentially raising interest rates.
1. Source: Morningstar. One cannot invest directly in an index, and an index is not representative of the Fund’s portfolio. Please see Index Descriptions following the Fund Summaries.
The dollar value, number of shares or principal amount, and names of all portfolio holdings are listed in the Fund’s Statement of Investments (SOI).
FRANKLIN MUTUAL SHARES VIP FUND
After strengthening in 2017’s second and third quarters, the US economy moderated in the fourth quarter. The economy grew faster in 2017 than in 2016, however, largely due to growth in consumer spending, business investment and exports. The unemployment rate decreased from 4.7% in December 2016 to 4.1% at period-end.2 Annual inflation, as measured by the Consumer Price Index, was 2.1% in December 2016, and while it varied over the 12-month period, remained unchanged at period-end.2 The US Federal Reserve (Fed) raised its target range for the federal funds rate 0.25% three times during the period, amid signs of a growing US economy, strengthening labor market and improving business spending. At its December meeting, the Fed confirmed that the monthly balance sheet reduction would increase from US$10 billion to US$20 billion beginning in January 2018.
In Europe, the UK’s economic growth moderated in 2017 compared to 2016, largely due to slower growth in the services sector. In November, the Bank of England raised its key policy rate 0.25%, its first increase in a decade. The eurozone’s growth accelerated in 2017’s second and third quarters, but moderated in the fourth quarter. However, the eurozone’s 2017 economic growth rate was the fastest in a decade. The bloc’s annual inflation rate, while low, ended higher than in December 2016. The ECB kept its benchmark interest rate unchanged during the period. However, at its October meeting, the ECB extended the time frame for its massive bond-buying program from December 2017 to at least September 2018, while reducing the amount of monthly bond purchases in half beginning in January 2018.
In Asia, Japan’s quarterly gross domestic product (GDP) grew for the seventh consecutive quarter, although third-quarter 2017 growth was lower than the previous quarter. The Bank of Japan left its benchmark interest rate unchanged during the period and continued its monetary stimulus measures.
In emerging markets, Brazil’s quarterly GDP grew for the third consecutive quarter, although third-quarter 2017 growth slowed from the previous quarter. The country’s central bank cut its benchmark interest rate several times during the period to spur economic growth. Russia’s GDP grew in 2017’s first three quarters compared to the prior-year periods, amid the Bank of Russia’s continued policy support. China’s GDP grew faster in 2017 than in 2016, supported by solid growth in industrial production, services, fixed-asset investment, retail sales, and imports and exports. The People’s Bank of China left its
benchmark interest rate unchanged during the period. Overall, emerging market stocks, as measured by the MSCI Emerging Markets Index, rose substantially during the period.3
Investment Strategy
At Franklin Mutual Advisors, we are committed to our distinctive value approach to investing. Our major investment strategy is investing in undervalued stocks. When selecting undervalued equities, we are attracted to what we believe are fundamentally strong companies with healthy balance sheets, high-quality assets, substantial free cash flow and shareholder-oriented management teams and whose stocks are trading at discounts to our assessment of the companies’ intrinsic or business value. We also look for asset-rich companies whose shares may be trading at depressed levels due to concerns over short-term earnings disappointments, litigation, management strategy or other perceived negatives. While the vast majority of our undervalued equity investments are made in publicly traded companies globally, we may invest occasionally in privately held companies as well.
We complement this more traditional investment strategy with two others. One is distressed investing, which is complex and can take many forms. The most common distressed investment the Fund undertakes is the purchase of financially troubled or bankrupt companies’ debt at a substantial discount to face value. After the financially distressed company is reorganized, often in bankruptcy court, the old debt is typically replaced with new securities issued by the financially stronger company.
The other piece of our investment strategy is participating in arbitrage situations, another highly specialized field. When companies announce proposed mergers or takeovers, commonly referred to as “deals,” the target company may trade at a discount to the bid it ultimately accepts. One form of arbitrage involves purchasing the target company’s stock when it is trading below the value we believe it would receive in a deal. In keeping with our commitment to a relatively conservative investment approach, we typically focus our arbitrage efforts on announced deals, and eschew rumored deals or other situations we consider relatively risky.
In addition, it is our practice to hedge the Fund’s currency exposure when we deem it advantageous for our shareholders.
2. Source: Bureau of Labor Statistics.
3. Please see Index Descriptions following the Fund Summaries.
FRANKLIN MUTUAL SHARES VIP FUND
What is meant by “hedge”?
To hedge an investment is to take a position intended to offset potential losses/gains that may be incurred by a companion financial instrument.
Manager’s Discussion
In 2017, an improving economic and political backdrop helped drive most equity markets higher. The positive performances were broad based, spanning across most regions and sectors, and complemented by minimal volatility. Global markets were aided by generally upbeat economic data, improved corporate earnings in the US, Europe and Japan, as well as improved industrial commodity prices, most notably crude oil. In addition, the most significant political risks identified by investors heading into 2017 failed to materialize.
In the US, markets began 2017 rallying as investors hoped that a Republican sweep of US elections in November 2016 would lead to a general loosening in regulations and tax reform, including lower corporate tax rates. Although the Trump administration’s policy agenda was hindered by political gridlock, efforts to loosen federal regulations yielded some results and tax reform legislation was finally passed in late December. Improving economic activity and corporate earnings appeared to be the most meaningful equity market catalysts during much of 2017. However, the modest level of economic growth and low interest rates pushed investors to keep favoring growth stocks. During the period, the Russell 1000® Growth Index generated a total return of +30.21%, while the Russell 1000® Value Index posted a total return of +13.66%.1 Within the Russell 1000® Growth Index, stocks with the largest weightings were technology firms that dominated the headlines: Apple4, Alphabet (a.k.a. Google),4 Microsoft, Amazon.com4 and Facebook.4
European equity markets started 2017 slowly, but positive political events and improved economic data fueled strong performances during the period. Elections in Europe produced outcomes generally regarded as positive economically as far-right parties largely failed to gain political power in national elections. Investors were particularly encouraged by the presidential election outcome in France. The reform-minded, centrist candidate, Emmanuel Macron, won the French presidential election in May and quickly began to push his agenda, most notably labor decrees giving employers in France more say in negotiating contracts directly with workers. Amid
| | | | |
| Top 10 Sectors/Industries | | | |
| 12/31/17 | | | |
| | | % of Total
Net Assets | |
| Banks | | | 10.0% | |
| Oil, Gas & Consumable Fuels | | | 8.5% | |
| Media | | | 7.9% | |
| Insurance | | | 7.8% | |
| Pharmaceuticals | | | 7.4% | |
| Software | | | 6.1% | |
| Health Care Equipment & Supplies | | | 4.5% | |
| Tobacco | | | 4.1% | |
| Food & Staples Retailing | | | 4.0% | |
| Communications Equipment | | | 2.7% | |
all the positive events, the UK remained the most significant outlier. In the UK, a June 2017 snap election resulting in no party having a majority in Parliament appeared to make a “hard Brexit,” in which the UK leaves the European Union (EU) in March 2019 without a negotiated deal, even more likely than before. Although the UK and EU appeared to make some progress late in the year, the snap election results left the Conservative Party in a precarious position and with the risk of another election in the near future.
As value investors, we managed to benefit from steady economic growth despite underlying market turbulence. In all market environments, we seek to invest prudently in securities that we believe represent good value, and then we adjust our views as the world around us changes.
After reducing our exposure to the media industry in 2016 and staying on the sidelines for much of 2017, the industry became a significant area of investment interest in the latter stages of the year due to significant structural changes. Since the 1980s, most Americans received their TV entertainment as part of a bundle from a cable provider. Disparate networks were combined and sold as packages, with annual price increases justified by the inclusion of more networks. Consumers rarely had the option to unbundle cable packages and most markets had no direct competition. However, the growth of fixed and mobile broadband connectivity ushered in the opportunity to bypass traditional distributors through the delivery of film and TV content over the internet and the launch of direct-to-consumer offerings by TV networks. The growing popularity of new digital options has driven cable providers to roll out lower-priced packages with fewer channels. This evolution has
4. Not a Fund holding.
FRANKLIN MUTUAL SHARES VIP FUND
begun to create winners and losers among networks and new opportunities for investors.
Pay TV subscription among US households peaked in 2009 at close to 100 million homes. Initially, the decline in subscribers was moderate, but has accelerated since 2015, reaching a pace of more than 2% per year in 2017. At first, media companies benefited from digital distribution by using it as an additional outlet for selling content. With the cannibalization of traditional platforms accelerating, media companies have begun to respond. The necessity for greater scale in content development and direct access to consumers is driving investment and merger decisions in the industry. From our standpoint, we are looking for networks with the most attractive content relative to the price they have been charging and may be able to charge in the future.
The Fund initiated a position in Walt Disney in the latter half of 2017. We believe Disney is well positioned to benefit from the evolution toward a more direct-to-consumer distribution model. In our view, Disney has one of the best intellectual property (IP) portfolios in all of media with a stable of globally recognized proprietary characters upon which to build a strong direct-to-consumer franchise. If Disney is successful in its bid to acquire the bulk of Twenty-First Century Fox’s4 content assets, the deal would further strengthen its IP portfolio and its content development scale. As it has done with its own IP, Disney would likely be able to leverage Fox’s content into attractions at its theme parks as well as consumer products. The acquisition would offer potential cost synergies that would likely offset some of the investments in the direct-to-consumer service. Under the leadership of chief executive officer Bob Iger, Disney has been effective in integrating acquired companies and navigating through a changing media landscape. Iger’s commitment to remain at the helm through 2021 strengthens our belief that the company should be able to execute on this opportunity.
Merger and acquisition activity remained healthy in 2017, although the pace of activity appeared to decelerate slightly due to less favorable political and regulatory conditions in the US, the UK and China. In the US, several key regulatory agencies remain short of members, including the Federal Communications Commission and the Federal Trade Commission. Many large deals continued to wind their way through prolonged regulatory reviews, including Bayer’s4 acquisition of Monsanto, AT&T’s acquisition of Time Warner, and Twenty-First Century Fox’s offer for Sky.
Credit spreads narrowed in 2017 for higher quality and high yield credit, albeit with some minor bouts of volatility. The
| | | | |
| Top 10 Holdings | | | |
12/31/17 | | | |
Company Sector/Industry, Country | | % of Total
Net Assets | |
Medtronic PLC
Health Care Equipment & Supplies, US | | | 3.0% | |
Merck & Co. Inc.
Pharmaceuticals, US | | | 2.8% | |
Eli Lilly & Co.
Pharmaceuticals, US | | | 2.6% | |
British American Tobacco PLC
Tobacco, UK | | | 2.5% | |
Microsoft Corp.
Software, US | | | 2.4% | |
Time Warner Inc.
Media, US | | | 2.2% | |
Royal Dutch Shell PLC
Oil, Gas & Consumable Fuels, UK | | | 2.1% | |
Novartis AG
Pharmaceuticals, Switzerland | | | 2.0% | |
American International Group Inc.
Insurance, US | | | 2.0% | |
Cisco Systems Inc.
Communications Equipment, US | | | 2.0% | |
broad-based decrease in yield differentials between bonds with the same maturity but different credit quality provided the Fund with the opportunity to exit a number of opportunities that presented themselves in early 2016, including several bond offerings related to leveraged acquisitions, as prices improved, spreads shrank, and the risk-adjusted returns were no longer mispriced. As the year progressed and investors became more willing buyers of credit, mispriced risk became more difficult to find, in our opinion. In times when the credit markets fluctuate and value is difficult to identify, we believe our industry specific expertise, deep fundamental analysis with a focus on cash flow, and intensive credit and covenant review combine seamlessly and provide us with different ways of looking at the same ideas others may disregard.
Turning to Fund performance, top positive contributors included multinational software company Microsoft, construction and mining equipment manufacturer Caterpillar and South Korea-based Samsung Electronics.
Microsoft continued to reap the rewards of its rapidly growing cloud business and from shifting Microsoft Office software clients to its subscription-based services. Microsoft reported solid quarterly results, including an improvement in operating margins and upward guidance to 2018 operating margins. Microsoft also announced a reorganization of its commercial
FRANKLIN MUTUAL SHARES VIP FUND
field sales teams in July 2017 as part of its increased focus on cloud computing.
Caterpillar raised its 2017 revenue and earnings guidance on multiple occasions during the year as demand generally improved across all of its divisions. Improved global economic conditions and a rebound in Chinese construction activity were significant catalysts for the increased demand. In September, Caterpillar’s new chief executive officer, Jim Umpleby, hosted an investor day at which he outlined his vision for the company. In particular, the company highlighted significant new growth opportunities in each of its business units, as well as margin targets that exceeded analyst expectations.
Samsung Electronics is a low cost provider of dynamic random-access memory and flash memory products, smartphones, consumer electronics and other goods. For investors, Samsung’s solid operating results outweighed both the conviction of Samsung vice chairman Jay Y. Lee for his involvement in a government bribery scandal and escalating tensions between North Korea and the international community. Samsung reported strong sales in its core businesses, including memory chips and OLED (organic light-emitting diode) displays. Sales of its newest generation of smartphones during 2017 exceeded market expectations. Shareholder- friendly actions also boosted shares of Samsung, including a plan to cancel existing treasury shares held by the company and the announcement of significant dividend increases in 2017 and 2018.
During the period under review, Fund investments that detracted from performance included US-based energy services company Baker Hughes, US-based industrials company General Electric (GE) and Israel-based pharmaceutical services provider Teva Pharmaceuticals.5
Baker Hughes is a US-based energy services company, majority owned by GE following the completed merger between Baker Hughes and GE’s oil-and-gas business in July 2017. Baker Hughes’ stock price slid lower in 2017 as the environment for long-cycle oil field service projects remained challenging and the newly combined company posted weaker-than-expected operating results. Toward year-end, we saw reasons for optimism as oil prices gained and Baker Hughes announced a $3 billion share repurchase program.
The stock price of GE, a US-based industrials company with a wide range of business units, declined as investors became more discouraged about the company’s poor cash flow
generation, significantly underfunded pension liability, bloated cost structure, and increased competition and overcapacity in the power market. Intensifying pressure by activist investors led to chief executive officer (CEO) Jeffrey Immelt’s resignation in June 2017 and the promotion of John Flannery to CEO. However, GE’s stock price continued to slide after the company lowered its 2017 earnings guidance in October, which heightened investor concerns about a potential dividend cut. A dividend cut of 50%, larger than most investors had speculated, was announced in November, along with the incoming CEO’s plan for portfolio optimization and significant cost reductions. These negative events have not altered our view that GE has well-positioned businesses. If GE delivers on its plan to improve free cash flow generation and reduce overhead expenses, we believe there is upside potential for its stock price.
Teva Pharmaceutical Industries experienced a challenging year. In January 2017, Teva provided lower earnings guidance and a US federal court invalidated four patents for the company’s top-selling multiple sclerosis drug Copaxone. The resignations of Teva’s chief executive officer (CEO) and chief financial officer in the first half of 2017 further hindered Teva’s stock price. In the second half of the year, weak operating results, a dividend cut and a debt rating downgrade escalated investor concerns.
During the period, the Fund held currency forwards and futures seeking to hedge most of the currency risk of the portfolio’s non-US dollar investments. The currency forwards had a negative impact on the Fund’s performance because of the depreciation of the US dollar versus the hedged currencies, while currency futures had a negligible impact.
What is a currency forward?
A currency forward is an agreement between the Fund and a counterparty to buy or sell a foreign currency in exchange for another currency at a specific exchange rate on a future date.
What is a future?
A future is an agreement between the Fund and a counterparty made through a US or foreign futures exchange to buy or sell an underlying instrument or asset at a specific price on a future date.
5. Not held at period-end.
FRANKLIN MUTUAL SHARES VIP FUND
Thank you for your participation in Franklin Mutual Shares VIP Fund. We look forward to serving your future investment needs.
The foregoing information reflects our analysis, opinions and portfolio holdings as of December 31, 2017, the end of the reporting period. The way we implement our main investment strategies and the resulting portfolio holdings may change depending on factors such as market and economic conditions. These opinions may not be relied upon as investment advice or an offer for a particular security. The information is not a complete analysis of every aspect of any market, country, industry, security or the Fund. Statements of fact are from sources considered reliable, but the investment manager makes no representation or warranty as to their completeness or accuracy. Although historical performance is no guarantee of future results, these insights may help you understand our investment management philosophy.
FRANKLIN MUTUAL SHARES VIP FUND
Class 2 Fund Expenses
As an investor in a variable insurance contract (Contract) that indirectly provides for investment in an underlying mutual fund, you can incur transaction and/or ongoing expenses at both the Fund level and the Contract Level: (1) transaction expenses can include sales charges (loads) on purchases, surrender fees, transfer fees and premium taxes; and (2) ongoing expenses can include management fees, distribution and service (12b-1) fees, contract fees, annual maintenance fees, mortality and expense risk fees and other fees and expenses. All mutual funds and Contracts have some types of ongoing expenses. The table below shows Fund-level ongoing expenses and can help you understand these costs and compare them with those of other mutual funds offered through the Contract. The table assumes a $1,000 investment held for the six months indicated. Please refer to the Fund prospectus for additional information on operating expenses.
Actual Fund Expenses
The table below provides information about the actual account values and actual expenses in the columns under the heading “Actual.” In these columns the Fund’s actual return, which includes the effect of ongoing Fund expenses but does not include the effect of ongoing Contract expenses, is used to calculate the “Ending Account Value.” You can estimate the Fund-level expenses you paid during the period by following these steps (of course, your account value and expenses will differ from those in this illustration): Divide your account value by $1,000 (if your account had an $8,600 value, then $8,600 ÷ $1,000 = 8.6). Then multiply the result by the number under the headings “Actual” and “Fund-Level Expenses Paid During Period” (if Fund-Level Expenses Paid During Period were $ 7.50, then 8.6 x $7.50 = $64.50). In this illustration, the estimated expenses paid this period at the Fund level are $64.50.
Hypothetical Example for Comparison with Other Mutual Funds
Under the heading “Hypothetical” in the table, information is provided about hypothetical account values and hypothetical expenses based on the Fund’s actual expense ratio and an assumed rate of return of 5% per year before expenses, which is not the Fund’s actual return. This information may not be used to estimate the actual ending account balance or expenses you paid for the period, but it can help you compare ongoing costs of investing in the Fund with those of other mutual funds offered through the Contract. To do so, compare this 5% hypothetical example with the 5% hypothetical examples that appear in the shareholder reports of other funds offered through the Contract.
Please note that expenses shown in the table are meant to highlight ongoing costs at the Fund level only and do not reflect any ongoing expenses at the Contract level, or transaction expenses at either the Fund or Contract levels. In addition, while the Fund does not have transaction expenses, if the transaction and ongoing expenses at the Contract level were included, the expenses shown below would be higher. You should consult your Contract prospectus or disclosure document for more information.
| | | | | | | | | | | | | | | | | | | | | | | | | | |
| | | | | | Actual (actual return after expenses) | | | | | Hypothetical (5% annual return before expenses) | | | | |
| Share Class | |
| Beginning Account
Value 7/1/17 |
| |
| Ending Account
Value 12/31/17 |
| |
| Fund-Level Expenses
Paid During Period 7/1/17–12/31/171,2 |
| | | |
| Ending Account
Value 12/31/17 |
| |
| Fund-Level Expenses
Paid /During Period 7/1/17–12/31/171,2 |
| |
| Net
Annualized Expense Ratio2 |
|
Class 2 | | | $1,000 | | | | $1,027.70 | | | | $5.01 | | | | | | $1,020.27 | | | | $4.99 | | | | 0.98% | |
1. Expenses are equal to the annualized expense ratio for the six-month period as indicated above—in the far right column—multiplied by the simple average account value over the period indicated, and then multiplied by 184/365 to reflect the one-half year period.
2. Reflects expenses after fee waivers and expense reimbursements. Does not include any ongoing expenses of the Contract for which the Fund is an investment option or acquired fund fees and expenses.
FRANKLIN TEMPLETON VARIABLE INSURANCE PRODUCTS TRUST
Financial Highlights
Franklin Mutual Shares VIP Fund
| | | | | | | | | | | | | | | | | | | | |
| | | Year Ended December 31, | |
| | | 2017 | | | 2016 | | | 2015 | | | 2014 | | | 2013 | |
| Class 1 | | | | | | | | | | | | | | | | | | | | |
Per share operating performance
(for a share outstanding throughout the year) | | | | | | | | | | | | | | | | | | | | |
| | | | | |
Net asset value, beginning of year | | | $20.40 | | | | $19.48 | | | | $22.91 | | | | $21.92 | | | | $17.45 | |
| | | | |
| | | | | |
| Income from investment operationsa: | | | | | | | | | | | | | | | | | | | | |
| | | | | |
Net investment incomeb | | | 0.49 | | | | 0.50 | | | | 0.44 | | | | 0.62c | | | | 0.42 | |
| | | | | |
Net realized and unrealized gains (losses) | | | 1.22 | | | | 2.56 | | | | (1.54 | ) | | | 1.01 | | | | 4.52 | |
| | | | |
Total from investment operations | | | 1.71 | | | | 3.06 | | | | (1.10 | ) | | | 1.63 | | | | 4.94 | |
| | | | | |
| Less distributions from: | | | | | | | | | | | | | | | | | | | | |
| | | | | |
Net investment income | | | (0.53 | ) | | | (0.46 | ) | | | (0.77 | ) | | | (0.52 | ) | | | (0.47 | ) |
| | | | | |
Net realized gains | | | (0.87 | ) | | | (1.68 | ) | | | (1.56 | ) | | | (0.12 | ) | | | — | |
| | | | |
Total distributions | | | (1.40 | ) | | | (2.14 | ) | | | (2.33 | ) | | | (0.64 | ) | | | (0.47 | ) |
| | | | |
Net asset value, end of year | | | $20.71 | | | | $20.40 | | | | $19.48 | | | | $22.91 | | | | $21.92 | |
| | | | |
| | | | | |
Total returnd | | | 8.64% | | | | 16.35% | | | | (4.69)% | | | | 7.38% | | | | 28.53% | |
| | | | | |
| Ratios to average net assets | | | | | | | | | | | | | | | | | | | | |
| | | | | |
Expensese,f | | | 0.72% | g | | | 0.72% | g | | | 0.73% | g | | | 0.73% | | | | 0.71% | |
| | | | | |
Expenses incurred in connection with securities sold short | | | —% | | | | 0.01% | | | | 0.02% | | | | 0.03% | | | | —% | h |
| | | | | |
Net investment income | | | 2.34% | | | | 2.57% | | | | 2.00% | | | | 2.83%c | | | | 2.08% | |
| | | | | |
| Supplemental data | | | | | | | | | | | | | | | | | | | | |
| | | | | |
Net assets, end of year (000’s) | | | $653,700 | | | | $610,395 | | | | $643,438 | | | | $656,463 | | | | $552,163 | |
| | | | | |
Portfolio turnover rate | | | 18.32% | | | | 24.45% | | | | 19.88% | | | | 21.33% | | | | 24.05% | |
aThe amount shown for a share outstanding throughout the period may not correlate with the Statement of Operations for the period due to the timing of sales and repurchases of the Fund’s shares in relation to income earned and/or fluctuating fair value of the investments of the Fund.
bBased on average daily shares outstanding.
cNet investment income per share includes approximately $0.23 per share related to income received in the form of special dividends in connection with certain Fund holdings. Excluding this amount, the ratio of net investment income to average net assets would have been 1.79%.
dTotal return does not include fees, charges or expenses imposed by the variable annuity and life insurance contracts for which Franklin Templeton Variable Insurance Products Trust serves as an underlying investment vehicle.
eIncludes dividend and/or interest expense on securities sold short and security borrowing fees, if any. See below for the ratios of such expenses to average net assets for the periods presented. See Note 1(d).
fBenefit of expense reduction rounds to less than 0.01%.
gBenefit of waiver and payments by affiliates rounds to less than 0.01%.
hRounds to less than 0.01%.
| | | | | | |
| | | The accompanying notes are an integral part of these financial statements. | Annual Report | | | MS-9 | |
FRANKLIN TEMPLETON VARIABLE INSURANCE PRODUCTS TRUST
FINANCIAL HIGHLIGHTS
Franklin Mutual Shares VIP Fund (continued)
| | | | | | | | | | | | | | | | | | | | |
| | | Year Ended December 31, | |
| | | 2017 | | | 2016 | | | 2015 | | | 2014 | | | 2013 | |
| Class 2 | | | | | | | | | | | | | | | | | | | | |
Per share operating performance
(for a share outstanding throughout the year) | | | | | | | | | | | | | | | | | | | | |
| | | | | |
Net asset value, beginning of year | | | $20.08 | | | | $19.20 | | | | $22.60 | | | | $21.63 | | | | $17.23 | |
| | | | |
| | | | | |
| Income from investment operationsa: | | | | | | | | | | | | | | | | | | | | |
| | | | | |
Net investment incomeb | | | 0.43 | | | | 0.45 | | | | 0.38 | | | | 0.58c | | | | 0.36 | |
| | | | | |
Net realized and unrealized gains (losses) | | | 1.20 | | | | 2.52 | | | | (1.51 | ) | | | 0.97 | | | | 4.46 | |
| | | | |
Total from investment operations | | | 1.63 | | | | 2.97 | | | | (1.13 | ) | | | 1.55 | | | | 4.82 | |
| | | | |
| | | | | |
| Less distributions from: | | | | | | | | | | | | | | | | | | | | |
| | | | | |
Net investment income | | | (0.48 | ) | | | (0.41 | ) | | | (0.71 | ) | | | (0.46 | ) | | | (0.42 | ) |
| | | | | |
Net realized gains | | | (0.87 | ) | | | (1.68 | ) | | | (1.56 | ) | | | (0.12 | ) | | | — | |
| | | | |
Total distributions | | | (1.35 | ) | | | (2.09 | ) | | | (2.27 | ) | | | (0.58 | ) | | | (0.42 | ) |
| | | | |
Net asset value, end of year | | | $20.36 | | | | $20.08 | | | | $19.20 | | | | $22.60 | | | | $21.63 | |
| | | | |
| | | | | |
Total returnd | | | 8.35% | | | | 16.06% | | | | (4.94)% | | | | 7.12% | | | | 28.26% | |
| | | | | |
| Ratios to average net assets | | | | | | | | | | | | | | | | | | | | |
| | | | | |
Expensese,f | | | 0.97% | g | | | 0.97% | g | | | 0.98% | g | | | 0.98% | | | | 0.96% | |
| | | | | |
Expenses incurred in connection with securities sold short | | | —% | | | | 0.01% | | | | 0.02% | | | | 0.03% | | | | —% | h |
| | | | | |
Net investment income | | | 2.09% | | | | 2.32% | | | | 1.75% | | | | 2.58%c | | | | 1.83% | |
| | | | | |
| Supplemental data | | | | | | | | | | | | | | | | | | | | |
| | | | | |
Net assets, end of year (000’s) | | | $3,476,913 | | | | $3,621,358 | | | | $3,353,505 | | | | $4,218,342 | | | | $4,558,547 | |
| | | | | |
Portfolio turnover rate | | | 18.32% | | | | 24.45% | | | | 19.88% | | | | 21.33% | | | | 24.05% | |
aThe amount shown for a share outstanding throughout the period may not correlate with the Statement of Operations for the period due to the timing of sales and repurchases of the Fund’s shares in relation to income earned and/or fluctuating fair value of the investments of the Fund.
bBased on average daily shares outstanding.
cNet investment income per share includes approximately $0.23 per share related to income received in the form of special dividends in connection with certain Fund holdings. Excluding this amount, the ratio of net investment income to average net assets would have been 1.54%.
dTotal return does not include fees, charges or expenses imposed by the variable annuity and life insurance contracts for which Franklin Templeton Variable Insurance Products Trust serves as an underlying investment vehicle.
eIncludes dividend and/or interest expense on securities sold short and security borrowing fees, if any. See below for the ratios of such expenses to average net assets for the periods presented. See Note 1(d).
fBenefit of expense reduction rounds to less than 0.01%.
gBenefit of waiver and payments by affiliates rounds to less than 0.01%.
hRounds to less than 0.01%.
| | | | |
| MS-10 | | Annual Report | The accompanying notes are an integral part of these financial statements. | | |
FRANKLIN TEMPLETON VARIABLE INSURANCE PRODUCTS TRUST
FINANCIAL HIGHLIGHTS
Franklin Mutual Shares VIP Fund (continued)
| | | | | | | | | | | | | | | | | | | | |
| | | Year Ended December 31, | |
| | | 2017 | | | 2016 | | | 2015 | | | 2014 | | | 2013 | |
| Class 4 | | | | | | | | | | | | | | | | | | | | |
Per share operating performance
(for a share outstanding throughout the year) | | | | | | | | | | | | | | | | | | | | |
| | | | | |
Net asset value, beginning of year | | | $20.23 | | | | $19.32 | | | | $22.72 | | | | $21.74 | | | | $17.31 | |
| | | | |
| | | | | |
| Income from investment operationsa: | | | | | | | | | | | | | | | | | | | | |
| | | | | |
Net investment incomeb | | | 0.41 | | | | 0.44 | | | | 0.36 | | | | 0.57c | | | | 0.34 | |
| | | | | |
Net realized and unrealized gains (losses) | | | 1.21 | | | | 2.53 | | | | (1.52 | ) | | | 0.96 | | | | 4.49 | |
| | | | |
Total from investment operations | | | 1.62 | | | | 2.97 | | | | (1.16 | ) | | | 1.53 | | | | 4.83 | |
| | | | |
| | | | | |
| Less distributions from: | | | | | | | | | | | | | | | | | | | | |
| | | | | |
Net investment income | | | (0.45 | ) | | | (0.38 | ) | | | (0.68 | ) | | | (0.43 | ) | | | (0.40 | ) |
| | | | | |
Net realized gains | | | (0.87 | ) | | | (1.68 | ) | | | (1.56 | ) | | | (0.12 | ) | | | — | |
| | | | |
Total distributions | | | (1.32 | ) | | | (2.06 | ) | | | (2.24 | ) | | | (0.55 | ) | | | (0.40 | ) |
| | | | |
Net asset value, end of year | | | $20.53 | | | | $20.23 | | | | $19.32 | | | | $22.72 | | | | $21.74 | |
| | | | |
| | | | | |
Total returnd | | | 8.25% | | | | 15.94% | | | | (5.05)% | | | | 7.04% | | | | 28.05% | |
| | | | | |
| Ratios to average net assets | | | | | | | | | | | | | | | | | | | | |
| | | | | |
Expensese,f | | | 1.07% | g | | | 1.07% | g | | | 1.08% | g | | | 1.08% | | | | 1.06% | |
| | | | | |
Expenses incurred in connection with securities sold short | | | —% | | | | 0.01% | | | | 0.02% | | | | 0.03% | | | | —% | h |
| | | | | |
Net investment income | | | 1.99% | | | | 2.22% | | | | 1.65% | | | | 2.48%c | | | | 1.73% | |
| | | | | |
| Supplemental data | | | | | | | | | | | | | | | | | | | | |
| | | | | |
Net assets, end of year (000’s) | | | $122,942 | | | | $122,476 | | | | $130,978 | | | | $158,020 | | | | $188,153 | |
| | | | | |
Portfolio turnover rate | | | 18.32% | | | | 24.45% | | | | 19.88% | | | | 21.33% | | | | 24.05% | |
aThe amount shown for a share outstanding throughout the period may not correlate with the Statement of Operations for the period due to the timing of sales and repurchases of the Fund’s shares in relation to income earned and/or fluctuating fair value of the investments of the Fund.
bBased on average daily shares outstanding.
cNet investment income per share includes approximately $0.23 per share related to income received in the form of special dividends in connection with certain Fund holdings. Excluding this amount, the ratio of net investment income to average net assets would have been 1.44%.
dTotal return does not include fees, charges or expenses imposed by the variable annuity and life insurance contracts for which Franklin Templeton Variable Insurance Products Trust serves as an underlying investment vehicle.
eIncludes dividend and/or interest expense on securities sold short and security borrowing fees, if any. See below for the ratios of such expenses to average net assets for the periods presented. See Note 1(d).
fBenefit of expense reduction rounds to less than 0.01%.
gBenefit of waiver and payments by affiliates rounds to less than 0.01%.
hRounds to less than 0.01%.
| | | | | | |
| | | The accompanying notes are an integral part of these financial statements. | Annual Report | | | MS-11 | |
FRANKLIN TEMPLETON VARIABLE INSURANCE PRODUCTS TRUST
Statement of Investments, December 31, 2017
| | | | | | | | | | | | | | |
| Franklin Mutual Shares VIP Fund | | | | | | | | | |
| | | | | Country | | | Shares/ Units/ Warrants | | | Value | |
| | Common Stocks and Other Equity Interests 90.3% | | | | | | | | | | | | |
| | Aerospace & Defense 0.1% | | | | | | | | | | | | |
| | BAE Systems PLC | | | United Kingdom | | | | 301,255 | | | $ | 2,331,135 | |
| | | | | | | | | | | | | | |
| | Auto Components 0.7% | | | | | | | | | | | | |
| | The Goodyear Tire & Rubber Co. | | | United States | | | | 632,638 | | | | 20,440,534 | |
| a,b,c | | International Automotive Components Group Brazil LLC | | | Brazil | | | | 1,730,515 | | | | 59,331 | |
| a,b,c | | International Automotive Components Group North America LLC | | | United States | | | | 15,382,424 | | | | 10,133,556 | |
| | | | | | | | | | | | | | |
| | | | | | | | | | | | | 30,633,421 | |
| | | | | | | | | | | | | | |
| | | Automobiles 1.2% | | | | | | | | | |
| | General Motors Co. | | | United States | | | | 1,245,430 | | | | 51,050,176 | |
| | | | | | | | | | | | | | |
| | | Banks 10.0% | | | | | | | | | |
| | Barclays PLC | | | United Kingdom | | | | 10,534,300 | | | | 28,893,099 | |
| | CIT Group Inc. | | | United States | | | | 757,326 | | | | 37,283,159 | |
| | Citigroup Inc. | | | United States | | | | 892,919 | | | | 66,442,103 | |
| | Citizens Financial Group Inc. | | | United States | | | | 1,870,766 | | | | 78,534,757 | |
| a | | FCB Financial Holdings Inc., A | | | United States | | | | 493,723 | | | | 25,081,128 | |
| | Guaranty Bancorp | | | United States | | | | 209,583 | | | | 5,794,970 | |
| | JPMorgan Chase & Co. | | | United States | | | | 733,020 | | | | 78,389,159 | |
| | PNC Financial Services Group Inc. | | | United States | | | | 365,939 | | | | 52,801,338 | |
| | State Bank Financial Corp. | | | United States | | | | 352,200 | | | | 10,509,648 | |
| | Wells Fargo & Co. | | | United States | | | | 698,860 | | | | 42,399,836 | |
| | | | | | | | | | | | | | |
| | | | | | | | | | | | | 426,129,197 | |
| | | | | | | | | | | | | | |
| | | Beverages 0.9% | | | | | | | | | |
| | PepsiCo Inc. | | | United States | | | | 319,942 | | | | 38,367,445 | |
| | | | | | | | | | | | | | |
| | | Building Products 0.7% | | | | | | | | | |
| | Johnson Controls International PLC | | | United States | | | | 784,700 | | | | 29,904,917 | |
| | | | | | | | | | | | | | |
| | | Chemicals 1.1% | | | | | | | | | |
| a,b,d | | Dow Corning Corp., Contingent Distribution | | | United States | | | | 100,000 | | | | — | |
| | Monsanto Co. | | | United States | | | | 405,580 | | | | 47,363,632 | |
| | | | | | | | | | | | | | |
| | | | | | | | | | | | | 47,363,632 | |
| | | | | | | | | | | | | | |
| | | Communications Equipment 2.7% | | | | | | | | | |
| | Cisco Systems Inc. | | | United States | | | | 2,183,380 | | | | 83,623,454 | |
| | Nokia OYJ, A | | | Finland | | | | 3,254,727 | | | | 15,206,154 | |
| | Nokia OYJ, ADR | | | Finland | | | | 3,299,845 | | | | 15,377,278 | |
| | | | | | | | | | | | | | |
| | | | | | | | | | | | | 114,206,886 | |
| | | | | | | | | | | | | | |
| | | Construction & Engineering 0.6% | | | | | | | | | |
| | Fluor Corp. | | | United States | | | | 528,682 | | | | 27,306,425 | |
| | | | | | | | | | | | | | |
| | | Construction Materials 0.7% | | | | | | | | | |
| | LafargeHolcim Ltd., B | | | Switzerland | | | | 547,060 | | | | 30,852,309 | |
| | | | | | | | | | | | | | |
| | | Consumer Finance 1.6% | | | | | | | | | |
| | Ally Financial Inc. | | | United States | | | | 865,370 | | | | 25,234,189 | |
| | Capital One Financial Corp. | | | United States | | | | 436,885 | | | | 43,505,009 | |
| | | | | | | | | | | | | | |
| | | | | | | | | | | | | 68,739,198 | |
| | | | | | | | | | | | | | |
| | | Containers & Packaging 2.2% | | | | | | | | | |
| | International Paper Co. | | | United States | | | | 878,375 | | | | 50,893,048 | |
| | WestRock Co. | | | United States | | | | 643,812 | | | | 40,695,357 | |
| | | | | | | | | | | | | | |
| | | | | | | | | | | | | 91,588,405 | |
| | | | | | | | | | | | | | |
FRANKLIN TEMPLETON VARIABLE INSURANCE PRODUCTS TRUST
STATEMENT OF INVESTMENTS
Franklin Mutual Shares VIP Fund (continued)
| | | | | | | | | | | | | | |
| | | | | Country | | | Shares/ Units/ Warrants | | | Value | |
| | Common Stocks and Other Equity Interests (continued) | | | | | | | | | | | | |
| | Diversified Financial Services 1.1% | | | | | | | | | | | | |
| | Voya Financial Inc. | | | United States | | | | 959,810 | | | $ | 47,481,801 | |
| | | | | | | | | | | | | | |
| | Diversified Telecommunication Services 0.7% | | | | | | | | | | | | |
| | Koninklijke KPN NV | | | Netherlands | | | | 8,378,890 | | | | 29,234,103 | |
| | | | | | | | | | | | | | |
| | Electric Utilities 0.5% | | | | | | | | | | | | |
| | PG&E Corp. | | | United States | | | | 486,543 | | | | 21,811,723 | |
| | | | | | | | | | | | | | |
| | Electrical Equipment 1.3% | | | | | | | | | | | | |
| a | | Sensata Technologies Holding NV | | | United States | | | | 1,104,530 | | | | 56,452,528 | |
| | | | | | | | | | | | | | |
| | Energy Equipment & Services 0.8% | | | | | | | | | | | | |
| | Baker Hughes a GE Co., A | | | United States | | | | 1,003,685 | | | | 31,756,593 | |
| a | | GulfMark Offshore Inc. | | | United States | | | | 131 | | | | 3,732 | |
| a | | GulfMark Offshore Inc., wts., 11/14/24 | | | United States | | | | 1,412 | | | | 1,017 | |
| | | | | | | | | | | | | | |
| | | | | | | | | | | | | 31,761,342 | |
| | | | | | | | | | | | | | |
| | Equity Real Estate Investment Trusts (REITs) 1.6% | | | | | | | | | | | | |
| | Alexander’s Inc. | | | United States | | | | 40,126 | | | | 15,883,877 | |
| | JBG SMITH Properties | | | United States | | | | 195,298 | | | | 6,782,700 | |
| | Vornado Realty Trust | | | United States | | | | 553,396 | | | | 43,264,499 | |
| | | | | | | | | | | | | | |
| | | | | | | | | | | | | 65,931,076 | |
| | | | | | | | | | | | | | |
| | Food & Staples Retailing 4.0% | | | | | | | | | | | | |
| | CVS Health Corp. | | | United States | | | | 821,861 | | | | 59,584,922 | |
| | The Kroger Co. | | | United States | | | | 2,243,460 | | | | 61,582,977 | |
| a | | Rite Aid Corp. | | | United States | | | | 2,439,970 | | | | 4,806,741 | |
| | Walgreens Boots Alliance Inc. | | | United States | | | | 628,158 | | | | 45,616,834 | |
| | | | | | | | | | | | | | |
| | | | | | | | | | | | | 171,591,474 | |
| | | | | | | | | | | | | | |
| | Health Care Equipment & Supplies 4.5% | | | | | | | | | | | | |
| | Medtronic PLC | | | United States | | | | 1,574,812 | | | | 127,166,069 | |
| | Stryker Corp. | | | United States | | | | 411,591 | | | | 63,730,750 | |
| | | | | | | | | | | | | | |
| | | | | | | | | | | | | 190,896,819 | |
| | | | | | | | | | | | | | |
| | Hotels, Restaurants & Leisure 0.1% | | | | | | | | | | | | |
| a | | Caesars Entertainment Corp. | | | United States | | | | 210,657 | | | | 2,664,811 | |
| | | | | | | | | | | | | | |
| | Household Products 0.4% | | | | | | | | | | | | |
| | Energizer Holdings Inc. | | | United States | | | | 352,892 | | | | 16,931,758 | |
| | | | | | | | | | | | | | |
| | Independent Power & Renewable Electricity Producers 0.9% | | | | | | | | | | | | |
| a | | Vistra Energy Corp. | | | United States | | | | 2,184,095 | | | | 40,012,620 | |
| | | | | | | | | | | | | | |
| | Industrial Conglomerates 1.4% | | | | | | | | | | | | |
| | General Electric Co. | | | United States | | | | 3,481,500 | | | | 60,752,175 | |
| | | | | | | | | | | | | | |
| | Insurance 7.8% | | | | | | | | | | | | |
| a | | Alleghany Corp. | | | United States | | | | 102,188 | | | | 60,913,245 | |
| | American International Group Inc. | | | United States | | | | 1,405,496 | | | | 83,739,451 | |
| a | | Brighthouse Financial Inc. | | | United States | | | | 88,836 | | | | 5,209,343 | |
| | Chubb Ltd. | | | United States | | | | 319,645 | | | | 46,709,724 | |
| | The Hartford Financial Services Group Inc. | | | United States | | | | 622,878 | | | | 35,055,574 | |
| | MetLife Inc. | | | United States | | | | 977,203 | | | | 49,407,384 | |
| | XL Group Ltd. | | | Bermuda | | | | 1,399,492 | | | | 49,206,139 | |
| | | | | | | | | | | | | | |
| | | | | | | | | | | | | 330,240,860 | |
| | | | | | | | | | | | | | |
FRANKLIN TEMPLETON VARIABLE INSURANCE PRODUCTS TRUST
STATEMENT OF INVESTMENTS
Franklin Mutual Shares VIP Fund (continued)
| | | | | | | | | | | | | | |
| | | | | Country | | | Shares/ Units/ Warrants | | | Value | |
| | Common Stocks and Other Equity Interests (continued) | | | | | | | | | | | | |
| | IT Services 1.8% | | | | | | | | | | | | |
| | Cognizant Technology Solutions Corp., A | | | United States | | | | 822,270 | | | $ | 58,397,615 | |
| | DXC Technology Co. | | | United States | | | | 177,792 | | | | 16,872,461 | |
| | | | | | | | | | | | | | |
| | | | | | | | | | | | | 75,270,076 | |
| | | | | | | | | | | | | | |
| | Machinery 2.0% | | | | | | | | | | | | |
| | Caterpillar Inc. | | | United States | | | | 293,306 | | | | 46,219,160 | |
| | CNH Industrial NV | | | United Kingdom | | | | 888,427 | | | | 11,906,491 | |
| | CNH Industrial NV, special voting | | | United Kingdom | | | | 1,844,814 | | | | 24,723,767 | |
| | | | | | | | | | | | | | |
| | | | | | | | | | | | | 82,849,418 | |
| | | | | | | | | | | | | | |
| | Media 7.9% | | | | | | | | | | | | |
| a | | Charter Communications Inc., A | | | United States | | | | 239,913 | | | | 80,601,172 | |
| a | | DISH Network Corp., A | | | United States | | | | 778,183 | | | | 37,158,238 | |
| | Sky PLC | | | United Kingdom | | | | 3,381,508 | | | | 46,213,562 | |
| | Time Warner Inc. | | | United States | | | | 1,018,288 | | | | 93,142,803 | |
| | The Walt Disney Co. | | | United States | | | | 741,600 | | | | 79,729,416 | |
| | | | | | | | | | | | | | |
| | | | | | | | | | | | | 336,845,191 | |
| | | | | | | | | | | | | | |
| | Metals & Mining 0.9% | | | | | | | | | | | | |
| | thyssenkrupp AG | | | Germany | | | | 1,071,230 | | | | 31,122,615 | |
| | Warrior Met Coal Inc. | | | United States | | | | 361,612 | | | | 9,094,542 | |
| | | | | | | | | | | | | | |
| | | | | | | | | | | | | 40,217,157 | |
| | | | | | | | | | | | | | |
| | Oil, Gas & Consumable Fuels 8.5% | | | | | | | | | | | | |
| | Anadarko Petroleum Corp. | | | United States | | | | 1,070,770 | | | | 57,436,103 | |
| | BP PLC | | | United Kingdom | | | | 4,322,322 | | | | 30,510,416 | |
| | Kinder Morgan Inc. | | | United States | | | | 3,158,940 | | | | 57,082,046 | |
| | Marathon Oil Corp. | | | United States | | | | 2,991,878 | | | | 50,652,495 | |
| | Plains All American Pipeline LP | | | United States | | | | 1,058,500 | | | | 21,847,440 | |
| | Royal Dutch Shell PLC, A (EUR Traded) | | | United Kingdom | | | | 1,798,278 | | | | 59,948,195 | |
| | Royal Dutch Shell PLC, A (GBP Traded) | | | United Kingdom | | | | 927,720 | | | | 31,070,419 | |
| | The Williams Cos. Inc. | | | United States | | | | 1,751,598 | | | | 53,406,223 | |
| | | | | | | | | | | | | | |
| | | | | | | | | | | | | 361,953,337 | |
| | | | | | | | | | | | | | |
| | Pharmaceuticals 7.4% | | | | | | | | | | | | |
| | Eli Lilly & Co. | | | United States | | | | 1,284,036 | | | | 108,449,680 | |
| | Merck & Co. Inc. | | | United States | | | | 2,101,048 | | | | 118,225,971 | |
| | Novartis AG, ADR | | | Switzerland | | | | 1,026,481 | | | | 86,183,345 | |
| | | | | | | | | | | | | | |
| | | | | | | | | | | | | 312,858,996 | |
| | | | | | | | | | | | | | |
| | Professional Services 0.9% | | | | | | | | | | | | |
| | RELX PLC | | | United Kingdom | | | | 1,702,110 | | | | 39,972,906 | |
| | | | | | | | | | | | | | |
| | Real Estate Management & Development 0.1% | | | | | | | | | | | | |
| a | | VICI Properties Inc. | | | United States | | | | 256,380 | | | | 5,255,790 | |
| | | | | | | | | | | | | | |
| | Software 6.1% | | | | | | | | | | | | |
| a | | Avaya Holdings Corp. | | | United States | | | | 998,738 | | | | 17,527,852 | |
| a,b | | Avaya Holdings Corp., wts., 12/15/22 | | | United States | | | | 91,551 | | | | 155,736 | |
| | CA Inc. | | | United States | | | | 1,429,032 | | | | 47,558,185 | |
| a | | Dell Technologies Inc., V | | | United States | | | | 198,331 | | | | 16,120,344 | |
| | Microsoft Corp. | | | United States | | | | 1,213,547 | | | | 103,806,810 | |
| | Symantec Corp. | | | United States | | | | 2,620,561 | | | | 73,532,942 | |
| | | | | | | | | | | | | | |
| | | | | | | | | | | | | 258,701,869 | |
| | | | | | | | | | | | | | |
FRANKLIN TEMPLETON VARIABLE INSURANCE PRODUCTS TRUST
STATEMENT OF INVESTMENTS
Franklin Mutual Shares VIP Fund (continued)
| | | | | | | | | | | | | | |
| | | | | Country | | | Shares/ Units/ Warrants | | | Value | |
| | Common Stocks and Other Equity Interests (continued) | | | | | | | | | | | | |
| | Technology Hardware, Storage & Peripherals 2.4% | | | | | | | | | | | | |
| | Hewlett Packard Enterprise Co. | | | United States | | | | 2,069,667 | | | $ | 29,720,418 | |
| | Samsung Electronics Co. Ltd. | | | South Korea | | | | 30,092 | | | | 71,834,562 | |
| | | | | | | | | | | | | | |
| | | | | | | | | | | | | 101,554,980 | |
| | | | | | | | | | | | | | |
| | Tobacco 4.1% | | | | | | | | | | | | |
| | Altria Group Inc. | | | United States | | | | 638,788 | | | | 45,615,851 | |
| | British American Tobacco PLC | | | United Kingdom | | | | 1,156,721 | | | | 78,385,871 | |
| | British American Tobacco PLC, ADR | | | United Kingdom | | | | 446,833 | | | | 29,933,343 | |
| | Imperial Brands PLC | | | United Kingdom | | | | 487,268 | | | | 20,833,264 | |
| | | | | | | | | | | | | | |
| | | | | | | | | | | | | 174,768,329 | |
| | | | | | | | | | | | | | |
| | Wireless Telecommunication Services 0.6% | | | | | | | | | | | | |
| | Vodafone Group PLC | | | United Kingdom | | | | 8,229,954 | | | | 26,118,233 | |
| | | | | | | | | | | | | | |
| | | | |
| | Total Common Stocks and Other Equity Interests
(Cost $2,789,021,935) | | | | | | | | | | | 3,840,602,518 | |
| | | | | | | | | | | | | | |
| | | | |
| | Management Investment Companies
(Cost $21,403,790) 0.5% | | | | | | | | | | | | |
| | Diversified Financial Services 0.5% | | | | | | | | | | | | |
| a | | Altaba Inc. | | | United States | | | | 326,600 | | | | 22,813,010 | |
| | | | | | | | | | | | | | |
| | | | |
| | | | | | | | Principal Amount | | | | |
| | Corporate Notes and Senior Floating Rate Interests 2.8% | | | | | | | | | |
| e,f | | Belk Inc., Closing Date Term Loan, 6.099%, (LIBOR + 4.75%), 12/12/22 | | | United States | | | $ | 5,709,031 | | | | 4,687,355 | |
| e,f | | Cumulus Media Holdings Inc., Term Loans, 4.82%, (LIBOR + 3.25%), 12/23/20 | | | United States | | | | 15,700,807 | | | | 13,561,572 | |
| | Frontier Communications Corp., | | | | | | | | | | | | |
| | senior note, 10.50%, 9/15/22 | | | United States | | | | 22,633,000 | | | | 17,172,789 | |
| | senior note, 11.00%, 9/15/25 | | | United States | | | | 25,535,000 | | | | 18,895,900 | |
| | iHeartCommunications Inc.,
senior secured note, first lien, 9.00%, 12/15/19 | | | United States | | | | 26,449,000 | | | | 19,770,627 | |
| | e,fTranche D Term Loan, 8.443%, (LIBOR + 6.75%), 1/30/19 | | | United States | | | | 34,746,619 | | | | 26,219,208 | |
| | e,f Tranche E Term Loan, 9.193%, (LIBOR + 7.50%), 7/30/19 | | | United States | | | | 11,168,253 | | | | 8,399,453 | |
| e,f | | Toys R US-Delaware Inc., (DIP), 10.319%, (LIBOR + 8.75%), 1/18/19 | | | United States | | | | 11,760,462 | | | | 12,054,473 | |
| | | | | | | | | | | | | | |
| | | |
| | Total Corporate Notes and Senior Floating Rate Interests
(Cost $143,678,975) | | | | | | | | 120,761,377 | |
| | | | | | | | | | | | | | |
| | | | |
| | Corporate Notes and Senior Floating Rate Interests in Reorganization 0.3% | | | | | | | | | | | | |
| b,c,g | | Broadband Ventures III LLC, secured promissory note, 5.00%, 2/01/12 | | | United States | | | | 1,754 | | | | — | |
| e,f,g | | Toys R US-Delaware Inc., Term B-4 Loan, 5.033%, (LIBOR + 4.375%), 4/24/20 | | | United States | | | | 21,079,272 | | | | 10,434,240 | |
| | | | | | | | | | | | | | |
| | | |
| | Total Corporate Notes and Senior Floating Rate Interests in Reorganization (Cost $20,352,434) | | | | | | | | 10,434,240 | |
| | | | | | | | | | | | | | |
| | | | |
| | | | | | | | Shares | | | | |
| | Companies in Liquidation 0.2% | | | | | | | | | | | | |
| a,b,d | | Avaya Holdings Corp., Contingent Distribution | | | United States | | | | 30,319,000 | | | | — | |
| a,b,d | | Avaya Inc., Contingent Distribution | | | United States | | | | 34,518,267 | | | | — | |
| a,b,c,h | | CB FIM Coinvestors LLC | | | United States | | | | 6,400,507 | | | | — | |
FRANKLIN TEMPLETON VARIABLE INSURANCE PRODUCTS TRUST
STATEMENT OF INVESTMENTS
Franklin Mutual Shares VIP Fund (continued)
| | | | | | | | | | | | | | |
| | | | | Country | | | Shares | | | Value | |
| | Companies in Liquidation (continued) | | | | | | | | | | | | |
| a,b,c | | FIM Coinvestor Holdings I, LLC | | | United States | | | | 8,006,950 | | | $ | — | |
| a,i | | Lehman Brothers Holdings Inc., Bankruptcy Claim | | | United States | | | | 144,058,799 | | | | 3,198,105 | |
| a,b,d | | Tribune Media, Litigation Trust, Contingent Distribution | | | United States | | | | 394,551 | | | | — | |
| a,b,d | | Vistra Energy Corp., Litigation Trust, Contingent Distribution | | | United States | | | | 129,926,405 | | | | 1,507,147 | |
| a | | Vistra Energy Corp., Litigation Trust, TRA | | | United States | | | | 2,184,095 | | | | 1,911,083 | |
| | | | | | | | | | | | | | |
| | | |
| | Total Companies in Liquidation
(Cost $21,025,005) | | | | | | | | 6,616,335 | |
| | | | | | | | | | | | | | |
| | | |
| | Total Investments before Short Term Investments
(Cost $2,995,482,139) | | | | | | | | 4,001,227,480 | |
| | | | | | | | | | | | | | |
| | | | |
| | | | | | | | Principal Amount | | | | |
| | Short Term Investments 6.4% | | | | | | | | | |
| | U.S. Government and Agency Securities 6.4% | | | | | | | | | | | | |
| j | | FHLB, 1/02/18 | | | United States | | | $ | 25,000,000 | | | | 25,000,000 | |
| j | | U.S. Treasury Bill, | | | | | | | | | | | | |
| | 1/02/18 - 4/26/18 | | | United States | | | | 204,700,000 | | | | 204,390,768 | |
| | k3/22/18 - 5/10/18 | | | United States | | | | 45,000,000 | | | | 44,818,214 | |
| | | | | | | | | | | | | | |
| | | |
| | Total U.S. Government and Agency Securities
(Cost $274,243,108) | | | | | | | | 274,208,982 | |
| | | | | | | | | | | | | | |
| | | |
| | Total Investments (Cost $3,269,725,247) 100.5% | | | | | | | | 4,275,436,462 | |
| | Securities Sold Short (0.6)% | | | | | | | | | | | (26,139,611 | ) |
| | Other Assets, less Liabilities 0.1% | | | | | | | | | | | 4,258,836 | |
| | | | | | | | | | | | | | |
| | Net Assets 100.0% | | | | | | | | | | $ | 4,253,555,687 | |
| | | | | | | | | | | | | | |
| | | | |
| | | | | | | | Shares | | | | |
| l | | Securities Sold Short (0.6)% | | | | | | | | | | | | |
| | Common Stocks (0.6)% | | | | | | | | | | | | |
| | Diversified Telecommunication Services (0.1)% | | | | | | | | | | | | |
| | AT&T Inc. | | | United States | | | | 150,874 | | | | (5,865,981 | ) |
| | | | | | | | | | | | | | |
| | Internet Software & Services (0.5)% | | | | | | | | | | | | |
| | Alibaba Group Holding Ltd., ADR | | | China | | | | 117,576 | | | | (20,273,630 | ) |
| | | | | | | | | | | | | | |
| | | |
| | Total Securities Sold Short (Proceeds $26,402,531) | | | | | | | $ | (26,139,611 | ) |
| | | | | | | | | | | | | | |
FRANKLIN TEMPLETON VARIABLE INSURANCE PRODUCTS TRUST
STATEMENT OF INVESTMENTS
Franklin Mutual Shares VIP Fund (continued)
aNon-income producing.
bFair valued using significant unobservable inputs. See Note 12 regarding fair value measurements.
cSee Note 8 regarding restricted securities.
dContingent distributions represent the right to receive additional distributions, if any, during the reorganization of the underlying company. Shares represent total underlying principal of debt securities.
eThe coupon rate shown represents the rate at period end.
fSee Note 1(f) regarding senior floating rate interests.
gSee Note 7 regarding credit risk and defaulted securities.
hSee Note 10 regarding holdings of 5% voting securities.
iBankruptcy claims represent the right to receive distributions, if any, during the liquidation of the underlying pool of assets. Shares represent amount of allowed unsecured claims.
jThe security was issued on a discount basis with no stated coupon rate.
kA portion or all of the security has been segregated as collateral for securities sold short and open forward exchange contracts. At December 31, 2017, the aggregate value of these securities and/or cash pledged amounted to $44,639,398, representing 1.0% of net assets.
lSee Note 1(d) regarding securities sold short.
FRANKLIN TEMPLETON VARIABLE INSURANCE PRODUCTS TRUST
STATEMENT OF INVESTMENTS
Franklin Mutual Shares VIP Fund (continued)
At December 31, 2017, the Fund had the following futures contracts outstanding. See Note 1(c).
| | | | | | | | | | | | | | | | | | | | |
| Futures Contracts | | | | | | | | | | | | | | | |
| Description | | | Type | | |
| Number of
Contracts |
| |
| Notional
Amount* |
| |
| Expiration
Date |
| |
| Value/
Unrealized Appreciation (Depreciation) |
|
| Currency Contracts | | | | | | | | | | | | | | | | | | | | |
EUR/USD | | | Short | | | | 478 | | | $ | 72,151,113 | | | | 3/19/18 | | | $ | (1,288,959 | ) |
GBP/USD | | | Short | | | | 1,341 | | | | 113,624,606 | | | | 3/19/18 | | | | (806,439 | ) |
| | | | | | | | | | | | | | | | | | | | |
Total Futures Contracts | | | | | | | | | | | | | | | | | | $ | (2,095,398 | ) |
| | | | | | | | | | | | | | | | | | | | |
*As of period end.
At December 31, 2017, the Fund had the following forward exchange contracts outstanding. See Note 1(c).
| | | | | | | | | | | | | | | | | | | | | | | | | | | | |
| Forward Exchange Contracts | | | | | | | | | | | | | |
| Currency | | | Counterpartya | | | | Type | | | | Quantity | | |
| Contract
Amount |
| |
| Settlement
Date |
| |
| Unrealized
Appreciation |
| |
| Unrealized
Depreciation |
|
| OTC Forward Exchange Contracts | | | | | | | | | | | | | | | | | |
South Korean Won | | | HSBK | | | | Buy | | | | 9,390,689,935 | | | $ | 8,629,116 | | | | 1/12/18 | | | $ | 171,026 | | | $ | — | |
South Korean Won | | | HSBK | | | | Sell | | | | 60,812,380,271 | | | | 54,073,226 | | | | 1/12/18 | | | | — | | | | (2,914,874 | ) |
South Korean Won | | | UBSW | | | | Sell | | | | 24,816,391,664 | | | | 22,106,817 | | | | 1/12/18 | | | | — | | | | (1,148,957 | ) |
British Pound | | | BOFA | | | | Sell | | | | 910,686 | | | | 1,222,628 | | | | 2/14/18 | | | | — | | | | (9,110 | ) |
British Pound | | | HSBK | | | | Sell | | | | 207,121 | | | | 280,444 | | | | 2/14/18 | | | | 305 | | | | — | |
British Pound | | | HSBK | | | | Sell | | | | 2,050,359 | | | | 2,747,842 | | | | 2/14/18 | | | | — | | | | (25,348 | ) |
British Pound | | | UBSW | | | | Sell | | | | 68,465,138 | | | | 92,143,122 | | | | 2/14/18 | | | | — | | | | (458,646 | ) |
Euro | | | HSBK | | | | Sell | | | | 387,000 | | | | 466,485 | | | | 2/20/18 | | | | 696 | | | | — | |
Euro | | | HSBK | | | | Sell | | | | 82,295,834 | | | | 97,611,500 | | | | 2/20/18 | | | | — | | | | (1,438,852 | ) |
| | | | | | | | | | | | | | | | | | | | | | | | |
Total Forward Exchange Contracts | | | $ | 172,027 | | | $ | (5,995,787 | ) |
| | | | | | | | | | | | | | | | | | | | | | | | |
Net unrealized appreciation (depreciation) | | | | | | | $ | (5,823,760 | ) |
| | | | | | | | | | | | | | | | | | | | | | | | | | | | |
aMay be comprised of multiple contracts with the same counterparty, currency and settlement date.
See Note 9 regarding other derivative information.
See Abbreviations on page MS-32.
| | | | |
| MS-18 | | Annual Report | The accompanying notes are an integral part of these financial statements. | | |
FRANKLIN TEMPLETON VARIABLE INSURANCE PRODUCTS TRUST
Financial Statements
Statement of Assets and Liabilities
December 31, 2017
| | | | |
| | | Franklin Mutual
Shares VIP Fund | |
Assets: | | | | |
Investments in securities: | | | | |
Cost - Unaffiliated issuers | | $ | 3,269,725,247 | |
| | | | |
Value - Unaffiliated issuers | | $ | 4,275,436,462 | |
Cash | | | 1,114,203 | |
Foreign currency, at value (cost $1,946,373) | | | 1,953,602 | |
Receivables: | | | | |
Investment securities sold | | | 2,771,374 | |
Capital shares sold | | | 298,031 | |
Dividends and interest | | | 9,248,355 | |
European Union tax reclaims | | | 1,369,360 | |
Deposits with brokers for: | | | | |
Securities sold short | | | 26,749,447 | |
Futures contracts | | | 3,582,210 | |
Unrealized appreciation on OTC forward exchange contracts | | | 172,027 | |
Other assets | | | 507 | |
| | | | |
Total assets | | | 4,322,695,578 | |
| | | | |
Liabilities: | | | | |
Payables: | | | | |
Investment securities purchased | | | 29,062,433 | |
Capital shares redeemed | | | 2,367,780 | |
Management fees | | | 2,466,336 | |
Distribution fees | | | 1,501,308 | |
Variation margin on futures contracts | | | 1,060,037 | |
Securities sold short, at value (proceeds $26,402,531) | | | 26,139,611 | |
Unrealized depreciation on OTC forward exchange contracts | | | 5,995,787 | |
Accrued expenses and other liabilities | | | 546,599 | |
| | | | |
Total liabilities | | | 69,139,891 | |
| | | | |
Net assets, at value | | $ | 4,253,555,687 | |
| | | | |
Net assets consist of: | | | | |
Paid-in capital | | $ | 3,028,860,655 | |
Undistributed net investment income | | | 89,531,283 | |
Net unrealized appreciation (depreciation) | | | 998,122,229 | |
Accumulated net realized gain (loss) | | | 137,041,520 | |
| | | | |
Net assets, at value | | $ | 4,253,555,687 | |
| | | | |
| |
| Class 1: | | | | |
Net assets, at value | | $ | 653,700,019 | |
| | | | |
Shares outstanding | | | 31,567,035 | |
| | | | |
Net asset value and maximum offering price per share | | $ | 20.71 | |
| | | | |
| |
| Class 2: | | | | |
Net assets, at value | | $ | 3,476,913,434 | |
| | | | |
Shares outstanding | | | 170,739,831 | |
| | | | |
Net asset value and maximum offering price per share | | $ | 20.36 | |
| | | | |
| |
| Class 4: | | | | |
Net assets, at value | | $ | 122,942,234 | |
| | | | |
Shares outstanding | | | 5,987,446 | |
| | | | |
Net asset value and maximum offering price per share | | $ | 20.53 | |
| | | | |
| | | | | | |
| | | The accompanying notes are an integral part of these financial statements. | Annual Report | | | MS-19 | |
FRANKLIN TEMPLETON VARIABLE INSURANCE PRODUCTS TRUST
FINANCIAL STATEMENTS
Statement of Operations
for the year ended December 31, 2017
| | | | |
| | | Franklin Mutual
Shares VIP Fund | |
Investment income: | | | | |
Dividends: (net of foreign taxes)* | | | | |
Unaffiliated issuers | | $ | 108,688,935 | |
Interest: | | | | |
Unaffiliated issuers | | | 22,725,455 | |
Income from securities loaned (net of fees and rebates) | | | 550,873 | |
Other income (Note 1g) | | | 159,460 | |
| | | | |
Total investment income | | | 132,124,723 | |
| | | | |
Expenses: | | | | |
Management fees (Note 3a) | | | 29,718,351 | |
Distribution fees: (Note 3c) | | | | |
Class 2 | | | 8,891,495 | |
Class 4 | | | 422,768 | |
Custodian fees (Note 4) | | | 107,459 | |
Reports to shareholders | | | 475,250 | |
Professional fees | | | 502,408 | |
Trustees’ fees and expenses | | | 18,570 | |
Other | | | 250,733 | |
| | | | |
Total expenses | | | 40,387,034 | |
Expense reductions (Note 4) | | | (6,728 | ) |
Expenses waived/paid by affiliates (Note 3e) | | | (10,554 | ) |
| | | | |
Net expenses | | | 40,369,752 | |
| | | | |
Net investment income | | | 91,754,971 | |
| | | | |
Realized and unrealized gains (losses): | | | | |
Net realized gain (loss) from: | | | | |
Investments: | | | | |
Unaffiliated issuers | | | 200,709,186 | |
Realized gain distributions from REITs | | | 15,087 | |
Foreign currency transactions | | | 603,059 | |
Forward exchange contracts | | | (19,285,260 | ) |
Futures contracts | | | (11,685,578 | ) |
Securities sold short | | | (346,179 | ) |
| | | | |
Net realized gain (loss) | | | 170,010,315 | |
| | | | |
Net change in unrealized appreciation (depreciation) on: | | | | |
Investments: | | | | |
Unaffiliated issuers | | | 100,306,952 | |
Translation of other assets and liabilities denominated in foreign currencies | | | 208,022 | |
Forward exchange contracts | | | (9,236,738 | ) |
Futures contracts | | | (4,720,495 | ) |
Securities sold short | | | 185,989 | |
| | | | |
Net change in unrealized appreciation (depreciation) | | | 86,743,730 | |
| | | | |
Net realized and unrealized gain (loss) | | | 256,754,045 | |
| | | | |
Net increase (decrease) in net assets resulting from operations | | $ | 348,509,016 | |
| | | | |
| |
*Foreign taxes withheld on dividends | | $ | 2,214,608 | |
| | | | |
| MS-20 | | Annual Report | The accompanying notes are an integral part of these financial statements. | | |
FRANKLIN TEMPLETON VARIABLE INSURANCE PRODUCTS TRUST
FINANCIAL STATEMENTS
Statements of Changes in Net Assets
| | | | | | | | |
| | | Franklin Mutual Shares VIP Fund | |
| | | Year Ended December 31, | |
| | | 2017 | | | 2016 | |
Increase (decrease) in net assets: | | | | | | | | |
Operations: | | | | | | | | |
Net investment income | | $ | 91,754,971 | | | $ | 96,857,347 | |
Net realized gain (loss) | | | 170,010,315 | | | | 177,041,416 | |
Net change in unrealized appreciation (depreciation) | | | 86,743,730 | | | | 340,244,965 | |
| | | | |
Net increase (decrease) in net assets resulting from operations | | | 348,509,016 | | | | 614,143,728 | |
| | | | |
Distributions to shareholders from: | | | | | | | | |
Net investment income: | | | | | | | | |
Class 1 | | | (15,730,869 | ) | | | (12,783,421 | ) |
Class 2 | | | (79,241,750 | ) | | | (69,990,186 | ) |
Class 4 | | | (2,544,123 | ) | | | (2,230,613 | ) |
Net realized gains: | | | | | | | | |
Class 1 | | | (25,751,420 | ) | | | (46,218,042 | ) |
Class 2 | | | (143,703,429 | ) | | | (288,327,268 | ) |
Class 4 | | | (4,873,893 | ) | | | (9,935,345 | ) |
| | | | |
Total distributions to shareholders | | | (271,845,484 | ) | | | (429,484,875 | ) |
| | | | |
Capital share transactions: (Note 2) | | | | | | | | |
Class 1 | | | 32,173,830 | | | | (54,403,896 | ) |
Class 2 | | | (207,728,869 | ) | | | 110,574,611 | |
Class 4 | | | (1,780,903 | ) | | | (14,522,761 | ) |
| | | | |
Total capital share transactions | | | (177,335,942 | ) | | | 41,647,954 | |
| | | | |
Net increase (decrease) in net assets | | | (100,672,410 | ) | | | 226,306,807 | |
Net assets: | | | | | | | | |
Beginning of year | | | 4,354,228,097 | | | | 4,127,921,290 | |
| | | | |
End of year | | $ | 4,253,555,687 | | | $ | 4,354,228,097 | |
| | | | |
Undistributed net investment income included in net assets: | | | | | | | | |
End of year | | $ | 89,531,283 | | | $ | 88,221,627 | |
| | | | |
| | | | | | |
| | | The accompanying notes are an integral part of these financial statements. | Annual Report | | | MS-21 | |
FRANKLIN TEMPLETON VARIABLE INSURANCE PRODUCTS TRUST
Notes to Financial Statements
Franklin Mutual Shares VIP Fund
1. Organization and Significant Accounting Policies
Franklin Templeton Variable Insurance Products Trust (Trust) is registered under the Investment Company Act of 1940 (1940 Act) as an open-end management investment company, consisting of eighteen separate funds and applies the specialized accounting and reporting guidance in U.S. Generally Accepted Accounting Principles (U.S. GAAP). Franklin Mutual Shares VIP Fund (Fund) is included in this report. Shares of the Fund are generally sold only to insurance company separate accounts to fund the benefits of variable life insurance policies or variable annuity contracts. The Fund offers three classes of shares: Class 1, Class 2 and Class 4. Each class of shares may differ by its distribution fees, voting rights on matters affecting a single class and its exchange privilege.
The following summarizes the Fund’s significant accounting policies.
a. Financial Instrument Valuation
The Fund’s investments in financial instruments are carried at fair value daily. Fair value is the price that would be received to sell an asset or paid to transfer a liability in an orderly transaction between market participants on the measurement date. The Fund calculates the net asset value (NAV) per share as of 4 p.m. Eastern time each day the New York Stock Exchange (NYSE) is open for trading. Under compliance policies and procedures approved by the Trust’s Board of Trustees (the Board), the Fund’s administrator has responsibility for oversight of valuation, including leading the cross-functional Valuation Committee (VC). The VC provides administration and oversight of the Fund’s valuation policies and procedures, which are approved annually by the Board. Among other things, these procedures allow the Fund to utilize independent pricing services, quotations from securities and financial instrument dealers, and other market sources to determine fair value.
Equity securities and derivative financial instruments listed on an exchange or on the NASDAQ National Market System are valued at the last quoted sale price or the official closing price of the day, respectively. Foreign equity securities are valued as of the close of trading on the foreign stock exchange on which the security is primarily traded, or as of 4 p.m. Eastern time. The value is then converted into its U.S. dollar equivalent at the foreign exchange rate in effect at 4 p.m. Eastern time on the day that the value of the security is determined. Over-the-counter
(OTC) securities are valued within the range of the most recent quoted bid and ask prices. Securities that trade in multiple markets or on multiple exchanges are valued according to the broadest and most representative market. Certain equity securities are valued based upon fundamental characteristics or relationships to similar securities.
Debt securities generally trade in the OTC market rather than on a securities exchange. The Fund’s pricing services use multiple valuation techniques to determine fair value. In instances where sufficient market activity exists, the pricing services may utilize a market-based approach through which quotes from market makers are used to determine fair value. In instances where sufficient market activity may not exist or is limited, the pricing services also utilize proprietary valuation models which may consider market characteristics such as benchmark yield curves, credit spreads, estimated default rates, anticipated market interest rate volatility, coupon rates, anticipated timing of principal repayments, underlying collateral, and other unique security features in order to estimate the relevant cash flows, which are then discounted to calculate the fair value.
Investments in open-end mutual funds are valued at the closing NAV.
Certain derivative financial instruments trade in the OTC market. The Fund’s pricing services use various techniques including industry standard option pricing models and proprietary discounted cash flow models to determine the fair value of those instruments. The Fund’s net benefit or obligation under the derivative contract, as measured by the fair value of the contract, is included in net assets.
The Fund has procedures to determine the fair value of financial instruments for which market prices are not reliable or readily available. Under these procedures, the VC convenes on a regular basis to review such financial instruments and considers a number of factors, including significant unobservable valuation inputs, when arriving at fair value. The VC primarily employs a market-based approach which may use related or comparable assets or liabilities, recent transactions, market multiples, book values, and other relevant information for the investment to determine the fair value of the investment. An income-based valuation approach may also be used in which the anticipated future cash flows of the investment are discounted to calculate fair value. Discounts may also be applied due to the nature or duration of any restrictions on the disposition of the investments. Due to the inherent uncertainty of valuations of
FRANKLIN TEMPLETON VARIABLE INSURANCE PRODUCTS TRUST
NOTES TO FINANCIAL STATEMENTS
Franklin Mutual Shares VIP Fund (continued)
such investments, the fair values may differ significantly from the values that would have been used had an active market existed. The VC employs various methods for calibrating these valuation approaches including a regular review of key inputs and assumptions, transactional back-testing or disposition analysis, and reviews of any related market activity.
Trading in securities on foreign securities stock exchanges and OTC markets may be completed before 4 p.m. Eastern time. In addition, trading in certain foreign markets may not take place on every Fund’s business day. Occasionally, events occur between the time at which trading in a foreign security is completed and 4 p.m. Eastern time that might call into question the reliability of the value of a portfolio security held by the Fund. As a result, differences may arise between the value of the Fund’s portfolio securities as determined at the foreign market close and the latest indications of value at 4 p.m. Eastern time. In order to minimize the potential for these differences, the VC monitors price movements following the close of trading in foreign stock markets through a series of country specific market proxies (such as baskets of American Depositary Receipts, futures contracts and exchange traded funds). These price movements are measured against established trigger thresholds for each specific market proxy to assist in determining if an event has occurred that may call into question the reliability of the values of the foreign securities held by the Fund. If such an event occurs, the securities may be valued using fair value procedures, which may include the use of independent pricing services.
When the last day of the reporting period is a non-business day, certain foreign markets may be open on those days that the Fund’s NAV is not calculated, which could result in differences between the value of the Fund’s portfolio securities on the last business day and the last calendar day of the reporting period. Any significant security valuation changes due to an open foreign market are adjusted and reflected by the Fund for financial reporting purposes.
b. Foreign Currency Translation
Portfolio securities and other assets and liabilities denominated in foreign currencies are translated into U.S. dollars based on the exchange rate of such currencies against U.S. dollars on the date of valuation. The Fund may enter into foreign currency exchange contracts to facilitate transactions denominated in a foreign currency. Purchases and sales of securities, income and expense items denominated in foreign currencies are translated
into U.S. dollars at the exchange rate in effect on the transaction date. Portfolio securities and assets and liabilities denominated in foreign currencies contain risks that those currencies will decline in value relative to the U.S. dollar. Occasionally, events may impact the availability or reliability of foreign exchange rates used to convert the U.S. dollar equivalent value. If such an event occurs, the foreign exchange rate will be valued at fair value using procedures established and approved by the Board.
The Fund does not separately report the effect of changes in foreign exchange rates from changes in market prices on securities held. Such changes are included in net realized and unrealized gain or loss from investments in the Statement of Operations.
Realized foreign exchange gains or losses arise from sales of foreign currencies, currency gains or losses realized between the trade and settlement dates on securities transactions and the difference between the recorded amounts of dividends, interest, and foreign withholding taxes and the U.S. dollar equivalent of the amounts actually received or paid. Net unrealized foreign exchange gains and losses arise from changes in foreign exchange rates on foreign denominated assets and liabilities other than investments in securities held at the end of the reporting period.
c. Derivative Financial Instruments
The Fund invested in derivative financial instruments in order to manage risk or gain exposure to various other investments or markets. Derivatives are financial contracts based on an underlying or notional amount, require no initial investment or an initial net investment that is smaller than would normally be required to have a similar response to changes in market factors, and require or permit net settlement. Derivatives contain various risks including the potential inability of the counterparty to fulfill their obligations under the terms of the contract, the potential for an illiquid secondary market, and/or the potential for market movements which expose the Fund to gains or losses in excess of the amounts shown in the Statement of Assets and Liabilities. Realized gain and loss and unrealized appreciation and depreciation on these contracts for the period are included in the Statement of Operations.
Derivative counterparty credit risk is managed through a formal evaluation of the creditworthiness of all potential counterparties. The Fund attempts to reduce its exposure to counterparty credit risk on OTC derivatives, whenever possible,
FRANKLIN TEMPLETON VARIABLE INSURANCE PRODUCTS TRUST
NOTES TO FINANCIAL STATEMENTS
Franklin Mutual Shares VIP Fund (continued)
1. Organization and Significant Accounting
Policies (continued)
c. Derivative Financial Instruments (continued)
by entering into International Swaps and Derivatives Association (ISDA) master agreements with certain counterparties. These agreements contain various provisions, including but not limited to collateral requirements, events of default, or early termination. Termination events applicable to the counterparty include certain deteriorations in the credit quality of the counterparty. Termination events applicable to the Fund include failure of the Fund to maintain certain net asset levels and/or limit the decline in net assets over various periods of time. In the event of default or early termination, the ISDA master agreement gives the non-defaulting party the right to net and close-out all transactions traded, whether or not arising under the ISDA agreement, to one net amount payable by one counterparty to the other. However, absent an event of default or early termination, OTC derivative assets and liabilities are presented gross and not offset in the Statement of Assets and Liabilities. Early termination by the counterparty may result in an immediate payment by the Fund of any net liability owed to that counterparty under the ISDA agreement. At December 31, 2017, the Fund had OTC derivatives in a net liability position of $5,823,760 and the aggregate value of collateral pledged for such contracts was $4,728,007.
Collateral requirements differ by type of derivative. Collateral terms are contract specific for OTC derivatives. Collateral or initial margin requirements are set by the broker or exchange clearing house for exchange traded and centrally cleared derivatives. Initial margin deposited is held at the exchange and can be in the form of cash and/or securities. For OTC derivatives traded under an ISDA master agreement, posting of collateral is required by either the Fund or the applicable counterparty if the total net exposure of all OTC derivatives with the applicable counterparty exceeds the minimum transfer amount, which typically ranges from $100,000 to $250,000, and can vary depending on the counterparty and the type of the agreement. Generally, collateral is determined at the close of Fund business each day and any additional collateral required due to changes in derivative values may be delivered by the Fund or the counterparty the next business day, or within a few business days. Collateral pledged and/or received by the Fund for OTC derivatives, if any, is held in segregated accounts with the Fund’s custodian/counterparty broker and can be in the form of cash and/or securities. Unrestricted cash may be invested
according to the Fund’s investment objectives. To the extent that the amounts due to the Fund from its counterparties are not subject to collateralization or are not fully collateralized, the Fund bears the risk of loss from counterparty non-performance.
The Fund entered into exchange traded futures contracts primarily to manage exposure to certain foreign currencies. A futures contract is an agreement between the Fund and a counterparty to buy or sell an asset at a specified price on a future date. Required initial margins are pledged by the Fund, and the daily change in fair value is accounted for as a variation margin payable or receivable in the Statement of Assets and Liabilities.
The Fund entered into OTC forward exchange contracts primarily to manage exposure to certain foreign currencies. A forward exchange contract is an agreement between the Fund and a counterparty to buy or sell a foreign currency at a specific exchange rate on a future date.
See Note 9 regarding other derivative information.
d. Securities Sold Short
The Fund is engaged in selling securities short, which obligates the Fund to replace a borrowed security with the same security at current fair value. The Fund incurs a loss if the price of the security increases between the date of the short sale and the date on which the Fund replaces the borrowed security. The Fund realizes a gain if the price of the security declines between those dates. Gains are limited to the price at which the Fund sold the security short, while losses are potentially unlimited in size.
The Fund is required to establish a margin account with the broker lending the security sold short. While the short sale is outstanding, the broker retains the proceeds of the short sale to the extent necessary to meet margin requirements until the short position is closed out. A deposit must also be maintained with the Fund’s custodian/counterparty broker consisting of cash and/or securities having a value equal to a specified percentage of the value of the securities sold short. The Fund is obligated to pay fees for borrowing the securities sold short and is required to pay the counterparty any dividends and/or interest due on securities sold short. Such dividends and/or interest and any security borrowing fees are recorded as an expense to the Fund.
FRANKLIN TEMPLETON VARIABLE INSURANCE PRODUCTS TRUST
NOTES TO FINANCIAL STATEMENTS
Franklin Mutual Shares VIP Fund (continued)
e. Securities Lending
The Fund participates in an agency based securities lending program to earn additional income. The Fund receives cash collateral against the loaned securities in an amount equal to at least 102% of the fair value of the loaned securities. Collateral is maintained over the life of the loan in an amount not less than 100% of the fair value of loaned securities, as determined at the close of Fund business each day; any additional collateral required due to changes in security values is delivered to the Fund on the next business day. The collateral is deposited into a joint cash account with other funds and is used to invest in a money market fund managed by Franklin Advisers, Inc., an affiliate of the Fund, and/or a joint repurchase agreement. The Fund may receive income from the investment of cash collateral, in addition to lending fees and rebates paid by the borrower. Income from securities loaned, net of fees paid to the securities lending agent and/or third-party vendor, is reported separately in the Statement of Operations. The Fund bears the market risk with respect to the collateral investment, securities loaned, and the risk that the agent may default on its obligations to the Fund. If the borrower defaults on its obligation to return the securities loaned, the Fund has the right to repurchase the securities in the open market using the collateral received. The securities lending agent has agreed to indemnify the Fund in the event of default by a third party borrower. At December 31, 2017, the Fund had no securities on loan.
f. Senior Floating Rate Interests
The Fund invests in senior secured corporate loans that pay interest at rates which are periodically reset by reference to a base lending rate plus a spread. These base lending rates are generally the prime rate offered by a designated U.S. bank or the London InterBank Offered Rate (LIBOR). Senior secured corporate loans often require prepayment of principal from excess cash flows or at the discretion of the borrower. As a result, actual maturity may be substantially less than the stated maturity. Senior secured corporate loans in which the Fund invests are generally readily marketable, but may be subject to certain restrictions on resale.
g. Income and Deferred Taxes
It is the Fund’s policy to qualify as a regulated investment company under the Internal Revenue Code. The Fund intends to distribute to shareholders substantially all of its taxable income
and net realized gains to relieve it from federal income and if applicable, excise taxes. As a result, no provision for U.S. federal income taxes is required.
The Fund may be subject to foreign taxation related to income received, capital gains on the sale of securities and certain foreign currency transactions in the foreign jurisdictions in which it invests. Foreign taxes, if any, are recorded based on the tax regulations and rates that exist in the foreign markets in which the Fund invests. When a capital gain tax is determined to apply, the Fund records an estimated deferred tax liability in an amount that would be payable if the securities were disposed of on the valuation date.
As a result of several court cases, in certain countries across the European Union, the Fund filed additional tax reclaims for previously withheld taxes on dividends earned in those countries (EU reclaims). These additional filings are subject to various administrative proceedings by the local jurisdictions’ tax authorities within the European Union, as well as a number of related judicial proceedings. Income recognized, if any, for EU reclaims is reflected as other income in the Statement of Operations and any related receivable, if any, is reflected as European Union tax reclaims in the Statement of Assets and Liabilities. When uncertainty exists as to the ultimate resolution of these proceedings, the likelihood of receipt of these EU reclaims, and the potential timing of payment, no amounts are reflected in the financial statements. For U.S. income tax purposes, when EU reclaims are received by the Fund and the Fund previously passed foreign tax credit on to its shareholders, the Fund must either amend historic tax reporting to shareholders or enter into a closing agreement with the Internal Revenue Service (IRS) in order to pay the associated tax liability on behalf of the Fund’s shareholders.
The Fund may recognize an income tax liability related to its uncertain tax positions under U.S. GAAP when the uncertain tax position has a less than 50% probability that it will be sustained upon examination by the tax authorities based on its technical merits. As of December 31, 2017, the Fund has determined that no tax liability is required in its financial statements related to uncertain tax positions for any open tax years (or expected to be taken in future tax years). Open tax years are those that remain subject to examination and are based on the statute of limitations in each jurisdiction in which the Fund invests.
FRANKLIN TEMPLETON VARIABLE INSURANCE PRODUCTS TRUST
NOTES TO FINANCIAL STATEMENTS
Franklin Mutual Shares VIP Fund (continued)
1. Organization and Significant Accounting Policies (continued)
h. Security Transactions, Investment Income, Expenses and Distributions
Security transactions are accounted for on trade date. Realized gains and losses on security transactions are determined on a specific identification basis. Interest income and estimated expenses are accrued daily. Amortization of premium and accretion of discount on debt securities are included in interest income. Dividend income is recorded on the ex-dividend date except for certain dividends from securities where the dividend rate is not available. In such cases, the dividend is recorded as soon as the information is received by the Fund. Distributions to shareholders are recorded on the ex-dividend date. Distributable earnings are determined according to income tax regulations (tax basis) and may differ from earnings recorded in accordance with U.S. GAAP. These differences may be permanent or temporary. Permanent differences are reclassified among capital accounts to reflect their tax character. These reclassifications have no impact on net assets or the results of operations. Temporary differences are not reclassified, as they may reverse in subsequent periods.
Common expenses incurred by the Trust are allocated among the Funds based on the ratio of net assets of each Fund to the combined net assets of the Trust. Fund specific expenses are charged directly to the Fund that incurred the expense.
Realized and unrealized gains and losses and net investment income, excluding class specific expenses, are allocated daily to each class of shares based upon the relative proportion of net assets of each class. Differences in per share distributions by class are generally due to differences in class specific expenses.
i. Accounting Estimates
The preparation of financial statements in accordance with U.S. GAAP requires management to make estimates and assumptions that affect the reported amounts of assets and liabilities at the date of the financial statements and the amounts of income and expenses during the reporting period. Actual results could differ from those estimates.
j. Guarantees and Indemnifications
Under the Trust’s organizational documents, its officers and trustees are indemnified by the Trust against certain liabilities arising out of the performance of their duties to the Trust. Additionally, in the normal course of business, the Trust, on behalf of the Fund, enters into contracts with service providers that contain general indemnification clauses. The Trust’s maximum exposure under these arrangements is unknown as this would involve future claims that may be made against the Trust that have not yet occurred. Currently, the Trust expects the risk of loss to be remote.
2. Shares of Beneficial Interest
At December 31, 2017, there were an unlimited number of shares authorized (without par value). Transactions in the Fund’s shares were as follows:
| | | | | | | | | | | | | | | | | | | | |
| | | Year Ended December 31, | |
| | | 2017 | | | | | | 2016 | |
| | | Shares | | | Amount | | | | | | Shares | | | Amount | |
| | | | | |
| Class 1 Shares: | | | | | | | | | | | | | | | | | | | | |
Shares sold | | | 2,282,225 | | | $ | 47,514,985 | | | | | | | | 2,468,008 | | | $ | 48,112,430 | |
Shares issued in reinvestment of distributions | | | 2,083,490 | | | | 41,482,289 | | | | | | | | 3,058,655 | | | | 59,001,463 | |
Shares redeemed | | | (2,721,619 | ) | | | (56,823,444 | ) | | | | | | | (8,638,060 | ) | | | (161,517,789 | ) |
| | | | |
Net increase (decrease) | | | 1,644,096 | | | $ | 32,173,830 | | | | | | | | (3,111,397 | ) | | $ | (54,403,896 | ) |
| | | | |
| Class 2 Shares: | | | | | | | | | | | | | | | | | | | | |
Shares sold | | | 5,279,163 | | | $ | 107,845,830 | | | | | | | | 19,363,703 | | | $ | 382,884,835 | |
Shares issued in reinvestment of distributions | | | 11,374,754 | | | | 222,945,179 | | | | | | | | 18,848,893 | | | | 358,317,454 | |
Shares redeemed | | | (26,252,304 | ) | | | (538,519,878 | ) | | | | | | | (32,549,983 | ) | | | (630,627,678 | ) |
| | | | |
Net increase (decrease) | | | (9,598,387 | ) | | $ | (207,728,869 | ) | | | | | | | 5,662,613 | | | $ | 110,574,611 | |
| | | | |
FRANKLIN TEMPLETON VARIABLE INSURANCE PRODUCTS TRUST
NOTES TO FINANCIAL STATEMENTS
Franklin Mutual Shares VIP Fund (continued)
| | | | | | | | | | | | | | | | | | | | |
| | | Year Ended December 31, | |
| | | 2017 | | | | | | 2016 | |
| | | Shares | | | Amount | | | | | | Shares | | | Amount | |
| | | | | |
| Class 4 Shares: | | | | | | | | | | | | | | | | | | | | |
Shares sold | | | 730,910 | | | $ | 15,136,184 | | | | | | | | 203,267 | | | $ | 3,894,989 | |
Shares issued in reinvestment of distributions | | | 375,216 | | | | 7,418,016 | | | | | | | | 634,967 | | | | 12,165,958 | |
Shares redeemed | | | (1,172,050 | ) | | | (24,335,103 | ) | | | | | | | (1,564,342 | ) | | | (30,583,708 | ) |
| | | | |
Net increase (decrease) | | | (65,924 | ) | | $ | (1,780,903 | ) | | | | | | | (726,108 | ) | | $ | (14,522,761 | ) |
| | | | |
3. Transactions with Affiliates
Franklin Resources, Inc. is the holding company for various subsidiaries that together are referred to as Franklin Templeton Investments. Certain officers and trustees of the Fund are also officers and/or directors of the following subsidiaries:
| | |
| Subsidiary | | Affiliation |
Franklin Mutual Advisers, LLC (Franklin Mutual) | | Investment manager |
Franklin Templeton Services, LLC (FT Services) | | Administrative manager |
Franklin Templeton Distributors, Inc. (Distributors) | | Principal underwriter |
Franklin Templeton Investor Services, LLC (Investor Services) | | Transfer agent |
a. Management Fees
The Fund pays an investment management fee to Franklin Mutual based on the average daily net assets of the Fund as follows:
| | |
| Annualized Fee Rate | | Net Assets |
0.750% | | Up to and including $200 million |
0.735% | | Over $200 million, up to and including $700 million |
0.700% | | Over $700 million, up to and including $1.2 billion |
0.675% | | Over $1.2 billion, up to and including $5 billion |
0.645% | | Over $5 billion, up to and including $10 billion |
0.625% | | Over $10 billion, up to and including $15 billion |
0.605% | | Over $15 billion, up to and including $20 billion |
0.585% | | In excess of $20 billion |
For the year ended December 31, 2017, the gross effective investment management fee rate was 0.688% of the Fund’s average daily net assets.
b. Administrative Fees
Under an agreement with Franklin Mutual, FT Services provides administrative services to the Fund. The fee is paid by Franklin Mutual based on Fund’s average net assets, and is not an additional expense of the Fund.
c. Distribution Fees
The Board has adopted distribution plans for Class 2 and Class 4 shares pursuant to Rule 12b-1 under the 1940 Act. Under the Fund’s compensation distribution plans, the Fund pays Distributors for costs incurred in connection with the servicing, sale and distribution of the Fund’s shares up to 0.35% per year of its average daily net assets of each class. The Board has agreed to limit the current rate to 0.25% per year for Class 2. The plan year, for purposes of monitoring compliance with the maximum annual plan rates, is February 1 through January 31.
FRANKLIN TEMPLETON VARIABLE INSURANCE PRODUCTS TRUST
NOTES TO FINANCIAL STATEMENTS
Franklin Mutual Shares VIP Fund (continued)
3. Transactions with Affiliates (continued)
d. Transfer Agent Fees
Investor Services, under terms of an agreement, performs shareholder servicing for the Fund and is not paid by the Fund for the services.
e. Investments in Affiliated Management Investment Companies
The Fund invests in one or more affiliated management investment companies for purposes other than exercising a controlling influence over the management or policies. Management fees paid by the Fund are waived on assets invested in the affiliated management investment companies, as noted in the Statement of Operations, in an amount not to exceed the management and administrative fees paid directly or indirectly by each affiliate. During the year ended December 31, 2017, the Fund held investments in affiliated management investment companies as follows:
| | | | | | | | | | | | | | | | | | | | | | | | | | | | | | | | |
| | | Number of Shares
Held at
Beginning
of Year | | | Gross
Additions | | | Gross
Reductions | | | Number
of Shares
Held at
End of
Year | | | Value at
End of
Year | | | Dividend
Income | | | Realized
Gain
(Loss) | | | Net Change in
Unrealized
Appreciation
(Depreciation) | |
| Non-Controlled Affiliates | | | | | | | | | | | | | | | | | | | | | | | | | | | | | | | | |
Institutional Fiduciary Trust Money Market Portfolio, 0.89% | | | — | | | | 217,627,000 | | | | (217,627,000 | ) | | | — | | | $ | — | | | $ | — | | | $ | — | | | $ | — | |
| | | | | | | | | | | | | | | | | | | | |
f. Other Affiliated Transactions
At December 31, 2017, Franklin Templeton Variable Insurance Products Trust – Franklin Founding Funds Allocation VIP Fund owned 7.8% of the Fund’s outstanding shares.
4. Expense Offset Arrangement
The Fund has entered into an arrangement with its custodian whereby credits realized as a result of uninvested cash balances are used to reduce a portion of the Fund’s custodian expenses. During the year ended December 31, 2017, the custodian fees were reduced as noted in the Statement of Operations.
5. Income Taxes
The tax character of distributions paid during the years ended December 31, 2017 and 2016, was as follows:
| | | | | | | | |
| | | 2017 | | | 2016 | |
Distributions paid from: | | | | | | | | |
Ordinary income | | $ | 129,070,184 | | | $ | 96,662,744 | |
Long term capital gain | | | 142,775,300 | | | | 332,822,131 | |
| | | | |
| | $ | 271,845,484 | | | $ | 429,484,875 | |
| | | | |
FRANKLIN TEMPLETON VARIABLE INSURANCE PRODUCTS TRUST
NOTES TO FINANCIAL STATEMENTS
Franklin Mutual Shares VIP Fund (continued)
At December 31, 2017, the cost of investments, net unrealized appreciation (depreciation), undistributed ordinary income and undistributed long term capital gains for income tax purposes were as follows:
| | | | |
Cost of investments | | $ | 3,253,802,491 | |
| | | | |
Unrealized appreciation | | $ | 1,247,621,289 | |
Unrealized depreciation | | | (260,039,708 | ) |
| | | | |
Net unrealized appreciation (depreciation) | | $ | 987,581,581 | |
| | | | |
Undistributed ordinary income | | $ | 94,042,307 | |
Undistributed long term capital gains | | | 144,824,979 | |
| | | | |
Distributable earnings | | $ | 238,867,286 | |
| | | | |
Differences between income and/or capital gains as determined on a book basis and a tax basis are primarily due to differing treatments of foreign currency transactions, defaulted securities and wash sales.
6. Investment Transactions
Purchases and sales of investments (excluding short term securities and securities sold short) for the year ended December 31, 2017, aggregated $735,233,677 and $966,513,173, respectively.
7. Credit Risk and Defaulted Securities
The Fund may purchase the pre-default or defaulted debt of distressed companies. Distressed companies are financially troubled and could be or are already involved in financial restructuring or bankruptcy. Risks associated with purchasing these securities include the possibility that the bankruptcy or other restructuring process takes longer than expected, or that distributions in restructuring are less than anticipated, either or both of which may result in unfavorable consequences to the Fund. If it becomes probable that the income on debt securities, including those of distressed companies, will not be collected, the Fund discontinues accruing income and recognizes an adjustment for uncollectible interest.
At December 31, 2017, the aggregate long value of distressed company securities for which interest recognition has been discontinued was $10,434,240 representing 0.3% of the Fund’s net assets. For information as to specific securities, see the accompanying Statement of Investments.
8. Restricted Securities
The Fund invests in securities that are restricted under the Securities Act of 1933 (1933 Act). Restricted securities are often purchased in private placement transactions, and cannot be sold without prior registration unless the sale is pursuant to an exemption under the 1933 Act. Disposal of these securities may require greater effort and expense, and prompt sale at an acceptable price may be difficult. The Fund may have registration rights for restricted securities. The issuer generally incurs all registration costs.
At December 31, 2017, investments in restricted securities, excluding securities exempt from registration under the 1933 Act deemed to be liquid, were as follows:
| | | | | | | | | | | | | | |
Principal Amount/ Shares | | Issuer | | Acquisition Date | | | Cost | | | Value | |
| 1,754 | | Broadband Ventures III LLC, secured promissory note, 5.00%, 2/01/12 | | | 7/01/10 - 11/30/12 | | | $ | 1,754 | | | $ | — | |
| 6,400,507 | | CB FIM Coinvestors LLC. | | | 1/15/09 - 6/02/09 | | | | — | | | | — | |
FRANKLIN TEMPLETON VARIABLE INSURANCE PRODUCTS TRUST
NOTES TO FINANCIAL STATEMENTS
Franklin Mutual Shares VIP Fund (continued)
8. Restricted Securities (continued)
| | | | | | | | | | | | | | |
Principal Amount/ Shares | | Issuer | | Acquisition Date | | | Cost | | | Value | |
| 8,006,950 | | FIM Coinvestor Holdings I, LLC | | | 11/20/06 - 6/02/09 | | | $ | — | | | $ | — | |
| 1,730,515 | | International Automotive Components Group Brazil LLC | | | 4/13/06 - 12/26/08 | | | | 1,149,241 | | | | 59,331 | |
| 15,382,424 | | International Automotive Components Group North America LLC | | | 1/12/06 - 3/18/13 | | | | 12,591,586 | | | | 10,133,556 | |
| | | | | | | | | | |
| | Total Restricted Securities (Value is 0.2% of Net Assets) | | | | | | $ | 13,742,581 | | | $ | 10,192,887 | |
| | | | | | | | | | |
9. Other Derivative Information
At December 31, 2017, the Fund’s investments in derivative contracts are reflected in the Statement of Assets and Liabilities as follows:
| | | | | | | | | | | | |
| | | Asset Derivatives | | | Liability Derivatives | |
Derivative Contracts Not Accounted for as Hedging Instruments | | Statement of Assets and
Liabilities Location | | Fair Value | | | Statement of Assets and
Liabilities Location | | Fair Value | |
Foreign exchange contracts | | Variation margin on futures contracts | | $ | — | | | Variation margin on futures contracts | | $
| 2,095,398a
|
|
| | Unrealized appreciation on OTC forward exchange contracts | | | 172,027 | | | Unrealized depreciation on OTC forward exchange contracts | | | 5,995,787 | |
| | | | | | | | | | | | |
Totals | | | | $ | 172,027 | | | | | $ | 8,091,185 | |
| | | | | | | | | | | | |
aThis amount reflects the cumulative appreciation (depreciation) of futures contracts as reported in the Statement of Investments. Only the variation margin receivable/ payable at year end is separately reported within the Statement of Assets and Liabilities. Prior variation margin movements were recorded to cash upon receipt or payment.
For the year ended December 31, 2017, the effect of derivative contracts in the Fund’s Statement of Operations was as follows:
| | | | | | | | | | | | |
Derivative Contracts Not Accounted for as Hedging Instruments | | Statement of Operations Location | | Net Realized Gain (Loss) for the Year | | | Statement of Operations Location | | Net Change in Unrealized Appreciation (Depreciation) for the Year | |
| | Net realized gain (loss) from: | | | | | | Net change in unrealized appreciation (depreciation) on: | | | | |
Foreign exchange contracts | | Forward exchange contracts | | $ | (19,285,260 | ) | | Forward exchange contracts | | $ | (9,236,738 | ) |
| | Futures contracts | | | (11,685,578 | ) | | Futures contracts | | | (4,720,495 | ) |
| | | | | | | | | | | | |
Totals | | | | $ | (30,970,838 | ) | | | | $ | (13,957,233 | ) |
| | | | | | | | | | | | |
For the year ended December 31, 2017, the average month end notional amount of futures contracts represented $176,696,050. The average month end contract value of forward exchange contracts was $298,156,571.
See Notes 1(c) regarding derivative financial instruments.
FRANKLIN TEMPLETON VARIABLE INSURANCE PRODUCTS TRUST
NOTES TO FINANCIAL STATEMENTS
Franklin Mutual Shares VIP Fund (continued)
10. Holdings of 5% Voting Securities of Portfolio Companies
The 1940 Act defines “affiliated companies” to include investments in portfolio companies in which a fund owns 5% or more of the outstanding voting securities. During the year ended December 31, 2017, investments in “affiliated companies” were as follows:
| | | | | | | | | | | | | | | | | | | | | | | | | | | | | | | | |
| Name of Issuer | | Number of Shares Held at Beginning of Year | | | Gross Additions | | | Gross Reductions | | | Number of Shares Held at End of Year | | | Value at End of Year | | | Dividend Income | | | Realized Gain (Loss) | | | Net Change in Unrealized Appreciation (Depreciation) | |
| Non-Controlled Affiliates | | | | | | | | | | | | | | | | | | | | | |
CB FIM Coinvestors LLC (Value is 0.0% of Net Assets) | | | 6,400,507 | | | | — | | | | — | | | | 6,400,507 | | | $ | — | | | $ | — | | | $ | — | | | $ | — | |
| | | | | | | | | | | | | | | | | | | | |
11. Credit Facility
The Fund, together with other U.S. registered and foreign investment funds (collectively, Borrowers), managed by Franklin Templeton Investments, are borrowers in a joint syndicated senior unsecured credit facility totaling $2 billion (Global Credit Facility) which matured on February 9, 2018. This Global Credit Facility provides a source of funds to the Borrowers for temporary and emergency purposes, including the ability to meet future unanticipated or unusually large redemption requests. Effective February 9, 2018, the Borrowers renewed the Global Credit Facility for a one year term, maturing February 8, 2019, for a total of $2 billion.
Under the terms of the Global Credit Facility, the Fund shall, in addition to interest charged on any borrowings made by the Fund and other costs incurred by the Fund, pay its share of fees and expenses incurred in connection with the implementation and maintenance of the Global Credit Facility, based upon its relative share of the aggregate net assets of all of the Borrowers, including an annual commitment fee of 0.15% based upon the unused portion of the Global Credit Facility. These fees are reflected in other expenses in the Statement of Operations. During the year ended December 31, 2017, the Fund did not use the Global Credit Facility.
12. Fair Value Measurements
The Fund follows a fair value hierarchy that distinguishes between market data obtained from independent sources (observable inputs) and the Fund’s own market assumptions (unobservable inputs). These inputs are used in determining the value of the Fund’s financial instruments and are summarized in the following fair value hierarchy:
| | • | | Level 1 – quoted prices in active markets for identical financial instruments |
| | • | | Level 2 – other significant observable inputs (including quoted prices for similar financial instruments, interest rates, prepayment speed, credit risk, etc.) |
| | • | | Level 3 – significant unobservable inputs (including the Fund’s own assumptions in determining the fair value of financial instruments) |
The input levels are not necessarily an indication of the risk or liquidity associated with financial instruments at that level.
For movements between the levels within the fair value hierarchy, the Fund has adopted a policy of recognizing the transfers as of the date of the underlying event which caused the movement.
FRANKLIN TEMPLETON VARIABLE INSURANCE PRODUCTS TRUST
NOTES TO FINANCIAL STATEMENTS
Franklin Mutual Shares VIP Fund (continued)
12. Fair Value Measurements (continued)
A summary of inputs used as of December 31, 2017, in valuing the Fund’s assets and liabilities carried at fair value, is as follows:
| | | | | | | | | | | | | | | | |
| | | Level 1 | | | Level 2 | | | Level 3 | | | Total | |
| | | | |
| Assets: | | | | | | | | | | | | | | | | |
Investments in Securities:a | | | | | | | | | | | | | | | | |
Equity Investments:b | | | | | | | | | | | | | | | | |
Auto Components | | $ | 20,440,534 | | | $ | — | | | $ | 10,192,887 | | | $ | 30,633,421 | |
Machinery | | | 58,125,651 | | | | 24,723,767 | | | | — | | | | 82,849,418 | |
Software | | | 258,546,133 | | | | — | | | | 155,736 | | | | 258,701,869 | |
All Other Equity Investments | | | 3,491,230,820 | | | | — | | | | — | c | | | 3,491,230,820 | |
Corporate Notes and Senior Floating Rate Interests | | | — | | | | 120,761,377 | | | | — | | | | 120,761,377 | |
Corporate Notes and Senior Floating Rate Interests in Reorganization | | | — | | | | 10,434,240 | | | | — | c | | | 10,434,240 | |
Companies in Liquidation | | | — | | | | 5,109,188 | | | | 1,507,147 | c | | | 6,616,335 | |
Short Term Investments | | | 249,208,982 | | | | 25,000,000 | | | | — | | | | 274,208,982 | |
| | | | |
Total Investments in Securities | | $ | 4,077,552,120 | | | $ | 186,028,572 | | | $ | 11,855,770 | | | $ | 4,275,436,462 | |
| | | | |
Other Financial Instruments: | | | | | | | | | | | | | | | | |
Forward Exchange Contracts | | $ | — | | | $ | 172,027 | | | $ | — | | | $ | 172,027 | |
| | | | |
| | | | |
| Liabilities: | | | | | | | | | | | | | | | | |
Other Financial Instruments: | | | | | | | | | | | | | | | | |
Securities Sold Short | | $ | 26,139,611 | | | $ | — | | | $ | — | | | $ | 26,139,611 | |
Futures Contracts | | | 2,095,398 | | | | — | | | | — | | | | 2,095,398 | |
Forward Exchange Contracts | | | — | | | | 5,995,787 | | | | — | | | | 5,995,787 | |
| | | | |
Total Other Financial Instruments | | $ | 28,235,009 | | | $ | 5,995,787 | | | $ | — | | | $ | 34,230,796 | |
| | | | |
aFor detailed categories, see the accompanying Statement of Investments.
bIncludes common stocks, management investment companies as well as other equity investments.
cIncludes securities determined to have no value at December 31, 2017.
A reconciliation of assets in which Level 3 inputs are used in determining fair value is presented when there are significant Level 3 financial instruments at the beginning and/or end of the year.
13. Subsequent Events
The Fund has evaluated subsequent events through the issuance of the financial statements and determined that no events have occurred that require disclosure other than those already disclosed in the financial statements.
Abbreviations
| | | | | | | | | | |
| Counterparty | | Currency | | Selected Portfolio |
| | | | | |
| BOFA | | Bank of America Corp. | | EUR | | Euro | | ADR | | American Depositary Receipt |
| | | | | |
| HSBK | | HSBC Bank PLC | | GBP | | British Pound | | DIP | | Debtor-In-Possession |
| | | | | |
| UBSW | | UBS AG | | USD | | United States Dollar | | FHLB | | Federal Home Loan Bank |
| | | | | |
| | | | | | | | LIBOR | | London InterBank Offered Rate |
| | | | | |
| | | | | | | | REIT | | Real Estate Investment Trust |
| | | | | |
| | | | | | | | TRA | | Tax Receivable Agreement Right |
FRANKLIN TEMPLETON VARIABLE INSURANCE PRODUCTS TRUST
Report of Independent Registered Public Accounting Firm
To the Board of Trustees of Franklin Templeton Variable Insurance Products Trust and Shareholders of Franklin Mutual Shares VIP Fund
Opinion on the Financial Statements
We have audited the accompanying statement of assets and liabilities, including the statement of investments, of Franklin Mutual Shares VIP Fund (the “Fund”) as of December 31, 2017, the related statement of operations for the year ended December 31, 2017, the statement of changes in net assets for each of the two years in the period ended December 31, 2017, including the related notes, and the financial highlights for each of the five years in the period ended December 31, 2017 (collectively referred to as the “financial statements”). In our opinion, the financial statements present fairly, in all material respects, the financial position of the Fund as of December 31, 2017, the results of its operations for the year then ended, the changes in its net assets for each of the two years in the period ended December 31, 2017 and the financial highlights for each of the five years in the period ended December 31, 2017 in conformity with accounting principles generally accepted in the United States of America.
Basis for Opinion
These financial statements are the responsibility of the Fund’s management. Our responsibility is to express an opinion on the Fund’s financial statements based on our audits. We are a public accounting firm registered with the Public Company Accounting Oversight Board (United States) (“PCAOB”) and are required to be independent with respect to the Fund in accordance with the U.S. federal securities laws and the applicable rules and regulations of the Securities and Exchange Commission and the PCAOB.
We conducted our audits of these financial statements in accordance with the standards of the PCAOB. Those standards require that we plan and perform the audit to obtain reasonable assurance about whether the financial statements are free of material misstatement, whether due to error or fraud.
Our audits included performing procedures to assess the risks of material misstatement of the financial statements, whether due to error or fraud, and performing procedures that respond to those risks. Such procedures included examining, on a test basis, evidence regarding the amounts and disclosures in the financial statements. Our audits also included evaluating the accounting principles used and significant estimates made by management, as well as evaluating the overall presentation of the financial statements. Our procedures included confirmation of securities owned as of December 31, 2017 by correspondence with the custodian and brokers; when replies were not received from brokers, we performed other auditing procedures. We believe that our audits provide a reasonable basis for our opinion.
PricewaterhouseCoopers LLP
San Francisco, California
February 15, 2018
We have served as the auditor of one or more investment companies in the Franklin Templeton Group of Funds since 1948.
FRANKLIN TEMPLETON VARIABLE INSURANCE PRODUCTS TRUST
Tax Information (unaudited)
Franklin Mutual Shares VIP Fund
Under Section 852(b)(3)(C) of the Internal Revenue Code (Code), the Fund hereby reports the maximum amount allowable but no less than $142,775,300 as a long term capital gain dividend for the fiscal year ended December 31, 2017.
Under Section 854(b)(1)(A) of the Code, the Fund hereby reports 59.27% of the ordinary income dividends as income qualifying for the dividends received deduction for the fiscal year ended December 31, 2017.
Franklin Rising Dividends VIP Fund
This annual report for Franklin Rising Dividends VIP Fund covers the fiscal year ended December 31, 2017.
Class 2 Performance Summary as of December 31, 2017
Average annual total return of Class 2 shares* represents the average annual change in value, assuming reinvestment of dividends and capital gains. Average returns smooth out variations in returns, which can be significant; they are not the same as year-by-year results.
| | | | | | | | | | | | |
| Periods ended 12/31/17 | | 1-Year | | | 5-Year | | | 10-Year | |
Average Annual Total Return | | | +20.56% | | | | +13.70% | | | | +8.82% | |
*The Fund has a fee waiver associated with any investment it makes in a Franklin Templeton money fund and/or other Franklin Templeton fund, contractually guaranteed through 4/30/18. Fund investment results reflect the fee waiver; without this waiver, the results would have been lower.
Performance reflects the Fund’s Class 2 operating expenses, but does not include any contract fees, expenses or sales charges. If they had been included, performance would be lower. These charges and deductions, particularly for variable life policies, can have a significant effect on contract values and insurance benefits. See the contract prospectus for a complete description of these expenses, including sales charges.
Performance data represent past performance, which does not guarantee future results. Investment return and principal value will fluctuate, and you may have a gain or loss when you sell your shares. Current performance may differ from figures shown.
Total Return Index Comparison for a Hypothetical $10,000 Investment (1/1/08–12/31/17)
The graph below shows the change in value of a hypothetical $10,000 investment in the Fund over the indicated period and includes reinvestment of any income or distributions. The Fund’s performance* is compared to the performance of the Standard & Poor’s® 500 Index (S&P 500®). One cannot invest directly in an index, and an index is not representative of the Fund’s portfolio. Please see Important Notes to Performance Information preceding the Fund Summaries.
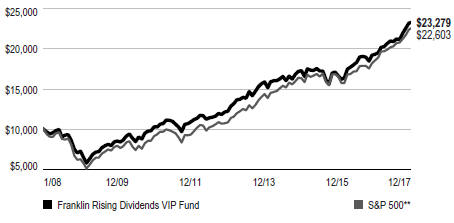
**Source: Morningstar. Please see Index Descriptions following the Fund Summaries.
FRANKLIN RISING DIVIDENDS VIP FUND
Fund Goal and Main Investments
The Fund seeks long-term capital appreciation, with preservation of capital as an important consideration. Preservation of capital, while not a goal, is also an important consideration. Under normal market conditions, the Fund invests at least 80% of its net assets in equity securities of financially sound companies that have paid consistently rising dividends.
Fund Risks
All investments involve risks, including possible loss of principal. Value securities may not increase in price as anticipated or may decline further in value. For stocks paying dividends, dividends are not guaranteed, and can increase, decrease or be totally eliminated without notice. Securities issued by smaller and midsize companies may be more volatile in price than those of larger companies, involve substantial risks and should be considered speculative. To the extent that the Fund focuses on particular countries, regions, industries, sectors or types of investment from time to time, the Fund may be subject to greater risks of adverse developments in such areas of focus than a fund that invests in a wider variety of countries, regions, industries, sectors or investments. Foreign investing carries additional risks such as currency and market volatility and political or social instability, risks that are heightened in developing countries. The Fund is actively managed but there is no guarantee that the manager’s investment decisions will produce the desired results. The Fund’s prospectus also includes a description of the main investment risks.
Performance Overview
You can find the Fund’s one-year total return in the Performance Summary. In comparison, the S&P 500 rose +21.83% for the same period.1 Please note the Fund employs a bottom-up stock selection process, and the managers invest in securities without regard to benchmark comparisons.
Economic and Market Overview
The US economy grew during the 12 months under review. After strengthening in 2017’s second and third quarters, the economy moderated in the fourth quarter. The economy grew faster in 2017 than in 2016, however, largely due to growth in
consumer spending, business investment and exports. The manufacturing and services sectors expanded during the period. The unemployment rate declined from 4.7% in December 2016 to 4.1% at period-end.2 Monthly retail sales were volatile but positive on average during the period. Annual inflation, as measured by the Consumer Price Index, was 2.1% in December 2016, and while it varied over the 12-month period, remained unchanged at period-end.2
The US Federal Reserve (Fed) raised its target range for the federal funds rate 0.25% at its March and June 2017 meetings, amid signs of a growing US economy, strengthening labor market and improving business spending. At its December meeting, the Fed raised its target range for the federal funds rate 0.25% to 1.25%–1.50%, as widely anticipated by the market. The Fed also confirmed that the monthly balance sheet reduction would increase from $10 billion to $20 billion beginning in January 2018.
US equity markets rose during the 12-month period, benefiting from mostly upbeat economic data, better US corporate earnings and improving global economic growth. Concerns about the terms of the UK’s exit from the European Union (EU), political uncertainty in the US, tensions between the US and North Korea, and the progress of US health care and tax reform plans curbed market sentiment at times. However, the markets were also supported by investor optimism arising from pro-growth and pro-business policy plans in the US, the prospect for reforms in the EU with Emmanuel Macron’s election as France’s president, and the US Fed chair’s comments indicating optimism about the US economy and the likelihood of gradual rate hikes. Furthermore, the Senate’s approval of a budget plan in October and subsequent passage of a tax reform bill near period-end drove many US equity indexes to end 2017 near record highs. In this environment, the broad US stock market, as measured by the S&P 500 Index, generated a +21.83% total return for the period.1
Investment Strategy
We are a research-driven, fundamental investment adviser, pursuing a disciplined value-oriented strategy. As bottom-up investors concentrating primarily on individual securities, we seek fundamentally sound companies that we believe meet our screening criteria, which include consistent, substantial
1. Source: Morningstar. One cannot invest directly in an index, and an index is not representative of the Fund’s portfolio. Please see Index Descriptions following the Fund Summaries.
2. Source: Bureau of Labor Statistics.
The dollar value, number of shares or principal amount, and names of all portfolio holdings are listed in the Fund’s Statement of Investments (SOI).
FRANKLIN RISING DIVIDENDS VIP FUND
dividend increases; reinvested earnings; and strong balance sheets. We attempt to acquire such stocks at attractive prices, often when they are out of favor with other investors. In following these criteria, we do not necessarily focus on companies whose securities pay a high dividend but rather on companies that consistently raise their dividends.
Manager’s Discussion
During the fiscal year ended December 31, 2017, some holdings that contributed to absolute performance included Albemarle, Microsoft and Roper Technologies.
Shares of Albemarle, a specialty chemicals producer, experienced strong growth during the period as the company continued to report solid performance in its lithium business. Periodic market concerns regarding the possibility of excess lithium supply were more than offset by the industry consensus that pointed to demand outpacing supply growth. Analysts believe that demand for lithium battery technology could benefit from growth in electric vehicles. Management continued to focus on expanding the company’s market-leading position in lithium. The company has increased its dividend for 23 consecutive years.
Microsoft, a software and information technology (IT) services company, saw its shares move higher in 2017 as the company’s cloud-based initiatives continued to deliver solid results, led by Office 365 subscriber growth and Azure revenue growth. Additionally, prudent expense management and better margins in the hardware business led to better operating results and earnings-per-share growth, which exceeded consensus expectations. The company has raised its dividend for 14 consecutive years.
Roper Technologies, a diversified industrial company, enjoyed significant stock price appreciation in 2017 after reporting robust financial results during the period. The company posted strong organic growth across all four of its segments, with the industrial technology and energy segments leading the way. This performance drove better-than-expected operating results. The company is confident about its business plans heading into 2018 and expects to continue to achieve strong operating results. The company has grown its dividend for 25 consecutive years.
Conversely, some holdings that detracted from absolute performance included Schlumberger, Matthews International and Walgreens Boots Alliance.
Shares of Schlumberger, a global oilfield services company, were weak during the period due to ongoing industry
Portfolio Composition
Based on Total Net Assets as of 12/31/17
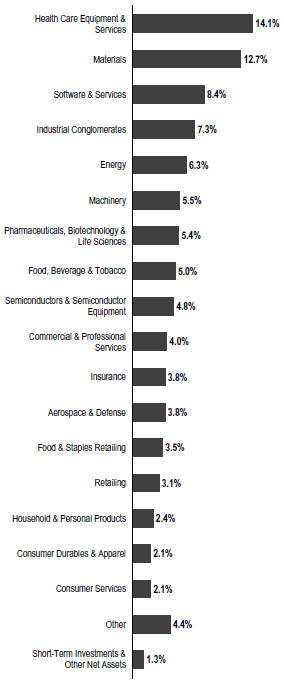
uncertainty about oil inventory surpluses and the prospect of a sustainable recovery in oil prices. Activity in the oil and gas services industry typically lags that of oil and gas producers, and the current concerns about the sustainability of production
FRANKLIN RISING DIVIDENDS VIP FUND
activity has led to cautious sentiment about services companies. Schlumberger continued to perform well despite a challenging environment, and we believe that it could be well-positioned to benefit from the recent oil price recovery. The company has raised its dividend for five consecutive years.
Shares of Matthews International, a small industrial conglomerate, declined steadily during the fiscal year. Mixed performance, with several lackluster quarters driven by weakness in casket sales and softer North American and European markets for the SGK segment hurt earnings. We believe that possible stabilization in these markets, as well as possible innovation and new market-driven growth opportunities, could position Matthews for better performance going forward. In addition, we believe the company’s lower operating expenses going forward could improve profitability. Matthews has raised its dividend for 23 consecutive years.
Shares of Walgreens Boots Alliance, a retail drugstore operator, declined in the latter half of the period due to investor concerns about Amazon entering the retail pharmacy industry. The company’s proposed acquisition of Rite Aid, which experienced significant delays and changes, were finalized in 2017. The Rite Aid integration process now underway could, in our opinion, start to deliver on synergies and improve store productivity. Also, the company’s beauty assortment and health care services initiatives could drive growth and improve profitability. Walgreens has increased its dividend for 42 years.
During the period, the Fund initiated a new position in Comcast, a telecommunications conglomerate (nine consecutive years of dividend increases). We added to existing positions including Analog Devices, an integrated circuits manufacturer (14 consecutive years of dividend increases), Accenture, a management consultant and professional services company (12 consecutive years of dividend increases) and Texas Instruments, a semiconductor designer and manufacturer (14 consecutive years of dividend increases), among others.
We exited positions in Hillenbrand, Qualcomm and Bemis, among others. We also reduced several holdings including Dover, United Technologies and Arthur J Gallagher & Company during the period.
Our 10 largest positions on December 31, 2017, represented 35.0% of the Fund’s total net assets. It is interesting to note how these 10 companies would respond to the Fund’s screening criteria based on a simple average of statistical measures. On average, these 10 companies have raised their dividends 29 years in a row and by 267% over the past 10 years. Their most recent year-over-year dividend increases averaged 8.4%
| | | | |
| Top 10 Holdings | | | |
| 12/31/17 | | | |
Company Sector/Industry | | % of Total
Net Assets | |
Microsoft Corp.
Software & Services | | | 5.0% | |
Albemarle Corp. Materials | | | 4.6% | |
Roper Technologies Inc.
Industrial Conglomerates | | | 4.6% | |
Stryker Corp.
Health Care Equipment & Services | | | 3.4% | |
Praxair Inc.
Materials | | | 3.2% | |
Becton, Dickinson and Co.
Health Care Equipment & Services | | | 3.2% | |
Accenture PLC
Software & Services | | | 2.8% | |
Air Products and Chemicals Inc.
Materials | | | 2.8% | |
West Pharmaceutical Services Inc.
Health Care Equipment & Services | | | 2.8% | |
Dover Corp.
Machinery | | | 2.6% | |
with a yield of 1.5% on December 31, 2017, and a dividend payout ratio of 34.4%, based on estimates of calendar year 2018 operating earnings estimates. The average price/earnings ratio was 24.1 times calendar year 2018 estimates versus 18.3 for that of the unmanaged S&P 500.
Thank you for your participation in Franklin Rising Dividends VIP Fund. We look forward to continuing to serve your investment needs.
The foregoing information reflects our analysis, opinions and portfolio holdings as of December 31, 2017, the end of the reporting period. The way we implement our main investment strategies and the resulting portfolio holdings may change depending on factors such as market and economic conditions. These opinions may not be relied upon as investment advice or an offer for a particular security. The information is not a complete analysis of every aspect of any market, country, industry, security or the Fund. Statements of fact are from sources considered reliable, but the investment manager makes no representation or warranty as to their completeness or accuracy. Although historical performance is no guarantee of future results, these insights may help you understand our investment management philosophy.
FRANKLIN RISING DIVIDENDS VIP FUND
Class 2 Fund Expenses
As an investor in a variable insurance contract (Contract) that indirectly provides for investment in an underlying mutual fund, you can incur transaction and/or ongoing expenses at both the Fund level and the Contract Level: (1) transaction expenses can include sales charges (loads) on purchases, surrender fees, transfer fees and premium taxes; and (2) ongoing expenses can include management fees, distribution and service (12b-1) fees, contract fees, annual maintenance fees, mortality and expense risk fees and other fees and expenses. All mutual funds and Contracts have some types of ongoing expenses. The table below shows Fund-level ongoing expenses and can help you understand these costs and compare them with those of other mutual funds offered through the Contract. The table assumes a $1,000 investment held for the six months indicated. Please refer to the Fund prospectus for additional information on operating expenses.
Actual Fund Expenses
The table below provides information about the actual account values and actual expenses in the columns under the heading “Actual.” In these columns the Fund’s actual return, which includes the effect of ongoing Fund expenses but does not include the effect of ongoing Contract expenses, is used to calculate the “Ending Account Value.” You can estimate the Fund-level expenses you paid during the period by following these steps (of course, your account value and expenses will differ from those in this illustration): Divide your account value by $1,000 (if your account had an $8,600 value, then $8,600 ÷ $1,000 = 8.6). Then multiply the result by the number under the headings “Actual” and “Fund-Level Expenses Paid During Period” (if Fund-Level Expenses Paid During Period were $ 7.50, then 8.6 x $7.50 = $64.50). In this illustration, the estimated expenses paid this period at the Fund level are $64.50.
Hypothetical Example for Comparison with Other Mutual Funds
Under the heading “Hypothetical” in the table, information is provided about hypothetical account values and hypothetical expenses based on the Fund’s actual expense ratio and an assumed rate of return of 5% per year before expenses, which is not the Fund’s actual return. This information may not be used to estimate the actual ending account balance or expenses you paid for the period, but it can help you compare ongoing costs of investing in the Fund with those of other mutual funds offered through the Contract. To do so, compare this 5% hypothetical example with the 5% hypothetical examples that appear in the shareholder reports of other funds offered through the Contract.
Please note that expenses shown in the table are meant to highlight ongoing costs at the Fund level only and do not reflect any ongoing expenses at the Contract level, or transaction expenses at either the Fund or Contract levels. In addition, while the Fund does not have transaction expenses, if the transaction and ongoing expenses at the Contract level were included, the expenses shown below would be higher. You should consult your Contract prospectus or disclosure document for more information.
| | | | | | | | | | | | | | | | | | | | | | | | | | |
| | | | | | Actual (actual return after expenses) | | | | | Hypothetical (5% annual return before expenses) | | | | |
| Share Class | |
| Beginning Account
Value 7/1/17 |
| |
| Ending Account
Value 12/31/17 |
| |
| Fund-Level Expenses
Paid During Period
7/1/17–12/31/17 |
1,2 | | | |
| Ending Account
Value 12/31/17 |
| |
| Fund-Level Expenses
Paid During Period
7/1/17–12/31/171,2 |
| |
| Net
Annualized
Expense
Ratio2 |
|
Class 2 | | $ | 1,000 | | | $ | 1,114.30 | | | $ | 4.64 | | | | | $ | 1,020.82 | | | $ | 4.43 | | | | 0.87 | % |
1. Expenses are equal to the annualized expense ratio for the six-month period as indicated above—in the far right column—multiplied by the simple average account value over the period indicated, and then multiplied by 184/365 to reflect the one-half year period.
2. Reflects expenses after fee waivers and expense reimbursements. Does not include any ongoing expenses of the Contract for which the Fund is an investment option or acquired fund fees and expenses.
FRD1 P1 P2 P4 06/17
SUPPLEMENT DATED JUNE 8, 2017
TO THE PROSPECTUSES
DATED MAY 1, 2017
OF
FRANKLIN RISING DIVIDENDS VIP FUND
(a series of Franklin Templeton Variable Insurance Products Trust)
Effective June 30, 2017, the Prospectus is amended as follows:
I. The section in the Fund Summary under the heading “Portfolio Managers” on page FRD-S4 is revised as follows:
Portfolio Managers
Donald G. Taylor, CPA President and Chief Investment Officer of Advisory Services and portfolio manager of the Fund since 1996.
Nicholas P. B. Getaz, CFA Research Analyst of Advisory Services and portfolio manager of the Fund since 2014.
II. In the Fund Details, under the heading “Management”, the portfolio manager information on page FRD-D6 is revised as follows:
Franklin Advisory Services, LLC (Advisory Services), 101 John F. Kennedy Parkway, Short Hills, NJ 07078, is the Fund’s investment manager.
The Fund is managed by a team of dedicated professionals focused on investments that have paid rising dividends. The portfolio managers of the team are as follows:
Donald G. Taylor, CPA
President and Chief Investment Officer of Advisory Services
Mr. Taylor has been the lead portfolio manager of the Fund since 1996. He has primary responsibility for the investments of the Fund. He has final authority over all aspects of the Fund’s investment portfolio, including but not limited to, purchases and sales of individual securities, portfolio risk assessment, and the management of daily cash balances in accordance with anticipated investment management requirements. The degree to which he may perform these functions, and the nature of these functions, may change from time to time. He joined Franklin Templeton Investments in 1996.
Nicholas P. B. Getaz, CFA
Research Analyst of Advisory Services
Mr. Getaz has been portfolio manager of the Fund since 2014, providing support to the lead portfolio manager(s) as needed. He joined Franklin Templeton Investments in 2011.
Please retain this supplement with your prospectus for future reference.
FRANKLIN TEMPLETON VARIABLE INSURANCE PRODUCTS TRUST
Financial Highlights
Franklin Rising Dividends VIP Fund
| | | | | | | | | | | | | | | | | | | | |
| | | Year Ended December 31, | |
| | | 2017 | | | 2016 | | | 2015 | | | 2014 | | | 2013 | |
| Class 1 | | | | | | | | | | | | | | | | | | | | |
Per share operating performance (for a share outstanding throughout the year) | | | | | | | | | | | | | | | | | | | | |
| | | | | |
Net asset value, beginning of year | | | $25.51 | | | | $25.26 | | | | $29.63 | | | | $28.14 | | | | $22.03 | |
| | | | |
| | | | | |
| Income from investment operationsa: | | | | | | | | | | | | | | | | | | | | |
| | | | | |
Net investment incomeb | | | 0.40 | | | | 0.42 | | | | 0.45 | | | | 0.45 | | | | 0.40 | |
| | | | | |
Net realized and unrealized gains (losses) | | | 4.76 | | | | 3.45 | | | | (1.33 | ) | | | 2.03 | | | | 6.16 | |
| | | | |
Total from investment operations | | | 5.16 | | | | 3.87 | | | | (0.88 | ) | | | 2.48 | | | | 6.56 | |
| | | | |
| | | | | |
| Less distributions from: | | | | | | | | | | | | | | | | | | | | |
| | | | | |
Net investment income | | | (0.48 | ) | | | (0.44 | ) | | | (0.48 | ) | | | (0.44 | ) | | | (0.45 | ) |
| | | | | |
Net realized gains | | | (0.98 | ) | | | (3.18 | ) | | | (3.01 | ) | | | (0.55 | ) | | | — | |
| | | | |
Total distributions | | | (1.46 | ) | | | (3.62 | ) | | | (3.49 | ) | | | (0.99 | ) | | | (0.45 | ) |
| | | | |
Net asset value, end of year | | | $29.21 | | | | $25.51 | | | | $25.26 | | | | $29.63 | | | | $28.14 | |
| | | | |
| | | | | |
Total returnc | | | 20.85% | | | | 16.33% | | | | (3.42)% | | | | 9.01% | | | | 30.05% | |
| | | | | |
| Ratios to average net assets | | | | | | | | | | | | | | | | | | | | |
| | | | | |
Expenses before waiver and payments by affiliates | | | 0.62% | | | | 0.63% | | | | 0.63% | | | | 0.62% | | | | 0.61% | |
| | | | | |
Expenses net of waiver and payments by affiliates | | | 0.62%d,e | | | | 0.62%d | | | | 0.63%e | | | | 0.62%e | | | | 0.61% | |
| | | | | |
Net investment income | | | 1.49% | | | | 1.67% | | | | 1.65% | | | | 1.58% | | | | 1.59% | |
| | | | | |
| Supplemental data | | | | | | | | | | | | | | | | | | | | |
| | | | | |
Net assets, end of year (000’s) | | | $216,015 | | | | $181,072 | | | | $143,376 | | | | $160,480 | | | | $168,380 | |
| | | | | |
Portfolio turnover rate | | | 3.36% | | | | 6.66% | | | | 4.74% | | | | 8.61% | | | | 0.07% | |
aThe amount shown for a share outstanding throughout the period may not correlate with the Statement of Operations for the period due to the timing of sales and repurchases of the Fund’s shares in relation to income earned and/or fluctuating fair value of the investments of the Fund.
bBased on average daily shares outstanding.
cTotal return does not include fees, charges or expenses imposed by the variable annuity and life insurance contracts for which Franklin Templeton Variable Insurance Products Trust serves as an underlying investment vehicle.
dBenefit of expense reduction rounds to less than 0.01%.
eBenefit of waiver and payments by affiliates rounds to less than 0.01%.
| | | | | | |
| | | The accompanying notes are an integral part of these financial statements. | Annual Report | | | FRD-7 | |
FRANKLIN TEMPLETON VARIABLE INSURANCE PRODUCTS TRUST
FINANCIAL HIGHLIGHTS
Franklin Rising Dividends VIP Fund (continued)
| | | | | | | | | | | | | | | | | | | | |
| | | Year Ended December 31, | |
| | | 2017 | | �� | 2016 | | | 2015 | | | 2014 | | | 2013 | |
| Class 2 | | | | | | | | | | | | | | | | | | | | |
Per share operating performance (for a share outstanding throughout the year) | | | | | | | | | | | | | | | | | | | | |
| | | | | |
Net asset value, beginning of year | | | $24.89 | | | | $24.72 | | | | $29.06 | | | | $27.62 | | | | $21.64 | |
| | | | |
| | | | | |
| Income from investment operationsa: | | | | | | | | | | | | | | | | | | | | |
| | | | | |
Net investment incomeb | | | 0.33 | | | | 0.35 | | | | 0.37 | | | | 0.37 | | | | 0.33 | |
| | | | | |
Net realized and unrealized gains (losses) | | | 4.63 | | | | 3.37 | | | | (1.29 | ) | | | 1.99 | | | | 6.04 | |
| | | | |
Total from investment operations | | | 4.96 | | | | 3.72 | | | | (0.92 | ) | | | 2.36 | | | | 6.37 | |
| | | | |
| | | | | |
| Less distributions from: | | | | | | | | | | | | | | | | | | | | |
| | | | | |
Net investment income | | | (0.41 | ) | | | (0.37 | ) | | | (0.41 | ) | | | (0.37 | ) | | | (0.39 | ) |
| | | | | |
Net realized gains | | | (0.98 | ) | | | (3.18 | ) | | | (3.01 | ) | | | (0.55 | ) | | | — | |
| | | | |
Total distributions | | | (1.39 | ) | | | (3.55 | ) | | | (3.42 | ) | | | (0.92 | ) | | | (0.39 | ) |
| | | | |
Net asset value, end of year | | | $28.46 | | | | $24.89 | | | | $24.72 | | | | $29.06 | | | | $27.62 | |
| | | | |
| | | | | |
Total returnc | | | 20.56% | | | | 16.04% | | | | (3.65)% | | | | 8.72% | | | | 29.69% | |
| | | | | |
| Ratios to average net assets | | | | | | | | | | | | | | | | | | | | |
| | | | | |
Expenses before waiver and payments by affiliates | | | 0.87% | | | | 0.88% | | | | 0.88% | | | | 0.87% | | | | 0.86% | |
| | | | | |
Expenses net of waiver and payments by affiliates | | | 0.87%d,e | | | | 0.87%d | | | | 0.88%e | | | | 0.87%e | | | | 0.86% | |
| | | | | |
Net investment income | | | 1.24% | | | | 1.42% | | | | 1.40% | | | | 1.33% | | | | 1.34% | |
| | | | | |
| Supplemental data | | | | | | | | | | | | | | | | | | | | |
| | | | | |
Net assets, end of year (000’s) | | | $1,640,883 | | | | $1,530,374 | | | | $1,310,783 | | | | $1,667,816 | | | | $1,752,012 | |
| | | | | |
Portfolio turnover rate | | | 3.36% | | | | 6.66% | | | | 4.74% | | | | 8.61% | | | | 0.07% | |
aThe amount shown for a share outstanding throughout the period may not correlate with the Statement of Operations for the period due to the timing of sales and repurchases of the Fund’s shares in relation to income earned and/or fluctuating fair value of the investments of the Fund.
bBased on average daily shares outstanding.
cTotal return does not include fees, charges or expenses imposed by the variable annuity and life insurance contracts for which Franklin Templeton Variable Insurance Products Trust serves as an underlying investment vehicle.
dBenefit of expense reduction rounds to less than 0.01%.
eBenefit of waiver and payments by affiliates rounds to less than 0.01%.
| | | | |
| FRD-8 | | Annual Report | The accompanying notes are an integral part of these financial statements. | | |
FRANKLIN TEMPLETON VARIABLE INSURANCE PRODUCTS TRUST
FINANCIAL HIGHLIGHTS
Franklin Rising Dividends VIP Fund (continued)
| | | | | | | | | | | | | | | | | | | | |
| | | Year Ended December 31, | |
| | | 2017 | | | 2016 | | | 2015 | | | 2014 | | | 2013 | |
| Class 4 | | | | | | | | | | | | | | | | | | | | |
Per share operating performance (for a share outstanding throughout the year) | | | | | | | | | | | | | | | | | | | | |
| | | | | |
Net asset value, beginning of year | | | $24.98 | | | | $24.81 | | | | $29.19 | | | | $27.76 | | | | $21.78 | |
| | | | |
| | | | | |
| Income from investment operationsa: | | | | | | | | | | | | | | | | | | | | |
| | | | | |
Net investment incomeb | | | 0.30 | | | | 0.32 | | | | 0.35 | | | | 0.35 | | | | 0.32 | |
| | | | | |
Net realized and unrealized gains (losses) | | | 4.65 | | | | 3.39 | | | | (1.31 | ) | | | 2.00 | | | | 6.07 | |
| | | | |
Total from investment operations | | | 4.95 | | | | 3.71 | | | | (0.96 | ) | | | 2.35 | | | | 6.39 | |
| | | | |
| | | | | |
| Less distributions from: | | | | | | | | | | | | | | | | | | | | |
| | | | | |
Net investment income | | | (0.41 | ) | | | (0.36 | ) | | | (0.41 | ) | | | (0.37 | ) | | | (0.41 | ) |
| | | | | |
Net realized gains | | | (0.98 | ) | | | (3.18 | ) | | | (3.01 | ) | | | (0.55 | ) | | | — | |
| | | | |
Total distributions | | | (1.39 | ) | | | (3.54 | ) | | | (3.42 | ) | | | (0.92 | ) | | | (0.41 | ) |
| | | | |
Net asset value, end of year | | | $28.54 | | | | $24.98 | | | | $24.81 | | | | $29.19 | | | | $27.76 | |
| | | | |
| | | | | |
Total returnc | | | 20.40% | | | | 15.93% | | | | (3.75)% | | | | 8.62% | | | | 29.57% | |
| | | | | |
| Ratios to average net assets | | | | | | | | | | | | | | | | | | | | |
| | | | | |
Expenses before waiver and payments by affiliates | | | 0.97% | | | | 0.98% | | | | 0.98% | | | | 0.97% | | | | 0.96% | |
| | | | | |
Expenses net of waiver and payments by affiliates | | | 0.97%d,e | | | | 0.97%d | | | | 0.98%e | | | | 0.97%e | | | | 0.96% | |
| | | | | |
Net investment income | | | 1.14% | | | | 1.32% | | | | 1.30% | | | | 1.23% | | | | 1.24% | |
| | | | | |
| Supplemental data | | | | | | | | | | | | | | | | | | | | |
| | | | | |
Net assets, end of year (000’s) | | | $36,407 | | | | $28,579 | | | | $20,453 | | | | $15,503 | | | | $12,028 | |
| | | | | |
Portfolio turnover rate | | | 3.36% | | | | 6.66% | | | | 4.74% | | | | 8.61% | | | | 0.07% | |
aThe amount shown for a share outstanding throughout the period may not correlate with the Statement of Operations for the period due to the timing of sales and repurchases of the Fund’s shares in relation to income earned and/or fluctuating fair value of the investments of the Fund.
bBased on average daily shares outstanding.
cTotal return does not include fees, charges or expenses imposed by the variable annuity and life insurance contracts for which Franklin Templeton Variable Insurance Products Trust serves as an underlying investment vehicle.
dBenefit of expense reduction rounds to less than 0.01%.
eBenefit of waiver and payments by affiliates rounds to less than 0.01%.
| | | | | | |
| | | The accompanying notes are an integral part of these financial statements. | Annual Report | | | FRD-9 | |
FRANKLIN TEMPLETON VARIABLE INSURANCE PRODUCTS TRUST
Statement of Investments, December 31, 2017
| | | | | | | | | | |
Franklin Rising Dividends VIP Fund | |
| | | | | Shares | | | Value | |
| | | | | | | | | | |
| | | Common Stocks 98.7% | | | | | | |
| | | Aerospace & Defense 3.8% | | | | | | |
| | General Dynamics Corp. | | | 157,911 | | | $ | 32,126,993 | |
| | United Technologies Corp. | | | 306,211 | | | | 39,063,337 | |
| | | | | | | | | | |
| | | | | | | | | 71,190,330 | |
| | | | | | | | | | |
| | | Building Products 1.7% | | | | | | |
| | Johnson Controls International PLC | | | 848,653 | | | | 32,342,166 | |
| | | Commercial & Professional Services 4.0% | | | | | | |
| | ABM Industries Inc. | | | 735,766 | | | | 27,753,093 | |
| | Brady Corp., A | | | 93,079 | | | | 3,527,694 | |
| | Cintas Corp. | | | 194,675 | | | | 30,336,205 | |
| | Matthews International Corp., A | | | 251,442 | | | | 13,276,138 | |
| | | | | | | | | | |
| | | | | | | | | 74,893,130 | |
| | | | | | | | | | |
| | | Consumer Durables & Apparel 2.1% | | | | | | |
| | Leggett & Platt Inc. | | | 260,600 | | | | 12,438,438 | |
| | NIKE Inc., B | | | 445,100 | | | | 27,841,005 | |
| | | | | | | | | | |
| | | | | | | | | 40,279,443 | |
| | | | | | | | | | |
| | | Consumer Services 2.1% | | | | | | |
| | McDonald’s Corp. | | | 196,045 | | | | 33,743,265 | |
| | Yum! Brands Inc. | | | 72,900 | | | | 5,949,369 | |
| | | | | | | | | | |
| | | | | | | | | 39,692,634 | |
| | | | | | | | | | |
| | | Diversified Financials 0.5% | | | | | | |
| | State Street Corp. | | | 106,800 | | | | 10,424,748 | |
| | | | | | | | | | |
| | | Energy 6.3% | | | | | | |
| | Chevron Corp. | | | 252,900 | | | | 31,660,551 | |
| | EOG Resources Inc. | | | 33,600 | | | | 3,625,776 | |
| | Exxon Mobil Corp. | | | 358,500 | | | | 29,984,940 | |
| | Occidental Petroleum Corp. | | | 370,790 | | | | 27,312,391 | |
| | Schlumberger Ltd. | | | 398,000 | | | | 26,821,220 | |
| | | | | | | | | | |
| | | | | | | | | 119,404,878 | |
| | | | | | | | | | |
| | | Food & Staples Retailing 3.5% | | | | | | |
| | CVS Health Corp. | | | 232,700 | | | | 16,870,750 | |
| | Wal-Mart Stores Inc. | | | 269,500 | | | | 26,613,125 | |
| | Walgreens Boots Alliance Inc. | | | 306,800 | | | | 22,279,816 | |
| | | | | | | | | | |
| | | | | | | | | 65,763,691 | |
| | | | | | | | | | |
| | | Food, Beverage & Tobacco 5.0% | | | | | | |
| | Archer-Daniels-Midland Co. | | | 489,200 | | | | 19,607,136 | |
| | Bunge Ltd. | | | 307,700 | | | | 20,640,516 | |
| | McCormick & Co. Inc. | | | 208,900 | | | | 21,288,999 | |
| | PepsiCo Inc. | | | 279,500 | | | | 33,517,640 | |
| | | | | | | | | | |
| | | | | | | | | 95,054,291 | |
| | | | | | | | | | |
| | | Health Care Equipment & Services 14.1% | | | | | | |
| | Abbott Laboratories | | | 636,100 | | | | 36,302,227 | |
| | Becton, Dickinson and Co. | | | 286,600 | | | | 61,349,596 | |
| | DENTSPLY SIRONA Inc. | | | 65,900 | | | | 4,338,197 | |
| | Medtronic PLC | | | 598,800 | | | | 48,353,100 | |
| | Stryker Corp. | | | 412,800 | | | | 63,917,952 | |
| | West Pharmaceutical Services Inc. | | | 527,618 | | | | 52,060,068 | |
| | | | | | | | | | |
| | | | | | | | | 266,321,140 | |
| | | | | | | | | | |
FRANKLIN TEMPLETON VARIABLE INSURANCE PRODUCTS TRUST
STATEMENT OF INVESTMENTS
Franklin Rising Dividends VIP Fund (continued)
| | | | | | | | | | |
| | | | | Shares | | | Value | |
| | | | | | | | | | |
| | | Common Stocks (continued) | | | | | | |
| | | Household & Personal Products 2.4% | | | | | | |
| | Colgate-Palmolive Co. | | | 202,300 | | | $ | 15,263,535 | |
| | The Procter & Gamble Co. | | | 322,600 | | | | 29,640,488 | |
| | | | | | | | | | |
| | | | | | | | | 44,904,023 | |
| | | | | | | | | | |
| | | Industrial Conglomerates 7.3% | | | | | | |
| | Carlisle Cos. Inc. | | | 101,061 | | | | 11,485,583 | |
| | Honeywell International Inc. | | | 257,900 | | | | 39,551,544 | |
| | Roper Technologies Inc. | | | 333,043 | | | | 86,258,137 | |
| | | | | | | | | | |
| | | | | | | | | 137,295,264 | |
| | | | | | | | | | |
| | | Insurance 3.8% | | | | | | |
| | Aflac Inc. | | | 265,800 | | | | 23,331,924 | |
| | Arthur J. Gallagher & Co. | | | 405,700 | | | | 25,672,696 | |
| | Erie Indemnity Co., A | | | 162,347 | | | | 19,780,359 | |
| | Old Republic International Corp. | | | 48,308 | | | | 1,032,825 | |
| | RLI Corp. | | | 31,500 | | | | 1,910,790 | |
| | | | | | | | | | |
| | | | | | | | | 71,728,594 | |
| | | | | | | | | | |
| | | Machinery 5.5% | | | | | | |
| | Donaldson Co. Inc. | | | 299,268 | | | | 14,649,169 | |
| | Dover Corp. | | | 483,976 | | | | 48,876,736 | |
| | Pentair PLC (United Kingdom) | | | 569,700 | | | | 40,232,214 | |
| | | | | | | | | | |
| | | | | | | | | 103,758,119 | |
| | | | | | | | | | |
| | | Materials 12.7% | | | | | | |
| | Air Products and Chemicals Inc. | | | 318,400 | | | | 52,243,072 | |
| | Albemarle Corp. | | | 678,700 | | | | 86,798,943 | |
| | Ecolab Inc. | | | 115,600 | | | | 15,511,208 | |
| | Nucor Corp. | | | 386,855 | | | | 24,596,241 | |
| | Praxair Inc. | | | 397,660 | | | | 61,510,049 | |
| | | | | | | | | | |
| | | | | | | | | 240,659,513 | |
| | | | | | | | | | |
| | | Media 1.5% | | | | | | |
| | Comcast Corp., A | | | 286,000 | | | | 11,454,300 | |
| | John Wiley & Sons Inc., A | | | 261,000 | | | | 17,160,750 | |
| | | | | | | | | | |
| | | | | | | | | 28,615,050 | |
| | | | | | | | | | |
| | | Pharmaceuticals, Biotechnology & Life Sciences 5.4% | | | | | | |
| | AbbVie Inc. | | | 192,700 | | | | 18,636,017 | |
| | Johnson & Johnson | | | 338,300 | | | | 47,267,276 | |
| | Perrigo Co. PLC | | | 180,500 | | | | 15,732,380 | |
| | Pfizer Inc. | | | 550,600 | | | | 19,942,732 | |
| | Roche Holding AG, ADR (Switzerland) | | | 25,000 | | | | 789,500 | |
| | | | | | | | | | |
| | | | | | | | | 102,367,905 | |
| | | | | | | | | | |
| | | Retailing 3.1% | | | | | | |
| | The Gap Inc. | | | 501,400 | | | | 17,077,684 | |
| | Ross Stores Inc. | | | 185,000 | | | | 14,846,250 | |
| | Target Corp. | | | 164,600 | | | | 10,740,150 | |
| | Tiffany & Co. | | | 161,500 | | | | 16,787,925 | |
| | | | | | | | | | |
| | | | | | | | | 59,452,009 | |
| | | | | | | | | | |
FRANKLIN TEMPLETON VARIABLE INSURANCE PRODUCTS TRUST
STATEMENT OF INVESTMENTS
Franklin Rising Dividends VIP Fund (continued)
| | | | | | | | | | |
| | | | | Shares | | | Value | |
| | | | | | | | | | |
| | | Common Stocks (continued) | | | | | | |
| | | Semiconductors & Semiconductor Equipment 4.8% | | | | | | |
| | Analog Devices Inc. | | | 432,437 | | | $ | 38,499,866 | |
| | Texas Instruments Inc. | | | 438,900 | | | | 45,838,716 | |
| | Versum Materials Inc. | | | 182,000 | | | | 6,888,700 | |
| | | | | | | | | | |
| | | | | | | | | 91,227,282 | |
| | | | | | | | | | |
| | | Software & Services 8.4% | | | | | | |
| | Accenture PLC, A | | | 350,400 | | | | 53,642,736 | |
| | Microsoft Corp. | | | 1,107,900 | | | | 94,769,766 | |
| | Visa Inc., A | | | 89,500 | | | | 10,204,790 | |
| | | | | | | | | | |
| | | | | | | | | 158,617,292 | |
| | | | | | | | | | |
| | | Trading Companies & Distributors 0.3% | | | | | | |
| | W.W. Grainger Inc. | | | 28,100 | | | | 6,638,625 | |
| | | | | | | | | | |
| | | Transportation 0.4% | | | | | | |
| | United Parcel Service Inc., B | | | 64,800 | | | | 7,720,920 | |
| | | | | | | | | | |
| | | |
| | Total Common Stocks (Cost $944,832,449) | | | | | | | 1,868,351,047 | |
| | | | | | | | | | |
| | Short Term Investments (Cost $13,833,792) 0.7% | | | | | | | | |
| | Money Market Funds 0.7% | | | | | | | | |
| a,b | | Institutional Fiduciary Trust Money Market Portfolio, 0.89% | | | 13,833,792 | | | | 13,833,792 | |
| | | | | | | | | | |
| | Total Investments (Cost $958,666,241) 99.4% | | | | | | | 1,882,184,839 | |
| | Other Assets, less Liabilities 0.6% | | | | | | | 11,121,165 | |
| | | | | | | | | | |
| | Net Assets 100.0% | | | | | | $ | 1,893,306,004 | |
| | | | | | | | | | |
See Abbreviations on page FRD-22.
aSee Note 3(e) regarding investments in affiliated management investment companies.
bThe rate shown is the annualized seven-day yield at period end.
| | | | |
| FRD-12 | | Annual Report | The accompanying notes are an integral part of these financial statements. | | |
FRANKLIN TEMPLETON VARIABLE INSURANCE PRODUCTS TRUST
Financial Statements
Statement of Assets and Liabilities
December 31, 2017
| | | | |
| | | Franklin Rising
Dividends
VIP Fund | |
Assets: | | | | |
Investments in securities: | | | | |
Cost - Unaffiliated issuers | | $ | 944,832,449 | |
Cost - Non-controlled affiliates (Note 3e) | | | 13,833,792 | |
| | | | |
Value - Unaffiliated issuers | | $ | 1,868,351,047 | |
Value - Non-controlled affiliates (Note 3e) | | | 13,833,792 | |
| | | | |
Receivables: | | | | |
Investment securities sold | | | 11,106,317 | |
Capital shares sold | | | 194,104 | |
Dividends | | | 2,787,004 | |
Other assets | | | 203 | |
| | | | |
Total assets | | | 1,896,272,467 | |
| | | | |
Liabilities: | | | | |
Payables: | | | | |
Capital shares redeemed | | | 1,133,171 | |
Management fees | | | 959,095 | |
Distribution fees | | | 703,778 | |
Accrued expenses and other liabilities | | | 170,419 | |
| | | | |
Total liabilities | | | 2,966,463 | |
| | | | |
Net assets, at value | | $ | 1,893,306,004 | |
| | | | |
Net assets consist of: | | | | |
Paid-in capital | | $ | 842,423,016 | |
Undistributed net investment income | | | 18,555,375 | |
Net unrealized appreciation (depreciation) | | | 923,518,598 | |
Accumulated net realized gain (loss) | | | 108,809,015 | |
| | | | |
Net assets, at value | | $ | 1,893,306,004 | |
| | | | |
| |
| Class 1: | | | | |
Net assets, at value | | $ | 216,015,393 | |
| | | | |
Shares outstanding | | | 7,395,750 | |
| | | | |
Net asset value and maximum offering price per share | | $ | 29.21 | |
| | | | |
| |
| Class 2: | | | | |
Net assets, at value | | $ | 1,640,883,401 | |
| | | | |
Shares outstanding | | | 57,661,197 | |
| | | | |
Net asset value and maximum offering price per share | | $ | 28.46 | |
| | | | |
| |
| Class 4: | | | | |
Net assets, at value | | $ | 36,407,210 | |
| | | | |
Shares outstanding | | | 1,275,453 | |
| | | | |
Net asset value and maximum offering price per share | | $ | 28.54 | |
| | | | |
| | | | | | |
| | | The accompanying notes are an integral part of these financial statements. | Annual Report | | | FRD-13 | |
FRANKLIN TEMPLETON VARIABLE INSURANCE PRODUCTS TRUST
FINANCIAL STATEMENTS
Statement of Operations
for the year ended December 31, 2017
| | | | |
| | | Franklin Rising
Dividends VIP Fund | |
Investment income: | | | | |
Dividends: (net of foreign taxes)* | | | | |
Unaffiliated issuers | | $ | 38,063,105 | |
Non-controlled affiliates (Note 3e) | | | 89,268 | |
| | | | |
Total investment income | | | 38,152,373 | |
| | | | |
Expenses: | | | | |
Management fees (Note 3a) | | | 10,923,258 | |
Distribution fees: (Note 3c) | | | | |
Class 2 | | | 3,944,845 | |
Class 4 | | | 112,390 | |
Custodian fees (Note 4) | | | 16,040 | |
Reports to shareholders | | | 175,600 | |
Professional fees | | | 83,829 | |
Trustees’ fees and expenses | | | 7,614 | |
Other | | | 71,115 | |
| | | | |
Total expenses | | | 15,334,691 | |
Expense reductions (Note 4) | | | (433 | ) |
Expenses waived/paid by affiliates (Note 3e) | | | (64,042 | ) |
| | | | |
Net expenses | | | 15,270,216 | |
| | | | |
Net investment income | | | 22,882,157 | |
| | | | |
Realized and unrealized gains (losses): | | | | |
Net realized gain (loss) from: | | | | |
Investments: | | | | |
Unaffiliated issuers | | | 108,533,033 | |
Foreign currency transactions | | | 196 | |
| | | | |
Net realized gain (loss) | | | 108,533,229 | |
| | | | |
Net change in unrealized appreciation (depreciation) on: | | | | |
Investments: | | | | |
Unaffiliated issuers | | | 207,698,448 | |
| | | | |
Net realized and unrealized gain (loss) | | | 316,231,677 | |
| | | | |
Net increase (decrease) in net assets resulting from operations | | $ | 339,113,834 | |
| | | | |
| |
*Foreign taxes withheld on dividends | | $ | 4,506 | |
| | | | |
| FRD-14 | | Annual Report | The accompanying notes are an integral part of these financial statements. | | |
FRANKLIN TEMPLETON VARIABLE INSURANCE PRODUCTS TRUST
FINANCIAL STATEMENTS
Statements of Changes in Net Assets
| | | | | | | | |
| | | Franklin Rising Dividends VIP Fund | |
| | | Year Ended December 31, | |
| | | 2017 | | | 2016 | |
Increase (decrease) in net assets: | | | | | | | | |
Operations: | | | | | | | | |
Net investment income | | $ | 22,882,157 | | | $ | 23,756,244 | |
Net realized gain (loss) | | | 108,533,229 | | | | 65,501,800 | |
Net change in unrealized appreciation (depreciation) | | | 207,698,448 | | | | 155,534,476 | |
| | | | |
Net increase (decrease) in net assets resulting from operations | | | 339,113,834 | | | | 244,792,520 | |
| | | | |
Distributions to shareholders from: | | | | | | | | |
Net investment income: | | | | | | | | |
Class 1 | | | (3,388,715 | ) | | | (2,718,521 | ) |
Class 2 | | | (24,052,908 | ) | | | (20,665,957 | ) |
Class 4 | | | (476,793 | ) | | | (304,600 | ) |
Net realized gains: | | | | | | | | |
Class 1 | | | (7,011,086 | ) | | | (19,761,965 | ) |
Class 2 | | | (57,291,559 | ) | | | (177,746,237 | ) |
Class 4 | | | (1,158,380 | ) | | | (2,696,441 | ) |
| | | | |
Total distributions to shareholders | | | (93,379,441 | ) | | | (223,893,721 | ) |
| | | | |
Capital share transactions: (Note 2) | | | | | | | | |
Class 1 | | | 7,492,496 | | | | 33,560,724 | |
Class 2 | | | (103,411,809 | ) | | | 203,254,702 | |
Class 4 | | | 3,465,199 | | | | 7,699,850 | |
| | | | |
Total capital share transactions | | | (92,454,114 | ) | | | 244,515,276 | |
| | | | |
Net increase (decrease) in net assets | | | 153,280,279 | | | | 265,414,075 | |
Net assets: | | | | | | | | |
Beginning of year | | | 1,740,025,725 | | | | 1,474,611,650 | |
| | | | |
End of year | | $ | 1,893,306,004 | | | $ | 1,740,025,725 | |
| | | | |
Undistributed net investment income included in net assets: | | | | | | | | |
End of year | | $ | 18,555,375 | | | $ | 23,924,204 | |
| | | | |
| | | | | | |
| | | The accompanying notes are an integral part of these financial statements. | Annual Report | | | FRD-15 | |
FRANKLIN TEMPLETON VARIABLE INSURANCE PRODUCTS TRUST
Notes to Financial Statements
Franklin Rising Dividends VIP Fund
1. Organization and Significant Accounting Policies
Franklin Templeton Variable Insurance Products Trust (Trust) is registered under the Investment Company Act of 1940 (1940 Act) as an open-end management investment company, consisting of eighteen separate funds and applies the specialized accounting and reporting guidance in U.S. Generally Accepted Accounting Principles (U.S. GAAP). Franklin Rising Dividends VIP Fund (Fund) is included in this report. Shares of the Fund are generally sold only to insurance company separate accounts to fund the benefits of variable life insurance policies or variable annuity contracts. The Fund offers three classes of shares: Class 1, Class 2 and Class 4. Each class of shares may differ by its distribution fees, voting rights on matters affecting a single class and its exchange privilege.
The following summarizes the Fund’s significant accounting policies.
a. Financial Instrument Valuation
The Fund’s investments in financial instruments are carried at fair value daily. Fair value is the price that would be received to sell an asset or paid to transfer a liability in an orderly transaction between market participants on the measurement date. The Fund calculates the net asset value (NAV) per share as of 4 p.m. Eastern time each day the New York Stock Exchange (NYSE) is open for trading. Under compliance policies and procedures approved by the Trust’s Board of Trustees (the Board), the Fund’s administrator has responsibility for oversight of valuation, including leading the cross-functional Valuation Committee (VC). The VC provides administration and oversight of the Fund’s valuation policies and procedures, which are approved annually by the Board. Among other things, these procedures allow the Fund to utilize independent pricing services, quotations from securities and financial instrument dealers, and other market sources to determine fair value.
Equity securities listed on an exchange or on the NASDAQ National Market System are valued at the last quoted sale price or the official closing price of the day, respectively. Foreign equity securities are valued as of the close of trading on the foreign stock exchange on which the security is primarily traded, or as of 4 p.m. Eastern time. The value is then converted into its U.S. dollar equivalent at the foreign exchange rate in effect at 4 p.m. Eastern time on the day that the value of the security is determined. Over-the-counter (OTC) securities are
valued within the range of the most recent quoted bid and ask prices. Securities that trade in multiple markets or on multiple exchanges are valued according to the broadest and most representative market. Certain equity securities are valued based upon fundamental characteristics or relationships to similar securities.
Investments in open-end mutual funds are valued at the closing NAV.
The Fund has procedures to determine the fair value of financial instruments for which market prices are not reliable or readily available. Under these procedures, the VC convenes on a regular basis to review such financial instruments and considers a number of factors, including significant unobservable valuation inputs, when arriving at fair value. The VC primarily employs a market-based approach which may use related or comparable assets or liabilities, recent transactions, market multiples, book values, and other relevant information for the investment to determine the fair value of the investment. An income-based valuation approach may also be used in which the anticipated future cash flows of the investment are discounted to calculate fair value. Discounts may also be applied due to the nature or duration of any restrictions on the disposition of the investments. Due to the inherent uncertainty of valuations of such investments, the fair values may differ significantly from the values that would have been used had an active market existed. The VC employs various methods for calibrating these valuation approaches including a regular review of key inputs and assumptions, transactional back-testing or disposition analysis, and reviews of any related market activity.
Trading in securities on foreign securities stock exchanges and OTC markets may be completed before 4 p.m. Eastern time. In addition, trading in certain foreign markets may not take place on every Fund’s business day. Occasionally, events occur between the time at which trading in a foreign security is completed and 4 p.m. Eastern time that might call into question the reliability of the value of a portfolio security held by the Fund. As a result, differences may arise between the value of the Fund’s portfolio securities as determined at the foreign market close and the latest indications of value at 4 p.m. Eastern time. In order to minimize the potential for these differences, the VC monitors price movements following the close of trading in foreign stock markets through a series of country specific market proxies (such as baskets of American Depositary Receipts, futures contracts and exchange traded funds). These price movements are measured against
FRANKLIN TEMPLETON VARIABLE INSURANCE PRODUCTS TRUST
NOTES TO FINANCIAL STATEMENTS
Franklin Rising Dividends VIP Fund (continued)
established trigger thresholds for each specific market proxy to assist in determining if an event has occurred that may call into question the reliability of the values of the foreign securities held by the Fund. If such an event occurs, the securities may be valued using fair value procedures, which may include the use of independent pricing services.
When the last day of the reporting period is a non-business day, certain foreign markets may be open on those days that the Fund’s NAV is not calculated, which could result in differences between the value of the Fund’s portfolio securities on the last business day and the last calendar day of the reporting period. Any significant security valuation changes due to an open foreign market are adjusted and reflected by the Fund for financial reporting purposes.
b. Foreign Currency Translation
Portfolio securities and other assets and liabilities denominated in foreign currencies are translated into U.S. dollars based on the exchange rate of such currencies against U.S. dollars on the date of valuation. The Fund may enter into foreign currency exchange contracts to facilitate transactions denominated in a foreign currency. Purchases and sales of securities, income and expense items denominated in foreign currencies are translated into U.S. dollars at the exchange rate in effect on the transaction date. Portfolio securities and assets and liabilities denominated in foreign currencies contain risks that those currencies will decline in value relative to the U.S. dollar. Occasionally, events may impact the availability or reliability of foreign exchange rates used to convert the U.S. dollar equivalent value. If such an event occurs, the foreign exchange rate will be valued at fair value using procedures established and approved by the Board.
The Fund does not separately report the effect of changes in foreign exchange rates from changes in market prices on securities held. Such changes are included in net realized and unrealized gain or loss from investments in the Statement of Operations.
Realized foreign exchange gains or losses arise from sales of foreign currencies, currency gains or losses realized between the trade and settlement dates on securities transactions and the difference between the recorded amounts of dividends, interest, and foreign withholding taxes and the U.S. dollar equivalent of the amounts actually received or paid. Net unrealized foreign exchange gains and losses arise from changes in foreign
exchange rates on foreign denominated assets and liabilities other than investments in securities held at the end of the reporting period.
c. Income and Deferred Taxes
It is the Fund’s policy to qualify as a regulated investment company under the Internal Revenue Code. The Fund intends to distribute to shareholders substantially all of its taxable income and net realized gains to relieve it from federal income and if applicable, excise taxes. As a result, no provision for U.S. federal income taxes is required.
The Fund may be subject to foreign taxation related to income received, capital gains on the sale of securities and certain foreign currency transactions in the foreign jurisdictions in which it invests. Foreign taxes, if any, are recorded based on the tax regulations and rates that exist in the foreign markets in which the Fund invests. When a capital gain tax is determined to apply, the Fund records an estimated deferred tax liability in an amount that would be payable if the securities were disposed of on the valuation date.
The Fund may recognize an income tax liability related to its uncertain tax positions under U.S. GAAP when the uncertain tax position has a less than 50% probability that it will be sustained upon examination by the tax authorities based on its technical merits. As of December 31, 2017, the Fund has determined that no tax liability is required in its financial statements related to uncertain tax positions for any open tax years (or expected to be taken in future tax years). Open tax years are those that remain subject to examination and are based on the statute of limitations in each jurisdiction in which the Fund invests.
d. Security Transactions, Investment Income, Expenses and Distributions
Security transactions are accounted for on trade date. Realized gains and losses on security transactions are determined on a specific identification basis. Estimated expenses are accrued daily. Dividend income is recorded on the ex-dividend date except for certain dividends from securities where the dividend rate is not available. In such cases, the dividend is recorded as soon as the information is received by the Fund. Distributions to shareholders are recorded on the ex-dividend date. Distributable earnings are determined according to income tax regulations (tax basis) and may differ from earnings recorded in accordance with U.S. GAAP. These differences may be permanent or
FRANKLIN TEMPLETON VARIABLE INSURANCE PRODUCTS TRUST
NOTES TO FINANCIAL STATEMENTS
Franklin Rising Dividends VIP Fund (continued)
1. Organization and Significant Accounting
Policies (continued)
d. Security Transactions, Investment Income, Expenses and Distributions (continued)
temporary. Permanent differences are reclassified among capital accounts to reflect their tax character. These reclassifications have no impact on net assets or the results of operations. Temporary differences are not reclassified, as they may reverse in subsequent periods.
Common expenses incurred by the Trust are allocated among the Funds based on the ratio of net assets of each Fund to the combined net assets of the Trust. Fund specific expenses are charged directly to the Fund that incurred the expense.
Realized and unrealized gains and losses and net investment income, excluding class specific expenses, are allocated daily to each class of shares based upon the relative proportion of net assets of each class. Differences in per share distributions by class are generally due to differences in class specific expenses.
e. Accounting Estimates
The preparation of financial statements in accordance with U.S. GAAP requires management to make estimates and assumptions that affect the reported amounts of assets and liabilities at the date of the financial statements and the amounts of income and expenses during the reporting period. Actual results could differ from those estimates.
f. Guarantees and Indemnifications
Under the Trust’s organizational documents, its officers and trustees are indemnified by the Trust against certain liabilities arising out of the performance of their duties to the Trust. Additionally, in the normal course of business, the Trust, on behalf of the Fund, enters into contracts with service providers that contain general indemnification clauses. The Trust’s maximum exposure under these arrangements is unknown as this would involve future claims that may be made against the Trust that have not yet occurred. Currently, the Trust expects the risk of loss to be remote.
2. Shares of Beneficial Interest
At December 31, 2017, there were an unlimited number of shares authorized (without par value). Transactions in the Fund’s shares were as follows:
| | | | | | | | | | | | | | | | | | | | |
| | | Year Ended December 31, | |
| | | 2017 | | | | | | 2016 | |
| | | Shares | | | Amount | | | | | | Shares | | | Amount | |
| | | | | |
| Class 1 Shares: | | | | | | | | | | | | | | | | | | | | |
Shares sold | | | 968,022 | | | $ | 25,981,840 | | | | | | | | 1,408,862 | | | $ | 34,658,685 | |
Shares issued in reinvestment of distributions | | | 394,680 | | | | 10,399,801 | | | | | | | | 944,162 | | | | 22,480,486 | |
Shares redeemed | | | (1,064,640 | ) | | | (28,889,145 | ) | | | | | | | (931,787 | ) | | | (23,578,447 | ) |
| | | | |
Net increase (decrease) | | | 298,062 | | | $ | 7,492,496 | | | | | | | | 1,421,237 | | | $ | 33,560,724 | |
| | | | |
| | | | | |
| Class 2 Shares: | | | | | | | | | | | | | | | | | | | | |
Shares sold | | | 2,058,817 | | | $ | 54,342,881 | | | | | | | | 9,423,278 | | | $ | 238,665,574 | |
Shares issued in reinvestment of distributions | | | 3,163,923 | | | | 81,344,467 | | | | | | | | 8,526,523 | | | | 198,412,194 | |
Shares redeemed | | | (9,039,170 | ) | | | (239,099,157 | ) | | | | | | | (9,496,533 | ) | | | (233,823,066 | ) |
| | | | |
Net increase (decrease) | | | (3,816,430 | ) | | $ | (103,411,809 | ) | | | | | | | 8,453,268 | | | $ | 203,254,702 | |
| | | | |
| Class 4 Shares: | | | | | | | | | | | | | | | | | | | | |
Shares sold | | | 269,622 | | | $ | 7,129,389 | | | | | | | | 404,421 | | | $ | 9,995,211 | |
Shares issued in reinvestment of distributions | | | 63,379 | | | | 1,635,173 | | | | | | | | 128,469 | | | | 3,001,041 | |
Shares redeemed | | | (201,530 | ) | | | (5,299,363 | ) | | | | | | | (213,254 | ) | | | (5,296,402 | ) |
| | | | |
Net increase (decrease) | | | 131,471 | | | $ | 3,465,199 | | | | | | | | 319,636 | | | $ | 7,699,850 | |
| | | | |
FRANKLIN TEMPLETON VARIABLE INSURANCE PRODUCTS TRUST
NOTES TO FINANCIAL STATEMENTS
Franklin Rising Dividends VIP Fund (continued)
3. Transactions with Affiliates
Franklin Resources, Inc. is the holding company for various subsidiaries that together are referred to as Franklin Templeton Investments. Certain officers and trustees of the Fund are also officers and/or directors of the following subsidiaries:
| | |
| Subsidiary | | Affiliation |
Franklin Advisers, Inc. (Advisers) | | Investment manager |
Franklin Advisory Services, LLC (Advisory Services) | | Investment manager |
Franklin Templeton Services, LLC (FT Services) | | Administrative manager |
Franklin Templeton Distributors, Inc. (Distributors) | | Principal underwriter |
Franklin Templeton Investor Services, LLC (Investor Services) | | Transfer agent |
a. Management Fees
Effective November 1, 2017, Advisers began serving as the Fund’s investment manager. Prior to November 1, 2017, Advisory Services served as the Fund’s investment manager.
Effective May 1, 2017, the Fund pays an investment management fee based on the average daily net assets of the Fund as follows:
| | |
| Annualized Fee Rate | | Net Assets |
0.750% | | Up to and including $500 million |
0.625% | | Over $500 million, up to and including $1 billion |
0.500% | | Over $1 billion, up to and including $5 billion |
0.490% | | In excess of $5 billion |
Prior to May 1, 2017, the Fund paid fees based on the average daily net assets of the Fund as follows:
| | |
| Annualized Fee Rate | | Net Assets |
0.750% | | Up to and including $500 million |
0.625% | | Over $500 million, up to and including $1 billion |
0.500% | | In excess of $1 billion |
For the year ended December 31, 2017, the gross effective investment management fee rate was 0.603% of the Fund’s average daily net assets.
b. Administrative Fees
Effective November 1, 2017, under an agreement with Advisers, FT Services provides administrative services to the Fund. The fee is paid by Advisers based on the Fund’s average daily net assets, and is not an additional expense of the Fund. Prior to November 1, 2017, the fee was paid by Advisory Services.
c. Distribution Fees
The Board has adopted distribution plans for Class 2 and Class 4 shares pursuant to Rule 12b-1 under the 1940 Act. Under the Fund’s compensation distribution plans, the Fund pays Distributors for costs incurred in connection with the servicing, sale and distribution of the Fund’s shares up to 0.35% per year of its average daily net assets of each class. The Board has agreed to limit the current rate to 0.25% per year for Class 2. The plan year, for purposes of monitoring compliance with the maximum annual plan rates, is February 1 through January 31.
FRANKLIN TEMPLETON VARIABLE INSURANCE PRODUCTS TRUST
NOTES TO FINANCIAL STATEMENTS
Franklin Rising Dividends VIP Fund (continued)
3. Transactions with Affiliates (continued)
d. Transfer Agent Fees
Investor Services, under terms of an agreement, performs shareholder servicing for the Fund and is not paid by the Fund for the services.
e. Investments in Affiliated Management Investment Companies
The Fund invests in one or more affiliated management investment companies for purposes other than exercising a controlling influence over the management or policies. Management fees paid by the Fund are waived on assets invested in the affiliated management investment companies, as noted in the Statement of Operations, in an amount not to exceed the management and administrative fees paid directly or indirectly by each affiliate. Prior to January 1, 2014, the waiver was accounted for as a reduction to management fees. During the year ended December 31, 2017, the Fund held investments in affiliated management investment companies as follows:
| | | | | | | | | | | | | | | | | | | | | | | | | | | | | | | | |
| | | Number of Shares Held at
Beginning
of Year | | | Gross Additions | | | Gross Reductions | | | Number of Shares Held at End of Year | | | Value at End of Year | | | Dividend
Income | | | Realized
Gain
(Loss) | | | Net Change in
Unrealized
Appreciation
(Depreciation) | |
Non-Controlled Affiliates | | | | | | | | | | | | | | | | | | | | | | | | | | | | | | | | |
Institutional Fiduciary Trust Money Market | | | | | | | | | | | | | | | | | | | | | | | | | | | | | | | | |
Portfolio, 0.89% | | | 14,889,095 | | | | 138,929,679 | | | | (139,984,982 | ) | | | 13,833,792 | | | $ | 13,833,792 | | | $ | 89,268 | | | $ | — | | | $ | — | |
4. Expense Offset Arrangement
The Fund has entered into an arrangement with its custodian whereby credits realized as a result of uninvested cash balances are used to reduce a portion of the Fund’s custodian expenses. During the year ended December 31, 2017, the custodian fees were reduced as noted in the Statement of Operations.
5. Income Taxes
The tax character of distributions paid during the years ended December 31, 2017 and 2016, was as follows:
| | | | | | | | |
| | | 2017 | | | 2016 | |
Distributions paid from: | | | | | | | | |
Ordinary income | | $ | 27,931,719 | | | $ | 23,726,865 | |
Long term capital gain | | | 65,447,722 | | | | 200,166,856 | |
| | | | |
| | $ | 93,379,441 | | | $ | 223,893,721 | |
| | | | |
FRANKLIN TEMPLETON VARIABLE INSURANCE PRODUCTS TRUST
NOTES TO FINANCIAL STATEMENTS
Franklin Rising Dividends VIP Fund (continued)
At December 31, 2017, the cost of investments, net unrealized appreciation (depreciation), undistributed ordinary income and undistributed long term capital gains for income tax purposes were as follows:
| | | | |
Cost of investments | | $ | 962,987,677 | |
| | | | |
Unrealized appreciation | | $ | 953,749,645 | |
Unrealized depreciation | | | (34,552,483 | ) |
| | | | |
Net unrealized appreciation (depreciation) | | $ | 919,197,162 | |
| | | | |
Undistributed ordinary income | | $ | 28,674,500 | |
Undistributed long term capital gains | | | 103,011,323 | |
| | | | |
Distributable earnings | | $ | 131,685,823 | |
| | | | |
Differences between income and/or capital gains as determined on a book basis and a tax basis are primarily due to differing treatment of corporate actions.
6. Investment Transactions
Purchases and sales of investments (excluding short term securities) for the year ended December 31, 2017, aggregated $60,155,942 and $229,451,753, respectively.
7. Credit Facility
The Fund, together with other U.S. registered and foreign investment funds (collectively, Borrowers), managed by Franklin Templeton Investments, are borrowers in a joint syndicated senior unsecured credit facility totaling $2 billion (Global Credit Facility) which matured on February 9, 2018. This Global Credit Facility provides a source of funds to the Borrowers for temporary and emergency purposes, including the ability to meet future unanticipated or unusually large redemption requests. Effective February 9, 2018, the Borrowers renewed the Global Credit Facility for a one year term, maturing February 8, 2019, for a total of $2 billion.
Under the terms of the Global Credit Facility, the Fund shall, in addition to interest charged on any borrowings made by the Fund and other costs incurred by the Fund, pay its share of fees and expenses incurred in connection with the implementation and maintenance of the Global Credit Facility, based upon its relative share of the aggregate net assets of all of the Borrowers, including an annual commitment fee of 0.15% based upon the unused portion of the Global Credit Facility. These fees are reflected in other expenses in the Statement of Operations. During the year ended December 31, 2017, the Fund did not use the Global Credit Facility.
8. Fair Value Measurements
The Fund follows a fair value hierarchy that distinguishes between market data obtained from independent sources (observable inputs) and the Fund’s own market assumptions (unobservable inputs). These inputs are used in determining the value of the Fund’s financial instruments and are summarized in the following fair value hierarchy:
| | • | | Level 1 – quoted prices in active markets for identical financial instruments |
| | • | | Level 2 – other significant observable inputs (including quoted prices for similar financial instruments, interest rates, prepayment speed, credit risk, etc.) |
| | • | | Level 3 – significant unobservable inputs (including the Fund’s own assumptions in determining the fair value of financial instruments) |
FRANKLIN TEMPLETON VARIABLE INSURANCE PRODUCTS TRUST
NOTES TO FINANCIAL STATEMENTS
Franklin Rising Dividends VIP Fund (continued)
8. Fair Value Measurements (continued)
The input levels are not necessarily an indication of the risk or liquidity associated with financial instruments at that level.
For movements between the levels within the fair value hierarchy, the Fund has adopted a policy of recognizing the transfers as of the date of the underlying event which caused the movement.
At December 31, 2017, all of the Fund’s investments in financial instruments carried at fair value were valued using Level 1 inputs. For detailed categories, see the accompanying Statement of Investments.
9. Subsequent Events
The Fund has evaluated subsequent events through the issuance of the financial statements and determined that no events have occurred that require disclosure other than those already disclosed in the financial statements.
Abbreviations
| | |
| Selected Portfolio |
| |
| ADR | | American Depositary Receipt |
FRANKLIN TEMPLETON VARIABLE INSURANCE PRODUCTS TRUST
Report of Independent Registered Public Accounting Firm
To the Board of Trustees of Franklin Templeton Variable Insurance Products Trust and Shareholders of Franklin Rising Dividends VIP Fund
Opinion on the Financial Statements
We have audited the accompanying statement of assets and liabilities, including the statement of investments, of Franklin Rising Dividends VIP Fund (the “Fund”) as of December 31, 2017, the related statement of operations for the year ended December 31, 2017, the statement of changes in net assets for each of the two years in the period ended December 31, 2017, including the related notes, and the financial highlights for each of the five years in the period ended December 31, 2017 (collectively referred to as the “financial statements”). In our opinion, the financial statements present fairly, in all material respects, the financial position of the Fund as of December 31, 2017, the results of its operations for the year then ended, the changes in its net assets for each of the two years in the period ended December 31, 2017 and the financial highlights for each of the five years in the period ended December 31, 2017 in conformity with accounting principles generally accepted in the United States of America.
Basis for Opinion
These financial statements are the responsibility of the Fund’s management. Our responsibility is to express an opinion on the Fund’s financial statements based on our audits. We are a public accounting firm registered with the Public Company Accounting Oversight Board (United States) (“PCAOB”) and are required to be independent with respect to the Fund in accordance with the U.S. federal securities laws and the applicable rules and regulations of the Securities and Exchange Commission and the PCAOB.
We conducted our audits of these financial statements in accordance with the standards of the PCAOB. Those standards require that we plan and perform the audit to obtain reasonable assurance about whether the financial statements are free of material misstatement, whether due to error or fraud.
Our audits included performing procedures to assess the risks of material misstatement of the financial statements, whether due to error or fraud, and performing procedures that respond to those risks. Such procedures included examining, on a test basis, evidence regarding the amounts and disclosures in the financial statements. Our audits also included evaluating the accounting principles used and significant estimates made by management, as well as evaluating the overall presentation of the financial statements. Our procedures included confirmation of securities owned as of December 31, 2017 by correspondence with the custodian and transfer agent. We believe that our audits provide a reasonable basis for our opinion.
PricewaterhouseCoopers LLP
San Francisco, California
February 15, 2018
We have served as the auditor of one or more investment companies in the Franklin Templeton Group of Funds since 1948.
FRANKLIN TEMPLETON VARIABLE INSURANCE PRODUCTS TRUST
Tax Information (unaudited)
Franklin Rising Dividends VIP Fund
Under Section 852(b)(3)(C) of the Internal Revenue Code (Code), the Fund hereby reports the maximum amount allowable but no less than $65,447,722 as a long term capital gain dividend for the fiscal year ended December 31, 2017.
Under Section 854(b)(1)(A) of the Code, the Fund hereby reports 100% of the ordinary income dividends as income qualifying for the dividends received deduction for the fiscal year ended December 31, 2017.
Franklin Small Cap Value VIP Fund
We are pleased to bring you Franklin Small Cap Value VIP Fund’s annual report for the fiscal year ended December 31, 2017.
Class 2 Performance Summary as of December 31, 2017
Average annual total return of Class 2 shares* represents the average annual change in value, assuming reinvestment of dividends and capital gains. Average returns smooth out variations in returns, which can be significant; they are not the same as year-by-year results.
| | | | | | | | | | | | |
| Periods ended 12/31/17 | | 1-Year | | | 5-Year | | | 10-Year | |
Average Annual Total Return | | | +10.65% | | | | +12.82% | | | | +8.73% | |
*The Fund has a fee waiver associated with any investment it makes in a Franklin Templeton money fund and/or other Franklin Templeton fund, contractually guaranteed through 4/30/18. Fund investment results reflect the fee waiver; without this waiver, the results would have been lower.
Performance reflects the Fund’s Class 2 operating expenses, but does not include any contract fees, expenses or sales charges. If they had been included, performance would be lower. These charges and deductions, particularly for variable life policies, can have a significant effect on contract values and insurance benefits. See the contract prospectus for a complete description of these expenses, including sales charges.
Performance data represent past performance, which does not guarantee future results. Investment return and principal value will fluctuate, and you may have a gain or loss when you sell your shares. Current performance may differ from figures shown.
Total Return Index Comparison for a Hypothetical $10,000 Investment (1/1/08–12/31/17)
The graph below shows the change in value of a hypothetical $10,000 investment in the Fund over the indicated period and includes reinvestment of any income or distributions. The Fund’s performance* is compared to the performance of the Russell 2000® Value Index. One cannot invest directly in an index, and an index is not representative of the Fund’s portfolio. Please see Important Notes to Performance Information preceding the Fund Summaries.
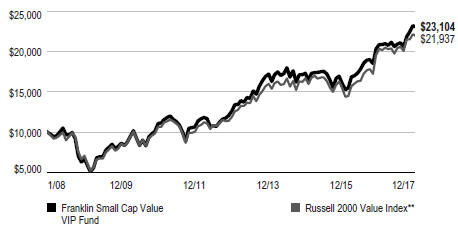
**Source: Morningstar. Please see Index Descriptions following the Fund Summaries.
FRANKLIN SMALL CAP VALUE VIP FUND
Fund Goal and Main Investments
The Fund seeks long-term total return. Under normal market conditions, the Fund invests at least 80% of its net assets in investments of small capitalization companies. For this Fund, small capitalization companies are those with market capitalizations not exceeding either the highest market capitalization in the Russell 2000® Index or the 12-month average of the highest market capitalization in the Russell 2000® Index, whichever is greater, at the time of purchase. The Fund generally invests in equity securities of companies that the manager believes are undervalued at the time of purchase and have the potential for capital appreciation.
Fund Risks
All investments involve risks, including possible loss of principal. Value securities may not increase in price as anticipated, or may decline further in value. The Fund’s investments in smaller company stocks carry special risks as such stocks have historically exhibited greater price volatility than large-company stocks, particularly over the short term. Additionally, smaller companies often have relatively small revenues, limited product lines and a small market share. In addition, the Fund may invest up to 25% of its total assets in foreign securities, which involve special risks, including currency fluctuations and economic and political uncertainty. The Fund also may invest in equity real estate investment trusts (REITs). The Fund is actively managed but there is no guarantee that the manager’s investment decisions will produce the desired results. The Fund’s prospectus also includes a description of the main investment risks.
Performance Overview
You can find the Fund’s one-year total return in the Performance Summary. In comparison, the Russell 2000® Value Index posted a +7.84% total return for the same period.1 Please note the Fund employs a bottom-up stock selection process, and the managers invest in securities without regard to benchmark comparisons.
Economic and Market Overview
The US economy grew during the 12 months under review. After strengthening in 2017’s second and third quarters, the economy moderated in the fourth quarter. The economy grew
faster in 2017 than in 2016, however, largely due to growth in consumer spending, business investment and exports. The manufacturing and services sectors expanded during the period. The unemployment rate declined from 4.7% in December 2016 to 4.1% at period-end.2 Monthly retail sales were volatile but positive on average during the period. Annual inflation, as measured by the Consumer Price Index, was 2.1% in December 2016, and while it varied over the 12-month period, remained unchanged at period-end.2
The US Federal Reserve (Fed) raised its target range for the federal funds rate 0.25% at its March and June 2017 meetings, amid signs of a growing US economy, strengthening labor market and improving business spending. At its December meeting, the Fed raised its target range for the federal funds rate 0.25% to 1.25%–1.50%, as widely anticipated by the market. The Fed also confirmed that the monthly balance sheet reduction would increase from $10 billion to $20 billion beginning in January 2018.
US equity markets rose during the 12-month period, benefiting from mostly upbeat economic data, better US corporate earnings and improving global economic growth. Concerns about the terms of the UK’s exit from the European Union (EU), political uncertainty in the US, tensions between the US and North Korea, and the progress of US health care and tax reform plans curbed market sentiment at times. However, the markets were also supported by investor optimism arising from pro-growth and pro-business policy plans in the US, the prospect for reforms in the EU with Emmanuel Macron’s election as France’s president, and the US Fed chair’s comments indicating optimism about the US economy and the likelihood of gradual rate hikes. Furthermore, the Senate’s approval of a budget plan in October and subsequent passage of a tax reform bill near period-end drove many US equity indexes to end 2017 near record highs. In this environment, the broad US stock market, as measured by the Standard & Poor’s® 500 Index, generated a +21.83% total return for the period.1
Investment Strategy
We generally invest in stocks that we believe are undervalued and have the potential for capital appreciation. We consider a stock price a “value” when it trades at less than the price at which we believe it would trade if the market reflected all
1. Source: Morningstar. One cannot invest directly in an index, and an index is not representative of the Fund’s portfolio. Please see Index Descriptions following the Fund Summaries.
2. Source: Bureau of Labor Statistics.
The dollar value, number of shares or principal amount, and names of all portfolio holdings are listed in the Fund’s Statement of Investments (SOI).
FRANKLIN SMALL CAP VALUE VIP FUND
factors relating to the company’s worth. Accordingly, we invest in companies that we believe have, for example, stock prices that are low relative to current or historical or future earnings, book value, cash flow or sales; recent sharp price declines but the potential for good long-term earnings prospects; and valuable intangibles not reflected in the stock price. Companies in which we may invest include those that may be considered out of favor, such as companies attempting to recover from bankruptcy, business setbacks, adverse events or cyclical downturns, or that may be considered potential takeover targets.
Manager’s Discussion
For the fiscal year ended December 31, 2017, some contributors to absolute Fund performance included MKS Instruments, BRP and Simpson Manufacturing.
MKS Instruments provides subsystems solutions and instruments to the semiconductor and other advanced manufacturing industries. During the period, MKS benefited from strong industry trends, while its operating model improvements drove its target profitability progressively higher. These factors, combined with the firm’s diversification away from semiconductors through the acquisition of laser manufacturer Newport and the paydown of its debt, led to higher market valuations.
BRP is a leading manufacturer of power-sport vehicles and equipment, primarily for the off-road, snowmobile and personal watercraft markets. BRP reported strong financial performance during the year, exceeding earnings-per-share estimates and raising its full-year outlook. New product introductions of side-by-side off-road vehicles and a significantly weakened competitor drove sales and market share gains. BRP also completed a large share repurchase program and initiated its first-ever quarterly dividend, signaling confidence in its business model.
Simpson Manufacturing, a manufacturer of building products, saw its share price appreciate during the period due to continued demand from its principal end market, residential housing. Simpson also announced a long-term operational plan in October 2017. The plan calls for Simpson to expand margins through cost cuts, better free cash flow from improvements in inventory management and increased returns to shareholders through a combination of dividends and share repurchases.
Detractors from absolute Fund performance included Oil States International, Aspen Insurance Holdings and Photronics.
Portfolio Composition
Based on Total Net Assets as of 12/31/17
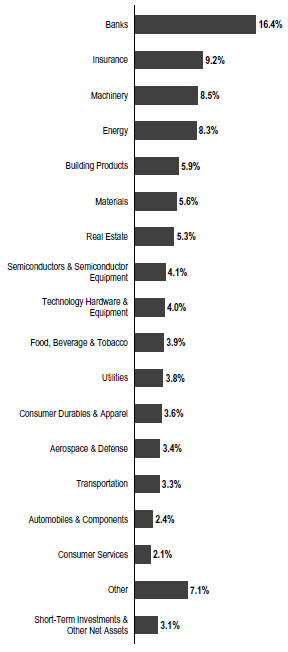
Oil States International is a provider of onshore and offshore well completion services, as well as deep-water connection products and services. Strong demand for onshore well completion products was unable to compensate for weaker-than-expected orders in its more profitable offshore products business, due to low crude oil prices that persisted throughout most of the period.
FRANKLIN SMALL CAP VALUE VIP FUND
| | | | |
| Top 10 Holdings | | | |
| 12/31/17 | | | |
| |
Company Sector/Industry | | % of Total
Net Assets | |
First Horizon National Corp.
Banks | | | 2.9% | |
Chemical Financial Corp.
Banks | | | 2.7% | |
Old Republic International Corp.
Insurance | | | 2.7% | |
Simpson Manufacturing Co. Inc.
Building Products | | | 2.5% | |
Spirit Airlines Inc.
Transportation | | | 2.5% | |
Columbia Banking System Inc.
Banks | | | 2.4% | |
The Hanover Insurance Group Inc.
Insurance | | | 2.4% | |
AAR Corp.
Aerospace & Defense | | | 2.2% | |
Spire Inc.
Utilities | | | 2.1% | |
Brinker International Inc.
Consumer Services | | | 2.1% | |
Shares of Aspen Insurance Holdings, a global insurance and reinsurance provider, declined due to above-average catastrophe losses from hurricanes and earthquakes in the third quarter of 2017, as well as disappointing expense management amid a challenging pricing environment. Additionally, as a company domiciled in Bermuda, management has indicated that US tax reform will modestly hurt financial results, which compares unfavorably to domestic US insurance peers that will largely see tax reductions. During the year, management engaged a consultant to improve its operational efficiency. While the announced efficiency plan was perceived by analysts to be a step in the right direction, the timeline to achieving the full $80 million in projected cost savings in 2021 was longer than expected.
Photronics is a leading manufacturer of photomasks for the semiconductor industry. During the period, Photronics experienced challenges due to a key customer losing market share, expiration of a supply agreement with Micron Technology (not a Portfolio holding) one year after the dissolution of their joint venture, and another important customer taking high-margin work in-house. These factors and the substantial investment that Photronics is making in China, which is set to materially reduce the cash buffer on its balance sheet, led to lower market valuations.
During the reporting period, we added some new positions with the largest purchases including Reliance Steel and Aluminum, a processor and distributor of metals products; Plexus, an electronic manufacturing company; Glacier Bancorp, a regional bank holding company providing commercial banking services; Highwoods Properties, a real estate investment trust; and Titan International, a manufacturer of off-the-road tires and wheel technology for agriculture, construction, forestry and mining equipment among others. We added to existing positions in Brinker International, an owner/operator and franchiser of casual dining restaurants, Rowan, an offshore drilling contractor; and Old Republic International, an insurance holding company; among others. Conversely, we exited some positions including Sensient Technologies, Everbank Financial, Cubic and Orbcomm. We also reduced our positions in Hill-Rom Holdings, Steris, Maple Leaf Foods, Gerresheimer and the aforementioned MKS Instruments, among others. Additionally, Mentor Graphics and Endurance Specialty Holdings were acquired in all cash deals during the period.
Thank you for your participation in Franklin Small Cap Value VIP Fund. We look forward to serving your future investment needs.
The foregoing information reflects our analysis, opinions and portfolio holdings as of December 31, 2017, the end of the reporting period. The way we implement our main investment strategies and the resulting portfolio holdings may change depending on factors such as market and economic conditions. These opinions may not be relied upon as investment advice or an offer for a particular security. The information is not a complete analysis of every aspect of any market, country, industry, security or the Fund. Statements of fact are from sources considered reliable, but the investment manager makes no representation or warranty as to their completeness or accuracy. Although historical performance is no guarantee of future results, these insights may help you understand our investment management philosophy.
FRANKLIN SMALL CAP VALUE VIP FUND
Class 2 Fund Expenses
As an investor in a variable insurance contract (Contract) that indirectly provides for investment in an underlying mutual fund, you can incur transaction and/or ongoing expenses at both the Fund level and the Contract Level: (1) transaction expenses can include sales charges (loads) on purchases, surrender fees, transfer fees and premium taxes; and (2) ongoing expenses can include management fees, distribution and service (12b-1) fees, contract fees, annual maintenance fees, mortality and expense risk fees and other fees and expenses. All mutual funds and Contracts have some types of ongoing expenses. The table below shows Fund-level ongoing expenses and can help you understand these costs and compare them with those of other mutual funds offered through the Contract. The table assumes a $1,000 investment held for the six months indicated. Please refer to the Fund prospectus for additional information on operating expenses.
Actual Fund Expenses
The table below provides information about the actual account values and actual expenses in the columns under the heading “Actual.” In these columns the Fund’s actual return, which includes the effect of ongoing Fund expenses but does not include the effect of ongoing Contract expenses, is used to calculate the “Ending Account Value.” You can estimate the Fund-level expenses you paid during the period by following these steps (of course, your account value and expenses will differ from those in this illustration): Divide your account value by $1,000 (if your account had an $8,600 value, then $8,600 ÷ $1,000 = 8.6). Then multiply the result by the number under the headings “Actual” and “Fund-Level Expenses Paid During Period” (if Fund-Level Expenses Paid During Period were $ 7.50, then 8.6 x $ 7.50 = $64.50). In this illustration, the estimated expenses paid this period at the Fund level are $64.50.
Hypothetical Example for Comparison with Other Mutual Funds
Under the heading “Hypothetical” in the table, information is provided about hypothetical account values and hypothetical expenses based on the Fund’s actual expense ratio and an assumed rate of return of 5% per year before expenses, which is not the Fund’s actual return. This information may not be used to estimate the actual ending account balance or expenses you paid for the period, but it can help you compare ongoing costs of investing in the Fund with those of other mutual funds offered through the Contract. To do so, compare this 5% hypothetical example with the 5% hypothetical examples that appear in the shareholder reports of other funds offered through the Contract.
Please note that expenses shown in the table are meant to highlight ongoing costs at the Fund level only and do not reflect any ongoing expenses at the Contract level, or transaction expenses at either the Fund or Contract levels. In addition, while the Fund does not have transaction expenses, if the transaction and ongoing expenses at the Contract level were included, the expenses shown below would be higher. You should consult your Contract prospectus or disclosure document for more information.
| | | | | | | | | | | | | | | | | | | | | | | | | | |
| | | | | | Actual (actual return after expenses) | | | | | Hypothetical (5% annual return before expenses) | | | | |
Share Class | |
| Beginning Account
Value 7/1/17 |
| |
| Ending Account
Value 12/31/17 |
| |
| Fund-Level Expenses
Paid During Period
7/1/17–12/31/171,2 |
| | | |
| Ending Account
Value 12/31/17 |
| |
| Fund-Level Expenses
Paid During Period
7/1/17–12/31/171,2 |
| |
| Net
Annualized
Expense
Ratio2 |
|
Class 2 | | | $1,000 | | | | $1,104.30 | | | | $4.77 | | | | | | $1,020.67 | | | | $4.58 | | | | 0.90% | |
1. Expenses are equal to the annualized expense ratio for the six-month period as indicated above—in the far right column—multiplied by the simple average account value over the period indicated, and then multiplied by 184/365 to reflect the one-half year period.
2. Reflects expenses after fee waivers and expense reimbursements. Does not include any ongoing expenses of the Contract for which the Fund is an investment option or acquired fund fees and expenses.
FSV1 P1 P2 P4 06/17
SUPPLEMENT DATED JUNE 8, 2017
TO THE PROSPECTUSES
DATED MAY 1, 2017
OF
FRANKLIN SMALL CAP VALUE VIP FUND
(a series of Franklin Templeton Variable Insurance Products Trust)
Effective June 30, 2017, the Prospectus is amended as follows:
I. The section in the Fund Summary under the heading “Portfolio Managers” on page FSV-S5 is revised as follows:
Portfolio Managers
Steven B. Raineri Vice President of Advisory Services and portfolio manager of the Fund since 2012.
Christopher Meeker, CFA Portfolio Manager of Advisory Services and portfolio manager of the Fund since 2015.
II. In the Fund Details, under the heading “Management”, the portfolio manager information on page FSV-D5 is revised as follows:
Franklin Advisory Services, LLC (Advisory Services), 101 John F. Kennedy Parkway, Short Hills, NJ 07078, is the Fund’s investment manager.
The Fund is managed by a team of dedicated professionals focused on investments of small cap value companies. The portfolio managers of the team are as follows:
Steven B. Raineri
Vice President of Advisory Services
Mr. Raineri has been a lead portfolio manager of the Fund since 2012. Mr. Raineri has primary responsibility for the investments of the Fund. He has final authority over all aspects of the Fund’s investment portfolio, including but not limited to, purchases and sales of individual securities, portfolio risk assessment, and the management of daily cash balances in accordance with anticipated investment management requirements. The degree to which he may perform these functions, and the nature of these functions, may change from time to time. He joined Franklin Templeton Investments in 2005.
Christopher Meeker, CFA
Portfolio Manager of Advisory Services
Mr. Meeker has been a portfolio manager of the Fund since 2015, providing support to the lead portfolio manager(s) as needed. He joined Franklin Templeton Investments in 2012. Prior to joining Franklin Templeton Investments, he worked as a senior buy-side analyst at Federated Global Investment Management with a focus on the international markets and coverage of the industrial, consumer and technology sectors.
Please retain this supplement with your prospectus for future reference.
FRANKLIN TEMPLETON VARIABLE INSURANCE PRODUCTS TRUST
Financial Highlights
Franklin Small Cap Value VIP Fund
| | | | | | | | | | | | | | | | | | | | |
| | | Year Ended December 31, | |
| | | 2017 | | | 2016 | | | 2015 | | | 2014 | | | 2013 | |
| Class 1 | | | | | | | | | | | | | | | | | | | | |
Per share operating performance
(for a share outstanding throughout the year) | | | | | | | | | | | | | | | | | | | | |
| | | | | |
Net asset value, beginning of year | | | $19.93 | | | | $18.12 | | | | $22.81 | | | | $24.54 | | | | $18.58 | |
| | | | |
| | | | | |
| Income from investment operationsa: | | | | | | | | | | | | | | | | | | | | |
| | | | | |
Net investment incomeb | | | 0.21 | c | | | 0.15 | | | | 0.21 | | | | 0.19 | | | | 0.19 | |
| | | | | |
Net realized and unrealized gains (losses) | | | 1.82 | | | | 4.79 | | | | (1.53 | ) | | | 0.06 | | | | 6.45 | |
| | | | |
Total from investment operations | | | 2.03 | | | | 4.94 | | | | (1.32 | ) | | | 0.25 | | | | 6.64 | |
| | | | |
| | | | | |
| Less distributions from: | | | | | | | | | | | | | | | | | | | | |
| | | | | |
Net investment income | | | (0.15 | ) | | | (0.21 | ) | | | (0.20 | ) | | | (0.20 | ) | | | (0.32 | ) |
| | | | | |
Net realized gains | | | (1.38 | ) | | | (2.92 | ) | | | (3.17 | ) | | | (1.78 | ) | | | (0.36 | ) |
| | | | |
Total distributions | | | (1.53 | ) | | | (3.13 | ) | | | (3.37 | ) | | | (1.98 | ) | | | (0.68 | ) |
| | | | |
Net asset value, end of year | | | $20.43 | | | | $19.93 | | | | $18.12 | | | | $22.81 | | | | $24.54 | |
| | | | |
| | | | | |
Total returnd | | | 10.92% | | | | 30.54% | | | | (7.18)% | | | | 0.88% | | | | 36.50% | |
| | | | | |
| Ratios to average net assets | | | | | | | | | | | | | | | | | | | | |
| | | | | |
Expenses before waiver and payments by affiliates | | | 0.66% | | | | 0.66% | | | | 0.65% | | | | 0.63% | | | | 0.63% | |
| | | | | |
Expenses net of waiver and payments by affiliates | | | 0.65% | e | | | 0.64% | e | | | 0.64% | e | |
| 0.63%
| e,f
| | | 0.63% | |
| | | | | |
Net investment income | | | 1.06% | c | | | 0.84% | | | | 1.04% | | | | 0.82% | | | | 0.90% | |
| | | | | |
| Supplemental data | | | | | | | | | | | | | | | | | | | | |
| | | | | |
Net assets, end of year (000’s) | | | $51,245 | | | | $47,831 | | | | $45,897 | | | | $57,843 | | | | $62,408 | |
| | | | | |
Portfolio turnover rate | | | 33.36% | | | | 34.60% | | | | 27.05% | | | | 19.45% | | | | 10.44% | |
aThe amount shown for a share outstanding throughout the period may not correlate with the Statement of Operations for the period due to the timing of sales and repurchases of the Fund’s shares in relation to income earned and/or fluctuating fair value of the investments of the Fund.
bBased on average daily shares outstanding.
cNet investment income per share includes approximately $0.06 per share related to income received in the form of special dividends in connection with certain Fund holdings. Excluding this amount, the ratio of net investment income to average net assets would have been 0.75%.
dTotal return does not include fees, charges or expenses imposed by the variable annuity and life insurance contracts for which Franklin Templeton Variable Insurance Products Trust serves as an underlying investment vehicle.
eBenefit of expense reduction rounds to less than 0.01%.
fBenefit of waiver and payments by affiliates rounds to less than 0.01%.
| | | | | | |
| | | The accompanying notes are an integral part of these financial statements. | Annual Report | | | FSV-7 | |
FRANKLIN TEMPLETON VARIABLE INSURANCE PRODUCTS TRUST
FINANCIAL HIGHLIGHTS
Franklin Small Cap Value VIP Fund (continued)
| | | | | | | | | | | | | | | | | | | | |
| | | Year Ended December 31, | |
| | | 2017 | | | 2016 | | | 2015 | | | 2014 | | | 2013 | |
| Class 2 | | | | | | | | | | | | | | | | | | | | |
Per share operating performance
(for a share outstanding throughout the year) | | | | | | | | | | | | | | | | | | | | |
| | | | | |
Net asset value, beginning of year | | | $19.36 | | | | $17.68 | | | | $22.32 | | | | $24.07 | | | | $18.23 | |
| | | | |
| | | | | |
| Income from investment operationsa: | | | | | | | | | | | | | | | | | | | | |
| | | | | |
Net investment incomeb | | | 0.15 | c | | | 0.10 | | | | 0.16 | | | | 0.13 | | | | 0.14 | |
| | | | | |
Net realized and unrealized gains (losses) | | | 1.77 | | | | 4.66 | | | | (1.49 | ) | | | 0.05 | | | | 6.34 | |
| | | | |
Total from investment operations | | | 1.92 | | | | 4.76 | | | | (1.33 | ) | | | 0.18 | | | | 6.48 | |
| | | | |
| | | | | |
| Less distributions from: | | | | | | | | | | | | | | | | | | | | |
| | | | | |
Net investment income | | | (0.10 | ) | | | (0.16 | ) | | | (0.14 | ) | | | (0.15 | ) | | | (0.28 | ) |
| | | | | |
Net realized gains | | | (1.38 | ) | | | (2.92 | ) | | | (3.17 | ) | | | (1.78 | ) | | | (0.36 | ) |
| | | | |
Total distributions | | | (1.48 | ) | | | (3.08 | ) | | | (3.31 | ) | | | (1.93 | ) | | | (0.64 | ) |
| | | | |
Net asset value, end of year | | | $19.80 | | | | $19.36 | | | | $17.68 | | | | $22.32 | | | | $24.07 | |
| | | | |
| | | | | |
Total returnd | | | 10.65% | | | | 30.19% | | | | (7.39)% | | | | 0.57% | | | | 36.24% | |
| | | | | |
| Ratios to average net assets | | | | | | | | | | | | | | | | | | | | |
| | | | | |
Expenses before waiver and payments by affiliates | | | 0.91% | | | | 0.91% | | | | 0.90% | | | | 0.88% | | | | 0.88% | |
| | | | | |
Expenses net of waiver and payments by affiliates | | | 0.90% | e | | | 0.89% | e | | | 0.89% | e | | | 0.88% | e,f | | | 0.88% | |
| | | | | |
Net investment income | | | 0.81% | c | | | 0.59% | | | | 0.79% | | | | 0.57% | | | | 0.65% | |
| | | | | |
| Supplemental data | | | | | | | | | | | | | | | | | | | | |
| | | | | |
Net assets, end of year (000’s) | | | $1,302,055 | | | | $1,366,807 | | | | $1,172,173 | | | | $1,445,325 | | | | $1,606,802 | |
| | | | | |
Portfolio turnover rate | | | 33.36% | | | | 34.60% | | | | 27.05% | | | | 19.45% | | | | 10.44% | |
aThe amount shown for a share outstanding throughout the period may not correlate with the Statement of Operations for the period due to the timing of sales and repurchases of the Fund’s shares in relation to income earned and/or fluctuating fair value of the investments of the Fund.
bBased on average daily shares outstanding.
cNet investment income per share includes approximately $0.06 per share related to income received in the form of special dividends in connection with certain Fund holdings. Excluding this amount, the ratio of net investment income to average net assets would have been 0.50%.
dTotal return does not include fees, charges or expenses imposed by the variable annuity and life insurance contracts for which Franklin Templeton Variable Insurance Products Trust serves as an underlying investment vehicle.
eBenefit of expense reduction rounds to less than 0.01%.
fBenefit of waiver and payments by affiliates rounds to less than 0.01%.
| | | | |
| FSV-8 | | Annual Report | The accompanying notes are an integral part of these financial statements. | | |
FRANKLIN TEMPLETON VARIABLE INSURANCE PRODUCTS TRUST
FINANCIAL HIGHLIGHTS
Franklin Small Cap Value VIP Fund (continued)
| | | | | | | | | | | | | | | | | | | | |
| | | Year Ended December 31, | |
| | | 2017 | | | 2016 | | | 2015 | | | 2014 | | | 2013 | |
| Class 4 | | | | | | | | | | | | | | | | | | | | |
Per share operating performance
(for a share outstanding throughout the year) | | | | | | | | | | | | | | | | | | | | |
| | | | | |
Net asset value, beginning of year | | | $19.74 | | | | $17.96 | | | | $22.63 | | | | $24.37 | | | | $18.44 | |
| | | | |
| | | | | |
| Income from investment operationsa: | | | | | | | | | | | | | | | | | | | | |
| | | | | |
Net investment incomeb | | | 0.14 | c | | | 0.09 | | | | 0.14 | | | | 0.11 | | | | 0.12 | |
| | | | | |
Net realized and unrealized gains (losses) | | | 1.81 | | | | 4.75 | | | | (1.52 | ) | | | 0.05 | | | | 6.42 | |
| | | | |
Total from investment operations | | | 1.95 | | | | 4.84 | | | | (1.38 | ) | | | 0.16 | | | | 6.54 | |
| | | | |
| | | | | |
| Less distributions from: | | | | | | | | | | | | | | | | | | | | |
| | | | | |
Net investment income | | | (0.09 | ) | | | (0.14 | ) | | | (0.12 | ) | | | (0.12 | ) | | | (0.25 | ) |
| | | | | |
Net realized gains | | | (1.38 | ) | | | (2.92 | ) | | | (3.17 | ) | | | (1.78 | ) | | | (0.36 | ) |
| | | | |
Total distributions | | | (1.47 | ) | | | (3.06 | ) | | | (3.29 | ) | | | (1.90 | ) | | | (0.61 | ) |
| | | | |
Net asset value, end of year | | | $20.22 | | | | $19.74 | | | | $17.96 | | | | $22.63 | | | | $24.37 | |
| | | | |
| | | | | |
Total returnd | | | 10.56% | | | | 30.12% | | | | (7.52)% | | | | 0.48% | | | | 36.12% | |
| | | | | |
| Ratios to average net assets | | | | | | | | | | | | | | | | | | | | |
| | | | | |
Expenses before waiver and payments by affiliates | | | 1.01% | | | | 1.01% | | | | 1.00% | | | | 0.98% | | | | 0.98% | |
| | | | | |
Expenses net of waiver and payments by affiliates | | | 1.00% | e | | | 0.99% | e | | | 0.99% | e | | | 0.98% | e,f | | | 0.98% | |
| | | | | |
Net investment income | | | 0.71% | c | | | 0.49% | | | | 0.69% | | | | 0.47% | | | | 0.55% | |
| | | | | |
| Supplemental data | | | | | | | | | | | | | | | | | | | | |
| | | | | |
Net assets, end of year (000’s) | | | $32,053 | | | | $32,751 | | | | $26,128 | | | | $30,452 | | | | $35,936 | |
| | | | | |
Portfolio turnover rate | | | 33.36% | | | | 34.60% | | | | 27.05% | | | | 19.45% | | | | 10.44% | |
aThe amount shown for a share outstanding throughout the period may not correlate with the Statement of Operations for the period due to the timing of sales and repurchases of the Fund’s shares in relation to income earned and/or fluctuating fair value of the investments of the Fund.
bBased on average daily shares outstanding.
cNet investment income per share includes approximately $0.06 per share related to income received in the form of special dividends in connection with certain Fund holdings. Excluding this amount, the ratio of net investment income to average net assets would have been 0.40%.
dTotal return does not include fees, charges or expenses imposed by the variable annuity and life insurance contracts for which Franklin Templeton Variable Insurance Products Trust serves as an underlying investment vehicle.
eBenefit of expense reduction rounds to less than 0.01%.
fBenefit of waiver and payments by affiliates rounds to less than 0.01%.
| | | | | | |
| | | The accompanying notes are an integral part of these financial statements. | Annual Report | | | FSV-9 | |
FRANKLIN TEMPLETON VARIABLE INSURANCE PRODUCTS TRUST
Statement of Investments, December 31, 2017
| | | | | | | | | | |
| Franklin Small Cap Value VIP Fund | | | | | | |
| | | | | Shares | | | Value | |
| | Common Stocks 96.0% | | | | | | | | |
| | | Aerospace & Defense 3.4% | | | | | | |
| | AAR Corp. | | | 780,516 | | | $ | 30,666,474 | |
| a | | Esterline Technologies Corp. | | | 213,146 | | | | 15,922,006 | |
| | | | | | | | | | |
| | | | | | | | | 46,588,480 | |
| | | | | | | | | | |
| | | Automobiles & Components 2.4% | | | | | | |
| | Gentex Corp. | | | 36,000 | | | | 754,200 | |
| | LCI Industries | | | 131,800 | | | | 17,134,000 | |
| | Thor Industries Inc. | | | 102,400 | | | | 15,433,728 | |
| | | | | | | | | | |
| | | | | | | | | 33,321,928 | |
| | | | | | | | | | |
| | | Banks 16.4% | | | | | | |
| | Access National Corp. | | | 244,865 | | | | 6,817,042 | |
| | Bryn Mawr Bank Corp. | | | 241,777 | | | | 10,686,543 | |
| | Chemical Financial Corp. | | | 699,042 | | | | 37,377,776 | |
| | Columbia Banking System Inc. | | | 753,300 | | | | 32,723,352 | |
| | First Horizon National Corp. | | | 1,992,037 | | | | 39,820,820 | |
| | First of Long Island Corp. | | | 473,555 | | | | 13,496,317 | |
| | German American Bancorp Inc. | | | 125,323 | | | | 4,427,661 | |
| | Glacier Bancorp Inc. | | | 471,900 | | | | 18,588,141 | |
| | Lakeland Financial Corp. | | | 551,400 | | | | 26,737,386 | |
| | Peoples Bancorp Inc. | | | 286,946 | | | | 9,360,178 | |
| | Pinnacle Financial Partners Inc. | | | 210,202 | | | | 13,936,393 | |
| | TrustCo Bank Corp. NY | | | 684,300 | | | | 6,295,560 | |
| | Washington Trust Bancorp Inc. | | | 124,891 | | | | 6,650,446 | |
| | | | | | | | | | |
| | | | | | | | | 226,917,615 | |
| | | | | | | | | | |
| | | Building Products 5.9% | | | | | | |
| a | | Gibraltar Industries Inc. | | | 433,479 | | | | 14,304,807 | |
| | Griffon Corp. | | | 15,933 | | | | 324,236 | |
| | Insteel Industries Inc. | | | 357,296 | | | | 10,118,623 | |
| | Simpson Manufacturing Co. Inc. | | | 608,260 | | | | 34,920,207 | |
| | Universal Forest Products Inc. | | | 584,340 | | | | 21,982,871 | |
| | | | | | | | | | |
| | | | | | | | | 81,650,744 | |
| | | | | | | | | | |
| | | Commercial & Professional Services 1.6% | | | | | | |
| | McGrath RentCorp. | | | 463,255 | | | | 21,763,720 | |
| | | | | | | | | | |
| | | Construction & Engineering 1.8% | | | | | | |
| | Argan Inc. | | | 19,516 | | | | 878,220 | |
| | EMCOR Group Inc. | | | 110,334 | | | | 9,019,804 | |
| | Granite Construction Inc. | | | 240,346 | | | | 15,245,147 | |
| | | | | | | | | | |
| | | | | | | | | 25,143,171 | |
| | | | | | | | | | |
| | | Consumer Durables & Apparel 3.6% | | | | | | |
| | BRP Inc. (Canada) | | | 693,445 | | | | 25,655,976 | |
| | Hooker Furniture Corp. | | | 18,405 | | | | 781,292 | |
| | La-Z-Boy Inc. | | | 49,100 | | | | 1,531,920 | |
| a | | M/I Homes Inc. | | | 651,788 | | | | 22,421,507 | |
| | | | | | | | | | |
| | | | | | | | | 50,390,695 | |
| | | | | | | | | | |
| | | Consumer Services 2.1% | | | | | | |
| | Brinker International Inc. | | | 744,740 | | | | 28,925,702 | |
| | | | | | | | | | |
FRANKLIN TEMPLETON VARIABLE INSURANCE PRODUCTS TRUST
STATEMENT OF INVESTMENTS
Franklin Small Cap Value VIP Fund (continued)
| | | | | | | | | | |
| | | | | Shares | | | Value | |
| | Common Stocks (continued) | | | | | | | | |
| | Electrical Equipment 0.9% | | | | | | | | |
| | Encore Wire Corp. | | | 36,908 | | | $ | 1,795,574 | |
| | EnerSys | | | 72,010 | | | | 5,014,057 | |
| | Regal Beloit Corp. | | | 68,600 | | | | 5,254,760 | |
| | | | | | | | | | |
| | | | | | | | | 12,064,391 | |
| | | | | | | | | | |
| | Energy 7.6% | | | | | | | | |
| a | | Energen Corp. | | | 416,807 | | | | 23,995,579 | |
| a | | Helix Energy Solutions Group Inc. | | | 30,800 | | | | 232,232 | |
| a | | Hunting PLC (United Kingdom) | | | 3,275,739 | | | | 26,763,517 | |
| a | | Natural Gas Services Group Inc. | | | 173,987 | | | | 4,558,459 | |
| a | | Oil States International Inc. | | | 763,023 | | | | 21,593,551 | |
| a | | Rowan Cos. PLC | | | 1,217,065 | | | | 19,059,238 | |
| a | | Unit Corp. | | | 432,917 | | | | 9,524,174 | |
| | | | | | | | | | |
| | | | | | | | | 105,726,750 | |
| | | | | | | | | | |
| | Food, Beverage & Tobacco 3.9% | | | | | | | | |
| | Dairy Crest Group PLC (United Kingdom) | | | 1,778,100 | | | | 13,843,121 | |
| | GrainCorp Ltd. (Australia) | | | 408,300 | | | | 2,608,971 | |
| a | | Landec Corp. | | | 848,600 | | | | 10,692,360 | |
| | Maple Leaf Foods Inc. (Canada) | | | 934,149 | | | | 26,617,784 | |
| | | | | | | | | | |
| | | | | | | | | 53,762,236 | |
| | | | | | | | | | |
| | Health Care Equipment & Services 1.0% | | | | | | | | |
| | Hill-Rom Holdings Inc. | | | 90,101 | | | | 7,594,613 | |
| | STERIS PLC | | | 78,750 | | | | 6,888,263 | |
| | | | | | | | | | |
| | | | | | | | | 14,482,876 | |
| | | | | | | | | | |
| | Industrial Conglomerates 0.5% | | | | | | | | |
| | Carlisle Cos. Inc. | | | 66,400 | | | | 7,546,360 | |
| | | | | | | | | | |
| | Insurance 9.2% | | | | | | | | |
| | Aspen Insurance Holdings Ltd. | | | 495,500 | | | | 20,117,300 | |
| | The Hanover Insurance Group Inc. | | | 302,500 | | | | 32,694,200 | |
| | Horace Mann Educators Corp. | | | 473,748 | | | | 20,892,287 | |
| | Old Republic International Corp. | | | 1,736,600 | | | | 37,128,508 | |
| | Validus Holdings Ltd. | | | 346,300 | | | | 16,248,396 | |
| | | | | | | | | | |
| | | | | | | | | 127,080,691 | |
| | | | | | | | | | |
| | Machinery 8.3% | | | | | | | | |
| | Astec Industries Inc. | | | 292,850 | | | | 17,131,725 | |
| | Federal Signal Corp. | | | 417,100 | | | | 8,379,539 | |
| | Hillenbrand Inc. | | | 17,332 | | | | 774,740 | |
| | Kennametal Inc. | | | 329,836 | | | | 15,967,361 | |
| | | | | | | | | | |
| a | | The Manitowoc Co. Inc. | | | 370,435 | | | | 14,572,913 | |
| | | | | | | | | | |
| | Mueller Industries Inc. | | | 449,900 | | | | 15,939,957 | |
| | Mueller Water Products Inc., A | | | 2,089,700 | | | | 26,183,941 | |
| | Titan International Inc. | | | 1,195,983 | | | | 15,404,261 | |
| | | | | | | | | 114,354,437 | |
| | Materials 5.6% | | | | | | | | |
| | A Schulman Inc. | | | 167,228 | | | | 6,229,243 | |
| | AptarGroup Inc. | | | 16,164 | | | | 1,394,630 | |
| a | | Detour Gold Corp. (Canada) | | | 909,100 | | | | 10,688,488 | |
| a | | Ingevity Corp. | | | 156,167 | | | | 11,005,088 | |
| | Minerals Technologies Inc. | | | 206,562 | | | | 14,221,794 | |
| | OceanaGold Corp. (Australia) | | | 3,708,500 | | | | 9,528,641 | |
FRANKLIN TEMPLETON VARIABLE INSURANCE PRODUCTS TRUST
STATEMENT OF INVESTMENTS
Franklin Small Cap Value VIP Fund (continued)
| | | | | | | | | | |
| | | | | Shares | | | Value | |
| | Common Stocks (continued) | | | | | | | | |
| | | Materials (continued) | | | | | | |
| | Reliance Steel & Aluminum Co. | | | 287,400 | | | $ | 24,656,046 | |
| | | | | | | | | | |
| | | | | | | | | 77,723,930 | |
| | | | | | | | | | |
| | | Pharmaceuticals, Biotechnology & Life Sciences 0.5% | | | | | | |
| | Gerresheimer AG (Germany) | | | 87,420 | | | | 7,249,756 | |
| | | | | | | | | | |
| | | Real Estate 5.3% | | | | | | |
| | Brandywine Realty Trust | | | 1,359,300 | | | | 24,725,667 | |
| | Highwoods Properties Inc. | | | 278,300 | | | | 14,168,253 | |
| | LTC Properties Inc. | | | 438,855 | | | | 19,112,135 | |
| | Sunstone Hotel Investors Inc. | | | 922,097 | | | | 15,242,264 | |
| | | | | | | | | | |
| | | | | | | | | 73,248,319 | |
| | | | | | | | | | |
| | | Retailing 0.8% | | | | | | |
| | Caleres Inc. | | | 340,423 | | | | 11,397,362 | |
| | | | | | | | | | |
| | | Semiconductors & Semiconductor Equipment 4.1% | | | | | | |
| | Cohu Inc. | | | 479,162 | | | | 10,517,606 | |
| a | | Kulicke and Soffa Industries Inc. (Singapore) | | | 633,100 | | | | 15,406,489 | |
| | MKS Instruments Inc. | | | 69,993 | | | | 6,614,339 | |
| a | | Photronics Inc. | | | 945,978 | | | | 8,064,462 | |
| | Versum Materials Inc. | | | 446,257 | | | | 16,890,827 | |
| | | | | | | | | | |
| | | | | | | | | 57,493,723 | |
| | | | | | | | | | |
| | | Technology Hardware & Equipment 4.0% | | | | | | |
| a | | Finisar Corp. | | | 422,200 | | | | 8,591,770 | |
| a | | NetScout Systems Inc. | | | 119,900 | | | | 3,650,955 | |
| a | | Plexus Corp. | | | 348,874 | | | | 21,183,629 | |
| a | | Zebra Technologies Corp., A | | | 206,200 | | | | 21,403,560 | |
| | | | | | | | | | |
| | | | | | | | | 54,829,914 | |
| | | | | | | | | | |
| | | Transportation 3.3% | | | | | | |
| a | | SAIA Inc. | | | 161,300 | | | | 11,411,975 | |
| a | | Spirit Airlines Inc. | | | 762,100 | | | | 34,180,185 | |
| | | | | | | | | | |
| | | | | | | | | 45,592,160 | |
| | | | | | | | | | |
| | | Utilities 3.8% | | | | | | |
| | Connecticut Water Service Inc. | | | 47,200 | | | | 2,709,752 | |
| | IDACORP Inc. | | | 228,289 | | | | 20,856,483 | |
| | Spire Inc. | | | 392,500 | | | | 29,496,375 | |
| | | | | | | | | | |
| | | | | | | | | 53,062,610 | |
| | | | | | | | | | |
| | | |
| | Total Common Stocks (Cost $957,542,406) | | | | | | | 1,330,317,570 | |
| | | | | | | | | | |
| | | |
| | | | | Principal Amount | | | | |
| | Corporate Bonds 0.9% | | | | | | | | |
| | | Energy 0.7% | | | | | | |
| | Unit Corp., senior sub. note, 6.625%, 5/15/21 | | $ | 9,632,000 | | | | 9,752,400 | |
| | | | | | | | | | |
| | | Machinery 0.2% | | | | | | |
| | Mueller Industries Inc., sub. bond, 6.00%, 3/01/27 | | | 2,378,000 | | | | 2,443,395 | |
| | | | | | | | | | |
| | | |
| | Total Corporate Bonds (Cost $11,621,409) | | | | | | | 12,195,795 | |
| | | | | | | | | | |
| | | |
| | Total Investments before Short Term Investments (Cost $969,163,815) | | | | | | | 1,342,513,365 | |
| | | | | | | | | | |
FRANKLIN TEMPLETON VARIABLE INSURANCE PRODUCTS TRUST
STATEMENT OF INVESTMENTS
Franklin Small Cap Value VIP Fund (continued)
| | | | | | | | | | |
| | | | | Shares | | | Value | |
| | Short Term Investments (Cost $43,492,005) 3.1% | | | | | | | | |
| | Money Market Funds 3.1% | | | | | | | | |
| b,c | | Institutional Fiduciary Trust Money Market Portfolio, 0.89% | | | 43,492,005 | | | $ | 43,492,005 | |
| | Total Investments (Cost $1,012,655,820) 100.0% | | | | | | | 1,386,005,370 | |
| | Other Assets, less Liabilities (0.0)%† | | | | | | | (652,220 | ) |
| | | | | | | | | | |
| | Net Assets 100.0% | | | | | | $ | 1,385,353,150 | |
| | | | | | | | | | |
†Rounds to less than 0.1% of net assets.
aNon-income producing.
bSee Note 3(e) regarding investments in affiliated management investment companies.
cThe rate shown is the annualized seven-day yield at period end.
| | | | | | |
| | | The accompanying notes are an integral part of these financial statements. | Annual Report | | | FSV-13 | |
FRANKLIN TEMPLETON VARIABLE INSURANCE PRODUCTS TRUST
Financial Statements
Statement of Assets and Liabilities
December 31, 2017
| | | | |
| | | Franklin Small
Cap Value VIP Fund | |
Assets: | | | | |
Investments in securities: | | | | |
Cost - Unaffiliated issuers | | $ | 969,163,815 | |
Cost - Non-controlled affiliates (Note 3e) | | | 43,492,005 | |
| | | | |
Value - Unaffiliated issuers | | $ | 1,342,513,365 | |
Value - Non-controlled affiliates (Note 3e) | | | 43,492,005 | |
Receivables: | | | | |
Investment securities sold | | | 2,127,970 | |
Capital shares sold | | | 225,163 | |
Dividends and interest | | | 1,819,821 | |
Other assets | | | 167 | |
| | | | |
Total assets | | | 1,390,178,491 | |
| | | | |
Liabilities: | | | | |
Payables: | | | | |
Investment securities purchased | | | 2,385,720 | |
Capital shares redeemed | | | 936,238 | |
Management fees | | | 722,360 | |
Distribution fees | | | 563,653 | |
Accrued expenses and other liabilities. | | | 217,370 | |
| | | | |
Total liabilities | | | 4,825,341 | |
| | | | |
Net assets, at value | | $ | 1,385,353,150 | |
| | | | |
Net assets consist of: | | | | |
Paid-in capital | | $ | 808,017,134 | |
Undistributed net investment income | | | 12,100,998 | |
Net unrealized appreciation (depreciation) | | | 373,354,291 | |
Accumulated net realized gain (loss) | | | 191,880,727 | |
| | | | |
Net assets, at value | | $ | 1,385,353,150 | |
| | | | |
| |
| Class 1: | | | | |
Net assets, at value | | $ | 51,245,300 | |
| | | | |
Shares outstanding | | | 2,508,263 | |
| | | | |
Net asset value and maximum offering price per share | | $ | 20.43 | |
| | | | |
| |
| Class 2: | | | | |
Net assets, at value | | $ | 1,302,054,839 | |
| | | | |
Shares outstanding | | | 65,751,013 | |
| | | | |
Net asset value and maximum offering price per share | | $ | 19.80 | |
| | | | |
| |
| Class 4: | | | | |
Net assets, at value | | $ | 32,053,011 | |
| | | | |
Shares outstanding | | | 1,585,420 | |
| | | | |
Net asset value and maximum offering price per share | | $ | 20.22 | |
| | | | |
| | | | |
| FSV-14 | | Annual Report | The accompanying notes are an integral part of these financial statements. | | |
FRANKLIN TEMPLETON VARIABLE INSURANCE PRODUCTS TRUST
FINANCIAL STATEMENTS
Statement of Operations
for the year ended December 31, 2017
| | | | |
| | | Franklin Small
Cap Value VIP Fund | |
Investment income: | | | | |
Dividends: (net of foreign taxes)* | | | | |
Unaffiliated issuers | | | | |
Paid in cash | | $ | 20,025,122 | |
Non-cash dividends | | | 2,378,500 | |
Non-controlled affiliates (Note 3e) | | | | |
Paid in cash | | | 263,559 | |
Interest: | | | | |
Unaffiliated issuers | | | 846,662 | |
| | | | |
Total investment income | | | 23,513,843 | |
| | | | |
Expenses: | | | | |
Management fees (Note 3a) | | | 8,602,706 | |
Distribution fees: (Note 3c) | | | | |
Class 2 | | | 3,232,977 | |
Class 4 | | | 109,908 | |
Custodian fees (Note 4) | | | 22,075 | |
Reports to shareholders | | | 310,726 | |
Professional fees | | | 65,890 | |
Trustees’ fees and expenses | | | 5,878 | |
Other | | | 55,971 | |
| | | | |
Total expenses | | | 12,406,131 | |
Expense reductions (Note 4) | | | (1,807 | ) |
Expenses waived/paid by affiliates (Note 3e) | | | (168,610 | ) |
Net expenses | | | 12,235,714 | |
| | | | |
Net investment income | | | 11,278,129 | |
| | | | |
Realized and unrealized gains (losses): | | | | |
Net realized gain (loss) from: | | | | |
Investments: | | | | |
Unaffiliated issuers | | | 192,677,950 | |
Realized gain distributions from REITs | | | 737,835 | |
Foreign currency transactions | | | 29,167 | |
| | | | |
Net realized gain (loss) | | | 193,444,952 | |
| | | | |
Net change in unrealized appreciation (depreciation) on: | | | | |
Investments: | | | | |
Unaffiliated issuers. | | | (67,861,879 | ) |
Translation of other assets and liabilities denominated in foreign currencies | | | 10,059 | |
| | | | |
Net change in unrealized appreciation (depreciation) | | | (67,851,820 | ) |
| | | | |
Net realized and unrealized gain (loss) | | | 125,593,132 | |
| | | | |
Net increase (decrease) in net assets resulting from operations | | $ | 136,871,261 | |
| | | | |
| |
*Foreign taxes withheld on dividends | | $ | 163,784 | |
| | | | | | |
| | | The accompanying notes are an integral part of these financial statements. | Annual Report | | | FSV-15 | |
FRANKLIN TEMPLETON VARIABLE INSURANCE PRODUCTS TRUST
FINANCIAL STATEMENTS
Statements of Changes in Net Assets
| | | | | | | | |
| | | Franklin Small Cap Value VIP Fund | |
| | | Year Ended December 31, | |
| | | 2017 | | | 2016 | |
Increase (decrease) in net assets: | | | | | | | | |
Operations: | | | | | | | | |
Net investment income | | $ | 11,278,129 | | | $ | 7,749,254 | |
Net realized gain (loss) | | | 193,444,952 | | | | 96,362,922 | |
Net change in unrealized appreciation (depreciation) | | | (67,851,820 | ) | | | 243,787,716 | |
| | | | |
Net increase (decrease) in net assets resulting from operations | | | 136,871,261 | | | | 347,899,892 | |
| | | | |
Distributions to shareholders from: | | | | | | | | |
Net investment income: | | | | | | | | |
Class 1 | | | (357,335 | ) | | | (515,097 | ) |
Class 2 | | | (6,657,162 | ) | | | (10,103,275 | ) |
Class 4 | | | (135,526 | ) | | | (189,568 | ) |
Net realized gains: | | | | | | | | |
Class 1 | | | (3,344,066 | ) | | | (7,134,342 | ) |
Class 2 | | | (91,049,189 | ) | | | (185,669,944 | ) |
Class 4 | | | (2,178,640 | ) | | | (4,020,473 | ) |
| | | | |
Total distributions to shareholders | | | (103,721,918 | ) | | | (207,632,699 | ) |
| | | | |
Capital share transactions: (Note 2) | | | | | | | | |
Class 1 | | | 2,002,869 | | | | (2,877,866 | ) |
Class 2 | | | (95,665,942 | ) | | | 62,430,130 | |
Class 4 | | | (1,521,461 | ) | | | 3,371,117 | |
| | | | |
Total capital share transactions | | | (95,184,534 | ) | | | 62,923,381 | |
| | | | |
Net increase (decrease) in net assets | | | (62,035,191 | ) | | | 203,190,574 | |
Net assets: | | | | | | | | |
Beginning of year | | | 1,447,388,341 | | | | 1,244,197,767 | |
| | | | |
End of year | | $ | 1,385,353,150 | | | $ | 1,447,388,341 | |
| | | | |
Undistributed net investment income included in net assets: | | | | | | | | |
End of year | | $ | 12,100,998 | | | $ | 7,943,725 | |
| | | | |
| | | | |
| FSV-16 | | Annual Report | The accompanying notes are an integral part of these financial statements. | | |
FRANKLIN TEMPLETON VARIABLE INSURANCE PRODUCTS TRUST
Notes to Financial Statements
Franklin Small Cap Value VIP Fund
1. Organization and Significant Accounting Policies
Franklin Templeton Variable Insurance Products Trust (Trust) is registered under the Investment Company Act of 1940 (1940 Act) as an open-end management investment company, consisting of eighteen separate funds and applies the specialized accounting and reporting guidance in U.S. Generally Accepted Accounting Principles (U.S. GAAP). Franklin Small Cap Value VIP Fund (Fund) is included in this report. Shares of the Fund are generally sold only to insurance company separate accounts to fund the benefits of variable life insurance policies or variable annuity contracts. The Fund offers three classes of shares: Class 1, Class 2 and Class 4. Each class of shares may differ by its distribution fees, voting rights on matters affecting a single class and its exchange privilege.
The following summarizes the Fund’s significant accounting policies.
a. Financial Instrument Valuation
The Fund’s investments in financial instruments are carried at fair value daily. Fair value is the price that would be received to sell an asset or paid to transfer a liability in an orderly transaction between market participants on the measurement date. The Fund calculates the net asset value (NAV) per share as of 4 p.m. Eastern time each day the New York Stock Exchange (NYSE) is open for trading. Under compliance policies and procedures approved by the Trust’s Board of Trustees (the Board), the Fund’s administrator has responsibility for oversight of valuation, including leading the cross-functional Valuation Committee (VC). The VC provides administration and oversight of the Fund’s valuation policies and procedures, which are approved annually by the Board. Among other things, these procedures allow the Fund to utilize independent pricing services, quotations from securities and financial instrument dealers, and other market sources to determine fair value.
Equity securities listed on an exchange or on the NASDAQ National Market System are valued at the last quoted sale price or the official closing price of the day, respectively. Foreign equity securities are valued as of the close of trading on the foreign stock exchange on which the security is primarily traded, or as of 4 p.m. Eastern time. The value is then converted into its U.S. dollar equivalent at the foreign exchange rate in effect at 4 p.m. Eastern time on the day that the value of the security is determined. Over-the-counter (OTC) securities are
valued within the range of the most recent quoted bid and ask prices. Securities that trade in multiple markets or on multiple exchanges are valued according to the broadest and most representative market. Certain equity securities are valued based upon fundamental characteristics or relationships to similar securities.
Debt securities generally trade in the OTC market rather than on a securities exchange. The Fund’s pricing services use multiple valuation techniques to determine fair value. In instances where sufficient market activity exists, the pricing services may utilize a market-based approach through which quotes from market makers are used to determine fair value. In instances where sufficient market activity may not exist or is limited, the pricing services also utilize proprietary valuation models which may consider market characteristics such as benchmark yield curves, credit spreads, estimated default rates, anticipated market interest rate volatility, coupon rates, anticipated timing of principal repayments, underlying collateral, and other unique security features in order to estimate the relevant cash flows, which are then discounted to calculate the fair value.
Investments in open-end mutual funds are valued at the closing NAV.
The Fund has procedures to determine the fair value of financial instruments for which market prices are not reliable or readily available. Under these procedures, the VC convenes on a regular basis to review such financial instruments and considers a number of factors, including significant unobservable valuation inputs, when arriving at fair value. The VC primarily employs a market-based approach which may use related or comparable assets or liabilities, recent transactions, market multiples, book values, and other relevant information for the investment to determine the fair value of the investment. An income-based valuation approach may also be used in which the anticipated future cash flows of the investment are discounted to calculate fair value. Discounts may also be applied due to the nature or duration of any restrictions on the disposition of the investments. Due to the inherent uncertainty of valuations of such investments, the fair values may differ significantly from the values that would have been used had an active market existed. The VC employs various methods for calibrating these valuation approaches including a regular review of key inputs and assumptions, transactional back-testing or disposition analysis, and reviews of any related market activity.
FRANKLIN TEMPLETON VARIABLE INSURANCE PRODUCTS TRUST
NOTES TO FINANCIAL STATEMENTS
Franklin Small Cap Value VIP Fund (continued)
1. Organization and Significant Accounting Policies (continued)
a. Financial Instrument Valuation (continued)
Trading in securities on foreign securities stock exchanges and OTC markets may be completed before 4 p.m. Eastern time. In addition, trading in certain foreign markets may not take place on every Fund’s business day. Occasionally, events occur between the time at which trading in a foreign security is completed and 4 p.m. Eastern time that might call into question the reliability of the value of a portfolio security held by the Fund. As a result, differences may arise between the value of the Fund’s portfolio securities as determined at the foreign market close and the latest indications of value at 4 p.m. Eastern time. In order to minimize the potential for these differences, the VC monitors price movements following the close of trading in foreign stock markets through a series of country specific market proxies (such as baskets of American Depositary Receipts, futures contracts and exchange traded funds). These price movements are measured against established trigger thresholds for each specific market proxy to assist in determining if an event has occurred that may call into question the reliability of the values of the foreign securities held by the Fund. If such an event occurs, the securities may be valued using fair value procedures, which may include the use of independent pricing services.
When the last day of the reporting period is a non-business day, certain foreign markets may be open on those days that the Fund’s NAV is not calculated, which could result in differences between the value of the Fund’s portfolio securities on the last business day and the last calendar day of the reporting period. Any significant security valuation changes due to an open foreign market are adjusted and reflected by the Fund for financial reporting purposes.
b. Foreign Currency Translation
Portfolio securities and other assets and liabilities denominated in foreign currencies are translated into U.S. dollars based on the exchange rate of such currencies against U.S. dollars on the date of valuation. The Fund may enter into foreign currency exchange contracts to facilitate transactions denominated in a foreign currency. Purchases and sales of securities, income and expense items denominated in foreign currencies are translated into U.S. dollars at the exchange rate in effect on the transaction date. Portfolio securities and assets and liabilities denominated in foreign currencies contain risks that those currencies will
decline in value relative to the U.S. dollar. Occasionally, events may impact the availability or reliability of foreign exchange rates used to convert the U.S. dollar equivalent value. If such an event occurs, the foreign exchange rate will be valued at fair value using procedures established and approved by the Board.
The Fund does not separately report the effect of changes in foreign exchange rates from changes in market prices on securities held. Such changes are included in net realized and unrealized gain or loss from investments in the Statement of Operations.
Realized foreign exchange gains or losses arise from sales of foreign currencies, currency gains or losses realized between the trade and settlement dates on securities transactions and the difference between the recorded amounts of dividends, interest, and foreign withholding taxes and the U.S. dollar equivalent of the amounts actually received or paid. Net unrealized foreign exchange gains and losses arise from changes in foreign exchange rates on foreign denominated assets and liabilities other than investments in securities held at the end of the reporting period.
c. Income and Deferred Taxes
It is the Fund’s policy to qualify as a regulated investment company under the Internal Revenue Code. The Fund intends to distribute to shareholders substantially all of its taxable income and net realized gains to relieve it from federal income and if applicable, excise taxes. As a result, no provision for U.S. federal income taxes is required.
The Fund may be subject to foreign taxation related to income received, capital gains on the sale of securities and certain foreign currency transactions in the foreign jurisdictions in which it invests. Foreign taxes, if any, are recorded based on the tax regulations and rates that exist in the foreign markets in which the Fund invests. When a capital gain tax is determined to apply, the Fund records an estimated deferred tax liability in an amount that would be payable if the securities were disposed of on the valuation date.
The Fund may recognize an income tax liability related to its uncertain tax positions under U.S. GAAP when the uncertain tax position has a less than 50% probability that it will be sustained upon examination by the tax authorities based on its technical merits. As of December 31, 2017, the Fund has determined that no tax liability is required in its financial statements related to uncertain tax positions for any open tax
FRANKLIN TEMPLETON VARIABLE INSURANCE PRODUCTS TRUST
NOTES TO FINANCIAL STATEMENTS
Franklin Small Cap Value VIP Fund (continued)
years (or expected to be taken in future tax years). Open tax years are those that remain subject to examination and are based on the statute of limitations in each jurisdiction in which the Fund invests.
d. Security Transactions, Investment Income, Expenses and Distributions
Security transactions are accounted for on trade date. Realized gains and losses on security transactions are determined on a specific identification basis. Interest income and estimated expenses are accrued daily. Amortization of premium and accretion of discount on debt securities are included in interest income. Dividend income and realized gain distributions are recorded on the ex-dividend date except for certain dividends from securities where the dividend rate is not available. In such cases, the dividend is recorded as soon as the information is received by the Fund. Distributions to shareholders are recorded on the ex-dividend date. Distributable earnings are determined according to income tax regulations (tax basis) and may differ from earnings recorded in accordance with U.S. GAAP. These differences may be permanent or temporary. Permanent differences are reclassified among capital accounts to reflect their tax character. These reclassifications have no impact on net assets or the results of operations. Temporary differences are not reclassified, as they may reverse in subsequent periods.
Common expenses incurred by the Trust are allocated among the Funds based on the ratio of net assets of each Fund to the combined net assets of the Trust. Fund specific expenses are charged directly to the Fund that incurred the expense.
Realized and unrealized gains and losses and net investment income, excluding class specific expenses, are allocated daily to each class of shares based upon the relative proportion of net assets of each class. Differences in per share distributions by class are generally due to differences in class specific expenses.
e. Accounting Estimates
The preparation of financial statements in accordance with U.S. GAAP requires management to make estimates and assumptions that affect the reported amounts of assets and liabilities at the date of the financial statements and the amounts of income and expenses during the reporting period. Actual results could differ from those estimates.
f. Guarantees and Indemnifications
Under the Trust’s organizational documents, its officers and trustees are indemnified by the Trust against certain liabilities arising out of the performance of their duties to the Trust. Additionally, in the normal course of business, the Trust, on behalf of the Fund, enters into contracts with service providers that contain general indemnification clauses. The Trust’s maximum exposure under these arrangements is unknown as this would involve future claims that may be made against the Trust that have not yet occurred. Currently, the Trust expects the risk of loss to be remote.
2. Shares of Beneficial Interest
At December 31, 2017, there were an unlimited number of shares authorized (without par value ). Transactions in the Fund’s shares were as follows:
| | | | | | | | | | | | | | | | | | | | |
| | | Year Ended December 31, | |
| | | 2017 | | | | | | 2016 | |
| | | Shares | | | Amount | | | | | | Shares | | | Amount | |
| | | | | |
| Class 1 Shares: | | | | | | | | | | | | | | | | | | | | |
Shares sold | | | 296,526 | | | $ | 5,843,664 | | | | | | | | 219,629 | | | $ | 4,034,514 | |
Shares issued in reinvestment of distributions | | | 198,148 | | | | 3,701,401 | | | | | | | | 456,683 | | | | 7,649,439 | |
Shares redeemed | | | (386,641 | ) | | | (7,542,196 | ) | | | | | | | (809,509 | ) | | | (14,561,819 | ) |
| | | | |
Net increase (decrease) | | | 108,033 | | | $ | 2,002,869 | | | | | | | | (133,197 | ) | | $ | (2,877,866 | ) |
| | | | |
FRANKLIN TEMPLETON VARIABLE INSURANCE PRODUCTS TRUST
NOTES TO FINANCIAL STATEMENTS
Franklin Small Cap Value VIP Fund (continued)
2. Shares of Beneficial Interest (continued)
| | | | | | | | | | | | | | | | | | | | |
| | | Year Ended December 31, | |
| | | 2017 | | | | | | 2016 | |
| | | Shares | | | Amount | | | | | | Shares | | | Amount | |
| | | | | |
| Class 2 Shares: | | | | | | | | | | | | | | | | | | | | |
Shares sold | | | 4,717,681 | | | $ | 89,392,050 | | | | | | | | 7,124,811 | | | $ | 128,912,250 | |
Shares issued in reinvestment of distributions | | | 5,389,208 | | | | 97,706,351 | | | | | | | | 12,018,000 | | | | 195,773,219 | |
Shares redeemed | | | (14,948,104 | ) | | | (282,764,343 | ) | | | | | | | (14,862,137 | ) | | | (262,255,339 | ) |
| | | | |
Net increase (decrease) | | | (4,841,215 | ) | | $ | (95,665,942 | ) | | | | | | | 4,280,674 | | | $ | 62,430,130 | |
| | | | |
| | | | | |
| Class 4 Shares: | | | | | | | | | | | | | | | | | | | | |
Shares sold | | | 232,357 | | | $ | 4,483,471 | | | | | | | | 330,960 | | | $ | 6,027,880 | |
Shares issued in reinvestment of distributions | | | 124,955 | | | | 2,314,166 | | | | | | | | 253,312 | | | | 4,210,041 | |
Shares redeemed | | | (430,938 | ) | | | (8,319,098 | ) | | | | | | | (379,696 | ) | | | (6,866,804 | ) |
| | | | |
Net increase (decrease) | | | (73,626 | ) | | $ | (1,521,461 | ) | | | | | | | 204,576 | | | $ | 3,371,117 | |
| | | | |
3. Transactions with Affiliates
Franklin Resources, Inc. is the holding company for various subsidiaries that together are referred to as Franklin Templeton Investments. Certain officers and trustees of the Fund are also officers and/or directors of the following subsidiaries:
| | |
| Subsidiary | | Affiliation |
Franklin Advisory Services, LLC (Advisory Services) | | Investment manager |
Franklin Templeton Services, LLC (FT Services) | | Administrative manager |
Franklin Templeton Distributors, Inc. (Distributors) | | Principal underwriter |
Franklin Templeton Investor Services, LLC (Investor Services) | | Transfer agent |
a. Management Fees
The Fund pays an investment management fee to Advisory Services based on the average daily net assets of the Fund as follows:
| | |
| Annualized Fee Rate | | Net Assets |
0.750% | | Up to and including $200 million |
0.635% | | Over $200 million, up to and including $700 million |
0.600% | | Over $700 million, up to and including $1.2 billion |
0.575% | | Over $1.2 billion, up to and including $1.3 billion |
0.475% | | In excess of $1.3 billion |
For the year ended December 31, 2017, the gross effective investment management fee rate was 0.626% of the Fund’s average daily net assets.
b. Administrative Fees
Under an agreement with Advisory Services, FT Services provides administrative services to the Fund. The fee is paid by Advisory Services based on the Fund’s average daily net assets, and is not an additional expense of the Fund.
FRANKLIN TEMPLETON VARIABLE INSURANCE PRODUCTS TRUST
NOTES TO FINANCIAL STATEMENTS
Franklin Small Cap Value VIP Fund (continued)
c. Distribution Fees
The Board has adopted distribution plans for Class 2 and Class 4 shares pursuant to Rule 12b-1 under the 1940 Act. Under the Fund’s compensation distribution plans, the Fund pays Distributors for costs incurred in connection with the servicing, sale and distribution of the Fund’s shares up to 0.35% per year of its average daily net assets of each class. The Board has agreed to limit the current rate to 0.25% per year for Class 2. The plan year, for purposes of monitoring compliance with the maximum annual plan rates, is February 1 through January 31.
d. Transfer Agent Fees
Investor Services, under terms of an agreement, performs shareholder servicing for the Fund and is not paid by the Fund for the services.
e. Investments in Affiliated Management Investment Companies
The Fund invests in one or more affiliated management investment companies for purposes other than exercising a controlling influence over the management or policies. Management fees paid by the Fund are waived on assets invested in the affiliated management investment companies, as noted in the Statement of Operations, in an amount not to exceed the management and administrative fees paid directly or indirectly by each affiliate. Prior to January 1, 2014, the waiver was accounted for as a reduction to management fees. During the year ended December 31, 2017, the Fund held investments in affiliated management investment companies as follows:
| | | | | | | | | | | | | | | | | | | | | | | | | | | | | | | | |
| | | Number of Shares Held at Beginning of Year | | | Gross Additions | | | Gross Reductions | | | Number of Shares Held at End of Year | | | Value at End of Year | | | Dividend Income | | | Realized Gain (Loss) | | | Net Change in Unrealized Appreciation (Depreciation) | |
| Non-Controlled Affiliates | | | | | | | | | | | | | | | | | | | | | | | | | | | | | | | | |
Institutional Fiduciary Trust Money Market Portfolio, 0.89% | | | 46,387,989 | | | | 276,143,786 | | | | (279,039,770 | ) | | | 43,492,005 | | | $ | 43,492,005 | | | $ | 263,559 | | | $ | — | | | $ | — | |
| | | | | | | | | | | | | | | | | | | | |
4. Expense Offset Arrangement
The Fund has entered into an arrangement with its custodian whereby credits realized as a result of uninvested cash balances are used to reduce a portion of the Fund’s custodian expenses. During the year ended December 31, 2017, the custodian fees were reduced as noted in the Statement of Operations.
5. Income Taxes
The tax character of distributions paid during the years ended December 31, 2017 and 2016, was as follows:
| | | | | | | | |
| | | 2017 | | | 2016 | |
Distributions paid from: | | | | | | | | |
Ordinary income | | $ | 7,150,023 | | | $ | 10,807,940 | |
Long term capital gain | | | 96,571,895 | | | | 196,824,759 | |
| | | | |
| | $ | 103,721,918 | | | $ | 207,632,699 | |
| | | | |
FRANKLIN TEMPLETON VARIABLE INSURANCE PRODUCTS TRUST
NOTES TO FINANCIAL STATEMENTS
Franklin Small Cap Value VIP Fund (continued)
5. Income Taxes (continued)
At December 31, 2017, the cost of investments, net unrealized appreciation (depreciation), undistributed ordinary income and undistributed long term capital gains for income tax purposes were as follows:
| | | | |
Cost of investments. | | $ | 1,014,804,083 | |
| | | | |
Unrealized appreciation | | $ | 378,188,891 | |
Unrealized depreciation | | | (6,987,604 | ) |
| | | | |
Net unrealized appreciation (depreciation) | | $ | 371,201,287 | |
| | | | |
Undistributed ordinary income | | $ | 24,447,462 | |
Undistributed long term capital gains | | | 181,682,526 | |
| | | | |
Distributable earnings | | $ | 206,129,988 | |
| | | | |
Differences between income and/or capital gains as determined on a book basis and a tax basis are primarily due to differing treatment of wash sales.
6. Investment Transactions
Purchases and sales of investments (excluding short term securities) for the year ended December 31, 2017, aggregated $445,072,972 and $634,728,533, respectively.
7. Credit Facility
The Fund together with other U.S. registered and foreign investment funds (collectively, Borrowers), managed by Franklin Templeton Investments, are borrowers in a joint syndicated senior unsecured credit facility totaling $2 billion (Global Credit Facility) which matured on February 9, 2018. This Global Credit Facility provides a source of funds to the Borrowers for temporary and emergency purposes, including the ability to meet future unanticipated or unusually large redemption requests. Effective February 9, 2018, the Borrowers renewed the Global Credit Facility for a one year term, maturing February 8, 2019, for a total of $2 billion.
Under the terms of the Global Credit Facility, the Fund shall, in addition to interest charged on any borrowings made by the Fund and other costs incurred by the Fund, pay its share of fees and expenses incurred in connection with the implementation and maintenance of the Global Credit Facility, based upon its relative share of the aggregate net assets of all of the Borrowers, including an annual commitment fee of 0.15% based upon the unused portion of the Global Credit Facility. These fees are reflected in other expenses in the Statement of Operations. During the year ended December 31, 2017, the Fund did not use the Global Credit Facility.
8. Fair Value Measurements
The Fund follows a fair value hierarchy that distinguishes between market data obtained from independent sources (observable inputs) and the Fund’s own market assumptions (unobservable inputs). These inputs are used in determining the value of the Fund’s financial instruments and are summarized in the following fair value hierarchy:
| | • | | Level 1 – quoted prices in active markets for identical financial instruments |
| | • | | Level 2 – other significant observable inputs (including quoted prices for similar financial instruments, interest rates, prepayment speed, credit risk, etc.) |
FRANKLIN TEMPLETON VARIABLE INSURANCE PRODUCTS TRUST
NOTES TO FINANCIAL STATEMENTS
Franklin Small Cap Value VIP Fund (continued)
| | • | | Level 3 – significant unobservable inputs (including the Fund’s own assumptions in determining the fair value of financial instruments) |
The input levels are not necessarily an indication of the risk or liquidity associated with financial instruments at that level.
For movements between the levels within the fair value hierarchy, the Fund has adopted a policy of recognizing the transfers as of the date of the underlying event which caused the movement.
A summary of inputs used as of December 31, 2017, in valuing the Fund’s assets carried at fair value, is as follows:
| | | | | | | | | | | | | | | | |
| | | Level 1 | | | Level 2 | | | Level 3 | | | Total | |
| | | | |
| Assets: | | | | | | | | | | | | | | | | |
Investments in Securities:a | | | | | | | | | | | | | | | | |
Equity Investments | | $ | 1,330,317,570 | | | $ | — | | | $ | — | | | $ | 1,330,317,570 | |
Corporate Bonds | | | — | | | | 12,195,795 | | | | — | | | | 12,195,795 | |
Short Term Investments | | | 43,492,005 | | | | — | | | | — | | | | 43,492,005 | |
| | | | |
Total Investments in Securities | | $ | 1,373,809,575 | | | $ | 12,195,795 | | | $ | — | | | $ | 1,386,005,370 | |
| | | | |
aFor detailed categories, see the accompanying Statement of Investments.
9. Subsequent Events
The Fund has evaluated subsequent events through the issuance of the financial statements and determined that no events have occurred that require disclosure other than those already disclosed in the financial statements.
FRANKLIN TEMPLETON VARIABLE INSURANCE PRODUCTS TRUST
Report of Independent Registered Public Accounting Firm
To the Board of Trustees of Franklin Templeton Variable Insurance Products Trust and Shareholders of Franklin Small Cap Value VIP Fund
Opinion on the Financial Statements
We have audited the accompanying statement of assets and liabilities, including the statement of investments, of Franklin Small Cap Value VIP Fund (the “Fund”) as of December 31, 2017, the related statement of operations for the year ended December 31, 2017, the statement of changes in net assets for each of the two years in the period ended December 31, 2017, including the related notes, and the financial highlights for each of the five years in the period ended December 31, 2017 (collectively referred to as the “financial statements”). In our opinion, the financial statements present fairly, in all material respects, the financial position of the Fund as of December 31, 2017, the results of its operations for the year then ended, the changes in its net assets for each of the two years in the period ended December 31, 2017 and the financial highlights for each of the five years in the period ended December 31, 2017 in conformity with accounting principles generally accepted in the United States of America.
Basis for Opinion
These financial statements are the responsibility of the Fund’s management. Our responsibility is to express an opinion on the Fund’s financial statements based on our audits. We are a public accounting firm registered with the Public Company Accounting Oversight Board (United States) (“PCAOB”) and are required to be independent with respect to the Fund in accordance with the U.S. federal securities laws and the applicable rules and regulations of the Securities and Exchange Commission and the PCAOB.
We conducted our audits of these financial statements in accordance with the standards of the PCAOB. Those standards require that we plan and perform the audit to obtain reasonable assurance about whether the financial statements are free of material misstatement, whether due to error or fraud.
Our audits included performing procedures to assess the risks of material misstatement of the financial statements, whether due to error or fraud, and performing procedures that respond to those risks. Such procedures included examining, on a test basis, evidence regarding the amounts and disclosures in the financial statements. Our audits also included evaluating the accounting principles used and significant estimates made by management, as well as evaluating the overall presentation of the financial statements. Our procedures included confirmation of securities owned as of December 31, 2017 by correspondence with the custodian, transfer agent, and brokers; when replies were not received from brokers, we performed other auditing procedures. We believe that our audits provide a reasonable basis for our opinion.
PricewaterhouseCoopers LLP
San Francisco, California
February 15, 2018
We have served as the auditor of one or more investment companies in the Franklin Templeton Group of Funds since 1948.
FRANKLIN TEMPLETON VARIABLE INSURANCE PRODUCTS TRUST
Tax Information (unaudited)
Franklin Small Cap Value VIP Fund
Under Section 852(b)(3)(C) of the Internal Revenue Code (Code), the Fund hereby reports the maximum amount allowable but no less than $96,571,895 as a long term capital gain dividend for the fiscal year ended December 31, 2017.
Under Section 854(b)(1)(A) of the Code, the Fund hereby reports 100% of the ordinary income dividends as income qualifying for the dividends received deduction for the fiscal year ended December 31, 2017.
This page intentionally left blank.
Franklin Small-Mid Cap Growth VIP Fund
This annual report for Franklin Small-Mid Cap Growth VIP Fund covers the fiscal year ended December 31, 2017.
Class 2 Performance Summary as of December 31, 2017
Average annual total return of Class 2 shares* represents the average annual change in value, assuming reinvestment of dividends and capital gains. Average returns smooth out variations in returns, which can be significant; they are not the same as year-by-year results.
| | | | | | | | | | | | |
| Periods ended 12/31/17 | | 1-Year | | | 5-Year | | | 10-Year | |
Average Annual Total Return | | | +21.40% | | | | +12.82% | | | | +7.35% | |
*The Fund has a fee waiver associated with any investment it makes in a Franklin Templeton money fund and/or other Franklin Templeton fund, contractually guaranteed through 4/30/18. Fund investment results reflect the fee waiver; without this waiver, the results would have been lower.
Performance reflects the Fund’s Class 2 operating expenses, but does not include any contract fees, expenses or sales charges. If they had been included, performance would be lower. These charges and deductions, particularly for variable life policies, can have a significant effect on contract values and insurance benefits. See the contract prospectus for a complete description of these expenses, including sales charges.
Performance data represent past performance, which does not guarantee future results. Investment return and principal value will fluctuate, and you may have a gain or loss when you sell your shares. Current performance may differ from figures shown.
Total Return Index Comparison for a Hypothetical $10,000 Investment (1/1/08–12/31/17)
The graph below shows the change in value of a hypothetical $10,000 investment in the Fund over the indicated period and includes reinvestment of any income or distributions. The Fund’s performance* is compared to the performance of the Standard & Poor’s® 500 Index (S&P 500®) and the Russell Midcap® Growth Index. One cannot invest directly in an index, and an index is not representative of the Fund’s portfolio. Please see Important Notes to Performance Information preceding the Fund Summaries.
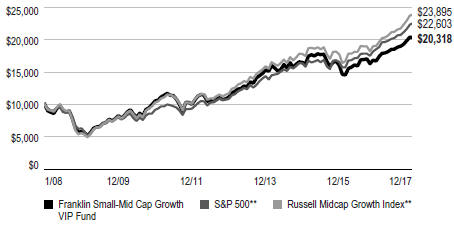
**Source: Morningstar. Please see Index Descriptions following the Fund Summaries.
FRANKLIN SMALL-MID CAP GROWTH VIP FUND
Fund Goal and Main Investments
The Fund seeks long-term capital growth. Under normal market conditions, the Fund invests at least 80% of its net assets in equity securities of small-capitalization and mid-capitalization companies. For this Fund, small cap companies are those within the market capitalization range of companies in the Russell 2500TM Index at the time of purchase, and midcap companies are those within the market capitalization range of companies in the Russell Midcap® Index at the time of purchase.1
Fund Risks
All investments involve risks, including possible loss of principal. Growth stock prices reflect projections of future earnings or revenues, and can, therefore, fall dramatically if the company fails to meet those projections. Smaller, midsized or relatively new or unseasoned companies can be particularly sensitive to changing economic conditions, and their prospects for growth are less certain than those of larger, more established companies. Historically, these securities have experienced more price volatility than larger company stocks, especially over the short term. To the extent the Fund focuses on particular countries, regions, industries, sectors or types of investment from time to time, it may be subject to greater risk of adverse developments in such areas of focus than a fund that invests in a wider variety of countries, regions, industries, sectors or investments. From time to time, the trading market for a particular security or type of security in which the Fund invests may become less liquid or even illiquid. The Fund is actively managed but there is no guarantee that the manager’s investment decisions will produce the desired results. The Fund’s prospectus also includes a description of the main investment risks.
Performance Overview
You can find the Fund’s one-year total return in the Performance Summary. In comparison, the Fund’s narrow benchmark, the Russell Midcap® Growth Index, generated a +25.27% total return, and its broad benchmark, the S&P 500, produced a +21.83% total return for the same period.2
Portfolio Composition
Based on Total Net Assets as of 12/31/17
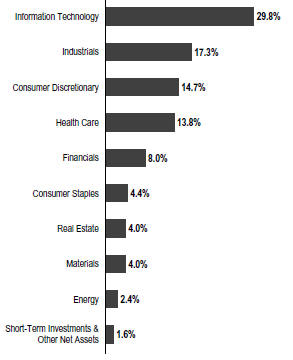
Economic and Market Overview
The US economy grew during the 12 months under review. After strengthening in 2017’s second and third quarters, the economy moderated in the fourth quarter. The economy grew faster in 2017 than in 2016, however, largely due to growth in consumer spending, business investment and exports. The manufacturing and services sectors expanded during the period. The unemployment rate declined from 4.7% in December 2016 to 4.1% at period-end.3 Monthly retail sales were volatile but positive on average during the period. Annual inflation, as measured by the Consumer Price Index, was 2.1% in December 2016, and while it varied over the 12-month period, remained unchanged at period-end.3
The US Federal Reserve (Fed) raised its target range for the federal funds rate 0.25% at its March and June 2017 meetings, amid signs of a growing US economy, strengthening labor
1. Please see Index Descriptions following the Fund Summaries.
2. Source: Morningstar. One cannot invest directly in an index, and an index is not representative of the Fund’s portfolio. Please see Index Descriptions following the Fund Summaries.
3. Source: Bureau of Labor Statistics.
The dollar value, number of shares or principal amount, and names of all portfolio holdings are listed in the Fund’s Statement of Investments (SOI).
FRANKLIN SMALL-MID CAP GROWTH VIP FUND
market and improving business spending. At its December meeting, the Fed raised its target range for the federal funds rate 0.25% to 1.25%–1.50%, as widely anticipated by the market. The Fed also confirmed that the monthly balance sheet reduction would increase from $10 billion to $20 billion beginning in January 2018.
US equity markets rose during the 12-month period, benefiting from mostly upbeat economic data, better US corporate earnings and improving global economic growth. Concerns about the terms of the UK’s exit from the European Union (EU), political uncertainty in the US, tensions between the US and North Korea, and the progress of US health care and tax reform plans curbed market sentiment at times. However, the markets were also supported by investor optimism arising from pro-growth and pro-business policy plans in the US, the prospect for reforms in the EU with Emmanuel Macron’s election as France’s president, and the US Fed chair’s comments indicating optimism about the US economy and the likelihood of gradual rate hikes. Furthermore, the Senate’s approval of a budget plan in October and subsequent passage of a tax reform bill near period-end drove many US equity indexes to end 2017 near record highs. In this environment, the broad US stock market, as measured by the Standard & Poor’s® 500 Index, generated a +21.83% total return for the period.2
Investment Strategy
We use fundamental, bottom-up research to seek companies meeting our criteria of growth potential, quality and valuation. In seeking sustainable growth characteristics, we look for companies we believe can produce sustainable earnings and cash flow growth, evaluating the long-term market opportunity and competitive structure of an industry to target leaders and emerging leaders. We define quality companies as those with strong and improving competitive positions in attractive markets. We also believe important attributes of quality are experienced and talented management teams as well as financial strength reflected in the capital structure, gross and operating margins, free cash flow generation and returns on capital employed. In assessing value, we consider whether security prices fully reflect the balance of the sustainable growth opportunities relative to business and financial risks.
Manager’s Discussion
During the period under review, nearly all sectors represented in the Fund’s portfolio delivered positive returns and
| | | | |
| Top 10 Holdings | | | |
12/31/17 | | | |
Company Sector/Industry | | % of Total
Net Assets | |
Roper Technologies Inc. | | | 2.3% | |
| Industrials | | | | |
NVR Inc. | | | 1.8% | |
| Consumer Discretionary | | | | |
2U Inc. | | | 1.8% | |
| Information Technology | | | | |
ServiceNow Inc. | | | 1.8% | |
| Information Technology | | | | |
Rockwell Automation Inc. | | | 1.7% | |
| Industrials | | | | |
Cognex Corp. | | | 1.7% | |
| Information Technology | | | | |
Vantiv Inc. | | | 1.7% | |
| Information Technology | | | | |
Edwards Lifesciences Corp. | | | 1.5% | |
| Health Care | | | | |
SBA Communications Corp. | | | 1.5% | |
| Real Estate | | | | |
Dollar Tree Inc. | | | 1.5% | |
| Consumer Discretionary | | | | |
contributed to absolute performance. Relative to the Fund’s narrow benchmark, the Russell MidCap Growth® Index, key contributors included stock selection in the information technology (IT), real estate and consumer staples sectors.
In IT, 2U, a provider of cloud-based software-as-a-service solutions for non-profit colleges and universities, contributed to relative performance.4 It benefited from an accelerating growth outlook for a number of new university program partnerships over the past year and a meaningful expansion of the company’s market through the acquisition of short-course provider GetSmarter. Machine vision products provider Cognex continued to report strong growth rates as its primary industrial-automation markets remained strong. In addition, its position in warehouses and consumer electronic end markets drove growth well above its targeted range. This has driven better-than-expected earnings results and fourth-quarter 2017 revenue guidance.
In the real estate sector, SBA Communications, which operates wireless telecommunications infrastructure, contributed to relative returns, as did Monster Beverage in consumer staples.
Another notable contributor was NVR, which builds and sells residential properties. The company improved its profit margins
4. Not part of the index.
FRANKLIN SMALL-MID CAP GROWTH VIP FUND
while expanding orders over the period under review. The company continued to exercise a disciplined capital allocation, with a significant share repurchasing, during the period. In addition, its asset-light model aided its positive return on investment.
In contrast, key detractors from the Fund’s relative performance included stock selection in the consumer discretionary, energy and health care sector during the period.
In consumer discretionary, entertainment technology company IMAX detracted from relative results.4,5 The 2017 domestic summer box office was disappointing relative to initial expectations, driven mostly by poorly reviewed films and franchise fatigue, in our opinion. The weakness in box office returns led to concerns about deteriorating trends. IMAX continued to grow its network, however, especially internationally where theatrical attendance continued to grow. Consumer products manufacturer Newell Brands reported a weak third quarter 2017 and lowered guidance after many retailers lowered inventory by canceling replenishment orders, primarily in the writing and appliances segments. The company seems to be in a better position than its peers but the entire supply chain, which sells into mass retailers is likely under more pressure, in our view.
In the energy sector, oilfield services provider Superior Energy Services detracted from the Fund’s relative performance.4,5 Its share price declined as crude oil prices fell in the first half of 2017, leading to investor concerns that there could be less demand for Superior’s oil exploration and production services. Weaker-than-expected earnings results reported during the period also weighed on the company’s share price.
In health care, medical care services provider DaVita detracted from the Fund’s relative performance.5
Thank you for your participation in Franklin Small-Mid Cap Growth VIP Fund. We look forward to serving your future investment needs.
The foregoing information reflects our analysis, opinions and portfolio holdings as of December 31, 2017, the end of the reporting period. The way we implement our main investment strategies and the resulting portfolio holdings may change depending on factors such as market and economic conditions. These opinions may not be relied upon as investment advice or an offer for a particular security. The information is not a complete analysis of every aspect of any market, country, industry, security or the Fund. Statements of fact are from sources considered reliable, but the investment manager makes no representation or warranty as to their completeness or accuracy. Although historical performance is no guarantee of future results, these insights may help you understand our investment management philosophy.
5. No longer held by period-end.
FRANKLIN SMALL-MID CAP GROWTH VIP FUND
Class 2 Fund Expenses
As an investor in a variable insurance contract (Contract) that indirectly provides for investment in an underlying mutual fund, you can incur transaction and/or ongoing expenses at both the Fund level and the Contract Level: (1) transaction expenses can include sales charges (loads) on purchases, surrender fees, transfer fees and premium taxes; and (2) ongoing expenses can include management fees, distribution and service (12b-1) fees, contract fees, annual maintenance fees, mortality and expense risk fees and other fees and expenses. All mutual funds and Contracts have some types of ongoing expenses. The table below shows Fund-level ongoing expenses and can help you understand these costs and compare them with those of other mutual funds offered through the Contract. The table assumes a $1,000 investment held for the six months indicated. Please refer to the Fund prospectus for additional information on operating expenses.
Actual Fund Expenses
The table below provides information about the actual account values and actual expenses in the columns under the heading “Actual.” In these columns the Fund’s actual return, which includes the effect of ongoing Fund expenses but does not include the effect of ongoing Contract expenses, is used to calculate the “Ending Account Value.” You can estimate the Fund-level expenses you paid during the period by following these steps (of course, your account value and expenses will differ from those in this illustration): Divide your account value by $1,000 (if your account had an $8,600 value, then $8,600 ÷ $1,000 = 8.6). Then multiply the result by the number under the headings “Actual” and “Fund-Level Expenses Paid During Period” (if Fund-Level Expenses Paid During Period were $ 7.50, then 8.6 x $ 7.50 = $64.50). In this illustration, the estimated expenses paid this period at the Fund level are $64.50.
Hypothetical Example for Comparison with Other Mutual Funds
Under the heading “Hypothetical” in the table, information is provided about hypothetical account values and hypothetical expenses based on the Fund’s actual expense ratio and an assumed rate of return of 5% per year before expenses, which is not the Fund’s actual return. This information may not be used to estimate the actual ending account balance or expenses you paid for the period, but it can help you compare ongoing costs of investing in the Fund with those of other mutual funds offered through the Contract. To do so, compare this 5% hypothetical example with the 5% hypothetical examples that appear in the shareholder reports of other funds offered through the Contract.
Please note that expenses shown in the table are meant to highlight ongoing costs at the Fund level only and do not reflect any ongoing expenses at the Contract level, or transaction expenses at either the Fund or Contract levels. In addition, while the Fund does not have transaction expenses, if the transaction and ongoing expenses at the Contract level were included, the expenses shown below would be higher. You should consult your Contract prospectus or disclosure document for more information.
| | | | | | | | | | | | | | | | | | | | | | | | | | |
| | | | | | Actual (actual return after expenses) | | | | | Hypothetical
(5% annual return before expenses) | | | | |
Share Class | |
| Beginning Account
Value 7/1/17 |
| |
| Ending Account
Value 12/31/17 |
| |
| Fund-Level Expenses
Paid During Period
7/1/17–12/31/17 |
1,2 | | | |
| Ending Account
Value 12/31/17 |
| |
| Fund-Level Expenses
Paid During Period
7/1/17–12/31/17 |
1,2 | |
| Net
Annualized
Expense
Ratio |
2 |
Class 2 | | | $1,000 | | | | $1,094.50 | | | | $5.75 | | | | | | $1,019.71 | | | | $5.55 | | | | 1.09% | |
1. Expenses are equal to the annualized expense ratio for the six-month period as indicated above—in the far right column—multiplied by the simple average account value over the period indicated, and then multiplied by 184/365 to reflect the one-half year period.
2. Reflects expenses after fee waivers and expense reimbursements. Does not include any ongoing expenses of the Contract for which the Fund is an investment option or acquired fund fees and expenses.
FRANKLIN TEMPLETON VARIABLE INSURANCE PRODUCTS TRUST
Financial Highlights
Franklin Small-Mid Cap Growth VIP Fund
| | | | | | | | | | | | | | | | | | | | |
| | | Year Ended December 31, | |
| | | 2017 | | | 2016 | | | 2015 | | | 2014 | | | 2013 | |
| Class 1 | | | | | | | | | | | | | | | | | | | | |
Per share operating performance
(for a share outstanding throughout the year) | | | | | | | | | | | | | | | | | | | | |
| | | | | |
Net asset value, beginning of year | | | $17.77 | | | | $19.09 | | | | $24.95 | | | | $28.38 | | | | $21.87 | |
| | | | |
| | | | | |
| Income from investment operationsa: | | | | | | | | | | | | | | | | | | | | |
| | | | | |
Net investment income (loss)b | | | (0.04 | ) | | | (0.03 | ) | | | — | c,d | | | (0.07 | ) | | | (0.09 | ) |
| | | | | |
Net realized and unrealized gains (losses) | | | 3.74 | | | | 0.77 | | | | (0.03 | ) | | | 2.04 | | | | 8.19 | |
| | | | |
Total from investment operations | | | 3.70 | | | | 0.74 | | | | (0.03 | ) | | | 1.97 | | | | 8.10 | |
| | | | |
Less distributions from net realized gains | | | (1.76 | ) | | | (2.06 | ) | | | (5.83 | ) | | | (5.40 | ) | | | (1.59 | ) |
| | | | |
Net asset value, end of year | | | $19.71 | | | | $17.77 | | | | $19.09 | | | | $24.95 | | | | $28.38 | |
| | | | |
| | | | | |
Total returne | | | 21.75% | | | | 4.40% | | | | (2.44)% | | | | 7.78% | | | | 38.50% | |
| | | | | |
| Ratios to average net assets | | | | | | | | | | | | | | | | | | | | |
| | | | | |
Expenses before waiver and payments by affiliates | | | 0.85% | | | | 0.84% | | | | 0.81% | | | | 0.80% | | | | 0.80% | |
| | | | | |
Expenses net of waiver and payments by affiliates | | | 0.84% | f | | | 0.82% | f | | | 0.81% | g | | | 0.80% | g | | | 0.80% | f |
| | | | | |
Net investment income (loss) | | | (0.24)% | | | | (0.16)% | | | | 0.01% | d | | | (0.29)% | | | | (0.35)% | |
| | | | | |
| Supplemental data | | | | | | | | | | | | | | | | | | | | |
| | | | | |
Net assets, end of year (000’s) | | | $36,864 | | | | $31,756 | | | | $87,866 | | | | $99,803 | | | | $98,020 | |
| | | | | |
Portfolio turnover rate | | | 40.49% | | | | 32.23% | h | | | 37.85% | | | | 48.73% | | | | 42.77% | |
aThe amount shown for a share outstanding throughout the period may not correlate with the Statement of Operations for the period due to the timing of sales and repurchases of the Fund’s shares in relation to income earned and/or fluctuating fair value of the investments of the Fund.
bBased on average daily shares outstanding.
cAmount rounds to less than $0.01 per share.
dNet investment income per share includes approximately $0.05 per share related to income received in the form of special dividends in connection with certain Fund holdings. Excluding this amount, the ratio of net investment income to average net assets would have been (0.24)%.
eTotal return does not include fees, charges or expenses imposed by the variable annuity and life insurance contracts for which Franklin Templeton Variable Insurance Products Trust serves as an underlying investment vehicle.
fBenefit of expense reduction rounds to less than 0.01%.
gBenefit of waiver and payments by affiliates rounds to less than 0.01%.
hExcludes the value of portfolio securities delivered as a result of a redemption in-kind. See Note 9.
| | | | |
| FSC-6 | | Annual Report | The accompanying notes are an integral part of these financial statements. | | |
FRANKLIN TEMPLETON VARIABLE INSURANCE PRODUCTS TRUST
FINANCIAL HIGHLIGHTS
Franklin Small-Mid Cap Growth VIP Fund (continued)
| | | | | | | | | | | | | | | | | | | | |
| | | Year Ended December 31, | |
| | | 2017 | | | 2016 | | | 2015 | | | 2014 | | | 2013 | |
| Class 2 | | | | | | | | | | | | | | | | | | | | |
Per share operating performance
(for a share outstanding throughout the year) | | | | | | | | | | | | | | | | | | | | |
| | | | | |
Net asset value, beginning of year | | | $16.27 | | | | $17.69 | | | | $23.56 | | | | $27.16 | | | | $21.04 | |
| | | | |
| | | | | |
| Income from investment operationsa: | | | | | | | | | | | | | | | | | | | | |
| | | | | |
Net investment income (loss)b | | | (0.08 | ) | | | (0.07 | ) | | | (0.05 | )c | | | (0.13 | ) | | | (0.14 | ) |
| | | | | |
Net realized and unrealized gains (losses) | | | 3.40 | | | | 0.71 | | | | 0.01 | | | | 1.93 | | | | 7.85 | |
| | | | |
Total from investment operations | | | 3.32 | | | | 0.64 | | | | (0.04 | ) | | | 1.80 | | | | 7.71 | |
| | | | |
Less distributions from net realized gains | | | (1.76 | ) | | | (2.06 | ) | | | (5.83 | ) | | | (5.40 | ) | | | (1.59 | ) |
| | | | |
Net asset value, end of year | | | $17.83 | | | | $16.27 | | | | $17.69 | | | | $23.56 | | | | $27.16 | |
| | | | |
| | | | | |
Total returnd | | | 21.40% | | | | 4.17% | | | | (2.66)% | | | | 7.47% | | | | 38.15% | |
| | | | | |
| Ratios to average net assets | | | | | | | | | | | | | | | | | | | | |
| | | | | |
Expenses before waiver and payments by affiliates | | | 1.10% | | | | 1.09% | | | | 1.06% | | | | 1.05% | | | | 1.05% | |
| | | | | |
Expenses net of waiver and payments by affiliates | | | 1.09% | e | | | 1.07% | e | | | 1.06% | f | | | 1.05% | f | | | 1.05% | e |
| | | | | |
Net investment income (loss) | | | (0.49)% | | | | (0.41)% | | | | (0.24)% | c | | | (0.54)% | | | | (0.60)% | |
| | | | | |
| Supplemental data | | | | | | | | | | | | | | | | | | | | |
| | | | | |
Net assets, end of year (000’s) | | | $390,094 | | | | $392,777 | | | | $478,649 | | | | $582,772 | | | | $660,806 | |
| | | | | |
Portfolio turnover rate | | | 40.49% | | | | 32.23% | g | | | 37.85% | | | | 48.73% | | | | 42.77% | |
aThe amount shown for a share outstanding throughout the period may not correlate with the Statement of Operations for the period due to the timing of sales and repurchases of the Fund’s shares in relation to income earned and/or fluctuating fair value of the investments of the Fund.
bBased on average daily shares outstanding.
cNet investment income per share includes approximately $0.05 per share related to income received in the form of special dividends in connection with certain Fund holdings. Excluding this amount, the ratio of net investment income to average net assets would have been (0.49)%.
dTotal return does not include fees, charges or expenses imposed by the variable annuity and life insurance contracts for which Franklin Templeton Variable Insurance Products Trust serves as an underlying investment vehicle.
eBenefit of expense reduction rounds to less than 0.01%. fBenefit of waiver and payments by affiliates rounds to less than 0.01%.
gExcludes the value of portfolio securities delivered as a result of a redemption in-kind. See Note 9.
| | | | | | |
| | | The accompanying notes are an integral part of these financial statements. | Annual Report | | | FSC-7 | |
FRANKLIN TEMPLETON VARIABLE INSURANCE PRODUCTS TRUST
FINANCIAL HIGHLIGHTS
Franklin Small-Mid Cap Growth VIP Fund (continued)
| | | | | | | | | | | | | | | | | | | | |
| | | Year Ended December 31, | |
| | | 2017 | | | 2016 | | | 2015 | | | 2014 | | | 2013 | |
| Class 4 | | | | | | | | | | | | | | | | | | | | |
Per share operating performance
(for a share outstanding throughout the year) | | | | | | | | | | | | | | | | | | | | |
| | | | | |
Net asset value, beginning of year | | | $16.81 | | | | $18.23 | | | | $24.14 | | | | $27.72 | | | | $21.47 | |
| | | | |
| | | | | |
| Income from investment operationsa: | | | | | | | | | | | | | | | | | | | | |
| | | | | |
Net investment income (loss)b | | | (0.10 | ) | | | (0.09 | ) | | | (0.07 | )c | | | (0.16 | ) | | | (0.17 | ) |
| | | | | |
Net realized and unrealized gains (losses) | | | 3.52 | | | | 0.73 | | | | (0.01 | ) | | | 1.98 | | | | 8.01 | |
| | | | |
Total from investment operations | | | 3.42 | | | | 0.64 | | | | (0.08 | ) | | | 1.82 | | | | 7.84 | |
| | | | |
Less distributions from net realized gains | | | (1.76 | ) | | | (2.06 | ) | | | (5.83 | ) | | | (5.40 | ) | | | (1.59 | ) |
| | | | |
Net asset value, end of year | | | $18.47 | | | | $16.81 | | | | $18.23 | | | | $24.14 | | | | $27.72 | |
| | | | |
| | | | | |
Total returnd | | | 21.30% | | | | 4.04% | | | | (2.77)% | | | | 7.39% | | | | 37.99% | |
| | | | | |
| Ratios to average net assets | | | | | | | | | | | | | | | | | | | | |
| | | | | |
Expenses before waiver and payments by affiliates | | | 1.20% | | | | 1.19% | | | | 1.16% | | | | 1.15% | | | | 1.15% | |
| | | | | |
Expenses net of waiver and payments by affiliates | | | 1.19% | e | | | 1.17% | e | | | 1.16% | f | | | 1.15% | f | | | 1.15% | e |
| | | | | |
Net investment income (loss) | | | (0.59)% | | | | (0.51)% | | | | (0.34)% | c | | | (0.64)% | | | | (0.70)% | |
| | | | | |
| Supplemental data | | | | | | | | | | | | | | | | | | | | |
| | | | | |
Net assets, end of year (000’s) | | | $15,829 | | | | $13,825 | | | | $15,105 | | | | $16,384 | | | | $19,132 | |
| | | | | |
Portfolio turnover rate | | | 40.49% | | | | 32.23% | g | | | 37.85% | | | | 48.73% | | | | 42.77% | |
aThe amount shown for a share outstanding throughout the period may not correlate with the Statement of Operations for the period due to the timing of sales and repurchases of the Fund’s shares in relation to income earned and/or fluctuating fair value of the investments of the Fund.
bBased on average daily shares outstanding.
cNet investment income per share includes approximately $0.05 per share related to income received in the form of special dividends in connection with certain Fund holdings. Excluding this amount, the ratio of net investment income to average net assets would have been (0.59)%.
dTotal return does not include fees, charges or expenses imposed by the variable annuity and life insurance contracts for which Franklin Templeton Variable Insurance Products Trust serves as an underlying investment vehicle.
eBenefit of expense reduction rounds to less than 0.01%.
fBenefit of waiver and payments by affiliates rounds to less than 0.01%.
gExcludes the value of portfolio securities delivered as a result of a redemption in-kind. See Note 9.
| | | | |
| FSC-8 | | Annual Report | The accompanying notes are an integral part of these financial statements. | | |
FRANKLIN TEMPLETON VARIABLE INSURANCE PRODUCTS TRUST
Statement of Investments, December 31, 2017
| | | | | | | | | | |
| Franklin Small-Mid Cap Growth VIP Fund | | | | | | |
| | | | | Shares | | | Value | |
| | Common Stocks 98.4% | | | | | | | | |
| | Consumer Discretionary 14.7% | | | | | | | | |
| | Aptiv PLC | | | 63,577 | | | $ | 5,393,237 | |
| a | | Burlington Stores Inc. | | | 22,500 | | | | 2,768,175 | |
| a | | Dollar Tree Inc. | | | 62,111 | | | | 6,665,131 | |
| | Dominos Pizza Inc. | | | 19,200 | | | | 3,628,032 | |
| a,b,c | | DraftKings Inc. | | | 733,541 | | | | 1,159,538 | |
| | Expedia Inc. | | | 36,400 | | | | 4,359,628 | |
| a | | Grand Canyon Education Inc. | | | 46,257 | | | | 4,141,389 | |
| | Hasbro Inc. | | | 11,000 | | | | 999,790 | |
| a | | Laureate Education Inc., A | | | 77,600 | | | | 1,052,256 | |
| a | | Liberty Broadband Corp., C | | | 39,350 | | | | 3,351,046 | |
| | MGM Resorts International | | | 20,000 | | | | 667,800 | |
| | Newell Brands Inc. | | | 120,744 | | | | 3,730,990 | |
| a | | Norwegian Cruise Line Holdings Ltd. | | | 46,778 | | | | 2,490,928 | |
| a | | NVR Inc. | | | 2,282 | | | | 8,005,758 | |
| a | | O’Reilly Automotive Inc. | | | 14,107 | | | | 3,393,298 | |
| | Ross Stores Inc. | | | 59,885 | | | | 4,805,771 | |
| | Thor Industries Inc. | | | 14,100 | | | | 2,125,152 | |
| | Tractor Supply Co. | | | 42,037 | | | | 3,142,266 | |
| | Vail Resorts Inc. | | | 10,000 | | | | 2,124,700 | |
| | Wynn Resorts Ltd. | | | 6,500 | | | | 1,095,835 | |
| | | | | | | | | | |
| | | | | | | | | 65,100,720 | |
| | | | | | | | | | |
| | | Consumer Staples 4.4% | | | | | | |
| | Church & Dwight Co. Inc. | | | 88,500 | | | | 4,440,045 | |
| a | | Hostess Brands Inc., A | | | 93,200 | | | | 1,380,292 | |
| | Lamb Weston Holdings Inc. | | | 15,300 | | | | 863,685 | |
| a | | Monster Beverage Corp. | | | 66,516 | | | | 4,209,798 | |
| | Pinnacle Foods Inc. | | | 74,494 | | | | 4,430,158 | |
| a | | Post Holdings Inc. | | | 53,139 | | | | 4,210,203 | |
| | | | | | | | | | |
| | | | | | | | | 19,534,181 | |
| | | | | | | | | | |
| | | Energy 2.4% | | | | | | |
| | Cabot Oil & Gas Corp., A | | | 147,249 | | | | 4,211,322 | |
| a | | Concho Resources Inc. | | | 10,100 | | | | 1,517,222 | |
| a,d | | Jagged Peak Energy Inc. | | | 192,600 | | | | 3,039,228 | |
| d | | RPC Inc. | | | 67,000 | | | | 1,710,510 | |
| | | | | | | | | | |
| | | | | | | | | 10,478,282 | |
| | | | | | | | | | |
| | | Financials 8.0% | | | | | | |
| | Affiliated Managers Group Inc. | | | 21,786 | | | | 4,471,577 | |
| | Arthur J. Gallagher & Co. | | | 81,608 | | | | 5,164,154 | |
| | CBOE Global Markets Inc. | | | 32,100 | | | | 3,999,339 | |
| | First Republic Bank/CA | | | 36,400 | | | | 3,153,696 | |
| | MarketAxess Holdings Inc. | | | 19,296 | | | | 3,892,968 | |
| | Moody’s Corp. | | | 24,709 | | | | 3,647,295 | |
| | The Progressive Corp. | | | 49,200 | | | | 2,770,944 | |
| a | | SVB Financial Group | | | 18,978 | | | | 4,436,487 | |
| a | | Western Alliance Bancorp | | | 14,400 | | | | 815,328 | |
| | Willis Towers Watson PLC | | | 21,100 | | | | 3,179,559 | |
| | | | | | | | | | |
| | | | | | | | | 35,531,347 | |
| | | | | | | | | | |
FRANKLIN TEMPLETON VARIABLE INSURANCE PRODUCTS TRUST
STATEMENT OF INVESTMENTS
Franklin Small-Mid Cap Growth VIP Fund (continued)
| | | | | | | | | | |
| | | | | Shares | | | Value | |
| | Common Stocks (continued) | | | | | | | | |
| | Health Care 13.8% | | | | | | | | |
| a | | ABIOMED Inc. | | | 5,700 | | | $ | 1,068,237 | |
| a | | Acadia Pharmaceuticals Inc. | | | 32,173 | | | | 968,729 | |
| a | | Agios Pharmaceuticals Inc. | | | 6,500 | | | | 371,605 | |
| a | | Alkermes PLC | | | 19,200 | | | | 1,050,816 | �� |
| a | | Alnylam Pharmaceuticals Inc. | | | 5,400 | | | | 686,070 | |
| a | | BioMarin Pharmaceutical Inc. | | | 26,708 | | | | 2,381,552 | |
| a | | Bioverativ Inc. | | | 15,400 | | | | 830,368 | |
| a | | Centene Corp. | | | 9,000 | | | | 907,920 | |
| a | | Cerner Corp. | | | 47,895 | | | | 3,227,644 | |
| a | | DexCom Inc. | | | 32,788 | | | | 1,881,703 | |
| a | | Edwards Lifesciences Corp. | | | 61,421 | | | | 6,922,761 | |
| a | | Exelixis Inc. | | | 43,700 | | | | 1,328,480 | |
| a | | Hologic Inc. | | | 99,267 | | | | 4,243,664 | |
| a | | Illumina Inc. | | | 26,600 | | | | 5,811,834 | |
| a | | Incyte Corp. | | | 28,869 | | | | 2,734,183 | |
| a | | Insulet Corp. | | | 35,688 | | | | 2,462,472 | |
| a | | Ionis Pharmaceuticals Inc. | | | 13,400 | | | | 674,020 | |
| a | | iRhythm Technologies Inc. | | | 23,900 | | | | 1,339,595 | |
| a | | Jazz Pharmaceuticals PLC | | | 7,600 | | | | 1,023,340 | |
| a | | Mettler-Toledo International Inc. | | | 9,655 | | | | 5,981,466 | |
| a | | Neurocrine Biosciences Inc. | | | 26,344 | | | | 2,044,031 | |
| a | | Nevro Corp. | | | 26,981 | | | | 1,862,768 | |
| a | | Penumbra Inc. | | | 17,248 | | | | 1,623,037 | |
| a | | Revance Therapeutics Inc. | | | 42,472 | | | | 1,518,374 | |
| a | | Seattle Genetics Inc. | | | 11,500 | | | | 615,250 | |
| a | | Tesaro Inc. | | | 5,324 | | | | 441,200 | |
| a | | Waters Corp. | | | 17,300 | | | | 3,342,187 | |
| | Zoetis Inc. | | | 49,800 | | | | 3,587,592 | |
| | | | | | | | | | |
| | | | | | | | | 60,930,898 | |
| | | | | | | | | | |
| | | Industrials 17.3% | | | | | | |
| | Acuity Brands Inc. | | | 17,007 | | | | 2,993,232 | |
| | Alaska Air Group Inc. | | | 16,200 | | | | 1,190,862 | |
| | Allegiant Travel Co. | | | 8,226 | | | | 1,272,974 | |
| | BWX Technologies Inc. | | | 40,100 | | | | 2,425,649 | |
| | Cummins Inc. | | | 8,400 | | | | 1,483,776 | |
| | Dun & Bradstreet Corp. | | | 9,442 | | | | 1,118,027 | |
| | Equifax Inc. | | | 18,700 | | | | 2,205,104 | |
| | Fortive Corp. | | | 44,900 | | | | 3,248,515 | |
| | Hexcel Corp. | | | 79,334 | | | | 4,906,808 | |
| | IDEX Corp. | | | 21,600 | | | | 2,850,552 | |
| a | | IHS Markit Ltd. | | | 110,515 | | | | 4,989,752 | |
| | J.B. Hunt Transport Services Inc. | | | 34,346 | | | | 3,949,103 | |
| a | | Mercury Systems Inc. | | | 19,700 | | | | 1,011,595 | |
| | Old Dominion Freight Line Inc. | | | 12,700 | | | | 1,670,685 | |
| | Republic Services Inc. | | | 35,500 | | | | 2,400,155 | |
| | Rockwell Automation Inc. | | | 38,300 | | | | 7,520,205 | |
| | Roper Technologies Inc. | | | 40,143 | | | | 10,397,037 | |
| | Snap-on Inc. | | | 7,700 | | | | 1,342,110 | |
| | Stanley Black & Decker Inc. | | | 25,896 | | | | 4,394,292 | |
| | Textron Inc. | | | 43,300 | | | | 2,450,347 | |
| a | | Univar Inc. | | | 113,100 | | | | 3,501,576 | |
| a | | Verisk Analytics Inc. | | | 52,061 | | | | 4,997,856 | |
FRANKLIN TEMPLETON VARIABLE INSURANCE PRODUCTS TRUST
STATEMENT OF INVESTMENTS
Franklin Small-Mid Cap Growth VIP Fund (continued)
| | | | | | | | | | |
| | | | | Shares | | | Value | |
| | Common Stocks (continued) | | | | | | | | |
| | Industrials (continued) | | | | | | | | |
| a | | WABCO Holdings Inc. | | | 27,700 | | | $ | 3,974,950 | |
| | | | | | | | | | |
| | | | | | | | | 76,295,162 | |
| | | | | | | | | | |
| | | Information Technology 29.8% | | | | | | |
| a | | 2U Inc. | | | 121,179 | | | | 7,817,257 | |
| a | | Alarm.com Holdings Inc. | | | 46,196 | | | | 1,743,899 | |
| | Amphenol Corp., A | | | 54,600 | | | | 4,793,880 | |
| | Analog Devices Inc. | | | 67,591 | | | | 6,017,627 | |
| a | | ANSYS Inc. | | | 15,569 | | | | 2,297,829 | |
| a | | Aquantia Corp. | | | 25,900 | | | | 293,447 | |
| a | | Atlassian Corp. PLC (Australia) | | | 42,782 | | | | 1,947,437 | |
| a | | Autodesk Inc. | | | 50,800 | | | | 5,325,364 | |
| a | | Black Knight Inc. | | | 24,100 | | | | 1,064,015 | |
| a | | Blackline Inc. | | | 15,800 | | | | 518,240 | |
| | Cognex Corp. | | | 122,296 | | | | 7,479,623 | |
| a | | CoStar Group Inc. | | | 18,835 | | | | 5,593,053 | |
| | CSRA Inc. | | | 126,955 | | | | 3,798,493 | |
| | DXC Technology Co. | | | 36,500 | | | | 3,463,850 | |
| | Fidelity National Information Services Inc. | | | 61,582 | | | | 5,794,250 | |
| a | | Fiserv Inc. | | | 25,400 | | | | 3,330,702 | |
| a | | FleetCor Technologies Inc. | | | 22,995 | | | | 4,424,928 | |
| a | | GoDaddy Inc., A | | | 122,617 | | | | 6,165,183 | |
| a | | Guidewire Software Inc. | | | 27,500 | | | | 2,042,150 | |
| a,d | | Inphi Corp. | | | 63,300 | | | | 2,316,780 | |
| a | | Integrated Device Technology Inc. | | | 75,140 | | | | 2,233,912 | |
| | KLA-Tencor Corp. | | | 39,587 | | | | 4,159,406 | |
| | Lam Research Corp. | | | 28,816 | | | | 5,304,161 | |
| | LogMeIn Inc. | | | 23,100 | | | | 2,644,950 | |
| | Microchip Technology Inc. | | | 58,727 | | | | 5,160,929 | |
| | Monolithic Power Systems | | | 21,100 | | | | 2,370,796 | |
| a | | Q2 Holdings Inc. | | | 22,696 | | | | 836,348 | |
| a | | Red Hat Inc. | | | 18,700 | | | | 2,245,870 | |
| a | | ServiceNow Inc. | | | 59,937 | | | | 7,815,185 | |
| a | | Square Inc., A | | | 61,300 | | | | 2,125,271 | |
| | Symantec Corp. | | | 59,000 | | | | 1,655,540 | |
| a | | Vantiv Inc., A | | | 100,534 | | | | 7,394,276 | |
| a,d | | ViaSat Inc. | | | 54,366 | | | | 4,069,295 | |
| a | | Wix.com Ltd. (Israel) | | | 23,000 | | | | 1,323,650 | |
| a | | Workday Inc., A | | | 42,743 | | | | 4,348,673 | |
| a | | Zendesk Inc. | | | 63,700 | | | | 2,155,608 | |
| | | | | | | | | | |
| | | | | | | | | 132,071,877 | |
| | | | | | | | | | |
| | | Materials 4.0% | | | | | | |
| | Albemarle Corp. | | | 14,900 | | | | 1,905,561 | |
| | Avery Dennison Corp. | | | 16,500 | | | | 1,895,190 | |
| a | | Axalta Coating Systems Ltd. | | | 117,707 | | | | 3,808,999 | |
| | Ball Corp. | | | 54,100 | | | | 2,047,685 | |
| a | | Ingevity Corp. | | | 38,641 | | | | 2,723,031 | |
| | Packaging Corp. of America | | | 18,200 | | | | 2,194,010 | |
| | Vulcan Materials Co. | | | 24,700 | | | | 3,170,739 | |
| | | | | | | | | | |
| | | | | | | | | 17,745,215 | |
| | | | | | | | | | |
FRANKLIN TEMPLETON VARIABLE INSURANCE PRODUCTS TRUST
STATEMENT OF INVESTMENTS
Franklin Small-Mid Cap Growth VIP Fund (continued)
| | | | | | | | | | |
| | | | | Shares | | | Value | |
| | Common Stocks (continued) | | | | | | | | |
| | Real Estate 4.0% | | | | | | | | |
| | American Campus Communities Inc. | | | 45,900 | | | $ | 1,883,277 | |
| a | | CBRE Group Inc. | | | 89,421 | | | | 3,872,823 | |
| | Equinix Inc. | | | 11,853 | | | | 5,372,017 | |
| a | | SBA Communications Corp., A | | | 40,957 | | | | 6,690,736 | |
| | | | | | | | | | |
| | | | | | | | | 17,818,853 | |
| | | | | | | | | | |
| | | |
| | Total Common Stocks (Cost $298,872,865) | | | | | | | 435,506,535 | |
| | | | | | | | | | |
| | | |
| | Short Term Investments 3.5% | | | | | | | | |
| | | Money Market Funds (Cost $7,874,860) 1.8% | | | | | | |
| e,f | | Institutional Fiduciary Trust Money Market Portfolio, 0.89% | | | 7,874,860 | | | | 7,874,860 | |
| | | | | | | | | | |
| | | |
| g | | Investments from Cash Collateral Received from Loaned Securities
(Cost $7,817,025) 1.7% | | | | | | | | |
| | | Money Market Funds 1.7% | | | | | | |
| e,f | | Institutional Fiduciary Trust Money Market Portfolio, 0.89% | | | 7,817,025 | | | | 7,817,025 | |
| | | | | | | | | | |
| | | |
| | Total Investments (Cost $314,564,750) 101.9% | | | | | | | 451,198,420 | |
| | Other Assets, less Liabilities (1.9)% | | | | | | | (8,412,048 | ) |
| | | | | | | | | | |
| | Net Assets 100.0% | | | | | | $ | 442,786,372 | |
| | | | | | | | | | |
aNon-income producing.
bFair valued using significant unobservable inputs. See Note 10 regarding fair value measurements.
cSee Note 7 regarding restricted securities.
dA portion or all of the security is on loan at December 31, 2017. See Note 1(c).
eSee Note 3(e) regarding investments in affiliated management investment companies.
fThe rate shown is the annualized seven-day yield at period end.
gSee Note 1(c) regarding securities on loan.
| | | | |
| FSC-12 | | Annual Report | The accompanying notes are an integral part of these financial statements. | | |
FRANKLIN TEMPLETON VARIABLE INSURANCE PRODUCTS TRUST
Financial Statements
Statement of Assets and Liabilities
December 31, 2017
| | | | |
| | | Franklin Small-Mid
Cap Growth
VIP Fund | |
Assets: | | | | |
+Investments in securities: | | | | |
Cost - Unaffiliated issuers | | $ | 298,872,865 | |
Cost - Non-controlled affiliates (Note 3e) | | | 15,691,885 | |
| | | | |
Value - Unaffiliated issuers | | $ | 435,506,535 | |
Value - Non-controlled affiliates (Note 3e) | | | 15,691,885 | |
Receivables: | | | | |
Capital shares sold | | | 91,110 | |
Dividends and interest | | | 121,075 | |
Other assets | | | 53 | |
| | | | |
Total assets | | | 451,410,658 | |
| | | | |
Liabilities: | | | | |
Payables: | | | | |
Capital shares redeemed. | | | 191,642 | |
Management fees | | | 302,012 | |
Distribution fees | | | 180,377 | |
Payable upon return of securities loaned | | | 7,817,025 | |
Accrued expenses and other liabilities | | | 133,230 | |
| | | | |
Total liabilities. | | | 8,624,286 | |
| | | | |
Net assets, at value | | $ | 442,786,372 | |
| | | | |
Net assets consist of: | | | | |
Paid-in capital | | $ | 262,034,512 | |
Net unrealized appreciation (depreciation) | | | 136,633,670 | |
Accumulated net realized gain (loss) | | | 44,118,190 | |
| | | | |
Net assets, at value | | $ | 442,786,372 | |
| | | | |
| |
| Class 1: | | | | |
Net assets, at value | | $ | 36,863,724 | |
| | | | |
Shares outstanding | | | 1,870,208 | |
| | | | |
Net asset value and maximum offering price per share | | $ | 19.71 | |
| | | | |
| |
| Class 2: | | | | |
Net assets, at value | | $ | 390,094,087 | |
| | | | |
Shares outstanding | | | 21,878,285 | |
| | | | |
Net asset value and maximum offering price per share | | $ | 17.83 | |
| | | | |
| |
| Class 4: | | | | |
Net assets, at value | | $ | 15,828,561 | |
| | | | |
Shares outstanding | | | 856,987 | |
| | | | |
Net asset value and maximum offering price per share | | $ | 18.47 | |
| | | | |
| |
+Includes securities loaned | | $ | 7,611,210 | |
| | | | | | |
| | | The accompanying notes are an integral part of these financial statements. | Annual Report | | | FSC-13 | |
FRANKLIN TEMPLETON VARIABLE INSURANCE PRODUCTS TRUST
FINANCIAL STATEMENTS
Statement of Operations
for the year ended December 31, 2017
| | | | |
| | | Franklin Small-Mid
Cap Growth
VIP Fund | |
Investment income: | | | | |
Dividends: | | | | |
Unaffiliated issuers | | $ | 2,654,474 | |
Non-controlled affiliates (Note 3e) | | | 73,986 | |
Income from securities loaned (net of fees and rebates) | | | 32,271 | |
| | | | |
Total investment income | | | 2,760,731 | |
| | | | |
Expenses: | | | | |
Management fees (Note 3a) | | | 3,665,287 | |
Distribution fees: (Note 3c) | | | | |
Class 2 | | | 1,018,790 | |
Class 4 | | | 53,173 | |
Custodian fees (Note 4) | | | 3,828 | |
Reports to shareholders | | | 154,879 | |
Professional fees | | | 43,652 | |
Trustees’ fees and expenses | | | 1,956 | |
Other | | | 29,287 | |
| | | | |
Total expenses | | | 4,970,852 | |
Expense reductions (Note 4) | | | (61 | ) |
Expenses waived/paid by affiliates (Note 3e) | | | (58,144 | ) |
| | | | |
Net expenses | | | 4,912,647 | |
| | | | |
Net investment income (loss) | | | (2,151,916 | ) |
| | | | |
Realized and unrealized gains (losses): | | | | |
Net realized gain (loss) from: | | | | |
Investments: | | | | |
Unaffiliated issuers | | | 46,758,223 | |
Foreign currency transactions | | | 290 | |
| | | | |
Net realized gain (loss) | | | 46,758,513 | |
| | | | |
Net change in unrealized appreciation (depreciation) on: | | | | |
Investments: | | | | |
Unaffiliated issuers | | | 44,201,889 | |
| | | | |
Net realized and unrealized gain (loss) | | | 90,960,402 | |
| | | | |
Net increase (decrease) in net assets resulting from operations | | $ | 88,808,486 | |
| | | | |
| | | | |
| FSC-14 | | Annual Report | The accompanying notes are an integral part of these financial statements. | | |
FRANKLIN TEMPLETON VARIABLE INSURANCE PRODUCTS TRUST
FINANCIAL STATEMENTS
Statements of Changes in Net Assets
| | | | | | | | |
| | | Franklin Small-Mid Cap Growth VIP Fund | |
| | | Year Ended December 31, | |
| | | 2017 | | | 2016 | |
Increase (decrease) in net assets: | | | | | | | | |
Operations: | | | | | | | | |
Net investment income (loss) | | $ | (2,151,916 | ) | | $ | (1,996,016 | ) |
Net realized gain (loss) | | | 46,758,513 | | | | 66,637,011 | |
Net change in unrealized appreciation (depreciation) | | | 44,201,889 | | | | (44,367,102 | ) |
| | | | |
Net increase (decrease) in net assets resulting from operations | | | 88,808,486 | | | | 20,273,893 | |
| | | | |
Distributions to shareholders from: | | | | | | | | |
Net realized gains: | | | | | | | | |
Class 1 | | | (3,085,657 | ) | | | (8,833,462 | ) |
Class 2 | | | (39,960,537 | ) | | | (52,547,749 | ) |
Class 4 | | | (1,450,459 | ) | | | (1,581,894 | ) |
| | | | |
Total distributions to shareholders | | | (44,496,653 | ) | | | (62,963,105 | ) |
| | | | |
Capital share transactions: (Note 2) | | | | | | | | |
Class 1 | | | 1,442,945 | | | | (50,265,073 | ) |
Class 2 | | | (41,878,699 | ) | | | (50,062,313 | ) |
Class 4 | | | 552,508 | | | | (245,962 | ) |
| | | | |
Total capital share transactions | | | (39,883,246 | ) | | | (100,573,348 | ) |
| | | | |
Net increase (decrease) in net assets | | | 4,428,587 | | | | (143,262,560 | ) |
Net assets (there is no undistributed net investment income at beginning or end of year): | | | | | | | | |
Beginning of year | | | 438,357,785 | | | | 581,620,345 | |
| | | | |
End of year | | $ | 442,786,372 | | | $ | 438,357,785 | |
| | | | |
| | | | | | |
| | | The accompanying notes are an integral part of these financial statements. | Annual Report | | | FSC-15 | |
FRANKLIN TEMPLETON VARIABLE INSURANCE PRODUCTS TRUST
Notes to Financial Statements
Franklin Small-Mid Cap Growth VIP Fund
1. Organization and Significant Accounting Policies
Franklin Templeton Variable Insurance Products Trust (Trust) is registered under the Investment Company Act of 1940 (1940 Act) as an open-end management investment company, consisting of eighteen separate funds and applies the specialized accounting and reporting guidance in U.S. Generally Accepted Accounting Principles (U.S. GAAP). Franklin Small-Mid Cap Growth VIP Fund (Fund) is included in this report. Shares of the Fund are generally sold only to insurance company separate accounts to fund the benefits of variable life insurance policies or variable annuity contracts. At December 31, 2017, 47.6% of the Fund’s shares were held through one insurance company. Investment activities of these insurance company separate accounts could have a material impact on the Fund. The Fund offers three classes of shares: Class 1, Class 2 and Class 4. Each class of shares differs by its distribution fees, voting rights on matters affecting a single class and its exchange privilege.
The following summarizes the Fund’s significant accounting policies.
a. Financial Instrument Valuation
The Fund’s investments in financial instruments are carried at fair value daily. Fair value is the price that would be received to sell an asset or paid to transfer a liability in an orderly transaction between market participants on the measurement date. The Fund calculates the net asset value (NAV) per share as of 4 p.m. Eastern time each day the New York Stock Exchange (NYSE) is open for trading. Under compliance policies and procedures approved by the Trust’s Board of Trustees (the Board), the Fund’s administrator has responsibility for oversight of valuation, including leading the cross-functional Valuation Committee (VC). The VC provides administration and oversight of the Fund’s valuation policies and procedures, which are approved annually by the Board. Among other things, these procedures allow the Fund to utilize independent pricing services, quotations from securities and financial instrument dealers, and other market sources to determine fair value.
Equity securities listed on an exchange or on the NASDAQ National Market System are valued at the last quoted sale price or the official closing price of the day, respectively. Foreign equity securities are valued as of the close of trading on the foreign stock exchange on which the security is primarily traded, or as of 4 p.m. Eastern time. The value is then converted
into its U.S. dollar equivalent at the foreign exchange rate in effect at 4 p.m. Eastern time on the day that the value of the security is determined. Over-the-counter (OTC) securities are valued within the range of the most recent quoted bid and ask prices. Securities that trade in multiple markets or on multiple exchanges are valued according to the broadest and most representative market. Certain equity securities are valued based upon fundamental characteristics or relationships to similar securities.
Investments in open-end mutual funds are valued at the closing NAV.
The Fund has procedures to determine the fair value of financial instruments for which market prices are not reliable or readily available. Under these procedures, the VC convenes on a regular basis to review such financial instruments and considers a number of factors, including significant unobservable valuation inputs, when arriving at fair value. The VC primarily employs a market-based approach which may use related or comparable assets or liabilities, recent transactions, market multiples, book values, and other relevant information for the investment to determine the fair value of the investment. An income-based valuation approach may also be used in which the anticipated future cash flows of the investment are discounted to calculate fair value. Discounts may also be applied due to the nature or duration of any restrictions on the disposition of the investments. Due to the inherent uncertainty of valuations of such investments, the fair values may differ significantly from the values that would have been used had an active market existed. The VC employs various methods for calibrating these valuation approaches including a regular review of key inputs and assumptions, transactional back-testing or disposition analysis, and reviews of any related market activity.
Trading in securities on foreign securities stock exchanges and OTC markets may be completed before 4 p.m. Eastern time. In addition, trading in certain foreign markets may not take place on every Fund’s business day. Occasionally, events occur between the time at which trading in a foreign security is completed and 4 p.m. Eastern time that might call into question the reliability of the value of a portfolio security held by the Fund. As a result, differences may arise between the value of the Fund’s portfolio securities as determined at the foreign market close and the latest indications of value at 4 p.m. Eastern time. In order to minimize the potential for these differences, the VC monitors price movements following the close of trading in foreign stock markets through a series of country
FRANKLIN TEMPLETON VARIABLE INSURANCE PRODUCTS TRUST
NOTES TO FINANCIAL STATEMENTS
Franklin Small-Mid Cap Growth VIP Fund (continued)
specific market proxies (such as baskets of American Depositary Receipts, futures contracts and exchange traded funds). These price movements are measured against established trigger thresholds for each specific market proxy to assist in determining if an event has occurred that may call into question the reliability of the values of the foreign securities held by the Fund. If such an event occurs, the securities may be valued using fair value procedures, which may include the use of independent pricing services.
When the last day of the reporting period is a non-business day, certain foreign markets may be open on those days that the Fund’s NAV is not calculated, which could result in differences between the value of the Fund’s portfolio securities on the last business day and the last calendar day of the reporting period. Any significant security valuation changes due to an open foreign market are adjusted and reflected by the Fund for financial reporting purposes.
b. Foreign Currency Translation
Portfolio securities and other assets and liabilities denominated in foreign currencies are translated into U.S. dollars based on the exchange rate of such currencies against U.S. dollars on the date of valuation. The Fund may enter into foreign currency exchange contracts to facilitate transactions denominated in a foreign currency. Purchases and sales of securities, income and expense items denominated in foreign currencies are translated into U.S. dollars at the exchange rate in effect on the transaction date. Portfolio securities and assets and liabilities denominated in foreign currencies contain risks that those currencies will decline in value relative to the U.S. dollar. Occasionally, events may impact the availability or reliability of foreign exchange rates used to convert the U.S. dollar equivalent value. If such an event occurs, the foreign exchange rate will be valued at fair value using procedures established and approved by the Board.
The Fund does not separately report the effect of changes in foreign exchange rates from changes in market prices on securities held. Such changes are included in net realized and unrealized gain or loss from investments in the Statement of Operations.
Realized foreign exchange gains or losses arise from sales of foreign currencies, currency gains or losses realized between the trade and settlement dates on securities transactions and the difference between the recorded amounts of dividends, interest, and foreign withholding taxes and the U.S. dollar equivalent of
the amounts actually received or paid. Net unrealized foreign exchange gains and losses arise from changes in foreign exchange rates on foreign denominated assets and liabilities other than investments in securities held at the end of the reporting period.
c. Securities Lending
The Fund participates in an agency based securities lending program to earn additional income. The Fund receives cash collateral against the loaned securities in an amount equal to at least 102% of the fair value of the loaned securities. Collateral is maintained over the life of the loan in an amount not less than 100% of the fair value of loaned securities, as determined at the close of Fund business each day; any additional collateral required due to changes in security values is delivered to the Fund on the next business day. The collateral is deposited into a joint cash account with other funds and is used to invest in a money market fund managed by Franklin Advisers, Inc., an affiliate of the Fund. The Fund may receive income from the investment of cash collateral, in addition to lending fees and rebates paid by the borrower. Income from securities loaned, net of fees paid to the securities lending agent and/or third-party vendor, is reported separately in the Statement of Operations. The Fund bears the market risk with respect to the collateral investment, securities loaned, and the risk that the agent may default on its obligations to the Fund. If the borrower defaults on its obligation to return the securities loaned, the Fund has the right to repurchase the securities in the open market using the collateral received. The securities lending agent has agreed to indemnify the Fund in the event of default by a third party borrower.
d. Income and Deferred Taxes
It is the Fund’s policy to qualify as a regulated investment company under the Internal Revenue Code. The Fund intends to distribute to shareholders substantially all of its taxable income and net realized gains to relieve it from federal income and if applicable, excise taxes. As a result, no provision for U.S. federal income taxes is required.
The Fund may be subject to foreign taxation related to income received, capital gains on the sale of securities and certain foreign currency transactions in the foreign jurisdictions in which it invests. Foreign taxes, if any, are recorded based on the tax regulations and rates that exist in the foreign markets in which the Fund invests. When a capital gain tax is determined
FRANKLIN TEMPLETON VARIABLE INSURANCE PRODUCTS TRUST
NOTES TO FINANCIAL STATEMENTS
Franklin Small-Mid Cap Growth VIP Fund (continued)
1. Organization and Significant Accounting Policies (continued)
d. Income and Deferred Taxes (continued)
to apply, the Fund records an estimated deferred tax liability in an amount that would be payable if the securities were disposed of on the valuation date.
The Fund may recognize an income tax liability related to its uncertain tax positions under U.S. GAAP when the uncertain tax position has a less than 50% probability that it will be sustained upon examination by the tax authorities based on its technical merits. As of December 31, 2017, the Fund has determined that no tax liability is required in its financial statements related to uncertain tax positions for any open tax years (or expected to be taken in future tax years). Open tax years are those that remain subject to examination and are based on the statute of limitations in each jurisdiction in which the Fund invests.
e. Security Transactions, Investment Income, Expenses and Distributions
Security transactions are accounted for on trade date. Realized gains and losses on security transactions are determined on a specific identification basis. Estimated expenses are accrued daily. Dividend income is recorded on the ex-dividend date except for certain dividends from securities where the dividend rate is not available. In such cases, the dividend is recorded as soon as the information is received by the Fund. Distributions to shareholders are recorded on the ex-dividend date. Distributable earnings are determined according to income tax regulations (tax basis) and may differ from earnings recorded in accordance with U.S. GAAP. These differences may be permanent or temporary. Permanent differences are reclassified among capital accounts to reflect their tax character. These reclassifications
have no impact on net assets or the results of operations. Temporary differences are not reclassified, as they may reverse in subsequent periods.
Common expenses incurred by the Trust are allocated among the Funds based on the ratio of net assets of each Fund to the combined net assets of the Trust. Fund specific expenses are charged directly to the Fund that incurred the expense.
Realized and unrealized gains and losses and net investment income, excluding class specific expenses, are allocated daily to each class of shares based upon the relative proportion of net assets of each class. Differences in per share distributions by class are generally due to differences in class specific expenses.
f. Accounting Estimates
The preparation of financial statements in accordance with U.S. GAAP requires management to make estimates and assumptions that affect the reported amounts of assets and liabilities at the date of the financial statements and the amounts of income and expenses during the reporting period. Actual results could differ from those estimates.
g. Guarantees and Indemnifications
Under the Trust’s organizational documents, its officers and trustees are indemnified by the Trust against certain liabilities arising out of the performance of their duties to the Trust. Additionally, in the normal course of business, the Trust, on behalf of the Fund, enters into contracts with service providers that contain general indemnification clauses. The Trust’s maximum exposure under these arrangements is unknown as this would involve future claims that may be made against the Trust that have not yet occurred. Currently, the Trust expects the risk of loss to be remote.
FRANKLIN TEMPLETON VARIABLE INSURANCE PRODUCTS TRUST
NOTES TO FINANCIAL STATEMENTS
Franklin Small-Mid Cap Growth VIP Fund (continued)
2. Shares of Beneficial Interest
At December 31, 2017, there were an unlimited number of shares authorized (without par value). Transactions in the Fund’s shares were as follows:
| | | | | | | | | | | | | | | | | | | | |
| | | Year Ended December 31, | |
| | | 2017 | | | | | | 2016 | |
| | | Shares | | | Amount | | | | | | Shares | | | Amount | |
| | | | | |
| Class 1 Shares: | | | | | | | | | | | | | | | | | | | | |
Shares sold | | | 111,735 | | | $ | 2,131,300 | | | | | | | | 134,053 | | | $ | 2,403,127 | |
Shares issued in reinvestment of distributions | | | 170,856 | | | | 3,085,657 | | | | | | | | 521,763 | | | | 8,833,462 | |
Shares redeemed in-kind (Note 9) | | | — | | | | — | | | | | | | | (2,772,844 | ) | | | (48,919,064 | ) |
Shares redeemed | | | (198,990 | ) | | | (3,774,012 | ) | | | | | | | (698,942 | ) | | | (12,582,598 | ) |
| | | | |
Net increase (decrease) | | | 83,601 | | | $ | 1,442,945 | | | | | | | | (2,815,970 | ) | | $ | (50,265,073 | ) |
| | | | |
| Class 2 Shares: | | | | | | | | | | | | | | | | | | | | |
Shares sold | | | 683,937 | | | $ | 11,660,672 | | | | | | | | 1,837,505 | | | $ | 30,239,284 | |
Shares issued in reinvestment of distributions | | | 2,442,575 | | | | 39,960,537 | | | | | | | | 3,385,809 | | | | 52,547,749 | |
Shares redeemed in-kind (Note 9) | | | — | | | | — | | | | | | | | (3,221,857 | ) | | | (52,049,416 | ) |
Shares redeemed | | | (5,392,842 | ) | | | (93,499,908 | ) | | | | | | | (4,916,789 | ) | | | (80,799,930 | ) |
| | | | |
Net increase (decrease) | | | (2,266,330 | ) | | $ | (41,878,699 | ) | | | | | | | (2,915,332 | ) | | $ | (50,062,313 | ) |
| | | | |
| Class 4 Shares: | | | | | | | | | | | | | | | | | | | | |
Shares sold | | | 145,506 | | | $ | 2,584,438 | | | | | | | | 147,333 | | | $ | 2,490,349 | |
Shares issued in reinvestment of distributions | | | 85,574 | | | | 1,450,459 | | | | | | | | 98,560 | | | | 1,581,894 | |
Shares redeemed | | | (196,455 | ) | | | (3,482,389 | ) | | | | | | | (252,259 | ) | | | (4,318,205 | ) |
| | | | |
Net increase (decrease) | | | 34,625 | | | $ | 552,508 | | | | | | | | (6,366 | ) | | $ | (245,962 | ) |
| | | | |
3. Transactions with Affiliates
Franklin Resources, Inc. is the holding company for various subsidiaries that together are referred to as Franklin Templeton Investments. Certain officers and trustees of the Fund are also officers and/or directors of the following subsidiaries:
| | |
| Subsidiary | | Affiliation |
Franklin Advisers, Inc. (Advisers) | | Investment manager |
Franklin Templeton Services, LLC (FT Services) | | Administrative manager |
Franklin Templeton Distributors, Inc. (Distributors) | | Principal underwriter |
Franklin Templeton Investor Services, LLC (Investor Services) | | Transfer agent |
FRANKLIN TEMPLETON VARIABLE INSURANCE PRODUCTS TRUST
NOTES TO FINANCIAL STATEMENTS
Franklin Small-Mid Cap Growth VIP Fund (continued)
3. Transactions with Affiliates (continued)
a. Management Fees
The Fund pays an investment management fee to Advisers based on the average daily net assets of the Fund as follows:
| | |
| Annualized Fee Rate | | Net Assets |
0.800% | | Up to and including $500 million |
0.700% | | Over $500 million, up to and including $1 billion |
0.650% | | Over $1 billion, up to and including $1.5 billion |
0.600% | | Over $1.5 billion, up to and including $6.5 billion |
0.575% | | Over $6.5 billion, up to and including $11.5 billion |
0.550% | | Over $11.5 billion, up to and including $16.5 billion |
0.540% | | Over $16.5 billion, up to and including $19 billion |
0.530% | | Over $19 billion, up to and including $21.5 billion |
0.520% | | In excess of $21.5 billion |
For the year ended December 31, 2017, the gross effective investment management fee rate was 0.800% of the Fund’s average daily net assets.
b. Administrative Fees
Under an agreement with Advisers, FT Services provides administrative services to the Fund. The fee is paid by Advisers based on Fund’s average daily net assets, and is not an additional expense of the Fund.
c. Distribution Fees
The Board has adopted distribution plans for Class 2 and Class 4 shares pursuant to Rule 12b-1 under the 1940 Act. Under the Fund’s compensation distribution plans, the Fund pays Distributors for costs incurred in connection with the servicing, sale and distribution of the Fund’s shares up to 0.35% per year of its average daily net assets of each class. The Board has agreed to limit the current rate to 0.25% per year for Class 2. The plan year, for purposes of monitoring compliance with the maximum annual plan rates, is February 1 through January 31.
d. Transfer Agent Fees
Investor Services, under terms of an agreement, performs shareholder servicing for the Fund and is not paid by the Fund for the services.
FRANKLIN TEMPLETON VARIABLE INSURANCE PRODUCTS TRUST
NOTES TO FINANCIAL STATEMENTS
Franklin Small-Mid Cap Growth VIP Fund (continued)
e. Investments in Affiliated Management Investment Companies
The Fund invests in one or more affiliated management investment companies for purposes other than exercising a controlling influence over the management or policies. Management fees paid by the Fund are waived on assets invested in the affiliated management investment companies, as noted in the Statement of Operations, in an amount not to exceed the management and administrative fees paid directly or indirectly by each affiliate. Prior to January 1, 2014, the waiver was accounted for as a reduction to management fees. During the year ended December 31, 2017, the Fund held investments in affiliated management investment companies as follows:
| | | | | | | | | | | | | | | | | | | | | | | | | | | | | | | | |
| | | Number
of Shares
Held at
Beginning
of Year | | | Gross
Additions | | | Gross
Reductions | | | Number
of Shares
Held at
End of
Year | | | Value at
End of
Year | | | Dividend
Income | | | Realized
Gain
(Loss) | | | Net Change in
Unrealized
Appreciation
(Depreciation) | |
| Non-Controlled Affiliates | | | | | | | | | | | | | | | | | | | | | | | | | | | | | | | | |
Institutional Fiduciary Trust Money Market Portfolio, 0.89% | | | 19,269,553 | | | | 176,532,442 | | | | (180,110,110 | ) | | | 15,691,885 | | | $ | 15,691,885 | | | $ | 73,986 | | | $ | — | | | $ | — | |
| | | | | | | | | | | | | | | | | | | | |
f. Interfund Transactions
The Fund engaged in purchases and sales of investments with funds or other accounts that have common investment managers (or affiliated investment managers), directors, trustees or officers. During the year ended December 31, 2017, these purchase and sale transactions aggregated $0 and $1,045,625, respectively.
4. Expense Offset Arrangement
The Fund has entered into an arrangement with their custodian whereby credits realized as a result of uninvested cash balances are used to reduce a portion of the Fund’s custodian expenses. During the year ended December 31, 2017, the custodian fees were reduced as noted in the Statement of Operations.
5. Income Taxes
The tax character of distributions paid during the years ended December 31, 2017 and 2016, was as follows:
| | | | | | | | |
| | | 2017 | | | 2016 | |
Distributions paid from long term capital gain | | $ | 44,496,653 | | | $ | 62,963,105 | |
| | | | |
At December 31, 2017, the cost of investments, net unrealized appreciation (depreciation), undistributed ordinary income and undistributed long term capital gains for income tax purposes were as follows:
| | | | |
Cost of investments | | $ | 315,003,452 | |
| | | | |
Unrealized appreciation | | $ | 141,378,669 | |
Unrealized depreciation | | | (5,183,701 | ) |
| | | | |
Net unrealized appreciation (depreciation) | | $ | 136,194,968 | |
| | | | |
Undistributed ordinary income | | $ | 4,747,187 | |
Undistributed long term capital gains | | | 39,809,704 | |
| | | | |
Distributable earnings | | $ | 44,556,891 | |
| | | | |
Differences between income and/or capital gains as determined on a book basis and a tax basis are primarily due to differing treatments of pass-through entity income and wash sales.
FRANKLIN TEMPLETON VARIABLE INSURANCE PRODUCTS TRUST
NOTES TO FINANCIAL STATEMENTS
Franklin Small-Mid Cap Growth VIP Fund (continued)
6. Investment Transactions
Purchases and sales of investments (excluding short term securities) for the year ended December 31, 2017, aggregated $179,924,394 and $260,320,269, respectively.
At December 31, 2017, in connection with securities lending transactions, the Fund loaned equity investments and received $7,817,025 of cash collateral. The gross amount of recognized liability for such transactions is included in payable upon return of securities loaned in the Statement of Assets and Liabilities. The agreements can be terminated at any time.
7. Restricted Securities
The Fund invests in securities that are restricted under the Securities Act of 1933 (1933 Act). Restricted securities are often purchased in private placement transactions, and cannot be sold without prior registration unless the sale is pursuant to an exemption under the 1933 Act. Disposal of these securities may require greater effort and expense, and prompt sale at an acceptable price may be difficult. The Fund may have registration rights for restricted securities. The issuer generally incurs all registration costs.
At December 31, 2017, investments in restricted securities, excluding securities exempt from registration under the 1933 Act deemed to be liquid, were as follows:
| | | | | | | | | | | | | | |
| Shares | | Issuer | | Acquisition
Date | | | Cost | | | Value | |
| 733,541 | | DraftKings Inc. (Value is 0.3% of Net Assets) | | | 8/07/15 | | | $ | 2,800,003 | | | $ | 1,159,538 | |
| | | | | | | | | | |
8. Credit Facility
The Fund, together with other U.S. registered and foreign investment funds (collectively, Borrowers), managed by Franklin Templeton Investments, are borrowers in a joint syndicated senior unsecured credit facility totaling $2 billion (Global Credit Facility) which matured on February 9, 2018. This Global Credit Facility provides a source of funds to the Borrowers for temporary and emergency purposes, including the ability to meet future unanticipated or unusually large redemption requests. Effective February 9, 2018, the Borrowers renewed the Global Credit Facility for a one year term, maturing February 8, 2019, for a total of $2 billion.
Under the terms of the Global Credit Facility, the Fund shall, in addition to interest charged on any borrowings made by the Fund and other costs incurred by the Fund, pay its share of fees and expenses incurred in connection with the implementation and maintenance of the Global Credit Facility, based upon its relative share of the aggregate net assets of all of the Borrowers, including an annual commitment fee of 0.15% based upon the unused portion of the Global Credit Facility. These fees are reflected in other expenses in the Statement of Operations. During the year ended December 31, 2017, the Fund did not use the Global Credit Facility.
9. Redemption In-Kind
During the year ended December 31, 2016, the Fund realized $22,002,600 of net gains resulting from a redemption in-kind in which a shareholder redeemed fund shares for cash and securities held by the Fund. Because such gains are not taxable to the Fund and are not distributed to remaining shareholders, they have been reclassified from accumulated net realized gains to paid-in capital.
FRANKLIN TEMPLETON VARIABLE INSURANCE PRODUCTS TRUST
NOTES TO FINANCIAL STATEMENTS
Franklin Small-Mid Cap Growth VIP Fund (continued)
10. Fair Value Measurements
The Fund follows a fair value hierarchy that distinguishes between market data obtained from independent sources (observable inputs) and the Fund’s own market assumptions (unobservable inputs). These inputs are used in determining the value of the Fund’s financial instruments and are summarized in the following fair value hierarchy:
| | • | | Level 1 – quoted prices in active markets for identical financial instruments |
| | • | | Level 2 – other significant observable inputs (including quoted prices for similar financial instruments, interest rates, prepayment speed, credit risk, etc.) |
| | • | | Level 3 – significant unobservable inputs (including the Fund’s own assumptions in determining the fair value of financial instruments) |
The input levels are not necessarily an indication of the risk or liquidity associated with financial instruments at that level.
For movements between the levels within the fair value hierarchy, the Fund has adopted a policy of recognizing the transfers as of the date of the underlying event which caused the movement.
A summary of inputs used as of December 31, 2017, in valuing the Fund’s assets carried at fair value, is as follows:
| | | | | | | | | | | | | | | | |
| | | Level 1 | | | Level 2 | | | Level 3 | | | Total | |
| | | | |
| Assets: | | | | | | | | | | | | | | | | |
Investments in Securities:a | | | | | | | | | | | | | | | | |
Equity Investments: | | | | | | | | | | | | | | | | |
Consumer Discretionary | | $ | 63,941,182 | | | $ | — | | | $ | 1,159,538 | | | $ | 65,100,720 | |
All Other Equity Investments | | | 370,405,815 | | | | — | | | | — | | | | 370,405,815 | |
Short Term Investments | | | 15,691,885 | | | | — | | | | — | | | | 15,691,885 | |
| | | | |
Total Investments in Securities | | $ | 450,038,882 | | | $ | — | | | $ | 1,159,538 | | | $ | 451,198,420 | |
| | | | |
aFor detailed categories, see the accompanying Statement of Investments.
A reconciliation of assets in which Level 3 inputs are used in determining fair value is presented when there are significant Level 3 financial instruments at the beginning and/or end of the year.
11. Subsequent Events
The Fund has evaluated subsequent events through the issuance of the financial statements and determined that no events have occurred that require disclosure other than those already disclosed in the financial statements.
FRANKLIN TEMPLETON VARIABLE INSURANCE PRODUCTS TRUST
Report of Independent Registered Public Accounting Firm
To the Board of Trustees of Franklin Templeton Variable Insurance Products Trust and Shareholders of Franklin Small-Mid Cap Growth VIP Fund
Opinion on the Financial Statements
We have audited the accompanying statement of assets and liabilities, including the statement of investments, of Franklin Small-Mid Cap Growth VIP Fund (the “Fund”) as of December 31, 2017, the related statement of operations for the year ended December 31, 2017, the statement of changes in net assets for each of the two years in the period ended December 31, 2017, including the related notes, and the financial highlights for each of the five years in the period ended December 31, 2017 (collectively referred to as the “financial statements”). In our opinion, the financial statements present fairly, in all material respects, the financial position of the Fund as of December 31, 2017, the results of its operations for the year then ended, the changes in its net assets for each of the two years in the period ended December 31, 2017 and the financial highlights for each of the five years in the period ended December 31, 2017 in conformity with accounting principles generally accepted in the United States of America.
Basis for Opinion
These financial statements are the responsibility of the Fund’s management. Our responsibility is to express an opinion on the Fund’s financial statements based on our audits. We are a public accounting firm registered with the Public Company Accounting Oversight Board (United States) (“PCAOB”) and are required to be independent with respect to the Fund in accordance with the U.S. federal securities laws and the applicable rules and regulations of the Securities and Exchange Commission and the PCAOB.
We conducted our audits of these financial statements in accordance with the standards of the PCAOB. Those standards require that we plan and perform the audit to obtain reasonable assurance about whether the financial statements are free of material misstatement, whether due to error or fraud.
Our audits included performing procedures to assess the risks of material misstatement of the financial statements, whether due to error or fraud, and performing procedures that respond to those risks. Such procedures included examining, on a test basis, evidence regarding the amounts and disclosures in the financial statements. Our audits also included evaluating the accounting principles used and significant estimates made by management, as well as evaluating the overall presentation of the financial statements. Our procedures included confirmation of securities owned as of December 31, 2017 by correspondence with the custodian and transfer agent. We believe that our audits provide a reasonable basis for our opinion.
PricewaterhouseCoopers LLP
San Francisco, California
February 15, 2018
We have served as the auditor of one or more investment companies in the Franklin Templeton Group of Funds since 1948.
FRANKLIN TEMPLETON VARIABLE INSURANCE PRODUCTS TRUST
Tax Information (unaudited)
Franklin Small-Mid Cap Growth VIP Fund
Under Section 852(b)(3)(C) of the Internal Revenue Code, the Fund hereby reports the maximum amount allowable but no less than $44,496,653 as a long term capital gain dividend for the fiscal year ended December 31, 2017.
This page intentionally left blank.
Franklin Strategic Income VIP Fund
This annual report for Franklin Strategic Income VIP Fund covers the fiscal year ended December 31, 2017.
Class 2 Performance Summary as of December 31, 2017
Average annual total return of Class 2 shares* represents the average annual change in value, assuming reinvestment of dividends and capital gains. Average returns smooth out variations in returns, which can be significant; they are not the same as year-by-year results.
| | | | | | | | | | | | |
| Periods ended 12/31/17 | | 1-Year | | | 5-Year | | | 10-Year | |
Average Annual Total Return** | | | +4.56% | | | | +2.69% | | | | +5.04% | |
*The Fund has a fee waiver associated with any investment it makes in a Franklin Templeton money fund and/or other Franklin Templeton fund, contractually guaranteed through 4/30/18. Fund investment results reflect the fee waiver; without this waiver, the results would have been lower.
**Total return information is based on net asset values calculated for shareholder transactions. Certain adjustments were made to the net assets of the Fund at 12/31/17 for financial reporting purposes, and as a result, the total returns based on those net asset values differ from the adjusted total returns reported in the Financial Highlights.
Performance reflects the Fund’s Class 2 operating expenses, but does not include any contract fees, expenses or sales charges. If they had been included, performance would be lower. These charges and deductions, particularly for variable life policies, can have a significant effect on contract values and insurance benefits. See the contract prospectus for a complete description of these expenses, including sales charges.
Performance data represent past performance, which does not guarantee future results. Investment return and principal value will fluctuate, and you may have a gain or loss when you sell your shares. Current performance may differ from figures shown.
Total Return Index Comparison for a Hypothetical $10,000 Investment (1/1/08-12/31/17)
The graph below shows the change in value of a hypothetical $10,000 investment in the Fund over the indicated period and includes reinvestment of any income or distributions. The Fund’s performance* is compared to the performance of the Bloomberg Barclays U.S. Aggregate Bond Index and the Lipper Multi-Sector Income Funds Classification Average. One cannot invest directly in an index, and an index is not representative of the Fund’s portfolio. Please see Important Notes to Performance Information preceding the Fund Summaries.
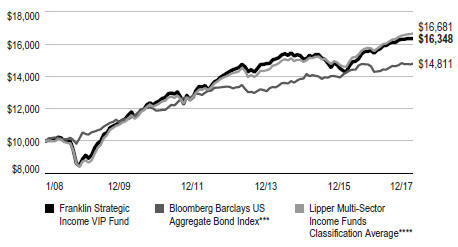
***Source: Morningstar. Please see Index Descriptions following the Fund Summaries.
****Source: Lipper, a Thomson Reuters Company. Please see Index Descriptions following the Fund Summaries.
FRANKLIN STRATEGIC INCOME VIP FUND
Fund Goal and Main Investments
The Fund seeks a high level of current income, with capital appreciation over the long term as a secondary goal. Under normal market conditions, the Fund invests primarily to predominantly in U.S. and foreign debt securities, including those in emerging markets.
Fund Risks
All investments involve risks, including possible loss of principal. Bond prices generally move in the opposite direction of interest rates. Thus, as prices of bonds in the Fund adjust to a rise in interest rates, the Fund’s share price may decline. Changes in the financial strength of a bond issuer or in a bond’s credit rating may affect its value. High yields reflect the higher credit risks associated with certain lower rated securities held in the portfolio. Floating rate loans and high yield corporate bonds are rated below investment grade and are subject to greater risk of default, which could result in loss of principal—a risk that may be heightened in a slowing economy. The risks of foreign securities include currency fluctuations and political uncertainty. Investments in developing markets involve heightened risks related to the same factors, in addition to those associated with their relatively small size and lesser liquidity. Investing in derivative securities and the use of foreign currency techniques involve special risks as such may not achieve the anticipated benefits and/or may result in losses to the Fund. The Fund is actively managed but there is no guarantee that the manager’s investment decisions will produce the desired results. The Fund’s prospectus also includes a description of the main investment risks.
Performance Overview
You can find the Fund’s one-year total return in the Performance Summary. For comparison, the Fund’s benchmark, the Bloomberg Barclays U.S. Aggregate Index, delivered a +3.54% total return for the period under review.1 The Fund’s peers, as measured by the Lipper Multi-Sector Income Funds Classification Average, produced a +6.09% return.2
Economic and Market Overview
The US economy grew during the 12 months under review. After strengthening in 2017’s second and third quarters, the economy moderated in the fourth quarter. The economy grew faster in 2017 than in 2016, however, largely due to growth in consumer spending, business investment and exports. The manufacturing and services sectors expanded during the period. The unemployment rate declined from 4.7% in December 2016 to 4.1% at period-end.3 Monthly retail sales were volatile but positive on average during the period. Annual inflation, as measured by the Consumer Price Index, was 2.1% in December 2016, and while it varied over the 12-month period, remained unchanged at period-end.3
The US Federal Reserve (Fed) raised its target range for the federal funds rate 0.25% at its March and June 2017 meetings, amid signs of a growing US economy, strengthening labor market and improving business spending. At its December meeting, the Fed raised its target range for the federal funds rate 0.25% to 1.25%–1.50%, as widely anticipated by the market. The Fed also confirmed that the monthly balance sheet reduction would increase from $10 billion to $20 billion beginning in January 2018.
The 10-year Treasury yield, which moves inversely to its price, shifted throughout the period. The yield rose in June amid renewed optimism for improvement in economic growth and was supported in July by hawkish comments from key central bankers around the world. Easing concerns about Hurricane Irma’s economic impact, the Fed’s balance sheet normalization beginning in October and strong economic data also pushed the yield higher. However, several factors weighed on the Treasury yield at certain points during the period, including tensions between the US and North Korea; uncertainty on whether the Fed would raise rates in December 2017; and the appointment of Jerome Powell, viewed as more dovish than other contenders, as the next Fed chair. Near period-end, the Senate’s approval of a budget plan and the subsequent passage of the tax bill drove the yield higher. Overall, the 10-year Treasury yield declined from 2.45% at the beginning of the period to 2.40% at period-end.
1. Source: Morningstar.
2. Source: Lipper, a Thomson Reuters Company.
One cannot invest directly in an index, and an index is not representative of the Fund’s portfolio. Please see Index Descriptions following the Fund Summaries.
3. Source: Bureau of Labor Statistics.
The dollar value, number of shares or principal amount, and names of all portfolio holdings are listed in the Fund’s Statement of Investments (SOI).
FRANKLIN STRATEGIC INCOME VIP FUND
Investment Strategy
We allocate our investments among the various types of debt available based on our assessment of changing economic, global market, industry and issuer conditions. We use a top-down analysis of macroeconomic trends, combined with a bottom-up fundamental analysis of market sectors, industries and issuers, seeking to take advantage of varying sector reactions to economic events. For example, we may evaluate business cycles, yield curves, country risk, and the relative interest rates among currencies, and values between and within markets. In selecting debt securities, we generally conduct our own analysis of the security’s intrinsic value rather than simply relying on the coupon rate or rating. We may also enter into various transactions involving certain currency-, interest rate-or credit-related derivative instruments.
What is the yield curve?
A yield curve is a line that plots the yield to maturity of bonds having equal credit quality against their maturity dates.
Manager’s Discussion
The Fund allocated assets across the broad fixed income markets. During the period, we maintained large allocations to spread sectors, primarily high-yield corporate credit, with a smaller exposure to investment-grade corporate bonds. The Fund also held positions in agency mortgage-backed securities and select non-US dollar global government bonds.
Additionally, the Fund sought to maintain a relatively defensive positioning to US interest rates.
The Fund’s corporate credit exposure was the most significant contributor to performance. High-yield corporate credit in particular, but also investment-grade corporate bonds, senior-secured floating-rate bank loan and collateralized loan obligations were all additive to performance. In addition, US dollar and non-US dollar yield curve positioning boosted absolute returns. Our sovereign emerging-market debt and non-agency residential mortgage-backed securities and commercial mortgage-backed securities also helped performance.
In contrast, our positions in tax-exempt municipal bonds and non-US dollar emerging markets securities detracted from performance.
The Fund utilized derivatives, including credit default swaps, currency forwards and government bond futures, primarily as a tool for efficient portfolio management and to manage overall portfolio risk. These derivative transactions may provide the
| | | | | | | | |
| Portfolio Composition* | | | | | | |
| Based on Consolidated Net Assets | | | | | | |
| | | 12/31/17 | | | 12/31/16 | |
| High-Yield Corporate Bonds | | | 29.8% | | | | 25.6% | |
| Investment-Grade Corporate Bonds | | | 17.6% | | | | 16.9% | |
| Floating-Rate Loans | | | 16.1% | | | | 16.4% | |
| Agency Mortgage-Backed Securities | | | 9.9% | | | | 9.9% | |
| International Government & Agency Bonds | | | 9.1% | | | | 7.9% | |
| US Treasury Securities | | | 4.1% | | | | 2.5% | |
| Collateralized Loan Obligations | | | 4.0% | | | | 3.9% | |
| Residential Mortgage-Backed Securities | | | 3.1% | | | | 1.6% | |
| Treasury Inflation-Protected Securities | | | 2.8% | | | | 2.9% | |
| Commercial Mortgage-Backed Securities | | | 2.4% | | | | 2.1% | |
| Asset-Backed Securities | | | 2.1% | | | | 2.1% | |
| Other | | | 0.9% | | | | 4.1% | |
| Municipal Bonds | | | 0.9% | | | | 1.9% | |
| Short-Term Investments & Other Net Assets | | | (2.8)% | | | | 2.3% | |
*Figures reflect certain derivatives held in the portfolio (or their underlying reference assets) and may not total 100% or may be negative due to rounding, use of any derivatives, unsettled trades or other factors. The composition may not match the Statement of Investments (SOI).
same, or similar, net long or short exposure to select currencies, interest rates, countries, duration or credit risks compared to holding securities.
What is a currency forward?
A currency forward is an agreement between the Fund and a counterparty to buy or sell a foreign currency in exchange for another currency at a specific exchange rate on a future date.
What is a credit derivative?
A credit derivative is a contract agreement between the Fund and a counterparty that is principally used by the Fund to gain or increase exposure to certain financial assets and/or to hedge against credit risk.
What is meant by “hedge”?
To hedge an investment is to take a position intended to offset potential losses/gains that may be incurred by a companion financial instrument.
FRANKLIN STRATEGIC INCOME VIP FUND
Thank you for your participation in Franklin Strategic Income VIP Fund. We look forward to serving your future investment needs.
The foregoing information reflects our analysis, opinions and portfolio holdings as of December 31, 2017, the end of the reporting period. The way we implement our main investment strategies and the resulting portfolio holdings may change depending on factors such as market and economic conditions. These opinions may not be relied upon as investment advice or an offer for a particular security. The information is not a complete analysis of every aspect of any market, country, industry, security or the Fund. Statements of fact are from sources considered reliable, but the investment manager makes no representation or warranty as to their completeness or accuracy. Although historical performance is no guarantee of future results, these insights may help you understand our investment management philosophy.
FRANKLIN STRATEGIC INCOME VIP FUND
Class 2 Fund Expenses
As an investor in a variable insurance contract (Contract) that indirectly provides for investment in an underlying mutual fund, you can incur transaction and/or ongoing expenses at both the Fund level and the Contract Level: (1) transaction expenses can include sales charges (loads) on purchases, surrender fees, transfer fees and premium taxes; and (2) ongoing expenses can include management fees, distribution and service (12b-1) fees, contract fees, annual maintenance fees, mortality and expense risk fees and other fees and expenses. All mutual funds and Contracts have some types of ongoing expenses. The table below shows Fund-level ongoing expenses and can help you understand these costs and compare them with those of other mutual funds offered through the Contract. The table assumes a $1,000 investment held for the six months indicated. Please refer to the Fund prospectus for additional information on operating expenses.
Actual Fund Expenses
The table below provides information about the actual account values and actual expenses in the columns under the heading “Actual.” In these columns the Fund’s actual return, which includes the effect of ongoing Fund expenses but does not include the effect of ongoing Contract expenses, is used to calculate the “Ending Account Value.” You can estimate the Fund-level expenses you paid during the period by following these steps (of course, your account value and expenses will differ from those in this illustration): Divide your account value by $1,000 (if your account had an $8,600 value, then $8,600 ÷ $1,000 = 8.6). Then multiply the result by the number under the headings “Actual” and “Fund-Level Expenses Paid During Period” (if Fund-Level Expenses Paid During Period were $ 7.50, then 8.6 x $ 7.50 = $64.50). In this illustration, the estimated expenses paid this period at the Fund level are $64.50.
Hypothetical Example for Comparison with Other Mutual Funds
Under the heading “Hypothetical” in the table, information is provided about hypothetical account values and hypothetical expenses based on the Fund’s actual expense ratio and an assumed rate of return of 5% per year before expenses, which is not the Fund’s actual return. This information may not be used to estimate the actual ending account balance or expenses you paid for the period, but it can help you compare ongoing costs of investing in the Fund with those of other mutual funds offered through the Contract. To do so, compare this 5% hypothetical example with the 5% hypothetical examples that appear in the shareholder reports of other funds offered through the Contract.
Please note that expenses shown in the table are meant to highlight ongoing costs at the Fund level only and do not reflect any ongoing expenses at the Contract level, or transaction expenses at either the Fund or Contract levels. In addition, while the Fund does not have transaction expenses, if the transaction and ongoing expenses at the Contract level were included, the expenses shown below would be higher. You should consult your Contract prospectus or disclosure document for more information.
| | | | | | | | | | | | | | | | | | | | | | | | | | |
| | | | | | Actual (actual return after expenses) | | | | | Hypothetical (5% annual return before expenses) | | | | |
Share Class | |
| Beginning Account
Value 7/1/17 |
| |
| Ending Account
Value 12/31/17 |
| |
| Fund-Level Expenses
Paid During Period
7/1/17–12/31/171,2 |
| | | |
| Ending Account
Value 12/31/17 |
| |
| Fund-Level Expenses
Paid During Period
7/1/17–12/31/171,2 |
| |
| Net
Annualized
Expense
Ratio2 |
|
Class 2 | | | $1,000 | | | | $1,011.30 | | | | $4.41 | | | | | | $1,020.82 | | | | $4.43 | | | | 0.87 | % |
1. Expenses are equal to the annualized expense ratio for the six-month period as indicated above—in the far right column—multiplied by the simple average account value over the period indicated, and then multiplied by 184/365 to reflect the one-half year period.
2. Reflects expenses after fee waivers and expense reimbursements. Does not include any ongoing expenses of the Contract for which the Fund is an investment option or acquired fund fees and expenses.
FRANKLIN TEMPLETON VARIABLE INSURANCE PRODUCTS TRUST
Consolidated Financial Highlights
Franklin Strategic Income VIP Fund
| | | | | | | | | | | | | | | | | | | | |
| | | Year Ended December 31, | |
| | | 2017 | | | 2016 | | | 2015 | | | 2014 | | | 2013 | |
| Class 1 | | | | | | | | | | | | | | | | | | | | |
Per share operating performance
(for a share outstanding throughout the year) | | | | | | | | | | | | | | | | | | | | |
| | | | | |
Net asset value, beginning of year | | | $11.01 | | | | $10.55 | | | | $11.90 | | | | $12.64 | | | | $13.17 | |
| | | | |
| | | | | |
| Income from investment operationsa: | | | | | | | | | | | | | | | | | | | | |
| | | | | |
Net investment incomeb | | | 0.45 | | | | 0.48 | | | | 0.53 | | | | 0.54 | | | | 0.59 | |
| | | | | |
Net realized and unrealized gains (losses) | | | 0.04 | | | | 0.37 | | | | (0.91 | ) | | | (0.25 | ) | | | (0.15 | ) |
| | | | |
Total from investment operations | | | 0.49 | | | | 0.85 | | | | (0.38 | ) | | | 0.29 | | | | 0.44 | |
| | | | |
| | | | | |
| Less distributions from: | | | | | | | | | | | | | | | | | | | | |
| | | | | |
Net investment income and net foreign currency gains | | | (0.35 | ) | | | (0.39 | ) | | | (0.77 | ) | | | (0.78 | ) | | | (0.80 | ) |
| | | | | |
Net realized gains | | | — | | | | — | | | | (0.20 | ) | | | (0.25 | ) | | | (0.17 | ) |
| | | | |
Total distributions | | | (0.35 | ) | | | (0.39 | ) | | | (0.97 | ) | | | (1.03 | ) | | | (0.97 | ) |
| | | | |
Net asset value, end of year | | | $11.15 | | | | $11.01 | | | | $10.55 | | | | $11.90 | | | | $12.64 | |
| | | | |
| | | | | |
Total returnc | | | 4.46% | | | | 8.25% | | | | (3.62)% | | | | 2.12% | | | | 3.52% | |
| | | | | |
| Ratios to average net assets | | | | | | | | | | | | | | | | | | | | |
| | | | | |
Expenses before waiver and payments by affiliates | | | 0.68% | | | | 0.67% | | | | 0.63% | | | | 0.63% | | | | 0.60% | |
| | | | | |
Expenses net of waiver and payments by affiliatesd | | | 0.63% | | | | 0.60% | | | | 0.62% | | | | 0.62% | | | | 0.60% | |
| | | | | |
Net investment income | | | 4.00% | | | | 4.42% | | | | 4.71% | | | | 4.34% | | | | 4.58% | |
| | | | | |
| Supplemental data | | | | | | | | | | | | | | | | | | | | |
| | | | | |
Net assets, end of year (000’s) | | | $361,465 | | | | $396,170 | | | | $441,658 | | | | $574,850 | | | | $705,493 | |
| | | | | |
Portfolio turnover rate | | | 108.73% | | | | 128.51% | | | | 85.85% | | | | 55.64% | | | | 48.06% | |
| | | | | |
Portfolio turnover rate excluding mortgage dollar rollse | | | 48.11% | | | | 77.93% | | | | 51.47% | | | | 48.86% | | | | 47.01% | |
aThe amount shown for a share outstanding throughout the period may not correlate with the Consolidated Statement of Operations for the period due to the timing of sales and repurchases of the Fund’s shares in relation to income earned and/or fluctuating fair value of the investments of the Fund.
bBased on average daily shares outstanding.
cTotal return does not include fees, charges or expenses imposed by the variable annuity and life insurance contracts for which Franklin Templeton Variable Insurance Products Trust serves as an underlying investment vehicle.
dBenefit of expense reduction rounds to less than 0.01%.
eSee Note 1(h) regarding mortgage dollar rolls.
| | | | |
| FSI-6 | | Annual Report | The accompanying notes are an integral part of these consolidated financial statements. |
FRANKLIN TEMPLETON VARIABLE INSURANCE PRODUCTS TRUST
CONSOLIDATED FINANCIAL HIGHLIGHTS
Franklin Strategic Income VIP Fund (continued)
| | | | | | | | | | | | | | | | | | | | |
| | | Year Ended December 31, | |
| | | 2017 | | | 2016 | | | 2015 | | | 2014 | | | 2013 | |
| Class 2 | | | | | | | | | | | | | | | | | | | | |
Per share operating performance
(for a share outstanding throughout the year) | | | | | | | | | | | | | | | | | | | | |
| | | | | |
Net asset value, beginning of year | | | $10.64 | | | | $10.21 | | | | $11.55 | | | | $12.30 | | | | $12.84 | |
| | | | |
| | | | | |
| Income from investment operationsa: | | | | | | | | | | | | | | | | | | | | |
| | | | | |
Net investment incomeb | | | 0.40 | | | | 0.43 | | | | 0.49 | | | | 0.49 | | | | 0.54 | |
| | | | | |
Net realized and unrealized gains (losses) | | | 0.04 | | | | 0.36 | | | | (0.89 | ) | | | (0.24 | ) | | | (0.13 | ) |
| | | | |
Total from investment operations | | | 0.44 | | | | 0.79 | | | | (0.40 | ) | | | 0.25 | | | | 0.41 | |
| | | | |
| | | | | |
| Less distributions from: | | | | | | | | | | | | | | | | | | | | |
| | | | | |
Net investment income and net foreign currency gains | | | (0.32 | ) | | | (0.36 | ) | | | (0.74 | ) | | | (0.75 | ) | | | (0.78 | ) |
| | | | | |
Net realized gains | | | — | | | | — | | | | (0.20 | ) | | | (0.25 | ) | | | (0.17 | ) |
| | | | |
Total distributions | | | (0.32 | ) | | | (0.36 | ) | | | (0.94 | ) | | | (1.00 | ) | | | (0.95 | ) |
| | | | |
Net asset value, end of year | | | $10.76 | | | | $10.64 | | | | $10.21 | | | | $11.55 | | | | $12.30 | |
| | | | |
| | | | | |
Total returnc | | | 4.17% | | | | 7.94% | | | | (3.87)% | | | | 1.86% | | | | 3.32% | |
| | | | | |
| Ratios to average net assets | | | | | | | | | | | | | | | | | | | | |
| | | | | |
Expenses before waiver and payments by affiliates | | | 0.93% | | | | 0.92% | | | | 0.88% | | | | 0.88% | | | | 0.85% | |
| | | | | |
Expenses net of waiver and payments by affiliatesd | | | 0.88% | | | | 0.85% | | | | 0.87% | | | | 0.87% | | | | 0.85% | |
| | | | | |
Net investment income | | | 3.75% | | | | 4.17% | | | | 4.46% | | | | 4.09% | | | | 4.33% | |
| | | | | |
| Supplemental data | | | | | | | | | | | | | | | | | | | | |
| | | | | |
Net assets, end of year (000’s) | | | $214,271 | | | | $203,418 | | | | $202,192 | | | | $206,571 | | | | $175,307 | |
| | | | | |
Portfolio turnover rate | | | 108.73% | | | | 128.51% | | | | 85.85% | | | | 55.64% | | | | 48.06% | |
| | | | | |
Portfolio turnover rate excluding mortgage dollar rollse | | | 48.11% | | | | 77.93% | | | | 51.47% | | | | 48.86% | | | | 47.01% | |
aThe amount shown for a share outstanding throughout the period may not correlate with the Consolidated Statement of Operations for the period due to the timing of sales and repurchases of the Fund’s shares in relation to income earned and/or fluctuating fair value of the investments of the Fund.
bBased on average daily shares outstanding.
cTotal return does not include fees, charges or expenses imposed by the variable annuity and life insurance contracts for which Franklin Templeton Variable Insurance Products Trust serves as an underlying investment vehicle.
dBenefit of expense reduction rounds to less than 0.01%.
eSee Note 1(h) regarding mortgage dollar rolls.
| | | | | | |
The accompanying notes are an integral part of these consolidated financial statements. | Annual Report | | | FSI-7 | |
FRANKLIN TEMPLETON VARIABLE INSURANCE PRODUCTS TRUST
CONSOLIDATED FINANCIAL HIGHLIGHTS
Franklin Strategic Income VIP Fund (continued)
| | | | | | | | | | | | | | | | | | | | |
| | | Year Ended December 31, | |
| | | 2017 | | | 2016 | | | 2015 | | | 2014 | | | 2013 | |
| Class 4 | | | | | | | | | | | | | | | | | | | | |
Per share operating performance (for a share outstanding throughout the year) | | | | | | | | | | | | | | | | | | | | |
| | | | | |
Net asset value, beginning of year | | | $10.90 | | | | $10.44 | | | | $11.78 | | | | $12.51 | | | | $13.04 | |
| | | | |
| | | | | |
| Income from investment operationsa: | | | | | | | | | | | | | | | | | | | | |
| | | | | |
Net investment incomeb | | | 0.40 | | | | 0.43 | | | | 0.49 | | | | 0.49 | | | | 0.54 | |
| | | | | |
Net realized and unrealized gains (losses) | | | 0.04 | | | | 0.38 | | | | (0.91 | ) | | | (0.25 | ) | | | (0.14 | ) |
| | | | |
Total from investment operations | | | 0.44 | | | | 0.81 | | | | (0.42 | ) | | | 0.24 | | | | 0.40 | |
| | | | |
| | | | | |
| Less distributions from: | | | | | | | | | | | | | | | | | | | | |
| | | | | |
Net investment income and net foreign currency gains | | | (0.30 | ) | | | (0.35 | ) | | | (0.72 | ) | | | (0.72 | ) | | | (0.76 | ) |
| | | | | |
Net realized gains | | | — | | | | — | | | | (0.20 | ) | | | (0.25 | ) | | | (0.17 | ) |
| | | | |
Total distributions | | | (0.30 | ) | | | (0.35 | ) | | | (0.92 | ) | | | (0.97 | ) | | | (0.93 | ) |
| | | | |
Net asset value, end of year | | | $11.04 | | | | $10.90 | | | | $10.44 | | | | $11.78 | | | | $12.51 | |
| | | | |
| | | | | |
Total returnc | | | 4.08% | | | | 7.86% | | | | (3.98)% | | | | 1.75% | | | | 3.17% | |
| | | | | |
| Ratios to average net assets | | | | | | | | | | | | | | | | | | | | |
| | | | | |
Expenses before waiver and payments by affiliates | | | 1.03% | | | | 1.02% | | | | 0.98% | | | | 0.98% | | | | 0.95% | |
| | | | | |
Expenses net of waiver and payments by affiliatesd | | | 0.98% | | | | 0.95% | | | | 0.97% | | | | 0.97% | | | | 0.95% | |
| | | | | |
Net investment income | | | 3.65% | | | | 4.07% | | | | 4.36% | | | | 3.99% | | | | 4.23% | |
| | | | | |
| Supplemental data | | | | | | | | | | | | | | | | | | | | |
| | | | | |
Net assets, end of year (000’s) | | | $74,013 | | | | $80,175 | | | | $92,965 | | | | $113,986 | | | | $134,970 | |
| | | | | |
Portfolio turnover rate | | | 108.73% | | | | 128.51% | | | | 85.85% | | | | 55.64% | | | | 48.06% | |
| | | | | |
Portfolio turnover rate excluding mortgage dollar rollse | | | 48.11% | | | | 77.93% | | | | 51.47% | | | | 48.86% | | | | 47.01% | |
aThe amount shown for a share outstanding throughout the period may not correlate with the Consolidated Statement of Operations for the period due to the timing of sales and repurchases of the Fund’s shares in relation to income earned and/or fluctuating fair value of the investments of the Fund.
bBased on average daily shares outstanding.
cTotal return does not include fees, charges or expenses imposed by the variable annuity and life insurance contracts for which Franklin Templeton Variable Insurance Products Trust serves as an underlying investment vehicle.
dBenefit of expense reduction rounds to less than 0.01%.
eSee Note 1(h) regarding mortgage dollar rolls.
| | | | |
| FSI-8 | | Annual Report | The accompanying notes are an integral part of these consolidated financial statements. |
FRANKLIN TEMPLETON VARIABLE INSURANCE PRODUCTS TRUST
Consolidated Statement of Investments, December 31, 2017
| | | | | | | | | | | | | | |
Franklin Strategic Income VIP Fund | | | | | | | | | |
| | | | | Country | | | Shares/ Warrants | | | Value | |
| | Common Stocks and Other Equity Interests 0.5% | | | | | | | | | | | | |
| | Consumer Services 0.1% | | | | | | | | | | | | |
| a,aa,ab | | Turtle Bay Resort. | | | United States | | | | 1,901,449 | | | $ | 343,872 | |
| | | | | | | | | | | | | | |
| | Energy 0.4% | | | | | | | | | | | | |
| a,ab | | CHC Group LLC | | | Cayman Islands | | | | 17,097 | | | | 153,873 | |
| a | | Energy XXI Gulf Coast Inc. | | | United States | | | | 12,122 | | | | 69,580 | |
| a | | Energy XXI Gulf Coast Inc., wts., 12/30/21 | | | United States | | | | 4,009 | | | | 120 | |
| a | | Halcon Resources Corp. | | | United States | | | | 97,655 | | | | 739,248 | |
| a | | Halcon Resources Corp., wts., 9/09/20 | | | United States | | | | 8,155 | | | | 5,790 | |
| a | | Linn Energy Inc. | | | United States | | | | 20,939 | | | | 842,793 | |
| a | | Midstates Petroleum Co. Inc. | | | United States | | | | 682 | | | | 11,308 | |
| a,ab | | Midstates Petroleum Co. Inc., wts., 4/21/20 | | | United States | | | | 4,836 | | | | 35 | |
| a | | Penn Virginia Corp. | | | United States | | | | 12,326 | | | | 482,070 | |
| | | | | | | | | | | | | | |
| | | | | | | | | | | | | 2,304,817 | |
| | | | | | | | | | | | | | |
| | Materials 0.0%† | | | | | | | | | | | | |
| a | | Verso Corp., A | | | United States | | | | 6,954 | | | | 122,182 | |
| a | | Verso Corp., wts., 7/25/23 | | | United States | | | | 732 | | | | 146 | |
| | Warrior Met Coal Inc. | | | United States | | | | 3,374 | | | | 84,856 | |
| | | | | | | | | | | | | 207,184 | |
| | | | | | | | | | | | | | |
| | Retailing 0.0%† | | | | | | | | | | | | |
| a,ab,ac | | Holdco 2, A | | | South Africa | | | | 14,792,309 | | | | 11,956 | |
| a,ab,ac | | Holdco 2, B | | | South Africa | | | | 1,472,041 | | | | 1,190 | |
| | | | | | | | | | | | | | |
| | | | | | | | | | | | | 13,146 | |
| | | | | | | | | | | | | | |
| | Transportation 0.0%† | | | | | | | | | | | | |
| a | | CEVA Holdings LLC | | | United States | | | | 224 | | | | 100,926 | |
| | | | | | | | | | | | | | |
| | | | |
| | Total Common Stocks and Other Equity Interests
(Cost $8,997,257) | | | | | | | | | | | 2,969,945 | |
| | | | | | | | | | | | | | |
| | Management Investment Companies 6.2% | | | | | | | | | | | | |
| | Diversified Financials 6.2% | | | | | | | | | | | | |
| b | | Franklin Lower Tier Floating Rate Fund | | | United States | | | | 2,081,861 | | | | 20,818,608 | |
| b | | Franklin Middle Tier Floating Rate Fund | | | United States | | | | 2,024,951 | | | | 19,500,282 | |
| | | | | | | | | | | | | | |
| | | | |
| | Total Management Investment Companies (Cost $40,585,221) | | | | | | | | | | | 40,318,890 | |
| | | | | | | | | | | | | | |
| | Convertible Preferred Stocks 0.0%† | | | | | | | | | | | | |
| | Transportation 0.0%† | | | | | | | | | | | | |
| a | | CEVA Holdings LLC, cvt. pfd., A-1 | | | United States | | | | 6 | | | | 3,660 | |
| a | | CEVA Holdings LLC, cvt. pfd., A-2 | | | United States | | | | 486 | | | | 218,480 | |
| | | | | | | | | | | | | | |
| | | | |
| | Total Convertible Preferred Stocks (Cost $731,856) | | | | | | | | | | | 222,140 | |
| | | | | | | | | | | | | | |
| | | | |
| | | | | | | | | Principal Amount | * | | | | |
| | Convertible Bonds (Cost $1,626,587) 0.2% | | | | | | | | | | | | |
| | Energy 0.2% | | | | | | | | | | | | |
| | CHC Group LLC/CHC Finance Ltd., cvt., secured note, zero cpn., 10/01/20 | | | Cayman Islands | | | | 879,236 | | | | 1,129,818 | |
| | | | | | | | | | | | | | |
FRANKLIN TEMPLETON VARIABLE INSURANCE PRODUCTS TRUST
CONSOLIDATED STATEMENT OF INVESTMENTS
Franklin Strategic Income VIP Fund (continued)
| | | | | | | | | | | | | | |
| | | | | | Country | | | | Principal Amount | * | | | Value | |
| | Corporate Bonds 48.8% | | | | | | | | | | | | |
| | Automobiles & Components 0.6% | | | | | | | | | | | | |
| | Fiat Chrysler Automobiles NV, senior note, 5.25%, 4/15/23 | | | United Kingdom | | | | 1,200,000 | | | $ | 1,258,908 | |
| | The Goodyear Tire & Rubber Co., | | | | | | | | | | | | |
| | senior bond, 5.00%, 5/31/26 | | | United States | | | | 1,800,000 | | | | 1,862,730 | |
| | senior note, 5.125%, 11/15/23 | | | United States | | | | 400,000 | | | | 418,356 | |
| | | | | | | | | | | | | | |
| | | | | | | | | | | | | 3,539,994 | |
| | | | | | | | | | | | | | |
| | | Banks 4.8% | | | | | | | | | |
| | Bank of America Corp., | | | | | | | | | | | | |
| | senior note, 5.65%, 5/01/18 | | | United States | | | | 750,000 | | | | 758,986 | |
| | senior note, 3.50%, 4/19/26 | | | United States | | | | 4,800,000 | | | | 4,911,521 | |
| | c senior note, Reg S, 7.75%, 4/30/18 | | | United States | | | | 500,000 | GBP | | | 690,492 | |
| | CIT Group Inc., senior note, 5.00%, 8/15/22 | | | United States | | | | 2,058,000 | | | | 2,186,625 | |
| | Citigroup Inc., | | | | | | | | | | | | |
| | senior note, 3.875%, 10/25/23 | | | United States | | | | 3,000,000 | | | | 3,136,572 | |
| | senior note, 3.30%, 4/27/25 | | | United States | | | | 300,000 | | | | 303,215 | |
| | senior note, 3.40%, 5/01/26 | | | United States | | | | 3,100,000 | | | | 3,123,313 | |
| | sub. bond, 5.50%, 9/13/25 | | | United States | | | | 500,000 | | | | 564,035 | |
| | sub. note, 4.05%, 7/30/22 | | | United States | | | | 300,000 | | | | 312,526 | |
| d | | ICICI Bank Ltd./Dubai, senior note, 144A, 3.80%, 12/14/27 | | | India | | | | 1,200,000 | | | | 1,185,702 | |
| | JPMorgan Chase & Co., | | | | | | | | | | | | |
| | e junior sub. bond, R, 6.00% to 8/01/23, FRN thereafter, Perpetual | | | United States | | | | 1,500,000 | | | | 1,616,325 | |
| | e junior sub. bond, X, 6.10% to 10/01/24, FRN thereafter, Perpetual | | | United States | | | | 500,000 | | | | 550,025 | |
| | senior bond, 3.30%, 4/01/26 | | | United States | | | | 400,000 | | | | 403,472 | |
| | senior bond, 3.20%, 6/15/26 | | | United States | | | | 1,500,000 | | | | 1,500,444 | |
| | senior note, 4.25%, 10/15/20 | | | United States | | | | 1,000,000 | | | | 1,048,858 | |
| | sub. note, 3.375%, 5/01/23 | | | United States | | | | 1,000,000 | | | | 1,017,051 | |
| | sub. note, 3.875%, 9/10/24 | | | United States | | | | 1,000,000 | | | | 1,043,818 | |
| | Royal Bank of Scotland Group PLC, sub. note, 5.125%, 5/28/24 | | | United Kingdom | | | | 500,000 | | | | 530,950 | |
| | Wells Fargo & Co., | | | | | | | | | | | | |
| | e junior sub. bond, S, 5.90% to 6/15/24, FRN thereafter, Perpetual | | | United States | | | | 1,500,000 | | | | 1,606,425 | |
| | senior note, 3.00%, 4/22/26 | | | United States | | | | 5,000,000 | | | | 4,909,543 | |
| | | | | | | | | | | | | | |
| | | | | | | | | | | | | 31,399,898 | |
| | | | | | | | | | | | | | |
| | | Capital Goods 1.5% | | | | | | | | | |
| | Aircastle Ltd., senior note, 4.125%, 5/01/24 | | | United States | | | | 2,600,000 | | | | 2,645,500 | |
| d | | Beacon Escrow Corp., senior note, 144A, 4.875%, 11/01/25 | | | United States | | | | 1,600,000 | | | | 1,614,000 | |
| | CNH Industrial NV, 3.85%, 11/15/27 | | | United Kingdom | | | | 700,000 | | | | 698,264 | |
| | Legrand France SA, senior bond, 8.50%, 2/15/25 | | | France | | | | 100,000 | | | | 129,807 | |
| d | | Tennant Co., senior note, 144A, 5.625%, 5/01/25 | | | United States | | | | 1,000,000 | | | | 1,055,000 | |
| d | | Terex Corp., senior note, 144A, 5.625%, 2/01/25 | | | United States | | | | 2,000,000 | | | | 2,092,500 | |
| d | | Vertiv Group Corp., senior note, 144A, 9.25%, 10/15/24 | | | United States | | | | 1,600,000 | | | | 1,716,000 | |
| | | | | | | | | | | | | | |
| | | | | | | | | | | | | 9,951,071 | |
| | | | | | | | | | | | | | |
| | | Commercial & Professional Services 0.8% | | | | | | | | | |
| d | | IHS Markit Ltd., senior note, 144A, 4.00%, 3/01/26 | | | United States | | | | 1,200,000 | | | | 1,209,000 | |
| | United Rentals North America Inc., senior bond, 5.875%, 9/15/26 | | | United States | | | | 1,600,000 | | | | 1,718,000 | |
| d | | West Corp., senior note, 144A, 8.50%, 10/15/25 | | | United States | | | | 2,500,000 | | | | 2,481,250 | |
| | | | | | | | | | | | | | |
| | | | | | | | | | | | | 5,408,250 | |
| | | | | | | | | | | | | | |
FRANKLIN TEMPLETON VARIABLE INSURANCE PRODUCTS TRUST
CONSOLIDATED STATEMENT OF INVESTMENTS
Franklin Strategic Income VIP Fund (continued)
| | | | | | | | | | | | | | | | | | |
| | | | | Country | | | Principal Amount* | | | | | | Value | |
| | Corporate Bonds (continued) | | | | | | | | | | | | | | | | |
| | Consumer Durables & Apparel 1.3% | | | | | | | | | | | | | | | | |
| d | | Hanesbrands Inc., senior bond, 144A, 4.875%, 5/15/26 | | | United States | | | | 2,700,000 | | | | | | | $ | 2,781,000 | |
| | KB Home, | | | | | | | | | | | | | | | | |
| | senior note, 4.75%, 5/15/19 | | | United States | | | | 1,000,000 | | | | | | | | 1,022,500 | |
| | senior note, 7.00%, 12/15/21 | | | United States | | | | 1,200,000 | | | | | | | | 1,338,000 | |
| | PulteGroup Inc., senior bond, 5.00%, 1/15/27 | | | United States | | | | 2,000,000 | | | | | | | | 2,097,500 | |
| | Toll Brothers Finance Corp., senior bond, 5.625%, 1/15/24 | | | United States | | | | 1,100,000 | | | | | | | | 1,211,375 | |
| | | | | | | | | | | | | | | | | | |
| | | | | | | | | | | | | | | | | 8,450,375 | |
| | | | | | | | | | | | | | | | | | |
| | | Consumer Services 2.1% | | | | | | | | | | | | |
| d | | 1011778 BC ULC/New Red Finance Inc., | | | | | | | | | | | | | | | | |
| | secured note, second lien, 144A, 5.00%, 10/15/25 | | | Canada | | | | 1,200,000 | | | | | | | | 1,215,000 | |
| | senior secured note, first lien, 144A, 4.25%, 5/15/24 | | | Canada | | | | 900,000 | | | | | | | | 900,000 | |
| d | | International Game Technology PLC, senior secured bond, 144A, 6.50%, 2/15/25 | | | United States | | | | 3,300,000 | | | | | | | | 3,720,750 | |
| d | | KFC Holding Co./Pizza Hut Holdings LLC/Taco Bell of America LLC, | | | | | | | | | | | | | | | | |
| | senior note, 144A, 5.00%, 6/01/24 | | | United States | | | | 900,000 | | | | | | | | 930,375 | |
| | senior note, 144A, 5.25%, 6/01/26 | | | United States | | | | 1,300,000 | | | | | | | | 1,371,500 | |
| | Marriott International Inc., senior bond, 3.75%, 10/01/25 | | | United States | | | | 3,000,000 | | | | | | | | 3,086,960 | |
| | MGM Resorts International, senior note, 6.75%, 10/01/20 | | | United States | | | | 200,000 | | | | | | | | 216,500 | |
| d | | Wynn Las Vegas LLC/Wynn Las Vegas Capital Corp., senior bond, 144A, 5.50%, 3/01/25 | | | United States | | | | 1,200,000 | | | | | | | | 1,239,000 | |
| d | | Wynn Macau Ltd., senior note, 144A, 4.875%, 10/01/24 | | | Macau | | | | 1,000,000 | | | | | | | | 1,008,295 | |
| | | | | | | | | | | | | | | | | | |
| | | | | | | | | | | | | | | | | 13,688,380 | |
| | | | | | | | | | | | | | | | | | |
| | | Diversified Financials 2.6% | | | | | | | | | | | | |
| | Capital One Financial Corp., senior note, 3.20%, 2/05/25 | | | United States | | | | 2,000,000 | | | | | | | | 1,983,094 | |
| | The Goldman Sachs Group Inc., | | | | | | | | | | | | | | | | |
| | senior note, 3.50%, 1/23/25 | | | United States | | | | 3,000,000 | | | | | | | | 3,049,575 | |
| | senior note, 3.75%, 2/25/26 | | | United States | | | | 1,500,000 | | | | | | | | 1,541,371 | |
| d | | Lincoln Finance Ltd., senior secured note, 144A, 6.875%, 4/15/21 | | | Netherlands | | | | 600,000 | | | | EUR | | | | 755,111 | |
| | Morgan Stanley, | | | | | | | | | | | | | | | | |
| | senior bond, 3.591% to 7/22/27, FRN thereafter, 7/22/28 | | | United States | | | | 1,000,000 | | | | | | | | 1,010,123 | |
| | senior note, 3.875%, 1/27/26 | | | United States | | | | 4,200,000 | | | | | | | | 4,381,370 | |
| | Navient Corp., | | | | | | | | | | | | | | | | |
| | senior note, 6.625%, 7/26/21 | | | United States | | | | 800,000 | | | | | | | | 846,000 | |
| | senior note, 7.25%, 9/25/23 | | | United States | | | | 2,500,000 | | | | | | | | 2,675,000 | |
| | senior note, 6.125%, 3/25/24 | | | United States | | | | 500,000 | | | | | | | | 508,750 | |
| | | | | | | | | | | | | | | | | | |
| | | | | | | | | | | | | | | | | 16,750,394 | |
| | | | | | | | | | | | | | | | | | |
| | | Energy 4.7% | | | | | | | | | | | | |
| | Anadarko Petroleum Corp., senior bond, 7.95%, 6/15/39 | | | United States | | | | 100,000 | | | | | | | | 136,431 | |
| | Apache Corp., senior bond, 2.625%, 1/15/23 | | | United States | | | | 1,900,000 | | | | | | | | 1,865,122 | |
| d | | BG Energy Capital PLC, senior bond, 144A, 5.125%, 10/15/41 | | | United Kingdom | | | | 100,000 | | | | | | | | 119,115 | |
| ab,f | | BreitBurn Energy Partners LP/BreitBurn Finance Corp., senior bond, 7.875%, 4/15/22 | | | United States | | | | 1,200,000 | | | | | | | | 4,440 | |
| d | | California Resources Corp., secured note, second lien, 144A, 8.00%, 12/15/22 | | | United States | | | | 716,000 | | | | | | | | 593,385 | |
| | Cheniere Corpus Christi Holdings LLC, | | | | | | | | | | | | | | | | |
| | senior secured note, first lien, 7.00%, 6/30/24 | | | United States | | | | 800,000 | | | | | | | | 912,000 | |
| | senior secured note, first lien, 5.875%, 3/31/25 | | | United States | | | | 700,000 | | | | | | | | 759,938 | |
FRANKLIN TEMPLETON VARIABLE INSURANCE PRODUCTS TRUST
CONSOLIDATED STATEMENT OF INVESTMENTS
Franklin Strategic Income VIP Fund (continued)
| | | | | | | | | | | | | | |
| | | | | | Country | | | | Principal Amount | * | | | Value | |
| | Corporate Bonds (continued) | | | | | | | | | | | | |
| | Energy (continued) | | | | | | | | | | | | |
| d | | Cheniere Energy Partners LP, senior secured note, first lien, 144A, 5.25%, 10/01/25 | | | United States | | | | 1,200,000 | | | $ | 1,224,000 | |
| | CNOOC Finance 2015 USA LLC, senior note, 3.50%, 5/05/25 | | | China | | | | 1,000,000 | | | | 1,011,525 | |
| | CONSOL Energy Inc., senior note, 5.875%, 4/15/22 | | | United States | | | | 2,500,000 | | | | 2,565,625 | |
| | Energy Transfer Equity LP, senior note, first lien, 7.50%, 10/15/20 | | | United States | | | | 1,900,000 | | | | 2,094,750 | |
| | Energy Transfer Partners LP, senior note, 5.20%, 2/01/22 | | | United States | | | | 1,000,000 | | | | 1,068,447 | |
| d,g | | EnQuest PLC, senior note, 144A, PIK, 7.00%, 10/15/23 | | | United Kingdom | | | | 1,219,861 | | | | 876,731 | |
| | Enterprise Products Operating LLC, senior bond, 6.125%, 10/15/39 | | | United States | | | | 100,000 | | | | 126,118 | |
| | Exxon Mobil Corp., senior bond, 4.114%, 3/01/46 | | | United States | | | | 200,000 | | | | 223,767 | |
| d,h | | Gaz Capital SA, (OJSC Gazprom), loan participation, senior note, 144A, 3.85%, 2/06/20 | | | Russia | | | | 1,500,000 | | | | 1,523,947 | |
| | Kinder Morgan Inc., | | | | | | | | | | | | |
| | senior bond, 4.30%, 6/01/25 | | | United States | | | | 2,000,000 | | | | 2,085,995 | |
| | senior note, 3.15%, 1/15/23 | | | United States | | | | 1,500,000 | | | | 1,492,375 | |
| | Martin Midstream Partners LP/Martin Midstream Finance Corp., senior note, 7.25%, 2/15/21 | | | United States | | | | 2,000,000 | | | | 2,030,000 | |
| | Oceaneering International Inc., senior note, 4.65%, 11/15/24 | | | United States | | | | 200,000 | | | | 194,824 | |
| | Regency Energy Partners LP/Regency Energy Finance Corp., | | | | | | | | | | | | |
| | senior note, 5.875%, 3/01/22 | | | United States | | | | 200,000 | | | | 218,820 | |
| | senior note, 5.00%, 10/01/22 | | | United States | | | | 500,000 | | | | 533,457 | |
| | Sabine Pass Liquefaction LLC, | | | | | | | | | | | | |
| | senior secured note, first lien, 5.625%, 2/01/21 | | | United States | | | | 2,000,000 | | | | 2,145,349 | |
| | senior secured note, first lien, 5.625%, 4/15/23 | | | United States | | | | 900,000 | | | | 989,009 | |
| | Sanchez Energy Corp., senior note, 6.125%, 1/15/23 | | | United States | | | | 300,000 | | | | 255,750 | |
| d | | Sinopec Group Overseas Development 2016 Ltd., senior note, 144A, 2.75%, 9/29/26 | | | China | | | | 1,300,000 | | | | 1,237,099 | |
| d,g | | W&T Offshore Inc., | | | | | | | | | | | | |
| | secured note, second lien, 144A, PIK, 9.00%, 5/15/20 | | | United States | | | | 483,815 | | | | 463,253 | |
| | senior secured note, third lien, 144A, PIK, 10.00%, 6/15/21 | | | United States | | | | 431,432 | | | | 335,213 | |
| | Weatherford International Ltd., | | | | | | | | | | | | |
| | senior note, 7.75%, 6/15/21 | | | United States | | | | 800,000 | | | | 818,500 | |
| | senior note, 8.25%, 6/15/23 | | | United States | | | | 1,000,000 | | | | 1,012,500 | |
| d | | Woodside Finance Ltd., | | | | | | | | | | | | |
| | senior bond, 144A, 3.70%, 3/15/28 | | | Australia | | | | 800,000 | | | | 796,556 | |
| | senior note, 144A, 3.70%, 9/15/26. | | | Australia | | | | 500,000 | | | | 502,917 | |
| | | | | | | | | | | | | | |
| | | | | | | | | | | | | 30,216,958 | |
| | | | | | | | | | | | | | |
| | Food & Staples Retailing 0.7% | | | | | | | | | | | | |
| | Kroger Co., senior bond, 2.65%, 10/15/26. | | | United States | | | | 1,400,000 | | | | 1,305,464 | |
| | Walgreens Boots Alliance Inc., senior note, 3.80%, 11/18/24 | | | United States | | | | 3,200,000 | | | | 3,272,077 | |
| | | | | | | | | | | | | | |
| | | | | | | | | | | | | 4,577,541 | |
| | | | | | | | | | | | | | |
| | Food, Beverage & Tobacco 1.6% | | | | | | | | | | | | |
| | Anheuser-Busch InBev Finance Inc., senior note, 3.30%, 2/01/23 | | | Belgium | | | | 1,300,000 | | | | 1,331,600 | |
| | Bunge Ltd. Finance Corp., senior note, 3.25%, 8/15/26 | | | United States | | | | 200,000 | | | | 191,436 | |
| | Coca-Cola Femsa SAB de CV, senior bond, 5.25%, 11/26/43 | | | Mexico | | | | 200,000 | | | | 236,883 | |
| d | | Imperial Brands Finance PLC, senior note, 144A, 3.50%, 2/11/23 | | | United Kingdom | | | | 2,100,000 | | | | 2,137,702 | |
| d | | JBS USA LLC/Finance Inc., senior note, 144A, 5.75%, 6/15/25 | | | United States | | | | 500,000 | | | | 483,750 | |
| | Kraft Heinz Foods Co., senior bond, 3.00%, 6/01/26 | | | United States | | | | 2,400,000 | | | | 2,313,093 | |
| d | | Lamb Weston Holdings Inc., | | | | | | | | | | | | |
| | senior note, 144A, 4.625%, 11/01/24 | | | United States | | | | 600,000 | | | | 621,000 | |
| | senior note, 144A, 4.875%, 11/01/26 | | | United States | | | | 1,400,000 | | | | 1,466,500 | |
FRANKLIN TEMPLETON VARIABLE INSURANCE PRODUCTS TRUST
CONSOLIDATED STATEMENT OF INVESTMENTS
Franklin Strategic Income VIP Fund (continued)
| | | | | | | | | | | | | | |
| | | | | Country | | | Principal Amount* | | | Value | |
| | Corporate Bonds (continued) | | | | | | | | | | | | |
| | Food, Beverage & Tobacco (continued) | | | | | | | | | | | | |
| d | | Post Holdings Inc., | | | | | | | | | | | | |
| | senior bond, 144A, 5.625%, 1/15/28 | | | United States | | | | 500,000 | | | $ | 502,500 | |
| | senior note, 144A, 5.50%, 3/01/25 | | | United States | | | | 1,000,000 | | | | 1,037,500 | |
| | Reynolds American Inc., senior note, 4.45%, 6/12/25 | | | United Kingdom | | | | 200,000 | | | | 213,530 | |
| | | | | | | | | | | | | | |
| | | | | | | | | | | | | 10,535,494 | |
| | | | | | | | | | | | | | |
| | | Health Care Equipment & Services 2.3% | | | | | | | | | |
| | Anthem Inc., senior bond, 3.30%, 1/15/23. | | | United States | | | | 200,000 | | | | 203,139 | |
| d | | Avantor Inc., senior secured note, first lien, 144A, 6.00%, 10/01/24 | | | United States | | | | 2,000,000 | | | | 1,997,500 | |
| | Centene Corp., senior note, 4.75%, 5/15/22 | | | United States | | | | 1,700,000 | | | | 1,772,250 | |
| | CHS/Community Health Systems Inc., | | | | | | | | | | | | |
| | senior note, 6.875%, 2/01/22 | | | United States | | | | 400,000 | | | | 232,000 | |
| | senior secured note, first lien, 6.25%, 3/31/23 | | | United States | | | | 500,000 | | | | 452,500 | |
| | DaVita Inc., | | | | | | | | | | | | |
| | senior bond, 5.125%, 7/15/24 | | | United States | | | | 500,000 | | | | 505,938 | |
| | senior bond, 5.00%, 5/01/25 | | | United States | | | | 900,000 | | | | 901,980 | |
| | senior note, 5.75%, 8/15/22 | | | United States | | | | 1,500,000 | | | | 1,544,062 | |
| | HCA Inc., | | | | | | | | | | | | |
| | senior bond, 5.875%, 5/01/23 | | | United States | | | | 1,500,000 | | | | 1,605,000 | |
| | senior secured bond, first lien, 5.875%, 3/15/22 | | | United States | | | | 450,000 | | | | 482,625 | |
| | senior secured bond, first lien, 5.25%, 4/15/25 | | | United States | | | | 600,000 | | | | 636,000 | |
| | senior secured bond, first lien, 5.50%, 6/15/47 | | | United States | | | | 1,200,000 | | | | 1,200,000 | |
| d | | MPH Acquisition Holdings LLC, senior note, 144A, 7.125%, 6/01/24 | | | United States | | | | 900,000 | | | | 960,750 | |
| d,g | | Polaris Intermediate Corp., senior note, 144A, PIK, 8.50%, 12/01/22 | | | United States | | | | 200,000 | | | | 208,000 | |
| | Stryker Corp., senior bond, 3.50%, 3/15/26 | | | United States | | | | 500,000 | | | | 516,687 | |
| | Tenet Healthcare Corp., | | | | | | | | | | | | |
| | senior note, 5.50%, 3/01/19 | | | United States | | | | 300,000 | | | | 306,000 | |
| | senior note, 8.125%, 4/01/22 | | | United States | | | | 1,000,000 | | | | 1,021,250 | |
| | | | | | | | | | | | | | |
| | | | | | | | | | | | | 14,545,681 | |
| | | | | | | | | | | | | | |
| | | Insurance 0.9% | | | | | | | | | |
| | MetLife Inc., | | | | | | | | | | | | |
| | senior note, 3.60%, 4/10/24 | | | United States | | | | 1,200,000 | | | | 1,256,204 | |
| | senior note, 3.00%, 3/01/25 | | | United States | | | | 300,000 | | | | 300,492 | |
| d | | Nippon Life Insurance Co., sub. bond, 144A, 5.10% to 10/16/24, FRN thereafter, 10/16/44 | | | Japan | | | | 3,500,000 | | | | 3,699,640 | |
| | Prudential Financial Inc., senior note, 3.50%, 5/15/24 | | | United States | | | | 800,000 | | | | 831,957 | |
| | | | | | | | | | | | | | |
| | | | | | | | | | | | | 6,088,293 | |
| | | | | | | | | | | | | | |
| | | Materials 6.3% | | | | | | | | | |
| | ArcelorMittal, | | | | | | | | | | | | |
| | senior note, 6.00%, 3/01/21 | | | France | | | | 1,800,000 | | | | 1,946,367 | |
| | senior note, 6.125%, 6/01/25 | | | France | | | | 300,000 | | | | 345,750 | |
| d | | Ardagh Packaging Finance PLC/Ardagh MP Holdings USA Inc., | | | | | | | | | | | | |
| | senior note, 144A, 6.00%, 6/30/21. | | | Luxembourg | | | | 1,300,000 | | | | 1,339,000 | |
| | senior note, 144A, 6.00%, 2/15/25. | | | Luxembourg | | | | 900,000 | | | | 949,500 | |
| d | | BWAY Holding Co., senior note, 144A, 7.25%, 4/15/25 | | | United States | | | | 2,700,000 | | | | 2,794,500 | |
| d | | Cemex Finance LLC, senior secured note, first lien, 144A, 6.00%, 4/01/24 | | | Mexico | | | | 1,000,000 | | | | 1,059,170 | |
| d | | Cemex SAB de CV, senior secured bond, first lien, 144A, 5.70%, 1/11/25 | | | Mexico | | | | 1,500,000 | | | | 1,584,877 | |
| d | | Ceramtec Group GmbH, senior note, 144A, 8.25%, 8/15/21 | | | Germany | | | | 1,200,000 | EUR | | | 1,508,329 | |
| | The Chemours Co., senior note, 6.625%, 5/15/23 | | | United States | | | | 2,000,000 | | | | 2,125,000 | |
FRANKLIN TEMPLETON VARIABLE INSURANCE PRODUCTS TRUST
CONSOLIDATED STATEMENT OF INVESTMENTS
Franklin Strategic Income VIP Fund (continued)
| | | | | | | | | | | | | | |
| | | | | | Country | | | | Principal Amount | * | | | Value | |
| | Corporate Bonds (continued) | | | | | | | | | | | | |
| | Materials (continued) | | | | | | | | | | | | |
| d | | First Quantum Minerals Ltd., | | | | | | | | | | | | |
| | senior note, 144A, 7.00%, 2/15/21 | | | Zambia | | | | 625,000 | | | $ | 650,000 | |
| | senior note, 144A, 7.25%, 4/01/23 | | | Zambia | | | | 1,600,000 | | | | 1,728,000 | |
| d | | FMG Resources (August 2006) Pty. Ltd., senior note, 144A, 5.125%, 5/15/24 | | | Australia | | | | 800,000 | | | | 818,584 | |
| | Freeport-McMoRan Inc., senior note, 4.55%, 11/14/24 | | | United States | | | | 2,500,000 | | | | 2,554,250 | |
| d | | Glencore Finance Canada Ltd., senior bond, 144A, 4.95%, 11/15/21 | | | Switzerland | | | | 1,000,000 | | | | 1,067,962 | |
| d | | Glencore Funding LLC, | | | | | | | | | |
| | senior note, 144A, 4.125%, 5/30/23 | | | Switzerland | | | | 600,000 | | | | 621,450 | |
| | senior note, 144A, 4.625%, 4/29/24 | | | Switzerland | | | | 250,000 | | | | 264,504 | |
| d | | INVISTA Finance LLC, senior secured note, 144A, 4.25%, 10/15/19 | | | United States | | | | 3,000,000 | | | | 3,052,800 | |
| | LYB International Finance BV, senior note, 4.00%, 7/15/23 | | | United States | | | | 2,100,000 | | | | 2,200,978 | |
| d | | New Gold Inc., senior note, 144A, 6.375%, 5/15/25 | | | Canada | | | | 700,000 | | | | 743,750 | |
| d | | Northwest Acquisitions ULC/Dominion Finco Inc., secured note, second lien, 144A, 7.125%, 11/01/22 | | | United States | | | | 400,000 | | | | 414,000 | |
| d | | Novelis Corp., senior bond, 144A, 5.875%, 9/30/26 | | | United States | | | | 2,300,000 | | | | 2,351,750 | |
| d | | Owens-Brockway Glass Container Inc., | | | | | | | | | | | | |
| | senior note, 144A, 5.00%, 1/15/22 | | | United States | | | | 1,400,000 | | | | 1,454,250 | |
| | senior note, 144A, 5.875%, 8/15/23 | | | United States | | | | 700,000 | | | | 755,563 | |
| | Reynolds Group Issuer Inc./Reynolds Group Issuer LLC/Reynolds | | | | | | | | | | | | |
| | Group Issuer Luxembourg SA, | | | | | | | | | | | | |
| | d senior note, 144A, 7.00%, 7/15/24. | | | United States | | | | 500,000 | | | | 536,438 | |
| | senior secured note, first lien, 5.75%, 10/15/20 | | | United States | | | | 678,376 | | | | 689,399 | |
| | d senior secured note, first lien, 144A, 5.125%, 7/15/23 | | | United States | | | | 700,000 | | | | 725,375 | |
| d | | Sealed Air Corp., | | | | | | | | | | | | |
| | senior bond, 144A, 5.125%, 12/01/24 | | | United States | | | | 1,000,000 | | | | 1,075,000 | |
| | senior bond, 144A, 5.50%, 9/15/25 | | | United States | | | | 400,000 | | | | 437,000 | |
| | senior note, 144A, 4.875%, 12/01/22 | | | United States | | | | 1,000,000 | | | | 1,060,000 | |
| | Steel Dynamics Inc., | | | | | | | | | | | | |
| | senior bond, 5.50%, 10/01/24 | | | United States | | | | 1,000,000 | | | | 1,065,000 | |
| | senior note, 5.125%, 10/01/21 | | | United States | | | | 1,000,000 | | | | 1,027,500 | |
| d | | SunCoke Energy Partners LP/SunCoke Energy Partners Finance | | | | | | | | | | | | |
| | Corp., senior note, 144A, 7.50%, 6/15/25 | | | United States | | | | 2,000,000 | | | | 2,100,000 | |
| | | | | | | | | | | | | | |
| | | | | | | | | | | | | 41,046,046 | |
| | | | | | | | | | | | | | |
| | Media 5.3% | | | | | | | | | | | | |
| | 21st Century Fox America Inc., senior note, 3.00%, 9/15/22 | | | United States | | | | 500,000 | | | | 507,795 | |
| d | | Altice Financing SA, secured bond, 144A, 7.50%, 5/15/26 | | | Luxembourg | | | | 200,000 | | | | 213,500 | |
| d | | Altice U.S. Finance I Corp., senior secured bond, 144A, 5.50%, 5/15/26 | | | United States | | | | 2,200,000 | | | | 2,246,750 | |
| | AMC Networks Inc., senior note, 5.00%, 4/01/24 | | | United States | | | | 2,000,000 | | | | 2,030,000 | |
| | CCO Holdings LLC/CCO Holdings Capital Corp., | | | | | | | | | | | | |
| | senior bond, 5.25%, 9/30/22 | | | United States | | | | 1,100,000 | | | | 1,129,562 | |
| | d senior bond, 144A, 5.375%, 5/01/25 | | | United States | | | | 900,000 | | | | 929,538 | |
| | Clear Channel Worldwide Holdings Inc., | | | | | | | | | | | | |
| | senior note, 6.50%, 11/15/22 | | | United States | | | | 1,000,000 | | | | 1,021,250 | |
| | senior sub. note, 7,625%, 3/15/20 | | | United States | | | | 700,000 | | | | 688,625 | |
| | CSC Holdings LLC, senior note, 6.75%, 11/15/21 | | | United States | | | | 2,000,000 | | | | 2,150,000 | |
| | DISH DBS Corp., | | | | | | | | | | | | |
| | senior note, 6.75%, 6/01/21 | | | United States | | | | 500,000 | | | | 526,875 | |
| | senior note, 5.875%, 7/15/22 | | | United States | | | | 500,000 | | | | 504,375 | |
| | senior note, 5.875%, 11/15/24 | | | United States | | | | 1,200,000 | | | | 1,171,500 | |
FRANKLIN TEMPLETON VARIABLE INSURANCE PRODUCTS TRUST
CONSOLIDATED STATEMENT OF INVESTMENTS
Franklin Strategic Income VIP Fund (continued)
| | | | | | | | | | | | | | |
| | | | | Country | | | Principal Amount* | | | Value | |
| | Corporate Bonds (continued) | | | | | | | | | | | | |
| | Media (continued) | | | | | | | | | | | | |
| | iHeartCommunications Inc., | | | | | | | | | | | | |
| | senior secured bond, first lien, 9.00%, 3/01/21 | | | United States | | | | 1,000,000 | | | $ | 720,000 | |
| | senior secured note, first lien, 9.00%, 9/15/22 | | | United States | | | | 700,000 | | | | 505,750 | |
| d | | Nexstar Broadcasting Inc., senior note, 144A, 5.625%, 8/01/24 | | | United States | | | | 2,000,000 | | | | 2,070,000 | |
| d | | Sirius XM Radio Inc., | | | | | | | | | | | | |
| | senior bond, 144A, 6.00%, 7/15/24 | | | United States | | | | 1,700,000 | | | | 1,802,000 | |
| | senior bond, 144A, 5.375%, 4/15/25 | | | United States | | | | 800,000 | | | | 835,000 | |
| | Tegna Inc., | | | | | | | | | | | | |
| | senior bond, 6.375%, 10/15/23 | | | United States | | | | 1,000,000 | | | | 1,051,250 | |
| | d senior bond, 144A, 5.50%, 9/15/24 | | | United States | | | | 500,000 | | | | 526,250 | |
| | senior note, 5.125%, 7/15/20 | | | United States | | | | 1,000,000 | | | | 1,025,000 | |
| | Time Warner Cable LLC, senior note, 4.00%, 9/01/21 | | | United States | | | | 1,300,000 | | | | 1,339,854 | |
| | Time Warner Inc., senior bond, 2.95%, 7/15/26 | | | United States | | | | 2,500,000 | | | | 2,368,285 | |
| d | | Unitymedia Hessen GmbH & Co. KG/Unitymedia NRW GmbH, senior secured note, first lien, 144A, 5.625%, 4/15/23 | | | Germany | | | | 560,000 | EUR | | | 699,956 | |
| d | | Unitymedia KabelBW GmbH, senior bond, 144A, 6.125%, 1/15/25 | | | Germany | | | | 1,700,000 | | | | 1,802,000 | |
| d | | Univision Communications Inc., senior secured note, first lien, 144A, 5.125%, 2/15/25 | | | United States | | | | 2,500,000 | | | | 2,443,750 | |
| d | | Virgin Media Finance PLC, senior bond, 144A, 6.375%, 10/15/24 | | | United Kingdom | | | | 900,000 | GBP | | | 1,306,342 | |
| d | | Virgin Media Secured Finance PLC, senior secured bond, first lien, 144A, 5.50%, 1/15/25 | | | United Kingdom | | | | 1,900,000 | | | | 1,957,000 | |
| d | | Ziggo Secured Finance BV, senior secured bond, 144A, 4.25%, 1/15/27 | | | Netherlands | | | | 700,000 | EUR | | | 875,059 | |
| | | | | | | | | | | | | | |
| | | | | | | | | | | | | 34,447,266 | |
| | | | | | | | | | | | | | |
| | | Pharmaceuticals, Biotechnology & Life Sciences 1.9% | | | | | | | | | |
| | Actavis Funding SCS, senior bond, 3.80%, 3/15/25 | | | United States | | | | 2,200,000 | | | | 2,242,606 | |
| | Baxalta Inc., senior note, 4.00%, 6/23/25 | | | United States | | | | 2,500,000 | | | | 2,587,392 | |
| | Biogen Inc., senior note, 3.625%, 9/15/22 | | | United States | | | | 1,500,000 | | | | 1,555,997 | |
| | Celgene Corp., senior bond, 3.45%, 11/15/27 | | | United States | | | | 800,000 | | | | 800,821 | |
| d,g | | Eagle Holdings Co. II LLC, senior note, 144A, PIK, 7.625%, 5/15/22 | | | United States | | | | 700,000 | | | | 714,000 | |
| d | | Endo DAC/Endo Finance LLC/Endo Finco Inc., | | | | | | | | | | | | |
| | senior bond, 144A, 6.00%, 2/01/25 | | | United States | | | | 1,200,000 | | | | 936,000 | |
| | senior note, 144A, 6.00%, 7/15/23 | | | United States | | | | 400,000 | | | | 316,000 | |
| d | | Jaguar Holding Co. II/Pharmaceutical Product Development LLC,
senior note, 144A, 6.375%, 8/01/23 | | | United States | | | | 1,200,000 | | | | 1,215,000 | |
| d | | Valeant Pharmaceuticals International, senior note, 144A, 6.375%, 10/15/20 | | | United States | | | | 1,100,000 | | | | 1,113,750 | |
| d | | Valeant Pharmaceuticals International Inc., | | | | | | | | | | | | |
| | senior bond, 144A, 6.125%, 4/15/25 | | | United States | | | | 300,000 | | | | 275,625 | |
| | senior note, 144A, 5.50%, 3/01/23 | | | United States | | | | 400,000 | | | | 368,000 | |
| | senior note, first lien, 144A, 7.00%, 3/15/24 | | | United States | | | | 200,000 | | | | 214,500 | |
| | | | | | | | | | | | | | |
| | | | | | | | | | | | | 12,339,691 | |
| | | | | | | | | | | | | | |
| | | Real Estate 1.1% | | | | | | | | | |
| | American Tower Corp., senior bond, 3.375%, 10/15/26 | | | United States | | | | 2,400,000 | | | | 2,361,750 | |
| | Equinix Inc., | | | | | | | | | | | | |
| | senior bond, 5.375%, 4/01/23 | | | United States | | | | 2,500,000 | | | | 2,597,500 | |
| | senior bond, 5.875%, 1/15/26 | | | United States | | | | 100,000 | | | | 107,625 | |
FRANKLIN TEMPLETON VARIABLE INSURANCE PRODUCTS TRUST
CONSOLIDATED STATEMENT OF INVESTMENTS
Franklin Strategic Income VIP Fund (continued)
| | | | | | | | | | | | | | |
| | | | | | Country | | | | Principal Amount | * | | | Value | |
| | Corporate Bonds (continued) | | | | | | | | | | | | |
| | Real Estate (continued) | | | | | | | | | | | | |
| | MPT Operating Partnership LP/MPT Finance Corp., | | | | | | | | | | | | |
| | senior bond, 5.25%, 8/01/26 | | | United States | | | | 800,000 | | | $ | 832,000 | |
| | senior bond, 5.00%, 10/15/27 | | | United States | | | | 1,100,000 | | | | 1,123,375 | |
| | | | | | | | | | | | | | |
| | | | | | | | | | | | | 7,022,250 | |
| | | | | | | | | | | | | | |
| | Retailing 0.9% | | | | | | | | | |
| d | | Amazon.com Inc., senior note, 144A, 2.80%, 8/22/24 | | | United States | | | | 1,000,000 | | | | 998,232 | |
| | Home Depot Inc., senior note, 2.125%, 9/15/26 | | | United States | | | | 1,500,000 | | | | 1,405,637 | |
| | JD.com Inc., senior note, 3.125%, 4/29/21 | | | China | | | | 200,000 | | | | 199,474 | |
| ac,g | | K2016470219 South Africa Ltd., senior secured note, 144A, PIK, 3.00%, 12/31/22 | | | South Africa | | | | 1,121,170 | | | | 16,817 | |
| ac,g | | K2016470260 South Africa Ltd., senior secured note, 144A, PIK, 25.00%, 12/31/22 | | | South Africa | | | | 195,633 | | | | 150,637 | |
| | Netflix Inc., senior bond, 5.875%, 2/15/25 | | | United States | | | | 2,300,000 | | | | 2,449,500 | |
| d | | PetSmart Inc., senior secured note, first lien, 144A, 5.875%, 6/01/25 . | | | United States | | | | 1,000,000 | | | | 772,500 | |
| | | | | | | | | | | | | | |
| | | | | | | | | | | | | 5,992,797 | |
| | | | | | | | | | | | | | |
| | Semiconductors & Semiconductor Equipment 0.3% | | | | | | | | | |
| | Qorvo Inc., senior bond, 7.00%, 12/01/25 | | | United States | | | | 1,400,000 | | | | 1,569,750 | |
| | Xilinx Inc., senior note, 2.125%, 3/15/19 | | | United States | | | | 200,000 | | | | 199,381 | |
| | | | | | | | | | | | | | |
| | | | | | | | | | | | | 1,769,131 | |
| | | | | | | | | | | | | | |
| | Software & Services 1.2% | | | | | | | | | |
| d | | First Data Corp., | | | | | | | | | | | | |
| | secured note, second lien, 144A, 5.75%, 1/15/24 | | | United States | | | | 2,100,000 | | | | 2,188,725 | |
| | senior note, 144A, 7.00%, 12/01/23 | | | United States | | | | 700,000 | | | | 742,000 | |
| | Fiserv Inc., senior bond, 3.85%, 6/01/25 | | | United States | | | | 600,000 | | | | 626,745 | |
| | Infor (U.S.) Inc., senior note, 6.50%, 5/15/22 | | | United States | | | | 2,000,000 | | | | 2,080,000 | |
| d | | Symantec Corp., senior note, 144A, 5.00%, 4/15/25 | | | United States | | | | 2,200,000 | | | | 2,293,500 | |
| | | | | | | | | | | | | | |
| | | | | | | | | | | | | 7,930,970 | |
| | | | | | | | | | | | | | |
| | Technology Hardware & Equipment 0.6% | | | | | | | | | |
| d | | CommScope Technologies LLC, | | | | | | | | | | | | |
| | senior bond, 144A, 6.00%, 6/15/25 | | | United States | | | | 1,400,000 | | | | 1,494,500 | |
| | senior bond, 144A, 5.00%, 3/15/27 | | | United States | | | | 1,700,000 | | | | 1,704,250 | |
| d | | Dell International LLC/EMC Corp., | | | | | | | | | | | | |
| | senior note, 144A, 5.875%, 6/15/21 | | | United States | | | | 300,000 | | | | 312,000 | |
| | senior note, 144A, 7.125%, 6/15/24 | | | United States | | | | 200,000 | | | | 219,048 | |
| | Juniper Networks Inc., senior bond, 5.95%, 3/15/41 | | | United States | | | | 100,000 | | | | 112,220 | |
| | Tech Data Corp., senior bond, 4.95%, 2/15/27 | | | United States | | | | 200,000 | | | | 211,292 | |
| | | | | | | | | | | | | | |
| | | | | | | | | | | | | 4,053,310 | |
| | | | | | | | | | | | | | |
| | Telecommunication Services 2.5% | | | | | | | | | |
| | AT&T Inc., senior bond, 3.40%, 5/15/25 | | | United States | | | | 1,900,000 | | | | 1,870,558 | |
| | CenturyLink Inc., | | | | | | | | | | | | |
| | senior bond, 6.75%, 12/01/23 | | | United States | | | | 500,000 | | | | 491,875 | |
| | senior bond, 5.625%, 4/01/25 | | | United States | | | | 300,000 | | | | 274,125 | |
| d | | Digicel Group Ltd., senior note, 144A, 8.25%, 9/30/20 | | | Bermuda | | | | 1,200,000 | | | | 1,186,278 | |
| d | | Digicel Ltd., senior note, 144A, 6.00%, 4/15/21 | | | Bermuda | | | | 1,000,000 | | | | 988,370 | |
| | Hughes Satellite Systems Corp., senior bond, 6.625%, 8/01/26 | | | United States | | | | 1,600,000 | | | | 1,680,000 | |
| | Intelsat Jackson Holdings SA, | | | | | | | | | | | | |
| | senior note, 7.25%, 10/15/20 | | | Luxembourg | | | | 1,000,000 | | | | 945,000 | |
| | senior note, 7.50%, 4/01/21 | | | Luxembourg | | | | 500,000 | | | | 457,500 | |
FRANKLIN TEMPLETON VARIABLE INSURANCE PRODUCTS TRUST
CONSOLIDATED STATEMENT OF INVESTMENTS
Franklin Strategic Income VIP Fund (continued)
| | | | | | | | | | | | | | |
| | | | | Country | | | Principal Amount* | | | Value | |
| | Corporate Bonds (continued) | | | | | | | | | | | | |
| | Telecommunication Services (continued) | | | | | | | | | | | | |
| | Sprint Communications Inc., | | | | | | | | | | | | |
| | senior note, 6.00%, 11/15/22 | | | United States | | | | 500,000 | | | $ | 501,250 | |
| | d senior note, 144A, 9.00%, 11/15/18 | | | United States | | | | 148,000 | | | | 155,970 | |
| | d senior note, 144A, 7.00%, 3/01/20 | | | United States | | | | 800,000 | | | | 858,000 | |
| | Sprint Corp., senior bond, 7.875%, 9/15/23 | | | United States | | | | 500,000 | | | | 533,750 | |
| d | | Sprint Spectrum Co. LLC/Sprint Spectrum Co. II LLC, first lien, 144A, 3.36%, 3/20/23 | | | United States | | | | 1,687,500 | | | | 1,702,266 | |
| | T-Mobile USA Inc., | | | | | | | | | | | | |
| | senior bond, 6.50%, 1/15/24 | | | United States | | | | 500,000 | | | | 531,250 | |
| | senior bond, 6.375%, 3/01/25 | | | United States | | | | 1,300,000 | | | | 1,394,250 | |
| | senior note, 6.125%, 1/15/22 | | | United States | | | | 200,000 | | | | 206,800 | |
| | senior note, 6.00%, 4/15/24 | | | United States | | | | 200,000 | | | | 212,500 | |
| | Verizon Communications Inc., senior note, 5.15%, 9/15/23 | | | United States | | | | 2,000,000 | | | | 2,227,721 | |
| | | | | | | | | | | | | | |
| | | | | | | | | | | | | 16,217,463 | |
| | | | | | | | | | | | | | |
| | Transportation 1.4% | | | | | | | | | | | | |
| d | | DAE Funding LLC, | | | | | | | | | | | | |
| | senior note, 144A, 4.50%, 8/01/22 | | | United Arab Emirates | | | | 700,000 | | | | 689,500 | |
| | senior note, 144A, 5.00%, 8/01/24 | | | United Arab Emirates | | | | 1,600,000 | | | | 1,580,000 | |
| | FedEx Corp., senior bond, 3.25%, 4/01/26 | | | United States | | | | 2,500,000 | | | | 2,522,827 | |
| d | | Park Aerospace Holdings Ltd., | | | | | | | | | | | | |
| | senior note, 144A, 5.25%, 8/15/22 | | | Ireland | | | | 1,000,000 | | | | 990,010 | |
| | senior note, 144A, 5.50%, 2/15/24 | | | Ireland | | | | 1,300,000 | | | | 1,294,800 | |
| d | | Transurban Finance Co. Pty. Ltd., senior secured bond, 144A, 3.375%, 3/22/27. | | | Australia | | | | 1,100,000 | | | | 1,072,209 | |
| | United Airlines Pass Through Trust, second lien, 2016-1, A,
3.45%, 1/07/30 | | | United States | | | | 1,000,000 | | | | 1,016,880 | |
| | | | | | | | | | | | | | |
| | | | | | | | | | | | | 9,166,226 | |
| | | | | | | | | | | | | | |
| | Utilities 3.4% | | | | | | | | | |
| | Calpine Corp., | | | | | | | | | | | | |
| | senior bond, 5.75%, 1/15/25 | | | United States | | | | 1,200,000 | | | | 1,144,500 | |
| | senior note, 5.375%, 1/15/23 | | | United States | | | | 1,300,000 | | | | 1,270,750 | |
| d | | Colbun SA, senior note, 144A, 3.95%, 10/11/27 | | | Chile | | | | 700,000 | | | | 702,156 | |
| | Dominion Energy Inc., senior bond, 2.85%, 8/15/26 | | | United States | | | | 1,100,000 | | | | 1,064,027 | |
| d | | Dynegy Inc., senior note, 144A, 8.00%, 1/15/25 | | | United States | | | | 2,000,000 | | | | 2,175,000 | |
| d,e | | EDF SA, junior sub. note, 144A, 5.25% to 1/29/23, FRN thereafter, Perpetual | | | France | | | | 3,000,000 | | | | 3,070,380 | |
| | Exelon Corp., senior bond, 3.95%, 6/15/25 | | | United States | | | | 1,800,000 | | | | 1,878,345 | |
| d | | InterGen NV, secured bond, 144A, 7.00%, 6/30/23 | | | Netherlands | | | | 2,500,000 | | | | 2,434,912 | |
| | The Southern Co., senior bond, 3.25%, 7/01/26 | | | United States | | | | 3,600,000 | | | | 3,536,140 | |
| d | | State Grid Overseas Invesments 2016 Ltd., senior note, 144A, 3.50%, 5/04/27 | | | China | | | | 1,300,000 | | | | 1,307,579 | |
| d | | Talen Energy Supply LLC, senior note, 144A, 9.50%, 7/15/22. | | | United States | | | | 1,700,000 | | | | 1,751,000 | |
| | senior note, 144A, 10.50%, 1/15/26 | | | United States | | | | 500,000 | | | | 496,775 | |
| d | | Three Gorges Finance I Cayman Islands Ltd., senior note, 144A, 3.15%, 6/02/26 | | | China | | | | 1,300,000 | | | | 1,273,350 | |
| | | | | | | | | | | | | | |
| | | | | | | | | | | | | 22,104,914 | |
| | | | | | | | | | | | | | |
| | | |
| | Total Corporate Bonds (Cost $314,645,248) | | | | | | | | 317,242,393 | |
| | | | | | | | | | | | | | |
FRANKLIN TEMPLETON VARIABLE INSURANCE PRODUCTS TRUST
CONSOLIDATED STATEMENT OF INVESTMENTS
Franklin Strategic Income VIP Fund (continued)
| | | | | | | | | | | | | | |
| | | | | Country | | | Principal Amount* | | | Value | |
| i,j | | Senior Floating Rate Interests 10.5% | | | | | | | | | | | | |
| | | Automobiles & Components 0.4% | | | | | | | | | |
| | Allison Transmission Inc., Term Loans, 3.57%, (LIBOR + 2.00%), 9/23/22 | | | United States | | | | 849,136 | | | $ | 855,947 | |
| | TI Group Automotive Systems LLC, Initial US Term Loan, 4.319%, (LIBOR + 2.75%), 6/30/22 | | | United States | | | | 1,823,170 | | | | 1,836,275 | |
| | | | | | | | | | | | | | |
| | | | | | | | | | | | | 2,692,222 | |
| | | | | | | | | | | | | | |
| | Capital Goods 0.1% | | | | | | | | | | | | |
| | Doncasters U.S. Finance LLC, Second Lien Term Loan, 9.943%, (LIBOR + 8.25%), 10/09/20 | | | United States | | | | 76,701 | | | | 72,993 | |
| | Harsco Corp., Term B-1 Loan, 4.375%, (LIBOR + 3.00%), 12/10/24 | | | United States | | | | 232,004 | | | | 235,194 | |
| | Leidos Innovations Corp., Term Loan B, 3.625%, (LIBOR + 2.00%), 8/16/23 | | | United States | | | | 160,149 | | | | 161,791 | |
| | | | | | | | | | | | | | |
| | | | | | | | | | | | | 469,978 | |
| | | | | | | | | | | | | | |
| | Commercial & Professional Services 0.1% | | | | | | | | | | | | |
| | KAR Auction Services Inc., Term Loan B, 4.25%, (LIBOR + 2.50%), 3/09/23 | | | United States | | | | 687,506 | | | | 692,232 | |
| | Ventia Pty. Ltd., Term B Loans (USD), 5.193%, (LIBOR + 3.50%), 5/21/22 | | | Australia | | | | 83,371 | | | | 84,622 | |
| | | | | | | | | | | | | | |
| | | | | | | | | | | | | 776,854 | |
| | | | | | | | | | | | | | |
| | Consumer Services 0.8% | | | | | | | | | | | | |
| | Aristocrat Technologies Inc., | | | | | | | | | | | | |
| | New 2017 Term Loans, 3.357%, (LIBOR + 2.00%), 10/19/24 | | | United States | | | | 783,000 | | | | 786,058 | |
| | Term B-2 Loans, 3.363%, (LIBOR + 2.00%), 10/20/21 | | | United States | | | | 166,886 | | | | 167,225 | |
| | Avis Budget Car Rental LLC, Tranche B Term Loan, 3.70%, (LIBOR + 2.00%), 3/15/22 | | | United States | | | | 729,434 | | | | 730,422 | |
| | Eldorado Resorts Inc., Initial Term Loan, 3.688% - 3.813%, (LIBOR + 2.25%), 4/17/24 | | | United States | | | | 345,096 | | | | 345,851 | |
| | Fitness International LLC, Term A Loan, 4.60%, (LIBOR + 3.25%), 4/01/20 | | | United States | | | | 2,789,554 | | | | 2,795,658 | |
| | Greektown Holdings LLC, Initial Term Loan, 4.319%, (LIBOR + 2.75%), 4/25/24 | | | United States | | | | 281,279 | | | | 281,366 | |
| | NVA Holdings Inc., Second Lien Term Loan, 8.693%, (LIBOR + 7.00%), 8/14/22 | | | United States | | | | 53,412 | | | | 53,835 | |
| | | | | | | | | | | | | | |
| | | | | | | | | | | | | 5,160,415 | |
| | | | | | | | | | | | | | |
| | Diversified Financials 0.0%† | | | | | | | | | | | | |
| | Russell Investments U.S. Institutional Holdco Inc., Term Loan B, 5.943%, (LIBOR + 4.25%), 6/01/23 | | | United States | | | | 329,152 | | | | 332,362 | |
| | | | | | | | | | | | | | |
| | Energy 1.5% | | | | | | | | | | | | |
| | Bowie Resource Holdings LLC, | | | | | | | | | | | | |
| | First Lien Initial Term Loan, 7.319%, (LIBOR + 5.75%), 8/14/20 | | | United States | | | | 2,413,268 | | | | 2,362,739 | |
| | Second Lien Initial Term Loan, 12.319%, (LIBOR + 10.75%), 2/16/21 | | | United States | | | | 1,248,332 | | | | 1,204,641 | |
| | Fieldwood Energy LLC, Loans, 4.568%, (LIBOR + 2.875%), 10/01/18 | | | United States | | | | 4,096,974 | | | | 3,984,307 | |
| | Foresight Energy LLC, Term Loans, 7.443%, (LIBOR + 5.75%), 3/28/22 | | | United States | | | | 1,234,022 | | | | 1,158,438 | |
| | OSG Bulk Ships Inc., Initial Term Loan, 5.65%, (LIBOR + 4.25%), 8/05/19 | | | United States | | | | 990,091 | | | | 960,389 | |
FRANKLIN TEMPLETON VARIABLE INSURANCE PRODUCTS TRUST
CONSOLIDATED STATEMENT OF INVESTMENTS
Franklin Strategic Income VIP Fund (continued)
| | | | | | | | | | | | | | |
| | | | | Country | | | Principal Amount* | | | Value | |
| i,j | | Senior Floating Rate Interests (continued) | | | | | | | | | | | | |
| | Energy (continued) | | | | | | | | | | | | |
| | UTEX Industries Inc., First Lien Initial Term Loan, 5.569%, (LIBOR + 4.00%), 5/21/21 | | | United States | | | | 53,609 | | | $ | 52,536 | |
| | | | | | | | | | | | | | |
| | | | | | | | | | | | | 9,723,050 | |
| | | | | | | | | | | | | | |
| | Food & Staples Retailing 0.2% | | | | | | | | | | | | |
| | Aramark Corp., U.S. Term B-1 Loan, 3.569%, (LIBOR + 2.00%), 3/11/25 | | | United States | | | | 385,610 | | | | 388,261 | |
| | Smart and Final Stores LLC, First Lien Term Loan, 5.193%, (LIBOR + 3.50%), 11/15/22 | | | United States | | | | 1,157,580 | | | | 1,135,875 | |
| | | | | | | | | | | | | | |
| | | | | | | | | | | | | 1,524,136 | |
| | | | | | | | | | | | | | |
| | Food, Beverage & Tobacco 0.3% | | | | | | | | | | | | |
| | JBS USA LUX SA, New Initial Term Loans, 4.10%, (LIBOR + 2.50%), 10/30/22 | | | United States | | | | 1,730,750 | | | | 1,701,760 | |
| | | | | | | | | | | | | | |
| | Health Care Equipment & Services 0.3% | | | | | | | | | | | | |
| | Quintiles IMS Inc., Term B-2 Dollar Loans, 3.693%, (LIBOR + 2.00%), 1/20/25 | | | United States | | | | 1,156,720 | | | | 1,163,046 | |
| | U.S. Renal Care Inc., Initial Term Loan, 5.943%, (LIBOR + 4.25%), 12/31/22 | | | United States | | | | 596,417 | | | | 589,111 | |
| | | | | | | | | | | | | | |
| | | | | | | | | | | | | 1,752,157 | |
| | | | | | | | | | | | | | |
| | Household & Personal Products 0.1% | | | | | | | | | | | | |
| | Spectrum Brands Inc., USD Term Loans, 3.397% - 3.623%, (LIBOR + 2.00%), 6/23/22 | | | United States | | | | 948,065 | | | | 954,422 | |
| | | | | | | | | | | | | | |
| | Materials 1.3% | | | | | | | | | | | | |
| | Ashland LLC, Term B Loan, 3.569% - 3.574%, (LIBOR + 2.00%), 5/17/24 | | | United States | | | | 717,558 | | | | 722,379 | |
| | Chemours Co., Tranche B-1 US Term Loans, 4.07%, (LIBOR + 2.50%), 5/12/22 | | | United States | | | | 2,690,651 | | | | 2,716,435 | |
| | Cyanco Intermediate Corp., Initial Term Loan, 6.069%, (LIBOR + 4.50%), 5/01/20 | | | United States | | | | 732,918 | | | | 743,912 | |
| | OCI Beaumont LLC, Term B-3 Loan, 8.172%, (LIBOR + 6.75%), 8/20/19 | | | United States | | | | 920,347 | | | | 934,350 | |
| | Oxbow Carbon LLC, | | | | | | | | | | | | |
| | k,l Second Lien Initial Term Loan, TBD, 1/05/24 | | | United States | | | | 229,047 | | | | 230,193 | |
| | k,l Term Loan, TBD, 1/05/22 | | | United States | | | | 1,350,000 | | | | 1,351,688 | |
| | Tranche A-1 Term Loan, 6.50%, (Prime + 2.00%), 10/21/19 | | | United States | | | | 436,364 | | | | 436,909 | |
| | Tranche B Term Loan, 7.00%, (Prime + 2.50%), 1/17/20 | | | United States | | | | 551,290 | | | | 551,980 | |
| | k,l Tranche B Term Loan, TBD, 1/05/23 | | | United States | | | | 560,000 | | | | 564,550 | |
| | | | | | | | | | | | | | |
| | | | | | | | | | | | | 8,252,396 | |
| | | | | | | | | | | | | | |
| | Media 0.8% | | | | | | | | | | | | |
| | Altice U.S. Finance I Corp., March 2017 Refinancing Term Loan Commitments, 3.819%, (LIBOR + 2.25%), 7/28/25 | | | United States | | | | 199,108 | | | | 198,710 | |
| | AMC Entertainment Holdings Inc., | | | | | | | | | | | | |
| | Incremental Term Loans, 3.727%, (LIBOR + 2.25%), 12/15/23 | | | United States | | | | 739,788 | | | | 741,638 | |
| | Initial Term Loans, 3.727%, (LIBOR + 2.25%), 12/15/22 | | | United States | | | | 994,189 | | | | 999,603 | |
FRANKLIN TEMPLETON VARIABLE INSURANCE PRODUCTS TRUST
CONSOLIDATED STATEMENT OF INVESTMENTS
Franklin Strategic Income VIP Fund (continued)
| | | | | | | | | | | | | | |
| | | | | Country | | | Principal Amount* | | | Value | |
| i,j | | Senior Floating Rate Interests (continued) | | | | | | | | | | | | |
| | Media 0.8% (continued) | | | | | | | | | | | | |
| k,l | | Charter Communications Operating LLC, Term Loan A-2, TBD, 3/31/23 | | | United States | | | | 939,421 | | | $ | 939,714 | |
| | CSC Holdings LLC, March 2017 Incremental Term Loans, 3.741%, (LIBOR + 2.25%), 7/17/25 | | | United States | | | | 1,228,029 | | | | 1,224,651 | |
| | Gray Television Inc., Term B-2 Loan, 3.611%, (LIBOR + 2.25%), 2/07/24 | | | United States | | | | 900,000 | | | | 906,589 | |
| | Lions Gate Entertainment Corp., Term A Loan, 3.569%, (LIBOR + 2.00%), 12/08/21 | | | United States | | | | 514,707 | | | | 515,994 | |
| | | | | | | | | | | | | | |
| | | | | | | | | | | | | 5,526,899 | |
| | | | | | | | | | | | | | |
| | Pharmaceuticals, Biotechnology & Life Sciences 1.0% | | | | | | | | | | | | |
| | Endo Luxembourg Finance Co. I S.A.R.L. and Endo LLC, Initial Term Loans, 5.875%, (LIBOR + 4.25%), 4/29/24 | | | United States | | | | 2,249,020 | | | | 2,266,088 | |
| | Grifols Worldwide Operations USA Inc., Tranche B Term Loan, 3.739%, (LIBOR + 2.25%), 1/31/25 | | | United States | | | | 2,341,332 | | | | 2,349,503 | |
| | RPI Finance Trust, Term A-3 Loan, 3.443%, (LIBOR + 1.75%), 10/14/21 | | | United States | | | | 352,976 | | | | 353,638 | |
| | Syneos Health Inc., Initial Term B Loans, 3.819%, (LIBOR + 2.25%), 8/01/24 | | | United States | | | | 743,946 | | | | 746,085 | |
| | Valeant Pharmaceuticals International Inc., Series F Tranche B Term Loan, 4.94%, (LIBOR + 3.50%), 4/01/22 | | | United States | | | | 680,220 | | | | 691,151 | |
| | | | | | | | | | | | | | |
| | | | | | | | | | | | | 6,406,465 | |
| | | | | | | | | | | | | | |
| | Retailing 1.2% | | | | | | | | | | | | |
| | Ascena Retail Group Inc., Tranche B Term Loan, 6.125%, (LIBOR + 4.50%), 8/21/22 | | | United States | | | | 3,388,412 | | | | 2,825,088 | |
| k | | Harbor Freight Tools USA Inc., Term Loan B, 4.819%, (LIBOR + 3.25%), 8/16/23 | | | United States | | | | 2,000,000 | | | | 2,015,782 | |
| | Jo-Ann Stores Inc., Initial Loans, 6.551%, (LIBOR + 5.00%), 10/23/23 | | | United States | | | | 1,393,762 | | | | 1,346,288 | |
| | PetSmart Inc., Tranche B-2 Loans, 4.57%, (LIBOR + 3.00%), 3/11/22 | | | United States | | | | 1,930,496 | | | | 1,555,860 | |
| | | | | | | | | | | | | | |
| | | | | | | | | | | | | 7,743,018 | |
| | | | | | | | | | | | | | |
| | Semiconductors & Semiconductor Equipment 0.2% | | | | | | | | | | | | |
| | MKS Instruments Inc., Tranche B-3 Term Loans, 3.569%, (LIBOR + 2.00%), 4/29/23 | | | United States | | | | 300,134 | | | | 303,322 | |
| | ON Semiconductor Corp., 2017 Replacement Term B-2 Loans, 3.569%, (LIBOR + 2.00%), 3/31/23 | | | United States | | | | 1,210,290 | | | | 1,217,477 | |
| | | | | | | | | | | | | | |
| | | | | | | | | | | | | 1,520,799 | |
| | | | | | | | | | | | | | |
| | Software & Services 0.3% | | | | | | | | | | | | |
| | Global Payments Inc., Term A-2 Loan, 3.319%, (LIBOR + 1.75%), 5/02/22 | | | United States | | | | 625,998 | | | | 626,487 | |
| | Rackspace Hosting Inc., 2017 Refinancing Term B Loans, 4.385%, (LIBOR + 3.00%), 11/03/23 | | | United States | | | | 386,678 | | | | 387,028 | |
| | Wex Inc., Term Loan B, 4.319%, (LIBOR + 2.75%), 7/01/23 | | | United States | | | | 653,255 | | | | 657,396 | |
| | | | | | | | | | | | | | |
| | | | | | | | | | | | | 1,670,911 | |
| | | | | | | | | | | | | | |
FRANKLIN TEMPLETON VARIABLE INSURANCE PRODUCTS TRUST
CONSOLIDATED STATEMENT OF INVESTMENTS
Franklin Strategic Income VIP Fund (continued)
| | | | | | | | | | | | | | |
| | | | | Country | | | Principal Amount* | | | Value | |
i,j | | Senior Floating Rate Interests (continued) | | | | | | | | | | | | |
| | | Technology Hardware & Equipment 0.2% | | | | | | | | | |
| | Ciena Corp., Refinancing Term Loan, 4.001%, (LIBOR + 2.50%), 1/28/22 | | | United States | | | | 181,320 | | | $ | 182,226 | |
| | Commscope Inc., Tranche 5 Term Loans, 3.38% - 3.569%, (LIBOR + 2.00%), 12/29/22 | | | United States | | | | 119,955 | | | | 120,805 | |
| | Western Digital Corp., U.S. Term B-3 Loan, 3.569%, (LIBOR + 2.00%), 4/29/23 | | | United States | | | | 939,230 | | | | 944,122 | |
| | | | | | | | | | | | | | |
| | | | | | | | | | | | | 1,247,153 | |
| | | | | | | | | | | | | | |
| | Telecommunication Services 0.1% | | | | | | | | | | | | |
| | Consolidated Communications Inc., Initial Term Loan, 4.57%, (LIBOR + 3.00%), 10/05/23 | | | United States | | | | 237,569 | | | | 234,391 | |
| | Global Tel*Link Corp., Term Loan, 5.693%, (LIBOR + 4.00%), 5/23/20 | | | United States | | | | 275,545 | | | | 276,923 | |
| | | | | | | | | | | | | | |
| | | | | | | | | | | | | 511,314 | |
| | | | | | | | | | | | | | |
| | Transportation 0.6% | | | | | | | | | | | | |
| | Air Canada, Term Loan, 3.745%, (LIBOR + 2.25%), 10/06/23 | | | Canada | | | | 49,426 | | | | 49,751 | |
| | The Hertz Corp., Tranche B-1 Term Loan, 5.45%, (LIBOR + 3.75%), 6/30/23 | | | United States | | | | 1,711,180 | | | | 1,709,754 | |
| | International Seaways Operating Corp., Initial Term Loans, 6.85%, (LIBOR + 5.50%), 6/22/22 | | | United States | | | | 844,687 | | | | 851,023 | |
| | Navios Maritime Midstream Partners LP, Term Loan, 6.13%, (LIBOR + 4.50%), 6/18/20 | | | Marshall Islands | | | | 1,272,508 | | | | 1,269,326 | |
| | XPO Logistics Inc., Loans, 3.599%, (LIBOR + 2.25%), 11/01/21 | | | United States | | | | 93,651 | | | | 94,332 | |
| | | | | | | | | | | | | | |
| | | | | | | | | | | | | 3,974,186 | |
| | | | | | | | | | | | | | |
| | Utilities 1.0% | | | | | | | | | | | | |
| | EFS Cogen Holdings I LLC (Linden), Term B Advance, 4.95%, (LIBOR + 3.25%), 6/28/23 | | | United States | | | | 2,922,128 | | | | 2,955,609 | |
| | Lightstone Holdco LLC, | | | | | | | | | | | | |
| | Initial Term B Loan, 6.069%, (LIBOR + 4.50%), 1/30/24 | | | United States | | | | 2,282,427 | | | | 2,295,408 | |
| | Initial Term C Loan, 6.069%, (LIBOR + 4.50%), 1/30/24 | | | United States | | | | 144,928 | | | | 145,752 | |
| | NRG Energy Inc., Term Loans, 3.943%, (LIBOR + 2.25%), 6/30/23 | | | United States | | | | 856,950 | | | | 858,413 | |
| | | | | | | | | | | | | | |
| | | | | | | | | | | | | 6,255,182 | |
| | | | | | | | | | | | | | |
| | | | |
| | Total Senior Floating Rate Interests
(Cost $68,706,956) | | | | | | | | | | | 68,195,679 | |
| | | | | | | | | | | | | | |
| | | Foreign Government and Agency Securities 7.4% | | | | | | | | | |
| | Government of Hungary, senior note, 6.25%, 1/29/20 | | | Hungary | | | | 1,500,000 | | | | 1,609,372 | |
| | Government of Indonesia, | | | | | | | | | | | | |
| | senior bond, FR34, 12.80%, 6/15/21 | | | Indonesia | | | | 17,235,000,000 | IDR | | | 1,547,562 | |
| | senior bond, FR53, 8.25%, 7/15/21 | | | Indonesia | | | | 46,000,000,000 | IDR | | | 3,643,504 | |
| | senior bond, FR64, 6.125%, 5/15/28 | | | Indonesia | | | | 34,000,000,000 | IDR | | | 2,430,334 | |
| | senior bond, FR70, 8.375%, 3/15/24 | | | Indonesia | | | | 26,500,000,000 | IDR | | | 2,171,466 | |
| | Government of Malaysia, senior note, 3.58%, 9/28/18 | | | Malaysia | | | | 10,200,000 | MYR | | | 2,533,819 | |
| | Government of Mexico, | | | | | | | | | | | | |
| | senior bond, M, 6.50%, 6/10/21 | | | Mexico | | | | 362,000 | m MXN | | | 1,781,353 | |
| | senior note, M 10, 8.50%, 12/13/18 | | | Mexico | | | | 2,305,000 | m MXN | | | 11,811,506 | |
| d | | Government of Serbia, | | | | | | | | | | | | |
| | senior note, 144A, 4.875%, 2/25/20 | | | Serbia | | | | 4,000,000 | | | | 4,155,240 | |
| | senior note, 144A, 7.25%, 9/28/21 | | | Serbia | | | | 200,000 | | | | 228,998 | |
FRANKLIN TEMPLETON VARIABLE INSURANCE PRODUCTS TRUST
CONSOLIDATED STATEMENT OF INVESTMENTS
Franklin Strategic Income VIP Fund (continued)
| | | | | | | | | | | | | | |
| | | | | Country | | | Principal Amount* | | | Value | |
| | Foreign Government and Agency Securities (continued) | | | | | | | | | | | | |
| d | | Government of Ukraine, | | | | | | | | | | | | |
| | 144A, 7.75%, 9/01/22 | | | Ukraine | | | | 200,000 | | | $ | 213,480 | |
| | 144A, 7.75%, 9/01/23 | | | Ukraine | | | | 369,000 | | | | 393,003 | |
| | 144A, 7.75%, 9/01/24 | | | Ukraine | | | | 369,000 | | | | 389,112 | |
| | 144A, 7.75%, 9/01/25 | | | Ukraine | | | | 369,000 | | | | 386,086 | |
| | 144A, 7.75%, 9/01/26 | | | Ukraine | | | | 369,000 | | | | 382,321 | |
| | 144A, 7.75%, 9/01/27 | | | Ukraine | | | | 369,000 | | | | 382,321 | |
| | a,n144A, VRI, GDP Linked Security, 5/31/40 | | | Ukraine | | | | 1,952,000 | | | | 1,087,752 | |
| | Nota Do Tesouro Nacional, | | | | | | | | | | | | |
| | 10.00%, 1/01/21 | | | Brazil | | | | 20,100 | o BRL | | | 6,246,307 | |
| | 10.00%, 1/01/23 | | | Brazil | | | | 14,600 | o BRL | | | 4,460,541 | |
| | pIndex Linked, 6.00%, 5/15/23 | | | Brazil | | | | 1,950 | o BRL | | | 1,881,197 | |
| | | | | | | | | | | | | | |
| | | | |
| | Total Foreign Government and Agency Securities
(Cost $45,679,267) | | | | | | | | | | | 47,735,274 | |
| | | | | | | | | | | | | | |
| | U.S. Government and Agency Securities 6.8% | | | | | | | | | | | | |
| | U.S. Treasury Bond, | | | | | | | | | | | | |
| | 7.875%, 2/15/21 | | | United States | | | | 900,000 | | | | 1,060,240 | |
| | 6.50%, 11/15/26 | | | United States | | | | 2,400,000 | | | | 3,187,607 | |
| | 3.00%, 11/15/45 | | | United States | | | | 5,000,000 | | | | 5,246,416 | |
| | q Index Linked, 0.625%, 1/15/24 | | | United States | | | | 7,727,848 | | | | 7,869,353 | |
| | U.S. Treasury Note, 3.75%, 11/15/18 | | | United States | | | | 7,000,000 | | | | 7,118,023 | |
| | 2.75%, 2/15/24 | | | United States | | | | 1,000,000 | | | | 1,026,205 | |
| | 2.25%, 11/15/25 | | | United States | | | | 8,500,000 | | | | 8,424,536 | |
| | qIndex Linked, 0.125%, 7/15/24 | | | United States | | | | 8,850,906 | | | | 8,754,368 | |
| | qIndex Linked, 0.625%, 7/15/21 | | | United States | | | | 1,751,097 | | | | 1,785,640 | |
| | | | | | | | | | | | | | |
| | | | |
| | Total U.S. Government and Agency Securities
(Cost $44,359,625) | | | | | | | | | | | 44,472,388 | |
| | | | | | | | | | | | | | |
| | Asset-Backed Securities and Commercial
Mortgage-Backed Securities 11.7% | | | | | | | | | | | | |
| | | Banks 1.1% | | | | | | | | | |
| | Banc of America Commercial Mortgage Trust, 2006-4, AJ, 5.695%, 7/10/46 | | | United States | | | | 224,215 | | | | 225,074 | |
| r | | Bear Stearns ARM Trust, 2004-4, A6, FRN, 3.551%, 6/25/34 | | | United States | | | | 1,106,363 | | | | 1,128,336 | |
| s | | Citibank Credit Card Issuance Trust, | | | | | | | | | | | | |
| | 2013-A2, A2, FRN, 1.832%, (1-month USD LIBOR + 0.28%), 5/26/20 | | | United States | | | | 650,000 | | | | 650,589 | |
| | 2013-A4, A4, FRN, 1.972%, (1-month USD LIBOR + 0.42%), 7/24/20 | | | United States | | | | 710,000 | | | | 711,489 | |
| | Citigroup Commercial Mortgage Trust, 2006-C5, AJ, 5.482%, 10/15/49 | | | United States | | | | 878,149 | | | | 819,431 | |
| r | | Commercial Mortgage Trust, 2006-GG7, AJ, FRN, 5.767%, 7/10/38 | | | United States | | | | 1,045,000 | | | | 980,459 | |
| | CSAIL Commercial Mortgage Trust, 2015-C1, A4, 3.505%, 4/15/50 | | | United States | | | | 915,000 | | | | 943,594 | |
| r | | CWABS Asset-Backed Certificates Trust, 2005-11, AF4, FRN, 4.629%, 3/25/34 | | | United States | | | | 1,275,000 | | | | 1,281,238 | |
| s | | Merrill Lynch Mortgage Investors Trust, 2005-A6, 2A3, FRN, 1.932%, (1-month USD LIBOR + 0.38%), 8/25/35 | | | United States | | | | 146,757 | | | | 145,550 | |
| | | | | | | | | | | | | | |
| | | | | | | | | | | | | 6,885,760 | |
| | | | | | | | | | | | | | |
FRANKLIN TEMPLETON VARIABLE INSURANCE PRODUCTS TRUST
CONSOLIDATED STATEMENT OF INVESTMENTS
Franklin Strategic Income VIP Fund (continued)
| | | | | | | | | | | | | | |
| | | | | Country | | | Principal Amount* | | | Value | |
| | Asset-Backed Securities and Commercial Mortgage-Backed Securities (continued) | | | | | | | | | | | | |
| | Diversified Financials 10.6% | | | | | | | | | | | | |
| d,s | | Ares XLIII CLO Ltd., 2017-43A, A, 144A, FRN, 2.579%, (3-month USD LIBOR + 1.22%), 10/15/29 | | | United States | | | | 432,000 | | | $ | 435,046 | |
| d,s | | Atrium VIII, | | | | | | | | | | | | |
| | 8A, BR, 144A, FRN, 3.263%, (3-month USD LIBOR + 1.90%), 10/23/24 | | | United States | | | | 350,000 | | | | 353,994 | |
| | 8A, CR, 144A, FRN, 3.863%, (3-month USD LIBOR + 2.50%),
10/23/24 | | | United States | | | | 470,000 | | | | 479,377 | |
| d,s | | Atrium XI, 11A, CR, 144A, FRN, 3.513%, (3-month USD LIBOR + 2.15%), 10/23/25 | | | United States | | | | 1,820,000 | | | | 1,834,396 | |
| | Banc of America Commercial Mortgage Trust, | | | | | | | | | | | | |
| | 2015-UBS7, A3, 3.441%, 9/15/48 | | | United States | | | | 1,050,000 | | | | 1,082,160 | |
| | 2015-UBS7, A4, 3.705%, 9/15/48 | | | United States | | | | 1,170,000 | | | | 1,225,298 | |
| | r 2015-UBS7, B, FRN, 4.366%, 9/15/48 | | | United States | | | | 760,000 | | | | 798,552 | |
| s | | Bank of America Credit Card Trust, 2005-A1, A, FRN, 1.807%, (1-month USD LIBOR + 0.33%), 6/15/20 | | | United States | | | | 800,000 | | | | 800,126 | |
| d,r | | BCAP LLC Trust, 2009-RR1, 2A2, 144A, FRN, 3.459%, 5/26/35 | | | United States | | | | 431,702 | | | | 418,464 | |
| d,s | | Birchwood Park CLO Ltd., 2014-1A, AR, 144A, FRN, 2.539%, (3-month USD LIBOR + 1.18%), 7/15/26 | | | United States | | | | 250,000 | | | | 250,403 | |
| d,s | | BlueMountain CLO Ltd., | | | | | | | | | | | | |
| | 2012-2A, BR, 144A, FRN, 3.336%, (3-month USD LIBOR + 1.90%), 11/20/28 | | | United States | | | | 510,000 | | | | 516,931 | |
| | 2012-2A, CR, 144A, FRN, 4.036%, (3-month USD LIBOR + 2.60%), 11/20/28 | | | United States | | | | 270,000 | | | | 273,991 | |
| d,s | | BlueMountain Fuji U.S. CLO II Ltd., 2017-2A, A1A, 144A, FRN, 2.531%, (3-month USD LIBOR + 1.20%), 10/20/30 | | | United States | | | | 1,800,000 | | | | 1,799,514 | |
| d,t,u | | BlueMountain Fuji U.S. CLO III Ltd., 2017-3A, A2, 144A, FRN, (3-month USD LIBOR + 1.15%), 1/15/30 | | | United States | | | | 200,000 | | | | 200,000 | |
| d,s | | Burnham Park CLO Ltd., | | | | | | | | | | | | |
| | 2016-1A, A, 144A, FRN, 2.793%, (3-month USD LIBOR + 1.43%), 10/20/29 | | | United States | | | | 350,000 | | | | 353,647 | |
| | 2016-1A, B, 144A, FRN, 3.163%, (3-month USD LIBOR + 1.80%), 10/20/29 | | | United States | | | | 460,000 | | | | 464,802 | |
| | 2016-1A, C, 144A, FRN, 3.763%, (3-month USD LIBOR + 2.40%), 10/20/29 | | | United States | | | | 460,000 | | | | 464,545 | |
| s | | Capital One Multi-Asset Execution Trust, | | | | | | | | | | | | |
| | 2014-A3, A3, FRN, 1.857%, (1-month USD LIBOR + 0.38%), 1/18/22 | | | United States | | | | 370,000 | | | | 371,267 | |
| | 2016-A1, A1, FRN, 1.927%, (1-month USD LIBOR + 0.45%), 2/15/22 | | | United States | | | | 2,950,000 | | | | 2,964,511 | |
| | 2016-A2, A2, FRN, 2.107%, (1-month USD LIBOR + 0.63%), 2/15/24 | | | United States | | | | 3,990,000 | | | | 4,044,338 | |
| d,s | | Carlyle Global Market Strategies CLO Ltd., | | | | | | | | | | | | |
| | 2012-4A, BR, 144A, FRN, 3.263%, (3-month USD LIBOR + 1.90%), 1/20/29 | | | United States | | | | 500,000 | | | | 508,240 | |
| | 2012-4A, C1R, 144A, FRN, 3.963%, (3-month USD LIBOR + 2.60%), 1/20/29 | | | United States | | | | 480,000 | | | | 488,242 | |
FRANKLIN TEMPLETON VARIABLE INSURANCE PRODUCTS TRUST
CONSOLIDATED STATEMENT OF INVESTMENTS
Franklin Strategic Income VIP Fund (continued)
| | | | | | | | | | | | | | |
| | | | | Country | | | Principal Amount* | | | Value | |
| | Asset-Backed Securities and Commercial Mortgage-Backed Securities (continued) | | | | | | | | | | | | |
| | Diversified Financials (continued) | | | | | | | | | | | | |
| d,s | | Carlyle U.S. CLO Ltd., 2017-2A, A1B, 144A, FRN, 2.551%, (3-month USD LIBOR + 1.22%), 7/20/31 | | | United States | | | | 1,150,000 | | | $ | 1,157,234 | |
| d,s | | Catamaran CLO Ltd., 2014-2A, BR, 144A, FRN, 4.304%, (3-month USD LIBOR + 2.95%), 10/18/26 | | | United States | | | | 1,550,000 | | | | 1,571,716 | |
| d,s | | Cent CLO LP, | | | | | | | | | | | | |
| | 2013-17A, B, 144A, FRN, 4.378%, (3-month USD LIBOR + 3.00%), 1/30/25 | | | United States | | | | 784,314 | | | | 784,392 | |
| | 2014-22A, A2AR, 144A, FRN, 3.342%, (3-month USD LIBOR + 1.95%), 11/07/26 | | | United States | | | | 392,000 | | | | 395,967 | |
| | 2014-22A, BR, 144A, FRN, 4.342%, (3-month USD LIBOR + 2.95%), 11/07/26 | | | United States | | | | 340,000 | | | | 347,796 | |
| d,r | | CGRBS Commercial Mortgage Trust, 2013-VN05, C, 144A, FRN, 3.584%, 3/13/35 | | | United States | | | | 870,000 | | | | 878,419 | |
| s | | Chase Issuance Trust, 2013-A6, A6, FRN, 2.008%, (1-month USD LIBOR + 0.42%), 7/15/20 | | | United States | | | | 1,090,000 | | | | 1,092,056 | |
| d,s | | Cole Park CLO Ltd., 15-1A, B, 144A, FRN, 3.613%, (3-month USD LIBOR + 2.25%), 10/20/28 | | | United States | | | | 270,000 | | | | 271,169 | |
| r | | COMM Mortgage Trust, 2014-CR19, B, FRN, 4.703%, 8/10/47 | | | United States | | | | 870,000 | | | | 920,496 | |
| d | | Core Industrial Trust, 2015-CALW, A, 144A, 3.04%, 2/10/34 | | | United States | | | | 1,410,000 | | | | 1,433,527 | |
| d,s | | Cumberland Park CLO Ltd., | | | | | | | | | | | | |
| | 2015-2A, B, 144A, FRN, 3.463%, (3-month USD LIBOR + 2.10%), 7/20/26 | | | United States | | | | 1,080,000 | | | | 1,091,945 | |
| | 2015-2A, C, 144A, FRN, 4.213%, (3-month USD LIBOR + 2.85%), 7/20/26 | | | United States | | | | 190,000 | | | | 193,773 | |
| s | | Discover Card Execution Note Trust, 2016-A2, A2, FRN, 2.017%, (1-month USD LIBOR + 0.54%), 9/15/21 | | | United States | | | | 2,950,000 | | | | 2,966,127 | |
| d,s | | Dryden 33 Senior Loan Fund, | | | | | | | | | | | | |
| | 2014-33A, BR, 144A, FRN, 3.209%, (3-month USD LIBOR + 1.85%), 10/15/28 | | | United States | | | | 535,000 | | | | 539,836 | |
| | 2014-33A, CR, 144A, FRN, 3.859%, (3-month USD LIBOR + 2.50%), 10/15/28 | | | United States | | | | 270,000 | | | | 274,344 | |
| d,s | | Dryden 34 Senior Loan Fund, 14-34A, AR, 144A, FRN, 2.519%, (3-month USD LIBOR + 1.16%), 10/15/26 | | | United States | | | | 450,000 | | | | 451,445 | |
| d,r | | Eleven Madison Trust Mortgage Trust, 2015-11MD, A, 144A, FRN, 3.555%, 9/10/35 | | | United States | | | | 1,350,000 | | | | 1,397,340 | |
| s | | FHLMC Structured Agency Credit Risk Debt Notes, | | | | | | | | | | | | |
| | 2014-DN1, M2, FRN, 3.752%, (1-month USD LIBOR + 2.20%), 2/25/24 | | | United States | | | | 1,264,200 | | | | 1,302,679 | |
| | 2014-DN4, M3, FRN, 6.102%, (1-month USD LIBOR + 4.55%), 10/25/24 | | | United States | | | | 681,403 | | | | 752,524 | |
| | 2014-HQ2, M2, FRN, 3.752%, (1-month USD LIBOR + 2.20%), 9/25/24 | | | United States | | | | 953,994 | | | | 984,552 | |
| | 2015-HQ1, M2, FRN, 3.752%, (1-month USD LIBOR + 2.20%), 3/25/25 | | | United States | | | | 347,920 | | | | 350,837 | |
| | 2015-HQ1, M3, FRN, 5.352%, (1-month USD LIBOR + 3.80%), 3/25/25 | | | United States | | | | 370,000 | | | | 402,429 | |
FRANKLIN TEMPLETON VARIABLE INSURANCE PRODUCTS TRUST
CONSOLIDATED STATEMENT OF INVESTMENTS
Franklin Strategic Income VIP Fund (continued)
| | | | | | | | | | | | | | |
| | | | | Country | | | Principal Amount* | | | Value | |
| | Asset-Backed Securities and Commercial Mortgage-Backed Securities (continued) | | | | | | | | | | | | |
| | Diversified Financials (continued) | | | | | | | | | | | | |
| d,s | | Flagship CLO VIII Ltd., 2014-8A, AR, 144A, FRN, 2.609%, (3-month USD LIBOR + 1.25%), 1/16/26 | | | United States | | | | 540,000 | | | $ | 543,353 | |
| d,s | | Flatiron CLO Ltd., 2014-1A, A1R, 144A, FRN, 2.533%, (3-month USD LIBOR + 1.18%), 7/17/26 | | | United States | | | | 1,640,000 | | | | 1,647,347 | |
| s | | FNMA Connecticut Avenue Securities, | | | | | | | | | | | | |
| | 2014-C03, 1M2, FRN, 4.552%, (1-month USD LIBOR + 3.00%), 7/25/24 | | | United States | | | | 912,447 | | | | 975,840 | |
| | 2015-C01, 1M2, FRN, 5.852%, (1-month USD LIBOR + 4.30%), 2/25/25 | | | United States | | | | 1,018,615 | | | | 1,116,673 | |
| | 2015-C01, 2M2, FRN, 6.102%, (1-month USD LIBOR + 4.55%), 2/25/25 | | | United States | | | | 1,607,403 | | | | 1,719,625 | |
| | 2015-C02, 1M2, FRN, 5.552%, (1-month USD LIBOR + 4.00%), 5/25/25 | | | United States | | | | 1,065,590 | | | | 1,158,679 | |
| | 2015-C02, 2M2, FRN, 5.552%, (1-month USD LIBOR + 4.00%), 5/25/25 | | | United States | | | | 1,116,217 | | | | 1,187,872 | |
| | 2015-C03, 2M2, FRN, 6.552%, (1-month USD LIBOR + 5.00%), 7/25/25 | | | United States | | | | 2,181,106 | | | | 2,402,242 | |
| | 2017-C01, 1M2, FRN, 5.102%, (1-month USD LIBOR + 3.55%), 7/25/29 | | | United States | | | | 1,890,000 | | | | 2,056,036 | |
| d,s | | Galaxy CLO Ltd., | | | | | | | | | | | | |
| | 2014-17A, AR, 144A, FRN, 2.759%, (3-month USD LIBOR + 1.40%), 7/15/26 | | | United States | | | | 720,000 | | | | 720,936 | |
| | 2014-17A, BR, 144A, FRN, 3.159%, (3-month USD LIBOR + 1.80%), 7/15/26 | | | United States | | | | 470,000 | | | | 471,001 | |
| | 2014-17A, C1R, 144A, FRN, 3.759%, (3-month USD LIBOR + 2.40%), 7/15/26 | | | United States | | | | 250,000 | | | | 251,225 | |
| d | | G-Force LLC, 2005-RRA, C, 144A, 5.20%, 8/22/36 | | | United States | | | | 1,158,213 | | | | 1,142,344 | |
| | GS Mortgage Securities Trust, | | | | | | | | | | | | |
| | r 2016-GS3, B, FRN, 3.395%, 10/10/49 | | | United States | | | | 900,000 | | | | 889,922 | |
| | 2017-GS6, B, 3.869%, 5/10/50 | | | United States | | | | 870,000 | | | | 888,374 | |
| s | | Impac Secured Assets Trust, 2007-2, FRN, 1.802%, (1-month USD LIBOR + 0.25%), 4/25/37 | | | United States | | | | 154,772 | | | | 153,496 | |
| d,s | | Invitation Homes Trust, 2015-SFR1, A, 144A, FRN, 2.91%, (1-month USD LIBOR + 1.45%), 3/17/32 | | | United States | | | | 1,420,590 | | | | 1,428,313 | |
| d,r | | J.P. Morgan Chase Commercial Mortgage Securities, 2016-Nine, B, 144A, FRN, 2.854%, 10/06/38 | | | United States | | | | 1,200,000 | | | | 1,153,691 | |
| | JPMCC Commercial Mortgage Securities Trust, 2017-JP6, B, 3.946%, 7/15/50 | | | United States | | | | 1,040,000 | | | | 1,057,868 | |
| d,t,u | | LCM 26 Ltd., 26A, B, 144A, FRN, 1/20/31 | | | United States | | | | 250,000 | | | | 250,000 | |
| d,s | | LCM XVI LP, 2016A, BR, 144A, FRN, 2.859%, (3-month USD LIBOR + 1.50%), 7/15/26 | | | United States | | | | 570,000 | | | | 570,941 | |
| d,s | | LCM XVII LP, | | | | | | | | | | | | |
| | 2017A, BR, 144A, FRN, 3.209%, (3-month USD LIBOR + 1.85%), 10/15/26 | | | United States | | | | 350,000 | | | | 351,915 | |
| | 2017A, CR, 144A, FRN, 3.859%, (3-month USD LIBOR + 2.50%), 10/15/26 | | | United States | | | | 320,000 | | | | 326,858 | |
FRANKLIN TEMPLETON VARIABLE INSURANCE PRODUCTS TRUST
CONSOLIDATED STATEMENT OF INVESTMENTS
Franklin Strategic Income VIP Fund (continued)
| | | | | | | | | | | | | | |
| | | | | Country | | | Principal Amount* | | | Value | |
| | Asset-Backed Securities and Commercial Mortgage-Backed Securities (continued) | | | | | | | | | | | | |
| | Diversified Financials (continued) | | | | | | | | | | | | |
| d,s | | LCM XXIV Ltd., 24A, A, 144A, FRN, 2.673%, (3-month USD LIBOR + 1.31%), 3/20/30 | | | United States | | | | 480,000 | | | $ | 482,078 | |
| d,s | | Madison Park Funding XXIII Ltd., | | | | | | | | | | | | |
| | 2017-23A, B, 144A, FRN, 3.162%, (3-month USD LIBOR + 1.70%), 7/27/30 | | | United States | | | | 400,000 | | | | 405,662 | |
| | 2017-23A, C, 144A, FRN, 3.812%, (3-month USD LIBOR + 2.35%), 7/27/30 | | | United States | | | | 500,000 | | | | 508,183 | |
| d,s | | Magnetite XVIII Ltd., 2016-18A, B, 144A, FRN, 3.166%, (3-month USD LIBOR + 1.75%), 11/15/28 | | | United States | | | | 200,000 | | | | 201,418 | |
| s | | MortgageIT Trust, 2004-1, A2, FRN, 2.452%, (1-month USD LIBOR + 0.90%), 11/25/34 | | | United States | | | | 204,928 | | | | 201,844 | |
| d,s | | Octagon Investment Partners 30 Ltd., 144A, FRN, 2.683%, (3-month USD LIBOR + 1.32%), 3/17/30 | | | United States | | | | 480,000 | | | | 486,667 | |
| d,s | | Octagon Investment Partners XX Ltd., 2014-1A, AR, 144A, FRN, 2.543%, (3-month USD LIBOR + 1.13%), 8/12/26 | | | United States | | | | 900,000 | | | | 903,096 | |
| d,s | | Octagon Investment Partners XXIII Ltd., 2015-1A, B, 144A, FRN, 3.359%, (3-month USD LIBOR + 2.00%), 7/15/27 | | | United States | | | | 400,000 | | | | 403,956 | |
| s | | Opteum Mortgage Acceptance Corp. Trust, 2005-4, 1APT, FRN, 1.862%, (1-month USD LIBOR + 0.31%), 11/25/35 | | | United States | | | | 299,219 | | | | 295,440 | |
| s | | Structured Asset Securities Corp., 2005-2XS, 2A2, FRN, 2.861%, (1-month USD LIBOR + 1.50%), 2/25/35 | | | United States | | | | 189,130 | | | | 186,722 | |
| r | | Thornburg Mortgage Securities Trust, 2005-1, A3, FRN, 3.189%, 4/25/45 | | | United States | | | | 192,108 | | | | 193,399 | |
| d,s | | Voya CLO Ltd., | | | | | | | | | | | | |
| | 2013-2A, B, 144A, FRN, 4.047%, (3-month USD LIBOR + 2.68%), 4/25/25 | | | United States | | | | 1,080,000 | | | | 1,080,734 | |
| | 2015-2A, B, 144A, FRN, 3.343%, (3-month USD LIBOR + 1.98%), 7/23/27 | | | United States | | | | 820,000 | | | | 828,733 | |
| | Wells Fargo Mortgage Backed Securities Trust, | | | | | | | | | | | | |
| | r 2004-W, A9, FRN, 3.71%, 11/25/34 | | | United States | | | | 511,287 | | | | 524,049 | |
| | 2007-3, 3A1, 5.50%, 4/25/22 | | | United States | | | | 104,569 | | | | 106,887 | |
| | | | | | | | | | | | | | |
| | | | | | | | | | | | | 68,961,866 | |
| | | | | | | | | | | | | | |
| | | | |
| | Total Asset-Backed Securities and Commercial Mortgage-Backed Securities (Cost $75,190,420) | | | | | | | | | | | 75,847,626 | |
| | | | | | | | | | | | | | |
| | Mortgage-Backed Securities 9.9% | | | | | | | | | | | | |
| v | | Federal Home Loan Mortgage Corp. (FHLMC) Adjustable Rate 0.0%† | | | | | | | | | | | | |
| | FHLMC, 2.948%, (US 1 Year CMT T-Note +/- MBS Margin), 1/01/33 | | | United States | | | | 16,411 | | | | 16,973 | |
| | | | | | | | | | | | | | |
| | | Federal Home Loan Mortgage Corp. (FHLMC) Fixed Rate 4.6% | | | | | | | | | |
| | FHLMC Gold 15 Year, 5.50%, 1/01/19 - 7/01/19 | | | United States | | | | 13,292 | | | | 13,465 | |
| | FHLMC Gold 30 Year, 3.00%, 1/01/47 | | | United States | | | | 566,080 | | | | 567,232 | |
| w | | FHLMC Gold 30 Year, 3.00%, 1/01/47 | | | United States | | | | 7,550,000 | | | | 7,555,120 | |
| w | | FHLMC Gold 30 Year, 3.50%, 1/01/47 | | | United States | | | | 4,530,000 | | | | 4,654,476 | |
| | FHLMC Gold 30 Year, 3.50%, 12/01/47 | | | United States | | | | 4,375,511 | | | | 4,499,086 | |
| w | | FHLMC Gold 30 Year, 4.00%, 1/01/47 | | | United States | | | | 1,820,000 | | | | 1,904,044 | |
| | FHLMC Gold 30 Year, 4.00%, 8/01/47 | | | United States | | | | 8,555,967 | | | | 8,955,439 | |
| | FHLMC Gold 30 Year, 4.00%, 11/01/47 | | | United States | | | | 743,728 | | | | 779,368 | |
| | FHLMC Gold 30 Year, 5.00%, 4/01/34 - 8/01/35 | | | United States | | | | 240,905 | | | | 260,251 | |
| | FHLMC Gold 30 Year, 5.50%, 3/01/33 - 1/01/35 | | | United States | | | | 184,485 | | | | 203,575 | |
FRANKLIN TEMPLETON VARIABLE INSURANCE PRODUCTS TRUST
CONSOLIDATED STATEMENT OF INVESTMENTS
Franklin Strategic Income VIP Fund (continued)
| | | | | | | | | | | | | | |
| | | | | Country | | | Principal Amount* | | | Value | |
| | Mortgage-Backed Securities (continued) | | | | | | | | | | | | |
| | Federal Home Loan Mortgage Corp. (FHLMC) Fixed Rate (continued) | | | | | | | | | | | | |
| | FHLMC Gold 30 Year, 6.00%, 4/01/33 - 2/01/36 | | | United States | | | | 171,565 | | | $ | 192,842 | |
| | FHLMC Gold 30 Year, 6.50%, 11/01/27 - 6/01/36 | | | United States | | | | 32,886 | | | | 36,447 | |
| | FHLMC Gold 30 Year, 7.00%, 9/01/21 - 4/01/30 | | | United States | | | | 13,358 | | | | 14,206 | |
| | FHLMC Gold 30 Year, 7.50%, 8/01/30 - 7/01/31 | | | United States | | | | 1,018 | | | | 1,081 | |
| | | | | | | | | | | | | | |
| | | | | | | | | | | | | 29,636,632 | |
| | | | | | | | | | | | | | |
| v | | Federal National Mortgage Association (FNMA) Adjustable Rate 0.0%† | | | | | | | | | | | | |
| | FNMA, 2.955% - 3.418%, (US 1 Year CMT T-Note +/- MBS Margin), 4/01/20 - 12/01/34 | | | United States | | | | 102,824 | | | | 108,348 | |
| | | | | | | | | | | | | | |
| | | Federal National Mortgage Association (FNMA) Fixed Rate 3.4% | | | | | | | | | |
| | FNMA 15 Year, 2.50%, 7/01/22 - 6/01/27 | | | United States | | | | 333,285 | | | | 335,147 | |
| | FNMA 15 Year, 4.50%, 6/01/19 - 3/01/20 | | | United States | | | | 29,452 | | | | 29,952 | |
| | FNMA 15 Year, 5.00%, 6/01/18 | | | United States | | | | 5,370 | | | | 5,470 | |
| | FNMA 15 Year, 5.50%, 9/01/18 - 11/01/18 | | | United States | | | | 22,328 | | | | 22,421 | |
| w | | FNMA 30 Year, 3.00%, 1/01/47 | | | United States | | | | 8,380,000 | | | | 8,382,331 | |
| | FNMA 30 Year, 3.00%, 3/01/47 | | | United States | | | | 572,747 | | | | 573,332 | |
| w | | FNMA 30 Year, 3.50%, 1/01/47 | | | United States | | | | 4,580,000 | | | | 4,705,392 | |
| | FNMA 30 Year, 3.50%, 11/01/47 | | | United States | | | | 5,655,520 | | | | 5,815,217 | |
| w | | FNMA 30 Year, 4.00%, 1/01/47 | | | United States | | | | 1,770,000 | | | | 1,852,089 | |
| | FNMA 30 Year, 4.00%, 1/01/48 | | | United States | | | | 200,000 | | | | 209,807 | |
| | FNMA 30 Year, 5.00%, 4/01/30 | | | United States | | | | 62,356 | | | | 67,087 | |
| | FNMA 30 Year, 6.50%, 6/01/28 - 10/01/37 | | | United States | | | | 166,952 | | | | 187,443 | |
| | | | | | | | | | | | | | |
| | | | | | | | | | | | | 22,185,688 | |
| | | | | | | | | | | | | | |
| | Government National Mortgage Association (GNMA) Fixed Rate 1.9% | | | | | | | | | | | | |
| | GNMA I SF 30 Year, 5.00%, 11/15/33 - 7/15/34 | | | United States | | | | 239,661 | | | | 260,433 | |
| | GNMA I SF 30 Year, 6.50%, 2/15/32 | | | United States | | | | 1,000 | | | | 1,110 | |
| | GNMA I SF 30 Year, 7.00%, 10/15/28 - 6/15/32 | | | United States | | | | 16,251 | | | | 16,495 | |
| | GNMA I SF 30 Year, 7.50%, 9/15/30 | | | United States | | | | 1,263 | | | | 1,435 | |
| w | | GNMA II SF 30 Year, 3.00%, 1/01/47 | | | United States | | | | 5,620,000 | | | | 5,669,895 | |
| | GNMA II SF 30 Year, 3.00%, 5/20/47 | | | United States | | | | 377,823 | | | | 381,638 | |
| w | | GNMA II SF 30 Year, 3.50%, 1/01/47 | | | United States | | | | 1,910,000 | | | | 1,976,044 | |
| | GNMA II SF 30 Year, 3.50%, 9/20/47 | | | United States | | | | 3,286,982 | | | | 3,404,809 | |
| | GNMA II SF 30 Year, 3.50%, 11/20/47 | | | United States | | | | 387,228 | | | | 401,109 | |
| | GNMA II SF 30 Year, 5.00%, 9/20/33 - 11/20/33 | | | United States | | | | 67,081 | | | | 73,266 | |
| | GNMA II SF 30 Year, 6.00%, 11/20/34 | | | United States | | | | 85,616 | | | | 97,198 | |
| | GNMA II SF 30 Year, 6.50%, 4/20/31 - 2/20/34 | | | United States | | | | 43,796 | | | | 50,213 | |
| | GNMA II SF 30 Year, 7.50%, 1/20/28 - 4/20/32 | | | United States | | | | 10,715 | | | | 12,102 | |
| | | | | | | | | | | | | | |
| | | | | | | | | | | | | 12,345,747 | |
| | | | | | | | | | | | | | |
| | | | |
| | Total Mortgage-Backed Securities
(Cost $64,215,927) | | | | | | | | | | | 64,293,388 | |
| | | | | | | | | | | | | | |
| | Municipal Bonds 0.9% | | | | | | | | | | | | |
| | California State GO, Various Purpose, Refunding, 5.00%, 9/01/29 | | | United States | | | | 1,650,000 | | | | 2,018,297 | |
| | New York City HDC Capital Fund Grant Program Revenue, New York City Housing Authority Program, Series B1, 5.00%, 7/01/33 | | | United States | | | | 500,000 | | | | 552,710 | |
| | Port Authority of New York and New Jersey Revenue, Consolidated, One Hundred Ninety-First Series, 4.823%, 6/01/45 | | | United States | | | | 1,490,000 | | | | 1,641,369 | |
FRANKLIN TEMPLETON VARIABLE INSURANCE PRODUCTS TRUST
CONSOLIDATED STATEMENT OF INVESTMENTS
Franklin Strategic Income VIP Fund (continued)
| | | | | | | | | | | | | | |
| | | | | | Country | | | | Principal Amount | * | | | Value | |
| | Municipal Bonds (continued) | | | | | | | | | | | | |
| f | | Puerto Rico Electric Power Authority Power Revenue, | | | | | | | | | | | | |
| | Series A, 6.75%, 7/01/36 | | | United States | | | | 3,465,000 | | | $ | 1,147,781 | |
| | Series XX, 5.25%, 7/01/40 | | | United States | | | | 165,000 | | | | 54,656 | |
| | San Jose RDA Successor Agency Tax Allocation, Senior, Refunding, Series A-T, 3.25%, 8/01/29 | | | United States | | | | 540,000 | | | | 533,239 | |
| | | | | | | | | | | | | | |
| | | | |
| | Total Municipal Bonds (Cost $7,828,355) | | | | | | | | | | | 5,948,052 | |
| | | | | | | | | | | | | | |
| | | | |
| | | | | | | | Shares | | | | |
| | Escrows and Litigation Trusts 0.0%† | | | | | | | | | |
| a,ab | | Midstates Petroleum Co. Inc./Midstates Petroleum Co. LLC, Escrow Account | | | United States | | | | 1,500,000 | | | | — | |
| a,ab | | NewPage Corp., Litigation Trust | | | United States | | | | 2,500,000 | | | | — | |
| a | | Penn Virginia Corp., Escrow Account | | | United States | | | | 1,500,000 | | | | 5,625 | |
| a,ab | | Vistra Energy Corp., Escrow Account | | | United States | | | | 3,000,000 | | | | 34,800 | |
| | | | | | | | | | | | | | |
| | | |
| | Total Escrows and Litigation Trusts (Cost $91,006) | | | | | | | | 40,425 | |
| | | | | | | | | | | | | | |
| | | |
| | Total Investments before Short Term Investments
(Cost $672,657,725) | | | | | | | | 668,416,018 | |
| | | | | | | | | | | | | | |
| | | | |
| | | | | | | | | Principal Amount | * | | | | |
| | Short Term Investments 1.6% | | | | | | | | | |
| | U.S. Government and Agency Securities (Cost $348,458) 0.1% | | | | | | | | | | | | |
| x,y | | U.S. Treasury Bill, 5/03/18. | | | United States | | | | 350,000 | | | | 348,362 | |
| | | | | | | | | | | | | | |
| | | |
| | Total Investments before Money Market Funds
(Cost $673,006,183) | | | | | | | | 668,764,380 | |
| | | | | | | | | | | | | | |
| | | | |
| | | | | | | | Shares | | | | |
| | Money Market Funds (Cost $10,018,679) 1.5% | | | | | | | | | | | | |
| b,z | | Institutional Fiduciary Trust Money Market Portfolio, 0.89% | | | United States | | | | 10,018,679 | | | | 10,018,679 | |
| | | | | | | | | | | | | | |
| | Total Investments (Cost $683,024,862) 104.5% | | | | | | | | | | | 678,783,059 | |
| | | Other Assets, less Liabilities (4.5)% | | | | | | | | (29,034,057) | |
| | | | | | | | | | | | | | |
| | Net Assets 100.0% | | | | | | | | | | $ | 649,749,002 | |
| | | | | | | | | | | | | | |
FRANKLIN TEMPLETON VARIABLE INSURANCE PRODUCTS TRUST
CONSOLIDATED STATEMENT OF INVESTMENTS
Franklin Strategic Income VIP Fund (continued)
†Rounds to less than 0.1% of net assets.
*The principal amount is stated in U.S. dollars unless otherwise indicated.
aNon-income producing.
aaThe security is owned by FT Holdings Corporation lll, a wholly-owned subsidiary of the Fund. See Note 1(g).
abFair valued using significant unobservable inputs. See Note 11 regarding fair value measurements.
acSee Note 8 regarding restricted securities.
bSee Note 3(e) regarding investments in affiliated management investment companies.
cSecurity was purchased pursuant to Regulation S under the Securities Act of 1933, which exempts from registration securities offered and sold outside of the United States. Such a security cannot be sold in the United States without either an effective registration statement filed pursuant to the Securities Act of 1933, or pursuant to an exemption from registration. This security has been deemed liquid under guidelines approved by the Trust’s Board of Trustees. At December 31, 2017, the value of this security was $690,492, representing 0.1% of net assets.
dSecurity was purchased pursuant to Rule 144A under the Securities Act of 1933 and may be sold in transactions exempt from registration only to qualified institutional buyers or in a public offering registered under the Securities Act of 1933. These securities have been deemed liquid under guidelines approved by the Trust’s Board of Trustees. At December 31, 2017, the aggregate value of these securities was $173,873,932, representing 26.7% of net assets.
ePerpetual security with no stated maturity date.
fSee Note 7 regarding defaulted securities.
gIncome may be received in additional securities and/or cash.
hSee Note 1(f) regarding loan participation notes.
iThe coupon rate shown represents the rate at period end.
jSee Note 1(i) regarding senior floating rate interests.
kSecurity purchased on a delayed delivery basis. See Note 1(c).
lA portion or all of the security represents an unsettled loan commitment. The coupon rate is to-be determined (TBD) at the time of settlement and will be based upon a reference index/floor plus a spread.
mPrincipal amount is stated in 100 Mexican Peso Units.
nThe principal represents the notional amount. See Note 1(d) regarding value recovery instruments.
oPrincipal amount is stated in 1,000 Brazilian Real Units.
pRedemption price at maturity and coupon payment is adjusted for inflation. See Note 1(k).
qPrincipal amount of security is adjusted for inflation. See Note 1(k).
rAdjustable rate security with an interest rate that is not based on a published reference index and spread. The rate is based on the structure of the agreement and current market conditions. The coupon rate shown represents the rate at period end.
sThe coupon rate shown represents the rate inclusive of any caps or floors, if applicable, in effect at period end.
tSecurity purchased on a when-issued basis. See Note 1(c).
uThe coupon rate will be determined at time of issue.
vAdjustable Rate Mortgage-Backed Security (ARM); the rate shown is the effective rate at period end. ARM rates are not based on a published reference rate and spread, but instead pass-through weighted average interest income inclusive of any caps or floors, if applicable, from the underlying mortgage loans in which the majority of mortgages pay interest based on the index shown at their designated reset dates plus a spread, less the applicable servicing and guaranty fee (MBS margin).
wSecurity purchased on a to-be-announced (TBA) basis. See Note 1(c).
xThe security was issued on a discount basis with no stated coupon rate.
yA portion or all of the security has been segregated as collateral for open futures contracts. At December 31, 2017, the value of this security and/or cash pledged amounted to $274,708, representing less than 0.1% of net assets.
zThe rate shown is the annualized seven-day yield at period end.
FRANKLIN TEMPLETON VARIABLE INSURANCE PRODUCTS TRUST
CONSOLIDATED STATEMENT OF INVESTMENTS
Franklin Strategic Income VIP Fund (continued)
At December 31, 2017, the Fund had the following futures contracts outstanding. See Note 1(d).
| | | | | | | | | | | | | | | | | | | | |
| Futures Contracts | | | | | | | | | | | | | | | |
| Description | | | Type | | |
| Number of
Contracts |
| |
| Notional
Amount |
* | |
| Expiration
Date |
| |
| Value/
Unrealized
Appreciation
(Depreciation) |
|
Interest Rate Contracts | | | | | | | | | | | | | | | | | | | | |
Euro-Bund | | | Long | | | | 13 | | | $ | 2,521,788 | | | | 3/08/18 | | | $ | (28,626 | ) |
Long Gilt | | | Long | | | | 46 | | | | 7,775,027 | | | | 3/27/18 | | | | 65,154 | |
U.S. Treasury 10 Yr. Note Ultra | | | Long | | | | 14 | | | | 1,869,875 | | | | 3/20/18 | | | | (6,709 | ) |
U.S. Treasury 30 Yr. Bond | | | Long | | | | 22 | | | | 3,366,000 | | | | 3/20/18 | | | | (2,122 | ) |
| | | | | | | | | | | | | | | | | | | | |
Total Futures Contracts | | | | | | | | | | | | | | | | | | $ | 27,697 | |
| | | | | | | | | | | | | | | | | | | | |
*As of period end.
At December 31, 2017, the Fund had the following forward exchange contracts outstanding. See Note 1(d).
| | | | | | | | | | | | | | | | | | | | | | | | | | | | |
| Forward Exchange Contracts | | | | | | | | | | | | | | | | |
| Currency | | Counterpartya | | | Type | | | Quantity | | | Contract
Amount* | | | Settlement
Date | | | Unrealized
Appreciation | | | Unrealized
Depreciation | |
| OTC Forward Exchange Contracts | | | | | | | | | | | | | | | | | | | | | | | | | |
Argentine Peso | | | JPHQ | | | | Buy | | | | 27,000,000 | | | | 1,456,389 | | | | 2/05/18 | | | $ | — | | | $ | (36,968 | ) |
Polish Zloty | | | JPHQ | | | | Buy | | | | 6,000,000 | | | | 1,641,452 | | | | 2/20/18 | | | | 82,223 | | | | — | |
Argentine Peso | | | JPHQ | | | | Buy | | | | 5,500,000 | | | | 298,248 | | | | 3/15/18 | | | | — | | | | (14,585 | ) |
Colombian Peso | | | JPHQ | | | | Buy | | | | 3,000,000,000 | | | | 987,573 | | | | 3/15/18 | | | | 10,442 | | | | — | |
Indian Rupee | | | JPHQ | | | | Buy | | | | 44,000,000 | | | | 658,288 | | | | 4/12/18 | | | | 24,062 | | | | — | |
Mexican Peso | | | JPHQ | | | | Buy | | | | 11,000,000 | | | | 576,883 | | | | 4/12/18 | | | | — | | | | (27,788 | ) |
Australian Dollar | | | DBAB | | | | Sell | | | | 5,308,345 | | | | 4,159,513 | | | | 4/19/18 | | | | 18,947 | | | | — | |
Australian Dollar | | | JPHQ | | | | Sell | | | | 7,050,000 | | | | 5,525,014 | | | | 4/19/18 | | | | 25,940 | | | | — | |
British Pound | | | DBAB | | | | Sell | | | | 1,600,000 | | | | 2,117,056 | | | | 4/19/18 | | | | — | | | | (51,910 | ) |
British Pound | | | JPHQ | | | | Sell | | | | 1,300,000 | | | | 13,913,965 | SEK | | | 4/19/18 | | | | — | | | | (54,214 | ) |
British Pound | | | JPHQ | | | | Sell | | | | 1,837,472 | | | | 2,434,568 | | | | 4/19/18 | | | | — | | | | (56,316 | ) |
Canadian Dollar | | | JPHQ | | | | Sell | | | | 9,700,000 | | | | 7,728,492 | | | | 4/19/18 | | | | 2,135 | | | | — | |
Euro | | | BZWS | | | | Sell | | | | 2,561,255 | | | | 3,039,531 | | | | 4/19/18 | | | | — | | | | (54,828 | ) |
Euro | | | CITI | | | | Sell | | | | 2,131,200 | | | | 2,529,564 | | | | 4/19/18 | | | | — | | | | (45,227 | ) |
Euro | | | DBAB | | | | Sell | | | | 992,876 | | | | 1,178,435 | | | | 4/19/18 | | | | — | | | | (21,100 | ) |
Euro | | | GSCO | | | | Sell | | | | 369,000 | | | | 437,900 | | | | 4/19/18 | | | | — | | | | (7,905 | ) |
Euro | | | HSBK | | | | Sell | | | | 142,717 | | | | 169,397 | | | | 4/19/18 | | | | — | | | | (3,026 | ) |
Euro | | | JPHQ | | | | Buy | | | | 2,700,000 | | | | 3,199,630 | | | | 4/19/18 | | | | 62,353 | | | | — | |
Euro | | | JPHQ | | | | Sell | | | | 12,278,207 | | | | 14,574,600 | | | | 4/19/18 | | | | — | | | | (259,213 | ) |
Indian Rupee | | | CITI | | | | Buy | | | | 4,537,000 | | | | 68,704 | | | | 4/19/18 | | | | 1,602 | | | | — | |
Indian Rupee | | | DBAB | | | | Buy | | | | 345,556,000 | | | | 5,234,111 | | | | 4/19/18 | | | | 120,690 | | | | — | |
Indian Rupee | | | HSBK | | | | Buy | | | | 144,338,000 | | | | 2,185,549 | | | | 4/19/18 | | | | 51,140 | | | | — | |
Japanese Yen | | | BZWS | | | | Sell | | | | 60,047,000 | | | | 542,586 | | | | 4/19/18 | | | | 6,481 | | | | — | |
Japanese Yen | | | CITI | | | | Sell | | | | 42,830,000 | | | | 387,017 | | | | 4/19/18 | | | | 4,627 | | | | — | |
Japanese Yen | | | DBAB | | | | Buy | | | | 292,000,000 | | | | 2,612,461 | | | | 4/19/18 | | | | — | | | | (5,458 | ) |
Japanese Yen | | | DBAB | | | | Sell | | | | 540,993,500 | | | | 4,879,970 | | | | 4/19/18 | | | | 49,930 | | | | — | |
Japanese Yen | | | HSBK | | | | Sell | | | | 147,626,000 | | | | 1,333,568 | | | | 4/19/18 | | | | 15,550 | | | | — | |
Japanese Yen | | | JPHQ | | | | Sell | | | | 1,136,286,000 | | | | 10,264,414 | | | | 4/19/18 | | | | 119,546 | | | | — | |
Mexican Peso | | | JPHQ | | | | Buy | | | | 30,000,000 | | | | 1,525,933 | | | | 4/19/18 | | | | — | | | | (30,287 | ) |
FRANKLIN TEMPLETON VARIABLE INSURANCE PRODUCTS TRUST
CONSOLIDATED STATEMENT OF INVESTMENTS
Franklin Strategic Income VIP Fund (continued)
| | | | | | | | | | | | | | | | | | | | | | | | | | | | |
| Forward Exchange Contracts (continued) | | | | | | | | | | | | | | | | |
| Currency | | Counterpartya | | | Type | | | Quantity | | | Contract
Amount* | | | Settlement
Date | | | Unrealized
Appreciation | | | Unrealized
Depreciation | |
| OTC Forward Exchange Contracts (continued) | | | | | | | | | | | | | | | | | | | | | | | | | |
Norwegian Krone | | | JPHQ | | | | Buy | | | | 13,700,000 | | | | 1,664,136 | | | | 4/19/18 | | | $ | 10,248 | | | $ | — | |
South Korean Won | | | JPHQ | | | | Sell | | | | 1,800,000,000 | | | | 1,654,108 | | | | 4/19/18 | | | | — | | | | (34,648 | ) |
Swedish Krona | | | JPHQ | | | | Buy | | | | 14,935,000 | | | | 1,801,220 | | | | 4/19/18 | | | | 32,193 | | | | — | |
British Pound | | | JPHQ | | | | Sell | | | | 1,250,000 | | | | 1,649,375 | | | | 8/15/18 | | | | — | | | | (52,649 | ) |
| | | | | | | | | | | | | | | | | | | | | | | | |
Total Forward Exchange Contracts | | | | | | | | | | | | | | | | | | | $ | 638,109 | | | $ | (756,122 | ) |
| | | | | | | | | | | | | | | | | | | | | | | | |
Net unrealized appreciation (depreciation) | | | | | | | | | | | | | | | | | | | | | | | $ | (118,013 | ) |
| | | | | | | | | | | | | | | | | | | | | | | | | | | | |
*In U.S. dollars unless otherwise indicated.
aMay be comprised of multiple contracts with the same counterparty, currency and settlement date.
At December 31, 2017, the Fund had the following credit default swap contracts outstanding. See Note 1(d).
| | | | | | | | | | | | | | | | | | | | | | | | | | | | | | | | | | |
| Credit Default Swap Contracts | | | | | | | | | | | | | | | | | | |
| Description | | Periodic
Payment Rate
Received
(Paid) | | | Payment
Frequency | | | Counter-
party | | | Maturity
Date | | | Notional
Amounta | | | Value | | | Unamortized
Upfront
Payments
(Receipts) | | | Unrealized
Appreciation
(Depreciation) | | | Ratingb |
| OTC Swap Contracts | | | | | | | | | | | | | | | | | | | | | | | | | | | | | | | | | | |
| | | | | | | | | |
| Contracts to Buy Protectionc | | | | | | | | | | | | | | | | | | | | | | | | | | | | | | | | | | |
| | | | | | | | | |
| Single Name | | | | | | | | | | | | | | | | | | | | | | | | | | | | | | | | | | |
Ally Financial Inc. | | | (5.00 | )% | | | Quarterly | | | | CITI | | | | 12/20/22 | | | $ | 750,000 | | | $ | (135,057 | ) | | $ | (136,050 | ) | | $ | 993 | | | |
Ally Financial Inc. | | | (5.00 | )% | | | Quarterly | | | | JPHQ | | | | 12/20/22 | | | | 1,250,000 | | | | (225,096 | ) | | | (228,313 | ) | | | 3,217 | | | |
Best Buy Co. Inc. | | | (5.00 | )% | | | Quarterly | | | | BZWS | | | | 6/20/22 | | | | 275,000 | | | | (48,525 | ) | | | (42,141 | ) | | | (6,384 | ) | | |
Best Buy Co. Inc. | | | (5.00 | )% | | | Quarterly | | | | CITI | | | | 6/20/22 | | | | 2,400,000 | | | | (423,491 | ) | | | (376,461 | ) | | | (47,030 | ) | | |
The Gap Inc. | | | (1.00 | )% | | | Quarterly | | | | CITI | | | | 6/20/22 | | | | 1,150,000 | | | | (4,204 | ) | | | 65,657 | | | | (69,861 | ) | | |
Kohl’s Corp. | | | (1.00 | )% | | | Quarterly | | | | CITI | | | | 6/20/22 | | | | 1,300,000 | | | | 20,371 | | | | 64,250 | | | | (43,879 | ) | | |
L Brands Inc. | | | (1.00 | )% | | | Quarterly | | | | CITI | | | | 6/20/22 | | | | 1,150,000 | | | | 17,429 | | | | 69,769 | | | | (52,340 | ) | | |
Macy’s Retail Holdings Inc. | | | (1.00 | )% | | | Quarterly | | | | CITI | | | | 6/20/22 | | | | 1,100,000 | | | | 59,033 | | | | 72,207 | | | | (13,174 | ) | | |
Target Corp. | | | (1.00 | )% | | | Quarterly | | | | CITI | | | | 6/20/22 | | | | 2,675,000 | | | | (63,517 | ) | | | (39,207 | ) | | | (24,310 | ) | | |
| | | | | | | | |
| Contracts to Sell Protectionc,d | | | | | | | | | | | | | | | | | | | | | | | | | | | | | | | |
| | | | | | | | | |
| Single Name | | | | | | | | | | | | | | | | | | | | | | | | | | | | | | | | | | |
Government of Argentina | | | 5.00 | % | | | Quarterly | | | | CITI | | | | 12/20/22 | | | | 5,000,000 | | | | 589,142 | | | | 419,596 | | | | 169,546 | | | B+ |
Government of Colombia | | | 1.00 | % | | | Quarterly | | | | JPHQ | | | | 12/20/22 | | | | 3,700,000 | | | | 16,861 | | | | (52,818 | ) | | | 69,679 | | | BBB- |
Government of Mexico | | | 1.00 | % | | | Quarterly | | | | FBCO | | | | 12/20/22 | | | | 1,700,000 | | | | 5,404 | | | | (8,671 | ) | | | 14,075 | | | BBB+ |
| | | | | | | | |
| Traded Index | | | | | | | | | | | | | | | | | | | | | | | | | | | | | | | |
| | | | | | | | | |
eCitibank Bespoke Index, Mezzanine Tranche 5-8% | | | 0.50 | % | | | Quarterly | | | | CITI | | | | 6/20/18 | | | | 3,000,000 | | | | 7,581 | | | | — | | | | 7,581 | | | Non-Investment Grade |
| | | | | | | | | |
eCitibank Bespoke Lisbon Index, Equity Tranche 0-3% | | | 0.00 | % | | | Quarterly | | | | CITI | | | | 6/20/19 | | | | 530,000 | | | | (59,440 | ) | | | (92,079 | ) | | | 32,639 | | | Non-Investment Grade |
FRANKLIN TEMPLETON VARIABLE INSURANCE PRODUCTS TRUST
CONSOLIDATED STATEMENT OF INVESTMENTS
Franklin Strategic Income VIP Fund (continued)
| | | | | | | | | | | | | | | | | | | | | | | | | | | | | | | | | | | | |
| Credit Default Swap Contracts (continued) | | | | | | | | | | | | | |
| | | | | | | | | |
| Description | | Periodic
Payment Rate
Received
(Paid) | | | Payment
Frequency | | | Counter-
party | | | Maturity
Date | | | Notional
Amounta | | | Value | | | Unamortized
Upfront
Payments
(Receipts) | | | Unrealized
Appreciation
(Depreciation) | | | Ratingb | |
| OTC Swap Contracts (continued) | | | | | | | | | | | | | | | | | | | | | | | | | | | | | |
| Contracts to Sell Protectionc,d (continued) | | | | | | | | | | | | | | | | | | | | | | | | | | | | | |
| Traded Index (continued) | | | | | | | | | | | | | | | | | | | | | | | | | | | | | |
eCitibank Bespoke Verona | | | | | | | | | | | | | | | | | | | | | | | | | | | | | | | | | | | | |
Index, Equity Tranche 0-3% 0.00% | | | | | | | Quarterly | | | | CITI | | | | 12/20/19 | | | $ | 1,100,000 | | | $ | (220,050 | ) | | $ | (217,720 | ) | | $ | (2,330 | ) | | | Non-Investment Grade | |
eCitibank Bespoke Verona Index, Mezzanine Tranche 7-15% | | | 0.40 | % | | | Quarterly | | | | CITI | | | | 12/20/19 | | | | 3,100,000 | | | | 3,481 | | | | — | | | | 3,481 | | | | Non-Investment Grade | |
| | | | | | | | | | | | | | | | | | | | | | | | | | | | | | | | | | | | |
MCDX.NA.29 | | | 1.00 | % | | | Quarterly | | | | CITI | | | | 12/20/22 | | | | 2,270,000 | | | | 70,454 | | | | 54,961 | | | | 15,493 | | | | Investment Grade | |
| | | | | | | | | | | | | | | | | | | | | | | | | | | | |
Total Credit Default Swap Contracts | | | | | | | | | | | | | | | | | | | | | | $ | (389,624 | ) | | $ | (447,020 | ) | | $ | 57,396 | | | | | |
| | | | | | | | | | | | | | | | | | | | | | | | | | | | |
aFor contracts to sell protection, the notional amount is equal to the maximum potential amount of the future payments and no recourse provisions have been entered into in association with the contracts.
bBased on Standard and Poor’s (S&P) Rating for single name swaps and internal ratings for index swaps. Internal ratings based on mapping into equivalent ratings from external vendors.
cPerformance triggers for settlement of contract include default, bankruptcy or restructuring for single name swaps and failure to pay or bankruptcy of the underlying securities for traded index swaps.
dThe fund enters contracts to sell protection to create a long credit position.
eRepresents a custom index comprised of a basket of underlying issuers.
See Note 9 regarding other derivative information.
See Abbreviations on page FSI - 53.
| | | | |
| FSI-32 | | Annual Report | The accompanying notes are an integral part of these consolidated financial statements. |
FRANKLIN TEMPLETON VARIABLE INSURANCE PRODUCTS TRUST
Consolidated Financial Statements
Consolidated Statement of Assets and Liabilities
December 31, 2017
| | | | |
| | | Franklin Strategic Income VIP Fund | |
Assets: | | | | |
Investments in securities: | | | | |
Cost - Unaffiliated issuers | | $ | 632,420,962 | |
Cost - Non-controlled affiliates (Note 3e) | | | 50,603,900 | |
| | | | |
Value - Unaffiliated issuers | | $ | 628,445,490 | |
Value - Non-controlled affiliates (Note 3e) | | | 50,337,569 | |
Cash | | | 8,868,756 | |
Restricted cash for OTC derivative contracts (Note 1e) | | | 180,000 | |
Foreign currency, at value (cost $93,430) | | | 93,868 | |
Receivables: | | | | |
Investment securities sold | | | 666,559 | |
Capital shares sold | | | 206,036 | |
Dividends and interest | | | 6,711,083 | |
Affiliates | | | 519,374 | |
Deposits with brokers for: | | | | |
OTC derivative contracts | | | 390,000 | |
Variation margin on futures contracts | | | 13,591 | |
OTC swap contracts (upfront payments $806,812) | | | 746,440 | |
Unrealized appreciation on OTC forward exchange contracts | | | 638,109 | |
Unrealized appreciation on OTC swap contracts | | | 316,704 | |
Other assets | | | 78 | |
| | | | |
Total assets | | | 698,133,657 | |
| | | | |
Liabilities: | | | | |
Payables: | | | | |
Investment securities purchased | | | 42,214,597 | |
Capital shares redeemed | | | 440,169 | |
Management fees | | | 311,884 | |
Distribution fees | | | 134,036 | |
Deposits from brokers for: | | | | |
OTC derivative contracts | | | 180,000 | |
OTC swap contracts (upfront receipts $1,368,642) | | | 1,193,460 | |
Unrealized depreciation on OTC forward exchange contracts | | | 756,122 | |
Unrealized depreciation on OTC swap contracts | | | 259,308 | |
Deferred tax | | | 90,679 | |
FT Subsidiary income taxes (Note 1g) | | | 2,588,805 | |
Accrued expenses and other liabilities | | | 215,595 | |
| | | | |
Total liabilities | | | 48,384,655 | |
| | | | |
Net assets, at value | | $ | 649,749,002 | |
Net assets consist of: | | | | |
Paid-in capital | | $ | 668,229,624 | |
Undistributed net investment income | | | 13,385,921 | |
Net unrealized appreciation (depreciation) | | | (4,389,856 | ) |
Accumulated net realized gain (loss) | | | (27,476,687 | ) |
| | | | |
Net assets, at value | | $ | 649,749,002 | |
| | | | |
| | | | | | |
| | | The accompanying notes are an integral part of these consolidated financial statements. | Annual Report | | | FSI-33 | |
FRANKLIN TEMPLETON VARIABLE INSURANCE PRODUCTS TRUST
CONSOLIDATED FINANCIAL STATEMENTS
Consolidated Statement of Assets and Liabilities (continued)
December 31, 2017
| | | | |
| | | Franklin Strategic Income VIP Fund | |
| |
| Class 1: | | | | |
Net assets, at value | | $ | 361,464,905 | |
| | | | |
Shares outstanding | | | 32,430,010 | |
| | | | |
Net asset value and maximum offering price per share | | $ | 11.15 | |
| | | | |
| |
| Class 2: | | | | |
Net assets, at value | | $ | 214,271,161 | |
| | | | |
Shares outstanding | | | 19,908,570 | |
| | | | |
Net asset value and maximum offering price per share | | $ | 10.76 | |
| | | | |
| |
| Class 4: | | | | |
Net assets, at value | | $ | 74,012,936 | |
| | | | |
Shares outstanding | | | 6,702,485 | |
| | | | |
Net asset value and maximum offering price per share | | $ | 11.04 | |
| | | | |
| | | | |
| FSI-34 | | Annual Report | The accompanying notes are an integral part of these consolidated financial statements. | | |
FRANKLIN TEMPLETON VARIABLE INSURANCE PRODUCTS TRUST
CONSOLIDATED FINANCIAL STATEMENTS
Consolidated Statement of Operations
for the year ended December 31, 2017
| | | | |
| | | Franklin Strategic Income VIP Fund | |
Investment income: | | | | |
Dividends: | | | | |
Unaffiliated issuers | | $ | 161,755 | |
Non-controlled affiliates (Note 3e) | | | 3,472,881 | |
Interest: (net of foreign taxes)~ | | | | |
Unaffiliated issuers | | | 27,144,017 | |
Other income (net of taxes of $139,525) (Note 1g) | | | 223,822 | |
| | | | |
Total investment income | | | 31,002,475 | |
| | | | |
Expenses: | | | | |
Management fees (Note 3a) | | | 4,018,971 | |
Distribution fees: (Note 3c) | | | | |
Class 2 | | | 528,664 | |
Class 4 | | | 271,043 | |
Custodian fees (Note 4) | | | 29,087 | |
Reports to shareholders | | | 179,946 | |
Registration and filing fees | | | 99 | |
Professional fees | | | 106,134 | |
Trustees’ fees and expenses | | | 2,909 | |
Other | | | 198,331 | |
| | | | |
Total expenses. | | | 5,335,184 | |
Expense reductions (Note 4) | | | (4,818 | ) |
Expenses waived/paid by affiliates (Note 3e) | | | (337,692 | ) |
| | | | |
Net expenses | | | 4,992,674 | |
| | | | |
Net investment income | | | 26,009,801 | |
| | | | |
Realized and unrealized gains (losses): | | | | |
Net realized gain (loss) from: | | | | |
Investments: | | | | |
Unaffiliated issuers | | | (16,261,226 | ) |
Non-controlled affiliates (Note 3e) | | | 332,845 | |
Foreign currency transactions | | | (134,413 | ) |
Forward exchange contracts | | | (477,456 | ) |
Futures contracts | | | 580,022 | |
Swap contracts | | | 672,542 | |
Capital gain distributions from management investment companies: | | | | |
Non-controlled affiliates (Note 3e) | | | 424,075 | |
Capital gain distribution received in FT Subsidiary (net of taxes of $2,449,280) (Note 1g) | | | 5,716,652 | |
| | | | |
Net realized gain (loss) | | | (9,146,959 | ) |
| | | | |
Net change in unrealized appreciation (depreciation) on: | | | | |
Investments: | | | | |
Unaffiliated issuers | | | 17,230,372 | |
Non-controlled affiliates (Note 3e) | | | (2,392,668 | ) |
Translation of other assets and liabilities denominated in foreign currencies | | | 218,750 | |
Forward exchange contracts | | | (3,664,917 | ) |
Futures contracts | | | (57,772 | ) |
Swap contracts | | | 94,508 | |
Change in deferred taxes on unrealized appreciation | | | (62,576 | ) |
| | | | |
Net change in unrealized appreciation (depreciation) | | | 11,365,697 | |
| | | | |
Net realized and unrealized gain (loss) | | | 2,218,738 | |
| | | | |
Net increase (decrease) in net assets resulting from operations | | $ | 28,228,539 | |
| | | | |
| |
~Foreign taxes withheld on interest | | $ | 83,924 | |
| | | | | | |
| | | The accompanying notes are an integral part of these consolidated financial statements. | Annual Report | | | FSI-35 | |
FRANKLIN TEMPLETON VARIABLE INSURANCE PRODUCTS TRUST
CONSOLIDATED FINANCIAL STATEMENTS
Consolidated Statements of Changes in Net Assets
| | | | | | | | |
| | | Franklin Strategic Income VIP Fund | |
| | | Year Ended December 31, | |
| | | 2017 | | | 2016 | |
Increase (decrease) in net assets: | | | | | | | | |
Operations: | | | | | | | | |
Net investment income | | $ | 26,009,801 | | | $ | 30,329,844 | |
Net realized gain (loss) | | | (9,146,959 | ) | | | (23,035,691 | ) |
Net change in unrealized appreciation (depreciation) on investments | | | 11,365,697 | | | | 47,403,999 | |
| | | | |
Net increase (decrease) in net assets resulting from operations | | | 28,228,539 | | | | 54,698,152 | |
| | | | |
Distributions to shareholders from: | | | | | | | | |
Net investment income: | | | | | | | | |
Class 1 | | | (11,689,930 | ) | | | (15,028,686 | ) |
Class 2 | | | (6,228,631 | ) | | | (6,934,919 | ) |
Class 4 | | | (2,076,378 | ) | | | (2,790,452 | ) |
| | | | |
Total distributions to shareholders | | | (19,994,939 | ) | | | (24,754,057 | ) |
| | | | |
Capital share transactions: (Note 2) | | | | | | | | |
Class 1 | | | (39,684,506 | ) | | | (63,348,838 | ) |
Class 2 | | | 8,628,689 | | | | (7,135,423 | ) |
Class 4 | | | (7,192,045 | ) | | | (16,512,240 | ) |
| | | | |
Total capital share transactions | | | (38,247,862 | ) | | | (86,996,501 | ) |
| | | | |
Net increase (decrease) in net assets | | | (30,014,262 | ) | | | (57,052,406 | ) |
Net assets: | | | | | | | | |
Beginning of year | | | 679,763,264 | | | | 736,815,670 | |
| | | | |
End of year | | $ | 649,749,002 | | | $ | 679,763,264 | |
| | | | |
Undistributed net investment income included in net assets: | | | | | | | | |
End of year | | $ | 13,385,921 | | | $ | 13,825,422 | |
| | | | |
| | | | |
| FSI-36 | | Annual Report | The accompanying notes are an integral part of these consolidated financial statements. | | |
FRANKLIN TEMPLETON VARIABLE INSURANCE PRODUCTS TRUST
Notes to Consolidated Financial Statements
Franklin Strategic Income VIP Fund
1. Organization and Significant Accounting Policies
Franklin Templeton Variable Insurance Products Trust (Trust) is registered under the Investment Company Act of 1940 (1940 Act) as an open-end management investment company, consisting of eighteen separate funds and applies the specialized accounting and reporting guidance in U.S. Generally Accepted Accounting Principles (U.S. GAAP). Franklin Strategic Income VIP Fund (Fund) is included in this report. Shares of the Fund are generally sold only to insurance company separate accounts to fund the benefits of variable life insurance policies or variable annuity contracts. At December 31, 2017, 67.7% of the Fund’s shares were held through one insurance company. Investment activities of these insurance company separate accounts could have a material impact on the Fund. The Fund offers three classes of shares: Class 1, Class 2 and Class 4. Each class of shares may differ by its distribution fees, voting rights on matters affecting a single class and its exchange privilege.
The following summarizes the Fund’s significant accounting policies.
a. Financial Instrument Valuation
The Fund’s investments in financial instruments are carried at fair value daily. Fair value is the price that would be received to sell an asset or paid to transfer a liability in an orderly transaction between market participants on the measurement date. The Fund calculates the net asset value (NAV) per share as of 4 p.m. Eastern time each day the New York Stock Exchange (NYSE) is open for trading. Under compliance policies and procedures approved by the Trust’s Board of Trustees (the Board), the Fund’s administrator has responsibility for oversight of valuation, including leading the cross-functional Valuation Committee (VC). The VC provides administration and oversight of the Fund’s valuation policies and procedures, which are approved annually by the Board. Among other things, these procedures allow the Fund to utilize independent pricing services, quotations from securities and financial instrument dealers, and other market sources to determine fair value.
Equity securities and derivative financial instruments listed on an exchange or on the NASDAQ National Market System are valued at the last quoted sale price or the official closing price of the day, respectively. Foreign equity securities are valued as of the close of trading on the foreign stock exchange on which the security is primarily traded, or as of 4 p.m. Eastern time.
The value is then converted into its U.S. dollar equivalent at the foreign exchange rate in effect at 4 p.m. Eastern time on the day that the value of the security is determined. Over-the-counter (OTC) securities are valued within the range of the most recent quoted bid and ask prices. Securities that trade in multiple markets or on multiple exchanges are valued according to the broadest and most representative market. Certain equity securities are valued based upon fundamental characteristics or relationships to similar securities.
Debt securities generally trade in the OTC market rather than on a securities exchange. The Fund’s pricing services use multiple valuation techniques to determine fair value. In instances where sufficient market activity exists, the pricing services may utilize a market-based approach through which quotes from market makers are used to determine fair value. In instances where sufficient market activity may not exist or is limited, the pricing services also utilize proprietary valuation models which may consider market characteristics such as benchmark yield curves, credit spreads, estimated default rates, anticipated market interest rate volatility, coupon rates, anticipated timing of principal repayments, underlying collateral, and other unique security features in order to estimate the relevant cash flows, which are then discounted to calculate the fair value. Securities denominated in a foreign currency are converted into their U.S. dollar equivalent at the foreign exchange rate in effect at 4 p.m. Eastern time on the date that the values of the foreign debt securities are determined.
Investments in open-end mutual funds are valued at the closing NAV.
Certain derivative financial instruments are centrally cleared or trade in the OTC market. The Fund’s pricing services use various techniques including industry standard option pricing models and proprietary discounted cash flow models to determine the fair value of those instruments. The Fund’s net benefit or obligation under the derivative contract, as measured by the fair value of the contract, is included in net assets.
The Fund has procedures to determine the fair value of financial instruments for which market prices are not reliable or readily available. Under these procedures, the VC convenes on a regular basis to review such financial instruments and considers a number of factors, including significant unobservable valuation inputs, when arriving at fair value. The VC primarily employs a market-based approach which may use related or comparable assets or liabilities, recent transactions, market
FRANKLIN TEMPLETON VARIABLE INSURANCE PRODUCTS TRUST
NOTES TO CONSOLIDATED FINANCIAL STATEMENTS
Franklin Strategic Income VIP Fund (continued)
1. Organization and Significant Accounting Policies (continued)
a. Financial Instrument Valuation (continued)
multiples, book values, and other relevant information for the investment to determine the fair value of the investment. An income-based valuation approach may also be used in which the anticipated future cash flows of the investment are discounted to calculate fair value. Discounts may also be applied due to the nature or duration of any restrictions on the disposition of the investments. Due to the inherent uncertainty of valuations of such investments, the fair values may differ significantly from the values that would have been used had an active market existed. The VC employs various methods for calibrating these valuation approaches including a regular review of key inputs and assumptions, transactional back-testing or disposition analysis, and reviews of any related market activity.
Trading in securities on foreign securities stock exchanges and OTC markets may be completed before 4 p.m. Eastern time. In addition, trading in certain foreign markets may not take place on every Fund’s business day. Occasionally, events occur between the time at which trading in a foreign security is completed and 4 p.m. Eastern time that might call into question the reliability of the value of a portfolio security held by the Fund. As a result, differences may arise between the value of the Fund’s portfolio securities as determined at the foreign market close and the latest indications of value at 4 p.m. Eastern time. In order to minimize the potential for these differences, the VC monitors price movements following the close of trading in foreign stock markets through a series of country specific market proxies (such as baskets of American Depositary Receipts, futures contracts and exchange traded funds). These price movements are measured against established trigger thresholds for each specific market proxy to assist in determining if an event has occurred that may call into question the reliability of the values of the foreign securities held by the Fund. If such an event occurs, the securities may be valued using fair value procedures, which may include the use of independent pricing services.
When the last day of the reporting period is a non-business day, certain foreign markets may be open on those days that the Fund’s NAV is not calculated, which could result in differences between the value of the Fund’s portfolio securities on the last business day and the last calendar day of the reporting period.
Any significant security valuation changes due to an open foreign market are adjusted and reflected by the Fund for financial reporting purposes.
b. Foreign Currency Translation
Portfolio securities and other assets and liabilities denominated in foreign currencies are translated into U.S. dollars based on the exchange rate of such currencies against U.S. dollars on the date of valuation. The Fund may enter into foreign currency exchange contracts to facilitate transactions denominated in a foreign currency. Purchases and sales of securities, income and expense items denominated in foreign currencies are translated into U.S. dollars at the exchange rate in effect on the transaction date. Portfolio securities and assets and liabilities denominated in foreign currencies contain risks that those currencies will decline in value relative to the U.S. dollar. Occasionally, events may impact the availability or reliability of foreign exchange rates used to convert the U.S. dollar equivalent value. If such an event occurs, the foreign exchange rate will be valued at fair value using procedures established and approved by the Board.
The Fund does not separately report the effect of changes in foreign exchange rates from changes in market prices on securities held. Such changes are included in net realized and unrealized gain or loss from investments in the Consolidated Statement of Operations.
Realized foreign exchange gains or losses arise from sales of foreign currencies, currency gains or losses realized between the trade and settlement dates on securities transactions and the difference between the recorded amounts of dividends, interest, and foreign withholding taxes and the U.S. dollar equivalent of the amounts actually received or paid. Net unrealized foreign exchange gains and losses arise from changes in foreign exchange rates on foreign denominated assets and liabilities other than investments in securities held at the end of the reporting period.
c. Securities Purchased on a When-Issued or Delayed Delivery and TBA Basis
The Fund purchases securities on a when-issued or delayed delivery and to-be-announced (TBA) basis, with payment and delivery scheduled for a future date. These transactions are subject to market fluctuations and are subject to the risk that the value at delivery may be more or less than the trade date
FRANKLIN TEMPLETON VARIABLE INSURANCE PRODUCTS TRUST
NOTES TO CONSOLIDATED FINANCIAL STATEMENTS
Franklin Strategic Income VIP Fund (continued)
purchase price. Although the Fund will generally purchase these securities with the intention of holding the securities, it may sell the securities before the settlement date.
d. Derivative Financial Instruments
The Fund invested in derivative financial instruments in order to manage risk or gain exposure to various other investments or markets. Derivatives are financial contracts based on an underlying or notional amount, require no initial investment or an initial net investment that is smaller than would normally be required to have a similar response to changes in market factors, and require or permit net settlement. Derivatives contain various risks including the potential inability of the counterparty to fulfill their obligations under the terms of the contract, the potential for an illiquid secondary market, and/or the potential for market movements which expose the Fund to gains or losses in excess of the amounts shown in the Consolidated Statement of Assets and Liabilities. Realized gain and loss and unrealized appreciation and depreciation on these contracts for the period are included in the Consolidated Statement of Operations.
Derivative counterparty credit risk is managed through a formal evaluation of the creditworthiness of all potential counterparties. The Fund attempts to reduce its exposure to counterparty credit risk on OTC derivatives, whenever possible, by entering into International Swaps and Derivatives Association (ISDA) master agreements with certain counterparties. These agreements contain various provisions, including but not limited to collateral requirements, events of default, or early termination. Termination events applicable to the counterparty include certain deteriorations in the credit quality of the counterparty. Termination events applicable to the Fund include failure of the Fund to maintain certain net asset levels and/or limit the decline in net assets over various periods of time. In the event of default or early termination, the ISDA master agreement gives the non-defaulting party the right to net and close-out all transactions traded, whether or not arising under the ISDA agreement, to one net amount payable by one counterparty to the other. However, absent an event of default or early termination, OTC derivative assets and liabilities are presented gross and not offset in the Consolidated Statement of Assets and Liabilities. Early termination by the counterparty may result in an immediate payment by the Fund of any net liability owed to that counterparty under the ISDA agreement.
Collateral requirements differ by type of derivative. Collateral or initial margin requirements are set by the broker or exchange clearing house for exchange traded and centrally cleared derivatives. Initial margin deposited is held at the exchange and can be in the form of cash and/or securities. For OTC derivatives traded under an ISDA master agreement, posting of collateral is required by either the Fund or the applicable counterparty if the total net exposure of all OTC derivatives with the applicable counterparty exceeds the minimum transfer amount, which typically ranges from $100,000 to $250,000, and can vary depending on the counterparty and the type of the agreement. Generally, collateral is determined at the close of Fund business each day and any additional collateral required due to changes in derivative values may be delivered by the Fund or the counterparty the next business day, or within a few business days. Collateral pledged and/or received by the Fund for OTC derivatives, if any, is held in segregated accounts with the Fund’s custodian/counterparty broker and can be in the form of cash and/or securities. Unrestricted cash may be invested according to the Fund’s investment objectives. To the extent that the amounts due to the Fund from its counterparties are not subject to collateralization or are not fully collateralized, the Fund bears the risk of loss from counterparty non-performance.
The Fund entered into exchange traded futures contracts primarily to manage and/or gain exposure to interest rate risk. A futures contract is an agreement between the Fund and a counterparty to buy or sell an asset at a specified price on a future date. Required initial margins are pledged by the Fund, and the daily change in fair value is accounted for as a variation margin payable or receivable.
The Fund entered into OTC forward exchange contracts primarily to manage and/or gain exposure to certain foreign currencies. A forward exchange contract is an agreement between the Fund and a counterparty to buy or sell a foreign currency at a specific exchange rate on a future date.
The Fund entered into credit default swap contracts primarily to manage exposure to credit risk. A credit default swap is an agreement between the Fund and a counterparty whereby the buyer of the contract receives credit protection and the seller of the contract guarantees the credit worthiness of a referenced debt obligation. These agreements may be privately negotiated in the over-the-counter market (OTC credit default swaps) or may be executed in a multilateral trade facility platform, such as a registered exchange (centrally cleared credit default swaps). The underlying referenced debt obligation may be a single
FRANKLIN TEMPLETON VARIABLE INSURANCE PRODUCTS TRUST
NOTES TO CONSOLIDATED FINANCIAL STATEMENTS
Franklin Strategic Income VIP Fund (continued)
1. Organization and Significant Accounting
Policies (continued)
d. Derivative Financial Instruments (continued)
issuer of corporate or sovereign debt, a credit index, a basket of issuers or indices, or a tranche of a credit index or basket of issuers or indices. In the event of a default of the underlying referenced debt obligation, the buyer is entitled to receive the notional amount of the credit default swap contract from the seller in exchange for the referenced debt obligation, a net settlement amount equal to the notional amount of the credit default swap less the recovery value of the referenced debt obligation, or other agreed upon amount. For centrally cleared credit default swaps, required initial margins are pledged by the Fund, and the daily change in fair value is accounted for as a variation margin payable or receivable in the Consolidated Statement of Assets and Liabilities. Over the term of the contract, the buyer pays the seller a periodic stream of payments, provided that no event of default has occurred. Such periodic payments are accrued daily as an unrealized appreciation or depreciation until the payments are made, at which time they are realized. Upfront payments and receipts are reflected in the Consolidated Statement of Assets and Liabilities and represent compensating factors between stated terms of the credit default swap agreement and prevailing market conditions (credit spreads and other relevant factors). These upfront payments and receipts are amortized over the term of the contract as a realized gain or loss in the Consolidated Statement of Operations.
The Fund invests in value recovery instruments (VRI) primarily to gain exposure to economic growth. Periodic payments from VRI are dependent on established benchmarks for underlying variables. VRI has a notional amount, which is used to calculate amounts of payments to holders. Payments are recorded upon receipt as realized gains in the Consolidated Statement of Operations. The risks of investing in VRI include growth risk, liquidity, and the potential loss of investment.
See Note 9 regarding other derivative information.
e. Restricted Cash
At December 31, 2017, the Fund held restricted cash in connection with investments in certain derivative securities. Restricted cash is held in a segregated account with the Fund’s custodian and is reflected in the Consolidated Statement of Assets and Liabilities.
f. Loan Participation Notes
The Fund invests in loan participation notes (Participations). Participations are loans originally issued to a borrower by one or more financial institutions (the Lender) and subsequently sold to other investors, such as the Fund. Participations typically result in the Fund having a contractual relationship only with the Lender and not with the borrower. The Fund has the right to receive from the Lender any payments of principal, interest and fees which the Lender received from the borrower. The Fund generally has no rights to either enforce compliance by the borrower with the terms of the loan agreement or to any collateral relating to the original loan. As a result, the Fund assumes the credit risk of both the borrower and the Lender that is selling the Participation. The Participations may also involve interest rate risk and liquidity risk, including the potential default or insolvency of the borrower and/or the Lender.
g. Investments in FT Holdings Corporation III (FT Subsidiary)
The Fund invests in certain financial instruments through its investment in FT Subsidiary. FT Subsidiary is a Delaware Corporation, is a wholly-owned subsidiary of the Fund, and is able to invest in certain financial instruments consistent with the investment objective of the Fund. At December 31, 2017, FT Subsidiary’s investment, Turtle Bay Resort, as well as any other assets and liabilities of FT Subsidiary are reflected in the Fund’s Consolidated Statement of Investments and Consolidated Statement of Assets and Liabilities. During the year ended December 31, 2017, Turtle Bay Resort paid a distribution to FT Subsidiary upon the sale of a majority of its assets to a third party. The distribution received is reflected net of taxes as other income and capital gain distribution received in FT Subsidiary in the Consolidated Statement of Operations. For U.S. income tax purposes, this distribution is taxable to FT Subsidiary, and as such an estimated tax liability was recorded in the FT Subsidiary. The estimated tax liability was calculated using the FT Subsidiary’s prior year effective federal rate of 34%, and a blended Hawaii state rate of 4% of the 2017 estimated capital gain and 6.4% of the 2017 estimated ordinary income. The tax liability is reflected as FT Subsidiary income taxes in the Consolidated Statement of Assets and Liabilities. The financial statements have been consolidated and include the accounts of the Fund and FT Subsidiary. All intercompany transactions and balances have been eliminated. At December 31, 2017, the net
FRANKLIN TEMPLETON VARIABLE INSURANCE PRODUCTS TRUST
NOTES TO CONSOLIDATED FINANCIAL STATEMENTS
Franklin Strategic Income VIP Fund (continued)
assets of FT Subsidiary were $6,177,466, representing less than 1% of the Fund’s consolidated net assets. The Fund’s investment in FT Subsidiary is limited to 25% of consolidated assets.
h. Mortgage Dollar Rolls
The Fund enters into mortgage dollar rolls, typically on a TBA basis. Mortgage dollar rolls are agreements between the Fund and a financial institution where the Fund sells (or buys) mortgage-backed securities for delivery on a specified date and simultaneously contracts to repurchase (or sell) substantially similar (same type, coupon, and maturity) securities at a future date and at a predetermined price. Gains or losses are realized on the initial sale, and the difference between the repurchase price and the sale price is recorded as an unrealized gain or loss to the Fund upon entering into the mortgage dollar roll. In addition, the Fund may invest the cash proceeds that are received from the initial sale. During the period between the sale and repurchase, the Fund is not entitled to principal and interest paid on the mortgage backed securities. Transactions in mortgage dollar rolls are accounted for as purchases and sales and may result in an increase to the Fund’s portfolio turnover rate. The risks of mortgage dollar roll transactions include the potential inability of the counterparty to fulfill its obligations.
i. Senior Floating Rate Interests
The Fund invests in senior secured corporate loans that pay interest at rates which are periodically reset by reference to a base lending rate plus a spread. These base lending rates are generally the prime rate offered by a designated U.S. bank or the London InterBank Offered Rate (LIBOR). Senior secured corporate loans often require prepayment of principal from excess cash flows or at the discretion of the borrower. As a result, actual maturity may be substantially less than the stated maturity. Senior secured corporate loans in which the Fund invests are generally readily marketable, but may be subject to certain restrictions on resale.
j. Income and Deferred Taxes
It is the Fund’s policy to qualify as a regulated investment company under the Internal Revenue Code. The Fund intends to distribute to shareholders substantially all of its taxable income and net realized gains to relieve it from federal income and if applicable, excise taxes. As a result, no provision for U.S. federal income taxes is required.
The Fund may be subject to foreign taxation related to income received, capital gains on the sale of securities and certain foreign currency transactions in the foreign jurisdictions in which it invests. Foreign taxes, if any, are recorded based on the tax regulations and rates that exist in the foreign markets in which the Fund invests. When a capital gain tax is determined to apply, the Fund records an estimated deferred tax liability in an amount that would be payable if the securities were disposed of on the valuation date.
The Fund may recognize an income tax liability related to its uncertain tax positions under U.S. GAAP when the uncertain tax position has a less than 50% probability that it will be sustained upon examination by the tax authorities based on its technical merits. As of December 31, 2017, the Fund has determined that no tax liability is required in its financial statements related to uncertain tax positions for any open tax years (or expected to be taken in future tax years). Open tax years are those that remain subject to examination and are based on the statute of limitations in each jurisdiction in which the Fund invests.
k. Security Transactions, Investment Income, Expenses and Distributions
Security transactions are accounted for on trade date. Realized gains and losses on security transactions are determined on a specific identification basis. Interest income and estimated expenses are accrued daily. Amortization of premium and accretion of discount on debt securities are included in interest income. Paydown gains and losses are recorded as an adjustment to interest income. Facility fees are recognized as income over the expected term of the loan. Dividend income is recorded on the ex-dividend date except for certain dividends from securities where the dividend rate is not available. In such cases, the dividend is recorded as soon as the information is received by the Fund. Distributions to shareholders are recorded on the ex-dividend date. Distributable earnings are determined according to income tax regulations (tax basis) and may differ from earnings recorded in accordance with U.S. GAAP. These differences may be permanent or temporary. Permanent differences are reclassified among capital accounts to reflect their tax character. These reclassifications have no impact on net assets or the results of operations. Temporary differences are not reclassified, as they may reverse in subsequent periods.
FRANKLIN TEMPLETON VARIABLE INSURANCE PRODUCTS TRUST
NOTES TO CONSOLIDATED FINANCIAL STATEMENTS
Franklin Strategic Income VIP Fund (continued)
1. Organization and Significant Accounting Policies (continued)
k. Security Transactions, Investment Income, Expenses and Distributions (continued)
Common expenses incurred by the Trust are allocated among the Funds based on the ratio of net assets of each Fund to the combined net assets of the Trust. Fund specific expenses are charged directly to the Fund that incurred the expense.
Realized and unrealized gains and losses and net investment income, excluding class specific expenses, are allocated daily to each class of shares based upon the relative proportion of net assets of each class. Differences in per share distributions by class are generally due to differences in class specific expenses.
Inflation-indexed bonds are adjusted for inflation through periodic increases or decreases in the security’s interest accruals, face amount, or principal redemption value, by amounts corresponding to the rate of inflation as measured by an index. Any increase or decrease in the face amount or principal redemption value will be included as interest income in the Consolidated Statement of Operations.
l. Accounting Estimates
The preparation of financial statements in accordance with U.S. GAAP requires management to make estimates and assumptions that affect the reported amounts of assets and liabilities at the date of the financial statements and the amounts of income and expenses during the reporting period. Actual results could differ from those estimates.
m. Guarantees and Indemnifications
Under the Trust’s organizational documents, its officers and trustees are indemnified by the Trust against certain liabilities arising out of the performance of their duties to the Trust. Additionally, in the normal course of business, the Trust, on behalf of the Fund, enters into contracts with service providers that contain general indemnification clauses. The Trust’s maximum exposure under these arrangements is unknown as this would involve future claims that may be made against the Trust that have not yet occurred. Currently, the Trust expects the risk of loss to be remote.
2. Shares of Beneficial Interest
At December 31, 2017, there were an unlimited number of shares authorized (without par value). Transactions in the Fund’s shares were as follows:
| | | | | | | | | | | | | | | | | | | | |
| | | Year Ended December 31, | |
| | | 2017 | | | | | | 2016 | |
| | | Shares | | | Amount | | | | | | Shares | | | Amount | |
| | | | | |
| Class 1 Shares: | | | | | | | | | | | | | | | | | | | | |
Shares sold | | | 707,945 | | | $ | 8,170,021 | | | | | | | | 468,712 | | | $ | 5,060,377 | |
Shares issued in reinvestment of distributions | | | 1,057,912 | | | | 11,689,930 | | | | | | | | 1,427,226 | | | | 15,028,686 | |
Shares redeemed | | | (5,334,630 | ) | | | (59,544,457 | ) | | | | | | | (7,769,695 | ) | | | (83,437,901 | ) |
| | | | |
Net increase (decrease) | | | (3,568,773 | ) | | $ | (39,684,506 | ) | | | | | | | (5,873,757 | ) | | $ | (63,348,838 | ) |
| | | | |
| | | | | |
| Class 2 Shares: | | | | | | | | | | | | | | | | | | | | |
Shares sold | | | 3,399,404 | | | $ | 36,838,010 | | | | | | | | 2,848,537 | | | $ | 29,648,040 | |
Shares issued in reinvestment of distributions | | | 583,205 | | | | 6,228,631 | | | | | | | | 679,894 | | | | 6,934,919 | |
Shares redeemed | | | (3,193,383 | ) | | | (34,437,952 | ) | | | | | | | (4,217,745 | ) | | | (43,718,382 | ) |
| | | | |
Net increase (decrease) | | | 789,226 | | | $ | 8,628,689 | | | | | | | | (689,314 | ) | | $ | (7,135,423 | ) |
| | | | |
| | | | | |
| Class 4 Shares: | | | | | | | | | | | | | | | | | | | | |
Shares sold | | | 426,432 | | | $ | 4,757,499 | | | | | | | | 197,446 | | | $ | 2,112,111 | |
Shares issued in reinvestment of distributions | | | 189,278 | | | | 2,076,378 | | | | | | | | 267,029 | | | | 2,790,452 | |
Shares redeemed | | | (1,268,068 | ) | | | (14,025,922 | ) | | | | | | | (2,012,761 | ) | | | (21,414,803 | ) |
| | | | |
Net increase (decrease) | | | (652,358 | ) | | $ | (7,192,045 | ) | | | | | | | (1,548,286 | ) | | $ | (16,512,240 | ) |
| | | | |
FRANKLIN TEMPLETON VARIABLE INSURANCE PRODUCTS TRUST
NOTES TO CONSOLIDATED FINANCIAL STATEMENTS
Franklin Strategic Income VIP Fund (continued)
3. Transactions with Affiliates
Franklin Resources, Inc. is the holding company for various subsidiaries that together are referred to as Franklin Templeton Investments. Certain officers and trustees of the Fund are also officers and/or directors of the following subsidiaries:
| | |
| Subsidiary | | Affiliation |
Franklin Advisers, Inc. (Advisers) | | Investment manager |
Franklin Templeton Services, LLC (FT Services) | | Administrative manager |
Franklin Templeton Distributors, Inc. (Distributors) | | Principal underwriter |
Franklin Templeton Investor Services, LLC (Investor Services) | | Transfer agent |
a. Management Fees
The Fund pays an investment management fee to Advisers based on the average daily net assets of the Fund as follows:
| | |
| Annualized Fee Rate | | Net Assets |
0.625% | | Up to and including $500 million |
0.525% | | Over $500 million, up to and including $1 billion |
0.480% | | Over $1 billion, up to and including $1.5 billion |
0.435% | | Over $1.5 billion, up to and including $6.5 billion |
0.415% | | Over $6.5 billion, up to and including $11.5 billion |
0.400% | | Over $11.5 billion, up to and including $16.5 billion |
0.390% | | Over $16.5 billion, up to and including $19 billion |
0.380% | | Over $19 billion, up to and including $21.5 billion |
0.370% | | In excess of $21.5 billion |
For the year ended December 31, 2017, the gross effective investment management fee rate was 0.600% of the Fund’s average daily net assets.
b. Administrative Fees
Under an agreement with Advisers, FT Services provides administrative services to the Fund. The fee is paid by Advisers based on the Fund’s average daily net assets, and is not an additional expense of the Fund.
c. Distribution Fees
The Board has adopted distribution plans for Class 2 and Class 4 shares pursuant to Rule 12b-1 under the 1940 Act. Under the Fund’s compensation distribution plans, the Fund pays Distributors for costs incurred in connection with the servicing, sale and distribution of the Fund’s shares up to 0.25% and 0.35% per year of its average daily net assets of Class 2 and Class 4, respectively. The plan year, for purposes of monitoring compliance with the maximum annual plan rates, is February 1 through January 31.
d. Transfer Agent Fees
Investor Services, under terms of an agreement, performs shareholder servicing for the Fund and is not paid by the Fund for the services.
FRANKLIN TEMPLETON VARIABLE INSURANCE PRODUCTS TRUST
NOTES TO CONSOLIDATED FINANCIAL STATEMENTS
Franklin Strategic Income VIP Fund (continued)
3. Transactions with Affiliates (continued)
e. Investments in Affiliated Management Investment Companies
The Fund invests in one or more affiliated management investment companies for purposes other than exercising a controlling influence over the management or policies. Management fees paid by the Fund are waived on assets invested in the affiliated management investment companies, as noted in the Consolidated Statement of Operations, in an amount not to exceed the management and administrative fees paid directly or indirectly by each affiliate. Prior to January 1, 2014, the waiver was accounted for as a reduction to management fees. During the year ended December 31, 2017, the Fund held investments in affiliated management investment companies as follows:
| | | | | | | | | | | | | | | | | | | | | | | | | | | | | | | | |
| | | Number of Shares Held at Beginning of Year | | | Gross Additions | | | Gross Reductions | | | Number
of Shares Held at
End of Year | | | Value at
End of Year | | | Dividend
Income | | | Realized
Gain (Loss) | | | Net Change in
Unrealized
Appreciation
(Depreciation) | |
| Non-Controlled Affiliates | | | | | | | | | | | | | | | | | | | | | | | | | | | | | | | | |
Franklin Lower Tier Floating Rate Fund | | | 2,590,404 | | | | — | | | | (508,543 | ) | | | 2,081,861 | | | $ | 20,818,608 | | | $ | 1,964,296 | | | $ | 310,211 | | | $ | (1,325,237 | ) |
Franklin Middle Tier Floating Rate Fund | | | 2,175,846 | | | | — | | | | (150,895 | ) | | | 2,024,951 | | | | 19,500,282 | | | | 1,398,982 | | | | 22,634 | | | | (1,067,431 | ) |
Institutional Fiduciary Trust Money Market Portfolio, 0.89% | | | 27,288,407 | | | | 138,211,703 | | | | (155,481,431 | ) | | | 10,018,679 | | | | 10,018,679 | | | | 109,603 | | | | — | | | | — | |
| | | | | | | | | | | | | | | | | | | | |
Total Affiliated Securities | | | | | | | | | | | | | | | | | | $ | 50,337,569 | | | $ | 3,472,881 | | | $ | 332,845 | | | $ | (2,392,668 | ) |
| | | | | | | | | | | | | | | | | | | | |
4. Expense Offset Arrangement
The Fund has entered into an arrangement with its custodian whereby credits realized as a result of uninvested cash balances are used to reduce a portion of the Fund’s custodian expenses. During the year ended December 31, 2017, the custodian fees were reduced as noted in the Consolidated Statement of Operations.
5. Income Taxes
For tax purposes, capital losses may be carried over to offset future capital gains, if any. At December 31, 2017, the capital loss carryforwards were as follows:
| | | | |
Capital loss carryforwards: | | | | |
Short term | | $ | 1,255,880 | |
Long term | | | 31,844,879 | |
| | | | |
Total capital loss carryforwards | | $ | 33,100,759 | |
| | | | |
The tax character of distributions paid during the years ended December 31, 2017 and 2016, was as follows:
| | | | | | | | |
| | | 2017 | | | 2016 | |
| |
Distributions paid from ordinary income | | $ | 19,994,939 | | | $ | 24,754,057 | |
| | | | |
FRANKLIN TEMPLETON VARIABLE INSURANCE PRODUCTS TRUST
NOTES TO CONSOLIDATED FINANCIAL STATEMENTS
Franklin Strategic Income VIP Fund (continued)
At December 31, 2017, the cost of investments, net unrealized appreciation (depreciation) and undistributed ordinary income for income tax purposes were as follows:
| | | | |
Cost of investments | | $ | 685,857,622 | |
| | | | |
Unrealized appreciation | | $ | 15,253,085 | |
Unrealized depreciation | | | (22,781,114 | ) |
| | | | |
Net unrealized appreciation (depreciation) | | $ | (7,528,029 | ) |
| | | | |
Distributable earnings - undistributed ordinary income | | $ | 16,612,235 | |
| | | | |
Differences between income and/or capital gains as determined on a book basis and a tax basis are primarily due to differing treatments of foreign currency transactions and bond discounts and premiums.
6. Investment Transactions
Purchases and sales of investments (excluding short term securities) for the year ended December 31, 2017, aggregated $735,630,931 and $734,982,357, respectively.
7. Credit Risk and Defaulted Securities
At December 31, 2017, the Fund had 49.8% of its portfolio invested in high yield, senior secured floating rate notes, or other securities rated below investment grade and unrated securities, if any. These securities may be more sensitive to economic conditions causing greater price volatility and are potentially subject to a greater risk of loss due to default than higher rated securities.
The Fund held defaulted securities and/or other securities for which the income has been deemed uncollectible. At December 31, 2017, the aggregate value of these securities was $1,206,877, representing 0.2% of the Fund’s net assets. The Fund discontinues accruing income on securities for which income has been deemed uncollectible and provides an estimate for losses on interest receivable. The securities have been identified in the accompanying Consolidated Statement of Investments.
8. Restricted Securities
The Fund invests in securities that are restricted under the Securities Act of 1933 (1933 Act). Restricted securities are often purchased in private placement transactions, and cannot be sold without prior registration unless the sale is pursuant to an exemption under the 1933 Act. Disposal of these securities may require greater effort and expense, and prompt sale at an acceptable price may be difficult. The Fund may have registration rights for restricted securities. The issuer generally incurs all registration costs.
At December 31, 2017, investments in restricted securities, excluding securities exempt from registration under the 1933 Act deemed to be liquid, were as follows:
| | | | | | | | | | | | | | |
Principal
Amount/
Shares | | Issuer | | Acquisition Date | | | Cost | | | Value | |
| 14,792,309 | | Holdco 2, A | | | 2/08/13 - 2/01/17 | | | $ | 114,768 | | | $ | 11,956 | |
| 1,472,041 | | Holdco 2, B | | | 2/01/17 | | | | 1,093 | | | | 1,190 | |
| 1,121,170 | | K2016470219 South Africa Ltd., senior secured note, 144A, PIK, 3.00%, 12/31/22 | | | 2/08/13 - 12/29/17 | | | | 2,011,105 | | | | 16,817 | |
| 195,633 | | K2016470260 South Africa Ltd., senior secured note, 144A, PIK, 25.00%, 12/31/22 | | | 2/01/17 - 12/29/17 | | | | 189,841 | | | | 150,637 | |
| | | | | | | | | | |
| | Total Restricted Securities (Value is 0.0%† of Net Assets) | | | | | | $ | 2,316,807 | | | $ | 180,600 | |
| | | | | | | | | | |
FRANKLIN TEMPLETON VARIABLE INSURANCE PRODUCTS TRUST
NOTES TO CONSOLIDATED FINANCIAL STATEMENTS
Franklin Strategic Income VIP Fund (continued)
8. Restricted Securities (continued)
†Rounds to less than 0.1% of net assets.
9. Other Derivative Information
At December 31, 2017, the Fund’s investments in derivative contracts are reflected in the Consolidated Statement of Assets and Liabilities as follows:
| | | | | | | | | | | | |
| | | Asset Derivatives | | | Liability Derivatives | |
Derivative Contracts Not Accounted for as Hedging Instruments | | Consolidated Statement of
Assets and Liabilities
Location | | Fair Value | | | Consolidated Statement of
Assets and Liabilities
Location | | Fair Value | |
Interest rate contracts | | Variation margin on futures contracts | | $ | 65,154 | a | | Variation margin on futures contracts | | $ | 37,457 | a |
Foreign exchange contracts | | Unrealized appreciation on OTC forward exchange contracts | | | 638,109 | | | Unrealized depreciation on OTC forward exchange contracts | | | 756,122 | |
Credit contracts | | OTC swap contracts (upfront payments) | | | 746,440 | | | OTC swap contracts (upfront receipts) | | | 1,193,460 | |
| | Unrealized appreciation on OTC swap contracts | | | 316,704 | | | Unrealized depreciation on OTC swap contracts | | | 259,308 | |
Value recovery instruments | | Investments in securities, at value | | | 1,087,752 | b | | | | | | |
| | | | | | | | | | | | |
Totals | | | | $ | 2,854,159 | | | | | $ | 2,246,347 | |
| | | | | | | | | | | | |
aThis amount reflects the cumulative appreciation (depreciation) of futures contracts as reported in the Consolidated Statement of Investments. Only the variation margin receivable/payable at year end is separately reported within the Consolidated Statement of Assets and Liabilities. Prior variation margin movements were recorded to cash upon receipt or payment. bVRI are included in investments in securities, at value in the Consolidated Statement of Assets and Liabilities.
For the year ended December 31, 2017, the effect of derivative contracts in the Fund’s Consolidated Statement of Operations was as follows:
| | | | | | | | | | | | |
Derivative Contracts Not Accounted for
as Hedging Instruments | | Consolidated Statement of
Operations Location | | Net Realized
Gain (Loss) for the Year | | | Consolidated Statement of
Operations Location | | Net Change in
Unrealized
Appreciation
(Depreciation)
for the Year | |
| | Net realized gain (loss) from: | | | | | | Net change in unrealized appreciation (depreciation) on: | | | | |
Interest rate contracts | | Futures contracts | | $ | 580,022 | | | Futures contracts | | $ | (57,772 | ) |
Foreign exchange contracts | | Forward exchange contracts | | | (477,456 | ) | | Forward exchange contracts | | | (3,664,917 | ) |
Credit contracts | | Swap contracts | | | 672,542 | | | Swap contracts | | | 94,508 | |
Value recovery instruments | | Investments | | | — | | | Investments | | | 492,392 | a |
| | | | | | | | | | | | |
Totals | | | | $ | 775,108 | | | | | $ | (3,135,789 | ) |
| | | | | | | | | | | | |
aVRI are included in net change in unrealized appreciation (depreciation) on investments in the Consolidated Statement of Operations.
For the year ended December 31, 2017, the average month end notional amount of futures contracts and swap contracts and the average month end contract value for forward exchange contracts, and average month end fair value of VRI, were as follows:
| | | | |
Futures Contracts | | $ | 16,921,047 | |
Swap contracts | | | 23,104,138 | |
Forward exchange contracts | | | 84,626,660 | |
VRI | | | 849,105 | |
FRANKLIN TEMPLETON VARIABLE INSURANCE PRODUCTS TRUST
NOTES TO CONSOLIDATED FINANCIAL STATEMENTS
Franklin Strategic Income VIP Fund (continued)
| | | | | | | | |
| | | Gross Amounts
of Assets and Liabilities
Presented in the
Consolidated Statement of Assets and
Liabilities | |
| | | | Assets | a | | | Liabilities | a |
| Derivatives | | | | | | | | |
Forward exchange contracts | | $ | 638,109 | | | $ | 756,122 | |
Swap contracts | | | 1,063,144 | | | | 1,452,768 | |
| | | | |
Total | | $ | 1,701,253 | | | $ | 2,208,890 | |
| | | | |
aAbsent an event of default or early termination, OTC derivative assets and liabilities are presented gross and not offset in the Consolidated Statement of Assets and Liabilities.
At December 31, 2017, the Fund’s OTC derivative assets, which may be offset against the Fund’s OTC derivative liabilities and collateral received from the counterparty, are as follows:
| | | | | | | | | | | | | | | | | | | | |
| | | | | | Amounts Not Offset in the
Consolidated Statement of Assets and Liabilities | | | | |
| | |
| Gross
Amounts of Assets Presented in the Consolidated Statement of
Assets and Liabilities |
| |
| Financial
Instruments
Available for Offset |
| |
| Financial
Instruments
Collateral
Received |
| |
| Cash
Collateral
Receiveda |
| |
| Net Amount (Not
less than zero) |
|
| Counterparty | | | | | | | | | | | | | | | | | | | | |
BZWS | | $ | 6,481 | | | $ | (6,481 | ) | | $ | — | | | $ | — | | | $ | — | |
CITI | | | 982,402 | | | | (982,402 | ) | | | — | | | | — | | | | — | |
DBAB | | | 189,567 | | | | (78,468 | ) | | | — | | | | (111,099 | ) | | | — | |
FBCO | | | 14,075 | | | | (8,671 | ) | | | — | | | | — | | | | 5,404 | |
GSCO | | | — | | | | — | | | | — | | | | — | | | | — | |
HSBK | | | 66,690 | | | | (3,026 | ) | | | — | | | | — | | | | 63,664 | |
JPHQ | | | 442,038 | | | | (442,038 | ) | | | — | | | | — | | | | — | |
| | | | |
Total | | $ | 1,701,253 | | | $ | (1,521,086 | ) | | $ | — | | | $ | (111,099 | ) | | $ | 69,068 | |
| | | | |
At December 31, 2017, the Fund’s OTC derivative liabilities, which may be offset against the Fund’s OTC derivative assets and collateral pledged to the counterparty, are as follows:
| | | | | | | | | | | | | | | | | | | | |
| | | | | | Amounts Not Offset in the
Consolidated Statement of Assets and Liabilities | | | | |
| | | Gross Amounts of Liabilities Presented in the Consolidated Statement of
Assets and Liabilities | | | Financial
Instruments
Available for Offset | | | Financial
Instruments
Collateral
Pledged | | | Cash Collateral
Pledged | | | Net Amount (Not
less than zero) | |
| Counterparty | | | | | | | | | | | | | | | | | | | | |
BZWS | | $ | 103,353 | | | $ | (6,481 | ) | | $ | — | | | $ | — | | | $ | 96,872 | |
CITI | | | 1,159,668 | | | | (982,402 | ) | | | — | | | | (10,000 | ) | | | 167,266 | |
DBAB | | | 78,468 | | | | (78,468 | ) | | | — | | | | — | | | | — | |
FBCO | | | 8,671 | | | | (8,671 | ) | | | — | | | | — | | | | — | |
GSCO | | | 7,905 | | | | — | | | | — | | | | — | | | | 7,905 | |
HSBK | | | 3,026 | | | | (3,026 | ) | | | — | | | | — | | | | — | |
JPHQ | | | 847,799 | | | | (442,038 | ) | | | — | | | | (380,000 | ) | | | 25,761 | |
| | | | |
Total | | $ | 2,208,890 | | | $ | (1,521,086 | ) | | $ | — | | | $ | (390,000 | ) | | $ | 297,804 | |
| | | | |
aIn some instances, the collateral amounts disclosed in the table above were adjusted due to the requirement to limit collateral amounts to avoid the effect of overcollateralization. Actual collateral received and/or pledged may be more than the amounts disclosed herein.
See Note 1(d) regarding derivative financial instruments.
FRANKLIN TEMPLETON VARIABLE INSURANCE PRODUCTS TRUST
NOTES TO CONSOLIDATED FINANCIAL STATEMENTS
Franklin Strategic Income VIP Fund (continued)
9. Other Derivative Information (continued)
See Abbreviations on page FSI-53.
10. Credit Facility
The Fund, together with other U.S. registered and foreign investment funds (collectively, Borrowers), managed by Franklin Templeton Investments, are borrowers in a joint syndicated senior unsecured credit facility totaling $2 billion (Global Credit Facility) which matured on February 9, 2018. This Global Credit Facility provides a source of funds to the Borrowers for temporary and emergency purposes, including the ability to meet future unanticipated or unusually large redemption requests. Effective February 9, 2018, the Borrowers renewed the Global Credit Facility for a one year term, maturing February 8, 2019, for a total of $2 billion.
Under the terms of the Global Credit Facility, the Fund shall, in addition to interest charged on any borrowings made by the Fund and other costs incurred by the Fund, pay its share of fees and expenses incurred in connection with the implementation and maintenance of the Global Credit Facility, based upon its relative share of the aggregate net assets of all of the Borrowers, including an annual commitment fee of 0.15% based upon the unused portion of the Global Credit Facility. These fees are reflected in other expenses in the Consolidated Statement of Operations. During the year ended December 31, 2017, the Fund did not use the Global Credit Facility.
11. Fair Value Measurements
The Fund follows a fair value hierarchy that distinguishes between market data obtained from independent sources (observable inputs) and the Fund’s own market assumptions (unobservable inputs). These inputs are used in determining the value of the Fund’s financial instruments and are summarized in the following fair value hierarchy:
| | • | | Level 1 – quoted prices in active markets for identical financial instruments |
| | • | | Level 2 – other significant observable inputs (including quoted prices for similar financial instruments, interest rates, prepayment speed, credit risk, etc.) |
| | • | | Level 3 – significant unobservable inputs (including the Fund’s own assumptions in determining the fair value of financial instruments) |
The input levels are not necessarily an indication of the risk or liquidity associated with financial instruments at that level.
For movements between the levels within the fair value hierarchy, the Fund has adopted a policy of recognizing the transfers as of the date of the underlying event which caused the movement.
FRANKLIN TEMPLETON VARIABLE INSURANCE PRODUCTS TRUST
NOTES TO CONSOLIDATED FINANCIAL STATEMENTS
Franklin Strategic Income VIP Fund (continued)
A summary of inputs used as of December 31, 2017, in valuing the Fund’s assets and liabilities carried at fair value, is as follows:
| | | | | | | | | | | | | | | | |
| | | Level 1 | | | Level 2 | | | Level 3 | | | Total | |
| Assets: | | | | | | | | | | | | | | | | |
Investments in Securities:a | | | | | | | | | | | | | | | | |
Equity Investments:b | | | | | | | | | | | | | | | | |
Consumer Services | | $ | — | | | $ | — | | | $ | 343,872 | | | $ | 343,872 | |
Energy | | | 2,150,909 | | | | — | | | | 153,908 | | | | 2,304,817 | |
Retailing | | | — | | | | — | | | | 13,146 | | | | 13,146 | |
Transportation | | | — | | | | 323,066 | | | | — | | | | 323,066 | |
All Other Equity Investments | | | 40,526,074 | | | | — | | | | — | | | | 40,526,074 | |
Convertible Bonds | | | — | | | | 1,129,818 | | | | — | | | | 1,129,818 | |
Corporate Bonds: | | | | | | | | | | | | | | | | |
Energy | | | — | | | | 30,212,518 | | | | 4,440 | | | | 30,216,958 | |
All Other Corporate Bonds | | | — | | | | 287,025,435 | | | | — | | | | 287,025,435 | |
Senior Floating Rate Interests | | | — | | | | 68,195,679 | | | | — | | | | 68,195,679 | |
Foreign Government and Agency Securities | | | — | | | | 47,735,274 | | | | — | | | | 47,735,274 | |
U.S. Government and Agency Securities | | | — | | | | 44,472,388 | | | | — | | | | 44,472,388 | |
Asset-Backed Securities and Commercial | | | | | | | | | | | | | | | | |
Mortgage-Backed Securities | | | — | | | | 75,847,626 | | | | — | | | | 75,847,626 | |
Mortgage-Backed Securities | | | — | | | | 64,293,388 | | | | — | | | | 64,293,388 | |
Municipal Bonds | | | — | | | | 5,948,052 | | | | — | | | | 5,948,052 | |
Escrows and Litigation Trusts | | | — | | | | 5,625 | | | | 34,800 | c | | | 40,425 | |
Short Term Investments | | | 10,367,041 | | | | — | | | | — | | | | 10,367,041 | |
| | | | |
Total Investments in Securities | | $ | 53,044,024 | | | $ | 625,188,869 | | | $ | 550,166 | | | $ | 678,783,059 | |
| | | | |
Other Financial Instruments: | | | | | | | | | | | | | | | | |
Futures Contracts | | $ | 65,154 | | | $ | — | | | $ | — | | | $ | 65,154 | |
Forward Exchange Contracts | | | — | | | | 638,109 | | | | — | | | | 638,109 | |
Swap Contracts. | | | — | | | | 316,704 | | | | — | | | | 316,704 | |
| | | | |
Total Other Financial Instruments | | $ | 65,154 | | | $ | 954,813 | | | $ | — | | | $ | 1,019,967 | |
| | | | |
| Liabilities: | | | | | | | | | | | | | | | | |
Other Financial Instruments: | | | | | | | | | | | | | | | | |
Futures Contracts | | $ | 37,457 | | | $ | — | | | $ | — | | | $ | 37,457 | |
Forward Exchange Contracts | | | — | | | | 756,122 | | | | — | | | | 756,122 | |
Swap Contracts. | | | — | | | | 259,308 | | | | — | | | | 259,308 | |
| | | | |
Total Other Financial Instruments | | $ | 37,457 | | | $ | 1,015,430 | | | $ | — | | | $ | 1,052,887 | |
| | | | |
aFor detailed categories, see the accompanying Consolidated Statement of Investments.
bIncludes common and convertible preferred stocks and management investment companies as well as other equity interests.
cIncludes securities determined to have no value at December 31, 2017.
FRANKLIN TEMPLETON VARIABLE INSURANCE PRODUCTS TRUST
NOTES TO FINANCIAL STATEMENTS
Franklin Strategic Income VIP Fund (continued)
11. Fair Value Measurements (continued)
A reconciliation of assets in which Level 3 inputs are used in determining fair value is presented when there are significant Level 3 financial instruments at the beginning and/or end of the year. At December 31, 2017, the reconciliation of assets is as follows:
| | | | | | | | | | | | | | | | | | | | | | | | | | | | | | | | | | | | |
| | |
| Balance at
Beginning of
Year |
| |
| Purchases
(Sales) |
| |
| Transfer
Into Level 3a |
| |
| Transfer
Out of Level 3b |
| |
| Cost Basis
Adjustmentsc |
| |
| Net
Realized Gain (Loss) |
| |
| Net
Unrealized Appreciation (Depreciation) |
| |
| Balance at
End of Year |
| |
| Net Change in
Unrealized Appreciation (Depreciation) on Assets Held at Year End |
|
| Assets: | | | | | | | | | | | | | | | | | | | | | | | | | | | | | | | | | | | | |
Investments in Securities: | | | | | | | | | | | | | | | | | | | | | | | | | | | | | | | | | | | | |
Equity Investments:d | | | | | | | | | | | | | | | | | | | | | | | | | | | | | | | | | | | | |
Consumer Services | | $ | 8,913,040 | | | $ | — | | | $ | — | | | $ | — | | | $ | — | | | $ | 5,716,652 | e | | $ | (8,569,168 | )e | | $ | 343,872 | | | $ | (8,569,168 | )e |
Energy | | | 1,305,543 | f | | | — | | | | 153,873 | | | | (1,051,255 | ) | | | — | | | | — | | | | (254,253 | ) | | | 153,908 | | | | (94,011 | ) |
Retailing | | | — | | | | — | | | | 12,097 | | | | — | | | | — | | | | — | | | | 1,049 | | | | 13,146 | | | | 1,049 | |
Corporate Bonds | | | — | | | | — | | | | 4,440 | | | | — | | | | — | | | | — | | | | — | | | | 4,440 | | | | — | |
Escrows and Litigation Trusts | | | 72,300 | f | | | — | | | | — | | | | (37,500 | ) | | | (4,481 | ) | | | 4,481 | | | | — | | | | 34,800 | f | | | — | |
| | | | |
Total Investments in Securities | | $ | 10,290,883 | | | $ | — | | | $ | 170,410 | | | $ | (1,088,755 | ) | | $ | (4,481 | ) | | $ | 5,721,133 | | | $ | (8,822,372 | ) | | $ | 550,166 | | | $ | (8,662,130 | ) |
| | | | |
aThe investments were transferred into Level 3 as a result of the unavailability of other significant observable valuation inputs. May include amounts related to a corporate action.
bThe investments were transferred out of Level 3 as a result of the availability of other significant observable valuation inputs. May include amounts related to a corporate action.
cMay include accretion, amortization, partnership adjustments, and/or other cost basis adjustments.
dIncludes common as well as other equity investments.
eSee Note 1(g).
fIncludes securities determined to have no value.
12. New Accounting Pronouncements
In March 2017, the Financial Accounting Standards Board (FASB) issued Accounting Standards Update (ASU) No. 2017-08, Receivables—Nonrefundable Fees and Other Costs (Subtopic 310-20): Premium Amortization on Purchased Callable Debt Securities. The amendments in the ASU shorten the amortization period for certain callable debt securities acquired at a premium, to be amortized to the earliest call date. The ASU does not require an accounting change for securities acquired at a discount, which continues to be amortized to maturity. The ASU is effective for fiscal years and interim periods within those fiscal years beginning after December 15, 2018. Management has reviewed the requirements and believes the adoption of this ASU will not have a material impact on the financial statements.
13. Subsequent Events
The Fund has evaluated subsequent events through the issuance of the consolidated financial statements and determined that no events have occurred that require disclosure other than those already disclosed in the consolidated financial statements.
FRANKLIN TEMPLETON VARIABLE INSURANCE PRODUCTS TRUST
NOTES TO CONSOLIDATED FINANCIAL STATEMENTS
Franklin Strategic Income VIP Fund (continued)
Abbreviations
| | | | | | | | | | |
| Counterparty | | Currency | | Selected Portfolio |
| | | | | |
| BZWS | | Barclays Bank PLC | | BRL | | Brazilian Real | | ARM | | Adjustable Rate Mortgage |
| | | | | |
| CITI | | Citigroup, Inc. | | EUR | | Euro | | CLO | | Collateralized Loan Obligation |
| | | | | |
| DBAB | | Deutsche Bank AG | | GBP | | British Pound | | CMT | | 1 year Constant Maturity Treasury Index |
| | | | | |
| FBCO | | Credit Suisse International | | IDR | | Indonesian Rupiah | | FRN | | Floating Rate Note |
| | | | | |
| GSCO | | The Goldman Sachs Group, Inc. | | MXN | | Mexican Peso | | GDP | | Gross Domestic Product |
| | | | | |
| HSBK | | HSBC Bank PLC | | MYR | | Malaysian Ringgit | | GO | | General Obligation |
| | | | | |
| JPHQ | | JP Morgan Chase & Co. | | SEK | | Swedish krona | | HDC | | Housing Development Corp. |
| | | | | |
| | | | USD | | United States Dollar | | LIBOR | | London InterBank Offered Rate |
| | | | | |
| | | | | | | | MBS | | Mortgage-Backed Security |
| | | | | |
| | | | | | | | PIK | | Payment-In-Kind |
| | | | | |
| | | | | | | | PRIME | | United States Prime Rate |
| | | | | |
| | | | | | | | RDA | | Redevelopment Agency/Authority |
| | | | | |
| | | | | | | | SF | | Single Family |
| | | | | |
| | | | | | | | T-Note | | Treasury Note |
| | | | | |
| | | | | | | | VRI | | Value Recovery Instrument |
| | |
Index Abbreviation | | |
| MCDX.NA.29 MCDX North America Index | | |
FRANKLIN TEMPLETON VARIABLE INSURANCE PRODUCTS TRUST
Report of Independent Registered Public Accounting Firm
To the Board of Trustees of Franklin Templeton Variable Insurance Products Trust and Shareholders of Franklin Strategic Income VIP Fund
Opinion on the Financial Statements
We have audited the accompanying consolidated statement of assets and liabilities, including the consolidated statement of investments, of Franklin Strategic Income VIP Fund and its subsidiary (the “Fund”) as of December 31, 2017, the related consolidated statement of operations for the year ended December 31, 2017, the consolidated statement of changes in net assets for each of the two years in the period ended December 31, 2017, including the related notes, and the consolidated financial highlights for each of the five years in the period ended December 31, 2017 (collectively referred to as the “consolidated financial statements”). In our opinion, the consolidated financial statements present fairly, in all material respects, the financial position of the Fund as of December 31, 2017, the results of their operations for the year then ended, the changes in their net assets for each of the two years in the period ended December 31, 2017 and the consolidated financial highlights for each of the five years in the period ended December 31, 2017, in conformity with accounting principles generally accepted in the United States of America.
Basis for Opinion
These consolidated financial statements are the responsibility of the Fund’s management. Our responsibility is to express an opinion on the Fund’s consolidated financial statements based on our audits. We are a public accounting firm registered with the Public Company Accounting Oversight Board (United States) (“PCAOB”) and are required to be independent with respect to the Fund in accordance with the U.S. federal securities laws and the applicable rules and regulations of the Securities and Exchange Commission and the PCAOB.
We conducted our audits of these consolidated financial statements in accordance with the standards of the PCAOB. Those standards require that we plan and perform the audit to obtain reasonable assurance about whether the consolidated financial statements are free of material misstatement, whether due to error or fraud.
Our audits included performing procedures to assess the risks of material misstatement of the consolidated financial statements, whether due to error or fraud, and performing procedures that respond to those risks. Such procedures included examining, on a test basis, evidence regarding the amounts and disclosures in the consolidated financial statements. Our audits also included evaluating the accounting principles used and significant estimates made by management, as well as evaluating the overall presentation of the consolidated financial statements. Our procedures included confirmation of securities owned as of December 31, 2017 by correspondence with the custodian, transfer agent, and brokers; when replies were not received from brokers, we performed other auditing procedures. We believe that our audits provide a reasonable basis for our opinion.
PricewaterhouseCoopers LLP
San Francisco, California
February 15, 2018
We have served as the auditor of one or more investment companies in the Franklin Templeton Group of Funds since 1948.
Franklin U.S. Government Securities VIP Fund
This annual report for Franklin U.S. Government Securities VIP Fund covers the fiscal year ended December 31, 2017.
Class 2 Performance Summary as of December 31, 2017
Average annual total return of Class 2 shares represents the average annual change in value, assuming reinvestment of dividends and capital gains. Average returns smooth out variations in returns, which can be significant; they are not the same as year-by-year results.
| | | | | | | | | | | | |
| Periods ended 12/31/17 | | 1-Year | | | 5-Year | | | 10-Year | |
Average Annual Total Return | | | +1.34% | | | | +0.71% | | | | +2.68% | |
Performance reflects the Fund’s Class 2 operating expenses, but does not include any contract fees, expenses or sales charges. If they had been included, performance would be lower. These charges and deductions, particularly for variable life policies, can have a significant effect on contract values and insurance benefits. See the contract prospectus for a complete description of these expenses, including sales charges.
Performance data represent past performance, which does not guarantee future results. Investment return and principal value will fluctuate, and you may have a gain or loss when you sell your shares. Current performance may differ from figures shown.
Total Return Index Comparison for a Hypothetical $10,000 Investment (1/1/08–12/31/17)
The graph below shows the change in value of a hypothetical $10,000 investment in the Fund over the indicated period and includes reinvestment of any income or distributions. The Fund’s performance is compared to the performance of the Bloomberg Barclays U.S. Government Index: Intermediate Component, the Lipper VIP General U.S. Government Funds Classification Average and the Consumer Price Index. One cannot invest directly in an index, and an index is not representative of the Fund’s portfolio. Please see Important Notes to Performance Information preceding the Fund Summaries.
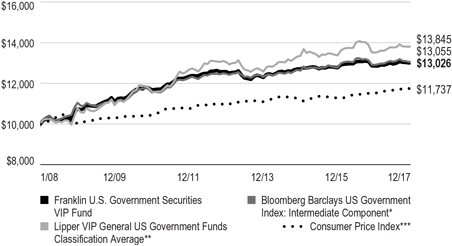
*Source: Morningstar. Please see Index Descriptions following the Fund Summaries.
**Source: Lipper, a Thomson Reuters Company. Please see Index Descriptions following the Fund Summaries.
***Source: Bureau of Labor Statistics, bls.gov/cpi. Please see Index Descriptions following the Fund Summaries.
FRANKLIN U.S. GOVERNMENT SECURITIES VIP FUND
Fund Goal and Main Investments
The Fund seeks income. Under normal market conditions, the Fund invests at least 80% of its net assets in U.S. government securities.
Fund Risks
All investments involve risks, including possible loss of principal. The Fund’s share price and yield will be affected by interest rate movements and mortgage prepayments. Bond prices generally move in the opposite direction of interest rates. Thus, as prices of bonds in the Fund adjust to a rise in interest rates, the Fund’s share price may decline. Changes in the financial strength of a bond issuer or in a bond’s credit rating may affect its value. The Fund is actively managed but there is no guarantee that the manager’s investment decisions will produce the desired results. The Fund’s prospectus also includes a description of the main investment risks.
Performance Overview
You can find the Fund’s one-year total return in the Performance Summary. In comparison, the Fund’s primary benchmark, the Bloomberg Barclays U.S. Government Index: Intermediate Component, produced a +1.14% total return.1 The Fund’s secondary benchmark, the Lipper VIP General U.S. Government Funds Classification Average, posted a +2.49% total return.2 Funds in the Lipper average may allocate as much as 35% of their investments in asset types other than U.S. government and agency mortgage-backed securities.
Economic and Market Overview
The US economy grew during the 12 months under review. After strengthening in 2017’s second and third quarters, the economy moderated in the fourth quarter. The economy grew faster in 2017 than in 2016, however, largely due to growth in consumer spending, business investment and exports. The manufacturing and services sectors expanded during the period. The unemployment rate declined from 4.7% in December 2016 to 4.1% at period-end.3 Monthly retail sales were volatile but positive on average during the period. Annual inflation, as measured by the Consumer Price Index, was 2.1% in December
Portfolio Composition
Based on Total Net Assets as of 12/31/17
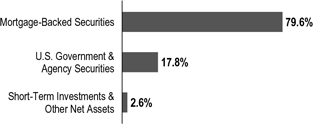
2016, and while it varied over the 12-month period, remained unchanged at period-end.3
The US Federal Reserve (Fed) raised its target range for the federal funds rate 0.25% at its March and June 2017 meetings, amid signs of a growing US economy, strengthening labor market and improving business spending. At its December meeting, the Fed raised its target range for the federal funds rate 0.25% to 1.25%–1.50%, as widely anticipated by the market. The Fed also confirmed that the monthly balance sheet reduction would increase from $10 billion to $20 billion beginning in January 2018.
The 10-year Treasury yield, which moves inversely to its price, shifted throughout the period. The yield rose in June amid renewed optimism for improvement in economic growth and was supported in July by hawkish comments from key central bankers around the world. Easing concerns about Hurricane Irma’s economic impact, the Fed’s balance sheet normalization beginning in October and strong economic data also pushed the yield higher. However, several factors weighed on the Treasury yield at certain points during the period, including tensions between the US and North Korea; uncertainty on whether the Fed would raise rates in December 2017; and the appointment of Jerome Powell, viewed as more dovish than other contenders, as the next Fed chair. Near period-end, the Senate’s approval of a budget plan and the subsequent passage of the tax bill drove the yield higher. Overall, the 10-year Treasury yield declined from 2.45% at the beginning of the period to 2.40% at period-end.
1. Source: Morningstar.
2. Source: Lipper, a Thomson Reuters Company.
One cannot invest directly in an index, and an index is not representative of the Fund’s portfolio. Please see Index Descriptions following the Fund Summaries.
3. Source: Bureau of Labor Statistics.
The dollar value, number of shares or principal amount, and names of all portfolio holdings are listed in the Fund’s Statement of Investments (SOI).
FRANKLIN U.S. GOVERNMENT SECURITIES VIP FUND
Investment Strategy
Using our straightforward investment approach, we seek to produce current income with a high degree of credit safety from a conservatively managed portfolio of U.S. government securities. Analyzing securities using proprietary and nonproprietary research, we seek to identify attractive investment opportunities.
Manager’s Discussion
From a perspective of excess returns over Treasuries of similar duration, emerging markets bonds performed well. Other major fixed income sectors that delivered notable positive excess returns, as measured by Bloomberg Barclays indexes, included high yield and investment grade corporate credit and commercial mortgage-backed securities (CMBS). In contrast, Ginnie Mae (GNMA) underperformed Treasuries. US economic indicators were generally encouraging during the reporting period. Steady growth in the services sector created new jobs and boosted employment levels. Retail sales grew for most of the period. Low energy prices pulled inflation lower. In this environment, home sales which had slowed in the middle of the period due to low supply levels and rising prices, rose to their strongest pace in almost 11 years toward period-end.
The Fund maintains a consistent and disciplined approach to our investment strategy. The Fund’s investment process and strategy have not changed, and the team continues to look for strong cash flow fundamentals and valuations seeking to uncover opportunities across the agency mortgage and agency debenture universe. The Fund emphasizes agency pass-throughs and invests in other agency securities for diversification purposes.
Within the agency mortgage pass-through sector, Freddie Mac MBS and Fannie Mae MBS had positive excess returns, while Ginnie Mae (GNMA) MBS had negative excess returns. All had positive total returns during the period.
During the period, we were more weighted toward GNMA IIs (pools of mortgages from multiple issuers) than GNMA Is (pools of mortgages from single issuers). Over the period, we increased exposure to GNMA II 3.0% and 4.0% coupons, while reducing the exposure to 3.5% coupons. At period-end, our heaviest exposures were in 3.5% and 4.0% coupons. Based on excess returns over Treasuries, coupon performance was mixed. GN I 5.0% securities were among the best performers, while GN I & II 4.0 and 4.5% securities lagged.
The Fund’s US yield curve positioning was a contributor during the period as yield curve movements had a positive
impact relative to the benchmark. Our exposure to fixed-rate mortgage-backed securities also helped results. None of the fixed income sectors detracted from results at period-end.
Thank you for your participation in Franklin U.S. Government Securities VIP Fund. We look forward to serving your future investment needs.
The foregoing information reflects our analysis, opinions and portfolio holdings as of December 31, 2017, the end of the reporting period. The way we implement our main investment strategies and the resulting portfolio holdings may change depending on factors such as market and economic conditions. These opinions may not be relied upon as investment advice or an offer for a particular security. The information is not a complete analysis of every aspect of any market, country, industry, security or the Fund. Statements of fact are from sources considered reliable, but the investment manager makes no representation or warranty as to their completeness or accuracy. Although historical performance is no guarantee of future results, these insights may help you understand our investment
management philosophy.
FRANKLIN U.S. GOVERNMENT SECURITIES VIP FUND
Class 2 Fund Expenses
As an investor in a variable insurance contract (Contract) that indirectly provides for investment in an underlying mutual fund, you can incur transaction and/or ongoing expenses at both the Fund level and the Contract Level: (1) transaction expenses can include sales charges (loads) on purchases, surrender fees, transfer fees and premium taxes; and (2) ongoing expenses can include management fees, distribution and service (12b-1) fees, contract fees, annual maintenance fees, mortality and expense risk fees and other fees and expenses. All mutual funds and Contracts have some types of ongoing expenses. The table below shows Fund-level ongoing expenses and can help you understand these costs and compare them with those of other mutual funds offered through the Contract. The table assumes a $1,000 investment held for the six months indicated. Please refer to the Fund prospectus for additional information on operating expenses.
Actual Fund Expenses
The table below provides information about the actual account values and actual expenses in the columns under the heading “Actual.” In these columns the Fund’s actual return, which includes the effect of ongoing Fund expenses but does not include the effect of ongoing Contract expenses, is used to calculate the “Ending Account Value.” You can estimate the Fund-level expenses you paid during the period by following these steps (of course, your account value and expenses will differ from those in this illustration): Divide your account value by $1,000 (if your account had an $8,600 value, then $8,600 ÷ $1,000 = 8.6). Then multiply the result by the number under the headings “Actual” and “Fund-Level Expenses Paid During Period” (if Fund-Level Expenses Paid During Period were $7.50, then 8.6 x $7.50 = $64.50). In this illustration, the estimated expenses paid this period at the Fund level are $64.50.
Hypothetical Example for Comparison with Other Mutual Funds
Under the heading “Hypothetical” in the table, information is provided about hypothetical account values and hypothetical expenses based on the Fund’s actual expense ratio and an assumed rate of return of 5% per year before expenses, which is not the Fund’s actual return. This information may not be used to estimate the actual ending account balance or expenses you paid for the period, but it can help you compare ongoing costs of investing in the Fund with those of other mutual funds offered through the Contract. To do so, compare this 5% hypothetical example with the 5% hypothetical examples that appear in the shareholder reports of other funds offered through the Contract.
Please note that expenses shown in the table are meant to highlight ongoing costs at the Fund level only and do not reflect any ongoing expenses at the Contract level, or transaction expenses at either the Fund or Contract levels. In addition, while the Fund does not have transaction expenses, if the transaction and ongoing expenses at the Contract level were included, the expenses shown below would be higher. You should consult your Contract prospectus or disclosure document for more information.
| | | | | | | | | | | | | | | | | | | | | | | | |
| | | | | | Actual
(actual return after expenses) | | | Hypothetical
(5% annual return before expenses) | | | | |
Share
Class | | Beginning Account
Value 7/1/17 | | | Ending Account
Value 12/31/17 | | | Fund-Level Expenses
Paid During Period
7/1/17–12/31/171,2 | | | Ending Account
Value 12/31/17 | | | Fund-Level Expenses
Paid During Period
7/1/17–12/31/171,2 | | | Annualized
Expense
Ratio2 | |
Class 2 | | | $1,000 | | | | $1,005.80 | | | | $3.79 | | | | $1,021.42 | | | | $3.82 | | | | 0.75 | % |
1. Expenses are equal to the annualized expense ratio for the six-month period as indicated above — in the far right column — multiplied by the simple average account value over the period indicated, and then multiplied by 184/365 to reflect the one-half year period.
2. Does not include any ongoing expenses of the Contract for which the Fund is an investment option or acquired fund fees and expenses.
FRANKLIN TEMPLETON VARIABLE INSURANCE PRODUCTS TRUST
Financial Highlights
Franklin U.S. Government Securities VIP Fund
| | | | | | | | | | | | | | | | | | | | |
| | | Year Ended December 31, | |
| | | 2017 | | | 2016 | | | 2015 | | | 2014 | | | 2013 | |
| Class 1 | | | | | | | | | | | | | | | | | | | | |
Per share operating performance
(for a share outstanding throughout the year) | | | | | | | | | | | | | | | | | | | | |
| | | | | |
Net asset value, beginning of year | | | $12.51 | | | | $12.74 | | | | $13.00 | | | | $12.91 | | | | $13.57 | |
| | | | |
| | | | | |
| Income from investment operationsa: | | | | | | | | | | | | | | | | | | | | |
| | | | | |
Net investment incomeb | | | 0.25 | | | | 0.22 | | | | 0.21 | | | | 0.24 | | | | 0.24 | |
| | | | | |
Net realized and unrealized gains (losses) | | | (0.04 | ) | | | (0.10 | ) | | | (0.12 | ) | | | 0.22 | | | | (0.51 | ) |
| | | | |
Total from investment operations | | | 0.21 | | | | 0.12 | | | | 0.09 | | | | 0.46 | | | | (0.27 | ) |
| | | | |
Less distributions from net investment income | | | (0.36 | ) | | | (0.35 | ) | | | (0.35 | ) | | | (0.37 | ) | | | (0.39 | ) |
| | | | |
Net asset value, end of year | | | $12.36 | | | | $12.51 | | | | $12.74 | | | | $13.00 | | | | $12.91 | |
| | | | |
| | | | | |
Total returnc | | | 1.66% | | | | 0.90% | | | | 0.71% | | | | 3.64% | | | | (1.99)% | |
| | | | | |
| Ratios to average net assets | | | | | | | | | | | | | | | | | | | | |
| | | | | |
Expensesd | | | 0.50% | | | | 0.50% | | | | 0.50% | | | | 0.49% | | | | 0.49% | |
| | | | | |
Net investment income | | | 2.00% | | | | 1.75% | | | | 1.64% | | | | 1.84% | | | | 1.84% | |
| | | | | |
| Supplemental data | | | | | | | | | | | | | | | | | | | | |
| | | | | |
Net assets, end of year (000’s) | | | $66,404 | | | | $73,695 | | | | $79,620 | | | | $90,656 | | | | $99,947 | |
| | | | | |
Portfolio turnover rate | | | 80.49% | | | | 86.28% | | | | 61.91% | | | | 42.88% | | | | 69.47% | |
| | | | | |
Portfolio turnover rate excluding mortgage dollar rollse | | | 80.49% | | | | 86.28% | | | | 61.91% | | | | 42.88% | | | | 67.80% | |
aThe amount shown for a share outstanding throughout the period may not correlate with the Statement of Operations for the period due to the timing of sales and repurchases of the Fund’s shares in relation to income earned and/or fluctuating fair value of the investments of the Fund.
bBased on average daily shares outstanding.
cTotal return does not include fees, charges or expenses imposed by the variable annuity and life insurance contracts for which Franklin Templeton Variable Insurance Products Trust serves as an underlying investment vehicle.
dBenefit of expense reduction rounds to less than 0.01%.
eSee Note 1(d) regarding mortgage dollar rolls.
| | | | | | |
| | | The accompanying notes are an integral part of these financial statements. | Annual Report | | | FUS-5 | |
FRANKLIN TEMPLETON VARIABLE INSURANCE PRODUCTS TRUST
FINANCIAL HIGHLIGHTS
Franklin U.S. Government Securities VIP Fund (continued)
| | | | | | | | | | | | | | | | | | | | |
| | | Year Ended December 31, | |
| | | 2017 | | | 2016 | | | 2015 | | | 2014 | | | 2013 | |
| Class 2 | | | | | | | | | | | | | | | | | | | | |
Per share operating performance
(for a share outstanding throughout the year) | | | | | | | | | | | | | | | | | | | | |
| | | | | |
Net asset value, beginning of year | | | $12.24 | | | | $12.47 | | | | $12.73 | | | | $12.65 | | | | $13.31 | |
| | | | |
| | | | | |
| Income from investment operationsa: | | | | | | | | | | | | | | | | | | | | |
| | | | | |
Net investment incomeb | | | 0.21 | | | | 0.19 | | | | 0.18 | | | | 0.20 | | | | 0.21 | |
| | | | | |
Net realized and unrealized gains (losses) | | | (0.04 | ) | | | (0.10 | ) | | | (0.12 | ) | | | 0.22 | | | | (0.50 | ) |
| | | | |
Total from investment operations | | | 0.17 | | | | 0.09 | | | | 0.06 | | | | 0.42 | | | | (0.29 | ) |
| | | | |
Less distributions from net investment income | | | (0.32 | ) | | | (0.32 | ) | | | (0.32 | ) | | | (0.34 | ) | | | (0.37 | ) |
| | | | |
Net asset value, end of year | | | $12.09 | | | | $12.24 | | | | $12.47 | | | | $12.73 | | | | $12.65 | |
| | | | |
| | | | | |
Total returnc | | | 1.34% | | | | 0.66% | | | | 0.47% | | | | 3.38% | | | | (2.24)% | |
| | | | | |
| Ratios to average net assets | | | | | | | | | | | | | | | | | | | | |
| | | | | |
Expensesd | | | 0.75% | | | | 0.75% | | | | 0.75% | | | | 0.74% | | | | 0.74% | |
| | | | | |
Net investment income | | | 1.75% | | | | 1.50% | | | | 1.39% | | | | 1.59% | | | | 1.59% | |
| | | | | |
| Supplemental data | | | | | | | | | | | | | | | | | | | | |
| | | | | |
Net assets, end of year (000’s) | | | $1,223,491 | | | | $1,268,963 | | | | $1,311,974 | | | | $1,369,037 | | | | $1,267,994 | |
| | | | | |
Portfolio turnover rate | | | 80.49% | | | | 86.28% | | | | 61.91% | | | | 42.88% | | | | 69.47% | |
| | | | | |
Portfolio turnover rate excluding mortgage dollar rollse | | | 80.49% | | | | 86.28% | | | | 61.91% | | | | 42.88% | | | | 67.80% | |
aThe amount shown for a share outstanding throughout the period may not correlate with the Statement of Operations for the period due to the timing of sales and repurchases of the Fund’s shares in relation to income earned and/or fluctuating fair value of the investments of the Fund.
bBased on average daily shares outstanding.
cTotal return does not include fees, charges or expenses imposed by the variable annuity and life insurance contracts for which Franklin Templeton Variable Insurance Products Trust serves as an underlying investment vehicle.
dBenefit of expense reduction rounds to less than 0.01%.
eSee Note 1(d) regarding mortgage dollar rolls.
| | | | |
| FUS-6 | | Annual Report | The accompanying notes are an integral part of these financial statements. | | |
FRANKLIN TEMPLETON VARIABLE INSURANCE PRODUCTS TRUST
Statement of Investments, December 31, 2017
| | | | | | | | | | |
Franklin U.S. Government Securities VIP Fund | |
| | | | | Principal Amount | | | Value | |
| | | Mortgage-Backed Securities 79.6% | | | | | | |
| a | | Federal Home Loan Mortgage Corp. (FHLMC) Adjustable Rate 1.3% | | | | | | |
| | FHLMC, 2.953%, (US 1 Year CMT T-Note +/- MBS Margin), 5/01/37 | | $ | 730,842 | | | $ | 770,948 | |
| | FHLMC, 3.521%, (12-month USD LIBOR +/- MBS Margin), 4/01/40 | | | 7,623,034 | | | | 8,021,025 | |
| | FHLMC, 3.426% - 3.66%, (12-month USD LIBOR +/- MBS Margin), 3/01/36 - 5/01/38 | | | 8,122,061 | | | | 8,532,012 | |
| | | | | | | | | | |
| | | | | | | | | 17,323,985 | |
| | | | | | | | | | |
| | | Federal Home Loan Mortgage Corp. (FHLMC) Fixed Rate 10.9% | | | | | | |
| | FHLMC Gold 15 Year, 4.50%, 3/01/25 - 4/01/25 | | | 1,062,815 | | | | 1,100,757 | |
| | FHLMC Gold 30 Year, 3.00%, 5/01/43 | | | 488,756 | | | | 492,071 | |
| | FHLMC Gold 30 Year, 3.00%, 6/01/46 | | | 39,005,083 | | | | 39,100,518 | |
| | FHLMC Gold 30 Year, 3.00%, 10/01/46 | | | 27,568,079 | | | | 27,631,262 | |
| | FHLMC Gold 30 Year, 3.50%, 3/01/32 - 5/01/43 | | | 4,094,872 | | | | 4,264,243 | |
| | FHLMC Gold 30 Year, 3.50%, 12/01/47 | | | 7,963,629 | | | | 8,188,541 | |
| | FHLMC Gold 30 Year, 3.50%, 1/01/48 | | | 15,000,000 | | | | 15,439,057 | |
| | FHLMC Gold 30 Year, 4.00%, 9/01/40 - 8/01/47 | | | 11,634,933 | | | | 12,208,512 | |
| b | | FHLMC Gold 30 Year, 4.00%, 1/01/47 | | | 5,000,000 | | | | 5,241,859 | |
| | FHLMC Gold 30 Year, 4.00%, 11/01/47 | | | 14,140,742 | | | | 14,818,388 | |
| | FHLMC Gold 30 Year, 4.50%, 5/01/40 - 7/01/41 | | | 2,680,590 | | | | 2,861,377 | |
| | FHLMC Gold 30 Year, 5.00%, 9/01/33 - 4/01/40 | | | 4,843,242 | | | | 5,270,143 | |
| | FHLMC Gold 30 Year, 5.50%, 7/01/33 - 5/01/38 | | | 1,320,815 | | | | 1,466,090 | |
| | FHLMC Gold 30 Year, 6.00%, 1/01/24 - 8/01/35 | | | 886,286 | | | | 996,735 | |
| | FHLMC Gold 30 Year, 6.50%, 12/01/23 - 5/01/35 | | | 455,767 | | | | 505,174 | |
| | FHLMC Gold 30 Year, 7.00%, 4/01/24 - 9/01/31 | | | 147,569 | | | | 161,576 | |
| | FHLMC Gold 30 Year, 7.50%, 12/01/22 - 5/01/24 | | | 1,580 | | | | 1,598 | |
| | FHLMC Gold 30 Year, 8.00%, 9/01/21 - 5/01/22 | | | 2,810 | | | | 2,993 | |
| | FHLMC Gold 30 Year, 8.50%, 10/01/21 - 7/01/31 | | | 316,630 | | | | 373,191 | |
| | FHLMC PC 30 Year, 8.50%, 9/01/20 | | | 115 | | | | 116 | |
| | | | | | | | | | |
| | | | | | | | | 140,124,201 | |
| | | | | | | | | | |
| a | | Federal National Mortgage Association (FNMA) Adjustable Rate 4.8% | | | | | | |
| | FNMA, 2.263% - 3.271%, (US 1 Year CMT T-Note +/- MBS Margin), 9/01/18 - 10/01/44 | | | 7,142,466 | | | | 7,505,598 | |
| | FNMA, 3.361%, (12-month USD LIBOR +/- MBS Margin), 8/01/36 | | | 6,523,500 | | | | 6,851,984 | |
| | FNMA, 3.385%, (12-month USD LIBOR +/- MBS Margin), 10/01/35 | | | 5,913,417 | | | | 6,209,093 | |
| | FNMA, 3.663%, (12-month USD LIBOR +/- MBS Margin), 9/01/37 | | | 17,501,248 | | | | 18,587,245 | |
| | FNMA, 3.21% - 4.133%, (US 3 Year CMT T-Note +/- MBS Margin), 3/01/20 - 3/01/29 | | | 45,062 | | | | 45,574 | |
| | FNMA, 2.413% - 4.918%, (6-month USD LIBOR +/- MBS Margin), 6/01/21 - 7/01/37 | | | 1,482,131 | | | | 1,527,776 | |
| | FNMA, 1.979% - 5.441%, (11th District COF +/- MBS Margin), 8/01/18 - 6/01/38 | | | 191,472 | | | | 196,641 | |
| | FNMA, 3.022% - 5.487%, (12-month USD LIBOR +/- MBS Margin), 1/01/19 - 3/01/47 | | | 11,485,571 | | | | 12,010,392 | |
| | FNMA, 3.271% - 7.22%, (US 1 Year CMT T-Note +/- MBS Margin), 7/01/19 - 12/01/40 | | | 8,171,489 | | | | 8,584,449 | |
| | | | | | | | | | |
| | | | | | | | | 61,518,752 | |
| | | | | | | | | | |
| | | Federal National Mortgage Association (FNMA) Fixed Rate 8.4% | | | | | | |
| | FNMA 15 Year, 2.64%, 7/01/25 | | | 2,500,000 | | | | 2,500,997 | |
| | FNMA 15 Year, 2.77%, 4/01/25 | | | 3,500,000 | | | | 3,519,084 | |
| | FNMA 15 Year, 2.99%, 11/01/24 | | | 2,995,919 | | | | 3,059,142 | |
| | FNMA 15 Year, 3.14%, 10/01/25 | | | 4,000,000 | | | | 4,094,630 | |
| | FNMA 15 Year, 3.28%, 7/01/27 | | | 4,000,000 | | | | 4,111,869 | |
| | FNMA 15 Year, 3.51%, 8/01/23 | | | 3,000,000 | | | | 3,149,261 | |
| | FNMA 15 Year, 5.50%, 1/01/25 | | | 1,146,670 | | | | 1,209,301 | |
| | FNMA 30 Year, 3.00%, 12/01/42 | | | 211,148 | | | | 212,185 | |
| | FNMA 30 Year, 3.00%, 9/01/47 | | | 19,751,091 | | | | 19,771,244 | |
| | FNMA 30 Year, 3.50%, 7/01/45 | | | 36,205,208 | | | | 37,224,761 | |
| | FNMA 30 Year, 4.00%, 1/01/41 - 8/01/41 | | | 8,392,303 | | | | 8,824,187 | |
| | FNMA 30 Year, 4.50%, 8/01/40 - 6/01/41 | | | 8,364,403 | | | | 8,967,345 | |
FRANKLIN TEMPLETON VARIABLE INSURANCE PRODUCTS TRUST
STATEMENT OF INVESTMENTS
Franklin U.S. Government Securities VIP Fund (continued)
| | | | | | | | | | |
| | | | | Principal Amount | | | Value | |
| | | Mortgage-Backed Securities (continued) | | | | | | |
| | | Federal National Mortgage Association (FNMA) Fixed Rate (continued) | | | | | | |
| | FNMA 30 Year, 5.00%, 3/01/34 - 7/01/41 | | $ | 4,926,325 | | | $ | 5,328,050 | |
| | FNMA 30 Year, 5.50%, 12/01/32 - 8/01/35 | | | 1,963,014 | | | | 2,170,471 | |
| | FNMA 30 Year, 6.00%, 1/01/24 - 8/01/38 | | | 2,371,356 | | | | 2,670,384 | |
| | FNMA 30 Year, 6.50%, 1/01/24 - 9/01/36 | | | 476,080 | | | | 528,215 | |
| | FNMA 30 Year, 7.50%, 4/01/23 - 8/01/25 | | | 17,082 | | | | 17,531 | |
| | FNMA 30 Year, 8.00%, 3/01/22 - 2/01/25 | | | 84,353 | | | | 86,129 | |
| | FNMA 30 Year, 8.50%, 3/01/20 - 6/01/21 | | | 341 | | | | 349 | |
| | FNMA 30 Year, 9.00%, 10/01/26 | | | 83,162 | | | | 87,683 | |
| | FNMA PL 30 Year, 5.50%, 4/01/34 | | | 1,177,744 | | | | 1,259,592 | |
| | | | | | | | | | |
| | | | | | | | | 108,792,410 | |
| | | | | | | | | | |
| | | Government National Mortgage Association (GNMA) Fixed Rate 54.2% | | | | | | |
| | GNMA I SF 30 Year, 3.00%, 7/15/42 | | | 546,690 | | | | 554,393 | |
| | GNMA I SF 30 Year, 4.00%, 10/15/40 - 8/15/46 | | | 12,043,965 | | | | 12,650,839 | |
| | GNMA I SF 30 Year, 4.50%, 1/15/39 - 6/15/40 | | | 11,804,263 | | | | 12,554,128 | |
| | GNMA I SF 30 Year, 4.50%, 7/15/40 - 6/15/41 | | | 4,871,583 | | | | 5,187,134 | |
| | GNMA I SF 30 Year, 5.00%, 6/15/30 - 11/15/39 | | | 11,652,823 | | | | 12,686,046 | |
| | GNMA I SF 30 Year, 5.00%, 11/15/39 - 5/15/40 | | | 11,756,347 | | | | 12,870,402 | |
| | GNMA I SF 30 Year, 5.00%, 5/15/40 - 9/15/40 | | | 1,567,393 | | | | 1,707,193 | |
| | GNMA I SF 30 Year, 5.50%, 12/15/28 - 10/15/39 | | | 6,096,700 | | | | 6,756,533 | |
| | GNMA I SF 30 Year, 6.00%, 11/15/23 - 11/15/38 | | | 3,175,841 | | | | 3,573,079 | |
| | GNMA I SF 30 Year, 6.50%, 6/15/23 - 9/15/38 | | | 1,634,317 | | | | 1,825,804 | |
| | GNMA I SF 30 Year, 7.00%, 9/15/22 - 1/15/32 | | | 433,627 | | | | 452,755 | |
| | GNMA I SF 30 Year, 7.50%, 2/15/22 - 8/15/33 | | | 463,076 | | | | 524,009 | |
| | GNMA I SF 30 Year, 8.00%, 12/15/21 - 7/15/23 | | | 110,038 | | | | 112,736 | |
| | GNMA I SF 30 Year, 8.50%, 6/15/22 - 12/15/24 | | | 44,677 | | | | 45,561 | |
| | GNMA I SF 30 Year, 9.00%, 9/15/19 - 3/15/20 | | | 942 | | | | 946 | |
| | GNMA I SF 30 Year, 9.50%, 9/15/18 - 12/15/20 | | | 18,790 | | | | 19,076 | |
| | GNMA I SF 30 Year, 10.00%, 9/15/18 - 8/15/21 | | | 8,056 | | | | 8,107 | |
| | GNMA II SF 30 Year, 3.00%, 12/20/42 - 2/20/45 | | | 2,790,782 | | | | 2,820,755 | |
| | GNMA II SF 30 Year, 3.00%, 9/20/45 | | | 11,111,724 | | | | 11,223,909 | |
| | GNMA II SF 30 Year, 3.00%, 7/20/47 | | | 23,907,734 | | | | 24,149,107 | |
| | GNMA II SF 30 Year, 3.00%, 9/20/47 | | | 29,773,273 | | | | 30,073,865 | |
| | GNMA II SF 30 Year, 3.50%, 12/20/40 - 8/20/43 | | | 2,811,341 | | | | 2,924,907 | |
| | GNMA II SF 30 Year, 3.50%, 8/20/42 | | | 7,815,086 | | | | 8,130,785 | |
| | GNMA II SF 30 Year, 3.50%, 9/20/42 | | | 22,700,703 | | | | 23,617,730 | |
| | GNMA II SF 30 Year, 3.50%, 10/20/42 | | | 6,910,176 | | | | 7,189,326 | |
| | GNMA II SF 30 Year, 3.50%, 11/20/42 | | | 13,542,973 | | | | 14,090,073 | |
| | GNMA II SF 30 Year, 3.50%, 12/20/42 | | | 10,242,805 | | | | 10,656,593 | |
| | GNMA II SF 30 Year, 3.50%, 1/20/43 | | | 17,167,491 | | | | 17,861,023 | |
| | GNMA II SF 30 Year, 3.50%, 3/20/43 | | | 6,200,951 | | | | 6,451,465 | |
| | GNMA II SF 30 Year, 3.50%, 4/20/43 | | | 7,768,113 | | | | 8,081,942 | |
| | GNMA II SF 30 Year, 3.50%, 5/20/43 | | | 14,264,640 | | | | 14,840,926 | |
| | GNMA II SF 30 Year, 3.50%, 6/20/43 | | | 6,536,193 | | | | 6,800,258 | |
| | GNMA II SF 30 Year, 3.50%, 9/20/47 | | | 104,889,757 | | | | 108,649,707 | |
| | GNMA II SF 30 Year, 3.50%, 10/20/47 | | | 7,961,303 | | | | 8,246,689 | |
| | GNMA II SF 30 Year, 3.50%, 11/20/47 | | | 143,050,109 | | | | 148,177,982 | |
| | GNMA II SF 30 Year, 4.00%, 11/20/39 - 3/20/41 | | | 10,943,222 | | | | 11,540,897 | |
| | GNMA II SF 30 Year, 4.00%, 7/20/41 - 2/20/44 | | | 6,134,137 | | | | 6,459,140 | |
| | GNMA II SF 30 Year, 4.00%, 11/20/41 | | | 7,664,811 | | | | 8,075,118 | |
| | GNMA II SF 30 Year, 4.00%, 5/20/47 | | | 13,864,187 | | | | 14,476,655 | |
| | GNMA II SF 30 Year, 4.00%, 10/20/47 | | | 69,209,376 | | | | 72,521,893 | |
FRANKLIN TEMPLETON VARIABLE INSURANCE PRODUCTS TRUST
STATEMENT OF INVESTMENTS
Franklin U.S. Government Securities VIP Fund (continued)
| | | | | | | | | | |
| | | | | Principal Amount | | | Value | |
| | | Mortgage-Backed Securities (continued) | | | | | | |
| | | Government National Mortgage Association (GNMA) Fixed Rate (continued) | | | | | | |
| | GNMA II SF 30 Year, 4.50%, 10/20/39 - 6/20/41 | | $ | 11,940,374 | | | $ | 12,665,143 | |
| | GNMA II SF 30 Year, 4.50%, 7/20/41 - 2/20/44 | | | 11,866,675 | | | | 12,572,879 | |
| | GNMA II SF 30 Year, 4.50%, 9/20/41 | | | 6,099,825 | | | | 6,462,998 | |
| | GNMA II SF 30 Year, 4.50%, 10/20/44 | | | 3,350,764 | | | | 3,541,686 | |
| | GNMA II SF 30 Year, 5.00%, 9/20/33 - 10/20/42 | | | 10,200,732 | | | | 11,127,790 | |
| | GNMA II SF 30 Year, 5.00%, 6/20/44 | | | 3,280,637 | | | | 3,540,259 | |
| | GNMA II SF 30 Year, 5.50%, 5/20/34 - 6/20/38 | | | 5,073,047 | | | | 5,611,401 | |
| | GNMA II SF 30 Year, 6.00%, 11/20/23 - 7/20/39 | | | 3,228,644 | | | | 3,669,311 | |
| | GNMA II SF 30 Year, 6.50%, 12/20/27 - 4/20/34 | | | 504,608 | | | | 573,441 | |
| | GNMA II SF 30 Year, 7.00%, 5/20/32 | | | 8,684 | | | | 10,225 | |
| | GNMA II SF 30 Year, 7.50%, 9/20/22 - 5/20/33 | | | 90,835 | | | | 99,677 | |
| | GNMA II SF 30 Year, 8.00%, 8/20/26 | | | 5,950 | | | | 6,952 | |
| | GNMA II SF 30 Year, 9.50%, 4/20/25 | | | 2,100 | | | | 2,109 | |
| | | | | | | | | | |
| | | | | | | | | 698,473,357 | |
| | | | | | | | | | |
| | | |
| | Total Mortgage-Backed Securities (Cost $1,031,516,297) | | | | | | | 1,026,232,705 | |
| | | | | | | | | | |
| | U.S. Government and Agency Securities 17.8% | | | | | | | | |
| | Federal Agricultural Mortgage Corp., | | | | | | | | |
| | 4.30%, 5/13/19 | | | 1,010,000 | | | | 1,044,333 | |
| | 1.41%, 3/06/20 | | | 10,000,000 | | | | 9,896,760 | |
| | 2.66%, 4/12/22 | | | 7,000,000 | | | | 7,128,611 | |
| | FHLB, 2.625%, 9/12/25 | | | 20,000,000 | | | | 20,029,020 | |
| | FICO, | | | | | | | | |
| | 1P, Strip, 5/11/18 | | | 10,000,000 | | | | 9,941,155 | |
| | 12, Strip, 6/06/18 | | | 4,627,000 | | | | 4,594,817 | |
| | 13P, Strip, 12/27/18 | | | 2,500,000 | | | | 2,454,729 | |
| | 15P, Strip, 3/07/19 | | | 1,798,000 | | | | 1,756,703 | |
| | A-P, Strip, 2/08/18 | | | 1,000,000 | | | | 998,484 | |
| | B-P, Strip, 4/06/18 | | | 1,405,000 | | | | 1,399,087 | |
| | D-P, Strip, 9/26/19 | | | 7,605,000 | | | | 7,346,354 | |
| | E-P, Strip, 11/02/18 | | | 8,896,000 | | | | 8,759,948 | |
| | Israel Government Agency for International Development Bond, | | | | | | | | |
| | 5.50%, 9/18/23 | | | 12,000,000 | | | | 13,971,949 | |
| | 7-Z, U.S. Government Guaranteed, Strip, 8/15/22 | | | 5,619,000 | | | | 5,062,446 | |
| | New Valley Generation IV, secured bond, 4.687%, 1/15/22 | | | 1,873,266 | | | | 2,015,498 | |
| | Overseas Private Investment Corp., | | | | | | | | |
| | A, zero cpn., 2/19/18 | | | 682,174 | | | | 730,029 | |
| | A, zero cpn., 11/15/20 | | | 2,575,000 | | | | 3,108,774 | |
| | Private Export Funding Corp., | | | | | | | | |
| | secured bond, 2.80%, 5/15/22 | | | 9,000,000 | | | | 9,189,783 | |
| | secured note, 4.30%, 12/15/21 | | | 1,865,000 | | | | 2,008,696 | |
| | secured note, LL, 2.25%, 3/15/20 | | | 1,700,000 | | | | 1,703,844 | |
| | senior secured note, MM, 2.30%, 9/15/20 | | | 3,500,000 | | | | 3,511,858 | |
| | SBA, | | | | | | | | |
| | c FRN, 4.125%, (US Prime - 0.125%), 3/25/18 | | | 13,521 | | | | 13,472 | |
| | PC, 1998-20I, 1, 6.00%, 9/01/18 | | | 61,576 | | | | 62,071 | |
| | Tunisia Government Agency for International Development Bonds, 1.686%, 7/16/19 | | | 7,000,000 | | | | 7,006,062 | |
FRANKLIN TEMPLETON VARIABLE INSURANCE PRODUCTS TRUST
STATEMENT OF INVESTMENTS
Franklin U.S. Government Securities VIP Fund (continued)
| | | | | | | | | | |
| | | | | Principal Amount | | | Value | |
| | | U.S. Government and Agency Securities (continued) | | | | | | |
| | TVA, | | | | | | | | |
| | 1.875%, 8/15/22 | | $ | 6,000,000 | | | $ | 5,908,914 | |
| | 5.88%, 4/01/36 | | | 5,000,000 | | | | 7,038,590 | |
| | Strip, 11/01/18 | | | 2,644,000 | | | | 2,599,307 | |
| | Strip, 6/15/19 | | | 5,973,000 | | | | 5,785,486 | |
| | Strip, 6/15/20 | | | 6,138,000 | | | | 5,804,226 | |
| | U.S. Treasury Bond, | | | | | | | | |
| | 2.50%, 2/15/46 | | | 4,000,000 | | | | 3,803,186 | |
| | d Index Linked, 2.00%, 1/15/26 | | | 13,670,816 | | | | 15,391,130 | |
| | d Index Linked, 1.75%, 1/15/28 | | | 9,419,464 | | | | 10,601,171 | |
| | d Index Linked, 3.625%, 4/15/28 | | | 7,625,449 | | | | 10,020,942 | |
| | U.S. Treasury Note, | | | | | | | | |
| | 2.375%, 8/15/24 | | | 13,000,000 | | | | 13,040,635 | |
| | d Index Linked, 0.125%, 4/15/19 | | | 5,263,494 | | | | 5,253,348 | |
| | d Index Linked, 0.125%, 7/15/24 | | | 16,102,000 | | | | 15,926,373 | |
| | Ukraine Government Agency for International Development Bonds, 1.844%, 5/16/19 | | | 5,000,000 | | | | 5,013,985 | |
| | | | | | | | | | |
| | | |
| | Total U.S. Government and Agency Securities (Cost $228,686,244) | | | | | | | 229,921,776 | |
| | | | | | | | | | |
| | | |
| | Total Investments before Short Term Investments (Cost $1,260,202,541) | | | | | | | 1,256,154,481 | |
| | | | | | | | | | |
| | Short Term Investments (Cost $36,651,299) 2.8% | | | | | | | | |
| | | Repurchase Agreements 2.8% | | | | | | |
| e | | Joint Repurchase Agreement, 1.377%, 1/02/18 (Maturity Value $36,656,905) | | | | | | | | |
| | BNP Paribas Securities Corp. (Maturity Value $5,975,442) | | | | | | | | |
| | Deutsche Bank Securities Inc. (Maturity Value $6,660,193) | | | | | | | | |
| | HSBC Securities (USA) Inc. (Maturity Value $23,901,768) | | | | | | | | |
| | Merrill Lynch, Pierce, Fenner & Smith Inc. (Maturity Value $119,502) | | | | | | | | |
| | Collateralized by U.S. Government Agency Securities, 0.00% - 1.98%, 7/27/18 - 11/22/21; U.S. Treasury Note, 1.25% - 2.00%, 12/31/18 - 4/30/22; and U.S. Treasury Note, Index Linked, 0.125%, 4/15/18 (valued at $37,387,193) | | | 36,651,299 | | | | 36,651,299 | |
| | | | | | | | | | |
| | Total Investments (Cost $1,296,853,840) 100.2% | | | | | | | 1,292,805,780 | |
| | Other Assets, less Liabilities (0.2)% | | | | | | | (2,910,988 | ) |
| | | | | | | | | | |
| | Net Assets 100.0% | | | | | | $ | 1,289,894,792 | |
| | | | | | | | | | |
See Abbreviations on page FUS-19.
aAdjustable Rate Mortgage-Backed Security (ARM); the rate shown is the effective rate at period end. ARM rates are not based on a published reference rate and spread, but instead pass-through weighted average interest income inclusive of any caps or floors, if applicable, from the underlying mortgage loans in which the majority of mortgages pay interest based on the index shown at their designated reset dates plus a spread, less the applicable servicing and guaranty fee (MBS margin).
bSecurity purchased on a to-be-announced (TBA) basis. See Note 1(c).
cThe coupon rate shown represents the rate at period end.
dPrincipal amount of security is adjusted for inflation. See Note 1(f).
eSee Note 1(b) regarding joint repurchase agreement.
| | | | |
| FUS-10 | | Annual Report | The accompanying notes are an integral part of these financial statements. | | |
FRANKLIN TEMPLETON VARIABLE INSURANCE PRODUCTS TRUST
Financial Statements
Statement of Assets and Liabilities
December 31, 2017
| | | | |
| | | Franklin U.S.
Government
Securities VIP Fund | |
Assets: | | | | |
Investments in securities: | | | | |
Cost - Unaffiliated issuers | | $ | 1,260,202,541 | |
Cost - Unaffiliated repurchase agreements | | | 36,651,299 | |
| | | | |
Value - Unaffiliated issuers | | $ | 1,256,154,481 | |
Value - Unaffiliated repurchase agreements | | | 36,651,299 | |
Receivables: | | | | |
Investment securities sold | | | 5,325,562 | |
Capital shares sold | | | 214,515 | |
Interest | | | 4,126,619 | |
Other assets | | | 154 | |
| | | | |
Total assets | | | 1,302,472,630 | |
| | | | |
Liabilities: | | | | |
Payables: | | | | |
Investment securities purchased | | | 10,443,533 | |
Capital shares redeemed | | | 940,540 | |
Management fees | | | 515,732 | |
Distribution fees | | | 513,809 | |
Accrued expenses and other liabilities | | | 164,224 | |
| | | | |
Total liabilities | | | 12,577,838 | |
| | | | |
Net assets, at value | | $ | 1,289,894,792 | |
| | | | |
Net assets consist of: | | | | |
Paid-in capital | | $ | 1,348,008,089 | |
Undistributed net investment income | | | 30,616,923 | |
Net unrealized appreciation (depreciation) | | | (4,048,060 | ) |
Accumulated net realized gain (loss) | | | (84,682,160 | ) |
| | | | |
Net assets, at value | | $ | 1,289,894,792 | |
| | | | |
| |
| Class 1: | | | | |
Net assets, at value | | $ | 66,403,916 | |
| | | | |
Shares outstanding | | | 5,371,469 | |
| | | | |
Net asset value and maximum offering price per share | | $ | 12.36 | |
| | | | |
| |
| Class 2: | | | | |
Net assets, at value | | $ | 1,223,490,876 | |
| | | | |
Shares outstanding | | | 101,236,975 | |
| | | | |
Net asset value and maximum offering price per share | | $ | 12.09 | |
| | | | |
| | | | | | |
| | | The accompanying notes are an integral part of these financial statements. | Annual Report | | | FUS-11 | |
FRANKLIN TEMPLETON VARIABLE INSURANCE PRODUCTS TRUST
FINANCIAL STATEMENTS
Statement of Operations
for the year ended December 31, 2017
| | | | |
| | | Franklin U.S.
Government
Securities VIP Fund | |
Investment income: | | | | |
Interest: | | | | |
Unaffiliated issuers: | | | | |
Paydown gain (loss) | | $ | (8,476,013 | ) |
Paid in cash | | | 41,649,378 | |
| | | | |
Total investment income | | | 33,173,365 | |
| | | | |
Expenses: | | | | |
Management fees (Note 3a) | | | 6,217,217 | |
Distribution fees: (Note 3c) | | | | |
Class 2 | | | 3,136,597 | |
Custodian fees (Note 4) | | | 12,820 | |
Reports to shareholders | | | 125,938 | |
Professional fees | | | 78,343 | |
Trustees’ fees and expenses | | | 5,142 | |
Other | | | 173,665 | |
| | | | |
Total expenses | | | 9,749,722 | |
Expense reductions (Note 4) | | | (1,962 | ) |
| | | | |
Net expenses | | | 9,747,760 | |
| | | | |
Net investment income | | | 23,425,605 | |
| | | | |
Realized and unrealized gains (losses): | | | | |
Net realized gain (loss) from: | | | | |
Investments: | | | | |
Unaffiliated issuers | | | (9,244,107 | ) |
| | | | |
Net change in unrealized appreciation (depreciation) on: | | | | |
Investments: | | | | |
Unaffiliated issuers | | | 4,564,648 | |
| | | | |
Net realized and unrealized gain (loss) | | | (4,679,459 | ) |
| | | | |
Net increase (decrease) in net assets resulting from operations | | $ | 18,746,146 | |
| | | | |
| | | | |
| FUS-12 | | Annual Report | The accompanying notes are an integral part of these financial statements. | | |
FRANKLIN TEMPLETON VARIABLE INSURANCE PRODUCTS TRUST
FINANCIAL STATEMENTS
Statements of Changes in Net Assets
| | | | | | | | |
| | | Franklin U.S. Government
Securities VIP Fund | |
| | | Year Ended December 31, | |
| | | 2017 | | | 2016 | |
Increase (decrease) in net assets: | | | | | | | | |
Operations: | | | | | | | | |
Net investment income | | $ | 23,425,605 | | | $ | 21,356,404 | |
Net realized gain (loss) | | | (9,244,107 | ) | | | 3,288,253 | |
Net change in unrealized appreciation (depreciation) | | | 4,564,648 | | | | (15,237,134 | ) |
| | | | |
Net increase (decrease) in net assets resulting from operations | | | 18,746,146 | | | | 9,407,523 | |
| | | | |
Distributions to shareholders from: | | | | | | | | |
Net investment income: | | | | | | | | |
Class 1 | | | (2,011,168 | ) | | | (2,105,837 | ) |
Class 2 | | | (33,122,555 | ) | | | (33,509,223 | ) |
| | | | |
Total distributions to shareholders | | | (35,133,723 | ) | | | (35,615,060 | ) |
| | | | |
Capital share transactions: (Note 2) | | | | | | | | |
Class 1 | | | (6,455,480 | ) | | | (4,571,855 | ) |
Class 2 | | | (29,919,965 | ) | | | (18,157,380 | ) |
| | | | |
Total capital share transactions | | | (36,375,445 | ) | | | (22,729,235 | ) |
| | | | |
Net increase (decrease) in net assets | | | (52,763,022 | ) | | | (48,936,772 | ) |
Net assets: | | | | | | | | |
Beginning of year | | | 1,342,657,814 | | | | 1,391,594,586 | |
| | | | |
End of year | | $ | 1,289,894,792 | | | $ | 1,342,657,814 | |
| | | | |
Undistributed net investment income included in net assets: | | | | | | | | |
End of year | | $ | 30,616,923 | | | $ | 30,162,856 | |
| | | | |
| | | | | | |
| | | The accompanying notes are an integral part of these financial statements. | Annual Report | | | FUS-13 | |
FRANKLIN TEMPLETON VARIABLE INSURANCE PRODUCTS TRUST
Notes to Financial Statements
Franklin U.S. Government Securities VIP Fund
1. Organization and Significant Accounting Policies
Franklin Templeton Variable Insurance Products Trust (Trust) is registered under the Investment Company Act of 1940 (1940 Act) as an open-end management investment company, consisting of eighteen separate funds and applies the specialized accounting and reporting guidance in U.S. Generally Accepted Accounting Principles (U.S. GAAP). Franklin U.S. Government Securities VIP Fund (Fund) is included in this report. Shares of the Fund are generally sold only to insurance company separate accounts to fund the benefits of variable life insurance policies or variable annuity contracts. At December 31, 2017, 42.9% of the Fund’s shares were held through one insurance company. Investment activities of these insurance company separate accounts could have a material impact on the Fund. The Fund offers two classes of shares: Class 1 and Class 2. Each class of shares may differ by its distribution fees, voting rights on matters affecting a single class and its exchange privilege.
The following summarizes the Fund’s significant accounting policies.
a. Financial Instrument Valuation
The Fund’s investments in financial instruments are carried at fair value daily. Fair value is the price that would be received to sell an asset or paid to transfer a liability in an orderly transaction between market participants on the measurement date. The Fund calculates the net asset value (NAV) per share as of 4 p.m. Eastern time each day the New York Stock Exchange (NYSE) is open for trading. Under compliance policies and procedures approved by the Trust’s Board of Trustees (the Board), the Fund’s administrator has responsibility for oversight of valuation, including leading the cross-functional Valuation Committee (VC). The VC provides administration and oversight of the Fund’s valuation policies and procedures, which are approved annually by the Board. Among other things, these procedures allow the Fund to utilize independent pricing services, quotations from securities and financial instrument dealers, and other market sources to determine fair value.
Debt securities generally trade in the over-the-counter market rather than on a securities exchange. The Fund’s pricing services use multiple valuation techniques to determine fair value. In instances where sufficient market activity exists, the pricing services may utilize a market-based approach through which quotes from market makers are used to determine fair
value. In instances where sufficient market activity may not exist or is limited, the pricing services also utilize proprietary valuation models which may consider market characteristics such as benchmark yield curves, credit spreads, estimated default rates, anticipated market interest rate volatility, coupon rates, anticipated timing of principal repayments, underlying collateral, and other unique security features in order to estimate the relevant cash flows, which are then discounted to calculate the fair value.
Investments in repurchase agreements are valued at cost, which approximates fair value.
The Fund has procedures to determine the fair value of financial instruments for which market prices are not reliable or readily available. Under these procedures, the VC convenes on a regular basis to review such financial instruments and considers a number of factors, including significant unobservable valuation inputs, when arriving at fair value. The VC primarily employs a market-based approach which may use related or comparable assets or liabilities, recent transactions, market multiples, book values, and other relevant information for the investment to determine the fair value of the investment. An income-based valuation approach may also be used in which the anticipated future cash flows of the investment are discounted to calculate fair value. Discounts may also be applied due to the nature or duration of any restrictions on the disposition of the investments. Due to the inherent uncertainty of valuations of such investments, the fair values may differ significantly from the values that would have been used had an active market existed. The VC employs various methods for calibrating these valuation approaches including a regular review of key inputs and assumptions, transactional back-testing or disposition analysis, and reviews of any related market activity.
b. Joint Repurchase Agreement
The Fund enters into a joint repurchase agreement whereby its uninvested cash balance is deposited into a joint cash account with other funds managed by the investment manager or an affiliate of the investment manager and is used to invest in one or more repurchase agreements. The value and face amount of the joint repurchase agreement are allocated to the funds based on their pro-rata interest. A repurchase agreement is accounted for as a loan by the Fund to the seller, collateralized by securities which are delivered to the Fund’s custodian. The fair value, including accrued interest, of the initial collateralization is required to be at least 102% of the dollar amount invested by
FRANKLIN TEMPLETON VARIABLE INSURANCE PRODUCTS TRUST
NOTES TO FINANCIAL STATEMENTS
Franklin U.S. Government Securities VIP Fund (continued)
the funds, with the value of the underlying securities marked to market daily to maintain coverage of at least 100%. Repurchase agreements are subject to the terms of Master Repurchase Agreements (MRAs) with approved counterparties (sellers). The MRAs contain various provisions, including but not limited to events of default and maintenance of collateral for repurchase agreements. In the event of default by either the seller or the Fund, certain MRAs may permit the non-defaulting party to net and close-out all transactions, if any, traded under such agreements. The Fund may sell securities it holds as collateral and apply the proceeds towards the repurchase price and any other amounts owed by the seller to the Fund in the event of default by the seller. This could involve costs or delays in addition to a loss on the securities if their value falls below the repurchase price owed by the seller. The joint repurchase agreement held by the Fund at year end, as indicated in the Statement of Investments, had been entered into on December 29, 2017.
c. Securities Purchased on a TBA Basis
The Fund purchases securities on a to-be-announced (TBA) basis, with payment and delivery scheduled for a future date. These transactions are subject to market fluctuations and are subject to the risk that the value at delivery may be more or less than the trade date purchase price. Sufficient assets have been segregated for these securities.
d. Mortgage Dollar Rolls
The Fund enters into mortgage dollar rolls, typically on a TBA basis. Mortgage dollar rolls are agreements between the Fund and a financial institution where the Fund sells (or buys) mortgage-backed securities for delivery on a specified date and simultaneously contracts to repurchase (or sell) substantially similar (same type, coupon, and maturity) securities at a future date and at a predetermined price. Gains or losses are realized on the initial sale, and the difference between the repurchase price and the sale price is recorded as an unrealized gain or loss to the Fund upon entering into the mortgage dollar roll. In addition, the Fund may invest the cash proceeds that are received from the initial sale. During the period between the sale and repurchase, the Fund is not entitled to principal and interest paid on the mortgage backed securities. Transactions in mortgage dollar rolls are accounted for as purchases and sales and may result in an increase to the Fund’s portfolio turnover rate. The risks of mortgage dollar roll transactions include the potential inability of the counterparty to fulfill its obligations.
e. Income Taxes
It is the Fund’s policy to qualify as a regulated investment company under the Internal Revenue Code. The Fund intends to distribute to shareholders substantially all of its taxable income and net realized gains to relieve it from federal income and if applicable, excise taxes. As a result, no provision for U.S. federal income taxes is required.
The Fund may recognize an income tax liability related to its uncertain tax positions under U.S. GAAP when the uncertain tax position has a less than 50% probability that it will be sustained upon examination by the tax authorities based on its technical merits. As of December 31, 2017, the Fund has determined that no tax liability is required in its financial statements related to uncertain tax positions for any open tax years (or expected to be taken in future tax years). Open tax years are those that remain subject to examination and are based on the statute of limitations in each jurisdiction in which the Fund invests.
f. Security Transactions, Investment Income, Expenses and Distributions
Security transactions are accounted for on trade date. Realized gains and losses on security transactions are determined on a specific identification basis. Interest income and estimated expenses are accrued daily. Amortization of premium and accretion of discount on debt securities are included in interest income. Paydown gains and losses are recorded separately in the Statement of Operations. Distributions to shareholders are recorded on the ex-dividend date. Distributable earnings are determined according to income tax regulations (tax basis) and may differ from earnings recorded in accordance with U.S. GAAP. These differences may be permanent or temporary. Permanent differences are reclassified among capital accounts to reflect their tax character. These reclassifications have no impact on net assets or the results of operations. Temporary differences are not reclassified, as they may reverse in subsequent periods.
Common expenses incurred by the Trust are allocated among the Funds based on the ratio of net assets of each Fund to the combined net assets of the Trust. Fund specific expenses are charged directly to the Fund that incurred the expense.
FRANKLIN TEMPLETON VARIABLE INSURANCE PRODUCTS TRUST
NOTES TO FINANCIAL STATEMENTS
Franklin U.S. Government Securities VIP Fund (continued)
1. Organization and Significant Accounting Policies (continued)
f. Security Transactions, Investment Income, Expenses and Distributions (continued)
Realized and unrealized gains and losses and net investment income, excluding class specific expenses, are allocated daily to each class of shares based upon the relative proportion of net assets of each class. Differences in per share distributions by class are generally due to differences in class specific expenses. Inflation-indexed bonds are adjusted for inflation through periodic increases or decreases in the security’s interest accruals, face amount, or principal redemption value, by amounts corresponding to the rate of inflation as measured by an index. Any increase or decrease in the face amount or principal redemption value will be included as interest income in the Statement of Operations.
g. Accounting Estimates
The preparation of financial statements in accordance with U.S. GAAP requires management to make estimates and assumptions that affect the reported amounts of assets and
liabilities at the date of the financial statements and the amounts of income and expenses during the reporting period. Actual results could differ from those estimates.
h. Guarantees and Indemnifications
Under the Trust’s organizational documents, its officers and trustees are indemnified by the Trust against certain liabilities arising out of the performance of their duties to the Trust. Additionally, in the normal course of business, the Trust, on behalf of the Fund, enters into contracts with service providers that contain general indemnification clauses. The Trust’s maximum exposure under these arrangements is unknown as this would involve future claims that may be made against the Trust that have not yet occurred. Currently, the Trust expects the risk of loss to be remote.
2. Shares of Beneficial Interest
At December 31, 2017, there were an unlimited number of shares authorized (without par value). Transactions in the Fund’s shares were as follows:
| | | | | | | | | | | | | | | | | | | | |
| | | Year Ended December 31, | |
| | | 2017 | | | | | | 2016 | |
| | | Shares | | | Amount | | | | | | Shares | | | Amount | |
| | | | | |
| Class 1 Shares: | | | | | | | | | | | | | | | | | | | | |
Shares sold | | | 214,758 | | | $ | 2,678,926 | | | | | | | | 351,919 | | | $ | 4,501,949 | |
Shares issued in reinvestment of distributions | | | 163,377 | | | | 2,011,168 | | | | | | | | 166,207 | | | | 2,105,837 | |
Shares redeemed | | | (896,031 | ) | | | (11,145,574 | ) | | | | | | | (876,092 | ) | | | (11,179,641 | ) |
| | | | |
Net increase (decrease) | | | (517,896 | ) | | $ | (6,455,480 | ) | | | | | | | (357,966 | ) | | $ | (4,571,855 | ) |
| | | | |
| Class 2 Shares: | | | | | | | | | | | | | | | | | | | | |
Shares sold | | | 7,795,899 | | | $ | 95,146,101 | | | | | | | | 17,880,837 | | | $ | 224,111,450 | |
Shares issued in reinvestment of distributions | | | 2,748,760 | | | | 33,122,555 | | | | | | | | 2,700,179 | | | | 33,509,223 | |
Shares redeemed | | | (12,993,385 | ) | | | (158,188,621 | ) | | | | | | | (22,088,516 | ) | | | (275,778,053 | ) |
| | | | |
Net increase (decrease) | | | (2,448,726 | ) | | $ | (29,919,965 | ) | | | | | | | (1,507,500 | ) | | $ | (18,157,380 | ) |
| | | | |
FRANKLIN TEMPLETON VARIABLE INSURANCE PRODUCTS TRUST
NOTES TO FINANCIAL STATEMENTS
Franklin U.S. Government Securities VIP Fund (continued)
3. Transactions with Affiliates
Franklin Resources, Inc. is the holding company for various subsidiaries that together are referred to as Franklin Templeton Investments. Certain officers and trustees of the Fund are also officers and/or directors of the following subsidiaries:
| | |
| Subsidiary | | Affiliation |
Franklin Advisers, Inc. (Advisers) | | Investment manager |
Franklin Templeton Services, LLC (FT Services) | | Administrative manager |
Franklin Templeton Distributors, Inc. (Distributors) | | Principal underwriter |
Franklin Templeton Investor Services, LLC (Investor Services) | | Transfer agent |
a. Management Fees
The Fund pays an investment management fee to Advisers based on the average daily net assets of the Fund as follows:
| | |
| Annualized Fee Rate | | Net Assets |
0.625% | | Up to and including $100 million |
0.500% | | Over $100 million, up to and including $250 million |
0.450% | | Over $250 million, up to and including $7.5 billion |
0.440% | | Over $7.5 billion, up to and including $10 billion |
0.430% | | Over $10 billion, up to and including $12.5 billion |
0.420% | | Over $12.5 billion, up to and including $15 billion |
0.400% | | In excess of $15 billion |
For the year ended December 31, 2017, the gross effective investment management fee rate was 0.469% of the Fund’s average daily net assets.
b. Administrative Fees
Under an agreement with Advisers, FT Services provides administrative services to the Fund. The fee is paid by Advisers based on the Fund’s average daily net assets, and is not an additional expense of the Fund.
c. Distribution Fees
The Board has adopted a distribution plan for Class 2 shares pursuant to Rule 12b-1 under the 1940 Act. Under the Fund’s compensation distribution plan, the Fund pays Distributors for costs incurred in connection with the servicing, sale and distribution of the Fund’s shares up to 0.35% per year of its average daily net assets. The Board has agreed to limit the current rate to 0.25% per year for Class 2. The plan year, for purposes of monitoring compliance with the maximum annual plan rate, is February 1 through January 31.
d. Transfer Agent Fees
Investor Services, under terms of an agreement, performs shareholder servicing for the Fund and is not paid by the Fund for the services.
4. Expense Offset Arrangement
The Fund has entered into an arrangement with its custodian whereby credits realized as a result of uninvested cash balances are used to reduce a portion of the Fund’s custodian expenses. During the year ended December 31, 2017, the custodian fees were reduced as noted in the Statement of Operations.
FRANKLIN TEMPLETON VARIABLE INSURANCE PRODUCTS TRUST
NOTES TO FINANCIAL STATEMENTS
Franklin U.S. Government Securities VIP Fund (continued)
5. Income Taxes
For tax purposes, capital losses may be carried over to offset future capital gains. Capital loss carryforwards with no expiration, if any, must be fully utilized before those losses with expiration dates.
At December 31, 2017, capital loss carryforwards were as follows:
| | | | |
Capital loss carryforwards subject to expiration: | | | | |
2018 | | $ | 426,637 | |
| |
Capital loss carryforwards not subject to expiration: | | | | |
Short term | | | 34,335,871 | |
Long term | | | 49,844,292 | |
| | | | |
Total capital loss carryforwards | | $ | 84,606,800 | |
| | | | |
On December 31, 2017, the Fund had expired capital loss carryforwards of $401,851, which were reclassified to paid-in capital.
The tax character of distributions paid during the years ended December 31, 2017 and 2016, was as follows:
| | | | | | | | |
| | | 2017 | | | 2016 | |
Distributions paid from ordinary income | | $ | 35,133,723 | | | $ | 35,615,060 | |
| | | | |
At December 31, 2017, the cost of investments, net unrealized appreciation (depreciation) and undistributed ordinary income for income tax purposes were as follows:
| | | | |
Cost of investments | | $ | 1,299,824,827 | |
| | | | |
Unrealized appreciation | | $ | 8,646,396 | |
Unrealized depreciation | | | (15,665,443 | ) |
| | | | |
Net unrealized appreciation (depreciation) | | $ | (7,019,047 | ) |
| | | | |
Distributable earnings - undistributed ordinary income | | $ | 33,512,566 | |
| | | | |
Differences between income and/or capital gains as determined on a book basis and a tax basis are primarily due to differing treatments of paydown losses and bond discounts and premiums.
6. Investment Transactions
Purchases and sales of investments (excluding short term securities) for the year ended December 31, 2017, aggregated $1,029,286,651 and $1,065,365,359, respectively.
7. Credit Facility
The Fund, together with other U.S. registered and foreign investment funds (collectively, Borrowers), managed by Franklin Templeton Investments, are borrowers in a joint syndicated senior unsecured credit facility totaling $2 billion (Global Credit Facility) which matured on February 9, 2018. This Global Credit Facility provides a source of funds to the Borrowers for temporary and emergency purposes, including the ability to meet future unanticipated or unusually large redemption requests. Effective February 9, 2018, the Borrowers renewed the Global Credit Facility for a one year term, maturing February 8, 2019, for a total of $2 billion.
FRANKLIN TEMPLETON VARIABLE INSURANCE PRODUCTS TRUST
NOTES TO FINANCIAL STATEMENTS
Franklin U.S. Government Securities VIP Fund (continued)
Under the terms of the Global Credit Facility, the Fund shall, in addition to interest charged on any borrowings made by the Fund and other costs incurred by the Fund, pay its share of fees and expenses incurred in connection with the implementation and maintenance of the Global Credit Facility, based upon its relative share of the aggregate net assets of all of the Borrowers, including an annual commitment fee of 0.15% based upon the unused portion of the Global Credit Facility. These fees are reflected in other expenses in the Statement of Operations. During the year ended December 31, 2017, the Fund did not use the Global Credit Facility.
8. Fair Value Measurements
The Fund follows a fair value hierarchy that distinguishes between market data obtained from independent sources (observable inputs) and the Fund’s own market assumptions (unobservable inputs). These inputs are used in determining the value of the Fund’s financial instruments and are summarized in the following fair value hierarchy:
| | • | | Level 1 – quoted prices in active markets for identical financial instruments |
| | • | | Level 2 – other significant observable inputs (including quoted prices for similar financial instruments, interest rates, prepayment speed, credit risk, etc.) |
| | • | | Level 3 – significant unobservable inputs (including the Fund’s own assumptions in determining the fair value of financial instruments) |
The input levels are not necessarily an indication of the risk or liquidity associated with financial instruments at that level.
For movements between the levels within the fair value hierarchy, the Fund has adopted a policy of recognizing the transfers as of the date of the underlying event which caused the movement.
At December 31, 2017, all of the Fund’s investments in financial instruments carried at fair value were valued using Level 2 inputs.
9. Subsequent Events
The Fund has evaluated subsequent events through the issuance of the financial statements and determined that no events have occurred that require disclosure other than those already disclosed in the financial statements.
Abbreviations
| | | | | | |
| Currency | | Selected Portfolio |
| | | |
| USD | | United States Dollar | | CMT | | Constant Maturity Treasury Index |
| | | |
| | | | COF | | Cost of Funds |
| | | |
| | | | FHLB | | Federal Home Loan Bank |
| | | |
| | | | FICO | | Financing Corp. |
| | | |
| | | | FRN | | Floating Rate Note |
| | | |
| | | | LIBOR | | London InterBank Offered Rate |
| | | |
| | | | MBS | | Mortgage-Backed Security |
| | | |
| | | | PC | | Participation Certificate |
| | | |
| | | | PL | | Project Loan |
| | | |
| | | | SBA | | Small Business Administration |
| | | |
| | | | SF | | Single Family |
| | | |
| | | | T-Note | | Treasury Note |
| | | |
| | | | TVA | | Tennessee Valley Authority |
FRANKLIN TEMPLETON VARIABLE INSURANCE PRODUCTS TRUST
Report of Independent Registered Public Accounting Firm
To the Board of Trustees of Franklin Templeton Variable Insurance Products Trust and Shareholders of Franklin U.S. Government Securities VIP Fund
Opinion on the Financial Statements
We have audited the accompanying statement of assets and liabilities, including the statement of investments, of Franklin U.S. Government Securities VIP Fund (the “Fund”) as of December 31, 2017, the related statement of operations for the year ended December 31, 2017, the statement of changes in net assets for each of the two years in the period ended December 31, 2017, including the related notes, and the financial highlights for each of the five years in the period ended December 31, 2017 (collectively referred to as the “financial statements”). In our opinion, the financial statements present fairly, in all material respects, the financial position of the Fund as of December 31, 2017, the results of its operations for the year then ended, the changes in its net assets for each of the two years in the period ended December 31, 2017 and the financial highlights for each of the five years in the period ended December 31, 2017 in conformity with accounting principles generally accepted in the United States of America.
Basis for Opinion
These financial statements are the responsibility of the Fund’s management. Our responsibility is to express an opinion on the Fund’s financial statements based on our audits. We are a public accounting firm registered with the Public Company Accounting Oversight Board (United States) (“PCAOB”) and are required to be independent with respect to the Fund in accordance with the U.S. federal securities laws and the applicable rules and regulations of the Securities and Exchange Commission and the PCAOB.
We conducted our audits of these financial statements in accordance with the standards of the PCAOB. Those standards require that we plan and perform the audit to obtain reasonable assurance about whether the financial statements are free of material misstatement, whether due to error or fraud.
Our audits included performing procedures to assess the risks of material misstatement of the financial statements, whether due to error or fraud, and performing procedures that respond to those risks. Such procedures included examining, on a test basis, evidence regarding the amounts and disclosures in the financial statements. Our audits also included evaluating the accounting principles used and significant estimates made by management, as well as evaluating the overall presentation of the financial statements. Our procedures included confirmation of securities owned as of December 31, 2017 by correspondence with the custodian and brokers; when replies were not received from brokers, we performed other auditing procedures. We believe that our audits provide a reasonable basis for our opinion.
PricewaterhouseCoopers LLP
San Francisco, California
February 15, 2018
We have served as the auditor of one or more investment companies in the Franklin Templeton Group of Funds since 1948.
Franklin VolSmart Allocation VIP Fund
This annual report for Franklin VolSmart Allocation VIP Fund covers the fiscal year ended December 31, 2017.
Class 2 Performance Summary as of December 31, 2017
Average annual total return of Class 2 shares* represents the average annual change in value, assuming reinvestment of dividends and capital gains. Average returns smooth out variations in returns, which can be significant; they are not the same as year-by-year results.
| | | | | | | | | | | | |
| Periods ended 12/31/17 | | 1-Year | | | 3-Year | | | Since Inception (4/1/13) | |
Average Annual Total Return | | | +15.54% | | | | +5.33% | | | | +4.66% | |
*Prior to 5/1/15, the Fund followed different investment strategies, had different subadvisory arrangements, allocated its core portfolio differently, had a different current target volatility goal and made different use of derivative instruments. As a result, the Fund generally held different investments and had a different investment profile. The Fund has an expense reduction and a fee waiver associated with any investments it makes in a Franklin Templeton money fund and/or other Franklin Templeton fund, contractually guaranteed through 4/30/18. Fund investment results reflect the expense reduction and fee waiver; without these reductions, the results would have been lower.
Performance reflects the Fund’s Class 2 operating expenses, but does not include any contract fees, expenses or sales charges. If they had been included, performance would be lower. These charges and deductions, particularly for variable life policies, can have a significant effect on contract values and insurance benefits. See the contract prospectus for a complete description of these expenses, including sales charges.
Performance data represent past performance, which does not guarantee future results. Investment return and principal value will fluctuate, and you may have a gain or loss when you sell your shares. Current performance may differ from figures shown.
Total Return Index Comparison for a Hypothetical $10,000 Investment (4/1/13–12/31/17)
The graph below shows the change in value of a hypothetical $10,000 investment in the Fund over the indicated period and includes reinvestment of any income or distributions. The Fund’s performance* is compared to the performance of the Standard & Poor’s® 500 Index (S&P 500®) and the Bloomberg Barclays US Aggregate Bond Index. One cannot invest directly in an index, and an index is not representative of the Fund’s portfolio. Please see Important Notes to Performance Information preceding the Fund Summaries.
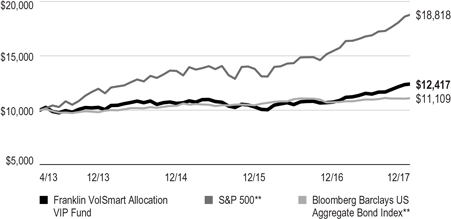
**Source: Morningstar. Please see Index Descriptions following the Fund Summaries.
FRANKLIN VOLSMART ALLOCATION VIP FUND
Fund Goal and Main Investments
The Fund seeks total return (including income and capital gains) while seeking to manage volatility.
Fund Risks
All investments involve risks, including possible loss of principal. There can be no guarantee that the Fund will stay within its target volatility. Also, the managed volatility and tail risk protection strategies could negatively impact the Fund’s return and expose the Fund to additional costs. Generally, investors should be comfortable with fluctuation in the value of their investments, especially over the short term. Stock prices fluctuate, sometimes rapidly and dramatically, due to factors affecting individual companies, particular industries or sectors, or general market conditions. Bond prices generally move in the opposite direction of interest rates. Changes in the financial strength of a bond issuer or in a bond’s credit rating may affect its value. Derivatives involve costs and can create economic leverage in the portfolio, which may result in significant volatility and cause the Fund to participate in losses on an amount that exceeds the Fund’s initial investment. The Fund may not achieve the anticipated benefits, and may realize losses when a counterparty fails to perform. Because the Fund allocates assets to a variety of investment strategies, ETFs and other mutual funds, which involve certain risks, it may be subject to those same risks. The Fund is actively managed but there is no guarantee that the manager’s investment decisions will produce the desired results. The Fund’s prospectus also includes a description of the main investment risks.
Performance Overview
You can find the Fund’s one-year total return in the Performance Summary. For comparison, the Fund’s benchmarks, the S&P 500 and the Bloomberg Barclays US Aggregate Bond Index, returned +21.83% and +3.54%, respectively, for the period under review.1 The Fund’s blended benchmark, a combination of leading stock and bond indexes that better reflects the asset allocation of the Fund’s portfolio, returned +13.94% for the same period.2
Economic and Market Overview
The US economy grew during the 12 months under review. After strengthening in 2017’s second and third quarters, the economy moderated in the fourth quarter. The economy grew faster in 2017 than in 2016, however, largely due to growth in consumer spending, business investment and exports. The manufacturing and services sectors expanded during the period. The unemployment rate declined from 4.7% in December 2016 to 4.1% at period-end.3 Monthly retail sales were volatile but positive on average during the period. Annual inflation, as measured by the Consumer Price Index, was 2.1% in December 2016, and while it varied over the 12-month period, remained unchanged at period-end.3
The US Federal Reserve (Fed) raised its target range for the federal funds rate 0.25% at its March and June 2017 meetings, amid signs of a growing US economy, strengthening labor market and improving business spending. At its December meeting, the Fed raised its target range for the federal funds rate 0.25% to 1.25%–1.50%, as widely anticipated by the market. The Fed also confirmed that the monthly balance sheet reduction would increase from $10 billion to $20 billion beginning in January 2018.
US equity markets rose during the 12-month period, benefiting from mostly upbeat economic data, better US corporate earnings and improving global economic growth. Concerns about the terms of the UK’s exit from the European Union (EU), political uncertainty in the US, tensions between the US and North Korea, and the progress of US health care and tax reform plans curbed market sentiment at times. However, the markets were also supported by investor optimism arising from pro-growth and pro-business policy plans in the US, the prospect for reforms in the EU with Emmanuel Macron’s election as France’s president, and the US Fed chair’s comments indicating optimism about the US economy and the likelihood of gradual rate hikes. Furthermore, the Senate’s approval of a budget plan in October and subsequent passage of a tax reform bill near period-end drove many US equity indexes to end 2017 near record highs. In this environment, the broad US stock market, as measured by the S&P 500, generated a +21.83% total return for the period.1
1. Source: Morningstar.
2. The Fund’s blended benchmark was calculated internally and rebalanced monthly and was composed of 60% S&P 500, 30% Bloomberg Barclays US Aggregate Bond Index and 10% Bloomberg Barclays 1-3 Month US Treasury Bill Index.
One cannot invest directly in an index, and an index is not representative of the Fund’s portfolio. Please see Index Descriptions following the Fund Summaries.
3. Source: Bureau of Labor Statistics.
The dollar value, number of shares or principal amount, and names of all portfolio holdings are listed in the Fund’s Statement of Investments (SOI).
FRANKLIN VOLSMART ALLOCATION VIP FUND
The 10-year Treasury yield, which moves inversely to its price, shifted throughout the period. The yield rose in June amid renewed optimism for improvement in economic growth and was supported in July by hawkish comments from key central bankers around the world. Easing concerns about Hurricane Irma’s economic impact, the Fed’s balance sheet normalization beginning in October and strong economic data also pushed the yield higher. However, several factors weighed on the Treasury yield at certain points during the period, including tensions between the US and North Korea; uncertainty on whether the Fed would raise rates in December 2017; and the appointment of Jerome Powell, viewed as more dovish than other contenders, as the next Fed chair. Near period-end, the Senate’s approval of a budget plan and the subsequent passage of the tax bill drove the yield higher. Overall, the 10-year Treasury yield declined from 2.45% at the beginning of the period to 2.40% at period-end.
Investment Strategy
Under normal market conditions, the Fund seeks to achieve its investment goal by allocating its assets across certain asset classes, sectors and strategies in an attempt to produce a diversified portfolio that will generate returns while minimizing the expected volatility of the Fund’s returns so that volatility does not exceed a target of 10% per year. (Volatility within the 10% target is referred to as “Target Volatility.”) The Fund’s assets are primarily invested in its “core portfolio,” which is principally composed of various US equity and fixed income investments and strategies, including other mutual funds that provide exposure to such investments and strategies.
In addition, the Fund employs a volatility management strategy, which is designed to manage the expected volatility of the Fund’s returns so that volatility remains within the Fund’s Target Volatility. Thus, the Fund may utilize certain derivative instruments (primarily futures contracts on indexes) in an effort to adjust the Fund’s expected volatility to within the Target Volatility. There is no guarantee that the Fund will stay within its Target Volatility. The Fund also employs a “tail risk protection strategy,” designed to protect the Fund from risks related to extreme short-term market downturns (tail risk). Thus, the Fund may utilize certain derivatives (primarily total return swap agreements) in an effort to hedge the tail risk of the Fund. There is no guarantee that the Fund’s volatility management or tail risk protection strategies will be successful.
| | | | |
| Portfolio Composition* | | | |
| 12/31/17 | | | |
| | | % of Total
Net Assets | |
| Stocks | | | 50.6% | |
| Capital Goods | | | 10.5% | |
| Health Care Equipment & Services | | | 6.6% | |
| Materials | | | 6.2% | |
| Software & Services | | | 4.7% | |
| Energy | | | 3.1% | |
| Semiconductors & Semiconductor Equipment | | | 3.0% | |
| Food, Beverage & Tobacco | | | 2.7% | |
| Pharmaceuticals, Biotechnology & Life Sciences | | | 2.4% | |
| Retailing | | | 2.2% | |
| Food & Staples Retailing | | | 1.7% | |
| Household & Personal Products | | | 1.5% | |
| Consumer Services | | | 1.2% | |
| Consumer Durables & Apparel | | | 1.1% | |
| Media | | | 1.0% | |
| Commercial & Professional Services | | | 1.0% | |
| Insurance | | | 0.9% | |
| Transportation | | | 0.6% | |
| Diversified Financials | | | 0.2% | |
| Underlying Funds - Equity | | | 20.0% | |
| Franklin DynaTech Fund – Class R6 | | | 9.8% | |
| Franklin Income Fund – Class R6 | | | 5.8% | |
| iShares Core MSCI EAFE ETF | | | 4.4% | |
| Underlying Funds - Fixed Income | | | 25.8% | |
| Franklin Low Duration Total Return Fund – Class R6 | | | 12.1% | |
| Franklin Strategic Income Fund – Class R6 | | | 10.0% | |
| Franklin Income Fund – Class R6 | | | 3.7% | |
| Hedge Strategy | | | 1.8% | |
| Short-Term Investments & Other Net Assets | | | 1.8% | |
*Figures are stated as a percentage of total and may not equal 100% or may be negative due to rounding, use of any derivatives, unsettled trades or other factors. The breakdown may not match the SOI.
What is a futures contract?
A futures contract is an agreement between the Fund and a counterparty made through a US or foreign futures exchange to buy or sell an underlying instrument or asset at a specific price on a future date.
FRANKLIN VOLSMART ALLOCATION VIP FUND
What is a total return swap agreement?
A swap agreement, such as an equity total return swap, is a contract between the Fund and a counterparty to exchange on a future date the returns, or differentials in rates of return, that would have been earned or realized if a notional amount were invested in specific instruments.
Manager’s Discussion
At the end of the 12-month period, at the asset allocation level, the Fund held roughly 70% in equities, 26% in fixed income and 4% in cash. In comparison, the Fund’s blended benchmark was composed of 60% equities, 30% fixed income and 10% cash.2
Equities
During the calendar year, the Fund’s underlying equity allocation outpaced its underlying index, the S&P 500. The Fund’s largest allocation was to US equities. Our favorable view and overweighting to the asset class was rewarded as US equity indexes posted a banner year in 2017. Our positive assessment reflected synchronized global economic growth, modest inflation and supportive liquidity conditions. Corporate indicators were also positive, with rising earnings-per-share growth and strong profit margins. Fund selection in the equity component benefited relative results, largely due to robust returns for technology-focused Franklin DynaTech Fund. The information technology (IT) sector enjoyed a prolonged rally for most of 2017 as strong earnings reports generally exceeded expectations.
From an equity sector perspective, materials and health care holdings strengthened relative returns. In contrast, positioning in consumer staples, including select food products holdings, and a structural sector underweighting in IT (outside of the technology-focused strategy) dampened relative results.
Fixed Income
Fixed income helped overall relative fund performance, largely due to an underweighted allocation relative to the Fund’s blended benchmark. However, the fixed income component’s returns matched its benchmark index, the Bloomberg Barclays US Aggregate Bond Index, during the review period. We held a cautious view of US and developed-market sovereign debt as we found valuations expensive, particularly in the eurozone, where term premiums were the lowest among government bonds. Improving global growth with inflation trending higher also warranted lower exposure to government bonds, from our perspective.
| | | | |
| Portfolio Strategy Holdings* | | | |
| 12/31/17 | | | |
| | | % of Total
Net Assets | |
| Franklin Rising Dividends Strategy | | | 50.6% | |
| Franklin Low Duration Total Return Fund | | | 12.1% | |
| Franklin Strategic Income Fund | | | 10.0% | |
| Franklin DynaTech Fund | | | 9.8% | |
| Franklin Income Fund | | | 9.5% | |
| iShares Core MSCI EAFE ETF | | | 4.4% | |
| Hedge Strategy | | | 1.8% | |
| Short-Term Investments & Other Net Assets | | | 1.8% | |
*The breakdown may not match the SOI.
Relative returns were mixed for the three underlying bond strategies. High-yield bonds delivered healthy results for the review period, and Franklin Strategic Income Fund and Franklin Income Fund both held a significant weighting in the sector. Attractive yields relative to fixed income sectors and 12-month trailing default rates that have declined since 2016 supported our rationale for holding high-yield bonds in 2017. Both strategies performed well during the review period as their holdings in spread sectors enabled them to outperform the fixed income benchmark. Conversely, Franklin Low Duration Total Return Fund weighed on relative performance, as its short-term maturity profile led to underperformance relative to the longer dated fixed income benchmark.
Hedging
During 2017, global equities reached meaningfully high price-to-earnings ratios and exhibited unusually low volatility, which suggests to us a level of investor complacency. Unusually low and protracted stock market volatility has persisted for some time, but we view this as a trend that we believe will eventually—and significantly—revert. Neither of the Fund’s volatility hedging strategies were meaningfully active during the review period.
Thank you for your participation in Franklin VolSmart Allocation VIP Fund. We look forward to serving your future investment needs.
FRANKLIN VOLSMART ALLOCATION VIP FUND
The foregoing information reflects our analysis, opinions and portfolio holdings as of December 31, 2017, the end of the reporting period. The way we implement our main investment strategies and the resulting portfolio holdings may change depending on factors such as market and economic conditions. These opinions may not be relied upon as investment advice or an offer for a particular security. The information is not a complete analysis of every aspect of any market, country, industry, security or the Fund. Statements of fact are from sources considered reliable, but the investment manager makes no representation or warranty as to their completeness or accuracy. Although historical performance is no guarantee of future results, these insights may help you understand our investment management philosophy.
FRANKLIN VOLSMART ALLOCATION VIP FUND
Class 2 Fund Expenses
As an investor in a variable insurance contract (Contract) that indirectly provides for investment in an underlying mutual fund, you can incur transaction and/or ongoing expenses at both the Fund level and the Contract Level: (1) transaction expenses can include sales charges (loads) on purchases, surrender fees, transfer fees and premium taxes; and (2) ongoing expenses can include management fees, distribution and service (12b-1) fees, contract fees, annual maintenance fees, mortality and expense risk fees and other fees and expenses. All mutual funds and Contracts have some types of ongoing expenses. The table below shows Fund-level ongoing expenses and can help you understand these costs and compare them with those of other mutual funds offered through the Contract. The table assumes a $1,000 investment held for the six months indicated. Please refer to the Fund prospectus for additional information on operating expenses.
Actual Fund Expenses
The table below provides information about the actual account values and actual expenses in the columns under the heading “Actual.” In these columns the Fund’s actual return, which includes the effect of ongoing Fund expenses but does not include the effect of ongoing Contract expenses, is used to calculate the “Ending Account Value.” You can estimate the Fund-level expenses you paid during the period by following these steps (of course, your account value and expenses will differ from those in this illustration): Divide your account value by $1,000 (if your account had an $8,600 value, then $8,600 ÷ $1,000 = 8.6). Then multiply the result by the number under the headings “Actual” and “Fund-Level Expenses Paid During Period” (if Fund-Level Expenses Paid During Period were $ 7.50, then 8.6 x $7.50 = $64.50). In this illustration, the estimated expenses paid this period at the Fund level are $64.50.
Hypothetical Example for Comparison with Other Mutual Funds
Under the heading “Hypothetical” in the table, information is provided about hypothetical account values and hypothetical expenses based on the Fund’s actual expense ratio and an assumed rate of return of 5% per year before expenses, which is not the Fund’s actual return. This information may not be used to estimate the actual ending account balance or expenses you paid for the period, but it can help you compare ongoing costs of investing in the Fund with those of other mutual funds offered through the Contract. To do so, compare this 5% hypothetical example with the 5% hypothetical examples that appear in the shareholder reports of other funds offered through the Contract.
Please note that expenses shown in the table are meant to highlight ongoing costs at the Fund level only and do not reflect any ongoing expenses at the Contract level, or transaction expenses at either the Fund or Contract levels. In addition, while the Fund does not have transaction expenses, if the transaction and ongoing expenses at the Contract level were included, the expenses shown below would be higher. You should consult your Contract prospectus or disclosure document for more information.
| | | | | | | | | | | | | | | | | | | | | | | | |
| | | | | | Actual
(actual return after expenses) | | | Hypothetical
(5% annual return before expenses) | | | | |
Share
Class | | Beginning Account
Value 7/1/17 | | | Ending Account
Value 12/31/17 | | | Fund-Level Expenses
Paid During Period
7/1/17–12/31/171,2 | | | Ending Account
Value 12/31/17 | | | Fund-Level Expenses
Paid During Period
7/1/17–12/31/171,2 | | | Net
Annualized
Expense
Ratio2 | |
Class 2 | | $ | 1,000 | | | $ | 1,081.60 | | | $ | 3.88 | | | $ | 1,021.48 | | | $ | 3.77 | | | | 0.74 | % |
1. Expenses are equal to the annualized expense ratio for the six-month period as indicated above – in the far right column – multiplied by the simple average account value over the period indicated, and then multiplied by 184/365 to reflect the one-half year period.
2. Reflects expenses after fee waivers and expense reimbursements. Does not include any ongoing expenses of the Contract for which the Fund is an investment option or acquired fund fees and expenses.
FRANKLIN TEMPLETON VARIABLE INSURANCE PRODUCTS TRUST
Financial Highlights
Franklin VolSmart Allocation VIP Fund
| | | | | | | | | | | | | | | | | | | | |
| | | Year Ended December 31, | |
| | | 2017 | | | 2016 | | | 2015 | | | 2014 | | | 2013a | |
| Class 2 | | | | | | | | | | | | | | | | | | | | |
Per share operating performance
(for a share outstanding throughout the year) | | | | | | | | | | | | | | | | | | | | |
| | | | | |
Net asset value, beginning of year | | | $10.10 | | | | $9.68 | | | | $10.20 | | | | $10.07 | | | | $10.00 | |
| | | | |
| | | | | |
| Income from investment operationsb: | | | | | | | | | | | | | | | | | | | | |
| | | | | |
Net investment incomec,d | | | 0.16 | | | | 0.16 | | | | 0.10 | | | | 0.11 | | | | 0.09 | |
| | | | | |
Net realized and unrealized gains (losses) | | | 1.41 | | | | 0.28 | | | | (0.42 | ) | | | 0.25 | | | | 0.17 | |
| | | | |
Total from investment operations | | | 1.57 | | | | 0.44 | | | | (0.32 | ) | | | 0.36 | | | | 0.26 | |
| | | | |
| | | | | |
| Less distributions from: | | | | | | | | | | | | | | | | | | | | |
| | | | | |
Net investment income and net foreign currency gains | | | — | | | | (— | )e | | | (0.05 | ) | | | (0.23 | ) | | | (0.19 | ) |
| | | | | |
Net realized gains | | | — | | | | (0.02 | ) | | | (0.15 | ) | | | (— | )e | | | — | |
| | | | |
Total distributions | | | — | | | | (0.02 | ) | | | (0.20 | ) | | | (0.23 | ) | | | (0.19 | ) |
| | | | |
Net asset value, end of year | | | $11.67 | | | | $10.10 | | | | $9.68 | | | | $10.20 | | | | $10.07 | |
| | | | |
| | | | | |
Total returnf | | | 15.54% | | | | 4.39% | | | | (3.12)% | | | | 3.60% | | | | 2.56% | |
| | | | | |
| Ratios to average net assetsg | | | | | | | | | | | | | | | | | | | | |
| | | | | |
Expenses before waiver and payments by affiliatesh | | | 1.14% | | | | 1.25% | | | | 1.77% | | | | 1.97% | | | | 2.97% | |
| | | | | |
Expenses net of waiver and payments by affiliatesh | | | 0.73% | i | | | 0.73% | i | | | 0.93% | | | | 1.08% | i | | | 1.08% | i |
| | | | | |
Net investment incomed | | | 1.44% | | | | 1.50% | | | | 1.30% | | | | 1.07% | | | | 1.21% | |
| | | | | |
| Supplemental data | | | | | | | | | | | | | | | | | | | | |
| | | | | |
Net assets, end of year (000’s) | | | $36 | | | | $31 | | | | $8,703 | | | | $10,201 | | | | $10,065 | |
| | | | | |
Portfolio turnover rate | | | 5.69% | | | | 1.00% | | | | 95.15% | | | | 22.04% | | | | 8.12% | |
aFor the period April 1, 2013 (commencement of operations) to December 31, 2013.
bThe amount shown for a share outstanding throughout the period may not correlate with the Statement of Operations for the period due to the timing of sales and repurchases of the Fund’s shares in relation to income earned and/or fluctuating fair value of the investments of the Fund.
cBased on average daily shares outstanding.
dRecognition of net investment income by the Fund is affected by the timing of declaration of dividends by the Underlying Funds and exchange traded funds in which the Fund invests.
eAmount rounds to less than $0.01 per share.
fTotal return does not include fees, charges or expenses imposed by the variable annuity and life insurance contracts for which Franklin Templeton Variable Insurance Products Trust serves as an underlying investment vehicle. Total return is not annualized for periods less than one year.
gRatios are annualized for periods less than one year.
hDoes not include expenses of the Underlying Funds and exchange traded funds in which the Fund invests. The weighted average indirect expenses of the Underlying Funds and exchange traded funds was 0.20% for the year ended December 31, 2017.
iBenefit of expense reduction rounds to less than 0.01%.
| | | | | | |
| | | The accompanying notes are an integral part of these financial statements. | Annual Report | | | FVA-7 | |
FRANKLIN TEMPLETON VARIABLE INSURANCE PRODUCTS TRUST
FINANCIAL HIGHLIGHTS
Franklin VolSmart Allocation VIP Fund (continued)
| | | | | | | | | | | | | | | | | | | | |
| | | Year Ended December 31, | |
| | | 2017 | | | 2016 | | | 2015 | | | 2014 | | | 2013a | |
| Class 5 | | | | | | | | | | | | | | | | | | | | |
Per share operating performance
(for a share outstanding throughout the year) | | | | | | | | | | | | | | | | | | | | |
| | | | | |
Net asset value, beginning of year | | | $10.07 | | | | $9.67 | | | | $10.20 | | | | $10.07 | | | | $10.00 | |
| | | | |
| | | | | |
| Income from investment operationsb: | | | | | | | | | | | | | | | | | | | | |
| | | | | |
Net investment incomec,d | | | 0.17 | | | | 0.16 | | | | 0.16 | | | | 0.13 | | | | 0.10 | |
| | | | | |
Net realized and unrealized gains (losses) | | | 1.41 | | | | 0.29 | | | | (0.47 | ) | | | 0.25 | | | | 0.17 | |
| | | | |
Total from investment operations | | | 1.58 | | | | 0.45 | | | | (0.31 | ) | | | 0.38 | | | | 0.27 | |
| | | | |
| | | | | |
| Less distributions from: | | | | | | | | | | | | | | | | | | | | |
| | | | | |
Net investment income and net foreign currency gains | | | — | | | | (0.03 | ) | | | (0.07 | ) | | | (0.25 | ) | | | (0.20 | ) |
| | | | | |
Net realized gains | | | — | | | | (0.02 | ) | | | (0.15 | ) | | | (— | )e | | | — | |
| | | | |
Total distributions | | | — | | | | (0.05 | ) | | | (0.22 | ) | | | (0.25 | ) | | | (0.20 | ) |
| | | | |
Net asset value, end of year. | | | $11.65 | | | | $10.07 | | | | $9.67 | | | | $10.20 | | | | $10.07 | |
| | | | |
| | | | | |
Total returnf | | | 15.69% | | | | 4.59% | | | | (3.10)% | | | | 3.75% | | | | 2.68% | |
| | | | | |
| Ratios to average net assetsg | | | | | | | | | | | | | | | | | | | | |
| | | | | |
Expenses before waiver and payments by affiliatesh | | | 1.04% | | | | 1.15% | | | | 1.66% | | | | 1.82% | | | | 2.82% | |
| | | | | |
Expenses net of waiver and payments by affiliatesh | | | 0.63% | i | | | 0.63% | i | | | 0.82% | | | | 0.93% | i | | | 0.93% | i |
| | | | | |
Net investment incomed | | | 1.54% | | | | 1.60% | | | | 1.41% | | | | 1.22% | | | | 1.36% | |
| | | | | |
| Supplemental data | | | | | | | | | | | | | | | | | | | | |
| | | | | |
Net assets, end of year (000’s) | | | $188,240 | | | | $124,581 | | | | $54,816 | | | | $10,201 | | | | $10,065 | |
| | | | | |
Portfolio turnover rate | | | 5.69% | | | | 1.00% | | | | 95.15% | | | | 22.04% | | | | 8.12% | |
aFor the period April 1, 2013 (commencement of operations) to December 31, 2013.
bThe amount shown for a share outstanding throughout the period may not correlate with the Statement of Operations for the period due to the timing of sales and repurchases of the Fund’s shares in relation to income earned and/or fluctuating fair value of the investments of the Fund.
cBased on average daily shares outstanding.
dRecognition of net investment income by the Fund is affected by the timing of declaration of dividends by the Underlying Funds and exchange traded funds in which the Fund invests.
eAmount rounds to less than $0.01 per share.
fTotal return does not include fees, charges or expenses imposed by the variable annuity and life insurance contracts for which Franklin Templeton Variable Insurance Products Trust serves as an underlying investment vehicle. Total return is not annualized for periods less than one year.
gRatios are annualized for periods less than one year.
hDoes not include expenses of the Underlying Funds and exchange traded funds in which the Fund invests. The weighted average indirect expenses of the Underlying Funds and exchange traded funds was 0.20% for the year ended December 31, 2017.
iBenefit of expense reduction rounds to less than 0.01%.
| | | | |
| FVA-8 | | Annual Report | The accompanying notes are an integral part of these financial statements. | | |
FRANKLIN TEMPLETON VARIABLE INSURANCE PRODUCTS TRUST
Statement of Investments, December 31, 2017
| | | | | | | | | | |
Franklin VolSmart Allocation VIP Fund | |
| | | | | Shares | | | Value | |
| | | Common Stocks 50.6% | | | | | | |
| | | Capital Goods 10.5% | | | | | | |
| | Carlisle Cos. Inc. | | | 7,460 | | | $ | 847,829 | |
| | Donaldson Co. Inc. | | | 13,830 | | | | 676,978 | |
| | Dover Corp. | | | 23,600 | | | | 2,383,364 | |
| | General Dynamics Corp. | | | 11,000 | | | | 2,237,950 | |
| | Honeywell International Inc. | | | 20,900 | | | | 3,205,224 | |
| | Johnson Controls International PLC | | | 40,092 | | | | 1,527,906 | |
| | Pentair PLC (United Kingdom) | | | 27,100 | | | | 1,913,802 | |
| | Roper Technologies Inc. | | | 16,900 | | | | 4,377,100 | |
| | United Technologies Corp. | | | 15,500 | | | | 1,977,335 | |
| | W.W. Grainger Inc. | | | 2,750 | | | | 649,688 | |
| | | | | | | | | | |
| | | | | | | | | 19,797,176 | |
| | | | | | | | | | |
| | | Commercial & Professional Services 1.0% | | | | | | |
| | Cintas Corp. | | | 7,700 | | | | 1,199,891 | |
| | Matthews International Corp., A | | | 11,870 | | | | 626,736 | |
| | | | | | | | | | |
| | | | | | | | | 1,826,627 | |
| | | | | | | | | | |
| | | Consumer Durables & Apparel 1.1% | | | | | | |
| | Leggett & Platt Inc. | | | 9,590 | | | | 457,731 | |
| | NIKE Inc., B | | | 24,400 | | | | 1,526,220 | |
| | | | | | | | | | |
| | | | | | | | | 1,983,951 | |
| | | | | | | | | | |
| | | Consumer Services 1.2% | | | | | | |
| | McDonald’s Corp. | | | 9,380 | | | | 1,614,486 | |
| | Yum! Brands Inc. | | | 7,700 | | | | 628,397 | |
| | | | | | | | | | |
| | | | | | | | | 2,242,883 | |
| | | | | | | | | | |
| | | Diversified Financials 0.2% | | | | | | |
| | State Street Corp. | | | 3,750 | | | | 366,038 | |
| | | | | | | | | | |
| | | Energy 3.1% | | | | | | |
| | Chevron Corp. | | | 10,590 | | | | 1,325,762 | |
| | EOG Resources Inc. | | | 5,730 | | | | 618,324 | |
| | Exxon Mobil Corp. | | | 14,800 | | | | 1,237,872 | |
| | Occidental Petroleum Corp. | | | 16,600 | | | | 1,222,756 | |
| | Schlumberger Ltd. | | | 21,300 | | | | 1,435,407 | |
| | | | | | | | | | |
| | | | | | | | | 5,840,121 | |
| | | | | | | | | | |
| | | Food & Staples Retailing 1.7% | | | | | | |
| | CVS Health Corp. | | | 12,550 | | | | 909,875 | |
| | Walgreens Boots Alliance Inc. | | | 14,300 | | | | 1,038,466 | |
| | Wal-Mart Stores Inc. | | | 13,390 | | | | 1,322,263 | |
| | | | | | | | | | |
| | | | | | | | | 3,270,604 | |
| | | | | | | | | | |
| | | Food, Beverage & Tobacco 2.7% | | | | | | |
| | Archer-Daniels-Midland Co. | | | 24,200 | | | | 969,936 | |
| | Bunge Ltd. | | | 19,100 | | | | 1,281,228 | |
| | McCormick & Co. Inc. | | | 10,750 | | | | 1,095,532 | |
| | PepsiCo Inc. | | | 14,300 | | | | 1,714,856 | |
| | | | | | | | | | |
| | | | | | | | | 5,061,552 | |
| | | | | | | | | | |
| | | Health Care Equipment & Services 6.6% | | | | | | |
| | Abbott Laboratories | | | 27,960 | | | | 1,595,677 | |
| | Becton, Dickinson and Co. | | | 13,900 | | | | 2,975,434 | |
| | DENTSPLY SIRONA Inc. | | | 13,000 | | | | 855,790 | |
| | Medtronic PLC | | | 29,600 | | | | 2,390,200 | |
FRANKLIN TEMPLETON VARIABLE INSURANCE PRODUCTS TRUST
STATEMENT OF INVESTMENTS
Franklin VolSmart Allocation VIP Fund (continued)
| | | | | | | | | | |
| | | | | Shares | | | Value | |
| | | Common Stocks (continued) | | | | | | |
| | | Health Care Equipment & Services (continued) | | | | | | |
| | Stryker Corp. | | | 19,600 | | | $ | 3,034,864 | |
| | West Pharmaceutical Services Inc. | | | 14,900 | | | | 1,470,183 | |
| | | | | | | | | | |
| | | | | | | | | 12,322,148 | |
| | | | | | | | | | |
| | | Household & Personal Products 1.5% | | | | | | |
| | Colgate-Palmolive Co. | | | 18,300 | | | | 1,380,735 | |
| | The Procter & Gamble Co. | | | 16,280 | | | | 1,495,806 | |
| | | | | | | | | | |
| | | | | | | | | 2,876,541 | |
| | | | | | | | | | |
| | | Insurance 0.9% | | | | | | |
| | Aflac Inc. | | | 9,120 | | | | 800,554 | |
| | Chubb Ltd. | | | 3,981 | | | | 581,743 | |
| | Erie Indemnity Co., A | | | 2,720 | | | | 331,405 | |
| | | | | | | | | | |
| | | | | | | | | 1,713,702 | |
| | | | | | | | | | |
| | | Materials 6.2% | | | | | | |
| | Air Products and Chemicals Inc. | | | 16,100 | | | | 2,641,688 | |
| | Albemarle Corp. | | | 33,300 | | | | 4,258,737 | |
| | Ecolab Inc. | | | 7,660 | | | | 1,027,819 | |
| | Nucor Corp | | | 12,200 | | | | 775,676 | |
| | Praxair Inc. | | | 18,800 | | | | 2,907,984 | |
| | | | | | | | | | |
| | | | | | | | | 11,611,904 | |
| | | | | | | | | | |
| | | Media 1.0% | | | | | | |
| | Comcast Corp., A | | | 24,400 | | | | 977,220 | |
| | John Wiley & Sons Inc., A | | | 14,600 | | | | 959,950 | |
| | | | | | | | | | |
| | | | | | | | | 1,937,170 | |
| | | | | | | | | | |
| | | Pharmaceuticals, Biotechnology & Life Sciences 2.4% | | | | | | |
| | AbbVie Inc. | | | 9,040 | | | | 874,259 | |
| | Johnson & Johnson | | | 17,000 | | | | 2,375,240 | |
| | Perrigo Co. PLC | | | 6,040 | | | | 526,446 | |
| | Pfizer Inc. | | | 13,410 | | | | 485,710 | |
| | Roche Holding AG, ADR (Switzerland) | | | 7,500 | | | | 236,850 | |
| | | | | | | | | | |
| | | | | | | | | 4,498,505 | |
| | | | | | | | | | |
| | | Retailing 2.2% | | | | | | |
| | The Gap Inc. | | | 15,720 | | | | 535,423 | |
| | Ross Stores Inc. | | | 22,600 | | | | 1,813,650 | |
| | Target Corp. | | | 13,240 | | | | 863,910 | |
| | Tiffany & Co. | | | 8,800 | | | | 914,760 | |
| | | | | | | | | | |
| | | | | | | | | 4,127,743 | |
| | | | | | | | | | |
| | | Semiconductors & Semiconductor Equipment 3.0% | | | | | | |
| | Analog Devices Inc. | | | 28,214 | | | | 2,511,892 | |
| | Texas Instruments Inc. | | | 28,700 | | | | 2,997,428 | |
| | Versum Materials Inc. | | | 5,495 | | | | 207,986 | |
| | | | | | | | | | |
| | | | | | | | | 5,717,306 | |
| | | | | | | | | | |
| | | Software & Services 4.7% | | | | | | |
| | Accenture PLC, A | | | 20,400 | | | | 3,123,036 | |
| | Microsoft Corp. | | | 52,300 | | | | 4,473,742 | |
| | Visa Inc., A | | | 11,200 | | | | 1,277,024 | |
| | | | | | | | | | |
| | | | | | | | | 8,873,802 | |
| | | | | | | | | | |
FRANKLIN TEMPLETON VARIABLE INSURANCE PRODUCTS TRUST
STATEMENT OF INVESTMENTS
Franklin VolSmart Allocation VIP Fund (continued)
| | | | | | | | | | |
| | | | | Shares | | | Value | |
| | | Common Stocks (continued) | | | | | | |
| | | Transportation 0.6% | | | | | | |
| | United Parcel Service Inc., B | | | 10,000 | | | $ | 1,191,500 | |
| | | | | | | | | | |
| | Total Common Stocks (Cost $76,185,477) | | | | | | | 95,259,273 | |
| | | | | | | | | | |
| | Investments in Underlying Funds and Exchange Traded Funds 45.8% | | | | | | | | |
| | | Domestic Equity 9.8% | | | | | | |
| a,b | | Franklin DynaTech Fund, Class R6 | | | 272,141 | | | | 18,437,573 | |
| | | | | | | | | | |
| | | Domestic Fixed Income 22.1% | | | | | | |
| b | | Franklin Low Duration Total Return Fund, Class R6 | | | 2,325,396 | | | | 22,835,389 | |
| b | | Franklin Strategic Income Fund, Class R6 | | | 1,907,939 | | | | 18,793,197 | |
| | | | | | | | | | |
| | | | | | | | | 41,628,586 | |
| | | | | | | | | | |
| | | Domestic Hybrid 9.5% | | | | | | |
| b | | Franklin Income Fund, Class R6 | | | 7,571,482 | | | | 17,868,696 | |
| | | | | | | | | | |
| | | Foreign Equity 4.4% | | | | | | |
| | iShares Core MSCI EAFE ETF | | | 125,600 | | | | 8,300,904 | |
| | | | | | | | | | |
| | Total Investments in Underlying Funds and Exchange Traded Funds (Cost $79,714,479) | | | | | | | 86,235,759 | |
| | | | | | | | | | |
| | Total Investments before Short Term Investments (Cost $155,899,956) | | | | | | | 181,495,032 | |
| | | | | | | | | | |
| | Short Term Investments (Cost $6,861,620) 3.6% | | | | | | | | |
| | | Money Market Funds 3.6% | | | | | | |
| b,c | | Institutional Fiduciary Trust Money Market Portfolio, 0.89% | | | 6,861,620 | | | | 6,861,620 | |
| | | | | | | | | | |
| | Total Investments (Cost $162,761,576) 100.0% | | | | | | | 188,356,652 | |
| | | | | | | | | | |
| | Other Assets, less Liabilities (0.0)%† | | | | | | | (80,852 | ) |
| | | | | | | | | | |
| | Net Assets 100.0% | | | | | | $ | 188,275,800 | |
| | | | | | | | | | |
†Rounds to less than 0.1% of net assets.
aNon-income producing.
bSee Note 3(e) regarding investments in Underlying Funds.
cThe rate shown is the annualized seven-day yield at period end.
At December 31, 2017, the Fund had the following total return swap contracts outstanding. See Note 1(c).
| | | | | | | | | | | | | | | | | | | | | | | | |
| Total Return Swap Contracts | |
| Underlying Instruments | | Financing
Rate | | | Payment
Frequency | | | Counterparty | | | Maturity
Date | | | Notional
Value | | | Value/
Unrealized
Appreciation
(Depreciation) | |
| OTC Swap Contracts | | | | | | | | | | | | | | | | | | | | | | | | |
| Longa | | | | | | | | | | | | | | | | | | | | | | | | |
Dynamic VIX Backwardation (BEFSDVB1) | | | 0.25 | % | | | Monthly | | | | BZWS | | | | 5/25/18 | | | $ | 34,100,000 | | | $ | (3,164 | ) |
| | | | | | | | | | | | | | | | | | | | | | | | |
aThe Fund receives the total return on the underlying instrument and pays a financing rate.
See Abbreviations on page FVA-23.
| | | | | | |
| | | The accompanying notes are an integral part of these financial statements. | Annual Report | | | FVA-11 | |
FRANKLIN TEMPLETON VARIABLE INSURANCE PRODUCTS TRUST
Financial Statements
Statement of Assets and Liabilities
December 31, 2017
| | | | |
| | | Franklin VolSmart
Allocation VIP
Fund | |
Assets: | | | | |
Investments in securities: | | | | |
Cost - Unaffiliated issuers | | $ | 83,867,508 | |
Cost - Non-controlled affiliates (Note 3e) | | | 78,894,068 | |
| | | | |
Value - Unaffiliated issuers | | $ | 103,560,177 | |
Value - Non-controlled affiliates (Note 3e) | | | 84,796,475 | |
Receivables: | | | | |
Capital shares sold | | | 14,671 | |
Dividends | | | 136,862 | |
Other assets | | | 14 | |
| | | | |
Total assets | | | 188,508,199 | |
| | | | |
Liabilities: | | | | |
Payables: | | | | |
Capital shares redeemed | | | 14,671 | |
Management fees | | | 69,008 | |
Distribution fees | | | 46,466 | |
Professional fees | | | 82,858 | |
Unrealized depreciation on OTC swap contracts | | | 3,164 | |
Accrued expenses and other liabilities | | | 16,232 | |
| | | | |
Total liabilities | | | 232,399 | |
| | | | |
Net assets, at value | | $ | 188,275,800 | |
| | | | |
Net assets consist of: | | | | |
Paid-in capital | | $ | 162,847,987 | |
Undistributed net investment income | | | 778,163 | |
Net unrealized appreciation (depreciation) | | | 25,591,912 | |
Accumulated net realized gain (loss) | | | (942,262 | ) |
| | | | |
Net assets, at value | | $ | 188,275,800 | |
| | | | |
| |
| Class 2: | | | | |
Net assets, at value | | $ | 35,721 | |
| | | | |
Shares outstanding | | | 3,061 | |
| | | | |
Net asset value and maximum offering price per share | | $ | 11.67 | |
| | | | |
| |
| Class 5: | | | | |
Net assets, at value | | $ | 188,240,079 | |
| | | | |
Shares outstanding | | | 16,162,667 | |
| | | | |
Net asset value and maximum offering price per share | | $ | 11.65 | |
| | | | |
| | | | |
| FVA-12 | | Annual Report | The accompanying notes are an integral part of these financial statements. | | |
FRANKLIN TEMPLETON VARIABLE INSURANCE PRODUCTS TRUST
FINANCIAL STATEMENTS
Statement of Operations
for the year ended December 31, 2017
| | | | |
| | | Franklin VolSmart
Allocation VIP
Fund | |
Investment income: | | | | |
Dividends: (net of foreign taxes)* | | | | |
Unaffiliated issuers. | | $ | 1,790,946 | |
Non-controlled affiliates (Note 3e) | | | 1,789,694 | |
| | | | |
Total investment income | | | 3,580,640 | |
| | | | |
Expenses: | | | | |
Management fees (Note 3a) | | | 1,318,737 | |
Distribution fees: (Note 3c) | | | | |
Class 2 | | | 83 | |
Class 5 | | | 247,434 | |
Custodian fees (Note 4) | | | 1,860 | |
Reports to shareholders | | | 18,933 | |
Registration and filing fees | | | 472 | |
Professional fees | | | 97,577 | |
Trustees’ fees and expenses | | | 627 | |
Other | | | 25,429 | |
| | | | |
Total expenses | | | 1,711,152 | |
Expense reductions (Note 4) | | | (51 | ) |
Expenses waived/paid by affiliates (Note 3e and 3f) | | | (669,258 | ) |
| | | | |
Net expenses | | | 1,041,843 | |
| | | | |
Net investment income | | | 2,538,797 | |
| | | | |
Realized and unrealized gains (losses): | | | | |
Net realized gain (loss) from: | | | | |
Investments: | | | | |
Unaffiliated issuers | | | 326,312 | |
Non-controlled affiliates (Note 3e) | | | 532,731 | |
Foreign currency transactions | | | (26 | ) |
Swap contracts | | | (376,240 | ) |
Capital gain distributions from Underlying Funds: | | | | |
Non-controlled affiliates (Note 3e) | | | 309,152 | |
| | | | |
Net realized gain (loss) | | | 791,929 | |
| | | | |
Net change in unrealized appreciation (depreciation) on: | | | | |
Investments: | | | | |
Unaffiliated issuers | | | 15,056,303 | |
Non-controlled affiliates (Note 3e) | | | 5,216,763 | |
Swap contracts | | | 1,874 | |
| | | | |
Net change in unrealized appreciation (depreciation) | | | 20,274,940 | |
| | | | |
Net realized and unrealized gain (loss) | | | 21,066,869 | |
| | | | |
Net increase (decrease) in net assets resulting from operations | | $ | 23,605,666 | |
| | | | |
| | | | |
| | | | |
| | | | |
| | | | |
| | | | |
| | | | |
| | | | |
*Foreign taxes withheld on dividends | | $ | 1,721 | |
| | | | | | |
| | | The accompanying notes are an integral part of these financial statements. | Annual Report | | | FVA-13 | |
FRANKLIN TEMPLETON VARIABLE INSURANCE PRODUCTS TRUST
FINANCIAL STATEMENTS
Statements of Changes in Net Assets
| | | | | | | | |
| | | Franklin VolSmart Allocation VIP Fund | |
| | | Year Ended December 31, | |
| | | 2017 | | | 2016 | |
Increase (decrease) in net assets: | | | | | | | | |
Operations: | | | | | | | | |
Net investment income | | $ | 2,538,797 | | | $ | 1,419,032 | |
Net realized gain (loss) | | | 791,929 | | | | (4,311,221 | ) |
Net change in unrealized appreciation (depreciation) | | | 20,274,940 | | | | 6,451,189 | |
| | | | |
Net increase (decrease) in net assets resulting from operations | | | 23,605,666 | | | | 3,559,000 | |
| | | | |
Distributions to shareholders from: | | | | | | | | |
Net investment income: | | | | | | | | |
Class 2 | | | — | | | | (294 | ) |
Class 5 | | | — | | | | (354,685 | ) |
Net realized gains: | | | | | | | | |
Class 2 | | | — | | | | (7,355 | ) |
Class 5 | | | — | | | | (116,711 | ) |
| | | | |
Total distributions to shareholders | | | — | | | | (479,045 | ) |
| | | | |
Capital share transactions: (Note 2) | | | | | | | | |
Class 2 | | | — | | | | (8,888,134 | ) |
Class 5 | | | 40,058,190 | | | | 66,900,840 | |
| | | | |
Total capital share transactions | | | 40,058,190 | | | | 58,012,706 | |
| | | | |
Net increase (decrease) in net assets | | | 63,663,856 | | | | 61,092,661 | |
Net assets: | | | | | | | | |
Beginning of year | | | 124,611,944 | | | | 63,519,283 | |
| | | | |
End of year | | $ | 188,275,800 | | | $ | 124,611,944 | |
| | | | |
Undistributed net investment income included in net assets: | | | | | | | | |
End of year | | $ | 778,163 | | | $ | — | |
| | | | |
Distributions in excess of net investment income included in net assets: | | | | | | | | |
End of year | | $ | — | | | $ | (1,374,219 | ) |
| | | | |
| | | | |
| FVA-14 | | Annual Report | The accompanying notes are an integral part of these financial statements. | | |
FRANKLIN TEMPLETON VARIABLE INSURANCE PRODUCTS TRUST
Notes to Financial Statements
Franklin VolSmart Allocation VIP Fund
1. Organization and Significant Accounting Policies
Franklin Templeton Variable Insurance Products Trust (Trust) is registered under the Investment Company Act of 1940 (1940 Act) as an open-end management investment company, consisting of eighteen separate funds and applies the specialized accounting and reporting guidance in U.S. Generally Accepted Accounting Principles (U.S. GAAP). Franklin VolSmart Allocation VIP Fund (Fund) is included in this report. The Fund invests in affiliated funds managed by Franklin Templeton (Underlying Funds). Shares of the Fund are generally sold only to insurance company separate accounts to fund the benefits of variable life insurance policies or variable annuity contracts. At December 31, 2017, 98.2% of the Fund’s shares were held through one insurance company. Investment activities of these insurance company separate accounts could have a material impact on the Fund. The Fund offers two classes of shares: Class 2 and Class 5. Each class of shares may differ by its distribution fees, voting rights on matters affecting a single class and its exchange privilege.
The accounting policies of the Underlying Funds are outlined in their respective shareholder reports. A copy of the Underlying Funds’ shareholder reports is available on the U.S. Securities and Exchange Commission (SEC) website at sec.gov or at the SEC’s Public Reference Room in Washington, D.C. The Underlying Funds’ shareholder reports are not covered by this report.
The following summarizes the Fund’s significant accounting policies.
a. Financial Instrument Valuation
The Fund’s investments in financial instruments are carried at fair value daily. Fair value is the price that would be received to sell an asset or paid to transfer a liability in an orderly transaction between market participants on the measurement date. The Fund calculates the net asset value (NAV) per share as of 4 p.m. Eastern time each day the New York Stock Exchange (NYSE) is open for trading. Under compliance policies and procedures approved by the Trust’s Board of Trustees (the Board), the Fund’s administrator has responsibility for oversight of valuation, including leading the cross-functional Valuation Committee (VC). The VC provides administration and oversight of the Fund’s valuation policies and procedures, which are approved annually by the Board. Among other things, these procedures allow the Fund to utilize
independent pricing services, quotations from securities and financial instrument dealers, and other market sources to determine fair value.
Investments in the Underlying Funds are valued at their closing NAV each trading day.
Equity securities and exchange traded funds (ETFs) listed on an exchange or on the NASDAQ National Market System are valued at the last quoted sale price or the official closing price of the day, respectively. Foreign equity securities are valued as of the close of trading on the foreign stock exchange on which the security is primarily traded, or as of 4 p.m. Eastern time. The value is then converted into its U.S. dollar equivalent at the foreign exchange rate in effect at 4 p.m. Eastern time on the day that the value of the security is determined. Over-the-counter (OTC) securities are valued within the range of the most recent quoted bid and ask prices. Securities that trade in multiple markets or on multiple exchanges are valued according to the broadest and most representative market. Certain equity securities are valued based upon fundamental characteristics or relationships to similar securities.
Certain derivative financial instruments trade in the OTC market. The Fund’s pricing services use various techniques including industry standard option pricing models and proprietary discounted cash flow models to determine the fair value of those instruments. The Fund’s net benefit or obligation under the derivative contract, as measured by the fair value of the contract, is included in net assets.
The Fund has procedures to determine the fair value of financial instruments for which market prices are not reliable or readily available. Under these procedures, the VC convenes on a regular basis to review such financial instruments and considers a number of factors, including significant unobservable valuation inputs, when arriving at fair value. The VC primarily employs a market-based approach which may use related or comparable assets or liabilities, recent transactions, market multiples, book values, and other relevant information for the investment to determine the fair value of the investment. An income-based valuation approach may also be used in which the anticipated future cash flows of the investment are discounted to calculate fair value. Discounts may also be applied due to the nature or duration of any restrictions on the disposition of the investments. Due to the inherent uncertainty of valuations of such investments, the fair values may differ significantly from the values that would have been used had an active market
FRANKLIN TEMPLETON VARIABLE INSURANCE PRODUCTS TRUST
NOTES TO FINANCIAL STATEMENTS
Franklin VolSmart Allocation VIP Fund (continued)
1. Organization and Significant Accounting
Policies (continued)
a. Financial Instrument Valuation (continued)
existed. The VC employs various methods for calibrating these valuation approaches including a regular review of key inputs and assumptions, transactional back-testing or disposition analysis, and reviews of any related market activity.
Trading in securities on foreign securities stock exchanges and OTC markets may be completed before 4 p.m. Eastern time. In addition, trading in certain foreign markets may not take place on every Fund’s business day. Occasionally, events occur between the time at which trading in a foreign security is completed and 4 p.m. Eastern time that might call into question the reliability of the value of a portfolio security held by the Fund. As a result, differences may arise between the value of the Fund’s portfolio securities as determined at the foreign market close and the latest indications of value at 4 p.m. Eastern time. In order to minimize the potential for these differences, the VC monitors price movements following the close of trading in foreign stock markets through a series of country specific market proxies (such as baskets of American Depositary Receipts, futures contracts and exchange traded funds). These price movements are measured against established trigger thresholds for each specific market proxy to assist in determining if an event has occurred that may call into question the reliability of the values of the foreign securities held by the Fund. If such an event occurs, the securities may be valued using fair value procedures, which may include the use of independent pricing services.
When the last day of the reporting period is a non-business day, certain foreign markets may be open on those days that the Fund’s NAV is not calculated, which could result in differences between the value of the Fund’s portfolio securities on the last business day and the last calendar day of the reporting period. Any significant security valuation changes due to an open foreign market are adjusted and reflected by the Fund for financial reporting purposes.
b. Foreign Currency Translation
Portfolio securities and other assets and liabilities denominated in foreign currencies are translated into U.S. dollars based on the exchange rate of such currencies against U.S. dollars on the date of valuation. The Fund may enter into foreign currency exchange contracts to facilitate transactions denominated in a
foreign currency. Purchases and sales of securities, income and expense items denominated in foreign currencies are translated into U.S. dollars at the exchange rate in effect on the transaction date. Portfolio securities and assets and liabilities denominated in foreign currencies contain risks that those currencies will decline in value relative to the U.S. dollar. Occasionally, events may impact the availability or reliability of foreign exchange rates used to convert the U.S. dollar equivalent value. If such an event occurs, the foreign exchange rate will be valued at fair value using procedures established and approved by the Board.
The Fund does not separately report the effect of changes in foreign exchange rates from changes in market prices on securities held. Such changes are included in net realized and unrealized gain or loss from investments in the Statement of Operations.
Realized foreign exchange gains or losses arise from sales of foreign currencies, currency gains or losses realized between the trade and settlement dates on securities transactions and the difference between the recorded amounts of dividends, interest, and foreign withholding taxes and the U.S. dollar equivalent of the amounts actually received or paid. Net unrealized foreign exchange gains and losses arise from changes in foreign exchange rates on foreign denominated assets and liabilities other than investments in securities held at the end of the reporting period.
c. Derivative Financial Instruments
The Fund invested in derivative financial instruments in order to manage risk or gain exposure to various other investments or markets. Derivatives are financial contracts based on an underlying or notional amount, require no initial investment or an initial net investment that is smaller than would normally be required to have a similar response to changes in market factors, and require or permit net settlement. Derivatives contain various risks including the potential inability of the counterparty to fulfill their obligations under the terms of the contract, the potential for an illiquid secondary market, and/or the potential for market movements which expose the Fund to gains or losses in excess of the amounts shown in the Statement of Assets and Liabilities. Realized gain and loss and unrealized appreciation and depreciation on these contracts for the period are included in the Statement of Operations.
FRANKLIN TEMPLETON VARIABLE INSURANCE PRODUCTS TRUST
NOTES TO FINANCIAL STATEMENTS
Franklin VolSmart Allocation VIP Fund (continued)
Derivative counterparty credit risk is managed through a formal evaluation of the creditworthiness of all potential counter-parties. The Fund attempts to reduce its exposure to counterparty credit risk on OTC derivatives, whenever possible, by entering into International Swaps and Derivatives Association (ISDA) master agreements with certain counterparties. These agreements contain various provisions, including but not limited to collateral requirements, events of default, or early termination. Termination events applicable to the counterparty include certain deteriorations in the credit quality of the counterparty. Termination events applicable to the Fund include failure of the Fund to maintain certain net asset levels and/or limit the decline in net assets over various periods of time. In the event of default or early termination, the ISDA master agreement gives the non-defaulting party the right to net and close-out all transactions traded, whether or not arising under the ISDA agreement, to one net amount payable by one counterparty to the other. However, absent an event of default or early termination, OTC derivative assets and liabilities are presented gross and not offset in the Statement of Assets and Liabilities. Early termination by the counterparty may result in an immediate payment by the Fund of any net liability owed to that counterparty under the ISDA agreement. At December 31, 2017, the Fund had OTC derivatives in a net liability position for such contracts of $3,164.
Collateral requirements differ by type of derivative. Collateral terms are contract specific for OTC derivatives. For OTC derivatives traded under an ISDA master agreement, posting of collateral is required by either the Fund or the applicable counterparty if the total net exposure of all OTC derivatives with the applicable counterparty exceeds the minimum transfer amount, which typically ranges from $100,000 to $250,000, and can vary depending on the counterparty and the type of the agreement. Generally, collateral is determined at the close of Fund business each day and any additional collateral required due to changes in derivative values may be delivered by the Fund or the counterparty the next business day, or within a few business days. Collateral pledged and/or received by the Fund, if any, is held in segregated accounts with the Fund’s custodian/counterparty broker and can be in the form of cash and/or securities. Unrestricted cash may be invested according to the Fund’s investment objectives. To the extent that the amounts due to the Fund from its counterparties are not subject to collateralization or are not fully collateralized, the Fund bears the risk of loss from counterparty non-performance.
The Fund entered into OTC total return swap contracts primarily to manage and/or gain exposure to equity price risk of an underlying instrument such as a stock, bond, index or basket of securities or indices. A total return swap is an agreement between the Fund and a counterparty to exchange a return linked to an underlying instrument for a floating or fixed rate payment, both based upon a notional amount. Over the term of the contract, contractually required payments to be paid or received are accrued daily and recorded as unrealized appreciation or depreciation until the payments are made, at which time they are recognized as realized gain or loss.
See Note 7 regarding other derivative information.
d. Income and Deferred Taxes
It is the Fund’s policy to qualify as a regulated investment company under the Internal Revenue Code. The Fund intends to distribute to shareholders substantially all of its taxable income and net realized gains to relieve it from federal income and if applicable, excise taxes. As a result, no provision for U.S. federal income taxes is required.
The Fund may be subject to foreign taxation related to income received, capital gains on the sale of securities and certain foreign currency transactions in the foreign jurisdictions in which it invests. Foreign taxes, if any, are recorded based on the tax regulations and rates that exist in the foreign markets in which the Fund invests. When a capital gain tax is determined to apply, the Fund records an estimated deferred tax liability in an amount that would be payable if the securities were disposed of on the valuation date.
The Fund may recognize an income tax liability related to its uncertain tax positions under U.S. GAAP when the uncertain tax position has a less than 50% probability that it will be sustained upon examination by the tax authorities based on its technical merits. As of December 31, 2017, the Fund has determined that no tax liability is required in its financial statements related to uncertain tax positions for any open tax years (or expected to be taken in future tax years). Open tax years are those that remain subject to examination and are based on the statute of limitations in each jurisdiction in which the Fund invests.
FRANKLIN TEMPLETON VARIABLE INSURANCE PRODUCTS TRUST
NOTES TO FINANCIAL STATEMENTS
Franklin VolSmart Allocation VIP Fund (continued)
1. Organization and Significant Accounting
Policies (continued)
e. Security Transactions, Investment Income, Expenses and Distributions
Security transactions are accounted for on trade date. Realized gains and losses on security transactions are determined on a specific identification basis. Estimated expenses are accrued daily. Dividend income and realized gain distributions are recorded on the ex-dividend date except for certain dividends from securities where the dividend rate is not available. In such cases, the dividend is recorded as soon as the information is received by the Fund. Distributions to shareholders are recorded on the ex-dividend date. Distributable earnings are determined according to income tax regulations (tax basis) and may differ from earnings recorded in accordance with U.S. GAAP. These differences may be permanent or temporary. Permanent differences are reclassified among capital accounts to reflect their tax character. These reclassifications have no impact on net assets or the results of operations. Temporary differences are not reclassified, as they may reverse in subsequent periods.
Common expenses incurred by the Trust are allocated among the Funds based on the ratio of net assets of each Fund to the combined net assets of the Trust. Fund specific expenses are charged directly to the Fund that incurred the expense.
The Fund indirectly bears its proportionate share of expenses from the Underlying Funds and ETFs. Since the Underlying Funds and ETFs have varied expense levels and the Fund may own different proportions of the Underlying Funds and ETFs at different times, the amount of expenses incurred indirectly by the Fund will vary.
Realized and unrealized gains and losses and net investment income, excluding class specific expenses, are allocated daily to each class of shares based upon the relative proportion of net assets of each class. Differences in per share distributions by class are generally due to differences in class specific expenses.
f. Accounting Estimates
The preparation of financial statements in accordance with U.S. GAAP requires management to make estimates and assumptions that affect the reported amounts of assets and liabilities at the date of the financial statements and the amounts of income and expenses during the reporting period. Actual results could differ from those estimates.
g. Guarantees and Indemnifications
Under the Trust’s organizational documents, its officers and trustees are indemnified by the Trust against certain liabilities arising out of the performance of their duties to the Trust. Additionally, in the normal course of business, the Trust, on behalf of the Fund, enters into contracts with service providers that contain general indemnification clauses. The Trust’s maximum exposure under these arrangements is unknown as this would involve future claims that may be made against the Trust that have not yet occurred. Currently, the Trust expects the risk of loss to be remote.
2. Shares of Beneficial Interest
At December 31, 2017, there were an unlimited number of shares authorized (without par value). Transactions in the Fund’s shares were as follows:
| | | | | | | | | | | | | | | | | | | | |
| | | Year Ended December 31, | |
| | | 2017 | | | | | | 2016 | |
| | | Shares | | | Amount | | | | | | Shares | | | Amount | |
| | | | | |
| Class 2 Shares: | | | | | | | | | | | | | | | | | | | | |
Shares redeemed | | | — | | | $ | — | | | | | | | | (895,626 | ) | | $ | (8,888,134 | ) |
| | | | |
FRANKLIN TEMPLETON VARIABLE INSURANCE PRODUCTS TRUST
NOTES TO FINANCIAL STATEMENTS
Franklin VolSmart Allocation VIP Fund (continued)
| | | | | | | | | | | | | | | | | | | | |
| | | Year Ended December 31, | |
| | | 2017 | | | | | | 2016 | |
| | | Shares | | | Amount | | | | | | Shares | | | Amount | |
| | | | | |
| Class 5 Shares: | | | | | | | | | | | | | | | | | | | | |
Shares sold | | | 6,311,063 | | | $ | 67,303,086 | | | | | | | | 8,177,643 | | | $ | 81,628,729 | |
Shares issued in reinvestment of distributions | | | — | | | | — | | | | | | | | 46,757 | | | | 471,396 | |
Shares redeemed | | | (2,514,276 | ) | | | (27,244,896 | ) | | | | | | | (1,525,885 | ) | | | (15,199,285 | ) |
| | | | |
Net increase (decrease) | | | 3,796,787 | | | $ | 40,058,190 | | | | | | | | 6,698,515 | | | $ | 66,900,840 | |
| | | | |
3. Transactions with Affiliates
Franklin Resources, Inc. is the holding company for various subsidiaries that together are referred to as Franklin Templeton Investments. Certain officers and trustees of the Fund are also officers, directors and/or trustees of certain of the Underlying Funds and of the following subsidiaries:
| | |
| Subsidiary | | Affiliation |
Franklin Advisers, Inc. (Advisers) | | Investment manager |
Franklin Advisory Services, LLC (Advisory Services) | | Investment manager |
K2/D&S Management Co., LLC (K2 Advisors) | | Investment manager |
Franklin Templeton Services, LLC (FT Services) | | Administrative manager |
Franklin Templeton Distributors, Inc. (Distributors) | | Principal underwriter |
Franklin Templeton Investor Services, LLC (Investor Services) | | Transfer agent |
a. Management Fees
The Fund pays an investment management fee to Advisers of 0.80% per year of the average daily net assets of the Fund.
Under a subadvisory agreement, Advisory Services and K2 Advisors, affiliates of Advisers, provide subadvisory services to the Fund. The subadvisory fee is paid by Advisers based on the Fund’s average daily net assets, and is not an additional expense of the Fund.
b. Administrative Fees
Under an agreement with Advisers, FT Services provides administrative services to the Fund. The fee is paid by Advisers based on the Fund’s average daily net assets, and is not an additional expense of the Fund.
c. Distribution Fees
The Board has adopted distribution plans for Class 2 and Class 5 shares pursuant to Rule 12b-1 under the 1940 Act. Under the Fund’s compensation distribution plans, the Fund pays Distributors for costs incurred in connection with the servicing, sale and distribution of the Fund’s shares up to 0.35% and 0.15% per year of its average daily net assets of Class 2 and Class 5, respectively. The Board has agreed to limit the current rate to 0.25% per year for Class 2. The plan year, for purposes of monitoring compliance with the maximum annual plan rates, is February 1 through January 31.
d. Transfer Agent Fees
Investor Services, under terms of an agreement, performs shareholder servicing for the Fund and is not paid by the Fund for the services.
FRANKLIN TEMPLETON VARIABLE INSURANCE PRODUCTS TRUST
NOTES TO FINANCIAL STATEMENTS
Franklin VolSmart Allocation VIP Fund (continued)
3. Transactions with Affiliates (continued)
e. Investments in Underlying Funds
The Fund invests in Underlying Funds which are managed by Advisers or affiliates of Advisers. The Fund does not invest in Underlying Funds for the purpose of exercising a controlling influence over the management or policies. Management fees paid by the Fund are waived on assets invested in the Underlying Funds, as noted in the Statement of Operations, in an amount not to exceed the management and administrative fees paid directly or indirectly by the Underlying Funds.
Investments in Underlying Funds for the year ended December 31, 2017, were as follows:
| | | | | | | | | | | | | | | | | | | | | | | | | | | | | | | | |
| Underlying Funds | | Number
of Shares
Held at
Beginning
of Year | | | Gross
Additions | | | Gross
Reductions | | | Number
of Shares
Held at
End of
Year | | | Value at
End of
Year | | | Dividend
Income | | | Realized
Gain
(Loss) | | | Net Change in
Unrealized
Appreciation
(Depreciation) | |
| Non-Controlled Affiliates | | | | | | | | | | | | | | | | | | | | | | | | | | | | | | | | |
| Franklin DynaTech Fund, Class R6 | | | 251,990 | | | | 104,165 | | | | (84,014 | ) | | | 272,141 | | | $ | 18,437,573 | | | $ | — | | | $ | 841,883a | | | $ | 4,600,980 | |
Franklin Income Fund, Class R6 | | | 5,053,596 | | | | 2,517,886 | | | | — | | | | 7,571,482 | | | | 17,868,696 | | | | 826,177 | | | | — | | | | 437,774 | |
Franklin Low Duration Total Return Fund, | | | | | | | | | | | | | | | | | | | | | | | | | | | | | | | | |
Class R6 | | | 1,612,689 | | | | 712,707 | | | | — | | | | 2,325,396 | | | | 22,835,389 | | | | 450,136 | | | | — | | | | (152,027 | ) |
Franklin Strategic Income Fund, Class R6 | | | 1,380,378 | | | | 527,561 | | | | — | | | | 1,907,939 | | | | 18,793,197 | | | | 477,159 | | | | — | | | | 330,036 | |
Institutional Fiduciary Trust Money Market | | | | | | | | | | | | | | | | | | | | | | | | | | | | | | | | |
Portfolio, 0.89% | | | 9,750,824 | | | | 49,184,107 | | | | (52,073,311 | ) | | | 6,861,620 | | | | 6,861,620 | | | | 36,222 | | | | — | | | | — | |
| | | | | | | | | | | | | | | | | | | | |
Total Affiliated Securities | | | | | | | | | | | | | | | | | | $ | 84,796,475 | | | $ | 1,789,694 | | | $ | 841,883 | | | $ | 5,216,763 | |
| | | | | | | | | | | | | | | | | | | | |
aIncludes realized gain distributions received.
f. Waiver and Expense Reimbursements
Advisers has contractually agreed in advance to waive or limit its fees and to assume as its own expense certain expenses otherwise payable by the Fund so that the expenses (excluding distribution fees and acquired fund fees and expenses) for each class of the Fund do not exceed 0.65%, based on the average net assets of each class (other than certain non-routine expenses or costs, including those relating to litigation, indemnification, reorganizations, and liquidations) until April 30, 2018. Total expenses waived or paid are not subject to recapture subsequent to the Fund’s fiscal year end.
4. Expense Offset Arrangement
The Fund has entered into an arrangement with its custodian whereby credits realized as a result of uninvested cash balances are used to reduce a portion of the Fund’s custodian expenses. During the year ended December 31, 2017, the custodian fees were reduced as noted in the Statement of Operations.
5. Income Taxes
For tax purposes, capital losses may be carried over to offset future capital gains, if any.
At December 31, 2017, the capital loss carryforwards were as follows:
| | | | |
Capital loss carryforwards: | | | | |
Short term | | $ | 164,571 | |
Long term. | | | 455,583 | |
| | | | |
Total capital loss carryforwards | | $ | 620,154 | |
| | | | |
During the year ended December 31, 2017, the Fund utilized $1,198,579 of capital loss carryforwards.
FRANKLIN TEMPLETON VARIABLE INSURANCE PRODUCTS TRUST
NOTES TO FINANCIAL STATEMENTS
Franklin VolSmart Allocation VIP Fund (continued)
The tax character of distributions paid during the years ended December 31, 2017 and 2016, was as follows:
| | | | | | | | |
| | | 2017 | | | 2016 | |
Distributions paid from: | | | | | | | | |
Ordinary income | | $ | — | | | $ | 355,325 | |
Long term capital gain | | | — | | | | 123,720 | |
| | | | |
| | $ | — | | | $ | 479,045 | |
| | | | |
At December 31, 2017, the cost of investments, net unrealized appreciation (depreciation) and undistributed ordinary income for income tax purposes were as follows:
| | | | |
Cost of investments | | $ | 163,230,402 | |
| | | | |
Unrealized appreciation | | $ | 27,122,155 | |
Unrealized depreciation | | | (1,999,069 | ) |
| | | | |
Net unrealized appreciation (depreciation) | | $ | 25,123,086 | |
| | | | |
Distributable earnings - undistributed ordinary income . | | $ | 924,882 | |
| | | | |
Differences between income and/or capital gains as determined on a book basis and a tax basis are primarily due to differing treatment of swaps.
6. Investment Transactions
Purchases and sales of investments (excluding short term securities) for the year ended December 31, 2017, aggregated $52,765,395 and $8,975,485, respectively.
7. Other Derivative Information
At December 31, 2017, the Fund’s investments in derivative contracts are reflected in the Statement of Assets and Liabilities as follows:
| | | | | | | | | | | | |
| | | Asset Derivatives | | | Liability Derivatives | |
Derivative Contracts
Not Accounted for
as Hedging Instruments | | Statement of Assets and
Liabilities Location | | Fair Value | | | Statement of Assets and
Liabilities Location | | Fair Value | |
Equity contracts | | Unrealized appreciation on OTC swap contracts | | $ | — | | | Unrealized depreciation on OTC swap contracts | | $ | 3,164 | |
| | | | | | | | | | | | |
For the year ended December 31, 2017, the effect of derivative contracts in the Fund’s Statement of Operations was as follows:
| | | | | | | | | | |
Derivative
Contracts
Not Accounted for
as Hedging
Instruments | | Statement of Operations Location | | Net Realized
Gain (Loss)
for the Year | | Statement of Operations Location | | Net Change in
Unrealized
Appreciation
(Depreciation)
for the Year | |
| | Net realized gain (loss) from: | | | | Net change in unrealized appreciation (depreciation) on: | | | | |
Equity contracts | | Swap contracts | | $(376,240) | | Swap contracts | | $ | 1,874 | |
| | | | | | | | | | |
For the year ended December 31, 2017, the average month end notional amount of swap contracts represented $31,023,077.
See Note 1(c) regarding derivative financial instruments.
FRANKLIN TEMPLETON VARIABLE INSURANCE PRODUCTS TRUST
NOTES TO FINANCIAL STATEMENTS
Franklin VolSmart Allocation VIP Fund (continued)
8. Credit Facility
The Fund, together with other U.S. registered and foreign investment funds (collectively, Borrowers), managed by Franklin Templeton Investments, are borrowers in a joint syndicated senior unsecured credit facility totaling $2 billion (Global Credit Facility) which matured on February 9, 2018. This Global Credit Facility provides a source of funds to the Borrowers for temporary and emergency purposes, including the ability to meet future unanticipated or unusually large redemption requests. Effective February 9, 2018, the Borrowers renewed the Global Credit Facility for a one year term, maturing February 8, 2019, for a total of $2 billion.
Under the terms of the Global Credit Facility, the Fund shall, in addition to interest charged on any borrowings made by the Fund and other costs incurred by the Fund, pay its share of fees and expenses incurred in connection with the implementation and maintenance of the Global Credit Facility, based upon its relative share of the aggregate net assets of all of the Borrowers, including an annual commitment fee of 0.15% based upon the unused portion of the Global Credit Facility. These fees are reflected in other expenses in the Consolidated Statement of Operations. During the year ended December 31, 2017, the Fund did not use the Global Credit Facility.
9. Fair Value Measurements
The Fund follows a fair value hierarchy that distinguishes between market data obtained from independent sources (observable inputs) and the Fund’s own market assumptions (unobservable inputs). These inputs are used in determining the value of the Fund’s financial instruments and are summarized in the following fair value hierarchy:
| | • | | Level 1 – quoted prices in active markets for identical financial instruments |
| | • | | Level 2 – other significant observable inputs (including quoted prices for similar financial instruments, interest rates, prepayment speed, credit risk, etc.) |
| | • | | Level 3 – significant unobservable inputs (including the Fund’s own assumptions in determining the fair value of financial instruments) |
The input levels are not necessarily an indication of the risk or liquidity associated with financial instruments at that level.
For movements between the levels within the fair value hierarchy, the Fund has adopted a policy of recognizing the transfers as of the date of the underlying event which caused the movement.
A summary of inputs used as of December 31, 2017, in valuing the Fund’s assets and liabilites carried at fair value, is as follows:
| | | | | | | | | | | | | | | | |
| | | Level 1 | | | Level 2 | | | Level 3 | | | Total | |
| Assets: | | | | | | | | | | | | | | | | |
Investments in Securities:a | | | | | | | | | | | | | | | | |
Equity Investments | | $ | 95,259,273 | | | $ | — | | | $ | — | | | $ | 95,259,273 | |
Investments in Underlying Funds and Exchange | | | | | | | | | | | | | | | | |
Traded Funds | | | 86,235,759 | | | | — | | | | — | | | | 86,235,759 | |
Short Term Investments | | | 6,861,620 | | | | — | | | | — | | | | 6,861,620 | |
| | | | |
Total Investments in Securities | | $ | 188,356,652 | | | $ | — | | | $ | — | | | $ | 188,356,652 | |
| | | | |
| | | | |
| Liabilities: | | | | | | | | | | | | | | | | |
Other Financial Instruments: | | | | | | | | | | | | | | | | |
Swap Contracts. | | $ | — | | | $ | 3,164 | | | $ | — | | | $ | 3,164 | |
| | | | |
aFor detailed categories, see the accompanying Statement of Investments.
FRANKLIN TEMPLETON VARIABLE INSURANCE PRODUCTS TRUST
NOTES TO FINANCIAL STATEMENTS
Franklin VolSmart Allocation VIP Fund (continued)
10. Subsequent Events
The Fund has evaluated subsequent events through the issuance of the financial statements and determined that no events have occurred that require disclosure other than those already disclosed in the financial statements.
Abbreviations
| | | | | | |
Counterparty | | Selected Portfolio |
| | | |
| BZWS | | Barclays Bank PLC | | ADR | | American Depositary Receipt |
| | | | EAFE | | Europe, Australia & Far East |
| | | | VIX | | Market Volatility Index |
FRANKLIN TEMPLETON VARIABLE INSURANCE PRODUCTS TRUST
Report of Independent Registered Public Accounting Firm
To the Board of Trustees of Franklin Templeton Variable Insurance Products Trust and Shareholders of Franklin VolSmart Allocation VIP Fund
Opinion on the Financial Statements
We have audited the accompanying statement of assets and liabilities, including the statement of investments, of Franklin VolSmart Allocation VIP Fund (the “Fund”) as of December 31, 2017, the related statement of operations for the year ended December 31, 2017, the statement of changes in net assets for each of the two years in the period ended December 31, 2017, including the related notes, and the financial highlights for each of the periods indicated therein (collectively referred to as the “financial statements”). In our opinion, the financial statements present fairly, in all material respects, the financial position of the Fund as of December 31, 2017, the results of its operations for the year then ended, the changes in its net assets for each of the two years in the period ended December 31, 2017 and the financial highlights for each of the periods indicated therein in conformity with accounting principles generally accepted in the United States of America.
Basis for Opinion
These financial statements are the responsibility of the Fund’s management. Our responsibility is to express an opinion on the Fund’s financial statements based on our audits. We are a public accounting firm registered with the Public Company Accounting Oversight Board (United States) (“PCAOB”) and are required to be independent with respect to the Fund in accordance with the U.S. federal securities laws and the applicable rules and regulations of the Securities and Exchange Commission and the PCAOB.
We conducted our audits of these financial statements in accordance with the standards of the PCAOB. Those standards require that we plan and perform the audit to obtain reasonable assurance about whether the financial statements are free of material misstatement, whether due to error or fraud.
Our audits included performing procedures to assess the risks of material misstatement of the financial statements, whether due to error or fraud, and performing procedures that respond to those risks. Such procedures included examining, on a test basis, evidence regarding the amounts and disclosures in the financial statements. Our audits also included evaluating the accounting principles used and significant estimates made by management, as well as evaluating the overall presentation of the financial statements. Our procedures included confirmation of securities owned as of December 31, 2017 by correspondence with the custodian, transfer agent, and brokers; when replies were not received from brokers, we performed other auditing procedures. We believe that our audits provide a reasonable basis for our opinion.
PricewaterhouseCoopers LLP
San Francisco, California
February 15, 2018
We have served as the auditor of one or more investment companies in the Franklin Templeton Group of Funds since 1948.
Templeton Developing Markets VIP Fund
We are pleased to bring you Templeton Developing Markets VIP Fund’s annual report for the fiscal year ended December 31, 2017.
Class 2 Performance Summary as of December 31, 2017
Average annual total return of Class 2 shares* represents the average annual change in value, assuming reinvestment of dividends and capital gains. Average returns smooth out variations in returns, which can be significant; they are not the same as year-by-year results.
| | | | | | | | | | | | |
| Periods ended 12/31/17 | | 1-Year | | | 5-Year | | | 10-Year | |
Average Annual Total Return | | | +40.41% | | | | +3.77% | | | | +0.95% | |
*The Fund has a fee waiver associated with any investment it makes in a Franklin Templeton money fund and/or other Franklin Templeton fund, contractually guaranteed through 4/30/18. Fund investment results reflect the fee waiver; without this waiver, the results would have been lower.
Performance reflects the Fund’s Class 2 operating expenses, but does not include any contract fees, expenses or sales charges. If they had been included, performance would be lower. These charges and deductions, particularly for variable life policies, can have a significant effect on contract values and insurance benefits. See the contract prospectus for a complete description of these expenses, including sales charges.
Performance data represent past performance, which does not guarantee future results. Investment return and principal value will fluctuate, and you may have a gain or loss when you sell your shares. Current performance may differ from figures shown.
Total Return Index Comparison for a Hypothetical $10,000 Investment (1/1/08–12/31/17)
The graph below shows the change in value of a hypothetical $10,000 investment in the Fund over the indicated period and includes reinvestment of any income or distributions. The Fund’s performance* is compared to the performance of MSCI Emerging Markets (EM) Index and the Standard & Poor’s®/ International Finance Corporation Investable (S&P®/IFCI) Composite Index. One cannot invest directly in an index, and an index is not representative of the Fund’s portfolio. Please see Important Notes to Performance Information preceding the Fund Summaries.
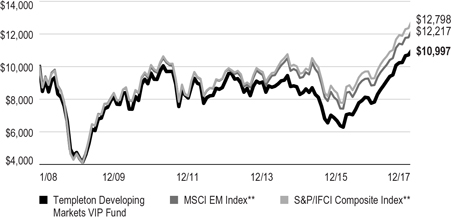
**Source: Morningstar. Please see Index Descriptions following the Fund Summaries.
TEMPLETON DEVELOPING MARKETS VIP FUND
Fund Goal and Main Investments
The Fund seeks long-term capital appreciation. Under normal market conditions, the Fund invests at least 80% of its net assets in emerging market investments.
Fund Risks
All investments involve risks, including possible loss of principal. Special risks are associated with foreign investing, including currency fluctuations, economic instability and political developments. Investments in developing markets, of which frontier markets are a subset, involve heightened risks related to the same factors, in addition to those associated with these markets’ smaller size, lesser liquidity and lack of established legal, political, business and social frameworks to support securities markets. Because these frameworks are typically even less developed in frontier markets, as well as various factors including the increased potential for extreme price volatility, illiquidity, trade barriers and exchange controls, the risks associated with developing markets are magnified in frontier markets. The Fund is designed for the aggressive portion of a well-diversified portfolio. The Fund is actively managed but there is no guarantee that the manager’s investment decisions will produce the desired results. The Fund’s prospectus also includes a description of the main investment risks.
Performance Overview
You can find the Fund’s one-year total return in the Performance Summary. In comparison, the MSCI EM Index generated a +37.75% total return, and the S&P/IFCI Composite Index produced a +37.89% total return for the same period.1 Please note, index performance numbers are for reference and we do not attempt to track an index but rather undertake investments on the basis of fundamental research.
Economic and Market Overview
Emerging market economies in general continued to grow faster than developed market economies during the 12 months under review. China’s economy grew faster in 2017 compared to the previous year, driven by solid growth in industrial production, services, fixed-asset investment, retail sales, and imports and exports. After moderating for two quarters, India’s economy grew faster in 2017’s third quarter compared to the
Geographic Composition
Based on Total Net Assets as of 12/31/17
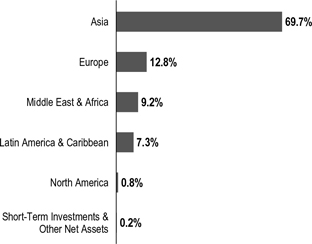
prior-year period, as investment and inventory growth offset private and public spending slowdowns. Russia’s economy grew at the fastest annualized rate in nearly five years in 2017’s second quarter, but it grew slower in the third quarter as industrial production declined. Brazil’s economy grew in 2017’s third quarter compared to the prior-year period, supported by growth in household spending and exports. South Africa’s economic growth moderated in 2017’s third quarter compared to the prior-year period amid faster mining growth and manufacturing decline. South Korea’s economy grew in 2017’s fourth quarter compared to the prior-year period; however, it contracted compared to the third quarter due to declines in manufacturing and construction.
Several central banks, including those of South Korea and Mexico, raised their benchmark interest rates during the
12-month period, while some, including those of South Africa and Chile, lowered their benchmark interest rates. Russia’s central bank reduced its key rate several times as the inflation rate continued to miss its target. Brazil’s central bank cut its benchmark interest rate several times during the period to support economic growth. India’s central bank reduced its benchmark interest rate in August due to slower inflation growth. China’s central bank left its benchmark interest rate unchanged during the period.
Emerging market stocks rose significantly during the 12 months under review, as improving corporate earnings growth and encouraging economic data from China and other emerging
1. Source: Morningstar. One cannot invest directly in an index, and an index is not representative of the Fund’s portfolio. Please see Index Descriptions following the Fund Summaries.
The dollar value, number of shares or principal amount, and names of all portfolio holdings are listed in the Fund’s Statement of Investments (SOI).
TEMPLETON DEVELOPING MARKETS VIP FUND
market countries helped offset investor concerns about the US Federal Reserve’s interest rate increases and geopolitical tensions in the Korean peninsula and other regions. Further supporting emerging market stocks were generally higher commodity prices, subsiding concerns about the potential for a protectionist US trade policy, emerging market currencies’ overall strength against the US dollar, and robust investment inflows. In this environment, emerging market stocks, as measured by the MSCI EM Index, generated a +37.75% total return for the 12 months ended December 31, 2017.1
Investment Strategy
We employ a fundamental research, value-oriented, long-term investment approach. We focus on the market price of a company’s securities relative to our evaluation of its long-term earnings, asset value and cash flow potential. We also consider a company’s profit and loss outlook, balance sheet strength, cash flow trends and asset value in relation to the current price of the company’s securities. Our analysis considers the company’s corporate governance behavior as well as its position in its sector, the economic framework and political environment. We invest in securities without regard to benchmark comparisons.
Manager’s Discussion
During the 12 months under review, key stock contributors to the Fund’s absolute performance included investments in Naspers, Samsung Electronics and Brilliance China Automotive Holdings.
Naspers is an internet and media group based in South Africa. It has sizable investments in some of the world’s leading technology companies, including China-based Tencent Holdings and Russia-based Mail.ru Group (both Fund holdings). Shares of Naspers rose during the 12-month period, largely driven by positive sentiment in Tencent, one of the world’s largest and most widely used internet service portals. Tencent reported strong year-over-year growth in quarterly earnings throughout 2017, driven by its online gaming, advertising and social networking segments. Investors also viewed positively Naspers’s addition of new investments in the online food delivery segment in 2017.
Samsung Electronics is a major South Korea-based manufacturer of consumer electronics. It is one of the world’s largest manufacturers of mobile phones, smartphones, tablets and televisions. The company is also a leading supplier of memory chips for high-end phones and is a key provider of OLED (organic light-emitting diode) displays. Its share price increase was driven by solid quarterly corporate sales and
| | | | |
| Top 10 Countries | | | |
| 12/31/17 | | | |
| | | % of Total
Net Assets | |
| China | | | 23.5% | |
| South Korea | | | 17.3% | |
| Taiwan | | | 10.4% | |
| South Africa | | | 8.2% | |
| Russia | | | 7.3% | |
| India | | | 6.7% | |
| Brazil | | | 4.9% | |
| Thailand | | | 3.9% | |
| Indonesia | | | 3.1% | |
| UK | | | 3.0% | |
earnings results reported in 2017, a new shareholder return policy for 2018-2020, including plans to boost its dividends, and a cancelation of existing company-held treasury shares. News that Samsung Electronics dethroned Intel (not a Fund holding) to become the world’s largest chip producer in 2017 in revenue terms also contributed to investor sentiment.
Brilliance China Automotive manufactures and sells automobiles for the Chinese domestic market, predominantly through its joint venture with German luxury car manufacturer BMW (nota Fund holding). The company reported strong sales volume and profit growth in 2017, supported by generally robust demand. The rise of China’s upper middle class has continued to drive luxury car demand in the country, as buyers pay more attention to vehicle performance and product quality. The announcement of a joint venture between Brilliance China Automotive and French automobile manufacturer Groupe Renault (not a Fund holding) to manufacture and sell light commercial vehicles under the Jinbei, Renault and Huasong brands further supported share price performance.
In contrast, key detractors from the Fund’s absolute performance included positions in Habib Bank, IMAX and Glenmark Pharmaceuticals.
Habib Bank is Pakistan’s biggest bank and one of the country’s largest companies in asset terms. News of a significant fine by the New York State Department of Financial Services on the bank’s New York branch for failure to comply with New York laws and regulations designed to combat money laundering, terrorist financing and other illicit financial transactions weighed on the bank’s profits and share price. Additionally, following Pakistan’s upgrade from the MSCI Frontier Markets Index to the MSCI EM Index, the Pakistani market corrected
TEMPLETON DEVELOPING MARKETS VIP FUND
sharply due to political turmoil and weaker-than-expected foreign investment inflows.2
IMAX is one of the world’s leading entertainment technology companies, specializing in immersive motion picture technologies. Its systems are used globally, and it has a notable market position in China. Disappointing corporate results for the first two quarters of 2017 pressured the US-based company’s shares. Revenues and gross profit margin declined in the second quarter compared to the year-ago period, following a decline in first-quarter gross margin. Third-quarter results, however, were better than expected, with revenue, earnings and gross margin all exceeding market forecasts, driven by a successful cost-cutting program and higher sales, leading its share price to rebound from period lows. The company also announced a new share-repurchase program to enhance shareholder value.
Glenmark Pharmaceuticals is an India-based manufacturer of generic drugs and pharmaceutical ingredients. Glenmark produces formulation products in areas such as oncology, respiratory and cardiology. It also researches and develops its own chemical and biological entities. In addition to India, the US is its main market. Its share price declined significantly in May 2017 as the company announced a weaker-than-expected first-quarter operating performance with disappointing revenue growth. Sales in India were impacted by the government’s demonetization efforts (recall of large-denominated currency notes from circulation), with price pressures also evident in other key markets. Better-than-expected second-quarter results and approval from the US Food & Drug Administration for a birth control pill in late 2017 provided investors with some reasons to remain optimistic.
It is important to recognize the effect of currency movements on the Fund’s performance. In general, if the value of the US dollar goes up compared with a foreign currency, an investment traded in that foreign currency will go down in value because it will be worth fewer US dollars. This can have a negative effect on Fund performance. Conversely, when the US dollar weakens in relation to a foreign currency, an investment traded in that foreign currency will increase in value, which can contribute to Fund performance. For the 12 months ended December 31, 2017, the US dollar declined in value relative to most currencies. As a result, the Fund’s performance was positively affected by the portfolio’s investment predominantly
| | | | |
| Top 10 Holdings | | | |
| 12/31/17 | | | |
| |
Company
Sector/Industry, Country | | % of Total
Net Assets | |
Samsung Electronics Co. Ltd.
Technology Hardware, Storage & Peripherals, South Korea | | | 7.7% | |
Naspers Ltd.
Media, South Africa | | | 7.1% | |
Brilliance China Automotive Holdings Ltd.
Automobiles, China | | | 6.2% | |
Taiwan Semiconductor Manufacturing Co. Ltd.
Semiconductors & Semiconductor Equipment, Taiwan | | | 6.1% | |
Alibaba Group Holding Ltd.
Internet Software & Services, China | | | 3.7% | |
Tencent Holdings Ltd.
Internet Software & Services, China | | | 3.4% | |
Unilever PLC
Personal Products, UK | | | 3.0% | |
ICICI Bank Ltd.
Banks, India | | | 2.3% | |
Itau Unibanco Holding SA
Banks, Brazil | | | 2.0% | |
Hon Hai Precision Industry Co. Ltd.
Electronic Equipment, Instruments & Components, Taiwan | | | 1.9% | |
in securities with non-US currency exposure. However, one cannot expect the same result in future periods.
During the 12-month period, we increased the Fund’s holdings in Russia, South Korea, Mexico and Peru as we identified companies in these countries with what we considered solid fundamentals. In sector terms, we increased holdings in financials and consumer discretionary and made some purchases in energy.3 Key purchases included new investments in Sberbank of Russia, Russia’s leading bank, and Russia-based Gazprom, the world’s largest gas producer. Additionally, we increased the Fund’s holdings in South Korea-based POSCO, one of the world’s biggest steel producers, and Grupo Financiero Santander Mexico, a major financial services company in Mexico.
Conversely, we reduced the Fund’s holdings in India and Brazil to focus on securities we considered to be more attractively valued within our investment universe. We also made some sales in China and South Africa. In sector terms, we reduced holdings in industrials and consumer staples and made some
2. Please see Index Descriptions following the Fund Summaries.
3. The financials sector comprises banks, capital markets, diversified financial services and insurance in the SOI. The consumer discretionary sector comprises autocomponents; automobiles; distributors; hotels, restaurants and leisure; internet and direct marketing retail; media; and textiles, apparel and luxury goods in the SOI. The energy sector comprises oil, gas and consumable fuels in the SOI.
TEMPLETON DEVELOPING MARKETS VIP FUND
sales in information technology (IT).4 Key sales included closing the Fund’s position in Remgro, a South African holding company with interests in food, finance and health care. We also reduced investments in the aforementioned Tencent Holdings and in Brazilian financial conglomerate Itau Unibanco Holding.
Thank you for your participation in Templeton Developing Markets VIP Fund. We look forward to serving your future investment needs.
The foregoing information reflects our analysis, opinions and portfolio holdings as of December 31, 2017, the end of the reporting period. The way we implement our main investment strategies and the resulting portfolio holdings may change depending on factors such as market and economic conditions. These opinions may not be relied upon as investment advice or an offer for a particular security. The information is not a complete analysis of every aspect of any market, country, industry, security or the Fund. Statements of fact are from sources considered reliable, but the investment manager makes no representation or warranty as to their completeness or accuracy. Although historical performance is no guarantee of future results, these insights may help you understand our investment management philosophy.
4. The industrials sector comprises construction and engineering, distributors, trading companies and distributors, and transportation infrastructure in the SOI. The consumer staples sector comprises beverages, food and staples retailing, food products and personal products in the SOI. The IT sector comprises electronic equipment, instruments and components; internet software and services; IT services; semiconductors and semiconductor equipment; and technology hardware, storage and peripherals in the SOI.
TEMPLETON DEVELOPING MARKETS VIP FUND
Class 2 Fund Expenses
As an investor in a variable insurance contract (Contract) that indirectly provides for investment in an underlying mutual fund, you can incur transaction and/or ongoing expenses at both the Fund level and the Contract Level: (1) transaction expenses can include sales charges (loads) on purchases, surrender fees, transfer fees and premium taxes; and (2) ongoing expenses can include management fees, distribution and service (12b-1) fees, contract fees, annual maintenance fees, mortality and expense risk fees and other fees and expenses. All mutual funds and Contracts have some types of ongoing expenses. The table below shows Fund-level ongoing expenses and can help you understand these costs and compare them with those of other mutual funds offered through the Contract. The table assumes a $1,000 investment held for the six months indicated. Please refer to the Fund prospectus for additional information on operating expenses.
Actual Fund Expenses
The table below provides information about the actual account values and actual expenses in the columns under the heading “Actual.” In these columns the Fund’s actual return, which includes the effect of ongoing Fund expenses but does not include the effect of ongoing Contract expenses, is used to calculate the “Ending Account Value.” You can estimate the Fund-level expenses you paid during the period by following these steps (of course, your account value and expenses will differ from those in this illustration): Divide your account value by $1,000 (if your account had an $8,600 value, then $8,600 ÷ $1,000 = 8.6). Then multiply the result by the number under the headings “Actual” and “Fund-Level Expenses Paid During Period” (if Fund-Level Expenses Paid During Period were $ 7.50, then 8.6 x $ 7.50 = $64.50). In this illustration, the estimated expenses paid this period at the Fund level are $64.50.
Hypothetical Example for Comparison with Other Mutual Funds
Under the heading “Hypothetical” in the table, information is provided about hypothetical account values and hypothetical expenses based on the Fund’s actual expense ratio and an assumed rate of return of 5% per year before expenses, which is not the Fund’s actual return. This information may not be used to estimate the actual ending account balance or expenses you paid for the period, but it can help you compare ongoing costs of investing in the Fund with those of other mutual funds offered through the Contract. To do so, compare this 5% hypothetical example with the 5% hypothetical examples that appear in the shareholder reports of other funds offered through the Contract.
Please note that expenses shown in the table are meant to highlight ongoing costs at the Fund level only and do not reflect any ongoing expenses at the Contract level, or transaction expenses at either the Fund or Contract levels. In addition, while the Fund does not have transaction expenses, if the transaction and ongoing expenses at the Contract level were included, the expenses shown below would be higher. You should consult your Contract prospectus or disclosure document for more information.
| | | | | | | | | | | | | | | | | | | | | | | | | | | | | | | | | | | | |
| | | | | | | | | Actual
(actual return after expenses) | | | | | | Hypothetical
(5% annual return before expenses) | | | | | | | |
Share
Class | | Beginning Account
Value 7/1/17 | | | | | | Ending Account
Value 12/31/17 | | | Fund-Level Expenses
Paid During Period
7/1/17–12/31/171,2 | | | | | | Ending Account
Value 12/31/17 | | | Fund-Level Expenses
Paid During Period
7/1/17–12/31/171,2 | | | | | | Net
Annualized
Expense
Ratio2 | |
Class 2 | | | $1,000 | | | | | | | | $1,158.60 | | | | $8.76 | | | | | | | | $1,017.09 | | | | $8.19 | | | | | | | | 1.61 | % |
1. Expenses are equal to the annualized expense ratio for the six-month period as indicated above — in the far right column — multiplied by the simple average account value over the period indicated, and then multiplied by 184/365 to reflect the one-half year period.
2. Reflects expenses after fee waivers and expense reimbursements. Does not include any ongoing expenses of the Contract for which the Fund is an investment option or acquired fund fees and expenses.
FRANKLIN TEMPLETON VARIABLE INSURANCE PRODUCTS TRUST
Financial Highlights
Templeton Developing Markets VIP Fund
| | | | | | | | | | | | | | | | | | | | |
| | | Year Ended December 31, | |
| | | 2017 | | | 2016 | | | 2015 | | | 2014 | | | 2013 | |
| Class 1 | | | | | | | | | | | | | | | | | | | | |
Per share operating performance
(for a share outstanding throughout the year) | | | | | | | | | | | | | | | | | | | | |
| | | | | |
Net asset value, beginning of year | | | $7.42 | | | | $6.37 | | | | $9.27 | | | | $10.26 | | | | $10.58 | |
| | | | |
| | | | | |
| Income from investment operationsa: | | | | | | | | | | | | | | | | | | | | |
| | | | | |
Net investment incomeb | | | 0.08 | | | | 0.05 | | | | 0.06 | | | | 0.15 | c | | | 0.13 | |
| | | | | |
Net realized and unrealized gains (losses) | | | 2.92 | | | | 1.08 | | | | (1.63 | ) | | | (0.97 | ) | | | (0.22 | ) |
| | | | |
Total from investment operations | | | 3.00 | | | | 1.13 | | | | (1.57 | ) | | | (0.82 | ) | | | (0.09 | ) |
| | | | |
| | | | | |
| Less distributions from: | | | | | | | | | | | | | | | | | | | | |
| | | | | |
Net investment income | | | (0.11 | ) | | | (0.08 | ) | | | (0.20 | ) | | | (0.17 | ) | | | (0.23 | ) |
| | | | | |
Net realized gains | | | — | | | | — | | | | (1.13 | ) | | | — | | | | — | |
| | | | |
Total distributions | | | (0.11 | ) | | | (0.08 | ) | | | (1.33 | ) | | | (0.17 | ) | | | (0.23 | ) |
| | | | |
Redemption fees | | | — | | | | — | | | | — | | | | — | d | | | — | d |
| | | | |
Net asset value, end of year | | | $10.31 | | | | $7.42 | | | | $6.37 | | | | $9.27 | | | | $10.26 | |
| | | | |
| | | | | |
Total returne | | | 40.65% | | | | 17.79% | | | | (19.42)% | | | | (8.09)% | | | | (0.73)% | |
| | | | | |
| Ratios to average net assets | | | | | | | | | | | | | | | | | | | | |
| | | | | |
Expenses before waiver and payments by affiliates | | | 1.36% | | | | 1.38% | | | | 1.33% | | | | 1.36% | | | | 1.35% | |
| | | | | |
Expenses net of waiver and payments by affiliates | | | 1.35% | f | | | 1.36% | | | | 1.32% | | | | 1.36% | g | | | 1.35% | |
| | | | | |
Net investment income | | | 0.86% | | | | 0.79% | | | | 0.74% | | | | 1.51% | c | | | 1.25% | |
| | | | | |
| Supplemental data | | | | | | | | | | | | | | | | | | | | |
| | | | | |
Net assets, end of year (000’s) | | | $105,493 | | | | $82,596 | | | | $77,000 | | | | $114,487 | | | | $145,707 | |
| | | | | |
Portfolio turnover rate | | | 10.76% | | | | 26.78% | | | | 71.69% | | | | 82.87% | | | | 44.59% | |
aThe amount shown for a share outstanding throughout the period may not correlate with the Statement of Operations for the period due to the timing of sales and repurchases of the Fund’s shares in relation to income earned and/or fluctuating fair value of the investments of the Fund.
bBased on average daily shares outstanding.
cNet investment income per share includes approximately $0.04 per share related to income received in the form of special dividends in connection with certain Fund holdings. Excluding this amount, the ratio of net investment income to average net assets would have been 1.11%.
dAmount rounds to less than $0.01 per share.
eTotal return does not include fees, charges or expenses imposed by the variable annuity and life insurance contracts for which Franklin Templeton Variable Insurance Products Trust serves as an underlying investment vehicle.
fBenefit of expense reduction rounds to less than 0.01%.
gBenefit of waiver and payments by affiliates rounds to less than 0.01%.
| | | | | | |
| | | The accompanying notes are an integral part of these financial statements. | Annual Report | | | TD-7 | |
FRANKLIN TEMPLETON VARIABLE INSURANCE PRODUCTS TRUST
FINANCIAL HIGHLIGHTS
Templeton Developing Markets VIP Fund (continued)
| | | | | | | | | | | | | | | | | | | | |
| | | Year Ended December 31, | |
| | | 2017 | | | 2016 | | | 2015 | | | 2014 | | | 2013 | |
| Class 2 | | | | | | | | | | | | | | | | | | | | |
Per share operating performance
(for a share outstanding throughout the year) | | | | | | | | | | | | | | | | | | | | |
| | | | | |
Net asset value, beginning of year | | | $7.36 | | | | $6.32 | | | | $9.20 | | | | $10.19 | | | | $10.50 | |
| | | | |
| | | | | |
| Income from investment operationsa: | | | | | | | | | | | | | | | | | | | | |
| | | | | |
Net investment incomeb | | | 0.05 | | | | 0.04 | | | | 0.04 | | | | 0.12 | c | | | 0.10 | |
| | | | | |
Net realized and unrealized gains (losses) | | | 2.91 | | | | 1.06 | | | | (1.61 | ) | | | (0.96 | ) | | | (0.21 | ) |
| | | | |
Total from investment operations | | | 2.96 | | | | 1.10 | | | | (1.57 | ) | | | (0.84 | ) | | | (0.11 | ) |
| | | | |
| | | | | |
| Less distributions from: | | | | | | | | | | | | | | | | | | | | |
| | | | | |
Net investment income | | | (0.09 | ) | | | (0.06 | ) | | | (0.18 | ) | | | (0.15 | ) | | | (0.20 | ) |
| | | | | |
Net realized gains | | | — | | | | — | | | | (1.13 | ) | | | — | | | | — | |
| | | | |
Total distributions | | | (0.09 | ) | | | (0.06 | ) | | | (1.31 | ) | | | (0.15 | ) | | | (0.20 | ) |
| | | | |
Redemption fees | | | — | | | | — | | | | — | | | | — | d | | | — | d |
| | | | |
Net asset value, end of year | | | $10.23 | | | | $7.36 | | | | $6.32 | | | | $9.20 | | | | $10.19 | |
| | | | |
| | | | | |
Total returne | | | 40.41% | | | | 17.44% | | | | (19.60)% | | | | (8.39)% | | | | (0.92)% | |
| | | | | |
| Ratios to average net assets | | | | | | | | | | | | | | | | | | | | |
| | | | | |
Expenses before waiver and payments by affiliates | | | 1.61% | | | | 1.63% | | | | 1.58% | | | | 1.61% | | | | 1.60% | |
| | | | | |
Expenses net of waiver and payments by affiliates | | | 1.60% | f | | | 1.61% | | | | 1.57% | | | | 1.61% | g | | | 1.60% | |
| | | | | |
Net investment income | | | 0.61% | | | | 0.54% | | | | 0.49% | | | | 1.26% | c | | | 1.00% | |
| | | | | |
| Supplemental data | | | | | | | | | | | | | | | | | | | | |
| | | | | |
Net assets, end of year (000’s) | | | $270,433 | | | | $205,151 | | | | $192,120 | | | | $250,813 | | | | $274,683 | |
| | | | | |
Portfolio turnover rate | | | 10.76% | | | | 26.78% | | | | 71.69% | | | | 82.87% | | | | 44.59% | |
aThe amount shown for a share outstanding throughout the period may not correlate with the Statement of Operations for the period due to the timing of sales and repurchases of the Fund’s shares in relation to income earned and/or fluctuating fair value of the investments of the Fund.
bBased on average daily shares outstanding.
cNet investment income per share includes approximately $0.04 per share related to income received in the form of special dividends in connection with certain Fund holdings. Excluding this amount, the ratio of net investment income to average net assets would have been 0.86%.
dAmount rounds to less than $0.01 per share.
eTotal return does not include fees, charges or expenses imposed by the variable annuity and life insurance contracts for which Franklin Templeton Variable Insurance Products Trust serves as an underlying investment vehicle.
fBenefit of expense reduction rounds to less than 0.01%.
gBenefit of waiver and payments by affiliates rounds to less than 0.01%.
| | | | |
| TD-8 | | Annual Report | The accompanying notes are an integral part of these financial statements. | | |
FRANKLIN TEMPLETON VARIABLE INSURANCE PRODUCTS TRUST
FINANCIAL HIGHLIGHTS
Templeton Developing Markets VIP Fund (continued)
| | | | | | | | | | | | | | | | | | | | |
| | | Year Ended December 31, | |
| | | 2017 | | | 2016 | | | 2015 | | | 2014 | | | 2013 | |
| Class 4 | | | | | | | | | | | | | | | | | | | | |
Per share operating performance
(for a share outstanding throughout the year) | | | | | | | | | | | | | | | | | | | | |
| | | | | |
Net asset value, beginning of year | | | $7.39 | | | | $6.34 | | | | $9.22 | | | | $10.20 | | | | $10.50 | |
| | | | |
| | | | | |
| Income from investment operationsa: | | | | | | | | | | | | | | | | | | | | |
| | | | | |
Net investment incomeb | | | 0.05 | | | | 0.03 | | | | 0.03 | | | | 0.12 | c | | | 0.10 | |
| | | | | |
Net realized and unrealized gains (losses) | | | 2.92 | | | | 1.06 | | | | (1.62 | ) | | | (0.97 | ) | | | (0.21 | ) |
| | | | |
Total from investment operations | | | 2.97 | | | | 1.09 | | | | (1.59 | ) | | | (0.85 | ) | | | (0.11 | ) |
| | | | |
| | | | | |
| Less distributions from: | | | | | | | | | | | | | | | | | | | | |
| | | | | |
Net investment income | | | (0.08 | ) | | | (0.04 | ) | | | (0.16 | ) | | | (0.13 | ) | | | (0.19 | ) |
| | | | | |
Net realized gains | | | — | | | | — | | | | (1.13 | ) | | | — | | | | — | |
| | | | |
Total distributions | | | (0.08 | ) | | | (0.04 | ) | | | (1.29 | ) | | | (0.13 | ) | | | (0.19 | ) |
| | | | |
Redemption fees | | | — | | | | — | | | | — | | | | — | d | | | — | d |
| | | | |
Net asset value, end of year | | | $10.28 | | | | $7.39 | | | | $6.34 | | | | $9.22 | | | | $10.20 | |
| | | | |
| | | | | |
Total returne | | | 40.30% | | | | 17.32% | | | | (19.70)% | | | | (8.48)% | | | | (1.07)% | |
| | | | | |
| Ratios to average net assets | | | | | | | | | | | | | | | | | | | | |
| | | | | |
Expenses before waiver and payments by affiliates | | | 1.71% | | | | 1.73% | | | | 1.68% | | | | 1.71% | | | | 1.70% | |
| | | | | |
Expenses net of waiver and payments by affiliates | | | 1.70% | f | | | 1.71% | | | | 1.67% | | | | 1.71% | g | | | 1.70% | |
| | | | | |
Net investment income | | | 0.51% | | | | 0.44% | | | | 0.39% | | | | 1.16% | c | | | 0.90% | |
| | | | | |
| Supplemental data | | | | | | | | | | | | | | | | | | | | |
| | | | | |
Net assets, end of year (000’s) | | | $7,199 | | | | $6,377 | | | | $7,109 | | | | $11,106 | | | | $15,225 | |
| | | | | |
Portfolio turnover rate | | | 10.76% | | | | 26.78% | | | | 71.69% | | | | 82.87% | | | | 44.59% | |
aThe amount shown for a share outstanding throughout the period may not correlate with the Statement of Operations for the period due to the timing of sales and repurchases of the Fund’s shares in relation to income earned and/or fluctuating fair value of the investments of the Fund.
bBased on average daily shares outstanding.
cNet investment income per share includes approximately $0.04 per share related to income received in the form of special dividends in connection with certain Fund holdings. Excluding this amount, the ratio of net investment income to average net assets would have been 0.76%.
dAmount rounds to less than $0.01 per share.
eTotal return does not include fees, charges or expenses imposed by the variable annuity and life insurance contracts for which Franklin Templeton Variable Insurance Products Trust serves as an underlying investment vehicle.
fBenefit of expense reduction rounds to less than 0.01%.
gBenefit of waiver and payments by affiliates rounds to less than 0.01%.
| | | | | | |
| | | The accompanying notes are an integral part of these financial statements. | Annual Report | | | TD-9 | |
FRANKLIN TEMPLETON VARIABLE INSURANCE PRODUCTS TRUST
Statement of Investments, December 31, 2017
| | | | | | | | | | | | | | |
| Templeton Developing Markets VIP Fund | |
| | | | | Industry | | | Shares | | | Value | |
| | | Common Stocks 95.5% | | | | | | | | | |
| | | Belgium 0.9% | | | | | | | | | |
| | Anheuser-Busch InBev SA/NV | | | Beverages | | | | 31,970 | | | $ | 3,572,244 | |
| | | | | | | | | | | | | | |
| | | Brazil 1.2% | | | | | | | | | |
| a | | B2W Cia Digital | | | Internet & Direct Marketing Retail | | | | 148,600 | | | | 919,652 | |
| | B3 SA - Brasil Bolsa Balcao | | | Capital Markets | | | | 55,400 | | | | 380,990 | |
| | M. Dias Branco SA | | | Food Products | | | | 136,200 | | | | 2,142,227 | |
| | Mahle-Metal Leve SA | | | Auto Components | | | | 136,600 | | | | 984,360 | |
| | | | | | | | | | | | | | |
| | | | | | | | | | | | | 4,427,229 | |
| | | | | | | | | | | | | | |
| | | Cambodia 1.0% | | | | | | | | | |
| | NagaCorp Ltd. | | | Hotels, Restaurants & Leisure | | | | 4,824,000 | | | | 3,741,713 | |
| | | | | | | | | | | | | | |
| | | China 23.5% | | | | | | | | | |
| a | | Alibaba Group Holding Ltd., ADR | | | Internet Software & Services | | | | 82,310 | | | | 14,192,713 | |
| | BAIC Motor Corp. Ltd., H | | | Automobiles | | | | 1,686,100 | | | | 2,196,957 | |
| a | | Baidu Inc., ADR | | | Internet Software & Services | | | | 14,556 | | | | 3,409,161 | |
| | Brilliance China Automotive Holdings Ltd. | | | Automobiles | | | | 8,909,300 | | | | 23,833,092 | |
| | China Life Insurance Co. Ltd., H | | | Insurance | | | | 539,000 | | | | 1,693,678 | |
| | China Mobile Ltd. | | | Wireless Telecommunication Services | | | | 490,500 | | | | 4,975,409 | |
| | China Petroleum & Chemical Corp., H | | | Oil, Gas & Consumable Fuels | | | | 5,918,000 | | | | 4,340,303 | |
| | CNOOC Ltd. | | | Oil, Gas & Consumable Fuels | | | | 2,000,500 | | | | 2,872,909 | |
| | COSCO Shipping Ports Ltd. | | | Transportation Infrastructure | | | | 1,091,638 | | | | 1,135,951 | |
| | Dah Chong Hong Holdings Ltd. | | | Distributors | | | | 1,746,100 | | | | 809,037 | |
| | Inner Mongolia Yitai Coal Co. Ltd., B | | | Oil, Gas & Consumable Fuels | | | | 441,500 | | | | 636,202 | |
| | NetEase Inc., ADR | | | Internet Software & Services | | | | 11,526 | | | | 3,977,277 | |
| | Ping An Bank Co. Ltd., A | | | Banks | | | | 1,636,500 | | | | 3,345,108 | |
| | Ping An Insurance Group Co. of China Ltd., A | | | Insurance | | | | 524,863 | | | | 5,645,787 | |
| | Poly Culture Group Corp. Ltd., H | | | Media | | | | 229,200 | | | | 462,927 | |
| | Tencent Holdings Ltd. | | | Internet Software & Services | | | | 252,800 | | | | 13,136,922 | |
| | Uni-President China Holdings Ltd. | | | Food Products | | | | 2,937,400 | | | | 2,458,846 | |
| | Weifu High-Technology Co. Ltd., B | | | Auto Components | | | | 334,339 | | | | 715,079 | |
| | | | | | | | | | | | | | |
| | | | | | | | | | | | | 89,837,358 | |
| | | | | | | | | | | | | | |
| | | Czech Republic 0.4% | | | | | | | | | |
| | Moneta Money Bank AS | | | Banks | | | | 390,403 | | | | 1,510,788 | |
| | | | | | | | | | | | | | |
| | | Hong Kong 2.8% | | | | | | | | | |
| | Dairy Farm International Holdings Ltd. | | | Food & Staples Retailing | | | | 149,333 | | | | 1,173,757 | |
| | MGM China Holdings Ltd. | | | Hotels, Restaurants & Leisure | | | | 1,731,200 | | | | 5,240,454 | |
| | Sands China Ltd. | | | Hotels, Restaurants & Leisure | | | | 807,600 | | | | 4,170,906 | |
| | | | | | | | | | | | | | |
| | | | | | | | | | | | | 10,585,117 | |
| | | | | | | | | | | | | | |
| | | Hungary 1.2% | | | | | | | | | |
| | Richter Gedeon Nyrt | | | Pharmaceuticals | | | | 177,170 | | | | 4,637,170 | |
| | | | | | | | | | | | | | |
| | | India 6.7% | | | | | | | | | |
| | Bajaj Holdings & Investment Ltd. | | | Diversified Financial Services | | | | 35,390 | | | | 1,589,529 | |
| | Biocon Ltd. | | | Biotechnology | | | | 552,287 | | | | 4,648,243 | |
| | Coal India Ltd. | | | Oil, Gas & Consumable Fuels | | | | 256,918 | | | | 1,058,217 | |
| | Glenmark Pharmaceuticals Ltd. | | | Pharmaceuticals | | | | 292,323 | | | | 2,723,357 | |
| | ICICI Bank Ltd. | | | Banks | | | | 1,806,409 | | | | 8,884,906 | |
| | Infosys Ltd. | | | IT Services | | | | 119,268 | | | | 1,946,792 | |
| | Reliance Industries Ltd. | | | Oil, Gas & Consumable Fuels | | | | 89,710 | | | | 1,294,289 | |
| | Tata Chemicals Ltd. | | | Chemicals | | | | 171,000 | | | | 1,959,509 | |
| a | | Tata Motors Ltd., A | | | Automobiles | | | | 401,271 | | | �� | 1,534,308 | |
| | | | | | | | | | | | | | |
| | | | | | | | | | | | | 25,639,150 | |
| | | | | | | | | | | | | | |
FRANKLIN TEMPLETON VARIABLE INSURANCE PRODUCTS TRUST
STATEMENT OF INVESTMENTS
Templeton Developing Markets VIP Fund (continued)
| | | | | | | | | | | | | | |
| | | | | Industry | | | Shares | | | Value | |
| | | Common Stocks (continued) | | | | | | | | | |
| | | Indonesia 3.1% | | | | | | | | | |
| | Astra International Tbk PT | | | Automobiles | | | | 10,115,100 | | | $ | 6,187,973 | |
| | Bank Danamon Indonesia Tbk PT | | | Banks | | | | 5,707,000 | | | | 2,923,431 | |
| | Perusahaan Gas Negara (Persero) Tbk PT | | | Gas Utilities | | | | 6,697,400 | | | | 863,862 | |
| | Semen Indonesia (Persero) Tbk PT | | | Construction Materials | | | | 2,764,700 | | | | 2,017,360 | |
| | | | | | | | | | | | | | |
| | | | | | | | | | | | | 11,992,626 | |
| | | | | | | | | | | | | | |
| | | Kenya 0.4% | | | | | | | | | |
| | Equity Group Holdings Ltd. | | | Banks | | | | 3,712,900 | | | | 1,439,108 | |
| | | | | | | | | | | | | | |
| | | Mexico 1.3% | | | | | | | | | |
| | Grupo Financiero Santander Mexico SAB de CV, B, ADR | | | Banks | | | | 545,057 | | | | 3,984,367 | |
| | Nemak SAB de CV | | | Auto Components | | | | 1,426,300 | | | | 1,035,133 | |
| | | | | | | | | | | | | | |
| | | | | | | | | | | | | 5,019,500 | |
| | | | | | | | | | | | | | |
| | | Nigeria 0.0%† | | | | | | | | | |
| | Nigerian Breweries PLC | | | Beverages | | | | 170,327 | | | | 63,873 | |
| | | | | | | | | | | | | | |
| | | Pakistan 0.6% | | | | | | | | | |
| | Habib Bank Ltd. | | | Banks | | | | 1,550,000 | | | | 2,338,302 | |
| | | | | | | | | | | | | | |
| | | Peru 1.1% | | | | | | | | | |
| | Compania de Minas Buenaventura SA, ADR | | | Metals & Mining | | | | 299,680 | | | | 4,219,494 | |
| | | | | | | | | | | | | | |
| | | Philippines 0.3% | | | | | | | | | |
| | BDO Unibank Inc. | | | Banks | | | | 327,469 | | | | 1,073,787 | |
| | | | | | | | | | | | | | |
| | | Russia 7.3% | | | | | | | | | |
| | Gazprom PJSC, ADR | | | Oil, Gas & Consumable Fuels | | | | 666,900 | | | | 2,941,029 | |
| | LUKOIL PJSC, ADR | | | Oil, Gas & Consumable Fuels | | | | 95,300 | | | | 5,453,066 | |
| a,b | | Mail.Ru Group Ltd., GDR, Reg S | | | Internet Software & Services | | | | 179,485 | | | | 5,187,116 | |
| | MMC Norilsk Nickel PJSC, ADR | | | Metals & Mining | | | | 137,400 | | | | 2,574,876 | |
| | Sberbank of Russia PJSC, ADR | | | Banks | | | | 402,166 | | | | 6,808,670 | |
| a | | Yandex NV, A | | | Internet Software & Services | | | | 150,078 | | | | 4,915,055 | |
| | | | | | | | | | | | | | |
| | | | | | | | | | | | | 27,879,812 | |
| | | | | | | | | | | | | | |
| | | Singapore 0.1% | | | | | | | | | |
| | DBS Group Holdings Ltd. | | | Banks | | | | 25,706 | | | | 477,603 | |
| | | | | | | | | | | | | | |
| | | South Africa 8.2% | | | | | | | | | |
| | Massmart Holdings Ltd. | | | Food & Staples Retailing | | | | 293,714 | | | | 3,312,603 | |
| | MTN Group Ltd. | | | Wireless Telecommunication Services | | | | 80,702 | | | | 891,007 | |
| | Naspers Ltd., N | | | Media | | | | 97,448 | | | | 27,180,907 | |
| | | | | | | | | | | | | | |
| | | | | | | | | | | | | 31,384,517 | |
| | | | | | | | | | | | | | |
| | | South Korea 17.3% | | | | | | | | | |
| | Daelim Industrial Co. Ltd. | | | Construction & Engineering | | | | 50,242 | | | | 3,878,619 | |
| | Fila Korea Ltd. | | | Textiles, Apparel & Luxury Goods | | | | 33,470 | | | | 2,558,756 | |
| | Hankook Tire Co. Ltd. | | | Auto Components | | | | 21,600 | | | | 1,104,916 | |
| | Hankook Tire Worldwide Co. Ltd. | | | Diversified Financial Services | | | | 37,500 | | | | 664,012 | |
| | Hanon Systems | | | Auto Components | | | | 292,362 | | | | 3,807,314 | |
| | Hite Jinro Co. Ltd. | | | Beverages | | | | 64,320 | | | | 1,452,266 | |
| | Hyundai Development Co-Engineering & Construction | | | Construction & Engineering | | | | 126,830 | | | | 4,580,674 | |
| | iMarketKorea Inc. | | | Trading Companies & Distributors | | | | 70,490 | | | | 595,025 | |
| | Interpark Holdings Corp. | | | Internet & Direct Marketing Retail | | | | 142,053 | | | | 524,360 | |
| | KT Skylife Co. Ltd. | | | Media | | | | 176,060 | | | | 2,218,533 | |
| | LG Corp. | | | Industrial Conglomerates | | | | 19,524 | | | | 1,664,536 | |
| | Naver Corp. | | | Internet Software & Services | | | | 2,573 | | | | 2,097,210 | |
| | POSCO | | | Metals & Mining | | | | 13,592 | | | | 4,234,070 | |
| | Samsung Electronics Co. Ltd. | | | Technology Hardware, Storage & Peripherals | | | | 12,367 | | | | 29,522,067 | |
FRANKLIN TEMPLETON VARIABLE INSURANCE PRODUCTS TRUST
STATEMENT OF INVESTMENTS
Templeton Developing Markets VIP Fund (continued)
| | | | | | | | | | | | |
| | | | | Industry | | Shares | | | Value | |
| | | Common Stocks (continued) | | | | | | | | |
| | | South Korea (continued) | | | | | | | | |
| | SK Hynix Inc. | | Semiconductors & Semiconductor Equipment | | | 96,260 | | | $ | 6,899,065 | |
| | Youngone Corp. | | Textiles, Apparel & Luxury Goods | | | 22,200 | | | | 655,159 | |
| | | | | | | | | | | | |
| | | | | | | | | | | 66,456,582 | |
| | | | | | | | | | | | |
| | | Taiwan 10.4% | | | | | | | | |
| | Catcher Technology Co. Ltd. | | Technology Hardware, Storage & Peripherals | | | 341,000 | | | | 3,770,115 | |
| | FIT Hon Teng Ltd. | | Electronic Equipment, Instruments & Components | | | 1,759,800 | | | | 1,191,543 | |
| | Hon Hai Precision Industry Co. Ltd. | | Electronic Equipment, Instruments & Components | | | 2,327,500 | | | | 7,468,838 | |
| | Largan Precision Co. Ltd. | | Electronic Equipment, Instruments & Components | | | 14,000 | | | | 1,897,057 | |
| | Pegatron Corp. | | Technology Hardware, Storage & Peripherals | | | 973,800 | | | | 2,363,353 | |
| | Taiwan Semiconductor Manufacturing Co. Ltd. | | Semiconductors & Semiconductor Equipment | | | 3,001,000 | | | | 23,215,340 | |
| | | | | | | | | | | | |
| | | | | | | | | | | 39,906,246 | |
| | | | | | | | | | | | |
| | | Thailand 3.9% | | | | | | | | |
| | Kasikornbank PCL, fgn | | Banks | | | 619,500 | | | | 4,545,916 | |
| | Kiatnakin Bank PCL, fgn | | Banks | | | 1,009,800 | | | | 2,457,066 | |
| | Land and Houses PCL, fgn | | Real Estate Management & Development | | | 4,853,900 | | | | 1,564,813 | |
| | PTT Exploration and Production PCL, fgn | | Oil, Gas & Consumable Fuels | | | 584,500 | | | | 1,794,596 | |
| | Siam Commercial Bank PCL, fgn | | Banks | | | 306,400 | | | | 1,411,115 | |
| | Thai Beverage PCL, fgn | | Beverages | | | 4,816,500 | | | | 3,313,032 | |
| | | | | | | | | | | | |
| | | | | | | | | | | 15,086,538 | |
| | | | | | | | | | | | |
| | | United Kingdom 3.0% | | | | | | | | |
| | Unilever PLC | | Personal Products | | | 206,804 | | | | 11,521,633 | |
| | | | | | | | | | | | |
| | | United States 0.8% | | | | | | | | |
| a | | IMAX Corp. | | Media | | | 134,442 | | | | 3,112,332 | |
| | | | | | | | | | | | |
| | | | |
| | Total Common Stocks (Cost $243,258,667) | | | | | | | | | 365,922,722 | |
| | | | | | | | | | | | |
| c | | Participatory Notes 0.6% | | | | | | | | | | |
| | | Saudi Arabia 0.6% | | | | | | | | |
| | Deutsche Bank AG/London, Samba Financial Group, 8/03/20 | | Banks | | | 88,055 | | | | 546,132 | |
| | HSBC Bank PLC, Saudi Basic Industries Corp., 1/22/18 | | Chemicals | | | 66,324 | | | | 1,803,869 | |
| | | | | | | | | | | | |
| | | | |
| | Total Participatory Notes (Cost $1,923,033) | | | | | | | | | 2,350,001 | |
| | | | | | | | | | | | |
| | Preferred Stocks 3.7% | | | | | | | | | | |
| | | Brazil 3.7% | | | | | | | | |
| d | | Banco Bradesco SA, 3.687%, ADR, pfd | | Banks | | | 627,815 | | | | 6,428,826 | |
| d | | Itau Unibanco Holding SA, 3.67%, ADR, pfd | | Banks | | | 589,962 | | | | 7,669,506 | |
| | | | | | | | | | | | |
| | | | |
| | Total Preferred Stocks (Cost $6,333,451) | | | | | | | | | 14,098,332 | |
| | | | | | | | | | | | |
| | | | |
| | Total Investments before Short Term Investments (Cost $251,515,151) | | | | | | | | | 382,371,055 | |
| | | | | | | | | | | | |
FRANKLIN TEMPLETON VARIABLE INSURANCE PRODUCTS TRUST
STATEMENT OF INVESTMENTS
Templeton Developing Markets VIP Fund (continued)
| | | | | | | | | | | | | | |
| | | | | | | | Shares | | | Value | |
| | Short Term Investments (Cost $1,128,203) 0.3% | | | | | | | | | | | | |
| | Money Market Funds 0.3% | | | | | | | | | | | | |
| | | United States 0.3% | | | | | | | | | |
| e,f | | Institutional Fiduciary Trust Money Market Portfolio, 0.89% | | | | | | | 1,128,203 | | | $ | 1,128,203 | |
| | | | | | | | | | | | | | |
| | Total Investments (Cost $252,643,354) 100.1% | | | | | | | | | | | 383,499,258 | |
| | Other Assets, less Liabilities (0.1)% | | | | | | | | | | | (374,154 | ) |
| | | | | | | | | | | | | | |
| | Net Assets 100.0% | | | | | | | | | | $ | 383,125,104 | |
| | | | | | | | | | | | | | |
See Abbreviations on page TD-23.
†Rounds to less than 0.1% of net assets.
aNon-income producing.
bSecurity was purchased pursuant to Regulation S under the Securities Act of 1933, which exempts from registration securities offered and sold outside of the United States. Such a security cannot be sold in the United States without either an effective registration statement filed pursuant to the Securities Act of 1933, or pursuant to an exemption from registration. This security has been deemed liquid under guidelines approved by the Trust’s Board of Trustees. At December 31, 2017, the value of this security was $5,187,116, representing 1.4% of net assets.
cSee Note 1(c) regarding Participatory Notes.
dVariable rate security. The rate shown represents the yield at period end.
eSee Note 3(e) regarding investments in affiliated management investment companies.
fThe rate shown is the annualized seven-day yield at period end.
| | | | | | |
| | | The accompanying notes are an integral part of these financial statements. | Annual Report | | | TD-13 | |
FRANKLIN TEMPLETON VARIABLE INSURANCE PRODUCTS TRUST
Financial Statements
Statement of Assets and Liabilities
December 31, 2017
| | | | |
| | | Templeton
Developing Markets
VIP Fund | |
Assets: | | | | |
Investments in securities: | | | | |
Cost - Unaffiliated issuers | | $ | 251,515,151 | |
Cost - Non-controlled affiliates (Note 3e) | | | 1,128,203 | |
| | | | |
Value - Unaffiliated issuers | | $ | 382,371,055 | |
Value - Non-controlled affiliates (Note 3e) | | | 1,128,203 | |
Receivables: | | | | |
Capital shares sold | | | 293,848 | |
Dividends | | | 1,047,093 | |
Foreign tax refund | | | 24,025 | |
Other assets | | | 37 | |
| | | | |
Total assets | | | 384,864,261 | |
| | | | |
Liabilities: | | | | |
Payables: | | | | |
Capital shares redeemed | | | 374,617 | |
Management fees | | | 396,461 | |
Distribution fees | | | 116,462 | |
Deferred tax | | | 662,038 | |
Accrued expenses and other liabilities | | | 189,579 | |
| | | | |
Total liabilities | | | 1,739,157 | |
| | | | |
Net assets, at value | | $ | 383,125,104 | |
| | | | |
Net assets consist of: | | | | |
Paid-in capital | | $ | 279,397,363 | |
Undistributed net investment income | | | 1,595,154 | |
Net unrealized appreciation (depreciation) | | | 130,180,412 | |
Accumulated net realized gain (loss) | | | (28,047,825 | ) |
| | | | |
Net assets, at value | | $ | 383,125,104 | |
| | | | |
| |
| Class 1: | | | | |
Net assets, at value | | $ | 105,492,696 | |
| | | | |
Shares outstanding | | | 10,227,498 | |
| | | | |
Net asset value and maximum offering price per share | | $ | 10.31 | |
| | | | |
| |
| Class 2: | | | | |
Net assets, at value | | $ | 270,433,425 | |
| | | | |
Shares outstanding | | | 26,441,621 | |
| | | | |
Net asset value and maximum offering price per share | | $ | 10.23 | |
| | | | |
| |
| Class 4: | | | | |
Net assets, at value | | $ | 7,198,983 | |
| | | | |
Shares outstanding | | | 700,382 | |
| | | | |
Net asset value and maximum offering price per share | | $ | 10.28 | |
| | | | |
| | | | |
| TD-14 | | Annual Report | The accompanying notes are an integral part of these financial statements. | | |
FRANKLIN TEMPLETON VARIABLE INSURANCE PRODUCTS TRUST
FINANCIAL STATEMENTS
Statement of Operations
for the year ended December 31, 2017
| | | | |
| | | Templeton
Developing Markets
VIP Fund | |
Investment income: | | | | |
Dividends: (net of foreign taxes)* | | | | |
Unaffiliated issuers | | $ | 7,749,767 | |
Non-controlled affiliates (Note 3e) | | | 16,602 | |
| | | | |
Total investment income | | | 7,766,369 | |
| | | | |
Expenses: | | | | |
Management fees (Note 3a) | | | 4,358,250 | |
Distribution fees: (Note 3c) | | | | |
Class 2 | | | 615,493 | |
Class 4 | | | 23,821 | |
Custodian fees (Note 4) | | | 115,586 | |
Reports to shareholders | | | 165,956 | |
Professional fees | | | 80,869 | |
Trustees’ fees and expenses | | | 1,428 | |
Other | | | 43,857 | |
| | | | |
Total expenses | | | 5,405,260 | |
Expense reductions (Note 4) | | | (92 | ) |
Expenses waived/paid by affiliates (Note 3e) | | | (13,236 | ) |
| | | | |
Net expenses | | | 5,391,932 | |
| | | | |
Net investment income | | | 2,374,437 | |
| | | | |
Realized and unrealized gains (losses): | | | | |
Net realized gain (loss) from: | | | | |
Investments: | | | | |
Unaffiliated issuers | | | 15,797,502 | |
Foreign currency transactions | | | 74,401 | |
| | | | |
Net realized gain (loss) | | | 15,871,903 | |
| | | | |
Net change in unrealized appreciation (depreciation) on: | | | | |
Investments: | | | | |
Unaffiliated issuers | | | 98,134,621 | |
Translation of other assets and liabilities denominated in foreign currencies | | | 20,125 | |
Change in deferred taxes on unrealized appreciation | | | (392,645 | ) |
| | | | |
Net change in unrealized appreciation (depreciation) | | | 97,762,101 | |
| | | | |
Net realized and unrealized gain (loss) | | | 113,634,004 | |
| | | | |
Net increase (decrease) in net assets resulting from operations | | $ | 116,008,441 | |
| | | | |
*Foreign taxes withheld on dividends | | $ | 1,176,928 | |
| | | | | | |
| | | The accompanying notes are an integral part of these financial statements. | Annual Report | | | TD-15 | |
FRANKLIN TEMPLETON VARIABLE INSURANCE PRODUCTS TRUST
FINANCIAL STATEMENTS
Statements of Changes in Net Assets
| | | | | | | | |
| | | Templeton Developing
Markets VIP Fund | |
| | | Year Ended December 31, | |
| | | 2017 | | | 2016 | |
Increase (decrease) in net assets: | | | | | | | | |
Operations: | | | | | | | | |
Net investment income | | $ | 2,374,437 | | | $ | 1,776,761 | |
Net realized gain (loss) | | | 15,871,903 | | | | 10,092,119 | |
Net change in unrealized appreciation (depreciation) | | | 97,762,101 | | | | 34,428,227 | |
| | | | |
Net increase (decrease) in net assets resulting from operations | | | 116,008,441 | | | | 46,297,107 | |
| | | | |
Distributions to shareholders from: | | | | | | | | |
Net investment income: | | | | | | | | |
Class 1 | | | (1,158,124 | ) | | | (875,959 | ) |
Class 2 | | | (2,409,152 | ) | | | (1,674,699 | ) |
Class 4 | | | (56,318 | ) | | | (44,436 | ) |
| | | | |
Total distributions to shareholders | | | (3,623,594 | ) | | | (2,595,094 | ) |
| | | | |
Capital share transactions: (Note 2) | | | | | | | | |
Class 1 | | | (8,439,257 | ) | | | (6,421,627 | ) |
Class 2 | | | (13,542,309 | ) | | | (17,591,736 | ) |
Class 4 | | | (1,401,998 | ) | | | (1,794,556 | ) |
| | | | |
Total capital share transactions | | | (23,383,564 | ) | | | (25,807,919 | ) |
| | | | |
Net increase (decrease) in net assets | | | 89,001,283 | | | | 17,894,094 | |
Net assets: | | | | | | | | |
Beginning of year | | | 294,123,821 | | | | 276,229,727 | |
| | | | |
End of year | | $ | 383,125,104 | | | $ | 294,123,821 | |
| | | | |
Undistributed net investment income included in net assets: | | | | | | | | |
End of year | | $ | 1,595,154 | | | $ | — | |
| | | | |
Distributions in excess of net investment income included in net assets: | | | | | | | | |
End of year | | $ | — | | | $ | (1,674,192 | ) |
| | | | |
| | | | |
| TD-16 | | Annual Report | The accompanying notes are an integral part of these financial statements. | | |
FRANKLIN TEMPLETON VARIABLE INSURANCE PRODUCTS TRUST
Notes to Financial Statements
Templeton Developing Markets VIP Fund
1. Organization and Significant Accounting Policies
Franklin Templeton Variable Insurance Products Trust (Trust) is registered under the Investment Company Act of 1940 (1940 Act) as an open-end management investment company, consisting of eighteen separate funds and applies the specialized accounting and reporting guidance in U.S. Generally Accepted Accounting Principles (U.S. GAAP). Templeton Developing Markets VIP Fund (Fund) is included in this report. Shares of the Fund are generally sold only to insurance company separate accounts to fund the benefits of variable life insurance policies or variable annuity contracts. The Fund offers three classes of shares: Class 1, Class 2 and Class 4. Each class of shares may differ by its distribution fees, voting rights on matters affecting a single class and its exchange privilege.
The following summarizes the Fund’s significant accounting policies.
a. Financial Instrument Valuation
The Fund’s investments in financial instruments are carried at fair value daily. Fair value is the price that would be received to sell an asset or paid to transfer a liability in an orderly transaction between market participants on the measurement date. The Fund calculates the net asset value (NAV) per share as of 4 p.m. Eastern time each day the New York Stock Exchange (NYSE) is open for trading. Under compliance policies and procedures approved by the Trust’s Board of Trustees (the Board), the Fund’s administrator has responsibility for oversight of valuation, including leading the cross-functional Valuation Committee (VC). The VC provides administration and oversight of the Fund’s valuation policies and procedures, which are approved annually by the Board. Among other things, these procedures allow the Fund to utilize independent pricing services, quotations from securities and financial instrument dealers, and other market sources to determine fair value.
Equity securities listed on an exchange or on the NASDAQ National Market System are valued at the last quoted sale price or the official closing price of the day, respectively. Foreign equity securities are valued as of the close of trading on the foreign stock exchange on which the security is primarily traded, or as of 4 p.m. Eastern time. The value is then converted into its U.S. dollar equivalent at the foreign exchange rate in effect at 4 p.m. Eastern time on the day that the value of the security is determined. Over-the-counter (OTC) securities are
valued within the range of the most recent quoted bid and ask prices. Securities that trade in multiple markets or on multiple exchanges are valued according to the broadest and most representative market. Certain equity securities are valued based upon fundamental characteristics or relationships to similar securities.
Investments in open-end mutual funds are valued at the closing NAV.
The Fund has procedures to determine the fair value of financial instruments for which market prices are not reliable or readily available. Under these procedures, the VC convenes on a regular basis to review such financial instruments and considers a number of factors, including significant unobservable valuation inputs, when arriving at fair value. The VC primarily employs a market-based approach which may use related or comparable assets or liabilities, recent transactions, market multiples, book values, and other relevant information for the investment to determine the fair value of the investment. An income-based valuation approach may also be used in which the anticipated future cash flows of the investment are discounted to calculate fair value. Discounts may also be applied due to the nature or duration of any restrictions on the disposition of the investments. Due to the inherent uncertainty of valuations of such investments, the fair values may differ significantly from the values that would have been used had an active market existed. The VC employs various methods for calibrating these valuation approaches including a regular review of key inputs and assumptions, transactional back-testing or disposition analysis, and reviews of any related market activity.
Trading in securities on foreign securities stock exchanges and OTC markets may be completed before 4 p.m. Eastern time. In addition, trading in certain foreign markets may not take place on every Fund’s business day. Occasionally, events occur between the time at which trading in a foreign security is completed and 4 p.m. Eastern time that might call into question the reliability of the value of a portfolio security held by the Fund. As a result, differences may arise between the value of the Fund’s portfolio securities as determined at the foreign market close and the latest indications of value at 4 p.m. Eastern time. In order to minimize the potential for these differences, the VC monitors price movements following the close of trading in foreign stock markets through a series of country specific market proxies (such as baskets of American Depositary Receipts, futures contracts and exchange traded funds). These price movements are measured against
FRANKLIN TEMPLETON VARIABLE INSURANCE PRODUCTS TRUST
NOTES TO FINANCIAL STATEMENTS
Templeton Developing Markets VIP Fund (continued)
1. Organization and Significant Accounting
Policies (continued)
a. Financial Instrument Valuation (continued)
established trigger thresholds for each specific market proxy to assist in determining if an event has occurred that may call into question the reliability of the values of the foreign securities held by the Fund. If such an event occurs, the securities may be valued using fair value procedures, which may include the use of independent pricing services.
When the last day of the reporting period is a non-business day, certain foreign markets may be open on those days that the Fund’s NAV is not calculated, which could result in differences between the value of the Fund’s portfolio securities on the last business day and the last calendar day of the reporting period. Any significant security valuation changes due to an open foreign market are adjusted and reflected by the Fund for financial reporting purposes.
b. Foreign Currency Translation
Portfolio securities and other assets and liabilities denominated in foreign currencies are translated into U.S. dollars based on the exchange rate of such currencies against U.S. dollars on the date of valuation. The Fund may enter into foreign currency exchange contracts to facilitate transactions denominated in a foreign currency. Purchases and sales of securities, income and expense items denominated in foreign currencies are translated into U.S. dollars at the exchange rate in effect on the transaction date. Portfolio securities and assets and liabilities denominated in foreign currencies contain risks that those currencies will decline in value relative to the U.S. dollar. Occasionally, events may impact the availability or reliability of foreign exchange rates used to convert the U.S. dollar equivalent value. If such an event occurs, the foreign exchange rate will be valued at fair value using procedures established and approved by the Board.
The Fund does not separately report the effect of changes in foreign exchange rates from changes in market prices on securities held. Such changes are included in net realized and unrealized gain or loss from investments in the Statement of Operations.
Realized foreign exchange gains or losses arise from sales of foreign currencies, currency gains or losses realized between the trade and settlement dates on securities transactions and the difference between the recorded amounts of dividends, interest, and foreign withholding taxes and the U.S. dollar equivalent of
the amounts actually received or paid. Net unrealized foreign exchange gains and losses arise from changes in foreign exchange rates on foreign denominated assets and liabilities other than investments in securities held at the end of the reporting period.
c. Participatory Notes
The Fund invests in Participatory Notes (P-Notes). P-Notes are promissory notes that are designed to offer a return linked to the performance of a particular underlying equity security or market. P-Notes are issued by banks or broker-dealers and allow the Fund to gain exposure to common stocks in certain foreign markets without registering with the market regulator. Income received from P-Notes is recorded as dividend income in the Statement of Operations. P-Notes may contain various risks including the potential inability of the counterparty to fulfill their obligations under the terms of the contract. These securities may be more volatile and less liquid than other investments held by the Fund.
d. Income and Deferred Taxes
It is the Fund’s policy to qualify as a regulated investment company under the Internal Revenue Code. The Fund intends to distribute to shareholders substantially all of its taxable income and net realized gains to relieve it from federal income and if applicable, excise taxes. As a result, no provision for U.S. federal income taxes is required.
The Fund may be subject to foreign taxation related to income received, capital gains on the sale of securities and certain foreign currency transactions in the foreign jurisdictions in which it invests. Foreign taxes, if any, are recorded based on the tax regulations and rates that exist in the foreign markets in which the Fund invests. When a capital gain tax is determined to apply, the Fund records an estimated deferred tax liability in an amount that would be payable if the securities were disposed of on the valuation date.
The Fund may recognize an income tax liability related to its uncertain tax positions under U.S. GAAP when the uncertain tax position has a less than 50% probability that it will be sustained upon examination by the tax authorities based on its technical merits. As of December 31, 2017, the Fund has determined that no tax liability is required in its financial statements related to uncertain tax positions for any open tax years (or expected to be taken in future tax years). Open tax
FRANKLIN TEMPLETON VARIABLE INSURANCE PRODUCTS TRUST
NOTES TO FINANCIAL STATEMENTS
Templeton Developing Markets VIP Fund (continued)
years are those that remain subject to examination and are based on the statute of limitations in each jurisdiction in which the Fund invests.
e. Security Transactions, Investment Income, Expenses and Distributions
Security transactions are accounted for on trade date. Realized gains and losses on security transactions are determined on a specific identification basis. Estimated expenses are accrued daily. Dividend income is recorded on the ex-dividend date except for certain dividends from securities where the dividend rate is not available. In such cases, the dividend is recorded as soon as the information is received by the Fund. Distributions to shareholders are recorded on the ex-dividend date. Distributable earnings are determined according to income tax regulations (tax basis) and may differ from earnings recorded in accordance with U.S. GAAP. These differences may be permanent or temporary. Permanent differences are reclassified among capital accounts to reflect their tax character. These reclassifications have no impact on net assets or the results of operations. Temporary differences are not reclassified, as they may reverse in subsequent periods.
Common expenses incurred by the Trust are allocated among the Funds based on the ratio of net assets of each Fund to the combined net assets of the Trust. Fund specific expenses are charged directly to the Fund that incurred the expense.
Realized and unrealized gains and losses and net investment income, excluding class specific expenses, are allocated daily to each class of shares based upon the relative proportion of net assets of each class. Differences in per share distributions by class are generally due to differences in class specific expenses.
f. Accounting Estimates
The preparation of financial statements in accordance with U.S. GAAP requires management to make estimates and assumptions that affect the reported amounts of assets and liabilities at the date of the financial statements and the amounts of income and expenses during the reporting period. Actual results could differ from those estimates.
g. Guarantees and Indemnifications
Under the Trust’s organizational documents, its officers and trustees are indemnified by the Trust against certain liabilities arising out of the performance of their duties to the Trust. Additionally, in the normal course of business, the Trust, on behalf of the Fund, enters into contracts with service providers that contain general indemnification clauses. The Trust’s maximum exposure under these arrangements is unknown as this would involve future claims that may be made against the Trust that have not yet occurred. Currently, the Trust expects the risk of loss to be remote.
2. Shares of Beneficial Interest
At December 31, 2017, there were an unlimited number of shares authorized (without par value). Transactions in the Fund’s shares were as follows:
| | | | | | | | | | | | | | | | | | | | |
| | | Year Ended December 31, | |
| | | 2017 | | | | | | 2016 | |
| | | Shares | | | Amount | | | | | | Shares | | | Amount | |
| | | | | |
| Class 1 Shares: | | | | | | | | | | | | | | | | | | | | |
Shares sold | | | 1,136,991 | | | $ | 10,043,847 | | | | | | | | 1,670,412 | | | $ | 11,807,302 | |
Shares issued in reinvestment of distributions | | | 132,055 | | | | 1,158,124 | | | | | | | | 130,351 | | | | 875,960 | |
Shares redeemed | | | (2,176,842 | ) | | | (19,641,228 | ) | | | | | | | (2,747,707 | ) | | | (19,104,889 | ) |
| | | | |
Net increase (decrease) | | | (907,796 | ) | | $ | (8,439,257 | ) | | | | | | | (946,944 | ) | | $ | (6,421,627 | ) |
| | | | |
| Class 2 Shares: | | | | | | | | | | | | | | | | | | | | |
Shares sold | | | 6,636,331 | | | $ | 58,458,562 | | | | | | | | 6,851,485 | | | $ | 48,325,937 | |
Shares issued in reinvestment of distributions | | | 276,596 | | | | 2,409,152 | | | | | | | | 251,080 | | | | 1,674,699 | |
Shares redeemed | | | (8,351,598 | ) | | | (74,410,023 | ) | | | | | | | (9,617,120 | ) | | | (67,592,372 | ) |
| | | | |
Net increase (decrease) | | | (1,438,671 | ) | | $ | (13,542,309 | ) | | | | | | | (2,514,555 | ) | | $ | (17,591,736 | ) |
| | | | |
FRANKLIN TEMPLETON VARIABLE INSURANCE PRODUCTS TRUST
NOTES TO FINANCIAL STATEMENTS
Templeton Developing Markets VIP Fund (continued)
2. Shares of Beneficial Interest (continued)
| | | | | | | | | | | | | | | | | | | | |
| | | Year Ended December 31, | |
| | | 2017 | | | | | | 2016 | |
| | | Shares | | | Amount | | | | | | Shares | | | Amount | |
| | | | | |
| Class 4 Shares: | | | | | | | | | | | | | | | | | | | | |
Shares sold | | | 85,028 | | | $ | 793,112 | | | | | | | | 84,033 | | | $ | 595,503 | |
Shares issued in reinvestment of distributions | | | 6,437 | | | | 56,318 | | | | | | | | 6,622 | | | | 44,436 | |
Shares redeemed | | | (253,881 | ) | | | (2,251,428 | ) | | | | | | | (348,788 | ) | | | (2,434,495 | ) |
| | | | |
Net increase (decrease) | | | (162,416 | ) | | $ | (1,401,998 | ) | | | | | | | (258,133 | ) | | $ | (1,794,556 | ) |
| | | | |
3. Transactions with Affiliates
Franklin Resources, Inc. is the holding company for various subsidiaries that together are referred to as Franklin Templeton Investments. Certain officers and trustees of the Fund are also officers and/or trustees of the following subsidiaries:
| | |
| Subsidiary | | Affiliation |
Templeton Asset Management Ltd. (TAML) | | Investment manager |
Franklin Templeton Services, LLC (FT Services) | | Administrative manager |
Franklin Templeton Distributors, Inc. (Distributors) | | Principal underwriter |
Franklin Templeton Investor Services, LLC (Investor Services) | | Transfer agent |
a. Management Fees
The Fund pays an investment management fee to TAML based on the average daily net assets of the Fund as follows:
| | |
| Annualized Fee Rate | | Net Assets |
1.250% | | Up to and including $200 million |
1.235% | | Over $200 million, up to and including $700 million |
1.200% | | Over $700 million, up to and including $1 billion |
1.150% | | Over $1 billion, up to and including $1.2 billion |
1.125% | | Over $1.2 billion, up to and including $5 billion |
1.075% | | Over $5 billion, up to and including $10 billion |
1.025% | | Over $10 billion, up to and including $15 billion |
0.975% | | Over $15 billion, up to and including $20 billion |
0.925% | | In excess of $20 billion |
For the year ended December 31, 2017, the gross effective investment management fee rate was 1.243% of the Fund’s average daily net assets.
b. Administrative Fees
Under an agreement with TAML, FT Services provides administrative services to the Fund. The fee is paid by TAML based on the Fund’s average daily net assets, and is not an additional expense of the Fund.
FRANKLIN TEMPLETON VARIABLE INSURANCE PRODUCTS TRUST
NOTES TO FINANCIAL STATEMENTS
Templeton Developing Markets VIP Fund (continued)
c. Distribution Fees
The Board has adopted distribution plans for Class 2 and Class 4 shares pursuant to Rule 12b-1 under the 1940 Act. Under the Fund’s compensation distribution plans, the Fund pays Distributors for costs incurred in connection with the servicing, sale and distribution of the Fund’s shares up to 0.25% and 0.35% per year of its average daily net assets of Class 2 and Class 4, respectively. The plan year, for purposes of monitoring compliance with the maximum annual plan rates, is February 1 through January 31.
d. Transfer Agent Fees
Investor Services, under terms of an agreement, performs shareholder servicing for the Fund and is not paid by the Fund for the services.
e. Investments in Affiliated Management Investment Companies
The Fund invests in one or more affiliated management investment companies for purposes other than exercising a controlling influence over the management or policies. Management fees paid by the Fund are waived on assets invested in the affiliated management investment companies, as noted in the Statement of Operations, in an amount not to exceed the management and administrative fees paid directly or indirectly by each affiliate. Prior to January 1, 2014, the waiver was accounted for as a reduction to management fees. During the year ended December 31, 2017, the Fund held investments in affiliated management investment companies as follows:
| | | | | | | | | | | | | | | | | | | | | | | | | | | | | | | | |
| | | Number
of Shares
Held at
Beginning
of Year | | | Gross
Additions | | | Gross
Reductions | | | Number
of Shares
Held at
End of
Year | | | Value at
End of
Year | | | Dividend
Income | | | Realized
Gain
(Loss) | | | Net Change in
Unrealized
Appreciation
(Depreciation) | |
| Non-Controlled Affiliates | | | | | | | | | | | | | | | | | | | | | | | | | |
Institutional Fiduciary Trust Money Market Portfolio, 0.89% | | | 4,395,622 | | | | 55,728,619 | | | | (58,996,038 | ) | | | 1,128,203 | | | $ | 1,128,203 | | | $ | 16,602 | | | $ | — | | | $ | — | |
| | | | | | | | | | | | | | | | | | | | |
4. Expense Offset Arrangement
The Fund has entered into an arrangement with its custodian whereby credits realized as a result of uninvested cash balances are used to reduce a portion of the Fund’s custodian expenses. During the year ended December 31, 2017, the custodian fees were reduced as noted in the Statement of Operations.
5. Income Taxes
For tax purposes, capital losses may be carried over to offset future capital gains, if any. At December 31, 2017, the capital loss carryforwards were as follows:
| | | | |
Capital loss carryforwards not subject to expiration: | |
Short term | | $ | 17,661,798 | |
Long term | | | 7,528,497 | |
| | | | |
Total capital loss carryforwards | | $ | 25,190,295 | |
| | | | |
During the year ended December 31, 2017, the Fund utilized $8,216,255 of capital loss carryforwards.
The tax character of distributions paid during the years ended December 31, 2017 and 2016, was as follows:
| | | | | | | | |
| | | 2017 | | | 2016 | |
Distributions paid from ordinary income | | $ | 3,623,594 | | | $ | 2,595,094 | |
| | | | |
FRANKLIN TEMPLETON VARIABLE INSURANCE PRODUCTS TRUST
NOTES TO FINANCIAL STATEMENTS
Templeton Developing Markets VIP Fund (continued)
5. Income Taxes (continued)
At December 31, 2017, the cost of investments, net unrealized appreciation (depreciation) and undistributed ordinary income for income tax purposes were as follows:
| | | | |
Cost of investments | | $ | 256,909,704 | |
| | | | |
Unrealized appreciation | | $ | 139,816,903 | |
Unrealized depreciation | | | (13,227,349 | ) |
| | | | |
Net unrealized appreciation (depreciation) | | $ | 126,589,554 | |
| | | | |
Distributable earnings - undistributed ordinary income | | $ | 3,003,976 | |
| | | | |
Differences between income and/or capital gains as determined on a book basis and a tax basis are primarily due to differing treatment of corporate actions.
6. Investment Transactions
Purchases and sales (excluding short term securities) for the year ended December 31, 2017, aggregated $37,048,792 and $58,443,812, respectively.
7. Concentration of Risk
Investing in foreign securities may include certain risks and considerations not typically associated with investing in U.S. securities, such as fluctuating currency values and changing local and regional economic, political and social conditions, which may result in greater market volatility. In addition, certain foreign securities may not be as liquid as U.S. securities.
The United States and other nations have imposed and could impose additional sanctions on certain issuers in Russia due to regional conflicts. These sanctions could result in the devaluation of Russia’s currency, a downgrade in Russian issuers’ credit ratings, or a decline in the value and liquidity of Russian stocks or other securities. Such sanctions could also adversely affect Russia’s economy, possibly forcing the economy into a recession. The Fund may be prohibited from investing in securities issued by companies subject to such sanctions. In addition, if the Fund holds the securities of an issuer that is subject to such sanctions, an immediate freeze of that issuer’s securities could result, impairing the ability of the Fund to buy, sell, receive or deliver those securities. There is also the risk that countermeasures could be taken by Russia’s government, which could involve the seizure of the Fund’s assets. These risks could affect the value of the Fund’s portfolio. While the Fund holds securities of certain issuers impacted by the sanctions, existing investments satisfy the applicable terms and conditions of the sanctions. At December 31, 2017, the Fund had 7.3% of its net assets invested in Russia.
8. Credit Facility
The Fund, together with other U.S. registered and foreign investment funds (collectively, Borrowers), managed by Franklin Templeton Investments, are borrowers in a joint syndicated senior unsecured credit facility totaling $2 billion (Global Credit Facility) which matured on February 9, 2018. This Global Credit Facility provides a source of funds to the Borrowers for temporary and emergency purposes, including the ability to meet future unanticipated or unusually large redemption requests. Effective February 9, 2018, the Borrowers renewed the Global Credit Facility for a one year term, maturing February 8, 2019, for a total of $2 billion.
FRANKLIN TEMPLETON VARIABLE INSURANCE PRODUCTS TRUST
NOTES TO FINANCIAL STATEMENTS
Templeton Developing Markets VIP Fund (continued)
Under the terms of the Global Credit Facility, the Fund shall, in addition to interest charged on any borrowings made by the Fund and other costs incurred by the Fund, pay its share of fees and expenses incurred in connection with the implementation and maintenance of the Global Credit Facility, based upon its relative share of the aggregate net assets of all of the Borrowers, including an annual commitment fee of 0.15% based upon the unused portion of the Global Credit Facility. These fees are reflected in other expenses in the Statement of Operations. During the year ended December 31, 2017, the Fund did not use the Global Credit Facility.
9. Fair Value Measurements
The Fund follows a fair value hierarchy that distinguishes between market data obtained from independent sources (observable inputs) and the Fund’s own market assumptions (unobservable inputs). These inputs are used in determining the value of the Fund’s financial instruments and are summarized in the following fair value hierarchy:
| | • | | Level 1 – quoted prices in active markets for identical financial instruments |
| | • | | Level 2 – other significant observable inputs (including quoted prices for similar financial instruments, interest rates, prepayment speed, credit risk, etc.) |
| | • | | Level 3 – significant unobservable inputs (including the Fund’s own assumptions in determining the fair value of financial instruments) |
The input levels are not necessarily an indication of the risk or liquidity associated with financial instruments at that level.
For movements between the levels within the fair value hierarchy, the Fund has adopted a policy of recognizing the transfers as of the date of the underlying event which caused the movement.
A summary of inputs used as of December 31, 2017, in valuing the Fund’s assets carried at fair value, is as follows:
| | | | | | | | | | | | | | | | |
| | | Level 1 | | | Level 2 | | | Level 3 | | | Total | |
| | | | |
| Assets: | | | | | | | | | | | | | | | | |
Investments in Securities:a | | | | | | | | | | | | | | | | |
Equity Investmentsb | | $ | 380,021,054 | | | $ | — | | | $ | — | | | $ | 380,021,054 | |
Participatory Notes | | | — | | | | 2,350,001 | | | | — | | | | 2,350,001 | |
Short Term Investments | | | 1,128,203 | | | | — | | | | — | | | | 1,128,203 | |
| | | | |
Total Investments in Securities | | $ | 381,149,257 | | | $ | 2,350,001 | | | $ | — | | | $ | 383,499,258 | |
| | | | |
aFor detailed categories, see the accompanying Statement of Investments.
bIncludes common and preferred stocks.
10. Subsequent Events
The Fund has evaluated subsequent events through the issuance of the financial statements and determined that no events have occurred that require disclosure other than those that have already been disclosed in the financial statements.
Abbreviations
| | |
| Selected Portfolio |
| |
| ADR | | American Depositary Receipt |
| |
| GDR | | Global Depositary Receipt |
FRANKLIN TEMPLETON VARIABLE INSURANCE PRODUCTS TRUST
Report of Independent Registered Public Accounting Firm
To the Board of Trustees of Franklin Templeton Variable Insurance Products Trust and Shareholders of Templeton Developing Markets VIP Fund
Opinion on the Financial Statements
We have audited the accompanying statement of assets and liabilities, including the statement of investments, of Templeton Developing Markets VIP Fund (the “Fund”) as of December 31, 2017, the related statement of operations for the year ended December 31, 2017, the statement of changes in net assets for each of the two years in the period ended December 31, 2017, including the related notes, and the financial highlights for each of the five years in the period ended December 31, 2017 (collectively referred to as the “financial statements”). In our opinion, the financial statements present fairly, in all material respects, the financial position of the Fund as of December 31, 2017, the results of its operations for the year then ended, the changes in its net assets for each of the two years in the period ended December 31, 2017 and the financial highlights for each of the five years in the period ended December 31, 2017 in conformity with accounting principles generally accepted in the United States of America.
Basis for Opinion
These financial statements are the responsibility of the Fund’s management. Our responsibility is to express an opinion on the Fund’s financial statements based on our audits. We are a public accounting firm registered with the Public Company Accounting Oversight Board (United States) (“PCAOB”) and are required to be independent with respect to the Fund in accordance with the U.S. federal securities laws and the applicable rules and regulations of the Securities and Exchange Commission and the PCAOB.
We conducted our audits of these financial statements in accordance with the standards of the PCAOB. Those standards require that we plan and perform the audit to obtain reasonable assurance about whether the financial statements are free of material misstatement, whether due to error or fraud.
Our audits included performing procedures to assess the risks of material misstatement of the financial statements, whether due to error or fraud, and performing procedures that respond to those risks. Such procedures included examining, on a test basis, evidence regarding the amounts and disclosures in the financial statements. Our audits also included evaluating the accounting principles used and significant estimates made by management, as well as evaluating the overall presentation of the financial statements. Our procedures included confirmation of securities owned as of December 31, 2017 by correspondence with the custodian and transfer agent. We believe that our audits provide a reasonable basis for our opinion.
PricewaterhouseCoopers LLP
San Francisco, California
February 15, 2018
We have served as the auditor of one or more investment companies in the Franklin Templeton Group of Funds since 1948.
FRANKLIN TEMPLETON VARIABLE INSURANCE PRODUCTS TRUST
Tax Information (unaudited)
Templeton Developing Markets VIP Fund
At December 31, 2017, more than 50% of the Fund’s total assets were invested in securities of foreign issuers. In most instances, foreign taxes were withheld from income paid to the Fund on these investments. The Fund elects to treat foreign taxes paid as allowed under Section 853 of the Internal Revenue Code (Code). This election will allow shareholders of record as of the 2018 distribution date, to treat their proportionate share of foreign taxes paid by the Fund as having been paid directly by them. The shareholder shall consider these amounts as foreign taxes paid in the tax year in which they receive the Fund distribution.
This page intentionally left blank.
Templeton Foreign VIP Fund
This annual report for Templeton Foreign VIP Fund covers the fiscal year ended December 31, 2017.
Class 2 Performance Summary as of December 31, 2017
Average annual total return of Class 2 shares* represents the average annual change in value, assuming reinvestment of dividends and capital gains. Average returns smooth out variations in returns, which can be significant; they are not the same as year-by-year results.
| | | | | | | | | | | | |
| Periods ended 12/31/17 | | 1-Year | | | 5-Year | | | 10-Year | |
Average Annual Total Return | | | +16.69% | | | | +5.03% | | | | +1.81% | |
*The Fund has a fee waiver associated with any investment it makes in a Franklin Templeton money fund and/or other Franklin Templeton fund, contractually guaranteed through 4/30/18. Fund investment results reflect the fee waiver; without this waiver, the results would have been lower.
Performance reflects the Fund’s Class 2 operating expenses, but does not include any contract fees, expenses or sales charges. If they had been included, performance would be lower. These charges and deductions, particularly for variable life policies, can have a significant effect on contract values and insurance benefits. See the contract prospectus for a complete description of these expenses, including sales charges.
Performance data represent past performance, which does not guarantee future results. Investment return and principal value will fluctuate, and you may have a gain or loss when you sell your shares. Current performance may differ from figures shown.
Total Return Index Comparison for a Hypothetical $10,000 Investment (1/1/08–12/31/17)
The graph below shows the change in value of a hypothetical $10,000 investment in the Fund over the indicated period and includes reinvestment of any income or distributions. The Fund’s performance* is compared to the performance of the MSCI All Country World Index (ACWI) ex USA Index. One cannot invest directly in an index, and an index is not representative of the Fund’s portfolio. Please see Important Notes to Performance Information preceding the Fund Summaries.
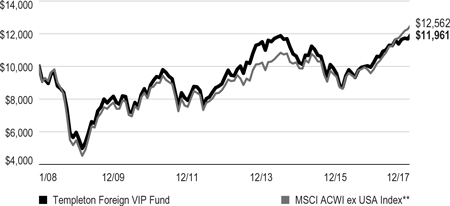
**Source: Morningstar. Please see Index Descriptions following the Fund Summaries.
TEMPLETON FOREIGN VIP FUND
Fund Goal and Main Investments
The Fund seeks long-term capital growth. Under normal market conditions, the Fund invests at least 80% of its net assets in investments of issuers located outside the US, including those in emerging markets.
Fund Risks
All investments involve risks, including possible loss of principal. Special risks are associated with foreign investing, including currency fluctuations, economic instability and political developments; investments in emerging markets involve heightened risks related to the same factors. Currency rates may fluctuate significantly over short periods of time, and can reduce returns. Because the Fund may invest its assets in companies in a specific region, including Europe, it is subject to greater risks of adverse developments in that region and/or the surrounding regions than a fund that is more broadly diversified geographically. Current political and financial uncertainty surrounding the European Union may increase market volatility and the economic risk of investing in companies in Europe. The Fund is actively managed but there is no guarantee that the manager’s investment decisions will produce the desired results. The Fund’s prospectus also includes a description of the main investment risks.
Performance Overview
You can find the Fund’s one-year total return in the Performance Summary. In comparison, the Fund’s benchmark, the MSCI ACWI ex USA Index, generated a +27.77% total return for the same period.1 Please note, index performance information is provided for reference and we do not attempt to track the index but rather undertake investments on the basis of fundamental research.
Economic and Market Overview
The global economy grew moderately during the 12-month period under review. In this environment, global developed and emerging market stocks generated a +24.62% total return, as measured by the MSCI ACWI.2 Global markets were aided by price gains in oil and other commodities, generally upbeat economic data across regions, the European Central Bank’s (ECB’s) extension of its monetary easing program, and investor
Geographic Composition
Based on Total Net Assets as of 12/31/17
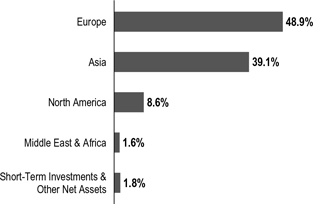
optimism about pro-growth and pro-business policies in the US. The prospect for reforms in the European Union (EU) with Emmanuel Macron’s election as France’s president, encouraging corporate earnings reports and the passage of the US tax reform bill also supported global stocks.
However, global markets reflected investor concerns about the terms of the UK’s exit from the EU, political uncertainty in the US and the EU, and geopolitical tensions in the Korean peninsula and other regions. Other concerns included the health of European banks, global oil oversupply despite a pact by major oil-producing countries to extend production cuts, and comments from key central bankers around the world about potentially raising interest rates.
After strengthening in 2017’s second and third quarters, the US economy moderated in the fourth quarter. The economy grew faster in 2017 than in 2016, however, largely due to growth in consumer spending, business investment and exports. The unemployment rate decreased from 4.7% in December 2016 to 4.1% at period-end.3 Annual inflation, as measured by the Consumer Price Index, was 2.1% in December 2016, and while it varied over the 12-month period, remained unchanged at period-end.3 The US Federal Reserve (Fed) raised its target range for the federal funds rate 0.25% three times during the period, amid signs of a growing US economy, strengthening labor market and improving business spending. At its December meeting, the Fed confirmed that the monthly balance sheet reduction would increase from US$10 billion to US$20 billion beginning in January 2018.
1. Source: Morningstar. One cannot invest directly in an index, and an index is not representative of the Fund’s portfolio. Please see Index Descriptions following the Fund Summaries.
2. Please see Index Descriptions following the Fund Summaries.
3. Source: US Bureau of Labor Statistics.
The dollar value, number of shares or principal amount, and names of all portfolio holdings are listed in the Fund’s Statement of Investments (SOI).
TEMPLETON FOREIGN VIP FUND
In Europe, the UK’s economic growth moderated in 2017 compared to 2016, largely due to slower growth in the services sector. In November, the Bank of England raised its key policy rate 0.25%, its first increase in a decade. The eurozone’s growth accelerated in 2017’s second and third quarters, but moderated in the fourth quarter. However, the eurozone’s 2017 economic growth rate was the fastest in a decade. The bloc’s annual inflation rate, while low, ended higher than in December 2016. The ECB kept its benchmark interest rate unchanged during the period. However, at its October meeting, the ECB extended the time frame for its massive bond-buying program from December 2017 to at least September 2018, while reducing the amount of monthly bond purchases in half beginning in January 2018.
In Asia, Japan’s quarterly gross domestic product (GDP) grew for the seventh consecutive quarter, although third-quarter 2017 growth was lower than the previous quarter. The Bank of Japan left its benchmark interest rate unchanged during the period and continued its monetary stimulus measures.
In emerging markets, Brazil’s quarterly GDP grew for the third consecutive quarter, although third-quarter 2017 growth slowed from the previous quarter. The country’s central bank cut its benchmark interest rate several times during the period to spur economic growth. Russia’s GDP grew in 2017’s first three quarters compared to the prior-year periods, amid the Bank of Russia’s continued policy support. China’s GDP grew faster in 2017 than in 2016, supported by solid growth in industrial production, services, fixed-asset investment, retail sales, and imports and exports. The People’s Bank of China left its benchmark interest rate unchanged during the period. Overall, emerging market stocks, as measured by the MSCI Emerging Markets Index, rose substantially during the period.2
Investment Strategy
Our investment philosophy is bottom up, value oriented and long term. When choosing investments for the Fund, we generally focus on the market price of a company’s securities relative to our evaluation of the company’s potential long-term earnings, asset value and cash flow. We also consider a company’s price/earnings ratio, profit margins and liquidation value.
| | | | |
| Top 10 Holdings | | | |
| 12/31/17 | | | |
| |
Company
Sector/Industry, Country | | % of Total Net Assets | |
Samsung Electronics Co. Ltd.
Technology Hardware, Storage & Peripherals, South Korea | | | 3.7% | |
BP PLC
Oil, Gas & Consumable Fuels, UK | | | 3.1% | |
Royal Dutch Shell PLC
Oil, Gas & Consumable Fuels, UK | | | 2.8% | |
Baidu Inc.
Internet Software & Services, China | | | 2.8% | |
SoftBank Group Corp.
Wireless Telecommunication Services, Japan | | | 2.6% | |
Wheaton Precious Metals Corp.
Metals & Mining, Canada | | | 2.5% | |
Standard Chartered PLC
Banks, UK | | | 2.3% | |
SBM Offshore NV
Energy Equipment & Services, Netherlands | | | 2.3% | |
Roche Holding AG
Pharmaceuticals, Switzerland | | | 2.1% | |
Aegon NV
Insurance, Netherlands | | | 2.0% | |
Manager’s Discussion
During the 12 months under review, all sectors represented in the Fund’s portfolio generated positive returns and contributed to absolute performance. However, the Fund underperformed its benchmark, the MSCI ACWI ex USA Index, for the review period. Stock selection and an overweighting in the energy sector detracted significantly from relative results.4 Key relative detractors within the sector included positions in drilling company Precision Drilling5,6 (Canada), oilfield services firm Petrofac5 (UK), energy equipment and services company Ensign Energy5,6 (Canada) and oil gas and consumable fuels company Cenovus Energy (Canada). Petrofac’s shares declined amid an escalating fraud investigation.
Stock selection and an overweighting in the health care sector also hampered relative results.7 Our position in pharmaceuticals firm Teva Pharmaceutical Industries (Israel) was a major detractor, as the company experienced a challenging 2017. Teva’s shares fell after management lowered its earnings guidance for 2017 and investors worried about the firm’s debt
4. The energy sector comprises energy equipment and services and oil, gas and consumable fuels in the SOI.
5. No longer held by period-end.
6. Not part of the index.
7. The health care sector comprises biotechnology, health care equipment and supplies, health care providers and services, life sciences tools and services, and pharmaceuticals in the SOI.
TEMPLETON FOREIGN VIP FUND
profile. Further pressuring shares were the loss of US patent protection for a key multiple sclerosis drug, a dividend cut and a debt rating downgrade. Encouragingly, the stock began to recover toward the end of 2017 after a seasoned chief executive officer joined the firm and announced a restructuring plan aimed at significantly reducing costs.
Stock selection in the materials sector also weighed on relative performance, particularly our investments in metals and mining companies Eldorado Gold (Canada) and Barrick Gold6 (Canada).8
Key individual detractors included media firm SES (Luxemburg), trading and manufacturing company Posco Daewoo (South Korea), and automobile producer Nissan Motor5 (Japan).
Conversely, stock selection in the financials sector, especially in banks, contributed significantly to relative results.9 Notably, our positions in Asian banks Hana Financial Group (South Korea), KB Financial Group (South Korea) and Bangkok Bank (Thailand), helped the Fund’s performance. Prospects for improving corporate governance and political stability in Asia have combined with rising interest rates and genuine economic growth to benefit the regional banking sector. South Korean banks KB and Hana also benefited from investors overlooking geopolitical tensions and domestic political turmoil in 2017 and focusing instead on improving corporate fundamentals and upgraded earnings outlooks attributable, in part, to the first South Korean interest rate hike in six years.
Stock selection and an underweighting in consumer staples also supported relative performance to a smaller extent.10 Within the sector, beverages company Kirin Holdings (Japan) contributed to performance.
Key individual contributors included semiconductor and consumer electronics company Samsung Electronics (South Korea), metals miner Sumitomo Metal Mining (Japan), storage and peripherals company Catcher Technology (Taiwan), biotechnology company Morphosys6 (Germany), internet services company Baidu (China), and oil and gas exploration and production company INPEX (Japan). Samsung Electronics reported solid operating results and strong sales in its core businesses, with 2017 sales of its newest generation of smartphones exceeding market expectations. Further boosting its shares were the cancelation of existing company-held
treasury shares and the announcement of significant dividend increases in 2017 and 2018.
From a geographic perspective, stock selection in Europe, especially in the UK, France and Italy, was a major detractor from relative performance. Stock selection in North America, particularly in Canada, also hindered relative performance. In the Middle East and Africa region, an overweighting and stock selection in Israel hurt relative results. In Asia, stock selection in China dampened relative results. In contrast, positioning in South Korea, Japan and Taiwan contributed to relative performance.
It is important to recognize the effect of currency movements on the Fund’s performance. In general, if the value of the US dollar goes up compared with a foreign currency, an investment traded in that foreign currency will go down in value because it will be worth fewer US dollars. This can have a negative effect on Fund performance. Conversely, when the US dollar weakens in relation to a foreign currency, an investment traded in that foreign currency will increase in value, which can contribute to Fund performance. For the 12 months ended December 31, 2017, the US dollar rose in value relative to certain currencies in which the Fund’s investments were traded. As a result, the Fund’s performance was negatively affected by the portfolio’s investment predominantly in securities with non-US currency exposure.
Thank you for your participation in Templeton Foreign VIP Fund. We look forward to serving your future investment needs.
The foregoing information reflects our analysis, opinions and portfolio holdings as of December 31, 2017, the end of the reporting period. The way we implement our main investment strategies and the resulting portfolio holdings may change depending on factors such as market and economic conditions. These opinions may not be relied upon as investment advice or an offer for a particular security. The information is not a complete analysis of every aspect of any market, country, industry, security or the Fund. Statements of fact are from sources considered reliable, but the investment manager makes no representation or warranty as to their completeness or accuracy. Although historical performance is no guarantee of future results, these insights may help you understand our investment management philosophy.
8. The materials sector comprises chemicals, construction materials, and metal and mining in the SOI.
9. The financials sector comprises banks, capital markets and insurance in the SOI.
10. The consumer staples sector comprises beverages in the SOI.
TEMPLETON FOREIGN VIP FUND
Class 2 Fund Expenses
As an investor in a variable insurance contract (Contract) that indirectly provides for investment in an underlying mutual fund, you can incur transaction and/or ongoing expenses at both the Fund level and the Contract Level: (1) transaction expenses can include sales charges (loads) on purchases, surrender fees, transfer fees and premium taxes; and (2) ongoing expenses can include management fees, distribution and service (12b-1) fees, contract fees, annual maintenance fees, mortality and expense risk fees and other fees and expenses. All mutual funds and Contracts have some types of ongoing expenses. The table below shows Fund-level ongoing expenses and can help you understand these costs and compare them with those of other mutual funds offered through the Contract. The table assumes a $1,000 investment held for the six months indicated. Please refer to the Fund prospectus for additional information on operating expenses.
Actual Fund Expenses
The table below provides information about the actual account values and actual expenses in the columns under the heading “Actual.” In these columns the Fund’s actual return, which includes the effect of ongoing Fund expenses but does not include the effect of ongoing Contract expenses, is used to calculate the “Ending Account Value.” You can estimate the Fund-level expenses you paid during the period by following these steps (of course, your account value and expenses will differ from those in this illustration): Divide your account value by $1,000 (if your account had an $8,600 value, then $8,600 ÷ $1,000 = 8.6). Then multiply the result by the number under the headings “Actual” and “Fund-Level Expenses Paid During Period” (if Fund-Level Expenses Paid During Period were $ 7.50, then 8.6 x $ 7.50 = $64.50). In this illustration, the estimated expenses paid this period at the Fund level are $64.50.
Hypothetical Example for Comparison with Other Mutual Funds
Under the heading “Hypothetical” in the table, information is provided about hypothetical account values and hypothetical expenses based on the Fund’s actual expense ratio and an assumed rate of return of 5% per year before expenses, which is not the Fund’s actual return. This information may not be used to estimate the actual ending account balance or expenses you paid for the period, but it can help you compare ongoing costs of investing in the Fund with those of other mutual funds offered through the Contract. To do so, compare this 5% hypothetical example with the 5% hypothetical examples that appear in the shareholder reports of other funds offered through the Contract.
Please note that expenses shown in the table are meant to highlight ongoing costs at the Fund level only and do not reflect any ongoing expenses at the Contract level, or transaction expenses at either the Fund or Contract levels. In addition, while the Fund does not have transaction expenses, if the transaction and ongoing expenses at the Contract level were included, the expenses shown below would be higher. You should consult your Contract prospectus or disclosure document for more information.
| | | | | | | | | | | | | | | | | | | | | | | | |
| | | | | | Actual
(actual return after expenses) | | | Hypothetical
(5% annual return before expenses) | | | | |
Share
Class | | Beginning Account
Value 7/1/17 | | | Ending Account
Value 12/31/17 | | | Fund-Level Expenses
Paid During Period
7/1/17–12/31/171,2 | | | Ending Account
Value 12/31/17 | | | Fund-Level Expenses
Paid During Period
7/1/17–12/31/171,2 | | | Net
Annualized
Expense
Ratio2 | |
Class 2 | | | $1,000 | | | | $1,061.00 | | | | $5.56 | | | | $1,019.81 | | | | $5.45 | | | | 1.07 | % |
1. Expenses are equal to the annualized expense ratio for the six-month period as indicated above — in the far right column — multiplied by the simple average account value over the period indicated, and then multiplied by 184/365 to reflect the one-half year period.
2. Reflects expenses after fee waivers and expense reimbursements. Does not include any ongoing expenses of the Contract for which the Fund is an investment option or acquired fund fees and expenses.
TF P1 P2 P4 07/17
SUPPLEMENT DATED JULY 11, 2017
TO THE PROSPECTUSES DATED MAY 1, 2017
TEMPLETON FOREIGN VIP FUND
(A series of Franklin Templeton Variable Insurance Products Trust)
The prospectus is amended as follows:
I. Cindy L. Sweeting, CFA, President of Investment Counsel and portfolio manager of the Fund, will be retiring effective December 31, 2017. Effective January 1, 2018, it is anticipated that she will no longer be a portfolio manager of the Fund, and Peter A. Nori will continue to be lead portfolio manager of the Fund.
II. Effective January 1, 2018, the portfolio management team under the “FUND SUMMARIES – Templeton Foreign VIP Fund – Portfolio Managers” section on page TF-S5 is replaced with the following:
Portfolio Managers
Peter A. Nori, CFA Executive Vice President/Portfolio Manager – Research Analyst of Investment Counsel and portfolio manager of the Fund since 1999.
Matthew R. Nagle, CFA Portfolio Manager of Investment Counsel and portfolio manager of the Fund since January 2018.
Heather Waddell, CFA Portfolio Manager of Investment Counsel and portfolio manager of the Fund since January 2018.
III. Effective January 1, 2018, the portfolio management team under the “FUND DETAILS – Templeton Foreign VIP Fund – Management” section on page TF-D8 is replaced with the following:
The Fund is managed by a team of dedicated professionals focused on global investment of issuers outside the U.S. The portfolio managers are as follows:
Peter A. Nori, CFA Executive Vice President/Portfolio Manager – Research Analyst of Investment Counsel
Mr. Nori has been the lead portfolio manager of the Fund since 1999. He has primary responsibility for the investment of the Fund. He has final authority over all aspects of the Fund’s investment portfolio, including but not limited to, purchases and sales of individual securities, portfolio risk assessment, and the management of daily cash balances in accordance with anticipated investment management requirements. The degree to which he may perform these functions, and the nature of these functions, may change from time to time. He joined Franklin Templeton Investments in 1987.
Matthew R. Nagle, CFA Portfolio Manager of Investment Counsel
Mr. Nagle has been a portfolio manager of the Fund since January 2018, providing research and advice on the purchases and sales of individual securities, and portfolio risk assessment. He joined Franklin Templeton Investments in 2003.
Heather Waddell, CFA Portfolio Manager of Investment Counsel
Ms. Waddell has been a portfolio manager of the Fund since January 2018, providing research and advice on the purchases and sales of individual securities, and portfolio risk assessment. She joined Franklin Templeton Investments in 1996.
CFA® and Chartered Financial Analyst® are trademarks owned by CFA Institute.
Please keep this supplement with your prospectus for future reference.
FRANKLIN TEMPLETON VARIABLE INSURANCE PRODUCTS TRUST
Financial Highlights
Templeton Foreign VIP Fund
| | | | | | | | | | | | | | | | | | | | |
| | | Year Ended December 31, | |
| | | 2017 | | | 2016 | | | 2015 | | | 2014 | | | 2013 | |
| Class 1 | | | | | | | | | | | | | | | | | | | | |
Per share operating performance (for a share outstanding throughout the year) | | | | | | | | | | | | | | | | | | | | |
| | | | | |
Net asset value, beginning of year | | | $13.89 | | | | $13.46 | | | | $15.34 | | | | $17.56 | | | | $14.63 | |
| | | | |
| | | | | |
| Income from investment operationsa: | | | | | | | | | | | | | | | | | | | | |
| | | | | |
Net investment incomeb | | | 0.30 | | | | 0.33 | | | | 0.31 | | | | 0.53 | c | | | 0.34 | |
| | | | | |
Net realized and unrealized gains (losses) | | | 2.03 | | | | 0.62 | | | | (1.16 | ) | | | (2.39 | ) | | | 3.00 | |
| | | | |
Total from investment operations | | | 2.33 | | | | 0.95 | | | | (0.85 | ) | | | (1.86 | ) | | | 3.34 | |
| | | | |
| | | | | |
| Less distributions from: | | | | | | | | | | | | | | | | | | | | |
| | | | | |
Net investment income | | | (0.42 | ) | | | (0.29 | ) | | | (0.53 | ) | | | (0.36 | ) | | | (0.41 | ) |
| | | | | |
Net realized gains | | | — | | | | (0.23 | ) | | | (0.50 | ) | | | — | | | | — | |
| | | | |
Total distributions | | | (0.42 | ) | | | (0.52 | ) | | | (1.03 | ) | | | (0.36 | ) | | | (0.41 | ) |
| | | | |
Redemption fees | | | — | | | | — | | | | — | | | | — | d | | | — | d |
| | | | |
Net asset value, end of year | | | $15.80 | | | | $13.89 | | | | $13.46 | | | | $15.34 | | | | $17.56 | |
| | | | |
| | | | | |
Total returne | | | 17.02% | | | | 7.49% | | | | (6.31)% | | | | (10.89)% | | | | 23.27% | |
| | | | | |
| Ratios to average net assets | | | | | | | | | | | | | | | | | | | | |
| | | | | |
Expenses before waiver and payments by affiliates | | | 0.82% | | | | 0.80% | | | | 0.78% | | | | 0.77% | | | | 0.78% | |
| | | | | |
Expenses net of waiver and payments by affiliates | | | 0.81% | f | | | 0.78% | | | | 0.78% | g | | | 0.77% | g | | | 0.78% | |
| | | | | |
Net investment income | | | 1.99% | | | | 2.38% | | | | 2.05% | | | | 3.11% | c | | | 2.16% | |
| | | | | |
| Supplemental data | | | | | | | | | | | | | | | | | | | | |
| | | | | |
Net assets, end of year (000’s) | | | $152,684 | | | | $133,218 | | | | $214,172 | | | | $248,355 | | | | $298,468 | |
| | | | | |
Portfolio turnover rate | | | 26.81% | | | | 20.93% | | | | 15.15% | | | | 25.71% | | | | 23.61% | |
aThe amount shown for a share outstanding throughout the period may not correlate with the Statement of Operations for the period due to the timing of sales and repurchases of the Fund’s shares in relation to income earned and/or fluctuating fair value of the investments of the Fund.
bBased on average daily shares outstanding.
cNet investment income per share includes approximately $0.16 per share related to income received in the form of special dividends in connection with certain Fund holdings. Excluding this amount, the ratio of net investment income to average net assets would have been 2.13%.
dAmount rounds to less than $0.01 per share.
eTotal return does not include fees, charges or expenses imposed by the variable annuity and life insurance contracts for which Franklin Templeton Variable Insurance Products Trust serves as an underlying investment vehicle.
fBenefit of expense reduction rounds to less than 0.01%.
gBenefit of waiver and payments by affiliates rounds to less than 0.01%.
| | | | | | |
| | | The accompanying notes are an integral part of these financial statements. | Annual Report | | | TF-7 | |
FRANKLIN TEMPLETON VARIABLE INSURANCE PRODUCTS TRUST
FINANCIAL HIGHLIGHTS
Templeton Foreign VIP Fund (continued)
| | | | | | | | | | | | | | | | | | | | |
| | | Year Ended December 31, | |
| | | 2017 | | | 2016 | | | 2015 | | | 2014 | | | 2013 | |
| Class 2 | | | | | | | | | | | | | | | | | | | | |
Per share operating performance (for a share outstanding throughout the year) | | | | | | | | | | | | | | | | | | | | |
| | | | | |
Net asset value, beginning of year | | | $13.61 | | | | $13.20 | | | | $15.05 | | | | $17.24 | | | | $14.37 | |
| | | | |
| | | | | |
| Income from investment operationsa: | | | | | | | | | | | | | | | | | | | | |
| | | | | |
Net investment incomeb | | | 0.26 | | | | 0.28 | | | | 0.27 | | | | 0.48 | c | | | 0.30 | |
| | | | | |
Net realized and unrealized gains (losses) | | | 1.98 | | | | 0.62 | | | | (1.13 | ) | | | (2.35 | ) | | | 2.94 | |
| | | | |
Total from investment operations | | | 2.24 | | | | 0.90 | | | | (0.86 | ) | | | (1.87 | ) | | | 3.24 | |
| | | | |
| | | | | |
| Less distributions from: | | | | | | | | | | | | | | | | | | | | |
| | | | | |
Net investment income | | | (0.38 | ) | | | (0.26 | ) | | | (0.49 | ) | | | (0.32 | ) | | | (0.37 | ) |
| | | | | |
Net realized gains | | | — | | | | (0.23 | ) | | | (0.50 | ) | | | — | | | | — | |
| | | | |
Total distributions | | | (0.38 | ) | | | (0.49 | ) | | | (0.99 | ) | | | (0.32 | ) | | | (0.37 | ) |
| | | | |
Redemption fees | | | — | | | | — | | | | — | | | | — | d | | | — | d |
| | | | |
Net asset value, end of year | | | $15.47 | | | | $13.61 | | | | $13.20 | | | | $15.05 | | | | $17.24 | |
| | | | |
| | | | | |
Total returne | | | 16.69% | | | | 7.18% | | | | (6.49)% | | | | (11.13)% | | | | 22.97% | |
| | | | | |
| Ratios to average net assets | | | | | | | | | | | | | | | | | | | | |
| | | | | |
Expenses before waiver and payments by affiliates | | | 1.07% | | | | 1.05% | | | | 1.03% | | | | 1.02% | | | | 1.03% | |
| | | | | |
Expenses net of waiver and payments by affiliates | | | 1.06% | f | | | 1.03% | | | | 1.03% | g | | | 1.02% | g | | | 1.03% | |
| | | | | |
Net investment income | | | 1.74% | | | | 2.13% | | | | 1.80% | | | | 2.86% | c | | | 1.91% | |
| | | | | |
| Supplemental data | | | | | | | | | | | | | | | | | | | | |
| | | | | |
Net assets, end of year (000’s) | | | $1,394,475 | | | | $1,436,518 | | | | $1,456,854 | | | | $1,645,571 | | | | $1,873,586 | |
| | | | | |
Portfolio turnover rate | | | 26.81% | | | | 20.93% | | | | 15.15% | | | | 25.71% | | | | 23.61% | |
aThe amount shown for a share outstanding throughout the period may not correlate with the Statement of Operations for the period due to the timing of sales and repurchases of the Fund’s shares in relation to income earned and/or fluctuating fair value of the investments of the Fund.
bBased on average daily shares outstanding.
cNet investment income per share includes approximately $0.16 per share related to income received in the form of special dividends in connection with certain Fund holdings. Excluding this amount, the ratio of net investment income to average net assets would have been 1.88%.
dAmount rounds to less than $0.01 per share.
eTotal return does not include fees, charges or expenses imposed by the variable annuity and life insurance contracts for which Franklin Templeton Variable Insurance Products Trust serves as an underlying investment vehicle.
fBenefit of expense reduction rounds to less than 0.01%.
gBenefit of waiver and payments by affiliates rounds to less than 0.01%.
| | | | |
| TF-8 | | Annual Report | The accompanying notes are an integral part of these financial statements. | | |
FRANKLIN TEMPLETON VARIABLE INSURANCE PRODUCTS TRUST
FINANCIAL HIGHLIGHTS
Templeton Foreign VIP Fund (continued)
| | | | | | | | | | | | | | | | | | | | |
| | | Year Ended December 31, | |
| | | 2017 | | | 2016 | | | 2015 | | | 2014 | | | 2013 | |
| Class 4 | | | | | | | | | | | | | | | | | | | | |
Per share operating performance (for a share outstanding throughout the year) | | | | | | | | | | | | | | | | | | | | |
| | | | | |
Net asset value, beginning of year | | | $13.71 | | | | $13.29 | | | | $15.16 | | | | $17.37 | | | | $14.48 | |
| | | | |
| | | | | |
| Income from investment operationsa: | | | | | | | | | | | | | | | | | | | | |
| | | | | |
Net investment incomeb | | | 0.23 | | | | 0.26 | | | | 0.25 | | | | 0.46 | c | | | 0.28 | |
| | | | | |
Net realized and unrealized gains (losses) | | | 2.03 | | | | 0.63 | | | | (1.14 | ) | | | (2.36 | ) | | | 2.97 | |
| | | | |
Total from investment operations | | | 2.26 | | | | 0.89 | | | | (0.89 | ) | | | (1.90 | ) | | | 3.25 | |
| | | | |
| | | | | |
| Less distributions from: | | | | | | | | | | | | | | | | | | | | |
| | | | | |
Net investment income | | | (0.26 | ) | | | (0.24 | ) | | | (0.48 | ) | | | (0.31 | ) | | | (0.36 | ) |
| | | | | |
Net realized gains | | | — | | | | (0.23 | ) | | | (0.50 | ) | | | — | | | | — | |
| | | | |
Total distributions | | | (0.26 | ) | | | (0.47 | ) | | | (0.98 | ) | | | (0.31 | ) | | | (0.36 | ) |
| | | | |
Redemption fees | | | — | | | | — | | | | — | | | | — | d | | | — | d |
| | | | |
Net asset value, end of year | | | $15.71 | | | | $13.71 | | | | $13.29 | | | | $15.16 | | | | $17.37 | |
| | | | |
| | | | | |
Total returne | | | 16.62% | | | | 7.09% | | | | (6.65)% | | | | (11.22)% | | | | 22.86% | |
| | | | | |
| Ratios to average net assets | | | | | | | | | | | | | | | | | | | | |
| | | | | |
Expenses before waiver and payments by affiliates | | | 1.17% | | | | 1.15% | | | | 1.13% | | | | 1.12% | | | | 1.13% | |
| | | | | |
Expenses net of waiver and payments by affiliates | | | 1.16% | f | | | 1.13% | | | | 1.13% | g | | | 1.12% | g | | | 1.13% | |
| | | | | |
Net investment income | | | 1.64% | | | | 2.03% | | | | 1.70% | | | | 2.76% | c | | | 1.81% | |
| | | | | |
| Supplemental data | | | | | | | | | | | | | | | | | | | | |
| | | | | |
Net assets, end of year (000’s) | | | $159,944 | | | | $484,763 | | | | $472,189 | | | | $503,143 | | | | $513,098 | |
| | | | | |
Portfolio turnover rate | | | 26.81% | | | | 20.93% | | | | 15.15% | | | | 25.71% | | | | 23.61% | |
aThe amount shown for a share outstanding throughout the period may not correlate with the Statement of Operations for the period due to the timing of sales and repurchases of the Fund’s shares in relation to income earned and/or fluctuating fair value of the investments of the Fund.
bBased on average daily shares outstanding.
cNet investment income per share includes approximately $0.16 per share related to income received in the form of special dividends in connection with certain Fund holdings. Excluding this amount, the ratio of net investment income to average net assets would have been 1.78%.
dAmount rounds to less than $0.01 per share.
eTotal return does not include fees, charges or expenses imposed by the variable annuity and life insurance contracts for which Franklin Templeton Variable Insurance Products Trust serves as an underlying investment vehicle.
fBenefit of expense reduction rounds to less than 0.01%.
gBenefit of waiver and payments by affiliates rounds to less than 0.01%.
| | | | | | |
| | | The accompanying notes are an integral part of these financial statements. | Annual Report | | | TF-9 | |
FRANKLIN TEMPLETON VARIABLE INSURANCE PRODUCTS TRUST
Statement of Investments, December 31, 2017
| | | | | | | | | | | | | | |
| Templeton Foreign VIP Fund | |
| | | | | Country | | | Shares | | | Value | |
| | | Common Stocks 98.2% | | | | | | | | | |
| | | Aerospace & Defense 2.5% | | | | | | | | | |
| | BAE Systems PLC | | | United Kingdom | | | | 2,720,370 | | | $ | 21,050,437 | |
| a | | Cobham PLC | | | United Kingdom | | | | 5,307,199 | | | | 9,052,056 | |
| a | | Rolls-Royce Holdings PLC, interim line | | | United Kingdom | | | | 53,065,600 | | | | 71,663 | |
| | Rolls-Royce Holdings PLC | | | United Kingdom | | | | 1,153,600 | | | | 13,195,236 | |
| | | | | | | | | | | | | | |
| | | | | | | | | | | | | 43,369,392 | |
| | | | | | | | | | | | | | |
| | | Auto Components 2.5% | | | | | | | | | |
| | Cie Generale des Etablissements Michelin, B | | | France | | | | 67,168 | | | | 9,634,316 | |
| | Hyundai Mobis Co. Ltd. | | | South Korea | | | | 79,105 | | | | 19,491,383 | |
| | Sumitomo Rubber Industries Ltd. | | | Japan | | | | 712,200 | | | | 13,247,293 | |
| | | | | | | | | | | | | | |
| | | | | | | | | | | | | 42,372,992 | |
| | | | | | | | | | | | | | |
| | | Automobiles 0.9% | | | | | | | | | |
| | Hero Motocorp Ltd. | | | India | | | | 154,059 | | | | 9,134,342 | |
| | Hyundai Motor Co. | | | South Korea | | | | 47,538 | | | | 6,947,819 | |
| | | | | | | | | | | | | | |
| | | | | | | | | | | | | 16,082,161 | |
| | | | | | | | | | | | | | |
| | | Banks 13.7% | | | | | | | | | |
| | Bangkok Bank PCL, fgn | | | Thailand | | | | 3,144,600 | | | | 21,144,225 | |
| | Barclays PLC | | | United Kingdom | | | | 6,770,066 | | | | 18,568,693 | |
| | BNP Paribas SA | | | France | | | | 427,800 | | | | 31,951,336 | |
| | Hana Financial Group Inc. | | | South Korea | | | | 494,927 | | | | 23,091,570 | |
| | HSBC Holdings PLC | | | United Kingdom | | | | 3,012,800 | | | | 30,830,409 | |
| | ING Groep NV | | | Netherlands | | | | 570,040 | | | | 10,481,289 | |
| | Kasikornbank PCL, fgn | | | Thailand | | | | 249,500 | | | | 1,830,841 | |
| | Kasikornbank PCL, NVDR | | | Thailand | | | | 1,610,500 | | | | 11,471,784 | |
| | KB Financial Group Inc., ADR | | | South Korea | | | | 437,706 | | | | 25,610,178 | |
| a | | Standard Chartered PLC | | | United Kingdom | | | | 3,816,307 | | | | 40,204,262 | |
| | United Overseas Bank Ltd. | | | Singapore | | | | 916,700 | | | | 18,128,385 | |
| | | | | | | | | | | | | | |
| | | | | | | | | | | | | 233,312,972 | |
| | | | | | | | | | | | | | |
| | | Beverages 2.0% | | | | | | | | | |
| | Kirin Holdings Co. Ltd. | | | Japan | | | | 709,500 | | | | 17,884,676 | |
| | Suntory Beverage & Food Ltd. | | | Japan | | | | 363,800 | | | | 16,174,629 | |
| | | | | | | | | | | | | | |
| | | | | | | | | | | | | 34,059,305 | |
| | | | | | | | | | | | | | |
| | | Biotechnology 1.0% | | | | | | | | | |
| | Shire PLC | | | United Kingdom | | | | 318,110 | | | | 16,754,074 | |
| | | | | | | | | | | | | | |
| | | Capital Markets 1.4% | | | | | | | | | |
| | UBS Group AG | | | Switzerland | | | | 1,326,231 | | | | 24,418,930 | |
| | | | | | | | | | | | | | |
| | | Chemicals 1.2% | | | | | | | | | |
| | Johnson Matthey PLC | | | United Kingdom | | | | 494,842 | | | | 20,548,976 | |
| | | | | | | | | | | | | | |
| | | Construction & Engineering 1.0% | | | | | | | | | |
| | Sinopec Engineering Group Co. Ltd. | | | China | | | | 17,492,000 | | | | 16,567,680 | |
| | | | | | | | | | | | | | |
| | | Construction Materials 0.8% | | | | | | | | | |
| | Taiheiyo Cement Corp. | | | Japan | | | | 310,400 | | | | 13,401,038 | |
| | | | | | | | | | | | | | |
| | | Diversified Telecommunication Services 2.5% | | | | | | | | | |
| | China Telecom Corp. Ltd., H | | | China | | | | 50,418,357 | | | | 24,006,129 | |
| | Singapore Telecommunications Ltd. | | | Singapore | | | | 3,003,400 | | | | 8,016,552 | |
| | Telefonica Deutschland Holding AG | | | Germany | | | | 2,094,590 | | | | 10,519,792 | |
| | | | | | | | | | | | | | |
| | | | | | | | | | | | | 42,542,473 | |
| | | | | | | | | | | | | | |
| | | Electronic Equipment, Instruments & Components 0.3% | | | | | | | | | |
| a | | Landis+Gyr Group AG. | | | Switzerland | | | | 58,400 | | | | 4,651,142 | |
| | | | | | | | | | | | | | |
FRANKLIN TEMPLETON VARIABLE INSURANCE PRODUCTS TRUST
STATEMENT OF INVESTMENTS
Templeton Foreign VIP Fund (continued)
| | | | | | | | | | | | | | |
| | | | | Country | | | Shares | | | Value | |
| | | Common Stocks (continued) | | | | | | | | | |
| | | Energy Equipment & Services 3.1% | | | | | | | | | |
| | SBM Offshore NV | | | Netherlands | | | | 2,224,690 | | | $ | 39,156,917 | |
| | Tenaris SA | | | Italy | | | | 875,992 | | | | 13,831,361 | |
| | | | | | | | | | | | | | |
| | | | | | | | | | | | | 52,988,278 | |
| | | | | | | | | | | | | | |
| | | Health Care Equipment & Supplies 0.7% | | | | | | | | | |
| a | | Arjo AB, B | | | Sweden | | | | 651,040 | | | | 1,857,915 | |
| | Getinge AB, B | | | Sweden | | | | 651,040 | | | | 9,444,334 | |
| | | | | | | | | | | | | | |
| | | | | | | | | | | | | 11,302,249 | |
| | | | | | | | | | | | | | |
| | | Health Care Providers & Services 1.7% | | | | | | | | | |
| | Shanghai Pharmaceuticals Holding Co. Ltd., H | | | China | | | | 5,083,800 | | | | 13,762,247 | |
| | Sinopharm Group Co. Ltd. | | | China | | | | 3,443,200 | | | | 14,895,993 | |
| | | | | | | | | | | | | | |
| | | | | | | | | | | | | 28,658,240 | |
| | | | | | | | | | | | | | |
| | | Household Durables 0.5% | | | | | | | | | |
| | Panasonic Corp. | | | Japan | | | | 634,900 | | | | 9,293,762 | |
| | | | | | | | | | | | | | |
| | | Industrial Conglomerates 2.2% | | | | | | | | | |
| | CK Hutchison Holdings Ltd. | | | Hong Kong | | | | 2,021,500 | | | | 25,382,434 | |
| | Siemens AG | | | Germany | | | | 85,456 | | | | 11,908,873 | |
| | | | | | | | | | | | | | |
| | | | | | | | | | | | | 37,291,307 | |
| | | | | | | | | | | | | | |
| | | Insurance 6.3% | | | | | | | | | |
| | Aegon NV | | | Netherlands | | | | 5,251,690 | | | | 33,489,698 | |
| | Aviva PLC | | | United Kingdom | | | | 1,743,972 | | | | 11,928,820 | |
| | AXA SA | | | France | | | | 722,428 | | | | 21,439,535 | |
| | China Life Insurance Co. Ltd., H | | | China | | | | 4,639,000 | | | | 14,576,941 | |
| | Chubb Ltd. | | | United States | | | | 113,369 | | | | 16,566,612 | |
| | DB Insurance Co. Ltd. | | | South Korea | | | | 147,418 | | | | 9,833,621 | |
| | | | | | | | | | | | | | |
| | | | | | | | | | | | | 107,835,227 | |
| | | | | | | | | | | | | | |
| | | Internet Software & Services 3.7% | | | | | | | | | |
| a | | Baidu Inc., ADR | | | China | | | | 201,130 | | | | 47,106,657 | |
| | NetEase Inc., ADR | | | China | | | | 48,100 | | | | 16,597,867 | |
| | | | | | | | | | | | | | |
| | | | | | | | | | | | | 63,704,524 | |
| | | | | | | | | | | | | | |
| | | Life Sciences Tools & Services 2.2% | | | | | | | | | |
| a | | MorphoSys AG | | | Germany | | | | 202,180 | | | | 18,576,437 | |
| | QIAGEN NV | | | Netherlands | | | | 616,864 | | | | 19,383,572 | |
| | | | | | | | | | | | | | |
| | | | | | | | | | | | | 37,960,009 | |
| | | | | | | | | | | | | | |
| | | Media 0.7% | | | | | | | | | |
| | SES SA, IDR | | | Luxembourg | | | | 796,442 | | | | 12,431,981 | |
| | | | | | | | | | | | | | |
| | | Metals & Mining 6.7% | | | | | | | | | |
| | Alamos Gold Inc., A | | | Canada | | | | 3,063,752 | | | | 19,945,025 | |
| | Barrick Gold Corp. | | | Canada | | | | 1,314,020 | | | | 19,013,869 | |
| | Eldorado Gold Corp. | | | Canada | | | | 3,898,300 | | | | 5,643,868 | |
| | Sumitomo Metal Mining Co. Ltd. | | | Japan | | | | 519,500 | | | | 23,871,598 | |
| | Tahoe Resources Inc. | | | Canada | | | | 441,941 | | | | 2,119,882 | |
| | Wheaton Precious Metals Corp. | | | Canada | | | | 1,940,600 | | | | 42,899,749 | |
| | | | | | | | | | | | | | |
| | | | | | | | | | | | | 113,493,991 | |
| | | | | | | | | | | | | | |
| | | Multiline Retail 0.8% | | | | | | | | | |
| | Ryohin Keikaku Co. Ltd. | | | Japan | | | | 41,300 | | | | 12,864,445 | |
| | | | | | | | | | | | | | |
FRANKLIN TEMPLETON VARIABLE INSURANCE PRODUCTS TRUST
STATEMENT OF INVESTMENTS
Templeton Foreign VIP Fund (continued)
| | | | | | | | | | | | | | |
| | | | | Country | | | Shares | | | Value | |
| | | Common Stocks (continued) | | | | | | | | | |
| | | Multi-Utilities 1.5% | | | | | | | | | |
| | innogy SE | | | Germany | | | | 406,610 | | | $ | 15,940,522 | |
| | Veolia Environnement SA | | | France | | | | 368,028 | | | | 9,394,189 | |
| | | | | | | | | | | | | | |
| | | | | | | | | | | | | 25,334,711 | |
| | | | | | | | | | | | | | |
| | | Oil, Gas & Consumable Fuels 13.0% | | | | | | | | | |
| | BP PLC | | | United Kingdom | | | | 7,393,705 | | | | 52,190,701 | |
| | Cenovus Energy Inc. | | | Canada | | | | 1,082,702 | | | | 9,887,375 | |
| | Eni SpA | | | Italy | | | | 1,507,144 | | | | 24,954,146 | |
| a | | Husky Energy Inc. | | | Canada | | | | 880,500 | | | | 12,432,484 | |
| | INPEX Corp. | | | Japan | | | | 1,724,000 | | | | 21,556,694 | |
| | Kunlun Energy Co. Ltd. | | | China | | | | 7,166,000 | | | | 7,466,064 | |
| | PTT Exploration and Production PCL, fgn | | | Thailand | | | | 3,183,300 | | | | 9,773,718 | |
| | Royal Dutch Shell PLC, A | | | United Kingdom | | | | 16,803 | | | | 562,752 | |
| | Royal Dutch Shell PLC, B | | | United Kingdom | | | | 1,390,353 | | | | 47,099,652 | |
| | Suncor Energy Inc. | | | Canada | | | | 475,800 | | | | 17,467,322 | |
| | Total SA | | | France | | | | 332,436 | | | | 18,365,358 | |
| | | | | | | | | | | | | | |
| | | | | | | | | | | | | 221,756,266 | |
| | | | | | | | | | | | | | |
| | | Pharmaceuticals 9.8% | | | | | | | | | |
| | Astellas Pharma Inc. | | | Japan | | | | 1,689,500 | | | | 21,545,117 | |
| | Bayer AG | | | Germany | | | | 198,000 | | | | 24,706,283 | |
| | Merck KGaA | | | Germany | | | | 151,830 | | | | 16,349,366 | |
| | Novartis AG | | | Switzerland | | | | 128,920 | | | | 10,902,661 | |
| | Roche Holding AG | | | Switzerland | | | | 143,560 | | | | 36,319,126 | |
| | Sanofi | | | France | | | | 352,215 | | | | 30,362,918 | |
| | Teva Pharmaceutical Industries Ltd., ADR | | | Israel | | | | 1,439,176 | | | | 27,272,385 | |
| | | | | | | | | | | | | | |
| | | | | | | | | | | | | 167,457,856 | |
| | | | | | | | | | | | | | |
| | | Professional Services 0.3% | | | | | | | | | |
| | Capita PLC | | | United Kingdom | | | | 1,051,471 | | | | 5,692,616 | |
| | | | | | | | | | | | | | |
| | | Semiconductors & Semiconductor Equipment 2.1% | | | | | | | | | |
| | Infineon Technologies AG | | | Germany | | | | 590,665 | | | | 16,182,705 | |
| | Taiwan Semiconductor Manufacturing Co. Ltd. | | | Taiwan | | | | 2,587,000 | | | | 20,012,691 | |
| | | | | | | | | | | | | | |
| | | | | | | | | | | | | 36,195,396 | |
| | | | | | | | | | | | | | |
| | | Specialty Retail 1.4% | | | | | | | | | |
| | Kingfisher PLC | | | United Kingdom | | | | 5,347,092 | | | | 24,385,251 | |
| | | | | | | | | | | | | | |
| | | Technology Hardware, Storage & Peripherals 5.0% | | | | | | | | | |
| | Catcher Technology Co. Ltd. | | | Taiwan | | | | 925,000 | | | | 10,226,852 | |
| | Quanta Computer Inc. | | | Taiwan | | | | 5,640,000 | | | | 11,767,823 | |
| | Samsung Electronics Co. Ltd. | | | South Korea | | | | 26,226 | | | | 62,605,783 | |
| | | | | | | | | | | | | | |
| | | | | | | | | | | | | 84,600,458 | |
| | | | | | | | | | | | | | |
| | | Trading Companies & Distributors 2.3% | | | | | | | | | |
| | Posco Daewoo Corp. | | | South Korea | | | | 446,020 | | | | 7,584,273 | |
| | SIG PLC | | | United Kingdom | | | | 5,760,800 | | | | 13,707,783 | |
| | Travis Perkins PLC | | | United Kingdom | | | | 856,731 | | | | 18,129,757 | |
| | | | | | | | | | | | | | |
| | | | | | | | | | | | | 39,421,813 | |
| | | | | | | | | | | | | | |
FRANKLIN TEMPLETON VARIABLE INSURANCE PRODUCTS TRUST
STATEMENT OF INVESTMENTS
Templeton Foreign VIP Fund (continued)
| | | | | | | | | | | | | | |
| | | | | Country | | | Shares | | | Value | |
| | | Common Stocks (continued) | | | | | | | | | |
| | | Wireless Telecommunication Services 4.4% | | | | | | | | | |
| | China Mobile Ltd. | | | China | | | | 1,636,000 | | | $ | 16,594,840 | |
| | SoftBank Group Corp. | | | Japan | | | | 565,100 | | | | 44,732,591 | |
| | Vodafone Group PLC, ADR | | | United Kingdom | | | | 434,503 | | | | 13,860,646 | |
| | | | | | | | | | | | | | |
| | | | | | | | | | | | | 75,188,077 | |
| | | | | | | | | | | | | | |
| | | | |
| | Total Common Stocks (Cost $1,308,802,592) | | | | | | | | | | | 1,675,937,592 | |
| | | | | | | | | | | | | | |
| | Short Term Investments (Cost $25,636,178) 1.5% | | | | | | | | | | | | |
| | Money Market Funds 1.5% | | | | | | | | | | | | |
| b,c | | Institutional Fiduciary Trust Money Market Portfolio, 0.89% | | | United States | | | | 25,636,178 | | | | 25,636,178 | |
| | | | | | | | | | | | | | |
| | Total Investments (Cost $1,334,438,770) 99.7% | | | | | | | | | | | 1,701,573,770 | |
| | Other Assets, less Liabilities 0.3% | | | | | | | | | | | 5,529,192 | |
| | | | | | | | | | | | | | |
| | Net Assets 100.0% | | | | | | | | | | $ | 1,707,102,962 | |
| | | | | | | | | | | | | | |
See Abbreviations on page TF-24.
aNon-income producing.
bSee Note 3(e) regarding investments in affiliated management investment companies.
cThe rate shown is the annualized seven-day yield at period end.
| | | | | | |
| | | The accompanying notes are an integral part of these financial statements. | Annual Report | | | TF-13 | |
FRANKLIN TEMPLETON VARIABLE INSURANCE PRODUCTS TRUST
Financial Statements
Statement of Assets and Liabilities
December 31, 2017
| | | | |
| | | Templeton
Foreign
VIP Fund | |
Assets: | | | | |
Investments in securities: | | | | |
Cost - Unaffiliated issuers | | $ | 1,308,802,592 | |
Cost - Non-controlled affiliates (Note 3e) | | | 25,636,178 | |
| | | | |
Value - Unaffiliated issuers | | $ | 1,675,937,592 | |
Value - Non-controlled affiliates (Note 3e) | | | 25,636,178 | |
Cash | | | 36,696 | |
Receivables: | | | | |
Capital shares sold | | | 1,324,955 | |
Dividends | | | 6,597,928 | |
European Union tax reclaims | | | 242,486 | |
Other assets | | | 242 | |
| | | | |
Total assets | | | 1,709,776,077 | |
| | | | |
Liabilities: | | | | |
Payables: | | | | |
Investment securities purchased | | | 172,738 | |
Capital shares redeemed | | | 272,530 | |
Management fees | | | 1,097,693 | |
Distribution fees | | | 666,412 | |
Reports to shareholders | | | 189,214 | |
Accrued expenses and other liabilities | | | 274,528 | |
| | | | |
Total liabilities | | | 2,673,115 | |
| | | | |
Net assets, at value | | $ | 1,707,102,962 | |
| | | | |
Net assets consist of: | | | | |
Paid-in capital | | $ | 1,390,329,317 | |
Undistributed net investment income | | | 35,287,355 | |
Net unrealized appreciation (depreciation) | | | 367,326,047 | |
Accumulated net realized gain (loss) | | | (85,839,757 | ) |
| | | | |
Net assets, at value | | $ | 1,707,102,962 | |
| | | | |
| |
| Class 1: | | | | |
Net assets, at value | | $ | 152,683,572 | |
| | | | |
Shares outstanding | | | 9,664,596 | |
| | | | |
Net asset value and maximum offering price per share | | $ | 15.80 | |
| | | | |
| |
| Class 2: | | | | |
Net assets, at value | | $ | 1,394,475,485 | |
| | | | |
Shares outstanding | | | 90,112,305 | |
| | | | |
Net asset value and maximum offering price per share | | $ | 15.47 | |
| | | | |
| |
| Class 4: | | | | |
Net assets, at value | | $ | 159,943,905 | |
| | | | |
Shares outstanding | | | 10,178,312 | |
| | | | |
Net asset value and maximum offering price per share | | $ | 15.71 | |
| | | | |
| | | | |
| TF-14 | | Annual Report | The accompanying notes are an integral part of these financial statements. | | |
FRANKLIN TEMPLETON VARIABLE INSURANCE PRODUCTS TRUST
FINANCIAL STATEMENTS
Statement of Operations
for the year ended December 31, 2017
| | | | |
| | | Templeton
Foreign
VIP Fund | |
Investment income: | | | | |
Dividends: (net of foreign taxes)* | | | | |
Unaffiliated issuers | | $ | 48,865,480 | |
Non-controlled affiliates (Note 3e) | | | 227,545 | |
Interest: | | | | |
Unaffiliated issuers | | | 35,484 | |
Income from securities loaned (net of fees and rebates) | | | 415,148 | |
Other income (Note 1d) | | | 37,820 | |
| | | | |
Total investment income | | | 49,581,477 | |
| | | | |
Expenses: | | | | |
Management fees (Note 3a) | | | 13,652,966 | |
Distribution fees: (Note 3c) | | | | |
Class 2 | | | 3,507,898 | |
Class 4 | | | 772,639 | |
Custodian fees (Note 4) | | | 213,088 | |
Reports to shareholders | | | 326,095 | |
Professional fees | | | 213,843 | |
Trustees’ fees and expenses | | | 8,087 | |
Other | | | 118,510 | |
| | | | |
Total expenses | | | 18,813,126 | |
Expense reductions (Note 4) | | | (10,345 | ) |
Expenses waived/paid by affiliates (Note 3e) | | | (240,607 | ) |
| | | | |
Net expenses | | | 18,562,174 | |
| | | | |
Net investment income | | | 31,019,303 | |
| | | | |
Realized and unrealized gains (losses): | | | | |
Net realized gain (loss) from: | | | | |
Investments: | | | | |
Unaffiliated issuers | | | (11,945,088 | ) |
Foreign currency transactions | | | 1,760,896 | |
| | | | |
Net realized gain (loss) | | | (10,184,192 | ) |
| | | | |
Net change in unrealized appreciation (depreciation) on: | | | | |
Investments: | | | | |
Unaffiliated issuers | | | 263,102,043 | |
Translation of other assets and liabilities denominated in foreign currencies | | | 418,855 | |
| | | | |
Net change in unrealized appreciation (depreciation) | | | 263,520,898 | |
| | | | |
Net realized and unrealized gain (loss) | | | 253,336,706 | |
| | | | |
Net increase (decrease) in net assets resulting from operations | | $ | 284,356,009 | |
| | | | |
*Foreign taxes withheld on dividends | | $ | 5,134,477 | |
| | | | | | |
| | | The accompanying notes are an integral part of these financial statements. | Annual Report | | | TF-15 | |
FRANKLIN TEMPLETON VARIABLE INSURANCE PRODUCTS TRUST
FINANCIAL STATEMENTS
Statements of Changes in Net Assets
| | | | | | | | |
| | | Templeton Foreign VIP Fund | |
| | | Year Ended December 31, | |
| | | 2017 | | | 2016 | |
Increase (decrease) in net assets: | | | | | | | | |
Operations: | | | | | | | | |
Net investment income | | $ | 31,019,303 | | | $ | 44,630,962 | |
Net realized gain (loss) | | | (10,184,192 | ) | | | (69,896,957 | ) |
Net change in unrealized appreciation (depreciation) | | | 263,520,898 | | | | 170,488,749 | |
| | | | |
Net increase (decrease) in net assets resulting from operations | | | 284,356,009 | | | | 145,222,754 | |
| | | | |
Distributions to shareholders from: | | | | | | | | |
Net investment income: | | | | | | | | |
Class 1 | | | (3,928,195 | ) | | | (4,469,747 | ) |
Class 2 | | | (35,708,156 | ) | | | (28,417,976 | ) |
Class 4 | | | (2,623,801 | ) | | | (8,605,853 | ) |
Net realized gains: | | | | | | | | |
Class 1 | | | — | | | | (3,504,221 | ) |
Class 2 | | | — | | | | (25,453,391 | ) |
Class 4 | | | — | | | | (8,118,929 | ) |
| | | | |
Total distributions to shareholders | | | (42,260,152 | ) | | | (78,570,117 | ) |
| | | | |
Capital share transactions: (Note 2) | | | | | | | | |
Class 1 | | | 1,154,617 | | | | (85,110,427 | ) |
Class 2 | | | (225,298,981 | ) | | | (66,083,288 | ) |
Class 4 | | | (365,347,762 | ) | | | (4,174,320 | ) |
| | | | |
Total capital share transactions | | | (589,492,126 | ) | | | (155,368,035 | ) |
| | | | |
Net increase (decrease) in net assets | | | (347,396,269 | ) | | | (88,715,398 | ) |
Net assets: | | | | | | | | |
Beginning of year | | | 2,054,499,231 | | | | 2,143,214,629 | |
| | | | |
End of year | | $ | 1,707,102,962 | | | $ | 2,054,499,231 | |
| | | | |
Undistributed net investment income included in net assets: | | | | | | | | |
End of year | | $ | 35,287,355 | | | $ | 44,764,301 | |
| | | | |
| | | | |
| TF-16 | | Annual Report | The accompanying notes are an integral part of these financial statements. | | |
FRANKLIN TEMPLETON VARIABLE INSURANCE PRODUCTS TRUST
Notes to Financial Statements
Templeton Foreign VIP Fund
1. Organization and Significant Accounting Policies
Franklin Templeton Variable Insurance Products Trust (Trust) is registered under the Investment Company Act of 1940 (1940 Act) as an open-end management investment company, consisting of eighteen separate funds and applies the specialized accounting and reporting guidance in U.S. Generally Accepted Accounting Principles (U.S. GAAP). Templeton Foreign VIP Fund (Fund) is included in this report. Shares of the Fund are generally sold only to insurance company separate accounts to fund the benefits of variable life insurance policies or variable annuity contracts. The Fund offers three classes of shares: Class 1, Class 2, and Class 4. Each class of shares may differ by its distribution fees, voting rights on matters affecting a single class and its exchange privilege.
The following summarizes the Fund’s significant accounting policies.
a. Financial Instrument Valuation
The Fund’s investments in financial instruments are carried at fair value daily. Fair value is the price that would be received to sell an asset or paid to transfer a liability in an orderly transaction between market participants on the measurement date. The Fund calculates the net asset value (NAV) per share as of 4 p.m. Eastern time each day the New York Stock Exchange (NYSE) is open for trading. Under compliance policies and procedures approved by the Trust’s Board of Trustees (the Board), the Fund’s administrator has responsibility for oversight of valuation, including leading the cross-functional Valuation Committee (VC). The VC provides administration and oversight of the Fund’s valuation policies and procedures, which are approved annually by the Board. Among other things, these procedures allow the Fund to utilize independent pricing services, quotations from securities and financial instrument dealers, and other market sources to determine fair value.
Equity securities listed on an exchange or on the NASDAQ National Market System are valued at the last quoted sale price or the official closing price of the day, respectively. Foreign equity securities are valued as of the close of trading on the foreign stock exchange on which the security is primarily traded, or as of 4 p.m. Eastern time. The value is then converted into its U.S. dollar equivalent at the foreign exchange rate in effect at 4 p.m. Eastern time on the day that the value of the security is determined. Over-the-counter (OTC) securities are
valued within the range of the most recent quoted bid and ask prices. Securities that trade in multiple markets or on multiple exchanges are valued according to the broadest and most representative market. Certain equity securities are valued based upon fundamental characteristics or relationships to similar securities.
Investments in open-end mutual funds are valued at the closing NAV.
The Fund has procedures to determine the fair value of financial instruments for which market prices are not reliable or readily available. Under these procedures, the VC convenes on a regular basis to review such financial instruments and considers a number of factors, including significant unobservable valuation inputs, when arriving at fair value. The VC primarily employs a market-based approach which may use related or comparable assets or liabilities, recent transactions, market multiples, book values, and other relevant information for the investment to determine the fair value of the investment. An income-based valuation approach may also be used in which the anticipated future cash flows of the investment are discounted to calculate fair value. Discounts may also be applied due to the nature or duration of any restrictions on the disposition of the investments. Due to the inherent uncertainty of valuations of such investments, the fair values may differ significantly from the values that would have been used had an active market existed. The VC employs various methods for calibrating these valuation approaches including a regular review of key inputs and assumptions, transactional back-testing or disposition analysis, and reviews of any related market activity.
Trading in securities on foreign securities stock exchanges and OTC markets may be completed before 4 p.m. Eastern time. In addition, trading in certain foreign markets may not take place on every Fund’s business day. Occasionally, events occur between the time at which trading in a foreign security is completed and 4 p.m. Eastern time that might call into question the reliability of the value of a portfolio security held by the Fund. As a result, differences may arise between the value of the Fund’s portfolio securities as determined at the foreign market close and the latest indications of value at 4 p.m. Eastern time. In order to minimize the potential for these differences, the VC monitors price movements following the close of trading in foreign stock markets through a series of country specific market proxies (such as baskets of American Depositary Receipts, futures contracts and exchange traded funds). These price movements are measured against
FRANKLIN TEMPLETON VARIABLE INSURANCE PRODUCTS TRUST
NOTES TO FINANCIAL STATEMENTS
Templeton Foreign VIP Fund (continued)
1. Organization and Significant Accounting Policies (continued)
a. Financial Instrument Valuation (continued)
established trigger thresholds for each specific market proxy to assist in determining if an event has occurred that may call into question the reliability of the values of the foreign securities held by the Fund. If such an event occurs, the securities may be valued using fair value procedures, which may include the use of independent pricing services.
When the last day of the reporting period is a non-business day, certain foreign markets may be open on those days that the Fund’s NAV is not calculated, which could result in differences between the value of the Fund’s portfolio securities on the last business day and the last calendar day of the reporting period. Any significant security valuation changes due to an open foreign market are adjusted and reflected by the Fund for financial reporting purposes.
b. Foreign Currency Translation
Portfolio securities and other assets and liabilities denominated in foreign currencies are translated into U.S. dollars based on the exchange rate of such currencies against U.S. dollars on the date of valuation. The Fund may enter into foreign currency exchange contracts to facilitate transactions denominated in a foreign currency. Purchases and sales of securities, income and expense items denominated in foreign currencies are translated into U.S. dollars at the exchange rate in effect on the transaction date. Portfolio securities and assets and liabilities denominated in foreign currencies contain risks that those currencies will decline in value relative to the U.S. dollar. Occasionally, events may impact the availability or reliability of foreign exchange rates used to convert the U.S. dollar equivalent value. If such an event occurs, the foreign exchange rate will be valued at fair value using procedures established and approved by the Board.
The Fund does not separately report the effect of changes in foreign exchange rates from changes in market prices on securities held. Such changes are included in net realized and unrealized gain or loss from investments in the Statement of Operations.
Realized foreign exchange gains or losses arise from sales of foreign currencies, currency gains or losses realized between the trade and settlement dates on securities transactions and the difference between the recorded amounts of dividends, interest, and foreign withholding taxes and the U.S. dollar equivalent of
the amounts actually received or paid. Net unrealized foreign exchange gains and losses arise from changes in foreign exchange rates on foreign denominated assets and liabilities other than investments in securities held at the end of the reporting period.
c. Securities Lending
The Fund participates in an agency based securities lending program to earn additional income. The Fund receives cash collateral against the loaned securities in an amount equal to at least 102% of the fair value of the loaned securities. Collateral is maintained over the life of the loan in an amount not less than 100% of the fair value of loaned securities, as determined at the close of Fund business each day; any additional collateral required due to changes in security values is delivered to the Fund on the next business day. The collateral is deposited into a joint cash account with other funds and is used to invest in a money market fund managed by Franklin Advisers, Inc., an affiliate of the Fund. The Fund may receive income from the investment of cash collateral, in addition to lending fees and rebates paid by the borrower. Income from securities loaned, net of fees paid to the securities lending agent and/or third-party vendor, is reported separately in the Statement of Operations. The Fund bears the market risk with respect to the collateral investment, securities loaned, and the risk that the agent may default on its obligations to the Fund. If the borrower defaults on its obligation to return the securities loaned, the Fund has the right to repurchase the securities in the open market using the collateral received. The securities lending agent has agreed to indemnify the Fund in the event of default by a third party borrower. At December 31, 2017, the Fund had no securities on loan.
d. Income and Deferred Taxes
It is the Fund’s policy to qualify as a regulated investment company under the Internal Revenue Code. The Fund intends to distribute to shareholders substantially all of its taxable income and net realized gains to relieve it from federal income and if applicable, excise taxes. As a result, no provision for U.S. federal income taxes is required.
The Fund may be subject to foreign taxation related to income received, capital gains on the sale of securities and certain foreign currency transactions in the foreign jurisdictions in which it invests. Foreign taxes, if any, are recorded based on the tax regulations and rates that exist in the foreign markets in which the Fund invests. When a capital gain tax is determined
FRANKLIN TEMPLETON VARIABLE INSURANCE PRODUCTS TRUST
NOTES TO FINANCIAL STATEMENTS
Templeton Foreign VIP Fund (continued)
to apply, the Fund records an estimated deferred tax liability in an amount that would be payable if the securities were disposed of on the valuation date.
As a result of several court cases, in certain countries across the European Union, the Fund filed additional tax reclaims for previously withheld taxes on dividends earned in those countries (EU reclaims). These additional filings are subject to various administrative proceedings by the local jurisdictions’ tax authorities within the European Union, as well as a number of related judicial proceedings. Income recognized, if any, for EU reclaims is reflected as other income in the Statement of Operations and any related receivable, if any, is reflected as European Union tax reclaims in the Statement of Assets and Liabilities. When uncertainty exists as to the ultimate resolution of these proceedings, the likelihood of receipt of these EU reclaims, and the potential timing of payment, no amounts are reflected in the financial statements. For U.S. income tax purposes, when EU reclaims are received by the Fund and the Fund previously passed foreign tax credit on to its shareholders, the Fund must either amend historic tax reporting to shareholders or enter into a closing agreement with the Internal Revenue Service (IRS) in order to pay the associated tax liability on behalf of the Fund’s shareholders.
The Fund may recognize an income tax liability related to its uncertain tax positions under U.S. GAAP when the uncertain tax position has a less than 50% probability that it will be sustained upon examination by the tax authorities based on its technical merits. As of December 31, 2017, the Fund has determined that no tax liability is required in its financial statements related to uncertain tax positions for any open tax years (or expected to be taken in future tax years). Open tax years are those that remain subject to examination and are based on the statute of limitations in each jurisdiction in which the Fund invests.
e. Security Transactions, Investment Income, Expenses and Distributions
Security transactions are accounted for on trade date. Realized gains and losses on security transactions are determined on a specific identification basis. Interest income and estimated expenses are accrued daily. Dividend income is recorded on the ex-dividend date except for certain dividends from securities where the dividend rate is not available. In such cases, the dividend is recorded as soon as the information is received by the Fund. Distributions to shareholders are recorded on the
ex-dividend date. Distributable earnings are determined according to income tax regulations (tax basis) and may differ from earnings recorded in accordance with U.S. GAAP. These differences may be permanent or temporary. Permanent differences are reclassified among capital accounts to reflect their tax character. These reclassifications have no impact on net assets or the results of operations. Temporary differences are not reclassified, as they may reverse in subsequent periods.
Common expenses incurred by the Trust are allocated among the Funds based on the ratio of net assets of each Fund to the combined net assets of the Trust. Fund specific expenses are charged directly to the Fund that incurred the expense.
Realized and unrealized gains and losses and net investment income, excluding class specific expenses, are allocated daily to each class of shares based upon the relative proportion of net assets of each class. Differences in per share distributions by class are generally due to differences in class specific expenses.
f. Accounting Estimates
The preparation of financial statements in accordance with U.S. GAAP requires management to make estimates and assumptions that affect the reported amounts of assets and liabilities at the date of the financial statements and the amounts of income and expenses during the reporting period. Actual results could differ from those estimates.
g. Redemption Fees
Redemptions and exchanges of interests in an insurance company subaccount that invested in Class 3 shares of the Fund were subject to a 1.0% short term trading fee if the interest in the subaccount had been held for less than 60 days. Such fees were retained by the Fund and accounted for as an addition to paid-in capital, allocated to each class of shares based upon the relative proportion of net assets of each class. There were no redemption fees for the year.
h. Guarantees and Indemnifications
Under the Trust’s organizational documents, its officers and trustees are indemnified by the Trust against certain liabilities arising out of the performance of their duties to the Trust. Additionally, in the normal course of business, the Trust, on behalf of the Fund, enters into contracts with service providers that contain general indemnification clauses. The Trust’s maximum exposure under these arrangements is unknown as
FRANKLIN TEMPLETON VARIABLE INSURANCE PRODUCTS TRUST
NOTES TO FINANCIAL STATEMENTS
Templeton Foreign VIP Fund (continued)
1. Organization and Significant Accounting Policies (continued)
h. Guarantees and Indemnifications (continued)
this would involve future claims that may be made against the Trust that have not yet occurred. Currently, the Trust expects the risk of loss to be remote.
2. Shares of Beneficial Interest
At December 31, 2017, there were an unlimited number of shares authorized (without par value). Transactions in the Fund’s shares were as follows:
| | | | | | | | | | | | | | | | | | | | |
| | | Year Ended December 31, | |
| | | 2017 | | | | | | 2016 | |
| | | Shares | | | Amount | | | | | | Shares | | | Amount | |
| | | | | |
| Class 1 Shares: | | | | | | | | | | | | | | | | | | | | |
Shares sold | | | 769,055 | | | $ | 11,623,740 | | | | | | | | 398,476 | | | $ | 5,247,673 | |
Shares issued in reinvestment of distributions | | | 267,406 | | | | 3,928,195 | | | | | | | | 633,861 | | | | 7,973,968 | |
Shares redeemed | | | (965,539 | ) | | | (14,397,318 | ) | | | | | | | (7,350,785 | ) | | | (98,332,068 | ) |
| | | | |
Net increase (decrease) | | | 70,922 | | | $ | 1,154,617 | | | | | | | | (6,318,448 | ) | | $ | (85,110,427 | ) |
| | | | |
| Class 2 Shares: | | | | | | | | | | | | | | | | | | | | |
Shares sold | | | 4,540,875 | | | $ | 66,812,334 | | | | | | | | 12,602,852 | | | $ | 163,261,270 | |
Shares issued in reinvestment of distributions | | | 2,478,012 | | | | 35,708,156 | | | | | | | | 4,365,589 | | | | 53,871,367 | |
Shares redeemed | | | (22,468,600 | ) | | | (327,819,471 | ) | | | | | | | (21,800,082 | ) | | | (283,215,925 | ) |
| | | | |
Net increase (decrease) | | | (15,449,713 | ) | | $ | (225,298,981 | ) | | | | | | | (4,831,641 | ) | | $ | (66,083,288 | ) |
| | | | |
| Class 4 Shares: | | | | | | | | | | | | | | | | | | | | |
Shares sold | | | 1,442,499 | | | $ | 21,238,967 | | | | | | | | 4,242,533 | | | $ | 54,403,633 | |
Shares issued in reinvestment of distributions | | | 179,222 | | | | 2,623,801 | | | | | | | | 1,344,436 | | | | 16,724,782 | |
Shares redeemed | | | (26,802,238 | ) | | | (389,210,530 | ) | | | | | | | (5,754,548 | ) | | | (75,302,735 | ) |
| | | | |
Net increase (decrease) | | | (25,180,517 | ) | | $ | (365,347,762 | ) | | | | | | | (167,579 | ) | | $ | (4,174,320 | ) |
| | | | |
3. Transactions with Affiliates
Franklin Resources, Inc. is the holding company for various subsidiaries that together are referred to as Franklin Templeton Investments. Certain officers and trustees of the Fund are also officers and/or directors of the following subsidiaries:
| | |
| Subsidiary | | Affiliation |
Templeton Investment Counsel, LLC (TIC) | | Investment manager |
Franklin Templeton Services, LLC (FT Services) | | Administrative manager |
Franklin Templeton Distributors, Inc. (Distributors) | | Principal underwriter |
Franklin Templeton Investor Services, LLC (Investor Services) | | Transfer agent |
FRANKLIN TEMPLETON VARIABLE INSURANCE PRODUCTS TRUST
NOTES TO FINANCIAL STATEMENTS
Templeton Foreign VIP Fund (continued)
a. Management Fees
The Fund pays an investment management fee to TIC based on the average daily net assets of the Fund as follows:
| | |
| Annualized Fee Rate | | Net Assets |
0.900% | | Up to and including $200 million |
0.810% | | Over $200 million, up to and including $700 million |
0.775% | | Over $700 million, up to and including $1.2 billion |
0.750% | | Over $1.2 billion, up to and including $1.3 billion |
0.675% | | Over $1.3 billion, up to and including $10 billion |
0.655% | | Over $10 billion, up to and including $15 billion |
0.635% | | Over $15 billion, up to and including $20 billion |
0.615% | | In excess of $20 billion |
For the year ended December 31, 2017, the gross effective investment management fee rate was 0.771% of the Fund’s average daily net assets.
b. Administrative Fees
Under an agreement with TIC, FT Services provides administrative services to the Fund. The fee is paid by TIC based on the Fund’s average daily net assets, and is not an additional expense of the Fund.
c. Distribution Fees
The Board has adopted distribution plans for Class 2 and Class 4 shares pursuant to Rule 12b-1 under the 1940 Act. Under the Fund’s compensation distribution plans, the Fund pays Distributors for costs incurred in connection with the servicing, sale and distribution of the Fund’s shares up to 0.25% and 0.35% per year of its average daily net assets of Class 2 and Class 4, respectively. The plan year, for purposes of monitoring compliance with the maximum annual plan rates, is February 1 through January 31.
d. Transfer Agent Fees
Investor Services, under terms of an agreement, performs shareholder servicing for the Fund and is not paid by the Fund for the services.
e. Investments in Affiliated Management Investment Companies
The Fund invests in one or more affiliated management investment companies for purposes other than exercising a controlling influence over the management or policies. Management fees paid by the Fund are waived on assets invested in the affiliated management investment companies, as noted in the Statement of Operations, in an amount not to exceed the management and administrative fees paid directly or indirectly by each affiliate. Prior to January 1, 2014, the waiver was accounted for as a reduction to management fees. During the year ended December 31, 2017, the Fund held investments in affiliated management investment companies as follows:
| | | | | | | | | | | | | | | | | | | | | | | | | | | | | | | | |
| | | Number of Shares Held at
Beginning of Year | | | Gross Additions | | | Gross Reductions | | | Number of Shares Held at End of Year | | | Value at End of Year | | | Dividend
Income | | | Realized
Gain
(Loss) | | | Net Change in
Unrealized
Appreciation
(Depreciation) | |
| Non-Controlled Affiliates | | | | | | | | | | | | | | | | | | | | | | | | | | | | | | | | |
Institutional Fiduciary Trust Money Market Portfolio, 0.89% | | | 111,135,782 | | | | 945,752,107 | | | | (1,031,251,711 | ) | | | 25,636,178 | | | $ | 25,636,178 | | | $ | 227,545 | | | $ | — | | | $ | — | |
| | | | | | | | | | | | | | | | | | | | |
FRANKLIN TEMPLETON VARIABLE INSURANCE PRODUCTS TRUST
NOTES TO FINANCIAL STATEMENTS
Templeton Foreign VIP Fund (continued)
3. Transactions with Affiliates (continued)
f. Interfund Transactions
The Fund engaged in purchases and sales of investments with funds or other accounts that have common investment managers (or affiliated investment managers), directors, trustees or officers. During the year ended December 31, 2017, these purchase and sale transactions aggregated $0 and $375,044,374, respectively.
4. Expense Offset Arrangement
The Fund has entered into an arrangement with its custodian whereby credits realized as a result of uninvested cash balances are used to reduce a portion of the Fund’s custodian expenses. During the year ended December 31, 2017, the custodian fees were reduced as noted in the Statement of Operations.
5. Income Taxes
For tax purposes, capital losses may be carried over to offset future capital gains, if any. At December 31, 2017, the Fund had long-term capital loss carryforwards of $79,259,651.
The tax character of distributions paid during the years ended December 31, 2017 and 2016, was as follows:
| | | | | | | | |
| | | 2017 | | | 2016 | |
Distributions paid from: | | | | | | | | |
Ordinary income | | $ | 42,260,152 | | | $ | 41,497,565 | |
Long term capital gain | | | — | | | | 37,072,552 | |
| | | | |
| | $ | 42,260,152 | | | $ | 78,570,117 | |
| | | | |
At December 31, 2017, the cost of investments, net unrealized appreciation (depreciation) and undistributed ordinary income for income tax purposes were as follows:
| | | | |
Cost of investments | | $ | 1,347,636,990 | |
| | | | |
Unrealized appreciation | | $ | 439,286,616 | |
Unrealized depreciation | | | (85,349,836 | ) |
| | | | |
Net unrealized appreciation (depreciation) | | $ | 353,936,780 | |
| | | | |
Distributable earnings - undistributed ordinary income | | $ | 40,944,949 | |
| | | | |
Differences between income and/or capital gains as determined on a book basis and a tax basis are primarily due to differing treatments of passive foreign investment company shares, foreign capital gains tax and wash sales.
6. Investment Transactions
Purchases and sales of investments (excluding short term securities) for the year ended December 31, 2017, aggregated $460,388,826 and $988,021,327, respectively.
FRANKLIN TEMPLETON VARIABLE INSURANCE PRODUCTS TRUST
NOTES TO FINANCIAL STATEMENTS
Templeton Foreign VIP Fund (continued)
7. Concentration of Risk
Investing in foreign securities may include certain risks and considerations not typically associated with investing in U.S. securities, such as fluctuating currency values and changing local and regional economic, political and social conditions, which may result in greater market volatility. In addition, certain foreign securities may not be as liquid as U.S. securities.
8. Credit Facility
The Fund, together with other U.S. registered and foreign investment funds (collectively, Borrowers), managed by Franklin Templeton Investments, are borrowers in a joint syndicated senior unsecured credit facility totaling $2 billion (Global Credit Facility) which matured on February 9, 2018. This Global Credit Facility provides a source of funds to the Borrowers for temporary and emergency purposes, including the ability to meet future unanticipated or unusually large redemption requests. Effective February 9, 2018, the Borrowers renewed the Global Credit Facility for a one year term, maturing February 8, 2019, for a total of $2 billion.
Under the terms of the Global Credit Facility, the Fund shall, in addition to interest charged on any borrowings made by the Fund and other costs incurred by the Fund, pay its share of fees and expenses incurred in connection with the implementation and maintenance of the Global Credit Facility, based upon its relative share of the aggregate net assets of all of the Borrowers, including an annual commitment fee of 0.15% based upon the unused portion of the Global Credit Facility. These fees are reflected in other expenses in the Statement of Operations. During the year ended December 31, 2017, the Fund did not use the Global Credit Facility.
9. Fair Value Measurements
The Fund follows a fair value hierarchy that distinguishes between market data obtained from independent sources (observable inputs) and the Fund’s own market assumptions (unobservable inputs). These inputs are used in determining the value of the Fund’s financial instruments and are summarized in the following fair value hierarchy:
| | • | | Level 1 – quoted prices in active markets for identical financial instruments |
| | • | | Level 2 – other significant observable inputs (including quoted prices for similar financial instruments, interest rates, prepayment speed, credit risk, etc.) |
| | • | | Level 3 – significant unobservable inputs (including the Fund’s own assumptions in determining the fair value of financial instruments) |
The input levels are not necessarily an indication of the risk or liquidity associated with financial instruments at that level.
For movements between the levels within the fair value hierarchy, the Fund has adopted a policy of recognizing the transfers as of the date of the underlying event which caused the movement.
FRANKLIN TEMPLETON VARIABLE INSURANCE PRODUCTS TRUST
NOTES TO FINANCIAL STATEMENTS
Templeton Foreign VIP Fund (continued)
9. Fair Value Measurements (continued)
A summary of inputs used as of December 31, 2017, in valuing the Fund’s assets carried at fair value, is as follows:
| | | | | | | | | | | | | | | | |
| | | Level 1 | | | Level 2 | | | Level 3 | | | Total | |
| | | | |
| Assets: | | | | | | | | | | | | | | | | |
Investments in Securities:a | | | | | | | | | | | | | | | | |
Equity Investments: | | | | | | | | | | | | | | | | |
Aerospace & Defense | | $ | 43,297,729 | | | $ | 71,663 | | | $ | — | | | $ | 43,369,392 | |
All Other Equity Investments | | | 1,632,568,200 | | | | — | | | | — | | | | 1,632,568,200 | |
Short Term Investments | | | 25,636,178 | | | | — | | | | — | | | | 25,636,178 | |
| | | | |
Total Investments in Securities | | $ | 1,701,502,107 | | | $ | 71,663 | | | $ | — | | | $ | 1,701,573,770 | |
| | | | |
aFor detailed categories, see the accompanying Statement of Investments.
10. Subsequent Events
The Fund has evaluated subsequent events through the issuance of the financial statements and determined that no events have occurred that require disclosure other than those already disclosed in the financial statements.
Abbreviations
| | |
| Selected Portfolio |
| |
| ADR | | American Depositary Receipt |
| |
| IDR | | International Depositary Receipt |
| |
| NVDR | | Non-Voting Depositary Receipt |
FRANKLIN TEMPLETON VARIABLE INSURANCE PRODUCTS TRUST
Report of Independent Registered Public Accounting Firm
To the Board of Trustees of Franklin Templeton Variable Insurance Products Trust and Shareholders of Templeton Foreign VIP Fund
Opinion on the Financial Statements
We have audited the accompanying statement of assets and liabilities, including the statement of investments, of Templeton Foreign VIP Fund (the “Fund”) as of December 31, 2017, the related statement of operations for the year ended December 31, 2017, the statement of changes in net assets for each of the two years in the period ended December 31, 2017, including the related notes, and the financial highlights for each of the five years in the period ended December 31, 2017 (collectively referred to as the “financial statements”). In our opinion, the financial statements present fairly, in all material respects, the financial position of the Fund as of December 31, 2017, the results of its operations for the year then ended, the changes in its net assets for each of the two years in the period ended December 31, 2017 and the financial highlights for each of the five years in the period ended December 31, 2017, in conformity with accounting principles generally accepted in the United States of America.
Basis for Opinion
These financial statements are the responsibility of the Fund’s management. Our responsibility is to express an opinion on the Fund’s financial statements based on our audits. We are a public accounting firm registered with the Public Company Accounting Oversight Board (United States) (“PCAOB”) and are required to be independent with respect to the Fund in accordance with the U.S. federal securities laws and the applicable rules and regulations of the Securities and Exchange Commission and the PCAOB.
We conducted our audits of these financial statements in accordance with the standards of the PCAOB. Those standards require that we plan and perform the audit to obtain reasonable assurance about whether the financial statements are free of material misstatement, whether due to error or fraud.
Our audits included performing procedures to assess the risks of material misstatement of the financial statements, whether due to error or fraud, and performing procedures that respond to those risks. Such procedures included examining, on a test basis, evidence regarding the amounts and disclosures in the financial statements. Our audits also included evaluating the accounting principles used and significant estimates made by management, as well as evaluating the overall presentation of the financial statements. Our procedures included confirmation of securities owned as of December 31, 2017 by correspondence with the custodian, transfer agent, brokers; when replies were not received from brokers, we performed other auditing procedures. We believe that our audits provide a reasonable basis for our opinion.
PricewaterhouseCoopers LLP
San Francisco, California
February 15, 2018
We have served as the auditor of one or more investment companies in the Franklin Templeton Group of Funds since 1948.
FRANKLIN TEMPLETON VARIABLE INSURANCE PRODUCTS TRUST
Tax Information (unaudited)
Templeton Foreign VIP Fund
At December 31, 2017, more than 50% of the Fund’s total assets were invested in securities of foreign issuers. In most instances, foreign taxes were withheld from income paid to the Fund on these investments. The Fund elects to treat foreign taxes paid as allowed under Section 853 of the Internal Revenue Code (Code). This election will allow shareholders of record as of the 2018 distribution date, to treat their proportionate share of foreign taxes paid by the Fund as having been paid directly by them. The shareholder shall consider these amounts as foreign taxes paid in the tax year in which they receive the Fund distribution.
Templeton Global Bond VIP Fund
This annual report for Templeton Global Bond VIP Fund covers the fiscal year ended December 31, 2017.
Class 2 Performance Summary as of December 31, 2017
Average annual total return of Class 2 shares* represents the average annual change in value, assuming reinvestment of dividends and capital gains. Average returns smooth out variations in returns, which can be significant; they are not the same as year-by-year results.
| | | | | | | | | | | | |
| Periods ended 12/31/17 | | 1-Year | | | 5-Year | | | 10-Year | |
Average Annual Total Return | | | +1.93% | | | | +0.77% | | | | +5.51% | |
*The Fund has a fee waiver associated with any investment it makes in a Franklin Templeton money fund and/or other Franklin Templeton fund, contractually guaranteed through 4/30/18. Fund investment results reflect the fee waiver; without this waiver, the results would have been lower.
Performance reflects the Fund’s Class 2 operating expenses, but does not include any contract fees, expenses or sales charges. If they had been included, performance would be lower. These charges and deductions, particularly for variable life policies, can have a significant effect on contract values and insurance benefits. See the contract prospectus for a complete description of these expenses, including sales charges.
Performance data represent past performance, which does not guarantee future results. Investment return and principal value will fluctuate, and you may have a gain or loss when you sell your shares. Current performance may differ from figures shown.
Total Return Index Comparison for a Hypothetical $10,000 Investment (1/1/08–12/31/17)
The graph below shows the change in value of a hypothetical $10,000 investment in the Fund over the indicated period and includes reinvestment of any income or distributions. The Fund’s performance* is compared to the performance of the J.P. Morgan (JPM) Global Government Bond Index (GGBI), the Citigroup World Government Bond Index (WGBI) and the Consumer Price Index. One cannot invest directly in an index, and an index is not representative of the Fund’s portfolio. Please see Important Notes to Performance Information preceding the Fund Summaries.
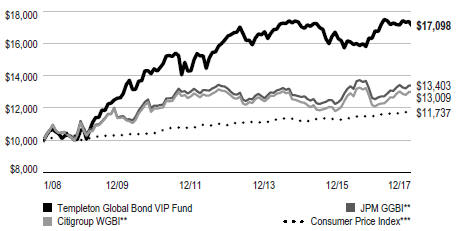
**Source: Morningstar. Please see Index Descriptions following the Fund Summaries.
***Source: Bureau of Labor Statistics, bls.gov/cpi. Please see Index Descriptions following the Fund Summaries.
TEMPLETON GLOBAL BOND VIP FUND
Fund Goal and Main Investments
The Fund seeks high current income, consistent with preservation of capital, with capital appreciation as a secondary consideration. Under normal market conditions, the Fund invests at least 80% of its net assets in bonds, which include debt securities of any maturity, such as bonds, notes, bills and debentures.
Fund Risks
All investments involve risks, including possible loss of principal. Foreign securities involve special risks, including currency fluctuations and economic and political uncertainties. Currency rates may fluctuate significantly over short periods of time, and can reduce returns. Sovereign debt securities are subject to various risks in addition to those relating to debt securities and foreign securities generally, including, but not limited to, the risk that a governmental entity may be unwilling or unable to pay interest and repay principal on its sovereign debt, or otherwise meet its obligations when due. Adverse conditions in a certain region or country can adversely affect securities of issuers in other countries whose economies appear to be unrelated. Investments in developing markets involve heightened risks related to the same factors, in addition to those associated with these markets’ smaller size, lesser liquidity and lack of established legal, political, business and social frameworks to support securities market. The Fund is actively managed but there is no guarantee that the manager’s investment decisions will produce the desired results. The Fund’s prospectus also includes a description of the main investment risks.
Performance Overview
You can find the Fund’s one-year total return in the Performance Summary. For comparison, the JPM GGBI produced a +6.83% total return and the Citigroup WGBI posted a +7.49% total return for the same period.1
Economic and Market Overview
The year began with a rally in emerging markets (EMs), as fourth-quarter 2016 fears for potential trade shocks dissipated. Capital moved into several markets we considered undervalued at a pace not seen in a number of years. The strengthening
Geographic Composition*
Based on Total Net Assets as of 12/31/17
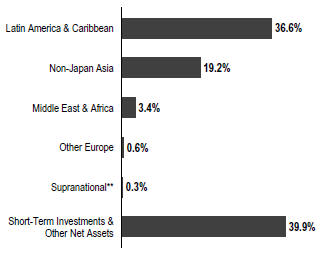
*Figures represent the net Fund exposure and include certain derivatives held in the portfolio (or their underlying reference assets) and may not total 100% or may be negative due to rounding, use of any derivatives or other factors.
**The Fund’s supranational investment was denominated in the Mexican peso.
trends in specific EMs largely continued throughout much of 2017, particularly in select areas of Latin America and Asia.
Duration exposures around the world generally performed well during the year, as rates in developed markets remained relatively low or range-bound, while a number of EM local-currency markets saw declining yields and strengthening valuations.
The 10-year US Treasury note reached its highest yield of 2017 at 2.62% on March 13, two days before the US Federal Reserve (Fed) made its first rate hike of 2017. However, yields declined in the second and third quarters as policy setbacks from the Trump administration and subdued inflation figures appeared to dampen expectations for higher rates.
Those negative trends began to reverse in the fall months as Fed Chair Janet Yellen returned from Jackson Hole with more hawkish-sounding comments on the need to normalize monetary policy. Additionally, a moderate pickup in inflation, exceptional strength in US labor markets, progress on tax reform and a new Fed chair nomination (Jay Powell) appeared to push rate expectations higher, in our opinion. The Fed also began unwinding its nearly $4.5 trillion balance sheet in
1. Source: Morningstar. One cannot invest directly in an index, and an index is not representative of the Fund’s portfolio. Please see Index Descriptions following the Fund Summaries.
The dollar value, number of shares or principal amount, and names of all portfolio holdings are listed in the Fund’s Statement of Investments (SOI).
TEMPLETON GLOBAL BOND VIP FUND
October. Ultimately, the Fed raised rates 25 basis points three times in 2017, as it indicated it would.
On the currency front, the US dollar broadly weakened during much of the year, with notable weakness against the euro and Mexican peso during the summer months. Those trends moderately reversed in September and October, before resuming over the final two months of the year, leaving the US dollar broadly weaker in 2017.
In Europe, economic optimism surged in the summer months, driven by the cyclical upswing in eurozone growth as well as some political refortifying after Emmanuel Macron’s victory in the French election in May. The euro appreciated 13.85% against the US dollar during the year.2 However, growing populist/nationalist movements in a number of countries continued to test the political cohesion across the eurozone. Angela Merkel’s win in the German election in September came with new uncertainties around forming a coalition government.
In October, European Central Bank (ECB) President Mario Draghi announced a reduction in the ECB’s bond-buying program, as expected, to €30 billion per month, down from a €60 billion monthly pace, scheduled to begin in January 2018. Draghi also indicated that rates would not be hiked until quantitative easing (QE) ends, implying that rates would likely remain unchanged in the upcoming year.
In Japan, Prime Minister Shinzo Abe’s political mandate was reaffirmed after his political coalition maintained its supermajority in October elections. The Bank of Japan (BOJ) continued to deploy massive levels of QE throughout 2017; however, the yen appreciated 3.54% against the US dollar during the year.2
Investment Strategy
We invest selectively in bonds around the world based upon our assessment of changing market, political and economic conditions. While seeking opportunities, we monitor various factors including changes in interest rates, currency exchange rates and credit risks. We seek to manage the Fund’s exposure to various currencies and regularly utilize currency and cross currency forward contracts and may also use currency and currency index futures contracts and other derivative instruments.
| | | | |
| Currency Composition* | | | |
| 12/31/17 | | | |
| | | % of Total Net Assets | |
| Americas | | | 160.8% | |
| U.S. Dollar | | | 118.2% | |
| Mexican Peso | | | 21.3% | |
| Brazilian Real | | | 13.1% | |
| Argentinian Peso | | | 4.1% | |
| Colombian Peso | | | 4.0% | |
| Peruvian Neuvo Sol | | | 0.1% | |
| Middle East & Africa | | | 3.5% | |
| South African Rand | | | 1.8% | |
| Ghanaian Cedi | | | 1.7% | |
| Australia & New Zealand | | | -9.7% | |
| New Zealand Dollar | | | 0.0%** | |
| Australian Dollar | | | -9.7% | |
| Asia Pacific | | | -14.6% | |
| Indian Rupee | | | 10.9% | |
| Indonesian Rupiah | | | 9.7% | |
| Philippine Peso | | | 1.8% | |
| South Korean Won | | | -4.4% | |
| Japanese Yen | | | -32.6% | |
| Europe | | | -40.0% | |
| Euro | | | -40.0% | |
*Figures represent the net Fund exposure and include certain derivatives held in the portfolio (or their underlying reference assets) and may not total 100% or may be negative due to rounding, use of any derivatives or other factors.
**Rounds to less than 0.1%.
What is a currency forward contract?
A currency forward contract is an agreement between the Fund and a counterparty to buy or sell a foreign currency in exchange for another currency at a specific exchange rate on a future date. Currency forward contracts are privately traded in the interbank market, not on a centralized exchange.
Manager’s Discussion
On the whole, we continued to position the Fund for rising rates by maintaining low portfolio duration and aiming at a negative correlation with US Treasury returns. We also continued to actively seek select duration exposures that we
2. Source: FactSet.
TEMPLETON GLOBAL BOND VIP FUND
What is a futures contract?
A futures contract is an agreement between the Fund and a counterparty made through a US or foreign futures exchange to buy or sell an underlying instrument or asset at a specific price on a future date.
believe can offer positive real yields without taking undue interest-rate risk, favoring countries that we believe have solid underlying fundamentals and prudent fiscal, monetary and financial policies. When investing globally, investment opportunities may take time to materialize, which may require weathering periods of volatility as the longer term investing theses develop. During the period, we added to some of our strongest investment convictions as prices became cheaper during periods of heightened volatility. We also maintained exposures to a number of emerging market currencies that we believe remained fundamentally undervalued. Overall, we were positioned for depreciation of the euro and Japanese yen, rising US Treasury yields and currency appreciation in select emerging markets. During the period, we used forward currency exchange contracts to actively manage currencies. We also used interest-rate swaps to tactically manage duration exposures.
What is duration?
Duration is a measure of a bond’s price sensitivity to interest-rate changes. In general, a portfolio of securities with a lower duration can be expected to be less sensitive to interest-rate changes than a portfolio with a higher duration.
What is an interest-rate swap?
An interest-rate swap is an agreement between two parties to exchange interest-rate payment obligations, generally one based on an interest rate fixed to maturity and the other based on an interest rate that changes in accordance with changes in a designated benchmark (for example, LIBOR, prime, commercial paper or other benchmarks).
During the period, the Fund’s positive performance was primarily attributable to interest-rate strategies and sovereign credit exposures. Currency positions detracted from absolute return. The Fund maintained a defensive approach regarding interest rates in developed markets, while holding duration exposures in select emerging markets. Select duration exposures in Latin America (Brazil) and Asia ex-Japan (Indonesia) contributed to absolute performance, while negative duration exposure to US Treasuries detracted. Among currencies, the Fund’s net-negative positions in the euro, the Japanese yen and the Australian dollar detracted from absolute
results. However, currency positions in Latin America (the Mexican peso and Brazilian real) and Asia ex-Japan (Indian rupee) contributed to absolute performance.
During the period, the Fund’s relative underperformance was primarily due to currency positions. Sovereign credit exposures and interest-rate strategies modestly contributed to relative return. Among currencies, the Fund’s underweighted positions in the euro, the Japanese yen and the Australian dollar detracted from relative performance, as did its lack of exposure to the British pound. However, overweighted currency positions in Latin America (the Mexican peso and Brazilian real) and Asia ex-Japan (Indian rupee) contributed to relative results. Select overweighted duration exposures in Latin America (Brazil) and Asia ex-Japan (Indonesia) contributed to relative performance, while underweighted duration exposure in the US and Europe detracted.
Thank you for your participation in Templeton Global Bond VIP Fund. We look forward to serving your future investment needs.
The foregoing information reflects our analysis, opinions and portfolio holdings as of December 31, 2017, the end of the reporting period. The way we implement our main investment strategies and the resulting portfolio holdings may change depending on factors such as market and economic conditions. These opinions may not be relied upon as investment advice or an offer for a particular security. The information is not a complete analysis of every aspect of any market, country, industry, security or the Fund. Statements of fact are from sources considered reliable, but the investment manager makes no representation or warranty as to their completeness or accuracy. Although historical performance is no guarantee of future results, these insights may help you understand our investment management philosophy.
TEMPLETON GLOBAL BOND VIP FUND
Class 2 Fund Expenses
As an investor in a variable insurance contract (Contract) that indirectly provides for investment in an underlying mutual fund, you can incur transaction and/or ongoing expenses at both the Fund level and the Contract Level: (1) transaction expenses can include sales charges (loads) on purchases, surrender fees, transfer fees and premium taxes; and (2) ongoing expenses can include management fees, distribution and service (12b-1) fees, contract fees, annual maintenance fees, mortality and expense risk fees and other fees and expenses. All mutual funds and Contracts have some types of ongoing expenses. The table below shows Fund-level ongoing expenses and can help you understand these costs and compare them with those of other mutual funds offered through the Contract. The table assumes a $1,000 investment held for the six months indicated. Please refer to the Fund prospectus for additional information on operating expenses.
Actual Fund Expenses
The table below provides information about the actual account values and actual expenses in the columns under the heading “Actual.” In these columns the Fund’s actual return, which includes the effect of ongoing Fund expenses but does not include the effect of ongoing Contract expenses, is used to calculate the “Ending Account Value.” You can estimate the Fund-level expenses you paid during the period by following these steps (of course, your account value and expenses will differ from those in this illustration): Divide your account value by $1,000 (if your account had an $8,600 value, then $8,600 ÷ $1,000 = 8.6). Then multiply the result by the number under the headings “Actual” and “Fund-Level Expenses Paid During Period” (if Fund-Level Expenses Paid During Period were $ 7.50, then 8.6 × $7.50 = $64.50). In this illustration, the estimated expenses paid this period at the Fund level are $64.50.
Hypothetical Example for Comparison with Other Mutual Funds
Under the heading “Hypothetical” in the table, information is provided about hypothetical account values and hypothetical expenses based on the Fund’s actual expense ratio and an assumed rate of return of 5% per year before expenses, which is not the Fund’s actual return. This information may not be used to estimate the actual ending account balance or expenses you paid for the period, but it can help you compare ongoing costs of investing in the Fund with those of other mutual funds offered through the Contract. To do so, compare this 5% hypothetical example with the 5% hypothetical examples that appear in the shareholder reports of other funds offered through the Contract.
Please note that expenses shown in the table are meant to highlight ongoing costs at the Fund level only and do not reflect any ongoing expenses at the Contract level, or transaction expenses at either the Fund or Contract levels. In addition, while the Fund does not have transaction expenses, if the transaction and ongoing expenses at the Contract level were included, the expenses shown below would be higher. You should consult your Contract prospectus or disclosure document for more information.
| | | | | | | | | | | | | | | | | | | | | | | | | | |
| | | | | | Actual (actual return after expenses) | | | | | Hypothetical (5% annual return before expenses) | | | | |
| Share Class | |
| Beginning
Account Value 7/1/17 |
| |
| Ending
Account Value 12/31/17 |
| |
| Fund-Level
Expenses
Paid During Period 7/1/17–12/31/171,2 |
| | | |
| Ending
Account Value 12/31/17 |
| |
| Fund-Level
Expenses Paid During Period 7/1/17–12/31/171,2 |
| |
| Net
Annualized
Expense
Ratio2 |
|
Class 2 | | $ | 1,000 | | | $ | 990.40 | | | $ | 3.56 | | | | | $ | 1,021.63 | | | $ | 3.62 | | | | 0.71 | % |
1. Expenses are equal to the annualized expense ratio for the six-month period as indicated above—in the far right column—multiplied by the simple average account value over the period indicated, and then multiplied by 184/365 to reflect the one-half year period.
2. Reflects expenses after fee waivers and expense reimbursements. Does not include any ongoing expenses of the Contract for which the Fund is an investment option or acquired fund fees and expenses.
FRANKLIN TEMPLETON VARIABLE INSURANCE PRODUCTS TRUST
Financial Highlights
Templeton Global Bond VIP Fund
| | | | | | | | | | | | | | | | | | | | |
| | | Year Ended December 31, | |
| | | 2017 | | | 2016 | | | 2015 | | | 2014 | | | 2013 | |
| Class 1 | | | | | | | | | | | | | | | | | | | | |
Per share operating performance
(for a share outstanding throughout the year) | | | | | | | | | | | | | | | | | | | | |
| | | | | |
Net asset value, beginning of year | | | $16.85 | | | | $16.34 | | | | $18.56 | | | | $19.15 | | | | $20.01 | |
| | | | |
| | | | | |
| Income from investment operationsa: | | | | | | | | | | | | | | | | | | | | |
| | | | | |
Net investment incomeb | | | 0.83 | | | | 0.62 | | | | 0.52 | | | | 0.58 | | | | 0.64 | |
| | | | | |
Net realized and unrealized gains (losses) | | | (0.46 | ) | | | (0.10 | ) | | | (1.22 | ) | | | (0.16 | ) | | | (0.30 | ) |
| | | | |
Total from investment operations | | | 0.37 | | | | 0.52 | | | | (0.70 | ) | | | 0.42 | | | | 0.34 | |
| | | | |
| | | | | |
| Less distributions from: | | | | | | | | | | | | | | | | | | | | |
| | | | | |
Net investment income and net foreign currency gains | | | — | | | | — | | | | (1.43 | ) | | | (1.01 | ) | | | (0.96 | ) |
| | | | | |
Net realized gains | | | (0.05 | ) | | | (0.01 | ) | | | (0.09 | ) | | | — | | | | (0.24 | ) |
| | | | |
Total distributions | | | (0.05 | ) | | | (0.01 | ) | | | (1.52 | ) | | | (1.01 | ) | | | (1.20 | ) |
| | | | |
Redemption fees | | | — | | | | — | | | | — | | | | — | c | | | — | c |
| | | | |
Net asset value, end of year | | | $17.17 | | | | $16.85 | | | | $16.34 | | | | $18.56 | | | | $19.15 | |
| | | | |
| | | | | |
Total returnd | | | 2.15% | | | | 3.21% | | | | (4.10)% | | | | 2.12% | | | | 1.89% | |
| | | | | |
| Ratios to average net assets | | | | | | | | | | | | | | | | | | | | |
| | | | | |
Expenses before waiver and payments by affiliates | | | 0.53% | | | | 0.53% | | | | 0.52% | | | | 0.51% | | | | 0.51% | |
| | | | | |
Expenses net of waiver and payments by affiliatese | | | 0.46% | | | | 0.48% | | | | 0.52% | f | | | 0.51% | | | | 0.51% | |
| | | | | |
Net investment income | | | 4.81% | | | | 3.88% | | | | 2.99% | | | | 3.08% | | | | 3.26% | |
| | | | | |
| Supplemental data | | | | | | | | | | | | | | | | | | | | |
| | | | | |
Net assets, end of year (000’s) | | | $286,502 | | | | $241,792 | | | | $292,802 | | | | $323,491 | | | | $280,963 | |
| | | | | |
Portfolio turnover rate | | | 37.97% | | | | 59.00% | | | | 51.58% | | | | 39.14% | | | | 34.39% | |
aThe amount shown for a share outstanding throughout the period may not correlate with the Statement of Operations for the period due to the timing of sales and repurchases of the Fund’s shares in relation to income earned and/or fluctuating fair value of the investments of the Fund.
bBased on average daily shares outstanding.
cAmount rounds to less than $0.01 per share.
dTotal return does not include fees, charges or expenses imposed by the variable annuity and life insurance contracts for which Franklin Templeton Variable Insurance Products Trust serves as an underlying investment vehicle.
eBenefit of expense reduction rounds to less than 0.01%.
fBenefit of waiver and payments by affiliates rounds to less than 0.01%.
| | | | |
| TGB-6 | | Annual Report | The accompanying notes are an integral part of these financial statements. | | |
FRANKLIN TEMPLETON VARIABLE INSURANCE PRODUCTS TRUST
FINANCIAL HIGHLIGHTS
Templeton Global Bond VIP Fund (continued)
| | | | | | | | | | | | | | | | | | | | |
| | | Year Ended December 31, | |
| | | 2017 | | | 2016 | | | 2015 | | | 2014 | | | 2013 | |
| Class 2 | | | | | | | | | | | | | | | | | | | | |
Per share operating performance
(for a share outstanding throughout the year) | | | | | | | | | | | | | | | | | | | | |
| | | | | |
Net asset value, beginning of year | | | $16.25 | | | | $15.80 | | | | $17.99 | | | | $18.60 | | | | $19.47 | |
| | | | |
| | | | | |
| Income from investment operationsa: | | | | | | | | | | | | | | | | | | | | |
| | | | | |
Net investment incomeb | | | 0.76 | | | | 0.56 | | | | 0.46 | | | | 0.52 | | | | 0.57 | |
| | | | | |
Net realized and unrealized gains (losses) | | | (0.45 | ) | | | (0.10 | ) | | | (1.17 | ) | | | (0.17 | ) | | | (0.27 | ) |
| | | | |
Total from investment operations | | | 0.31 | | | | 0.46 | | | | (0.71 | ) | | | 0.35 | | | | 0.30 | |
| | | | |
| | | | | |
| Less distributions from: | | | | | | | | | | | | | | | | | | | | |
| | | | | |
Net investment income and net foreign currency gains | | | — | | | | — | | | | (1.39 | ) | | | (0.96 | ) | | | (0.93 | ) |
| | | | | |
Net realized gains | | | (0.05 | ) | | | (0.01 | ) | | | (0.09 | ) | | | — | | | | (0.24 | ) |
| | | | |
Total distributions | | | (0.05 | ) | | | (0.01 | ) | | | (1.48 | ) | | | (0.96 | ) | | | (1.17 | ) |
| | | | |
Redemption fees | | | — | | | | — | | | | — | | | | —c | | | | —c | |
| | | | |
Net asset value, end of year | | | $16.51 | | | | $16.25 | | | | $15.80 | | | | $17.99 | | | | $18.60 | |
| | | | |
| | | | | |
Total returnd | | | 1.93% | | | | 2.94% | | | | (4.30)% | | | | 1.83% | | | | 1.63% | |
| | | | | |
| Ratios to average net assets | | | | | | | | | | | | | | | | | | | | |
| | | | | |
Expenses before waiver and payments by affiliates | | | 0.78% | | | | 0.78% | | | | 0.77% | | | | 0.76% | | | | 0.76% | |
| | | | | |
Expenses net of waiver and payments by affiliatese | | | 0.71% | | | | 0.73% | | | | 0.77%f | | | | 0.76% | | | | 0.76% | |
| | | | | |
Net investment income | | | 4.56% | | | | 3.63% | | | | 2.74% | | | | 2.83% | | | | 3.01% | |
| | | | | |
| Supplemental data | | | | | | | | | | | | | | | | | | | | |
| | | | | |
Net assets, end of year (000’s) | | | $2,730,081 | | | | $2,812,535 | | | | $2,971,667 | | | | $3,177,638 | | | | $2,826,039 | |
| | | | | |
Portfolio turnover rate | | | 37.97% | | | | 59.00% | | | | 51.58% | | | | 39.14% | | | | 34.39% | |
aThe amount shown for a share outstanding throughout the period may not correlate with the Statement of Operations for the period due to the timing of sales and repurchases of the Fund’s shares in relation to income earned and/or fluctuating fair value of the investments of the Fund.
bBased on average daily shares outstanding.
cAmount rounds to less than $0.01 per share.
dTotal return does not include fees, charges or expenses imposed by the variable annuity and life insurance contracts for which Franklin Templeton Variable Insurance Products Trust serves as an underlying investment vehicle.
eBenefit of expense reduction rounds to less than 0.01%.
fBenefit of waiver and payments by affiliates rounds to less than 0.01%.
| | | | | | |
| | | The accompanying notes are an integral part of these financial statements. | Annual Report | | | TGB-7 | |
FRANKLIN TEMPLETON VARIABLE INSURANCE PRODUCTS TRUST
FINANCIAL HIGHLIGHTS
Templeton Global Bond VIP Fund (continued)
| | | | | | | | | | | | | | | | | | | | |
| | | Year Ended December 31, | |
| | | 2017 | | | 2016 | | | 2015 | | | 2014 | | | 2013 | |
| Class 4 | | | | | | | | | | | | | | | | | | | | |
Per share operating performance
(for a share outstanding throughout the year) | | | | | | | | | | | | | | | | | | | | |
| | | | | |
Net asset value, beginning of year | | | $16.62 | | | | $16.18 | | | | $18.38 | | | | $18.97 | | | | $19.82 | |
| | | | |
| | | | | |
| Income from investment operationsa: | | | | | | | | | | | | | | | | | | | | |
| | | | | |
Net investment incomeb | | | 0.76 | | | | 0.56 | | | | 0.46 | | | | 0.51 | | | | 0.56 | |
| | | | | |
Net realized and unrealized gains (losses) | | | (0.45 | ) | | | (0.11 | ) | | | (1.21 | ) | | | (0.18 | ) | | | (0.28 | ) |
| | | | |
Total from investment operations | | | 0.31 | | | | 0.45 | | | | (0.75 | ) | | | 0.33 | | | | 0.28 | |
| | | | |
| | | | | |
| Less distributions from: | | | | | | | | | | | | | | | | | | | | |
| | | | | |
Net investment income and net foreign currency gains | | | — | | | | — | | | | (1.36 | ) | | | (0.92 | ) | | | (0.89 | ) |
| | | | | |
Net realized gains | | | (0.05 | ) | | | (0.01 | ) | | | (0.09 | ) | | | — | | | | (0.24 | ) |
| | | | |
Total distributions | | | (0.05 | ) | | | (0.01 | ) | | | (1.45 | ) | | | (0.92 | ) | | | (1.13 | ) |
| | | | |
Redemption fees | | | — | | | | — | | | | — | | | | — | c | | | — | c |
| | | | |
Net asset value, end of year | | | $16.88 | | | | $16.62 | | | | $16.18 | | | | $18.38 | | | | $18.97 | |
| | | | |
| | | | | |
Total returnd | | | 1.76% | | | | 2.87% | | | | (4.39)% | | | | 1.69% | | | | 1.54% | |
| | | | | |
| Ratios to average net assets | | | | | | | | | | | | | | | | | | | | |
| | | | | |
Expenses before waiver and payments by affiliates | | | 0.88% | | | | 0.88% | | | | 0.87% | | | | 0.86% | | | | 0.86% | |
| | | | | |
Expenses net of waiver and payments by affiliatese | | | 0.81% | | | | 0.83% | | | | 0.87% | f | | | 0.86% | | | | 0.86% | |
| | | | | |
Net investment income | | | 4.46% | | | | 3.53% | | | | 2.64% | | | | 2.73% | | | | 2.91% | |
| | | | | |
| Supplemental data | | | | | | | | | | | | | | | | | | | | |
| | | | | |
Net assets, end of year (000’s) | | | $98,934 | | | | $96,798 | | | | $103,045 | | | | $111,199 | | | | $118,145 | |
| | | | | |
Portfolio turnover rate | | | 37.97% | | | | 59.00% | | | | 51.58% | | | | 39.14% | | | | 34.39% | |
aThe amount shown for a share outstanding throughout the period may not correlate with the Statement of Operations for the period due to the timing of sales and repurchases of the Fund’s shares in relation to income earned and/or fluctuating fair value of the investments of the Fund.
bBased on average daily shares outstanding.
cAmount rounds to less than $0.01 per share.
dTotal return does not include fees, charges or expenses imposed by the variable annuity and life insurance contracts for which Franklin Templeton Variable Insurance Products Trust serves as an underlying investment vehicle.
eBenefit of expense reduction rounds to less than 0.01%.
fBenefit of waiver and payments by affiliates rounds to less than 0.01%.
| | | | |
| TGB-8 | | Annual Report | The accompanying notes are an integral part of these financial statements. | | |
FRANKLIN TEMPLETON VARIABLE INSURANCE PRODUCTS TRUST
Statement of Investments, December 31, 2017
| | | | | | | | | | |
| Templeton Global Bond VIP Fund | | | | |
| | | | | | Principal Amount | * | | | Value | |
| | Foreign Government and Agency Securities 60.1% | | | | | | | | |
| | | Argentina 3.8% | | | | | | |
| | Argentine Bonos del Tesoro, | | | | | | | | |
| | 21.20%, 9/19/18 | | | 44,122,000 | ARS | | $ | 2,301,199 | |
| | 18.20%, 10/03/21 | | | 798,350,000 | ARS | | | 44,045,957 | |
| | 16.00%, 10/17/23 | | | 240,805,000 | ARS | | | 12,884,313 | |
| | senior note, 15.50%, 10/17/26 | | | 1,067,286,000 | ARS | | | 58,089,267 | |
| a | | Government of Argentina, FRN, 24.225%, (ARS Badlar + 2.00%), 4/03/22 | | | 24,036,000 | ARS | | | 1,288,895 | |
| | | | | | | | | | |
| | | | | | | | | 118,609,631 | |
| | | | | | | | | | |
| | | Brazil 11.1% | | | | | | |
| | Letra Tesouro Nacional, | | | | | | | | |
| | Strip, 1/01/19 | | | 38,960 | b BRL | | | 11,017,032 | |
| | Strip, 7/01/19 | | | 102,840 | b BRL | | | 27,929,403 | |
| | Strip, 7/01/20 | | | 259,441 | b BRL | | | 63,758,167 | |
| | Strip, 7/01/21 | | | 24,360 | b BRL | | | 5,387,204 | |
| | Nota Do Tesouro Nacional, | | | | | | | | |
| | 10.00%, 1/01/21 | | | 38,520 | b BRL | | | 11,970,534 | |
| | 10.00%, 1/01/23 | | | 522,145 | b BRL | | | 159,523,908 | |
| | 10.00%, 1/01/25 | | | 69,029 | b BRL | | | 20,790,990 | |
| | 10.00%, 1/01/27 | | | 40,733 | b BRL | | | 12,146,238 | |
| | c Index Linked, 6.00%, 5/15/19 | | | 2,087 | b BRL | | | 1,998,051 | |
| | c Index Linked, 6.00%, 8/15/22 | | | 18,002 | b BRL | | | 17,264,338 | |
| | c Index Linked, 6.00%, 5/15/23 | | | 4,510 | b BRL | | | 4,350,872 | |
| | c Index Linked, 6.00%, 8/15/24 | | | 3,110 | b BRL | | | 3,007,448 | |
| | senior note, 10.00%, 1/01/19 | | | 21,390 | b BRL | | | 6,647,461 | |
| | | | | | | | | | |
| | | | | | | | | 345,791,646 | |
| | | | | | | | | | |
| | Colombia 4.0% | | | | | | | | |
| | Government of Colombia, | | | | | | | | |
| | senior bond, 7.75%, 4/14/21 | | | 2,386,000,000 | COP | | | 845,890 | |
| | senior bond, 4.375%, 3/21/23 | | | 362,000,000 | COP | | | 115,255 | |
| | senior bond, 9.85%, 6/28/27 | | | 576,000,000 | COP | | | 242,044 | |
| | Titulos de Tesoreria, | | | | | | | | |
| | B, 5.00%, 11/21/18 | | | 2,882,000,000 | COP | | | 968,968 | |
| | B, 7.75%, 9/18/30 | | | 140,945,200,000 | COP | | | 51,578,995 | |
| | B, 7.00%, 6/30/32 | | | 5,967,000,000 | COP | | | 2,030,197 | |
| | senior bond, B, 11.25%, 10/24/18 | | | 5,135,000,000 | COP | | | 1,811,292 | |
| | senior bond, B, 11.00%, 7/24/20 | | | 9,167,000,000 | COP | | | 3,489,182 | |
| | senior bond, B, 7.00%, 5/04/22 | | | 10,237,000,000 | COP | | | 3,610,144 | |
| | senior bond, B, 10.00%, 7/24/24 | | | 40,977,000,000 | COP | | | 16,556,441 | |
| | senior bond, B, 7.50%, 8/26/26 | | | 77,594,200,000 | COP | | | 27,773,928 | |
| | senior bond, B, 6.00%, 4/28/28 | | | 42,303,600,000 | COP | | | 13,632,648 | |
| | senior note, B, 7.00%, 9/11/19 | | | 4,056,000,000 | COP | | | 1,406,881 | |
| | | | | | | | | | |
| | | | | | | | | 124,061,865 | |
| | | | | | | | | | |
| | | Ghana 1.7% | | | | | | |
| | Government of Ghana, | | | | | | | | |
| | 24.75%, 3/01/21 | | | 80,000 | GHS | | | 21,091 | |
| | 24.50%, 6/21/21 | | | 80,000 | GHS | | | 21,247 | |
| | 24.75%, 7/19/21 | | | 80,000 | GHS | | | 21,418 | |
| | 18.75%, 1/24/22 | | | 26,840,000 | GHS | | | 6,278,479 | |
| | 19.75%, 3/25/24 | | | 26,840,000 | GHS | | | 6,584,978 | |
| | 19.00%, 11/02/26 | | | 80,510,000 | GHS | | | 19,652,647 | |
| | senior bond, 19.75%, 3/15/32 | | | 80,510,000 | GHS | | | 19,548,431 | |
FRANKLIN TEMPLETON VARIABLE INSURANCE PRODUCTS TRUST
STATEMENT OF INVESTMENTS
Templeton Global Bond VIP Fund (continued)
| | | | | | | | | | |
| | | | | | Principal Amount | * | | | Value | |
| | Foreign Government and Agency Securities (continued) | | | | | | | | |
| | | Ghana (continued) | | | | | | |
| | Government of Ghana, (continued) senior note, 21.50%, 3/09/20 | | | 520,000 GHS | | | $ | 124,437 | |
| | | | | | | | | | |
| | | | | | | | | 52,252,728 | |
| | | | | | | | | | |
| | India 8.5% | | | | | | | | |
| | Government of India, | | | | | | | | |
| | senior bond, 7.80%, 5/03/20 | | | 270,800,000 | INR | | | 4,330,467 | |
| | senior bond, 8.20%, 2/15/22 | | | 500,000,000 | INR | | | 8,100,329 | |
| | senior bond, 8.35%, 5/14/22 | | | 212,700,000 | INR | | | 3,467,436 | |
| | senior bond, 8.08%, 8/02/22 | | | 1,783,000,000 | INR | | | 28,812,599 | |
| | senior bond, 8.13%, 9/21/22 | | | 28,000,000 | INR | | | 452,360 | |
| | senior bond, 9.15%, 11/14/24 | | | 2,409,000,000 | INR | | | 41,036,772 | |
| | senior note, 7.28%, 6/03/19 | | | 28,000,000 | INR | | | 441,498 | |
| | senior note, 8.27%, 6/09/20 | | | 1,222,000,000 | INR | | | 19,748,967 | |
| | senior note, 8.12%, 12/10/20 | | | 844,000,000 | INR | | | 13,676,660 | |
| | senior note, 7.80%, 4/11/21 | | | 1,980,300,000 | INR | | | 31,759,557 | |
| | senior note, 8.79%, 11/08/21 | | | 653,000,000 | INR | | | 10,817,154 | |
| | senior note, 8.15%, 6/11/22 | | | 1,621,000,000 | INR | | | 26,245,270 | |
| | senior note, 6.84%, 12/19/22 | | | 98,000,000 | INR | | | 1,516,025 | |
| | senior note, 7.16%, 5/20/23 | | | 133,700,000 | INR | | | 2,092,193 | |
| | senior note, 8.83%, 11/25/23 | | | 2,983,900,000 | INR | | | 49,946,672 | |
| | senior note, 7.68%, 12/15/23 | | | 1,376,000,000 | INR | | | 22,008,564 | |
| | | | | | | | | | |
| | | | | | | | | 264,452,523 | |
| | | | | | | | | | |
| | | Indonesia 4.7% | | | | | | |
| | Government of Indonesia, | | | | | | | | |
| | senior bond, FR34, 12.80%, 6/15/21 | | | 324,406,000,000 | IDR | | | 29,129,000 | |
| | senior bond, FR35, 12.90%, 6/15/22 | | | 71,229,000,000 | IDR | | | 6,656,963 | |
| | senior bond, FR39, 11.75%, 8/15/23 | | | 5,491,000,000 | IDR | | | 512,068 | |
| | senior bond, FR40, 11.00%, 9/15/25 | | | 46,856,000,000 | IDR | | | 4,416,225 | |
| | senior bond, FR43, 10.25%, 7/15/22 | | | 147,832,000,000 | IDR | | | 12,745,646 | |
| | senior bond, FR44, 10.00%, 9/15/24 | | | 4,454,000,000 | IDR | | | 392,482 | |
| | senior bond, FR46, 9.50%, 7/15/23 | | | 226,780,000,000 | IDR | | | 19,339,186 | |
| | senior bond, FR47, 10.00%, 2/15/28 | | | 12,000,000 | IDR | | | 1,104 | |
| | senior bond, FR52, 10.50%, 8/15/30 | | | 6,960,000,000 | IDR | | | 666,247 | |
| | senior bond, FR59, 7.00%, 5/15/27 | | | 47,752,000,000 | IDR | | | 3,704,366 | |
| | senior bond, FR61, 7.00%, 5/15/22 | | | 244,849,000,000 | IDR | | | 18,809,202 | |
| | senior bond, FR63, 5.625%, 5/15/23 | | | 258,951,000,000 | IDR | | | 18,845,366 | |
| | senior bond, FR64, 6.125%, 5/15/28 | | | 37,000,000 | IDR | | | 2,645 | |
| | senior bond, FR68, 8.375%, 3/15/34 | | | 81,180,000,000 | IDR | | | 6,693,949 | |
| | senior bond, FR70, 8.375%, 3/15/24 | | | 136,475,000,000 | IDR | | | 11,183,048 | |
| | senior bond, FR71, 9.00%, 3/15/29 | | | 51,222,000,000 | IDR | | | 4,472,838 | |
| | senior bond, FR73, 8.75%, 5/15/31 | | | 85,845,000,000 | IDR | | | 7,375,991 | |
| | | | | | | | | | |
| | | | | | | | | 144,946,326 | |
| | | | | | | | | | |
| | | Mexico 17.6% | | | | | | |
| | Government of Mexico, | | | | | | | | |
| | senior bond, M, 8.00%, 6/11/20 | | | 3,814,000 | d MXN | | | 19,577,143 | |
| | senior bond, M, 6.50%, 6/10/21 | | | 18,568,200 | d MXN | | | 91,371,598 | |
| | senior note, M, 4.75%, 6/14/18 | | | 6,801,300 | d MXN | | | 34,181,181 | |
| | senior note, M, 5.00%, 12/11/19 | | | 18,742,300 | d MXN | | | 90,901,942 | |
| | senior note, M 10, 8.50%, 12/13/18 | | | 60,159,700 | d MXN | | | 308,276,201 | |
FRANKLIN TEMPLETON VARIABLE INSURANCE PRODUCTS TRUST
STATEMENT OF INVESTMENTS
Templeton Global Bond VIP Fund (continued)
| | | | | | | | | | |
| | | | | | Principal Amount | * | | | Value | |
| | Foreign Government and Agency Securities (continued) | | | | | | | | |
| | Mexico (continued) | | | | | | | | |
| e | | Mexican Udibonos, | | | | | | | | |
| | Index Linked, 4.00%, 6/13/19 | | | 459,512 | f MXN | | $ | 2,356,617 | |
| | Index Linked, 2.50%, 12/10/20 | | | 361,889 | f MXN | | | 1,792,816 | |
| | | | | | | | | | |
| | | | | | | | | 548,457,498 | |
| | | | | | | | | | |
| | Peru 0.1% | | | | | | | | |
| | Government of Peru, senior bond, 7.84%, 8/12/20 | | | 11,090,000 | PEN | | | 3,819,536 | |
| | | | | | | | | | |
| | Philippines 1.8% | | | | | | | | |
| | Government of the Philippines, | | | | | | | | |
| | senior note, 5.875%, 1/31/18 | | | 81,610,000 | PHP | | | 1,634,330 | |
| | senior note, 3.375%, 8/20/20 | | | 1,102,110,000 | PHP | | | 21,629,531 | |
| | senior note, 5-72, 2.125%, 5/23/18 | | | 686,978,000 | PHP | | | 13,697,028 | |
| | senior note, 7-51, 5.00%, 8/18/18 | | | 64,060,000 | PHP | | | 1,292,940 | |
| | senior note, 7-56, 3.875%, 11/22/19 | | | 813,510,000 | PHP | | | 16,238,793 | |
| | | | | | | | | | |
| | | | | | | | | 54,492,622 | |
| | | | | | | | | | |
| | South Africa 1.7% | | | | | | | | |
| | Government of South Africa, | | | | | | | | |
| | 8.00%, 1/31/30 | | | 141,289,000 | ZAR | | | 10,452,912 | |
| | 7.00%, 2/28/31 | | | 100,900,000 | ZAR | | | 6,805,156 | |
| | 8.25%, 3/31/32 | | | 181,200,000 | ZAR | | | 13,407,312 | |
| | 8.875%, 2/28/35 | | | 79,858,000 | ZAR | | | 6,096,592 | |
| | 8.50%, 1/31/37 | | | 42,938,000 | ZAR | | | 3,128,664 | |
| | R186, 10.50%, 12/21/26 | | | 100,497,000 | ZAR | | | 9,078,269 | |
| | senior bond, 6.25%, 3/31/36 | | | 89,397,000 | ZAR | | | 5,220,552 | |
| | | | | | | | | | |
| | | | | | | | | 54,189,457 | |
| | | | | | | | | | |
| | South Korea 4.3% | | | | | | | | |
| | Korea Monetary Stabilization Bond, senior note, 1.72%, 12/02/18 | | | 8,710,000,000 | KRW | | | 8,152,976 | |
| | Korea Treasury Bond, | | | | | | | | |
| | senior note, 1.75%, 12/10/18 | | | 107,140,000,000 | KRW | | | 100,286,051 | |
| | senior note, 1.25%, 12/10/19 | | | 18,280,000,000 | KRW | | | 16,858,668 | |
| | senior note, 1.375%, 9/10/21 | | | 5,151,300,000 | KRW | | | 4,672,899 | |
| | senior note, 3.00%, 3/10/23 | | | 3,919,000,000 | KRW | | | 3,781,119 | |
| | | | | | | | | | |
| | | | | | | | | 133,751,713 | |
| | | | | | | | | | |
| g | | Supranational 0.3% | | | | | | | | |
| | Inter-American Development Bank, senior bond, 7.50%, 12/05/24 | | | 200,000,000 | MXN | | | 9,835,880 | |
| | | | | | | | | | |
| | Ukraine 0.5% | | | | | | | | |
| h,i,j | | Government of Ukraine, 144A, VRI, GDP Linked Security, 5/31/40 | | | 29,978,000 | | | | 16,705,241 | |
| | | | | | | | | | |
| | | |
| | Total Foreign Government and Agency Securities
(Cost $1,854,947,987) | | | | | | | 1,871,366,666 | |
| | | | | | | | | | |
| | Short Term Investments 33.3% | | | | | | | | |
| | Foreign Government and Agency Securities 7.8% | | | | | | | | |
| | Argentina 0.4% | | | | | | | | |
| | Argentine Bonos del Tesoro, 22.75%, 3/05/18 | | | 2,617,000 | ARS | | | 139,877 | |
| | Letras del Banco Central de la Republica Argentina, Strip, 6/21/18 - 7/18/18 | | | 214,296,585 | ARS | | | 10,143,615 | |
| | | | | | | | | | |
| | | | | | | | | 10,283,492 | |
| | | | | | | | | | |
| | Colombia 0.0%† | | | | | | | | |
| | Colombian Tes Corto Plazo, Strip, 3/13/18 | | | 2,517,000,000 | COP | | | 834,769 | |
| | | | | | | | | | |
FRANKLIN TEMPLETON VARIABLE INSURANCE PRODUCTS TRUST
STATEMENT OF INVESTMENTS
Templeton Global Bond VIP Fund (continued)
| | | | | | | | | | |
| | | | | | Principal Amount | * | | | Value | |
| | Short Term Investments (continued) | | | | | | | | |
| | Foreign Government and Agency Securities (continued) | | | | | | | | |
| | Mexico 3.4% | | | | | | | | |
| k | | Mexico Treasury Bill, 3/01/18 - 12/06/18 | | | 216,821,540 | l MXN | | $ | 106,255,832 | |
| | | | | | | | | | |
| | South Korea 4.0% | | | | | | | | |
| | Korea Monetary Stabilization Bond, | | | | | | | | |
| | k senior note, 1/16/18 | | | 37,500,000,000 | KRW | | | 35,113,597 | |
| | senior note, 1.33%, 10/02/18 | | | 35,500,000,000 | KRW | | | 33,142,559 | |
| | senior note, 1.61%, 10/08/18 | | | 60,000,000,000 | KRW | | | 56,127,282 | |
| | | | | | | | | | |
| | | | | | | | | 124,383,438 | |
| | | | | | | | | | |
| | | |
| | Total Foreign Government and Agency Securities
(Cost $240,590,716) | | | | | | | 241,757,531 | |
| | | | | | | | | | |
| | | U.S. Government and Agency Securities 4.2% | | | | | | |
| | United States 4.2% | | | | | | | | |
| k | | U.S. Treasury Bill, | | | | | | | | |
| | 1/11/18 | | | 51,545,000 | | | | 51,529,891 | |
| | 1/18/18 | | | 79,455,000 | | | | 79,411,432 | |
| | | | | | | | | | |
| | | |
| | Total U.S. Government and Agency Securities
(Cost $130,931,958) | | | | | | | 130,941,323 | |
| | | | | | | | | | |
| | | |
| | Total Investments before Money Market Funds
(Cost $2,226,470,661) | | | | | | | 2,244,065,520 | |
| | | | | | | | | | |
| | | |
| | | | | Shares | | | | |
| | Money Market Funds (Cost $664,514,279) 21.3% | | | | | | | | |
| | United States 21.3% | | | | | | | | |
| m,n | | Institutional Fiduciary Trust Money Market Portfolio, 0.89% | | | 664,514,279 | | | | 664,514,279 | |
| | | | | | | | | | |
| | | |
| | Total Investments (Cost $2,890,984,940) 93.4% | | | | | | | 2,908,579,799 | |
| | Other Assets, less Liabilities 6.6%. | | | | | | | 206,937,475 | |
| | | | | | | | | | |
| | Net Assets 100.0% | | | | | | $ | 3,115,517,274 | |
| | | | | | | | | | |
†Rounds to less than 0.1% of net assets.
*The principal amount is stated in U.S. dollars unless otherwise indicated.
aThe coupon rate shown represents the rate at period end.
bPrincipal amount is stated in 1,000 Brazilian Real Units.
cRedemption price at maturity and coupon payment is adjusted for inflation. See Note 1(f).
dPrincipal amount is stated in 100 Mexican Peso Units.
ePrincipal amount of security is adjusted for inflation. See Note 1(f).
fPrincipal amount is stated in 100 Unidad de Inversion Units.
gA supranational organization is an entity formed by two or more central governments through international treaties.
hSecurity was purchased pursuant to Rule 144A under the Securities Act of 1933 and may be sold in transactions exempt from registration only to qualified institutional buyers or in a public offering registered under the Securities Act of 1933. This security has been deemed liquid under guidelines approved by the Trust’s Board of Trustees.
iNon-income producing.
jThe principal represents the notional amount. See Note 1(c) regarding value recovery instruments.
kThe security was issued on a discount basis with no stated coupon rate.
lPrincipal amount is stated in 10 Mexican Peso Units.
mSee Note 3(e) regarding investments in affiliated management investment companies.
nThe rate shown is the annualized seven-day yield at period end.
FRANKLIN TEMPLETON VARIABLE INSURANCE PRODUCTS TRUST
STATEMENT OF INVESTMENTS
Templeton Global Bond VIP Fund (continued)
At December 31, 2017, the Fund had the following forward exchange contracts outstanding. See Note 1(c).
| | | | | | | | | | | | | | | | | | | | | | | | | | | | |
| Forward Exchange Contracts | | | | | | | | | | | | | |
| Currency | | | Counterparty | a | | | Type | | | | Quantity | | |
| Contract
Amount |
* | |
| Settlement
Date |
| |
| Unrealized
Appreciation |
| |
| Unrealized
Depreciation |
|
| OTC Forward Exchange Contracts | | | | | | | | | | | | | | | | | |
Euro | | | BOFA | | | | Sell | | | | 2,643,000 | | | | 3,123,735 | | | | 1/08/18 | | | $ | — | | | $ | (49,336 | ) |
Euro | | | JPHQ | | | | Sell | | | | 32,859,900 | | | | 38,856,996 | | | | 1/08/18 | | | | — | | | | (593,179 | ) |
Euro | | | SCNY | | | | Sell | | | | 2,400,751 | | | | 2,837,100 | | | | 1/08/18 | | | | — | | | | (45,138 | ) |
Euro | | | UBSW | | | | Sell | | | | 8,311,299 | | | | 9,825,784 | | | | 1/08/18 | | | | — | | | | (152,402 | ) |
Euro | | | BZWS | | | | Sell | | | | 7,003,000 | | | | 8,281,853 | | | | 1/10/18 | | | | — | | | | (126,707 | ) |
Euro | | | GSCO | | | | Sell | | | | 8,105,300 | | | | 9,556,554 | | | | 1/10/18 | | | | — | | | | (175,546 | ) |
Euro | | | HSBK | | | | Sell | | | | 33,800,018 | | | | 39,973,592 | | | | 1/10/18 | | | | — | | | | (610,368 | ) |
Euro | | | JPHQ | | | | Sell | | | | 18,441,000 | | | | 21,454,075 | | | | 1/10/18 | | | | — | | | | (688,185 | ) |
Euro | | | SCNY | | | | Sell | | | | 15,572,000 | | | | 18,343,816 | | | | 1/10/18 | | | | — | | | | (353,613 | ) |
South Korean Won | | | HSBK | | | | Sell | | | | 47,242,119,023 | | | | 41,831,247 | | | | 1/10/18 | | | | — | | | | (2,438,387 | ) |
Euro | | | JPHQ | | | | Sell | | | | 6,147,005 | | | | 7,267,758 | | | | 1/11/18 | | | | — | | | | (113,467 | ) |
Japanese Yen | | | BZWS | | | | Sell | | | | 1,689,110,000 | | | | 14,967,413 | | | | 1/11/18 | | | | — | | | | (32,037 | ) |
Japanese Yen | | | DBAB | | | | Sell | | | | 770,370,000 | | | | 6,832,550 | | | | 1/11/18 | | | | — | | | | (8,406 | ) |
Japanese Yen | | | GSCO | | | | Sell | | | | 329,010,000 | | | | 2,913,991 | | | | 1/11/18 | | | | — | | | | (7,647 | ) |
Japanese Yen | | | JPHQ | | | | Sell | | | | 2,831,950,000 | | | | 25,110,615 | | | | 1/11/18 | | | | — | | | | (37,358 | ) |
Indian Rupee | | | JPHQ | | | | Buy | | | | 82,107,000 | | | | 1,242,351 | | | | 1/12/18 | | | | 42,424 | | | | — | |
Euro | | | BOFA | | | | Sell | | | | 17,769,000 | | | | 20,931,882 | | | | 1/16/18 | | | | — | | | | (411,580 | ) |
Euro | | | DBAB | | | | Sell | | | | 25,440,500 | | | | 30,117,990 | | | | 1/16/18 | | | | — | | | | (440,192 | ) |
Euro | | | HSBK | | | | Sell | | | | 8,692,000 | | | | 10,353,650 | | | | 1/16/18 | | | | — | | | | (86,858 | ) |
Euro | | | JPHQ | | | | Sell | | | | 5,636,000 | | | | 6,715,649 | | | | 1/16/18 | | | | — | | | | (54,105 | ) |
Euro | | | SCNY | | | | Sell | | | | 657,000 | | | | 773,250 | | | | 1/16/18 | | | | — | | | | (15,914 | ) |
Japanese Yen | | | BZWS | | | | Sell | | | | 2,516,120,000 | | | | 22,220,927 | | | | 1/16/18 | | | | — | | | | (128,060 | ) |
Japanese Yen | | | CITI | | | | Sell | | | | 138,680,000 | | | | 1,224,504 | | | | 1/16/18 | | | | — | | | | (7,296 | ) |
Japanese Yen | | | HSBK | | | | Sell | | | | 536,380,000 | | | | 4,733,739 | | | | 1/16/18 | | | | — | | | | (30,560 | ) |
Japanese Yen | | | JPHQ | | | | Sell | | | | 708,450,000 | | | | 6,298,229 | | | | 1/16/18 | | | | 5,548 | | | | — | |
Euro | | | BOFA | | | | Sell | | | | 561,829 | | | | 670,431 | | | | 1/17/18 | | | | — | | | | (4,460 | ) |
Euro | | | GSCO | | | | Sell | | | | 1,789,884 | | | | 2,120,189 | | | | 1/17/18 | | | | — | | | | (29,889 | ) |
Euro | | | JPHQ | | | | Sell | | | | 15,313,111 | | | | 18,276,719 | | | | 1/17/18 | | | | — | | | | (117,982 | ) |
Euro | | | GSCO | | | | Sell | | | | 1,898,500 | | | | 2,253,026 | | | | 1/18/18 | | | | — | | | | (27,670 | ) |
Euro | | | JPHQ | | | | Sell | | | | 32,873,792 | | | | 39,019,054 | | | | 1/18/18 | | | | — | | | | (472,706 | ) |
Euro | | | MSCO | | | | Sell | | | | 15,372,250 | | | | 18,135,719 | | | | 1/18/18 | | | | — | | | | (331,186 | ) |
Euro | | | UBSW | | | | Sell | | | | 599,610 | | | | 711,299 | | | | 1/18/18 | | | | — | | | | (9,021 | ) |
Euro | | | DBAB | | | | Sell | | | | 9,037,398 | | | | 10,660,333 | | | | 1/22/18 | | | | — | | | | (199,164 | ) |
Euro | | | JPHQ | | | | Sell | | | | 14,818,028 | | | | 17,502,610 | | | | 1/22/18 | | | | — | | | | (302,996 | ) |
Euro | | | UBSW | | | | Sell | | | | 11,641,500 | | | | 13,775,736 | | | | 1/22/18 | | | | — | | | | (212,897 | ) |
Japanese Yen | | | JPHQ | | | | Sell | | | | 652,895,000 | | | | 5,869,722 | | | | 1/22/18 | | | | 68,749 | | | | — | |
Japanese Yen | | | SCNY | | | | Sell | | | | 707,660,000 | | | | 6,382,503 | | | | 1/22/18 | | | | 94,944 | | | | — | |
Indian Rupee | | | DBAB | | | | Buy | | | | 491,655,000 | | | | 7,519,960 | | | | 1/23/18 | | | | 166,853 | | | | — | |
Indian Rupee | | | JPHQ | | | | Buy | | | | 358,075,000 | | | | 5,475,153 | | | | 1/23/18 | | | | 123,195 | | | | — | |
Euro | | | DBAB | | | | Sell | | | | 14,940,282 | | | | 17,710,360 | | | | 1/24/18 | | | | — | | | | (244,415 | ) |
Euro | | | JPHQ | | | | Sell | | | | 300,000 | | | | 356,412 | | | | 1/24/18 | | | | — | | | | (4,119 | ) |
Japanese Yen | | | BZWS | | | | Sell | | | | 735,200,000 | | | | 6,521,026 | | | | 1/24/18 | | | | — | | | | (11,883 | ) |
Japanese Yen | | | DBAB | | | | Sell | | | | 858,140,000 | | | | 7,724,867 | | | | 1/24/18 | | | | 99,526 | | | | — | |
Japanese Yen | | | JPHQ | | | | Sell | | | | 7,105,349,700 | | | | 64,223,489 | | | | 1/24/18 | | | | 1,086,111 | | | | — | |
South Korean Won | | | HSBK | | | | Sell | | | | 59,965,000,000 | | | | 53,049,940 | | | | 1/24/18 | | | | — | | | | (3,156,182 | ) |
Japanese Yen | | | CITI | | | | Sell | | | | 913,412,000 | | | | 8,262,957 | | | | 1/25/18 | | | | 146,067 | | | | — | |
Japanese Yen | | | JPHQ | | | | Sell | | | | 1,407,000,000 | | | | 12,724,798 | | | | 1/25/18 | | | | 221,718 | | | | — | |
Euro | | | GSCO | | | | Sell | | | | 4,711,000 | | | | 5,585,738 | | | | 1/29/18 | | | | — | | | | (77,538 | ) |
FRANKLIN TEMPLETON VARIABLE INSURANCE PRODUCTS TRUST
STATEMENT OF INVESTMENTS
Templeton Global Bond VIP Fund (continued)
| | | | | | | | | | | | | | | | | | | | | | | | | | | | |
| Forward Exchange Contracts (continued) | | | | | | | | | | | | | |
| Currency | | | Counterparty | a | | | Type | | | | Quantity | | |
| Contract
Amount |
* | |
| Settlement
Date |
| |
| Unrealized
Appreciation |
| |
| Unrealized
Depreciation |
|
| OTC Forward Exchange Contracts (continued) | | | | | | | | | | | | | | | | | |
Indian Rupee | | | HSBK | | | | Buy | | | | 679,529,000 | | | | 10,358,674 | | | | 1/29/18 | | | $ | 260,350 | | | $ | — | |
Indonesian Rupiah | | | HSBK | | | | Buy | | | | 424,000,000,000 | | | | 31,245,394 | | | | 1/29/18 | | | | 39,423 | | | | — | |
Japanese Yen | | | DBAB | | | | Sell | | | | 897,860,782 | | | | 8,102,267 | | | | 1/29/18 | | | | 122,004 | | | | — | |
Japanese Yen | | | JPHQ | | | | Sell | | | | 490,100,000 | | | | 4,434,030 | | | | 1/29/18 | | | | 77,980 | | | | — | |
Euro | | | DBAB | | | | Sell | | | | 27,189,556 | | | | 32,043,164 | | | | 1/30/18 | | | | — | | | | (644,249 | ) |
Euro | | | GSCO | | | | Sell | | | | 2,227,000 | | | | 2,625,254 | | | | 1/30/18 | | | | — | | | | (52,056 | ) |
Indian Rupee | | | JPHQ | | | | Buy | | | | 60,607,000 | | | | 926,996 | | | | 1/30/18 | | | | 20,013 | | | | — | |
Japanese Yen | | | DBAB | | | | Sell | | | | 8,368,505,770 | | | | 74,632,175 | | | | 1/30/18 | | | | 248,803 | | | | — | |
Euro | | | BOFA | | | | Sell | | | | 65,140,400 | | | | 75,973,249 | | | | 1/31/18 | | | | — | | | | (2,343,136 | ) |
Euro | | | BZWS | | | | Sell | | | | 44,990,331 | | | | 53,888,294 | | | | 1/31/18 | | | | — | | | | (202,256 | ) |
Euro | | | CITI | | | | Sell | | | | 77,832,770 | | | | 90,620,694 | | | | 1/31/18 | | | | — | | | | (2,955,353 | ) |
Euro | | | SCNY | | | | Sell | | | | 12,300,264 | | | | 14,677,290 | | | | 1/31/18 | | | | — | | | | (110,955 | ) |
Japanese Yen | | | BZWS | | | | Sell | | | | 1,079,470,000 | | | | 9,776,037 | | | | 1/31/18 | | | | 180,743 | | | | — | |
Japanese Yen | | | HSBK | | | | Sell | | | | 1,162,462,488 | | | | 10,505,761 | | | | 1/31/18 | | | | 172,756 | | | | — | |
Indian Rupee | | | JPHQ | | | | Buy | | | | 139,661,000 | | | | 2,121,863 | | | | 2/01/18 | | | | 59,943 | | | | — | |
Euro | | | GSCO | | | | Sell | | | | 21,051,000 | | | | 24,614,934 | | | | 2/02/18 | | | | — | | | | (696,836 | ) |
Euro | | | HSBK | | | | Sell | | | | 25,974,891 | | | | 30,433,351 | | | | 2/02/18 | | | | — | | | | (798,916 | ) |
Euro | | | JPHQ | | | | Sell | | | | 11,263,000 | | | | 13,180,165 | | | | 2/02/18 | | | | — | | | | (362,491 | ) |
Euro | | | BOFA | | | | Sell | | | | 32,701,000 | | | | 38,271,942 | | | | 2/05/18 | | | | — | | | | (1,054,276 | ) |
Euro | | | DBAB | | | | Sell | | | | 4,115,651 | | | | 4,815,723 | | | | 2/05/18 | | | | — | | | | (133,758 | ) |
Euro | | | BOFA | | | | Sell | | | | 11,879,864 | | | | 13,931,279 | | | | 2/06/18 | | | | — | | | | (356,227 | ) |
Euro | | | DBAB | | | | Sell | | | | 12,156,556 | | | | 14,198,614 | | | | 2/07/18 | | | | — | | | | (422,460 | ) |
Indian Rupee | | | DBAB | | | | Buy | | | | 736,704,494 | | | | 11,199,521 | | | | 2/08/18 | | | | 301,004 | | | | — | |
Indian Rupee | | | HSBK | | | | Buy | | | | 240,033,500 | | | | 3,678,111 | | | | 2/08/18 | | | | 68,997 | | | | — | |
Japanese Yen | | | JPHQ | | | | Sell | | | | 1,719,500,000 | | | | 15,617,408 | | | | 2/08/18 | | | | 327,388 | | | | — | |
Japanese Yen | | | SCNY | | | | Sell | | | | 1,720,000,000 | | | | 15,656,646 | | | | 2/08/18 | | | | 362,180 | | | | — | |
Euro | | | DBAB | | | | Sell | | | | 13,483,000 | | | | 15,692,527 | | | | 2/09/18 | | | | — | | | | (525,681 | ) |
Japanese Yen | | | BZWS | | | | Sell | | | | 1,720,220,000 | | | | 15,584,526 | | | | 2/09/18 | | | | 287,408 | | | | — | |
Japanese Yen | | | CITI | | | | Sell | | | | 366,860,000 | | | | 3,327,951 | | | | 2/09/18 | | | | 65,635 | | | | — | |
Japanese Yen | | | JPHQ | | | | Sell | | | | 1,723,960,000 | | | | 15,713,648 | | | | 2/09/18 | | | | 383,271 | | | | — | |
Euro | | | HSBK | | | | Sell | | | | 1,800,000 | | | | 2,098,575 | | | | 2/12/18 | | | | — | | | | (66,935 | ) |
Euro | | | JPHQ | | | | Sell | | | | 6,146,997 | | | | 7,281,456 | | | | 2/12/18 | | | | — | | | | (113,758 | ) |
Japanese Yen | | | CITI | | | | Sell | | | | 751,731,000 | | | | 6,848,081 | | | | 2/13/18 | | | | 162,069 | | | | — | |
Euro | | | CITI | | | | Sell | | | | 37,063,039 | | | | 43,418,980 | | | | 2/14/18 | | | | — | | | | (1,175,013 | ) |
Euro | | | JPHQ | | | | Sell | | | | 8,370,000 | | | | 9,813,699 | | | | 2/14/18 | | | | — | | | | (257,027 | ) |
Japanese Yen | | | CITI | | | | Sell | | | | 493,314,670 | | | | 4,369,638 | | | | 2/14/18 | | | | — | | | | (18,179 | ) |
Japanese Yen | | | CITI | | | | Sell | | | | 689,390,000 | | | | 6,190,226 | | | | 2/14/18 | | | | 58,405 | | | | — | |
Australian Dollar | | | JPHQ | | | | Sell | | | | 50,143,500 | | | | 38,290,830 | | | | 2/15/18 | | | | — | | | | (829,022 | ) |
Euro | | | DBAB | | | | Sell | | | | 5,008,730 | | | | 5,874,349 | | | | 2/15/18 | | | | — | | | | (152,451 | ) |
Indian Rupee | | | JPHQ | | | | Buy | | | | 378,455,000 | | | | 5,808,088 | | | | 2/15/18 | | | | 95,586 | | | | — | |
Japanese Yen | | | CITI | | | | Sell | | | | 683,420,000 | | | | 6,304,322 | | | | 2/15/18 | | | | 225,324 | | | | — | |
Japanese Yen | | | JPHQ | | | | Sell | | | | 2,553,380,000 | | | | 23,638,249 | | | | 2/15/18 | | | | 926,021 | | | | — | |
Euro | | | BOFA | | | | Sell | | | | 10,503,638 | | | | 12,414,722 | | | | 2/16/18 | | | | — | | | | (224,568 | ) |
Japanese Yen | | | GSCO | | | | Sell | | | | 1,205,250,280 | | | | 11,115,571 | | | | 2/16/18 | | | | 394,423 | | | | — | |
Japanese Yen | | | HSBK | | | | Sell | | | | 1,035,240,000 | | | | 9,301,348 | | | | 2/16/18 | | | | 92,504 | | | | — | |
Japanese Yen | | | JPHQ | | | | Sell | | | | 353,873,000 | | | | 3,171,900 | | | | 2/16/18 | | | | 24,068 | | | | — | |
Euro | | | GSCO | | | | Sell | | | | 3,692,733 | | | | 4,379,449 | | | | 2/20/18 | | | | — | | | | (65,083 | ) |
Euro | | | JPHQ | | | | Sell | | | | 14,818,028 | | | | 17,532,394 | | | | 2/20/18 | | | | — | | | | (302,420 | ) |
Euro | | | SCNY | | | | Sell | | | | 4,975,000 | | | | 5,906,743 | | | | 2/20/18 | | | | — | | | | (81,112 | ) |
FRANKLIN TEMPLETON VARIABLE INSURANCE PRODUCTS TRUST
STATEMENT OF INVESTMENTS
Templeton Global Bond VIP Fund (continued)
| | | | | | | | | | | | | | | | | | | | | | | | | | | | |
| Forward Exchange Contracts (continued) | | | | | | | | | | | | | |
| Currency | | | Counterparty | a | | | Type | | | | Quantity | | |
| Contract
Amount |
* | |
| Settlement
Date |
| |
| Unrealized
Appreciation |
| |
| Unrealized
Depreciation |
|
| OTC Forward Exchange Contracts (continued) | | | | | | | | | | | | | | | | | |
Euro | | | UBSW | | | | Sell | | | | 3,245,000 | | | | 3,854,736 | | | | 2/20/18 | | | $ | — | | | $ | (50,911 | ) |
Japanese Yen | | | DBAB | | | | Sell | | | | 838,612,000 | | | | 7,651,220 | | | | 2/20/18 | | | | 190,096 | | | | — | |
South Korean Won | | | CITI | | | | Sell | | | | 19,797,000,000 | | | | 17,707,753 | | | | 2/20/18 | | | | — | | | | (854,284 | ) |
Australian Dollar | | | CITI | | | | Sell | | | | 13,307,000 | | | | 9,828,949 | | | | 2/22/18 | | | | — | | | | (552,318 | ) |
Euro | | | BOFA | | | | Sell | | | | 7,066,000 | | | | 8,351,411 | | | | 2/22/18 | | | | — | | | | (154,080 | ) |
Euro | | | DBAB | | | | Sell | | | | 3,887,000 | | | | 4,592,957 | | | | 2/22/18 | | | | — | | | | (85,906 | ) |
Euro | | | HSBK | | | | Sell | | | | 19,488,000 | | | | 23,112,768 | | | | 2/22/18 | | | | — | | | | (345,345 | ) |
Euro | | | JPHQ | | | | Sell | | | | 28,236,000 | | | | 33,371,846 | | | | 2/22/18 | | | | — | | | | (616,417 | ) |
Euro | | | UBSW | | | | Sell | | | | 678,250 | | | | 802,838 | | | | 2/22/18 | | | | — | | | | (13,586 | ) |
Japanese Yen | | | HSBK | | | | Sell | | | | 1,621,372,000 | | | | 14,902,316 | | | | 2/22/18 | | | | 475,668 | | | | — | |
Japanese Yen | | | JPHQ | | | | Sell | | | | 1,135,828,000 | | | | 10,485,663 | | | | 2/22/18 | | | | 379,290 | | | | — | |
Euro | | | JPHQ | | | | Sell | | | | 4,730,771 | | | | 5,577,390 | | | | 2/26/18 | | | | — | | | | (118,387 | ) |
Japanese Yen | | | DBAB | | | | Sell | | | | 371,821,000 | | | | 3,432,299 | | | | 2/26/18 | | | | 123,307 | | | | — | |
Japanese Yen | | | HSBK | | | | Sell | | | | 1,131,678,000 | | | | 10,236,798 | | | | 2/27/18 | | | | 165,056 | | | | — | |
South Korean Won | | | HSBK | | | | Sell | | | | 35,277,000,000 | | | | 32,008,892 | | | | 2/27/18 | | | | — | | | | (1,070,015 | ) |
Euro | | | BOFA | | | | Sell | | | | 2,680,925 | | | | 3,207,459 | | | | 2/28/18 | | | | — | | | | (20,726 | ) |
Euro | | | DBAB | | | | Sell | | | | 2,368,470 | | | | 2,829,137 | | | | 2/28/18 | | | | — | | | | (22,810 | ) |
Euro | | | GSCO | | | | Sell | | | | 2,227,000 | | | | 2,670,730 | | | | 2/28/18 | | | | — | | | | (10,869 | ) |
Euro | | | SCNY | | | | Sell | | | | 12,544,218 | | | | 14,992,850 | | | | 2/28/18 | | | | — | | | | (112,029 | ) |
Japanese Yen | | | BZWS | | | | Sell | | | | 1,920,010,000 | | | | 17,801,738 | | | | 2/28/18 | | | | 712,900 | | | | — | |
Japanese Yen | | | DBAB | | | | Sell | | | | 685,950,000 | | | | 6,340,997 | | | | 2/28/18 | | | | 235,774 | | | | — | |
Japanese Yen | | | JPHQ | | | | Sell | | | | 2,260,398,000 | | | | 20,814,743 | | | | 2/28/18 | | | | 696,319 | | | | — | |
Euro | | | BOFA | | | | Sell | | | | 2,694,506 | | | | 3,205,034 | | | | 3/01/18 | | | | — | | | | (39,718 | ) |
Japanese Yen | | | DBAB | | | | Sell | | | | 229,660,000 | | | | 2,101,824 | | | | 3/01/18 | | | | 57,632 | | | | — | |
Japanese Yen | | | HSBK | | | | Sell | | | | 1,247,125,000 | | | | 11,419,513 | | | | 3/01/18 | | | | 318,915 | | | | — | |
Euro | | | GSCO | | | | Sell | | | | 26,074,100 | | | | 31,148,692 | | | | 3/05/18 | | | | — | | | | (258,334 | ) |
Japanese Yen | | | JPHQ | | | | Sell | | | | 848,300,000 | | | | 7,604,764 | | | | 3/05/18 | | | | 52,186 | | | | — | |
South Korean Won | | | HSBK | | | | Sell | | | | 42,561,000,000 | | | | 39,397,390 | | | | 3/05/18 | | | | — | | | | (513,526 | ) |
Euro | | | UBSW | | | | Sell | | | | 6,231,299 | | | | 7,417,240 | | | | 3/06/18 | | | | — | | | | (89,042 | ) |
Japanese Yen | | | HSBK | | | | Sell | | | | 400,800,000 | | | | 3,571,238 | | | | 3/06/18 | | | | 2,613 | | | | — | |
Euro | | | BOFA | | | | Sell | | | | 11,879,864 | | | | 14,124,564 | | | | 3/07/18 | | | | — | | | | (186,980 | ) |
Euro | | | GSCO | | | | Sell | | | | 2,045,000 | | | | 2,433,499 | | | | 3/07/18 | | | | — | | | | (30,091 | ) |
South Korean Won | | | GSCO | | | | Sell | | | | 44,346,000,000 | | | | 39,478,323 | | | | 3/07/18 | | | | — | | | | (2,107,098 | ) |
Euro | | | JPHQ | | | | Sell | | | | 6,146,997 | | | | 7,293,351 | | | | 3/12/18 | | | | — | | | | (114,325 | ) |
Australian Dollar | | | CITI | | | | Sell | | | | 58,003,000 | | | | 43,076,218 | | | | 3/13/18 | | | | — | | | | (2,170,645 | ) |
Australian Dollar | | | JPHQ | | | | Sell | | | | 86,973,000 | | | | 64,360,020 | | | | 3/13/18 | | | | — | | | | (3,485,702 | ) |
Euro | | | DBAB | | | | Sell | | | | 25,440,500 | | | | 30,215,936 | | | | 3/13/18 | | | | — | | | | (444,151 | ) |
Japanese Yen | | | DBAB | | | | Sell | | | | 595,700,000 | | | | 5,519,216 | | | | 3/13/18 | | | | 212,911 | | | | — | |
Indian Rupee | | | DBAB | | | | Buy | | | | 258,123,000 | | | | 3,971,429 | | | | 3/14/18 | | | | 43,863 | | | | — | |
South Korean Won | | | DBAB | | | | Sell | | | | 13,919,000,000 | | | | 12,792,023 | | | | 3/14/18 | | | | — | | | | (261,221 | ) |
Euro | | | JPHQ | | | | Sell | | | | 14,818,028 | | | | 17,529,801 | | | | 3/15/18 | | | | — | | | | (330,786 | ) |
Euro | | | BOFA | | | | Sell | | | | 10,503,638 | | | | 12,416,350 | | | | 3/16/18 | | | | — | | | | (244,820 | ) |
Euro | | | GSCO | | | | Sell | | | | 1,789,884 | | | | 2,123,983 | | | | 3/19/18 | | | | — | | | | (33,986 | ) |
Euro | | | MSCO | | | | Sell | | | | 15,372,250 | | | | 18,199,361 | | | | 3/19/18 | | | | — | | | | (334,161 | ) |
Indian Rupee | | | CITI | | | | Buy | | | | 69,318,000 | | | | 1,063,323 | | | | 3/19/18 | | | | 14,411 | | | | — | |
Japanese Yen | | | BZWS | | | | Sell | | | | 981,707,504 | | | | 8,955,845 | | | | 3/19/18 | | | | 207,801 | | | | — | |
Japanese Yen | | | CITI | | | | Sell | | | | 286,112,008 | | | | 2,599,246 | | | | 3/20/18 | | | | 49,527 | | | | — | |
South Korean Won | | | CITI | | | | Sell | | | | 5,895,000,000 | | | | 5,214,737 | | | | 3/20/18 | | | | — | | | | (313,855 | ) |
South Korean Won | | | HSBK | | | | Sell | | | | 7,007,000,000 | | | | 6,198,691 | | | | 3/20/18 | | | | — | | | | (372,785 | ) |
FRANKLIN TEMPLETON VARIABLE INSURANCE PRODUCTS TRUST
STATEMENT OF INVESTMENTS
Templeton Global Bond VIP Fund (continued)
| | | | | | | | | | | | | | | | | | | | | | | | | | | | |
| Forward Exchange Contracts (continued) | | | | | | | | | | | | | |
| Currency | | | Counterparty | a | | | Type | | | | Quantity | | |
| Contract
Amount |
* | |
| Settlement
Date |
| |
| Unrealized
Appreciation |
| |
| Unrealized
Depreciation |
|
| OTC Forward Exchange Contracts (continued) | | | | | | | | | | | | | | | | | |
Japanese Yen | | | DBAB | | | | Sell | | | | 725,287,000 | | | | 6,565,228 | | | | 3/22/18 | | | $ | 100,938 | | | $ | — | |
Japanese Yen | | | CITI | | | | Sell | | | | 1,866,452,000 | | | | 16,883,711 | | | | 3/23/18 | | | | 247,471 | | | | — | |
Japanese Yen | | | BZWS | | | | Sell | | | | 983,714,840 | | | | 8,909,008 | | | | 3/26/18 | | | | 139,207 | | | | — | |
Japanese Yen | | | JPHQ | | | | Sell | | | | 285,510,329 | | | | 2,618,244 | | | | 3/26/18 | | | | 72,924 | | | | — | |
Japanese Yen | | | MSCO | | | | Sell | | | | 575,230,000 | | | | 5,207,586 | | | | 3/26/18 | | | | 79,421 | | | | — | |
South Korean Won | | | HSBK | | | | Sell | | | | 23,174,880,977 | | | | 20,545,107 | | | | 3/27/18 | | | | — | | | | (1,190,513 | ) |
Japanese Yen | | | JPHQ | | | | Sell | | | | 172,207,000 | | | | 1,536,863 | | | | 3/30/18 | | | | 1,256 | | | | — | |
Brazilian Real | | | CITI | | | | Buy | | | | 206,375,000 | | | | 53,420,739 | EUR | | | 4/03/18 | | | | — | | | | (2,804,513 | ) |
Japanese Yen | | | JPHQ | | | | Sell | | | | 2,831,950,000 | | | | 25,361,920 | | | | 4/06/18 | | | | 98,043 | | | | — | |
Japanese Yen | | | SCNY | | | | Sell | | | | 415,980,000 | | | | 3,729,090 | | | | 4/10/18 | | | | 17,220 | | | | — | |
Japanese Yen | | | BZWS | | | | Sell | | | | 1,712,605,900 | | | | 15,348,971 | | | | 4/11/18 | | | | 66,125 | | | | — | |
Japanese Yen | | | HSBK | | | | Sell | | | | 2,816,800,000 | | | | 25,217,547 | | | | 4/11/18 | | | | 81,163 | | | | — | |
Japanese Yen | | | CITI | | | | Sell | | | | 261,800,000 | | | | 2,410,348 | | | | 4/13/18 | | | | 73,829 | | | | — | |
Japanese Yen | | | DBAB | | | | Sell | | | | 1,406,600,000 | | | | 12,955,816 | | | | 4/13/18 | | | | 402,156 | | | | — | |
Japanese Yen | | | BOFA | | | | Sell | | | | 700,840,000 | | | | 6,454,774 | | | | 4/18/18 | | | | 197,991 | | | | — | |
South Korean Won | | | HSBK | | | | Sell | | | | 5,991,000,000 | | | | 5,243,764 | | | | 4/18/18 | | | | — | | | | (376,897 | ) |
Japanese Yen | | | JPHQ | | | | Sell | | | | 1,886,055,000 | | | | 16,857,989 | | | | 4/20/18 | | | | 18,087 | | | | — | |
Japanese Yen | | | JPHQ | | | | Sell | | | | 917,650,000 | | | | 8,567,961 | | | | 4/23/18 | | | | 373,096 | | | | — | |
Indian Rupee | | | DBAB | | | | Buy | | | | 79,271,000 | | | | 1,196,995 | | | | 4/25/18 | | | | 30,604 | | | | — | |
Indian Rupee | | | DBAB | | | | Buy | | | | 838,950,988 | | | | 12,659,589 | | | | 4/27/18 | | | | 329,681 | | | | — | |
Japanese Yen | | | GSCO | | | | Sell | | | | 944,420,000 | | | | 8,369,327 | | | | 4/27/18 | | | | — | | | | (66,660 | ) |
South Korean Won | | | HSBK | | | | Sell | | | | 15,755,000,000 | | | | 13,995,736 | | | | 4/30/18 | | | | — | | | | (787,943 | ) |
Indonesian Rupiah | | | JPHQ | | | | Buy | | | | 1,721,000,000,000 | | | | 123,991,354 | | | | 5/03/18 | | | | 1,963,123 | | | | — | |
Japanese Yen | | | CITI | | | | Sell | | | | 341,992,119 | | | | 3,022,801 | | | | 5/09/18 | | | | — | | | | (34,267 | ) |
Japanese Yen | | | CITI | | | | Sell | | | | 493,314,665 | | | | 4,392,105 | | | | 5/14/18 | | | | — | | | | (18,982 | ) |
Japanese Yen | | | JPHQ | | | | Sell | | | | 335,950,000 | | | | 2,994,474 | | | | 5/14/18 | | | | — | | | | (9,501 | ) |
Australian Dollar | | | JPHQ | | | | Sell | | | | 50,143,500 | | | | 38,272,277 | | | | 5/15/18 | | | | — | | | | (838,983 | ) |
Japanese Yen | | | GSCO | | | | Sell | | | | 490,555,000 | | | | 4,367,944 | | | | 5/15/18 | | | | — | | | | (18,736 | ) |
Japanese Yen | | | HSBK | | | | Sell | | | | 413,563,000 | | | | 3,697,479 | | | | 5/15/18 | | | | — | | | | (716 | ) |
Japanese Yen | | | SCNY | | | | Sell | | | | 366,681,000 | | | | 3,274,551 | | | | 5/15/18 | | | | — | | | | (4,412 | ) |
South Korean Won | | | CITI | | | | Sell | | | | 11,823,000,000 | | | | 10,619,779 | | | | 5/15/18 | | | | — | | | | (476,744 | ) |
Indian Rupee | | | HSBK | | | | Buy | | | | 402,232,000 | | | | 6,021,248 | | | | 5/16/18 | | | | 193,613 | | | | — | |
Japanese Yen | | | CITI | | | | Sell | | | | 366,680,000 | | | | 3,263,410 | | | | 5/16/18 | | | | — | | | | (15,745 | ) |
Japanese Yen | | | JPHQ | | | | Sell | | | | 355,193,000 | | | | 3,163,711 | | | | 5/16/18 | | | | — | | | | (12,717 | ) |
Japanese Yen | | | SCNY | | | | Sell | | | | 340,600,700 | | | | 3,030,174 | | | | 5/16/18 | | | | — | | | | (15,758 | ) |
South Korean Won | | | HSBK | | | | Sell | | | | 75,818,000,000 | | | | 67,830,910 | | | | 5/17/18 | | | | — | | | | (3,330,449 | ) |
Japanese Yen | | | BOFA | | | | Sell | | | | 1,105,661,700 | | | | 9,924,259 | | | | 5/18/18 | | | | 35,312 | | | | — | |
Japanese Yen | | | CITI | | | | Sell | | | | 1,599,298,500 | | | | 14,346,508 | | | | 5/18/18 | | | | 42,515 | | | | — | |
South Korean Won | | | DBAB | | | | Sell | | | | 13,920,000,000 | | | | 12,530,381 | | | | 5/18/18 | | | | — | | | | (534,862 | ) |
Japanese Yen | | | BOFA | | | | Sell | | | | 1,102,846,375 | | | | 10,045,282 | | | | 5/21/18 | | | | 179,706 | | | | — | |
Japanese Yen | | | CITI | | | | Sell | | | | 1,599,308,500 | | | | 14,295,751 | | | | 5/21/18 | | | | — | | | | (10,955 | ) |
Japanese Yen | | | DBAB | | | | Sell | | | | 796,770,000 | | | | 7,129,295 | | | | 5/21/18 | | | | 1,743 | | �� | | — | |
Japanese Yen | | | HSBK | | | | Sell | | | | 1,106,730,400 | | | | 10,102,514 | | | | 5/21/18 | | | | 202,194 | | | | — | |
Japanese Yen | | | BOFA | | | | Sell | | | | 1,105,842,500 | | | | 10,134,187 | | | | 5/22/18 | | | | 241,205 | | | | — | |
Japanese Yen | | | CITI | | | | Sell | | | | 376,247,000 | | | | 3,384,374 | | | | 5/22/18 | | | | 18,430 | | | | — | |
Japanese Yen | | | JPHQ | | | | Sell | | | | 715,709,000 | | | | 6,559,067 | | | | 5/22/18 | | | | 156,260 | | | | — | |
Japanese Yen | | | SCNY | | | | Sell | | | | 937,086,000 | | | | 8,427,881 | | | | 5/24/18 | | | | 43,587 | | | | — | |
Japanese Yen | | | BOFA | | | | Sell | | | | 1,085,075,000 | | | | 9,936,584 | | | | 5/25/18 | | | | 227,610 | | | | — | |
Japanese Yen | | | HSBK | | | | Sell | | | | 207,909,000 | | | | 1,871,031 | | | | 5/29/18 | | | | 10,259 | | | | — | |
FRANKLIN TEMPLETON VARIABLE INSURANCE PRODUCTS TRUST
STATEMENT OF INVESTMENTS
Templeton Global Bond VIP Fund (continued)
| | | | | | | | | | | | | | | | | | | | | | | | | | | | |
| Forward Exchange Contracts (continued) | | | | | | | | | | | | | |
| Currency | | | Counterparty | a | | | Type | | | | Quantity | | |
| Contract
Amount |
* | |
| Settlement
Date |
| |
| Unrealized
Appreciation |
| |
| Unrealized
Depreciation |
|
| OTC Forward Exchange Contracts (continued) | | | | | | | | | | | | | | | | | |
Australian Dollar | | | GSCO | | | | Sell | | | | 127,700,540 | | | | 96,596,519 | | | | 6/05/18 | | | $ | — | | | $ | (3,005,724 | ) |
Japanese Yen | | | CITI | | | | Sell | | | | 1,370,500,000 | | | | 12,339,399 | | | | 6/08/18 | | | | 66,008 | | | | — | |
Japanese Yen | | | HSBK | | | | Sell | | | | 1,026,200,000 | | | | 9,202,143 | | | | 6/11/18 | | | | 10,413 | | | | — | |
Japanese Yen | | | CITI | | | | Sell | | | | 2,595,800,000 | | | | 23,119,194 | | | | 6/12/18 | | | | — | | | | (132,953 | ) |
Japanese Yen | | | CITI | | | | Sell | | | | 310,702,000 | | | | 2,769,674 | | | | 6/13/18 | | | | — | | | | (13,642 | ) |
Japanese Yen | | | HSBK | | | | Sell | | | | 1,798,900,000 | | | | 16,034,406 | | | | 6/13/18 | | | | — | | | | (80,414 | ) |
Japanese Yen | | | JPHQ | | | | Sell | | | | 1,666,680,000 | | | | 14,858,055 | | | | 6/13/18 | | | | — | | | | (72,318 | ) |
Japanese Yen | | | JPHQ | | | | Sell | | | | 702,800,000 | | | | 6,277,803 | | | | 6/15/18 | | | | — | | | | (18,758 | ) |
Japanese Yen | | | HSBK | | | | Sell | | | | 1,455,540,000 | | | | 13,558,826 | | | | 6/18/18 | | | | 515,886 | | | | — | |
Japanese Yen | | | MSCO | | | | Sell | | | | 300,000,000 | | | | 2,681,876 | | | | 6/18/18 | | | | — | | | | (6,393 | ) |
Japanese Yen | | | DBAB | | | | Sell | | | | 1,453,310,000 | | | | 13,399,996 | | | | 6/19/18 | | | | 376,241 | | | | — | |
Japanese Yen | | | CITI | | | | Sell | | | | 1,086,780,000 | | | | 9,949,464 | | | | 6/20/18 | | | | 209,751 | | | | — | |
Japanese Yen | | | DBAB | | | | Sell | | | | 1,455,820,000 | | | | 13,275,761 | | | | 6/22/18 | | | | 227,116 | | | | — | |
Japanese Yen | | | CITI | | | | Sell | | | | 493,314,665 | | | | 4,417,414 | | | | 8/14/18 | | | | — | | | | (19,559 | ) |
Japanese Yen | | | HSBK | | | | Sell | | | | 1,026,200,000 | | | | 9,257,472 | | | | 9/11/18 | | | | 10,553 | | | | — | |
| | | | | | | | | | | | | | | | | | | | | | | | |
Total Forward Exchange Contracts | | | | | | | $ | 18,010,439 | | | $ | (55,010,690 | ) |
| | | | | | | | | | | | | | | | | | | | | | | | |
Net unrealized appreciation (depreciation) | | | | | | | $ | (37,000,251 | ) |
| | | | | | | | | | | | | | | | | | | | | | | | | | | | |
*In U.S. dollars unless otherwise indicated.
aMay be comprised of multiple contracts with the same counterparty, currency and settlement date.
At December 31, 2017, the Fund had the following interest rate swap contracts outstanding. See Note 1(c).
| | | | | | | | | | | | | | | | | | | | |
| Interest Rate Swap Contracts | | | | | | | | | | | | | | | |
| Description | | Payment
Frequency | | | Counterparty | | | Maturity
Date | | | Notional
Amount | | | Value/
Unrealized
Appreciation
(Depreciation) | |
| Centrally Cleared Swap Contracts | | | | | | | | | | | | | | | | | | | | |
Receive Floating 3-month USD LIBOR | | | Quarterly | | | | | | | | | | | | | | | | | |
Pay Fixed 3.558% | | | Semi-Annual | | | | | | | | 3/04/21 | | | $ | 3,240,000 | | | $ | (172,693 | ) |
Receive Floating 3-month USD LIBOR | | | Quarterly | | | | | | | | | | | | | | | | | |
Pay Fixed 2.775% | | | Semi-Annual | | | | | | | | 10/04/23 | | | | 13,090,000 | | | | (407,066 | ) |
Receive Floating 3-month USD LIBOR | | | Quarterly | | | | | | | | | | | | | | | | | |
Pay Fixed 2.795% | | | Semi-Annual | | | | | | | | 10/04/23 | | | | 13,090,000 | | | | (421,902 | ) |
Receive Floating 3-month USD LIBOR | | | Quarterly | | | | | | | | | | | | | | | | | |
Pay Fixed 2.765% | | | Semi-Annual | | | | | | | | 10/07/23 | | | | 13,090,000 | | | | (396,961 | ) |
Receive Floating 3-month USD LIBOR | | | Quarterly | | | | | | | | | | | | | | | | | |
Pay Fixed 2.731% | | | Semi-Annual | | | | | | | | 7/07/24 | | | | 34,000,000 | | | | (1,258,372 | ) |
Receive Floating 3-month USD LIBOR | | | Quarterly | | | | | | | | | | | | | | | | | |
Pay Fixed 1.914% | | | Semi-Annual | | | | | | | | 1/22/25 | | | | 114,670,000 | | | | 2,290,423 | |
Receive Floating 3-month USD LIBOR | | | Quarterly | | | | | | | | | | | | | | | | | |
Pay Fixed 1.970% | | | Semi-Annual | | | | | | | | 1/23/25 | | | | 143,340,000 | | | | 2,309,067 | |
Receive Floating 3-month USD LIBOR | | | Quarterly | | | | | | | | | | | | | | | | | |
Pay Fixed 1.973% | | | Semi-Annual | | | | | | | | 1/27/25 | | | | 84,590,000 | | | | 1,345,775 | |
Receive Floating 3-month USD LIBOR | | | Quarterly | | | | | | | | | | | | | | | | | |
FRANKLIN TEMPLETON VARIABLE INSURANCE PRODUCTS TRUST
STATEMENT OF INVESTMENTS
Templeton Global Bond VIP Fund (continued)
| | | | | | | | | | | | | | | | | | | | |
| Interest Rate Swap Contracts (continued) | | | | | | | | | | | | | | | |
| Description | | Payment
Frequency | | | Counterparty | | | Maturity
Date | | | Notional
Amount | | | Value/
Unrealized
Appreciation
(Depreciation) | |
| Centrally Cleared Swap Contracts (continued) | | | | | | | | | | | | | | | | | | | | |
Pay Fixed 1.937% | | | Semi-Annual | | | | | | | | 1/29/25 | | | $ | 21,150,000 | | | $ | 389,976 | |
Receive Floating 3-month USD LIBOR | | | Quarterly | | | | | | | | | | | | | | | | | |
Pay Fixed 1.942% | | | Semi-Annual | | | | | | | | 1/30/25 | | | | 17,910,000 | | | | 324,262 | |
Receive Floating 3-month USD LIBOR | | | Quarterly | | | | | | | | | | | | | | | | | |
Pay Fixed 1.817% | | | Semi-Annual | | | | | | | | 2/03/25 | | | | 28,210,000 | | | | 761,758 | |
Receive Floating 3-month USD LIBOR | | | Quarterly | | | | | | | | | | | | | | | | | |
Pay Fixed 4.349% | | | Semi-Annual | | | | | | | | 2/25/41 | | | | 7,460,000 | | | | (2,558,771 | ) |
Receive Floating 3-month USD LIBOR | | | Quarterly | | | | | | | | | | | | | | | | | |
Pay Fixed 4.320% | | | Semi-Annual | | | | | | | | 2/28/41 | | | | 5,600,000 | | | | (1,886,237 | ) |
Receive Floating 3-month USD LIBOR | | | Quarterly | | | | | | | | | | | | | | | | | |
Pay Fixed 4.299% | | | Semi-Annual | | | | | | | | 3/01/41 | | | | 1,870,000 | | | | (623,388 | ) |
Receive Floating 3-month USD LIBOR | | | Quarterly | | | | | | | | | | | | | | | | | |
Pay Fixed 3.668% | | | Semi-Annual | | | | | | | | 10/04/43 | | | | 6,370,000 | | | | (1,448,812 | ) |
Receive Floating 3-month USD LIBOR | | | Quarterly | | | | | | | | | | | | | | | | | |
Pay Fixed 3.687% | | | Semi-Annual | | | | | | | | 10/04/43 | | | | 6,370,000 | | | | (1,472,387 | ) |
Receive Floating 3-month USD LIBOR | | | Quarterly | | | | | | | | | | | | | | | | | |
Pay Fixed 3.675% | | | Semi-Annual | | | | | | | | 10/07/43 | | | | 6,370,000 | | | | (1,455,377 | ) |
Receive Floating 3-month USD LIBOR | | | Quarterly | | | | | | | | | | | | | | | | | |
Pay Fixed 2.378% | | | Semi-Annual | �� | | | | | | | 11/18/46 | | | | 122,400,000 | | | | 4,088,929 | |
Receive Floating 3-month USD LIBOR | | | Quarterly | | | | | | | | | | | | | | | | | |
Pay Fixed 2.537% | | | Semi-Annual | | | | | | | | 4/13/47 | | | | 72,700,000 | | | | (151,507 | ) |
Receive Floating 3-month USD LIBOR | | | Quarterly | | | | | | | | | | | | | | | | | |
Pay Fixed 2.587% | | | Semi-Annual | | | | | | | | 7/27/47 | | | | 36,700,000 | | | | (710,840 | ) |
| | | | | | | | | | | | | | | | | | | | |
Total Centrally Cleared Swap Contracts | | | $ | (1,454,123 | ) |
| | | | | | | | | | | | | | | | | | | | |
| OTC Swap Contracts | | | | | | | | | | | | | | | | | | | | |
Receive Floating 3-month USD LIBOR | | | Quarterly | | | | | | | | | | | | | | | | | |
Pay Fixed 3.523% | | | Semi-Annual | | | | DBAB | | | | 3/28/21 | | | $ | 14,630,000 | | | $ | (750,940 | ) |
Receive Floating 3-month USD LIBOR | | | Quarterly | | | | | | | | | | | | | | | | | |
Pay Fixed 4.347% | | | Semi-Annual | | | | CITI | | | | 2/25/41 | | | | 7,460,000 | | | | (2,555,107 | ) |
| | | | | | | | | | | | | | | | | | | | |
Total OTC Swap Contracts | | | $ | (3,306,047 | ) |
| | | | | | | | | | | | | | | | | | | | |
Total Interest Rate Swap Contracts | | | $ | (4,760,170 | ) |
| | | | | | | | | | | | | | | | | | | | |
See Note 9 regarding other derivative information.
See Abbreviations on page TGB-33.
| | | | |
| TGB-18 | | Annual Report | The accompanying notes are an integral part of these financial statements. | | |
FRANKLIN TEMPLETON VARIABLE INSURANCE PRODUCTS TRUST
Financial Statements
Statement of Assets and Liabilities
December 31, 2017
| | | | |
| | | Templeton Global Bond VIP Fund | |
Assets: | | | | |
Investments in securities: | | | | |
Cost - Unaffiliated issuers | | $ | 2,226,470,661 | |
Cost - Non-controlled affiliates (Note 3e) | | | 664,514,279 | |
| | | | |
Value - Unaffiliated issuers | | $ | 2,244,065,520 | |
Value - Non-controlled affiliates (Note 3e) | | | 664,514,279 | |
Cash | | | 2,269,000 | |
Restricted cash for OTC derivative contracts (Note 1d) | | | 1,729,000 | |
Foreign currency, at value (cost $1,565,582) | | | 1,572,534 | |
Receivables: | | | | |
Investment securities sold | | | 139,787,013 | |
Capital shares sold | | | 1,380,599 | |
Interest | | | 30,564,366 | |
Deposits with brokers for: | | | | |
OTC derivative contracts | | | 32,490,000 | |
Centrally cleared swap contracts | | | 49,424,066 | |
Unrealized appreciation on OTC forward exchange contracts | | | 18,010,439 | |
Other assets | | | 1,240 | |
| | | | |
Total assets | | | 3,185,808,056 | |
| | | | |
Liabilities: | | | | |
Payables: | | | | |
Capital shares redeemed | | | 1,963,760 | |
Management fees | | | 1,022,058 | |
Distribution fees | | | 1,213,990 | |
Variation margin on centrally cleared swap contracts | | | 1,346,893 | |
Deposits from brokers for: | | | | |
OTC derivative contracts | | | 1,729,000 | |
Unrealized depreciation on OTC forward exchange contracts | | | 55,010,690 | |
Unrealized depreciation on OTC swap contracts | | | 3,306,047 | |
Deferred tax. | | | 3,249,504 | |
Accrued expenses and other liabilities. | | | 1,448,840 | |
| | | | |
Total liabilities | | | 70,290,782 | |
| | | | |
Net assets, at value | | $ | 3,115,517,274 | |
| | | | |
Net assets consist of: | | | | |
Paid-in capital | | $ | 3,153,176,935 | |
Accumulated net investment loss | | | (7,265,628 | ) |
Net unrealized appreciation (depreciation) | | | (27,119,763 | ) |
Accumulated net realized gain (loss) | | | (3,274,270 | ) |
| | | | |
Net assets, at value | | $ | 3,115,517,274 | |
| | | | |
| | | | | | |
| | | The accompanying notes are an integral part of these financial statements. | Annual Report | | | TGB-19 | |
FRANKLIN TEMPLETON VARIABLE INSURANCE PRODUCTS TRUST
FINANCIAL STATEMENTS
Statement of Assets and Liabilities (continued)
December 31, 2017
| | | | |
| | | Templeton Global Bond VIP Fund | |
| |
| Class 1: | | | | |
Net assets, at value | | $ | 286,502,241 | |
| | | | |
Shares outstanding | | | 16,690,251 | |
| | | | |
Net asset value and maximum offering price per share | | $ | 17.17 | |
| | | | |
| |
| Class 2: | | | | |
Net assets, at value | | $ | 2,730,080,907 | |
| | | | |
Shares outstanding | | | 165,373,215 | |
| | | | |
Net asset value and maximum offering price per share | | $ | 16.51 | |
| | | | |
| |
| Class 4: | | | | |
Net assets, at value | | $ | 98,934,126 | |
| | | | |
Shares outstanding | | | 5,862,680 | |
| | | | |
Net asset value and maximum offering price per share | | $ | 16.88 | |
| | | | |
| | | | |
| TGB-20 | | Annual Report | The accompanying notes are an integral part of these financial statements. | | |
FRANKLIN TEMPLETON VARIABLE INSURANCE PRODUCTS TRUST
FINANCIAL STATEMENTS
Statement of Operations
for the year ended December 31, 2017
| | | | |
| | | Templeton Global Bond VIP Fund | |
Investment income: | | | | |
Dividends: (net of foreign taxes)* | | | | |
Non-controlled affiliates (Note 3e) | | $ | 3,302,872 | |
Interest: (net of foreign taxes)~ | | | | |
Unaffiliated issuers | | | 162,896,234 | |
| | | | |
Total investment income | | | 166,199,106 | |
| | | | |
Expenses: | | | | |
Management fees (Note 3a) | | | 14,451,488 | |
Distribution fees: (Note 3c) | | | | |
Class 2 | | | 6,994,783 | |
Class 4 | | | 344,609 | |
Custodian fees (Note 4) | | | 1,522,685 | |
Reports to shareholders | | | 289,240 | |
Professional fees | | | 141,800 | |
Trustees’ fees and expenses | | | 13,487 | |
Other | | | 356,249 | |
| | | | |
Total expenses | | | 24,114,341 | |
Expense reductions (Note 4) | | | (141,945 | ) |
Expenses waived/paid by affiliates (Note 3e) | | | (2,231,184 | ) |
| | | | |
Net expenses | | | 21,741,212 | |
| | | | |
Net investment income. | | | 144,457,894 | |
| | | | |
Realized and unrealized gains (losses): | | | | |
Net realized gain (loss) from: | | | | |
Investments:# | | | | |
Unaffiliated issuers | | | (37,544,209 | ) |
Foreign currency transactions. | | | (862,682 | ) |
Forward exchange contracts. | | | (38,241,460 | ) |
Swap contracts | | | (7,792,863 | ) |
| | | | |
Net realized gain (loss) | | | (84,441,214 | ) |
| | | | |
Net change in unrealized appreciation (depreciation) on: | | | | |
Investments: | | | | |
Unaffiliated issuers | | | 163,324,450 | |
Translation of other assets and liabilities denominated in foreign currencies | | | 490,094 | |
Forward exchange contracts. | | | (162,154,453 | ) |
Swap contracts | | | 250,657 | |
Change in deferred taxes on unrealized appreciation. | | | (591,978 | ) |
| | | | |
Net change in unrealized appreciation (depreciation) | | | 1,318,770 | |
| | | | |
Net realized and unrealized gain (loss) | | | (83,122,444 | ) |
| | | | |
Net increase (decrease) in net assets resulting from operations | | $ | 61,335,450 | |
| | | | |
| |
*Foreign taxes withheld on dividends | | $ | 7 | |
~Foreign taxes withheld on interest | | $ | 4,965,980 | |
#Net of foreign taxes | | $ | 286,625 | |
| | | | | | |
| | | The accompanying notes are an integral part of these financial statements. | Annual Report | | | TGB-21 | |
FRANKLIN TEMPLETON VARIABLE INSURANCE PRODUCTS TRUST
FINANCIAL STATEMENTS
Statements of Changes in Net Assets
| | | | | | | | |
| | | Templeton Global Bond VIP Fund | |
| | | Year Ended December 31, | |
| | | 2017 | | | 2016 | |
Increase (decrease) in net assets: | | | | | | | | |
Operations: | | | | | | | | |
Net investment income | | $ | 144,457,894 | | | $ | 116,633,475 | |
Net realized gain (loss) | | | (84,441,214 | ) | | | (287,949,944 | ) |
Net change in unrealized appreciation (depreciation) | | | 1,318,770 | | | | 258,515,773 | |
| | | | |
Net increase (decrease) in net assets resulting from operations | | | 61,335,450 | | | | 87,199,304 | |
| | | | |
Distributions to shareholders from: | | | | | | | | |
Net realized gains: | | | | | | | | |
Class 1 | | | (806,829 | ) | | | (230,624 | ) |
Class 2 | | | (8,999,053 | ) | | | (2,445,769 | ) |
Class 4 | | | (307,109 | ) | | | (81,295 | ) |
| | | | |
Total distributions to shareholders | | | (10,112,991 | ) | | | (2,757,688 | ) |
| | | | |
Capital share transactions: (Note 2) | | | | | | | | |
Class 1 | | | 40,791,975 | | | | (58,117,212 | ) |
Class 2 | | | (128,337,512 | ) | | | (233,957,681 | ) |
Class 4 | | | 715,746 | | | | (8,756,905 | ) |
| | | | |
Total capital share transactions | | | (86,829,791 | ) | | | (300,831,798 | ) |
| | | | |
Net increase (decrease) in net assets | | | (35,607,332 | ) | | | (216,390,182 | ) |
Net assets: | | | | | | | | |
Beginning of year | | | 3,151,124,606 | | | | 3,367,514,788 | |
| | | | |
End of year | | $ | 3,115,517,274 | | | $ | 3,151,124,606 | |
| | | | |
Accumulated net investment loss included in net assets: | | | | | | | | |
End of year | | $ | (7,265,628 | ) | | $ | (170,378,447 | ) |
| | | | |
| | | | |
| TGB-22 | | Annual Report | The accompanying notes are an integral part of these financial statements. | | |
FRANKLIN TEMPLETON VARIABLE INSURANCE PRODUCTS TRUST
Notes to Financial Statements
Templeton Global Bond VIP Fund
1. Organization and Significant Accounting Policies
Franklin Templeton Variable Insurance Products Trust (Trust) is registered under the Investment Company Act of 1940 (1940 Act) as an open-end management investment company, consisting of eighteen separate funds and applies the specialized accounting and reporting guidance in U.S. Generally Accepted Accounting Principles (U.S. GAAP). Templeton Global Bond VIP Fund (Fund) is included in this report. Shares of the Fund are generally sold only to insurance company separate accounts to fund the benefits of variable life insurance policies or variable annuity contracts. The Fund offers three classes of shares: Class 1, Class 2 and Class 4. Each class of shares may differ by its distribution fees, voting rights on matters affecting a single class and its exchange privilege.
The following summarizes the Fund’s significant accounting policies.
a. Financial Instrument Valuation
The Fund’s investments in financial instruments are carried at fair value daily. Fair value is the price that would be received to sell an asset or paid to transfer a liability in an orderly transaction between market participants on the measurement date. The Fund calculates the net asset value (NAV) per share as of 4 p.m. Eastern time each day the New York Stock Exchange (NYSE) is open for trading. Under compliance policies and procedures approved by the Trust’s Board of Trustees (the Board), the Fund’s administrator has responsibility for oversight of valuation, including leading the cross-functional Valuation Committee (VC). The VC provides administration and oversight of the Fund’s valuation policies and procedures, which are approved annually by the Board. Among other things, these procedures allow the Fund to utilize independent pricing services, quotations from securities and financial instrument dealers, and other market sources to determine fair value.
Debt securities generally trade in the over-the-counter (OTC) market rather than on a securities exchange. The Fund’s pricing services use multiple valuation techniques to determine fair value. In instances where sufficient market activity exists, the pricing services may utilize a market-based approach through which quotes from market makers are used to determine fair value. In instances where sufficient market activity may not exist or is limited, the pricing services also utilize proprietary valuation models which may consider market characteristics
such as benchmark yield curves, credit spreads, estimated default rates, anticipated market interest rate volatility, coupon rates, anticipated timing of principal repayments, underlying collateral, and other unique security features in order to estimate the relevant cash flows, which are then discounted to calculate the fair value. Securities denominated in a foreign currency are converted into their U.S. dollar equivalent at the foreign exchange rate in effect at 4 p.m. Eastern time on the date that the values of the foreign debt securities are determined.
Investments in open-end mutual funds are valued at the closing NAV.
Derivative financial instruments listed on an exchange are valued at the official closing price of the day. Certain derivative financial instruments are centrally cleared or trade in the OTC market. The Fund’s pricing services use various techniques including industry standard option pricing models and proprietary discounted cash flow models to determine the fair value of those instruments. The Fund’s net benefit or obligation under the derivative contract, as measured by the fair value of the contract, is included in net assets.
The Fund has procedures to determine the fair value of financial instruments for which market prices are not reliable or readily available. Under these procedures, the VC convenes on a regular basis to review such financial instruments and considers a number of factors, including significant unobservable valuation inputs, when arriving at fair value. The VC primarily employs a market-based approach which may use related or comparable assets or liabilities, recent transactions, market multiples, book values, and other relevant information for the investment to determine the fair value of the investment. An income-based valuation approach may also be used in which the anticipated future cash flows of the investment are discounted to calculate fair value. Discounts may also be applied due to the nature or duration of any restrictions on the disposition of the investments. Due to the inherent uncertainty of valuations of such investments, the fair values may differ significantly from the values that would have been used had an active market existed. The VC employs various methods for calibrating these valuation approaches including a regular review of key inputs and assumptions, transactional back-testing or disposition analysis, and reviews of any related market activity.
FRANKLIN TEMPLETON VARIABLE INSURANCE PRODUCTS TRUST
NOTES TO FINANCIAL STATEMENTS
Templeton Global Bond VIP Fund (continued)
1. Organization and Significant Accounting
Policies (continued)
b. Foreign Currency Translation
Portfolio securities and other assets and liabilities denominated in foreign currencies are translated into U.S. dollars based on the exchange rate of such currencies against U.S. dollars on the date of valuation. The Fund may enter into foreign currency exchange contracts to facilitate transactions denominated in a foreign currency. Purchases and sales of securities, income and expense items denominated in foreign currencies are translated into U.S. dollars at the exchange rate in effect on the transaction date. Portfolio securities and assets and liabilities denominated in foreign currencies contain risks that those currencies will decline in value relative to the U.S. dollar. Occasionally, events may impact the availability or reliability of foreign exchange rates used to convert the U.S. dollar equivalent value. If such an event occurs, the foreign exchange rate will be valued at fair value using procedures established and approved by the Board.
The Fund does not separately report the effect of changes in foreign exchange rates from changes in market prices on securities held. Such changes are included in net realized and unrealized gain or loss from investments in the Statement of Operations.
Realized foreign exchange gains or losses arise from sales of foreign currencies, currency gains or losses realized between the trade and settlement dates on securities transactions and the difference between the recorded amounts of dividends, interest, and foreign withholding taxes and the U.S. dollar equivalent of the amounts actually received or paid. Net unrealized foreign exchange gains and losses arise from changes in foreign exchange rates on foreign denominated assets and liabilities other than investments in securities held at the end of the reporting period.
c. Derivative Financial Instruments
The Fund invested in derivative financial instruments in order to manage risk or gain exposure to various other investments or markets. Derivatives are financial contracts based on an underlying or notional amount, require no initial investment or an initial net investment that is smaller than would normally be required to have a similar response to changes in market factors, and require or permit net settlement. Derivatives contain various risks including the potential inability of the counterparty to fulfill their obligations under the terms of the contract, the potential for an illiquid secondary market, and/or the potential
for market movements which expose the Fund to gains or losses in excess of the amounts shown in the Statement of Assets and Liabilities. Realized gain and loss and unrealized appreciation and depreciation on these contracts for the period are included in the Statement of Operations.
Derivative counterparty credit risk is managed through a formal evaluation of the creditworthiness of all potential counterparties. The Fund attempts to reduce its exposure to counterparty credit risk on OTC derivatives, whenever possible, by entering into International Swaps and Derivatives Association (ISDA) master agreements with certain counterparties. These agreements contain various provisions, including but not limited to collateral requirements, events of default, or early termination. Termination events applicable to the counterparty include certain deteriorations in the credit quality of the counterparty. Termination events applicable to the Fund include failure of the Fund to maintain certain net asset levels and/or limit the decline in net assets over various periods of time. In the event of default or early termination, the ISDA master agreement gives the non-defaulting party the right to net and close-out all transactions traded, whether or not arising under the ISDA agreement, to one net amount payable by one counterparty to the other. However, absent an event of default or early termination, OTC derivative assets and liabilities are presented gross and not offset in the Statement of Assets and Liabilities. Early termination by the counterparty may result in an immediate payment by the Fund of any net liability owed to that counterparty under the ISDA agreement.
Collateral requirements differ by type of derivative. Collateral or initial margin requirements are set by the broker or exchange clearing house for exchange traded and centrally cleared derivatives. Initial margin deposited is held at the exchange and can be in the form of cash and/or securities. For OTC derivatives traded under an ISDA master agreement, posting of collateral is required by either the Fund or the applicable counterparty if the total net exposure of all OTC derivatives with the applicable counterparty exceeds the minimum transfer amount, which typically ranges from $100,000 to $250,000, and can vary depending on the counterparty and the type of the agreement. Generally, collateral is determined at the close of Fund business each day and any additional collateral required due to changes in derivative values may be delivered by the Fund or the counterparty the next business day, or within a few business days. Collateral pledged and/or received by the Fund for OTC derivatives, if any, is held in segregated accounts with
FRANKLIN TEMPLETON VARIABLE INSURANCE PRODUCTS TRUST
NOTES TO FINANCIAL STATEMENTS
Templeton Global Bond VIP Fund (continued)
the Fund’s custodian/counterparty broker and can be in the form of cash and/or securities. Unrestricted cash may be invested according to the Fund’s investment objectives. To the extent that the amounts due to the Fund from its counterparties are not subject to collateralization or are not fully collateralized, the Fund bears the risk of loss from counterparty non-performance.
The Fund entered into OTC forward exchange contracts primarily to manage and/or gain exposure to certain foreign currencies. A forward exchange contract is an agreement between the Fund and a counterparty to buy or sell a foreign currency at a specific exchange rate on a future date.
The Fund entered into interest rate swap contracts primarily to manage interest rate risk. An interest rate swap is an agreement between the Fund and a counterparty to exchange cash flows based on the difference between two interest rates, applied to a notional amount. These agreements may be privately negotiated in the over-the-counter market (OTC interest rate swaps) or may be executed on a registered exchange (centrally cleared interest rate swaps). For centrally cleared interest rate swaps, required initial margins are pledged by the Fund, and the daily change in fair value is accounted for as a variation margin payable or receivable in the Statement of Assets and Liabilities. Over the term of the contract, contractually required payments to be paid and to be received are accrued daily and recorded as unrealized depreciation and appreciation until the payments are made, at which time they are realized.
The Fund invests in value recovery instruments (VRI) primarily to gain exposure to economic growth. Periodic payments from VRI are dependent on established benchmarks for underlying variables. VRI has a notional amount, which is used to calculate amounts of payments to holders. Payments are recorded upon receipt as realized gains in the Statement of Operations. The risks of investing in VRI include growth risk, liquidity, and the potential loss of investment.
See Note 9 regarding other derivative information.
d. Restricted Cash
At December 31, 2017, the Fund held restricted cash in connection with investments in certain derivative securities. Restricted cash is held in a segregated account with the Fund’s counterparty broker and is reflected in the Statement of Assets and Liabilities.
e. Income and Deferred Taxes
It is the Fund’s policy to qualify as a regulated investment company under the Internal Revenue Code. The Fund intends to distribute to shareholders substantially all of its taxable income and net realized gains to relieve it from federal income and if applicable, excise taxes. As a result, no provision for U.S. federal income taxes is required.
The Fund may be subject to foreign taxation related to income received, capital gains on the sale of securities and certain foreign currency transactions in the foreign jurisdictions in which it invests. Foreign taxes, if any, are recorded based on the tax regulations and rates that exist in the foreign markets in which the Fund invests. When a capital gain tax is determined to apply, the Fund records an estimated deferred tax liability in an amount that would be payable if the securities were disposed of on the valuation date.
The Fund may recognize an income tax liability related to its uncertain tax positions under U.S. GAAP when the uncertain tax position has a less than 50% probability that it will be sustained upon examination by the tax authorities based on its technical merits. As of December 31, 2017, the Fund has determined that no tax liability is required in its financial statements related to uncertain tax positions for any open tax years (or expected to be taken in future tax years). Open tax years are those that remain subject to examination and are based on the statute of limitations in each jurisdiction in which the Fund invests.
f. Security Transactions, Investment Income, Expenses and Distributions
Security transactions are accounted for on trade date. Realized gains and losses on security transactions are determined on a specific identification basis. Interest income and estimated expenses are accrued daily. Amortization of premium and accretion of discount on debt securities are included in interest income. Dividend income is recorded on the ex-dividend date. Distributions to shareholders are recorded on the ex-dividend date. Distributable earnings are determined according to income tax regulations (tax basis) and may differ from earnings recorded in accordance with U.S. GAAP. These differences may be permanent or temporary. Permanent differences are reclassified among capital accounts to reflect their tax character. These reclassifications have no impact on net assets or the results of operations. Temporary differences are not reclassified, as they may reverse in subsequent periods.
FRANKLIN TEMPLETON VARIABLE INSURANCE PRODUCTS TRUST
NOTES TO FINANCIAL STATEMENTS
Templeton Global Bond VIP Fund (continued)
1. Organization and Significant Accounting Policies (continued)
f. Security Transactions, Investment Income, Expenses and Distributions (continued)
Common expenses incurred by the Trust are allocated among the Funds based on the ratio of net assets of each Fund to the combined net assets of the Trust. Fund specific expenses are charged directly to the Fund that incurred the expense.
Realized and unrealized gains and losses and net investment income, excluding class specific expenses, are allocated daily to each class of shares based upon the relative proportion of net assets of each class. Differences in per share distributions by class are generally due to differences in class specific expenses.
Inflation-indexed bonds are adjusted for inflation through periodic increases or decreases in the security’s interest accruals, face amount, or principal redemption value, by amounts corresponding to the rate of inflation as measured by an index. Any increase or decrease in the face amount or principal redemption value will be included as interest income in the Statement of Operations.
g. Accounting Estimates
The preparation of financial statements in accordance with U.S. GAAP requires management to make estimates and assumptions that affect the reported amounts of assets and liabilities at the date of the financial statements and the amounts of income and expenses during the reporting period. Actual results could differ from those estimates.
h. Guarantees and Indemnifications
Under the Trust’s organizational documents, its officers and trustees are indemnified by the Trust against certain liabilities arising out of the performance of their duties to the Trust. Additionally, in the normal course of business, the Trust, on behalf of the Fund, enters into contracts with service providers that contain general indemnification clauses. The Trust’s maximum exposure under these arrangements is unknown as this would involve future claims that may be made against the Trust that have not yet occurred. Currently, the Trust expects the risk of loss to be remote.
2. Shares of Beneficial Interest
At December 31, 2017, there were an unlimited number of shares authorized (without par value). Transactions in the Fund’s shares were as follows:
| | | | | | | | | | | | | | | | | | | | |
| | | Year Ended December 31, | |
| | | 2017 | | | | | | 2016 | |
| | | Shares | | | Amount | | | | | | Shares | | | Amount | |
| | | | | |
| Class 1 Shares: | | | | | | | | | | | | | | | | | | | | |
Shares sold | | | 4,567,479 | | | $ | 79,103,441 | | | | | | | | 2,249,431 | | | $ | 36,190,152 | |
Shares issued in reinvestment of distributions | | | 46,290 | | | | 806,829 | | | | | | | | 14,671 | | | | 230,624 | |
Shares redeemed | | | (2,272,230 | ) | | | (39,118,295 | ) | | | | | | | (5,831,060 | ) | | | (94,537,988 | ) |
| | | | |
Net increase (decrease) | | | 2,341,539 | | | $ | 40,791,975 | | | | | | | | (3,566,958 | ) | | $ | (58,117,212 | ) |
| | | | |
| Class 2 Shares: | | | | | | | | | | | | | | | | | | | | |
Shares sold | | | 10,419,624 | | | $ | 173,987,516 | | | | | | | | 12,422,365 | | | $ | 192,901,752 | |
Shares issued in reinvestment of distributions | | | 535,977 | | | | 8,999,053 | | | | | | | | 161,118 | | | | 2,445,769 | |
Shares redeemed | | | (18,675,809 | ) | | | (311,324,081 | ) | | | | | | | (27,589,750 | ) | | | (429,305,202 | ) |
| | | | |
Net increase (decrease) | | | (7,720,208 | ) | | $ | (128,337,512 | ) | | | | | | | (15,006,267 | ) | | $ | (233,957,681 | ) |
| | | | |
| Class 4 Shares: | | | | | | | | | | | | | | | | | | | | |
Shares sold | | | 1,027,651 | | | $ | 17,546,285 | | | | | | | | 793,050 | | | $ | 12,575,365 | |
Shares issued in reinvestment of distributions | | | 17,886 | | | | 307,109 | | | | | | | | 5,231 | | | | 81,295 | |
Shares redeemed | | | (1,005,305 | ) | | | (17,137,648 | ) | | | | | | | (1,344,557 | ) | | | (21,413,565 | ) |
| | | | |
Net increase (decrease) | | | 40,232 | | | $ | 715,746 | | | | | | | | (546,276 | ) | | $ | (8,756,905 | ) |
| | | | |
FRANKLIN TEMPLETON VARIABLE INSURANCE PRODUCTS TRUST
NOTES TO FINANCIAL STATEMENTS
Templeton Global Bond VIP Fund (continued)
3. Transactions with Affiliates
Franklin Resources, Inc. is the holding company for various subsidiaries that together are referred to as Franklin Templeton Investments. Certain officers and trustees of the Fund are also officers and/or directors of the following subsidiaries:
| | |
| Subsidiary | | Affiliation |
Franklin Advisers, Inc. (Advisers) | | Investment manager |
Franklin Templeton Services, LLC (FT Services) | | Administrative manager |
Franklin Templeton Distributors, Inc. (Distributors) | | Principal underwriter |
Franklin Templeton Investor Services, LLC (Investor Services) | | Transfer agent |
a. Management Fees
The Fund pays an investment management fee to Advisers based on the average daily net assets of the Fund as follows:
| | |
| Annualized Fee Rate | | Net Assets |
0.625% | | Up to and including $100 million |
0.500% | | Over $100 million, up to and including $250 million |
0.450% | | Over $250 million, up to and including $7.5 billion |
0.440% | | Over $7.5 billion, up to and including $10 billion |
0.430% | | Over $10 billion, up to and including $12.5 billion |
0.420% | | Over $12.5 billion, up to and including $15 billion |
0.400% | | In excess of $15 billion |
For the year ended December 31, 2017, the gross effective investment management fee rate was 0.458% of the Fund’s average daily net assets.
b. Administrative Fees
Under an agreement with Advisers, FT Services provides administrative services to the Fund. The fee is paid by Advisers based on the Fund’s average daily net assets, and is not an additional expense of the Fund.
c. Distribution Fees
The Board has adopted distribution plans for Class 2 and Class 4 shares pursuant to Rule 12b-1 under the 1940 Act. Under the Fund’s compensation distribution plans, the Fund pays Distributors for costs incurred in connection with the servicing, sale and distribution of the Fund’s shares up to 0.25% and 0.35% per year of its average daily net assets of Class 2 and Class 4, respectively. The plan year, for purposes of monitoring compliance with the maximum annual plan rates, is February 1 through January 31.
d. Transfer Agent Fees
Investor Services, under terms of an agreement, performs shareholder servicing for the Fund and is not paid by the Fund for the services.
FRANKLIN TEMPLETON VARIABLE INSURANCE PRODUCTS TRUST
NOTES TO FINANCIAL STATEMENTS
Templeton Global Bond VIP Fund (continued)
3. Transactions with Affiliates (continued)
e. Investments in Affiliated Management Investment Companies
The Fund invests in one or more affiliated management investment companies for purposes other than exercising a controlling influence over the management or policies. Management fees paid by the Fund are waived on assets invested in the affiliated management investment companies, as noted in the Statement of Operations, in an amount not to exceed the management and administrative fees paid directly or indirectly by each affiliate. During the year ended December 31, 2017, the Fund held investments in affiliated management investment companies as follows:
| | | | | | | | | | | | | | | | | | | | | | | | | | | | | | | | |
| | | Number of Shares Held at Beginning of Year | | | Gross Additions | | | Gross Reductions | | | Number of Shares Held at End of Year | | | Value at End of Year | | | Dividend Income | | | Realized Gain (Loss) | | | Net Change in Unrealized Appreciation (Depreciation) | |
| Non-Controlled Affiliates | | | | | | | | | | | | | | | | | | | | | | | | | | | | | | | | |
Institutional Fiduciary Trust Money Market Portfolio, 0.89% | | | 436,780,215 | | | | 983,120,684 | | | | (755,386,620 | ) | | | 664,514,279 | | | $ | 664,514,279 | | | $ | 3,302,879 | | | $ | — | | | $ | — | |
| | | | | | | | | | | | | | | | | | | | |
f. Interfund Transactions
The Fund engaged in purchases and sales of investments with funds or other accounts that have common investment managers (or affiliated investment managers), directors, trustees or officers. During the year ended December 31, 2017, these purchase and sale transactions aggregated $- and $8,246,196 respectively.
4. Expense Offset Arrangement
The Fund has entered into an arrangement with its custodian whereby credits realized as a result of uninvested cash balances are used to reduce a portion of the Fund’s custodian expenses. During the year ended December 31, 2017, the custodian fees were reduced as noted in the Statement of Operations.
5. Income Taxes
For tax purposes, capital losses may be carried over to offset future capital gains, if any. At December 31, 2017, the capital loss carryforwards were as follows:
| | | | |
| | | Templeton Global Bond VIP Fund | |
Capital loss carryforwards not subject to expiration: | | | | |
Short term | | $ | 2,981,110 | |
Long term | | | 294,319 | |
| | | | |
Total capital loss carryforwards | | $ | 3,275,429 | |
| | | | |
The tax character of distributions paid during the years ended December 31, 2017 and 2016, was as follows:
| | | | | | | | |
| | | 2017 | | | 2016 | |
Distributions paid from: | | | | | | | | |
Long term capital gain | | $ | 10,104,459 | | | $ | 2,757,688 | |
| | | | |
FRANKLIN TEMPLETON VARIABLE INSURANCE PRODUCTS TRUST
NOTES TO FINANCIAL STATEMENTS
Templeton Global Bond VIP Fund (continued)
At December 31, 2017, the cost of investments and net unrealized appreciation (depreciation) for income tax purposes were as follows:
| | | | |
Cost of investments | | $ | 2,901,580,071 | |
| | | | |
Unrealized appreciation | | $ | 188,593,995 | |
Unrealized depreciation | | | (219,327,805 | ) |
| | | | |
Net unrealized appreciation (depreciation) | | $ | (30,733,810 | ) |
| | | | |
Differences between income and/or capital gains as determined on a book basis and a tax basis are primarily due to differing treatments of foreign currency transactions and bond discounts and premiums.
6. Investment Transactions
Purchases and sales of investments (excluding short term securities) for the year ended December 31, 2017, aggregated $845,917,023 and $1,311,452,669 respectively.
7. Credit Risk
At December 31, 2017, the Fund had 20.6% of its portfolio invested in high yield or other securities rated below investment grade and unrated securities, if any. These securities may be more sensitive to economic conditions causing greater price volatility and are potentially subject to a greater risk of loss due to default than higher rated securities.
8. Concentration of Risk
Investing in foreign securities may include certain risks and considerations not typically associated with investing in U.S. securities, such as fluctuating currency values and changing local and regional economic, political and social conditions, which may result in greater market volatility. In addition, certain foreign securities may not be as liquid as U.S. securities.
FRANKLIN TEMPLETON VARIABLE INSURANCE PRODUCTS TRUST
NOTES TO FINANCIAL STATEMENTS
Templeton Global Bond VIP Fund (continued)
9. Other Derivative Information
At December 31, 2017, the Fund’s investments in derivative contracts are reflected in the Statement of Assets and Liabilities as follows:
| | | | | | | | | | | | |
| | | Asset Derivatives | | | Liability Derivatives | |
Derivative Contracts Not Accounted for as Hedging Instruments | | Statement of Assets and Liabilities Location | | Fair Value | | | Statement of Assets and Liabilities Location | | Fair Value | |
Interest rate contracts | | Variation margin on centrally cleared swap contracts | | $
| 11,510,190
| a
| | Variation margin on centrally cleared swap contracts | | $
| 12,964,313
| a
|
| | | | | | | | Unrealized depreciation on OTC swap contracts | | | 3,306,047 | |
Foreign exchange contracts | | Unrealized appreciation on OTC forward exchange contracts | | | 18,010,439 | | | Unrealized depreciation on OTC forward exchange contracts | | | 55,010,690 | |
Value recovery instruments | | Investments in securities, at value | | | 16,705,241 | b | | | | | | |
| | | | | | | | | | | | |
Totals | | | | $ | 46,225,870 | | | | | $ | 71,281,050 | |
| | | | | | | | | | | | |
aThis amount reflects the cumulative appreciation (depreciation) of centrally cleared swap contracts as reported in the Statement of Investments. Only the variation margin receivable/payable at year end is separately reported within the Statement of Assets and Liabilities. Prior variation margin movements were recorded to cash upon receipt or payment.
bVRI are included in investments in securities, at value in the Statement of Assets and Liabilities.
For the year ended December 31, 2017, the effect of derivative contracts in the Fund’s Statement of Operations was as follows:
| | | | | | | | | | | | |
Derivative Contracts Not Accounted for as Hedging Instruments | | Statement of Operations Location | | Net Realized
Gain (Loss)
for the Year | | | Statement of Operations Location | | Net Change in
Unrealized
Appreciation
(Depreciation)
for the Year | |
| | Net realized gain (loss) from: | | | | | | Net change in unrealized appreciation (depreciation) on: | | | | |
Interest rate contracts | | Swap contracts | | $ | (7,792,863 | ) | | Swap contracts | | $ | 250,657 | |
Foreign exchange contracts | | Forward exchange contracts | | | (38,241,460 | ) | | Forward exchange contracts | | | (162,154,453 | ) |
Value recovery instruments | | Investments | | | — | | | Investments | | | 7,561,632 | a |
| | | | | | | | | | | | |
Totals | | | | $ | (46,034,323 | ) | | | | $ | (154,342,164 | ) |
| | | | | | | | | | | | |
aVRI are included in net change in unrealized appreciation (depreciation) on investments in the Statement of Operations.
For the year ended December 31, 2017, the average month end notional amount of swap contracts represented $830,981,538. The average month end contract value and fair value of forward exchange contracts and VRI, was $3,367,244,937 and $13,040,195, respectively.
See Note 1(e) regarding derivative financial instruments.
FRANKLIN TEMPLETON VARIABLE INSURANCE PRODUCTS TRUST
NOTES TO FINANCIAL STATEMENTS
Templeton Global Bond VIP Fund (continued)
At December 31, 2017, the Fund’s OTC derivative assets and liabilities are as follows:
| | | | | | | | |
| | | Gross Amounts
of Assets and Liabilities
Presented in the
Statement of Assets and
Liabilities | |
| | | | Assets | a | | | Liabilities | a |
| Derivatives | | | | | | | | |
Forward exchange contracts | | $ | 18,010,439 | | | $ | 55,010,690 | |
Swap Contracts | | | — | | | | 3,306,047 | |
| | | | |
Total | | $ | 18,010,439 | | | $ | 58,316,737 | |
| | | | |
aAbsent an event of default or early termination, OTC derivative assets and liabilities are presented gross and not offset in the Statement of Assets and Liabilities.
At December 31, 2017, the Fund’s OTC derivative assets, which may be offset against the Fund’s OTC derivative liabilities and collateral received from the counterparty, are as follows:
| | | | | | | | | | | | | | | | | | | | |
| | | | | | Amounts Not Offset in the Statement of
Assets and Liabilities | | | | |
| | |
| Gross
Amounts of Assets Presented in the Statement of Assets and Liabilities |
| |
| Financial
Instruments Available for Offset |
| |
| Financial
Instruments Collateral Received |
| |
| Cash Collateral
Receivedb |
| |
| Net Amount (Not
less than zero) |
|
| Counterparty | | | | | | | | | | | | | | | | | |
BOFA | | $ | 881,824 | | | $ | (881,824 | ) | | $ | — | | | $ | — | | | $ | — | |
BZWS | | | 1,594,184 | | | | (500,943 | ) | | | — | | | | (1,093,241 | ) | | | — | |
CITI | | | 1,379,442 | | | | (1,379,442 | ) | | | — | | | | — | | | | — | |
DBAB | | | 3,270,252 | | | | (3,270,252 | ) | | | — | | | | — | | | | — | |
GSCO | | | 394,423 | | | | (394,423 | ) | | | — | | | | — | | | | — | |
HSBK | | | 2,620,363 | | | | (2,620,363 | ) | | | — | | | | — | | | | — | |
JPHQ | | | 7,272,599 | | | | (7,272,599 | ) | | | — | | | | — | | | | — | |
MSCO | | | 79,421 | | | | (79,421 | ) | | | — | | | | — | | | | — | |
SCNY | | | 517,931 | | | | (517,931 | ) | | | — | | | | — | | | | — | |
UBSW | | | — | | | | — | | | | — | | | | — | | | | — | |
| | | | |
Total | | $ | 18,010,439 | | | $ | (16,917,198 | ) | | $ | — | | | $ | (1,093,241 | ) | | $ | — | |
| | | | |
FRANKLIN TEMPLETON VARIABLE INSURANCE PRODUCTS TRUST
NOTES TO FINANCIAL STATEMENTS
Templeton Global Bond VIP Fund (continued)
9. Other Derivative Information (continued)
At December 31, 2017, the Fund’s OTC derivative liabilities, which may be offset against the Fund’s OTC derivative assets and collateral pledged to the counterparty, are as follows:
| | | | | | | | | | | | | | | | | | | | |
| | | | | | Amounts Not Offset in the Statement of
Assets and Liabilities | | | | |
| | | Gross Amounts of Liabilities Presented in the Statement of Assets and Liabilities | | | Financial Instruments Available for Offset | | | Financial Instruments Collateral Pledged | | | Cash Collateral Pledged | | | Net Amount (Not less than zero) | |
| Counterparty | | | | | | | | | | | | | | | | | |
BOFA | | $ | 5,089,907 | | | $ | (881,824 | ) | | $ | — | | | $ | (3,150,000 | ) | | $ | 1,058,083 | |
BZWS | | | 500,943 | | | | (500,943 | ) | | | — | | | | — | | | | — | |
CITI | | | 14,129,410 | | | | (1,379,442 | ) | | | — | | | | (10,910,000 | ) | | | 1,839,968 | |
DBAB | | | 4,870,666 | | | | (3,270,252 | ) | | | — | | | | (540,000 | ) | | | 1,060,414 | |
GSCO | | | 6,663,763 | | | | (394,423 | ) | | | — | | | | (5,600,000 | ) | | | 669,340 | |
HSBK | | | 15,256,809 | | | | (2,620,363 | ) | | | — | | | | (10,890,000 | ) | | | 1,746,446 | |
JPHQ | | | 9,866,709 | | | | (7,272,599 | ) | | | — | | | | (850,000 | ) | | | 1,744,110 | |
MSCO | | | 671,740 | | | | (79,421 | ) | | | — | | | | (290,000 | ) | | | 302,319 | |
SCNY. | | | 738,931 | | | | (517,931 | ) | | | — | | | | — | | | | 221,000 | |
UBSW | | | 527,859 | | | | — | | | | — | | | | (260,000 | ) | | | 267,859 | |
| | | | |
Total | | $ | 58,316,737 | | | $ | (16,917,198 | ) | | $ | — | | | $ | (32,490,000 | ) | | $ | 8,909,539 | |
| | | | |
bIn some instances, the collateral amounts disclosed in the table above were adjusted due to the requirement to limit collateral amounts to avoid the effect of overcollateralization. Actual collateral received and/or pledged may be more than the amounts disclosed herein.
See Abbreviations on page TGB-35.
10. Credit Facility
The Fund, together with other U.S. registered and foreign investment funds (collectively, Borrowers), managed by Franklin Templeton Investments, are borrowers in a joint syndicated senior unsecured credit facility totaling $2 billion (Global Credit Facility) which matured on February 9, 2018. This Global Credit Facility provides a source of funds to the Borrowers for temporary and emergency purposes, including the ability to meet future unanticipated or unusually large redemption requests. Effective February 9, 2018, the Borrowers renewed the Global Credit Facility for a one year term, maturing February 8, 2019, for a total of $2 billion.
Under the terms of the Global Credit Facility, the Fund shall, in addition to interest charged on any borrowings made by the Fund and other costs incurred by the Fund, pay its share of fees and expenses incurred in connection with the implementation and maintenance of the Global Credit Facility, based upon its relative share of the aggregate net assets of all of the Borrowers, including an annual commitment fee of 0.15% based upon the unused portion of the Global Credit Facility. These fees are reflected in other expenses in the Statement of Operations. During the year ended December 31, 2017, the Fund did not use the Global Credit Facility.
11. Fair Value Measurements
The Fund follows a fair value hierarchy that distinguishes between market data obtained from independent sources (observable inputs) and the Fund’s own market assumptions (unobservable inputs). These inputs are used in determining the value of the Fund’s financial instruments and are summarized in the following fair value hierarchy:
| | • | | Level 1 – quoted prices in active markets for identical financial instruments |
| | • | | Level 2 – other significant observable inputs (including quoted prices for similar financial instruments, interest rates, prepayment speed, credit risk, etc.) |
FRANKLIN TEMPLETON VARIABLE INSURANCE PRODUCTS TRUST
NOTES TO FINANCIAL STATEMENTS
Templeton Global Bond VIP Fund (continued)
| | • | | Level 3 – significant unobservable inputs (including the Fund’s own assumptions in determining the fair value of financial instruments) |
The input levels are not necessarily an indication of the risk or liquidity associated with financial instruments at that level.
For movements between the levels within the fair value hierarchy, the Fund has adopted a policy of recognizing the transfers as of the date of the underlying event which caused the movement.
A summary of inputs used as of December 31, 2017, in valuing the Fund’s assets and liabilities carried at fair value, is as follows:
| | | | | | | | | | | | | | | | |
| | | Level 1 | | | Level 2 | | | Level 3 | | | Total | |
| | | | |
| Assets: | | | | | | | | | | | | | | | | |
Investments in Securities:a | | | | | | | | | | | | | | | | |
Foreign Government and Agency Securities | | $ | — | | | $ | 1,871,366,666 | | | $ | — | | | $ | 1,871,366,666 | |
Short Term Investments | | | 795,455,602 | | | | 241,757,531 | | | | — | | | | 1,037,213,133 | |
| | | | |
Total Investments in Securities | | $ | 795,455,602 | | | $ | 2,113,124,197 | | | $ | — | | | $ | 2,908,579,799 | |
| | | | |
Other Financial Instruments: | | | | | | | | | | | | | | | | |
Forward Exchange Contracts | | $ | — | | | $ | 18,010,439 | | | $ | — | | | $ | 18,010,439 | |
Swap Contracts. | | | — | | | | 11,510,190 | | | | — | | | | 11,510,190 | |
| | | | |
Total Other Financial Instruments | | $ | — | | | $ | 29,520,629 | | | $ | — | | | $ | 29,520,629 | |
| | | | |
| | | | |
| Liabilities: | | | | | | | | | | | | | | | | |
Other Financial Instruments: | | | | | | | | | | | | | | | | |
Forward Exchange Contracts | | $ | — | | | $ | 55,010,690 | | | $ | — | | | $ | 55,010,690 | |
Swap Contracts. | | | — | | | | 16,270,360 | | | | — | | | | 16,270,360 | |
| | | | |
Total Other Financial Instruments | | $ | — | | | $ | 71,281,050 | | | $ | — | | | $ | 71,281,050 | |
| | | | |
aFor detailed categories, see the accompanying Statement of Investments.
12. Subsequent Events
The Fund has evaluated subsequent events through the issuance of the financial statements and determined that no events have occurred that require disclosure other than those already disclosed in the financial statements.
Abbreviations
| | | | | | | | | | |
| Counterparty/Exchange | | Currency | | Selected Portfolio |
| | | | | |
| BOFA | | Bank of America Corp. | | ARS | | Argentine Peso | | ARS | | Auction Rate Security |
| | | | | |
| BZWS | | Barclays Bank PLC | | BRL | | Brazilian Real | | BADLAR | | Argentina Deposit Rates Badlar Private Banks ARS |
| | | | | |
| CITI | | Citigroup, Inc. | | COP | | Colombian Peso | | FRN | | Floating Rate Note |
| | | | | |
| DBAB | | Deutsche Bank AG | | EUR | | Euro | | GDP | | Gross Domestic Product |
| | | | | |
| GSCO | | The Goldman Sachs Group, Inc. | | GHS | | Ghanaian Cedi | | LIBOR | | London InterBank Offered Rate |
| | | | | |
| HSBK | | HSBC Bank PLC | | IDR | | Indonesian Rupiah | | VRI | | Value Recovery Instrument |
| | | | | |
| JPHQ | | JP Morgan Chase & Co. | | INR | | Indian Rupee | | | | |
| | | | | |
| MSCO | | Morgan Stanley | | KRW | | South Korean Won | | | | |
| | | | | |
| SCNY | | Standard Chartered Bank | | MXN | | Mexican Peso | | | | |
| | | | | |
| UBSW | | UBS AG | | PEN | | Peruvian Nuevo Sol | | | | |
| | | | | |
| | | | PHP | | Philippine Peso | | | | |
| | | | | |
| | | | USD | | United States Dollar | | | | |
| | | | | |
| | | | ZAR | | South African Rand | | | | |
FRANKLIN TEMPLETON VARIABLE INSURANCE PRODUCTS TRUST
Report of Independent Registered Public Accounting Firm
To the Board of Trustees of Franklin Templeton Variable Insurance Products Trust and Shareholders of Templeton Global Bond VIP Fund
Opinion on the Financial Statements
We have audited the accompanying statement of assets and liabilities, including the statement of investments, of Templeton Global Bond VIP Fund (the “Fund”) as of December 31, 2017, the related statement of operations for the year ended December 31, 2017, the statement of changes in net assets for each of the two years in the period ended December 31, 2017, including the related notes, and the financial highlights for each of the five years in the period ended December 31, 2017 (collectively referred to as the “financial statements”). In our opinion, the financial statements present fairly, in all material respects, the financial position of the Fund as of December 31, 2017, the results of its operations for the year then ended, the changes in its net assets for each of the two years in the period ended December 31, 2017 and the financial highlights for each of the five years in the period ended December 31, 2017 in conformity with accounting principles generally accepted in the United States of America.
Basis for Opinion
These financial statements are the responsibility of the Fund’s management. Our responsibility is to express an opinion on the Fund’s financial statements based on our audits. We are a public accounting firm registered with the Public Company Accounting Oversight Board (United States) (“PCAOB”) and are required to be independent with respect to the Fund in accordance with the U.S. federal securities laws and the applicable rules and regulations of the Securities and Exchange Commission and the PCAOB.
We conducted our audits of these financial statements in accordance with the standards of the PCAOB. Those standards require that we plan and perform the audit to obtain reasonable assurance about whether the financial statements are free of material misstatement, whether due to error or fraud.
Our audits included performing procedures to assess the risks of material misstatement of the financial statements, whether due to error or fraud, and performing procedures that respond to those risks. Such procedures included examining, on a test basis, evidence regarding the amounts and disclosures in the financial statements. Our audits also included evaluating the accounting principles used and significant estimates made by management, as well as evaluating the overall presentation of the financial statements. Our procedures included confirmation of securities owned as of December 31, 2017 by correspondence with the custodian, transfer agent, and brokers; when replies were not received from brokers, we performed other auditing procedures. We believe that our audits provide a reasonable basis for our opinion.
PricewaterhouseCoopers LLP
San Francisco, California
February 15, 2018
We have served as the auditor of one or more investment companies in the Franklin Templeton Group of Funds since 1948.
FRANKLIN TEMPLETON VARIABLE INSURANCE PRODUCTS TRUST
Tax Information (unaudited)
Templeton Global Bond VIP Fund
Under Section 852(b)(3)(C) of the Internal Revenue Code, the Fund hereby reports the maximum amount allowable but no less than $10,104,459 as a long term capital gain dividend for the fiscal year ended December 31, 2017.
At December 31, 2017, more than 50% of the Fund’s total assets were invested in securities of foreign issuers. In most instances, foreign taxes were withheld from income paid to the Fund on these investments. The Fund elects to treat foreign taxes paid as allowed under Section 853 of the Internal Revenue Code (Code). This election will allow shareholders of record as of the 2018 distribution date, to treat their proportionate share of foreign taxes paid by the Fund as having been paid directly by them. The shareholder shall consider these amounts as foreign taxes paid in the tax year in which they receive the Fund distribution.
This page intentionally left blank.
Templeton Growth VIP Fund
This annual report for Templeton Growth VIP Fund covers the fiscal year ended December 31, 2017.
Class 2 Performance Summary as of December 31, 2017
Average annual total return of Class 2 shares* represents the average annual change in value, assuming reinvestment of dividends and capital gains. Average returns smooth out variations in returns, which can be significant; they are not the same as year-by-year results.
| | | | | | | | | | | | |
| Periods ended 12/31/17 | | 1-Year | | | 5-Year | | | 10-Year | |
Average Annual Total Return | | | +18.50% | | | | +9.08% | | | | +3.51% | |
*The Fund has a fee waiver associated with any investment it makes in a Franklin Templeton money fund and/or other Franklin Templeton fund, contractually guaranteed through 4/30/18. Fund investment results reflect the fee waiver; without this waiver, the results would have been lower
Performance reflects the Fund’s Class 2 operating expenses, but does not include any contract fees, expenses or sales charges. If they had been included, performance would be lower. These charges and deductions, particularly for variable life policies, can have a significant effect on contract values and insurance benefits. See the contract prospectus for a complete description of these expenses, including sales charges.
Performance data represent past performance, which does not guarantee future results. Investment return and principal value will fluctuate, and you may have a gain or loss when you sell your shares. Current performance may differ from figures shown.
Total Return Index Comparison for a Hypothetical $10,000 Investment (1/1/08–12/31/17)
The graph below shows the change in value of a hypothetical $10,000 investment in the Fund over the indicated period and includes reinvestment of any income or distributions. The Fund’s performance* is compared to the performance of the MSCI All Country World Index (ACWI). One cannot invest directly in an index, and an index is not representative of the Fund’s portfolio. Please see Important Notes to Performance Information preceding the Fund Summaries.
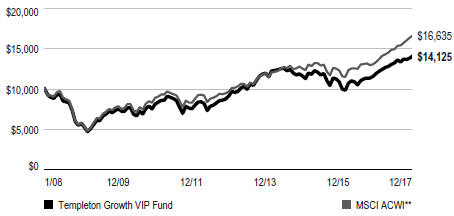
**Source: Morningstar. Please see Index Descriptions following the Fund Summaries.
TEMPLETON GROWTH VIP FUND
Fund Goal and Main Investments
The Fund seeks long-term capital growth. Under normal market conditions, the Fund invests predominantly in equity securities of companies located anywhere in the world, including developing markets.
Fund Risks
All investments involve risks, including possible loss of principal. Special risks are associated with foreign investing, including currency fluctuations, economic instability and political developments; investments in emerging markets involve heightened risks related to the same factors. Because the Fund may invest its assets in companies in a specific region, including Europe, it is subject to greater risks of adverse developments in that region and/or the surrounding regions than a fund that is more broadly diversified geographically. Current political and financial uncertainty surrounding the European Union may increase market volatility and the economic risk of investing in companies in Europe. In addition, smaller company stocks have historically experienced more price volatility than larger company stocks, especially over the short term. The Fund is actively managed but there is no guarantee that the manager’s investment decisions will produce the desired results. The Fund’s prospectus also includes a description of the main investment risks.
Performance Overview
You can find the Fund’s one-year total return in the Performance Summary. For comparison, the Fund’s benchmark, the MSCI ACWI, returned +24.62% for the period under review.1
Economic and Market Overview
The global economy grew moderately during the 12-month period under review. In this environment, global developed and emerging market stocks generated a +24.62% total return, as measured by the MSCI ACWI.1 Global markets were aided by price gains in oil and other commodities, generally upbeat economic data across regions, the European Central Bank’s (ECB’s) extension of its monetary easing program, and investor optimism about pro-growth and pro-business policies in the US. The prospect for reforms in the European Union (EU) with Emmanuel Macron’s election as France’s president,
Geographic Composition
Based on Total Net Assets as of 12/31/17
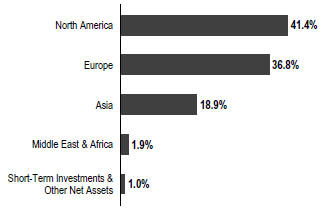
encouraging corporate earnings reports and the passage of the US tax reform bill also supported global stocks.
However, global markets reflected investor concerns about the terms of the UK’s exit from the EU, political uncertainty in the US and the EU, and geopolitical tensions in the Korean peninsula and other regions. Other concerns included the health of European banks, global oil oversupply despite a pact by major oil-producing countries to extend production cuts, and comments from key central bankers around the world about potentially raising interest rates.
After strengthening in 2017’s second and third quarters, the US economy moderated in the fourth quarter. The economy grew faster in 2017 than in 2016, however, largely due to growth in consumer spending, business investment and exports. The unemployment rate decreased from 4.7% in December 2016 to 4.1% at period-end.2 Annual inflation, as measured by the Consumer Price Index, was 2.1% in December 2016, and while it varied over the 12-month period, remained unchanged at period-end.2 The US Federal Reserve (Fed) raised its target range for the federal funds rate 0.25% three times during the period, amid signs of a growing US economy, strengthening labor market and improving business spending. At its December meeting, the Fed confirmed that the monthly balance sheet reduction would increase from US$10 billion to US$20 billion beginning in January 2018.
In Europe, the UK’s economic growth moderated in 2017 compared to 2016, largely due to slower growth in the services
1. Source: Morningstar. One cannot invest directly in an index, and an index is not representative of the Fund’s portfolio. Please see Index Descriptions following the Fund Summaries.
2. Source: Bureau of Labor Statistics.
The dollar value, number of shares or principal amount, and names of all portfolio holdings are listed in the Fund’s Statement of Investments (SOI).
TEMPLETON GROWTH VIP FUND
sector. In November, the Bank of England raised its key policy rate 0.25%, its first increase in a decade. The eurozone’s growth accelerated in 2017’s second and third quarters, but moderated in the fourth quarter. However, the eurozone’s 2017 economic growth rate was the fastest in a decade. The bloc’s annual inflation rate, while low, ended higher than in December 2016. The ECB kept its benchmark interest rate unchanged during the period. However, at its October meeting, the ECB extended the time frame for its massive bond-buying program from December 2017 to at least September 2018, while reducing the amount of monthly bond purchases in half beginning in January 2018.
In Asia, Japan’s quarterly gross domestic product (GDP) grew for the seventh consecutive quarter, although third-quarter 2017 growth was lower than the previous quarter. The Bank of Japan left its benchmark interest rate unchanged during the period and continued its monetary stimulus measures.
In emerging markets, Brazil’s quarterly GDP grew for the third consecutive quarter, although third-quarter 2017 growth slowed from the previous quarter. The country’s central bank cut its benchmark interest rate several times during the period to spur economic growth. Russia’s GDP grew in 2017’s first three quarters compared to the prior-year periods, amid the Bank of Russia’s continued policy support. China’s GDP grew faster in 2017 than in 2016, supported by solid growth in industrial production, services, fixed-asset investment, retail sales, and imports and exports. The People’s Bank of China left its benchmark interest rate unchanged during the period. Overall, emerging market stocks, as measured by the MSCI Emerging Markets (EM) Index, rose substantially during the period.3
Investment Strategy
Our investment philosophy is bottom up, value oriented and long term. When choosing equity investments for the Fund, we focus on the market price of a company’s securities relative to our evaluation of the company’s potential long-term earnings, asset value and cash flow. We also consider a company’s price/earnings ratio, price/cash flow ratio, profit margins and liquidation value.
Manager’s Discussion
Global equities rallied in 2017 as investors looked beyond political turmoil and nascent monetary policy tightening and focused instead on global growth and on fiscal stimulus that
could potentially contribute to corporate earnings. Economic and corporate fundamentals supported the rally. For 2017, for the first time in a decade, all countries tracked by the Organisation for Economic Co-operation and Development are projected to post positive economic growth, while business confidence in many major economies neared or exceeded pre-financial crisis highs. The headline risks unnerving investors at the beginning of 2017—from a potential US political crisis to a Fed policy mistake, to a populist uprising in Europe or nuclear conflict on the Korean peninsula—largely failed to materialize.
Continued market strength belied a transition in leadership in 2017. For the most part, these were shifts for which the Fund was well positioned. Perhaps the most significant change was the underperformance of the US relative to international markets. Our preference for cheaper, earlier-cycle international markets over the more mature and expensive US market has long been articulated, and the Fund benefited from an underweighted positioning during the first instance of US underperformance in eight years. A big pullback in the US dollar accompanied US underperformance as many investors sold the dollar at the onset of rate hike news and attempted to price the impact of deficit-enhancing fiscal stimulus. Soft-dollar proxies responded in-kind, with emerging market stocks, as measured by the MSCI EM Index, posting their best year since 2009. Industrial commodities rode the same tailwinds as emerging markets, climbing to multi-year highs. The crude oil price recovery in the second half of 2017 affirmed our conviction to remain overweighted in the energy sector despite supply concerns that battered crude oil in the first half of the period.4 As expected, China remained stable in anticipation of President Xi Jinping’s momentous power consolidation in November, while in Japan and South Korea, anticipated improvements in corporate profitability and governance continued to materialize, albeit slowly. Our decision to stay the course in Europe, where we have believed that political risks were overstated and economic conditions were improving, was rewarded by the biggest annual gain for continental stocks (in US dollar terms) in nearly a decade.
Yet, despite these positive developments and posting double-digit percentage absolute gains, the Fund underperformed its benchmark, the MSCI ACWI. Although the Fund benefited from positioning in certain sectors and regions, overall positioning hurt relative results as we faced a bottom-up headwind at the stock level. This headwind has been
3. Please see Index Descriptions following the Fund Summaries.
4. The energy sector comprises energy equipment and services and oil, gas and consumable fuels in the SOI.
TEMPLETON GROWTH VIP FUND
exacerbated recently by the continued underperformance of value versus growth. After outperforming growth in 2016, value lagged growth in 2017, with global growth outperforming global value in the past 10 years.
From a sector standpoint, health care was the most significant relative detractor, pressured largely by stock selection and stock-specific weakness.5 Israel-based generic drugmaker Teva Pharmaceutical Industries was a major detractor, declining after management lowered earnings guidance, which raised investor concerns about the firm’s debt profile. Our analysis indicates that Teva does not have a liquidity problem and should be able to address balance sheet issues, cut costs and deliver on a more conservative outlook. Encouragingly, the stock began to recover toward the end of 2017 after a seasoned chief executive officer joined the firm and announced a restructuring plan aimed at significantly reducing costs. In addition, US biotechnology firm Allergan declined due to concerns about generic competition. Despite the market’s excessive focus on product-specific headwinds, Allergan as a whole has one of the industry’s most durable drug portfolios when it comes to exclusivity and patent protection, according to our analysis. Additionally, we feel the company has an industry-leading research and development (R&D) pipeline which, in conjunction with its base businesses, should continue to drive strong earnings and free cash flow growth over our investment horizon.
More broadly, concerns about generic competition, regulatory scrutiny and a consolidating payor sector all took their toll on health care stocks in 2017. Yet, we believe pricing pressures and generic competition are best addressed through innovation, and innovation is fueled by R&D, which has doubled in the pharmaceuticals industry in the past 30 years. Furthermore, despite the political controversy surrounding drug pricing, prescription drug costs account for less than 15% of health care spending in the US and the EU. Given the efficacy of prescription drugs and their ability to reduce costs elsewhere in the health care system, we believe they likely represent good value for the money. The sector is not often cheap based on free cash flow multiples, and we are finding the best values among innovative firms that in our analysis are capable of commanding pricing power and are consistently generating cash flow by successfully addressing unmet medical needs. It is rare to find highly cash-generative, innovative businesses with enormous growth potential trading in what we consider deep
| | | | |
| Top 10 Holdings | | | |
| 12/31/17 | | | |
| |
Company Sector/Industry, Country | | % of Total
Net Assets | |
Samsung Electronics Co. Ltd. Technology Hardware, Storage & Peripherals, South Korea | | | 2.5% | |
Royal Dutch Shell PLC Oil, Gas & Consumable Fuels, UK | | | 2.4% | |
KB Financial Group Inc. Banks, South Korea | | | 2.4% | |
Citigroup Inc. Banks, US | | | 2.3% | |
Oracle Corp. Software, US | | | 2.2% | |
Twenty-First Century Fox Inc. Media, US | | | 2.0% | |
BP PLC Oil, Gas & Consumable Fuels, UK | | | 2.0% | |
Teva Pharmaceutical Industries Ltd. Pharmaceuticals, Israel | | | 1.9% | |
Standard Chartered PLC Banks, UK | | | 1.9% | |
Amgen Inc. Biotechnology, US | | | 1.8% | |
value territory, but we believe select biotechnology and pharmaceuticals firms offer such a proposition.
Stock selection in the underweighted consumer discretionary sector also negatively impacted the Fund’s relative performance.6 Shares of Luxembourg-based satellite and network services provider SES weighed on the sector, declining after management delivered a second consecutive quarter of disappointing earnings results. The adverse newsflow has cast doubts on management’s credibility and led to a stock price decline and a much lower price-to-book valuation multiple compared to the company’s industry peers. Our analysis implies that the stock is now trading at replacement cost for a business with very high barriers to entry and valuable orbital satellite slots that cannot be replicated. Additionally, the company’s high single-digit dividend and free cash flow yields, as well as a contract backlog equivalent to four years of revenue, lead us to believe the stock remains undervalued.
Turning to contributors, stock selection in the financials sector led the Fund’s overweighted financials holdings overall to outperform the index’s financials components, with South
5. The health care sector comprises biotechnology, health care equipment and supplies, health care providers and services, life sciences tools and services, and pharmaceuticals in the SOI.
6. The consumer discretionary sector comprises automobiles, household durables, media, multiline retail and specialty retail in the SOI.
TEMPLETON GROWTH VIP FUND
Korean lender KB Financial Group and French lender Credit Agricole finishing 2017 among the Fund’s top relative contributors.7 The European banking sector in general continues to make encouraging progress. Earnings revisions have returned to a positive trajectory, regulatory capital has been largely rebuilt and the bulk of post-crisis re-regulation efforts are now complete. As economic data have improved and political risks have receded, credit demand has increased. With the bulk of recovery behind it, we believe sector performance will now be more dependent on factors outside management’s control, such as the trajectory of interest rates and credit demand. To this end, in our assessment, value opportunities in European banks have become somewhat more selective recently. In Asia, prospects for improving corporate governance and political stability have combined with rising interest rates and genuine economic growth to benefit the regional banking sector. In the US, we have pared some holdings as we believe expectations for rising rates have largely been incorporated into valuations; nevertheless, in our analysis, select opportunities in well-managed banks and consumer finance firms persist.
Stock selection also drove the outperformance relative to the benchmark of the Fund’s industrials holdings, led by US truck manufacturer Navistar International (not part of the index) and German airline Deutsche Lufthansa (not held at period-end).8 Navistar’s shares surged to the highest level in five years as the combination of an improving North American heavy-truck market and the company’s cost-reduction initiatives raised market expectations for higher sales and profits. In addition to the ongoing operational turnaround, its stock also continued to benefit from the strategic stake of Volkswagen (VW; not a Fund holding) in the company. We believe the deal will allow Navistar to realize immediate purchasing synergies, receive access to VW’s drivetrain technology in 2019 and be able to spread the costs of R&D and capital expenditures over a larger production base, potentially generating a large sum annually in operational synergies. Looking ahead, we see a reasonable likelihood that Navistar could become either a full VW subsidiary, or, if not, continue to benefit from the alliance, as well as from ongoing restructuring initiatives and a cyclical truck market recovery, eventually ending up as a lean and profitable standalone company. Meanwhile, Lufthansa rebounded as the insolvency of Germany’s number two airline, Air Berlin (not a Fund holding), was viewed by many investors as an opportunity for Lufthansa to consolidate its market share and improve its competitive positioning. We closed the Fund’s
position in Lufthansa to realize profits amid renewed strength as the stock approached full valuation, based on our analysis.
From a regional standpoint, stock selection and an overweighting in Asia contributed to relative performance, while stock selection offset the benefits of an underweighting in North America and an overweighting in Europe.
It is important to recognize the effect of currency movements on the Fund’s performance. In general, if the value of the US dollar goes up compared with a foreign currency, an investment traded in that foreign currency will go down in value because it will be worth fewer US dollars. This can have a negative effect on Fund performance. Conversely, when the US dollar weakens in relation to a foreign currency, an investment traded in that foreign currency will increase in value, which can contribute to Fund performance. For the 12 months ended December 31, 2017, the US dollar declined in value relative to most currencies. As a result, the Fund’s performance was positively affected by the portfolio’s substantial investment in securities with non-US currency exposure. However, one cannot expect the same result in future periods.
We remain constructive on the Fund’s positioning and outlook despite recent challenges. We believe value’s headwinds stem largely from unconventional monetary policies, which, since the global financial crisis, has depressed interest rates and sent investors out the risk curve in search of growth and yield. We believe these policies are unsustainable for three reasons. First, they increase social inequality, which has political consequences; second, they inflate asset prices, which creates stability risks; and third, rising inflationary pressures and falling unemployment rates give data-dependent central bankers reasons to begin reversing such policies. As policies transition, we believe the mature cycle will eventually change, as it always has, and with it the conditions unfavorable to value. We would not want to own the leaders of the last cycle during this transition: the growth stocks and bond proxies trading at expensive valuations. However, the stocks left behind—those of companies whose long-term fundamentals have been overlooked and undervalued by a short-term focused market—appear to us well positioned over a long-term investment horizon we believe is likely to include a turning point in this mature cycle.
7. The financials sector comprises banks, capital markets, consumer finance, diversified financial services and insurance in the SOI.
8. The industrials sector comprises aerospace and defense, air freight and logistics, industrial conglomerates and machinery in the SOI.
TEMPLETON GROWTH VIP FUND
Thank you for your participation in Templeton Growth VIP Fund. We look forward to serving your future investment needs.
The foregoing information reflects our analysis, opinions and portfolio holdings as of December 31, 2017, the end of the reporting period. The way we implement our main investment strategies and the resulting portfolio holdings may change depending on factors such as market and economic conditions. These opinions may not be relied upon as investment advice or an offer for a particular security. The information is not a complete analysis of every aspect of any market, country, industry, security or the Fund. Statements of fact are from sources considered reliable, but the investment manager makes no representation or warranty as to their completeness or accuracy. Although historical performance is no guarantee of future results, these insights may help you understand our investment management philosophy.
TEMPLETON GROWTH VIP FUND
Class 2 Fund Expenses
As an investor in a variable insurance contract (Contract) that indirectly provides for investment in an underlying mutual fund, you can incur transaction and/or ongoing expenses at both the Fund level and the Contract Level: (1) transaction expenses can include sales charges (loads) on purchases, surrender fees, transfer fees and premium taxes; and (2) ongoing expenses can include management fees, distribution and service (12b-1) fees, contract fees, annual maintenance fees, mortality and expense risk fees and other fees and expenses. All mutual funds and Contracts have some types of ongoing expenses. The table below shows Fund-level ongoing expenses and can help you understand these costs and compare them with those of other mutual funds offered through the Contract. The table assumes a $1,000 investment held for the six months indicated. Please refer to the Fund prospectus for additional information on operating expenses.
Actual Fund Expenses
The table below provides information about the actual account values and actual expenses in the columns under the heading “Actual.” In these columns the Fund’s actual return, which includes the effect of ongoing Fund expenses but does not include the effect of ongoing Contract expenses, is used to calculate the “Ending Account Value.” You can estimate the Fund-level expenses you paid during the period by following these steps (of course, your account value and expenses will differ from those in this illustration): Divide your account value by $1,000 (if your account had an $8,600 value, then $8,600 ÷ $1,000 = 8.6). Then multiply the result by the number under the headings “Actual” and “Fund-Level Expenses Paid During Period” (if Fund-Level Expenses Paid During Period were $ 7.50, then 8.6 x $7.50 = $64.50). In this illustration, the estimated expenses paid this period at the Fund level are $64.50.
Hypothetical Example for Comparison with Other Mutual Funds
Under the heading “Hypothetical” in the table, information is provided about hypothetical account values and hypothetical expenses based on the Fund’s actual expense ratio and an assumed rate of return of 5% per year before expenses, which is not the Fund’s actual return. This information may not be used to estimate the actual ending account balance or expenses you paid for the period, but it can help you compare ongoing costs of investing in the Fund with those of other mutual funds offered through the Contract. To do so, compare this 5% hypothetical example with the 5% hypothetical examples that appear in the shareholder reports of other funds offered through the Contract.
Please note that expenses shown in the table are meant to highlight ongoing costs at the Fund level only and do not reflect any ongoing expenses at the Contract level, or transaction expenses at either the Fund or Contract levels. In addition, while the Fund does not have transaction expenses, if the transaction and ongoing expenses at the Contract level were included, the expenses shown below would be higher. You should consult your Contract prospectus or disclosure document for more information.
| | | | | | | | | | | | | | | | | | | | | | | | | | |
| | | | | | Actual (actual return after expenses) | | | | | Hypothetical (5% annual return before expenses) | | | | |
| Share Class | |
| Beginning
Account Value 7/1/17 |
| |
| Ending
Account Value 12/31/17 |
| |
| Fund-Level
Expenses
Paid During Period 7/1/17–12/31/171,2 |
| | | |
| Ending
Account Value 12/31/17 |
| |
| Fund-Level
Expenses Paid During Period 7/1/17–12/31/171,2 |
| |
| Net
Annualized
Expense
Ratio2 |
|
Class 2 | | $ | 1,000 | | | $ | 1,068.20 | | | $ | 5.63 | | | | | $ | 1,019.76 | | | $ | 5.50 | | | | 1.08 | % |
1. Expenses are equal to the annualized expense ratio for the six-month period as indicated above—in the far right column—multiplied by the simple average account value over the period indicated, and then multiplied by 184/365 to reflect the one-half year period.
2. Reflects expenses after fee waivers and expense reimbursements. Does not include any ongoing expenses of the Contract for which the Fund is an investment option or acquired fund fees and expenses.
FRANKLIN TEMPLETON VARIABLE INSURANCE PRODUCTS TRUST
Financial Highlights
Templeton Growth VIP Fund
| | | | | | | | | | | | | | | | | | | | |
| | | Year Ended December 31, | |
| | | 2017 | | | 2016 | | | 2015 | | | 2014 | | | 2013 | |
| Class 1 | | | | | | | | | | | | | | | | | | | | |
Per share operating performance
(for a share outstanding throughout the year) | | | | | | | | | | | | | | | | | | | | |
| | | | | |
Net asset value, beginning of year | | | $13.93 | | | | $13.54 | | | | $14.85 | | | | $15.47 | | | | $12.16 | |
| | | | |
| | | | | |
| Income from investment operationsa: | | | | | | | | | | | | | | | | | | | | |
| | | | | |
Net investment incomeb | | | 0.29 | | | | 0.26 | | | | 0.28 | | | | 0.38c | | | | 0.22 | |
| | | | | |
Net realized and unrealized gains (losses) | | | 2.30 | | | | 0.96 | | | | (1.17 | ) | | | (0.75 | ) | | | 3.49 | |
| | | | |
Total from investment operations | | | 2.59 | | | | 1.22 | | | | (0.89 | ) | | | (0.37 | ) | | | 3.71 | |
| | | | |
| | | | | |
| Less distributions from: | | | | | | | | | | | | | | | | | | | | |
| | | | | |
Net investment income | | | (0.28 | ) | | | (0.31 | ) | | | (0.42 | ) | | | (0.25 | ) | | | (0.40 | ) |
| | | | | |
Net realized gains | | | — | | | | (0.52 | ) | | | — | | | | — | | | | — | |
| | | | |
Total distributions | | | (0.28 | ) | | | (0.83 | ) | | | (0.42 | ) | | | (0.25 | ) | | | (0.40 | ) |
| | | | |
Net asset value, end of year | | | $16.24 | | | | $13.93 | | | | $13.54 | | | | $14.85 | | | | $15.47 | |
| | | | |
| | | | | |
Total returnd | | | 18.77% | | | | 9.90% | | | | (6.24)% | | | | (2.53)% | | | | 31.05% | |
| | | | | |
| Ratios to average net assets | | | | | | | | | | | | | | | | | | | | |
| | | | | |
Expenses | | | 0.82% | e,f | | | 0.82% | e | | | 0.80% | e | | | 0.78% | | | | 0.78% | f |
| | | | | |
Net investment income | | | 1.94% | | | | 2.01% | | | | 1.96% | | | | 2.46% | c | | | 1.62% | |
| | | | | |
| Supplemental data | | | | | | | | | | | | | | | | | | | | |
| | | | | |
Net assets, end of year (000’s) | | | $466,207 | | | | $453,997 | | | | $468,548 | | | | $572,860 | | | | $588,409 | |
| | | | | |
Portfolio turnover rate | | | 26.46% | | | | 22.88% | | | | 20.92% | | | | 17.46% | | | | 11.60% | |
aThe amount shown for a share outstanding throughout the period may not correlate with the Statement of Operations for the period due to the timing of sales and repurchases of the Fund’s shares in relation to income earned and/or fluctuating fair value of the investments of the Fund.
bBased on average daily shares outstanding.
cNet investment income per share includes approximately $0.09 per share related to income received in the form of special dividends in connection with certain Fund holdings. Excluding this amount, the ratio of net investment income to average net assets would have been 1.88%.
dTotal return does not include fees, charges or expenses imposed by the variable annuity and life insurance contracts for which Franklin Templeton Variable Insurance Products Trust serves as an underlying investment vehicle.
eBenefit of waiver and payments by affiliates rounds to less than 0.01%.
fBenefit of expense reduction rounds to less than 0.01%.
| | | | |
| TG-8 | | Annual Report | The accompanying notes are an integral part of these financial statements. | | |
FRANKLIN TEMPLETON VARIABLE INSURANCE PRODUCTS TRUST
FINANCIAL HIGHLIGHTS
Templeton Growth VIP Fund (continued)
| | | | | | | | | | | | | | | | | | | | |
| | | Year Ended December 31, | |
| | | 2017 | | | 2016 | | | 2015 | | | 2014 | | | 2013 | |
| Class 2 | | | | | | | | | | | | | | | | | | | | |
Per share operating performance
(for a share outstanding throughout the year) | | | | | | | | | | | | | | | | | | | | |
| | | | | |
Net asset value, beginning of year | | | $13.70 | | | | $13.32 | | | | $14.61 | | | | $15.23 | | | | $11.97 | |
| | | | |
| | | | | |
| Income from investment operationsa: | | | | | | | | | | | | | | | | | | | | |
| | | | | |
Net investment incomeb | | | 0.25 | | | | 0.23 | | | | 0.25 | | | | 0.34 | c | | | 0.19 | |
| | | | | |
Net realized and unrealized gains (losses) | | | 2.26 | | | | 0.94 | | | | (1.16 | ) | | | (0.75 | ) | | | 3.44 | |
| | | | |
Total from investment operations | | | 2.51 | | | | 1.17 | | | | (0.91 | ) | | | (0.41 | ) | | | 3.63 | |
| | | | |
| | | | | |
| Less distributions from: | | | | | | | | | | | | | | | | | | | | |
| | | | | |
Net investment income | | | (0.24 | ) | | | (0.27 | ) | | | (0.38 | ) | | | (0.21 | ) | | | (0.37 | ) |
| | | | | |
Net realized gains | | | — | | | | (0.52 | ) | | | — | | | | — | | | | — | |
| | | | |
Total distributions | | | (0.24 | ) | | | (0.79 | ) | | | (0.38 | ) | | | (0.21 | ) | | | (0.37 | ) |
| | | | |
Net asset value, end of year | | | $15.97 | | | | $13.70 | | | | $13.32 | | | | $14.61 | | | | $15.23 | |
| | | | |
| | | | | |
Total returnd | | | 18.50% | | | | 9.62% | | | | (6.49)% | | | | (2.81)% | | | | 30.82% | |
| | | | | |
| Ratios to average net assets | | | | | | | | | | | | | | | | | | | | |
| | | | | |
Expenses | | | 1.07% | e,f | | | 1.07% | e | | | 1.05%e | | | | 1.03% | | | | 1.03% | f |
| | | | | |
Net investment income | | | 1.69% | | | | 1.76% | | | | 1.71% | | | | 2.21% | c | | | 1.37% | |
| | | | | |
| Supplemental data | | | | | | | | | | | | | | | | | | | | |
| | | | | |
Net assets, end of year (000’s) | | | $879,521 | | | | $876,128 | | | | $921,895 | | | | $1,171,896 | | | | $1,450,304 | |
| | | | | |
Portfolio turnover rate | | | 26.46% | | | | 22.88% | | | | 20.92% | | | | 17.46% | | | | 11.60% | |
aThe amount shown for a share outstanding throughout the period may not correlate with the Statement of Operations for the period due to the timing of sales and repurchases of the Fund’s shares in relation to income earned and/or fluctuating fair value of the investments of the Fund.
bBased on average daily shares outstanding.
cNet investment income per share includes approximately $0.09 per share related to income received in the form of special dividends in connection with certain Fund holdings. Excluding this amount, the ratio of net investment income to average net assets would have been 1.63%.
dTotal return does not include fees, charges or expenses imposed by the variable annuity and life insurance contracts for which Franklin Templeton Variable Insurance Products Trust serves as an underlying investment vehicle.
eBenefit of waiver and payments by affiliates rounds to less than 0.01%.
fBenefit of expense reduction rounds to less than 0.01%.
| | | | | | |
| | | The accompanying notes are an integral part of these financial statements. | Annual Report | | | TG-9 | |
FRANKLIN TEMPLETON VARIABLE INSURANCE PRODUCTS TRUST
FINANCIAL HIGHLIGHTS
Templeton Growth VIP Fund (continued)
| | | | | | | | | | | | | | | | | | | | |
| | | Year Ended December 31, | |
| | | 2017 | | | 2016 | | | 2015 | | | 2014 | | | 2013 | |
| Class 4 | | | | | | | | | | | | | | | | | | | | |
Per share operating performance
(for a share outstanding throughout the year) | | | | | | | | | | | | | | | | | | | | |
| | | | | |
Net asset value, beginning of year | | | $13.83 | | | | $13.44 | | | | $14.73 | | | | $15.35 | | | | $12.07 | |
| | | | |
| | | | | |
| Income from investment operationsa: | | | | | | | | | | | | | | | | | | | | |
| | | | | |
Net investment incomeb | | | 0.24 | | | | 0.22 | | | | 0.23 | | | | 0.33c | | | | 0.17 | |
| | | | | |
Net realized and unrealized gains (losses) | | | 2.28 | | | | 0.94 | | | | (1.16 | ) | | | (0.76 | ) | | | 3.47 | |
| | | | |
Total from investment operations | | | 2.52 | | | | 1.16 | | | | (0.93 | ) | | | (0.43 | ) | | | 3.64 | |
| | | | |
| | | | | |
| Less distributions from: | | | | | | | | | | | | | | | | | | | | |
| | | | | |
Net investment income | | | (0.22 | ) | | | (0.25 | ) | | | (0.36 | ) | | | (0.19 | ) | | | (0.36 | ) |
| | | | | |
Net realized gains | | | — | | | | (0.52 | ) | | | — | | | | — | | | | — | |
| | | | |
Total distributions | | | (0.22 | ) | | | (0.77 | ) | | | (0.36 | ) | | | (0.19 | ) | | | (0.36 | ) |
| | | | |
Net asset value, end of year | | | $16.13 | | | | $13.83 | | | | $13.44 | | | | $14.73 | | | | $15.35 | |
| | | | |
| | | | | |
Total returnd | | | 18.38% | | | | 9.47% | | | | (6.54)% | | | | (2.88)% | | | | 30.64% | |
| | | | | |
| Ratios to average net assets | | | | | | | | | | | | | | | | | | | | |
| | | | | |
Expenses | | | 1.17% | e,f | | | 1.17% | e | | | 1.15% | e | | | 1.13% | | | | 1.13% | f |
| | | | | |
Net investment income | | | 1.59% | | | | 1.66% | | | | 1.61% | | | | 2.11% | c | | | 1.27% | |
| | | | | |
| Supplemental data | | | | | | | | | | | | | | | | | | | | |
| | | | | |
Net assets, end of year (000’s) | | | $38,798 | | | | $43,286 | | | | $47,777 | | | | $59,989 | | | | $72,683 | |
| | | | | |
Portfolio turnover rate | | | 26.46% | | | | 22.88% | | | | 20.92% | | | | 17.46% | | | | 11.60% | |
aThe amount shown for a share outstanding throughout the period may not correlate with the Statement of Operations for the period due to the timing of sales and repurchases of the Fund’s shares in relation to income earned and/or fluctuating fair value of the investments of the Fund.
bBased on average daily shares outstanding.
cNet investment income per share includes approximately $0.09 per share related to income received in the form of special dividends in connection with certain Fund holdings. Excluding this amount, the ratio of net investment income to average net assets would have been 1.53%.
dTotal return does not include fees, charges or expenses imposed by the variable annuity and life insurance contracts for which Franklin Templeton Variable Insurance Products Trust serves as an underlying investment vehicle.
eBenefit of waiver and payments by affiliates rounds to less than 0.01%.
fBenefit of expense reduction rounds to less than 0.01%.
| | | | |
| TG-10 | | Annual Report | The accompanying notes are an integral part of these financial statements. | | |
FRANKLIN TEMPLETON VARIABLE INSURANCE PRODUCTS TRUST
Statement of Investments, December 31, 2017
| | | | | | | | | | | | | | |
Templeton Growth VIP Fund | | | | | | | | | |
| | | | | Country | | | Shares | | | Value | |
| | Common Stocks 98.5% | | | | | | | | | | | | |
| | Aerospace & Defense 1.5% | | | | | | | | | | | | |
| | BAE Systems PLC | | | United Kingdom | | | | 2,698,452 | | | $ | 20,880,834 | |
| | | | | | | | | | | | | | |
| | Air Freight & Logistics 1.1% | | | | | | | | | | | | |
| | United Parcel Service Inc., B | | | United States | | | | 127,570 | | | | 15,199,965 | |
| | | | | | | | | | | | | | |
| | Automobiles 2.3% | | | | | | | | | | | | |
| | Hero Motocorp Ltd. | | | India | | | | 224,600 | | | | 13,316,803 | |
| | Hyundai Motor Co. | | | South Korea | | | | 61,300 | | | | 8,959,176 | |
| | Nissan Motor Co. Ltd. | | | Japan | | | | 1,013,110 | | | | 10,100,981 | |
| | | | | | | | | | | | | | |
| | | | | | | | | | | | | 32,376,960 | |
| | | | | | | | | | | | | | |
| | Banks 14.1% | | | | | | | | | | | | |
| | Bangkok Bank PCL, fgn | | | Thailand | | | | 1,704,150 | | | | 11,458,669 | |
| | Bangkok Bank PCL, NVDR | | | Thailand | | | | 913,600 | | | | 5,666,171 | |
| a | | Bank of Ireland Group PLC | | | Ireland | | | | 320,100 | | | | 2,724,877 | |
| | Barclays PLC | | | United Kingdom | | | | 2,662,560 | | | | 7,302,774 | |
| | BNP Paribas SA | | | France | | | | 243,927 | | | | 18,218,311 | |
| | Citigroup Inc. | | | United States | | | | 421,450 | | | | 31,360,094 | |
| | Credit Agricole SA | | | France | | | | 626,216 | | | | 10,368,409 | |
| | HSBC Holdings PLC | | | United Kingdom | | | | 2,362,494 | | | | 24,175,736 | |
| | ING Groep NV | | | Netherlands | | | | 384,356 | | | | 7,067,129 | |
| | JPMorgan Chase & Co. | | | United States | | | | 169,570 | | | | 18,133,816 | |
| | KB Financial Group Inc. | | | South Korea | | | | 552,314 | | | | 32,806,378 | |
| a | | Standard Chartered PLC | | | United Kingdom | | | | 2,433,563 | | | | 25,637,247 | |
| | | | | | | | | | | | | | |
| | | | | | | | | | | | | 194,919,611 | |
| | | | | | | | | | | | | | |
| | Beverages 0.3% | | | | | | | | | | | | |
| | Suntory Beverage & Food Ltd. | | | Japan | | | | 78,700 | | | | 3,499,019 | |
| | | | | | | | | | | | | | |
| | Biotechnology 3.7% | | | | | | | | | | | | |
| | Amgen Inc. | | | United States | | | | 144,300 | | | | 25,093,770 | |
| a | | Celgene Corp. | | | United States | | | | 60,320 | | | | 6,294,995 | |
| | Gilead Sciences Inc. | | | United States | | | | 283,260 | | | | 20,292,747 | |
| | | | | | | | | | | | | | |
| | | | | | | | | | | | | 51,681,512 | |
| | | | | | | | | | | | | | |
| | Capital Markets 2.2% | | | | | | | | | | | | |
| | Man Group PLC | | | United Kingdom | | | | 2,385,372 | | | | 6,661,702 | |
| | UBS Group AG | | | Switzerland | | | | 1,096,280 | | | | 20,185,009 | |
| | Value Partners Group Ltd. | | | Hong Kong | | | | 2,850,000 | | | | 3,027,704 | |
| | | | | | | | | | | | | | |
| | | | | | | | | | | | | 29,874,415 | |
| | | | | | | | | | | | | | |
| | Chemicals 1.3% | | | | | | | | | | | | |
| | Akzo Nobel NV | | | Netherlands | | | | 208,005 | | | | 18,223,193 | |
| | | | | | | | | | | | | | |
| | Communications Equipment 2.2% | | | | | | | | | | | | |
| | Cisco Systems Inc. | | | United States | | | | 326,510 | | | | 12,505,333 | |
| a | | CommScope Holding Co. Inc. | | | United States | | | | 84,400 | | | | 3,192,852 | |
| | Ericsson, B | | | Sweden | | | | 1,947,362 | | | | 12,783,480 | |
| a | | NetScout Systems Inc. | | | United States | | | | 86,600 | | | | 2,636,970 | |
| | | | | | | | | | | | | | |
| | | | | | | | | | | | | 31,118,635 | |
| | | | | | | | | | | | | | |
| | Consumer Finance 1.7% | | | | | | | | | | | | |
| | Ally Financial Inc. | | | United States | | | | 160,390 | | | | 4,676,972 | |
| | Capital One Financial Corp. | | | United States | | | | 187,470 | | | | 18,668,263 | |
| | | | | | | | | | | | | | |
| | | | | | | | | | | | | 23,345,235 | |
| | | | | | | | | | | | | | |
| | Diversified Financial Services 0.6% | | | | | | | | | | | | |
| | Voya Financial Inc. | | | United States | | | | 157,941 | | | | 7,813,341 | |
| | | | | | | | | | | | | | |
FRANKLIN TEMPLETON VARIABLE INSURANCE PRODUCTS TRUST
STATEMENT OF INVESTMENTS
Templeton Growth VIP Fund (continued)
| | | | | | | | | | | | | | |
| | | | | Country | | | Shares | | | Value | |
| | Common Stocks (continued) | | | | | | | | | | | | |
| | Diversified Telecommunication Services 3.1% | | | | | | | | | | | | |
| | China Telecom Corp. Ltd., ADR | | | China | | | | 179,195 | | | $ | 8,506,387 | |
| | China Telecom Corp. Ltd., H | | | China | | | | 2,006,000 | | | | 955,134 | |
| | Singapore Telecommunications Ltd. | | | Singapore | | | | 7,861,800 | | | | 20,984,393 | |
| | Telefonica SA | | | Spain | | | | 1,290,675 | | | | 12,581,985 | |
| | | | | | | | | | | | | | |
| | | | | | | | | | | | | 43,027,899 | |
| | | | | | | | | | | | | | |
| | Energy Equipment & Services 1.5% | | | | | | | | | | | | |
| | Halliburton Co. | | | United States | | | | 141,370 | | | | 6,908,752 | |
| | Helmerich & Payne Inc. | | | United States | | | | 212,730 | | | | 13,750,867 | |
| | | | | | | | | | | | | | |
| | | | | | | | | | | | | 20,659,619 | |
| | | | | | | | | | | | | | |
| | Food & Staples Retailing 1.2% | | | | | | | | | | | | |
| | Walgreens Boots Alliance Inc. | | | United States | | | | 232,390 | | | | 16,876,162 | |
| | | | | | | | | | | | | | |
| | Health Care Equipment & Supplies 1.8% | | | | | | | | | | | | |
| a | | Arjo AB, B | | | Sweden | | | | 1,057,200 | | | | 3,016,999 | |
| | Getinge AB, B | | | Sweden | | | | 1,057,200 | | | | 15,336,308 | |
| | Medtronic PLC | | | United States | | | | 74,440 | | | | 6,011,030 | |
| | | | | | | | | | | | | | |
| | | | | | | | | | | | | 24,364,337 | |
| | | | | | | | | | | | | | |
| | Health Care Providers & Services 2.1% | | | | | | | | | | | | |
| | AmerisourceBergen Corp. | | | United States | | | | 173,200 | | | | 15,903,224 | |
| | Cardinal Health Inc. | | | United States | | | | 209,760 | | | | 12,851,995 | |
| | | | | | | | | | | | | | |
| | | | | | | | | | | | | 28,755,219 | |
| | | | | | | | | | | | | | |
| | Household Durables 1.3% | | | | | | | | | | | | |
| | Panasonic Corp. | | | Japan | | | | 1,255,690 | | | | 18,380,979 | |
| | | | | | | | | | | | | | |
| | Industrial Conglomerates 1.3% | | | | | | | | | | | | |
| | Siemens AG | | | Germany | | | | 127,032 | | | | 17,702,770 | |
| | | | | | | | | | | | | | |
| | Insurance 5.0% | | | | | | | | | | | | |
| | Aegon NV | | | Netherlands | | | | 2,921,736 | | | | 18,631,727 | |
| | American International Group Inc. | | | United States | | | | 178,670 | | | | 10,645,159 | |
| | AXA SA | | | France | | | | 685,098 | | | | 20,331,691 | |
| | China Life Insurance Co. Ltd., H | | | China | | | | 6,041,230 | | | | 18,983,111 | |
| | | | | | | | | | | | | | |
| | | | | | | | | | | | | 68,591,688 | |
| | | | | | | | | | | | | | |
| | Internet Software & Services 2.9% | | | | | | | | | | | | |
| a | | Alphabet Inc., A | | | United States | | | | 18,550 | | | | 19,540,570 | |
| a | | Baidu Inc., ADR | | | China | | | | 89,180 | | | | 20,886,848 | |
| | | | | | | | | | | | | | |
| | | | | | | | | | | | | 40,427,418 | |
| | | | | | | | | | | | | | |
| | IT Services 0.6% | | | | | | | | | | | | |
| | DXC Technology Co. | | | United States | | | | 92,729 | | | | 8,799,982 | |
| | | | | | | | | | | | | | |
| | Life Sciences Tools & Services 0.5% | | | | | | | | | | | | |
| | QIAGEN NV | | | Netherlands | | | | 205,690 | | | | 6,463,348 | |
| | | | | | | | | | | | | | |
| | Machinery 1.5% | | | | | | | | | | | | |
| a | | Navistar International Corp. | | | United States | | | | 471,200 | | | | 20,205,056 | |
| | | | | | | | | | | | | | |
| | Media 5.3% | | | | | | | | | | | | |
| | Comcast Corp., A | | | United States | | | | 455,054 | | | | 18,224,913 | |
| | SES SA, IDR | | | Luxembourg | | | | 1,290,560 | | | | 20,144,866 | |
| | Sky PLC | | | United Kingdom | | | | 570,237 | | | | 7,793,175 | |
| | Twenty-First Century Fox Inc., A | | | United States | | | | 803,522 | | | | 27,745,614 | |
| | | | | | | | | | | | | | |
| | | | | | | | | | | | | 73,908,568 | |
| | | | | | | | | | | | | | |
FRANKLIN TEMPLETON VARIABLE INSURANCE PRODUCTS TRUST
STATEMENT OF INVESTMENTS
Templeton Growth VIP Fund (continued)
| | | | | | | | | | | | | | |
| | | | | Country | | | Shares | | | Value | |
| | Common Stocks (continued) | | | | | | | | | | | | |
| | Metals & Mining 3.4% | | | | | | | | | | | | |
| | Barrick Gold Corp. | | | Canada | | | | 865,310 | | | $ | 12,521,036 | |
| | MMC Norilsk Nickel PJSC, ADR | | | Russia | | | | 695,600 | | | | 13,035,544 | |
| | Sumitomo Metal Mining Co. Ltd. | | | Japan | | | | 138,250 | | | | 6,352,740 | |
| | Wheaton Precious Metals Corp. | | | Canada | | | | 686,882 | | | | 15,184,512 | |
| | | | | | | | | | | | | | |
| | | | | | | | | | | | | 47,093,832 | |
| | | | | | | | | | | | | | |
| | Multiline Retail 0.4% | | | | | | | | | | | | |
| | Ryohin Keikaku Co. Ltd. | | | Japan | | | | 19,340 | | | | 6,024,174 | |
| | | | | | | | | | | | | | |
| | Multi-Utilities 2.1% | | | | | | | | | | | | |
| | innogy SE | | | Germany | | | | 410,700 | | | | 16,100,864 | |
| | Veolia Environnement SA | | | France | | | | 484,100 | | | | 12,357,014 | |
| | | | | | | | | | | | | | |
| | | | | | | | | | | | | 28,457,878 | |
| | | | | | | | | | | | | | |
| | Oil, Gas & Consumable Fuels 10.9% | | | | | | | | | | | | |
| | Apache Corp. | | | United States | | | | 333,330 | | | | 14,073,193 | |
| | BP PLC | | | United Kingdom | | | | 3,841,161 | | | | 27,113,996 | |
| | ConocoPhillips | | | United States | | | | 361,710 | | | | 19,854,262 | |
| | Eni SpA | | | Italy | | | | 1,331,279 | | | | 22,042,307 | |
| | Galp Energia SGPS SA, B | | | Portugal | | | | 736,470 | | | | 13,541,427 | |
| a | | Husky Energy Inc. | | | Canada | | | | 719,150 | | | | 10,154,254 | |
| | Kunlun Energy Co. Ltd. | | | China | | | | 10,826,000 | | | | 11,279,320 | |
| | Royal Dutch Shell PLC, B | | | United Kingdom | | | | 985,659 | | | | 33,390,222 | |
| | | | | | | | | | | | | | |
| | | | | | | | | | | | | 151,448,981 | |
| | | | | | | | | | | | | | |
| | Personal Products 1.2% | | | | | | | | | | | | |
| | Coty Inc., A | | | United States | | | | 863,820 | | | | 17,181,380 | |
| | | | | | | | | | | | | | |
| | Pharmaceuticals 8.5% | | | | | | | | | | | | |
| | Allergan PLC | | | United States | | | | 123,514 | | | | 20,204,420 | |
| | Eli Lilly & Co. | | | United States | | | | 192,470 | | | | 16,256,016 | |
| | Merck KGaA | | | Germany | | | | 127,234 | | | | 13,700,819 | |
| | Perrigo Co. PLC | | | United States | | | | 192,570 | | | | 16,784,401 | |
| | Roche Holding AG | | | Switzerland | | | | 45,563 | | | | 11,526,946 | |
| | Sanofi | | | France | | | | 146,857 | | | | 12,659,901 | |
| | Teva Pharmaceutical Industries Ltd., ADR | | | Israel | | | | 1,376,180 | | | | 26,078,611 | |
| | | | | | | | | | | | | | |
| | | | | | | | | | | | | 117,211,114 | |
| | | | | | | | | | | | | | |
| | Software 3.6% | | | | | | | | | | | | |
| | Microsoft Corp. | | | United States | | | | 241,809 | | | | 20,684,293 | |
| | Oracle Corp. | | | United States | | | | 630,670 | | | | 29,818,078 | |
| | | | | | | | | | | | | | |
| | | | | | | | | | | | | 50,502,371 | |
| | | | | | | | | | | | | | |
| | Specialty Retail 2.5% | | | | | | | | | | | | |
| | Advance Auto Parts Inc. | | | United States | | | | 109,960 | | | | 10,961,912 | |
| | Kingfisher PLC | | | United Kingdom | | | | 5,181,552 | | | | 23,630,311 | |
| | | | | | | | | | | | | | |
| | | | | | | | | | | | | 34,592,223 | |
| | | | | | | | | | | | | | |
| | Technology Hardware, Storage & Peripherals 3.9% | | | | | | | | | | | | |
| | Apple Inc. | | | United States | | | | 111,670 | | | | 18,897,914 | |
| | Samsung Electronics Co. Ltd. | | | South Korea | | | | 14,520 | | | | 34,661,633 | |
| | | | | | | | | | | | | | |
| | | | | | | | | | | | | 53,559,547 | |
| | | | | | | | | | | | | | |
FRANKLIN TEMPLETON VARIABLE INSURANCE PRODUCTS TRUST
STATEMENT OF INVESTMENTS
Templeton Growth VIP Fund (continued)
| | | | | | | | | | | | | | |
| | | | | Country | | | Shares | | | Value | |
| | Common Stocks (continued) | | | | | | | | | | | | |
| | Wireless Telecommunication Services 2.9% | | | | | | | | | | | | |
| | China Mobile Ltd. | | | China | | | | 636,000 | | | $ | 6,451,295 | |
| | SoftBank Group Corp. | | | Japan | | | | 247,120 | | | | 19,561,702 | |
| | Vodafone Group PLC | | | United Kingdom | | | | 4,524,457 | | | | 14,358,625 | |
| | | | | | | | | | | | | | |
| | | | | | | | | | | | | 40,371,622 | |
| | | | | | | | | | | | | | |
| | | | |
| | Total Common Stocks (Cost $1,073,214,739) | | | | | | | | | | | 1,363,538,887 | |
| | | | | | | | | | | | | | |
| | | | |
| | | | | | | | Principal Amount | | | | |
| | Corporate Bonds (Cost $6,419,697) 0.5% | | | | | | | | | | | | |
| | Oil, Gas & Consumable Fuels 0.5% | | | | | | | | | | | | |
| b | | Chesapeake Energy Corp., secured note, second lien, 144A, 8.00%, 12/15/22 | | | United States | | | $ | 6,893,000 | | | | 7,461,673 | |
| | | | | | | | | | | | | | |
| | Total Investments before Short Term Investments (Cost $1,079,634,436) | | | | | | | | | | | 1,371,000,560 | |
| | | | | | | | | | | | | | |
| | Short Term Investments (Cost $10,800,000) 0.8% | | | | | | | | | | | | |
| | Time Deposits 0.8% | | | | | | | | | | | | |
| | Royal Bank of Canada, 1.35%, 1/02/18 | | | United States | | | | 10,800,000 | | | | 10,800,000 | |
| | | | | | | | | | | | | | |
| | Total Investments (Cost $1,090,434,436) 99.8% | | | | | | | | | | | 1,381,800,560 | |
| | Other Assets, less Liabilities 0.2% | | | | | | | | | | | 2,725,227 | |
| | | | | | | | | | | | | | |
| | Net Assets 100.0% | | | | | | | | | | $ | 1,384,525,787 | |
| | | | | | | | | | | | | | |
See Abbreviations on page TG-25.
aNon-income producing.
bSecurity was purchased pursuant to Rule 144A under the Securities Act of 1933 and may be sold in transactions exempt from registration only to qualified institutional buyers or in a public offering registered under the Securities Act of 1933. This security has been deemed liquid under guidelines approved by the Trust’s Board of Trustees.
| | | | |
| TG-14 | | Annual Report | The accompanying notes are an integral part of these financial statements. | | |
FRANKLIN TEMPLETON VARIABLE INSURANCE PRODUCTS TRUST
Financial Statements
Statement of Assets and Liabilities
December 31, 2017
| | | | |
| | | Templeton
Growth
VIP Fund | |
Assets: | | | | |
Investments in securities: | | | | |
Cost - Unaffiliated issuers | | $ | 1,090,434,436 | |
| | | | |
Value - Unaffiliated issuers | | $ | 1,381,800,560 | |
Cash | | | 117,140 | |
Receivables: | | | | |
Investment securities sold | | | 33,345 | |
Capital shares sold | | | 101,276 | |
Dividends and interest | | | 3,739,999 | |
European Union tax reclaims | | | 895,045 | |
Other assets | | | 160 | |
| | | | |
Total assets | | | 1,386,687,525 | |
| | | | |
Liabilities: | | | | |
Payables: | | | | |
Investment securities purchased | | | 41,834 | |
Capital shares redeemed | | | 428,857 | |
Management fees | | | 912,423 | |
Distribution fees | | | 386,042 | |
Reports to shareholders | | | 113,358 | |
Deferred tax. | | | 61,785 | |
Accrued expenses and other liabilities. | | | 217,439 | |
| | | | |
Total liabilities | | | 2,161,738 | |
| | | | |
Net assets, at value | | $ | 1,384,525,787 | |
| | | | |
Net assets consist of: | | | | |
Paid-in capital | | $ | 967,903,247 | |
Undistributed net investment income | | | 26,603,305 | |
Net unrealized appreciation (depreciation) | | | 291,444,367 | |
Accumulated net realized gain (loss) | | | 98,574,868 | |
| | | | |
Net assets, at value | | $ | 1,384,525,787 | |
| | | | |
| |
| Class 1: | | | | |
Net assets, at value | | $ | 466,206,565 | |
| | | | |
Shares outstanding | | | 28,703,159 | |
| | | | |
Net asset value and maximum offering price per share | | $ | 16.24 | |
| | | | |
| |
| Class 2: | | | | |
Net assets, at value | | $ | 879,521,173 | |
| | | | |
Shares outstanding | | | 55,063,624 | |
| | | | |
Net asset value and maximum offering price per share | | $ | 15.97 | |
| | | | |
| |
| Class 4: | | | | |
Net assets, at value | | $ | 38,798,049 | |
| | | | |
Shares outstanding | | | 2,405,075 | |
| | | | |
Net asset value and maximum offering price per share | | $ | 16.13 | |
| | | | |
| | | | | | |
| | | The accompanying notes are an integral part of these financial statements. | Annual Report | | | TG-15 | |
FRANKLIN TEMPLETON VARIABLE INSURANCE PRODUCTS TRUST
FINANCIAL STATEMENTS
Statement of Operations
for the year ended December 31, 2017
| | | | |
| | | Templeton
Growth
VIP Fund | |
Investment income: | | | | |
Dividends: (net of foreign taxes)* | | | | |
Unaffiliated issuers | | $ | 36,898,880 | |
Interest: | | | | |
Unaffiliated issuers | | | 1,317,963 | |
Income from securities loaned (net of fees and rebates) | | | 201,121 | |
Other income (Note 1d) | | | 47,113 | |
| | | | |
Total investment income. | | | 38,465,077 | |
| | | | |
Expenses: | | | | |
Management fees (Note 3a) | | | 10,870,448 | |
Distribution fees: (Note 3c) | | | | |
Class 2 | | | 2,213,242 | |
Class 4 | | | 143,920 | |
Custodian fees (Note 4) | | | 110,450 | |
Reports to shareholders | | | 188,547 | |
Professional fees | | | 171,303 | |
Trustees’ fees and expenses | | | 5,944 | |
Other. | | | 98,380 | |
| | | | |
Total expenses | | | 13,802,234 | |
Expense reductions (Note 4) | | | (8,565 | ) |
Expenses waived/paid by affiliates (Note 3e) | | | (24,139 | ) |
| | | | |
Net expenses | | | 13,769,530 | |
| | | | |
Net investment income | | | 24,695,547 | |
| | | | |
Realized and unrealized gains (losses): | | | | |
Net realized gain (loss) from: | | | | |
Investments: | | | | |
Unaffiliated issuers | | | 116,916,092 | |
Foreign currency transactions | | | 161,039 | |
| | | | |
Net realized gain (loss) | | | 117,077,131 | |
| | | | |
Net change in unrealized appreciation (depreciation) on: | | | | |
Investments: | | | | |
Unaffiliated issuers | | | 95,909,984 | |
Translation of other assets and liabilities denominated in foreign currencies | | | 308,262 | |
Change in deferred taxes on unrealized appreciation | | | (61,785 | ) |
| | | | |
Net change in unrealized appreciation (depreciation) | | | 96,156,461 | |
| | | | |
Net realized and unrealized gain (loss) | | | 213,233,592 | |
| | | | |
Net increase (decrease) in net assets resulting from operations | | $ | 237,929,139 | |
| | | | |
| |
* Foreign taxes withheld on dividends | | $ | 3,034,066 | |
| | | | |
| TG-16 | | Annual Report | The accompanying notes are an integral part of these financial statements. | | |
FRANKLIN TEMPLETON VARIABLE INSURANCE PRODUCTS TRUST
FINANCIAL STATEMENTS
Statements of Changes in Net Assets
| | | | | | | | |
| | | Templeton Growth VIP Fund | |
| | | Year Ended December 31, | |
| | | 2017 | | | 2016 | |
Increase (decrease) in net assets: | | | | | | | | |
Operations: | | | | | | | | |
Net investment income | | $ | 24,695,547 | | | $ | 24,853,200 | |
Net realized gain (loss) | | | 117,077,131 | | | | (7,519,261 | ) |
Net change in unrealized appreciation (depreciation) | | | 96,156,461 | | | | 106,000,252 | |
| | | | |
Net increase (decrease) in net assets resulting from operations | | | 237,929,139 | | | | 123,334,191 | |
| | | | |
Distributions to shareholders from: | | | | | | | | |
Net investment income: | | | | | | | | |
Class 1 | | | (8,645,537 | ) | | | (10,324,588 | ) |
Class 2 | | | (14,420,565 | ) | | | (17,569,556 | ) |
Class 4 | | | (607,359 | ) | | | (854,329 | ) |
Net realized gains: | | | | | | | | |
Class 1 | | | — | | | | (17,221,955 | ) |
Class 2 | | | — | | | | (33,791,595 | ) |
Class 4 | | | — | | | | (1,749,580 | ) |
| | | | |
Total distributions to shareholders | | | (23,673,461 | ) | | | (81,511,603 | ) |
| | | | |
Capital share transactions: (Note 2) | | | | | | | | |
Class 1 | | | (59,747,929 | ) | | | (29,290,497 | ) |
Class 2 | | | (132,483,391 | ) | | | (71,266,569 | ) |
Class 4 | | | (10,910,240 | ) | | | (6,073,422 | ) |
| | | | |
Total capital share transactions | | | (203,141,560 | ) | | | (106,630,488 | ) |
| | | | |
Net increase (decrease) in net assets | | | 11,114,118 | | | | (64,807,900 | ) |
Net assets: | | | | | | | | |
Beginning of year | | | 1,373,411,669 | | | | 1,438,219,569 | |
| | | | |
End of year | | $ | 1,384,525,787 | | | $ | 1,373,411,669 | |
| | | | |
Undistributed net investment income included in net assets: | | | | | | | | |
End of year | | $ | 26,603,305 | | | $ | 25,406,323 | |
| | | | |
| | | | | | |
| | | The accompanying notes are an integral part of these financial statements. | Annual Report | | | TG-17 | |
FRANKLIN TEMPLETON VARIABLE INSURANCE PRODUCTS TRUST
Notes to Financial Statements
Templeton Growth VIP Fund
1. Organization and Significant Accounting Policies
Franklin Templeton Variable Insurance Products Trust (Trust) is registered under the Investment Company Act of 1940 (1940 Act) as an open-end management investment company, consisting of eighteen separate funds and applies the specialized accounting and reporting guidance in U.S. Generally Accepted Accounting Principles (U.S. GAAP). Templeton Growth VIP Fund (Fund) is included in this report. Shares of the Fund are generally sold only to insurance company separate accounts to fund the benefits of variable life insurance policies or variable annuity contracts. The Fund offers three classes of shares: Class
1, Class 2 and Class 4. Each class of shares may differ by its distribution fees, voting rights on matters affecting a single class and its exchange privilege.
The following summarizes the Fund’s significant accounting policies.
a. Financial Instrument Valuation
The Fund’s investments in financial instruments are carried at fair value daily. Fair value is the price that would be received to sell an asset or paid to transfer a liability in an orderly transaction between market participants on the measurement date. The Fund calculates the net asset value (NAV) per share as of 4 p.m. Eastern time each day the New York Stock Exchange (NYSE) is open for trading. Under compliance policies and procedures approved by the Trust’s Board of Trustees (the Board), the Fund’s administrator has responsibility for oversight of valuation, including leading the cross-functional Valuation Committee (VC). The VC provides administration and oversight of the Fund’s valuation policies and procedures, which are approved annually by the Board. Among other things, these procedures allow the Fund to utilize independent pricing services, quotations from securities and financial instrument dealers, and other market sources to determine fair value.
Equity securities listed on an exchange or on the NASDAQ National Market System are valued at the last quoted sale price or the official closing price of the day, respectively. Foreign equity securities are valued as of the close of trading on the foreign stock exchange on which the security is primarily traded, or as of 4 p.m. Eastern time. The value is then converted into its U.S. dollar equivalent at the foreign exchange rate in effect at 4 p.m. Eastern time on the day that the value of the security is determined. Over-the-counter (OTC) securities are
valued within the range of the most recent quoted bid and ask prices. Securities that trade in multiple markets or on multiple exchanges are valued according to the broadest and most representative market. Certain equity securities are valued based upon fundamental characteristics or relationships to similar securities.
Debt securities generally trade in the OTC market rather than on a securities exchange. The Fund’s pricing services use multiple valuation techniques to determine fair value. In instances where sufficient market activity exists, the pricing services may utilize a market-based approach through which quotes from market makers are used to determine fair value. In instances where sufficient market activity may not exist or is limited, the pricing services also utilize proprietary valuation models which may consider market characteristics such as benchmark yield curves, credit spreads, estimated default rates, anticipated market interest rate volatility, coupon rates, anticipated timing of principal repayments, underlying collateral, and other unique security features in order to estimate the relevant cash flows, which are then discounted to calculate the fair value.
Investments in open-end mutual funds are valued at the closing NAV. Investments in time deposits are valued at cost, which approximates fair value.
The Fund has procedures to determine the fair value of financial instruments for which market prices are not reliable or readily available. Under these procedures, the VC convenes on a regular basis to review such financial instruments and considers a number of factors, including significant unobservable valuation inputs, when arriving at fair value. The VC primarily employs a market-based approach which may use related or comparable assets or liabilities, recent transactions, market multiples, book values, and other relevant information for the investment to determine the fair value of the investment. An income-based valuation approach may also be used in which the anticipated future cash flows of the investment are discounted to calculate fair value. Discounts may also be applied due to the nature or duration of any restrictions on the disposition of the investments. Due to the inherent uncertainty of valuations of such investments, the fair values may differ significantly from the values that would have been used had an active market existed. The VC employs various methods for calibrating these valuation approaches including a regular review of key inputs and assumptions, transactional back-testing or disposition analysis, and reviews of any related market activity.
FRANKLIN TEMPLETON VARIABLE INSURANCE PRODUCTS TRUST
NOTES TO FINANCIAL STATEMENTS
Templeton Growth VIP Fund (continued)
Trading in securities on foreign securities stock exchanges and OTC markets may be completed before 4 p.m. Eastern time. In addition, trading in certain foreign markets may not take place on every Fund’s business day. Occasionally, events occur between the time at which trading in a foreign security is completed and 4 p.m. Eastern time that might call into question the reliability of the value of a portfolio security held by the Fund. As a result, differences may arise between the value of the Fund’s portfolio securities as determined at the foreign market close and the latest indications of value at 4 p.m. Eastern time. In order to minimize the potential for these differences, the VC monitors price movements following the close of trading in foreign stock markets through a series of country specific market proxies (such as baskets of American Depositary Receipts, futures contracts and exchange traded funds). These price movements are measured against established trigger thresholds for each specific market proxy to assist in determining if an event has occurred that may call into question the reliability of the values of the foreign securities held by the Fund. If such an event occurs, the securities may be valued using fair value procedures, which may include the use of independent pricing services.
When the last day of the reporting period is a non-business day, certain foreign markets may be open on those days that the Fund’s NAV is not calculated, which could result in differences between the value of the Fund’s portfolio securities on the last business day and the last calendar day of the reporting period. Any significant security valuation changes due to an open foreign market are adjusted and reflected by the Fund for financial reporting purposes.
b. Foreign Currency Translation
Portfolio securities and other assets and liabilities denominated in foreign currencies are translated into U.S. dollars based on the exchange rate of such currencies against U.S. dollars on the date of valuation. The Fund may enter into foreign currency exchange contracts to facilitate transactions denominated in a foreign currency. Purchases and sales of securities, income and expense items denominated in foreign currencies are translated into U.S. dollars at the exchange rate in effect on the transaction date. Portfolio securities and assets and liabilities denominated in foreign currencies contain risks that those currencies will decline in value relative to the U.S. dollar. Occasionally, events may impact the availability or reliability of foreign exchange
rates used to convert the U.S. dollar equivalent value. If such an event occurs, the foreign exchange rate will be valued at fair value using procedures established and approved by the Board.
The Fund does not separately report the effect of changes in foreign exchange rates from changes in market prices on securities held. Such changes are included in net realized and unrealized gain or loss from investments in the Statement of Operations.
Realized foreign exchange gains or losses arise from sales of foreign currencies, currency gains or losses realized between the trade and settlement dates on securities transactions and the difference between the recorded amounts of dividends, interest, and foreign withholding taxes and the U.S. dollar equivalent of the amounts actually received or paid. Net unrealized foreign exchange gains and losses arise from changes in foreign exchange rates on foreign denominated assets and liabilities other than investments in securities held at the end of the reporting period.
c. Securities Lending
The Fund participates in an agency based securities lending program to earn additional income. The Fund receives cash collateral against the loaned securities in an amount equal to at least 102% of the fair value of the loaned securities. Collateral is maintained over the life of the loan in an amount not less than 100% of the fair value of loaned securities, as determined at the close of Fund business each day; any additional collateral required due to changes in security values is delivered to the Fund on the next business day. The collateral is deposited into a joint cash account with other funds and is used to invest in a money market fund managed by Franklin Advisers, Inc., an affiliate of the Fund. The Fund may receive income from the investment of cash collateral, in addition to lending fees and rebates paid by the borrower. Income from securities loaned, net of fees paid to the securities lending agent and/or third-party vendor, is reported separately in the Statement of Operations. The Fund bears the market risk with respect to the collateral investment, securities loaned, and the risk that the agent may default on its obligations to the Fund. If the borrower defaults on its obligation to return the securities loaned, the Fund has the right to repurchase the securities in the open market using the collateral received. The securities lending agent has agreed to indemnify the Fund in the event of default by a third party borrower. At December 31, 2017, the Fund had no securities on loan.
FRANKLIN TEMPLETON VARIABLE INSURANCE PRODUCTS TRUST
NOTES TO FINANCIAL STATEMENTS
Templeton Growth VIP Fund (continued)
1. Organization and Significant Accounting Policies (continued)
d. Income and Deferred Taxes
It is the Fund’s policy to qualify as a regulated investment company under the Internal Revenue Code. The Fund intends to distribute to shareholders substantially all of its taxable income and net realized gains to relieve it from federal income and if applicable, excise taxes. As a result, no provision for U.S. federal income taxes is required.
The Fund may be subject to foreign taxation related to income received, capital gains on the sale of securities and certain foreign currency transactions in the foreign jurisdictions in which it invests. Foreign taxes, if any, are recorded based on the tax regulations and rates that exist in the foreign markets in which the Fund invests. When a capital gain tax is determined to apply, the Fund records an estimated deferred tax liability in an amount that would be payable if the securities were disposed of on the valuation date.
As a result of several court cases, in certain countries across the European Union, the Fund filed additional tax reclaims for previously withheld taxes on dividends earned in those countries (EU reclaims). These additional filings are subject to various administrative proceedings by the local jurisdictions’ tax authorities within the European Union, as well as a number of related judicial proceedings. Income recognized, if any, for EU reclaims is reflected as other income in the Statement of Operations and any related receivable, if any, is reflected as European Union tax reclaims in the Statement of Assets and Liabilities. When uncertainty exists as to the ultimate resolution of these proceedings, the likelihood of receipt of these EU reclaims, and the potential timing of payment, no amounts are reflected in the financial statements. For U.S. income tax purposes, when EU reclaims are received by the Fund and the Fund previously passed foreign tax credit on to its shareholders, the Fund must either amend historic tax reporting to shareholders or enter into a closing agreement with the Internal Revenue Service (IRS) in order to pay the associated tax liability on behalf of the Fund’s shareholders.
The Fund may recognize an income tax liability related to its uncertain tax positions under U.S. GAAP when the uncertain tax position has a less than 50% probability that it will be sustained upon examination by the tax authorities based on its technical merits. As of December 31, 2017, the Fund has determined that no tax liability is required in its financial
statements related to uncertain tax positions for any open tax years (or expected to be taken in future tax years). Open tax years are those that remain subject to examination and are based on the statute of limitations in each jurisdiction in which the Fund invests.
e. Security Transactions, Investment Income, Expenses and Distributions
Security transactions are accounted for on trade date. Realized gains and losses on security transactions are determined on a specific identification basis. Interest income and estimated expenses are accrued daily. Amortization of premium and accretion of discount on debt securities are included in interest income. Dividend income is recorded on the ex-dividend date except for certain dividends from securities where the dividend rate is not available. In such cases, the dividend is recorded as soon as the information is received by the Fund. Distributions to shareholders are recorded on the ex-dividend date. Distributable earnings are determined according to income tax regulations (tax basis) and may differ from earnings recorded in accordance with U.S. GAAP. These differences may be permanent or temporary. Permanent differences are reclassified among capital accounts to reflect their tax character. These reclassifications have no impact on net assets or the results of operations. Temporary differences are not reclassified, as they may reverse in subsequent periods.
Common expenses incurred by the Trust are allocated among the Funds based on the ratio of net assets of each Fund to the combined net assets of the Trust. Fund specific expenses are charged directly to the Fund that incurred the expense.
Realized and unrealized gains and losses and net investment income, excluding class specific expenses, are allocated daily to each class of shares based upon the relative proportion of net assets of each class. Differences in per share distributions by class are generally due to differences in class specific expenses.
f. Accounting Estimates
The preparation of financial statements in accordance with U.S. GAAP requires management to make estimates and assumptions that affect the reported amounts of assets and liabilities at the date of the financial statements and the amounts of income and expenses during the reporting period. Actual results could differ from those estimates.
FRANKLIN TEMPLETON VARIABLE INSURANCE PRODUCTS TRUST
NOTES TO FINANCIAL STATEMENTS
Templeton Growth VIP Fund (continued)
g. Guarantees and Indemnifications
Under the Trust’s organizational documents, its officers and trustees are indemnified by the Trust against certain liabilities arising out of the performance of their duties to the Trust. Additionally, in the normal course of business, the Trust, on behalf of the Fund, enters into contracts with service providers
that contain general indemnification clauses. The Trust’s maximum exposure under these arrangements is unknown as this would involve future claims that may be made against the Trust that have not yet occurred. Currently, the Trust expects the risk of loss to be remote.
2. Shares of Beneficial Interest
At December 31, 2017, there were an unlimited number of shares authorized (without par value). Transactions in the Fund’s shares were as follows:
| | | | | | | | | | | | | | | | | | | | |
| | | Year Ended December 31, | |
| | | 2017 | | | | | | 2016 | |
| | | Shares | | | Amount | | | | | | Shares | | | Amount | |
| | | | | |
| Class 1 Shares: | | | | | | | | | | | | | | | | | | | | |
Shares sold | | | 276,995 | | | $ | 4,131,560 | | | | | | | | 110,663 | | | $ | 1,440,832 | |
Shares issued in reinvestment of distributions | | | 578,684 | | | | 8,645,537 | | | | | | | | 2,252,375 | | | | 27,546,543 | |
Shares redeemed | | | (4,745,568 | ) | | | (72,525,026 | ) | | | | | | | (4,377,350 | ) | | | (58,277,872 | ) |
| | | | |
Net increase (decrease) | | | (3,889,889 | ) | | $ | (59,747,929 | ) | | | | | | | (2,014,312 | ) | | $ | (29,290,497 | ) |
| | | | |
| Class 2 Shares: | | | | | | | | | | | | | | | | | | | | |
Shares sold | | | 1,016,363 | | | $ | 15,049,406 | | | | | | | | 3,935,051 | | | $ | 50,119,612 | |
Shares issued in reinvestment of distributions | | | 980,324 | | | | 14,420,565 | | | | | | | | 4,262,336 | | | | 51,361,152 | |
Shares redeemed | | | (10,869,278 | ) | | | (161,953,362 | ) | | | | | | | (13,462,698 | ) | | | (172,747,333 | ) |
| | | | |
Net increase (decrease) | | | (8,872,591 | ) | | $ | (132,483,391 | ) | | | | | | | (5,265,311 | ) | | $ | (71,266,569 | ) |
| | | | |
| Class 4 Shares: | | | | | | | | | | | | | | | | | | | | |
Shares sold | | | 26,043 | | | $ | 392,232 | | | | | | | | 280,303 | | | $ | 3,402,727 | |
Shares issued in reinvestment of distributions | | | 40,845 | | | | 607,359 | | | | | | | | 213,961 | | | | 2,603,908 | |
Shares redeemed | | | (791,302 | ) | | | (11,909,831 | ) | | | | | | | (920,832 | ) | | | (12,080,057 | ) |
| | | | |
Net increase (decrease) | | | (724,414 | ) | | $ | (10,910,240 | ) | | | | | | | (426,568 | ) | | $ | (6,073,422 | ) |
| | | | |
3. Transactions with Affiliates
Franklin Resources, Inc. is the holding company for various subsidiaries that together are referred to as Franklin Templeton Investments. Certain officers and trustees of the Fund are also officers and/or directors of the following subsidiaries:
| | |
| Subsidiary | | Affiliation |
Templeton Global Advisors Limited (TGAL) | | Investment manager |
Franklin Templeton Services, LLC (FT Services) | | Administrative manager |
Franklin Templeton Distributors, Inc. (Distributors) | | Principal underwriter |
Franklin Templeton Investor Services, LLC (Investor Services) | | Transfer agent |
FRANKLIN TEMPLETON VARIABLE INSURANCE PRODUCTS TRUST
NOTES TO FINANCIAL STATEMENTS
Templeton Growth VIP Fund (continued)
3. Transactions with Affiliates (continued)
a. Management Fees
The Fund pays an investment management fee to TGAL based on the average daily net assets of the Fund as follows:
| | |
| Annualized Fee Rate | | Net Assets |
1.000% | | Up to and including $100 million |
0.900% | | Over $100 million, up to and including $250 million |
0.800% | | Over $250 million, up to and including $500 million |
0.750% | | Over $500 million, up to and including $1 billion |
0.700% | | Over $1 billion, up to and including $5 billion |
0.675% | | Over $5 billion, up to and including $10 billion |
0.655% | | Over $10 billion, up to and including $15 billion |
0.635% | | Over $15 billion, up to and including $20 billion |
0.615% | | In excess of $20 billion |
For the year ended December 31, 2017, the gross effective investment management fee rate was 0.779% of the Fund’s average daily net assets.
b. Administrative Fees
Under an agreement with TGAL, FT Services provides administrative services to the Fund. The fee is paid by TGAL based on the Fund’s average daily net assets, and is not an additional expense of the Fund.
c. Distribution Fees
The Board has adopted distribution plans for Class 2 and Class 4 shares pursuant to Rule 12b-1 under the 1940 Act. Under the Fund’s compensation distribution plans, the Fund pays Distributors for costs incurred in connection with the servicing, sale and distribution of the Fund’s shares up to 0.35% per year of its average daily net assets of each class. The Board has agreed to limit the current rate to 0.25% per year for Class 2. The plan year, for purposes of monitoring compliance with the maximum annual plan rates, is February 1 through January 31.
d. Transfer Agent Fees
Investor Services, under terms of an agreement, performs shareholder servicing for the Fund and is not paid by the Fund for the services.
FRANKLIN TEMPLETON VARIABLE INSURANCE PRODUCTS TRUST
NOTES TO FINANCIAL STATEMENTS
Templeton Growth VIP Fund (continued)
e. Investments in Affiliated Management Investment Companies
The Fund invests in one or more affiliated management investment companies for purposes other than exercising a controlling influence over the management or policies. Management fees paid by the Fund are waived on assets invested in the affiliated management investment companies, as noted in the Statement of Operations, in an amount not to exceed the management and administrative fees paid directly or indirectly by each affiliate. During the year ended December 31, 2017, the Fund held investments in affiliated management investment companies as follows:
| | | | | | | | | | | | | | | | | | | | | | | | | | | | | | | | |
| | | Number of Shares Held at Beginning of Year | | | Gross Additions | | | Gross Reductions | | | Number of Shares Held at End of Year | | | Value at End of Year | | | Dividend Income | | | Realized Gain (Loss) | | | Net Change in Unrealized Appreciation (Depreciation) | |
| Non-Controlled Affiliates | | | | | | | | | | | | | | | | | | | | | | | | | | | | | | | | |
Institutional Fiduciary Trust Money Market Portfolio, 0.89% | | | — | | | | 314,569,031 | | | | (314,569,031 | ) | | | — | | | $ | — | | | $ | — | | | $ | — | | | $ | — | |
| | | | | | | | | | | | | | | | | | | | |
f. Other Affiliated Transactions
At December 31, 2017, Franklin Templeton Variable Insurance Products Trust—Franklin Founding Funds Allocation VIP Fund owned 24.0% of the Fund’s outstanding shares.
4. Expense Offset Arrangement
The Fund has entered into an arrangement with its custodian whereby credits realized as a result of uninvested cash balances are used to reduce a portion of the Fund’s custodian expenses. During the year ended December 31, 2017, the custodian fees were reduced as noted in the Statement of Operations.
5. Income Taxes
For tax purposes, capital losses may be carried over to offset future capital gains. Capital loss carryforwards with no expiration, if any, must be fully utilized before those losses with expiration dates. During the year ended December 31, 2017, the Fund utilized $11,293,392 of capital loss carryforwards.
The tax character of distributions paid during the years ended December 31, 2017 and 2016, was as follows:
| | | | | | | | |
| | | 2017 | | | 2016 | |
Distributions paid from: | | | | | | | | |
Ordinary income | | $ | 23,673,461 | | | $ | 28,757,144 | |
Long term capital gain | | | — | | | | 52,754,459 | |
| | | | |
| | $ | 23,673,461 | | | $ | 81,511,603 | |
| | | | |
FRANKLIN TEMPLETON VARIABLE INSURANCE PRODUCTS TRUST
NOTES TO FINANCIAL STATEMENTS
Templeton Growth VIP Fund (continued)
5. Income Taxes (continued)
At December 31, 2017, the cost of investments, net unrealized appreciation (depreciation), undistributed ordinary income and undistributed long term capital gains for income tax purposes were as follows:
| | | | |
Cost of investments | | $ | 1,096,496,035 | |
| | | | |
Unrealized appreciation | | $ | 361,728,190 | |
Unrealized depreciation | | | (76,423,665 | ) |
| | | | |
Net unrealized appreciation (depreciation) | | $ | 285,304,525 | |
| | | | |
Undistributed ordinary income | | $ | 33,708,345 | |
Undistributed long term capital gains | | | 96,717,497 | |
| | | | |
Distributable earnings | | $ | 130,425,842 | |
| | | | |
Differences between income and/or capital gains as determined on a book basis and a tax basis are primarily due to differing treatments of EU reclaims and foreign capital gains tax.
6. Investment Transactions
Purchases and sales of investments (excluding short term securities) for the year ended December 31, 2017, aggregated $359,195,266 and $507,601,632, respectively.
7. Concentration of Risk
Investing in foreign securities may include certain risks and considerations not typically associated with investing in U.S. securities, such as fluctuating currency values and changing local and regional economic, political and social conditions, which may result in greater market volatility. In addition, certain foreign securities may not be as liquid as U.S. securities.
8. Credit Facility
The Fund, together with other U.S. registered and foreign investment funds (collectively, Borrowers), managed by Franklin Templeton Investments, are borrowers in a joint syndicated senior unsecured credit facility totaling $2 billion (Global Credit Facility) which matured on February 9, 2018. This Global Credit Facility provides a source of funds to the Borrowers for temporary and emergency purposes, including the ability to meet future unanticipated or unusually large redemption requests. Effective February 9, 2018, the Borrowers renewed the Global Credit Facility for a one year term, maturing February 8, 2019, for a total of $2 billion.
Under the terms of the Global Credit Facility, the Fund shall, in addition to interest charged on any borrowings made by the Fund and other costs incurred by the Fund, pay its share of fees and expenses incurred in connection with the implementation and maintenance of the Global Credit Facility, based upon its relative share of the aggregate net assets of all of the Borrowers, including an annual commitment fee of 0.15% based upon the unused portion of the Global Credit Facility. These fees are reflected in other expenses in the Statement of Operations. During the year ended December 31, 2017, the Fund did not use the Global Credit Facility.
FRANKLIN TEMPLETON VARIABLE INSURANCE PRODUCTS TRUST
NOTES TO FINANCIAL STATEMENTS
Templeton Growth VIP Fund (continued)
9. Fair Value Measurements
The Fund follows a fair value hierarchy that distinguishes between market data obtained from independent sources (observable inputs) and the Fund’s own market assumptions (unobservable inputs). These inputs are used in determining the value of the Fund’s financial instruments and are summarized in the following fair value hierarchy:
| | • | | Level 1 – quoted prices in active markets for identical financial instruments |
| | • | | Level 2 – other significant observable inputs (including quoted prices for similar financial instruments, interest rates, prepayment speed, credit risk, etc.) |
| | • | | Level 3 – significant unobservable inputs (including the Fund’s own assumptions in determining the fair value of financial instruments) |
The input levels are not necessarily an indication of the risk or liquidity associated with financial instruments at that level.
For movements between the levels within the fair value hierarchy, the Fund has adopted a policy of recognizing the transfers as of the date of the underlying event which caused the movement.
A summary of inputs used as of December 31, 2017, in valuing the Fund’s assets carried at fair value, is as follows:
| | | | | | | | | | | | | | | | |
| | | Level 1 | | | Level 2 | | | Level 3 | | | Total | |
| | | | |
| Assets: | | | | | | | | | | | | | | | | |
Investments in Securities:a | | | | | | | | | | | | | | | | |
Equity Investments | | $ | 1,363,538,887 | | | $ | — | | | $ | — | | | $ | 1,363,538,887 | |
Corporate Bonds | | | — | | | | 7,461,673 | | | | — | | | | 7,461,673 | |
Short Term Investments | | | — | | | | 10,800,000 | | | | — | | | | 10,800,000 | |
| | | | |
Total Investments in Securities | | $ | 1,363,538,887 | | | $ | 18,261,673 | | | $ | — | | | $ | 1,381,800,560 | |
| | | | |
aFor detailed categories, see the accompanying Statement of Investments.
10. Subsequent Events
The Fund has evaluated subsequent events through the issuance of the financial statements and determined that no events have occurred that require disclosure other than those already disclosed in the financial statements.
Abbreviations
| | |
| Selected Portfolio |
| |
| ADR | | American Depositary Receipt |
| |
| IDR | | International Depositary Receipt |
| |
| NVDR | | Non-Voting Depositary Receipt |
FRANKLIN TEMPLETON VARIABLE INSURANCE PRODUCTS TRUST
Report of Independent Registered Public Accounting Firm
To the Board of Trustees and Shareholders of Franklin Templeton Variable Insurance Products Trust and Sharholders of Templeton Growth VIP Fund
Opinion on the Financial Statements
We have audited the accompanying statement of assets and liabilities, including the statement of investments, of Templeton Growth VIP Fund (the “Fund”) as of December 31, 2017, the related statement of operations for the year ended December 31, 2017, the statement of changes in net assets for each of the two years in the period ended December 31, 2017, including the related notes, and the financial highlights for each of the five years in the period ended December 31, 2017 (collectively referred to as the “financial statements”). In our opinion, the financial statements present fairly, in all material respects, the financial position of the Fund as of December 31, 2017, the results of its operations for the year then ended, the changes in its net assets for each of the two years in the period ended December 31, 2017 and the financial highlights for each of the five years in the period ended December 31, 2017 in conformity with accounting principles generally accepted in the United States of America.
Basis for Opinion
These financial statements are the responsibility of the Fund’s management. Our responsibility is to express an opinion on the Fund’s financial statements based on our audits. We are a public accounting firm registered with the Public Company Accounting Oversight Board (United States) (“PCAOB”) and are required to be independent with respect to the Fund in accordance with the U.S. federal securities laws and the applicable rules and regulations of the Securities and Exchange Commission and the PCAOB.
We conducted our audits of these financial statements in accordance with the standards of the PCAOB. Those standards require that we plan and perform the audit to obtain reasonable assurance about whether the financial statements are free of material misstatement, whether due to error or fraud.
Our audits included performing procedures to assess the risks of material misstatement of the financial statements, whether due to error or fraud, and performing procedures that respond to those risks. Such procedures included examining, on a test basis, evidence regarding the amounts and disclosures in the financial statements. Our audits also included evaluating the accounting principles used and significant estimates made by management, as well as evaluating the overall presentation of the financial statements. Our procedures included confirmation of securities owned as of December 31, 2017 by correspondence with the custodian and brokers; when replies were not received from brokers, we performed other auditing procedures. We believe that our audits provide a reasonable basis for our opinion.
PricewaterhouseCoopers LLP
San Francisco, California
February 15, 2018
We have served as the auditor of one or more investment companies in the Franklin Templeton Group of Funds since 1948.
FRANKLIN TEMPLETON VARIABLE INSURANCE PRODUCTS TRUST
Tax Information (unaudited)
Templeton Growth VIP Fund
Under Section 854(b)(1)(A) of the Internal Revenue Code (Code), the Fund hereby reports 35.62% of the ordinary income dividends as income qualifying for the dividends received deduction for the fiscal year ended December 31, 2017.
At December 31, 2017, more than 50% of the Fund’s total assets were invested in securities of foreign issuers. In most instances, foreign taxes were withheld from income paid to the Fund on these investments. The Fund elects to treat foreign taxes paid as allowed under Section 853 of the Code. This election will allow shareholders of record as of the 2018 distribution date, to treat their proportionate share of foreign taxes paid by the Fund as having been paid directly by them. The shareholder shall consider these amounts as foreign taxes paid in the tax year in which they receive the Fund distribution.
This page intentionally left blank.
FRANKLIN TEMPLETON VARIABLE INSURANCE PRODUCTS TRUST
Index Descriptions
The indexes are unmanaged and include reinvestment of any income or distributions. They do not reflect any fees, expenses or sales charges.
For Russell Indexes: Frank Russell Company is the source and owner of the trademarks, service marks and copyrights related to the Russell Indexes. Russell® is a trademark of Frank Russell Company.
See www.franklintempletondatasources.com for additional data provider information.
Bloomberg Barclays US Aggregate Bond Index is a market capitalization-weighted index representing the US investment-grade, fixed-rate, taxable bond market with index components for government and corporate, mortgage pass-through and asset-backed securities. All issues included are SEC registered, taxable, dollar denominated and nonconvertible, must have at least one year to final maturity and must be rated investment grade (Baa3/BBB-/BBB- or higher) using the middle rating of Moody’s, Standard & Poor’s and Fitch, respectively.
Bloomberg Barclays US Government Index: Intermediate Component is the intermediate component of the Barclays US Government Index, which includes public obligations of the US Treasury with at least one year to final maturity and publicly issued debt of US government agencies, quasi-federal corporations, and corporate or foreign debt guaranteed by the US government.
Citigroup World Government Bond Index is a market capitalization-weighted index consisting of investment-grade world government bond markets.
Consumer Price Index (CPI) is a commonly used measure of the inflation rate.
FTSE® EPRA®/NAREIT® Developed Index is a free float-adjusted index designed to measure the performance of publicly traded real estate securities in the North American, European and Asian real estate markets.
J.P. Morgan (JPM) Global Government Bond Index (GGBI) tracks total returns for liquid, fixed-rate, domestic government bonds with maturities greater than one year issued by developed countries globally.
Lipper Multi-Sector Income Funds Classification Average is calculated by averaging the total returns of all funds within the Lipper Multi-Sector Income Funds Classification in the Lipper Open-End underlying funds universe. Lipper Multi-Sector Income Funds are defined as funds that seek current income by allocation of assets among different fixed income securities sectors (not primarily in one sector except for defensive purposes), including US and foreign governments, with a significant portion rated below investment grade. For the 12-month period ended 12/31/17, there were 316 funds in this category. Lipper calculations do not include contract fees, expenses or sales charges, and may have been different if such charges had been considered.
Lipper VIP Equity Income Funds Classification Average is an equally weighted average calculation of performance figures for all funds within the Lipper Equity Income Funds classification in the Lipper VIP underlying funds universe. Lipper Equity Income Funds seek relatively high current income and growth of income through investing 60% or more of their portfolios in equities. For the 12-month period ended 12/31/17, there were 75 funds in this category. Lipper calculations do not include contract fees, expenses or sales charges, and may have been different if such charges had been considered.
Lipper VIP General US Government Funds Classification Average is an equally weighted average calculation of performance figures for all funds within the Lipper General US Government Funds classification in the Lipper VIP underlying funds universe. Lipper General US Government Funds invest primarily in US government and agency issues. For the 12-month period ended 12/31/17, there were 56 funds in this category. Lipper calculations do not include contract fees, expenses or sales charges, and may have been different if such charges had been considered.
MSCI All Country World Index (ACWI) is a free float-adjusted, market capitalization-weighted index designed to measure equity market performance in global developed and emerging markets.
MSCI All Country World Index (ACWI) ex USA Index captures large- and mid-capitalization representation across 22 of 23 developed markets countries (excluding the US) and 23 emerging markets countries. The index covers approximately 85% of the global equity opportunity set outside the US.
FRANKLIN TEMPLETON VARIABLE INSURANCE PRODUCTS TRUST
Index Descriptions
MSCI Emerging Markets (EM) Index is a free float-adjusted, market capitalization-weighted index designed to measure equity market performance in global emerging markets.
MSCI Frontier Markets Index is a free float-adjusted, market capitalization-weighted index designed to measure equity market performance in frontier markets.
MSCI World Index is a free float-adjusted, market capitalization-weighted index designed to measure equity market performance in global developed markets.
Russell 1000® Growth Index is market capitalization weighted and measures performance of those Russell 1000® Index companies with higher price-to-book ratios and higher forecasted growth values.
Russell 1000® Index is market capitalization weighted and measures performance of the largest companies in the Russell 3000® Index, which represents the majority of the U.S. market’s total capitalization.
Russell 1000® Value Index is market capitalization weighted and measures performance of those Russell 1000® Index companies with lower price-to-book ratios and lower forecasted growth values.
Russell 2000® Index is market capitalization weighted and measures performance of the 2,000 smallest companies in the Russell 3000® Index, which represent a small amount of the total market capitalization of the Russell 3000® Index.
Russell 2000® Value Index is market capitalization weighted and measures performance of those Russell 2000® Index companies with lower price-to-book ratios and lower forecasted growth values.
Russell 2500TM Index is market capitalization weighted and measures performance of the smallest companies in the Russell 3000® Index, which represent a modest amount of the Russell 3000® Index’s total market capitalization.
Russell 3000® Growth Index is market capitalization weighted and measures performance of those Russell 3000® Index companies with higher price-to-book ratios and higher forecasted growth values.
Russell Midcap® Growth Index is market capitalization weighted and measures performance of those Russell Midcap® Index companies with higher price-to-book ratios and higher forecasted growth values.
Russell Midcap® Index is market capitalization weighted and measures performance of the smallest companies in the Russell 1000® Index, which represents a modest amount of the Russell 1000® Index’s total market capitalization.
Standard & Poor’s® 500 Index (S&P 500®) is a market capitalization-weighted index of 500 stocks designed to measure total US equity market performance.
Standard & Poor’s®/International Finance Corporation Investable (S&P/IFCI) Composite Index is a free float-adjusted, market capitalization-weighted index designed to measure equity performance in global emerging markets.
FRANKLIN TEMPLETON VARIABLE INSURANCE PRODUCTS TRUST
Special Meeting of Shareholders
MEETING OF SHAREHOLDERS: OCTOBER 30, 2017
(UNAUDITED)
A Special Meeting of Shareholders of Franklin Templeton Variable Insurance Products Trust was held at the offices of Franklin Templeton Investments, One Franklin Parkway, San Mateo, California on October 30, 2017. The purpose of the meeting was to elect Trustees of Franklin Templeton Variable Insurance Products Trust and to vote on the following proposals: for each of the Funds, except Franklin Founding Funds Allocation VIP Fund and Franklin VolSmart Allocation VIP Fund, to approve the use of a “manager of managers” structure whereby the Fund’s investment manager would be able to hire and replace subadvisers without shareholder approval; for Franklin Rising Dividends VIP Fund, to approve a new Investment Management Agreement with Franklin Advisers, Inc.; for Templeton Developing Markets VIP Fund, to approve a new Subadvisory Agreement with Franklin Templeton Investment Management Limited; and for each of the Funds, to approve an amended fundamental investment restriction regarding investments in commodities. At the meeting, (i) the following persons were elected by the shareholders to serve as Trustees of Franklin Templeton Variable Insurance Products Trust: Harris J. Ashton, Terrence J. Checki, Mary C. Choksi, Edith E. Holiday, Gregory E. Johnson, Rupert H. Johnson, Jr., J. Michael Luttig, Larry D. Thompson, and John B. Wilson; and (ii) all other proposals voted on were approved by shareholders. No other business was transacted at the meeting.
The results of the voting at the meeting are as follows:
| Proposal 1. | To elect a Board of Trustees: |
| | | | | | | | |
| Name | | For | | | Withheld | |
Harris J. Ashton | | | 1,483,931,005 | | | | 63,700,507 | |
Terrence J. Checki | | | 1,487,851,289 | | | | 59,780,222 | |
Mary C. Choksi | | | 1,487,649,087 | | | | 59,982,424 | |
Edith E. Holiday | | | 1,487,786,345 | | | | 59,845,166 | |
Gregory E. Johnson | | | 1,490,898,162 | | | | 56,733,349 | |
Rupert H. Johnson, Jr. | | | 1,485,176,267 | | | | 62,455,244 | |
J. Michael Luttig | | | 1,488,062,993 | | | | 59,568,519 | |
Larry D. Thompson | | | 1,486,098,183 | | | | 61,533,328 | |
John B. Wilson | | | 1,489,011,786 | | | | 58,619,724 | |
Total Trust Shares Outstanding*: 1,598,054,299
| Proposal 2. | To approve the use of a “manager of managers” structure whereby the Fund’s investment manager would be able to hire and replace subadvisers without shareholder approval: |
Franklin Flex Cap Growth VIP Fund
| | | | |
| | | Shares | |
For | | | 13,749,224 | |
Against | | | 879,952 | |
Abstain | | | 1,118,404 | |
Total Fund Shares Voted | | | 15,747,580 | |
Total Fund Outstanding Shares* | | | 15,802,049 | |
FRANKLIN TEMPLETON VARIABLE INSURANCE PRODUCTS TRUST
SPECIAL MEETING OF SHAREHOLDERS
| | | | |
| Franklin Rising Dividends VIP Fund | | | | |
| |
| | | Shares | |
For | | | 58,234,322 | |
Against | | | 5,102,328 | |
Abstain | | | 3,925,714 | |
Total Fund Shares Voted | | | 67,262,364 | |
Total Fund Outstanding Shares* | | | 69,031,623 | |
| |
| Franklin Small-Mid Cap Growth VIP Fund | | | | |
| |
| | | Shares | |
For | | | 23,115,445 | |
Against | | | 2,258,073 | |
Abstain | | | 1,396,522 | |
Total Fund Shares Voted | | | 26,770,040 | |
Total Fund Outstanding Shares* | | | 27,311,145 | |
| |
| Franklin Small Cap Value VIP Fund | | | | |
| |
| | | Shares | |
For | | | 53,566,894 | |
Against | | | 4,789,585 | |
Abstain | | | 3,897,280 | |
Total Fund Shares Voted | | | 62,253,759 | |
Total Fund Outstanding Shares* | | | 73,514,199 | |
| |
| Franklin Strategic Income VIP Fund | | | | |
| |
| | | Shares | |
For | | | 50,927,089 | |
Against | | | 5,281,784 | |
Abstain | | | 3,535,384 | |
Total Fund Shares Voted | | | 59,744,257 | |
Total Fund Outstanding Shares* | | | 60,841,388 | |
| |
| Franklin U.S. Government Securities VIP Fund | | | | |
| |
| | | Shares | |
For | | | 89,132,433 | |
Against | | | 7,353,649 | |
Abstain | | | 6,346,786 | |
Total Fund Shares Voted | | | 102,832,867 | |
Total Fund Outstanding Shares* | | | 109,725,751 | |
| |
| Franklin Mutual Global Discovery VIP Fund | | | | |
| |
| | | Shares | |
For | | | 27,411,088 | |
Against | | | 2,091,298 | |
Abstain | | | 2,391,763 | |
Total Fund Shares Voted | | | 31,894,149 | |
Total Fund Outstanding Shares* | | | 32,602,413 | |
FRANKLIN TEMPLETON VARIABLE INSURANCE PRODUCTS TRUST
SPECIAL MEETING OF SHAREHOLDERS
| | | | |
| Franklin Mutual Shares VIP Fund | | | | |
| |
| | | Shares | |
For | | | 173,288,690 | |
Against | | | 16,123,033 | |
Abstain | | | 11,727,399 | |
Total Fund Shares Voted | | | 201,139,121 | |
Total Fund Outstanding Shares* | | | 201,829,901 | |
| |
| Templeton Developing Markets VIP Fund | | | | |
| |
| | | Shares | |
For | | | 33,445,421 | |
Against | | | 2,083,042 | |
Abstain | | | 1,602,155 | |
Total Fund Shares Voted | | | 37,130,617 | |
Total Fund Outstanding Shares* | | | 38,665,160 | |
| |
| Templeton Foreign VIP Fund | | | | |
| |
| | | Shares | |
For | | | 90,056,367 | |
Against | | | 6,884,702 | |
Abstain | | | 5,875,891 | |
Total Fund Shares Voted | | | 102,816,960 | |
Total Fund Outstanding Shares* | | | 113,425,059 | |
| |
| Templeton Global Bond VIP Fund | | | | |
| |
| | | Shares | |
For | | | 153,662,270 | |
Against | | | 14,159,085 | |
Abstain | | | 9,838,114 | |
Total Fund Shares Voted | | | 177,659,469 | |
Total Fund Outstanding Shares* | | | 188,040,251 | |
| |
| Templeton Growth VIP Fund | | | | |
| |
| | | Shares | |
For | | | 77,388,057 | |
Against | | | 7,366,622 | |
Abstain | | | 5,511,620 | |
Total Fund Shares Voted | | | 90,266,300 | |
Total Fund Outstanding Shares* | | | 91,604,126 | |
| |
| Franklin Growth and Income VIP Fund | | | | |
| |
| | | Shares | |
For | | | 6,587,641 | |
Against | | | 468,056 | |
Abstain | | | 110,295 | |
Total Fund Shares Voted | | | 7,165,992 | |
Total Fund Outstanding Shares* | | | 7,208,893 | |
FRANKLIN TEMPLETON VARIABLE INSURANCE PRODUCTS TRUST
SPECIAL MEETING OF SHAREHOLDERS
| | | | |
| Franklin Income VIP Fund | | | | |
| |
| | | Shares | |
For | | | 331,527,467 | |
Against | | | 31,877,033 | |
Abstain | | | 26,008,222 | |
Total Fund Shares Voted | | | 389,412,722 | |
Total Fund Outstanding Shares* | | | 392,023,197 | |
| |
| Franklin Large Cap Growth VIP Fund | | | | |
| |
| | | Shares | |
For | | | 5,389,158 | |
Against | | | 481,087 | |
Abstain | | | 485,968 | |
Total Fund Shares Voted | | | 6,356,213 | |
Total Fund Outstanding Shares* | | | 6,415,938 | |
| |
| Franklin Global Real Estate VIP Fund | | | | |
| |
| | | Shares | |
For | | | 10,375,756 | |
Against | | | 709,592 | |
Abstain | | | 684,561 | |
Total Fund Shares Voted | | | 11,769,909 | |
Total Fund Outstanding Shares* | | | 11,847,583 | |
| Proposal 3. | To approve a new Investment Management Agreement with Franklin Advisers, Inc: |
| | | | |
| Franklin Rising Dividends VIP Fund | | | | |
| |
| | | Shares | |
For | | | 61,230,619 | |
Against | | | 1,892,274 | |
Abstain | | | 4,139,471 | |
Total Fund Shares Voted | | | 67,262,364 | |
Total Fund Shares Outstanding* | | | 69,031,623 | |
| Proposal 4. | To approve a new Subadvisory Agreement with Franklin Templeton Investment Management Limited: |
| | | | |
| Templeton Developing Markets VIP Fund | | | | |
| |
| | | Shares | |
For | | | 34,067,321 | |
Against | | | 1,503,503 | |
Abstain | | | 1,559,793 | |
Total Fund Shares Voted | | | 37,130,617 | |
Total Fund Shares Outstanding* | | | 38,665,160 | |
FRANKLIN TEMPLETON VARIABLE INSURANCE PRODUCTS TRUST
SPECIAL MEETING OF SHAREHOLDERS
| Proposal 5. | To approve an amended fundamental investment restriction regarding investments in commodities: |
| | | | |
| Franklin Flex Cap Growth VIP Fund | | | | |
| |
| | | Shares | |
For | | | 13,865,526 | |
Against | | | 747,561 | |
Abstain | | | 1,134,493 | |
Total Fund Shares Voted | | | 15,747,580 | |
Total Fund Outstanding Shares* | | | 15,802,049 | |
| |
| Franklin Rising Dividends VIP Fund | | | | |
| |
| | | Shares | |
For | | | 59,751,082 | |
Against | | | 2,758,376 | |
Abstain | | | 4,752,906 | |
Total Fund Shares Voted | | | 67,262,364 | |
Total Fund Outstanding Shares* | | | 69,031,623 | |
| |
| Franklin Small-Mid Cap Growth VIP Fund | | | | |
| |
| | | Shares | |
For | | | 23,646,532 | |
Against | | | 1,565,814 | |
Abstain | | | 1,557,694 | |
Total Fund Shares Voted | | | 26,770,040 | |
Total Fund Outstanding Shares* | | | 27,311,145 | |
| |
| Franklin Small Cap Value VIP Fund | | | | |
| |
| | | Shares | |
For | | | 54,478,087 | |
Against | | | 3,057,279 | |
Abstain | | | 4,718,393 | |
Total Fund Shares Voted | | | 62,253,759 | |
Total Fund Outstanding Shares* | | | 73,514,199 | |
| |
| Franklin Strategic Income VIP Fund | | | | |
| |
| | | Shares | |
For | | | 52,089,907 | |
Against | | | 3,535,016 | |
Abstain | | | 4,119,335 | |
Total Fund Shares Voted | | | 59,744,257 | |
Total Fund Outstanding Shares* | | | 60,841,388 | |
FRANKLIN TEMPLETON VARIABLE INSURANCE PRODUCTS TRUST
SPECIAL MEETING OF SHAREHOLDERS
| | | | |
| Franklin U.S. Government Securities VIP Fund | | | | |
| |
| | | Shares | |
For | | | 90,516,652 | |
Against | | | 4,962,770 | |
Abstain | | | 7,353,445 | |
Total Fund Shares Voted | | | 102,832,867 | |
Total Fund Outstanding Shares* | | | 109,725,751 | |
|
| Franklin Mutual Global Discovery VIP Fund | |
| |
| | | Shares | |
For | | | 28,033,432 | |
Against | | | 1,252,638 | |
Abstain | | | 2,608,079 | |
Total Fund Shares Voted | | | 31,894,149 | |
Total Fund Outstanding Shares* | | | 32,602,413 | |
| |
| Franklin Mutual Shares VIP Fund | | | | |
| |
| | | Shares | |
For | | | 177,273,923 | |
Against | | | 10,129,961 | |
Abstain | | | 13,735,237 | |
Total Fund Shares Voted | | | 201,139,121 | |
Total Fund Outstanding Shares* | | | 201,829,901 | |
| |
| Templeton Developing Markets VIP Fund | | | | |
| |
| | | Shares | |
For | | | 34,011,236 | |
Against | | | 1,427,546 | |
Abstain | | | 1,691,835 | |
Total Fund Shares Voted | | | 37,130,617 | |
Total Fund Outstanding Shares* | | | 38,665,160 | |
| |
| Templeton Foreign VIP Fund | | | | |
| |
| | | Shares | |
For | | | 91,743,616 | |
Against | | | 4,425,178 | |
Abstain | | | 6,648,165 | |
Total Fund Shares Voted | | | 102,816,960 | |
Total Fund Outstanding Shares* | | | 113,425,059 | |
| |
| Templeton Global Bond VIP Fund | | | | |
| |
| | | Shares | |
For | | | 157,121,313 | |
Against | | | 8,459,106 | |
Abstain | | | 12,079,050 | |
Total Fund Shares Voted | | | 177,659,469 | |
Total Fund Outstanding Shares* | | | 188,040,251 | |
FRANKLIN TEMPLETON VARIABLE INSURANCE PRODUCTS TRUST
SPECIAL MEETING OF SHAREHOLDERS
| | | | |
| Templeton Growth VIP Fund | |
| |
| | | Shares | |
For | | | 79,782,773 | |
Against | | | 4,136,520 | |
Abstain | | | 6,347,006 | |
Total Fund Shares Voted | | | 90,266,300 | |
Total Fund Outstanding Shares* | | | 91,604,126 | |
|
| Franklin Growth and Income VIP Fund | |
| |
| | | Shares | |
For | | | 6,699,033 | |
Against | | | 291,508 | |
Abstain | | | 175,451 | |
Total Fund Shares Voted | | | 7,165,992 | |
Total Fund Outstanding Shares* | | | 7,208,893 | |
|
| Franklin Income VIP Fund | |
| |
| | | Shares | |
For | | | 338,299,973 | |
Against | | | 18,075,707 | |
Abstain | | | 33,037,042 | |
Total Fund Shares Voted | | | 389,412,722 | |
Total Fund Outstanding Shares* | | | 392,023,197 | |
|
| Franklin Large Cap Growth VIP Fund | |
| |
| | | Shares | |
For | | | 5,515,296 | |
Against | | | 284,582 | |
Abstain | | | 556,334 | |
Total Fund Shares Voted | | | 6,356,213 | |
Total Fund Outstanding Shares* | | | 6,415,938 | |
|
| Franklin Global Real Estate VIP Fund | |
| |
| | | Shares | |
For | | | 10,531,666 | |
Against | | | 347,186 | |
Abstain | | | 891,057 | |
Total Fund Shares Voted | | | 11,769,909 | |
Total Fund Outstanding Shares* | | | 11,847,583 | |
|
| Franklin Founding Funds Allocation VIP Fund | |
| |
| | | Shares | |
For | | | 122,854,798 | |
Against | | | 4,270,018 | |
Abstain | | | 14,343,426 | |
Total Fund Shares Voted | | | 141,468,242 | |
Total Fund Outstanding Shares* | | | 142,224,672 | |
FRANKLIN TEMPLETON VARIABLE INSURANCE PRODUCTS TRUST
SPECIAL MEETING OF SHAREHOLDERS
| | | | |
| Franklin VolSmart Allocation VIP Fund | |
| |
| | | Shares | |
For | | | 13,979,495 | |
Against | | | 469,722 | |
Abstain | | | 1,491,733 | |
Total Fund Shares Voted | | | 15,940,951 | |
Total Fund Outstanding Shares* | | | 15,940,951 | |
FRANKLIN TEMPLETON VARIABLE INSURANCE PRODUCTS TRUST
Board Members and Officers
The name, year of birth and address of the officers and board members, as well as their affiliations, positions held with the Trust, principal occupations during at least the past five years and number of US registered portfolios overseen in the Franklin Templeton Investments fund complex, are shown below. Generally, each board member serves until that person’s successor is elected and qualified.
Independent Board Members
| | | | | | | | |
Name, Year of Birth and Address | | Position | | Length of Time Served | | Number of Portfolios in Fund Complex Overseen by Board Member* | | Other Directorships Held During at Least the Past 5 Years |
| | | | |
Harris J. Ashton (1932) One Franklin Parkway San Mateo, CA 94403-1906 | | Trustee | | Since 1988 | | 139 | | Bar-S Foods (meat packing company) (1981-2010). |
|
| Principal Occupation During at Least the Past 5 Years: |
| Director of various companies; and formerly, Director, RBC Holdings, Inc. (bank holding company) (until 2002); and President, Chief Executive Officer and Chairman of the Board, General Host Corporation (nursery and craft centers) (until 1998). |
| | | | |
Terrence J. Checki (1945) One Franklin Parkway San Mateo, CA 94403-1906 | | Trustee | | Since October 2017 | | 113 | | Hess Corporation (exploration of oil and gas) (2014-present). |
|
| Principal Occupation During at Least the Past 5 Years: |
| Member of the Council on Foreign Relations (1996-present); Member of the National Committee on U.S.-China Relations (1999-present); member of the Board of Trustees of the Economic Club of New York (2013-present); member of the Board of Trustees of the Foreign Policy Association (2005-present) and member of various other boards of trustees and advisory boards; and formerly, Executive Vice President of the Federal Reserve Bank of New York and Head of its Emerging Markets and Internal Affairs Group and Member of Management Committee (1995-2014); and Visiting Fellow at the Council on Foreign Relations (2014). |
| | | | |
Mary C. Choksi (1950) One Franklin Parkway San Mateo, CA 94403-1906 | | Trustee | | Since 2014 | | 139 | | Avis Budget Group Inc. (car rental) (2007-present), Omnicom Group Inc. (advertising and marketing communications services) (2011-present) and White Mountains Insurance Group, Ltd. (holding company) (2017-present) |
|
| Principal Occupation During at Least the Past 5 Years: |
| Director of various companies; and formerly, Founder and Senior Advisor, Strategic Investment Group (investment management group) (2015-2017); Founding Partner and Senior Managing Director, Strategic Investment Group (1987-2015); Founding Partner and Managing Director, Emerging Markets Management LLC (investment management firm) (1987-2011); and Loan Officer/Senior Loan Officer/Senior Pension Investment Officer, World Bank Group (international financial institution) (1977-1987). |
| | | | |
Edith E. Holiday (1952) One Franklin Parkway San Mateo, CA 94403-1906 | | Trustee | | Since 2005 | | 139 | | Hess Corporation (exploration of oil and gas) (1993-present), Canadian National Railway (railroad) (2001-present), White Mountains Insurance Group, Ltd. (holding company) (2004-present), Santander Consumer USA Holdings, Inc. (consumer finance) (November 2016), RTI International Metals, Inc. (manufacture and distribution of titanium) (1999-2015) and H.J. Heinz Company (processed foods and allied products) (1994-2013). |
|
| Principal Occupation During at Least the Past 5 Years: |
| Director or Trustee of various companies and trusts; and formerly, Assistant to the President of the United States and Secretary of the Cabinet (1990-1993); General Counsel to the United States Treasury Department (1989-1990); and Counselor to the Secretary and Assistant Secretary for Public Affairs and Public Liaison – United States Treasury Department (1988-1989). |
| | | | |
J. Michael Luttig (1954) One Franklin Parkway San Mateo, CA 94403-1906 | | Trustee | | Since 2009 | | 139 | | Boeing Capital Corporation (aircraft financing) (2006-2013). |
|
| Principal Occupation During at Least the Past 5 Years: |
| Executive Vice President, General Counsel and member of the Executive Council, The Boeing Company (aerospace company) (2006-present); and formerly, Federal Appeals Court Judge, U.S. Court of Appeals for the Fourth Circuit (1991-2006). |
FRANKLIN TEMPLETON VARIABLE INSURANCE PRODUCTS TRUST
Independent Board Members (continued)
| | | | | | | | |
Name, Year of Birth and Address | | Position | | Length of Time Served | | Number of Portfolios in Fund Complex Overseen by Board Member* | | Other Directorships Held During at Least the Past 5 Years |
| | | | |
Larry D. Thompson (1945) One Franklin Parkway San Mateo, CA 94403-1906 | | Trustee | | Since 2007 | | 139 | | The Southern Company (energy company) (2014-present; previously 2010-2012), Graham Holdings Company (education and media organization) (2011-present) and Cbeyond, Inc. (business communications provider) (2010-2012). |
|
| Principal Occupation During at Least the Past 5 Years: |
| Director of various companies; Counsel, Finch McCranie, LLP (law firm) (2015-present); Independent Compliance Monitor and Auditor, Volkswagen AG (manufacturer of automobiles and commercial vehicles) (2017-present); John A. Sibley Professor of Corporate and Business Law, University of Georgia School of Law (2015; previously 2011-2012); and formerly, Executive Vice President – Government Affairs, General Counsel and Corporate Secretary, PepsiCo, Inc. (consumer products) (2012-2014); Senior Vice President – Government Affairs, General Counsel and Secretary, PepsiCo, Inc. (2004-2011); Senior Fellow of The Brookings Institution (2003-2004); Visiting Professor, (2003-2004); Visiting Professor, University of Georgia School of Law (2004); and Deputy Attorney General, U.S. Department of Justice (2001-2003). |
| | | | |
John B. Wilson (1959) One Franklin Parkway San Mateo, CA 94403-1906 | | Lead Independent Trustee | | Trustee since 2007 and Lead Independent Trustee since 2008 | | 113 | | None |
|
| Principal Occupation During at Least the Past 5 Years: |
| President and Founder, Hyannis Port Capital, Inc. (real estate and private equity investing) (2002-present); serves on private and non-profit boards; and formerly, President, Staples International and Head of Global Transformation (office supplies) (2012-2016); Chief Operating Officer and Executive Vice President, Gap, Inc. (retail) (1996-2000); Chief Financial Officer and Executive Vice President – Finance and Strategy, Staples, Inc. (1992-1996); Senior Vice President – Corporate Planning, Northwest Airlines, Inc. (airlines) (1990-1992); and Vice President and Partner, Bain & Company (consulting firm) (1986-1990). |
|
| Interested Board Members and Officers |
| | | | |
Name, Year of Birth and Address | | Position | | Length of Time Served | | Number of Portfolios in Fund Complex Overseen by Board Member* | | Other Directorships Held During at Least the Past 5 Years |
| | | | |
**Gregory E. Johnson (1961) One Franklin Parkway San Mateo, CA 94403-1906 | | Trustee | | Since 2013 | | 153 | | None |
|
| Principal Occupation During at Least the Past 5 Years: |
| Chairman of the Board, Member – Office of the Chairman, Director and Chief Executive Officer, Franklin Resources, Inc.; officer and/or director or trustee, as the case may be, of some of the other subsidiaries of Franklin Resources, Inc. and of 43 of the investment companies in Franklin Templeton Investments; Vice Chairman, Investment Company Institute; and formerly, President, Franklin Resources, Inc. (1994-2015). |
| | | | |
**Rupert H. Johnson, Jr. (1940) One Franklin Parkway San Mateo, CA 94403-1906 | | Chairman of the Board, and Trustee | | Chairman of the Board since 2013, and Trustee since 1988 | | 139 | | None |
|
| Principal Occupation During at Least the Past 5 Years: |
| Vice Chairman, Member – Office of the Chairman and Director, Franklin Resources, Inc.; Director, Franklin Advisers, Inc.; Senior Vice President, Franklin Advisory Services, LLC; and officer and/or director or trustee, as the case may be, of some of the other subsidiaries of Franklin Resources, Inc. and of 41 of the investment companies in Franklin Templeton Investments. |
| | | | |
Alison E. Baur (1964) One Franklin Parkway San Mateo, CA 94403-1906 | | Vice President | | Since 2012 | | Not Applicable | | Not Applicable |
|
| Principal Occupation During at Least the Past 5 Years: |
| Deputy General Counsel, Franklin Templeton Investments; and officer of some of the other subsidiaries of Franklin Resources, Inc. and of 45 of the investment companies in Franklin Templeton Investments. |
FRANKLIN TEMPLETON VARIABLE INSURANCE PRODUCTS TRUST
Interested Board Members and Officers (continued)
| | | | | | | | |
Name, Year of Birth and Address | | Position | | Length of Time Served | | Number of Portfolios in Fund Complex Overseen by Board Member* | | Other Directorships Held During at Least the Past 5 Years |
| | | | |
Gaston Gardey (1967) One Franklin Parkway San Mateo, CA 94403-1906 | | Chief Financial Officer, Chief Accounting Officer and Treasurer | | Since 2009 | | Not Applicable | | Not Applicable |
|
| Principal Occupation During at Least the Past 5 Years: |
| Treasurer, U.S. Fund Administration & Reporting, Franklin Templeton Investments; and officer of 28 of the investment companies in Franklin Templeton Investments. |
| | | | |
Aliya S. Gordon (1973) One Franklin Parkway San Mateo, CA 94403-1906 | | Vice President | | Since 2009 | | Not Applicable | | Not Applicable |
|
| Principal Occupation During at Least the Past 5 Years: |
| Senior Associate General Counsel, Franklin Templeton Investments; and officer of 45 of the investment companies in Franklin Templeton Investments. |
| | | | |
Steven J. Gray (1955) One Franklin Parkway San Mateo, CA 94403-1906 | | Vice President | | Since 2009 | | Not Applicable | | Not Applicable |
|
| Principal Occupation During at Least the Past 5 Years: |
| Senior Associate General Counsel, Franklin Templeton Investments; Vice President, Franklin Templeton Distributors, Inc. and FASA, LLC; and officer of 45 of the investment companies in Franklin Templeton Investments. |
| | | | |
Matthew T. Hinkle (1971) One Franklin Parkway San Mateo, CA 94403-1906 | | Chief Executive Officer – Finance and Administration | | Since June 2017 | | Not Applicable | | Not Applicable |
|
| Principal Occupation During at Least the Past 5 Years: |
| Senior Vice President, Franklin Templeton Services, LLC; officer of 45 of the investment companies in Franklin Templeton Investments; and formerly, Vice President, Global Tax (2012-April 2017) and Treasurer/Assistant Treasurer, Franklin Templeton Investments (2009-2017). |
| | | | |
Edward B. Jamieson (1948) One Franklin Parkway San Mateo, CA 94403-1906 | | President and Chief Executive Officer – Investment Management | | Since 2010 | | Not Applicable | | Not Applicable |
|
| Principal Occupation During at Least the Past 5 Years: |
| President and Director, Franklin Advisers, Inc.; Executive Vice President, Franklin Templeton Institutional, LLC; and officer and/or trustee, as the case may be, of some of the other subsidiaries of Franklin Resources, Inc. and of 10 of the investment companies in Franklin Templeton Investments. |
| | | | |
Robert Lim (1948) One Franklin Parkway San Mateo, CA 94403-1906 | | Vice President – AML Compliance | | Since 2016 | | Not Applicable | | Not Applicable |
|
| Principal Occupation During at Least the Past 5 Years: |
| Vice President, Franklin Templeton Companies, LLC; Chief Compliance Officer, Franklin Templeton Distributors, Inc. and Franklin Templeton Investor Services, LLC; and officer of 45 of the investment companies in Franklin Templeton Investments. |
| | | | |
Kimberly H. Novotny (1972) 300 S.E. 2nd Street Fort Lauderdale, FL 33301-1923 | | Vice President | | Since 2013 | | Not Applicable | | Not Applicable |
|
| Principal Occupation During at Least the Past 5 Years: |
| Associate General Counsel, Franklin Templeton Investments; Vice President and Corporate Secretary, Fiduciary Trust International of the South; Vice President, Templeton Investment Counsel, LLC; Assistant Secretary, Franklin Resources, Inc.; and officer of 45 of the investment companies in Franklin Templeton Investments. |
FRANKLIN TEMPLETON VARIABLE INSURANCE PRODUCTS TRUST
Interested Board Members and Officers (continued)
| | | | | | | | |
Name, Year of Birth and Address | | Position | | Length of Time Served | | Number of Portfolios in Fund Complex Overseen by Board Member* | | Other Directorships Held During at Least the Past 5 Years |
| | | | |
Robert C. Rosselot (1960) 300 S.E. 2nd Street Fort Lauderdale, FL 33301-1923 | | Chief Compliance Officer | | Since 2013 | | Not Applicable | | Not Applicable |
|
| Principal Occupation During at Least the Past 5 Years: |
| Director, Global Compliance, Franklin Templeton Investments; Vice President, Franklin Templeton Companies, LLC; officer of 45 of the investment companies in Franklin Templeton Investments; and formerly, Senior Associate General Counsel, Franklin Templeton Investments (2007-2013); and Secretary and Vice President, Templeton Group of Funds (2004-2013). |
| | | | |
Karen L. Skidmore (1952) One Franklin Parkway San Mateo, CA 94403-1906 | | Vice President and Secretary | | Since 2006 | | Not Applicable | | Not Applicable |
|
| Principal Occupation During at Least the Past 5 Years: |
| Senior Associate General Counsel, Franklin Templeton Investments; and officer of 45 of the investment companies in Franklin Templeton Investments. |
| | | | |
Navid J. Tofigh (1972) One Franklin Parkway San Mateo, CA 94403-1906 | | Vice President | | Since 2015 | | Not Applicable | | Not Applicable |
|
| Principal Occupation During at Least the Past 5 Years: |
| Associate General Counsel, Franklin Templeton Investments; and officer of 45 of the investment companies in Franklin Templeton Investments. |
| | | | |
Craig S. Tyle (1960) One Franklin Parkway San Mateo, CA 94403-1906 | | Vice President | | Since 2005 | | Not Applicable | | Not Applicable |
|
| Principal Occupation During at Least the Past 5 Years: |
| General Counsel and Executive Vice President, Franklin Resources, Inc.; and officer of some of the other subsidiaries of Franklin Resources, Inc. and of 45 of the investment companies in Franklin Templeton Investments. |
| | | | |
Lori A. Weber (1964) 300 S.E. 2nd Street Fort Lauderdale, FL 33301-1923 | | Vice President | | Since 2011 | | Not Applicable | | Not Applicable |
|
| Principal Occupation During at Least the Past 5 Years: |
| Senior Associate General Counsel, Franklin Templeton Investments; Assistant Secretary, Franklin Resources, Inc.; Vice President and Secretary, Templeton Investment Counsel, LLC; and officer of 45 of the investment companies in Franklin Templeton Investments. |
*We base the number of portfolios on each separate series of the US registered investment companies within the Franklin Templeton Investments fund complex. These portfolios have a common investment manager or affiliated investment managers.
**Gregory E. Johnson is considered to be an interested person of the Fund under the federal securities laws due to his position as an officer and director of Franklin Resources, Inc. (Resources), which is the parent company of the Fund’s investment manager and distributor. Rupert H. Johnson, Jr. is considered to be an interested person of the Fund under the federal securities laws due to his position as officer and director and major shareholder of Resources.
Note 1: Rupert H. Johnson, Jr. is the uncle of Gregory E. Johnson.
Note 2: Officer information is current as of the date of this report. It is possible that after this date, information about officers may change.
The Sarbanes-Oxley Act of 2002 and Rules adopted by the Securities and Exchange Commission require the Fund to disclose whether the Fund’s Audit Committee includes at least one member who is an audit committee financial expert within the meaning of such Act and Rules. The Fund’s Board has determined that there is at least one such financial expert on the Audit Committee and has designated John B. Wilson as its audit committee financial expert. The Board believes that Mr. Wilson qualifies as such an expert in view of his extensive business background and experience, including service as chief financial officer of Staples, Inc. from 1992 to 1996. Mr. Wilson has been a Member and Chairman of the Fund’s Audit Committee since 2007. As a result of such background and experience, the Board believes that Mr. Wilson has acquired an understanding of generally accepted accounting principles and financial statements, the general application of such principles in connection with the accounting estimates, accruals and reserves, and analyzing and evaluating financial statements that present a breadth and level of complexity of accounting issues generally comparable to those of the Fund, as well as an understanding of internal controls and procedures for financial reporting and an understanding of audit committee functions. Mr. Wilson is an independent Board member as that term is defined under the relevant Securities and Exchange Commission Rules and Releases.
The Statement of Additional Information (SAI) includes additional information about the board members and is available, without charge, upon request. Shareholders may call (800) DIAL BEN/342-5236 to request the SAI.
FRANKLIN TEMPLETON VARIABLE INSURANCE PRODUCTS TRUST
Shareholder Information
Proxy Voting Policies and Procedures
The Trust’s investment manager has established Proxy Voting Policies and Procedures (Policies) that the Trust uses to determine how to vote proxies relating to portfolio securities. Shareholders may view the Trust’s complete Policies online at franklintempleton.com. Alternatively, shareholders may request copies of the Policies free of charge by calling the Proxy Group collect at (954) 527-7678 or by sending a written request to: Franklin Templeton Companies, LLC, 300 S.E. 2nd Street, Fort Lauderdale, FL 33301, Attention: Proxy Group. Copies of the Trust’s proxy voting records are also made available online at franklintempleton.com and posted on the US Securities and Exchange Commission’s website at sec.gov and reflect the most recent 12-month period ended June 30.
Quarterly Statement of Investments
The Trust files a complete statement of investments with the US Securities and Exchange Commission for the first and third quarters for each fiscal year on Form N-Q. Shareholders may view the filed Form N-Q by visiting the Commission’s website at sec.gov. The filed form may also be viewed and copied at the Commission’s Public Reference Room in Washington, DC. Information regarding the operations of the Public Reference Room may be obtained by calling (800) SEC-0330.
This page intentionally left blank.
This page intentionally left blank.
This page intentionally left blank.
Annual Report
Franklin Templeton
Variable Insurance Products Trust
Investment Managers
Franklin Advisers, Inc.
Franklin Advisory Services, LLC
Franklin Mutual Advisers, LLC
Franklin Templeton Institutional, LLC
Templeton Asset Management Ltd.
Templeton Global Advisors Limited
Templeton Investment Counsel, LLC
Fund Administrator
Franklin Templeton Services, LLC
Distributor
Franklin Templeton Distributors, Inc.
Franklin Templeton Variable Insurance Products Trust (FTVIP) shares are not offered to the public; they are offered and sold only to: (1) insurance company separate accounts (Separate Account) to serve as the underlying investment vehicle for variable contracts; (2) certain qualified plans; and (3) other mutual funds (funds of funds).
Authorized for distribution to investors in Separate Accounts only when accompanied or preceded by the current prospectus for the applicable contract, which includes the Separate Account and the FTVIP prospectuses. Investors should carefully consider a fund’s investment goals, risks, charges and expenses before investing. The prospectus contains this and other information; please read it carefully before investing.
To help ensure we provide you with quality service, all calls to and from our service areas are monitored and/or recorded.
| | |
| ©2018 Franklin Templeton Investments. All rights reserved. | | VIP2 A 02/18 |
| (a) | The Registrant has adopted a code of ethics that applies to its principal executive officers and principal financial and accounting officer. |
| (f) | Pursuant to Item 12(a)(1), the Registrant is attaching as an exhibit a copy of its code of ethics that applies to its principal executive officers and principal financial and accounting officer. |
| Item 3. | Audit Committee Financial Expert. |
| (a) (1) | The Registrant has an audit committee financial expert serving on its audit committee. |
| | (2) | The audit committee financial expert is John B. Wilson and he is “independent” as defined under the relevant Securities and Exchange Commission Rules and Releases. |
| Item 4. | Principal Accountant Fees and Services. |
(a) Audit Fees
The aggregate fees paid to the principal accountant for professional services rendered by the principal accountant for the audit of the registrant’s annual financial statements or for services that are normally provided by the principal accountant in connection with statutory and regulatory filings or engagements were $818,062 for the fiscal year ended December 31, 2017 and $937,061 for the fiscal year ended December 31, 2016.
(b) Audit-Related Fees
The aggregate fees paid to the principal accountant for assurance and related services rendered by the principal accountant to the registrant that are reasonably related to the performance of the audit of the registrant’s financial statements and are not reported under paragraph (a) of Item 4 were $0 for the fiscal year ended December 31, 2017 and $4,682 for the fiscal year ended December 31, 2016. The services for which these fees were paid included attestation services.
There were no fees paid to the principal accountant for assurance and related services rendered by the principal accountant to the registrant’s investment adviser and any entity controlling, controlled by or under common control with the investment adviser that provides ongoing services to the registrant that are reasonably related to the performance of the audit of their financial statements.
(c) Tax Fees
There were no fees paid to the principal accountant for professional services rendered by the principal accountant to the registrant for tax compliance, tax advice and tax planning.
There were no fees paid to the principal accountant for professional services rendered by the principal accountant to the registrant’s investment adviser and any entity controlling, controlled by or under common control with the investment adviser that provides ongoing services to the registrant for tax compliance, tax advice and tax planning.
(d) All Other Fees
There were no fees paid to the principal accountant for products and services rendered by the principal accountant to the registrant not reported in paragraphs (a)-(c) of Item 4.
The aggregate fees paid to the principal accountant for products and services rendered by the principal accountant to the registrant’s investment adviser and any entity controlling, controlled by or under common control with the investment adviser that provides ongoing services to the registrant other than services reported in paragraphs (a)-(c) of Item 4 were $14,000 for the fiscal year ended December 31, 2017 and $349,307 for the fiscal year ended December 31, 2016. The services for which these fees were paid included review of materials provided to the fund Board in connection with the investment management contract renewal process and derivatives assessments, review of system processes related to fixed income securities, compliance examination for Investment Advisor Act rule 204-2 and 206-4(2), and benchmarking services in connection with the 2015 ICI TA Survey.
(e) (1) The registrant’s audit committee is directly responsible for approving the services to be provided by the auditors, including:
(i) pre-approval of all audit and audit related services;
(ii) pre-approval of all non-audit related services to be provided to the Fund by the auditors;
(iii) pre-approval of all non-audit related services to be provided to the registrant by the auditors to the registrant’s investment adviser or to any entity that controls, is controlled by or is under common control with the registrant’s investment adviser and that provides ongoing services to the registrant where the non-audit services relate directly to the operations or financial reporting of the registrant; and
(iv) establishment by the audit committee, if deemed necessary or appropriate, as an alternative to committee pre-approval of services to be provided by the auditors, as required by paragraphs (ii) and (iii) above, of policies and procedures to permit such services to be pre-approved by other means, such as through establishment of guidelines or by action of a designated member or members of the committee; provided the policies and procedures are detailed as to the particular service and the committee is informed of each service and such policies and procedures do not include delegation of audit committee responsibilities, as contemplated under the Securities Exchange Act of 1934, to management; subject, in the case of (ii) through (iv), to any waivers, exceptions or exemptions that may be available under applicable law or rules.
(e) (2) None of the services provided to the registrant described in paragraphs (b)-(d) of Item 4 were approved by the audit committee pursuant to paragraph (c)(7)(i)(C) of Rule 2-01 of regulation S-X.
(f) No disclosures are required by this Item 4(f).
(g) The aggregate non-audit fees paid to the principal accountant for services rendered by the principal accountant to the registrant and the registrant’s investment adviser and any entity controlling, controlled by or under common control with the investment adviser that provides ongoing services to the registrant were $14,000 for the fiscal year ended December 31, 2017 and $353,989 for the fiscal year ended December 31, 2016.
(h) The registrant’s audit committee of the board has considered whether the provision of non-audit services that were rendered to the registrant’s investment adviser (not including any sub-adviser whose role is primarily portfolio management and is subcontracted with or overseen by another investment adviser), and any entity controlling, controlled by, or under common control with the investment adviser that provides ongoing services to the registrant that were not pre-approved pursuant to paragraph (c)(7)(ii) of Rule 2-01 of Regulation S-X is compatible with maintaining the principal accountant’s independence.
| | | | |
Item 5. | | Audit Committee of Listed Registrants. | | N/A |
| | |
| Item 6. | | Schedule of Investments. | | N/A |
| | |
Item 7. | | Disclosure of Proxy Voting Policies and Procedures for Closed- End Management Investment Companies. | | N/A |
| | |
Item 8. | | Portfolio Managers of Closed-End Management Investment Companies. | | N/A |
| | |
Item 9. | | Purchases of Equity Securities by Closed-End Management Investment Company and Affiliated Purchasers. | | N/A |
Item 10. Submission of Matters to a Vote of Security Holders.
There have been no changes to the procedures by which shareholders may recommend nominees to the Registrant’s Board of Trustees that would require disclosure herein.
Item 11. Controls and Procedures.
(a) Evaluation of Disclosure Controls and Procedures. The Registrant maintains disclosure controls and procedures that are designed to ensure that information required to be disclosed in the Registrant’s filings under the Securities Exchange Act of 1934 and the Investment Company Act of 1940 is recorded, processed, summarized and reported within the periods specified in the rules and forms of the Securities
and Exchange Commission. Such information is accumulated and communicated to the Registrant’s management, including its principal executive officer and principal financial officer, as appropriate, to allow timely decisions regarding required disclosure. The Registrant’s management, including the principal executive officer and the principal financial officer, recognizes that any set of controls and procedures, no matter how well designed and operated, can provide only reasonable assurance of achieving the desired control objectives.
Within 90 days prior to the filing date of this Shareholder Report on Form N-CSR, the Registrant had carried out an evaluation, under the supervision and with the participation of the Registrant’s management, including the Registrant’s principal executive officer and the Registrant’s principal financial officer, of the effectiveness of the design and operation of the Registrant’s disclosure controls and procedures. Based on such evaluation, the Registrant’s principal executive officer and principal financial officer concluded that the Registrant’s disclosure controls and procedures are effective.
(b) Changes in Internal Controls. There have been no changes in the Registrant’s internal controls or in other factors that could materially affect the internal controls over financial reporting subsequent to the date of their evaluation in connection with the preparation of this Shareholder Report on Form N-CSR.
(a) (1) Code of Ethics
(a) (2) Certifications pursuant to Section 302 of the Sarbanes-Oxley Act of 2002 of Matthew T. Hinkle, Chief Executive Officer - Finance and Administration, and Gaston Gardey, Chief Financial Officer and Chief Accounting Officer
(b) Certifications pursuant to Section 906 of the Sarbanes-Oxley Act of 2002 of Matthew T. Hinkle, Chief Executive Officer - Finance and Administration, and Gaston Gardey, Chief Financial Officer and Chief Accounting Officer
SIGNATURES
Pursuant to the requirements of the Securities Exchange Act of 1934 and the Investment Company Act of 1940, the registrant has duly caused this report to be signed on its behalf by the undersigned, thereunto duly authorized.
Franklin Templeton Variable Insurance Products Trust
| | |
| |
| By | | /s/ MATTHEW T. HINKLE |
| | Matthew T. Hinkle |
| | Chief Executive Officer – |
| | Finance and Administration |
Date February 26, 2018 |
Pursuant to the requirements of the Securities Exchange Act of 1934 and the Investment Company Act of 1940, this report has been signed below by the following persons on behalf of the registrant and in the capacities and on the dates indicated.
| | |
| By | | /s/ MATTHEW T. HINKLE |
| | Matthew T. Hinkle |
| | Chief Executive Officer – |
| | Finance and Administration |
| Date February 26, 2018 |
| | |
| By | | /s/ GASTON GARDEY |
| | Gaston Gardey |
| | Chief Financial Officer and |
| | Chief Accounting Officer |
Date February 26, 2018 |