UNITED STATES
SECURITIES AND EXCHANGE COMMISSION
Washington, DC 20549
FORM N-CSRS
CERTIFIED SHAREHOLDER REPORT OF REGISTERED
MANAGEMENT INVESTMENT COMPANIES
Investment Company Act file number 811-05583
Franklin Templeton Variable Insurance Products Trust
(Exact name of registrant as specified in charter)
One Franklin Parkway,
San Mateo, CA 94403-1906
(Address of principal executive offices) (Zip code)
Craig S. Tyle, One Franklin Parkway,
San Mateo, CA 94403-1906
(Name and address of agent for service)
Registrant’s telephone number, including area code: (650) 312-2000
Date of fiscal year end: 12/31
Date of reporting period: 06/30/20
| Item 1. | Reports to Stockholders. |
Internet Delivery of Shareholder Reports: Effective January 1, 2021, as permitted by regulations adopted by the SEC, you may not be receiving paper copies of the Fund’s annual or semiannual shareholder reports by mail, unless you specifically request them from the insurance company that offers your variable annuity or variable life insurance contract or your financial intermediary. Instead of delivering paper copies of the report, the insurance company may choose to make the reports available on a website, and will notify you by mail each time a shareholder report is posted and provide you with a website link to access the report. Instructions for requesting paper copies will be provided by your insurance company.
If you already elected to receive shareholder reports electronically, you will not be affected by this change and you need not take any action. You may elect to receive shareholder reports and other communications from the insurance company or your financial intermediary electronically by following the instructions provided by the insurance company or by contacting your financial intermediary.
You may elect to receive all future Fund shareholder reports in paper free of charge from the insurance company. You can inform the insurance company or your financial intermediary that you wish to continue receiving paper copies of your shareholder reports by following the instructions provided by the insurance company or by contacting your financial intermediary. Your election to receive reports in paper will apply to all portfolio companies available under your contract with the insurance company.
This notice is not legally a part of the shareholder report.
Franklin Templeton Variable Insurance
Products Trust Semiannual Report
*Not part of the semiannual report. Retain for your records.
| | | | | | | | |
| | | | | |
| Not FDIC Insured | | | | | May Lose Value | | | | | No Bank Guarantee |
MASTER CLASS – 4
FRANKLIN TEMPLETON VARIABLE INSURANCE PRODUCTS TRUST
Important Notes to
Performance Information
Performance data is historical and cannot predict or guarantee future results. Principal value and investment return will fluctuate with market conditions, and you may have a gain or loss when you withdraw your money. Inception dates of the funds may have preceded the effective dates of the subaccounts, contracts or their availability in all states.
When reviewing the index comparisons, please keep in mind that indexes have a number of inherent performance differentials over the funds. First, unlike the funds, which must hold a minimum amount of cash to maintain liquidity,
indexes do not have a cash component. Second, the funds are actively managed and, thus, are subject to management fees to cover salaries of securities analysts or portfolio managers in addition to other expenses. Indexes are unmanaged and do not include any commissions or other expenses typically associated with investing in securities. Third, indexes often contain a different mix of securities than the fund to which they are compared. Additionally, please remember that indexes are simply a measure of performance and cannot be invested in directly.
Franklin Allocation VIP Fund
This semiannual report for Franklin Allocation VIP Fund covers the period ended June 30, 2020.
Class 4 Performance Summary as of June 30, 2020
The Fund’s Class 4 Shares posted a -1.37% total return* for the six-month period ended June 30, 2020.
*On May 1, 2019, the Fund’s investment strategies changed. Performance prior to May 1, 2019, is attributable to the Fund’s performance before the strategy change. The Fund has an expense reduction contractually guaranteed through 4/30/21. Fund investment results reflect the expense reduction; without this reduction, the results would have been lower.
Performance reflects the Fund’s Class 4 operating expenses, but does not include any contract fees, expenses or sales charges. If they had been included, performance would be lower. These charges and deductions, particularly for variable life policies, can have a significant effect on contract values and insurance benefits. See the contract prospectus for a complete description of these expenses, including sales charges.
Performance data represent past performance, which does not guarantee future results. Investment return and principal value will fluctuate, and you may have a gain or loss when you sell your shares. Current performance may differ from figures shown.
FRANKLIN ALLOCATION VIP FUND
Fund Goal and Main Investments
The Fund seeks capital appreciation, with income as a secondary goal. Under normal market conditions, the Fund allocates approximately 60% of its assets to the equity asset class and 40% of its assets to the fixed income asset class by allocating the Fund’s assets among various sleeves (investment strategies).
Fund Risks
All investments involve risks, including possible loss of principal. Unexpected events and their aftermaths, such as the spread of deadly diseases; natural, environmental or man-made disasters; financial, political or social disruptions; terrorism and war; and other tragedies or catastrophes, can cause investor fear and panic, which can adversely affect the economies of many companies, sectors, nations, regions and the market in general, in ways that cannot necessarily be foreseen. Because the Fund invests in underlying funds, and the Fund’s performance is directly related to the performance of the underlying funds held by it, the ability of the Fund to achieve its investment goals is directly related to the ability of the underlying funds to meet their investment goals. Additionally, because these underlying funds may engage in a variety of investment strategies involving certain risks, the Fund may be subject to these same risks. Stock prices fluctuate, sometimes rapidly and dramatically, due to factors affecting individual companies, particular industries or sectors, or general market conditions. Bonds are affected by changes in interest rates and the creditworthiness of their issuers. Bond prices generally move in the opposite direction of interest rates. Thus, as prices of bonds adjust to a rise in interest rates, the Fund’s share price may decline. Higher yielding, lower rated corporate bonds entail a greater degree of credit risk compared to investment-grade securities. Foreign investing carries additional risks such as currency and market volatility and political or social instability, risks that are heightened in developing countries. Value securities may not increase in price as anticipated or may decline further in value. The Fund’s prospectus also includes a description of the main investment risks.
Asset Allocation*
Based on Total Net Assets as of 6/30/20
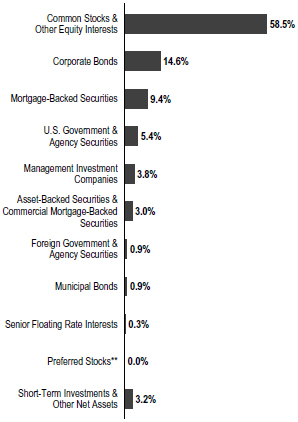
*The asset allocation is based on the Statement of Investments (SOI), which classifies each underlying fund into a broad asset class.
**Rounds to less than 0.1%.
Performance Overview
You can find the Fund’s six-month total return in the Performance Summary. In comparison, the Fund’s benchmark, the Standard & Poor’s® 500 Index (S&P 500®), posted a -3.08% total return. The Fund’s other benchmarks, the Bloomberg Barclays U.S. Aggregate Bond Index posted a +6.14% total return; the MSCI World ex USA Index-NR posted a -11.20% total return; and the Linked Allocation VIP Fund Benchmark posted a -0.81% total return.1,2
1. Source: Morningstar.
2. Source: FactSet. The Linked Allocation VIP Fund benchmark was calculated internally and rebalanced monthly and was composed of 40% S&P 500, 40% Bloomberg Barclays U.S. Aggregate Bond Index and 20% MSCI World ex USA Index-NR.
One cannot invest directly in an index, and an index is not representative of the Fund’s portfolio. Please see Index Descriptions following the Fund Summaries.
The dollar value, number of shares or principal amount, and names of all portfolio holdings are listed in the Fund’s Statement of Investments (SOI).
FRANKLIN ALLOCATION VIP FUND
Economic and Market Overview
Global developed and emerging market equities, as measured by the MSCI All Country World Index (USD), posted a -5.99% total return during the six months under review.1 Stocks fell sharply in early 2020 as countries around the world implemented lockdown measures in an effort to slow the spread of the novel coronavirus (COVID-19). Global supply chain disruptions, business and personal restrictions, and subdued consumer spending drove many investors to sell equity holdings in favor of perceived safe investments such as government bonds and cash. While global equities, notably in the U.S., rebounded in April and May amid optimism about easing lockdown restrictions, concerns about a second wave of infections hindered equities in June, as investors weighed the possibility of renewed restrictions.
In the U.S., government mandates to mitigate the COVID-19 pandemic severely impacted the economy beginning in March 2020. As a result, the unemployment rate surged to 14.7% in April, as many businesses, particularly those involved in hospitality, retail and travel, announced mass layoffs.3 According to the National Bureau of Economic Research, the longest U.S. economic expansion in history ended in February 2020 as the country slipped into a severe recession. Nonetheless, near period-end, there were signs that a recovery was underway, as jobless claims fell considerably from their peak in early April, retail sales rose sharply in May, and the unemployment rate fell to 11.1% in June.3 Along with optimism about improved treatments and potential vaccines for COVID-19, the positive economic signals contributed to a significant equity rebound in April and May. However, an increase in COVID-19 infections in many states throughout June pressured U.S. stocks.
The U.S. Federal Reserve (Fed) made significant efforts to support the U.S. economy. In March 2020, as the pandemic began to severely impact the economy and financial markets, the Fed implemented two emergency rate cuts, lowering the federal funds target rate to a range of 0.00%–0.25%, and announced sweeping quantitative easing measures aimed at ensuring credit flow to borrowers and supporting credit markets with unlimited amounts of bond purchasing.
In the eurozone, some analysts forecasted a significant contraction in 2020, particularly in southern European countries, as the magnitude of the economic disruption
Geographic Composition
Based on Total Net Assets as of 6/30/20

caused by the pandemic became apparent. European developed market equities, as measured by the MSCI Europe Index (USD), posted a -12.43% total return for the period.1 To stimulate growth, the European Central Bank implemented a broad bond-buying program, and many countries passed fiscal stimulus measures.
Asian developed and emerging market equities, as measured by the MSCI All Country Asia Index (USD), posted a -5.51% total return during the six-month period.1 The onset of the pandemic brought dramatically slower economic activity in Asia, as businesses halted operations and manufacturing and export activity declined sharply in the region’s major economies. Asian markets generally advanced toward period-end, bolstered by fiscal stimulus measures and economies reopening throughout the region.
Emerging market stocks, as measured by the MSCI Emerging Markets Index (USD), posted a -9.67% total return due primarily to the COVID-19 pandemic.1 A sharp decrease in prices for oil and other natural resources also hurt emerging market economies reliant on these exports. In the last quarter of the reporting period, however, investor optimism led to a stock rally, particularly in emerging market countries that had successfully lowered infection rates.
3. Source: U.S. Bureau of Labor Statistics.
See www.franklintempletondatasources.com for additional data provider information.
FRANKLIN ALLOCATION VIP FUND
Investment Strategy
The Fund seeks to achieve its investment goals by allocating its assets among the broad asset classes of equity and fixed income investments through a variety of investment strategies or “sleeves” managed by the investment manager or its affiliates, which include Franklin U.S. Smart Beta Equity Strategy, Franklin Total Return Strategy, Franklin Growth Strategy, Templeton Foreign Strategy, Franklin International Growth Strategy, Franklin U.S. Government Securities Strategy, Franklin Rising Dividends Strategy, Franklin Investment Grade Corporate Strategy, Templeton Global Bond VIP Fund Strategy, Franklin International Core Equity Strategy, Franklin U.S. Core Equity (IU) Strategy, Franklin Emerging Market Core Equity (IU) Strategy and Franklin U.S. Core Bond Strategy. The Fund is structured as a multi-manager fund (meaning the Fund’s assets are managed by multiple sub-advisors), with the investment manager having overall responsibility for the Funds’ investments. Allocation to each sleeve will generally not exceed 20% and will vary with market conditions. However, under normal market conditions, no sleeve constitutes a majority of the Fund’s assets.
Top 10 Holdings
6/30/20
| | | | |
Company Sector/Industry | | % of Total Net Assets | |
Templeton Global Bond VIP Fund | | | 3.8 | % |
Diversified Financials | | | | |
Microsoft Corp. | | | 1.6 | % |
Software & Services | | | | |
Apple Inc. | | | 1.1 | % |
Technology Hardware & Equipment | | | | |
Amazon.com Inc. | | | 0.8 | % |
Retailing | | | | |
Texas Instruments Inc. | | | 0.6 | % |
Semiconductors & Semiconductor Equipment | | | | |
Mastercard Inc. | | | 0.5 | % |
Software & Services | | | | |
Accenture PLC | | | 0.5 | % |
Software & Services | | | | |
NIKE Inc. | | | 0.5 | % |
Consumer Durables & Apparel | | | | |
Johnson & Johnson | | | 0.5 | % |
Pharmaceuticals, Biotechnology & Life Sciences | | | | |
Air Products and Chemicals Inc. | | | 0.5 | % |
Materials | | | | |
Manager’s Discussion
The Fund’s performance can be attributed largely to its allocation among the underlying sleeves and their investments in domestic and foreign equities, fixed income securities, and short-term investments and other net assets. The allocation to the sleeves did not change over the period.
During the six months under review, the Franklin Growth Strategy outperformed the S&P 500, the Franklin Rising Dividends Strategy underperformed the S&P 500, the Templeton Foreign Strategy underperformed the MSCI All Country World ex USA Index-NR, the Franklin International Growth Strategy outperformed the MSCI World ex-USA Index, the U.S. Smart Beta Equity Strategy underperformed the Russell 1000® Index, the Franklin International Core Equity Strategy outperformed the MSCI EAFE Index, the Franklin U.S. Government Securities Strategy underperformed the Bloomberg Barclays U.S. Government Index: Intermediate Component, the Franklin Investment-Grade Corporate Strategy outperformed the Bloomberg Barclays U.S. Corporate Investment-Grade Index, the Templeton Global Bond VIP Fund outperformed the J.P. Morgan Global Government Bond Index, the Franklin U.S. Core Bond Strategy underperformed the Bloomberg Barclays U.S. Aggregate Bond Index.
Thank you for your participation in Franklin Allocation VIP Fund. We look forward to serving your Future investment needs.
The foregoing information reflects our analysis, opinions and portfolio holdings as of June 30, 2020, the end of the reporting period. The way we implement our main investment strategies and the resulting portfolio holdings may change depending on factors such as market and economic conditions. These opinions may not be relied upon as investment advice or an offer for a particular security. The information is not a complete analysis of every aspect of any market, country, industry, security or the Fund. Statements of fact are from sources considered reliable, but the investment manager makes no representation or warranty as to their completeness or accuracy. Although historical performance is no guarantee of future results, these insights may help you understand our investment management philosophy.
FRANKLIN ALLOCATION VIP FUND
Class 4 Fund Expenses
As an investor in a variable insurance contract (Contract) that indirectly provides for investment in an underlying mutual fund, you can incur transaction and/or ongoing expenses at both the Fund level and the Contract Level: (1) transaction expenses can include sales charges (loads) on purchases, surrender fees, transfer fees and premium taxes; and (2) ongoing expenses can include management fees, distribution and service (12b-1) fees, contract fees, annual maintenance fees, mortality and expense risk fees and other fees and expenses. All mutual funds and Contracts have some types of ongoing expenses. The table below shows Fund-level ongoing expenses and can help you understand these costs and compare them with those of other mutual funds offered through the Contract. The table assumes a $1,000 investment held for the six months indicated. Please refer to the Fund prospectus for additional information on operating expenses.
Actual Fund Expenses
The table below provides information about the actual account values and actual expenses in the columns under the heading “Actual.” In these columns the Fund’s actual return, which includes the effect of ongoing Fund expenses but does not include the effect of ongoing Contract expenses, is used to calculate the “Ending Account Value.” You can estimate the Fund-level expenses you paid during the period by following these steps (of course, your account value and expenses will differ from those in this illustration): Divide your account value by $1,000 (if your account had an $8,600 value, then $8,600 ÷ $1,000 = 8.6). Then multiply the result by the number under the headings “Actual” and “Fund-Level Expenses Paid During Period” (if Fund-Level Expenses Paid During Period were $ 7.50, then 8.6 x $ 7.50 = $64.50). In this illustration, the estimated expenses paid this period at the Fund level are $64.50.
Hypothetical Example for Comparison with Other Mutual Funds
Under the heading “Hypothetical” in the table, information is provided about hypothetical account values and hypothetical expenses based on the Fund’s actual expense ratio and an assumed rate of return of 5% per year before expenses, which is not the Fund’s actual return. This information may not be used to estimate the actual ending account balance or expenses you paid for the period, but it can help you compare ongoing costs of investing in the Fund with those of other mutual funds offered through the Contract. To do so, compare this 5% hypothetical example with the 5% hypothetical examples that appear in the shareholder reports of other funds offered through the Contract.
Please note that expenses shown in the table are meant to highlight ongoing costs at the Fund level only and do not reflect any ongoing expenses at the Contract level, or transaction expenses at either the Fund or Contract levels. In addition, while the Fund does not have transaction expenses, if the transaction and ongoing expenses at the Contract level were included, the expenses shown below would be higher. You should consult your Contract prospectus or disclosure document for more information.
| | | | | | | | | | | | | | | | | | |
| | | | | | | |
| | | | | | | Actual (actual return after expenses) | | | | Hypothetical (5% annual return before expenses) | | | | |
| | | | | | | | | |
Share Class | | Beginning
Account
Value 1/1/20 | | | | Ending
Account Value 6/30/20 | | Fund-Level
Expenses
Paid During
Period
1/1/20–6/30/201, 2 | | | | Ending
Account
Value 6/30/20 | | Fund-Level
Expenses
Paid During
Period
1/1/20–6/30/201, 2 | | | | Net
Annualized
Expense
Ratio1, 2 |
Class 4 | | $1,000 | | | | $986.30 | | $4.40 | | | | $1,020.44 | | $4.47 | | | | 0.89% |
1. Expenses are equal to the annualized expense ratio for the six-month period as indicated above—in the far right column—multiplied by the simple average account value over the period indicated, and then multiplied by 182/366 to reflect the one-half year period.
2. Reflects expenses after fee waivers and expense reimbursements. Does not include acquired fund fees and expenses.
FRANKLIN TEMPLETON VARIABLE INSURANCE PRODUCTS TRUST
Financial Highlights
Franklin Allocation VIP Fund
| | | | | | | | | | | | | | | | | | | | | | | | |
| | | Six Months Ended June 30, 2020 (unaudited) | | | Year Ended December 31, | |
| | | 2019 | | | 2018 | | | 2017 | | | 2016 | | | 2015 | |
| | | | | | |
Class 1 | | | | | | | | | | | | | | | | | | | | | | | | |
| | | | | | |
| Per share operating performance | | | | | | | | | | | | | | | | | | | | | | | | |
(for a share outstanding throughout the period) | | | | | | | | | | | | | | | | | | | | | | | | |
| | | | | | |
Net asset value, beginning of period | | | $ 6.86 | | | | $ 6.37 | | | | $ 7.44 | | | | $ 7.13 | | | | $ 6.80 | | | | $ 7.47 | |
| | | | | | |
| Income from investment operationsa: | | | | | | | | | | | | | | | | | | | | | | | | |
| | | | | | |
Net investment incomeb | | | 0.07 | | | | 0.11 | c | | | 0.23 | c | | | 0.21 | c | | | 0.21 | c | | | 0.26 | c |
| | | | | | |
Net realized and unrealized gains (losses) | | | (0.17 | ) | | | 1.11 | | | | (0.89 | ) | | | 0.63 | | | | 0.64 | | | | (0.68 | ) |
| | | | | | |
Total from investment operations | | | (0.10 | ) | | | 1.22 | | | | (0.66 | ) | | | 0.84 | | | | 0.85 | | | | (0.42 | ) |
| | | | | | |
| Less distributions from: | | | | | | | | | | | | | | | | | | | | | | | | |
| | | | | | |
Net investment income | | | (0.12 | ) | | | (0.27 | ) | | | (0.24 | ) | | | (0.22 | ) | | | (0.29 | ) | | | (0.24 | ) |
| | | | | | |
Net realized gains | | | (1.80 | ) | | | (0.46 | ) | | | (0.17 | ) | | | (0.31 | ) | | | (0.23 | ) | | | (0.01 | ) |
| | | | | | |
| Total distributions | | | (1.92 | ) | | | (0.73 | ) | | | (0.41 | ) | | | (0.53 | ) | | | (0.52 | ) | | | (0.25 | ) |
| | | | | | |
| Net asset value, end of period | | | $ 4.84 | | | | $ 6.86 | | | | $ 6.37 | | | | $ 7.44 | | | | $ 7.13 | | | | $ 6.80 | |
| | | | | | |
Total returnd | | | (1.09)% | | | | 20.04% | | | | (9.34)% | | | | 12.17% | | | | 13.43% | | | | (5.93)% | |
| | | | | | |
| Ratios to average net assetse | | | | | | | | | | | | | | | | | | | | | | | | |
| | | | | | |
Expenses before waiver and payments by affiliates | | | 0.59% | | | | 0.44% | | | | 0.12% | | | | 0.12% | | | | 0.11% | | | | 0.11% | |
| | | | | | |
Expenses net of waiver and payments by affiliates | | | 0.54%f | | | | 0.39% | | | | 0.10% | | | | 0.10% | | | | 0.10% | | | | 0.10% | |
| | | | | | |
Net investment income | | | 2.32% | | | | 1.55% | | | | 3.13% | | | | 2.75% | | | | 3.09% | | | | 3.51% | |
| | | | | | |
| Supplemental data | | | | | | | | | | | | | | | | | | | | | | | | |
| | | | | | |
Net assets, end of period (000’s) | | | $804 | | | | $842 | | | | $984 | | | | $1,047 | | | | $1,025 | | | | $1,083 | |
| | | | | | |
Portfolio turnover rate | | | 49.61% | | | | 170.79% | | | | 2.23% | | | | 1.28% | | | | 0.10% | | | | 0.26% | |
Portfolio turnover rate excluding mortgage dollar rolls | | | 42.14% | g | | | 158.11% | g | | | 2.23% | | | | 1.28% | | | | 0.10% | | | | 0.26% | |
aThe amount shown for a share outstanding throughout the period may not correlate with the Statement of Operations for the period due to the timing of sales and repurchases of the Fund’s shares in relation to income earned and/or fluctuating fair value of the investments of the Fund.
bBased on average daily shares outstanding.
cRecognition of net investment income by the Fund is affected by the timing of declaration of dividends by the Underlying Funds and exchange traded funds in which the Fund invests.
dTotal return does not include fees, charges or expenses imposed by the variable annuity and life insurance contracts for which Franklin Templeton Variable Insurance Products Trust serves as an underlying investment vehicle. Total return is not annualized for periods less than one year.
eRatios are annualized for periods less than one year.
fBenefit of expense reduction rounds to less than 0.01%.
gSee Note 1(f) regarding mortgage dollar rolls.
| | | | |
| | | |
| FFA-6 | | Semiannual Report | The accompanying notes are an integral part of these financial statements. | | |
FRANKLIN TEMPLETON VARIABLE INSURANCE PRODUCTS TRUST
FINANCIAL HIGHLIGHTS
Franklin Allocation VIP Fund (continued)
| | | | | | | | | | | | | | | | | | | | | | | | |
| | | Six Months Ended June 30, 2020 (unaudited) | | | Year Ended December 31, | |
| | | 2019 | | | 2018 | | | 2017 | | | 2016 | | | 2015 | |
| | | | | | |
Class 2 | | | | | | | | | | | | | | | | | | | | | | | | |
| | | | | | |
| Per share operating performance | | | | | | | | | | | | | | | | | | | | | | | | |
(for a share outstanding throughout the period) | | | | | | | | | | | | | | | | | | | | | | | | |
| | | | | | |
Net asset value, beginning of period | | | $ 6.81 | | | | $ 6.32 | | | | $ 7.39 | | | | $ 7.08 | | | | $ 6.75 | | | | $ 7.42 | |
| | | | | | |
| Income from investment operationsa: | | | | | | | | | | | | | | | | | | | | | | | | |
| | | | | | |
Net investment incomeb | | | 0.06 | | | | 0.09 | c | | | 0.21 | c | | | 0.18 | c | | | 0.19 | c | | | 0.24 | c |
| | | | | | |
Net realized and unrealized gains (losses) | | | (0.18 | ) | | | 1.11 | | | | (0.89 | ) | | | 0.64 | | | | 0.64 | | | | (0.68 | ) |
| | | | | | |
Total from investment operations | | | (0.12 | ) | | | 1.20 | | | | (0.68 | ) | | | 0.82 | | | | 0.83 | | | | (0.44 | ) |
| | | | | | |
| Less distributions from: | | | | | | | | | | | | | | | | | | | | | | | | |
| | | | | | |
Net investment income | | | (0.10 | ) | | | (0.25 | ) | | | (0.22 | ) | | | (0.20 | ) | | | (0.27 | ) | | | (0.22 | ) |
| | | | | | |
Net realized gains | | | (1.80 | ) | | | (0.46 | ) | | | (0.17 | ) | | | (0.31 | ) | | | (0.23 | ) | | | (0.01 | ) |
| | | | | | |
| Total distributions | | | (1.90 | ) | | | (0.71 | ) | | | (0.39 | ) | | | (0.51 | ) | | | (0.50 | ) | | | (0.23 | ) |
| | | | | | |
| Net asset value, end of period | | | $ 4.79 | | | | $ 6.81 | | | | $ 6.32 | | | | $ 7.39 | | | | $ 7.08 | | | | $ 6.75 | |
| | | | | | |
Total returnd | | | (1.43)% | | | | 19.86% | | | | (9.65)% | | | | 11.98% | | | | 13.18% | | | | (6.21)% | |
| | | | | | |
| Ratios to average net assetse | | | | | | | | | | | | | | | | | | | | | | | | |
| | | | | | |
Expenses before waiver and payments by affiliates | | | 0.84% | | | | 0.69% | | | | 0.37% | | | | 0.37% | | | | 0.36% | | | | 0.36% | |
| | | | | | |
Expenses net of waiver and payments by affiliates | | | 0.79%f | | | | 0.64% | | | | 0.35% | | | | 0.35% | | | | 0.35% | | | | 0.35% | |
| | | | | | |
Net investment income | | | 2.07% | | | | 1.30% | | | | 2.88% | | | | 2.50% | | | | 2.84% | | | | 3.26% | |
| | | | | | |
| Supplemental data | | | | | | | | | | | | | | | | | | | | | | | | |
| | | | | | |
Net assets, end of period (000’s) | | | $371,639 | | | | $403,040 | | | | $390,300 | | | | $480,402 | | | | $474,669 | | | | $480,715 | |
| | | | | | |
Portfolio turnover rate | | | 49.61% | | | | 170.79% | | | | 2.23% | | | | 1.28% | | | | 0.10% | | | | 0.26% | |
| | | | | | |
Portfolio turnover rate excluding mortgage dollar rolls | | | 42.14% | g | | | 158.11% | g | | | 2.23% | | | | 1.28% | | | | 0.10% | | | | 0.26% | |
aThe amount shown for a share outstanding throughout the period may not correlate with the Statement of Operations for the period due to the timing of sales and repurchases of the Fund’s shares in relation to income earned and/or fluctuating fair value of the investments of the Fund.
bBased on average daily shares outstanding.
cRecognition of net investment income by the Fund is affected by the timing of declaration of dividends by the Underlying Funds and exchange traded funds in which the Fund invests.
dTotal return does not include fees, charges or expenses imposed by the variable annuity and life insurance contracts for which Franklin Templeton Variable Insurance Products Trust serves as an underlying investment vehicle. Total return is not annualized for periods less than one year.
eRatios are annualized for periods less than one year.
fBenefit of expense reduction rounds to less than 0.01%.
gSee Note 1(f) regarding mortgage dollar rolls.
| | | | | | |
| | | |
| | The accompanying notes are an integral part of these financial statements. | Semiannual Report | | | FFA-7 | |
FRANKLIN TEMPLETON VARIABLE INSURANCE PRODUCTS TRUST
FINANCIAL HIGHLIGHTS
Franklin Allocation VIP Fund (continued)
| | | | | | | | | | | | | | | | | | | | | | | | |
| | | Six Months Ended June 30, 2020 (unaudited) | | | Year Ended December 31, | |
| | | 2019 | | | 2018 | | | 2017 | | | 2016 | | | 2015 | |
| | | | | | |
Class 4 | | | | | | | | | | | | | | | | | | | | | | | | |
| | | | | | |
| Per share operating performance | | | | | | | | | | | | | | | | | | | | | | | | |
(for a share outstanding throughout the period) | | | | | | | | | | | | | | | | | | | | | | | | |
| | | | | | |
Net asset value, beginning of period | | | $ 6.97 | | | | $ 6.46 | | | | $ 7.53 | | | | $ 7.21 | | | | $ 6.87 | | | | $ 7.54 | |
| | | | | | |
| Income from investment operationsa: | | | | | | | | | | | | | | | | | | | | | | | | |
| | | | | | |
Net investment incomeb | | | 0.06 | | | | 0.08 | c | | | 0.20 | c | | | 0.18 | c | | | 0.19c | | | | 0.23 | c |
| | | | | | |
Net realized and unrealized gains (losses) | | | (0.18 | ) | | | 1.13 | | | | (0.89 | ) | | | 0.64 | | | | 0.64 | | | | (0.68 | ) |
| | | | | | |
Total from investment operations | | | (0.12 | ) | | | 1.21 | | | | (0.69 | ) | | | 0.82 | | | | 0.83 | | | | (0.45 | ) |
| | | | | | |
| Less distributions from: | | | | | | | | | | | | | | | | | | | | | | | | |
| | | | | | |
Net investment income | | | (0.09 | ) | | | (0.24 | ) | | | (0.21 | ) | | | (0.19 | ) | | | (0.26 | ) | | | (0.21 | ) |
| | | | | | |
Net realized gains | | | (1.80 | ) | | | (0.46 | ) | | | (0.17 | ) | | | (0.31 | ) | | | (0.23 | ) | | | (0.01 | ) |
| | | | | | |
| Total distributions | | | (1.89 | ) | | | (0.70 | ) | | | (0.38 | ) | | | (0.50 | ) | | | (0.49 | ) | | | (0.22 | ) |
| | | | | | |
| Net asset value, end of period | | | $ 4.96 | | | | $ 6.97 | | | | $ 6.46 | | | | $ 7.53 | | | | $ 7.21 | | | | $ 6.87 | |
| | | | | | |
Total returnd | | | (1.37)% | | | | 19.56% | | | | (9.58)% | | | | 11.78% | | | | 12.92% | | | | (6.24)% | |
| | | | | | |
| Ratios to average net assetse | | | | | | | | | | | | | | | | | | | | | | | | |
| | | | | | |
Expenses before waiver and payments by affiliates | | | 0.94% | | | | 0.79% | | | | 0.47% | | | | 0.47% | | | | 0.46% | | | | 0.46% | |
| | | | | | |
Expenses net of waiver and payments by affiliates | | | 0.89%f | | | | 0.74% | | | | 0.45% | | | | 0.45% | | | | 0.45% | | | | 0.45% | |
| | | | | | |
Net investment income | | | 1.97% | | | | 1.20% | | | | 2.78% | | | | 2.40% | | | | 2.74% | | | | 3.16% | |
| | | | | | |
| Supplemental data | | | | | | | | | | | | | | | | | | | | | | | | |
| | | | | | |
Net assets, end of period (000’s) | | | $378,968 | | | | $406,693 | | | | $393,385 | | | | $528,862 | | | | $530,403 | | | | $550,825 | |
| | | | | | |
Portfolio turnover rate | | | 49.61% | | | | 170.79% | | | | 2.23% | | | | 1.28% | | | | 0.10% | | | | 0.26% | |
| | | | | | |
Portfolio turnover rate excluding mortgage dollar rolls | | | 42.14% | g | | | 158.11% | g | | | 2.23% | | | | 1.28% | | | | 0.10% | | | | 0.26% | |
aThe amount shown for a share outstanding throughout the period may not correlate with the Statement of Operations for the period due to the timing of sales and repurchases of the Fund’s shares in relation to income earned and/or fluctuating fair value of the investments of the Fund.
bBased on average daily shares outstanding.
cRecognition of net investment income by the Fund is affected by the timing of declaration of dividends by the Underlying Funds and exchange traded funds in which the Fund invests.
dTotal return does not include fees, charges or expenses imposed by the variable annuity and life insurance contracts for which Franklin Templeton Variable Insurance Products Trust serves as an underlying investment vehicle. Total return is not annualized for periods less than one year.
eRatios are annualized for periods less than one year.
fBenefit of expense reduction rounds to less than 0.01%.
gSee Note 1(f) regarding mortgage dollar rolls.
| | | | |
| | | |
| FFA-8 | | Semiannual Report | The accompanying notes are an integral part of these financial statements. | | |
FRANKLIN TEMPLETON VARIABLE INSURANCE PRODUCTS TRUST
Statement of Investments, June 30, 2020 (unaudited)
Franklin Allocation VIP Fund
| | | | | | | | | | | | | | |
| | | | | Country/
Organization | | | Shares/
Rights | | | Value | |
| | | | |
| | Common Stocks and Other Equity Interests 58.5% | | | | | | | | | | | | |
| | Automobiles & Components 0.7% | | | | | | | | | | | | |
| | Aptiv PLC | | | United States | | | | 7,000 | | | $ | 545,440 | |
| | Bayerische Motoren Werke AG | | | Germany | | | | 8,162 | | | | 521,021 | |
| | Cie Generale des Etablissements Michelin SCA | | | France | | | | 8,517 | | | | 887,674 | |
| a | | Faurecia SE | | | France | | | | 3,230 | | | | 126,891 | |
| a | | Fiat Chrysler Automobiles NV | | | United Kingdom | | | | 36,368 | | | | 367,942 | |
| | General Motors Co. | | | United States | | | | 18,814 | | | | 475,994 | |
| | Gentex Corp. | | | United States | | | | 8,426 | | | | 217,138 | |
| | Honda Motor Co. Ltd. | | | Japan | | | | 16,200 | | | | 418,830 | |
| | Isuzu Motors Ltd. | | | Japan | | | | 67,200 | | | | 610,669 | |
| | Lear Corp. | | | United States | | | | 1,868 | | | | 203,649 | |
| a | | Peugeot SA | | | France | | | | 25,032 | | | | 410,467 | |
| | Toyota Industries Corp. | | | Japan | | | | 6,500 | | | | 345,492 | |
| | | | | | | | | | | | | | |
| | | | |
| | | | | | | | | | | | | 5,131,207 | |
| | | | | | | | | | | | | | |
| | | | |
| | Banks 1.2% | | | | | | | | | | | | |
| | Banco de Sabadell SA | | | Spain | | | | 242,207 | | | | 85,090 | |
| a | | Bank of Ireland Group PLC | | | Ireland | | | | 32,153 | | | | 66,246 | |
| a | | FinecoBank Banca Fineco SpA | | | Italy | | | | 135,215 | | | | 1,829,846 | |
| | Housing Development Finance Corp. Ltd. | | | India | | | | 27,108 | | | | 629,974 | |
| | ING Groep NV | | | Netherlands | | | | 149,749 | | | | 1,043,793 | |
| | Kasikornbank PCL, fgn | | | Thailand | | | | 96,700 | | | | 293,867 | |
| | KB Financial Group Inc. | | | South Korea | | | | 29,025 | | | | 823,885 | |
| | KBC Groep NV | | | Belgium | | | | 24,134 | | | | 1,386,404 | |
| | Shinhan Financial Group Co. Ltd. | | | South Korea | | | | 14,863 | | | | 360,143 | |
| | Shinsei Bank Ltd. | | | Japan | | | | 8,000 | | | | 96,762 | |
| | Standard Chartered PLC | | | United Kingdom | | | | 211,107 | | | | 1,144,321 | |
| | Sumitomo Mitsui Financial Group Inc. | | | Japan | | | | 30,100 | | | | 849,476 | |
| | Sumitomo Mitsui Financial Group Inc., ADR | | | Japan | | | | 112,000 | | | | 629,440 | |
| | | | | | | | | | | | | | |
| | | | |
| | | | | | | | | | | | | 9,239,247 | |
| | | | | | | | | | | | | | |
| | | | |
| | Capital Goods 5.9% | | | | | | | | | | | | |
| | 3M Co. | | | United States | | | | 8,752 | | | | 1,365,225 | |
| | Allegion PLC | | | United States | | | | 4,871 | | | | 497,914 | |
| | Allison Transmission Holdings Inc. | | | United States | | | | 2,215 | | | | 81,468 | |
| | Amada Co. Ltd. | | | Japan | | | | 13,500 | | | | 110,536 | |
| | AMETEK Inc. | | | United States | | | | 4,018 | | | | 359,089 | |
| a | | Andritz AG | | | Austria | | | | 3,171 | | | | 115,607 | |
| | Atlas Copco AB | | | Sweden | | | | 7,152 | | | | 265,723 | |
| | Atlas Copco AB, A | | | Sweden | | | | 11,437 | | | | 486,992 | |
| | BAE Systems PLC | | | United Kingdom | | | | 77,090 | | | | 460,938 | |
| | BWX Technologies Inc. | | | United States | | | | 8,401 | | | | 475,833 | |
| | CAE Inc. | | | Canada | | | | 15,000 | | | | 243,306 | |
| | Carlisle Cos. Inc. | | | United States | | | | 3,400 | | | | 406,878 | |
| | Caterpillar Inc. | | | United States | | | | 3,346 | | | | 423,269 | |
| | CK Hutchison Holdings Ltd. | | | Hong Kong | | | | 152,000 | | | | 984,283 | |
| | Cummins Inc. | | | United States | | | | 4,550 | | | | 788,333 | |
| a | | Dassault Aviation SA | | | France | | | | 253 | | | | 232,106 | |
| | Deere & Co. | | | United States | | | | 3,086 | | | | 484,965 | |
FRANKLIN TEMPLETON VARIABLE INSURANCE PRODUCTS TRUST
STATEMENT OF INVESTMENTS (UNAUDITED)
Franklin Allocation VIP Fund (continued)
| | | | | | | | | | | | | | |
| | | | | Country/
Organization | | | Shares/
Rights | | | Value | |
| | | | |
| | Common Stocks and Other Equity Interests (continued) | | | | | | | | | | | | |
| | Capital Goods (continued) | | | | | | | | | | | | |
| | Donaldson Co. Inc. | | | United States | | | | 8,500 | | | $ | 395,420 | |
| | Dover Corp. | | | United States | | | | 8,900 | | | | 859,384 | |
| | Emerson Electric Co. | | | United States | | | | 18,102 | | | | 1,122,867 | |
| | Epiroc AB, A | | | Sweden | | | | 9,709 | | | | 121,643 | |
| | Epiroc AB, B | | | Sweden | | | | 17,653 | | | | 216,773 | |
| | Fastenal Co. | | | United States | | | | 34,853 | | | | 1,493,103 | |
| | Ferguson PLC | | | United Kingdom | | | | 15,500 | | | | 1,267,330 | |
| | Fortive Corp. | | | United States | | | | 6,517 | | | | 440,940 | |
| | Geberit AG | | | Switzerland | | | | 1,568 | | | | 786,721 | |
| | General Dynamics Corp. | | | United States | | | | 8,887 | | | | 1,328,251 | |
| | Graco Inc. | | | United States | | | | 4,752 | | | | 228,048 | |
| | GrafTech International Ltd. | | | United States | | | | 844 | | | | 6,735 | |
| | Honeywell International Inc. | | | United States | | | | 19,445 | | | | 2,811,553 | |
| | Huntington Ingalls Industries Inc. | | | United States | | | | 1,176 | | | | 205,200 | |
| | Illinois Tool Works Inc. | | | United States | | | | 10,617 | | | | 1,856,382 | |
| a | | Ingersoll-Rand Inc. | | | United States | | | | 5,626 | | | | 158,203 | |
| | Johnson Controls International PLC | | | United States | | | | 22,400 | | | | 764,736 | |
| | Kingspan Group PLC | | | Ireland | | | | 2,612 | | | | 168,606 | |
| | Komatsu Ltd. | | | Japan | | | | 22,800 | | | | 466,956 | |
| | Kone OYJ, B | | | Finland | | | | 6,442 | | | | 444,261 | |
| | Kurita Water Industries Ltd. | | | Japan | | | | 4,000 | | | | 111,272 | |
| | Lennox International Inc. | | | United States | | | | 502 | | | | 116,961 | |
| | Lockheed Martin Corp. | | | United States | | | | 6,731 | | | | 2,456,277 | |
| | Masco Corp. | | | United States | | | | 2,247 | | | | 112,822 | |
| a | | Mercury Systems Inc. | | | United States | | | | 3,640 | | | | 286,322 | |
| | Mitsubishi Electric Corp. | | | Japan | | | | 54,100 | | | | 706,614 | |
| | MSC Industrial Direct Co. Inc., A | | | United States | | | | 1,257 | | | | 91,522 | |
| | MTU Aero Engines AG | | | Germany | | | | 7,900 | | | | 1,375,272 | |
| | Northrop Grumman Corp. | | | United States | | �� | | 7,855 | | | | 2,414,941 | |
| | nVent Electric PLC | | | United States | | | | 15,900 | | | | 297,807 | |
| | Obayashi Corp. | | | Japan | | | | 27,400 | | | | 257,600 | |
| | Otis Worldwide Corp. | | | United States | | | | 7,237 | | | | 411,496 | |
| | PACCAR Inc. | | | United States | | | | 4,976 | | | | 372,454 | |
| | Pentair PLC | | | United States | | | | 13,900 | | | | 528,061 | |
| | Raytheon Technologies Corp. | | | United States | | | | 50,395 | | | | 3,105,340 | |
| | Rockwell Automation Inc. | | | United States | | | | 3,621 | | | | 771,273 | |
| | Roper Technologies Inc. | | | United States | | | | 8,700 | | | | 3,377,862 | |
| | Schneider Electric SE | | | France | | | | 6,764 | | | | 752,338 | |
| | Siemens AG | | | Germany | | | | 4,442 | | | | 523,830 | |
| | Sinopec Engineering Group Co. Ltd. | | | China | | | | 615,000 | | | | 264,064 | |
| | SKF AB, B | | | Sweden | | | | 15,639 | | | | 292,313 | |
| | Snap-on Inc. | | | United States | | | | 1,016 | | | | 140,726 | |
| | Stanley Black & Decker Inc. | | | United States | | | | 4,652 | | | | 648,396 | |
| | Sumitomo Heavy Industries Ltd. | | | Japan | | | | 4,500 | | | | 98,420 | |
| | Toro Co. | | | United States | | | | 3,572 | | | | 236,967 | |
| | Trane Technologies PLC | | | United States | | | | 6,456 | | | | 574,455 | |
| | W.W. Grainger Inc. | | | United States | | | | 3,289 | | | | 1,033,272 | |
FRANKLIN TEMPLETON VARIABLE INSURANCE PRODUCTS TRUST
STATEMENT OF INVESTMENTS (UNAUDITED)
Franklin Allocation VIP Fund (continued)
| | | | | | | | | | | | | | |
| | | | | Country/
Organization | | | Shares/
Rights | | | Value | |
| | | | |
| | Common Stocks and Other Equity Interests (continued) | | | | | | | | | | | | |
| | Capital Goods (continued) | | | | | | | | | | | | |
| | Watsco Inc. | | | United States | | | | 809 | | | $ | 143,759 | |
| | Yangzijiang Shipbuilding Holdings Ltd. | | | Singapore | | | | 98,600 | | | | 66,379 | |
| | | | | | | | | | | | | | |
| | | | |
| | | | | | | | | | | | | 44,494,392 | |
| | | | | | | | | | | | | | |
| | | | |
| | Commercial & Professional Services 1.6% | | | | | | | | | | | | |
| | Adecco Group AG | | | Switzerland | | | | 6,392 | | | | 301,291 | |
| | Cintas Corp. | | | United States | | | | 6,084 | | | | 1,620,534 | |
| a | | Copart Inc. | | | United States | | | | 6,003 | | | | 499,870 | |
| a | | CoStar Group Inc. | | | United States | | | | 300 | | | | 213,201 | |
| | Equifax Inc. | | | United States | | | | 3,190 | | | | 548,297 | |
| | Experian PLC | | | United Kingdom | | | | 45,000 | | | | 1,579,384 | |
| a | | IAA Inc. | | | United States | | | | 1,139 | | | | 43,931 | |
| | IHS Markit Ltd. | | | United States | | | | 21,309 | | | | 1,608,829 | |
| | KAR Auction Services Inc. | | | United States | | | | 1,042 | | | | 14,338 | |
| | ManpowerGroup Inc. | | | United States | | | | 57 | | | | 3,919 | |
| | Matthews International Corp., A | | | United States | | | | 5,800 | | | | 110,780 | |
| | Persol Holdings Co. Ltd. | | | Japan | | | | 6,900 | | | | 95,129 | |
| | Randstad NV | | | Netherlands | | | | 4,940 | | | | 220,873 | |
| | Recruit Holdings Co. Ltd. | | | Japan | | | | 11,000 | | | | 378,292 | |
| | RELX PLC | | | United Kingdom | | | | 36,436 | | | | 843,305 | |
| | Republic Services Inc. | | | United States | | | | 3,900 | | | | 319,995 | |
| | Robert Half International Inc. | | | United States | | | | 4,264 | | | | 225,267 | |
| | Rollins Inc. | | | United States | | | | 4,605 | | | | 195,206 | |
| | SGS SA | | | Switzerland | | | | 267 | | | | 654,055 | |
| | Verisk Analytics Inc. | | | United States | | | | 8,961 | | | | 1,525,162 | |
| | Wolters Kluwer NV | | | Netherlands | | | | 11,387 | | | | 889,311 | |
| | | | | | | | | | | | | | |
| | | | |
| | | | | | | | | | | | | 11,890,969 | |
| | | | | | | | | | | | | | |
| | | | |
| | Consumer Durables & Apparel 1.5% | | | | | | | | | | | | |
| a | | Adidas AG | | | Germany | | | | 785 | | | | 206,948 | |
| | Bandai Namco Holdings Inc. | | | Japan | | | | 1,500 | | | | 78,957 | |
| | Barratt Developments PLC | | | United Kingdom | | | | 19,371 | | | | 119,052 | |
| | The Berkeley Group Holdings PLC | | | United Kingdom | | | | 4,927 | | | | 253,731 | |
| | Burberry Group PLC | | | United Kingdom | | | | 7,850 | | | | 155,111 | |
| a | | Capri Holdings Ltd. | | | United States | | | | 4,944 | | | | 77,275 | |
| | Carter’s Inc. | | | United States | | | | 1,386 | | | | 111,850 | |
| | D.R. Horton Inc. | | | United States | | | | 2,668 | | | | 147,941 | |
| | Garmin Ltd. | | | United States | | | | 4,296 | | | | 418,860 | |
| | Hanesbrands Inc. | | | United States | | | | 5,102 | | | | 57,602 | |
| | Hasbro Inc. | | | United States | | | | 3,501 | | | | 262,400 | |
| | Hermes International | | | France | | | | 878 | | | | 737,110 | |
| | Leggett & Platt Inc. | | | United States | | | | 3,927 | | | | 138,034 | |
| a | | Lululemon Athletica Inc. | | | United States | | | | 3,432 | | | | 1,070,818 | |
| a | | Moncler SpA | | | Italy | | | | 5,423 | | | | 208,515 | |
| | NIKE Inc., B | | | United States | | | | 40,408 | | | | 3,962,005 | |
| a | | NVR Inc | | | United States | | | | 112 | | | | 364,980 | |
| | Pandora AS | | | Denmark | | | | 4,400 | | | | 240,280 | |
a | | Persimmon PLC | | | United Kingdom | | | | 8,975 | | | | 253,996 | |
FRANKLIN TEMPLETON VARIABLE INSURANCE PRODUCTS TRUST
STATEMENT OF INVESTMENTS (UNAUDITED)
Franklin Allocation VIP Fund (continued)
| | | | | | | | | | | | | | |
| | | | | Country/
Organization | | | Shares/
Rights | | | Value | |
| | | | |
| | Common Stocks and Other Equity Interests (continued) | | | | | | | | | | | | |
| | Consumer Durables & Apparel (continued) | | | | | | | | | | | | |
| | PulteGroup Inc. | | | United States | | | | 3,970 | | | $ | 135,099 | |
| | Sekisui Chemical Co. Ltd. | | | Japan | | | | 13,100 | | | | 187,693 | |
| | Sekisui House Ltd. | | | Japan | | | | 25,600 | | | | 488,759 | |
| | Sony Corp. | | | Japan | | | | 7,700 | | | | 531,532 | |
| | Tapestry Inc. | | | United States | | | | 9,480 | | | | 125,894 | |
| | Taylor Wimpey PLC | | | United Kingdom | | | | 87,452 | | | | 154,347 | |
| | VF Corp. | | | United States | | | | 9,705 | | | | 591,423 | |
| | Whirlpool Corp. | | | United States | | | | 525 | | | | 68,003 | |
| | | | | | | | | | | | | | |
| | | | |
| | | | | | | | | | | | | 11,148,215 | |
| | | | | | | | | | | | | | |
| | | | |
| | Consumer Services 1.0% | | | | | | | | | | | | |
| | Carnival Corp. | | | United States | | | | 11,718 | | | | 192,409 | |
| | Choice Hotels International Inc. | | | United States | | | | 1,034 | | | | 81,583 | |
| | Darden Restaurants Inc. | | | United States | | | | 4,295 | | | | 325,432 | |
| | Domino’s Pizza Inc. | | | United States | | | | 1,302 | | | | 481,011 | |
| | H&R Block Inc. | | | United States | | | | 7,332 | | | | 104,701 | |
| | Las Vegas Sands Corp. | | | United States | | | | 17,329 | | | | 789,163 | |
| | McDonald’s Corp. | | | United States | | | | 13,301 | | | | 2,453,635 | |
| | Six Flags Entertainment Corp. | | | United States | | | | 1,814 | | | | 34,847 | |
| | Starbucks Corp. | | | United States | | | | 10,065 | | | | 740,683 | |
| a | | TAL Education Group, ADR | | | China | | | | 23,000 | | | | 1,572,740 | |
| | Wyndham Destinations Inc. | | | United States | | | | 1,962 | | | | 55,289 | |
| | Yum! Brands Inc. | | | United States | | | | 11,125 | | | | 966,874 | |
| | | | | | | | | | | | | | |
| | | | |
| | | | | | | | | | | | | 7,798,367 | |
| | | | | | | | | | | | | | |
| | | | |
| | Diversified Financials 2.2% | | | | | | | | | | | | |
| | 3i Group PLC | | | United Kingdom | | | | 40,649 | | | | 418,546 | |
| | American Express Co. | | | United States | | | | 3,590 | | | | 341,768 | |
| a | | Amundi SA | | | France | | | | 2,687 | | | | 211,215 | |
| a | | Berkshire Hathaway Inc., B | | | United States | | | | 6,469 | | | | 1,154,781 | |
| | BlackRock Inc. | | | United States | | | | 1,465 | | | | 797,092 | |
| | Challenger Ltd. | | | Australia | | | | 17,538 | | | | 54,303 | |
| | The Charles Schwab Corp. | | | United States | | | | 17,831 | | | | 601,618 | |
| | Daiwa Securities Group Inc. | | | Japan | | | | 33,500 | | | | 140,730 | |
| | Deutsche Boerse AG | | | Germany | | | | 9,427 | | | | 1,705,916 | |
| | EXOR NV | | | Netherlands | | | | 3,689 | | | | 211,720 | |
| | FactSet Research Systems Inc. | | | United States | | | | 1,114 | | | | 365,916 | |
| | Flow Traders | | | Netherlands | | | | 10,867 | | | | 388,782 | |
| | Hargreaves Lansdown PLC | | | United Kingdom | | | | 11,932 | | | | 240,612 | |
| | Hong Kong Exchanges and Clearing Ltd. | | | Hong Kong | | | | 24,800 | | | | 1,056,267 | |
| | Intercontinental Exchange Inc. | | | United States | | | | 8,255 | | | | 756,158 | |
| | Intermediate Capital Group PLC | | | United Kingdom | | | | 74,000 | | | | 1,180,534 | |
| | Invesco Ltd. | | | United States | | | | 7,131 | | | | 76,730 | |
| | Japan Exchange Group Inc. | | | Japan | | | | 2,600 | | | | 60,216 | |
| | Lazard Ltd., A | | | United States | | | | 3,513 | | | | 100,577 | |
| | M&G PLC | | | United Kingdom | | | | 112,702 | | | | 234,010 | |
| | Magellan Financial Group Ltd. | | | Australia | | | | 5,399 | | | | 220,439 | |
| | MarketAxess Holdings Inc. | | | United States | | | | 1,105 | | | | 553,517 | |
FRANKLIN TEMPLETON VARIABLE INSURANCE PRODUCTS TRUST
STATEMENT OF INVESTMENTS (UNAUDITED)
Franklin Allocation VIP Fund (continued)
| | | | | | | | | | | | | | |
| | | | | Country/
Organization | | | Shares/
Rights | | | Value | |
| | | | |
| | Common Stocks and Other Equity Interests (continued) | | | | | | | | | | | | |
| | Diversified Financials (continued) | | | | | | | | | | | | |
| | MFA Financial Inc. | | | United States | | | | 4,330 | | | $ | 10,782 | |
| | Mitsubishi UFJ Lease & Finance Co. Ltd. | | | Japan | | | | 16,800 | | | | 80,167 | |
| | Moody’s Corp. | | | United States | | | | 2,363 | | | | 649,187 | |
| | Morningstar Inc. | | | United States | | | | 545 | | | | 76,829 | |
| | MSCI Inc. | | | United States | | | | 2,378 | | | | 793,824 | |
| | Nasdaq Inc. | | | United States | | | | 1,600 | | | | 191,152 | |
| a | | Natixis SA | | | France | | | | 39,782 | | | | 104,917 | |
| | Nomura Holdings Inc. | | | Japan | | | | 46,600 | | | | 209,401 | |
| | ORIX Corp. | | | Japan | | | | 46,500 | | | | 577,402 | |
| | Partners Group Holding AG | | �� | Switzerland | | | | 780 | | | | 710,340 | |
| | S&P Global Inc. | | | United States | | | | 2,099 | | | | 691,579 | |
| | Santander Consumer USA Holdings Inc. | | | United States | | | | 3,125 | | | | 57,531 | |
| | SEI Investments Co. | | | United States | | | | 3,055 | | | | 167,964 | |
| | Singapore Exchange Ltd. | | | Singapore | | | | 34,000 | | | | 204,608 | |
| | State Street Corp. | | | United States | | | | 2,700 | | | | 171,585 | |
| | T. Rowe Price Group Inc. | | | United States | | | | 7,039 | | | | 869,316 | |
| | Tradeweb Markets Inc. | | | United States | | | | 2,100 | | | | 122,094 | |
| | UBS Group AG | | | Switzerland | | | | 4,941 | | | | 57,064 | |
| | | | | | | | | | | | | | |
| | | | |
| | | | | | | | | | | | | 16,617,189 | |
| | | | | | | | | | | | | | |
| | | | |
| | Energy 1.3% | | | | | | | | | | | | |
| | Ampol Ltd. | | | Australia | | | | 10,004 | | | | 203,815 | |
| | BP PLC | | | United Kingdom | | | | 168,151 | | | | 644,167 | |
| | Cabot Oil & Gas Corp., A | | | United States | | | | 6,007 | | | | 103,200 | |
| | Chevron Corp. | | | United States | | | | 6,700 | | | | 597,841 | |
| | Cimarex Energy Co. | | | United States | | | | 1,926 | | | | 52,946 | |
| | ConocoPhillips | | | United States | | | | 15,805 | | | | 664,126 | |
| | Eni SpA | | | Italy | | | | 9,775 | | | | 93,695 | |
| | EOG Resources Inc. | | | United States | | | | 6,000 | | | | 303,960 | |
| | Equinor ASA | | | Norway | | | | 51,818 | | | | 746,655 | |
| | Exxon Mobil Corp. | | | United States | | | | 28,776 | | | | 1,286,863 | |
| | Galp Energia SGPS SA, B | | | Portugal | | | | 38,527 | | | | 446,873 | |
| | HollyFrontier Corp. | | | United States | | | | 2,216 | | | | 64,707 | |
| | Husky Energy Inc. | | | Canada | | | | 82,500 | | | | 271,040 | |
| | Neste Oil OYJ | | | Finland | | | | 8,059 | | | | 316,498 | |
| | ONEOK Inc. | | | United States | | | | 3,393 | | | | 112,715 | |
| | Phillips 66 | | | United States | | | | 10,544 | | | | 758,114 | |
| | Royal Dutch Shell PLC, B | | | United Kingdom | | | | 45,465 | | | | 689,235 | |
| | SBM Offshore NV | | | Netherlands | | | | 46,666 | | | | 687,586 | |
| | Tenaris SA | | | Italy | | | | 20,416 | | | | 132,664 | |
| | Total SA | | | France | | | | 22,632 | | | | 872,577 | |
| | Valero Energy Corp. | | | United States | | | | 12,245 | | | | 720,251 | |
| | | | | | | | | | | | | | |
| | | | |
| | | | | | | | | | | | | 9,769,528 | |
| | | | | | | | | | | | | | |
| | | | |
| | Food & Staples Retailing 1.3% | | | | | | | | | | | | |
| | Casey’s General Stores Inc. | | | United States | | | | 947 | | | | 141,595 | |
| | Coles Group Ltd. | | | Australia | | | | 13,349 | | | | 158,661 | |
| | Costco Wholesale Corp. | | | United States | | | | 4,887 | | | | 1,481,787 | |
FRANKLIN TEMPLETON VARIABLE INSURANCE PRODUCTS TRUST
STATEMENT OF INVESTMENTS (UNAUDITED)
Franklin Allocation VIP Fund (continued)
| | | | | | | | | | | | | | |
| | | | | Country/
Organization | | | Shares/
Rights | | | Value | |
| | | | |
| | Common Stocks and Other Equity Interests (continued) | | | | | | | | | | | | |
| | Food & Staples Retailing (continued) | | | | | | | | | | | | |
| a | | Jeronimo Martins SGPS SA | | | Portugal | | | | 7,526 | | | $ | 131,693 | |
| | Koninklijke Ahold Delhaize NV | | | Netherlands | | | | 45,170 | | | | 1,230,957 | |
| | The Kroger Co. | | | United States | | | | 14,920 | | | | 505,042 | |
| | Lawson Inc. | | | Japan | | | | 2,000 | | | | 100,601 | |
| | Matsumotokiyoshi Holdings Co. Ltd. | | | Japan | | | | 15,700 | | | | 570,516 | |
| | Seven & i Holdings Co. Ltd. | | | Japan | | | | 8,500 | | | | 278,065 | |
| | Seven & I Holdings Co. Ltd., ADR | | | Japan | | | | 24,600 | | | | 399,750 | |
| a | | Sprouts Farmers Market Inc. | | | United States | | | | 2,539 | | | | 64,973 | |
| | Sundrug Co. Ltd. | | | Japan | | | | 20,200 | | | | 668,533 | |
| | Sysco Corp. | | | United States | | | | 15,175 | | | | 829,466 | |
| | Walgreens Boots Alliance Inc. | | | United States | | | | 17,826 | | | | 755,644 | |
| | Walmart Inc. | | | United States | | | | 20,575 | | | | 2,464,474 | |
| | Welcia Holdings Co. Ltd. | | | Japan | | | | 1,000 | | | | 80,787 | |
| | | | | | | | | | | | | | |
| | | | |
| | | | | | | | | | | | | 9,862,544 | |
| | | | | | | | | | | | | | |
| | | | |
| | Food, Beverage & Tobacco 2.4% | | | | | | | | | | | | |
| a | | a2 Milk Co. Ltd. | | | New Zealand | | | | 4,168 | | | | 54,558 | |
| | Altria Group Inc. | | | United States | | | | 30,176 | | | | 1,184,408 | |
| | Anheuser-Busch InBev SA/NV | | | Belgium | | | | 1,207 | | | | 59,495 | |
| | Brown-Forman Corp., A | | | United States | | | | 1,586 | | | | 91,306 | |
| | Brown-Forman Corp., B | | | United States | | | | 10,899 | | | | 693,830 | |
| | Calbee Inc. | | | Japan | | | | 3,300 | | | | 91,211 | |
| | The Coca-Cola Co. | | | United States | | | | 27,892 | | | | 1,246,215 | |
| | Constellation Brands Inc., A | | | United States | | | | 3,204 | | | | 560,540 | |
| | Flowers Foods Inc. | | | United States | | | | 5,437 | | | | 121,571 | |
| | General Mills Inc. | | | United States | | | | 18,181 | | | | 1,120,859 | |
| | The Hershey Co. | | | United States | | | | 5,251 | | | | 680,635 | |
| | Hormel Foods Corp. | | | United States | | | | 8,792 | | | | 424,390 | |
| | Imperial Brands PLC | | | United Kingdom | | | | 35,970 | | | | 684,720 | |
| | Ingredion Inc. | | | United States | | | | 1,870 | | | | 155,210 | |
| | J M Smucker Co/The | | | United States | | | | 2,302 | | | | 243,575 | |
| | Kellogg Co. | | | United States | | | | 4,386 | | | | 289,739 | |
| | Kirin Holdings Co. Ltd. | | | Japan | | | | 39,200 | | | | 826,326 | |
| | Lamb Weston Holdings Inc. | | | United States | | | | 3,132 | | | | 200,229 | |
| | McCormick & Co. Inc. | | | United States | | | | 5,900 | | | | 1,058,519 | |
| | Mondelez International Inc., A | | | United States | | | | 8,669 | | | | 443,246 | |
| a | | Monster Beverage Corp. | | | United States | | | | 25,224 | | | | 1,748,528 | |
| | Nestle SA | | | Switzerland | | | | 3,119 | | | | 345,805 | |
| | Orkla ASA | | | Norway | | | | 8,204 | | | | 72,045 | |
| | PepsiCo Inc. | | | United States | | | | 23,188 | | | | 3,066,845 | |
| | Philip Morris International Inc. | | | United States | | | | 17,946 | | | | 1,257,297 | |
| | Suntory Beverage & Food Ltd. | | | Japan | | | | 5,300 | | | | 206,797 | |
| | Tyson Foods Inc. | | | United States | | | | 8,574 | | | | 511,953 | |
| b | | WH Group Ltd., Reg S | | | Hong Kong | | | | 435,500 | | | | 376,354 | |
| | Yamazaki Baking Co. Ltd. | | | Japan | | | | 6,100 | | | | 104,781 | |
| | | | | | | | | | | | | | |
| | | | |
| | | | | | | | | | | | | 17,920,987 | |
| | | | | | | | | | | | | | |
FRANKLIN TEMPLETON VARIABLE INSURANCE PRODUCTS TRUST
STATEMENT OF INVESTMENTS (UNAUDITED)
Franklin Allocation VIP Fund (continued)
| | | | | | | | | | | | | | |
| | | | | Country/
Organization | | | Shares/
Rights | | | Value | |
| | | | |
| | Common Stocks and Other Equity Interests (continued) | | | | | | | | | | | | |
| | Health Care Equipment & Services 3.5% | | | | | | | | | | | | |
| | Abbott Laboratories | | | United States | | | | 21,260 | | | $ | 1,943,802 | |
| | Baxter International Inc. | | | United States | | | | 2,315 | | | | 199,322 | |
| | Becton Dickinson and Co. | | | United States | | | | 8,200 | | | | 1,962,014 | |
| | Cerner Corp. | | | United States | | | | 7,697 | | | | 527,629 | |
| | Chemed Corp. | | | United States | | | | 371 | | | | 167,347 | |
| | Cochlear Ltd. | | | Australia | | | | 10,700 | | | | 1,404,588 | |
| | Coloplast AS, B | | | Denmark | | | | 3,667 | | | | 571,512 | |
| | CVS Health Corp. | | | United States | | | | 7,000 | | | | 454,790 | |
| | Danaher Corp. | | | United States | | | | 6,787 | | | | 1,200,145 | |
| | Dentsply Sirona Inc. | | | United States | | | | 5,700 | | | | 251,142 | |
| a | | Edwards Lifesciences Corp. | | | United States | | | | 7,321 | | | | 505,954 | |
| | Fisher & Paykel Healthcare Corp. Ltd. | | | New Zealand | | | | 11,382 | | | | 262,205 | |
| | GN Store Nord AS | | | Denmark | | | | 25,000 | | | | 1,338,128 | |
| a | | Haemonetics Corp. | | | United States | | | | 5,724 | | | | 512,642 | |
| | HCA Healthcare Inc. | | | United States | | | | 5,464 | | | | 530,336 | |
| | Hoya Corp. | | | Japan | | | | 5,000 | | | | 478,795 | |
| a | | IDEXX Laboratories Inc. | | | United States | | | | 645 | | | | 212,953 | |
| a | | Intuitive Surgical Inc. | | | United States | | | | 2,822 | | | | 1,608,060 | |
| a | | Laboratory Corp. of America Holdings | | | United States | | | | 3,110 | | | | 516,602 | |
| a | | LivaNova PLC | | | United Kingdom | | | | 21,000 | | | | 1,010,730 | |
| | Medipal Holdings Corp. | | | Japan | | | | 6,000 | | | | 115,804 | |
| | Medtronic PLC | | | United States | | | | 17,500 | | | | 1,604,750 | |
| a | | Premier Inc., A | | | United States | | | | 636 | | | | 21,802 | |
| | Quest Diagnostics Inc. | | | United States | | | | 5,173 | | | | 589,515 | |
| | ResMed Inc. | | | United States | | | | 3,990 | | | | 766,080 | |
| | Sinopharm Group Co. Ltd., H | | | China | | | | 121,600 | | | | 312,626 | |
| | Stryker Corp. | | | United States | | | | 14,092 | | | | 2,539,238 | |
| | Suzuken Co. Ltd. | | | Japan | | | | 2,900 | | | | 108,343 | |
| | Teleflex Inc. | | | United States | | | | 3,284 | | | | 1,195,310 | |
| | UnitedHealth Group Inc. | | | United States | | | | 2,600 | | | | 766,870 | |
| | Universal Health Services Inc., B | | | United States | | | | 1,389 | | | | 129,024 | |
| a | | Varian Medical Systems Inc. | | | United States | | | | 1,904 | | | | 233,278 | |
| a | | Veeva Systems Inc. | | | United States | | | | 400 | | | | 93,768 | |
| | West Pharmaceutical Services Inc. | | | United States | | | | 8,100 | | | | 1,840,077 | |
| | | | | | | | | | | | | | |
| | | | |
| | | | | | | | | | | | | 25,975,181 | |
| | | | | | | | | | | | | | |
| | | | |
| | Household & Personal Products 1.3% | | | | | | | | | | | | |
| | Church & Dwight Co. Inc. | | | United States | | | | 7,316 | | | | 565,527 | |
| | Clorox Co. | | | United States | | | | 4,417 | | | | 968,957 | |
| | Colgate-Palmolive Co. | | | United States | | | | 31,604 | | | | 2,315,309 | |
| a | | Essity AB, B | | | Sweden | | | | 9,223 | | | | 298,987 | |
| | Estee Lauder Cos. Inc., A | | | United States | | | | 7,118 | | | | 1,343,024 | |
| | Kimberly-Clark Corp. | | | United States | | | | 7,114 | | | | 1,005,564 | |
| | Nu Skin Enterprises Inc., A | | | United States | | | | 1,539 | | | | 58,836 | |
| | The Procter & Gamble Co. | | | United States | | | | 21,338 | | | | 2,551,385 | |
| | Unilever NV | | | United Kingdom | | | | 3,053 | | | | 162,765 | |
FRANKLIN TEMPLETON VARIABLE INSURANCE PRODUCTS TRUST
STATEMENT OF INVESTMENTS (UNAUDITED)
Franklin Allocation VIP Fund (continued)
| | | | | | | | | | | | | | |
| | | | | Country/
Organization | | | Shares/
Rights | | | Value | |
| | | | |
| | Common Stocks and Other Equity Interests (continued) | | | | | | | | | | | | |
| | Household & Personal Products (continued) | | | | | | | | | | | | |
| | Unilever PLC | | | United Kingdom | | | | 5,139 | | | $ | 277,192 | |
| | | | | | | | | | | | | | |
| | | | |
| | | | | | | | | | | | | 9,547,546 | |
| | | | | | | | | | | | | | |
| | | | |
| | Insurance 0.5% | | | | | | | | | | | | |
| | Admiral Group PLC | | | United Kingdom | | | | 7,784 | | | | 220,737 | |
| | Aflac Inc. | | | United States | | | | 9,100 | | | | 327,873 | |
| | AIA Group Ltd. | | | Hong Kong | | | | 104,540 | | | | 978,237 | |
| | Allianz SE | | | Germany | | | | 1,938 | | | | 395,980 | |
| | American National Insurance Co. | | | United States | | | | 258 | | | | 18,594 | |
| | Assured Guaranty Ltd. | | | United States | | | | 1,941 | | | | 47,380 | |
| | Aviva PLC | | | United Kingdom | | | | 103,080 | | | | 349,363 | |
| a | | CNP Assurances | | | France | | | | 7,394 | | | | 85,751 | |
| | Direct Line Insurance Group PLC | | | United Kingdom | | | | 60,093 | | | | 201,487 | |
| | Erie Indemnity Co., A | | | United States | | | | 3,000 | | | | 575,700 | |
| | Fidelity National Financial Inc. | | | United States | | | | 2,105 | | | | 64,539 | |
| | Japan Post Insurance Co. Ltd. | | | Japan | | | | 9,400 | | | | 123,858 | |
| | Medibank Private Ltd. | | | Australia | | | | 29,647 | | | | 61,457 | |
| | MS&AD Insurance Group Holdings Inc. | | | Japan | | | | 6,400 | | | | 176,248 | |
| | NN Group NV | | | Netherlands | | | | 1,839 | | | | 61,799 | |
| | RenaissanceRe Holdings Ltd. | | | United States | | | | 565 | | | | 96,632 | |
| | | | | | | | | | | | | | |
| | | | |
| | | | | | | | | | | | | 3,785,635 | |
| | | | | | | | | | | | | | |
| | | | |
| | Materials 3.3% | | | | | | | | | | | | |
| | Air Products and Chemicals Inc. | | | United States | | | | 15,272 | | | | 3,687,577 | |
| | Albemarle Corp. | | | United States | | | | 15,630 | | | | 1,206,792 | |
| a | | ArcelorMittal SA | | | France | | | | 46,281 | | | | 490,158 | |
| | BHP Group PLC | | | United Kingdom | | | | 14,994 | | | | 306,811 | |
| | Celanese Corp. | | | United States | | | | 9,041 | | | | 780,600 | |
| | Covestro AG | | | Germany | | | | 12,999 | | | | 495,065 | |
| | Eastman Chemical Co. | | | United States | | | | 2,905 | | | | 202,304 | |
| | Ecolab Inc. | | | United States | | | | 9,621 | | | | 1,914,098 | |
| | EMS-Chemie Holding AG | | | Switzerland | | | | 344 | | | | 267,255 | |
| | Evraz PLC | | | Russia | | | | 20,712 | | | | 73,381 | |
| | Fortescue Metals Group Ltd. | | | Australia | | | | 61,175 | | | | 594,637 | |
| | International Flavors & Fragrances Inc. | | | United States | | | | 2,516 | | | | 308,109 | |
| | Johnson Matthey PLC | | | United Kingdom | | | | 11,509 | | | | 299,727 | |
| | Koninklijke DSM NV | | | Netherlands | | | | 12,000 | | | | 1,665,668 | |
| | Linde PLC | | | United Kingdom | | | | 14,985 | | | | 3,178,468 | |
| | LyondellBasell Industries NV, A | | | United States | | | | 11,096 | | | | 729,229 | |
| | Martin Marietta Materials Inc. | | | United States | | | | 2,363 | | | | 488,125 | |
| | NewMarket Corp. | | | United States | | | | 243 | | | | 97,317 | |
| | Nitto Denko Corp. | | | Japan | | | | 6,500 | | | | 368,486 | |
| | Nucor Corp. | | | United States | | | | 4,370 | | | | 180,962 | |
| | Packaging Corp. of America | | | United States | | | | 2,231 | | | | 222,654 | |
| | Reliance Steel & Aluminum Co. | | | United States | | | | 536 | | | | 50,882 | |
| | Rio Tinto Ltd. | | | Australia | | | | 9,594 | | | | 656,840 | |
| | Rio Tinto PLC | | | Australia | | | | 7,923 | | | | 445,861 | |
| | Royal Gold Inc. | | | United States | | | | 493 | | | | 61,290 | |
FRANKLIN TEMPLETON VARIABLE INSURANCE PRODUCTS TRUST
STATEMENT OF INVESTMENTS (UNAUDITED)
Franklin Allocation VIP Fund (continued)
| | | | | | | | | | | | | | |
| | | | | Country/
Organization | | | Shares/
Rights | | | Value | |
| | | | |
| | Common Stocks and Other Equity Interests (continued) | | | | | | | | | | | | |
| | Materials (continued) | | | | | | | | | | | | |
| | Shin-Etsu Chemical Co. Ltd. | | | Japan | | | | 400 | | | $ | 46,945 | |
| | Sonoco Products Co. | | | United States | | | | 2,993 | | | | 156,504 | |
| | Steel Dynamics Inc. | | | United States | | | | 4,132 | | | | 107,804 | |
| | Sumitomo Metal Mining Co. Ltd. | | | Japan | | | | 24,100 | | | | 678,892 | |
| | Symrise AG | | | Germany | | | | 14,000 | | | | 1,635,708 | |
| | Taiheiyo Cement Corp. | | | Japan | | | | 5,000 | | | | 116,171 | |
| | Tosoh Corp. | | | Japan | | | | 30,800 | | | | 423,096 | |
| | Umicore SA | | | Belgium | | | | 36,000 | | | | 1,699,195 | |
| | Valvoline Inc. | | | United States | | | | 2,681 | | | | 51,824 | |
| | Wheaton Precious Metals Corp. | | | Canada | | | | 21,490 | | | | 945,209 | |
| | | | | | | | | | | | | | |
| | | | |
| | | | | | | | | | | | | 24,633,644 | |
| | | | | | | | | | | | | | |
| | | | |
| | Media & Entertainment 2.1% | | | | | | | | | | | | |
| a | | Alphabet Inc., A | | | United States | | | | 2,146 | | | | 3,043,135 | |
| a | | AMC Networks Inc., A | | | United States | | | | 1,108 | | | | 25,916 | |
| | Ascential PLC | | | United Kingdom | | | | 324,885 | | | | 1,165,435 | |
| a | | Baidu Inc., ADR | | | China | | | | 5,625 | | | | 674,381 | |
| | Cable One Inc. | | | United States | | | | 555 | | | | 985,042 | |
| | Cinemark Holdings Inc. | | | United States | | | | 2,017 | | | | 23,296 | |
| | Comcast Corp., A | | | United States | | | | 38,307 | | | | 1,493,207 | |
| a | | CTS Eventim AG & Co. KGaA | | | Germany | | | | 24,000 | | | | 1,002,055 | |
| | CyberAgent Inc. | | | Japan | | | | 35,000 | | | | 1,720,378 | |
| a | | Facebook Inc., A | | | United States | | | | 12,128 | | | | 2,753,905 | |
| | The Interpublic Group of Cos. Inc. | | | United States | | | | 8,214 | | | | 140,952 | |
| | Kakaku.com Inc. | | | Japan | | | | 5,700 | | | | 145,203 | |
| a | | Match Group Inc. | | | United States | | | | 1,348 | | | | 144,304 | |
| a | | Match Group Inc. | | | United States | | | | 2,007 | | | | 649,064 | |
| | Nippon Television Holdings Inc. | | | Japan | | | | 13,500 | | | | 146,218 | |
| | Omnicom Group Inc. | | | United States | | | | 6,512 | | | | 355,555 | |
| | Tokyo Broadcasting System Holdings Inc. | | | Japan | | | | 14,900 | | | | 238,346 | |
| a | | Ubisoft Entertainment SA | | | France | | | | 1,485 | | | | 122,963 | |
| | The Walt Disney Co. | | | United States | | | | 10,412 | | | | 1,161,042 | |
| | | | | | | | | | | | | | |
| | | | |
| | | | | | | | | | | | | 15,990,397 | |
| | | | | | | | | | | | | | |
| | | | |
| | Pharmaceuticals, Biotechnology & Life Sciences 5.9% | | | | | | | | | | | | |
| a | | 10X Genomics Inc., A | | | United States | | | | 900 | | | | 80,379 | |
| | AbbVie Inc. | | | United States | | | | 25,727 | | | | 2,525,877 | |
| | Agilent Technologies Inc. | | | United States | | | | 7,385 | | | | 652,612 | |
| | Amgen Inc. | | | United States | | | | 12,284 | | | | 2,897,304 | |
| | Astellas Pharma Inc. | | | Japan | | | | 27,800 | | | | 464,248 | |
| | AstraZeneca PLC, ADR | | | United Kingdom | | | | 12,114 | | | | 640,709 | |
| | Bayer AG | | | Germany | | | | 21,485 | | | | 1,592,402 | |
| a | | Biogen Inc. | | | United States | | | | 4,887 | | | | 1,307,517 | |
| | Bristol-Myers Squibb Co. | | | United States | | | | 26,105 | | | | 1,534,974 | |
| a | | Bristol-Myers Squibb Co., rts., 2/01/49 | | | United States | | | | 5,723 | | | | 20,488 | |
| a | | Catalent Inc. | | | United States | | | | 20,489 | | | | 1,501,844 | |
| | Chugai Pharmaceutical Co. Ltd. | | | Japan | | | | 3,600 | | | | 192,744 | |
| | CSL Ltd. | | | Australia | | | | 12,186 | | | | 2,423,310 | |
FRANKLIN TEMPLETON VARIABLE INSURANCE PRODUCTS TRUST
STATEMENT OF INVESTMENTS (UNAUDITED)
Franklin Allocation VIP Fund (continued)
| | | | | | | | | | | | | | |
| | | | | Country/
Organization | | | Shares/
Rights | | | Value | |
| | | | |
| | Common Stocks and Other Equity Interests (continued) | | | | | | | | | | | | |
| | Pharmaceuticals, Biotechnology & Life Sciences (continued) | | | | | | | | | | | | |
| a | | Deciphera Pharmaceuticals Inc. | | | United States | | | | 3,500 | | | $ | 209,020 | |
| | Eli Lilly and Co. | | | United States | | | | 7,262 | | | | 1,192,275 | |
| a | | Exelixis Inc. | | | United States | | | | 7,348 | | | | 174,441 | |
| a | | Galapagos NV | | | Belgium | | | | 1,565 | | | | 308,869 | |
| a | | Genmab A/S | | | Denmark | | | | 2,200 | | | | 741,752 | |
| | Gilead Sciences Inc. | | | United States | | | | 21,800 | | | | 1,677,292 | |
| a | | GW Pharmaceuticals PLC, ADR | | | United Kingdom | | | | 1,326 | | | | 162,727 | |
| | Hikma Pharmaceuticals PLC | | | United Kingdom | | | | 45,000 | | | | 1,234,799 | |
| a | | Illumina Inc. | | | United States | | | | 3,446 | | | | 1,276,226 | |
| a | | Iovance Biotherapeutics Inc. | | | United States | | | | 2,500 | | | | 68,625 | |
| | Johnson & Johnson. | | | United States | | | | 26,655 | | | | 3,748,493 | |
| | Merck & Co. Inc. | | | United States | | | | 22,963 | | | | 1,775,729 | |
| a | | Mettler-Toledo International Inc. | | | United States | | | | 3,480 | | | | 2,803,314 | |
| a | | Neurocrine Biosciences Inc. | | | United States | | | | 2,809 | | | | 342,698 | |
| | Novartis AG | | | Switzerland | | | | 12,343 | | | | 1,075,335 | |
| | Novo Nordisk AS, B | | | Denmark | | | | 15,177 | | | | 988,650 | |
| | Orion OYJ | | | Finland | | | | 1,749 | | | | 84,809 | |
| | Pfizer Inc. | | | United States | | | | 70,822 | | | | 2,315,879 | |
| a | | PTC Therapeutics Inc. | | | United States | | | | 2,300 | | | | 116,702 | |
| a | | Reata Pharmaceuticals Inc. | | | United States | | | | 700 | | | | 109,214 | |
| a | | Regeneron Pharmaceuticals Inc. | | | United States | | | | 1,113 | | | | 694,122 | |
| | Roche Holding AG | | | Switzerland | | | | 8,164 | | | | 2,828,414 | |
| | Sanofi | | | France | | | | 12,151 | | | | 1,239,104 | |
| | Santen Pharmaceutical Co. Ltd. | | | Japan | | | | 50,000 | | | | 920,473 | |
| | Sartorius Stedim Biotech | | | France | | | | 1,200 | | | | 304,218 | |
| | Shionogi & Co. Ltd. | | | Japan | | | | 3,500 | | | | 219,567 | |
| | Takeda Pharmaceutical Co. Ltd., ADR | | | Japan | | | | 69,900 | | | | 1,253,307 | |
| a | | Waters Corp. | | | United States | | | | 3,696 | | | | 666,758 | |
| a | | WuXi Biologics (Cayman) Inc. | | | China | | | | 6,500 | | | | 119,311 | |
| | | | | | | | | | | | | | |
| | | | |
| | | | | | | | | | | | | 44,486,531 | |
| | | | | | | | | | | | | | |
| | | | |
| | Real Estate 1.5% | | | | | | | | | | | | |
| | American Tower Corp. | | | United States | | | | 6,129 | | | | 1,584,592 | |
| a | | Aroundtown SA | | | Germany | | | | 36,347 | | | | 208,315 | |
| | CapitaLand Mall Trust | | | Singapore | | | | 39,200 | | | | 55,624 | |
| | CK Asset Holdings Ltd. | | | Hong Kong | | | | 140,330 | | | | 841,524 | |
| | Crown Castle International Corp. | | | United States | | | | 6,785 | | | | 1,135,470 | |
| | Daito Trust Construction Co. Ltd. | | | Japan | | | | 3,000 | | | | 276,484 | |
| | EPR Properties | | | United States | | | | 2,325 | | | | 77,027 | |
| | Equinix Inc. | | | United States | | | | 1,198 | | | | 841,355 | |
| | Gaming and Leisure Properties Inc. | | | United States | | | | 5,396 | | | | 186,702 | |
| | Gecina SA | | | France | | | | 1,959 | | | | 241,929 | |
| | Goodman Group | | | Australia | | | | 7,321 | | | | 75,529 | |
| | Kerry Properties Ltd. | | | Hong Kong | | | | 27,500 | | | | 71,434 | |
| | Kimco Realty Corp. | | | United States | | | | 10,578 | | | | 135,822 | |
| | Link REIT | | | Hong Kong | | | | 11,100 | | | | 91,132 | |
| | Mitsui Fudosan Co. Ltd. | | | Japan | | | | 32,700 | | | | 580,907 | |
FRANKLIN TEMPLETON VARIABLE INSURANCE PRODUCTS TRUST
STATEMENT OF INVESTMENTS (UNAUDITED)
Franklin Allocation VIP Fund (continued)
| | | | | | | | | | | | | | |
| | | | | Country/
Organization | | | Shares/
Rights | | | Value | |
| | | | |
| | Common Stocks and Other Equity Interests (continued) | | | | | | | | | | | | |
| | Real Estate (continued) | | | | | | | | | | | | |
| | National Retail Properties Inc. | | | United States | | | | 5,357 | | | $ | 190,066 | |
| | OMEGA Healthcare Investors Inc. | | | United States | | | | 6,649 | | | | 197,675 | |
| | Public Storage | | | United States | | | | 5,214 | | | | 1,000,515 | |
| | Realty Income Corp. | | | United States | | | | 9,590 | | | | 570,605 | |
| | Segro PLC | | | United Kingdom | | | | 39,210 | | | | 433,644 | |
| | Simon Property Group Inc. | | | United States | | | | 7,737 | | | | 529,056 | |
| | Spirit Realty Capital Inc. | | | United States | | | | 3,149 | | | | 109,774 | |
| | STORE Capital Corp. | | | United States | | | | 5,795 | | | | 137,979 | |
| | Sun Hung Kai Properties Ltd. | | | Hong Kong | | | | 23,500 | | | | 300,216 | |
| | Swire Pacific Ltd., A | | | Hong Kong | | | | 69,500 | | | | 369,374 | |
| | Ventas Inc. | | | United States | | | | 6,506 | | | | 238,250 | |
| | VEREIT Inc. | | | United States | | | | 30,782 | | | | 197,928 | |
| | WP Carey Inc. | | | United States | | | | 3,880 | | | | 262,482 | |
| | | | | | | | | | | | | | |
| | | | |
| | | | | | | | | | | | | 10,941,410 | |
| | | | | | | | | | | | | | |
| | | | |
| | Retailing 3.7% | | | | | | | | | | | | |
| | ABC-Mart Inc. | | | Japan | | | | 1,300 | | | | 76,262 | |
| a | | Alibaba Group Holding Ltd. | | | China | | | | 12,600 | | | | 339,994 | |
| a | | Alibaba Group Holding Ltd., ADR | | | China | | | | 3,145 | | | | 678,377 | |
| a | | Amazon.com Inc. | | | United States | | | | 2,238 | | | | 6,174,239 | |
| a | | AutoZone Inc. | | | United States | | | | 569 | | | | 641,900 | |
| | Best Buy Co. Inc. | | | United States | | | | 7,734 | | | | 674,946 | |
| a | | boohoo Group PLC | | | United Kingdom | | | | 290,000 | | | | 1,485,006 | |
| a | | Booking Holdings Inc. | | | United States | | | | 423 | | | | 673,560 | |
| a | | Burlington Stores Inc. | | | United States | | | | 531 | | | | 104,570 | |
| | Dick’s Sporting Goods Inc. | | | United States | | | | 2,556 | | | | 105,461 | |
| | Dollar General Corp. | | | United States | | | | 6,650 | | | | 1,266,892 | |
| | Expedia Group Inc. | | | United States | | | | 2,151 | | | | 176,812 | |
| | Foot Locker Inc. | | | United States | | | | 4,357 | | | | 127,050 | |
| | The Gap Inc. | | | United States | | | | 8,417 | | | | 106,223 | |
| | Genuine Parts Co. | | | United States | | | | 4,377 | | | | 380,624 | |
| | Hennes & Mauritz AB, B | | | Sweden | | | | 20,642 | | | | 301,261 | |
| | The Home Depot Inc. | | | United States | | | | 6,699 | | | | 1,678,166 | |
| | Industria de Diseno Textil SA | | | Spain | | | | 25,457 | | | | 675,402 | |
| | Kohl’s Corp. | | | United States | | | | 6,012 | | | | 124,869 | |
| | L Brands Inc. | | | United States | | | | 7,713 | | | | 115,464 | |
| | Lowe’s Cos. Inc. | | | United States | | | | 8,700 | | | | 1,175,544 | |
| | Macy’s Inc. | | | United States | | | | 10,257 | | | | 70,568 | |
| a | | MercadoLibre Inc. | | | Argentina | | | | 1,500 | | | | 1,478,655 | |
| | Next PLC | | | United Kingdom | | | | 5,466 | | | | 330,925 | |
| | Nitori Holdings Co. Ltd. | | | Japan | | | | 300 | | | | 58,821 | |
| | Nordstrom Inc. | | | United States | | | | 3,773 | | | | 58,444 | |
| a | | O’Reilly Automotive Inc. | | | United States | | | | 2,453 | | | | 1,034,357 | |
| | Penske Automotive Group Inc. | | | United States | | | | 782 | | | | 30,271 | |
| | Pool Corp. | | | United States | | | | 1,094 | | | | 297,426 | |
| | Ross Stores Inc. | | | United States | | | | 24,749 | | | | 2,109,605 | |
| | Seria Co. Ltd. | | | Japan | | | | 9,400 | | | | 335,267 | |
FRANKLIN TEMPLETON VARIABLE INSURANCE PRODUCTS TRUST
STATEMENT OF INVESTMENTS (UNAUDITED)
Franklin Allocation VIP Fund (continued)
| | | | | | | | | | | | | | |
| | | | | Country/
Organization | | | Shares/
Rights | | | Value | |
| | | | |
| | Common Stocks and Other Equity Interests (continued) | | | | | | | | | | | | |
| | Retailing (continued) | | | | | | | | | | | | |
| | Target Corp. | | | United States | | | | 22,141 | | | $ | 2,655,370 | |
| | The TJX Cos. Inc. | | | United States | | | | 24,414 | | | | 1,234,372 | |
| | Tractor Supply Co. | | | United States | | | | 3,801 | | | | 500,934 | |
| a | | Ulta Beauty Inc. | | | United States | | | | 1,843 | | | | 374,903 | |
| a | | Urban Outfitters Inc. | | | United States | | | | 2,374 | | | | 36,132 | |
| | Williams-Sonoma Inc. | | | United States | | | | 2,842 | | | | 233,072 | |
| a | | Zalando SE | | | Germany | | | | 2,247 | | | | 159,389 | |
| | Zozo Inc. | | | Japan | | | | 4,300 | | | | 95,856 | |
| | | | | | | | | | | | | | |
| | | | |
| | | | | | | | | | | | | 28,176,989 | |
| | | | | | | | | | | | | | |
| | | | |
| | Semiconductors & Semiconductor Equipment 3.1% | | | | | | | | | | | | |
| | Advantest Corp. | | | Japan | | | | 2,900 | | | | 165,504 | |
| | Analog Devices Inc. | | | United States | | | | 16,200 | | | | 1,986,768 | |
| | Applied Materials Inc. | | | United States | | | | 25,796 | | | | 1,559,368 | |
| | ASML Holding NV | | | Netherlands | | | | 5,200 | | | | 1,902,058 | |
| | ASML Holding NV, N.Y. shs | | | Netherlands | | | | 4,022 | | | | 1,480,217 | |
| | Intel Corp. | | | United States | | | | 25,458 | | | | 1,523,152 | |
| | KLA Corp. | | | United States | | | | 4,502 | | | | 875,549 | |
| | Lam Research Corp. | | | United States | | | | 4,069 | | | | 1,316,159 | |
| | Maxim Integrated Products Inc. | | | United States | | | | 8,003 | | | | 485,062 | |
| | Monolithic Power Systems | | | United States | | | | 2,700 | | | | 639,900 | |
| | NVIDIA Corp. | | | United States | | | | 3,187 | | | | 1,210,773 | |
| | NXP Semiconductors NV | | | Netherlands | | | | 11,677 | | | | 1,331,645 | |
| | QUALCOMM Inc. | | | United States | | | | 10,224 | | | | 932,531 | |
| | Skyworks Solutions Inc. | | | United States | | | | 6,004 | | | | 767,672 | |
| | Taiwan Semiconductor Manufacturing Co. Ltd. | | | Taiwan | | | | 84,000 | | | | 899,686 | |
| | Texas Instruments Inc. | | | United States | | | | 36,020 | | | | 4,573,459 | |
| | Tokyo Electron Ltd. | | | Japan | | | | 3,200 | | | | 789,580 | |
| | Xilinx Inc. | | | United States | | | | 7,578 | | | | 745,600 | |
| | | | | | | | | | | | | | |
| | | | |
| | | | | | | | | | | | | 23,184,683 | |
| | | | | | | | | | | | | | |
| | | | |
| | Software & Services 7.7% | | | | | | | | | | | | |
| | Accenture PLC, A | | | United States | | | | 18,612 | | | | 3,996,369 | |
| a | | Adobe Inc. | | | United States | | | | 1,077 | | | | 468,829 | |
| a | | Adyen NV | | | Netherlands | | | | 1,568 | | | | 2,282,012 | |
| | Amdocs Ltd. | | | United States | | | | 4,288 | | | | 261,053 | |
| a | | Aspen Technology Inc. | | | United States | | | | 1,336 | | | | 138,423 | |
| a | | Atlassian Corp. PLC | | | United States | | | | 1,000 | | | | 180,270 | |
| a | | Autodesk Inc. | | | United States | | | | 5,142 | | | | 1,229,915 | |
| | Automatic Data Processing Inc. | | | United States | | | | 12,915 | | | | 1,922,914 | |
| a | | Avalara Inc. | | | United States | | | | 2,280 | | | | 303,445 | |
| | AVEVA Group PLC | | | United Kingdom | | | | 28,000 | | | | 1,419,633 | |
| a | | Bill.Com Holdings Inc. | | | United States | | | | 4,300 | | | | 387,903 | |
| | Booz Allen Hamilton Holding Corp. | | | United States | | | | 1,899 | | | | 147,723 | |
| | Broadridge Financial Solutions Inc. | | | United States | | | | 3,665 | | | | 462,486 | |
| a | | Cadence Design Systems Inc. | | | United States | | | | 4,030 | | | | 386,719 | |
| a | | Check Point Software Technologies Ltd. | | | Israel | | | | 4,600 | | | | 494,178 | |
| | Citrix Systems Inc. | | | United States | | | | 1,868 | | | | 276,296 | |
FRANKLIN TEMPLETON VARIABLE INSURANCE PRODUCTS TRUST
STATEMENT OF INVESTMENTS (UNAUDITED)
Franklin Allocation VIP Fund (continued)
| | | | | | | | | | | | | | |
| | | | | Country/
Organization | | | Shares/
Rights | | | Value | |
| | | | |
| | Common Stocks and Other Equity Interests (continued) | | | | | | | | | | | | |
| | Software & Services (continued) | | | | | | | | | | | | |
| | Cognizant Technology Solutions Corp., A | | | United States | | | | 11,809 | | | $ | 670,987 | |
| a | | CyberArk Software Ltd. | | | Israel | | | | 15,000 | | | | 1,489,050 | |
| | Fujitsu Ltd. | | | Japan | | | | 7,800 | | | | 913,250 | |
| | International Business Machines Corp. | | | United States | | | | 11,026 | | | | 1,331,610 | |
| | Intuit Inc. | | | United States | | | | 11,888 | | | | 3,521,107 | |
| | Jack Henry & Associates Inc. | | | United States | | | | 2,322 | | | | 427,318 | |
| | Keywords Studios PLC | | | Ireland | | | | 74,000 | | �� | | 1,661,417 | |
| | Mastercard Inc., A | | | United States | | | | 13,525 | | | | 3,999,343 | |
| | Microsoft Corp. | | | United States | | | | 59,398 | | | | 12,088,087 | |
| | NEC Corp. | | | Japan | | | | 3,500 | | | | 168,160 | |
| a | | Nice Ltd. | | | Israel | | | | 669 | | | | 126,104 | |
| | Nomura Research Institute Ltd. | | | Japan | | | | 13,300 | | | | 363,259 | |
| a | | Okta Inc., A | | | United States | | | | 400 | | | | 80,092 | |
| | Oracle Corp. Japan | | | Japan | | | | 1,500 | | | | 177,919 | |
| | Otsuka Corp. | | | Japan | | | | 4,200 | | | | 221,826 | |
| | Paychex Inc. | | | United States | | | | 10,879 | | | | 824,084 | |
| a | | PayPal Holdings Inc. | | | United States | | | | 3,600 | | | | 627,228 | |
| a | | PTC Inc. | | | United States | | | | 7,221 | | | | 561,722 | |
| | The Sage Group PLC | | | United Kingdom | | | | 198,153 | | | | 1,644,788 | |
| a | | salesforce.com Inc. | | | United States | | | | 3,353 | | | | 628,118 | |
| | SAP SE | | | Germany | | | | 12,172 | | | | 1,701,366 | |
| a | | ServiceNow Inc. | | | United States | | | | 6,255 | | | | 2,533,650 | |
| a | | Shopify Inc., A | | | Canada | | | | 1,550 | | | | 1,471,260 | |
| a | | Synopsys Inc. | | | United States | | | | 2,700 | | | | 526,500 | |
| | Trend Micro Inc. | | | Japan | | | | 2,100 | | | | 117,357 | |
| a | | Twilio Inc., A | | | United States | | | | 2,562 | | | | 562,154 | |
| a | | Tyler Technologies Inc. | | | United States | | | | 1,196 | | | | 414,869 | |
| a | | VeriSign Inc. | | | United States | | | | 2,984 | | | | 617,181 | |
| | Visa Inc., A. | | | United States | | | | 14,984 | | | | 2,894,459 | |
| a | | Workday Inc., A | | | United States | | | | 4,520 | | | | 846,867 | |
| | | | | | | | | | | | | | |
| | | | |
| | | | | | | | | | | | | 57,569,300 | |
| | | | | | | | | | | | | | |
| | | | |
| | Technology Hardware & Equipment 2.2% | | | | | | | | | | | | |
| | Amphenol Corp., A | | | United States | | | | 8,633 | | | | 827,128 | |
| | Apple Inc. | | | United States | | | | 23,012 | | | | 8,394,778 | |
| | Avnet Inc. | | | United States | | | | 8,800 | | | | 245,388 | |
| | Cisco Systems Inc. | | | United States | | | | 32,765 | | | | 1,528,160 | |
| | Cognex Corp. | | | United States | | | | 2,387 | | | | 142,552 | |
| a | | F5 Networks Inc. | | | United States | | | | 2,000 | | | | 278,960 | |
| | Hitachi Ltd. | | | Japan | | | | 31,300 | | | | 994,865 | |
| | HP Inc. | | | United States | | | | 50,192 | | | | 874,846 | |
| a | | Keysight Technologies Inc. | | | United States | | | | 4,262 | | | | 429,524 | |
| | Motorola Solutions Inc. | | | United States | | | | 4,497 | | | �� | 630,165 | |
| | NetApp Inc. | | | United States | | | | 6,842 | | | | 303,579 | |
| | Samsung Electronics Co. Ltd. | | | South Korea | | | | 28,228 | | | | 1,252,930 | |
| | TE Connectivity Ltd. | | | United States | | | | 10,949 | | | | 892,891 | |
FRANKLIN TEMPLETON VARIABLE INSURANCE PRODUCTS TRUST
STATEMENT OF INVESTMENTS (UNAUDITED)
Franklin Allocation VIP Fund (continued)
| | | | | | | | | | | | | | |
| | | | | Country/
Organization | | | Shares/
Rights | | | Value | |
| | | | |
| | Common Stocks and Other Equity Interests (continued) | | | | | | | | | | | | |
| | Technology Hardware & Equipment (continued) | | | | | | | | | | | | |
| | Ubiquiti Inc. | | | United States | | | | 323 | | | $ | 56,383 | |
| | | | | | | | | | | | | | |
| | | | |
| | | | | | | | | | | | | 16,852,149 | |
| | | | | | | | | | | | | | |
| | | | |
| | Telecommunication Services 0.9% | | | | | | | | | | | | |
| | AT&T Inc. | | | United States | | | | 39,921 | | | | 1,206,812 | |
| | Deutsche Telekom AG | | | Germany | | | | 46,352 | | | | 777,682 | |
| | KDDI Corp. | | | Japan | | | | 32,100 | | | | 957,772 | |
| | Nippon Telegraph & Telephone Corp. | | | Japan | | | | 19,700 | | | | 458,999 | |
| | NTT DOCOMO Inc. | | | Japan | | | | 39,100 | | | | 1,038,027 | |
| | Proximus SADP | | | Belgium | | | | 6,611 | | | | 134,701 | |
| | Softbank Corp. | | | Japan | | | | 15,200 | | | | 193,743 | |
| | Swisscom AG | | | Switzerland | | | | 432 | | | | 226,541 | |
| a | | Telefonica SA | | | Spain | | | | 1,055 | | | | 5,033 | |
| | Telefonica SA | | | Spain | | | | 25,330 | | | | 121,137 | |
| a | | Telefonica SA, rts., 7/01/20 | | | Spain | | | | 10 | | | | 2 | |
| | Verizon Communications Inc. | | | United States | | | | 24,629 | | | | 1,357,797 | |
| | Vodafone Group PLC. | | | United Kingdom | | | | 381,269 | | | | 606,101 | |
| | | | | | | | | | | | | | |
| | | | |
| | | | | | | | | | | | | 7,084,347 | |
| | | | | | | | | | | | | | |
| | | | |
| | Transportation 1.9% | | | | | | | | | | | | |
| | Alaska Air Group Inc. | | | United States | | | | 3,923 | | | | 142,248 | |
| | AP Moeller-Maersk A/S, B | | | Denmark | | | | 354 | | | | 414,850 | |
| | C.H. Robinson Worldwide Inc. | | | United States | | | | 4,472 | | | | 353,556 | |
| | Canadian National Railway Co. | | | Canada | | | | 5,714 | | | | 506,089 | |
| | Canadian Pacific Railway Ltd. | | | Canada | | | | 2,972 | | | | 758,870 | |
| | ComfortDelGro Corp. Ltd. | | | Singapore | | | | 105,100 | | | | 110,454 | |
| | Delta Air Lines Inc. | | | United States | | | | 17,452 | | | | 489,529 | |
| a | | Deutsche Lufthansa AG | | | Germany | | | | 6,653 | | | | 66,740 | |
| | DSV Panalpina A/S | | | Denmark | | | | 13,500 | | | | 1,658,109 | |
| | Expeditors International of Washington Inc. | | | United States | | | | 5,057 | | | | 384,534 | |
| | Japan Airlines Co. Ltd. | | | Japan | | | | 4,700 | | | | 84,814 | |
| | JB Hunt Transport Services Inc. | | | United States | | | | 5,526 | | | | 664,999 | |
| | Kamigumi Co. Ltd. | | | Japan | | | | 4,300 | | | | 84,566 | |
| | Kansas City Southern | | | United States | | | | 4,295 | | | | 641,201 | |
| a | | Kuehne + Nagel International AG | | | Switzerland | | | | 2,278 | | | | 379,443 | |
| | Landstar System Inc. | | | United States | | | | 1,110 | | | | 124,664 | |
| | Norfolk Southern Corp. | | | United States | | | | 4,400 | | | | 772,508 | |
| | Old Dominion Freight Line Inc. | | | United States | | | | 776 | | | | 131,602 | |
| | Southwest Airlines Co. | | | United States | | | | 14,883 | | | | 508,701 | |
| a | | Uber Technologies Inc. | | | United States | | | | 5,938 | | | | 184,553 | |
| | Union Pacific Corp. | | | United States | | | | 20,596 | | | | 3,482,166 | |
| | United Parcel Service Inc., B | | | United States | | | | 18,127 | | | | 2,015,360 | |
| | | | | | | | | | | | | | |
| | | | |
| | | | | | | | | | | | | 13,959,556 | |
| | | | | | | | | | | | | | |
| | | | |
| | Utilities 1.8% | | | | | | | | | | | | |
| | AGL Energy Ltd. | | | Australia | | | | 28,153 | | | | 333,006 | |
| | Alliant Energy Corp. | | | United States | | | | 6,338 | | | | 303,210 | |
| | Ameren Corp. | | | United States | | | | 4,398 | | | | 309,443 | |
FRANKLIN TEMPLETON VARIABLE INSURANCE PRODUCTS TRUST
STATEMENT OF INVESTMENTS (UNAUDITED)
Franklin Allocation VIP Fund (continued)
| | | | | | | | | | | | | | |
| | | | | Country/
Organization | | | Shares/
Rights | | | Value | |
| | | | |
| | Common Stocks and Other Equity Interests (continued) | | | | | | | | | | | | |
| | Utilities (continued) | | | | | | | | | | | | |
| | American Electric Power Co. Inc. | | | United States | | | | 3,773 | | | $ | 300,482 | |
| | American Water Works Co. Inc. | | | United States | | | | 4,219 | | | | 542,817 | |
| | Atmos Energy Corp. | | | United States | | | | 3,092 | | | | 307,901 | |
| | Centrica PLC | | | United Kingdom | | | | 184,452 | | | | 87,639 | |
| | Consolidated Edison Inc. | | | United States | | | | 8,867 | | | | 637,803 | |
| | Dominion Energy Inc. | | | United States | | | | 11,218 | | | | 910,677 | |
| | DTE Energy Co. | | | United States | | | | 5,418 | | | | 582,435 | |
| | E.ON SE | | | Germany | | | | 68,411 | | | | 772,133 | |
| | Endesa SA | | | Spain | | | | 13,312 | | | | 330,191 | |
| | Evergy Inc. | | | United States | | | | 4,253 | | | | 252,160 | |
| | Eversource Energy | | | United States | | | | 7,824 | | | | 651,504 | |
| | Exelon Corp. | | | United States | | | | 26,169 | | | | 949,673 | |
| | Hawaiian Electric Industries Inc. | | | United States | | | | 3,031 | | | | 109,298 | |
| | NextEra Energy Inc. | | | United States | | | | 9,508 | | | | 2,283,536 | |
| | OGE Energy Corp. | | | United States | | | | 5,530 | | | | 167,891 | |
| | PPL Corp. | | | United States | | | | 13,989 | | | | 361,476 | |
| | Public Service Enterprise Group Inc. | | | United States | | | | 15,856 | | | | 779,481 | |
| | Red Electrica Corp. SA | | | Spain | | | | 12,336 | | | | 230,780 | |
| | Sempra Energy | | | United States | | | | 2,118 | | | | 248,293 | |
| | The Southern Co. | | | United States | | | | 19,795 | | | | 1,026,371 | |
| | Toho Gas Co. Ltd. | | | Japan | | | | 1,500 | | | | 74,974 | |
| | Tokyo Gas Co. Ltd. | | | Japan | | | | 15,300 | | | | 366,352 | |
| | Veolia Environnement SA | | | France | | | | 14,635 | | | | 330,446 | |
| | Xcel Energy Inc. | | | United States | | | | 3,971 | | | | 248,188 | |
| | | | | | | | | | | | | | |
| | | | |
| | | | | | | | | | | | | 13,498,160 | |
| | | | | | | | | | | | | | |
| | | | |
| | Total Common Stocks and Other Equity Interests
(Cost $408,190,714) | | | | | | | | | | | 439,558,173 | |
| | | | | | | | | | | | | | |
| | | | |
| | Management Investment Companies (Cost $34,937,947) 3.8% | | | | | | | | | | | | |
| | Diversified Financials 3.8% | | | | | | | | | | | | |
| c | | Templeton Global Bond VIP Fund, Class 1 | | | United States | | | | 1,981,831 | | | | 28,696,911 | |
| | | | | | | | | | | | | | |
| | | | |
| | Preferred Stocks (Cost $116,835) 0.0%† | | | | | | | | | | | | |
| | Materials 0.0%† | | | | | | | | | | | | |
| d | | Fuchs Petrolub SE, 2.711%, pfd | | | Germany | | | | 3,045 | | | | 122,379 | |
| | | | | | | | | | | | | | |
| | | | |
| | | | | | | |
| Principal
Amount* |
| | | | |
| | | | | | | | | | | | | | |
| | | | |
| | Corporate Bonds 14.6% | | | | | | | | | | | | |
| | Automobiles & Components 0.0%† | | | | | | | | | | | | |
| e | | Adient U.S. LLC, senior secured note, 144A, 7.00%, 5/15/26 | | | United States | | | | 100,000 | | | | 103,664 | |
| e | | Allison Transmission Inc., senior bond, 144A, 5.875%, 6/01/29 | | | United States | | | | 100,000 | | | | 104,290 | |
| | | | | | | | | | | | | | |
| | | | |
| | | | | | | | | | | | | 207,954 | |
| | | | | | | | | | | | | | |
FRANKLIN TEMPLETON VARIABLE INSURANCE PRODUCTS TRUST
STATEMENT OF INVESTMENTS (UNAUDITED)
Franklin Allocation VIP Fund (continued)
| | | | | | | | | | | | | | |
| | | | | Country/
Organization | | | Principal Amount* | | | Value | |
| | | | |
| | Corporate Bonds (continued) | | | | | | | | | | | | |
| | Banks 2.5% | | | | | | | | | | | | |
| e | | Akbank T.A.S., senior note, 144A, 5.125%, 3/31/25 | | | Turkey | | | | 200,000 | | | $ | 189,199 | |
| | Bancolombia SA, senior note, 3.00%, 1/29/25 | | | Colombia | | | | 650,000 | | | | 637,676 | |
| | Bank of America Corp., | | | | | | | | | | | | |
| | sub. bond, 4.183%, 11/25/27 | | | United States | | | | 1,810,000 | | | | 2,066,924 | |
| | sub. note, 4.20%, 8/26/24 | | | United States | | | | 400,000 | | | | 444,115 | |
| b | | BDO Unibank Inc., senior note, Reg S, 2.95%, 3/06/23 | | | Philippines | | | | 200,000 | | | | 204,978 | |
| e | | BNP Paribas SA, | | | | | | | | | | | | |
| | senior bond, 144A, 3.052% to 1/13/30, FRN thereafter, 1/13/31 | | | France | | | | 200,000 | | | | 210,650 | |
| | senior note, 144A, 2.219% to 6/09/25, FRN thereafter, 6/09/26 | | | France | | | | 200,000 | | | | 204,567 | |
| e | | BPCE SA, | | | | | | | | | | | | |
| | senior note, 144A, 5.70%, 10/22/23 | | | France | | | | 400,000 | | | | 447,738 | |
| | sub. note, 144A, 5.15%, 7/21/24 | | | France | | | | 800,000 | | | | 893,776 | |
| | sub. note, 144A, 4.875%, 4/01/26 | | | France | | | | 500,000 | | | | 567,548 | |
| | Citigroup Inc., | | | | | | | | | | | | |
| | senior note, 2.572% to 6/30/30, FRN thereafter, 6/03/31 | | | United States | | | | 200,000 | | | | 206,967 | |
| | senior note, 3.352% to 4/24/24, FRN thereafter, 4/24/25 | | | United States | | | | 1,700,000 | | | | 1,837,771 | |
| f | | Comerica Inc., junior sub. bond, 5.625% to 10/01/25, FRN thereafter, Perpetual | | | United States | | | | 100,000 | | | | 101,730 | |
| | Credit Suisse Group Funding Guernsey Ltd., | | | | | | | | | | | | |
| | senior note, 3.80%, 9/15/22 | | | Switzerland | | | | 1,200,000 | | | | 1,275,232 | |
| | senior note, 3.80%, 6/09/23 | | | Switzerland | | | | 400,000 | | | | 431,082 | |
| | HSBC Holdings PLC, senior bond, 2.848% to 6/04/30, FRN thereafter, 6/04/31 | | | United Kingdom | | | | 300,000 | | | | 307,443 | |
| | JPMorgan Chase & Co., | | | | | | | | | | | | |
| | senior bond, 3.54% to 5/01/27, FRN thereafter, 5/01/28 | | | United States | | | | 1,350,000 | | | | 1,508,302 | |
| | senior bond, 4.493% to 3/23/30, FRN thereafter, 3/24/31 | | | United States | | | | 400,000 | | | | 489,650 | |
| | sub. note, 3.875%, 9/10/24 | | | United States | | | | 400,000 | | | | 443,748 | |
| | Lloyds Banking Group PLC, | | | | | | | | | | | | |
| | senior note, 4.05%, 8/16/23 | | | United Kingdom | | | | 400,000 | | | | 435,339 | |
| | senior note, 3.87%, 7/09/25 | | | United Kingdom | | | | 200,000 | | | | 217,832 | |
| | PNC Bank NA, senior bond, 3.10%, 10/25/27 | | | United States | | | | 400,000 | | | | 448,879 | |
| e | | Standard Chartered PLC, senior note, 144A, 4.05%, 4/12/26 | | | United Kingdom | | | | 970,000 | | | | 1,056,757 | |
| | SVB Financial Group, senior note, 3.125%, 6/05/30 | | | United States | | | | 100,000 | | | | 107,311 | |
| | Truist Bank, sub. Bond, 2.25%, 3/11/30 | | | United States | | | | 400,000 | | | | 404,486 | |
| | Truist Financial Corp., sub. bond, 3.875%, 3/19/29 | | | United States | | | | 1,660,000 | | | | 1,884,069 | |
| | US Bancorp., sub. bond, 3.00%, 7/30/29 | | | United States | | | | 300,000 | | | | 325,992 | |
| | Wells Fargo & Co., senior note, 2.393% to 6/02/27, FRN thereafter, 6/02/28 | | | United States | | | | 200,000 | | | | 206,803 | |
| g | | Wells Fargo Bank NA, senior note, FRN, 2.082%, 9/09/22 | | | United States | | | | 1,100,000 | | | | 1,118,009 | |
| | | | | | | | | | | | | | |
| | | | |
| | | | | | | | | | | | | 18,674,573 | |
| | | | | | | | | | | | | | |
| | | | |
| | Capital Goods 0.4% | | | | | | | | | | | | |
| e | | Beacon Roofing Supply Inc., senior note, 144A, 4.875%, 11/01/25 | | | United States | | | | 100,000 | | | | 89,517 | |
| e | | Carrier Global Corp., senior note, 144A, 3.577%, 4/05/50 | | | United States | | | | 430,000 | | | | 421,447 | |
| | Caterpillar Inc., | | | | | | | | | | | | |
| | senior bond, 3.25%, 4/09/50 | | | United States | | | | 200,000 | | | | 224,454 | |
| | senior note, 2.60%, 4/09/30 | | | United States | | | | 500,000 | | | | 544,382 | |
FRANKLIN TEMPLETON VARIABLE INSURANCE PRODUCTS TRUST
STATEMENT OF INVESTMENTS (UNAUDITED)
Franklin Allocation VIP Fund (continued)
| | | | | | | | | | | | | | |
| | | | | Country/
Organization | | | Principal Amount* | | | Value | |
| | | | |
| | Corporate Bonds (continued) | | | | | | | | | | | | |
| | Capital Goods (continued) | | | | | | | | | | | | |
| | Lockheed Martin Corp., senior bond, 4.70%, 5/15/46 | | | United States | | | | 200,000 | | | $ | 273,458 | |
| | Northrop Grumman Corp., senior bond, 5.25%, 5/01/50 | | | United States | | | | 200,000 | | | | 288,848 | |
| | Raytheon Technologies Corp., senior bond, 4.50%, 6/01/42 | | | United States | | | | 800,000 | | | | 992,043 | |
| e | | Resideo Funding Inc., senior note, 144A, 6.125%, 11/01/26 | | | United States | | | | 200,000 | | | | 196,131 | |
| e | | WESCO Distribution Inc., senior note, 144A, 7.125%, 6/15/25 | | | United States | | | | 100,000 | | | | 105,720 | |
| | Westinghouse Air Brake Technologies Corp., senior note, 3.20%, 6/15/25 | | | United States | | | | 100,000 | | | | 102,201 | |
| | | | | | | | | | | | | | |
| | | | |
| | | | | | | | | | | | | 3,238,201 | |
| | | | | | | | | | | | | | |
| | | | |
| | Commercial & Professional Services 0.1% | | | | | | | | | | | | |
| e | | Ashtead Capital Inc., secured note, second lien, 144A, 4.125%, 8/15/25 | | | United Kingdom | | | | 575,000 | | | | 587,937 | |
| e | | Harsco Corp., senior note, 144A, 5.75%, 7/31/27 | | | United States | | | | 100,000 | | | | 100,503 | |
| | | | | | | | | | | | | | |
| | | | |
| | | | | | | | | | | | | 688,440 | |
| | | | | | | | | | | | | | |
| | | | |
| | Consumer Durables & Apparel 0.1% | | | | | | | | | | | | |
| e | | Ashton Woods USA LLC/Ashton Woods Finance Co., senior note, 144A, 6.75%, 8/01/25 | | | United States | | | | 100,000 | | | | 98,615 | |
| | Mohawk Industries Inc., senior bond, 3.625%, 5/15/30 | | | United States | | | | 290,000 | | | | 316,479 | |
| | NIKE Inc., | | | | | | | | | | | | |
| | senior bond, 2.375%, 11/01/26 | | | United States | | | | 100,000 | | | | 108,992 | |
| | senior bond, 3.875%, 11/01/45 | | | United States | | | | 100,000 | | | | 120,738 | |
| | | | | | | | | | | | | | |
| | | | |
| | | | | | | | | | | | | 644,824 | |
| | | | | | | | | | | | | | |
| | | | |
| | Consumer Services 0.1% | | | | | | | | | | | | |
| | Marriott International Inc., senior note, 3.60%, 4/15/24 | | | United States | | | | 300,000 | | | | 301,802 | |
| e | | Wynn Las Vegas LLC/Wynn Las Vegas Capital Corp., senior bond, 144A, 5.25%, 5/15/27 | | | United States | | | | 100,000 | | | | 86,663 | |
| | | | | | | | | | | | | | |
| | | | |
| | | | | | | | | | | | | 388,465 | |
| | | | | | | | | | | | | | |
| | | | |
| | Diversified Financials 1.2% | | | | | | | | | | | | |
| | Capital One Financial Corp., | | | | | | | | | | | | |
| | senior note, 3.20%, 1/30/23 | | | United States | | | | 200,000 | | | | 210,786 | |
| | senior note, 3.75%, 3/09/27 | | | United States | | | | 1,035,000 | | | | 1,143,811 | |
| | DY9 Leasing LLC, secured bond, 2.372%, 3/19/27 | | | United States | | | | 672,597 | | | | 705,437 | |
| | The Goldman Sachs Group Inc., | | | | | | | | | | | | |
| | senior note, 3.50%, 1/23/25 | | | United States | | | | 1,400,000 | | | | 1,525,959 | |
| | sub. note, 4.25%, 10/21/25 | | | United States | | | | 400,000 | | | | 451,116 | |
| | Goldman Sachs Group Inc., senior note, 2.60%, 2/07/30 | | | United States | | | | 300,000 | | | | 313,576 | |
| | Morgan Stanley, | | | | | | | | | | | | |
| | senior bond, 3.591% to 7/22/27, FRN thereafter, 7/22/28 | | | United States | | | | 1,460,000 | | | | 1,644,025 | |
| | sub. bond, 4.875%, 11/01/22 | | | United States | | | | 400,000 | | | | 435,336 | |
| | Private Export Funding Corp., secured bond, 2.80%, 5/15/22 | | | United States | | | | 1,600,000 | | | | 1,668,687 | |
| | Springleaf Finance Corp., senior bond, 5.375%, 11/15/29 | | | United States | | | | 100,000 | | | | 94,620 | |
| b | | TNB Global Ventures Capital Bhd., senior note, Reg S, 3.244%, 10/19/26 | | | Malaysia | | | | 300,000 | | | | 319,549 | |
| e | | UBS AG London, senior note, 144A, 1.75%, 4/21/22 | | | Switzerland | | | | 200,000 | | | | 203,828 | |
| | | | | | | | | | | | | | |
| | | | |
| | | | | | | | | | | | | 8,716,730 | |
| | | | | | | | | | | | | | |
| | | | |
| | Energy 2.5% | | | | | | | | | | | | |
| e | | Aker BP ASA, | | | | | | | | | | | | |
| | senior note, 144A, 4.75%, 6/15/24 | | | Norway | | | | 200,000 | | | | 201,615 | |
| | senior note, 144A, 3.75%, 1/15/30 | | | Norway | | | | 500,000 | | | | 471,358 | |
FRANKLIN TEMPLETON VARIABLE INSURANCE PRODUCTS TRUST
STATEMENT OF INVESTMENTS (UNAUDITED)
Franklin Allocation VIP Fund (continued)
| | | | | | | | | | | | | | |
| | | | | Country/
Organization | | | Principal Amount* | | | Value | |
| | | | |
| | Corporate Bonds (continued) | | | | | | | | | | | | |
| | Energy (continued) | | | | | | | | | | | | |
| | Baker Hughes a GE Co. LLC/Baker Hughes Co-Obligor Inc., | | | | | | | | | | | | |
| | senior bond, 3.337%, 12/15/27 | | | United States | | | | 400,000 | | | $ | 426,383 | |
| | senior bond, 4.08%, 12/15/47 | | | United States | | | | 735,000 | | | | 765,449 | |
| | BP Capital Markets America Inc, | | | | | | | | | | | | |
| | senior note, 3.937%, 9/21/28 | | | United States | | | | 100,000 | | | | 114,462 | |
| | senior note, 4.234%, 11/06/28 | | | United States | | | | 400,000 | | | | 465,008 | |
| | Canadian Natural Resources Ltd., | | | | | | | | | | | | |
| | senior bond, 3.90%, 2/01/25 | | | Canada | | | | 1,010,000 | | | | 1,082,876 | |
| | senior bond, 3.85%, 6/01/27 | | | Canada | | | | 300,000 | | | | 321,039 | |
| | senior note, 2.95%, 1/15/23 | | | Canada | | | | 400,000 | | | | 412,851 | |
| | Cheniere Corpus Christi Holdings LLC, | | | | | | | | | | | | |
| | senior secured bond, first lien, 5.125%, 6/30/27 | | | United States | | | | 200,000 | | | | 219,750 | |
| | senior secured note, first lien, 5.875%, 3/31/25 | | | United States | | | | 200,000 | | | | 224,668 | |
| | Chevron Corp., senior note, 2.355%, 12/05/22 | | | United States | | | | 100,000 | | | | 104,089 | |
| | Ecopetrol SA, senior bond, 4.125%, 1/16/25 | | | Colombia | | | | 250,000 | | | | 251,539 | |
| | Enable Midstream Partners LP, senior bond, 4.95%, 5/15/28 | | | United States | | | | 300,000 | | | | 278,813 | |
| | Energy Transfer Operating LP, | | | | | | | | | | | | |
| | senior bond, 4.75%, 1/15/26 | | | United States | | | | 100,000 | | | | 109,289 | |
| | senior bond, 6.05%, 6/01/41 | | | United States | | | | 700,000 | | | | 722,467 | |
| | Enterprise Products Operating LLC, | | | | | | | | | | | | |
| | senior bond, 3.125%, 7/31/29 | | | United States | | | | 400,000 | | | | 428,895 | |
| | senior bond, 6.125%, 10/15/39 | | | United States | | | | 700,000 | | | | 890,773 | |
| | EOG Resources Inc., senior bond, 4.375%, 4/15/30 | | | United States | | | | 50,000 | | | | 59,638 | |
| | Exxon Mobil Corp., | | | | | | | | | | | | |
| | senior bond, 2.61%, 10/15/30 | | | United States | | | | 100,000 | | | | 106,845 | |
| | senior note, 3.294%, 3/19/27 | | | United States | | | | 400,000 | | | | 449,479 | |
| | Kinder Morgan Inc., senior bond, 5.55%, 6/01/45 | | | United States | | | | 800,000 | | | | 972,493 | |
| | Kinder Morgan Inc./DE, senior note, 4.30%, 3/01/28 | | | United States | | | | 400,000 | | | | 453,824 | |
| | MPLX LP, | | | | | | | | | | | | |
| | senior bond, 5.50%, 2/15/49 | | | United States | | | | 425,000 | | | | 482,948 | |
| | senior note, 4.875%, 12/01/24 | | | United States | | | | 400,000 | | | | 444,519 | |
| | senior note, 4.875%, 6/01/25 | | | United States | | | | 100,000 | | | | 111,690 | |
| | Occidental Petroleum Corp., senior note, 2.60%, 8/13/21 | | | United States | | | | 400,000 | | | | 391,990 | |
| | Reliance Industries Ltd., senior note, 2.06%, 1/15/26 | | | United States | | | | 750,000 | | | | 769,926 | |
| e | | Schlumberger Holdings Corp., senior note, 144A, 3.75%, 5/01/24 | | | United States | | | | 1,510,000 | | | | 1,627,484 | |
| e | | Schlumberger Investment SA, senior bond, 144A, 2.40%, 8/01/22 | | | United States | | | | 400,000 | | | | 410,103 | |
| | Total Capital International SA, senior note, 3.455%, 2/19/29 | | | France | | | | 670,000 | | | | 762,280 | |
| | Total Capital SA, senior note, 3.883%, 10/11/28 | | | France | | | | 400,000 | | | | 465,015 | |
| | TransCanada PipeLines Ltd, senior bond, 4.25%, 5/15/28 | | | Canada | | | | 500,000 | | | | 575,541 | |
| | TransCanada PipeLines Ltd., senior bond, 4.875%, 5/15/48 | | | Canada | | | | 200,000 | | | | 247,534 | |
| | Transcontinental Gas Pipe Line Co. LLC, senior note, 7.85%, 2/01/26 | | | United States | | | | 400,000 | | | | 521,253 | |
| | Valero Energy Corp., senior bond, 4.00%, 4/01/29 | | | United States | | | | 935,000 | | | | 1,041,086 | |
| | The Williams Cos. Inc., | | | | | | | | | | | | |
| | senior bond, 4.125%, 11/15/20 | | | United States | | | | 1,350,000 | | | | 1,352,237 | |
| | senior bond, 4.85%, 3/01/48 | | | United States | | | | 320,000 | | | | 350,449 | |
| | | | | | | | | | | | | | |
| | | | |
| | | | | | | | | | | | | 19,087,658 | |
| | | | | | | | | | | | | | |
FRANKLIN TEMPLETON VARIABLE INSURANCE PRODUCTS TRUST
STATEMENT OF INVESTMENTS (UNAUDITED)
Franklin Allocation VIP Fund (continued)
| | | | | | | | | | | | | | |
| | | | | Country/
Organization | | | Principal Amount* | | | Value | |
| | | | |
| | Corporate Bonds (continued) | | | | | | | | | | | | |
| | Food & Staples Retailing 0.5% | | | | | | | | | | | | |
| e | | Cencosud SA, senior note, 144A, 4.375%, 7/17/27 | | | Chile | | | | 300,000 | | | $ | 306,206 | |
| e | | CK Hutchison International 19 Ltd., senior note, 144A, 3.25%, 4/11/24 | | | Hong Kong | | | | 1,035,000 | | | | 1,097,138 | |
| | Costco Wholesale Corp., senior note, 1.375%, 6/20/27 | | | United States | | | | 200,000 | | | | 204,666 | |
| | The Kroger Co., senior bond, 5.40%, 1/15/49 | | | United States | | | | 550,000 | | | | 771,701 | |
| | Walgreens Boots Alliance Inc., senior note, 3.80%, 11/18/24 | | | United States | | | | 500,000 | | | | 551,078 | |
| | Walmart Inc., senior note, 3.55%, 6/26/25 | | | United States | | | | 100,000 | | | | 113,434 | |
| | Wal-Mart Stores Inc., senior bond, 5.25%, 9/01/35 | | | United States | | | | 300,000 | | | | 438,352 | |
| | | | | | | | | | | | | | |
| | | | |
| | | | | | | | | | | | | 3,482,575 | |
| | | | | | | | | | | | | | |
| | | | |
| | Food, Beverage & Tobacco 0.4% | | | | | | | | | | | | |
| | Anheuser-Busch Cos. LLC/InBev Worldwide Inc., senior bond, 4.90%, 2/01/46 | | | Belgium | | | | 100,000 | | | | 122,692 | |
| | Anheuser-Busch InBev Worldwide Inc., | | | | | | | | | | | | |
| | senior bond, 3.50%, 6/01/30 | | | Belgium | | | | 200,000 | | | | 225,300 | |
| | senior bond, 5.80%, 1/23/59 | | | Belgium | | | | 100,000 | | | | 142,643 | |
| | B&G Foods Inc., senior note, 5.25%, 9/15/27 | | | United States | | | | 100,000 | | | | 100,344 | |
| | Bunge Ltd. Finance Corp., senior note, 4.35%, 3/15/24 | | | United States | | | | 200,000 | | | | 218,554 | |
| | The Coca-Cola Co., | | | | | | | | | | | | |
| | senior bond, 4.20%, 3/25/50 | | | United States | | | | 200,000 | | | | 263,283 | |
| | senior note, 1.45%, 6/01/27 | | | United States | | | | 100,000 | | | | 102,801 | |
| e | | Imperial Brands Finance PLC, | | | | | | | | | | | | |
| | senior note, 144A, 4.25%, 7/21/25 | | | United Kingdom | | | | 585,000 | | | | 644,553 | |
| | senior note, 144A, 3.50%, 7/26/26 | | | United Kingdom | | | | 300,000 | | | | 321,209 | |
| e | | JBS USA LUX SA/JBS USA Food Co./JBS USA Finance Inc., senior bond, 144A, 5.50%, 1/15/30 | | | United States | | | | 100,000 | | | | 102,669 | |
| e | | Kraft Heinz Foods Co., senior note, 144A, 3.875%, 5/15/27 | | | United States | | | | 100,000 | | | | 104,634 | |
| e | | Post Holdings Inc., senior bond, 144A, 4.625%, 4/15/30 | | | United States | | | | 200,000 | | | | 196,630 | |
| | Reynolds American Inc., senior bond, 5.85%, 8/15/45 | | | United Kingdom | | | | 650,000 | | | | 815,127 | |
| | | | | | | | | | | | | | |
| | | | |
| | | | | | | | | | | | | 3,360,439 | |
| | | | | | | | | | | | | | |
| | | | |
| | Health Care Equipment & Services 0.9% | | | | | | | | | | | | |
| | Abbott Laboratories, | | | | | | | | | | | | |
| | senior bond, 3.75%, 11/30/26 | | | United States | | | | 450,000 | | | | 524,002 | |
| | senior bond, 4.75%, 11/30/36 | | | United States | | | | 200,000 | | | | 269,343 | |
| | Anthem Inc., | | | | | | | | | | | | |
| | senior bond, 4.65%, 1/15/43 | | | United States | | | | 100,000 | | | | 125,823 | |
| | senior bond, 5.10%, 1/15/44 | | | United States | | | | 600,000 | | | | 792,839 | |
| | senior note, 4.101%, 3/01/28 | | | United States | | | | 400,000 | | | | 468,092 | |
| | CHS/Community Health Systems Inc., senior secured note, first lien, 6.25%, 3/31/23 | | | United States | | | | 100,000 | | | | 94,391 | |
| | Cigna Corp., | | | | | | | | | | | | |
| | senior note, 4.375%, 10/15/28 | | | United States | | | | 500,000 | | | | 592,125 | |
| | senior note, 2.40%, 3/15/30 | | | United States | | | | 300,000 | | | | 311,642 | |
| | e senior note, 144A, 3.05%, 10/15/27 | | | United States | | | | 550,000 | | | | 598,624 | |
| | CVS Health Corp., | | | | | | | | | | | | |
| | senior bond, 4.30%, 3/25/28 | | | United States | | | | 300,000 | | | | 350,956 | |
| | senior bond, 4.78%, 3/25/38 | | | United States | | | | 100,000 | | | | 124,377 | |
| | senior bond, 5.30%, 12/05/43 | | | United States | | | | 800,000 | | | | 1,047,375 | |
FRANKLIN TEMPLETON VARIABLE INSURANCE PRODUCTS TRUST
STATEMENT OF INVESTMENTS (UNAUDITED)
Franklin Allocation VIP Fund (continued)
| | | | | | | | | | | | | | |
| | | | | Country/
Organization | | | Principal Amount* | | | Value | |
| | | | |
| | Corporate Bonds (continued) | | | | | | | | | | | | |
| | Health Care Equipment & Services (continued) | | | | | | | | | | | | |
| | CVS Health Corp., (continued) | | | | | | | | | | | | |
| | senior bond, 5.125%, 7/20/45 | | | United States | | | | 200,000 | | | $ | 258,000 | |
| | HCA Inc., | | | | | | | | | | | | |
| | senior secured bond, first lien, 4.50%, 2/15/27 | | | United States | | | | 408,000 | | | | 455,206 | |
| | senior secured bond, first lien, 4.125%, 6/15/29 | | | United States | | | | 300,000 | | | | 331,222 | |
| | Quest Diagnostics Inc., senior bond, 2.80%, 6/30/31 | | | United States | | | | 600,000 | | | | 630,297 | |
| | | | | | | | | | | | | | |
| | | | |
| | | | | | | | | | | | | 6,974,314 | |
| | | | | | | | | | | | | | |
| | | | |
| | Household & Personal Products 0.1% | | | | | | | | | | | | |
| | Avon Products Inc., senior bond, 7.00%, 3/15/23 | | | United Kingdom | | | | 260,000 | | | | 259,188 | |
| | The Procter & Gamble Co., senior bond, 3.55%, 3/25/40 | | | United States | | | | 400,000 | | | | 483,469 | |
| | | | | | | | | | | | | | |
| | | | |
| | | | | | | | | | | | | 742,657 | |
| | | | | | | | | | | | | | |
| | | | |
| | Insurance 0.8% | | | | | | | | | | | | |
| | Aflac Inc., | | | | | | | | | | | | |
| | senior bond, 4.75%, 1/15/49 | | | United States | | | | 700,000 | | | | 902,890 | |
| | senior note, 3.60%, 4/01/30 | | | United States | | | | 600,000 | | | | 701,279 | |
| | The Allstate Corp., senior bond, 4.20%, 12/15/46 | | | United States | | | | 700,000 | | | | 867,845 | |
| | Arch Capital Group Ltd., senior bond, 3.635%, 6/30/50 | | | United States | | | | 300,000 | | | | 315,363 | |
| | Marsh & McLennan Cos. Inc., senior bond, 4.375%, 3/15/29 | | | United States | | | | 400,000 | | | | 482,555 | |
| | MetLife Inc., | | | | | | | | | | | | |
| | junior sub. bond, 6.40%, 12/15/66 | | | United States | | | | 450,000 | | | | 532,283 | |
| | senior bond, 5.70%, 6/15/35 | | | United States | | | | 300,000 | | | | 434,744 | |
| e | | Metropolitan Life Global Funding I, | | | | | | | | | | | | |
| | secured note, 144A, 3.60%, 1/11/24 | | | United States | | | | 940,000 | | | | 1,028,437 | |
| | senior note, 144A, 2.95%, 4/09/30 | | | United States | | | | 250,000 | | | | 274,255 | |
| | Willis North America Inc., senior bond, 2.95%, 9/15/29 | | | United States | | | | 100,000 | | | | 106,154 | |
| | | | | | | | | | | | | | |
| | | | |
| | | | | | | | | | | | | 5,645,805 | |
| | | | | | | | | | | | | | |
| | | | |
| | Materials 0.5% | | | | | | | | | | | | |
| | Air Products and Chemicals Inc., senior bond, 2.70%, 5/15/40 | | | United States | | | | 400,000 | | | | 425,812 | |
| e | | Alpek SAB de CV, senior note, 144A, 4.25%, 9/18/29 | | | Mexico | | | | 200,000 | | | | 197,812 | |
| | Bemis Co.Inc., senior note, 2.63%, 6/19/30 | | | United States | | | | 100,000 | | | | 102,635 | |
| e | | Braskem Netherlands Finance BV, senior bond, 144A, 4.50%, 1/31/30 | | | Brazil | | | | 300,000 | | | | 275,025 | |
| e | | CCL Industries Inc., senior note, 144A, 3.05%, 6/01/30 | | | Canada | | | | 200,000 | | | | 205,031 | |
| b | | CNAC HK Finbridge Co. Ltd., | | | | | | | | | | | | |
| | senior note, Reg S, 4.875%, 3/14/25 | | | China | | | | 200,000 | | | | 222,360 | |
| | senior note, Reg S, 3.875%, 6/19/29 | | | China | | | | 200,000 | | | | 217,267 | |
| | EI du Pont de Nemours and Co., senior note, 1.70%, 7/15/25 | | | United States | | | | 180,000 | | | | 185,975 | |
| e | | Glencore Funding LLC, senior note, 144A, 4.625%, 4/29/24 | | | Switzerland | | | | 900,000 | | | | 994,147 | |
| e | | Mauser Packaging Solutions Holding Co., senior note, 144A, 7.25%, 4/15/25. | | | United States | | | | 100,000 | | | | 90,974 | |
| e | | Novelis Corp., senior bond, 144A, 4.75%, 1/30/30 | | | United States | | | | 100,000 | | | | 95,748 | |
| e | | Plastipak Holdings Inc., senior note, 144A, 6.25%, 10/15/25 | | | United States | | | | 100,000 | | | | 97,312 | |
| e | | Reynolds Group Issuer Inc./Reynolds Group Issuer LLC/Reynolds Group | | | | | | | | | | | | |
| | Issuer Luxembourg SA, senior note, 144A, 7.00%, 7/15/24 | | | United States | | | | 100,000 | | | | 100,515 | |
| e | | SunCoke Energy Partners LP/SunCoke Energy Partners Finance Corp., senior note, 144A, 7.50%, 6/15/25 | | | United States | | | | 100,000 | | | | 84,832 | |
| | Westlake Chemical Corp., senior bond, 3.375%, 6/15/30 | | | United States | | | | 100,000 | | | | 102,346 | |
| | WRKCo Inc., senior bond, 3.00%, 6/15/33 | | | United States | | | | 235,000 | | | | 245,703 | |
| | | | | | | | | | | | | | |
FRANKLIN TEMPLETON VARIABLE INSURANCE PRODUCTS TRUST
STATEMENT OF INVESTMENTS (UNAUDITED)
Franklin Allocation VIP Fund (continued)
| | | | | | | | | | | | | | |
| | | | | Country/
Organization | | | Principal Amount* | | | Value | |
| | | | |
| | Corporate Bonds (continued) | | | | | | | | | | | | |
| | Materials (continued) | | | | | | | | | | | | |
| e | | Yara International ASA, senior note, 144A, 3.148%, 6/04/30 | | | Norway | | | | 100,000 | | | $ | 104,177 | |
| | | | | | | | | | | | | | |
| | | | |
| | | | | | | | | | | | | 3,747,671 | |
| | | | | | | | | | | | | | |
| | | | |
| | Media & Entertainment 0.5% | | | | | | | | | | | | |
| | Charter Communications Operating LLC/Charter Communications Operating Capital, | | | | | | | | | | | | |
| | senior bond, 2.80%, 4/01/31 | | | United States | | | | 200,000 | | | | 203,197 | |
| | senior secured note, first lien, 4.50%, 2/01/24 | | | United States | | | | 550,000 | | | | 608,924 | |
| | Comcast Corp., senior bond, 4.049%, 11/01/52 | | | United States | | | | 1,025,000 | | | | 1,260,704 | |
| e | | Diamond Sports Group LLC/Diamond Sports Finance Co., first lien, 144A, 5.375%, 8/15/26 | | | United States | | | | 100,000 | | | | 72,992 | |
| | Fox Corp., senior bond, 5.476%, 1/25/39 | | | United States | | | | 520,000 | | | | 695,914 | |
| | NBCUniversal Media LLC, senior bond, 5.95%, 4/01/41 | | | United States | | | | 200,000 | | | | 297,518 | |
| | Netflix Inc., senior bond, 4.875%, 4/15/28 | | | United States | | | | 100,000 | | | | 107,090 | |
| e | | Nexstar Broadcasting Inc., senior note, 144A, 5.625%, 7/15/27 | | | United States | | | | 100,000 | | | | 100,253 | |
| e | | Univision Communications Inc., senior secured note, first lien, 144A, 5.125%, 2/15/25 | | | United States | | | | 100,000 | | | | 94,501 | |
| | | | | | | | | | | | | | |
| | | | |
| | | | | | | | | | | | | 3,441,093 | |
| | | | | | | | | | | | | | |
| | | | |
| | Pharmaceuticals, Biotechnology & Life Sciences 0.9% | | | | | | | | | | | | |
| e | | AbbVie Inc., | | | | | | | | | | | | |
| | senior bond, 144A, 3.80%, 3/15/25 | | | United States | | | | 400,000 | | | | 446,476 | |
| | senior bond, 144A, 4.85%, 6/15/44 | | | United States | | | | 550,000 | | | | 688,275 | |
| | senior bond, 144A, 4.25%, 11/21/49 | | | United States | | | | 370,000 | | | | 445,493 | |
| | senior note, 144A, 3.20%, 11/21/29 | | | United States | | | | 500,000 | | | | 558,276 | |
| | Amgen Inc., senior note, 2.20%, 2/21/27 | | | United States | | | | 100,000 | | | | 105,606 | |
| | AstraZeneca PLC, | | | | | | | | | | | | |
| | senior bond, 4.375%, 11/16/45 | | | United Kingdom | | | | 750,000 | | | | 976,723 | |
| | senior note, 3.375%, 11/16/25 | | | United Kingdom | | | | 100,000 | | | | 112,464 | |
| | Biogen Inc., senior bond, 5.20%, 9/15/45 | | | United States | | | | 575,000 | | | | 755,919 | |
| e | | Bristol-Myers Squibb Co., | | | | | | | | | | | | |
| | senior bond, 144A, 4.625%, 5/15/44 | | | United States | | | | 400,000 | | | | 537,037 | |
| | senior note, 144A, 2.60%, 5/16/22 | | | United States | | | | 100,000 | | | | 104,000 | |
| | Gilead Sciences Inc., | | | | | | | | | | | | |
| | senior bond, 4.60%, 9/01/35 | | | United States | | | | 200,000 | | | | 261,560 | |
| | senior bond, 4.80%, 4/01/44 | | | United States | | | | 700,000 | | | | 937,208 | |
| | senior note, 3.25%, 9/01/22 | | | United States | | | | 100,000 | | | | 105,673 | |
| | Perrigo Finance Unlimited Co., senior note, 3.15%, 6/15/30 | | | United States | | | | 100,000 | | | | 101,047 | |
| | Takeda Pharmaceutical Co. Ltd., | | | | | | | | | | | | |
| | h 3.175%, 7/09/50 | | | Japan | | | | 400,000 | | | | 403,477 | |
| | senior note, 5.00%, 11/26/28 | | | Japan | | | | 300,000 | | | | 370,317 | |
| | | | | | | | | | | | | | |
| | | | |
| | | | | | | | | | | | | 6,909,551 | |
| | | | | | | | | | | | | | |
| | | | |
| | Real Estate 0.1% | | | | | | | | | | | | |
| b | | China Overseas Finance Cayman VI Ltd., senior note, Reg S, 5.95%, 5/08/24 | | | China | | | | 200,000 | | | | 228,939 | |
| | Simon Property Group LP, senior note, 3.375%, 12/01/27 | | | United States | | | | 595,000 | | | | 632,297 | |
| | | | | | | | | | | | | | |
| | | | |
| | | | | | | | | | | | | 861,236 | |
| | | | | | | | | | | | | | |
FRANKLIN TEMPLETON VARIABLE INSURANCE PRODUCTS TRUST
STATEMENT OF INVESTMENTS (UNAUDITED)
Franklin Allocation VIP Fund (continued)
| | | | | | | | | | | | | | |
| | | | | Country/
Organization | | | Principal Amount* | | | Value | |
| | | | |
| | Corporate Bonds (continued) | | | | | | | | | | | | |
| | Retailing 0.4% | | | | | | | | | | | | |
| | Alibaba Group Holding Ltd., | | | | | | | | | | | | |
| | senior bond, 4.00%, 12/06/37 | | | China | | | | 300,000 | | | $ | 348,735 | |
| | senior bond, 4.20%, 12/06/47 | | | China | | | | 800,000 | | | | 987,959 | |
| | AutoNation Inc., senior bond, 4.75%, 6/01/30 | | | United States | | | | 100,000 | | | | 108,551 | |
| | AutoZone Inc., senior note, 3.75%, 4/18/29 | | | United States | | | | 100,000 | | | | 113,786 | |
| | Dollar Tree Inc., | | | | | | | | | | | | |
| | senior bond, 4.20%, 5/15/28 | | | United States | | | | 500,000 | | | | 582,237 | |
| | senior note, 4.00%, 5/15/25 | | | United States | | | | 450,000 | | | | 507,044 | |
| e | | Party City Holdings Inc., senior note, 144A, 6.625%, 8/01/26 | | | United States | | | | 200,000 | | | | 45,000 | |
| | Target Corp., senior note, 2.25%, 4/15/25 | | | United States | | | | 100,000 | | | | 107,092 | |
| | | | | | | | | | | | | | |
| | | | |
| | | | | | | | | | | | | 2,800,404 | |
| | | | | | | | | | | | | | |
| | | | |
| | Semiconductors & Semiconductor Equipment 0.0%† | | | | | | | | | | | | |
| | Intel Corp., senior note, 3.90%, 3/25/30 | | | United States | | | | 100,000 | | | | 121,018 | |
| | | | | | | | | | | | | | |
| | | | |
| | Software & Services 0.4% | | | | | | | | | | | | |
| | Fiserv Inc., senior bond, 3.50%, 7/01/29 | | | United States | | | | 870,000 | | | | 978,793 | |
| | Microsoft Corp, senior note, 3.30%, 2/06/27 | | | United States | | | | 100,000 | | | | 114,424 | |
| | Microsoft Corp., senior note, 2.65%, 11/03/22 | | | United States | | | | 1,720,000 | | | | 1,810,875 | |
| | | | | | | | | | | | | | |
| | | | |
| | | | | | | | | | | | | 2,904,092 | |
| | | | | | | | | | | | | | |
| | | | |
| | Technology Hardware & Equipment 0.0%† | | | | | | | | | | | | |
| e | | CommScope Technologies LLC, senior bond, 144A, 5.00%, 3/15/27 | | | United States | | | | 100,000 | | | | 90,371 | |
| e | | Presidio Holdings Inc., senior note, 144A, 8.25%, 2/01/28 | | | United States | | | | 100,000 | | | | 100,313 | |
| | | | | | | | | | | | | | |
| | | | |
| | | | | | | | | | | | | 190,684 | |
| | | | | | | | | | | | | | |
| | | | |
| | Telecommunication Services 0.4% | | | | | | | | | | | | |
| e | | Altice France SA/France, senior secured note, 144A, 5.50%, 1/15/28 | | | France | | | | 300,000 | | | | 303,507 | |
| | AT&T Inc., | | | | | | | | | | | | |
| | senior note, 3.80%, 2/15/27 | | | United States | | | | 920,000 | | | | 1,036,888 | |
| | senior note, 2.30%, 6/01/27 | | | United States | | | | 100,000 | | | | 103,407 | |
| | Bell Canada Inc., senior bond, 4.464%, 4/01/48 | | | Canada | | | | 200,000 | | | | 253,806 | |
| | France Telecom SA, senior bond, 9.00%, 3/01/31 | | | France | | | | 300,000 | | | | 489,720 | |
| | Telefonica Emisiones SA, | | | | | | | | | | | | |
| | senior bond, 7.045%, 6/20/36 | | | Spain | | | | 200,000 | | | | 291,319 | |
| | senior bond, 5.52%, 3/01/49 | | | Spain | | | | 200,000 | | | | 263,349 | |
| | Time Warner Entertainment Co. LP, senior bond, 8.375%, 3/15/23 | | | United States | | | | 100,000 | | | | 117,268 | |
| | Verizon Communications Inc., | | | | | | | | | | | | |
| | senior bond, 4.016%, 12/03/29 | | | United States | | | | 100,000 | | | | 119,767 | |
| | senior bond, 4.00%, 3/22/50 | | | United States | | | | 100,000 | | | | 126,477 | |
| | | | | | | | | | | | | | |
| | | | |
| | | | | | | | | | | | | 3,105,508 | |
| | | | | | | | | | | | | | |
| | | | |
| | Transportation 0.4% | | | | | | | | | | | | |
| | Burlington Northern Santa Fe LLC, | | | | | | | | | | | | |
| | senior bond, 4.90%, 4/01/44 | | | United States | | | | 200,000 | | | | 268,037 | |
| | senior bond, 4.15%, 4/01/45 | | | United States | | | | 100,000 | | | | 124,209 | |
FRANKLIN TEMPLETON VARIABLE INSURANCE PRODUCTS TRUST
STATEMENT OF INVESTMENTS (UNAUDITED)
Franklin Allocation VIP Fund (continued)
| | | | | | | | | | | | | | |
| | | | | Country/
Organization | | | Principal Amount* | | | Value | |
| | | | |
| | Corporate Bonds (continued) | | | | | | | | | | | | |
| | Transportation (continued) | | | | | | | | | | | | |
| | CSX Corp., senior bond, 4.75%, 11/15/48 | | | United States | | | | 725,000 | | | $ | 963,800 | |
| | Fedex Corp., senior bond, 5.10%, 1/15/44 | | | United States | | | | 550,000 | | | | 643,368 | |
| | FedEx Corp., | | | | | | | | | | | | |
| | senior bond, 4.75%, 11/15/45 | | | United States | | | | 100,000 | | | | 110,387 | |
| | senior note, 3.80%, 5/15/25 | | | United States | | | | 400,000 | | | | 445,124 | |
| e | | Mexico City Airport Trust, senior secured bond, first lien, 144A, 5.50%, 7/31/47 | | | Mexico | | | | 200,000 | | | | 176,615 | |
| b,i | | RZD Capital PLC, (Russian Railways), loan participation, senior bond, Reg S, 5.70%, 4/05/22 | | | Russia | | | | 200,000 | | | | 212,674 | |
| | United Parcel Service Inc., senior bond, 5.30%, 4/01/50 | | | United States | | | | 100,000 | | | | 143,488 | |
| | | | | | | | | | | | | | |
| | | | |
| | | | | | | | | | | | | 3,087,702 | |
| | | | | | | | | | | | | | |
| | | | |
| | Utilities 1.4% | | | | | | | | | | | | |
| e | | Calpine Corp., senior note, 144A, 5.125%, 3/15/28 | | | United States | | | | 100,000 | | | | 97,962 | |
| e | | Colbun SA, | | | | | | | | | | | | |
| | senior note, 144A, 3.95%, 10/11/27 | | | Chile | | | | 200,000 | | | | 215,471 | |
| | senior note, 144A, 3.15%, 3/06/30 | | | Chile | | | | 200,000 | | | | 202,600 | |
| | Dominion Energy Inc., | | | | | | | | | | | | |
| | senior note, 4.25%, 6/01/28 | | | United States | | | | 1,250,000 | | | | 1,440,190 | |
| | senior note, 3.375%, 4/01/30 | | | United States | | | | 100,000 | | | | 110,850 | |
| | Duke Energy Corp., senior bond, 3.75%, 9/01/46 | | | United States | | | | 200,000 | | | | 226,868 | |
| | Duke Energy Florida LLC., secured bond, 6.40%, 6/15/38 | | | United States | | | | 200,000 | | | | 305,370 | |
| e | | Electricite de France SA, senior note, 144A, 4.50%, 9/21/28 | | | France | | | | 1,055,000 | | | | 1,229,909 | |
| e | | Enel Finance International NV, senior note, 144A, 4.25%, 9/14/23 | | | Italy | | | | 1,200,000 | | | | 1,306,734 | |
| | Exelon Corp., senior bond, 4.05%, 4/15/30 | | | United States | | | | 400,000 | | | | 462,703 | |
| | Georgia Power Co., senior bond, 4.30%, 3/15/42 | | | United States | | | | 1,200,000 | | | | 1,396,096 | |
| | MidAmerican Energy Holdings Co., senior bond, 6.125%, 4/01/36 | | | United States | | | | 200,000 | | | | 288,651 | |
| | Public Service Enterprise Group Inc., senior note, 2.875%, 6/15/24 | | | United States | | | | 1,000,000 | | | | 1,068,270 | |
| | The Southern Co., senior bond, 3.70%, 4/30/30 | | | United States | | | | 700,000 | | | | 801,872 | |
| e | | State Grid Overseas Investment 2016 Ltd., senior note, 144A, 3.50%, 5/04/27 | | | China | | | | 600,000 | | | | 664,434 | |
| e | | Talen Energy Supply LLC, senior secured note, 144A, 7.25%, 5/15/27 | | | United States | | | | 100,000 | | | | 99,669 | |
| e | | Vistra Operations Co. LLC, senior secured note, first lien, 144A, 3.55%, 7/15/24 | | | United States | | | | 235,000 | | | | 242,692 | |
| | | | | | | | | | | | | | |
| | | | |
| | | | | | | | | | | | | 10,160,341 | |
| | | | | | | | | | | | | | |
| | | | |
| | Total Corporate Bonds (Cost $101,858,508) | | | | | | | | | | | 109,181,935 | |
| | | | | | | | | | | | | | |
| | | | |
| g,j | | Senior Floating Rate Interests 0.3% | | | | | | | | | | | | |
| | Automobiles & Components 0.0%† | | | | | | | | | | | | |
| | Clarios Global LP (Power Solutions), Initial Dollar Term Loan, 3.678%, (1-month USD LIBOR + 3.50%), 4/30/26 | | | United States | | | | 29,850 | | | | 28,531 | |
| | | | | | | | | | | | | | |
| | | | |
| | Capital Goods 0.1% | | | | | | | | | | | | |
| | Altra Industrial Motion Corp., Term Loan, 2.178%, (1-month USD LIBOR + 2.00%), 10/01/25 | | | United States | | | | 27,138 | | | | 25,917 | |
| k | | Dynasty Acquisition Co. Inc., | | | | | | | | | | | | |
| | Initial Term B-1 Loan, 3.808%, (3-month USD LIBOR + 3.50%), 4/04/26 | | | United States | | | | 24,471 | | | | 21,106 | |
| | Initial Term B-2 Loan (CAD), 3.808%, (3-month USD LIBOR + 3.50%), 4/04/26 | | | United States | | | | 13,156 | | | | 11,347 | |
FRANKLIN TEMPLETON VARIABLE INSURANCE PRODUCTS TRUST
STATEMENT OF INVESTMENTS (UNAUDITED)
Franklin Allocation VIP Fund (continued)
| | | | | | | | | | | | | | |
| | | | | Country/
Organization | | | Principal Amount* | | | Value | |
| | | | |
| g,j | | Senior Floating Rate Interests (continued) | | | | | | | | | | | | |
| | Capital Goods (continued) | | | | | | | | | | | | |
| | Navistar Inc., Tranche B Term Loan, 3.70%, (1-month USD LIBOR + 3.50%), 11/06/24 | | | United States | | | | 296,962 | | | $ | 282,114 | |
| | | | | | | | | | | | | | |
| | | | |
| | | | | | | | | | | | | 340,484 | |
| | | | | | | | | | | | | | |
| | | | |
| | Commercial & Professional Services 0.0%† | | | | | | | | | | | | |
| | Pitney Bowes Inc., Incremental Tranche Term B Loans, 5.68%, (1-month USD LIBOR + 5.50%), 1/07/25 | | | United States | | | | 98,750 | | | | 83,444 | |
| k | | Ventia Pty. Ltd., Term B Loans, 5.00%, (3-month USD LIBOR + 4.00%), 5/21/26 | | | Australia | | | | 22,500 | | | | 22,050 | |
| | | | | | | | | | | | | | |
| | | | |
| | | | | | | | | | | | | 105,494 | |
| | | | | | | | | | | | | | |
| | | | |
| | Consumer Durables & Apparel 0.0%† | | | | | | | | | | | | |
| | Playtika Holding Corp., Term B Loans, 7.072%, (3-month USD LIBOR + 6.00%), 12/10/24 | | | United States | | | | 19,500 | | | | 19,537 | |
| | | | | | | | | | | | | | |
| | | | |
| | Consumer Services 0.1% | | | | | | | | | | | | |
| | Caesars Resort Collection LLC, Term B Loans, 2.928%, (1-month USD LIBOR + 2.75%), 12/22/24 | | | United States | | | | 99,490 | | | | 89,154 | |
| | NASCAR Holdings Inc., Initial Term Loans, 2.93%, (1-month USD LIBOR + 2.75%), 10/18/26 | | | United States | | | | 259,179 | | | | 249,590 | |
| | | | | | | | | | | | | | |
| | | | |
| | | | | | | | | | | | | 338,744 | |
| | | | | | | | | | | | | | |
| | | | |
| | Energy 0.0%† | | | | | | | | | | | | |
| | Buckeye Partners LP, Initial Term Loans, 2.923%, (1-month USD LIBOR + 2.75%), 11/01/26 | | | United States | | | | 51,192 | | | | 49,388 | |
| | | | | | | | | | | | | | |
| | | | |
| | Food & Staples Retailing 0.0%† | | | | | | | | | | | | |
| | Whatabrands LLC, 2020 Refinancing Term Loans, 2.925%, (1-month USD LIBOR + 2.75%), 8/02/26 | | | United States | | | | 19,900 | | | | 19,092 | |
| | | | | | | | | | | | | | |
| | | | |
| | Food, Beverage & Tobacco 0.0%† | | | | | | | | | | | | |
| | B&G Foods Inc., Tranche B-4 Term Loan, 2.678%, (1-month USD LIBOR + 2.50%), 10/10/26 | | | United States | | | | 99,250 | | | | 98,226 | |
| | JBS USA Lux SA, New Term Loans, 3.072%, (3-month USD LIBOR + 2.00%), 5/01/26 | | | United States | | | | 43,786 | | | | 41,980 | |
| | | | | | | | | | | | | | |
| | | | | | | | | | | | | 140,206 | |
| | | | |
| | Health Care Equipment & Services 0.0%† | | | | | | | | | | | | |
| | Catalent Pharma Solutions Inc., Dollar Term B-2 Loan, 3.25%, (1-month USD LIBOR + 2.25%), 5/17/26 | | | United States | | | | 99,496 | | | | 98,501 | |
| | Inovalon Holdings Inc., Refinancing Date Term Loans, 3.188%, (1-month USD LIBOR + 3.00%), 4/02/25 | | | United States | | | | 4,426 | | | | 4,311 | |
| | Phoenix Guarantor Inc., Tranche B-1 Term Loan, 3.435%, (1-month USD LIBOR + 3.25%), 3/05/26 | | | United States | | | | 36,806 | | | | 35,540 | |
| | | | | | | | | | | | | | |
| | | | |
| | | | | | | | | | | | | 138,352 | |
| | | | | | | | | | | | | | |
| | | | |
| | Household & Personal Products 0.0%† | | | | | | | | | | | | |
| k,l | | Coty Inc, Term Loan, TBD, 4/05/25 | | | United States | | | | 29,924 | | | | 26,894 | |
| | | | | | | | | | | | | | |
FRANKLIN TEMPLETON VARIABLE INSURANCE PRODUCTS TRUST
STATEMENT OF INVESTMENTS (UNAUDITED)
Franklin Allocation VIP Fund (continued)
| | | | | | | | | | | | | | |
| | | | | Country/
Organization | | | Principal Amount* | | | Value | |
| | | | |
| g,j | | Senior Floating Rate Interests (continued) | | | | | | | | | | | | |
| | Insurance 0.0%† | | | | | | | | | | | | |
| | Alliant Holdings Intermediate LLC/Alliant Holdings Co-Issuer, Initial Term Loan, 2.928%, (1-month USD LIBOR + 2.75%), 5/10/25 | | | United States | | | | 39,797 | | | $ | 37,807 | |
| | AssuredPartners Inc., 2020 February Refinancing Term Loans, 3.678%, (1-month USD LIBOR + 3.50%), 2/13/27 | | | United States | | | | 29,850 | | | | 28,619 | |
| | | | | | | | | | | | | | |
| | | | |
| | | | | | | | | | | | | 66,426 | |
| | | | | | | | | | | | | | |
| | | | |
| | Materials 0.0%† | | | | | | | | | | | | |
| k,l | | Illuminate Buyer LLC, Term Loan, TBD, 6/15/27 | | | United States | | | | 8,147 | | | | 8,040 | |
| | Mauser Packaging Solutions Holding Co., Initial Term Loan, 4.561%, (1-month USD LIBOR + 3.25%), 4/03/24 | | | United States | | | | 29,923 | | | | 27,021 | |
| | | | | | | | | | | | | | |
| | | | |
| | | | | | | | | | | | | 35,061 | |
| | | | | | | | | | | | | | |
| | | | |
| | Media & Entertainment 0.0%† | | | | | | | | | | | | |
| k,l | | Banijay Group U.S. Holding Inc., Facility B (USD) Loan, TBD, 2/03/25 | | | France | | | | 20,000 | | | | 19,000 | |
| | Diamond Sports Group LLC, Term Loan, 3.43%, (1-month USD LIBOR + 3.25%), 8/24/26 | | | United States | | | | 67,755 | | | | 55,474 | |
| | | | | | | | | | | | | | |
| | | | |
| | | | | | | | | | | | | 74,474 | |
| | | | | | | | | | | | | | |
| | | | |
| | Pharmaceuticals, Biotechnology & Life Sciences 0.0%† | | | | | | | | | | | | |
| | eResearch Technology Inc., Initial Term Loan, 5.50%, (1-month USD LIBOR + 4.50%), 2/04/27 | | | United States | | | | 10,909 | | | | 10,745 | |
| | Grifols Worldwide Operations USA Inc., Dollar Tranche B Term Loan, 2.109%, (1-week USD LIBOR + 2.00%), 11/15/27 | | | United States | | | | 69,650 | | | | 67,261 | |
| | | | | | | | | | | | | | |
| | | | |
| | | | | | | | | | | | | 78,006 | |
| | | | | | | | | | | | | | |
| | | | |
| | Retailing 0.0%† | | | | | | | | | | | | |
| | Bass Pro Group LLC, Initial Term Loans, 6.072%, (3-month USD LIBOR + 5.00%), 9/25/24 | | | United States | | | | 133,890 | | | | 129,405 | |
| | Harbor Freight Tools USA Inc., Refinancing Loans, 3.25%, (1-month USD LIBOR + 2.50%), 8/19/23 | | | United States | | | | 60,332 | | | | 58,236 | |
| | Staples Inc., 2019 Refinancing Term B-1 Loans, 5.687%, (3-month USD LIBOR + 5.00%), 4/12/26 | | | United States | | | | 14,561 | | | | 12,577 | |
| | | | | | | | | | | | | | |
| | | | |
| | | | | | | | | | | | | 200,218 | |
| | | | | | | | | | | | | | |
| | | | |
| | Software & Services 0.1% | | | | | | | | | | | | |
| | Dcert Buyer Inc., Initial Term Loans, 4.178%, (1-month USD LIBOR + 4.00%), 10/16/26 | | | United States | | | | 49,875 | | | | 48,431 | |
| | Hyland Software Inc., Term Loans, 4.00%, (1-month USD LIBOR + 3.25%), 7/01/24 | | | United States | | | | 14,962 | | | | 14,573 | |
| | LegalZoom.com Inc., 2018 Term Loans, 4.678%, (1-month USD LIBOR + 4.50%), 11/21/24 | | | United States | | | | 39,798 | | | | 39,002 | |
| | Surf Holdings LLC, Dollar Tranche Term Loan, 3.827%, (3-month USD LIBOR + 3.50%), 3/05/27 | | | United States | | | | 30,372 | | | | 29,239 | |
| | TIBCO Software Inc., Term B-3 Loans, 3.93%, (1-month USD LIBOR + 3.75%), 7/31/26 | | | United States | | | | 30,000 | | | | 28,838 | |
| k,l | | The Ultimate Software Group Inc., 2020 Incremental Term Loan, TBD, 5/03/26 | | | United States | | | | 5,253 | | | | 5,202 | |
| k | | Vertafore Inc., Initial Term Loans, 3.428%, (1-month USD LIBOR + 3.25%), 7/02/25 | | | United States | | | | 9,975 | | | | 9,432 | |
| | Waystar (Navicure Inc.), Initial Term Loans, 4.178%, (1-month USD LIBOR + 4.00%), 10/22/26 | | | United States | | | | 29,925 | | | | 28,952 | |
| | | | | | | | | | | | | | |
| | | | |
| | | | | | | | | | | | | 203,669 | |
| | | | | | | | | | | | | | |
FRANKLIN TEMPLETON VARIABLE INSURANCE PRODUCTS TRUST
STATEMENT OF INVESTMENTS (UNAUDITED)
Franklin Allocation VIP Fund (continued)
| | | | | | | | | | | | | | | | |
| | | | | Country/
Organization | | | Principal Amount* | | | | | Value | |
| | | | | |
| g,j | | Senior Floating Rate Interests (continued) | | | | | | | | | | | | | | |
| | Technology Hardware & Equipment 0.0%† | | | | | | | | | | | | | | |
| | CommScope Inc., Initial Term Loans, 3.428%, (1-month USD LIBOR + 3.25%), 4/04/26 | | | United States | | | | 69,649 | | | | | $ | 66,384 | |
| | | | | | | | | | | | | | | | |
| | | | | |
| | Telecommunication Services 0.0%† | | | | | | | | | | | | | | |
| | Aventiv Technologies LLC, Initial Term Loan, 5.500%, (3-month USD LIBOR + 4.50%), 11/01/24 | | | United States | | | | 29,620 | | | | | | 24,738 | |
| | Global Tel*Link Corp., First Lien Term Loan, 4.428%, (1-month USD LIBOR + 4.25%), 11/29/25 | | | United States | | | | 39,474 | | | | | | 34,428 | |
| | | | | | | | | | | | | | | | |
| | | | | |
| | | | | | | | | | | | | | | 59,166 | |
| | | | | | | | | | | | | | | | |
| | | | | |
| | Transportation 0.0%† | | | | | | | | | | | | | | |
| | Avis Budget Car Rental LLC, Tranche B Term, 2.43%, (1-month USD LIBOR + 2.25%), 8/06/27 | | | United States | | | | 116,014 | | | | | | 103,736 | |
| | JetBlue Airways Corporation, Term Loan, 6.25%, (3-month USD LIBOR + 5.25%), 6/16/24 | | | United States | | | | 5,078 | | | | | | 4,987 | |
| k | | The Kenan Advantage Group Inc., | | | | | | | | | | | | | | |
| | Initial Canadian Term Loan, 4.00%, (1-month USD LIBOR + 3.00%), 7/29/22 | | �� | United States | | | | 5,749 | | | | | | 5,389 | |
| | Initial U.S. Term Loans, 4.00%, (1-month USD LIBOR + 3.00%), 7/31/22 | | | United States | | | | 24,173 | | | | | | 22,617 | |
| | | | | | | | | | | | | | | | |
| | | | | |
| | | | | | | | | | | | | | | 136,729 | |
| | | | | | | | | | | | | | | | |
| | | | | |
| | Total Senior Floating Rate Interests (Cost $2,224,556) | | | | | | | | | | | | | 2,126,855 | |
| | | | | | | | | | | | | | | | |
| | | | | |
| | Foreign Government and Agency Securities 0.9% | | | | | | | | | | | | | | |
| e | | The African Export-Import Bank, senior bond, 144A, 3.994%, 9/21/29 | | | Supranationalm | | | | 200,000 | | | | | | 197,859 | |
| e | | Angolan Government International Bond, senior note, 144A, 8.25%, 5/09/28 | | | Angola | | | | 550,000 | | | | | | 455,288 | |
| b | | Banque Centrale de Tunisie International Bond, senior note, Reg S, 5.625%, 2/17/24 | | | Tunisia | | | | 350,000 | | | EUR | | | 362,808 | |
| e | | Banque Ouest Africaine de Developpement, senior note, 144A, 5.00%, 7/27/27 | | | Supranationalm | | | | 300,000 | | | | | | 313,755 | |
| e | | Dominican Republic, senior note, 144A, 8.90%, 2/15/23 | | | Dominican Republic | | | | 15,700,000 | | | DOP | | | 251,077 | |
| e | | Government of Belarus International Bond, senior note, 144A, 7.625%, 6/29/27 | | | Belarus | | | | 200,000 | | | | | | 206,855 | |
| | Government of Colombia, | | | | | | | | | | | | | | |
| | senior bond, 9.85%, 6/28/27 | | | Colombia | | | | 630,000,000 | | | COP | | | 211,895 | |
| | senior bond, 5.00%, 6/15/45 | | | Colombia | | | | 500,000 | | | | | | 563,398 | |
| e | | Government of Gabon, senior note, 144A, 6.625%, 2/06/31 | | | Gabon | | | | 350,000 | | | | | | 313,588 | |
| e | | Government of Indonesia, senior bond, 144A, 4.35%, 1/08/27 | | | Indonesia | | | | 500,000 | | | | | | 556,575 | |
| e | | Government of Iraq, 144A, 5.80%, 1/15/28 | | | Iraq | | | | 350,000 | | | | | | 316,295 | |
| e | | Government of Kazakhstan, senior bond, 144A, 4.875%, 10/14/44 | | | Kazakhstan | | | | 300,000 | | | | | | 382,057 | |
| | Government of Mexico, | | | | | | | | | | | | | | |
| | senior bond, M 20, 8.50%, 5/31/29 | | | Mexico | | | | 61,000n | | | MXN | | | 314,510 | |
| | senior note, 4.15%, 3/28/27 | | | Mexico | | | | 500,000 | | | | | | 535,938 | |
| | Government of Peru, senior bond, 6.55%, 3/14/37 | | | Peru | | | | 200,000 | | | | | | 305,111 | |
| | Government of South Africa, senior bond, 7.00%, 2/28/31 | | | South Africa | | | | 5,800,000 | | | ZAR | | | 275,181 | |
| e | | Government of Ukraine, senior bond, 144A, 7.375%, 9/25/32 | | | Ukraine | | | | 300,000 | | | | | | 302,321 | |
| | Government of Uruguay, | | | | | | | | | | | | | | |
| | senior bond, 4.50%, 8/14/24 | | | Uruguay | | | | 100,000 | | | | | | 109,741 | |
| | senior bond, 4.375%, 1/23/31 | | | Uruguay | | | | 150,000 | | | | | | 175,736 | |
| | o senior bond, Index Linked, 3.70%, 6/26/37 | | | Uruguay | | | | 10,507,408 | | | UYU | | | 250,169 | |
FRANKLIN TEMPLETON VARIABLE INSURANCE PRODUCTS TRUST
STATEMENT OF INVESTMENTS (UNAUDITED)
Franklin Allocation VIP Fund (continued)
| | | | | | | | | | | | | | | | |
| | | | | Country/
Organization | | | Principal Amount* | | | | | Value | |
| | | | | |
| | Foreign Government and Agency Securities (continued) | | | | | | | | | | | | | | |
| e | | Panama Notas del Tesoro, senior note, 144A, 3.75%, 4/17/26 | | | Panama | | | | 250,000 | | | | | $ | 261,991 | |
| | | | | | | | | | | | | | | | |
| | | | | |
| | Total Foreign Government and Agency Securities
(Cost $6,894,290) | | | | | | | | | | | | | 6,662,148 | |
| | | | | | | | | | | | | | | | |
| | | | | |
| | U.S. Government and Agency Securities 5.4% | | | | | | | | | | | | | | |
| | Federal Agricultural Mortgage Corp., 2.90%, 1/03/22 | | | United States | | | | 800,000 | | | | | | 830,743 | |
| | FFCB, | | | | | | | | | | | | | | |
| | 3.17%, 3/07/28 | | | United States | | | | 800,000 | | | | | | 922,163 | |
| | senior bond, 2.86%, 7/11/28 | | | United States | | | | 800,000 | | | | | | 903,007 | |
| | Overseas Private Investment Corp., senior note, 2.12%, 3/20/24 | | | United States | | | | 400,000 | | | | | | 412,615 | |
| | TVA, 5.88%, 4/01/36 | | | United States | | | | 630,000 | | | | | | 983,651 | |
| | U.S. Treasury Bond, | | | | | | | | | | | | | | |
| | 3.125%, 2/15/42 | | | United States | | | | 500,000 | | | | | | 678,838 | |
| | 2.50%, 2/15/46 | | | United States | | | | 840,000 | | | | | | 1,040,205 | |
| | 2.50%, 5/15/46 | | | United States | | | | 395,000 | | | | | | 489,839 | |
| | 2.25%, 8/15/46 | | | United States | | | | 4,575,000 | | | | | | 5,425,575 | |
| | 2.75%, 11/15/47 | | | United States | | | | 150,000 | | | | | | 196,216 | |
| | p 3.00%, 2/15/49 | | | United States | | | | 2,150,000 | | | | | | 2,967,462 | |
| | 2.25%, 8/15/49 | | | United States | | | | 500,000 | | | | | | 601,230 | |
| | o Index Linked, 2.00%, 1/15/26 | | | United States | | | | 516,828 | | | | | | 601,396 | |
| | o Index Linked, 1.75%, 1/15/28 | | | United States | | | | 2,387,013 | | | | | | 2,850,292 | |
| | o Index Linked, 3.625%, 4/15/28 | | | United States | | | | 713,497 | | | | | | 961,033 | |
| | U.S. Treasury Note, | | | | | | | | | | | | | | |
| | 2.125%, 3/31/24 | | | United States | | | | 16,100,000 | | | | | | 17,252,785 | |
| | 2.375%, 8/15/24 | | | United States | | | | 880,000 | | | | | | 957,619 | |
| | 2.25%, 8/15/27 | | | United States | | | | 920,000 | | | | | | 1,033,544 | |
| | o Index Linked, 0.125%, 7/15/24 | | | United States | | | | 864,016 | | | | | | 903,608 | |
| | o Index Linked, 0.375%, 7/15/25 | | | United States | | | | 648,838 | | | | | | 693,918 | |
| | United States Treasury Note/Bond, 1.25%, 5/15/50 | | | United States | | | | 50,000 | | | | | | 48,016 | |
| | | | | | | | | | | | | | | | |
| | | | | |
| | Total U.S. Government and Agency Securities
(Cost $38,686,872) | | | | | | | | | | | | | 40,753,755 | |
| | | | | | | | | | | | | | | | |
| | | | | |
| | Asset-Backed Securities and Commercial Mortgage-Backed Securities 3.0% | | | | | | | | | | | | | | |
| | | | | |
| | Diversified Financials 3.0% | | | | | | | | | | | | | | |
| e,q | | Adagio CLO VIII DAC, VIII-A, B1, 144A, FRN, 1.65%, 4/15/32 | | | Ireland | | | | 250,000 | | | EUR | | | 275,695 | |
| | American Express Credit Account Master Trust, | | | | | | | | | | | | | | |
| | 2019-1, A, 2.87%, 10/15/24 | | | United States | | | | 600,000 | | | | | | 625,901 | |
| | 2019-3, A, 2.00%, 4/15/25 | | | United States | | | | 410,000 | | | | | | 425,000 | |
| e,q | | Ares European CLO VIII BV, 8A, BR, 144A, FRN, 1.60%, 4/17/32 | | | Netherlands | | | | 250,000 | | | EUR | | | 271,989 | |
| e,r | | Atrium XII, 12A, CR, 144A, FRN, 2.748%, (3-month USD LIBOR + 1.65%), 4/22/27 | | | United States | | | | 1,240,000 | | | | | | 1,185,459 | |
| e,q | | Avoca CLO XVII Designated Activity Co., 17A, B1R, 144A, FRN, 1.70%, 10/15/32 | | | Ireland | | | | 250,000 | | | EUR | | | 272,550 | |
| | BA Credit Card Trust, 2018-A3, A3, 3.10%, 12/15/23 | | | United States | | | | 500,000 | | | | | | 514,200 | |
| e,q | | Blackrock European CLO IX DAC, 9A, B, 144A, FRN, 1.55%, 12/15/32 | | | Ireland | | | | 250,000 | | | EUR | | | 268,141 | |
| e,q | | BlueMountain CLO XXII Ltd., 2018-1A, B, 144A, FRN, 2.46%, 7/30/30 | | | United States | | | | 900,000 | | | | | | 845,694 | |
| e,q | | BlueMountain Fuji Eur CLO V DAC, 5A, B, 144A, FRN, 1.55%, 1/15/33 | | | Ireland | | | | 250,000 | | | EUR | | | 269,739 | |
FRANKLIN TEMPLETON VARIABLE INSURANCE PRODUCTS TRUST
STATEMENT OF INVESTMENTS (UNAUDITED)
Franklin Allocation VIP Fund (continued)
| | | | | | | | | | | | | | | | |
| | | | | Country/
Organization | | | Principal Amount* | | | | | Value | |
| | | | | |
| | Asset-Backed Securities and Commercial Mortgage-Backed Securities (continued) | | | | | | | | | | | | | | |
| | Diversified Financials (continued) | | | | | | | | | | | | | | |
| e | | BWAY Mortgage Trust, 2013-1515, C, 144A, 3.454%, 3/10/33 | | | United States | | | | 750,000 | | | | | $ | 805,913 | |
| | Capital One Multi-Asset Execution Trust, 2015-A4, A4, 2.75%, 5/15/25 | | | United States | | | | 380,000 | | | | | | 398,341 | |
| e,r | | Carlyle Global Market Strategies CLO Ltd., 2014-4RA, C, 144A, FRN, 4.119%, (3-month USD LIBOR + 2.90%), 7/15/30 | | | United States | | | | 250,000 | | | | | | 214,435 | |
| e,q | | Cent CLO, 2018-28A, C, 144A, FRN, 3.894%, 11/07/30 | | | United States | | | | 750,000 | | | | | | 676,565 | |
| e,q | | CIM Trust, 2019-INV2, A3, 144A, FRN, 4.00%, 5/25/49 | | | United States | | | | 437,518 | | | | | | 452,360 | |
| q | | Citibank Credit Card Issuance Trust, 2017-A7, A7, FRN, 0.545%, 8/08/24 | | | United States | | | | 130,000 | | | | | | 130,591 | |
| | Discover Card Execution Note Trust, 2019-A1, A1, 3.04%, 7/15/24 | | | United States | | | | 500,000 | | | | | | 520,604 | |
| e,r | | Dryden 42 Senior Loan Fund, 2016-42A, CR, 144A, FRN, 3.269%, (3-month USD LIBOR + 2.05%), 7/15/30 | | | United States | | | | 900,000 | | | | | | 849,806 | |
| e,q | | Euro-Galaxy III CLO BV, 2013-3A, B2ER, 144A, FRN, 1.50%, 1/17/31 | | | Netherlands | | | | 250,000 | | | EUR | | | 277,062 | |
| q | | FHLMC Structured Agency Credit Risk Debt Notes, | | | | | | | | | | | | | | |
| | 2017-HQA1, M2, FRN, 3.735%, 8/25/29 | | | United States | | | | 216,624 | | | | | | 222,054 | |
| | 2017-HQA3, M2, FRN, 2.535%, 4/25/30 | | | United States | | | | 185,342 | | | | | | 186,363 | |
| | FNMA Connecticut Avenue Securities, | | | | | | | | | | | | | | |
| | r 2013-C01, M2, FRN, 5.435%, (1-month USD LIBOR + 5.25%), 10/25/23 | | | United States | | | | 699,575 | | | | | | 640,916 | |
| | r 2014-C01, M2, FRN, 4.585%, (1-month USD LIBOR + 4.40%), 1/25/24 | | | United States | | | | 862,491 | | | | | | 771,517 | |
| | r 2014-C03, 1M2, FRN, 3.185%, (1-month USD LIBOR + 3.00%), 7/25/24 | | | United States | | | | 1,198,077 | | | | | | 1,059,757 | |
| | r 2014-C04, 2M2, FRN, 5.185%, (1-month USD LIBOR + 5.00%), 11/25/24 | | | United States | | | | 913,437 | | | | | | 945,445 | |
| | q 2016-C02, 1M2, FRN, 6.185%, 9/25/28 | | | United States | | | | 665,104 | | | | | | 694,876 | |
| | q 2016-C04, 1M2, FRN, 4.435%, 1/25/29 | | | United States | | | | 824,407 | | | | | | 860,371 | |
| | q 2016-C05, 2M2, FRN, 4.635%, 1/25/29 | | | United States | | | | 276,926 | | | | | | 285,245 | |
| | q 2016-C06, 1M2, FRN, 4.435%, 4/25/29 | | | United States | | | | 167,062 | | | | | | 176,006 | |
| | r 2017-C01, 1M2, FRN, 3.735%, (1-month USD LIBOR + 3.55%), 7/25/29 | | | United States | | | | 877,436 | | | | | | 899,677 | |
| | q 2017-C02, 2M2, FRN, 3.835%, 9/25/29 | | | United States | | | | 499,604 | | | | | | 504,189 | |
| | q 2017-C05, 1M2, FRN, 2.385%, 1/25/30 | | | United States | | | | 862,240 | | | | | | 851,834 | |
| e,r | | LCM XXV Ltd., 25A, B2, 144A, FRN, 2.785%, (3-month USD LIBOR + 1.65%), 7/20/30 | | | United States | | | | 1,200,000 | | | | | | 1,158,579 | |
| e,q | | Madison Park Euro Funding VIII DAC, 8A, BRN, 144A, FRN, 1.70%, 4/15/32 | | | Ireland | | | | 300,000 | | | EUR | | | 325,848 | |
| e,q | | Neuberger Berman CLO XVIII Ltd., 2014-18A, CR2, 144A, FRN, 4.109%, 10/21/30 | | | United States | | | | 800,000 | | | | | | 707,510 | |
| e,q | | Octagon Investment Partners 28 Ltd., 2016-1A, BR, 144A, FRN, 2.82%, 10/24/30 | | | United States | | | | 1,200,000 | | | | | | 1,169,561 | |
| e,r | | Octagon Investment Partners XVI Ltd., 2013-1A, CR, 144A, FRN, 2.985%, (3-month USD LIBOR + 1.85%), 7/17/30 | | | United States | | | | 850,000 | | | | | | 787,623 | |
| e,q | | Provident Funding Mortgage Trust, 2019-1, A2, 144A, FRN, 3.00%, 12/25/49 | | | United States | | | | 283,436 | | | | | | 301,016 | |
| | 2020-1, A3, 144A, FRN, 3.00%, 2/25/50 | | | United States | | | | 443,152 | | | | | | 453,491 | |
| e,q | | Towd Point Mortgage Trust, 2015-5, A1B, 144A, FRN, 2.75%, 5/25/55 | | | United States | | | | 446,881 | | | | | | 450,993 | |
| | | | | | | | | | | | | | | | |
| | | | | |
| | Total Asset-Backed Securities and Commercial Mortgage-Backed Securities (Cost $23,924,137) | | | | | | | | | | | | | 22,732,916 | |
| | | | | | | | | | | | | | | | |
FRANKLIN TEMPLETON VARIABLE INSURANCE PRODUCTS TRUST
STATEMENT OF INVESTMENTS (UNAUDITED)
Franklin Allocation VIP Fund (continued)
| | | | | | | | | | | | | | |
| | | | | Country/
Organization | | | Principal Amount* | | | Value | |
| | | | |
| | Mortgage-Backed Securities 9.4% | | | | | | | | | | | | |
| | Federal Home Loan Mortgage Corp. (FHLMC) Fixed Rate 2.3% | | | | | | | | | | | | |
| | FHLMC 15 Year, 2.00%, 7/01/35 | | | United States | | | | 230,000 | | | $ | 237,897 | |
| | FHLMC 30 Year, 3.00%, 3/01/50 | | | United States | | | | 6,091,031 | | | | 6,442,356 | |
| | FHLMC 30 Year, 3.50%, 2/01/47 | | | United States | | | | 4,346,585 | | | | 4,694,953 | |
| | FHLMC 30 Year, 4.00%, 5/01/47 - 8/01/49 | | | United States | | | | 5,127,141 | | | | 5,489,693 | |
| | | | | | | | | | | | | | |
| | | | |
| | | | | | | | | | | | | 16,864,899 | |
| | | | | | | | | | | | | | |
| | | | |
| | Federal National Mortgage Association (FNMA) Fixed Rate 3.3% | | | | | | | | | | | | |
| | FNMA 15 Year, 2.50%, 6/01/35 | | | United States | | | | 795,781 | | | | 834,010 | |
| | FNMA 15 Year, 3.00%, 6/01/35 | | | United States | | | | 397,019 | | | | 418,120 | |
| | FNMA 30 Year, 2.50%, 6/01/50 | | | United States | | | | 598,706 | | | | 624,098 | |
| s | | FNMA 30 Year, 2.50%, 7/01/50 | | | United States | | | | 1,050,000 | | | | 1,094,256 | |
| | FNMA 30 Year, 3.00%, 1/01/50 | | | United States | | | | 5,058,795 | | | | 5,333,157 | |
| s | | FNMA 30 Year, 3.00%, 6/01/50 | | | United States | | | | 12,955,000 | | | | 13,641,210 | |
| | FNMA 30 Year, 4.00%, 1/01/50 | | | United States | | | | 1,021,243 | | | | 1,082,149 | |
| | FNMA 30 Year, 4.50%, 2/01/50 | | | United States | | | | 1,922,884 | | | | 2,102,639 | |
| | | | | | | | | | | | | | |
| | | | |
| | | | | | | | | | | | | 25,129,639 | |
| | | | | | | | | | | | | | |
| | | | |
| | Government National Mortgage Association (GNMA) Fixed Rate 3.8% | | | | | | | | | | | | |
| | GNMA II SF 30 Year, 3.00%, 9/20/47 - 2/20/50 | | | United States | | | | 3,908,495 | | | | 4,148,312 | |
| | GNMA II SF 30 Year, 3.50%, 12/20/49 | | | United States | | | | 1,138,335 | | | | 1,203,064 | |
| | GNMA II SF 30 Year, 3.50%, 2/20/50 | | | United States | | | | 10,816,883 | | | | 11,454,365 | |
| | GNMA II SF 30 Year, 3.50%, 6/20/50 | | | United States | | | | 3,990,000 | | | | 4,238,734 | |
| | GNMA II SF 30 Year, 4.00%, 11/20/49 | | | United States | | | | 4,612,420 | | | | 4,890,698 | |
| | GNMA II SF 30 Year, 4.00%, 12/20/49 | | | United States | | | | 2,724,831 | | | | 2,890,804 | |
| | | | | | | | | | | | | | |
| | | | |
| | | | | | | | | | | | | 28,825,977 | |
| | | | | | | | | | | | | | |
| | | | |
| | Total Mortgage-Backed Securities (Cost $70,009,383) | | | | | | | | | | | 70,820,515 | |
| | | | | | | | | | | | | | |
| | | | |
| | Municipal Bonds 0.9% | | | | | | | | | | | | |
| | Broward County Airport System Revenue, Refunding, Series C, 3.477%, 10/01/43 | | | United States | | | | 140,000 | | | | 140,078 | |
| | California Health Facilities Financing Authority Revenue, | | | | | | | | | | | | |
| | Senior, No Place Like Home Program, 2.934%, 6/01/32 | | | United States | | | | 135,000 | | | | 140,222 | |
| | Senior, No Place Like Home Program, 2.984%, 6/01/33 | | | United States | | | | 115,000 | | | | 119,306 | |
| | Senior, No Place Like Home Program, 3.034%, 6/01/34 | | | United States | | | | 90,000 | | | | 93,246 | |
| | California State GO, Bid Group - A, Refunding, 2.50%, 10/01/29 | | | United States | | | | 500,000 | | | | 544,850 | |
| | City of Austin Electric Utility System Revenue, Travis and Williamson Counties, Refunding, 6.262%, 11/15/32 | | | United States | | | | 270,000 | | | | 350,687 | |
| | Foothill/Eastern Transportation Corridor Agency Toll Road Revenue, Refunding, Series A, 4.094%, 1/15/49 | | | United States | | | | 70,000 | | | | 71,989 | |
| | Gilroy USD, GO, Santa Clara County, Refunding, 3.364%, 8/01/47 | | | United States | | | | 290,000 | | | | 298,036 | |
| | Honolulu City and County Wastewater System Revenue, Second Bond Resolution, Refunding, Junior Series B, 2.585%, 7/01/28 | | | United States | | | | 50,000 | | | | 53,120 | |
| | Maricopa County UHSD No. 210 Phoenix, GO, Series C, 5.00%, 7/01/31 | | | United States | | | | 200,000 | | | | 263,908 | |
| | Massachusetts State College Building Authority Revenue, Refunding, Series C, 3.373%, 5/01/43 | | | United States | | | | 230,000 | | | | 238,443 | |
| | Metro Wastewater Reclamation District Sewer Revenue, Refunding, Series B, 3.158%, 4/01/41 | | | United States | | | | 220,000 | | | | 230,908 | |
FRANKLIN TEMPLETON VARIABLE INSURANCE PRODUCTS TRUST
STATEMENT OF INVESTMENTS (UNAUDITED)
Franklin Allocation VIP Fund (continued)
| | | | | | | | | | | | | | |
| | | | | Country/
Organization | | | Principal Amount* | | | Value | |
| | | | |
| | Municipal Bonds (continued) | | | | | | | | | | | | |
| | New Jersey State Transportation Trust Fund Authority Revenue, Transportation System, Series B, 4.131%, 6/15/42 | | | United States | | | | 160,000 | | | $ | 149,426 | |
| | New York State Dormitory Authority Revenues, Non State Supported Debt, State University of New York Dormitory Facilities, Series B, 3.142%, 7/01/43 | | | United States | | | | 140,000 | | | | 144,670 | |
| | Ohio State Hospital Facility Revenue, Cleveland Clinic Health System Obligated Group, Refunding, Series G, 3.276%, 1/01/42 | | | United States | | | | 90,000 | | | | 95,211 | |
| | Oregon State Department of Transportation Highway User Tax Revenue, senior lien, Refunding, Series B, 3.168%, 11/15/38 | | | United States | | | | 175,000 | | | | 189,107 | |
| | Pennsylvania State Turnpike Commission Turnpike Revenue, Motor License Fund-Enhanced, Subordinate, Refunding, First Series, 3.579%, 12/01/43 | | | United States | | | | 440,000 | | | | 462,092 | |
| | Regional Transportation District Sales Tax Revenue, FasTracks Project, Refunding, Series A, 3.258%, 11/01/38 | | | United States | | | | 140,000 | | | | 152,942 | |
| | RWJ Barnabas Health Inc., 3.477%, 7/01/49 | | | United States | | | | 120,000 | | | | 126,892 | |
| | Salt Lake City Sales and Excise Tax Revenue, Refunding, Series B, 3.102%, 4/01/38 | | | United States | | | | 125,000 | | | | 127,242 | |
| | San Bernardino Community College District GO, San Bernadino and Riverside Counties, Election of 2018, Series A-1, 3.271%, 8/01/39 | | | United States | | | | 100,000 | | | | 108,995 | |
| | San Diego County Regional Transportation Commission Sales Tax Revenue, Limited Tax, Refunding, Series A, 3.248%, 4/01/48 | | | United States | | | | 105,000 | | | | 111,983 | |
| | San Francisco City and County Public Utilities Commission Water Revenue, Green Bonds, Refunding, Sub-Series A, 3.473%, 11/01/43 | | | United States | | | | 105,000 | | | | 112,534 | |
| | Sarasota County Capital Import, Revenue, 5.00%, 10/01/34 | | | United States | | | | 500,000 | | | | 649,275 | |
| | Texas State GO, Transportation Commission, Highway Improvement, Refunding, 3.211%, 4/01/44 | | | United States | | | | 765,000 | | | | 811,696 | |
| | Texas State University System Financing Revenue, | | | | | | | | | | | | |
| | Refunding, Series B, 2.938%, 3/15/33 | | | United States | | | | 105,000 | | | | 108,568 | |
| | Refunding, Serise B, 3.289%, 3/15/40 | | | United States | | | | 90,000 | | | | 92,664 | |
| | University of Pittsburgh of the Commonwealth System of Higher Education Revenue, Refunding, Series C, 3.005%, 9/15/41 | | | United States | | | | 250,000 | | | | 268,010 | |
| | Utah Transit Authority Sales Tax Revenue, Refunding, Series B, 3.443%, 12/15/42 | | | United States | | | | 175,000 | | | | 181,659 | |
| | | | | | | | | | | | | | |
| | | | |
| | Total Municipal Bonds (Cost $6,164,913) | | | | | | | | | | | 6,437,759 | |
| | | | | | | | | | | | | | |
| | | | |
| | Total Investments before Short Term Investments
(Cost $693,008,155) | | | | | | | | | | | 727,093,346 | |
| | | | | | | | | | | | | | |
| | | | |
| | | | | | | | Shares | | | | |
| | | | | | | | | | | | | | | |
| | | | |
| | Short Term Investments (Cost $31,820,585) 4.2% | | | | | | | | | | | | |
| | | | |
| | Money Market Funds 4.2% | | | | | | | | | | | | |
| c,t | | Institutional Fiduciary Trust Money Market Portfolio, 0.00% | | | United States | | | | 31,820,585 | | | | 31,820,585 | |
| | | | | | | | | | | | | | |
| | | | |
| | Total Investments (Cost $724,828,740) 101.0% | | | | | | | | | | | 758,913,931 | |
| | Options Written (0.0)%† | | | | | | | | | | | (2,898 | ) |
| | Other Assets, less Liabilities (1.0)% | | | | | | | | | | | (7,499,753 | ) |
| | | | | | | | | | | | | | |
| | | | |
| | Net Assets 100.0% | | | | | | | | | | $ | 751,411,280 | |
| | | | | | | | | | | | | | |
FRANKLIN TEMPLETON VARIABLE INSURANCE PRODUCTS TRUST
STATEMENT OF INVESTMENTS (UNAUDITED)
Franklin Allocation VIP Fund (continued)
| | | | | | | | | | | | | | |
| | | | | Number of
Contracts | | | Notional
Amount | | | Value | |
| u | | Options Written (Premiums received $4,426) (0.0)%† | | | | | | | | | | | | |
| | Puts - Exchange-Traded | | | | | | | | | | | | |
| | ManpowerGroup Inc., Put Option, Strike Price $65, Expires 7/17/20 | | | 19 | | | | 1,900 | | | $ | (2,898 | ) |
| | | | | | | | | | | | | | |
†Rounds to less than 0.1% of net assets.
*The principal amount is stated in U.S. dollars unless otherwise indicated.
aNon-income producing.
bSecurity was purchased pursuant to Regulation S under the Securities Act of 1933, which exempts from registration securities offered and sold outside of the United States. Such a security cannot be sold in the United States without either an effective registration statement filed pursuant to the Securities Act of 1933, or pursuant to an exemption from registration. At June 30, 2020, the aggregate value of these securities was $2,144,929, representing 0.3% of net assets.
cSee Note 3(e) regarding investments in affiliated management investment companies.
dVariable rate security. The rate shown represents the yield at period end.
eSecurity was purchased pursuant to Rule 144A under the Securities Act of 1933 and may be sold in transactions exempt from registration only to qualified institutional buyers or in a public offering registered under the Securities Act of 1933. At June 30, 2020, the aggregate value of these securities was $38,699,308, representing 5.1% of net assets.
fPerpetual security with no stated maturity date
gThe coupon rate shown represents the rate at period end.
hSecurity purchased on a when-issued basis. See Note 1(c).
iSee Note 1(e) regarding loan participation notes.
jSee Note 1(g) regarding senior floating rate interests.
kA portion or all of the security purchased on a delayed delivery basis. See Note 1(c).
lA portion or all of the security represents an unsettled loan commitment. The coupon rate is to-be determined (TBD) at the time of settlement and will be based upon a reference index/floor plus a spread.
mA supranational organization is an entity formed by two or more central governments through international treaties.
nPrincipal amount is stated in 100 Mexican Peso Units
oPrincipal amount of security is adjusted for inflation. See Note 1(i).
pA portion or all of the security has been segregated as collateral for open swap contracts. At June 30, 2020, the value of this security and/or cash pledged amounted to $370,353, representing less than 0.1% of net assets.
qAdjustable rate security with an interest rate that is not based on a published reference index and spread. The rate is based on the structure of the agreement and current market conditions. The coupon rate shown represents the rate at period end.
rThe coupon rate shown represents the rate inclusive of any caps or floors, if applicable, in effect at period end.
sSecurity purchased on a to-be-announced (TBA) basis. See Note 1(c).
tThe rate shown is the annualized seven-day effective yield at period end.
uSee Note 1(d) regarding written options.
FRANKLIN TEMPLETON VARIABLE INSURANCE PRODUCTS TRUST
STATEMENT OF INVESTMENTS (UNAUDITED)
Franklin Allocation VIP Fund (continued)
At June 30, 2020, the Fund had the following futures contracts outstanding. See Note 1(d).
Futures Contracts
| | | | | | | | | | | | | | | | | | | | |
| | | | | |
| Description | | Type | | | Number of
Contracts | | | Notional
Amount* | | | Expiration
Date | | | Value/
Unrealized
Appreciation
(Depreciation) | |
| | | | | |
| Equity Contracts | | | | | | | | | | | | | | | | | | | | |
S&P 500 E-Mini | | | Long | | | | 48 | | | | $ 7,416,480 | | | | 9/18/20 | | | | $ 56,057 | |
| | | | | | | | | | | | | | | | | | | | |
| | | | | |
| Interest Rate Contracts | | | | | | | | | | | | | | | | | | | | |
Australian 3 Yr. Bond | | | Long | | | | 30 | | | | 2,423,137 | | | | 9/15/20 | | | | 642 | |
Australian 10 Yr. Bond | | | Long | | | | 4 | | | | 410,656 | | | | 9/15/20 | | | | 4,214 | |
Canada 10 Yr. Bond | | | Long | | | | 32 | | | | 3,625,826 | | | | 9/21/20 | | | | 9,204 | |
CME Ultra Long Term U.S. Treasury Bond | | | Long | | | | 4 | | | | 872,625 | | | | 9/21/20 | | | | 11,369 | |
Euro-OAT | | | Long | | | | 19 | | | | 3,578,422 | | | | 9/08/20 | | | | 59,091 | |
U.S. Treasury 2 Yr. Note | | | Long | | | | 32 | | | | 7,066,500 | | | | 9/30/20 | | | | 1,335 | |
U.S. Treasury 5 Yr. Note | | | Long | | | | 24 | | | | 3,017,813 | | | | 9/30/20 | | | | 5,657 | |
U.S. Treasury 10 Yr. Note | | | Short | | | | 10 | | | | 1,391,719 | | | | 9/21/20 | | | | (5,363 | ) |
U.S. Treasury 10 Yr. Note | | | Long | | | | 54 | | | | 7,515,281 | | | | 9/21/20 | | | | 24,370 | |
U.S. Treasury 30 Yr. Bond | | | Long | | | | 7 | | | | 1,249,938 | | | | 9/21/20 | | | | 4,146 | |
Ultra 10 Yr. U.S. Treasury Note | | | Short | | | | 17 | | | | 2,677,234 | | | | 9/21/20 | | | | (15,806 | ) |
| | | | | | | | | | | | | | | | | | | | |
| | | | | |
| | | | | | | | | | | $33,829,151 | | | | | | | | $ 98,859 | |
| | | | | | | | | | | | | | | | | | | | |
| | | | | |
Total Futures Contracts | | | | | | | | | | | $41,245,631 | | | | | | | | $154,916 | |
| | | | | | | | | | | | | | | | | | | | |
*As of period end
At June 30, 2020, the Fund had the following forward exchange contracts outstanding. See Note 1(d).
Forward Exchange Contracts
| | | | | | | | | | | | | | | | | | | | | | | | | | | | |
| | | | | | | |
| Currency | | Counterpartya | | | Type | | | Quantity | | | Contract
Amount* | | | Settlement
Date | | | Unrealized
Appreciation | | | Unrealized
Depreciation | |
| | | | | | | |
| OTC Forward Exchange Contracts | | | | | | | | | | | | | | | | | | | | | | | | | | | | |
Australian Dollar | | | JPHQ | | | | Buy | | | | 1,100,000 | | | | 719,644 | | | | 7/02/20 | | | | $ 39,372 | | | | $ — | |
Australian Dollar | | | JPHQ | | | | Sell | | | | 1,100,000 | | | | 758,373 | | | | 7/02/20 | | | | — | | | | (643 | ) |
Turkish Lira | | | JPHQ | | | | Buy | | | | 1,380,000 | | | | 200,305 | | | | 7/14/20 | | | | 300 | | | | — | |
Japanese Yen | | | CITI | | | | Buy | | | | 182,581,700 | | | | 1,700,000 | | | | 7/16/20 | | | | — | | | | (8,679 | ) |
Japanese Yen | | | CITI | | | | Sell | | | | 182,581,700 | | | | 1,699,264 | | | | 7/16/20 | | | | 7,943 | | | | — | |
Australian Dollar | | | JPHQ | | | | Sell | | | | 390,000 | | | | 267,856 | | | | 7/21/20 | | | | — | | | | (1,305 | ) |
Japanese Yen | | | JPHQ | | | | Buy | | | | 239,900,000 | | | | 2,216,760 | | | | 7/22/20 | | | | 5,698 | | | | — | |
Japanese Yen | | | JPHQ | | | | Sell | | | | 134,000,000 | | | | 1,255,829 | | | | 7/22/20 | | | | 14,440 | | | | — | |
Canadian Dollar | | | JPHQ | | | | Sell | | | | 430,000 | | | | 327,148 | | | | 7/23/20 | | | | 10,370 | | | | — | |
Danish Krone | | | JPHQ | | | | Buy | | | | 7,518,245 | | | | 1,097,909 | | | | 7/23/20 | | | | 36,088 | | | | — | |
Danish Krone | | | JPHQ | | | | Sell | | | | 7,518,245 | | | | 1,122,696 | | | | 7/23/20 | | | | — | | | | (11,302 | ) |
Euro | | | JPHQ | | | | Sell | | | | 696,577 | | | | 776,366 | | | | 7/23/20 | | | | — | | | | (6,611 | ) |
Mexican Peso | | | JPHQ | | | | Buy | | | | 6,950,000 | | | | 360,128 | | | | 7/23/20 | | | | — | | | | (58,641 | ) |
Mexican Peso | | | JPHQ | | | | Sell | | | | 6,950,000 | | | | 306,782 | | | | 7/23/20 | | | | 5,296 | | | | — | |
Norwegian Krone | | | JPHQ | | | | Buy | | | | 6,740,000 | | | | 745,252 | | | | 7/23/20 | | | | — | | | | (44,768 | ) |
Norwegian Krone | | | JPHQ | | | | Sell | | | | 6,740,000 | | | | 661,303 | | | | 7/23/20 | | | | — | | | | (39,180 | ) |
Euro | | | JPHQ | | | | Buy | | | | 380,000 | | | | 430,742 | | | | 8/05/20 | | | | — | | | | (3,480 | ) |
Euro | | | JPHQ | | | | Sell | | | | 380,000 | | | | 427,861 | | | | 8/05/20 | | | | 599 | | | | — | |
FRANKLIN TEMPLETON VARIABLE INSURANCE PRODUCTS TRUST
STATEMENT OF INVESTMENTS (UNAUDITED)
Franklin Allocation VIP Fund (continued)
Forward Exchange Contracts (continued)
| | | | | | | | | | | | | | | | | | | | | | | | | | | | |
| | | | | | | |
| Currency | | Counterpartya | | | Type | | | Quantity | | | Contract
Amount* | | | Settlement
Date | | | Unrealized
Appreciation | | | Unrealized
Depreciation | |
| | | | | | |
| OTC Forward Exchange Contracts (continued) | | | | | | | | | | | | | | | | | | | | | | | | | |
Australian Dollar | | | JPHQ | | | | Sell | | | | 1,480,000 | | | | 894,305 | | | | 8/06/20 | | | | $ — | | | | $ (127,243 | ) |
Japanese Yen | | | JPHQ | | | | Buy | | | | 102,000,000 | | | | 956,669 | | | | 8/13/20 | | | | — | | | | (11,466 | ) |
Japanese Yen | | | JPHQ | | | | Sell | | | | 102,000,000 | | | | 950,196 | | | | 8/13/20 | | | | 4,993 | | | | — | |
Singapore Dollar | | | JPHQ | | | | Buy | | | | 1,400,000 | | | | 104,547,800 | | | | JPY 8/13/20 | | | | 35,917 | | | | — | |
Singapore Dollar | | | JPHQ | | | | Sell | | | | 3,750,000 | | | | 279,675,187 | | | | JPY 8/13/20 | | | | — | | | | (99,576 | ) |
Chinese Yuan Renminbi | | | JPHQ | | | | Buy | | | | 5,095,000 | | | | 730,016 | | | | 8/21/20 | | | | — | | | | (11,470 | ) |
Chinese Yuan Renminbi | | | JPHQ | | | | Sell | | | | 5,095,000 | | | | 723,660 | | | | 8/21/20 | | | | 5,114 | | | | — | |
Japanese Yen | | | JPHQ | | | | Buy | | | | 70,500,000 | | | | 674,444 | | | | 9/14/20 | | | | — | | | | (20,834 | ) |
Canadian Dollar | | | JPHQ | | | | Buy | | | | 830,000 | | | | 588,665 | | | | 9/15/20 | | | | 22,849 | | | | — | |
Canadian Dollar | | | JPHQ | | | | Sell | | | | 1,450,000 | | | | 1,047,083 | | | | 9/15/20 | | | | — | | | | (21,225 | ) |
Euro | | | JPHQ | | | | Buy | | | | 350,000 | | | | 397,098 | | | | 9/15/20 | | | | — | | | | (3,207 | ) |
Euro | | | JPHQ | | | | Buy | | | | 860,000 | | | | 930,892 | | | | 9/15/20 | | | | 36,952 | | | | — | |
Euro | | | JPHQ | | | | Sell | | | | 1,504,009 | | | | 1,691,860 | | | | 9/15/20 | | | | — | | | | (753 | ) |
Norwegian Krone | | | JPHQ | | | | Buy | | | | 7,680,000 | | | | 760,411 | | | | 9/15/20 | | | | 37,918 | | | | — | |
Norwegian Krone | | | JPHQ | | | | Sell | | | | 7,680,000 | | | | 752,941 | | | | 9/15/20 | | | | — | | | | (45,388 | ) |
South Korean Won | | | JPHQ | | | | Buy | | | | 238,000,000 | | | | 194,603 | | | | 9/16/20 | | | | 3,909 | | | | — | |
South Korean Won | | | JPHQ | | | | Sell | | | | 467,500,000 | | | | 380,855 | | | | 9/16/20 | | | | — | | | | (9,080 | ) |
Indonesian Rupiah | | | JPHQ | | | | Buy | | | | 4,950,000,000 | | | | 339,041 | | | | 12/07/20 | | | | — | | | | (8,328 | ) |
| | | | | | | | | | | | | | | | | | | | | | | | |
| | | | | | |
Total Forward Exchange Contracts | | | | | | | | | | | | | | | | | | | | $ 267,758 | | | | $ (533,179 | ) |
| | | | | | | | | | | | | | | | | | | | | | | | |
| | | | | |
Net unrealized appreciation (depreciation) | | | | | | | | | | | | | | | | | | | | $ (265,421 | ) |
| | | | | | | | | | | | | | | | | | | | | | | | | | | | |
*In U.S. dollars unless otherwise indicated.
aMay be comprised of multiple contracts with the same counterparty, currency and settlement date.
At June 30, 2020, the Fund had the following credit default swap contracts outstanding. See Note 1(d).
Credit Default Swap Contracts
| | | | | | | | | | | | | | | | | | | | | | | | | | | | | | | | | | | | |
| Description | | Annual
Payment Rate
Received
(Paid) | | | Payment
Frequency | | | Counter-
party | | | Maturity
Date | | | Notional
Amounta
| | | Value | | | Unamortized
Upfront
Payments
(Receipts) | | | Unrealized
Appreciation
(Depreciation) | | | Ratingb | |
| | | | | | | | | |
OTC Swap Contracts | | | | | | | | | | | | | | | | | | | | | | | | | | | | | | | | | | | | |
Contracts to Buy Protectionc | | | | | | | | | | | | | | | | | | | | | | | | | | | | | | | | | |
Single Name | | | | | | | | | | | | | | | | | | | | | | | | | | | | | | | | | | | | |
Avon Products Inc. | | | (5.00)% | | | | Quarterly | | | | CITI | | | | 3/20/23 | | | | $260,000 | | | | $(2,426 | ) | | | $(20,577 | ) | | | $18,151 | | | | | |
Contracts to Sell Protectionc,d | | | | | | | | | | | | | | | | | | | | | | | | | | | | | | | | | | | | |
Single Name | | | | | | | | | | | | | | | | | | | | | | | | | | | | | | | | | | | | |
Government of Russia | | | 1.00% | | | | Quarterly | | | | CITI | | | | 12/20/24 | | | | 300,000 | | | | (212 | ) | | | 2,661 | | | | (2,873 | ) | | | BBB- | |
Traded Index | | | | | | | | | | | | | | | | | | | | | | | | | | | | | | | | | | | | |
eCitibank Bespoke Phoenix Index, | | | | | | | | | | | | | | | | | | | | | | | | | | | | | | | | | | | | |
Mezzanine Tranche 5-7% | | | 2.90% | | | | Quarterly | | | | CITI | | | | 12/20/21 | | | | 250,000 | | | | (46,947 | ) | | | — | | | | (46,947 | ) | |
| Non-
Investment
Grade |
|
| | | | | | | | |
Total Credit Default Swap Contracts | | | | | | | | | | | | | | | | | | | | $(49,585 | ) | | | $(17,916 | ) | | | $(31,669 | ) | | | | |
FRANKLIN TEMPLETON VARIABLE INSURANCE PRODUCTS TRUST
STATEMENT OF INVESTMENTS (UNAUDITED)
Franklin Allocation VIP Fund (continued)
Credit Default Swap Contracts (continued)
aFor contracts to sell protection, the notional amount is equal to the maximum potential amount of the future payments and no recourse provisions have been entered into in association with the contracts.
bBased on Standard and Poor’s (S&P) Rating for single name swaps. Internal ratings based on mapping into equivalent ratings from external vendors.
cPerformance triggers for settlement of contract include default, bankruptcy or restructuring for single name swaps and failure to pay or bankruptcy of the underlying securities for traded index swaps.
dThe fund enters contracts to sell protection to create a long credit position.
eRepresents a custom index comprised of a basket of underlying instruments.
At June 30, 2020, the Fund had the following cross-currency swap contracts outstanding. See Note 1(d).
Cross-Currency Swap Contracts
| | | | | | | | | | | | | | | | | | | | | | | | |
| Description | | Payment
Frequency | | | Coun-
terparty | | | Maturity
Date | | | Notional Amount | | | | | | Value/
Unrealized
Appreciation
(Depreciation) | |
| | | | | | |
| OTC Swap Contracts | | | | | | | | | | | | | | | | | | | | | | | | |
Receive Floating 3-month USD LIBOR + 1.334% | | | Quarterly | | | | | | | | | | | | 280,000 | | | | USD | | | | | |
Pay Floating 3-month EUR LIBOR + 1.12% | | | Quarterly | | | | CITI | | | | 7/10/21 | | | | 250,000 | | | | EUR | | | $ | 389 | |
Receive Floating 3-month USD LIBOR + 1.305% | | | Quarterly | | | | | | | | | | | | 387,450 | | | | USD | | | | | |
Pay Floating 3-month EUR LIBOR + 1.11% | | | Quarterly | | | | JPHQ | | | | 8/20/21 | | | | 350,000 | | | | EUR | | | | (5,414 | ) |
Receive Floating 3-month USD LIBOR + 1.23% | | | Quarterly | | | | | | | | | | | | 277,500 | | | | USD | | | | | |
Pay Floating 3-month EUR LIBOR + 1.07% | | | Quarterly | | | | CITI | | | | 9/17/21 | | | | 250,000 | | | | EUR | | | | (3,372 | ) |
Receive Floating 3-month USD LIBOR + 1.87% | | | Quarterly | | | | | | | | | | | | 275,000 | | | | USD | | | | | |
Pay Floating 3-month EUR LIBOR + 1.70% | | | Quarterly | | | | CITI | | | | 10/15/21 | | | | 250,000 | | | | EUR | | | | (5,078 | ) |
Receive Floating 3-month USD LIBOR + 1.318% | | | Quarterly | | | | | | | | | | | | 943,500 | | | | USD | | | | | |
Pay Floating 3-month EUR LIBOR + 1.20% | | | Quarterly | | | | CITI | | | | 12/12/21 | | | | 850,000 | | | | EUR | | | | (12,185 | ) |
| | | | | | | | | | | | | | | | | | | | | | | | |
Total Cross Currency Swap Contracts | | | | | | | | | | | | | | | | | | | | | | $ | (25,660 | ) |
| | | | | | | | | | | | | | | | | | | | | | | | |
At June 30, 2020, the Fund had the following inflation index swap contracts outstanding. See Note 1(d).
Inflation Index Swap Contracts
| | | | | | | | | | | | | | | | |
| Description | | Payment
Frequency | | | Maturity
Date | | | Notional
Amount | | | Value/
Unrealized
Appreciaton
(Depreciation) | |
| | | | |
| Centrally Cleared Swap Contracts | | | | | | | | | | | | | | | | |
Receive Floating | | | At maturity | | | | | | | | | | | | | |
Pay Fixed 1.913% | | | At maturity | | | | 1/14/29 | | | $ | 700,000 | | | $ | (36,368 | ) |
Receive variable change in USA-CPI-U | | | At maturity | | | | | | | | | | | | | |
Pay Fixed 1.943% | | | At maturity | | | | 1/15/29 | | | | 2,500,000 | | | | (137,239 | ) |
| | | | | | | | | | | | | | | | |
Total Inflation Index Swap Contracts | | | | | | | | | | | | | | $ | (173,607 | ) |
| | | | | | | | | | | | | | | | |
See Note 8 regarding other derivative information.
See Abbreviations on page FFA-61.
| | | | |
| | | |
| FFA-42 | | Semiannual Report | The accompanying notes are an integral part of these financial statements. | | |
FRANKLIN TEMPLETON VARIABLE INSURANCE PRODUCTS TRUST
FINANCIAL STATEMENTS
Statement of Assets and Liabilities
June 30, 2020 (unaudited)
| | | | |
| |
| | | Franklin Allocation VIP Fund | |
| |
Assets: | | | | |
Investments in securities: | | | | |
Cost - Unaffiliated issuers | | | $658,070,208 | |
Cost - Non-controlled affiliates (Note 3e) | | | 66,758,532 | |
| | | | |
| |
Value - Unaffiliated issuers | | | $698,396,435 | |
Value - Non-controlled affiliates (Note 3e) | | | 60,517,496 | |
Cash | | | 23,930 | |
Foreign currency, at value (cost $2,900,859) | | | 2,893,378 | |
Receivables: | | | | |
Investment securities sold | | | 3,508,337 | |
Capital shares sold | | | 88,619 | |
Dividends and interest | | | 2,335,622 | |
Deposits with brokers for: | | | | |
OTC derivative contracts | | | 73,606 | |
Futures contracts | | | 927,821 | |
Centrally cleared swap contracts | | | 210,325 | |
Variation margin on centrally cleared swap contracts | | | 5,416 | |
OTC swap contracts (upfront payments $3,122) | | | 2,661 | |
Unrealized appreciation on OTC forward exchange contracts | | | 267,758 | |
Unrealized appreciation on OTC swap contracts | | | 18,540 | |
Other assets | | | 1,947 | |
| | | | |
| |
Total assets | | | 769,271,891 | |
| | | | |
| |
Liabilities: | | | | |
Payables: | | | | |
Investment securities purchased | | | 16,278,660 | |
Capital shares redeemed | | | 275,245 | |
Management fees | | | 274,484 | |
Distribution fees | | | 184,060 | |
Trustees’ fees and expenses | | | 314 | |
Variation margin on futures contracts | | | 109,597 | |
OTC swap contracts (upfront receipts $26,254) | | | 20,577 | |
Options written, at value (premiums received $4,426) | | | 2,898 | |
Unrealized depreciation on OTC forward exchange contracts | | | 533,179 | |
Unrealized depreciation on OTC swap contracts | | | 75,869 | |
Deferred tax | | | 216 | |
Accrued expenses and other liabilities | | | 105,512 | |
| | | | |
| |
Total liabilities | | | 17,860,611 | |
| | | | |
| |
Net assets, at value | | | $751,411,280 | |
| | | | |
| |
Net assets consist of: | | | | |
Paid-in capital | | | $725,212,750 | |
Total distributable earnings (losses) | | | 26,198,530 | |
| | | | |
| |
Net assets, at value | | | $751,411,280 | |
| | | | |
| | | | | | |
| | | |
| | The accompanying notes are an integral part of these financial statements. | Semiannual Report | | | FFA-43 | |
FRANKLIN TEMPLETON VARIABLE INSURANCE PRODUCTS TRUST
FINANCIAL STATEMENTS
Statement of Assets and Liabilities (continued)
June 30, 2020 (unaudited)
| | | | |
| | | Franklin
Allocation VIP Fund | |
| |
| Class 1: | | | | |
Net assets, at value | | | $ 804,498 | |
| | | | |
Shares outstanding | | | 166,322 | |
| | | | |
Net asset value and maximum offering price per share | | | $4.84 | |
| | | | |
| |
| Class 2: | | | | |
Net assets, at value | | | $371,639,070 | |
| | | | |
Shares outstanding | | | 77,524,145 | |
| | | | |
Net asset value and maximum offering price per share | | | $4.79 | |
| | | | |
| |
| Class 4: | | | | |
Net assets, at value | | | $378,967,712 | |
| | | | |
Shares outstanding | | | 76,372,625 | |
| | | | |
Net asset value and maximum offering price per share | | | $4.96 | |
| | | | |
| | | | |
| | | |
| FFA-44 | | Semiannual Report | The accompanying notes are an integral part of these financial statements. | | |
FRANKLIN TEMPLETON VARIABLE INSURANCE PRODUCTS TRUST
FINANCIAL STATEMENTS
Statement of Operations
for the six months ended June 30, 2020 (unaudited)
| | | | |
| | | Franklin
Allocation VIP Fund | |
| |
| |
Investment income: | | | | |
Dividends:(net of foreign taxes)* | | | | |
Unaffiliated issuers | | $ | 4,260,934 | |
Non-controlled affiliates (Note 3e) | | | 2,531,672 | |
Interest:(net of foreign taxes)~ | | | | |
Unaffiliated issuers | | | 3,816,079 | |
| | | | |
| |
Total investment income | | | 10,608,685 | |
| | | | |
| |
Expenses: | | | | |
Management fees (Note 3a) | | | 2,038,845 | |
Distribution fees: (Note 3c) | | | | |
Class 2 | | | 462,107 | |
Class 4 | | | 654,011 | |
Custodian fees (Note 4) | | | 20,927 | |
Reports to shareholders | | | 42,652 | |
Professional fees | | | 39,957 | |
Trustees’ fees and expenses | | | 2,438 | |
Other | | | 44,986 | |
| | | | |
| |
Total expenses | | | 3,305,923 | |
Expense reductions (Note 4) | | | (14,316 | ) |
Expenses waived/paid by affiliates (Note 3e and 3f) | | | (180,568 | ) |
| | | | |
| |
Net expenses | | | 3,111,039 | |
| | | | |
| |
Net investment income | | | 7,497,646 | |
| | | | |
| |
Realized and unrealized gains (losses): | | | | |
Net realized gain (loss) from: | | | | |
Investments: | | | | |
Unaffiliated issuers | | | (14,133,947 | ) |
Non-controlled affiliates (Note 3e) | | | (1,061,746 | ) |
Written options | | | 68,032 | |
Realized gain distributions from REITs | | | 4,867 | |
Foreign currency transactions | | | 213,395 | |
Forward exchange contracts | | | (22,661 | ) |
Futures contracts | | | 1,639,105 | |
Swap contracts | | | (857,729 | ) |
| | | | |
| |
Net realized gain (loss) | | | (14,150,684 | ) |
| | | | |
| |
Net change in unrealized appreciation (depreciation) on: | | | | |
Investments: | | | | |
Unaffiliated issuers | | | (2,867,896 | ) |
Non-controlled affiliates (Note 3e) | | | (3,493,563 | ) |
Translation of other assets and liabilities denominated in foreign currencies | | | (20,849 | ) |
Forward exchange contracts | | | (199,386 | ) |
Written options | | | 1,528 | |
Futures contracts | | | 365,252 | |
Swap contracts | | | (149,866 | ) |
Change in deferred taxes on unrealized appreciation | | | 16 | |
| | | | |
| | | | | | |
| | | |
| | The accompanying notes are an integral part of these financial statements. | Semiannual Report | | | FFA-45 | |
FRANKLIN TEMPLETON VARIABLE INSURANCE PRODUCTS TRUST
FINANCIAL STATEMENTS
Statement of Operations (continued)
for the six months ended June 30, 2020 (unaudited)
| | | | |
| | | Franklin
Allocation VIP Fund | |
Net change in unrealized appreciation (depreciation) | | $ | (6,364,764 | ) |
| | | | |
Net realized and unrealized gain (loss) | | | (20,515,448 | ) |
| | | | |
Net increase (decrease) in net assets resulting from operations | | $ | (13,017,802 | ) |
| | | | |
| |
| | | | |
*Foreign taxes withheld on dividends | | $ | 147,015 | |
~Foreign taxes withheld on interest | | $ | 2,318 | |
| | | | |
| | | |
| FFA-46 | | Semiannual Report | The accompanying notes are an integral part of these financial statements. | | |
FRANKLIN TEMPLETON VARIABLE INSURANCE PRODUCTS TRUST
FINANCIAL STATEMENTS
Statements of Changes in Net Assets
| | | | | | | | |
| | | Franklin Allocation VIP Fund | |
| | | Six Months Ended | | | | |
| | | June 30, | | | Year Ended December 31, | |
| | | 2020 | | | | |
| | | (unaudited) | | | 2019 | |
| |
| | |
Increase (decrease) in net assets: | | | | | | | | |
Operations: | | | | | | | | |
Net investment income | | | $ 7,497,646 | | | | $ 10,197,177 | |
Net realized gain (loss) | | | (14,150,684 | ) | | | 239,840,198 | |
Net change in unrealized appreciation (depreciation) | | | (6,364,764 | ) | | | (103,898,058 | ) |
| | | | |
| | |
Net increase (decrease) in net assets resulting from operations | | | (13,017,802 | ) | | | 146,139,317 | |
| | | | |
| | |
Distributions to shareholders: | | | | | | | | |
Class 1 | | | (227,035 | ) | | | (114,944 | ) |
Class 2 | | | (106,811,345 | ) | | | (41,503,915 | ) |
Class 4 | | | (104,689,180 | ) | | | (39,405,922 | ) |
| | | | |
| | |
Total distributions to shareholders | | | (211,727,560 | ) | | | (81,024,781 | ) |
| | | | |
| | |
Capital share transactions: (Note 2) | | | | | | | | |
Class 1 | | | 202,051 | | | | (205,346 | ) |
Class 2 | | | 82,030,559 | | | | (18,907,288 | ) |
Class 4 | | | 83,349,005 | | | | (20,095,745 | ) |
| | | | |
| | |
Total capital share transactions | | | 165,581,615 | | | | (39,208,379 | ) |
| | | | |
| | |
Net increase (decrease) in net assets | | | (59,163,747 | ) | | | 25,906,157 | |
Net assets: | | | | | | | | |
Beginning of period | | | 810,575,027 | | | | 784,668,870 | |
| | | | |
| | |
End of period | | | $ 751,411,280 | | | | $ 810,575,027 | |
| | | | |
| | | | | | |
| | | |
| | The accompanying notes are an integral part of these financial statements. | Semiannual Report | | | FFA-47 | |
FRANKLIN TEMPLETON VARIABLE INSURANCE PRODUCTS TRUST
Notes to Financial Statements (unaudited)
Franklin Allocation VIP Fund
1. Organization and Significant Accounting Policies
Franklin Templeton Variable Insurance Products Trust (Trust) is registered under the Investment Company Act of 1940 (1940 Act) as an open-end management investment company, consisting of eighteen separate funds and applies the specialized accounting and reporting guidance in U.S. Generally Accepted Accounting Principles (U.S. GAAP). Franklin Allocation VIP Fund (Fund) is included in this report. Shares of the Fund are generally sold only to insurance company separate accounts to fund the benefits of variable life insurance policies or variable annuity contracts. The Fund offers three classes of shares: Class 1, Class 2, and Class 4. Each class of shares may differ by its distribution fees, voting rights on matters affecting a single class and its exchange privilege.
The following summarizes the Fund’s significant accounting policies.
a. Financial Instrument Valuation
The Fund’s investments in financial instruments are carried at fair value daily. Fair value is the price that would be received to sell an asset or paid to transfer a liability in an orderly transaction between market participants on the measurement date. The Fund calculates the net asset value (NAV) per share each business day as of 4 p.m. Eastern time or the regularly scheduled close of the New York Stock Exchange (NYSE), whichever is earlier. Under compliance policies and procedures approved by the Trust’s Board of Trustees (the Board), the Fund’s administrator has responsibility for oversight of valuation, including leading the cross-functional Valuation Committee (VC). The Fund may utilize independent pricing services, quotations from securities and financial instrument dealers, and other market sources to determine fair value.
Equity securities, exchange traded funds and derivative financial instruments listed on an exchange or on the NASDAQ National Market System are valued at the last quoted sale price or the official closing price of the day, respectively. Foreign equity securities are valued as of the close of trading on the foreign stock exchange on which the security is primarily traded, or as of 4 p.m. Eastern time. The value is then converted into its U.S. dollar equivalent at the foreign exchange rate in effect at 4 p.m. Eastern time on the day that the value of the security is determined. Over-the-counter (OTC) securities are valued within the range of the most recent quoted bid and ask prices. Securities that trade
in multiple markets or on multiple exchanges are valued according to the broadest and most representative market. Certain equity securities are valued based upon fundamental characteristics or relationships to similar securities.
Debt securities generally trade in the OTC market rather than on a securities exchange. The Fund’s pricing services use multiple valuation techniques to determine fair value. In instances where sufficient market activity exists, the pricing services may utilize a market-based approach through which quotes from market makers are used to determine fair value. In instances where sufficient market activity may not exist or is limited, the pricing services also utilize proprietary valuation models which may consider market characteristics such as benchmark yield curves, credit spreads, estimated default rates, anticipated market interest rate volatility, coupon rates, anticipated timing of principal repayments, underlying collateral, and other unique security features in order to estimate the relevant cash flows, which are then discounted to calculate the fair value. Securities denominated in a foreign currency are converted into their U.S. dollar equivalent at the foreign exchange rate in effect at 4 p.m. Eastern time on the date that the values of the foreign debt securities are determined.
Investments in open-end mutual funds are valued at the closing NAV.
Certain derivative financial instruments are centrally cleared or trade in the OTC market. The Fund’s pricing services use various techniques including industry standard option pricing models and proprietary discounted cash flow models to determine the fair value of those instruments. The Fund’s net benefit or obligation under the derivative contract, as measured by the fair value of the contract, is included in net assets.
The Fund has procedures to determine the fair value of financial instruments for which market prices are not reliable or readily available. Under these procedures, the Fund primarily employs a market-based approach which may use related or comparable assets or liabilities, recent transactions, market multiples, book values, and other relevant information for the investment to determine the fair value of the investment. An income-based valuation approach may also be used in which the anticipated future cash flows of the investment are discounted to calculate fair value. Discounts may also be applied due to the nature or duration of any restrictions on the disposition of the investments. Due to the
FRANKLIN TEMPLETON VARIABLE INSURANCE PRODUCTS TRUST
NOTES TO FINANCIAL STATEMENTS (UNAUDITED)
Franklin Allocation VIP Fund (continued)
inherent uncertainty of valuations of such investments, the fair values may differ significantly from the values that would have been used had an active market existed.
Trading in securities on foreign securities stock exchanges and OTC markets may be completed before 4 p.m. Eastern time. In addition, trading in certain foreign markets may not take place on every Fund’s business day. Events can occur between the time at which trading in a foreign security is completed and 4 p.m. Eastern time that might call into question the reliability of the value of a portfolio security held by the Fund. As a result, differences may arise between the value of the Fund’s portfolio securities as determined at the foreign market close and the latest indications of value at 4 p.m. Eastern time. In order to minimize the potential for these differences, an independent pricing service may be used to adjust the value of the Fund’s portfolio securities to the latest indications of fair value at 4 p.m. Eastern time. At June 30, 2020, certain securities may have been fair valued using these procedures, in which case the securities were categorized as Level 2 inputs within the fair value hierarchy. See the Fair Value Measurements note for more information.
When the last day of the reporting period is a non-business day, certain foreign markets may be open on those days that the Fund’s NAV is not calculated, which could result in differences between the value of the Fund’s portfolio securities on the last business day and the last calendar day of the reporting period. Any significant security valuation changes due to an open foreign market are adjusted and reflected by the Fund for financial reporting purposes.
b. Foreign Currency Translation
Portfolio securities and other assets and liabilities denominated in foreign currencies are translated into U.S. dollars based on the exchange rate of such currencies against U.S. dollars on the date of valuation. The Fund may enter into foreign currency exchange contracts to facilitate transactions denominated in a foreign currency. Purchases and sales of securities, income and expense items denominated in foreign currencies are translated into U.S. dollars at the exchange rate in effect on the transaction date. Portfolio securities and assets and liabilities denominated in foreign currencies contain risks that those currencies will decline in value relative to the U.S. dollar. Occasionally, events may impact the availability or reliability of foreign exchange rates used to convert the U.S. dollar equivalent
value. If such an event occurs, the foreign exchange rate will be valued at fair value using procedures established and approved by the Board.
The Fund does not separately report the effect of changes in foreign exchange rates from changes in market prices on securities held. Such changes are included in net realized and unrealized gain or loss from investments in the Statement of Operations.
Realized foreign exchange gains or losses arise from sales of foreign currencies, currency gains or losses realized between the trade and settlement dates on securities transactions and the difference between the recorded amounts of dividends, interest, and foreign withholding taxes and the U.S. dollar equivalent of the amounts actually received or paid. Net unrealized foreign exchange gains and losses arise from changes in foreign exchange rates on foreign denominated assets and liabilities other than investments in securities held at the end of the reporting period.
c. Securities Purchased on a When-Issued or Delayed Delivery and TBA Basis
The Fund purchases securities on a when-issued or delayed delivery and to-be-announced (TBA) basis, with payment and delivery scheduled for a future date. These transactions are subject to market fluctuations and are subject to the risk that the value at delivery may be more or less than the trade date purchase price. Although the Fund will generally purchase these securities with the intention of holding the securities, it may sell the securities before the settlement date. Sufficient assets have been segregated for these securities and collateral has been pledged and/or received for open TBA trades.
d. Derivative Financial Instruments
The Fund invested in derivative financial instruments in order to manage risk or gain exposure to various other investments or markets. Derivatives are financial contracts based on an underlying or notional amount, require no initial investment or an initial net investment that is smaller than would normally be required to have a similar response to changes in market factors, and require or permit net settlement. Derivatives contain various risks including the potential inability of the counterparty to fulfill their obligations under the terms of the contract, the potential for an illiquid secondary market, and/or the potential for market movements which expose the Fund to gains or losses in excess of the amounts shown in the
FRANKLIN TEMPLETON VARIABLE INSURANCE PRODUCTS TRUST
NOTES TO FINANCIAL STATEMENTS (UNAUDITED)
Franklin Allocation VIP Fund (continued)
1. Organization and Significant Accounting Policies (continued)
d. Derivative Financial Instruments (continued)
Statement of Assets and Liabilities. Realized gain and loss and unrealized appreciation and depreciation on these contracts for the period are included in the Statement of Operations.
Derivative counterparty credit risk is managed through a formal evaluation of the creditworthiness of all potential counterparties. The Fund attempts to reduce its exposure to counterparty credit risk on OTC derivatives, whenever possible, by entering into International Swaps and Derivatives Association (ISDA) master agreements with certain counterparties. These agreements contain various provisions, including but not limited to collateral requirements, events of default, or early termination. Termination events applicable to the counterparty include certain deteriorations in the credit quality of the counterparty. Termination events applicable to the Fund include failure of the Fund to maintain certain net asset levels and/or limit the decline in net assets over various periods of time. In the event of default or early termination, the ISDA master agreement gives the non-defaulting party the right to net and close-out all transactions traded, whether or not arising under the ISDA agreement, to one net amount payable by one counterparty to the other. However, absent an event of default or early termination, OTC derivative assets and liabilities are presented gross and not offset in the Statement of Assets and Liabilities. Early termination by the counterparty may result in an immediate payment by the Fund of any net liability owed to that counterparty under the ISDA agreement.
Collateral requirements differ by type of derivative. Collateral or initial margin requirements are set by the broker or exchange clearing house for exchange traded and centrally cleared derivatives. Initial margin deposited is held at the exchange and can be in the form of cash and/or securities. For OTC derivatives traded under an ISDA master agreement, posting of collateral is required by either the Fund or the applicable counterparty if the total net exposure of all OTC derivatives with the applicable counterparty exceeds the minimum transfer amount, which typically ranges from $100,000 to $250,000, and can vary depending on the counterparty and the type of the agreement. Generally, collateral is determined at the close of Fund business each day and any additional collateral required due to changes in derivative values may be delivered by the Fund or the
counterparty the next business day, or within a few business days. Collateral pledged and/or received by the Fund for OTC derivatives, if any, is held in segregated accounts with the Fund’s custodian/counterparty broker and can be in the form of cash and/or securities. Unrestricted cash may be invested according to the Fund’s investment objectives. To the extent that the amounts due to the Fund from its counterparties are not subject to collateralization or are not fully collateralized, the Fund bears the risk of loss from counterparty non-performance.
The Fund entered into exchange traded futures contracts primarily to manage and/or gain exposure to interest rate and equity price risk. A futures contract is an agreement between the Fund and a counterparty to buy or sell an asset at a specified price on a future date. Required initial margins are pledged by the Fund, and the daily change in fair value is accounted for as a variation margin payable or receivable in the Statement of Assets and Liabilities.
The Fund entered into OTC forward exchange contracts primarily to manage and/or gain exposure to certain foreign currencies. A forward exchange contract is an agreement between the Fund and a counterparty to buy or sell a foreign currency at a specific exchange rate on a future date.
The Fund entered into credit default swap contracts primarily to manage and/or gain exposure to credit risk. A credit default swap is an agreement between the Fund and a counterparty whereby the buyer of the contract receives credit protection and the seller of the contract guarantees the credit worthiness of a referenced debt obligation. These agreements may be privately negotiated in the over-the-counter market (OTC credit default swaps) or may be executed in a multilateral trade facility platform, such as a registered exchange (centrally cleared credit default swaps). The underlying referenced debt obligation may be a single issuer of corporate or sovereign debt, a credit index, a basket of issuers or indices, or a tranche of a credit index or basket of issuers or indices. In the event of a default of the underlying referenced debt obligation, the buyer is entitled to receive the notional amount of the credit default swap contract from the seller in exchange for the referenced debt obligation, a net settlement amount equal to the notional amount of the credit default swap less the recovery value of the referenced debt obligation, or other agreed upon amount. For centrally cleared credit default swaps, required initial margins are pledged by the Fund, and the daily change in fair value is accounted for as a variation margin payable or
FRANKLIN TEMPLETON VARIABLE INSURANCE PRODUCTS TRUST
NOTES TO FINANCIAL STATEMENTS (UNAUDITED)
Franklin Allocation VIP Fund (continued)
receivable in the Statement of Assets and Liabilities. Over the term of the contract, the buyer pays the seller a periodic stream of payments, provided that no event of default has occurred. Such periodic payments are accrued daily as an unrealized appreciation or depreciation until the payments are made, at which time they are realized. Upfront payments and receipts are reflected in the Statement of Assets and Liabilities and represent compensating factors between stated terms of the credit default swap agreement and prevailing market conditions (credit spreads and other relevant factors). These upfront payments and receipts are amortized over the term of the contract as a realized gain or loss in the Statement of Operations.
The Fund entered into OTC cross currency swap contracts primarily to manage and/or gain exposure to certain foreign currencies. A cross currency swap is an agreement between the Fund and a counterparty to exchange cash flows (determined using either a fixed or floating rate) based on the notional amounts of two different currencies. The notional amounts are typically determined based on the spot exchange rates at the opening of the contract. Cross currency swaps may require the exchange of notional amounts at the opening and/or closing of the contract. Over the term of the contract, contractually required payments to be paid and to be received are accrued daily and recorded as unrealized depreciation and appreciation until the payments are made, at which time they are realized. Upfront payments and receipts are reflected in the Statement of Assets and Liabilities and represent compensating factors between stated terms of the cross currency swap contract and prevailing market conditions (interest rate spreads and other relevant factors). These upfront payments and receipts are amortized over the term of the contract as a realized gain or loss in the Statement of Operations.
The Fund entered into inflation index swap contracts primarily to manage and/or gain exposure to inflation risk. An inflation index swap is an agreement between the Fund and a counterparty to exchange cash flows whereby one party makes payments based on the percentage change in an index that serves as a measure of inflation and the other party makes a regular payment based on a compounded fixed rate, applied to a notional amount. These agreements may be privately negotiated in the over-the-counter market (OTC inflation index swap) or may be executed on a registered exchange (centrally cleared inflation index swap). For centrally cleared inflation index swaps, required initial margins are pledged by the Fund, and the daily change in fair
value is accounted for as a variation margin payable or receivable. Over the term of the contract, contractually required payments to be paid and to be received are accrued daily and recorded as unrealized depreciation and appreciation until the payments are made, at which time they are realized. Typically, an inflation index swap has payment obligations netted and exchanged upon maturity.
The Fund entered into interest rate swap contracts primarily to manage interest rate risk. An interest rate swap is an agreement between the Fund and a counterparty to exchange cash flows based on the difference between two interest rates, applied to a notional amount. These agreements may be privately negotiated in the over-the-counter market (OTC interest rate swaps) or may be executed on a registered exchange (centrally cleared interest rate swaps). For centrally cleared interest rate swaps, required initial margins are pledged by the Fund, and the daily change in fair value is accounted for as a variation margin payable or receivable in the Statement of Assets and Liabilities. Over the term of the contract, contractually required payments to be paid and to be received are accrued daily and recorded as unrealized depreciation and appreciation until the payments are made, at which time they are realized.
The Fund entered into OTC total return swap contracts primarily to manage and/or gain exposure to credit and market risk of an underlying instrument such as a stock, bond, index or basket of securities or indices. A total return swap is an agreement between the Fund and a counterparty to exchange a return linked to an underlying instrument for a floating or fixed rate payment, both based upon a notional amount. Over the term of the contract, contractually required payments to be paid or received are accrued daily and recorded as unrealized appreciation or depreciation until the payments are made, at which time they are recognized as realized gain or loss.
See Note 8 regarding other derivative information.
e. Loan Participation Notes
The Fund invests in loan participation notes (Participations). Participations are loans originally issued to a borrower by one or more financial institutions (the Lender) and subsequently sold to other investors, such as the Fund. Participations typically result in the Fund having a contractual relationship only with the Lender and not with the borrower. The Fund has the right to receive from the Lender any payments of principal, interest and fees which the Lender received from
FRANKLIN TEMPLETON VARIABLE INSURANCE PRODUCTS TRUST
NOTES TO FINANCIAL STATEMENTS (UNAUDITED)
Franklin Allocation VIP Fund (continued)
1. Organization and Significant Accounting Policies (continued)
e. Loan Participation Notes (continued)
the borrower. The Fund generally has no rights to either enforce compliance by the borrower with the terms of the loan agreement or to any collateral relating to the original loan. As a result, the Fund assumes the credit risk of both the borrower and the Lender that is selling the Participation. The Participations may also involve interest rate risk and liquidity risk, including the potential default or insolvency of the borrower and/or the Lender.
f. Mortgage Dollar Rolls
The Fund enters into mortgage dollar rolls, typically on a TBA basis. Mortgage dollar rolls are agreements between the Fund and a financial institution where the Fund sells (or buys) mortgage-backed securities for delivery on a specified date and simultaneously contracts to repurchase (or sell) substantially similar (same type, coupon, and maturity) securities at a future date and at a predetermined price. Gains or losses are realized on the initial sale, and the difference between the repurchase price and the sale price is recorded as an unrealized gain or loss to the Fund upon entering into the mortgage dollar roll. In addition, the Fund may invest the cash proceeds that are received from the initial sale. During the period between the sale and repurchase, the Fund is not entitled to principal and interest paid on the mortgage backed securities. Transactions in mortgage dollar rolls are accounted for as purchases and sales and may result in an increase to the Fund’s portfolio turnover rate. The risks of mortgage dollar roll transactions include the potential inability of the counterparty to fulfill its obligations.
g. Senior Floating Rate Interests
The Fund invests in senior secured corporate loans that pay interest at rates which are periodically reset by reference to a base lending rate plus a spread. These base lending rates are generally the prime rate offered by a designated U.S. bank or the London InterBank Offered Rate (LIBOR). Senior secured corporate loans often require prepayment of principal from excess cash flows or at the discretion of the borrower. As a result, actual maturity may be substantially less than the stated maturity. Senior secured corporate loans in which the Fund invests are generally readily marketable, but may be subject to certain restrictions on resale. On
July 27, 2017, the United Kingdom’s Financial Conduct Authority announced its intention to cease sustaining LIBOR after 2021. There remains uncertainty regarding the future utilization of LIBOR and the nature of any replacement rate. As such, the potential effect of a transition away from LIBOR on the Fund or the Fund’s investments that use or may use a floating rate based on LIBOR cannot yet be determined.
h. Income and Deferred Taxes
It is the Fund’s policy to qualify as a regulated investment company under the Internal Revenue Code. The Fund intends to distribute to shareholders substantially all of its taxable income and net realized gains to relieve it from federal income and if applicable, excise taxes. As a result, no provision for U.S. federal income taxes is required.
The Fund may be subject to foreign taxation related to income received, capital gains on the sale of securities and certain foreign currency transactions in the foreign jurisdictions in which it invests. Foreign taxes, if any, are recorded based on the tax regulations and rates that exist in the foreign markets in which the Fund invests. When a capital gain tax is determined to apply, the Fund records an estimated deferred tax liability in an amount that would be payable if the securities were disposed of on the valuation date.
The Fund may recognize an income tax liability related to its uncertain tax positions under U.S. GAAP when the uncertain tax position has a less than 50% probability that it will be sustained upon examination by the tax authorities based on its technical merits. As of June 30, 2020, the Fund has determined that no tax liability is required in its financial statements related to uncertain tax positions for any open tax years (or expected to be taken in future tax years). Open tax years are those that remain subject to examination and are based on the statute of limitations in each jurisdiction in which the Fund invests.
i. Security Transactions, Investment Income, Expenses and Distributions
Security transactions are accounted for on trade date. Realized gains and losses on security transactions are determined on a specific identification basis. Interest income and estimated expenses are accrued daily. Amortization of premium and accretion of discount on debt securities are included in interest income. Paydown gains and losses are recorded as an adjustment to interest income. Dividend
FRANKLIN TEMPLETON VARIABLE INSURANCE PRODUCTS TRUST
NOTES TO FINANCIAL STATEMENTS (UNAUDITED)
Franklin Allocation VIP Fund (continued)
income, capital gain distributions are recorded on the ex-dividend date except for certain dividends from securities where the dividend rate is not available. In such cases, the dividend is recorded as soon as the information is received by the Fund. Distributions to shareholders are recorded on the ex-dividend date. Distributable earnings are determined according to income tax regulations (tax basis) and may differ from earnings recorded in accordance with U.S. GAAP. These differences may be permanent or temporary. Permanent differences are reclassified among capital accounts to reflect their tax character. These reclassifications have no impact on net assets or the results of operations. Temporary differences are not reclassified, as they may reverse in subsequent periods.
Common expenses incurred by the Trust are allocated among the Funds based on the ratio of net assets of each Fund to the combined net assets of the Trust or based on the ratio of number of shareholders of each Fund to the combined number of shareholders of the Trust. Fund specific expenses are charged directly to the Fund that incurred the expense.
Realized and unrealized gains and losses and net investment income, excluding class specific expenses, are allocated daily to each class of shares based upon the relative proportion of net assets of each class. Differences in per share distributions by class are generally due to differences in class specific expenses.
Inflation-indexed bonds are adjusted for inflation through periodic increases or decreases in the security’s interest accruals, face amount, or principal redemption value, by
amounts corresponding to the rate of inflation as measured by an index. Any increase or decrease in the face amount or principal redemption value will be included as interest income in the Statement of Operations.
j. Accounting Estimates
The preparation of financial statements in accordance with U.S. GAAP requires management to make estimates and assumptions that affect the reported amounts of assets and liabilities at the date of the financial statements and the amounts of income and expenses during the reporting period. Actual results could differ from those estimates.
k. Guarantees and Indemnifications
Under the Trust’s organizational documents, its officers and trustees are indemnified by the Trust against certain liabilities arising out of the performance of their duties to the Trust. Additionally, in the normal course of business, the Trust, on behalf of the Fund, enters into contracts with service providers that contain general indemnification clauses. The Trust’s maximum exposure under these arrangements is unknown as this would involve future claims that may be made against the Trust that have not yet occurred. Currently, the Trust expects the risk of loss to be remote.
2. Shares of Beneficial Interest
At June 30, 2020, there were an unlimited number of shares authorized (without par value). Transactions in the Fund’s shares were as follows:
| | | | | | | | | | | | | | | | |
| | |
| | | Six Months Ended June 30, 2020 | | | Year Ended December 31, | |
| | | | |
| | | Shares | | | Amount | | | Shares | | | Amount | |
| | | | |
| Class 1 Shares: | | | | | | | | | | | | | | | | |
Shares sold | | | 3,998 | | | $ | 25,836 | | | | 12,786 | | | $ | 87,589 | |
Shares issued in reinvestment of distributions | | | 47,596 | | | | 227,035 | | | | 18,101 | | | | 114,944 | |
Shares redeemed | | | (7,955 | ) | | | (50,820 | ) | | | (62,639 | ) | | | (407,879) | |
| | | | |
| | | | |
Net increase (decrease) | | | 43,639 | | | $ | 202,051 | | | | (31,752 | ) | | $ | (205,346) | |
| | | | |
FRANKLIN TEMPLETON VARIABLE INSURANCE PRODUCTS TRUST
NOTES TO FINANCIAL STATEMENTS (UNAUDITED)
Franklin Allocation VIP Fund (continued)
2. Shares of Beneficial Interest (continued)
| | | | | | | | | | | | | | | | |
| | |
| | | Six Months Ended June 30, 2020 | | | Year Ended December 31, | |
| | | | |
| | | Shares | | | Amount | | | Shares | | | Amount | |
| | | | |
| Class 2 Shares: | | | | | | | | | | | | | | | | |
Shares sold | | | 1,929,143 | | | $ | 12,305,662 | | | | 2,057,930 | | | $ | 13,832,099 | |
Shares issued in reinvestment of distributions | | | 22,581,680 | | | | 106,811,345 | | | | 6,577,483 | | | | 41,503,915 | |
Shares redeemed | | | (6,182,367 | ) | | | (37,086,448 | ) | | | (11,168,839 | ) | | | (74,243,302) | |
| | | | |
| | | | |
Net increase (decrease) | | | 18,328,456 | | | $ | 82,030,559 | | | | (2,533,426 | ) | | $ | (18,907,288) | |
| | | | |
| | | | |
| Class 4 Shares: | | | | | | | | | | | | | | | | |
Shares sold | | | 999,707 | | | $ | 6,553,397 | | | | 973,482 | | | $ | 6,631,528 | |
Shares issued in reinvestment of distributions | | | 21,365,139 | | | | 104,689,180 | | | | 6,099,988 | | | | 39,405,922 | |
Shares redeemed | | | (4,318,741 | ) | | | (27,893,572 | ) | | | (9,669,394 | ) | | | (66,133,195) | |
| | | | |
| | | | |
Net increase (decrease) | | | 18,046,105 | | | $ | 83,349,005 | | | | (2,595,924 | ) | | $ | (20,095,745) | |
| | | | |
3. Transactions with Affiliates
Franklin Resources, Inc. is the holding company for various subsidiaries that together are referred to as Franklin Templeton. Certain officers and trustees of the Fund are also officers and/or directors of the following subsidiaries:
| | |
| |
| Subsidiary | | Affiliation |
Franklin Advisers, Inc. (Advisers) | | Investment Manager |
Templeton Global Advisors Limited (Global Advisors) | | Investment Manager |
Franklin Templeton Institutional, LLC (FT Institutional) | | Investment Manager |
Franklin Templeton Services, LLC (FT Services) | | Administrative manager |
Franklin Templeton Distributors, Inc. (Distributors) | | Principal underwriter |
Franklin Templeton Investor Services, LLC (Investor Services) | | Transfer agent |
a. Management Fees
The Fund pays an investment management fee to Advisers of 0.55% per year of the average daily net assets of the Fund.
Under a subadvisory agreement, Global Advisors and FT Institutional, affiliates of Advisers, provide subadvisory services to the Fund. The subadvisory fee is paid by Advisers based on the Fund’s average daily net assets, and is not an additional expense of the Fund.
b. Administrative Fees
Under an agreement with Advisers, FT Services provides administrative services to the Fund. The fee is paid by Advisers based on the Fund’s average daily net assets, and is not an additional expense of the Fund.
FRANKLIN TEMPLETON VARIABLE INSURANCE PRODUCTS TRUST
NOTES TO FINANCIAL STATEMENTS (UNAUDITED)
Franklin Allocation VIP Fund (continued)
c. Distribution Fees
The Board has adopted distribution plans for Class 2 and Class 4 shares pursuant to Rule 12b-1 under the 1940 Act. Under the Fund’s compensation distribution plans, the Fund pays Distributors for costs incurred in connection with the servicing, sale and distribution of the Fund’s shares up to 0.35% per year of its average daily net assets of each class. The Board has agreed to limit the current rate to 0.25% per year for Class 2. The plan year, for purposes of monitoring compliance with the maximum annual plan rates, is February 1 through January 31.
d. Transfer Agent Fees
Investor Services, under terms of an agreement, performs shareholder servicing for the Fund and is not paid by the Fund for the services.
e. Investments in Affiliated Management Investment Companies
The Fund invests in one or more affiliated management investment companies for purposes other than exercising a controlling influence over the management or policies. Management fees paid by the Fund are waived on assets invested in the affiliated management investment companies, as noted in the Statement of Operations, in an amount not to exceed the management and administrative fees paid directly or indirectly by each affiliate. During the period ended June 30, 2020, the Fund held investments in affiliated management investment companies as follows:
| | | | | | | | | | | | | | | | | | | | | | | | | | | | | | | | |
| | | | | | | | |
| | | Value at
Beginning
of Period | | | Purchases | | | Sales | | | Realized Gain (Loss) | | | Net Change in
Unrealized
Appreciation
(Depreciation) | | | Value at End of Period | | | Number of
Shares Held at
End of Period | | | Dividend
Income | |
| | | | | | | |
| Non-Controlled Affiliates | | | | | | | | | | | | | | | | | | | | | | | | | | | | | |
| | | | | | | | |
Franklin LibertyQ U.S. Equity ETF | | $ | — | | | $ | 4,446,394 | | | $ | (4,056,817 | ) | | $ | (389,577 | ) | | $ | — | | | $ | — | a | | | — | | | $ | 10,093 | |
| | | | | | | | |
Institutional Fiduciary Trust Money Market Portfolio, 0.00% | | | 21,473,752 | | | | 153,839,221 | | | | (143,492,388 | ) | | | — | | | | — | | | | 31,820,585 | | | | 31,820,585 | | | | 72,098 | |
Templeton Global Bond VIP Fund, Class 1 | | | 33,013,162 | | | | 4,449,481 | | | | (4,600,000 | ) | | | (672,169 | ) | | | (3,493,563 | ) | | | 28,696,911 | | | | 1,981,831 | | | | 2,449,481 | |
| | | | | | | | | | | | |
| | | | | | | | |
Total Affiliated Securities | | $ | 54,486,914 | | | $ | 162,735,096 | | | $ | (152,149,205 | ) | | $ | (1,061,746 | ) | | $ | (3,493,563 | ) | | $ | 60,517,496 | | | | | | | $ | 2,531,672 | |
| | | | | | | | | | | | |
aAs of June 30, 2020, no longer held by the fund.
f. Waiver and Expense Reimbursements
Advisers has contractually agreed in advance to waive or limit its fees and to assume as its own expense certain expenses otherwise payable by the Fund so that the operating expenses (excluding distribution fees and certain non-routine expenses or costs, including those relating to litigation, indemnification, reorganizations, and liquidations) and acquired fund fees and expenses for each class of the Fund do not exceed 0.57%, based on the average net assets of each class until April 30, 2021. Total expenses waived or paid are not subject to recapture subsequent to the Fund’s fiscal year end.
4. Expense Offset Arrangement
The Fund has entered into an arrangement with its custodian whereby credits realized as a result of uninvested cash balances are used to reduce a portion of the Fund’s custodian expenses. During the period ended June 30, 2020, the custodian fees were reduced as noted in the Statement of Operations.
FRANKLIN TEMPLETON VARIABLE INSURANCE PRODUCTS TRUST
NOTES TO FINANCIAL STATEMENTS (UNAUDITED)
Franklin Allocation VIP Fund (continued)
5. Income Taxes
At June 30, 2020, the cost of investments and net unrealized appreciation (depreciation) for income tax purposes were as follows:
| | | | |
Cost of investments | | | $725,772,409 | |
| | | | |
| |
Unrealized appreciation | | | $ 68,781,770 | |
Unrealized depreciation | | | (36,002,107 | ) |
| | | | |
| |
Net unrealized appreciation (depreciation) | | | $ 32,779,663 | |
| | | | |
Differences between income and/or capital gains as determined on a book basis and a tax basis are primarily due to differing treatments of paydown losses, bond discounts and premiums and wash sales.
6. Investment Transactions
Purchases and sales of investments (excluding short term securities) for the period ended June 30, 2020, aggregated $365,133,226 and $412,343,542, respectively.
7. Novel Coronavirus Pandemic
The global outbreak of the novel coronavirus disease, known as COVID-19, has caused adverse effects on many companies, sectors, nations, regions and the markets in general, and may continue for an unpredictable duration. The effects of this pandemic may materially impact the value and performance of the Fund, its ability to buy and sell fund investments at appropriate valuations and its ability to achieve its investment objectives.
8. Other Derivative Information
At June 30, 2020, investments in derivative contracts are reflected in the Statement of Assets and Liabilities as follows:
| | | | | | | | | | | | | | | | |
| | | |
| | | Asset Derivatives | | | | | | Liability Derivatives | |
| | | | | |
Derivative Contracts Not Accounted for as Hedging Instruments | | Statement of Assets and Liabilities Location | | Fair Value | | | | | | Statement of Assets and Liabilities Location | | Fair Value | |
| | | | | |
Interest rate contracts | | Variation margin on futures contracts | | | $120,028 | a | | | | | | Variation margin on futures contracts | | | $ 21,169 | a |
| | | | | |
| | Unrealized appreciation on OTC swap contracts | | | 389 | | | | | | | Unrealized depreciation on OTC swap contracts | | | 26,049 | |
| | | | | |
Foreign exchange contracts | | Unrealized appreciation on OTC forward exchange contracts | | | 267,758 | | | | | | | Unrealized depreciation on OTC forward exchange contracts | | | 533,179 | |
| | | | | |
Credit contracts | | OTC swap contracts (upfront payments) | | | 2,661 | | | | | | | OTC swap contracts (upfront receipts) | | | 20,577 | |
| | | | | |
| | Unrealized appreciation on OTC swap contracts | | | 18,151 | | | | | | | Unrealized depreciation on OTC swap contracts | | | 49,820 | |
| | | | | |
Equity contracts | | Investments in securities, at value | | | — | | | | | | | Options written, at value | | | 2,898 | |
| | | | | |
| | Variation margin on futures contracts | | | 56,057 | a | | | | | | Variation margin on futures contracts | | | — | |
FRANKLIN TEMPLETON VARIABLE INSURANCE PRODUCTS TRUST
NOTES TO FINANCIAL STATEMENTS (UNAUDITED)
Franklin Allocation VIP Fund (continued)
| | | | | | | | | | | | |
| | | |
| | | Asset Derivatives | | | | | Liability Derivatives |
| | | | | |
Derivative Contracts Not Accounted for as Hedging Instruments | | Statement of Assets and Liabilities Location | | Fair Value | | | | | Statement of Assets and Liabilities Location | | Fair Value |
| | | | | |
Inflation contracts | | Variation margin on centrally cleared swap contracts | | $ — | | | | | | Variation margin on centrally cleared swap contracts | | $ 173,607a |
| | | | | |
Totals | | | | $465,044 | | | | | | | | $827,299 |
aThis amount reflects the cumulative appreciation (depreciation) of futures contracts and centrally cleared swap contracts as reported in the Statement of Investments. Only the variation margin receivable/payable at period end is separately reported within the Statement of Assets and Liabilities. Prior variation margin movements were recorded to cash upon receipt or payment.
For the period ended June 30, 2020, the effect of derivative contracts in the Statement of Operations was as follows:
| | | | | | | | | | | | | | | | |
| | | | | |
Derivative Contracts Not Accounted for as Hedging Instruments | | Statement of Operations Location | | Net Realized Gain (Loss) for the Period | | | | | | Statement of Operations Location | | Net Change in
Unrealized
Appreciation
(Depreciation)
for the Period | |
| | | | | |
| | Net realized gain (loss) from: | | | | | | | | | | Net change in unrealized appreciation (depreciation) on: | | | | |
| | | | | |
Interest rate contracts | | Investments | | | $ (149,096) | | | | | | | Investments | | | $ — | |
| | | | | |
| | Written options | | | 59,737 | | | | | | | Written options | | | — | |
| | | | | |
| | Futures contracts | | | 1,307,952 | | | | | | | Futures contracts | | | 355,917 | |
| | | | | |
| | Swap contracts | | | (53,983) | | | | | | | Swap contracts | | | 65,600 | |
| | | | | |
Foreign exchange contracts | | Investments | | | 27,482 | | | | | | | Investments | | | — | |
| | | | | |
| | Forward exchange contracts | | | (22,661) | | | | | | | Forward exchange contracts | | | (199,386) | |
| | | | | |
Credit contracts | | Written options | | | 6,663 | | | | | | | Written options | | | — | |
| | | | | |
| | Swap contracts | | | (599,207) | | | | | | | Swap contracts | | | (18,080) | |
| | | | | |
Equity contracts | | Written options | | | 1,632 | | | | | | | Written options | | | 1,528 | |
| | | | | |
| | Futures contracts | | | 331,153 | | | | | | | Futures contracts | | | 9,335 | |
| | | | | |
Inflation contracts | | Swap contracts | | | (204,539) | | | | | | | Swap contracts | | | (197,386) | |
Totals | | | | | $ 705,133 | | | | | | | | | | $ 17,528 | |
For the period ended June 30, 2020, the average month end notional amount of futures contracts, swap contracts and options, and the average month end contract value for forward exchange contracts were as follows:
| | | | | | | | |
Futures contracts | | $ | 53,406,412 | | | | | |
Swap contracts | | $ | 16,007,098 | | | | | |
Forward exchange contracts | | $ | 21,986,085 | | | | | |
Options | | | 2,657,429 | | | | shares | |
FRANKLIN TEMPLETON VARIABLE INSURANCE PRODUCTS TRUST
NOTES TO FINANCIAL STATEMENTS (UNAUDITED)
Franklin Allocation VIP Fund (continued)
8. Other Derivative Information (continued)
At June 30, 2020, OTC derivative assets and liabilities are as follows:
| | | | | | | | |
| |
| | | Gross Amounts of Assets and Liabilities Presented in the Statement of Assets and Liabilities | |
| | |
| | | Assetsa | | | Liabilitiesa | |
| | |
| Derivatives | | | | | | | | |
| | |
Forward exchange contracts | | | $267,758 | | | | $533,179 | |
| | |
Swap contracts | | | 21,201 | | | | 96,446 | |
| | |
Total | | | $288,959 | | | | $629,625 | |
aAbsent an event of default or early termination, OTC derivative assets and liabilities are presented gross and not offset in the Statement of Assets and Liabilities.
At June 30, 2020, OTC derivative assets, which may be offset against OTC derivative liabilities and collateral received from the counterparty, are as follows:
| | | | | | | | | | | | | | | | | | | | |
| | | |
| | | | | | Amounts Not Offset in the
Statement of Assets and Liabilities | | | | |
| | | | | |
| | | Gross Amounts of
Assets Presented in
the Statement of
Assets and Liabilities | | | Financial
Instruments
Available for
Offset | | | Financial
Instruments
Collateral
Receiveda | | | Cash
Collateral
Received | | | Net Amount
(Not less than zero) | |
| | | | | |
| Counterparty | | | | | | | | | | | | | | | | | | | | |
| | | | | |
CITI | | | $ 29,144 | | | | $ (29,144) | | | | $ — | | | | $ — | | | | $ — | |
| | | | | |
JPHQ | | | 259,815 | | | | (259,815) | | | | — | | | | — | | | | — | |
| | | | | |
Total | | | $288,959 | | | | $(288,959) | | | | $ — | | | | $ — | | | | $ — | |
At June 30, 2020, OTC derivative liabilities, which may be offset against OTC derivative assets and collateral pledged to the counterparty, are as follows:
| | | | | | | | | | | | | | | | | | | | |
| | | |
| | | | | | Amounts Not Offset in the
Statement of Assets and Liabilities | | | | |
| | | | | |
| | | Gross Amounts of
Liabilities Presented in
the Statement of
Assets and Liabilities | | | Financial
Instruments
Available for
Offset | | | Financial
Instruments
Collateral
Pledgeda,b | | | Cash
Collateral
Pledgeda | | | Net Amount
(Not less
than zero) | |
| | | | | |
| Counterparty | | | | | | | | | | | | | | | | | | | | |
| | | | | |
CITI | | | $ 99,711 | | | | $ (29,144) | | | | $ — | | | | $(70,567) | | | | $ — | |
| | | | | |
JPHQ | | | 529,914 | | | | (259,815) | | | | (270,099 | ) | | | — | | | | — | |
| | | | | |
Total | | | $629,625 | | | | $(288,959) | | | | $(270,099 | ) | | | $(70,567) | | | | $ — | |
aIn some instances, the collateral amounts disclosed in the table above were adjusted due to the requirement to limit collateral amounts to avoid the effect of overcollateralization. Actual collateral received and/or pledged may be more than the amounts disclosed herein.
bSee the accompanying Statement of Investments for securities pledged as collateral for derivatives.
See Note 1(d) regarding derivative financial instruments.
FRANKLIN TEMPLETON VARIABLE INSURANCE PRODUCTS TRUST
NOTES TO FINANCIAL STATEMENTS (UNAUDITED)
Franklin Allocation VIP Fund (continued)
See Abbreviations on page FFA-61.
9. Credit Facility
The Fund, together with other U.S. registered and foreign investment funds (collectively, Borrowers), managed by Franklin Templeton, are borrowers in a joint syndicated senior unsecured credit facility totaling $2 billion (Global Credit Facility) which matures on February 5, 2021. This Global Credit Facility provides a source of funds to the Borrowers for temporary and emergency purposes, including the ability to meet future unanticipated or unusually large redemption requests.
Under the terms of the Global Credit Facility, the Fund shall, in addition to interest charged on any borrowings made by the Fund and other costs incurred by the Fund, pay its share of fees and expenses incurred in connection with the implementation and maintenance of the Global Credit Facility, based upon its relative share of the aggregate net assets of all of the Borrowers, including an annual commitment fee of 0.15% based upon the unused portion of the Global Credit Facility. These fees are reflected in other expenses in the Statement of Operations. During the period ended June 30, 2020, the Fund did not use the Global Credit Facility.
10. Fair Value Measurements
The Fund follows a fair value hierarchy that distinguishes between market data obtained from independent sources (observable inputs) and the Fund’s own market assumptions (unobservable inputs). These inputs are used in determining the value of the Fund’s financial instruments and are summarized in the following fair value hierarchy:
| | • | | Level 1 – quoted prices in active markets for identical financial instruments |
| | • | | Level 2 – other significant observable inputs (including quoted prices for similar financial instruments, interest rates, prepayment speed, credit risk, etc.) |
| | • | | Level 3 – significant unobservable inputs (including the Fund’s own assumptions in determining the fair value of financial instruments) |
The input levels are not necessarily an indication of the risk or liquidity associated with financial instruments at that level.
FRANKLIN TEMPLETON VARIABLE INSURANCE PRODUCTS TRUST
NOTES TO FINANCIAL STATEMENTS (UNAUDITED)
Franklin Allocation VIP Fund (continued)
10. Fair Value Measurements (continued)
A summary of inputs used as of June 30, 2020, in valuing the Fund’s assets and liabilities carried at fair value, is as follows:
| | | | | | | | | | | | | | |
| | | | |
| | | Level 1 | | | Level 2 | | | Level 3 | | | Total |
| | | | |
| Assets: | | | | | | | | | | | | | | |
Investments in Securities:a | | | | | | | | | | | | | | |
Equity Investments:b | | | | | | | | | | | | | | |
Automobiles & Components | | $ | 1,442,221 | | | $ | 3,688,986 | | | $ | — | | | $ 5,131,207 |
Banks | | | 629,440 | | | | 8,609,807 | | | | — | | | 9,239,247 |
Capital Goods | | | 33,917,815 | | | | 10,576,577 | | | | — | | | 44,494,392 |
Commercial & Professional Services | | | 7,818,640 | | | | 4,072,329 | | | | — | | | 11,890,969 |
Consumer Durables & Apparel | �� | | 7,532,184 | | | | 3,616,031 | | | | — | | | 11,148,215 |
Diversified Financials | | | 37,246,911 | | | | 8,067,189 | | | | — | | | 45,314,100 |
Energy | | | 4,935,763 | | | | 4,833,765 | | | | — | | | 9,769,528 |
Food & Staples Retailing | | | 6,642,731 | | | | 3,219,813 | | | | — | | | 9,862,544 |
Food, Beverage & Tobacco | | | 15,098,895 | | | | 2,822,092 | | | | — | | | 17,920,987 |
Health Care Equipment & Services | | | 21,383,180 | | | | 4,592,001 | | | | — | | | 25,975,181 |
Household & Personal Products | | | 8,808,602 | | | | 738,944 | | | | — | | | 9,547,546 |
Insurance | | | 1,130,718 | | | | 2,654,917 | | | | — | | | 3,785,635 |
Materials | | | 14,369,748 | | | | 10,386,275 | | | | — | | | 24,756,023 |
Media & Entertainment | | | 11,449,799 | | | | 4,540,598 | | | | — | | | 15,990,397 |
Pharmaceuticals, Biotechnology & Life Sciences | | | 29,748,526 | | | | 14,738,005 | | | | — | | | 44,486,531 |
Real Estate | | | 7,395,298 | | | | 3,546,112 | | | | — | | | 10,941,410 |
Retailing | | | 24,318,806 | | | | 3,858,183 | | | | — | | | 28,176,989 |
Semiconductors & Semiconductor Equipment | | | 19,427,855 | | | | 3,756,828 | | | | — | | | 23,184,683 |
Software & Services | | | 50,715,638 | | | | 6,853,662 | | | | — | | | 57,569,300 |
Technology Hardware & Equipment | | | 14,604,354 | | | | 2,247,795 | | | | — | | | 16,852,149 |
Telecommunication Services | | | 2,564,611 | | | | 4,519,736 | | | | — | | | 7,084,347 |
Transportation | | | 11,160,580 | | | | 2,798,976 | | | | — | | | 13,959,556 |
Utilities | | | 10,972,639 | | | | 2,525,521 | | | | — | | | 13,498,160 |
All Other Equity Investments | | | 7,798,367 | | | | — | | | | — | | | 7,798,367 |
Corporate Bonds | | | — | | | | 109,181,935 | | | | — | | | 109,181,935 |
Senior Floating Rate Interests | | | — | | | | 2,126,855 | | | | — | | | 2,126,855 |
Foreign Government and Agency Securities | | | — | | | | 6,662,148 | | | | — | | | 6,662,148 |
U.S. Government and Agency Securities | | | — | | | | 40,753,755 | | | | — | | | 40,753,755 |
Asset-Backed Securities and Commercial Mortgage-Backed Securities | | | — | | | | 22,732,916 | | | | — | | | 22,732,916 |
Mortgage-Backed Securities | | | — | | | | 70,820,515 | | | | — | | | 70,820,515 |
Municipal Bonds | | | — | | | | 6,437,759 | | | | — | | | 6,437,759 |
Short Term Investments | | | 31,820,585 | | | | — | | | | — | | | 31,820,585 |
| | | |
| | | | |
Total Investments in Securities | | $ | 382,933,906 | | | $ | 375,980,025 | | | $ | — | | | $ 758,913,931 |
| | | |
| | | | |
Other Financial Instruments: | | | | | | | | | | | | | | |
Futures Contracts | | $ | 176,085 | | | $ | — | | | $ | — | | | $176,085 |
Forward Exchange Contracts | | | — | | | | 267,758 | | | | — | | | 267,758 |
Swap Contracts | | | — | | | | 18,540 | | | | — | | | 18,540 |
| | | |
| | | | |
Total Other Financial Instruments | | $ | 176,085 | | | $ | 286,298 | | | $ | — | | | $ 462,383 |
| | | |
FRANKLIN TEMPLETON VARIABLE INSURANCE PRODUCTS TRUST
NOTES TO FINANCIAL STATEMENTS (UNAUDITED)
Franklin Allocation VIP Fund (continued)
| | | | | | | | | | | | | | |
| | | | |
| | | Level 1 | | | Level 2 | | | Level 3 | | | Total |
| | | | |
| Liabilities: | | | | | | | | | | | | | | |
Other Financial Instruments: | | | | | | | | | | | | | | |
Options Written | | $ | 2,898 | | | $ | — | | | $ | — | | | $ 2,898 |
Futures Contracts | | | 21,169 | | | | — | | | | — | | | 21,169 |
Forward Exchange Contracts | | | — | | | | 533,179 | | | | — | | | 533,179 |
Swap Contracts | | | — | | | | 249,476 | | | | — | | | 249,476 |
| | | |
| | | | |
Total Other Financial Instruments | | $ | 24,067 | | | $ | 782,655 | | | $ | — | | | $ 806,722 |
| | | |
aFor detailed categories, see the accompanying Statement of Investments.
bIncludes common stocks and management investment companies as well as other equity investments.
11. New Accounting Pronouncements
In March 2020, the Financial Accounting Standards Board (FASB) issued Accounting Standards Update (ASU) No. 2020-04, Reference Rate Reform (Topic 848) – Facilitation of the Effects of Reference Rate Reform on Financial Reporting. The amendments in the ASU provides optional temporary financial reporting relief from the effect of certain types of contract modifications due to the planned discontinuation of the London Interbank Offered Rate (LIBOR) and other interbank-offered based reference rates as of the end of 2021. The ASU is effective for certain reference rate-related contract modifications that occur during the period March 12, 2020 through December 31, 2022. Management is currently evaluating the impact, if any, of applying this ASU.
12. Subsequent Events
The Fund has evaluated subsequent events through the issuance of the financial statements and determined that no events have occurred that require disclosure.
Abbreviations
| | | | | | | | | | |
| | |
| Counterparty | | Currency | | Selected Portfolio |
| | | | | |
| CITI | | Citigroup, Inc. | | COP | | Colombian Peso | | ADR | | American Depositary Receipt |
| | | | | |
| JPHQ | | JP Morgan Chase & Co. | | CNY | | Chinese Yuan | | CLO | | Collateralized Loan Obligations |
| | | | | |
| | | | DOP | | Dominican Peso | | FFCB | | Federal Farm Credit Bank |
| | | | | |
| | | | DKK | | Danish Krone | | FRN | | Floating Rate Note |
| | | | | |
| | | | EUR | | Euro | | GO | | General Obligation |
| | | | | |
| | | | JPY | | Japanese Yen | | LIBOR | | London InterBank Offered Rate |
| | | | | |
| | | | MXN | | Mexican Peso | | SF | | Single Family |
| | | | | |
| | | | USD | | United States Dollar | | USD | | United School District |
| | | | | |
| | | | UYU | | Uruguayan Peso | | UHSD | | Unified/Union High School District |
| | | | ZAR | | South African Rand | | | | |
This page intentionally left blank.
Franklin Flex Cap Growth VIP Fund
This semiannual report for Franklin Flex Cap Growth VIP Fund covers the period ended June 30, 2020.
Class 4 Performance Summary as of June 30, 2020
The Fund’s Class 4 Shares posted a +15.21% total return* for the six-month period ended June 30, 2020.
*The Fund has an expense reduction and a fee waiver associated with any investments in a Franklin Templeton money fund and/or other Franklin Templeton fund, contractually guaranteed through 4/30/21. Fund investment results reflect the expense reduction and fee waiver; without these reductions, the results would have been lower.
Performance reflects the Fund’s Class 4 operating expenses, but does not include any contract fees, expenses or sales charges. If they had been included, performance would be lower. These charges and deductions, particularly for variable life policies, can have a significant effect on contract values and insurance benefits. See the contract prospectus for a complete description of these expenses, including sales charges.
Performance data represent past performance, which does not guarantee future results. Investment return and principal value will fluctuate, and you may have a gain or loss when you sell your shares. Current performance may differ from figures shown.
FRANKLIN FLEX CAP GROWTH VIP FUND
Fund Goal and Main Investments
The Fund seeks capital appreciation. Under normal market conditions, the Fund invests predominantly in equity securities of companies that the investment manager believes have the potential for capital appreciation.
Fund Risks
All investments involve risks, including possible loss of principal. Unexpected events and their aftermaths, such as the spread of deadly diseases; natural, environmental or man-made disasters; financial, political or social disruptions; terrorism and war; and other tragedies or catastrophes, can cause investor fear and panic, which can adversely affect the economies of many companies, sectors, nations, regions and the market in general, in ways that cannot necessarily be foreseen. Growth stock prices reflect projections of future earnings or revenues, and can, therefore, fall dramatically if the company fails to meet those projections. To the extent the Fund focuses on particular countries, regions, industries, sectors or types of investment from time to time, it may be subject to greater risk of adverse developments in such areas of focus than a fund that invests in a wider variety of countries, regions, industries, sectors or investments. Smaller, midsized and relatively new or unseasoned companies can be particularly sensitive to changing economic conditions, and their prospects for growth are less certain than those of larger, more established companies. Historically, these securities have experienced more price volatility than larger-company stocks, especially over the short term. Foreign securities involve special risks, including currency fluctuations and economic and political uncertainties. The Fund is actively managed but there is no guarantee that the manager’s investment decisions will produce the desired results. The Fund’s prospectus also includes a description of the main investment risks.
Performance Overview
You can find the Fund’s six-month total return in the Performance Summary. In comparison, the Russell 3000® Growth Index posted a +8.98% total return, the Russell 1000® Growth Index posted a +9.81% total return, and the Standard and Poor’s® 500 (S&P® 500) posted a -3.08% total return for the same period.1
Portfolio Composition
Based on Total Net Assets as of 6/30/20
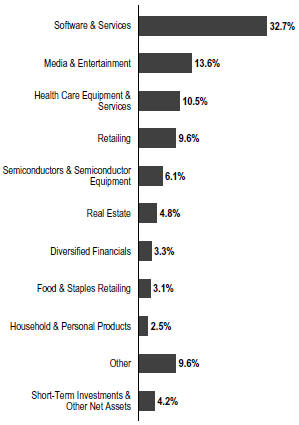
Economic and Market Overview
U.S. equities, as measured by the S&P 500, nearly reversed earlier losses but declined modestly during the six-month period. A sharp selloff began in late February 2020 amid investor fears of a global economic slowdown due to the novel coronavirus (COVID-19) pandemic.
Government-issued restrictions to mitigate the pandemic severely curtailed U.S. economic activity beginning in March 2020. As a result, the unemployment rate surged to 14.7% in April as many businesses, particularly in hospitality, retail and travel, announced mass layoffs.2 Within just two months, the unemployment rate went from a 50-year low to an 80-year high.2 The longest U.S. economic expansion in history ended in February, according to the National Bureau
1. Source: Morningstar. One cannot invest directly in an index, and an index is not representative of the Fund’s portfolio. Please see Index Descriptions following the Fund Summaries.
2. Source: Bureau of Labor Statistics.
The dollar value, number of shares or principal amount, and names of all portfolio holdings are listed in the Fund’s Statement of Investments (SOI).
FRANKLIN FLEX CAP GROWTH VIP FUND
of Economic Research, and the country slipped into a deep recession.
In an effort to buffer the sharp drop in economic activity, the Fed implemented two emergency rate cuts in March 2020, lowering the federal funds target rate to a range of 0.00%–0.25%. Additionally, the Fed announced broad quantitative easing measures aimed at ensuring the flow of credit to borrowers and supporting credit markets with unlimited amounts of bond purchasing. Meanwhile, Congress passed the Coronavirus Aid, Relief and Economic Security Act to provide economic relief for individuals and businesses and additional funding for small businesses.
Benefiting from these fiscal and monetary measures, equities began to advance at the end of March 2020. As states gradually reopened, economic activity resumed, leading to declining initial jobless claims and record-high increases in job additions and existing home sales. Optimism about potential COVID-19 vaccines and treatments and rising retail sales further supported equities, which rebounded from multi-year lows to post the strongest second-quarter returns in more than 20 years. Nevertheless, surging infection rates in several states near the end of June led to concerns that economic recovery could be hindered if reopening measures are paused or rolled back.
Investment Strategy
We use fundamental, bottom-up research to seek companies meeting our criteria of growth potential, quality and valuation. In seeking sustainable growth characteristics, we look for companies we believe can produce sustainable earnings and cash flow growth, evaluating the long-term market opportunity and competitive structure of an industry to target leaders and emerging leaders. We define quality companies as those with strong and improving competitive positions in attractive markets. We also believe important attributes of quality are experienced and talented management teams as well as financial strength reflected in the capital structure, gross and operating margins, free cash flow generation and returns on capital employed. Our valuation analysis includes a range of potential outcomes based on an assessment of multiple scenarios. In assessing value, we consider whether security prices fully reflect the balance of the sustainable growth opportunities relative to business and financial risks.
Manager’s Discussion
During the six months ended June 30, 2020, a majority of sectors in the Fund’s portfolio posted positive absolute returns. Relative to the Russell 3000® Growth Index,
| | | | |
| Top 10 Holdings | | | |
6/30/20 | | | |
| |
Company Sector/Industry | | % of Total
Net Assets | |
Microsoft Corp.
Software & Services | | | 8.4% | |
Amazon.com Inc.
Retailing | | | 6.8% | |
ServiceNow Inc.
Software & Services | | | 6.2% | |
Alphabet Inc.
Media & Entertainment | | | 5.5% | |
salesforce.com Inc.
Software & Services | | | 4.3% | |
Mastercard Inc.
Software & Services | | | 3.7% | |
Costco Wholesale Corp.
Food & Staples Retailing | | | 3.1% | |
Visa Inc.
Software & Services | | | 2.9% | |
Facebook Inc.
Media & Entertainment | | | 2.8% | |
Danaher Corp.
Health Care Equipment & Services | | | 2.5% | |
contributors included stock selection and an overweighted position in information technology (IT), stock selection and an underweight in health care, and stock selection in consumer discretionary. Relative detractors included overweighted positions in utilities and consumer staples.
In IT, enterprise workflow management provider ServiceNow contributed to relative results. Shares rose after the company raised subscription revenue guidance in its fourth-quarter 2019 earnings report. Investors were further impressed when first-quarter 2020 earnings came in line with expectations despite many businesses reducing activity in March due to COVID-19. Graphics processing units (GPU) manufacturer NVIDIA and electronic payments company PayPal Holdings contributed as well.
In health care, cloud software provider Veeva Systems helped relative performance. Shares of the company, which focuses on the life sciences industry, rose after revenue for its April quarter beat expectations. We are concerned, however, about a lack of transparency around the number of shares owned by the CEO and his resulting voting power. Veterinary services and products company IDEXX Laboratories also contributed.
FRANKLIN FLEX CAP GROWTH VIP FUND
In consumer discretionary, online marketplace and web services operator Amazon.com contributed to relative results as shares of the company rose during the COVID-19 pandemic. Consumers increasingly turned to the online retailer for basic goods as they spent growing amounts of time at home, boosting sales. The company also benefited from the increase in remote working, which has made more companies reliant on technology infrastructure provided by Amazon Web Services.
Elsewhere, Singaporean-internet platform provider Sea was also a significant relative contributor.
Turning to relative detractors, in utilities, an off-benchmark position in clean energy company NextEra Energy hurt results.
In consumer staples, beauty products manufacturer Estee Lauder detracted from relative performance. Sales were hurt by the pandemic-induced closure of most of the company’s retail stores, though a growth in online sales, particularly in Asia, offset some of those losses.
Elsewhere, aerospace and defense companies Raytheon and Boeing detracted from relative results. Raytheon merged with United Technologies on April 3, 2020, to form Raytheon Technologies. The company has been hurt by the negative impact of recently declining aviation demand, and the Fund liquidated its position during the period. We also sold off our holdings in Boeing due to the collapse of international aviation travel, significantly decreased sales of the troubled 777 airliner and an uncertain rollout for the company’s new 777X airliner.
Thank you for your participation in Franklin Flex Cap Growth VIP Fund. We look forward to serving your future investment needs.
The foregoing information reflects our analysis, opinions and portfolio holdings as of June 30, 2020, the end of the reporting period. The way we implement our main investment strategies and the resulting portfolio holdings may change depending on factors such as market and economic conditions. These opinions may not be relied upon as investment advice or an offer for a particular security. The information is not a complete analysis of every aspect of any market, state, industry, security or the Fund. Statements of fact are from sources considered reliable, but the investment manager makes no representation or warranty as to their completeness or accuracy. Although historical performance is no guarantee of future results, these insights may help you understand our investment management philosophy.
FRANKLIN FLEX CAP GROWTH VIP FUND
Class 4 Fund Expenses
As an investor in a variable insurance contract (Contract) that indirectly provides for investment in an underlying mutual fund, you can incur transaction and/or ongoing expenses at both the Fund level and the Contract Level: (1) transaction expenses can include sales charges (loads) on purchases, surrender fees, transfer fees and premium taxes; and (2) ongoing expenses can include management fees, distribution and service (12b-1) fees, contract fees, annual maintenance fees, mortality and expense risk fees and other fees and expenses. All mutual funds and Contracts have some types of ongoing expenses. The table below shows Fund-level ongoing expenses and can help you understand these costs and compare them with those of other mutual funds offered through the Contract. The table assumes a $1,000 investment held for the six months indicated. Please refer to the Fund prospectus for additional information on operating expenses.
Actual Fund Expenses
The table below provides information about the actual account values and actual expenses in the columns under the heading “Actual.” In these columns the Fund’s actual return, which includes the effect of ongoing Fund expenses but does not include the effect of ongoing Contract expenses, is used to calculate the “Ending Account Value.” You can estimate the Fund-level expenses you paid during the period by following these steps (of course, your account value and expenses will differ from those in this illustration): Divide your account value by $1,000 (if your account had an $8,600 value, then $8,600 ÷ $1,000 = 8.6). Then multiply the result by the number under the headings “Actual” and “Fund-Level Expenses Paid During Period” (if Fund-Level Expenses Paid During Period were $ 7.50, then 8.6 x $ 7.50 = $64.50). In this illustration, the estimated expenses paid this period at the Fund level are $64.50.
Hypothetical Example for Comparison with Other Mutual Funds
Under the heading “Hypothetical” in the table, information is provided about hypothetical account values and hypothetical expenses based on the Fund’s actual expense ratio and an assumed rate of return of 5% per year before expenses, which is not the Fund’s actual return. This information may not be used to estimate the actual ending account balance or expenses you paid for the period, but it can help you compare ongoing costs of investing in the Fund with those of other mutual funds offered through the Contract. To do so, compare this 5% hypothetical example with the 5% hypothetical examples that appear in the shareholder reports of other funds offered through the Contract.
Please note that expenses shown in the table are meant to highlight ongoing costs at the Fund level only and do not reflect any ongoing expenses at the Contract level, or transaction expenses at either the Fund or Contract levels. In addition, while the Fund does not have transaction expenses, if the transaction and ongoing expenses at the Contract level were included, the expenses shown below would be higher. You should consult your Contract prospectus or disclosure document for more information.
| | | | | | | | | | | | | | | | | | |
| | | | | | | |
| | | | | | | Actual (actual return after expenses) | | | | Hypothetical
(5% annual return before expenses) | | | | |
Share Class | | Beginning
Account
Value 1/1/20 | | | | Ending
Account
Value 6/30/20 | | Fund-Level
Expenses
Paid During
Period
1/1/20–6/30/201, 2 | | | | Ending Account
Value 6/30/20 | | Fund-Level
Expenses Paid During Period
1/1/20–6/30/201, 2 | | | | Net
Annualized
Expense
Ratio2 |
Class 4 | | $1,000 | | | | $1,152.10 | | $5.67 | | | | $1,019.59 | | $5.32 | | | | 1.06% |
1. Expenses are equal to the annualized expense ratio for the six-month period as indicated above—in the far right column—multiplied by the simple average account value over the period indicated, and then multiplied by 182/366 to reflect the one-half year period.
2. Reflects expenses after fee waivers and expense reimbursements. Does not include any ongoing expenses of the Contract for which the Fund is an investment option or acquired fund fees and expenses.
FRANKLIN TEMPLETON VARIABLE INSURANCE PRODUCTS TRUST
Financial Highlights
Franklin Flex Cap Growth VIP Fund
| | | | | | | | | | | | | | | | | | | | | | | | |
| | |
| | | Six Months Ended June 30, 2020 (unaudited) | | | Year Ended December 31, | |
| | | 2019 | | | 2018 | | | 2017 | | | 2016 | | | 2015 | |
| | | | | | |
Class 2 | | | | | | | | | | | | | | | | | | | | | | | | |
| | | | | | |
Per share operating performance
(for a share outstanding throughout the period) | | | | | | | | | | | | | | | | | | | | | | | | |
| | | | | | |
Net asset value, beginning of period | | | $ 8.06 | | | | $ 6.46 | | | | $ 7.46 | | | | $ 5.89 | | | | $ 7.09 | | | | $ 16.61 | |
| | | | |
| | | | | | |
| Income from investment operationsa: | | | | | | | | | | | | | | | | | | | | | | | | |
| | | | | | |
Net investment income (loss)b | | | (0.01 | ) | | | (0.01 | ) | | | (0.02 | ) | | | (0.01 | ) | | | (0.03 | ) | | | (0.06 | ) |
| | | | | | |
Net realized and unrealized gains (losses) | | | 1.22 | | | | 1.99 | | | | 0.42 | | | | 1.60 | | | | (0.20 | ) | | | 1.00 | |
| | | | |
| | | | | | |
Total from investment operations | | | 1.21 | | | | 1.98 | | | | 0.40 | | | | 1.59 | | | | (0.23 | ) | | | 0.94 | |
| | | | |
| | | | | | |
| Less distributions from: | | | | | | | | | | | | | | | | | | | | | | | | |
| | | | | | |
Net realized gains | | | (0.58 | ) | | | (0.38 | ) | | | (1.40 | ) | | | (0.02 | ) | | | (0.97 | ) | | | (10.46 | ) |
| | | | |
| | | | | | |
Net asset value, end of period | | | $ 8.69 | | | | $ 8.06 | | | | $ 6.46 | | | | $ 7.46 | | | | $ 5.89 | | | | $ 7.09 | |
| | | | |
| | | | | | |
Total returnc | | | 15.30% | | | | 31.16% | | | | 3.14% | | | | 26.94% | | | | (2.89 | )% | | | 4.37% | |
| | | | | | |
| Ratios to average net assetsd | | | | | | | | | | | | | | | | | | | | | | | | |
| | | | | | |
Expenses before waiver and payments by affiliates | | | 1.33% | | | | 1.33% | | | | 1.30% | | | | 1.35% | | | | 1.36% | | | | 1.33% | |
| | | | | | |
Expenses net of waiver and payments by affiliates | | | 0.96%e | | | | 0.96%e | | | | 0.96%e | | | | 0.96% | | | | 0.96% | | | | 0.96% | |
| | | | | | |
Net investment income (loss) | | | (0.36)% | | | | (0.19)% | | | | (0.20)% | | | | (0.20)% | | | | (0.44)% | | | | (0.62)% | |
| | | | | | |
| Supplemental data | | | | | | | | | | | | | | | | | | | | | | | | |
| | | | | | |
Net assets, end of period (000’s) | | | $101,481 | | | | $97,964 | | | | $69,233 | | | | $81,084 | | | | $73,337 | | | | $82,901 | |
| | | | | | |
Portfolio turnover rate | | | 16.11% | | | | 26.29% | | | | 15.17% | | | | 52.12% | | | | 17.76% | | | | 88.15% | |
aThe amount shown for a share outstanding throughout the period may not correlate with the Statement of Operations for the period due to the timing of sales and repurchases of the Fund’s shares in relation to income earned and/or fluctuating fair value of the investments of the Fund.
bBased on average daily shares outstanding.
cTotal return does not include fees, charges or expenses imposed by the variable annuity and life insurance contracts for which Franklin Templeton Variable Insurance Products Trust serves as an underlying investment vehicle. Total return is not annualized for periods less than one year.
dRatios are annualized for periods less than one year.
eBenefit of expense reduction rounds to less than 0.01%.
| | | | |
| | | |
| FFC-6 | | Semiannual Report | The accompanying notes are an integral part of these financial statements. | | |
FRANKLIN TEMPLETON VARIABLE INSURANCE PRODUCTS TRUST
FINANCIAL HIGHLIGHTS
Franklin Flex Cap Growth VIP Fund (continued)
| | | | | | | | | | | | | | | | | | | | | | | | |
| | |
| | | Six Months Ended June 30, 2020 (unaudited) | | | Year Ended December 31, | |
| | | 2019 | | | 2018 | | | 2017 | | | 2016 | | | 2015 | |
| | | | | | |
Class 4 | | | | | | | | | | | | | | | | | | | | | | | | |
| | | | | | |
Per share operating performance
(for a share outstanding throughout the period) | | | | | | | | | | | | | | | | | | | | | | | | |
| | | | | | |
Net asset value, beginning of period | | | $ 7.71 | | | | $ 6.20 | | | | $ 7.21 | | | | $ 5.70 | | | | $ 6.90 | | | | $ 16.44 | |
| | | | |
| | | | | | |
| Income from investment operationsa: | | | | | | | | | | | | | | | | | | | | | | | | |
| | | | | | |
Net investment income (loss)b | | | (0.02 | ) | | | (0.02 | ) | | | (0.02 | ) | | | (0.02 | ) | | | (0.03 | ) | | | (0.07 | ) |
| | | | | | |
Net realized and unrealized gains (losses) | | | 1.17 | | | | 1.91 | | | | 0.41 | | | | 1.55 | | | | (0.20 | ) | | | 0.99 | |
| | | | |
| | | | | | |
Total from investment operations | | | 1.15 | | | | 1.89 | | | | 0.39 | | | | 1.53 | | | | (0.23 | ) | | | 0.92 | |
| | | | |
| | | | | | |
| Less distributions from: | | | | | | | | | | | | | | | | | | | | | | | | |
| | | | | | |
Net realized gains | | | (0.58 | ) | | | (0.38 | ) | | | (1.40 | ) | | | (0.02 | ) | | | (0.97 | ) | | | (10.46 | ) |
| | | | |
| | | | | | |
Net asset value, end of period | | | $ 8.28 | | | | $ 7.71 | | | | $ 6.20 | | | | $ 7.21 | | | | $ 5.70 | | | | $ 6.90 | |
| | | | |
| | | | | | |
Total returnc | | | 15.21% | | | | 31.03% | | | | 3.10% | | | | 26.78% | | | | (2.98 | )% | | | 4.32% | |
| | | | | | |
| Ratios to average net assetsd | | | | | | | | | | | | | | | | | | | | | | | | |
| | | | | | |
Expenses before waiver and payments by affiliates | | | 1.43% | | | | 1.43% | | | | 1.40% | | | | 1.45% | | | | 1.46% | | | | 1.43% | |
| | | | | | |
Expenses net of waiver and payments by affiliates | | | 1.06%e | | | | 1.06%e | | | | 1.06%e | | | | 1.06% | | | | 1.06% | | | | 1.06% | |
| | | | | | |
Net investment income (loss) | | | (0.46)% | | | | (0.29)% | | | | (0.30)% | | | | (0.30)% | | | | (0.54)% | | | | (0.72)% | |
| | | | | | |
| Supplemental data | | | | | | | | | | | | | | | | | | | | | | | | |
| | | | | | |
Net assets, end of period (000’s) | | | $32,448 | | | | $31,761 | | | | $29,681 | | | | $30,112 | | | | $27,163 | | | | $34,479 | |
| | | | | | |
Portfolio turnover rate | | | 16.11% | | | | 26.29% | | | | 15.17% | | | | 52.12% | | | | 17.76% | | | | 88.15% | |
aThe amount shown for a share outstanding throughout the period may not correlate with the Statement of Operations for the period due to the timing of sales and repurchases of the Fund’s shares in relation to income earned and/or fluctuating fair value of the investments of the Fund.
bBased on average daily shares outstanding.
cTotal return does not include fees, charges or expenses imposed by the variable annuity and life insurance contracts for which Franklin Templeton Variable Insurance Products Trust serves as an underlying investment vehicle. Total return is not annualized for periods less than one year.
dRatios are annualized for periods less than one year.
eBenefit of expense reduction rounds to less than 0.01%.
| | | | | | |
| | | |
| | The accompanying notes are an integral part of these financial statements. | Semiannual Report | | | FFC-7 | |
FRANKLIN TEMPLETON VARIABLE INSURANCE PRODUCTS TRUST
Statement of Investments, June 30, 2020 (unaudited)
| | | | | | | | | | |
| Franklin Flex Cap Growth VIP Fund | | | | | | | | |
| | | | | Shares | | | Value | |
| | Common Stocks 95.8% | | | | | | | | |
| | Automobiles & Components 0.9% | | | | | | | | |
| a | | Tesla Inc. | | | 1,181 | | | $ | 1,275,256 | |
| | | | | | | | | | |
| | | |
| | | Capital Goods 1.5% | | | | | | |
| | Fortive Corp. | | | 9,730 | | | | 658,332 | |
| | Roper Technologies Inc. | | | 3,325 | | | | 1,290,964 | |
| | | | | | | | | | |
| | | |
| | | | | | | | | 1,949,296 | |
| | | | | | | | | | |
| | | |
| | Commercial & Professional Services 1.9% | | | | | | | | |
| | | |
| a | | CoStar Group Inc. | | | 1,746 | | | | 1,240,830 | |
| | Verisk Analytics Inc. | | | 7,706 | | | | 1,311,561 | |
| | | | | | | | | | |
| | | |
| | | | | | | | | 2,552,391 | |
| | | | | | | | | | |
| | Consumer Durables & Apparel 1.3% | | | | | | | | |
| | NIKE Inc., B | | | 17,213 | | | | 1,687,735 | |
| | | | | | | | | | |
| | | |
| | | Diversified Financials 3.3% | | | | | | |
| | Intercontinental Exchange Inc. | | | 12,679 | | | | 1,161,396 | |
| | MSCI Inc. | | | 5,901 | | | | 1,969,872 | |
| | Tradeweb Markets Inc. | | | 22,178 | | | | 1,289,429 | |
| | | | | | | | | | |
| | | |
| | | | | | | | | 4,420,697 | |
| | | | | | | | | | |
| | | |
| | Food & Staples Retailing 3.1% | | | | | | | | |
| | Costco Wholesale Corp. | | | 13,546 | | | | 4,107,283 | |
| | | | | | | | | | |
| | | |
| | Health Care Equipment & Services 10.5% | | | | | | | | |
| | Abbott Laboratories | | | 27,566 | | | | 2,520,359 | |
| | Danaher Corp. | | | 19,354 | | | | 3,422,368 | |
| a | | IDEXX Laboratories Inc. | | | 8,293 | | | | 2,738,017 | |
| a | | Intuitive Surgical Inc. | | | 4,426 | | | | 2,522,068 | |
| a | | Veeva Systems Inc. | | | 12,433 | | | | 2,914,544 | |
| | | | | | | | | | |
| | | |
| | | | | | | | | 14,117,356 | |
| | | | | | | | | | |
| | | |
| | Household & Personal Products 2.5% | | | | | | | | |
| | Estee Lauder Cos. Inc., A | | | 18,062 | | | | 3,407,938 | |
| | | | | | | | | | |
| | | |
| | Media & Entertainment 13.6% | | | | | | | | |
| a | | Alphabet Inc., C | | | 5,246 | | | | 7,415,798 | |
| a | | Charter Communications Inc., A | | | 4,421 | | | | 2,254,887 | |
| a | | Facebook Inc., A | | | 16,685 | | | | 3,788,663 | |
| a | | Netflix Inc. | | | 4,693 | | | | 2,135,503 | |
| a | | Sea Ltd., ADR (Taiwan) | | | 22,650 | | | | 2,428,986 | |
| a | | ZoomInfo Technologies Inc. | | | 3,800 | | | | 193,914 | |
| | | | | | | | | | |
| | | |
| | | | | | | | | 18,217,751 | |
| | | | | | | | | | |
| | | |
| | | Pharmaceuticals, Biotechnology & Life Sciences 1.1% | | | | | | |
| a | | 10X Genomics Inc., A | | | 369 | | | | 32,955 | |
| a | | Applied Molecular Transport Inc. | | | 5,900 | | | | 148,326 | |
| a | | Illumina Inc. | | | 3,403 | | | | 1,260,301 | |
| a | | Legend Biotech Corp., ADR | | | 1,700 | | | | 72,352 | |
| | | | | | | | | | |
| | | |
| | | | | | | | | 1,513,934 | |
| | | | | | | | | | |
FRANKLIN TEMPLETON VARIABLE INSURANCE PRODUCTS TRUST
STATEMENT OF INVESTMENTS (UNAUDITED)
Franklin Flex Cap Growth VIP Fund (continued)
| | | | | | | | | | |
| | | | | Shares | | | Value | |
| | Common Stocks (continued) | | | | | | | | |
| | | |
| | Real Estate 4.8% | | | | | | | | |
| | American Tower Corp. | | | 9,835 | | | $ | 2,542,741 | |
| | Crown Castle International Corp. | | | 15,536 | | | | 2,599,950 | |
| | Equinix Inc. | | | 1,830 | | | | 1,285,209 | |
| | | | | | | | | | |
| | | |
| | | | | | | | | 6,427,900 | |
| | | | | | | | | | |
| | | |
| | Retailing 9.6% | | | | | | | | |
| a | | Alibaba Group Holding Ltd., ADR (China) | | | 8,731 | | | | 1,883,277 | |
| a | | Amazon.com Inc. | | | 3,302 | | | | 9,109,623 | |
| a | | Booking Holdings Inc. | | | 221 | | | | 351,907 | |
| a | | MercadoLibre Inc. (Argentina) | | | 1,505 | | | | 1,483,584 | |
| a | | Vroom Inc. | | | 500 | | | | 26,070 | |
| | | | | | | | | | |
| | | |
| | | | | | | | | 12,854,461 | |
| | | | | | | | | | |
| | | |
| | Semiconductors & Semiconductor Equipment 6.1% | | | | | | | | |
| | Analog Devices Inc. | | | 11,440 | | | | 1,403,002 | |
| | ASML Holding NV, N.Y. shs (Netherlands) | | | 3,880 | | | | 1,427,956 | |
| | NVIDIA Corp. | | | 7,606 | | | | 2,889,595 | |
| | Xilinx Inc. | | | 24,545 | | | | 2,414,983 | |
| | | | | | | | | | |
| | | |
| | | | | | | | | 8,135,536 | |
| | | | | | | | | | |
| | | |
| | Software & Services 32.7% | | | | | | | | |
| a | | Adobe Inc. | | | 7,606 | | | | 3,310,968 | |
| a | | Atlassian Corp. PLC | | | 8,542 | | | | 1,539,866 | |
| a | | Bill.Com Holdings Inc. | | | 284 | | | | 25,620 | |
| a | | Coupa Software Inc. | | | 6,091 | | | | 1,687,451 | |
| | Mastercard Inc., A | | | 16,572 | | | | 4,900,340 | |
| | Microsoft Corp. | | | 55,590 | | | | 11,313,121 | |
| a | | PayPal Holdings Inc. | | | 17,063 | | | | 2,972,886 | |
| a | | salesforce.com Inc. | | | 30,587 | | | | 5,729,863 | |
| a | | ServiceNow Inc. | | | 20,489 | | | | 8,299,274 | |
| a | | Shift4 Payments Inc. | | | 2,600 | | | | 92,300 | |
| | Visa Inc., A | | | 20,224 | | | | 3,906,670 | |
| | | | | | | | | | |
| | | |
| | | | | | | | | 43,778,359 | |
| | | | | | | | | | |
| | | |
| | Technology Hardware & Equipment 0.9% | | | | | | | | |
| a | | Keysight Technologies Inc. | | | 12,248 | | | | 1,234,353 | |
| | | | | | | | | | |
| | | |
| | Utilities 2.0% | | | | | | | | |
| | NextEra Energy Inc. | | | 11,110 | | | | 2,668,289 | |
| | | | | | | | | | |
| | | |
| | Total Common Stocks (Cost $61,854,237) | | | | | | | 128,348,535 | |
| | | | | | | | | | |
FRANKLIN TEMPLETON VARIABLE INSURANCE PRODUCTS TRUST
STATEMENT OF INVESTMENTS (UNAUDITED)
Franklin Flex Cap Growth VIP Fund (continued)
| | | | | | | | | | |
| | | | | Shares | | | Value | |
| | Short Term Investments (Cost $5,605,537) 4.2% | | | | | | | | |
| | | |
| | Money Market Funds 4.2% | | | | | | | | |
| b,c | | Institutional Fiduciary Trust Money Market Portfolio, 0.00% | | | 5,605,537 | | | $ | 5,605,537 | |
| | | | | | | | | | |
| | | |
| | Total Investments (Cost $67,459,774) 100.0% | | | | | | | 133,954,072 | |
| | Other Assets, less Liabilities (0.0)%† | | | | | | | (25,760 | ) |
| | | | | | | | | | |
| | | |
| | Net Assets 100.0% | | | | | | $ | 133,928,312 | |
| | | | | | | | | | |
See Abbreviations on page FFC-20.
†Rounds to less than 0.1% of net assets.
aNon-income producing.
bSee Note 3(e) regarding investments in affiliated management investment companies.
cThe rate shown is the annualized seven-day effective yield at period end.
| | | | |
| | | |
| FFC-10 | | Semiannual Report | The accompanying notes are an integral part of these financial statements. | | |
FRANKLIN TEMPLETON VARIABLE INSURANCE PRODUCTS TRUST
FINANCIAL STATEMENTS
Statement of Assets and Liabilities
June 30, 2020 (unaudited)
| | | | |
| | | Franklin Flex
Cap Growth
VIP Fund | |
Assets: | | | | |
Investments in securities: | | | | |
Cost - Unaffiliated issuers | | $ | 61,854,237 | |
Cost - Non-controlled affiliates (Note 3e) | | | 5,605,537 | |
| | | | |
| |
Value - Unaffiliated issuers | | $ | 128,348,535 | |
Value - Non-controlled affiliates (Note 3e) | | | 5,605,537 | |
Cash | | | 72 | |
Receivables: | | | | |
Capital shares sold | | | 214,725 | |
Dividends | | | 18,521 | |
Other assets | | | 108 | |
| | | | |
| |
Total assets | | | 134,187,498 | |
| | | | |
Liabilities: | | | | |
Payables: | | | | |
Capital shares redeemed | | | 109,016 | |
Management fees | | | 66,773 | |
Distribution fees | | | 29,579 | |
Reports to shareholders | | | 25,867 | |
Professional fees | | | 24,710 | |
Accrued expenses and other liabilities | | | 3,241 | |
| | | | |
| |
Total liabilities | | | 259,186 | |
| | | | |
| |
Net assets, at value | | $ | 133,928,312 | |
| | | | |
Net assets consist of: | | | | |
Paid-in capital | | $ | 58,259,407 | |
Total distributable earnings (losses) | | | 75,668,905 | |
| | | | |
| |
Net assets, at value | | $ | 133,928,312 | |
| | | | |
| Class 2: | | | | |
Net assets, at value | | $ | 101,480,767 | |
| | | | |
| |
Shares outstanding | | | 11,671,510 | |
| | | | |
Net asset value and maximum offering price per share | | | $8.69 | |
| | | | |
| Class 4: | | | | |
Net assets, at value | | $ | 32,447,545 | |
| | | | |
Shares outstanding | | | 3,916,935 | |
| | | | |
Net asset value and maximum offering price per share | | | $8.28 | |
| | | | |
| | | | | | |
| | | |
| | The accompanying notes are an integral part of these financial statements. | Semiannual Report | | | FFC-11 | |
FRANKLIN TEMPLETON VARIABLE INSURANCE PRODUCTS TRUST
FINANCIAL STATEMENTS
Statement of Operations
for the six months ended June 30, 2020 (unaudited)
| | | | |
| | | Franklin Flex
Cap Growth
VIP Fund | |
Investment income: | | | | |
Dividends: | | | | |
Unaffiliated issuers | | $ | 359,155 | |
Non-controlled affiliates (Note 3e) | | | 3,120 | |
Income from securities loaned: | | | | |
Unaffiliated entities (net of fees and rebates) | | | 318 | |
Non-controlled affiliates (Note 3e) | | | 10 | |
| | | | |
| |
Total investment income | | | 362,603 | |
| | | | |
Expenses: | | | | |
Management fees (Note 3a) | | | 593,671 | |
Distribution fees: (Note 3c) | | | | |
Class 2 | | | 113,408 | |
Class 4 | | | 53,355 | |
Custodian fees (Note 4) | | | 1,815 | |
Reports to shareholders | | | 22,731 | |
Professional fees | | | 29,521 | |
Trustees’ fees and expenses | | | 386 | |
Other | | | 3,553 | |
| | | | |
| |
Total expenses | | | 818,440 | |
Expense reductions (Note 4) | | | (128 | ) |
Expenses waived/paid by affiliates (Note 3e and 3f) | | | (222,312 | ) |
| | | | |
| |
Net expenses | | | 596,000 | |
| | | | |
| |
Net investment income (loss) | | | (233,397 | ) |
| | | | |
Realized and unrealized gains (losses): | | | | |
Net realized gain (loss) from: | | | | |
Investments: | | | | |
Unaffiliated issuers. | | | 9,427,688 | |
| | | | |
Net change in unrealized appreciation (depreciation) on: | | | | |
Investments: | | | | |
Unaffiliated issuers. | | | 5,559,178 | |
| | | | |
| |
Net realized and unrealized gain (loss) | | | 14,986,866 | |
| | | | |
| |
Net increase (decrease) in net assets resulting from operations | | $ | 14,753,469 | |
| | | | |
| | | | |
| | | |
| FFC-12 | | Semiannual Report | The accompanying notes are an integral part of these financial statements. | | |
FRANKLIN TEMPLETON VARIABLE INSURANCE PRODUCTS TRUST
FINANCIAL STATEMENTS
Statements of Changes in Net Assets
| | | | | | | | |
| | | Franklin Flex Cap
Growth VIP Fund | |
| | |
| | | Six Months Ended
June 30, 2020
(unaudited) | | | Year Ended
December 31, 2019 | |
Increase (decrease) in net assets: | | | | | | | | |
Operations: | | | | | | | | |
Net investment income (loss) | | $ | (233,397 | ) | | $ | (271,500 | ) |
Net realized gain (loss) | | | 9,427,688 | | | | 8,427,290 | |
Net change in unrealized appreciation (depreciation) | | | 5,559,178 | | | | 22,895,498 | |
| | | | |
| | |
Net increase (decrease) in net assets resulting from operations | | | 14,753,469 | | | | 31,051,288 | |
| | | | |
| | |
Distributions to shareholders: | | | | | | | | |
Class 2 | | | (6,270,140 | ) | | | (4,527,605 | ) |
Class 4 | | | (2,134,830 | ) | | | (1,613,765 | ) |
| | | | |
| | |
Total distributions to shareholders | | | (8,404,970 | ) | | | (6,141,370 | ) |
| | | | |
| | |
Capital share transactions: (Note 2) | | | | | | | | |
Class 2 | | | (583,815 | ) | | | 10,720,742 | |
Class 4 | | | (1,561,279 | ) | | | (4,820,540 | ) |
| | | | |
| | |
Total capital share transactions | | | (2,145,094 | ) | | | 5,900,202 | |
| | | | |
| | |
Net increase (decrease) in net assets | | | 4,203,405 | | | | 30,810,120 | |
Net assets: | | | | | | | | |
Beginning of period | | | 129,724,907 | | | | 98,914,787 | |
| | | | |
| | |
End of period | | $ | 133,928,312 | | | $ | 129,724,907 | |
| | | | |
| | | | | | |
| | | |
| | The accompanying notes are an integral part of these financial statements. | Semiannual Report | | | FFC-13 | |
FRANKLIN TEMPLETON VARIABLE INSURANCE PRODUCTS TRUST
Notes to Financial Statements (unaudited)
Franklin Flex Cap Growth VIP Fund
1. Organization and Significant Accounting Policies
Franklin Templeton Variable Insurance Products Trust (Trust) is registered under the Investment Company Act of 1940 (1940 Act) as an open-end management investment company, consisting of eighteen separate funds and applies the specialized accounting and reporting guidance in U.S. Generally Accepted Accounting Principles (U.S. GAAP). Franklin Flex Cap Growth VIP Fund (Fund) is included in this report. Shares of the Fund are generally sold only to insurance company separate accounts to fund the benefits of variable life insurance policies or variable annuity contracts. The Fund offers two classes of shares: Class 2 and Class 4. Each class of shares may differ by its distribution fees, voting rights on matters affecting a single class and its exchange privilege.
The following summarizes the Fund’s significant accounting policies.
a. Financial Instrument Valuation
The Fund’s investments in financial instruments are carried at fair value daily. Fair value is the price that would be received to sell an asset or paid to transfer a liability in an orderly transaction between market participants on the measurement date. The Fund calculates the net asset value (NAV) per share each business day as of 4 p.m. Eastern time or the regularly scheduled close of the New York Stock Exchange (NYSE), whichever is earlier. Under compliance policies and procedures approved by the Trust’s Board of Trustees (the Board), the Fund’s administrator has responsibility for oversight of valuation, including leading the cross-functional Valuation Committee (VC). The Fund may utilize independent pricing services, quotations from securities and financial instrument dealers, and other market sources to determine fair value.
Equity securities listed on an exchange or on the NASDAQ National Market System are valued at the last quoted sale price or the official closing price of the day, respectively. Foreign equity securities are valued as of the close of trading on the foreign stock exchange on which the security is primarily traded, or as of 4 p.m. Eastern time. The value is then converted into its U.S. dollar equivalent at the foreign exchange rate in effect at 4 p.m. Eastern time on the day that the value of the security is determined. Over-the-counter (OTC) securities are valued within the range of the most recent quoted bid and ask prices. Securities that trade in multiple markets or on multiple exchanges are valued
according to the broadest and most representative market. Certain equity securities are valued based upon fundamental characteristics or relationships to similar securities.
Investments in open-end mutual funds are valued at the closing NAV.
The Fund has procedures to determine the fair value of financial instruments for which market prices are not reliable or readily available. Under these procedures, the Fund primarily employs a market-based approach which may use related or comparable assets or liabilities, recent transactions, market multiples, book values, and other relevant information for the investment to determine the fair value of the investment. An income-based valuation approach may also be used in which the anticipated future cash flows of the investment are discounted to calculate fair value. Discounts may also be applied due to the nature or duration of any restrictions on the disposition of the investments. Due to the inherent uncertainty of valuations of such investments, the fair values may differ significantly from the values that would have been used had an active market existed.
Trading in securities on foreign securities stock exchanges and OTC markets may be completed before 4 p.m. Eastern time. In addition, trading in certain foreign markets may not take place on every Fund’s business day. Events can occur between the time at which trading in a foreign security is completed and 4 p.m. Eastern time that might call into question the reliability of the value of a portfolio security held by the Fund. As a result, differences may arise between the value of the Fund’s portfolio securities as determined at the foreign market close and the latest indications of value at 4 p.m. Eastern time. In order to minimize the potential for these differences, an independent pricing service may be used to adjust the value of the Fund’s portfolio securities to the latest indications of fair value at 4 p.m. Eastern time.
When the last day of the reporting period is a non-business day, certain foreign markets may be open on those days that the Fund’s NAV is not calculated, which could result in differences between the value of the Fund’s portfolio securities on the last business day and the last calendar day of the reporting period. Any significant security valuation changes due to an open foreign market are adjusted and reflected by the Fund for financial reporting purposes.
FRANKLIN TEMPLETON VARIABLE INSURANCE PRODUCTS TRUST
NOTES TO FINANCIAL STATEMENTS (UNAUDITED)
Franklin Flex Cap Growth VIP Fund (continued)
b. Securities Lending
The Fund participates in an agency based securities lending program to earn additional income. The Fund receives cash collateral against the loaned securities in an amount equal to at least 102% of the fair value of the loaned securities. Collateral is maintained over the life of the loan in an amount not less than 100% of the fair value of loaned securities, as determined at the close of Fund business each day; any additional collateral required due to changes in security values is delivered to the Fund on the next business day. The collateral is deposited into a joint cash account with other funds and is used to invest in a money market fund managed by Franklin Advisers, Inc., an affiliate of the Fund. The Fund may receive income from the investment of cash collateral, in addition to lending fees and rebates paid by the borrower. Income from securities loaned, net of fees paid to the securities lending agent and/or third-party vendor, is reported separately in the Statement of Operations. The Fund bears the market risk with respect to the collateral investment, securities loaned, and the risk that the agent may default on its obligations to the Fund. If the borrower defaults on its obligation to return the securities loaned, the Fund has the right to repurchase the securities in the open market using the collateral received. The securities lending agent has agreed to indemnify the Fund in the event of default by a third party borrower. At June 30, 2020, the Fund had no securities on loan.
c. Income and Deferred Taxes
It is the Fund’s policy to qualify as a regulated investment company under the Internal Revenue Code. The Fund intends to distribute to shareholders substantially all of its taxable income and net realized gains to relieve it from federal income and if applicable, excise taxes. As a result, no provision for U.S. federal income taxes is required.
The Fund may be subject to foreign taxation related to income received, capital gains on the sale of securities and certain foreign currency transactions in the foreign jurisdictions in which it invests. Foreign taxes, if any, are recorded based on the tax regulations and rates that exist in the foreign markets in which the Fund invests. When a capital gain tax is determined to apply, the Fund records an estimated deferred tax liability in an amount that would be payable if the securities were disposed of on the valuation date.
The Fund may recognize an income tax liability related to its uncertain tax positions under U.S. GAAP when the uncertain tax position has a less than 50% probability that it will be sustained upon examination by the tax authorities based on its technical merits. As of June 30, 2020, the Fund has determined that no tax liability is required in its financial statements related to uncertain tax positions for any open tax years (or expected to be taken in future tax years). Open tax years are those that remain subject to examination and are based on the statute of limitations in each jurisdiction in which the Fund invests.
d. Security Transactions, Investment Income, Expenses and Distributions
Security transactions are accounted for on trade date. Realized gains and losses on security transactions are determined on a specific identification basis. Estimated expenses are accrued daily. Dividend income is recorded on the ex-dividend date except for certain dividends from securities where the dividend rate is not available. In such cases, the dividend is recorded as soon as the information is received by the Fund. Distributions to shareholders are recorded on the ex-dividend date. Distributable earnings are determined according to income tax regulations (tax basis) and may differ from earnings recorded in accordance with U.S. GAAP. These differences may be permanent or temporary. Permanent differences are reclassified among capital accounts to reflect their tax character. These reclassifications have no impact on net assets or the results of operations. Temporary differences are not reclassified, as they may reverse in subsequent periods.
Common expenses incurred by the Trust are allocated among the Funds based on the ratio of net assets of each Fund to the combined net assets of the Trust or based on the ratio of number of shareholders of each Fund to the combined number of shareholders of the Trust. Fund specific expenses are charged directly to the Fund that incurred the expense.
Realized and unrealized gains and losses and net investment income, excluding class specific expenses, are allocated daily to each class of shares based upon the relative proportion of net assets of each class. Differences in per share distributions by class are generally due to differences in class specific expenses.
FRANKLIN TEMPLETON VARIABLE INSURANCE PRODUCTS TRUST
NOTES TO FINANCIAL STATEMENTS (UNAUDITED)
Franklin Flex Cap Growth VIP Fund (continued)
1. Organization and Significant Accounting
Policies (continued)
e. Accounting Estimates
The preparation of financial statements in accordance with U.S. GAAP requires management to make estimates and assumptions that affect the reported amounts of assets and liabilities at the date of the financial statements and the amounts of income and expenses during the reporting period. Actual results could differ from those estimates.
f. Guarantees and Indemnifications
Under the Trust’s organizational documents, its officers and trustees are indemnified by the Trust against certain liabilities arising out of the performance of their duties to the Trust.
2. Shares of Beneficial Interest
Additionally, in the normal course of business, the Trust, on behalf of the Fund, enters into contracts with service providers that contain general indemnification clauses. The Trust’s maximum exposure under these arrangements is unknown as this would involve future claims that may be made against the Trust that have not yet occurred. Currently, the Trust expects the risk of loss to be remote.
At June 30, 2020, there were an unlimited number of shares authorized (without par value). Transactions in the Fund’s shares were as follows:
| | | | | | | | | | | | | | | | |
| | |
| | | Six Months Ended
June 30, 2020 | | | Year Ended
December 31, 2019 | |
| | | | |
| | | Shares | | | Amount | | | Shares | | | Amount | |
| | | | |
| Class 2 Shares: | | | | | | | | | | | | | | | | |
Shares sold | | | 2,904,628 | | | $ | 24,148,076 | | | | 3,678,687 | | | $ | 27,630,014 | |
Shares issued in reinvestment of distributions | | | 752,718 | | | | 6,270,140 | | | | 606,105 | | | | 4,527,605 | |
Shares redeemed | | | (4,138,598 | ) | | | (31,002,031 | ) | | | (2,846,348 | ) | | | (21,436,877) | |
| | | | |
| | | | |
Net increase (decrease) | | | (481,252 | ) | | $ | (583,815 | ) | | | 1,438,444 | | | $ | 10,720,742 | |
| | | | |
| | | | |
| Class 4 Shares: | | | | | | | | | | | | | | | | |
Shares sold | | | 241,848 | | | $ | 1,885,103 | | | | 406,751 | | | $ | 2,950,254 | |
Shares issued in reinvestment of distributions | | | 268,870 | | | | 2,134,830 | | | | 226,017 | | | | 1,613,765 | |
Shares redeemed | | | (714,042 | ) | | | (5,581,212 | ) | | | (1,300,636 | ) | | | (9,384,559) | |
| | | | |
| | | | |
Net increase (decrease) | | | (203,324 | ) | | $ | (1,561,279 | ) | | | (667,868 | ) | | $ | (4,820,540) | |
| | | | |
3. Transactions with Affiliates
Franklin Resources, Inc. is the holding company for various subsidiaries that together are referred to as Franklin Templeton. Certain officers and trustees of the Fund are also officers and/or directors of the following subsidiaries:
| | |
| |
| Subsidiary | | Affiliation |
Franklin Advisers, Inc. (Advisers) | | Investment manager |
Franklin Templeton Services, LLC (FT Services) | | Administrative manager |
Franklin Templeton Distributors, Inc. (Distributors) | | Principal underwriter |
Franklin Templeton Investor Services, LLC (Investor Services) | | Transfer agent |
FRANKLIN TEMPLETON VARIABLE INSURANCE PRODUCTS TRUST
NOTES TO FINANCIAL STATEMENTS (UNAUDITED)
Franklin Flex Cap Growth VIP Fund (continued)
a. Management Fees
The Fund pays an investment management fee to Advisers based on the average daily net assets of the Fund as follows:
| | |
| |
| Annualized Fee Rate | | Net Assets |
1.000% | | Up to and including $100 million |
0.900% | | Over $100 million, up to and including $250 million |
0.850% | | Over $250 million, up to and including $10 billion |
0.800% | | Over $10 billion, up to and including $12.5 billion |
0.775% | | Over $12.5 billion, up to and including $15 billion |
0.750% | | In excess of $15 billion |
For the period ended June 30, 2020, the annualized gross effective investment management fee rate was 0.981% of the Fund’s average daily net assets.
b. Administrative Fees
Under an agreement with Advisers, FT Services provides administrative services to the Fund. The fee is paid by Advisers based on the Fund’s average daily net assets, and is not an additional expense of the Fund.
c. Distribution Fees
The Board has adopted distribution plans for Class 2 and Class 4 shares pursuant to Rule 12b-1 under the 1940 Act. Under the Fund’s compensation distribution plans, the Fund pays Distributors for costs incurred in connection with the servicing, sale and distribution of the Fund’s shares up to 0.35% per year of its average daily net assets of Class 2 and Class 4, respectively. The Board has agreed to limit the current rate to 0.25% per year for Class 2. The plan year, for purposes of monitoring compliance with the maximum annual plan rates, is February 1 through January 31.
d. Transfer Agent Fees
Investor Services, under terms of an agreement, performs shareholder servicing for the Fund and is not paid by the Fund for the services.
e. Investments in Affiliated Management Investment Companies
The Fund invests in one or more affiliated management investment companies for purposes other than exercising a controlling influence over the management or policies. Management fees paid by the Fund are waived on assets invested in the affiliated management investment companies, as noted in the Statement of Operations, in an amount not to exceed the management and administrative fees paid directly or indirectly by each affiliate. During the period ended June 30, 2020, the Fund held investments in affiliated management investment companies as follows:
| | | | | | | | | | | | | | | | | | | | | | | | | | | | | | | | |
| | | | | | | | |
| | | Value at
Beginning
of Period | | | Purchases | | | Sales | | | Realized
Gain (Loss) | | | Net Change in
Unrealized
Appreciation
(Depreciation) | | | Value at
End of
Period | | | Number of
Shares
Held at End
of Period | | | Investment
Income | |
| Non-Controlled Affiliates | | | | | | | | | | | | | | | | | | | | | | | | | | | | | | | | |
| | | | | | | | |
| | | | | | | | | | | | | | | | | | | | | | | | | | | | | | | Dividends | |
| | | | | | | | | | | | | | | | | | | | | | | | | | | | | | | | |
| | | | | | | | |
Institutional Fiduciary Trust Money Market Portfolio, 0.00% | | | $2,694,405 | | | | $25,240,403 | | | | $(22,329,271) | | | | $ — | | | | $ — | | | | $ 5,605,537 | | | | 5,605,537 | | | | $3,120 | |
FRANKLIN TEMPLETON VARIABLE INSURANCE PRODUCTS TRUST
NOTES TO FINANCIAL STATEMENTS (UNAUDITED)
Franklin Flex Cap Growth VIP Fund (continued)
3. Transactions with Affiliates (continued)
e. Investments in Affiliated Management Investment Companies (continued)
| | | | | | | | | | | | | | | | | | | | | | | | | | | | | | | | |
| | | | | | | | |
| | | Value at
Beginning
of Period | | | Purchases | | | Sales | | | Realized
Gain (Loss) | | | Net Change in
Unrealized
Appreciation
(Depreciation) | | | Value at
End of
Period | | | Number of
Shares
Held at End
of Period | | | Investment
Income | |
| Non-Controlled Affiliates (continued) | | | | | | | | | | | | | | | | | | | | | | | | | | | | | |
| | | | | | | | | | | | | | | | | | | | | | | | | | | | | |
| Income from
securities
loaned |
|
| | | | | | | | | | | | | | | | | | | | | | | | | | | | | | | | |
Institutional Fiduciary Trust Money Market Portfolio, 0.00% | | | $ 23,100 | | | | $ 1,211,910 | | | | $ (1,235,010) | | | | $ — | | | | $ — | | | | $ — | | | | — | | | | $ 10 | |
| | | | | | | | | | | | |
Total Affiliated Securities | | | $2,717,505 | | | | $26,452,313 | | | | $(23,564,281) | | | | $ — | | | | $ — | | | | $5,605,537 | | | | | | | | $3,130 | |
| | | | | | | | | | | | |
f. Waiver and Expense Reimbursements
Advisers have contractually agreed in advance to waive or limit its fees and to assume as its own expense certain expenses otherwise payable by the Fund so that the operating expenses (excluding distribution fees and acquired fund fees and expenses and certain non-routine expenses or costs, including those relating to litigation, indemnification, reorganizations, and liquidations) for each class of the Fund does not exceed 0.71% based on the average net assets of each class until April 30, 2021. Total expenses waived or paid are not subject to recapture subsequent to the Fund’s fiscal year end.
4. Expense Offset Arrangement
The Fund has entered into an arrangement with its custodian whereby credits realized as a result of uninvested cash balances are used to reduce a portion of the Fund’s custodian expenses. During the period ended June 30, 2020, the custodian fees were reduced as noted in the Statement of Operations.
5. Income Taxes
At June 30, 2020, the cost of investments and net unrealized appreciation (depreciation) for income tax purposes were as follows:
| | | | |
Cost of investments | | $ | 67,479,008 | |
| | | | |
| |
Unrealized appreciation | | $ | 66,503,224 | |
Unrealized depreciation | | | (28,160) | |
| | | | |
| |
Net unrealized appreciation (depreciation) | | $ | 66,475,064 | |
| | | | |
Differences between income and/or capital gains as determined on a book basis and a tax basis are primarily due to differing treatment of wash sales.
6. Investment Transactions
Purchases and sales of investments (excluding short term securities) for the period ended June 30, 2020, aggregated $19,323,735 and $33,088,462, respectively.
FRANKLIN TEMPLETON VARIABLE INSURANCE PRODUCTS TRUST
NOTES TO FINANCIAL STATEMENTS (UNAUDITED)
Franklin Flex Cap Growth VIP Fund (continued)
7. Novel Coronavirus Pandemic
The global outbreak of the novel coronavirus disease, known as COVID-19, has caused adverse effects on many companies, sectors, nations, regions and the markets in general, and may continue for an unpredictable duration. The effects of this pandemic may materially impact the value and performance of the Fund, its ability to buy and sell fund investments at appropriate valuations and its ability to achieve its investment objectives.
8. Credit Facility
The Fund, together with other U.S. registered and foreign investment funds (collectively, Borrowers), managed by Franklin Templeton, are borrowers in a joint syndicated senior unsecured credit facility totaling $2 billion (Global Credit Facility) which matures on February 5, 2021. This Global Credit Facility provides a source of funds to the Borrowers for temporary and emergency purposes, including the ability to meet future unanticipated or unusually large redemption requests.
Under the terms of the Global Credit Facility, the Fund shall, in addition to interest charged on any borrowings made by the Fund and other costs incurred by the Fund, pay its share of fees and expenses incurred in connection with the implementation and maintenance of the Global Credit Facility, based upon its relative share of the aggregate net assets of all of the Borrowers, including an annual commitment fee of 0.15% based upon the unused portion of the Global Credit Facility. These fees are reflected in other expenses in the Statement of Operations. During the period ended June 30, 2020, the Fund did not use the Global Credit Facility.
9. Fair Value Measurements
The Fund follows a fair value hierarchy that distinguishes between market data obtained from independent sources (observable inputs) and the Fund’s own market assumptions (unobservable inputs). These inputs are used in determining the value of the Fund’s financial instruments and are summarized in the following fair value hierarchy:
| | • | | Level 1 – quoted prices in active markets for identical financial instruments |
| | • | | Level 2 – other significant observable inputs (including quoted prices for similar financial instruments, interest rates, prepayment speed, credit risk, etc.) |
| | • | | Level 3 – significant unobservable inputs (including the Fund’s own assumptions in determining the fair value of financial instruments) |
The input levels are not necessarily an indication of the risk or liquidity associated with financial instruments at that level.
At June 30, 2020, all of the Fund’s investments in financial instruments carried at fair value were valued using Level 1 inputs. For detailed categories, see the accompanying Statement of Investments.
10. New Accounting Pronouncements
In March 2020, the Financial Accounting Standards Board issued Accounting Standards Update (ASU) No. 2020-04, Reference Rate Reform (Topic 848) – Facilitation of the Effects of Reference Rate Reform on Financial Reporting. The amendments in the ASU provides optional temporary financial reporting relief from the effect of certain types of contract modifications due to the planned discontinuation of the London Interbank Offered Rate (LIBOR) and other interbank-offered based reference rates as of the end of 2021. The ASU is effective for certain reference rate-related contract modifications that occur during the period March 12, 2020 through December 31, 2022. Management is currently evaluating the impact, if any, of applying this ASU.
FRANKLIN TEMPLETON VARIABLE INSURANCE PRODUCTS TRUST
NOTES TO FINANCIAL STATEMENTS (UNAUDITED)
Franklin Flex Cap Growth VIP Fund (continued)
11. Subsequent Events
The Fund has evaluated subsequent events through the issuance of the financial statements and determined that no events have occurred that require disclosure.
Abbreviations
| | |
|
| Selected Portfolio |
| |
| ADR | | American Depositary Receipt |
Franklin Income VIP Fund
This semiannual report for Franklin Income VIP Fund covers the period ended June 30, 2020.
Class 4 Performance Summary as of June 30, 2020
The Fund’s Class 4 Shares posted a -11.40% total return* for the six-month period ended June 30, 2020.
*The Fund has a fee waiver associated with any investment it makes in a Franklin Templeton money fund and/or other Franklin Templeton fund, contractually guaranteed through 4/30/21. Fund investment results reflect the fee waiver; without this waiver, the results would have been lower.
Performance reflects the Fund’s Class 4 operating expenses, but does not include any contract fees, expenses or sales charges. If they had been included, performance would be lower. These charges and deductions, particularly for variable life policies, can have a significant effect on contract values and insurance benefits. See the contract prospectus for a complete description of these expenses, including sales charges.
Performance data represent past performance, which does not guarantee future results. Investment return and principal value will fluctuate, and you may have a gain or loss when you sell your shares. Current performance may differ from figures shown.
FRANKLIN INCOME VIP FUND
Fund Goal and Main Investments
The Fund seeks to maximize income, while maintaining prospects for capital appreciation. Under normal market conditions, the Fund invests in a diversified portfolio of debt and equity securities.
Fund Risks
All investments involve risks, including possible loss of principal. Unexpected events and their aftermaths, such as the spread of deadly diseases; natural, environmental or man-made disasters; financial, political or social disruptions; terrorism and war; and other tragedies or catastrophes, can cause investor fear and panic, which can adversely affect the economies of many companies, sectors, nations, regions and the market in general, in ways that cannot necessarily be foreseen. Stock prices fluctuate, sometimes rapidly and dramatically, due to factors affecting individual companies, particular industries or sectors, or general market conditions. The Fund’s portfolio includes a substantial portion of higher yielding, lower rated corporate bonds because of the relatively higher yields they offer. The Fund’s share price and yield will be affected by interest rate movements. Bond prices generally move in the opposite direction of interest rates. Thus, as prices of bonds in the Fund adjust to a rise in interest rates, the Fund’s share price may decline. Changes in the financial strength of a bond issuer or in a bond’s credit rating may affect its value. Foreign investing carries additional risks such as currency and market volatility and political or social instability, risks that are heightened in developing countries. The Fund is actively managed but there is no guarantee that the manager’s investment decisions will produce the desired results. The Fund’s prospectus also includes a description of the main investment risks.
Performance Overview
You can find the Fund’s six-month total return in the Performance Summary. In comparison, the Fund’s primary benchmark, the Standard & Poor’s® 500 Index (S&P 500®) posted a -3.08% total return.1 The Fund’s secondary benchmark, the Blended Benchmark, posted a -5.20% total return.2
Portfolio Composition
6/30/20
| | | | |
| Equity | | | 52.1% | |
| Information Technology | | | 10.4% | |
| Health Care | | | 7.9% | |
| Financials | | | 7.9% | |
| Utilities | | | 6.7% | |
| Consumer Staples | | | 3.8% | |
| Industrials | | | 3.7% | |
| Energy | | | 3.6% | |
| Communication Services | | | 3.4% | |
| Materials | | | 2.2% | |
| Consumer Discretionary | | | 2.2% | |
| Real Estate | | | 0.3% | |
| Fixed Income* | | | 42.1% | |
| Health Care | | | 13.6% | |
| Financials | | | 12.4% | |
| Communication Services | | | 5.5% | |
| Energy | | | 2.7% | |
| Consumer Discretionary | | | 2.7% | |
| Industrials | | | 1.3% | |
| Consumer Staples | | | 1.3% | |
| Materials | | | 1.3% | |
| Real Estate | | | 0.7% | |
| Utilities | | | 0.3% | |
| Information Technology | | | 0.3% | |
| Short-Term Investments & Other Net Assets | | | 5.8% | |
*Includes senior floating rate interests.
Economic and Market Overview
The U.S. bond market, as measured by the Bloomberg Barclays U.S. Aggregate Bond Index, advanced during the six-month period despite significant economic disruption in the wake of the novel coronavirus (COVID-19) pandemic. In late February 2020, as more countries adopted social distancing and lockdown measures to slow the global pandemic, the U.S. bond market began pricing in the adverse impact on economic activity. Higher-quality, longer-term
1. Source: Morningstar.
2. Source: FactSet. The Fund’s Blended Benchmark was calculated internally and rebalanced monthly and was composed of 50% MSCI USA High Dividend Yield Index + 25% Bloomberg Barclays U.S. High Yield Very Liquid Index + 25% Bloomberg Barclays U.S. Aggregate Bond Index.
One cannot invest directly in an index, and an index is not representative of the Fund’s portfolio. Please see Index Descriptions following the Fund Summaries.
The dollar value, number of shares or principal amount, and names of all portfolio holdings are listed in the Fund’s Statement of Investments (SOI).
FRANKLIN INCOME VIP FUND
bonds rallied, while riskier, lower-rated corporate bonds declined sharply, reflecting a reversal in many investors’ risk appetite. During the last quarter of the reporting period, however, as generally slowing infection rates and phased business reopenings by states drove hopes for an economic rebound, corporate bond valuations advanced significantly. Nevertheless, an increase in infection rates toward period-end prompted concern among investors, hindering lower-rated bonds.
The U.S. Federal Reserve (Fed) enacted two emergency rate cuts in response to the COVID-19 pandemic in March 2020, lowering the federal funds target rate to a range of 0.00%–0.25%. In addition, the Fed announced unlimited, open-ended purchasing of government-backed and corporate bonds to help keep markets functioning, significantly expanding its balance sheet.
U.S. Treasury bonds, as measured by the Bloomberg Barclays U.S. Treasury Index, rose significantly during the reporting period. Bond purchasing by the Fed and robust demand for investments perceived as safe drove the U.S. Treasury market higher despite the widening U.S. federal budget deficit and the massive increase in issuance. Mortgage-backed securities (MBS), as measured by the Bloomberg Barclays MBS Index, also posted positive returns, aided by declining Treasury rates and the Fed’s decision to purchase agency MBS.
U.S. corporate bond performance varied significantly based on credit rating, as investors became concerned about the pandemic-related economic disruption and the potential credit downgrades of many companies. Investment-grade corporate bonds, as represented by the Bloomberg Barclays U.S. Corporate Bond Index, rebounded significantly after mid-March 2020 to post positive overall returns for the reporting period. In contrast, high-yield corporate bonds, as represented by the Bloomberg Barclays U.S. Corporate High Yield Bond Index, declined due to investor concerns about a potential increase in credit defaults.
Investment Strategy
In analyzing debt and equity securities, we consider such factors as a company’s experience and managerial strength; responsiveness to changes in interest rates and business conditions; debt maturity schedules and borrowing requirements; changing financial condition and market recognition of the change; and a security’s relative value based on such factors as anticipated cash flow, interest or dividend coverage, asset coverage and earnings. When choosing investments for the Fund, we apply a bottom-up, value oriented, long-term approach, focusing on the market
Top Five Equity Holdings
6/30/20
| | |
| |
Company Sector/Industry | | % of Total
Net Assets |
| | | | |
JPMorgan Chase & Co.
Financials | | | 2.8% | |
The Southern Co.
Electric Utilities | | | 1.8% | |
Dominion Energy Inc.
Utilities | | | 1.8% | |
Verizon Communications Inc.
Financials | | | 1.6% | |
Procter & Gamble Co.
Communication Services | | | 1.5% | |
price of a company’s securities relative to the investment manager’s evaluation of the company’s long-term earnings, asset value and cash flow potential.
Manager’s Discussion
The Fund underperformed its benchmark during the six-month period due to weak performance across both equity and fixed income holdings. Asset allocation for equities was relatively stable, ending at 52.1% relative to 51.4% at the beginning of the period. The Fund’s fixed income positioning decreased as we modestly reduced our allocation to high-yield and investment-grade corporate bonds, ending at 42.1% of assets relative to 46.4% at the beginning of the period. Cash made up 5.8% of Fund assets at period-end.
On the equity side, overweightings and stock selection in the energy and financials sectors hurt relative performance. Notable detractors in energy included Weatherford International and Royal Dutch Shell, which were negatively impacted by weak commodity prices. In financials, Wells Fargo and JPMorgan Chase hurt results as lower interest rates impacted profitability and broader credit concerns increased as the economy moved into recession.
Turning to relative contributors in equity, an overweighting and stock selection in information technology helped results. Contributors in the sector included semiconductor companies Intel and Texas Instruments. S&P 500 put options also contributed and have been a regular part of our strategy over the last two years as we look to protect the Fund during significant drawdowns, as occurred in the period. Additionally, underweightings in the industrials and consumer staples sectors benefited performance relative to the benchmark.
FRANKLIN INCOME VIP FUND
Top Five Fixed Income Holdings
and Senior Floating Rate Interests
6/30/20
| | |
Company Sector/Industry | | % of Total
Net Assets |
| | | | |
CHS/Community Health Systems Inc. Health Care | | | 5.4% | |
U.S. Treasury Note Financials | | | 4.6% | |
GNMA II SF 30 Year Financials | | | 3.4% | |
Tenet Healthcare Corp. Health Care | | | 3.0% | |
Bausch Health Cos. Inc. Health Care | | | 1.7% | |
Fixed income holdings benefited from the sharp decline in interest rates during the period, but were hurt when credit spread widened materially in response to the global pandemic. This was most acute in the sub-investment grade segment of the market.
Selection and an overweighting in energy sector corporate bond holdings hurt relative performance. Chesapeake Energy and HighPoint Resources were notable detractors, impacted by global commodity oversupply and weak demand as a result of the pandemic. Elsewhere, bonds of Community Health Systems hurt performance due to the pressure COVID-19 placed on hospitals, which delayed profitable elective procedures while operators focused resources toward the public health crisis.
While treasury and securitized holdings benefited performance during periods of elevated market volatility, the generally shorter duration of our positioning lagged the broader market move amid a sharp decline in longer-term interest rates.
In contrast, communication services bonds contributed to relative results, especially T-Mobile/Sprint bonds which benefitted from the consummation of their corporate combination. Strong individual contributors included intermediate and longer duration investment-grade holdings in CVS Health, Bristol Meyers Squibb, British American Tobacco, Citigroup and HSBC Holdings, which benefited from the decline in interest rates. Additionally, our underweighting in the industrials sector benefited relative results given the sector’s negative performance.
Thank you for your participation in Franklin Income VIP Fund. We look forward to serving your future investment needs.
The foregoing information reflects our analysis, opinions and portfolio holdings as of June 30, 2020, the end of the reporting period. The way we implement our main investment strategies and the resulting portfolio holdings may change depending on factors such as market and economic conditions. These opinions may not be relied upon as investment advice or an offer for a particular security. The information is not a complete analysis of every aspect of any market, country, industry, security or the Fund. Statements of fact are from sources considered reliable, but the investment manager makes no representation or warranty as to their completeness or accuracy. Although historical performance is no guarantee of future results, these insights may help you understand our investment management philosophy.
FRANKLIN INCOME VIP FUND
Class 4 Fund Expenses
As an investor in a variable insurance contract (Contract) that indirectly provides for investment in an underlying mutual fund, you can incur transaction and/or ongoing expenses at both the Fund level and the Contract Level: (1) transaction expenses can include sales charges (loads) on purchases, surrender fees, transfer fees and premium taxes; and (2) ongoing expenses can include management fees, distribution and service (12b-1) fees, contract fees, annual maintenance fees, mortality and expense risk fees and other fees and expenses. All mutual funds and Contracts have some types of ongoing expenses. The table below shows Fund-level ongoing expenses and can help you understand these costs and compare them with those of other mutual funds offered through the Contract. The table assumes a $1,000 investment held for the six months indicated. Please refer to the Fund prospectus for additional information on operating expenses.
Actual Fund Expenses
The table below provides information about the actual account values and actual expenses in the columns under the heading “Actual.” In these columns the Fund’s actual return, which includes the effect of ongoing Fund expenses but does not include the effect of ongoing Contract expenses, is used to calculate the “Ending Account Value.” You can estimate the Fund-level expenses you paid during the period by following these steps (of course, your account value and expenses will differ from those in this illustration): Divide your account value by $1,000 (if your account had an $8,600 value, then $8,600 ÷ $1,000 = 8.6). Then multiply the result by the number under the headings “Actual” and “Fund-Level Expenses Paid During Period” (if Fund-Level Expenses Paid During Period were $ 7.50, then 8.6 x $ 7.50 = $64.50). In this illustration, the estimated expenses paid this period at the Fund level are $64.50.
Hypothetical Example for Comparison with Other Mutual Funds
Under the heading “Hypothetical” in the table, information is provided about hypothetical account values and hypothetical expenses based on the Fund’s actual expense ratio and an assumed rate of return of 5% per year before expenses, which is not the Fund’s actual return. This information may not be used to estimate the actual ending account balance or expenses you paid for the period, but it can help you compare ongoing costs of investing in the Fund with those of other mutual funds offered through the Contract. To do so, compare this 5% hypothetical example with the 5% hypothetical examples that appear in the shareholder reports of other funds offered through the Contract.
Please note that expenses shown in the table are meant to highlight ongoing costs at the Fund level only and do not reflect any ongoing expenses at the Contract level, or transaction expenses at either the Fund or Contract levels. In addition, while the Fund does not have transaction expenses, if the transaction and ongoing expenses at the Contract level were included, the expenses shown below would be higher. You should consult your Contract prospectus or disclosure document for more information.
| | | | | | | | | | | | | | | | | | |
| | | | | | | |
| | | | | | | Actual (actual return after expenses) | | | | Hypothetical (5% annual return before expenses) | | | | |
Share Class | | Beginning
Account
Value 1/1/20 | | | | Ending
Account
Value 6/30/20 | | Fund-Level
Expenses
Paid During
Period
1/1/20–6/30/201, 2 | | | | Ending
Account
Value 6/30/20 | | Fund-Level
Expenses
Paid During
Period
1/1/20–6/30/201, 2 | | | | Net
Annualized
Expense
Ratio2 |
Class 4 | | $1,000 | | | | $886.00 | | $3.80 | | | | $1,020.84 | | $4.07 | | | | 0.81% |
1. Expenses are equal to the annualized expense ratio for the six-month period as indicated above—in the far right column—multiplied by the simple average account value over the period indicated, and then multiplied by 182/366 to reflect the one-half year period.
2. Reflects expenses after fee waivers and expense reimbursements. Does not include any ongoing expenses of the Contract for which the Fund is an investment option or acquired fund fees and expenses.
FRANKLIN TEMPLETON VARIABLE INSURANCE PRODUCTS TRUST
Financial Highlights
Franklin Income VIP Fund
| | | | | | | | | | | | | | | | | | | | | | | | |
| | |
| | | Six Months Ended
June 30, 2020 (unaudited) | | | Year Ended December 31, | |
| | | 2019 | | | 2018 | | | 2017 | | | 2016 | | | 2015 | |
| | | | | | |
Class 1 | | | | | | | | | | | | | | | | | | | | | | | | |
| | | | | | |
Per share operating performance
(for a share outstanding throughout the period) | | | | | | | | | | | | | | | | | | | | | | | | |
| | | | | | |
Net asset value, beginning of period | | | $16.52 | | | | $15.26 | | | | $16.72 | | | | $15.87 | | | | $14.64 | | | | $16.48 | |
| | | | |
| | | | | | |
| Income from investment operationsa: | | | | | | | | | | | | | | | | | | | | | | | | |
| | | | | | |
Net investment incomeb | | | 0.30 | | | | 0.75 | | | | 0.71 | | | | 0.69 | | | | 0.67 | | | | 0.71 | |
| | | | | | |
Net realized and unrealized gains (losses) | | | (2.15 | ) | | | 1.68 | | | | (1.35 | ) | | | 0.87 | | | | 1.34 | | | | (1.78 | ) |
| | | | |
| | | | | | |
Total from investment operations | | | (1.85 | ) | | | 2.43 | | | | (0.64 | ) | | | 1.56 | | | | 2.01 | | | | (1.07 | ) |
| | | | |
| | | | | | |
| Less distributions from: | | | | | | | | | | | | | | | | | | | | | | | | |
| | | | | | |
Net investment income | | | (0.90 | ) | | | (0.91 | ) | | | (0.82 | ) | | | (0.71 | ) | | | (0.78 | ) | | | (0.77 | ) |
| | | | | | |
Net realized gains | | | (0.01 | ) | | | (0.26 | ) | | | — | | | | — | | | | — | | | | — | |
| | | | |
| | | | | | |
Total distributions | | | (0.91 | ) | | | (1.17 | ) | | | (0.82 | ) | | | (0.71 | ) | | | (0.78 | ) | | | (0.77 | ) |
| | | | |
| | | | | | |
Net asset value, end of period | | | $13.76 | | | | $16.52 | | | | $15.26 | | | | $16.72 | | | | $15.87 | | | | $14.64 | |
| | | | |
| | | | | | |
Total returnc | | | (11.22)% | | | | 16.42% | | | | (4.09)% | | | | 9.94% | | | | 14.33% | | | | (6.84)% | |
| | | | | | |
| Ratios to average net assetsd | | | | | | | | | | | | | | | | | | | | | | | | |
| | | | | | |
Expenses before waiver and payments by affiliates | | | 0.47% | | | | 0.46% | | | | 0.47% | | | | 0.47% | | | | 0.47% | | | | 0.46% | |
| | | | | | |
Expenses net of waiver and payments by affiliatese | | | 0.46% | | | | 0.45% | | | | 0.45% | | | | 0.45% | | | | 0.44% | | | | 0.46%f | |
| | | | | | |
Net investment income | | | 4.08% | | | | 4.38% | | | | 4.33% | | | | 4.22% | | | | 4.47% | | | | 4.47% | |
| | | | | | |
| Supplemental data | | | | | | | | | | | | | | | | | | | | | | | | |
| | | | | | |
Net assets, end of period (000’s) | | | $269,045 | | | | $309,330 | | | | $612,657 | | | | $735,149 | | | | $696,227 | | | | $604,228 | |
| | | | | | |
Portfolio turnover rate | | | 20.53% | | | | 25.16% | | | | 43.22% | | | | 20.96% | | | | 39.03% | | | | 31.53% | |
aThe amount shown for a share outstanding throughout the period may not correlate with the Statement of Operations for the period due to the timing of sales and repurchases of the Fund’s shares in relation to income earned and/or fluctuating fair value of the investments of the Fund.
bBased on average daily shares outstanding.
cTotal return does not include fees, charges or expenses imposed by the variable annuity and life insurance contracts for which Franklin Templeton Variable Insurance Products Trust serves as an underlying investment vehicle. Total return is not annualized for periods less than one year.
dRatios are annualized for periods less than one year.
eBenefit of expense reduction rounds to less than 0.01%.
fBenefit of waiver and payments by affiliates rounds to less than 0.01%.
| | | | |
| | | |
| FI-6 | | Semiannual Report | The accompanying notes are an integral part of these financial statements. | | |
FRANKLIN TEMPLETON VARIABLE INSURANCE PRODUCTS TRUST
FINANCIAL HIGHLIGHTS
Franklin Income VIP Fund (continued)
| | | | | | | | | | | | | | | | | | | | | | | | |
| | |
| | | Six Months Ended
June 30, 2020 (unaudited) | | | Year Ended December 31, | |
| | | 2019 | | | 2018 | | | 2017 | | | 2016 | | | 2015 | |
| | | | | | |
Class 2 | | | | | | | | | | | | | | | | | | | | | | | | |
| | | | | | |
Per share operating performance
(for a share outstanding throughout the period) | | | | | | | | | | | | | | | | | | | | | | | | |
| | | | | | |
Net asset value, beginning of period | | | $15.91 | | | | $14.74 | | | | $16.17 | | | | $15.38 | | | | $14.20 | | | | $16.00 | |
| | | | |
| | | | | | |
| Income from investment operationsa: | | | | | | | | | | | | | | | | | | | | | | | | |
| | | | | | |
Net investment incomeb | | | 0.28 | | | | 0.64 | | | | 0.65 | | | | 0.63 | | | | 0.61 | | | | 0.65 | |
| | | | | | |
Net realized and unrealized gains (losses) | | | (2.08 | ) | | | 1.66 | | | | (1.30 | ) | | | 0.83 | | | | 1.31 | | | | (1.73 | ) |
| | | | |
| | | | | | |
Total from investment operations | | | (1.80 | ) | | | 2.30 | | | | (0.65 | ) | | | 1.46 | | | | 1.92 | | | | (1.08 | ) |
| | | | |
| | | | | | |
| Less distributions from: | | | | | | | | | | | | | | | | | | | | | | | | |
| | | | | | |
Net investment income | | | (0.86 | ) | | | (0.87 | ) | | | (0.78 | ) | | | (0.67 | ) | | | (0.74 | ) | | | (0.72 | ) |
| | | | | | |
Net realized gains | | | (0.01 | ) | | | (0.26 | ) | | | — | | | | — | | | | — | | | | — | |
| | | | |
| | | | | | |
Total distributions | | | (0.87 | ) | | | (1.13 | ) | | | (0.78 | ) | | | (0.67 | ) | | | (0.74 | ) | | | (0.72 | ) |
| | | | |
| | | | | | |
Net asset value, end of period | | | $13.24 | | | | $15.91 | | | | $14.74 | | | | $16.17 | | | | $15.38 | | | | $14.20 | |
| | | | |
| | | | | | |
Total returnc | | | (11.36)% | | | | 16.06% | | | | (4.30)% | | | | 9.67% | | | | 14.02% | | �� | | (7.05)% | |
| | | | | | |
| Ratios to average net assetsd | | | | | | | | | | | | | | | | | | | | | | | | |
| | | | | | |
Expenses before waiver and payments by affiliates | | | 0.72% | | | | 0.71% | | | | 0.72% | | | | 0.72% | | | | 0.72% | | | | 0.71% | |
| | | | | | |
Expenses net of waiver and payments by affiliatese | | | 0.71% | | | | 0.70% | | | | 0.70% | | | | 0.70% | | | | 0.69% | | | | 0.71%f | |
| | | | | | |
Net investment income | | | 3.83% | | | | 4.13% | | | | 4.08% | | | | 3.97% | | | | 4.22% | | | | 4.22% | |
| | | | | | |
| Supplemental data | | | | | | | | | | | | | | | | | | | | | | | | |
| | | | | | |
Net assets, end of period (000’s) | | | $3,527,837 | | | | $4,318,156 | | | | $4,086,652 | | | | $5,041,498 | | | | $5,088,556 | | | | $4,907,599 | |
| | | | | | |
Portfolio turnover rate | | | 20.53% | | | | 25.16% | | | | 43.22% | | | | 20.96% | | | | 39.03% | | | | 31.53% | |
aThe amount shown for a share outstanding throughout the period may not correlate with the Statement of Operations for the period due to the timing of sales and repurchases of the Fund’s shares in relation to income earned and/or fluctuating fair value of the investments of the Fund.
bBased on average daily shares outstanding.
cTotal return does not include fees, charges or expenses imposed by the variable annuity and life insurance contracts for which Franklin Templeton Variable Insurance Products Trust serves as an underlying investment vehicle. Total return is not annualized for periods less than one year.
dRatios are annualized for periods less than one year.
eBenefit of expense reduction rounds to less than 0.01%.
fBenefit of waiver and payments by affiliates rounds to less than 0.01%.
| | | | | | |
| | | |
| | The accompanying notes are an integral part of these financial statements. | Semiannual Report | | | FI-7 | |
FRANKLIN TEMPLETON VARIABLE INSURANCE PRODUCTS TRUST
FINANCIAL HIGHLIGHTS
Franklin Income VIP Fund (continued)
| | | | | | | | | | | | | | | | | | | | | | | | |
| | |
| | | Six Months Ended
June 30, 2020 (unaudited) | | | Year Ended December 31, | |
| | | 2019 | | | 2018 | | | 2017 | | | 2016 | | | 2015 | |
| | | | | | |
Class 4 | | | | | | | | | | | | | | | | | | | | | | | | |
| | | | | | |
Per share operating performance
(for a share outstanding throughout the period) | | | | | | | | | | | | | | | | | | | | | | | | |
| | | | | | |
Net asset value, beginning of period | | | $16.32 | | | | $15.08 | | | | $16.53 | | | | $15.71 | | | | $14.49 | | | | $16.31 | |
| | | | |
| | | | | | |
| Income from investment operationsa: | | | | | | | | | | | | | | | | | | | | | | | | |
| | | | | | |
Net investment incomeb | | | 0.27 | | | | 0.64 | | | | 0.64 | | | | 0.62 | | | | 0.61 | | | | 0.65 | |
| | | | | | |
Net realized and unrealized gains (losses) | | | (2.12 | ) | | | 1.71 | | | | (1.33 | ) | | | 0.85 | | | | 1.33 | | | | (1.76 | ) |
| | | | |
| | | | | | |
Total from investment operations | | | (1.85 | ) | | | 2.35 | | | | (0.69 | ) | | | 1.47 | | | | 1.94 | | | | (1.11 | ) |
| | | | |
| | | | | | |
| Less distributions from: | | | | | | | | | | | | | | | | | | | | | | | | |
| | | | | | |
Net investment income | | | (0.85 | ) | | | (0.85 | ) | | | (0.76 | ) | | | (0.65 | ) | | | (0.72 | ) | | | (0.71 | ) |
| | | | | | |
Net realized gains | | | (0.01 | ) | | | (0.26 | ) | | | — | | | | — | | | | — | | | | — | |
| | | | |
| | | | | | |
Total distributions | | | (0.86 | ) | | | (1.11 | ) | | | (0.76 | ) | | | (0.65 | ) | | | (0.72 | ) | | | (0.71 | ) |
| | | | |
| | | | | | |
Net asset value, end of period | | | $13.61 | | | | $16.32 | | | | $15.08 | | | | $16.53 | | | | $15.71 | | | | $14.49 | |
| | | | |
| | | | | | |
Total returnc | | | (11.40)% | | | | 16.05% | | | | (4.42)% | | | | 9.55% | | | | 13.87% | | | | (7.15)% | |
| | | | | | |
| Ratios to average net assetsd | | | | | | | | | | | | | | | | | | | | | | | | |
| | | | | | |
Expenses before waiver and payments by affiliates | | | 0.82% | | | | 0.81% | | | | 0.82% | | | | 0.82% | | | | 0.82% | | | | 0.81% | |
| | | | | | |
Expenses net of waiver and payments by affiliatese | | | 0.81% | | | | 0.80% | | | | 0.80% | | | | 0.80% | | | | 0.79% | | | | 0.81%f | |
| | | | | | |
Net investment income | | | 3.73% | | | | 4.03% | | | | 3.98% | | | | 3.87% | | | | 4.12% | | | | 4.12% | |
| | | | | | |
| Supplemental data | | | | | | | | | | | | | | | | | | | | | | | | |
| | | | | | |
Net assets, end of period (000’s) | | | $278,008 | | | | $323,582 | | | | $294,700 | | | | $335,217 | | | | $309,935 | | | | $306,023 | |
| | | | | | |
Portfolio turnover rate | | | 20.53% | | | | 25.16% | | | | 43.22% | | | | 20.96% | | | | 39.03% | | | | 31.53% | |
aThe amount shown for a share outstanding throughout the period may not correlate with the Statement of Operations for the period due to the timing of sales and repurchases of the Fund’s shares in relation to income earned and/or fluctuating fair value of the investments of the Fund.
bBased on average daily shares outstanding.
cTotal return does not include fees, charges or expenses imposed by the variable annuity and life insurance contracts for which Franklin Templeton Variable Insurance Products Trust serves as an underlying investment vehicle. Total return is not annualized for periods less than one year.
dRatios are annualized for periods less than one year.
eBenefit of expense reduction rounds to less than 0.01%.
fBenefit of waiver and payments by affiliates rounds to less than 0.01%.
| | | | |
| | | |
| FI-8 | | Semiannual Report | The accompanying notes are an integral part of these financial statements. | | |
FRANKLIN TEMPLETON VARIABLE INSURANCE PRODUCTS TRUST
Statement of Investments, June 30, 2020 (unaudited)
Franklin Income VIP Fund
| | | | | | | | | | | | | | |
| | | | |
| | | | | Country | | | Shares | | | Value | |
| | | | |
| | Common Stocks 36.6% | | | | | | | | | | | | |
| | | Communication Services 2.9% | | | | | | | | | |
| a | | Alphabet Inc., A | | | United States | | | | 10,000 | | | $ | 14,180,500 | |
| | BCE Inc. | | | Canada | | | | 466,000 | | | | 19,435,689 | |
| | Comcast Corp., A | | | United States | | | | 500,000 | | | | 19,490,000 | |
| | Verizon Communications Inc. | | | United States | | | | 1,200,000 | | | | 66,156,000 | |
| | | | | | | | | | | | | | |
| | | | |
| | | | | | | | | | | | | 119,262,189 | |
| | | | | | | | | | | | | | |
| | | Consumer Discretionary 0.6% | | | | | | | | | |
| | General Motors Co. | | | United States | | | | 1,000,000 | | | | 25,300,000 | |
| | | | | | | | | | | | | | |
| | | | |
| | Consumer Staples 3.8% | | | | | | | | | | | | |
| | The Coca-Cola Co. | | | United States | | | | 675,000 | | | | 30,159,000 | |
| | PepsiCo Inc. | | | United States | | | | 300,000 | | | | 39,678,000 | |
| | Philip Morris International Inc. | | | United States | | | | 350,000 | | | | 24,521,000 | |
| | The Procter & Gamble Co. | | | United States | | | | 500,000 | | | | 59,785,000 | |
| | | | | | | | | | | | | | |
| | | | |
| | | | | | | | | | | | | 154,143,000 | |
| | | | | | | | | | | | | | |
| | | Energy 3.4% | | | | | | | | | |
| | BP PLC,ADR | | | United Kingdom | | | | 850,000 | | | | 19,822,000 | |
| | Chevron Corp. | | | United States | | | | 500,000 | | | | 44,615,000 | |
| | Exxon Mobil Corp. | | | United States | | | | 1,000,000 | | | | 44,720,000 | |
| | Royal Dutch Shell PLC, A, ADR | | | United Kingdom | | | | 900,000 | | | | 29,421,000 | |
| a | | Weatherford International PLC | | | United States | | | | 931,735 | | | | 1,835,518 | |
| | | | | | | | | | | | | | |
| | | | |
| | | | | | | | | | | | | 140,413,518 | |
| | | | | | | | | | | | | | |
| | Financials 5.3% | | | | | | | | | | | | |
| | Bank of America Corp. | | | United States | | | | 365,000 | | | | 8,668,750 | |
| | Barclays PLC | | | United Kingdom | | | | 12,500,000 | | | | 17,634,270 | |
| | Citigroup Inc. | | | United States | | | | 200,000 | | | | 10,220,000 | |
| | JPMorgan Chase & Co. | | | United States | | | | 600,000 | | | | 56,436,000 | |
| | MetLife Inc. | | | United States | | | | 535,108 | | | | 19,542,144 | |
| | Morgan Stanley | | | United States | | | | 435,000 | | | | 21,010,500 | |
| | Truist Financial Corp. | | | United States | | | | 500,000 | | | | 18,775,000 | |
| | U.S. Bancorp | | | United States | | | | 550,000 | | | | 20,251,000 | |
| | Wells Fargo & Co. | | | United States | | | | 1,665,000 | | | | 42,624,000 | |
| | | | | | | | | | | | | | |
| | | | |
| | | | | | | | | | | | | 215,161,664 | |
| | | | | | | | | | | | | | |
| | Health Care 7.3% | | | | | | | | | | | | |
| | AbbVie Inc. | | | United States | | | | 250,000 | | | | 24,545,000 | |
| | AstraZeneca PLC | | | United Kingdom | | | | 455,000 | | | | 47,351,924 | |
| | Bayer AG | | | Germany | | | | 311,750 | | | | 23,105,946 | |
| | Bristol-Myers Squibb Co. | | | United States | | | | 1,000,000 | | | | 58,800,000 | |
| | CVS Health Corp. | | | United States | | | | 520,000 | | | | 33,784,400 | |
| | Johnson & Johnson | | | United States | | | | 300,000 | | | | 42,189,000 | |
| | Merck & Co. Inc. | | | United States | | | | 400,000 | | | | 30,932,000 | |
| | Pfizer Inc. | | | United States | | | | 1,100,000 | | | | 35,970,000 | |
| | | | | | | | | | | | | | |
| | | | |
| | | | | | | | | | | | | 296,678,270 | |
| | | | | | | | | | | | | | |
| | | Industrials 2.6% | | | | | | | | | |
| | Cummins Inc. | | | United States | | | | 100,000 | | | | 17,326,000 | |
| | Honeywell International Inc. | | | United States | | | | 275,000 | | | | 39,762,250 | |
| | Union Pacific Corp. | | | United States | | | | 150,000 | | | | 25,360,500 | |
FRANKLIN TEMPLETON VARIABLE INSURANCE PRODUCTS TRUST
STATEMENT OF INVESTMENTS (UNAUDITED)
Franklin Income VIP Fund (continued)
| | | | | | | | | | | | | | |
| | | | |
| | | | | Country | | | Shares | | | Value | |
| | | | |
| | Common Stocks (continued) | | | | | | | | | | | | |
| | Industrials (continued) | | | | | | | | | | | | |
| | United Parcel Service Inc., B | | | United States | | | | 217,700 | | | $ | 24,203,886 | |
| | | | | | | | | | | | | | |
| | | | |
| | | | | | | | | | | | | 106,652,636 | |
| | | | | | | | | | | | | | |
| | Information Technology 2.7% | | | | | | | | | | | | |
| | Analog Devices Inc. | | | United States | | | | 260,045 | | | | 31,891,919 | |
| | Intel Corp. | | | United States | | | | 414,307 | | | | 24,787,988 | |
| | Oracle Corp. | | | United States | | | | 38,400 | | | | 2,122,368 | |
| | Texas Instruments Inc. | | | United States | | | | 400,000 | | | | 50,788,000 | |
| | | | | | | | | | | | | | |
| | | | |
| | | | | | | | | | | | | 109,590,275 | |
| | | | | | | | | | | | | | |
| | Materials 2.2% | | | | | | | | | | | | |
| | Air Products and Chemicals Inc. | | | United States | | | | 46,700 | | | | 11,276,182 | |
| | BASF SE | | | Germany | | | | 600,000 | | | | 33,698,578 | |
| | Rio Tinto PLC, ADR | | | Australia | | | | 800,000 | | | | 44,944,000 | |
| | | | | | | | | | | | | | |
| | | | |
| | | | | | | | | | | | | 89,918,760 | |
| | | | | | | | | | | | | | |
| | Real Estate 0.3% | | | | | | | | | | | | |
| | Host Hotels & Resorts Inc. | | | United States | | | | 1,000,000 | | | | 10,790,000 | |
| | | | | | | | | | | | | | |
| | | | |
| | Utilities 5.5% | | | | | | | | | | | | |
| | Dominion Energy Inc. | | | United States | | | | 906,638 | | | | 73,600,873 | |
| | DTE Energy Co. | | | United States | | | | 100,000 | | | | 10,750,000 | |
| | Duke Energy Corp. | | | United States | | | | 577,500 | | | | 46,136,475 | |
| | Sempra Energy | | | United States | | | | 275,000 | | | | 32,238,250 | |
| | The Southern Co. | | | United States | | | | 1,200,000 | | | | 62,220,000 | |
| | | | | | | | | | | | | | |
| | | | |
| | | | | | | | | | | | | 224,945,598 | |
| | | | | | | | | | | | | | |
| | | | |
| | Total Common Stocks (Cost $1,324,967,991) | | | | | | | | | | | 1,492,855,910 | |
| | | | | | | | | | | | | | |
| | | | |
| b | | Equity-Linked Securities 11.5% | | | | | | | | | | | | |
| | Communication Services 0.4% | | | | | | | | | | | | |
| c | | Barclays Bank PLC into Comcast Corp., 9.00%, 144A | | | United States | | | | 408,000 | | | | 16,182,873 | |
| | | | | | | | | | | | | | |
| | | | |
| | Consumer Discretionary 1.6% | | | | | | | | | | | | |
| c | | JPMorgan Chase Bank NA into Target Corp., 9.00%, 144A | | | United States | | | | 250,000 | | | | 28,653,767 | |
| c | | Royal Bank of Canada into The Home Depot Inc., 8.50%, 144A | | | United States | | | | 151,500 | | | | 34,828,237 | |
| | | | | | | | | | | | | | |
| | | | |
| | | | | | | | | | | | | 63,482,004 | |
| | | | | | | | | | | | | | |
| | Energy 0.2% | | | | | | | | | | | | |
| c | | Societe Generale SA into Schlumberger Ltd., 9.00%, 144A | | | United States | | | | 429,000 | | | | 8,893,806 | |
| | | | | | | | | | | | | | |
| | | | |
| | Financials 1.6% | | | | | | | | | | | | |
| c | | Barclays Bank PLC into Bank of America Corp., 8.50%, 144A | | | United States | | | | 600,000 | | | | 14,837,176 | |
| c | | Merrill Lynch International & Co. CV into Wells Fargo &Co., 8.00%, 144A | | | United States | | | | 775,000 | | | | 21,165,026 | |
| c | | UBS AG London into MetLife Inc., 7.50%, 144A | | | United States | | | | 800,000 | | | | 30,256,089 | |
| | | | | | | | | | | | | | |
| | | | | | | | | | | | | 66,258,291 | |
| | | | | | | | | | | | | | |
| | Health Care 0.6% | | | | | | | | | | | | |
| c | | UBS AG London into CVS Health Corp., 8.50%, 144A | | | United States | | | | 400,000 | | | | 25,627,569 | |
| | | | | | | | | | | | | | |
| | | | |
| | Industrials 0.8% | | | | | | | | | | | | |
| c | | Societe Generale SA into Raytheon Technologies Corp., 8.00%, 144A | | | United States | | | | 548,000 | | | | 33,642,740 | |
| | | | | | | | | | | | | | |
FRANKLIN TEMPLETON VARIABLE INSURANCE PRODUCTS TRUST
STATEMENT OF INVESTMENTS (UNAUDITED)
Franklin Income VIP Fund (continued)
| | | | | | | | | | | | | | |
| | | | |
| | | | | Country | | | Shares | | | Value | |
| | | | |
| b | | Equity-Linked Securities (continued) | | | | | | | | | | | | |
| | | Information Technology 6.3% | | | | | | | | | |
| c | | Credit Suisse AG/London into International Business Machines Corp., 7.50%, 144A | | | United States | | | | 160,000 | | | $ | 19,849,631 | |
| c | | Credit Suisse AG/London into Cisco Systems Inc., 10.00%, 144A | | | United States | | | | 508,000 | | | | 23,604,731 | |
| c | | JPMorgan Chase Bank NA into Apple Inc., 7.00%, 144A | | | United States | | | | 450,000 | | | | 101,792,321 | |
| c | | Royal Bank of Canada into Intel Corp., 8.00%, 144A | | | United States | | | | 1,100,000 | | | | 59,115,202 | |
| c | | UBS AG London into Texas Instruments Inc., 8.50%, 144A | | | United States | | | | 400,000 | | | | 50,958,735 | |
| | | | | | | | | | | | | | |
| | | | |
| | | | | | | | | | | | | 255,320,620 | |
| | | | | | | | | | | | | | |
| | Total Equity-Linked Securities (Cost $481,232,090) | | | | | | | | | | | 469,407,903 | |
| | | | | | | | | | | | | | |
| | | | |
| | Convertible Preferred Stocks 3.1% | | | | | | | | | | | | |
| | | | |
| | Communication Services 0.1% | | | | | | | | | | | | |
| a,c | | 2020 Cash Mandatory Exchangeable Trust, 5.25%, cvt. pfd., 144A | | | United States | | | | 5,000 | | | | 5,112,750 | |
| | | | | | | | | | | | | | |
| | | | |
| | Financials 0.4% | | | | | | | | | | | | |
| | Bank of America Corp., 7.25%, cvt. pfd., L | | | United States | | | | 4,666 | | | | 6,262,705 | |
| a | | FNMA, 5.375%, cvt. pfd | | | United States | | | | 475 | | | | 11,162,500 | |
| | | | | | | | | | | | | | |
| | | | |
| | | | | | | | | | | | | 17,425,205 | |
| | | | | | | | | | | | | | |
| | Information Technology 1.4% | | | | | | | | | | | | |
| | Broadcom Inc., 8.00%, cvt. pfd., A | | | United States | | | | 50,000 | | | | 55,717,500 | |
| | | | | | | | | | | | | | |
| | | | |
| | | Utilities 1.2% | | | | | | | | | |
| | NextEra Energy Inc., 5.279%, cvt. pfd | | | United States | | | | 400,000 | | | | 16,980,000 | |
| | Sempra Energy, 6.75%, cvt. pfd., B | | | United States | | | | 200,000 | | | | 19,652,000 | |
| | The Southern Co., 6.75%, cvt. pfd | | | United States | | | | 280,000 | | | | 12,336,800 | |
| | | | | | | | | | | | | | |
| | | | |
| | | | | | | | | | | | | 48,968,800 | |
| | | | | | | | | | | | | | |
| | | | |
| | Total Convertible Preferred Stocks (Cost $146,617,041) | | | | | | | | | | | 127,224,255 | |
| | | | | | | | | | | | | | |
| | | | |
| | Preferred Stocks (Cost $9,900,000) 0.3% | | | | | | | | | | | | |
| | Financials 0.3% | | | | | | | | | | | | |
| d | | JPMorgan Chase & Co., 6.00%, pfd., EE | | | United States | | | | 396,000 | | | | 10,850,400 | |
| | | | | | | | | | | | | | |
| | | | |
| | | | | | | |
| Principal
Amount |
* | | | | |
| | | | |
| | Convertible Bonds (Cost $7,887,235) 0.3% | | | | | | | | | | | | |
| | | Industrials 0.3% | | | | | | | | | |
| | Southwest Airlines Co., cvt., senior note, 1.25%, 5/01/25 | | | United States | | | $ | 8,500,000 | | | | 10,251,264 | |
| | | | | | | | | | | | | | |
| | | | |
| | Corporate Bonds 32.9% | | | | | | | | | | | | |
| | Communication Services 5.5% | | | | | | | | | | | | |
| | AT&T Inc., senior bond, 4.125%, 2/17/26 | | | United States | | | | 12,000,000 | | | | 13,685,241 | |
| c | | CCO Holdings LLC/CCO Holdings Capital Corp., senior bond, 144A, 5.50%, 5/01/26 | | | United States | | | | 10,000,000 | | | | 10,385,950 | |
| c | | Diamond Sports Group LLC/Diamond Sports Finance Co., first lien, 144A, 5.375%, 8/15/26 | | | United States | | | | 11,000,000 | | | | 8,029,120 | |
| | DISH DBS Corp., | | | | | | | | | | | | |
| | senior bond, 5.875%, 7/15/22 | | | United States | | | | 27,000,000 | | | | 27,513,675 | |
| | senior bond, 5.00%, 3/15/23 | | | United States | | | | 21,000,000 | | | | 20,979,315 | |
| | senior note, 5.875%, 11/15/24 | | | United States | | | | 9,400,000 | | | | 9,360,379 | |
FRANKLIN TEMPLETON VARIABLE INSURANCE PRODUCTS TRUST
STATEMENT OF INVESTMENTS (UNAUDITED)
Franklin Income VIP Fund (continued)
| | | | | | | | | | | | | | |
| | | | |
| | | | | Country | | | Principal
Amount* | | | Value | |
| | Corporate Bonds (continued) | | | | | | | | | | | | |
| | | Communication Services (continued) | | | | | | | | | |
| | Netflix Inc., senior bond, 4.875%, 4/15/28 | | | United States | | | $ | 22,000,000 | | | $ | 23,559,800 | |
| | Sprint Communications Inc., | | | | | | | | | | | | |
| | senior bond, 11.50%, 11/15/21 | | | United States | | | | 30,000,000 | | | | 33,293,250 | |
| | senior note, 7.00%, 8/15/20 | | | United States | | | | 7,500,000 | | | | 7,542,975 | |
| | senior note, 6.00%, 11/15/22 | | | United States | | | | 6,300,000 | | | | 6,653,525 | |
| | Sprint Corp., | | | | | | | | | | | | |
| | senior bond, 7.875%, 9/15/23 | | | United States | | | | 12,500,000 | | | | 14,093,687 | |
| | senior bond, 7.125%, 6/15/24 | | | United States | | | | 8,200,000 | | | | 9,273,708 | |
| | senior note, 7.625%, 3/01/26 | | | United States | | | | 7,500,000 | | | | 8,870,137 | |
| c | | Univision Communications Inc., | | | | | | | | | | | | |
| | senior note, 144A, 6.625%, 6/01/27 | | | United States | | | | 8,500,000 | | | | 8,149,375 | |
| | senior secured note, first lien, 144A, 5.125%, 5/15/23 | | | United States | | | | 15,000,000 | | | | 15,182,775 | |
| | senior secured note, first lien, 144A, 5.125%, 2/15/25 | | | United States | | | | 7,140,000 | | | | 6,747,336 | |
| | | | | | | | | | | | | | |
| | | | |
| | | | | | | | | | | | | 223,320,248 | |
| | | | | | | | | | | | | | |
| | | Consumer Discretionary 2.5% | | | | | | | | | |
| c,e | | Colt Merger Sub Inc., senior secured note, 144A, 6.25%, 7/01/25 | | | United States | | | | 18,000,000 | | | | 17,904,600 | |
| | Ford Motor Co., senior note, 4.346%, 12/08/26 | | | United States | | | | 13,500,000 | | | | 12,633,840 | |
| | Ford Motor Credit Co. LLC, senior note, 5.125%, 6/16/25 | | | United States | | | | 20,000,000 | | | | 20,095,600 | |
| | General Motors Co., | | | | | | | | | | | | |
| | senior bond, 5.15%, 4/01/38 | | | United States | | | | 16,000,000 | | | | 15,348,908 | |
| | senior note, 6.125%, 10/01/25 | | | United States | | | | 2,100,000 | | | | 2,362,630 | |
| c | | Golden Nugget Inc., senior note, 144A, 6.75%, 10/15/24 | | | United States | | | | 5,000,000 | | | | 3,600,000 | |
| c | | Shea Homes LP/Shea Homes Funding Corp., senior bond, 144A, 6.125%, 4/01/25 | | | United States | | | | 9,580,000 | | | | 9,662,819 | |
| c | | Wynn Las Vegas LLC/Wynn Las Vegas Capital Corp., | | | | | | | | | | | | |
| | senior bond, 144A, 5.50%, 3/01/25 | | | United States | | | | 13,200,000 | | | | 12,120,174 | |
| | senior bond, 144A, 5.25%, 5/15/27 | | | United States | | | | 10,000,000 | | | | 8,666,300 | |
| | | | | | | | | | | | | | |
| | | | |
| | | | | | | | | | | | | 102,394,871 | |
| | | | | | | | | | | | | | |
| | | Consumer Staples 1.3% | | | | | | | | | |
| | BAT Capital Corp., | | | | | | | | | | | | |
| | senior note, 3.222%, 8/15/24 | | | United Kingdom | | | | 10,000,000 | | | | 10,721,391 | |
| | senior note, 3.557%, 8/15/27 | | | United Kingdom | | | | 20,000,000 | | | | 21,653,390 | |
| | Kraft Heinz Foods Co., senior bond, 4.625%, 1/30/29 | | | United States | | | | 10,600,000 | | | | 11,432,478 | |
| c | | Post Holdings Inc., | | | | | | | | | | | | |
| | senior bond, 144A, 5.00%, 8/15/26 | | | United States | | | | 7,500,000 | | | | 7,542,562 | |
| | senior bond, 144A, 5.625%, 1/15/28 | | | United States | | | | 2,500,000 | | | | 2,593,288 | |
| | | | | | | | | | | | | | |
| | | | |
| | | | | | | | | | | | | 53,943,109 | |
| | | | | | | | | | | | | | |
| | | Energy 2.7% | | | | | | | | | |
| | Calumet Specialty Products Partners LP/Calumet Finance Corp., | | | | | | | | | | | | |
| | senior note, 7.625%, 1/15/22 | | | United States | | | | 8,000,000 | | | | 7,668,120 | |
| | senior note, 7.75%, 4/15/23 | | | United States | | | | 2,000,000 | | | | 1,867,290 | |
| c | | senior note, 144A, 11.00%, 4/15/25 | | | United States | | | | 30,000,000 | | | | 29,174,700 | |
| | HighPoint Operating Corp., | | | | | | | | | | | | |
| | senior bond, 7.00%, 10/15/22 | | | United States | | | | 17,937,000 | | | | 4,367,928 | |
| | senior note, 8.75%, 6/15/25 | | | United States | | | | 26,600,000 | | | | 6,517,000 | |
FRANKLIN TEMPLETON VARIABLE INSURANCE PRODUCTS TRUST
STATEMENT OF INVESTMENTS (UNAUDITED)
Franklin Income VIP Fund (continued)
| | | | | | | | | | | | | | |
| | | | |
| | | | | Country | | | Principal
Amount* | | | Value | |
| | Corporate Bonds (continued) | | | | | | | | | | | | |
| | | Energy (continued) | | | | | | | | | |
| | Kinder Morgan Inc., senior bond, 7.75%, 1/15/32 | | | United States | | | $ | 21,000,000 | | | $ | 29,376,920 | |
| e | | Occidental Petroleum Corp., senior note, 8.00%, 7/15/25 | | | United States | | | | 5,000,000 | | | | 5,031,250 | |
| c | | Weatherford International Ltd., senior note, 144A, 11.00%, 12/01/24 | | | United States | | | | 39,344,000 | | | | 27,540,800 | |
| | | | | | | | | | | | | | |
| | | | |
| | | | | | | | | | | 111,544,008 | |
| | | | | | | | | | | | | | |
| | Financials 3.4% | | | | | | | | | | | | |
| | Bank of America Corp., | | | | | | | | | | | | |
| | f junior sub. bond, AA, 6.10% to 3/17/25, FRN thereafter, Perpetual | | | United States | | | | 8,000,000 | | | | 8,445,560 | |
| | f junior sub. bond, X, 6.25% to 9/05/24, FRN thereafter, Perpetual | | | United States | | | | 6,000,000 | | | | 6,222,462 | |
| | senior bond, 3.419% to 12/20/27, FRN thereafter, 12/20/28 | | | United States | | | | 10,000,000 | | | | 11,143,800 | |
| | Capital One Financial Corp., senior sub. note, 4.20%, 10/29/25 | | | United States | | | | 15,500,000 | | | | 17,220,496 | |
| | Citigroup Inc., sub. bond, 4.125%, 7/25/28 | | | United States | | | | 18,500,000 | | | | 20,923,152 | |
| | The Goldman Sachs Group Inc., senior note, 3.272% to 9/29/24, FRN thereafter, 9/29/25 | | | United States | | | | 15,500,000 | | | | 16,719,883 | |
| | HSBC Holdings PLC, senior note, 4.292% to 9/12/25, FRN thereafter, 9/12/26 | | | United Kingdom | | | | 18,500,000 | | | | 20,603,178 | |
| f | | JPMorgan Chase & Co., | | | | | | | | | | | | |
| | g junior sub. bond, FRN, 4.23%, (3-month USD LIBOR + 3.47%), Perpetual | | | United States | | | | 19,559,000 | | | | 17,842,480 | |
| | junior sub. bond, R, 6.00% to 8/01/23, FRN thereafter, Perpetual | | | United States | | | | 3,200,000 | | | | 3,234,133 | |
| f | | Morgan Stanley, junior sub. bond, 5.55% to 7/15/20, FRN thereafter, Perpetual | | | United States | | | | 2,064,000 | | | | 1,897,233 | |
| | Prudential Financial Inc., junior sub. bond, 5.70% to 9/15/28, FRN thereafter, 9/15/48 | | | United States | | | | 5,000,000 | | | | 5,620,538 | |
| f | | Wells Fargo & Co., junior sub. bond, S, 5.90% to 6/15/24, FRN thereafter, Perpetual | | | United States | | | | 6,600,000 | | | | 6,553,943 | |
| | | | | | | | | | | | | | |
| | | | |
| | | | | | | | | | | 136,426,858 | |
| | | | | | | | | | | | | | |
| | Health Care 13.6% | | | | | | | | | | | | |
| c | | AbbVie Inc., senior bond, 144A, 3.80%, 3/15/25 | | | United States | | | | 17,000,000 | | | | 18,975,228 | |
| c | | Bausch Health Cos. Inc., | | | | | | | | | | | | |
| | senior bond, 144A, 6.125%, 4/15/25 | | | United States | | | | 9,400,000 | | | | 9,547,392 | |
| | senior note, 144A, 5.50%, 3/01/23 | | | United States | | | | 11,270,000 | | | | 11,243,008 | |
| | senior note, 144A, 5.875%, 5/15/23 | | | United States | | | | 1,950,000 | | | | 1,946,646 | |
| | senior note, 144A, 9.00%, 12/15/25 | | | United States | | | | 5,000,000 | | | | 5,392,050 | |
| | senior note, first lien, 144A, 7.00%, 3/15/24 | | | United States | | | | 4,500,000 | | | | 4,678,065 | |
| | senior secured note, first lien, 144A, 5.50%, 11/01/25 | | | United States | | | | 35,000,000 | | | | 35,807,100 | |
| c | | Bayer U.S. Finance II LLC, senior note, 144A, 4.25%, 12/15/25 | | | Germany | | | | 15,000,000 | | | | 17,246,445 | |
| c | | Bristol-Myers Squibb Co., senior bond, 144A, 3.40%, 7/26/29 | | | United States | | | | 8,000,000 | | | | 9,331,230 | |
| c | | CHS/Community Health Systems Inc., | | | | | | | | | | | | |
| | senior note, 144A, 9.875%, 6/30/23 | | | United States | | | | 94,701,000 | | | | 74,017,828 | |
| | senior note, 144A, 8.125%, 6/30/24 | | | United States | | | | 49,344,000 | | | | 33,214,187 | |
| | senior note, 144A, 8.00%, 12/15/27 | | | United States | | | | 32,000,000 | | | | 30,666,720 | |
| | senior note, 144A, 6.875%, 4/01/28 | | | United States | | | | 91,000,000 | | | | 34,068,125 | |
| | senior secured note, 144A, 6.625%, 2/15/25 | | | United States | | | | 39,000,000 | | | | 36,757,500 | |
| | senior secured note, 144A, 8.00%, 3/15/26 | | | United States | | | | 12,500,000 | | | | 11,827,500 | |
| | Cigna Corp., senior note, 3.75%, 7/15/23 | | | United States | | | | 13,292,000 | | | | 14,438,833 | |
| | CVS Health Corp., | | | | | | | | | | | | |
| | senior bond, 4.30%, 3/25/28 | | | United States | | | | 8,000,000 | | | | 9,358,823 | |
| | senior bond, 5.05%, 3/25/48 | | | United States | | | | 3,900,000 | | | | 5,081,297 | |
| | senior note, 4.10%, 3/25/25 | | | United States | | | | 5,100,000 | | | | 5,768,787 | |
FRANKLIN TEMPLETON VARIABLE INSURANCE PRODUCTS TRUST
STATEMENT OF INVESTMENTS (UNAUDITED)
Franklin Income VIP Fund (continued)
| | | | | | | | | | | | | | |
| | | | |
| | | | | Country | | | Principal
Amount* | | | Value | |
| | Corporate Bonds (continued) | | | | | | | | | | | | |
| | | Health Care (continued) | | | | | | | | | |
| | DaVita Inc., | | | | | | | | | | | | |
| | senior bond, 5.125%, 7/15/24 | | | United States | | | $ | 5,000,000 | | | $ | 5,092,500 | |
| | senior bond, 5.00%, 5/01/25 | | | United States | | | | 4,000,000 | | | | 4,094,000 | |
| c | | Endo Dac/Endo Finance LLC/Endo Finco Inc., | | | | | | | | | | | | |
| | secured note, second lien, 144A, 9.50%, 7/31/27 | | | United States | | | | 5,273,000 | | | | 5,603,617 | |
| | senior note, 144A, 6.00%, 6/30/28 | | | United States | | | | 7,094,000 | | | | 4,611,100 | |
| | HCA Inc., | | | | | | | | | | | | |
| | senior bond, 5.875%, 5/01/23 | | | United States | | | | 7,500,000 | | | | 8,129,850 | |
| | senior secured note, first lien, 5.00%, 3/15/24 | | | United States | | | | 10,400,000 | | | | 11,571,452 | |
| c | | Mallinckrodt International Finance SA, first lien, senior note, 144A, 10.00%, 4/15/25 | | | United States | | | | 2,500,000 | | | | 2,118,750 | |
| c | | Mallinckrodt International Finance SA/Mallinckrodt CB LLC, | | | | | | | | | | | | |
| | senior note, 144A, 5.75%, 8/01/22 | | | United States | | | | 12,100,000 | | | | 3,055,250 | |
| | senior note, 144A, 5.50%, 4/15/25 | | | United States | | | | 7,600,000 | | | | 1,277,750 | |
| | Mylan NV, senior note, 3.95%, 6/15/26 | | | United States | | | | 10,000,000 | | | | 11,189,159 | |
| c | | Par Pharmaceutical Inc., senior secured note, 144A, 7.50%, 4/01/27 | | | United States | | | | 8,429,000 | | | | 8,678,035 | |
| | Tenet Healthcare Corp., | | | | | | | | | | | | |
| | secured note, second lien, 5.125%, 5/01/25 | | | United States | | | | 2,500,000 | | | | 2,415,525 | |
| | senior note, 8.125%, 4/01/22 | | | United States | | | | 30,000,000 | | | | 31,554,000 | |
| | senior note, 6.75%, 6/15/23 | | | United States | | | | 58,200,000 | | | | 57,821,700 | |
| | c senior note, second lien, 144A, 6.25%, 2/01/27 | | | United States | | | | 29,000,000 | | | | 28,872,980 | |
| | | | | | | | | | | | | | |
| | | | |
| | | | | | | | | | | | | 555,452,432 | |
| | | | | | | | | | | | | | |
| | Industrials 1.3% | | | | | | | | | | | | |
| c | | Ashtead Capital Inc., second lien, 144A, 4.25%, 11/01/29 | | | United Kingdom | | | | 4,500,000 | | | | 4,511,250 | |
| | Raytheon Technologies Corp., senior note, 3.95%, 8/16/25 | | | United States | | | | 15,000,000 | | | | 17,138,389 | |
| | United Rentals North America Inc., senior bond, 4.875%, 1/15/28 | | | United States | | | | 18,000,000 | | | | 18,478,170 | |
| c | | WESCO Distribution Inc., senior note, 144A, 7.125%, 6/15/25 | | | United States | | | | 14,000,000 | | | | 14,800,800 | |
| | | | | | | | | | | | | | |
| | | | |
| | | | | | | | | | | | | 54,928,609 | |
| | | | | | | | | | | | | | |
| | Information Technology 0.3% | | | | | | | | | | | | |
| c | | CommScope Inc., senior bond, 144A, 5.50%, 6/15/24 | | | United States | | | | 10,000,000 | | | | 10,183,300 | |
| | | | | | | | | | | | | | |
| | Materials 1.3% | | | | | | | | | | | | |
| c | | Cemex Finance LLC, senior secured note, first lien, 144A, 6.00%, 4/01/24 | | | Mexico | | | | 9,665,000 | | | | 9,595,509 | |
| c | | Cleveland-Cliffs Inc., senior secured note, 144A, 6.75%, 3/15/26 | | | United States | | | | 5,000,000 | | | | 4,837,500 | |
| c | | FMG Resources (August 2006) Pty. Ltd., senior note, 144A, 5.125%, 5/15/24 | | | Australia | | | | 6,700,000 | | | | 6,918,453 | |
| c | | Mauser Packaging Solutions Holding Co., | | | | | | | | | | | | |
| | secured note, 144A, 5.50%, 4/15/24 | | | United States | | | | 10,000,000 | | | | 9,843,625 | |
| | senior note, 144A, 7.25%, 4/15/25 | | | United States | | | | 23,000,000 | | | | 20,924,020 | |
| | | | | | | | | | | | | | |
| | | | |
| | | | | | | | | | | | | 52,119,107 | |
| | | | | | | | | | | | | | |
| | | Real Estate 0.7% | | | | | | | | | |
| | Equinix Inc., senior bond, 5.375%, 5/15/27 | | | United States | | | | 11,000,000 | | | | 12,026,465 | |
| | Iron Mountain Inc., senior sub. bond, 5.75%, 8/15/24 | | | United States | | | | 16,000,000 | | | | 16,203,440 | |
| | | | | | | | | | | | | | |
| | | | | | | | | | | | | 28,229,905 | |
| | | | | | | | | | | | | | |
| | | Utilities 0.3% | | | | | | | | | |
| | Calpine Corp., senior note, 5.50%, 2/01/24 | | | United States | | | | 11,375,000 | | | | 11,410,433 | |
| | | | | | | | | | | | | | |
| | | | |
| | Total Corporate Bonds (Cost $1,392,803,100) | | | | | | | | | | | 1,339,952,880 | |
| | | | | | | | | | | | | | |
FRANKLIN TEMPLETON VARIABLE INSURANCE PRODUCTS TRUST
STATEMENT OF INVESTMENTS (UNAUDITED)
Franklin Income VIP Fund (continued)
| | | | | | | | | | | | | | |
| | | | |
| | | | | Country | | | Principal
Amount* | | | Value | |
| g,h | | Senior Floating Rate Interests (Cost $16,539,326) 0.2% | | | | | | | | | | | | |
| | | Consumer Discretionary 0.2% | | | | | | | | | |
| | Belk Inc., Term Loans, 7.75%, (3-month USD LIBOR + 6.75%), 7/31/25 | | | United States | | | $ | 17,575,134 | | | $ | 6,406,136 | |
| | | | | | | | | | | | | | |
| | | | |
| | U.S. Government and Agency Securities 4.5% | | | | | | | | | | | | |
| | U.S. Treasury Note, | | | | | | | | | | | | |
| | 2.375%, 3/15/21 | | | United States | | | | 75,000,000 | | | | 76,168,945 | |
| | 2.75%, 4/30/23 | | | United States | | | | 25,000,000 | | | | 26,817,871 | |
| | 2.75%, 5/31/23 | | | United States | | | | 50,000,000 | | | | 53,742,188 | |
| | 2.875%, 5/31/25 | | | United States | | | | 25,000,000 | | | | 28,154,785 | |
| | | | | | | | | | | | | | |
| | | | |
| | Total U.S. Government and Agency Securities
(Cost $174,892,363) | | | | | | | | | | | 184,883,789 | |
| | | | | | | | | | | | | | |
| | | | |
| | Mortgage-Backed Securities 4.5% | | | | | | | | | | | | |
| | Federal Home Loan Mortgage Corp. (FHLMC) Fixed Rate 0.2% | | | | | | | | | | | | |
| | FHLMC 30 Year, 4.00%, 5/01/49 - 10/01/49 | | | United States | | | | 7,169,412 | | | | 7,648,238 | |
| | | | | | | | | | | | | | |
| | | | |
| | Federal National Mortgage Association (FNMA) Fixed Rate 0.8% | | | | | | | | | | | | |
| | FNMA 30 Year, 3.00%, 7/01/50 | | | United States | | | | 4,980,000 | | | | 5,251,842 | |
| | FNMA 30 Year, 4.00%, 10/01/47 - 2/01/50 | | | United States | | | | 28,016,940 | | | | 29,837,235 | |
| | | | | | | | | | | | | | |
| | | | |
| | | | | | | | | | | 35,089,077 | |
| | | | | | | | | | | | | | |
| | Government National Mortgage Association (GNMA) Fixed Rate 3.5% | | | | | | | | | | | | |
| | GNMA II SF 30 Year, 3.50%, 1/20/50 | | | United States | | | | 23,888,979 | | | | 25,268,036 | |
| | GNMA II SF 30 Year, 3.50%, 6/20/50 | | | United States | | | | 66,530,000 | | | | 70,677,437 | |
| | GNMA II SF 30 Year, 4.00%, 9/20/49 - 12/20/49 | | | United States | | | | 32,169,715 | | | | 34,116,030 | |
| | GNMA II SF 30 Year, 4.00%, 1/20/50 | | | United States | | | | 11,693,863 | | | | 12,415,067 | |
| | | | | | | | | | | | | | |
| | | | |
| | | | | | | | | | | 142,476,570 | |
| | | | | | | | | | | | | | |
| | Total Mortgage-Backed Securities
(Cost $184,095,753) | | | | | | | | | | | 185,213,885 | |
| | | | | | | | | | | | | | |
| | | | |
| | | | | | | | Shares | | | | |
| | Escrows and Litigation Trusts (Cost $62,603) 0.0% | | | | | | | | | | | | |
| a,i | | Motors Liquidation Co., Escrow Account, cvt. pfd., C | | | United States | | | | 1,400,000 | | | | — | |
| | | | | | | | | | | | | | |
| | | | |
| | | | | Number of
Contracts | | | Notional
Amount# | | | | |
| | | | |
| | Options Purchased (Cost $19,402,038) 0.3% | | | | | | | | | | | | |
| | Puts - Exchange-Traded | | | | | | | | | | | | |
| | S&P 500 Index, September Strike Price $3,000.00, Expires 9/18/20 | | | 1,000 | | | | 100,000 | | | | 12,037,000 | |
| | | | | | | | | | | | | | |
| | | | |
| | Total Investments before Short Term Investments
(Cost $3,758,399,540) | | | | | | | | | | | 3,839,083,422 | |
| | | | | | | | | | | | | | |
| | | | |
| | | | | Country | | | Shares | | | | |
| | | | |
| | Short Term Investments 6.1% | | | | | | | | | | | | |
| | | | |
| | Money Market Funds (Cost $249,194,489) 6.1% | | | | | | | | | | | | |
| j,k | | Institutional Fiduciary Trust Money Market Portfolio, 0.00% | | | United States | | | | 249,194,489 | | | | 249,194,489 | |
| | | | | | | | | | | | | | |
FRANKLIN TEMPLETON VARIABLE INSURANCE PRODUCTS TRUST
STATEMENT OF INVESTMENTS (UNAUDITED)
Franklin Income VIP Fund (continued)
| | | | | | | | | | | | | | |
| | | | |
| | | | | Country | | | Shares | | | Value | |
| | Short Term Investments (continued) | | | | | | | | | | | | |
| | | | |
| l | | Investments from Cash Collateral Received for Loaned Securities 0.0%† | | | | | | | | | | | | |
| | | Money Market Funds (Cost $114,000) 0.0%† | | | | | | | | | |
| j,k | | Institutional Fiduciary Trust Money Market Portfolio, 0.00% | | | United States | | | | 114,000 | | | $ | 114,000 | |
| | | | | | | | | | | | | | |
| | | | |
| | | | | | | | Principal
Amount* | | | | |
| | | Repurchase Agreements (Cost $29,677) 0.0%† | | | | | | | | | |
| m | | Joint Repurchase Agreement, 0.07%, 7/01/20 (Maturity Value $29,677) | | | | | | | | | | | | |
| | BNP Paribas Securities Corp. | | | | | | | | | | | | |
| | Collateralized by U.S. Treasury Bonds, 7.875%, 2/15/21; U.S. Treasury Notes, 0.125% - 2.875%, 12/31/20 - 1/31/24; and U.S. Treasury Strips, 8/15/20 -11/15/22 (valued at $30,271) | | | United States | | | $ | 29,677 | | | | 29,677 | |
| | | | | | | | | | | | | | |
| | Total Investments from Cash Collateral Received for Loaned Securities (Cost $143,677) | | | | | | | | | | | 143,677 | |
| | | | | | | | | | | | | | |
| | | | |
| | Total Investments (Cost $4,007,737,706) 100.3% | | | | | | | | | | | 4,088,421,588 | |
| | Options Written (0.1)% | | | | | | | | | | | (3,991,000 | ) |
| | Other Assets, less Liabilities (0.2)% | | | | | | | | | | | (9,539,878 | ) |
| | | | | | | | | | | | | | |
| | Net Assets 100.0% | | | | | | | | | | $ | 4,074,890,710 | |
| | | | | | | | | | | | | | |
| | | | |
| | | | | Number of
Contracts | | | Notional
Amount# | | | | |
| n | | Options Written (Premiums received $6,297,961) (0.1)% | | | | | | | | | | | | |
| | | Puts - Exchange-Traded | | | | | | | | | |
| | S&P 500 Index, September Strike Price $2,600.00, Expires 9/18/20 | | | 1,000 | | | | 100,000 | | | | (3,991,000 | ) |
| | | | | | | | | | | | | | |
FRANKLIN TEMPLETON VARIABLE INSURANCE PRODUCTS TRUST
STATEMENT OF INVESTMENTS (UNAUDITED)
Franklin Income VIP Fund (continued)
See Abbreviations on page FI-31.
†Rounds to less than 0.1% of net assets.
*The principal amount is stated in U.S. dollars unless otherwise indicated.
#Notional amount is the number of units specified in the contract, and can include currency units, bushels, shares, pounds, barrels or other units. Currency units are stated in U.S. dollars unless otherwise indicated.
aNon-income producing.
bSee Note 1(f) regarding equity-linked securities.
cSecurity was purchased pursuant to Rule 144A under the Securities Act of 1933 and may be sold in transactions exempt from registration only to qualified institutional buyers or in a public offering registered under the Securities Act of 1933. At June 30, 2020, the aggregate value of these securities was $1,112,371,415, representing 27.3% of net assets.
dA portion or all of the security is on loan at June 30, 2020. See Note 1(g).
eSecurity purchased on a when-issued basis. See Note 1(d).
fPerpetual security with no stated maturity date.
gThe coupon rate shown represents the rate at period end.
hSee Note 1(h) regarding senior floating rate interests.
iFair valued using significant unobservable inputs. See Note 11 regarding fair value measurements.
jSee Note 3(e) regarding investments in affiliated management investment companies.
kThe rate shown is the annualized seven-day effective yield at period end.
lSee Note 1(g) regarding securities on loan.
mSee Note 1(c) regarding joint repurchase agreement.
nSee Note 1(e) regarding written options.
| | | | | | |
| | | |
| | The accompanying notes are an integral part of these financial statements. | Semiannual Report | | | FI-17 | |
FRANKLIN TEMPLETON VARIABLE INSURANCE PRODUCTS TRUST
NOTES TO FINANCIAL STATEMENTS (UNAUDITED)
Statement of Assets and Liabilities
June 30, 2020 (unaudited)
| | | | |
| |
| | | Franklin Income VIP Fund | |
| |
Assets: | | | | |
Investments in securities: | | | | |
Cost - Unaffiliated issuers | | $ | 3,758,399,540 | |
Cost - Non-controlled affiliates (Note 3e) | | | 249,308,489 | |
Cost - Unaffiliated repurchase agreements | | | 29,677 | |
| | | | |
Value - Unaffiliated issuers+ | | $ | 3,839,083,422 | |
Value - Non-controlled affiliates (Note 3e) | | | 249,308,489 | |
Value - Unaffiliated repurchase agreements | | | 29,677 | |
Cash | | | 4,675,862 | |
Receivables: | | | | |
Investment securities sold | | | 213,058 | |
Capital shares sold | | | 1,515,795 | |
Dividends and interest | | | 21,945,631 | |
Other assets | | | 3,878 | |
| | | | |
Total assets | | | 4,116,775,812 | |
| | | | |
Liabilities: | | | | |
Payables: | | | | |
Investment securities purchased | | | 33,547,935 | |
Capital shares redeemed | | | 1,425,480 | |
Management fees | | | 1,497,626 | |
Distribution fees | | | 819,511 | |
Trustees’ fees and expenses | | | 2,324 | |
Options written, at value (premiums received $6,297,961) | | | 3,991,000 | |
Payable upon return of securities loaned | | | 143,677 | |
Accrued expenses and other liabilities | | | 457,549 | |
| | | | |
Total liabilities | | | 41,885,102 | |
| | | | |
Net assets, at value | | $ | 4,074,890,710 | |
| | | | |
Net assets consist of: | | | | |
Paid-in capital | | $ | 4,254,277,890 | |
Total distributable earnings (losses) | | | (179,387,180 | ) |
| | | | |
Net assets, at value | | $ | 4,074,890,710 | |
| | | | |
| |
| Class 1: | | | | |
Net assets, at value | | $ | 269,045,044 | |
| | | | |
Shares outstanding | | | 19,555,215 | |
| | | | |
| |
Net asset value and maximum offering price per share | | | $13.76 | |
| | | | |
| |
| Class 2: | | | | |
Net assets, at value | | $ | 3,527,837,470 | |
| | | | |
Shares outstanding | | | 266,422,343 | |
| | | | |
Net asset value and maximum offering price per share | | | $13.24 | |
| | | | |
| |
| Class 4: | | | | |
Net assets, at value | | $ | 278,008,196 | |
| | | | |
Shares outstanding | | | 20,433,394 | |
| | | | |
Net asset value and maximum offering price per share | | | $13.61 | |
| | | | |
| |
+Includes securities loaned | | $ | 139,740 | |
| | | | |
| | | | |
| | | |
| FI-18 | | Semiannual Report | The accompanying notes are an integral part of these financial statements. | | |
FRANKLIN TEMPLETON VARIABLE INSURANCE PRODUCTS TRUST
NOTES TO FINANCIAL STATEMENTS (UNAUDITED)
Statement of Operations
for the six months ended June 30, 2020 (unaudited)
| | | | |
| |
| | | Franklin Income VIP Fund | |
| |
Investment income: | | | | |
Dividends:(net of foreign taxes)* | | | | |
Unaffiliated issuers | | | $ 36,052,149 | |
Non-controlled affiliates (Note 3e) | | | 359,942 | |
Interest: | | | | |
Unaffiliated issuers | | | 61,535,391 | |
Income from securities loaned: | | | | |
Unaffiliated entities (net of fees and rebates) | | | 26,259 | |
Non-controlled affiliates (Note 3e) | | | 11,050 | |
| | | | |
Total investment income | | | 97,984,791 | |
| | | | |
Expenses: | | | | |
Management fees (Note 3a) | | | 9,857,734 | |
Distribution fees: (Note 3c) | | | | |
Class 2 | | | 4,705,187 | |
Class 4 | | | 506,943 | |
Custodian fees (Note 4) | | | 23,359 | |
Reports to shareholders | | | 218,614 | |
Professional fees | | | 28,283 | |
Trustees’ fees and expenses | | | 15,124 | |
Other | | | 37,961 | |
| | | | |
Total expenses | | | 15,393,205 | |
Expense reductions (Note 4) | | | (34,169 | ) |
Expenses waived/paid by affiliates (Note 3e) | | | (309,781 | ) |
| | | | |
Net expenses | | | 15,049,255 | |
| | | | |
Net investment income | | | 82,935,536 | |
| | | | |
Realized and unrealized gains (losses): | | | | |
Net realized gain (loss) from: | | | | |
Investments: | | | | |
Unaffiliated issuers | | | (339,468,856 | ) |
Written options | | | 368,220 | |
Foreign currency transactions | | | 48,604 | |
| | | | |
Net realized gain (loss) | | | (339,052,032 | ) |
| | | | |
Net change in unrealized appreciation (depreciation) on: | | | | |
Investments: | | | | |
Unaffiliated issuers | | | (304,789,908 | ) |
Translation of other assets and liabilities denominated in foreign currencies | | | (3,134 | ) |
Written options | | | 2,306,961 | |
| | | | |
Net change in unrealized appreciation (depreciation) | | | (302,486,081 | ) |
| | | | |
Net realized and unrealized gain (loss) | | | (641,538,113 | ) |
| | | | |
Net increase (decrease) in net assets resulting from operations | | | $(558,602,577 | ) |
| | | | |
| |
*Foreign taxes withheld on dividends | | | $ 732,781 | |
| | | | | | |
| | | |
| | The accompanying notes are an integral part of these financial statements. | Semiannual Report | | | FI-19 | |
FRANKLIN TEMPLETON VARIABLE INSURANCE PRODUCTS TRUST
NOTES TO FINANCIAL STATEMENTS (UNAUDITED)
Statements of Changes in Net Assets
| | | | | | | | |
| |
| | | Franklin Income VIP Fund | |
| | |
| | | Six Months Ended
June 30, 2020
(unaudited) | | | Year Ended
December 31, 2019 | |
Increase (decrease) in net assets: | | | | | | | | |
Operations: | | | | | | | | |
Net investment income | | $ | 82,935,536 | | | $ | 211,417,673 | |
Net realized gain (loss) | | | (339,052,032 | ) | | | 40,047,821 | |
Net change in unrealized appreciation (depreciation) | | | (302,486,081 | ) | | | 514,968,839 | |
| | | | |
| | |
Net increase (decrease) in net assets resulting from operations | | | (558,602,577 | ) | | | 766,434,333 | |
| | | | |
| | |
Distributions to shareholders: | | | | | | | | |
Class 1 | | | (16,535,949 | ) | | | (26,604,329 | ) |
Class 2 | | | (219,850,517 | ) | | | (301,656,285 | ) |
Class 4 | | | (16,548,919 | ) | | | (21,101,452 | ) |
| | | | |
| | |
Total distributions to shareholders | | | (252,935,385 | ) | | | (349,362,066 | ) |
| | | | |
| | |
Capital share transactions: (Note 2) | | | | | | | | |
Class 1 | | | 11,324,652 | | | | (360,324,820 | ) |
Class 2 | | | (84,014,489 | ) | | | (103,843,936 | ) |
Class 4 | | | 8,051,378 | | | | 4,153,985 | |
| | | | |
| | |
Total capital share transactions | | | (64,638,459 | ) | | | (460,014,771 | ) |
| | | | |
| | |
Net increase (decrease) in net assets | | | (876,176,421 | ) | | | (42,942,504 | ) |
Net assets: | | | | | | | | |
Beginning of period | | | 4,951,067,131 | | | | 4,994,009,635 | |
| | | | |
| | |
End of period | | $ | 4,074,890,710 | | | $ | 4,951,067,131 | |
| | | | |
| | | | |
| | | |
| FI-20 | | Semiannual Report | The accompanying notes are an integral part of these financial statements. | | |
FRANKLIN TEMPLETON VARIABLE INSURANCE PRODUCTS TRUST
Notes to Financial Statements (unaudited)
Franklin Income VIP Fund
1. Organization and Significant Accounting Policies
Franklin Templeton Variable Insurance Products Trust (Trust) is registered under the Investment Company Act of 1940 (1940 Act) as an open-end management investment company, consisting of eighteen separate funds and applies the specialized accounting and reporting guidance in U.S. Generally Accepted Accounting Principles (U.S. GAAP). Franklin Income VIP Fund (Fund) is included in this report. Shares of the Fund are generally sold only to insurance company separate accounts to fund the benefits of variable life insurance policies or variable annuity contracts. The Fund offers three classes of shares: Class 1, Class 2 and Class 4. Each class of shares may differ by its distribution fees, voting rights on matters affecting a single class and its exchange privilege.
The following summarizes the Fund’s significant accounting policies.
a. Financial Instrument Valuation
The Fund’s investments in financial instruments are carried at fair value daily. Fair value is the price that would be received to sell an asset or paid to transfer a liability in an orderly transaction between market participants on the measurement date. The Fund calculates the net asset value (NAV) per share each business day as of 4 p.m. Eastern time or the regularly scheduled close of the New York Stock Exchange (NYSE), whichever is earlier. Under compliance policies and procedures approved by the Trust’s Board of Trustees (the Board), the Fund’s administrator has responsibility for oversight of valuation, including leading the cross-functional Valuation Committee (VC). The Fund may utilize independent pricing services, quotations from securities and financial instrument dealers, and other market sources to determine fair value.
Equity securities and derivative financial instruments listed on an exchange or on the NASDAQ National Market System are valued at the last quoted sale price or the official closing price of the day, respectively. Foreign equity securities are valued as of the close of trading on the foreign stock exchange on which the security is primarily traded, or as of 4 p.m. Eastern time. The value is then converted into its U.S. dollar equivalent at the foreign exchange rate in effect at 4 p.m. Eastern time on the day that the value of the security is determined. Over-the-counter (OTC) securities are valued within the range of the most recent quoted bid and ask prices. Securities that trade in multiple markets or on multiple
exchanges are valued according to the broadest and most representative market. Certain equity securities are valued based upon fundamental characteristics or relationships to similar securities.
Debt securities generally trade in the OTC market rather than on a securities exchange. The Fund’s pricing services use multiple valuation techniques to determine fair value. In instances where sufficient market activity exists, the pricing services may utilize a market-based approach through which quotes from market makers are used to determine fair value. In instances where sufficient market activity may not exist or is limited, the pricing services also utilize proprietary valuation models which may consider market characteristics such as benchmark yield curves, credit spreads, estimated default rates, anticipated market interest rate volatility, coupon rates, anticipated timing of principal repayments, underlying collateral, and other unique security features in order to estimate the relevant cash flows, which are then discounted to calculate the fair value. Securities denominated in a foreign currency are converted into their U.S. dollar equivalent at the foreign exchange rate in effect at 4 p.m. Eastern time on the date that the values of the foreign debt securities are determined.
Investments in open-end mutual funds are valued at the closing NAV. Investments in repurchase agreements are valued at cost, which approximates fair value.
The Fund has procedures to determine the fair value of financial instruments for which market prices are not reliable or readily available. Under these procedures, the Fund primarily employs a market-based approach which may use related or comparable assets or liabilities, recent transactions, market multiples, book values, and other relevant information for the investment to determine the fair value of the investment. An income-based valuation approach may also be used in which the anticipated future cash flows of the investment are discounted to calculate fair value. Discounts may also be applied due to the nature or duration of any restrictions on the disposition of the investments. Due to the inherent uncertainty of valuations of such investments, the fair values may differ significantly from the values that would have been used had an active market existed.
Trading in securities on foreign securities stock exchanges and OTC markets may be completed before 4 p.m. Eastern time. In addition, trading in certain foreign markets may not take place on every Fund’s business day. Events can occur
FRANKLIN TEMPLETON VARIABLE INSURANCE PRODUCTS TRUST
NOTES TO FINANCIAL STATEMENTS (UNAUDITED)
Franklin Income VIP Fund (continued)
1. Organization and Significant Accounting
Policies (continued)
a. Financial Instrument Valuation (continued)
between the time at which trading in a foreign security is completed and 4 p.m. Eastern time that might call into question the reliability of the value of a portfolio security held by the Fund. As a result, differences may arise between the value of the Fund’s portfolio securities as determined at the foreign market close and the latest indications of value at 4 p.m. Eastern time. In order to minimize the potential for these differences, an independent pricing service may be used to adjust the value of the Fund’s portfolio securities to the latest indications of fair value at 4 p.m. Eastern time. At June 30, 2020, certain securities may have been fair valued using these procedures, in which case the securities were categorized as Level 2 inputs within the fair value hierarchy. See the Fair Value Measurements note for more information.
When the last day of the reporting period is a non-business day, certain foreign markets may be open on those days that the Fund’s NAV is not calculated, which could result in differences between the value of the Fund’s portfolio securities on the last business day and the last calendar day of the reporting period. Any significant security valuation changes due to an open foreign market are adjusted and reflected by the Fund for financial reporting purposes.
b. Foreign Currency Translation
Portfolio securities and other assets and liabilities denominated in foreign currencies are translated into U.S. dollars based on the exchange rate of such currencies against U.S. dollars on the date of valuation. The Fund may enter into foreign currency exchange contracts to facilitate transactions denominated in a foreign currency. Purchases and sales of securities, income and expense items denominated in foreign currencies are translated into U.S. dollars at the exchange rate in effect on the transaction date. Portfolio securities and assets and liabilities denominated in foreign currencies contain risks that those currencies will decline in value relative to the U.S. dollar. Occasionally, events may impact the availability or reliability of foreign exchange rates used to convert the U.S. dollar equivalent value. If such an event occurs, the foreign exchange rate will be valued at fair value using procedures established and approved by the Board.
The Fund does not separately report the effect of changes in foreign exchange rates from changes in market prices on securities held. Such changes are included in net realized and unrealized gain or loss from investments in the Statement of Operations.
Realized foreign exchange gains or losses arise from sales of foreign currencies, currency gains or losses realized between the trade and settlement dates on securities transactions and the difference between the recorded amounts of dividends, interest, and foreign withholding taxes and the U.S. dollar equivalent of the amounts actually received or paid. Net unrealized foreign exchange gains and losses arise from changes in foreign exchange rates on foreign denominated assets and liabilities other than investments in securities held at the end of the reporting period.
c. Joint Repurchase Agreement
The Fund enters into a joint repurchase agreement whereby its uninvested cash balance is deposited into a joint cash account with other funds managed by the investment manager or an affiliate of the investment manager and is used to invest in one or more repurchase agreements. The value and face amount of the joint repurchase agreement are allocated to the funds based on their pro-rata interest. A repurchase agreement is accounted for as a loan by the Fund to the seller, collateralized by securities which are delivered to the Fund’s custodian. The fair value, including accrued interest, of the initial collateralization is required to be at least 102% of the dollar amount invested by the funds, with the value of the underlying securities marked to market daily to maintain coverage of at least 100%. Repurchase agreements are subject to the terms of Master Repurchase Agreements (MRAs) with approved counterparties (sellers). The MRAs contain various provisions, including but not limited to events of default and maintenance of collateral for repurchase agreements. In the event of default by either the seller or the Fund, certain MRAs may permit the non-defaulting party to net and close-out all transactions, if any, traded under such agreements. The Fund may sell securities it holds as collateral and apply the proceeds towards the repurchase price and any other amounts owed by the seller to the Fund in the event of default by the seller. This could involve costs or delays in addition to a loss on the securities if their value falls below the repurchase price owed by the seller. The joint repurchase agreement held by the Fund at period end, as indicated in the Statement of Investments, had been entered into on June 30, 2020.
FRANKLIN TEMPLETON VARIABLE INSURANCE PRODUCTS TRUST
NOTES TO FINANCIAL STATEMENTS (UNAUDITED)
Franklin Income VIP Fund (continued)
d. Securities Purchased on a When-Issued Basis
The Fund purchases securities on a when-issued basis, with payment and delivery scheduled for a future date. These transactions are subject to market fluctuations and are subject to the risk that the value at delivery may be more or less than the trade date purchase price. Although the Fund will generally purchase these securities with the intention of holding the securities, it may sell the securities before the settlement date. Sufficient assets have been segregated for these securities.
e. Derivative Financial Instruments
The Fund invested in derivative financial instruments in order to manage risk or gain exposure to various other investments or markets. Derivatives are financial contracts based on an underlying or notional amount, require no initial investment or an initial net investment that is smaller than would normally be required to have a similar response to changes in market factors, and require or permit net settlement. Derivatives contain various risks including the potential inability of the counterparty to fulfill their obligations under the terms of the contract, the potential for an illiquid secondary market, and/or the potential for market movements which expose the Fund to gains or losses in excess of the amounts shown in the Statement of Assets and Liabilities. Realized gain and loss and unrealized appreciation and depreciation on these contracts for the period are included in the Statement of Operations.
Collateral requirements differ by type of derivative. Collateral or initial margin requirements are set by the broker or exchange clearing house for exchange traded and centrally cleared derivatives. Initial margin deposited is held at the exchange and can be in the form of cash and/or securities.
The Fund purchased or wrote exchange traded option contracts primarily to gain exposure to equity price risk. An option is a contract entitling the holder to purchase or sell a specific amount of shares or units of an asset or notional amount of a swap (swaption), at a specified price. When an option is purchased or written, an amount equal to the premium paid or received is recorded as an asset or liability, respectively. Upon exercise of an option, the acquisition cost or sales proceeds of the underlying investment is adjusted by any premium received or paid. Upon expiration of an option, any premium received or paid is recorded as a realized gain or loss. Upon closing an option other than through expiration
or exercise, the difference between the premium received or paid and the cost to close the position is recorded as a realized gain or loss.
See Note 9 regarding other derivative information.
f. Equity-Linked Securities
The Fund invests in equity-linked securities. Equity-linked securities are hybrid financial instruments that generally combine both debt and equity characteristics into a single note form. Income received from equity-linked securities is recorded as realized gains in the Statement of Operations and may be based on the performance of an underlying equity security, an equity index, or an option position. The risks of investing in equity-linked securities include unfavorable price movements in the underlying security and the credit risk of the issuing financial institution. There may be no guarantee of a return of principal with equity-linked securities and the appreciation potential may be limited. Equity-linked securities may be more volatile and less liquid than other investments held by the Fund.
g. Securities Lending
The Fund participates in an agency based securities lending program to earn additional income. The Fund receives cash collateral against the loaned securities in an amount equal to at least 102% of the fair value of the loaned securities. Collateral is maintained over the life of the loan in an amount not less than 100% of the fair value of loaned securities, as determined at the close of Fund business each day; any additional collateral required due to changes in security values is delivered to the Fund on the next business day. The collateral is deposited into a joint cash account with other funds and is used to invest in a money market fund managed by Franklin Advisers, Inc., an affiliate of the Fund, and/or a joint repurchase agreement. The Fund may receive income from the investment of cash collateral, in addition to lending fees and rebates paid by the borrower. Income from securities loaned, net of fees paid to the securities lending agent and/or third-party vendor, is reported separately in the Statement of Operations. The Fund bears the market risk with respect to the collateral investment, securities loaned, and the risk that the agent may default on its obligations to the Fund. If the borrower defaults on its obligation to return the securities loaned, the Fund has the right to repurchase the securities in the open market using the collateral received. The securities lending agent has agreed to indemnify the Fund in the event of default by a third party borrower.
FRANKLIN TEMPLETON VARIABLE INSURANCE PRODUCTS TRUST
NOTES TO FINANCIAL STATEMENTS (UNAUDITED)
Franklin Income VIP Fund (continued)
1. Organization and Significant Accounting
Policies (continued)
h. Senior Floating Rate Interests
The Fund invests in senior secured corporate loans that pay interest at rates which are periodically reset by reference to a base lending rate plus a spread. These base lending rates are generally the prime rate offered by a designated U.S. bank or the London InterBank Offered Rate (LIBOR). Senior secured corporate loans often require prepayment of principal from excess cash flows or at the discretion of the borrower. As a result, actual maturity may be substantially less than the stated maturity. Senior secured corporate loans in which the Fund invests are generally readily marketable, but may be subject to certain restrictions on resale. On July 27, 2017, the United Kingdom’s Financial Conduct Authority announced its intention to cease sustaining LIBOR after 2021. There remains uncertainty regarding the future utilization of LIBOR and the nature of any replacement rate. As such, the potential effect of a transition away from LIBOR on the Fund or the Fund’s investments that use or may use a floating rate based on LIBOR cannot yet be determined.
i. Income and Deferred Taxes
It is the Fund’s policy to qualify as a regulated investment company under the Internal Revenue Code. The Fund intends to distribute to shareholders substantially all of its taxable income and net realized gains to relieve it from federal income and if applicable, excise taxes. As a result, no provision for U.S. federal income taxes is required.
The Fund may be subject to foreign taxation related to income received, capital gains on the sale of securities and certain foreign currency transactions in the foreign jurisdictions in which it invests. Foreign taxes, if any, are recorded based on the tax regulations and rates that exist in the foreign markets in which the Fund invests. When a capital gain tax is determined to apply, the Fund records an estimated deferred tax liability in an amount that would be payable if the securities were disposed of on the valuation date.
The Fund may recognize an income tax liability related to its uncertain tax positions under U.S. GAAP when the uncertain tax position has a less than 50% probability that it will be sustained upon examination by the tax authorities based on its technical merits. As of June 30, 2020, the Fund has determined that no tax liability is required in its financial
statements related to uncertain tax positions for any open tax years (or expected to be taken in future tax years). Open tax years are those that remain subject to examination and are based on the statute of limitations in each jurisdiction in which the Fund invests.
j. Security Transactions, Investment Income, Expenses and Distributions
Security transactions are accounted for on trade date. Realized gains and losses on security transactions are determined on a specific identification basis. Interest income and estimated expenses are accrued daily. Amortization of premium and accretion of discount on debt securities are included in interest income. Facility fees are recognized as income over the expected term of the loan. Dividend income is recorded on the ex-dividend date except for certain dividends from securities where the dividend rate is not available. In such cases, the dividend is recorded as soon as the information is received by the Fund. Distributions to shareholders are recorded on the ex-dividend date. Distributable earnings are determined according to income tax regulations (tax basis) and may differ from earnings recorded in accordance with U.S. GAAP. These differences may be permanent or temporary. Permanent differences are reclassified among capital accounts to reflect their tax character. These reclassifications have no impact on net assets or the results of operations. Temporary differences are not reclassified, as they may reverse in subsequent periods.
Common expenses incurred by the Trust are allocated among the Funds based on the ratio of net assets of each Fund to the combined net assets of the Trust or based on the ratio of number of shareholders of each Fund to the combined number of shareholders of the Trust. Fund specific expenses are charged directly to the Fund that incurred the expense.
Realized and unrealized gains and losses and net investment income, excluding class specific expenses, are allocated daily to each class of shares based upon the relative proportion of net assets of each class. Differences in per share distributions by class are generally due to differences in class specific expenses.
k. Accounting Estimates
The preparation of financial statements in accordance with U.S. GAAP requires management to make estimates and assumptions that affect the reported amounts of assets and
FRANKLIN TEMPLETON VARIABLE INSURANCE PRODUCTS TRUST
NOTES TO FINANCIAL STATEMENTS (UNAUDITED)
Franklin Income VIP Fund (continued)
liabilities at the date of the financial statements and the amounts of income and expenses during the reporting period. Actual results could differ from those estimates.
l. Guarantees and Indemnifications
Under the Trust’s organizational documents, its officers and trustees are indemnified by the Trust against certain liabilities arising out of the performance of their duties to the Trust.
Additionally, in the normal course of business, the Trust, on behalf of the Fund, enters into contracts with service providers that contain general indemnification clauses. The Trust’s maximum exposure under these arrangements is unknown as this would involve future claims that may be made against the Trust that have not yet occurred. Currently, the Trust expects the risk of loss to be remote.
2. Shares of Beneficial Interest
At June 30, 2020, there were an unlimited number of shares authorized (without par value). Transactions in the Fund’s shares were as follows:
| | | | | | | | | | | | | | | | |
| | |
| | | Six Months Ended June 30, 2020 | | | Year Ended December 31, 2019 | |
| | | | |
| | | Shares | | | Amount | | | Shares | | | Amount | |
| | | | |
| Class 1 Shares: | | | | | | | | | | | | | | | | |
Shares sold | | | 1,059,465 | | | $ | 15,551,192 | | | | 1,872,752 | | | $ | 30,211,199 | |
Shares issued in reinvestment of distributions | | | 1,187,927 | | | | 16,535,949 | | | | 1,709,790 | | | | 26,604,329 | |
Shares redeemed | | | (1,412,137 | ) | | | (20,762,489 | ) | | | (25,004,206 | ) | | | (417,140,348 | ) |
| | | | |
Net increase (decrease) | | | 835,255 | | | $ | 11,324,652 | | | | (21,421,664 | ) | | $ | (360,324,820 | ) |
| | | | |
| | | | |
| Class 2 Shares: | | | | | | | | | | | | | | | | |
Shares sold | | | 8,367,886 | | | $ | 119,310,211 | | | | 16,435,568 | | | $ | 256,969,286 | |
Shares issued in reinvestment of distributions | | | 16,406,755 | | | | 219,850,517 | | | | 20,097,021 | | | | 301,656,285 | |
Shares redeemed | | | (29,700,434 | ) | | | (423,175,217 | ) | | | (42,487,994 | ) | | | (662,469,507 | ) |
| | | | |
Net increase (decrease) | | | (4,925,793 | ) | | $ | (84,014,489 | ) | | | (5,955,405 | ) | | $ | (103,843,936 | ) |
| | | | |
| | | | |
| Class 4 Shares: | | | | | | | | | | | | | | | | |
Shares sold | | | 1,086,206 | | | $ | 16,185,257 | | | | 2,582,430 | | | $ | 41,387,759 | |
Shares issued in reinvestment of distributions | | | 1,201,810 | | | | 16,548,919 | | | | 1,370,224 | | | | 21,101,452 | |
Shares redeemed | | | (1,686,095 | ) | | | (24,682,798 | ) | | | (3,658,374 | ) | | | (58,335,226 | ) |
| | | | |
Net increase (decrease) | | | 601,921 | | | $ | 8,051,378 | | | | 294,280 | | | $ | 4,153,985 | |
| | | | |
3. Transactions with Affiliates
Franklin Resources, Inc. is the holding company for various subsidiaries that together are referred to as Franklin Templeton. Certain officers and trustees of the Fund are also officers and/or directors of the following subsidiaries:
| | | | |
| | |
| Subsidiary | | Affiliation | | |
Franklin Advisers, Inc. (Advisers) | | Investment manager |
Franklin Templeton Services, LLC (FT Services) | | Administrative manager |
Franklin Templeton Distributors, Inc. (Distributors) | | Principal underwriter |
Franklin Templeton Investor Services, LLC (Investor Services) | | Transfer agent |
FRANKLIN TEMPLETON VARIABLE INSURANCE PRODUCTS TRUST
NOTES TO FINANCIAL STATEMENTS (UNAUDITED)
Franklin Income VIP Fund (continued)
3. Transactions with Affiliates (continued)
a. Management Fees
The Fund pays an investment management fee to Advisers based on the average daily net assets of the Fund as follows:
| | |
| |
| Annualized Fee Rate | | Net Assets |
0.625% | | Up to and including $100 million |
0.500% | | Over $100 million, up to and including $250 million |
0.450% | | Over $250 million, up to and including $7.5 billion |
0.440% | | Over $7.5 billion, up to and including $10 billion |
0.430% | | Over $10 billion, up to and including $12.5 billion |
0.420% | | Over $12.5 billion, up to and including $15 billion |
0.400% | | In excess of $15 billion |
For the period ended June 30, 2020, the annualized gross effective investment management fee rate was 0.456% of the Fund’s average daily net assets.
b. Administrative Fees
Under an agreement with Advisers, FT Services provides administrative services to the Fund. The fee is paid by Advisers based on the Fund’s average daily net assets, and is not an additional expense of the Fund.
c. Distribution Fees
The Board has adopted distribution plans for Class 2 and Class 4 shares pursuant to Rule 12b-1 under the 1940 Act. Under the Fund’s compensation distribution plans, the Fund pays Distributors for costs incurred in connection with the servicing, sale and distribution of the Fund’s shares up to 0.35% per year of its average daily net assets of each class. The Board has agreed to limit the current rate to 0.25% per year for Class 2. The plan year, for purposes of monitoring compliance with the maximum annual plan rates, is February 1 through January 31.
d. Transfer Agent Fees
Investor Services, under terms of an agreement, performs shareholder servicing for the Fund and is not paid by the Fund for the services.
FRANKLIN TEMPLETON VARIABLE INSURANCE PRODUCTS TRUST
NOTES TO FINANCIAL STATEMENTS (UNAUDITED)
Franklin Income VIP Fund (continued)
e. Investments in Affiliated Management Investment Companies
The Fund invests in one or more affiliated management investment companies for purposes other than exercising a controlling influence over the management or policies. Management fees paid by the Fund are waived on assets invested in the affiliated management investment companies, as noted in the Statement of Operations, in an amount not to exceed the management and administrative fees paid directly or indirectly by each affiliate. During the period ended June 30, 2020, the Fund held investments in affiliated management investment companies as follows:
| | | | | | | | | | | | | | | | | | | | | | | | | | | | | | | | |
| | | | | | | | |
| | | Value at
Beginning of Period | | | Purchases | | | Sales | | | Realized
Gain (Loss) | | | Net Change in
Unrealized
Appreciation
(Depreciation) | | | Value at End of
Period | | | Number of
Shares Held at End
of Period | | | Investment
Income | |
Non-Controlled Affiliates | | | | | | | | | | | | | | | | | | | | | | | | | | | | | | | | |
| | | | | | | | | | | | | | | | | | | | | | | | | | | | | | | Dividends | |
| | | | | | | | | | | | | | | | | | | | | | | | | | | | | | | | |
Institutional Fiduciary Trust Money Market Portfolio, 0.00% | | | $83,971,136 | | | | $736,334,414 | | | | $ (571,111,061) | | | | $ — | | | | $ — | | | | $249,194,489 | | | | 249,194,489 | | | | $359,942 | |
| | | | | | | | | | | | | | | | | | | | | | | | | | | | | |
| Income from
securities
loaned |
|
| | | | | | | | | | | | | | | | | | | | | | | | | | | | | | | | |
Institutional Fiduciary Trust Money Market Portfolio, 0.00% | | | 747,000 | | | | 95,007,000 | | | | (95,640,000) | | | | — | | | | — | | | | 114,000 | | | | 114,000 | | | | 11,050 | |
| | | | | | | | | | | | |
Total Affiliated Securities | | | $84,718,136 | | | | $831,341,414 | | | | $(666,751,061) | | | | $ — | | | | $ — | | | | $249,308,489 | | | | | | | | $370,992 | |
| | | | | | | | | | | | |
4. Expense Offset Arrangement
The Fund has entered into an arrangement with its custodian whereby credits realized as a result of uninvested cash balances are used to reduce a portion of the Fund’s custodian expenses. During the period ended June 30, 2020, the custodian fees were reduced as noted in the Statement of Operations.
5. Income Taxes
At June 30, 2020, the cost of investments and net unrealized appreciation (depreciation) for income tax purposes were as follows:
| | | | |
Cost of investments | | $ | 4,000,093,993 | |
| | | | |
| |
Unrealized appreciation | | $ | 470,838,273 | |
Unrealized depreciation | | | (386,501,678) | |
| | | | |
| |
Net unrealized appreciation (depreciation) | | $ | 84,336,595 | |
| | | | |
Differences between income and/or capital gains as determined on a book basis and a tax basis are primarily due to differing treatments of equity-linked securities, foreign currency transactions and wash sales.
6. Investment Transactions
Purchases and sales of investments (excluding short term securities) for the period ended June 30, 2020, aggregated $852,555,912 and $1,186,554,240, respectively.
FRANKLIN TEMPLETON VARIABLE INSURANCE PRODUCTS TRUST
NOTES TO FINANCIAL STATEMENTS (UNAUDITED)
Franklin Income VIP Fund (continued)
6. Investment Transactions (continued)
At June 30, 2020, in connection with securities lending transactions, the Fund loaned equity investments and received $143,677 of cash collateral. The gross amount of recognized liability for such transactions is included in payable upon return of securities loaned in the Statement of Assets and Liabilities. The agreements can be terminated at any time.
7. Credit Risk
At June 30, 2020, the Fund had 24.0% of its portfolio invested in high yield, senior secured floating rate loans, or other securities rated below investment grade and unrated securities, if any. These securities may be more sensitive to economic conditions causing greater price volatility and are potentially subject to a greater risk of loss due to default than higher rated securities.
8. Novel Coronavirus Pandemic
The global outbreak of the novel coronavirus disease, known as COVID-19, has caused adverse effects on many companies, sectors, nations, regions and the markets in general, and may continue for an unpredictable duration. The effects of this pandemic may materially impact the value and performance of the Fund, its ability to buy and sell fund investments at appropriate valuations and its ability to achieve its investment objectives.
9. Other Derivative Information
At June 30, 2020, investments in derivative contracts are reflected in the Statement of Assets and Liabilities as follows:
| | | | | | | | | | | | |
| | |
| | | Asset Derivatives | | | Liability Derivatives | |
| | | | |
Derivative Contracts
Not Accounted for as
Hedging Instruments | | Statement of
Assets and Liabilities
Location | | Fair Value | | | Statement of
Assets and Liabilities
Location | | Fair Value | |
Equity contracts | | Investments in securities, at value | | | $12,037,000a | | | Options written, at value | | | $3,991,000 | |
| | | | | | | | | | | | |
| aPurchased | option contracts are included in investments in securities, at value in the Statement of Assets and Liabilities. |
For the period ended June 30, 2020, the effect of derivative contracts in the Statement of Operations was as follows:
| | | | | | | | | | | | |
| | | | |
Derivative Contracts
Not Accounted for as
Hedging Instruments | | Statement of
Operations Location | | Net Realized
Gain (Loss) for
the Period | | | Statement of
Operations Location | | Net Change in
Unrealized
Appreciation
(Depreciation)
for the Period | |
| | Net realized gain (loss) from: | | | | | | Net change in unrealized appreciation (depreciation) on: | | | | |
Equity contracts | | Investments | | $ | (10,604,077 | )a | | Investments | | $ | 15,369,038 | a |
| | Written options | | | 368,220 | | | Written options | | | 2,306,961 | |
| | | | | | | | | | | | |
Totals | | | | $ | (10,235,857 | ) | | | | $ | 17,675,999 | |
| | | | | | | | | | | | |
aPurchased option contracts are included in net realized gain (loss) from investments and net change in unrealized appreciation (depreciation) on investments in the Statement of Operations.
For the period ended June 30, 2020, the average month end notional amount of options represented 307,143 shares.
See Note 1(e) regarding derivative financial instruments.
FRANKLIN TEMPLETON VARIABLE INSURANCE PRODUCTS TRUST
NOTES TO FINANCIAL STATEMENTS (UNAUDITED)
Franklin Income VIP Fund (continued)
10. Credit Facility
The Fund, together with other U.S. registered and foreign investment funds (collectively, Borrowers), managed by Franklin Templeton, are borrowers in a joint syndicated senior unsecured credit facility totaling $2 billion (Global Credit Facility) which matures on February 5, 2021. This Global Credit Facility provides a source of funds to the Borrowers for temporary and emergency purposes, including the ability to meet future unanticipated or unusually large redemption requests.
Under the terms of the Global Credit Facility, the Fund shall, in addition to interest charged on any borrowings made by the Fund and other costs incurred by the Fund, pay its share of fees and expenses incurred in connection with the implementation and maintenance of the Global Credit Facility, based upon its relative share of the aggregate net assets of all of the Borrowers, including an annual commitment fee of 0.15% based upon the unused portion of the Global Credit Facility. These fees are reflected in other expenses in the Statement of Operations. During the period ended June 30, 2020, the Fund did not use the Global Credit Facility.
11. Fair Value Measurements
The Fund follows a fair value hierarchy that distinguishes between market data obtained from independent sources (observable inputs) and the Fund’s own market assumptions (unobservable inputs). These inputs are used in determining the value of the Fund’s financial instruments and are summarized in the following fair value hierarchy:
| | • | | Level 1 – quoted prices in active markets for identical financial instruments |
| | • | | Level 2 – other significant observable inputs (including quoted prices for similar financial instruments, interest rates, prepayment speed, credit risk, etc.) |
| | • | | Level 3 – significant unobservable inputs (including the Fund’s own assumptions in determining the fair value of financial instruments) |
The input levels are not necessarily an indication of the risk or liquidity associated with financial instruments at that level.
FRANKLIN TEMPLETON VARIABLE INSURANCE PRODUCTS TRUST
NOTES TO FINANCIAL STATEMENTS (UNAUDITED)
Franklin Income VIP Fund (continued)
11. Fair Value Measurements (continued)
A summary of inputs used as of June 30, 2020, in valuing the Fund’s assets and liabilities carried at fair value, is as follows:
| | | | | | | | | | | | | | | | |
| | | | |
| | | Level 1 | | | Level 2 | | | Level 3 | | | Total | |
| | | | |
| Assets: | | | | | | | | | | | | | | | | |
Investments in Securities:a | | | | | | | | | | | | | | | | |
Equity Investments:b | | | | | | | | | | | | | | | | |
Communication Services | | $ | 119,262,189 | | | $ | 5,112,750 | | | $ | — | | | $ | 124,374,939 | |
Financials | | | 214,640,499 | | | | 28,796,770 | | | | — | | | | 243,437,269 | |
Health Care | | | 226,220,400 | | | | 70,457,870 | | | | — | | | | 296,678,270 | |
Materials | | | 56,220,182 | | | | 33,698,578 | | | | — | | | | 89,918,760 | |
All Other Equity Investments | | | 876,521,327 | | | | �� | | | | — | | | | 876,521,327 | |
Equity-Linked Securities | | | — | | | | 469,407,903 | | | | — | | | | 469,407,903 | |
Convertible Bonds | | | — | | | | 10,251,264 | | | | — | | | | 10,251,264 | |
Corporate Bonds | | | — | | | | 1,339,952,880 | | | | — | | | | 1,339,952,880 | |
Senior Floating Rate Interests | | | — | | | | 6,406,136 | | | | — | | | | 6,406,136 | |
U.S. Government and Agency Securities | | | — | | | | 184,883,789 | | | | — | | | | 184,883,789 | |
Mortgage-Backed Securities | | | — | | | | 185,213,885 | | | | — | | | | 185,213,885 | |
Escrows and Litigation Trusts | | | — | | | | — | | | | —c | | | | — | |
Options Purchased | | | 12,037,000 | | | | — | | | | — | | | | 12,037,000 | |
Short Term Investments | | | 249,194,489 | | | | 143,677 | | | | — | | | | 249,338,166 | |
| | | | |
Total Investments in Securities | | $ | 1,754,096,086 | | | $ | 2,334,325,502 | | | $ | — | | | $ | 4,088,421,588 | |
| | | | |
| | | | |
| Liabilities: | | | | | | | | | | | | | | | | |
Other Financial Instruments: | | | | | | | | | | | | | | | | |
Options Written | | $ | 3,991,000 | | | $ | — | | | $ | — | | | $ | 3,991,000 | |
| | | | |
a For detailed categories, see the accompanying Statement of Investments.
b Includes common, preferred and convertible preferred stocks.
c Includes securities determined to have no value at June 30, 2020.
A reconciliation in which Level 3 inputs are used in determining fair value is presented when there are significant Level 3 assets and/or liabilities at the beginning and/or end of the period.
12. New Accounting Pronouncements
In March 2020, the Financial Accounting Standards Board issued Accounting Standards Update (ASU) No. 2020-04, Reference Rate Reform (Topic 848) – Facilitation of the Effects of Reference Rate Reform on Financial Reporting. The amendments in the ASU provides optional temporary financial reporting relief from the effect of certain types of contract modifications due to the planned discontinuation of the LIBOR and other interbank-offered based reference rates as of the end of 2021. The ASU is effective for certain reference rate-related contract modifications that occur during the period March 12, 2020 through December 31, 2022. Management is currently evaluating the impact, if any, of applying this ASU.
13. Subsequent Events
The Fund has evaluated subsequent events through the issuance of the financial statements and determined that no events have occurred that require disclosure.
FRANKLIN TEMPLETON VARIABLE INSURANCE PRODUCTS TRUST
NOTES TO FINANCIAL STATEMENTS (UNAUDITED)
Franklin Income VIP Fund (continued)
Abbreviations
| | | | | | |
| |
| Currency | | Selected Portfolio |
| | | |
| USD | | United States Dollar | | ADR | | American Depositary Receipt |
| | | |
| | | | FRN | | Floating Rate Note |
| | | |
| | | | LIBOR | | London InterBank Offered Rate |
This page intentionally left blank.
Franklin Mutual Global Discovery VIP Fund
This semiannual report for Franklin Mutual Global Discovery VIP Fund covers the period ended June 30, 2020.
Class 4 Performance Summary as of June 30, 2020
The Fund’s Class 4 Shares posted a -21.29% total return for the six-month period ended June 30, 2020.
Performance reflects the Fund’s Class 4 operating expenses, but does not include any contract fees, expenses or sales charges. If they had been included, performance would be lower. These charges and deductions, particularly for variable life policies, can have a significant effect on contract values and insurance benefits. See the contract prospectus for a complete description of these expenses, including sales charges.
Performance data represent past performance, which does not guarantee future results. Investment return and principal value will fluctuate, and you may have a gain or loss when you sell your shares. Current performance may differ from figures shown.
FRANKLIN MUTUAL GLOBAL DISCOVERY VIP FUND
Fund Goal and Main Investments
The Fund’s investment goal is capital appreciation. Under normal market conditions, the Fund invests primarily in U.S. and foreign equity securities that we believe are available at market prices less than their intrinsic value. The equity securities in which the Fund invests are primarily common stock, with a current focus on mid- and large cap companies. To a lesser extent, the Fund also invests in merger arbitrage securities and the debt and equity of distressed companies. The Fund may invest substantially and potentially up to 100% of its assets in foreign securities, which may include sovereign debt and participations in foreign government debt.
Geographic Composition*
Based on Total Net Assets as of 6/30/20
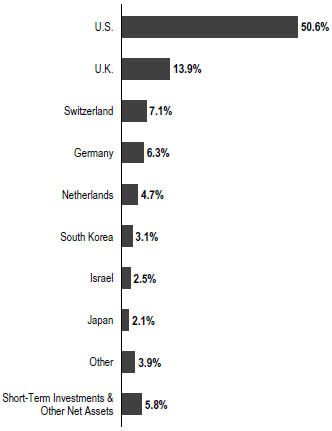
*Figures are stated as a percentage of total and may not equal 100% or may be negative due to rounding, use of any derivatives, unsettled trades or other factors.
Fund Risks
All investments involve risks, including possible loss of principal. Unexpected events and their aftermaths, such as the spread of deadly diseases; natural, environmental or man-made disasters; financial, political or social disruptions; terrorism and war; and other tragedies or catastrophes, can cause investor fear and panic, which can adversely affect the economies of many companies, sectors, nations, regions and the market in general, in ways that cannot necessarily be foreseen. Value securities may not increase in price as anticipated, or may decline further in value. The Fund’s investments in foreign securities involve more risks than U.S. securities, including political and economic developments, trading practices, availability of information, limited markets, and currency exchange fluctuations and policies. Because the Fund may invest at least a significant portion of its assets in companies in a specific region, including Europe, the Fund is subject to greater risks of adverse developments in that region and/or the surrounding regions than a fund that is more broadly diversified geographically. Securities issued by smaller and midsize companies may be more volatile in price than those of larger companies, involve substantial risks and should be considered speculative. Derivatives involve costs and can create economic leverage in the Fund’s portfolio which may result in significant volatility and cause the Fund to participate in losses (as well as gains) in an amount that exceeds the Fund’s initial investment. The Fund’s investments in companies engaged in mergers, reorganizations or liquidations also involve special risks as pending deals may not be completed on time or on favorable terms, as well as lower-rated bonds, which entail higher credit risk. The Fund is actively managed but there is no guarantee that the manager’s investment decisions will produce the desired results. The Fund’s prospectus also includes a description of the main investment risks.
Performance Overview
You can find the Fund’s six-month total return in the Performance Summary. In comparison, the Fund’s benchmark, the MSCI World Index posted a -5.48% total return for the same period.1
1. Source: Morningstar. One cannot invest directly in an index, and an index is not representative of the Fund’s portfolio. Please see Index Descriptions following the Fund Summaries.
The dollar value, number of shares or principal amount, and names of all portfolio holdings are listed in the Fund’s Statement of Investments (SOI).
FRANKLIN MUTUAL GLOBAL DISCOVERY VIP FUND
Economic and Market Overview
Global developed and emerging market equities, as measured by the MSCI All Country World Index, posted a -5.99% total return during the six months under review.1 Stocks fell sharply in early 2020 as countries around the world implemented lockdown measures in an effort to slow the spread of the novel coronavirus (COVID-19). Global supply chain disruptions, business and personal restrictions, and subdued consumer spending drove many investors to sell equity holdings in favor of perceived safe investments such as government bonds and cash. While global equities, notably in the U.S., rebounded in April and May amid optimism about easing lockdown restrictions, concerns about a second wave of infections hindered equities in June, as investors weighed the possibility of renewed restrictions.
In the U.S., government mandates to mitigate the COVID-19 pandemic severely impacted the economy beginning in March 2020. As a result, the unemployment rate surged to 14.7% in April, as many businesses, particularly those involved in hospitality, retail and travel, announced mass layoffs.2 According to the National Bureau of Economic Research, the longest U.S. economic expansion in history ended in February 2020 as the country slipped into a severe recession. Nonetheless, near period-end, there were signs that a recovery was underway, as jobless claims fell considerably from their peak in early April, retail sales rose sharply in May, and the unemployment rate fell to 11.1% in June.2 Along with optimism about improved treatments and potential vaccines for COVID-19, the positive economic signals contributed to a significant equity rebound in April and May. However, an increase in COVID-19 infections in many states throughout June pressured U.S. stocks.
The U.S. Federal Reserve (Fed) made significant efforts to support the U.S. economy. In March 2020, as the pandemic began to severely impact the economy and financial markets, the Fed implemented two emergency rate cuts, lowering the federal funds target rate to a range of 0.00%–0.25%, and announced sweeping quantitative easing measures aimed at ensuring credit flow to borrowers and supporting credit markets with unlimited amounts of bond purchasing.
In the eurozone, some analysts forecasted a significant contraction in 2020, particularly in southern European countries, as the magnitude of the economic disruption caused by the pandemic became apparent. European developed market equities, as measured by the MSCI
Europe Index, posted a -12.43% total return for the period.1 To stimulate growth, the European Central Bank implemented a broad bond-buying program, and many countries passed fiscal stimulus measures.
Asian developed and emerging market equities, as measured by the MSCI All Country Asia Index, posted a -5.51% total return during the six-month period.1 The onset of the pandemic brought dramatically slower economic activity in Asia, as businesses halted operations and manufacturing and export activity declined sharply in the region’s major economies. Asian markets generally advanced toward period-end, bolstered by fiscal stimulus measures and economies reopening throughout the region.
Emerging market stocks, as measured by the MSCI Emerging Markets Index, posted a -9.67% total return due primarily to the COVID-19 pandemic.1 A sharp decrease in prices for oil and other natural resources also hurt emerging market economies reliant on these exports. In the last quarter of the reporting period, however, investor optimism led to a stock rally, particularly in emerging market countries that had successfully lowered infection rates.
Investment Strategy
At Franklin Mutual Advisors, we are committed to our distinctive value approach to investing. Our major investment strategy is investing in undervalued stocks. When selecting undervalued equities, we are attracted to what we believe are fundamentally strong companies with healthy balance sheets, high-quality assets, substantial free cash flow and shareholder-oriented management teams and whose stocks are trading at discounts to our assessment of the companies’ intrinsic or business value. We also look for asset-rich companies whose shares may be trading at depressed levels due to concerns over short-term earnings disappointments, litigation, management strategy or other perceived negatives. While the vast majority of our undervalued equity investments are made in publicly traded companies globally, we may invest occasionally in privately held companies as well. Our portfolio selection process generally includes an assessment of the potential impacts of any material environmental, social and governance (ESG) factors on the long-term risk and return profile of a company.
We complement this more traditional investment strategy with two others. One is distressed investing, which is complex and can take many forms. The most common distressed investment the Fund undertakes is the purchase
2. Source: U.S. Bureau of Labor Statistics.
FRANKLIN MUTUAL GLOBAL DISCOVERY VIP FUND
of financially troubled or bankrupt companies’ debt at a substantial discount to face value. After the financially distressed company is reorganized, often in bankruptcy court, the old debt is typically replaced with new securities issued by the financially stronger company.
The other piece of our investment strategy is participating in arbitrage situations, another highly specialized field. When companies announce proposed mergers or takeovers, commonly referred to as “deals,” the target company may trade at a discount to the bid it ultimately accepts. One form of arbitrage involves purchasing the target company’s stock when it is trading below the value we believe it would receive in a deal. In keeping with our commitment to a relatively conservative investment approach, we typically focus our arbitrage efforts on announced deals, and eschew rumored deals or other situations we consider relatively risky.
In addition, it is our practice to hedge the Fund’s currency exposure when we deem it advantageous for our shareholders.
Manager’s Discussion
The novel coronavirus (COVID-19) pandemic has significantly altered our way of life, although the market indexes would suggest that it is business as usual. Stocks have rallied off the March 23 market bottom and are within range of the pre-pandemic, all-time highs achieved earlier in the year. While the economy has reopened, the recovery is likely to be uneven. The question that we wrestle with daily is what does this scenario mean for equities in general and value stocks in particular?
As markets rose sharply in April, investors moved back into the growth stocks that propelled the market to the all-time highs of January. In late May, however, there was a turn in market sentiment resulting in value briefly outperforming growth. Undervalued stocks often benefit in periods of improving economic activity or stabilization as business prospects improve. Increasing demand across the economy, especially in cyclical sectors, can provide a tailwind for these companies and drive shareholder value. This is a scenario that often occurs off an economic bottom, and we are positioning our portfolios to capitalize on this trend.
The second-quarter earnings reporting season (occurring in July and August) marks the first period with the full impact of the economic lockdowns and will provide a more complete view into the pandemic’s impact on corporate statements. Many financial officers withdrew full-year 2020 guidance, as they reported first-quarter results, due to limited revenue
| | | | |
| Top 10 Sectors/Industries | | | |
| 6/30/20 | | | |
| |
| | | % of Total
Net Assets | |
| Pharmaceuticals | | | 11.8% | |
| Oil, Gas & Consumable Fuels | | | 9.0% | |
| Banks | | | 7.2% | |
| Insurance | | | 6.8% | |
| Technology Hardware, Storage & Peripherals | | | 4.8% | |
| Software | | | 4.1% | |
| Tobacco | | | 3.9% | |
| Health Care Providers & Services | | | 3.8% | |
| Automobiles | | | 3.3% | |
| Diversified Financial Services | | | 3.2% | |
visibility. As a result, the path ahead for stocks is less clear. We remain cautious amid these elevated risks.
Our traditional value equity investment approach is complemented with two other strategies: distressed investing and merger arbitrage.
Within our distressed credit strategy, we targeted companies and industries directly impacted by the coronavirus pandemic. The robust government fiscal and monetary intervention have limited the number of attractive options, but we have found opportunities in the energy sector and the retail and travel industries. Although each situation is unique, these securities have strong collateral packages and covenant protections or other features that we believe make them substantially more attractive than the broad array of available distressed debt.
Within merger arbitrage, which involves trading the stocks of companies involved in a merger or acquisition (M&A), activity has slowed significantly since the onset of the pandemic. Deal terms agreed to before the virus emerged have become unbalanced and are now more favorable for sellers than they are for buyers. Not surprisingly, some of these proposals have become embroiled in litigation. Also, M&A activity has slowed as the economic realities of the coronavirus get priced into the market, and bankers are challenged to conduct due diligence remotely. As the period ended, we began to see signs that transactions activity might resume, but we would expect the second half of the year to be focused on resolving pending deals, rather than significant growth in new ones.
Fund Performance
Turning to Fund performance, investments that detracted included U.S.-based companies Wells Fargo, American
FRANKLIN MUTUAL GLOBAL DISCOVERY VIP FUND
International Group (AIG; not held at period-end) and Hartford Financial Services Group.
The shares of diversified financial services company Wells Fargo were pulled down by negative investor sentiment for financials, which have trailed the broader market rally from the March 23 bottom. Concerns about a possible dividend cut as bank earnings have come under pressure, and speculation about the Fed moving to negative interest rates—subsequently refuted by Fed Chairman Jerome Powell—contributed to the selloff. Earlier in the period, management reported year-end 2019 earnings that fell well short of consensus estimates.
Shares of insurer AIG retreated as COVID-19 concerns and a lack of clarity on forward guidance related to expenses and investment income contributed to negative investor sentiment. The stock initially rallied following the company’s first-quarter earnings call at which management revealed that the majority of its property policies—which include coverage for business interruption—contained exclusions for losses related to viruses.
Shares of insurance products provider Hartford Financial Services Group trended down on investor concerns about COVID-19 exposure within the company’s various insurance lines. Management asserted that significant losses on business interruption coverages are unlikely because of existing policy language containing virus exclusions in most policies. Nevertheless, there has been a surge in property claims attributable to the pandemic, and management acknowledged there could be higher loss costs, litigation activity and legal expenses. Share repurchases totaled $150 million in 2020’s first quarter, but like most companies, stock buybacks have been suspended pending greater clarity on earnings. There is $650 million remaining under the authorization, which expires in December. Earlier in the period, Hartford’s stock price rallied after the insurer reported fourth-quarter 2019 financial results that surpassed consensus estimates for operating earnings and revenue, driven by underwriting results in property and casualty, a lower group disability loss ratio in group benefits and improved net investment income.
During the period under review, Fund investments that contributed positively to performance included U.S.-based companies Eli Lilly, Kraft Heinz and NortonLifeLock (not held at period-end).
Shares of pharmaceutical products company Eli Lilly were volatile but climbed during the period. Investor sentiment improved as the market came to the realization that the company’s business may not be meaningfully impacted by
| | |
| Top 10 Holdings | | |
| 6/30/20 | | |
| |
Company Sector/Industry, Country | | % of Total
Net Assets |
| | | | |
GlaxoSmithKline PLC Pharmaceuticals, U.K. | | | 3.4 | % |
Samsung Electronics Co. Ltd. Technology Hardware, Storage & Peripherals, South Korea | | | 3.1 | % |
Novartis AG Pharmaceuticals, Switzerland | | | 3.0 | % |
Merck & Co. Inc. Pharmaceuticals, U.S. | | | 3.0 | % |
Medtronic PLC Health Care Equipment & Supplies, U.S. | | | 3.0 | % |
British American Tobacco PLC Tobacco, U.K. | | | 2.9 | % |
Volkswagen AG Automobiles, Germany | | | 2.6 | % |
NN Group NV Insurance, Netherlands | | | 2.5 | % |
CVS Health Corp. Health Care Providers & Services, U.S. | | | 2.5 | % |
Charter Communications Inc. Media, U.S. | | | 2.5 | % |
the disruption caused by the COVID-19 pandemic. First-quarter financial results exceeded consensus sales and earnings expectations, with revenues benefiting from customers stocking up amid COVID-19, which is likely to reverse later in the year. Management raised 2020 guidance for earnings per share and reiterated the outlook for revenue and operating margin. In our view, Eli Lilly has a strong drug pipeline with several important compounds that positions the company well for continued growth over time.
Investors bid up shares of food products producer Kraft Heinz as surging demand for its products led to better-than-expected sales growth. Management raised its sales guidance in a business update early in the period, and financial results in the subsequent quarterly earnings report exceeded consensus estimates. The company reaffirmed the dividend payment, which also contributed to positive investor sentiment, and several analysts upgraded Kraft Heinz stock.
Shares of cybersecurity solutions provider NortonLifeLock outperformed during the period as work-from-home requirements attributable to the COVID-19 pandemic led to increased consumer purchases of the company’s cybersecurity subscriptions, generating solid fiscal fourth-quarter earnings that were in line with consensus
FRANKLIN MUTUAL GLOBAL DISCOVERY VIP FUND
expectations. NortonLifeLock’s stock rallied entering the year and surged after management announced in early January the payment of a one-time, $12 per share cash dividend funded by the 2019 sale of the enterprise security business to Broadcom. Symantec, the precursor to NortonLifeLock, sold the business as part of its transition to a pure-play consumer-focused cybersecurity company, and management subsequently adopted the NortonLifeLock brand.
During the period, the Fund held currency forwards and futures seeking to hedge most of the currency risk of the portfolio’s non-U.S. dollar investments. The hedges had a positive overall impact on the Fund’s performance.
Thank you for your participation in Franklin Mutual Global Discovery VIP Fund. We look forward to serving your future investment needs.
The foregoing information reflects our analysis, opinions and portfolio holdings as of June 30, 2020, the end of the reporting period. The way we implement our main investment strategies and the resulting portfolio holdings may change depending on factors such as market and economic conditions. These opinions may not be relied upon as investment advice or an offer for a particular security. The information is not a complete analysis of every aspect of any market, country, industry, security or the Fund. Statements of fact are from sources considered reliable, but the investment manager makes no representation or warranty as to their completeness or accuracy. Although historical performance is no guarantee of future results, these insights may help you understand our investment management philosophy.
FRANKLIN MUTUAL GLOBAL DISCOVERY VIP FUND
Class 4 Fund Expenses
As an investor in a variable insurance contract (Contract) that indirectly provides for investment in an underlying mutual fund, you can incur transaction and/or ongoing expenses at both the Fund level and the Contract Level: (1) transaction expenses can include sales charges (loads) on purchases, surrender fees, transfer fees and premium taxes; and (2) ongoing expenses can include management fees, distribution and service (12b-1) fees, contract fees, annual maintenance fees, mortality and expense risk fees and other fees and expenses. All mutual funds and Contracts have some types of ongoing expenses. The table below shows Fund-level ongoing expenses and can help you understand these costs and compare them with those of other mutual funds offered through the Contract. The table assumes a $1,000 investment held for the six months indicated. Please refer to the Fund prospectus for additional information on operating expenses.
Actual Fund Expenses
The table below provides information about the actual account values and actual expenses in the columns under the heading “Actual.” In these columns the Fund’s actual return, which includes the effect of ongoing Fund expenses but does not include the effect of ongoing Contract expenses, is used to calculate the “Ending Account Value.” You can estimate the Fund-level expenses you paid during the period by following these steps (of course, your account value and expenses will differ from those in this illustration): Divide your account value by $1,000 (if your account had an $8,600 value, then $8,600 ÷ $1,000 = 8.6). Then multiply the result by the number under the headings “Actual” and “Fund-Level Expenses Paid During Period” (if Fund-Level Expenses Paid During Period were $ 7.50, then 8.6 x $ 7.50 = $64.50). In this illustration, the estimated expenses paid this period at the Fund level are $64.50.
Hypothetical Example for Comparison with Other Mutual Funds
Under the heading “Hypothetical” in the table, information is provided about hypothetical account values and hypothetical expenses based on the Fund’s actual expense ratio and an assumed rate of return of 5% per year before expenses, which is not the Fund’s actual return. This information may not be used to estimate the actual ending account balance or expenses you paid for the period, but it can help you compare ongoing costs of investing in the Fund with those of other mutual funds offered through the Contract. To do so, compare this 5% hypothetical example with the 5% hypothetical examples that appear in the shareholder reports of other funds offered through the Contract.
Please note that expenses shown in the table are meant to highlight ongoing costs at the Fund level only and do not reflect any ongoing expenses at the Contract level, or transaction expenses at either the Fund or Contract levels. In addition, while the Fund does not have transaction expenses, if the transaction and ongoing expenses at the Contract level were included, the expenses shown below would be higher. You should consult your Contract prospectus or disclosure document for more information.
| | | | | | | | | | | | | | | | | | |
| | | | | | | |
| | | | | | | Actual (actual return after expenses) | | | | Hypothetical (5% annual return before expenses) | | | | |
Share Class | | Beginning
Account
Value 1/1/20 | | | | Ending
Account
Value 6/30/20 | | Fund-Level
Expenses
Paid During
Period
1/1/20–6/30/201, 2 | | | | Ending Account
Value 6/30/20 | | Fund-Level
Expenses Paid During
Period 1/1/20–6/30/201, 2 | | | | Net
Annualized
Expense
Ratio2 |
Class 4 | | $1,000 | | | | $787.10 | | $5.82 | | | | $1,018.35 | | $6.57 | | | | 1.31% |
1. Expenses are equal to the annualized expense ratio for the six-month period as indicated above—in the far right column—multiplied by the simple average account value over the period indicated, and then multiplied by 182/366 to reflect the one-half year period.
2. Reflects expenses after fee waivers and expense reimbursements. Does not include any ongoing expenses of the Contract for which the Fund is an investment option or acquired fund fees and expenses.
FRANKLIN TEMPLETON VARIABLE INSURANCE PRODUCTS TRUST
Financial Highlights
Franklin Mutual Global Discovery VIP Fund
| | | | | | | | | | | | | | | | | | | | | | | | |
| | |
| | | Six Months Ended
June 30, 2020 (unaudited) | | | Year Ended December 31, | |
| | | 2019 | | | 2018 | | | 2017 | | | 2016 | | | 2015 | |
| | | | | | |
Class 1 | | | | | | | | | | | | | | | | | | | | | | | | |
| | | | | | |
Per share operating performance
(for a share outstanding throughout the period) | | | | | | | | | | | | | | | | | | | | | | | | |
| | | | | | |
Net asset value, beginning of period | | | $19.17 | | | | $17.47 | | | | $20.38 | | | | $20.22 | | | | $19.85 | | | | $22.61 | |
| | | | |
| | | | | | |
| Income from investment operationsa: | | | | | | | | | | | | | | | | | | | | | | | | |
| | | | | | |
Net investment incomeb | | | 0.31 | c | | | 0.43 | | | | 0.36 | | | | 0.47 | | | | 0.41 | | | | 0.37 | |
| | | | | | |
Net realized and unrealized gains (losses) | | | (4.36 | ) | | | 3.64 | | | | (2.50 | ) | | | 1.29 | | | | 1.92 | | | | (1.17 | ) |
| | | | |
| | | | | | |
Total from investment operations | | | (4.05 | ) | | | 4.07 | | | | (2.14 | ) | | | 1.76 | | | | 2.33 | | | | (0.80 | ) |
| | | | |
| | | | | | |
| Less distributions from: | | | | | | | | | | | | | | | | | | | | | | | | |
| | | | | | |
Net investment income | | | — | | | | (0.37 | ) | | | (0.52 | ) | | | (0.42 | ) | | | (0.39 | ) | | | (0.69 | ) |
| | | | | | |
Net realized gains | | | — | | | | (2.00 | ) | | | (0.25 | ) | | | (1.18 | ) | | | (1.57 | ) | | | (1.27 | ) |
| | | | |
| | | | | | |
Total distributions | | | — | | | | (2.37 | ) | | | (0.77 | ) | | | (1.60 | ) | | | (1.96 | ) | | | (1.96 | ) |
| | | | |
| | | | | | |
Net asset value, end of period | | | $15.12 | | | | $19.17 | | | | $17.47 | | | | $20.38 | | | | $20.22 | | | | $19.85 | |
| | | | |
| | | | | | |
Total returnd | | | (21.13)% | | | | 24.71% | | | | (11.01)% | | | | 8.99% | | | | 12.32% | | | | (3.39)% | |
| | | | | | |
| Ratios to average net assetse | | | | | | | | | | | | | | | | | | | | | | | | |
| | | | | | |
Expensesf,g | | | 0.96% | | | | 0.94% | | | | 0.96% | | | | 1.01% | | | | 1.01% | | | | 1.02% | |
| | | | | | |
Expenses incurred in connection with securities sold short | | | 0.02% | | | | 0.02% | | | | 0.01% | | | | —% | | | | 0.01% | | | | 0.02% | |
| | | | | | |
Net investment income | | | 3.92% | c | | | 2.22% | | | | 1.81% | | | | 2.29% | | | | 2.10% | | | | 1.71% | |
| | | | | | |
| Supplemental data | | | | | | | | | | | | | | | | | | | | | | | | |
| | | | | | |
Net assets, end of period (000’s) | | | $3,065 | | | | $3,878 | | | | $3,282 | | | | $3,189 | | | | $3,084 | | | | $2,632 | |
| | | | | | |
Portfolio turnover rate | | | 19.48% | | | | 21.82% | | | | 29.84% | | | | 17.49% | | | | 17.54% | | | | 21.88% | |
aThe amount shown for a share outstanding throughout the period may not correlate with the Statement of Operations for the period due to the timing of sales and repurchases of the Fund’s shares in relation to income earned and/or fluctuating fair value of the investments of the Fund.
bBased on average daily shares outstanding.
cNet investment income per share includes approximately $0.14 per share related to income received in the form of special dividends in connection with certain Fund holdings. Excluding this amount, the ratio of net investment income to average net assets would have been 2.05%.
dTotal return does not include fees, charges or expenses imposed by the variable annuity and life insurance contracts for which Franklin Templeton Variable Insurance Products Trust serves as an underlying investment vehicle. Total return is not annualized for periods less than one year.
eRatios are annualized for periods less than one year.
fIncludes dividend and/or interest expense on securities sold short and security borrowing fees, if any. See below for the ratios of such expenses to average net assets for the periods presented. See Note 1(e).
gBenefit of waiver and payments by affiliates and expense reduction rounds to less than 0.01%.
| | | | |
| | | |
| MGD-8 | | Semiannual Report | The accompanying notes are an integral part of these financial statements. | | |
FRANKLIN TEMPLETON VARIABLE INSURANCE PRODUCTS TRUST
FINANCIAL HIGHLIGHTS
Franklin Mutual Global Discovery VIP Fund (continued)
| | | | | | | | | | | | | | | | | | | | | | | | |
| | |
| | | Six Months Ended
June 30, 2020 (unaudited) | | | Year Ended December 31, | |
| | | 2019 | | | 2018 | | | 2017 | | | 2016 | | | 2015 | |
| | | | | | |
Class 2 | | | | | | | | | | | | | | | | | | | | | | | | |
| | | | | | |
Per share operating performance
(for a share outstanding throughout the period) | | | | | | | | | | | | | | | | | | | | | | | | |
| | | | | | |
Net asset value, beginning of period | | | $18.54 | | | | $16.96 | | | | $19.80 | | | | $19.69 | | | | $19.37 | | | | $22.11 | |
| | | | |
| | | | | | |
| Income from investment operationsa: | | | | | | | | | | | | | | | | | | | | | | | | |
| | | | | | |
Net investment incomeb | | | 0.28 | c | | | 0.37 | | | | 0.30 | | | | 0.41 | | | | 0.35 | | | | 0.32 | |
| | | | | | |
Net realized and unrealized gains (losses) | | | (4.21 | ) | | | 3.53 | | | | (2.42 | ) | | | 1.25 | | | | 1.87 | | | | (1.16 | ) |
| | | | |
| | | | | | |
Total from investment operations | | | (3.93 | ) | | | 3.90 | | | | (2.12 | ) | | | 1.66 | | | | 2.22 | | | | (0.84 | ) |
| | | | |
| | | | | | |
| Less distributions from: | | | | | | | | | | | | | | | | | | | | | | | | |
| | | | | | |
Net investment income | | | — | | | | (0.32 | ) | | | (0.47 | ) | | | (0.37 | ) | | | (0.33 | ) | | | (0.63 | ) |
| | | | | | |
Net realized gains | | | — | | | | (2.00 | ) | | | (0.25 | ) | | | (1.18 | ) | | | (1.57 | ) | | | (1.27 | ) |
| | | | |
| | | | | | |
Total distributions | | | — | | | | (2.32 | ) | | | (0.72 | ) | | | (1.55 | ) | | | (1.90 | ) | | | (1.90 | ) |
| | | | |
| | | | | | |
Net asset value, end of period | | | $14.61 | | | | $18.54 | | | | $16.96 | | | | $19.80 | | | | $19.69 | | | | $19.37 | |
| | | | |
| | | | | | |
Total returnd | | | (21.20)% | | | | 24.37% | | | | (11.22)% | | | | 8.71% | | | | 12.06% | | | | (3.65)% | |
| | | | | | |
| Ratios to average net assetse | | | | | | | | | | | | | | | | | | | | | | | | |
| | | | | | |
Expensesf,g | | | 1.21% | | | | 1.19% | | | | 1.21% | | | | 1.26% | | | | 1.26% | | | | 1.27% | |
| | | | | | |
Expenses incurred in connection with securities sold short | | | 0.02% | | | | 0.02% | | | | 0.01% | | | | —% | | | | 0.01% | | | | 0.02% | |
| | | | | | |
Net investment income | | | 3.67% | c | | | 1.97% | | | | 1.56% | | | | 2.04% | | | | 1.85% | | | | 1.46% | |
| | | | | | |
| Supplemental data | | | | | | | | | | | | | | | | | | | | | | | | |
| | | | | | |
Net assets, end of period (000’s) | | | $412,641 | | | | $539,759 | | | | $500,607 | | | | $631,179 | | | | $630,397 | | | | $629,366 | |
| | | | | | |
Portfolio turnover rate | | | 19.48% | | | | 21.82% | | | | 29.84% | | | | 17.49% | | | | 17.54% | | | | 21.88% | |
aThe amount shown for a share outstanding throughout the period may not correlate with the Statement of Operations for the period due to the timing of sales and repurchases of the Fund’s shares in relation to income earned and/or fluctuating fair value of the investments of the Fund.
bBased on average daily shares outstanding.
cNet investment income per share includes approximately $0.14 per share related to income received in the form of special dividends in connection with certain Fund holdings. Excluding this amount, the ratio of net investment income to average net assets would have been 1.80%.
dTotal return does not include fees, charges or expenses imposed by the variable annuity and life insurance contracts for which Franklin Templeton Variable Insurance Products Trust serves as an underlying investment vehicle. Total return is not annualized for periods less than one year.
eRatios are annualized for periods less than one year.
fIncludes dividend and/or interest expense on securities sold short and security borrowing fees, if any. See below for the ratios of such expenses to average net assets for the periods presented. See Note 1(e).
gBenefit of waiver and payments by affiliates and expense reduction rounds to less than 0.01%.
| | | | | | |
| | | |
| | The accompanying notes are an integral part of these financial statements. | Semiannual Report | | | MGD-9 | |
FRANKLIN TEMPLETON VARIABLE INSURANCE PRODUCTS TRUST
FINANCIAL HIGHLIGHTS
Franklin Mutual Global Discovery VIP Fund (continued)
| | | | | | | | | | | | | | | | | | | | | | | | |
| | |
| | | Six Months Ended
June 30, 2020 (unaudited) | | | Year Ended December 31, | |
| | | 2019 | | | 2018 | | | 2017 | | | 2016 | | | 2015 | |
| | | | | | |
Class 4 | | | | | | | | | | | | | | | | | | | | | | | | |
| | | | | | |
Per share operating performance
(for a share outstanding throughout the period) | | | | | | | | | | | | | | | | | | | | | | | | |
| | | | | | |
Net asset value, beginning of period | | | $18.98 | | | | $17.30 | | | | $20.17 | | | | $20.02 | | | | $19.66 | | | | $22.39 | |
| | | | |
| | | | | | |
| Income from investment operationsa: | | | | | | | | | | | | | | | | | | | | | | | | |
| | | | | | |
Net investment incomeb | | | 0.29 | c | | | 0.36 | | | | 0.29 | | | | 0.40 | | | | 0.34 | | | | 0.30 | |
| | | | | | |
Net realized and unrealized gains (losses) | | | (4.33 | ) | | | 3.61 | | | | (2.47 | ) | | | 1.27 | | | | 1.89 | | | | (1.17 | ) |
| | | | |
| | | | | | |
Total from investment operations | | | (4.04 | ) | | | 3.97 | | | | (2.18 | ) | | | 1.67 | | | | 2.23 | | | | (0.87 | ) |
| | | | |
| | | | | | |
| Less distributions from: | | | | | | | | | | | | | | | | | | | | | | | | |
| | | | | | |
Net investment income | | | — | | | | (0.29 | ) | | | (0.44 | ) | | | (0.34 | ) | | | (0.30 | ) | | | (0.59 | ) |
| | | | | | |
Net realized gains | | | — | | | | (2.00 | ) | | | (0.25 | ) | | | (1.18 | ) | | | (1.57 | ) | | | (1.27 | ) |
| | | | |
| | | | | | |
Total distributions | | | — | | | | (2.29 | ) | | | (0.69 | ) | | | (1.52 | ) | | | (1.87 | ) | | | (1.86 | ) |
| | | | |
| | | | | | |
Net asset value, end of period | | | $14.94 | | | | $18.98 | | | | $17.30 | | | | $20.17 | | | | $20.02 | | | | $19.66 | |
| | | | |
| | | | | | |
Total returnd | | | (21.29)% | | | | 24.28% | | | | (11.31)% | | | | 8.61% | | | | 11.91% | | | | (3.74)% | |
| | | | | | |
| Ratios to average net assetse | | | | | | | | | | | | | | | | | | | | | | | | |
| | | | | | |
Expensesf,g | | | 1.31% | | | | 1.29% | | | | 1.31% | | | | 1.36% | | | | 1.36% | | | | 1.37% | |
| | | | | | |
Expenses incurred in connection with securities sold short | | | 0.02% | | | | 0.02% | | | | 0.01% | | | | —% | | | | 0.01% | | | | 0.02% | |
| | | | | | |
Net investment income | | | 3.57% | c | | | 1.87% | | | | 1.46% | | | | 1.94% | | | | 1.75% | | | | 1.36% | |
| | | | | | |
| Supplemental data | | | | | | | | | | | | | | | | | | | | | | | | |
| | | | | | |
Net assets, end of period (000’s) | | | $24,116 | | | | $30,865 | | | | $30,094 | | | | $41,713 | | | | $45,262 | | | | $49,054 | |
| | | | | | |
Portfolio turnover rate | | | 19.48% | | | | 21.82% | | | | 29.84% | | | | 17.49% | | | | 17.54% | | | | 21.88% | |
aThe amount shown for a share outstanding throughout the period may not correlate with the Statement of Operations for the period due to the timing of sales and repurchases of the Fund’s shares in relation to income earned and/or fluctuating fair value of the investments of the Fund.
bBased on average daily shares outstanding.
cNet investment income per share includes approximately $0.14 per share related to income received in the form of special dividends in connection with certain Fund holdings. Excluding this amount, the ratio of net investment income to average net assets would have been 1.70%.
dTotal return does not include fees, charges or expenses imposed by the variable annuity and life insurance contracts for which Franklin Templeton Variable Insurance Products Trust serves as an underlying investment vehicle. Total return is not annualized for periods less than one year.
eRatios are annualized for periods less than one year.
fIncludes dividend and/or interest expense on securities sold short and security borrowing fees, if any. See below for the ratios of such expenses to average net assets for the periods presented. See Note 1(e).
gBenefit of waiver and payments by affiliates and expense reduction rounds to less than 0.01%.
| | | | |
| | | |
| MGD-10 | | Semiannual Report | The accompanying notes are an integral part of these financial statements. | | |
FRANKLIN TEMPLETON VARIABLE INSURANCE PRODUCTS TRUST
Statement of Investments, June 30, 2020 (unaudited)
| | | | | | | | | | | | | | |
Franklin Mutual Global Discovery VIP Fund | | | | |
| | | | |
| | | | | Country | | | Shares/ Warrants | | | Value | |
| | | | |
| | Common Stocks and Other Equity Interests 89.1% | | | | | | | | | | | | |
| | Aerospace & Defense 1.2% | | | | | | | | | | | | |
| | BAE Systems PLC | | | United Kingdom | | | | 914,196 | | | $ | 5,466,177 | |
| | | | | | | | | | | | | | |
| | Auto Components 0.0%† | | | | | | | | | | | | |
| a,b,c | | International Automotive Components Group Brazil LLC | | | Brazil | | | | 424,073 | | | | 7,974 | |
| | | | | | | | | | | | | | |
| | Automobiles 0.7% | | | | | | | | | | | | |
| | General Motors Co. | | | United States | | | | 119,200 | | | | 3,015,760 | |
| | | | | | | | | | | | | | |
| | Banks 7.2% | | | | | | | | | | | | |
| | Citigroup Inc. | | | United States | | | | 87,450 | | | | 4,468,695 | |
| | First Horizon National Corp. | | | United States | | | | 353,473 | | | | 3,520,591 | |
| | ING Groep NV | | | Netherlands | | | | 803,522 | | | | 5,600,776 | |
| | JPMorgan Chase & Co. | | | United States | | | | 68,686 | | | | 6,460,605 | |
| | Standard Chartered PLC | | | United Kingdom | | | | 892,332 | | | | 4,836,953 | |
| | Wells Fargo & Co. | | | United States | | | | 257,820 | | | | 6,600,192 | |
| | | | | | | | | | | | | | |
| | | | | | | | | | | | | 31,487,812 | |
| | | | | | | | | | | | | | |
| | Beverages 0.9% | | | | | | | | | | | | |
| | Heineken NV | | | Netherlands | | | | 41,100 | | | | 3,788,853 | |
| | | | | | | | | | | | | | |
| | Building Products 2.1% | | | | | | | | | | | | |
| | Johnson Controls International PLC | | | United States | | | | 266,700 | | | | 9,105,138 | |
| | | | | | | | | | | | | | |
| | Capital Markets 3.0% | | | | | | | | | | | | |
| | Credit Suisse Group AG | | | Switzerland | | | | 722,165 | | | | 7,514,031 | |
| a | | Deutsche Bank AG | | | Germany | | | | 433,542 | | | | 4,135,664 | |
| | Guotai Junan Securities Co. Ltd. | | | China | | | | 1,275,797 | | | | 1,774,230 | |
| | | | | | | | | | | | | | |
| | | | | | | | | | | | | 13,423,925 | |
| | | | | | | | | | | | | | |
| | Chemicals 2.8% | | | | | | | | | | | | |
| | BASF SE | | | Germany | | | | 130,518 | | | | 7,330,452 | |
| | Covestro AG | | | Germany | | | | 134,621 | | | | 5,127,021 | |
| | | | | | | | | | | | | | |
| | | | | | | | | | | | | 12,457,473 | |
| | | | | | | | | | | | | | |
| | Communications Equipment 1.3% | | | | | | | | | | | | |
| | Cisco Systems Inc. | | | United States | | | | 120,380 | | | | 5,614,523 | |
| | | | | | | | | | | | | | |
| | Construction Materials 1.3% | | | | | | | | | | | | |
| a | | LafargeHolcim Ltd., B | | | Switzerland | | | | 126,515 | | | | 5,573,748 | |
| | | | | | | | | | | | | | |
| | Consumer Finance 1.1% | | | | | | | | | | | | |
| | Capital One Financial Corp. | | | United States | | | | 79,688 | | | | 4,987,672 | |
| | | | | | | | | | | | | | |
| | Containers & Packaging 1.3% | | | | | | | | | | | | |
| | International Paper Co. | | | United States | | | | 160,200 | | | | 5,640,642 | |
| | | | | | | | | | | | | | |
| | Diversified Financial Services 3.2% | | | | | | | | | | | | |
| a | | Berkshire Hathaway Inc., B | | | United States | | | | 30,300 | | | | 5,408,853 | |
| | M&G PLC | | | United Kingdom | | | | 998,386 | | | | 2,073,009 | |
| | Voya Financial Inc. | | | United States | | | | 143,950 | | | | 6,715,268 | |
| | | | | | | | | | | | | | |
| | | | | | | | | | | | | 14,197,130 | |
| | | | | | | | | | | | | �� | |
| | Entertainment 2.2% | | | | | | | | | | | | |
| | The Walt Disney Co. | | | United States | | | | 85,691 | | | | 9,555,403 | |
| | | | | | | | | | | | | | |
FRANKLIN TEMPLETON VARIABLE INSURANCE PRODUCTS TRUST
STATEMENT OF INVESTMENTS (UNAUDITED)
Franklin Mutual Global Discovery VIP Fund (continued)
| | | | | | | | | | | | | | |
| | | | |
| | | | | Country | | | Shares/
Warrants | | | Value | |
| | | | |
| | Common Stocks and Other Equity Interests (continued) | | | | | | | | | | | | |
| | Food & Staples Retailing 1.0% | | | | | | | | | | | | |
| | Walgreens Boots Alliance Inc. | | | United States | | | | 102,504 | | | $ | 4,345,145 | |
| | | | | | | | | | | | | | |
| | Food Products 2.1% | | | | | | | | | | | | |
| | The Kraft Heinz Co. | | | United States | | | | 292,300 | | | | 9,321,447 | |
| | | | | | | | | | | | | | |
| | Health Care Equipment & Supplies 3.0% | | | | | | | | | | | | |
| | Medtronic PLC | | | United States | | | | 142,613 | | | | 13,077,612 | |
| | | | | | | | | | | | | | |
| | Health Care Providers & Services 3.8% | | | | | | | | | | | | |
| | Anthem Inc. | | | United States | | | | 21,532 | | | | 5,662,486 | |
| | CVS Health Corp. | | | United States | | | | 168,591 | | | | 10,953,357 | |
| | | | | | | | | | | | | | |
| | | | | | | | | | | | | 16,615,843 | |
| | | | | | | | | | | | | | |
| | Hotels, Restaurants & Leisure 1.1% | | | | | | | | | | | | |
| a | | Accor SA | | | France | | | | 180,200 | | | | 4,917,513 | |
| | | | | | | | | | | | | | |
| | Industrial Conglomerates 0.8% | | | | | | | | | | | | |
| | General Electric Co. | | | United States | | | | 544,250 | | | | 3,717,228 | |
| | | | | | | | | | | | | | |
| | Insurance 6.8% | | | | | | | | | | | | |
| | Alleghany Corp. | | | United States | | | | 2,730 | | | | 1,335,352 | |
| | China Pacific Insurance Group Co. Ltd., H | | | China | | | | 1,931,308 | | | | 5,190,715 | |
| | Everest Re Group Ltd. | | | United States | | | | 10,778 | | | | 2,222,423 | |
| | The Hartford Financial Services Group Inc. | | | United States | | | | 259,596 | | | | 10,007,426 | |
| | NN Group NV | | | Netherlands | | | | 333,803 | | | | 11,217,375 | |
| | | | | | | | | | | | | | |
| | | | | | | | | | | | | 29,973,291 | |
| | | | | | | | | | | | | | |
| | IT Services 1.9% | | | | | | | | | | | | |
| | Cognizant Technology Solutions Corp., A | | | United States | | | | 146,460 | | | | 8,321,857 | |
| | | | | | | | | | | | | | |
| | Machinery 0.9% | | | | | | | | | | | | |
| a | | CNH Industrial NV | | | United Kingdom | | | | 536,078 | | | | 3,765,939 | |
| | | | | | | | | | | | | | |
| | Media 2.6% | | | | | | | | | | | | |
| a | | Charter Communications Inc., A | | | United States | | | | 21,286 | | | | 10,856,711 | |
| a | | iHeartMedia Inc., A | | | United States | | | | 95,199 | | | | 794,912 | |
| a,b | | iHeartMedia Inc., B | | | United States | | | | 1,606 | | | | 11,399 | |
| | | | | | | | | | | | | | |
| | | | | | | | | | | | | 11,663,022 | |
| | | | | | | | | | | | | | |
| | Oil, Gas & Consumable Fuels 9.0% | | | | | | | | | | | | |
| | Ampol Ltd. | | | Australia | | | | 17,886 | | | | 364,398 | |
| | BP PLC | | | United Kingdom | | | | 2,011,862 | | | | 7,707,214 | |
| | Canadian Natural Resources Ltd. | | | Canada | | | | 279,600 | | | | 4,850,341 | |
| | ENEOS Holdings Inc. | | | Japan | | | | 1,015,239 | | | | 3,618,884 | |
| | Kinder Morgan Inc. | | | United States | | | | 441,470 | | | | 6,697,100 | |
| | Royal Dutch Shell PLC, A (EUR Traded) | | | United Kingdom | | | | 127,534 | | | | 2,087,464 | |
| | Royal Dutch Shell PLC, A (GBP Traded) | | | United Kingdom | | | | 226,238 | | | | 3,622,210 | |
| | The Williams Cos. Inc. | | | United States | | | | 553,901 | | | | 10,535,197 | |
| | | | | | | | | | | | | | |
| | | | | | | | | | | | | 39,482,808 | |
| | | | | | | | | | | | | | |
| | Pharmaceuticals 11.8% | | | | | | | | | | | | |
| a | | Elanco Animal Health Inc. | | | United States | | | | 60,998 | | | | 1,308,407 | |
| | Eli Lilly and Co. | | | United States | | | | 55,735 | | | | 9,150,572 | |
| | GlaxoSmithKline PLC | | | United Kingdom | | | | 735,340 | | | | 14,853,032 | |
FRANKLIN TEMPLETON VARIABLE INSURANCE PRODUCTS TRUST
STATEMENT OF INVESTMENTS (UNAUDITED)
Franklin Mutual Global Discovery VIP Fund (continued)
| | | | | | | | | | | | | | |
| | | | |
| | | | | Country | | | Shares/ Warrants | | | Value | |
| | Common Stocks and Other Equity Interests (continued) | | | | | | | | | | | | |
| | Pharmaceuticals (continued) | | | | | | | | | | | | |
| | Merck & Co. Inc. | | | United States | | | | 171,045 | | | $ | 13,226,910 | |
| | Novartis AG, ADR | | | Switzerland | | | | 153,897 | | | | 13,441,364 | |
| | | | | | | | | | | | | | |
| | | | | | | | | | | | | 51,980,285 | |
| | | | | | | | | | | | | | |
| | Semiconductors & Semiconductor Equipment 1.3% | | | | | | | | | | | | |
| a | | Renesas Electronics Corp. | | | Japan | | | | 1,102,140 | | | | 5,665,443 | |
| | | | | | | | | | | | | | |
| | Software 4.1% | | | | | | | | | | | | |
| a | | Avaya Holdings Corp. | | | United States | | | | 4 | | | | 49 | |
| a | | Avaya Holdings Corp., wts., 12/15/22 | | | United States | | | | 5,179 | | | | 6,474 | |
| a | | Check Point Software Technologies Ltd. | | | Israel | | | | 100,267 | | | | 10,771,684 | |
| | Oracle Corp. | | | United States | | | | 128,100 | | | | 7,080,087 | |
| | | | | | | | | | | | | | |
| | | | | | | | | | | | | 17,858,294 | |
| | | | | | | | | | | | | | |
| | Specialty Retail 0.3% | | | | | | | | | | | | |
| a | | Dufry AG | | | Switzerland | | | | 49,991 | | | | 1,497,406 | |
| | | | | | | | | | | | | | |
| | Technology Hardware, Storage & Peripherals 4.8% | | | | | | | | | | | | |
| | Hewlett Packard Enterprise Co. | | | United States | | | | 125,444 | | | | 1,220,570 | |
| | Samsung Electronics Co. Ltd. | | | South Korea | | | | 308,280 | | | | 13,683,342 | |
| | Western Digital Corp. | | | United States | | | | 138,906 | | | | 6,132,700 | |
| | | | | | | | | | | | | | |
| | | | | | | | | | | | | 21,036,612 | |
| | | | | | | | | | | | | | |
| | Textiles, Apparel & Luxury Goods 0.8% | | | | | | | | | | | | |
| | Cie Financiere Richemont SA | | | Switzerland | | | | 56,843 | | | | 3,666,391 | |
| | | | | | | | | | | | | | |
| | Tobacco 3.9% | | | | | | | | | | | | |
| | Altria Group Inc. | | | United States | | | | 107,584 | | | | 4,222,672 | |
| | British American Tobacco PLC | | | United Kingdom | | | | 252,780 | | | | 9,694,430 | |
| | British American Tobacco PLC, ADR | | | United Kingdom | | | | 83,985 | | | | 3,260,298 | |
| | | | | | | | | | | | | | |
| | | | | | | | | | | | | 17,177,400 | |
| | | | | | | | | | | | | | |
| | Wireless Telecommunication Services 0.8% | | | | | | | | | | | | |
| | Vodafone Group PLC | | | United Kingdom | | | | 2,268,154 | | | | 3,605,672 | |
| | | | | | | | | | | | | | |
| | | | |
| | Total Common Stocks and Other Equity Interests
(Cost $387,991,944) | | | | | | | | | | | 392,011,438 | |
| | | | | | | | | | | | | | |
| | | |
| | Preferred Stocks (Cost $12,585,173) 2.6% | | | | | | | | | |
| | Automobiles 2.6% | | | | | | | | | | | | |
| a,d | | Volkswagen AG, pfd | | | Germany | | | | 74,193 | | | | 11,276,333 | |
| | | | | | | | | | | | | | |
| | | | |
| | | | | | | | Principal
Amount | | | | |
| | Corporate Bonds, Notes and Senior Floating Rate Interests 1.9% | | | | | | | | | |
| e | | American Airlines Inc., senior secured note, 144A, 11.75%, 7/15/25 | | | United States | | | $ | 4,710,000 | | | | 4,438,186 | |
| e | | Macy’s Inc., senior secured note, first lien, 144A, 8.375%, 6/15/25 | | | United States | | | | 829,000 | | | | 826,409 | |
| f,g,h | | Mileage Plus Holdings LLC, Term Loan B, TBD, 6/25/27 | | | United States | | | | 533,000 | | | | 529,955 | |
| e,i | | Mileage Plus Holdings LLC/Mileage Plus Intellectual Property Assets Ltd., senior secured note, first lien, 144A, 6.50%, 6/20/27 | | | United States | | | | 2,060,000 | | | | 2,070,300 | |
FRANKLIN TEMPLETON VARIABLE INSURANCE PRODUCTS TRUST
STATEMENT OF INVESTMENTS (UNAUDITED)
Franklin Mutual Global Discovery VIP Fund (continued)
| | | | | | | | | | | | | | |
| | | | |
| | | | | Country | | | Principal
Amount | | | Value | |
| | Corporate Bonds, Notes and Senior Floating Rate Interests (continued) | | | | | | | | | |
| | Occidental Petroleum Corp., | | | | | | | | | | | | |
| | senior note, 4.85%, 3/15/21 | | | United States | | | $ | 173,000 | | | $ | 172,459 | |
| h,j | | senior note, FRN, 1.842%, (3-month USD LIBOR + 1.45%), 8/15/22 | | | United States | | | | 553,000 | | | | 508,972 | |
| | | | | | | | | | | | | | |
| | | |
| | Total Corporate Bonds, Notes and Senior Floating Rate Interests
(Cost $8,625,850) | | | | | | | | 8,546,281 | |
| | | | | | | | | | | | | | |
| | | | |
| | Corporate Notes in Reorganization 0.6% | | | | | | | | | | | | |
| k | | Frontier Communications Corp., | | | | | | | | | | | | |
| | senior note, 10.50%, 9/15/22 | | | United States | | | | 3,610,000 | | | | 1,258,139 | |
| | senior note, 11.00%, 9/15/25 | | | United States | | | | 4,065,000 | | | | 1,418,563 | |
| | | | | | | | | | | | | | |
| | | | |
| | Total Corporate Notes in Reorganization (Cost $7,152,596) | | | | | | | | | | | 2,676,702 | |
| | | | | | | | | | | | | | |
| | | | |
| | | | | | | | Shares | | | | |
| | | | |
| | Companies in Liquidation 0.0%† | | | | | | | | | | | | |
| a,b,l | | Tribune Media Co., Litigation Trust, Contingent Distribution | | | United States | | | | 57,340 | | | | — | |
| a,b,l | | Vistra Energy Corp., Litigation Trust, Contingent Distribution | | | United States | | | | 5,912,264 | | | | 3,252 | |
| a,b,l | | Walter Energy Inc., Litigation Trust, Contingent Distribution | | | United States | | | | 966,000 | | | | — | |
| | | | | | | | | | | | | | |
| | | | |
| | Total Companies in Liquidation (Cost $185,800) | | | | | | | | | | | 3,252 | |
| | | | | | | | | | | | | | |
| | | | |
| | Total Investments before Short Term Investments
(Cost $416,541,363) | | | | | | | | | | | 414,514,006 | |
| | | | | | | | | | | | | | |
| | | | |
| | | | | | | | Principal
Amount | | | | |
| | Short Term Investments 5.3% | | | | | | | | | | | | |
| | | | |
| | U.S. Government and Agency Securities 5.3% | | | | | | | | | | | | |
| m | | FHLB, 7/01/20 | | | United States | | | $ | 3,700,000 | | | | 3,700,000 | |
| m | | U.S. Treasury Bill, | | | | | | | | | | | | |
| | 7/02/20 | | | United States | | | | 13,000,000 | | | | 12,999,969 | |
| | n 7/23/20 - 11/27/20 | | | United States | | | | 6,500,000 | | | | 6,498,304 | |
| | | | | | | | | | | | | | |
| | | | |
| | Total U.S. Government and Agency Securities
(Cost $23,195,830) | | | | | | | | | | | 23,198,273 | |
| | | | | | | | | | | | | | |
| | | | |
| | Total Investments (Cost $439,737,193) 99.5% | | | | | | | | | | | 437,712,279 | |
| | | | |
| | Other Assets, less Liabilities 0.5% | | | | | | | | | | | 2,109,646 | |
| | | | | | | | | | | | | | |
| | | | |
| | Net Assets 100.0% | | | | | | | | | | $ | 439,821,925 | |
| | | | | | | | | | | | | | |
FRANKLIN TEMPLETON VARIABLE INSURANCE PRODUCTS TRUST
STATEMENT OF INVESTMENTS (UNAUDITED)
Franklin Mutual Global Discovery VIP Fund (continued)
†Rounds to less than 0.1% of net assets.
aNon-income producing.
bFair valued using significant unobservable inputs. See Note 13 regarding fair value measurements.
cSee Note 10 regarding restricted securities.
dVariable rate security. The rate shown represents the yield at period end.
eSecurity was purchased pursuant to Rule 144A under the Securities Act of 1933 and may be sold in transactions exempt from registration only to qualified institutional buyers or in a public offering registered under the Securities Act of 1933. At June 30, 2020, the aggregate value of these securities was $7,334,895, representing 1.7% of net assets.
fSecurity purchased on a delayed delivery basis. See Note 1(c).
gA portion or all of the security represents an unsettled loan commitment. The coupon rate is to-be determined (TBD) at the time of settlement and will be based upon a reference index/floor plus a spread.
hSee Note 1(g) regarding senior floating rate interests.
iSecurity purchased on a when-issued basis. See Note 1(c).
jThe coupon rate shown represents the rate at period end.
kSee Note 7 regarding credit risk and defaulted securities.
lContingent distributions represent the right to receive additional distributions, if any, during the reorganization of the underlying company. Shares represent total underlying principal of debt securities.
mThe security was issued on a discount basis with no stated coupon rate.
nA portion or all of the security has been segregated as collateral for open forward exchange contracts. At June 30, 2020, the aggregate value of these securities pledged amounted to $910,870, representing 0.2% of net assets.
At June 30, 2020, the Fund had the following futures contracts outstanding. See Note 1(d).
| | | | | | | | | | | | | | | | | | | | |
| Futures Contracts | | | | | | | | | | | | | | | |
| | | | | |
| Description | | Type | | | Number of
Contracts | | | Notional
Amount* | | | Expiration
Date | | | Value/
Unrealized
Appreciation
(Depreciation) | |
| Currency Contracts | | | | | | | | | | | | | | | | | | | | |
EUR/USD | | | Short | | | | 167 | | | $ | 23,491,681 | | | | 9/14/20 | | | | $154,589 | |
GBP/USD | | | Short | | | | 128 | | | | 9,917,600 | | | | 9/14/20 | | | | 272,278 | |
| | | | | | | | | | | | | | | | | | | | |
Total Futures Contracts | | | | | | | | | | | | | | | | | | | $426,867 | |
| | | | | | | | | | | | | | | | | | | | |
* As of period end.
FRANKLIN TEMPLETON VARIABLE INSURANCE PRODUCTS TRUST
STATEMENT OF INVESTMENTS (UNAUDITED)
Franklin Mutual Global Discovery VIP Fund (continued)
At June 30, 2020, the Fund had the following forward exchange contracts outstanding. See Note 1(d).
| | | | | | | | | | | | | | | | | | | | | | | | | | | | |
| Forward Exchange Contracts | | | | | | | | | | | | | | | | |
| | | | | | | |
| Currency | | Counterpartya | | | Type | | | Quantity | | | Contract
Amount | | | Settlement
Date | | | Unrealized
Appreciation | | | Unrealized
Depreciation | |
| OTC Forward Exchange Contracts | |
Australian Dollar | | | HSBK | | | | Buy | | | | 35,532 | | | $ | 24,376 | | | | 7/15/20 | | | $ | 145 | | | $ | — | |
Australian Dollar | | | UBSW | | | | Buy | | | | 73,602 | | | | 51,056 | | | | 7/15/20 | | | | — | | | | (262 | ) |
Australian Dollar | | | UBSW | | | | Buy | | | | 2,986,417 | | | | 2,054,149 | | | | 7/15/20 | | | | 6,814 | | | | — | |
Australian Dollar | | | UBSW | | | | Sell | | | | 3,619,790 | | | | 2,499,186 | | | | 7/15/20 | | | | 1,126 | | | | — | |
Euro | | | BOFA | | | | Sell | | | | 665,303 | | | | 736,468 | | | | 7/15/20 | | | | — | | | | (11,208 | ) |
Euro | | | BONY | | | | Sell | | | | 480,594 | | | | 540,818 | | | | 7/15/20 | | | | 720 | | | | — | |
Euro | | | HSBK | | | | Buy | | | | 67,940 | | | | 76,216 | | | | 7/15/20 | | | | 136 | | | | — | |
Euro | | | HSBK | | | | Buy | | | | 1,303,998 | | | | 1,467,772 | | | | 7/15/20 | | | | — | | | | (2,321 | ) |
Euro | | | HSBK | | | | Sell | | | | 1,235,751 | | | | 1,400,423 | | | | 7/15/20 | | | | 11,668 | | | | — | |
Euro | | | HSBK | | | | Sell | | | | 1,498,320 | | | | 1,670,080 | | | | 7/15/20 | | | | — | | | | (13,752 | ) |
Euro | | | SSBT | | | | Sell | | | | 918,276 | | | | 1,018,389 | | | | 7/15/20 | | | | — | | | | (13,584 | ) |
Euro | | | SSBT | | | | Sell | | | | 961,741 | | | | 1,084,091 | | | | 7/15/20 | | | | 3,273 | | | | — | |
Euro | | | UBSW | | | | Sell | | | | 1,592,124 | | | | 1,798,978 | | | | 7/15/20 | | | | 9,724 | | | | — | |
Euro | | | UBSW | | | | Sell | | | | 29,083,618 | | | | 31,880,595 | | | | 7/15/20 | | | | — | | | | (804,000 | ) |
South Korean Won | | | HSBK | | | | Buy | | | | 595,344,910 | | | | 493,029 | | | | 7/17/20 | | | | 3,332 | | | | — | |
South Korean Won | | | HSBK | | | | Sell | | | | 661,260,600 | | | | 555,112 | | | | 7/17/20 | | | | 3,795 | | | | — | |
South Korean Won | | | HSBK | | | | Sell | | | | 15,855,081,459 | | | | 12,966,962 | | | | 7/17/20 | | | | — | | | | (252,006 | ) |
South Korean Won | | | UBSW | | | | Sell | | | | 356,186,851 | | | | 291,264 | | | | 7/17/20 | | | | — | | | | (5,702 | ) |
British Pound | | | HSBK | | | | Buy | | | | 13,155 | | | | 16,358 | | | | 8/14/20 | | | | — | | | | (54 | ) |
British Pound | | | UBSW | | | | Sell | | | | 8,878,011 | | | | 11,135,645 | | | | 8/14/20 | | | | 132,626 | | | | — | |
Swiss Franc | | | UBSW | | | | Sell | | | | 6,823,321 | | | | 7,260,938 | | | | 8/17/20 | | | | 48,626 | | | | — | |
| | | | | | | | | | | | | | | | | | | | | | | | |
Total Forward Exchange Contracts | | | $ | 221,985 | | | $ | (1,102,889 | ) |
| | | | | | | | | | | | | | | | | | | | | | | | |
Net unrealized appreciation (depreciation) | | | | | | | $ | (880,904 | ) |
| | | | | | | | | | | | | | | | | | | | | | | | | | | | |
aMay be comprised of multiple contracts with the same counterparty, currency and settlement date.
See Note 11 regarding other derivative information.
See Abbreviations on page MGD-32.
| | | | |
| | | |
| MGD- 16 | | Semiannual Report | The accompanying notes are an integral part of these financial statements. | | |
FRANKLIN TEMPLETON VARIABLE INSURANCE PRODUCTS TRUST
FINANCIAL STATEMENTS
Statement of Assets and Liabilities
June 30, 2020 (unaudited)
| | | | |
| | | Franklin Mutual
Global Discovery
VIP Fund | |
Assets: | | | | |
Investments in securities: | | | | |
Cost - Unaffiliated issuers | | $ | 439,737,193 | |
| | | | |
Value - Unaffiliated issuers | | $ | 437,712,279 | |
Cash | | | 159,574 | |
Receivables: | | | | |
Investment securities sold | | | 3,500,602 | |
Capital shares sold | | | 328,635 | |
Dividends and interest | | | 1,512,037 | |
European Union tax reclaims | | | 323,586 | |
Deposits with brokers for: | | | | |
Futures contracts | | | 766,705 | |
Unrealized appreciation on OTC forward exchange contracts | | | 221,985 | |
Other assets | | | 436 | |
| | | | |
| |
Total assets | | | 444,525,839 | |
| | | | |
Liabilities: | | | | |
Payables: | | | | |
Investment securities purchased | | | 2,556,590 | |
Capital shares redeemed | | | 376,998 | |
Management fees | | | 324,159 | |
Distribution fees | | | 93,946 | |
Trustees’ fees and expenses | | | 266 | |
Variation margin on futures contracts | | | 84,556 | |
Unrealized depreciation on OTC forward exchange contracts | | | 1,102,889 | |
Accrued expenses and other liabilities | | | 164,510 | |
| | | | |
| |
Total liabilities | | | 4,703,914 | |
| | | | |
| |
Net assets, at value | | $ | 439,821,925 | |
| | | | |
Net assets consist of: | | | | |
Paid-in capital | | $ | 429,236,675 | |
Total distributable earnings (losses) | | | 10,585,250 | |
| | | | |
| |
Net assets, at value | | $ | 439,821,925 | |
| | | | |
| Class 1: | | | | |
Net assets, at value | | $ | 3,065,102 | |
| | | | |
Shares outstanding | | | 202,754 | |
| | | | |
Net asset value and maximum offering price per share | | | $15.12 | |
| | | | |
| Class 2: | | | | |
Net assets, at value | | $ | 412,640,974 | |
| | | | |
Shares outstanding | | | 28,252,674 | |
| | | | |
Net asset value and maximum offering price per share | | | $14.61 | |
| | | | |
| Class 4: | | | | |
Net assets, at value | | $ | 24,115,849 | |
| | | | |
Shares outstanding | | | 1,614,021 | |
| | | | |
Net asset value and maximum offering price per share | | | $14.94 | |
| | | | |
| | | | | | |
| | | |
| | The accompanying notes are an integral part of these financial statements. | Semiannual Report | | | MGD-17 | |
FRANKLIN TEMPLETON VARIABLE INSURANCE PRODUCTS TRUST
FINANCIAL STATEMENTS
Statement of Operations
for the six months ended June 30, 2020 (unaudited)
| | | | |
| | | Franklin Mutual
Global Discovery
VIP Fund | |
Investment income: | | | | |
Dividends:(net of foreign taxes)* | | | | |
Unaffiliated issuers | | $ | 11,415,997 | |
Interest: | | | | |
Unaffiliated issuers | | | 382,971 | |
Adjustment for uncollectible interest (Note 7) | | | (404,250 | ) |
Income from securities loaned: | | | | |
Non-controlled affiliates (Note 3e) | | | 1,064 | |
| | | | |
| |
Total investment income | | | 11,395,782 | |
| | | | |
Expenses: | | | | |
Management fees (Note 3a) | | | 2,048,477 | |
Distribution fees: (Note 3c) | | | | |
Class 2 | | | 549,594 | |
Class 4 | | | 44,168 | |
Custodian fees (Note 4) | | | 12,054 | |
Reports to shareholders | | | 49,719 | |
Professional fees | | | 57,177 | |
Trustees’ fees and expenses | | | 1,691 | |
Dividends on securities sold short | | | 55,552 | |
Other | | | 15,373 | |
| | | | |
| |
Total expenses | | | 2,833,805 | |
Expense reductions (Note 4) | | | (2,438 | ) |
Expenses waived/paid by affiliates (Note 3e) | | | (392 | ) |
| | | | |
| |
Net expenses | | | 2,830,975 | |
| | | | |
| |
Net investment income | | | 8,564,807 | |
| | | | |
Realized and unrealized gains (losses): | | | | |
Net realized gain (loss) from: | | | | |
Investments: | | | | |
Unaffiliated issuers | | | (16,150,154 | ) |
Foreign currency transactions | | | 22,651 | |
Forward exchange contracts | | | 936,222 | |
Futures contracts | | | 219,169 | |
Securities sold short | | | (293,748 | ) |
| | | | |
| |
Net realized gain (loss) | | | (15,265,860 | ) |
| | | | |
| |
Net change in unrealized appreciation (depreciation) on: | | | | |
Investments: | | | | |
Unaffiliated issuers | | | (112,740,294 | ) |
Translation of other assets and liabilities denominated in foreign currencies | | | (10,093 | ) |
Forward exchange contracts | | | 493,454 | |
Futures contracts | | | 761,318 | |
Securities sold short | | | 374,951 | |
| | | | |
| |
Net change in unrealized appreciation (depreciation) | | | (111,120,664 | ) |
| | | | |
| |
Net realized and unrealized gain (loss) | | | (126,386,524 | ) |
| | | | |
| |
Net increase (decrease) in net assets resulting from operations | | $ | (117,821,717 | ) |
| | | | |
| |
*Foreign taxes withheld on dividends | | $ | 301,515 | |
| | | | |
| | | |
| MGD-18 | | Semiannual Report | The accompanying notes are an integral part of these financial statements. | | |
FRANKLIN TEMPLETON VARIABLE INSURANCE PRODUCTS TRUST
FINANCIAL STATEMENTS
Statements of Changes in Net Assets
| | | | | | | | |
| | | Franklin Mutual Global Discovery VIP Fund | |
| | |
| | | Six Months Ended
June 30, 2020
(unaudited) | | | Year Ended
December 31, 2019 | |
Increase (decrease) in net assets: | | | | | | | | |
Operations: | | | | | | | | |
Net investment income | | $ | 8,564,807 | | | $ | 11,110,516 | |
Net realized gain (loss) | | | (15,265,860 | ) | | | 10,200,575 | |
Net change in unrealized appreciation (depreciation) | | | (111,120,664 | ) | | | 100,899,252 | |
| | | | |
| | |
Net increase (decrease) in net assets resulting from operations | | | (117,821,717 | ) | | | 122,210,343 | |
| | | | |
Distributions to shareholders: | | | | | | | | |
Class 1 | | | — | | | | (427,555 | ) |
Class 2 | | | — | | | | (61,286,007 | ) |
Class 4 | | | — | | | | (3,431,154 | ) |
| | | | |
| | |
Total distributions to shareholders | | | — | | | | (65,144,716 | ) |
| | | | |
| | |
Capital share transactions: (Note 2) | | | | | | | | |
Class 1 | | | (24,744 | ) | | | 231,219 | |
Class 2 | | | (16,256,228 | ) | | | (14,266,368 | ) |
Class 4 | | | (578,181 | ) | | | (2,510,695 | ) |
| | | | |
| | |
Total capital share transactions | | | (16,859,153 | ) | | | (16,545,844 | ) |
| | | | |
| | |
Net increase (decrease) in net assets | | | (134,680,870 | ) | | | 40,519,783 | |
Net assets: | | | | | | | | |
Beginning of period | | | 574,502,795 | | | | 533,983,012 | |
| | | | |
| | |
End of period | | $ | 439,821,925 | | | $ | 574,502,795 | |
| | | | |
| | | | | | |
| | | |
| | The accompanying notes are an integral part of these financial statements. | Semiannual Report | | | MGD-19 | |
FRANKLIN TEMPLETON VARIABLE INSURANCE PRODUCTS TRUST
Notes to Financial Statements (unaudited)
Franklin Mutual Global Discovery VIP Fund
1. Organization and Significant Accounting Policies
Franklin Templeton Variable Insurance Products Trust (Trust) is registered under the Investment Company Act of 1940 (1940 Act) as an open-end management investment company, consisting of eighteen separate funds and applies the specialized accounting and reporting guidance in U.S. Generally Accepted Accounting Principles (U.S. GAAP). Franklin Mutual Global Discovery VIP Fund (Fund) is included in this report. Shares of the Fund are generally sold only to insurance company separate accounts to fund the benefits of variable life insurance policies or variable annuity contracts. At June 30, 2020, 43.5% of the Fund’s shares were held through one insurance company. Investment activities of these insurance company separate accounts could have a material impact on the Fund. The Fund offers three classes of shares: Class 1, Class 2, and Class 4. Each class of shares may differ by its distribution fees, voting rights on matters affecting a single class and its exchange privilege.
The following summarizes the Fund’s significant accounting policies.
a. Financial Instrument Valuation
The Fund’s investments in financial instruments are carried at fair value daily. Fair value is the price that would be received to sell an asset or paid to transfer a liability in an orderly transaction between market participants on the measurement date. The Fund calculates the net asset value (NAV) per share each business day as of 4 p.m. Eastern time or the regularly scheduled close of the New York Stock Exchange (NYSE), whichever is earlier. Under compliance policies and procedures approved by the Trust’s Board of Trustees (the Board), the Fund’s administrator has responsibility for oversight of valuation, including leading the cross-functional Valuation Committee (VC). The Fund may utilize independent pricing services, quotations from securities and financial instrument dealers, and other market sources to determine fair value.
Equity securities and derivative financial instruments listed on an exchange or on the NASDAQ National Market System are valued at the last quoted sale price or the official closing price of the day, respectively. Foreign equity securities are valued as of the close of trading on the foreign stock exchange on which the security is primarily traded, or as of 4 p.m. Eastern time. The value is then converted into its U.S. dollar equivalent at the foreign exchange rate in effect at 4 p.m. Eastern time on the day that the value of the security is
determined. Over-the-counter (OTC) securities are valued within the range of the most recent quoted bid and ask prices. Securities that trade in multiple markets or on multiple exchanges are valued according to the broadest and most representative market. Certain equity securities are valued based upon fundamental characteristics or relationships to similar securities.
Debt securities generally trade in the OTC market rather than on a securities exchange. The Fund’s pricing services use multiple valuation techniques to determine fair value. In instances where sufficient market activity exists, the pricing services may utilize a market-based approach through which quotes from market makers are used to determine fair value. In instances where sufficient market activity may not exist or is limited, the pricing services also utilize proprietary valuation models which may consider market characteristics such as benchmark yield curves, credit spreads, estimated default rates, anticipated market interest rate volatility, coupon rates, anticipated timing of principal repayments, underlying collateral, and other unique security features in order to estimate the relevant cash flows, which are then discounted to calculate the fair value.
Investments in open-end mutual funds are valued at the closing NAV. Investments in repurchase agreements are valued at cost, which approximates fair value.
Certain derivative financial instruments trade in the OTC market. The Fund’s pricing services use various techniques including industry standard option pricing models and proprietary discounted cash flow models to determine the fair value of those instruments. The Fund’s net benefit or obligation under the derivative contract, as measured by the fair value of the contract, is included in net assets.
The Fund has procedures to determine the fair value of financial instruments for which market prices are not reliable or readily available. Under these procedures, the Fund primarily employs a market-based approach which may use related or comparable assets or liabilities, recent transactions, market multiples, book values, and other relevant information for the investment to determine the fair value of the investment. An income-based valuation approach may also be used in which the anticipated future cash flows of the investment are discounted to calculate fair value. Discounts may also be applied due to the nature or duration of any restrictions on the disposition of the investments. Due to the
FRANKLIN TEMPLETON VARIABLE INSURANCE PRODUCTS TRUST
FINANCIAL STATEMENTS
Franklin Mutual Global Discovery VIP Fund (continued)
inherent uncertainty of valuations of such investments, the fair values may differ significantly from the values that would have been used had an active market existed.
Trading in securities on foreign securities stock exchanges and OTC markets may be completed before 4 p.m. Eastern time. In addition, trading in certain foreign markets may not take place on every Fund’s business day. Events can occur between the time at which trading in a foreign security is completed and 4 p.m. Eastern time that might call into question the reliability of the value of a portfolio security held by the Fund. As a result, differences may arise between the value of the Fund’s portfolio securities as determined at the foreign market close and the latest indications of value at 4 p.m. Eastern time. In order to minimize the potential for these differences, an independent pricing service may be used to adjust the value of the Fund’s portfolio securities to the latest indications of fair value at 4 p.m. Eastern time. At June 30, 2020, certain securities may have been fair valued using these procedures, in which case the securities were categorized as Level 2 inputs within the fair value hierarchy. See the Fair Value Measurements note for more information.
When the last day of the reporting period is a non-business day, certain foreign markets may be open on those days that the Fund’s NAV is not calculated, which could result in differences between the value of the Fund’s portfolio securities on the last business day and the last calendar day of the reporting period. Any significant security valuation changes due to an open foreign market are adjusted and reflected by the Fund for financial reporting purposes.
b. Foreign Currency Translation
Portfolio securities and other assets and liabilities denominated in foreign currencies are translated into U.S. dollars based on the exchange rate of such currencies against U.S. dollars on the date of valuation. The Fund may enter into foreign currency exchange contracts to facilitate transactions denominated in a foreign currency. Purchases and sales of securities, income and expense items denominated in foreign currencies are translated into U.S. dollars at the exchange rate in effect on the transaction date. Portfolio securities and assets and liabilities denominated in foreign currencies contain risks that those currencies will decline in value relative to the U.S. dollar. Occasionally, events may impact the availability or reliability of foreign exchange rates used to convert the U.S. dollar equivalent
value. If such an event occurs, the foreign exchange rate will be valued at fair value using procedures established and approved by the Board.
The Fund does not separately report the effect of changes in foreign exchange rates from changes in market prices on securities held. Such changes are included in net realized and unrealized gain or loss from investments in the Statement of Operations.
Realized foreign exchange gains or losses arise from sales of foreign currencies, currency gains or losses realized between the trade and settlement dates on securities transactions and the difference between the recorded amounts of dividends, interest, and foreign withholding taxes and the U.S. dollar equivalent of the amounts actually received or paid. Net unrealized foreign exchange gains and losses arise from changes in foreign exchange rates on foreign denominated assets and liabilities other than investments in securities held at the end of the reporting period.
c. Securities Purchased on a When-Issued or Delayed Delivery Basis
The Fund purchases securities on a when-issued or delayed delivery basis, with payment and delivery scheduled for a future date. These transactions are subject to market fluctuations and are subject to the risk that the value at delivery may be more or less than the trade date purchase price. Although the Fund will generally purchase these securities with the intention of holding the securities, it may sell the securities before the settlement date. Sufficient assets have been segregated for these securities.
d. Derivative Financial Instruments
The Fund invested in derivative financial instruments in order to manage risk or gain exposure to various other investments or markets. Derivatives are financial contracts based on an underlying or notional amount, require no initial investment or an initial net investment that is smaller than would normally be required to have a similar response to changes in market factors, and require or permit net settlement. Derivatives contain various risks including the potential inability of the counterparty to fulfill their obligations under the terms of the contract, the potential for an illiquid secondary market, and/or the potential for market movements which expose the Fund to gains or losses in excess of the amounts shown in the Statement of Assets and Liabilities. Realized gain and loss
FRANKLIN TEMPLETON VARIABLE INSURANCE PRODUCTS TRUST
FINANCIAL STATEMENTS
Franklin Mutual Global Discovery VIP Fund (continued)
1. Organization and Significant Accounting Policies (continued)
d. Derivative Financial Instruments (continued)
and unrealized appreciation and depreciation on these contracts for the period are included in the Statement of Operations.
Derivative counterparty credit risk is managed through a formal evaluation of the creditworthiness of all potential counterparties. The Fund attempts to reduce its exposure to counterparty credit risk on OTC derivatives, whenever possible, by entering into International Swaps and Derivatives Association (ISDA) master agreements with certain counterparties. These agreements contain various provisions, including but not limited to collateral requirements, events of default, or early termination. Termination events applicable to the counterparty include certain deteriorations in the credit quality of the counterparty. Termination events applicable to the Fund include failure of the Fund to maintain certain net asset levels and/or limit the decline in net assets over various periods of time. In the event of default or early termination, the ISDA master agreement gives the non-defaulting party the right to net and close-out all transactions traded, whether or not arising under the ISDA agreement, to one net amount payable by one counterparty to the other. However, absent an event of default or early termination, OTC derivative assets and liabilities are presented gross and not offset in the Statement of Assets and Liabilities. Early termination by the counterparty may result in an immediate payment by the Fund of any net liability owed to that counterparty under the ISDA agreement. At June 30, 2020, the Fund had OTC derivatives in a net liability position of $881,624 and the aggregate value of collateral pledged for such contracts was $910,870.
Collateral requirements differ by type of derivative. Collateral or initial margin requirements are set by the broker or exchange clearing house for exchange traded and centrally cleared derivatives. Initial margin deposited is held at the exchange and can be in the form of cash and/or securities. For OTC derivatives traded under an ISDA master agreement, posting of collateral is required by either the Fund or the applicable counterparty if the total net exposure of all OTC derivatives with the applicable counterparty exceeds the minimum transfer amount, which typically ranges from $100,000 to $250,000, and can vary depending on the counterparty and the type of the agreement. Generally, collateral is determined at the close of Fund business each
day and any additional collateral required due to changes in derivative values may be delivered by the Fund or the counterparty the next business day, or within a few business days. Collateral pledged and/or received by the Fund for OTC derivatives, if any, is held in segregated accounts with the Fund’s custodian/counterparty broker and can be in the form of cash and/or securities. Unrestricted cash may be invested according to the Fund’s investment objectives. To the extent that the amounts due to the Fund from its counterparties are not subject to collateralization or are not fully collateralized, the Fund bears the risk of loss from counterparty non-performance.
The Fund entered into exchange traded futures contracts primarily to manage exposure to certain foreign currencies. A futures contract is an agreement between the Fund and a counterparty to buy or sell an asset at a specified price on a future date. Required initial margins are pledged by the Fund, and the daily change in fair value is accounted for as a variation margin payable or receivable in the Statement of Assets and Liabilities.
The Fund entered into OTC forward exchange contracts primarily to manage exposure to certain foreign currencies. A forward exchange contract is an agreement between the Fund and a counterparty to buy or sell a foreign currency at a specific exchange rate on a future date.
See Note 11 regarding other derivative information.
e. Securities Sold Short
The Fund is engaged in selling securities short, which obligates the Fund to replace a borrowed security with the same security at current fair value. The Fund incurs a loss if the price of the security increases between the date of the short sale and the date on which the Fund replaces the borrowed security. The Fund realizes a gain if the price of the security declines between those dates. Gains are limited to the price at which the Fund sold the security short, while losses are potentially unlimited in size.
The Fund is required to establish a margin account with the broker lending the security sold short. While the short sale is outstanding, the broker retains the proceeds of the short sale to the extent necessary to meet margin requirements until the short position is closed out. A deposit must also be maintained with the Fund’s custodian/counterparty broker consisting of cash and/or securities having a value equal to a specified percentage of the value of the securities sold short.
FRANKLIN TEMPLETON VARIABLE INSURANCE PRODUCTS TRUST
FINANCIAL STATEMENTS
Franklin Mutual Global Discovery VIP Fund (continued)
The Fund is obligated to pay fees for borrowing the securities sold short and is required to pay the counterparty any dividends and/or interest due on securities sold short. Such dividends and/or interest and any security borrowing fees are recorded as an expense to the Fund. At June 30, 2020, the Fund had no securities sold short.
f. Securities Lending
The Fund participates in an agency based securities lending program to earn additional income. The Fund receives cash collateral against the loaned securities in an amount equal to at least 102% of the fair value of the loaned securities. Collateral is maintained over the life of the loan in an amount not less than 100% of the fair value of loaned securities, as determined at the close of Fund business each day; any additional collateral required due to changes in security values is delivered to the Fund on the next business day. The collateral is deposited into a joint cash account with other funds and is used to invest in a money market fund managed by Franklin Advisers, Inc., an affiliate of the Fund. The Fund may receive income from the investment of cash collateral, in addition to lending fees and rebates paid by the borrower. Income from securities loaned, net of fees paid to the securities lending agent and/or third-party vendor, is reported separately in the Statement of Operations. The Fund bears the market risk with respect to the collateral investment, securities loaned, and the risk that the agent may default on its obligations to the Fund. If the borrower defaults on its obligation to return the securities loaned, the Fund has the right to repurchase the securities in the open market using the collateral received. The securities lending agent has agreed to indemnify the Fund in the event of default by a third party borrower. At June 30, 2020, the Fund had no securities on loan.
g. Senior Floating Rate Interests
The Fund invests in senior secured corporate loans that pay interest at rates which are periodically reset by reference to a base lending rate plus a spread. These base lending rates are generally the prime rate offered by a designated U.S. bank or the London InterBank Offered Rate (LIBOR). Senior secured corporate loans often require prepayment of principal from excess cash flows or at the discretion of the borrower. As a result, actual maturity may be substantially less than the stated maturity. Senior secured corporate loans in which the Fund invests are generally readily marketable, but may be subject to certain restrictions on resale. On
July 27, 2017, the United Kingdom’s Financial Conduct Authority announced its intention to cease sustaining LIBOR after 2021. There remains uncertainty regarding the future utilization of LIBOR and the nature of any replacement rate. As such, the potential effect of a transition away from LIBOR on the Fund or the Fund’s investments that use or may use a floating rate based on LIBOR cannot yet be determined.
h. Income and Deferred Taxes
It is the Fund’s policy to qualify as a regulated investment company under the Internal Revenue Code. The Fund intends to distribute to shareholders substantially all of its taxable income and net realized gains to relieve it from federal income and if applicable, excise taxes. As a result, no provision for U.S. federal income taxes is required.
The Fund may be subject to foreign taxation related to income received, capital gains on the sale of securities and certain foreign currency transactions in the foreign jurisdictions in which it invests. Foreign taxes, if any, are recorded based on the tax regulations and rates that exist in the foreign markets in which the Fund invests. When a capital gain tax is determined to apply, the Fund records an estimated deferred tax liability in an amount that would be payable if the securities were disposed of on the valuation date.
As a result of several court cases, in certain countries across the European Union, the Fund filed additional tax reclaims for previously withheld taxes on dividends earned in those countries (EU reclaims). These additional filings are subject to various administrative proceedings by the local jurisdictions’ tax authorities within the European Union, as well as a number of related judicial proceedings. Income recognized, if any, for EU reclaims is reflected as other income in the Statement of Operations and any related receivable, if any, is reflected as European Union tax reclaims in the Statement of Assets and Liabilities. When uncertainty exists as to the ultimate resolution of these proceedings, the likelihood of receipt of these EU reclaims, and the potential timing of payment, no amounts are reflected in the financial statements. For U.S. income tax purposes, when EU reclaims are received by the Fund and the Fund previously passed foreign tax credit on to its shareholders, the Fund must either amend historic tax reporting to shareholders or enter into a closing agreement with the Internal Revenue Service (IRS) in order to pay the associated tax liability on behalf of the Fund’s shareholders.
FRANKLIN TEMPLETON VARIABLE INSURANCE PRODUCTS TRUST
FINANCIAL STATEMENTS
Franklin Mutual Global Discovery VIP Fund (continued)
1. Organization and Significant Accounting Policies (continued)
h. Income and Deferred Taxes (continued)
The Fund may recognize an income tax liability related to its uncertain tax positions under U.S. GAAP when the uncertain tax position has a less than 50% probability that it will be sustained upon examination by the tax authorities based on its technical merits. As of June 30, 2020, the Fund has determined that no tax liability is required in its financial statements related to uncertain tax positions for any open tax years (or expected to be taken in future tax years). Open tax years are those that remain subject to examination and are based on the statute of limitations in each jurisdiction in which the Fund invests.
i. Security Transactions, Investment Income, Expenses and Distributions
Security transactions are accounted for on trade date. Realized gains and losses on security transactions are determined on a specific identification basis. Interest income and estimated expenses are accrued daily. Amortization of premium and accretion of discount on debt securities are included in interest income. Dividend income and dividends declared on securities sold short are recorded on the ex-dividend date except for certain dividends from securities where the dividend rate is not available. In such cases, the dividend is recorded as soon as the information is received by the Fund. Distributions to shareholders are recorded on the ex-dividend date. Distributable earnings are determined according to income tax regulations (tax basis) and may differ from earnings recorded in accordance with U.S. GAAP. These differences may be permanent or temporary. Permanent differences are reclassified among capital accounts to reflect their tax character. These reclassifications have no impact on net assets or the results of operations. Temporary differences are not reclassified, as they may reverse in subsequent periods.
Common expenses incurred by the Trust are allocated among the Funds based on the ratio of net assets of each Fund to the combined net assets of the Trust or based on the ratio of number of shareholders of each Fund to the combined number of shareholders of the Trust. Fund specific expenses are charged directly to the Fund that incurred the expense.
Realized and unrealized gains and losses and net investment income, excluding class specific expenses, are allocated daily to each class of shares based upon the relative proportion of net assets of each class. Differences in per share distributions by class are generally due to differences in class specific expenses.
j. Accounting Estimates
The preparation of financial statements in accordance with U.S. GAAP requires management to make estimates and assumptions that affect the reported amounts of assets and liabilities at the date of the financial statements and the amounts of income and expenses during the reporting period. Actual results could differ from those estimates.
k. Guarantees and Indemnifications
Under the Trust’s organizational documents, its officers and trustees are indemnified by the Trust against certain liabilities arising out of the performance of their duties to the Trust. Additionally, in the normal course of business, the Trust, on behalf of the Fund, enters into contracts with service providers that contain general indemnification clauses. The Trust’s maximum exposure under these arrangements is unknown as this would involve future claims that may be made against the Trust that have not yet occurred. Currently, the Trust expects the risk of loss to be remote.
FRANKLIN TEMPLETON VARIABLE INSURANCE PRODUCTS TRUST
FINANCIAL STATEMENTS
Franklin Mutual Global Discovery VIP Fund (continued)
2. Shares of Beneficial Interest
At June 30, 2020, there were an unlimited number of shares authorized (without par value). Transactions in the Fund’s shares were as follows:
| | | | | | | | | | | | | | | | | | | | |
| | | Six Months Ended June 30, 2020 | | | | | | Year Ended December 31, 2019 | |
| | | | |
| | | | | |
| | | Shares | | | Amount | | | | | | Shares | | | Amount | |
| |
| | | | | |
| Class 1 Shares: | | | | | | | | | | | | | | | | | | | | |
Shares sold | | | 18,126 | | | $ | 275,922 | | | | | | | | 24,462 | | | $ | 464,734 | |
Shares issued in reinvestment of distributions | | | — | | | | — | | | | | | | | 24,488 | | | | 427,555 | |
Shares redeemed | | | (17,724 | ) | | | (300,666 | ) | | | | | | | (34,522 | ) | | | (661,070) | |
| | | | |
| | | | | |
Net increase (decrease) | | | 402 | | | $ | (24,744 | ) | | | | | | | 14,428 | | | $ | 231,219 | |
| | | | |
| | | | | |
| Class 2 Shares: | | | | | | | | | | | | | | | | | | | | |
Shares sold | | | 1,459,013 | | | $ | 20,082,823 | | | | | | | | 753,358 | | | $ | 13,863,507 | |
Shares issued in reinvestment of distributions | | | — | | | | — | | | | | | | | 3,626,391 | | | | 61,286,007 | |
Shares redeemed | | | (2,320,626 | ) | | | (36,339,051 | ) | | | | | | | (4,790,566 | ) | | | (89,415,882) | |
| | | | |
| | | | | |
Net increase (decrease) | | | (861,613 | ) | | $ | (16,256,228 | ) | | | | | | | (410,817 | ) | | $ | (14,266,368) | |
| | | | |
| | | | | |
| Class 4 Shares: | | | | | | | | | | | | | | | | | | | | |
Shares sold | | | 131,469 | | | $ | 1,791,616 | | | | | | | | 22,659 | | | $ | 428,560 | |
Shares issued in reinvestment of distributions | | | — | | | | — | | | | | | | | 198,332 | | | | 3,431,154 | |
Shares redeemed | | | (144,056 | ) | | | (2,369,797 | ) | | | | | | | (334,363 | ) | | | (6,370,409) | |
| | | | |
| | | | | |
Net increase (decrease) | | | (12,587 | ) | | $ | (578,181 | ) | | | | | | | (113,372 | ) | | $ | (2,510,695) | |
| | | | |
3. Transactions with Affiliates
Franklin Resources, Inc. is the holding company for various subsidiaries that together are referred to as Franklin Templeton. Certain officers and trustees of the Fund are also officers and/or directors of the following subsidiaries:
| | |
| |
| Subsidiary | | Affiliation |
Franklin Mutual Advisers, LLC (Franklin Mutual) | | Investment manager |
Franklin Templeton Services, LLC (FT Services) | | Administrative manager |
Franklin Templeton Distributors, Inc. (Distributors) | | Principal underwriter |
Franklin Templeton Investor Services, LLC (Investor Services) | | Transfer agent |
FRANKLIN TEMPLETON VARIABLE INSURANCE PRODUCTS TRUST
FINANCIAL STATEMENTS
Franklin Mutual Global Discovery VIP Fund (continued)
3. Transactions with Affiliates (continued)
a. Management Fees
The Fund pays an investment management fee to Franklin Mutual based on the average daily net assets of the Fund as follows:
| | |
| |
| Annualized Fee Rate | | Net Assets |
0.875% | | Up to and including $4 billion |
0.845% | | Over $4 billion, up to and including $7 billion |
0.825% | | Over $7 billion, up to and including $10 billion |
0.805% | | Over $10 billion, up to and including $13 billion |
0.785% | | Over $13 billion, up to and including $16 billion |
0.765% | | Over $16 billion, up to and including $19 billion |
0.745% | | Over $19 billion, up to and including $22 billion |
0.725% | | Over $22 billion, up to and including $25 billion |
0.705% | | Over $25 billion, up to and including $28 billion |
0.685% | | In excess of $28 billion |
b. Administrative Fees
Under an agreement with Franklin Mutual, FT Services provides administrative services to the Fund. The fee is paid by Franklin Mutual based on the Fund’s average daily net assets, and is not an additional expense of the Fund.
c. Distribution Fees
The Board has adopted distribution plans for Class 2 and Class 4 shares pursuant to Rule 12b-1 under the 1940 Act. Under the Fund’s compensation distribution plans, the Fund pays Distributors for costs incurred in connection with the servicing, sale and distribution of the Fund’s shares up to 0.35% per year of its average daily net assets of each class. The Board has agreed to limit the current rate to 0.25% per year for Class 2. The plan year, for purposes of monitoring compliance with the maximum annual plan rates, is February 1 through January 31.
d. Transfer Agent Fees
Investor Services, under terms of an agreement, performs shareholder servicing for the Fund and is not paid by the Fund for the services.
FRANKLIN TEMPLETON VARIABLE INSURANCE PRODUCTS TRUST
FINANCIAL STATEMENTS
Franklin Mutual Global Discovery VIP Fund (continued)
e. Investments in Affiliated Management Investment Companies
The Fund invests in one or more affiliated management investment companies for purposes other than exercising a controlling influence over the management or policies. Management fees paid by the Fund are waived on assets invested in the affiliated management investment companies, as noted in the Statement of Operations, in an amount not to exceed the management and administrative fees paid directly or indirectly by each affiliate. During the period ended June 30, 2020, the Fund held investments in affiliated management investment companies as follows:
| | | | | | | | | | | | | | | | | | | | | | | | | | | | | | | | |
| | | | | | | | |
| | | Value at
Beginning
of Period | | | Purchases | | | Sales | | | Realized
Gain (Loss) | | | Net Change in
Unrealized
Appreciation
(Depreciation) | | | Value at
End of
Period | | | Number of
Shares
Held at End
of Period | | | Income from
securities loaned | |
Non-Controlled Affiliates | | | | | | | | | | | | | | | | | | | | | | | | | | | | | | | | |
Institutional Fiduciary Trust Money Market Portfolio, 0.00% | | | $ — | | | | $5,503,000 | | | | $(5,503,000) | | | | $ — | | | | $ — | | | | $ — | | | | — | | | | $1,064 | |
| | | | | | | | | | | | |
4. Expense Offset Arrangement
The Fund has entered into an arrangement with its custodian whereby credits realized as a result of uninvested cash balances are used to reduce a portion of the Fund’s custodian expenses. During the period ended June 30, 2020, the custodian fees were reduced as noted in the Statement of Operations.
5. Income Taxes
At June 30, 2020, the cost of investments and net unrealized appreciation (depreciation) for income tax purposes were as follows:
| | | | |
Cost of investments | | $ | 439,767,840 | |
| | | | |
| |
Unrealized appreciation | | $ | 60,106,053 | |
Unrealized depreciation | | | (62,614,923) | |
| | | | |
| |
Net unrealized appreciation (depreciation) | | $ | (2,508,870) | |
| | | | |
Differences between income and/or capital gains as determined on a book basis and a tax basis are primarily due to differing treatments of foreign currency transactions and pass-through entity income.
6. Investment Transactions
Purchases and sales of investments (excluding short term securities and securities sold short) for the period ended June 30, 2020, aggregated $87,351,219 and $97,603,018, respectively.
7. Credit Risk and Defaulted Securities
The Fund may purchase the pre-default or defaulted debt of distressed companies. Distressed companies are financially troubled and could be or are already involved in financial restructuring or bankruptcy. Risks associated with purchasing these securities include the possibility that the bankruptcy or other restructuring process takes longer than expected, or that distributions in restructuring are less than anticipated, either or both of which may result in unfavorable consequences to the
FRANKLIN TEMPLETON VARIABLE INSURANCE PRODUCTS TRUST
FINANCIAL STATEMENTS
Franklin Mutual Global Discovery VIP Fund (continued)
7. Credit Risk and Defaulted Securities (continued)
Fund. If it becomes probable that the income on debt securities, including those of distressed companies, will not be collected, the Fund discontinues accruing income and recognizes an adjustment for uncollectible interest. For the period ended June 30, 2020, the Fund recorded an adjustment for uncollectible interest of $404,250 as noted in the Statement of Operations.
At June 30, 2020, the aggregate long value of distressed company securities for which interest recognition has been discontinued was $2,676,702, representing 0.6% of the Fund’s net assets. For information as to specific securities, see the accompanying Statement of Investments.
8. Concentration of Risk
Investing in foreign securities may include certain risks and considerations not typically associated with investing in U.S. securities, such as fluctuating currency values and changing local, regional and global economic, political and social conditions, which may result in greater market volatility. Current political and financial uncertainty surrounding the European Union may increase market volatility and the economic risk of investing in securities in Europe. In addition, certain foreign securities may not be as liquid as U.S. securities.
9. Novel Coronavirus Pandemic
The global outbreak of the novel coronavirus disease, known as COVID-19, has caused adverse effects on many companies, sectors, nations, regions and the markets in general, and may continue for an unpredictable duration. The effects of this pandemic may materially impact the value and performance of the Fund, its ability to buy and sell fund investments at appropriate valuations and its ability to achieve its investment objectives.
10. Restricted Securities
The Fund invests in securities that are restricted under the Securities Act of 1933 (1933 Act). Restricted securities are often purchased in private placement transactions, and cannot be sold without prior registration unless the sale is pursuant to an exemption under the 1933 Act. Disposal of these securities may require greater effort and expense, and prompt sale at an acceptable price may be difficult. The Fund may have registration rights for restricted securities. The issuer generally incurs all registration costs.
At June 30, 2020, investments in restricted securities, excluding securities exempt from registration under the 1933 Act, were as follows:
| | | | | | | | | | | | | | |
| | | | |
| Shares | | Issuer | | Acquisition
Date | | | Cost | | | Value | |
| 424,073 | | International Automotive Components Group Brazil LLC (Value is 0.0%† of Net Assets) | | | 4/13/06 - 12/26/08 | | | $ | 281,629 | | | $ | 7,974 | |
| | | | | | | | | | |
†Rounds to less than 0.1% of net assets.
FRANKLIN TEMPLETON VARIABLE INSURANCE PRODUCTS TRUST
FINANCIAL STATEMENTS
Franklin Mutual Global Discovery VIP Fund (continued)
11. Other Derivative Information
At June 30, 2020, investments in derivative contracts are reflected in the Statement of Assets and Liabilities as follows:
| | | | | | | | | | | | |
| | |
| | | Asset Derivatives | | | Liability Derivatives | |
| | | | |
Derivative Contracts
Not Accounted for as
Hedging Instruments | | Statement of Assets and Liabilities Location | | Fair Value | | | Statement of Assets and Liabilities Location | | Fair Value | |
Foreign exchange contracts | | Variation margin on futures contracts | | $
| 426,867
| a
| | Variation margin on futures contracts | | $ | — | |
| | Unrealized appreciation on OTC forward exchange contracts | | | 221,985 | | | Unrealized depreciation on OTC forward exchange contracts | | | 1,102,889 | |
| | | | | | | | | | | | |
| | | | |
Totals | | | | $ | 648,852 | | | | | $ | 1,102,889 | |
| | | | | | | | | | | | |
aThis amount reflects the cumulative appreciation (depreciation) of futures contracts as reported in the Statement of Investments. Only the variation margin receivable/payable at period end is separately reported within the Statement of Assets and Liabilities. Prior variation margin movements were recorded to cash upon receipt or payment.
For the period ended June 30, 2020, the effect of derivative contracts in the Statement of Operations was as follows:
| | | | | | | | | | | | |
| | | | |
Derivative Contracts
Not Accounted for as
Hedging Instruments | | Statement of
Operations Location | | Net Realized
Gain (Loss) for
the Period | | | Statement of
Operations Location | | Net Change in
Unrealized
Appreciation
(Depreciation)
for the Period | |
| | Net realized gain (loss) from: | | | | | | Net change in unrealized appreciation (depreciation) on: | | | | |
| | | | |
Foreign exchange contracts | | Forward exchange contracts | | | $ 936,222 | | | Forward exchange contracts | | | $ 493,454 | |
| | | | |
| | Futures contracts | | | 219,169 | | | Futures contracts | | | 761,318 | |
| | | | | | | | | | | | |
| | | | |
Totals | | | | | $1,155,391 | | | | | | $1,254,772 | |
| | | | | | | | | | | | |
For the period ended June 30, 2020, the average month end notional amount of futures contracts represented $34,606,397. The average month end contract value of forward exchange contracts was $86,068,276.
See Note 1(d) regarding derivative financial instruments.
12. Credit Facility
The Fund, together with other U.S. registered and foreign investment funds (collectively, Borrowers), managed by Franklin Templeton, are borrowers in a joint syndicated senior unsecured credit facility totaling $2 billion (Global Credit Facility) which matures on February 5, 2021. This Global Credit Facility provides a source of funds to the Borrowers for temporary and emergency purposes, including the ability to meet future unanticipated or unusually large redemption requests.
Under the terms of the Global Credit Facility, the Fund shall, in addition to interest charged on any borrowings made by the Fund and other costs incurred by the Fund, pay its share of fees and expenses incurred in connection with the implementation and maintenance of the Global Credit Facility, based upon its relative share of the aggregate net assets of all of the Borrowers, including an annual commitment fee of 0.15% based upon the unused portion of the Global Credit Facility. These fees are reflected in other expenses in the Statement of Operations. During the period ended June 30, 2020, the Fund did not use the Global Credit Facility.
FRANKLIN TEMPLETON VARIABLE INSURANCE PRODUCTS TRUST
FINANCIAL STATEMENTS
Franklin Mutual Global Discovery VIP Fund (continued)
13. Fair Value Measurements
The Fund follows a fair value hierarchy that distinguishes between market data obtained from independent sources (observable inputs) and the Fund’s own market assumptions (unobservable inputs). These inputs are used in determining the value of the Fund’s financial instruments and are summarized in the following fair value hierarchy:
| | • | | Level 1 – quoted prices in active markets for identical financial instruments |
| | • | | Level 2 – other significant observable inputs (including quoted prices for similar financial instruments, interest rates, prepayment speed, credit risk, etc.) |
| | • | | Level 3 – significant unobservable inputs (including the Fund’s own assumptions in determining the fair value of financial instruments) |
The input levels are not necessarily an indication of the risk or liquidity associated with financial instruments at that level.
FRANKLIN TEMPLETON VARIABLE INSURANCE PRODUCTS TRUST
FINANCIAL STATEMENTS
Franklin Mutual Global Discovery VIP Fund (continued)
A summary of inputs used as of June 30, 2020, in valuing the Fund’s assets and liabilities carried at fair value, is as follows:
| | | | | | | | | | | | | | | | |
| | | | |
| | | Level 1 | | | Level 2 | | | Level 3 | | | Total | |
| Assets: | | | | | | | | | | | | | | | | |
Investments in Securities:a | | | | | | | | | | | | | | | | |
Equity Investments:b | | | | | | | | | | | | | | | | |
Aerospace & Defense | | $ | — | | | $ | 5,466,177 | | | $ | — | | | $ | 5,466,177 | |
Auto Components | | | — | | | | — | | | | 7,974 | | | | 7,974 | |
Automobiles | | | 3,015,760 | | | | 11,276,333 | | | | — | | | | 14,292,093 | |
Banks | | | 21,050,083 | | | | 10,437,729 | | | | — | | | | 31,487,812 | |
Capital Markets | | | — | | | | 13,423,925 | | | | — | | | | 13,423,925 | |
Chemicals | | | — | | | | 12,457,473 | | | | — | | | | 12,457,473 | |
Construction Materials | | | — | | | | 5,573,748 | | | | — | | | | 5,573,748 | |
Diversified Financial Services | | | 12,124,121 | | | | 2,073,009 | | | | — | | | | 14,197,130 | |
Hotels, Restaurants & Leisure | | | — | | | | 4,917,513 | | | | — | | | | 4,917,513 | |
Insurance | | | 13,565,201 | | | | 16,408,090 | | | | — | | | | 29,973,291 | |
Machinery | | | — | | | | 3,765,939 | | | | — | | | | 3,765,939 | |
Media | | | 11,651,623 | | | | — | | | | 11,399 | | | | 11,663,022 | |
Oil, Gas & Consumable Fuels | | | 22,082,638 | �� | | | 17,400,170 | | | | — | | | | 39,482,808 | |
Pharmaceuticals | | | 37,127,253 | | | | 14,853,032 | | | | — | | | | 51,980,285 | |
Semiconductors & Semiconductor Equipment | | | — | | | | 5,665,443 | | | | — | | | | 5,665,443 | |
Software | | | 17,851,820 | | | | 6,474 | | | | — | | | | 17,858,294 | |
Specialty Retail | | | — | | | | 1,497,406 | | | | — | | | | 1,497,406 | |
Technology Hardware, Storage & Peripherals | | | 7,353,270 | | | | 13,683,342 | | | | — | | | | 21,036,612 | |
Textiles, Apparel & Luxury Goods | | | — | | | | 3,666,391 | | | | — | | | | 3,666,391 | |
Tobacco | | | 7,482,970 | | | | 9,694,430 | | | | — | | | | 17,177,400 | |
Wireless Telecommunication Services | | | — | | | | 3,605,672 | | | | — | | | | 3,605,672 | |
All Other Equity Investments | | | 94,091,363 | | | | — | | | | — | | | | 94,091,363 | |
Corporate Bonds, Notes and Senior Floating | | | | | | | | | | | | | | | | |
Rate Interests | | | — | | | | 8,546,281 | | | | — | | | | 8,546,281 | |
Corporate Notes in Reorganization | | | — | | | | 2,676,702 | | | | — | | | | 2,676,702 | |
Companies in Liquidation | | | — | | | | — | | | | 3,252c | | | | 3,252 | |
Short Term Investments | | | 19,498,273 | | | | 3,700,000 | | | | — | | | | 23,198,273 | |
| | | | |
Total Investments in Securities | | $ | 266,894,375 | | | $ | 170,795,279 | | | $ | 22,625 | | | $ | 437,712,279 | |
| | | | |
Other Financial Instruments: | | | | | | | | | | | | | | | | |
Futures Contracts | | $ | 426,867 | | | $ | — | | | $ | — | | | $ | 426,867 | |
Forward Exchange Contracts | | | — | | | | 221,985 | | | | — | | | | 221,985 | |
| | | | |
Total Other Financial Instruments | | $ | 426,867 | | | $ | 221,985 | | | $ | — | | | $ | 648,852 | |
| | | | |
| Liabilities: | | | | | | | | | | | | | | | | |
Other Financial Instruments: | | | | | | | | | | | | | | | | |
Forward Exchange Contracts | | $ | — | | | $ | 1,102,889 | | | $ | — | | | $ | 1,102,889 | |
| | | | |
aFor detailed categories, see the accompanying Statement of Investments.
bIncludes common and preferred stocks as well as other equity interests.
cIncludes securities determined to have no value at June 30, 2020.
A reconciliation in which Level 3 inputs are used in determining fair value is presented when there are significant Level 3 assets and liabilities at the beginning and/or end of the period.
FRANKLIN TEMPLETON VARIABLE INSURANCE PRODUCTS TRUST
FINANCIAL STATEMENTS
Franklin Mutual Global Discovery VIP Fund (continued)
14. New Accounting Pronouncements
In March 2020, the Financial Accounting Standards Board issued Accounting Standards Update (ASU) No. 2020-04, Reference Rate Reform (Topic 848) – Facilitation of the Effects of Reference Rate Reform on Financial Reporting. The amendments in the ASU provides optional temporary financial reporting relief from the effect of certain types of contract modifications due to the planned discontinuation of LIBOR and other interbank-offered based reference rates as of the end of 2021. The ASU is effective for certain reference rate-related contract modifications that occur during the period March 12, 2020 through December 31, 2022. Management is currently evaluating the impact, if any, of applying this ASU.
15. Subsequent Events
The Fund has evaluated subsequent events through the issuance of the financial statements and determined that no events have occurred that require disclosure.
Abbreviations
| | | | | | | | | | | | |
| | | |
| Counterparty | | Currency | | Selected Portfolio | | |
| | | | | | |
| BOFA | | Bank of America Corp. | | EUR | | Euro | | ADR | | American Depositary Receipt | | |
| | | | | | |
| BONY | | Bank of New York | | GBP | | British Pound | | FHLB | | Federal Home Loan Bank | | |
| | | | | | |
| HSBK | | HSBC Bank PLC | | USD | | United States Dollar | | | | | | |
| | | | | | |
| SSBT | | State Street Bank and Trust Co., N.A. | | | | | | | | | | |
| | | | | | |
| UBSW | | UBS AG | | | | | | | | | | |
Franklin Mutual Shares VIP Fund
This semiannual report for Franklin Mutual Shares VIP Fund covers the period ended June 30, 2020.
Class 4 Performance Summary as of June 30, 2020
The Fund’s Class 4 Shares posted a -21.22% total return for the six-month period ended June 30, 2020.
Performance reflects the Fund’s Class 4 operating expenses, but does not include any contract fees, expenses or sales charges. If they had been included, performance would be lower. These charges and deductions, particularly for variable life policies, can have a significant effect on contract values and insurance benefits. See the contract prospectus for a complete description of these expenses, including sales charges.
Performance data represent past performance, which does not guarantee future results. Investment return and principal value will fluctuate, and you may have a gain or loss when you sell your shares. Current performance may differ from figures shown.
FRANKLIN MUTUAL SHARES VIP FUND
Fund Goal and Main Investments
The Fund’s principal investment goal is capital appreciation. Its secondary goal is income. Under normal market conditions, the Fund invests primarily in U.S. and foreign equity securities that we believe are available at market prices less than their intrinsic value. The equity securities in which the Fund invests are primarily common stock, with a current focus on companies with market capitalizations greater than $5 billion. To a lesser extent, the Fund also invests in merger arbitrage securities and the debt and equity of distressed companies. The Fund may invest up to 35% of its assets in foreign securities, which may include sovereign debt and participations in foreign government debt.
Fund Risks
All investments involve risks, including possible loss of principal. Unexpected events and their aftermaths, such as the spread of deadly diseases; natural, environmental or man-made disasters; financial, political or social disruptions; terrorism and war; and other tragedies or catastrophes, can cause investor fear and panic, which can adversely affect the economies of many companies, sectors, nations, regions and the market in general, in ways that cannot necessarily be foreseen. Value securities may not increase in price as anticipated or may decline further in value. The Fund’s investments in foreign securities involve more risks than investing in U.S. securities, including currency exchange rates and policies, country or government specific issues, less favorable trading practices regulation and greater price volatility. Securities issued by smaller and midsize companies may be more volatile in price than those of larger companies, involve substantial risks and should be considered speculative. Derivatives involve costs and can create economic leverage in the Fund’s portfolio which may result in significant volatility and cause the Fund to participate in losses (as well as gains) in an amount that exceeds the Fund’s initial investment. The Fund may also invest in companies engaged in mergers, reorganizations or liquidations, which involve special risks as pending deals may not be completed on time or on favorable terms, as well as lower-rated bonds, which entail higher credit risk. To the extent that the Fund focuses on particular countries, regions, industries, sectors or types of investment from time to time, the Fund may be subject to greater risks of adverse developments in such areas of focus than a fund that invests
Geographic Composition*
Based on Total Net Assets as of 6/30/20
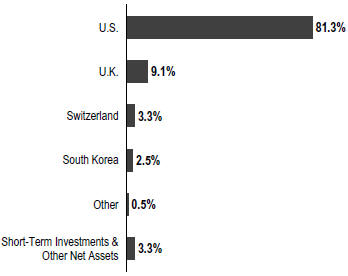
*Figures are stated as a percentage of total and may not equal 100% or may be negative due to rounding, use of any derivatives, unsettled trades or other factors.
in a wider variety of countries, regions, industries, sectors or investments. The Fund is actively managed but there is no guarantee that the manager’s investment decisions will produce the desired results. The Fund’s prospectus also includes a description of the main investment risks.
Performance Overview
You can find the Fund’s six-month total return in the Performance Summary. In comparison, the Fund’s benchmark, the Standard & Poor’s® 500 Index (S&P 500®) posted a -3.08% total return for the period under review.1
Economic and Market Overview
Global developed and emerging market equities, as measured by the MSCI All Country World Index, posted a -5.99% total return during the six months under review.1 Stocks fell sharply in early 2020 as countries around the world implemented lockdown measures in an effort to slow the spread of the novel coronavirus (COVID-19). Global supply chain disruptions, business and personal restrictions, and subdued consumer spending drove many investors to sell equity holdings in favor of perceived safe investments such as government bonds and cash. While global equities, notably in the U.S., rebounded in April and May amid optimism about easing lockdown restrictions, concerns about
1. Source: Morningstar. One cannot invest directly in an index, and an index is not representative of the Fund’s portfolio. Please see Index Descriptions following the Fund Summaries.
The dollar value, number of shares or principal amount, and names of all portfolio holdings are listed in the Fund’s Statement of Investments (SOI).
FRANKLIN MUTUAL SHARES VIP FUND
a second wave of infections hindered equities in June, as investors weighed the possibility of renewed restrictions.
In the U.S., government mandates to mitigate the COVID-19 pandemic severely impacted the economy beginning in March 2020. As a result, the unemployment rate surged to 14.7% in April, as many businesses, particularly those involved in hospitality, retail and travel, announced mass layoffs.2 According to the National Bureau of Economic Research, the longest U.S. economic expansion in history ended in February 2020 as the country slipped into a severe recession. Nonetheless, near period-end, there were signs that a recovery was underway, as jobless claims fell considerably from their peak in early April, retail sales rose sharply in May, and the unemployment rate fell to 11.1% in June.2 Along with optimism about improved treatments and potential vaccines for COVID-19, the positive economic signals contributed to a significant equity rebound in April and May. However, an increase in COVID-19 infections in many states throughout June pressured U.S. stocks.
The U.S. Federal Reserve (Fed) made significant efforts to support the U.S. economy. In March 2020, as the pandemic began to severely impact the economy and financial markets, the Fed implemented two emergency rate cuts, lowering the federal funds target rate to a range of 0.00%–0.25%, and announced sweeping quantitative easing measures aimed at ensuring credit flow to borrowers and supporting credit markets with unlimited amounts of bond purchasing.
In the eurozone, some analysts forecasted a significant contraction in 2020, particularly in southern European countries, as the magnitude of the economic disruption caused by the pandemic became apparent. European developed market equities, as measured by the MSCI Europe Index, posted a -12.43% total return for the period.1 To stimulate growth, the European Central Bank implemented a broad bond-buying program, and many countries passed fiscal stimulus measures.
Asian developed and emerging market equities, as measured by the MSCI All Country Asia Index, posted a -5.51% total return during the six-month period.1 The onset of the pandemic brought dramatically slower economic activity in Asia, as businesses halted operations and manufacturing and export activity declined sharply in the region’s major economies. Asian markets generally advanced toward period-end, bolstered by fiscal stimulus measures and economies reopening throughout the region.
Top 10 Sectors/Industries
6/30/20
| | |
| |
| | | % of Total
Net Assets |
| |
| Pharmaceuticals | | 10.7% |
| |
| Banks | | 6.7% |
| |
| Media | | 6.2% |
| |
| Oil, Gas & Consumable Fuels | | 5.8% |
| |
| Insurance | | 5.4% |
| |
| Technology Hardware, Storage & Peripherals | | 4.3% |
| |
| Food Products | | 4.2% |
| |
| Software | | 3.4% |
| |
| Tobacco | | 3.3% |
| |
| Food & Staples Retailing | | 3.3% |
Emerging market stocks, as measured by the MSCI Emerging Markets Index, posted a -9.67% total return due primarily to the COVID-19 pandemic.1 A sharp decrease in prices for oil and other natural resources also hurt emerging market economies reliant on these exports. In the last quarter of the reporting period, however, investor optimism led to a stock rally, particularly in emerging market countries that had successfully lowered infection rates.
Investment Strategy
At Franklin Mutual Advisors, we are committed to our distinctive value approach to investing. Our major investment strategy is investing in undervalued stocks. When selecting undervalued equities, we are attracted to what we believe are fundamentally strong companies with healthy balance sheets, high-quality assets, substantial free cash flow and shareholder-oriented management teams and whose stocks are trading at discounts to our assessment of the companies’ intrinsic or business value. We also look for asset-rich companies whose shares may be trading at depressed levels due to concerns over short-term earnings disappointments, litigation, management strategy or other perceived negatives. While the vast majority of our undervalued equity investments are made in publicly traded companies globally, we may invest occasionally in privately held companies as well. Our portfolio selection process generally includes an assessment of the potential impacts of any material environmental, social and governance (ESG) factors on the long-term risk and return profile of a company.
We complement this more traditional investment strategy with two others. One is distressed investing, which is complex and can take many forms. The most common
2. Source: U.S. Bureau of Labor Statistics.
FRANKLIN MUTUAL SHARES VIP FUND
distressed investment the Fund undertakes is the purchase of financially troubled or bankrupt companies’ debt at a substantial discount to face value. After the financially distressed company is reorganized, often in bankruptcy court, the old debt is typically replaced with new securities issued by the financially stronger company.
The other piece of our investment strategy is participating in arbitrage situations, another highly specialized field. When companies announce proposed mergers or takeovers, commonly referred to as “deals,” the target company may trade at a discount to the bid it ultimately accepts. One form of arbitrage involves purchasing the target company’s stock when it is trading below the value we believe it would receive in a deal. In keeping with our commitment to a relatively conservative investment approach, we typically focus our arbitrage efforts on announced deals, and eschew rumored deals or other situations we consider relatively risky.
In addition, it is our practice to hedge the Fund’s currency exposure when we deem it advantageous for our shareholders.
Manager’s Discussion
The novel coronavirus (COVID-19) pandemic has significantly altered our way of life, although the market indexes would suggest that it is business as usual. Stocks have rallied off the March 23 market bottom and are within range of the pre-pandemic, all-time highs achieved earlier in the year. While the economy has reopened, the recovery is likely to be uneven. The question that we wrestle with daily is what does this scenario mean for equities in general and value stocks in particular?
As markets rose sharply in April, investors moved back into the growth stocks that propelled the market to the all-time highs of January. In late May, however, there was a turn in market sentiment resulting in value briefly outperforming growth. Undervalued stocks often benefit in periods of improving economic activity or stabilization as business prospects improve. Increasing demand across the economy, especially in cyclical sectors, can provide a tailwind for these companies and drive shareholder value. This is a scenario that often occurs off an economic bottom, and we are positioning our portfolios to capitalize on this trend.
The second-quarter earnings reporting season (occurring in July and August) marks the first period with the full impact of the economic lockdowns and will provide a more complete view into the pandemic’s impact on corporate statements. Many financial officers withdrew full-year 2020 guidance, as they reported first-quarter results, due to limited revenue
visibility. As a result, the path ahead for stocks is less clear. We remain cautious amid these elevated risks.
Our traditional value equity investment approach is complemented with two other strategies: distressed investing and merger arbitrage.
Within our distressed credit strategy, we targeted companies and industries directly impacted by the coronavirus pandemic. The robust government fiscal and monetary intervention have limited the number of attractive options, but we have found opportunities in the energy sector and the retail and travel industries. Although each situation is unique, these securities have strong collateral packages and covenant protections or other features that we believe make them substantially more attractive than the broad array of available distressed debt.
Within merger arbitrage, which involves trading the stocks of companies involved in a merger or acquisition (M&A), activity has slowed significantly since the onset of the pandemic. Deal terms agreed to before the virus emerged have become unbalanced and are now more favorable for sellers than they are for buyers. Not surprisingly, some of these proposals have become embroiled in litigation. Also, M&A activity has slowed as the economic realities of the coronavirus get priced into the market, and bankers are challenged to conduct due diligence remotely. As the period ended, we began to see signs that transactions activity might resume, but we would expect the second half of the year to be focused on resolving pending deals, rather than significant growth in new ones.
Fund Performance
Turning to Fund performance, investments that detracted included U.S.-based companies American International Group (AIG; not held at period-end), Wells Fargo and Citigroup.
Shares of insurer AIG retreated as COVID-19 concerns and a lack of clarity on forward guidance related to expenses and investment income contributed to negative investor sentiment. The stock initially rallied following the company’s first-quarter earnings call at which management revealed that the majority of its property policies—which include coverage for business interruption—contained exclusions for losses related to viruses.
The shares of diversified financial services company Wells Fargo were pulled down by negative investor sentiment for financials, which have trailed the broader market rally from the March 23 bottom. Concerns about a possible dividend cut as bank earnings have come under pressure, and
FRANKLIN MUTUAL SHARES VIP FUND
speculation about the Fed moving to negative interest rates—subsequently refuted by Fed Chairman Jerome Powell—contributed to the selloff. Earlier in the period, management reported year-end 2019 earnings that fell well short of consensus estimates.
The stocks of a number of U.S. banks, including Citigroup, sold off during the period as concern about the economic effects of COVID-19 and Fed interest-rate cuts led to negative sentiment for financials. The Fed’s decision in late June to cap bank dividends and curtail stock buybacks—as part of its stress test review of large banks—also contributed to the bearish outlook. During the period, Citigroup reported a sharp drop in first-quarter profit, although earnings per share was relatively in line with expectations. A year-over-year increase in revenue was driven by strong capital markets revenue but was offset by a significant rise in loan loss provision. Earlier in the period, management reported fourth-quarter 2019 earnings that surpassed consensus forecasts.
During the period under review, Fund investments that contributed positively to performance included U.S.-based companies Eli Lilly, NortonLifeLock and Kraft Heinz.
Shares of pharmaceutical products company Eli Lilly were volatile but climbed during the period. Investor sentiment improved as the market came to the realization that the company’s business may not be meaningfully impacted by the disruption caused by the COVID-19 pandemic. First-quarter financial results exceeded consensus sales and earnings expectations, with revenues benefiting from customers stocking up amid COVID-19, which is likely to reverse later in the year. Management raised 2020 guidance for earnings per share and reiterated the outlook for revenue and operating margin. In our view, Eli Lilly has a strong drug pipeline with several important compounds that positions the company well for continued growth over time.
Shares of cybersecurity solutions provider NortonLifeLock outperformed during the period as work-from-home requirements attributable to the COVID-19 pandemic led to increased consumer purchases of the company’s cybersecurity subscriptions, generating solid fiscal fourth-quarter earnings that were in line with consensus expectations. NortonLifeLock’s stock rallied entering the year and surged after management announced in early January the payment of a one-time, $12 per share cash dividend funded by the 2019 sale of the enterprise security business to Broadcom. Symantec, the precursor to NortonLifeLock, sold the business as part of its transition to a pure-play consumer-focused cybersecurity company, and management subsequently adopted the NortonLifeLock brand.
Top 10 Holdings
6/30/20
| | |
| |
Company Sector/Industry, Country | | % of Total
Net Assets |
| |
Charter Communications Inc. Media, U.S. | | 2.9% |
| |
Medtronic PLC Health Care Equipment & Supplies, U.S. | | 2.8% |
| |
Merck & Co. Inc. Pharmaceuticals, U.S. | | 2.6% |
| |
Samsung Electronics Co. Ltd. Technology Hardware, Storage & Peripherals, South Korea | | 2.5% |
| |
British American Tobacco PLC Tobacco, U.K. | | 2.4% |
| |
GlaxoSmithKline PLC Pharmaceuticals, U.K. | | 2.4% |
| |
The KraftHeinz Co. Food Products, U.S. | | 2.3% |
| |
Novartis AG Pharmaceuticals, Switzerland | | 2.2% |
| |
The Kroger Co. Food & Staples Retailing, U.S. | | 2.2% |
| |
Oracle Corp. Software, U.S. | | 2.2% |
Investors bid up shares of food products producer Kraft Heinz as surging demand for its products led to better-than-expected sales growth. Management raised its sales guidance in a business update early in the period, and financial results in the subsequent quarterly earnings report exceeded consensus estimates. The company reaffirmed the dividend payment, which also contributed to positive investor sentiment, and several analysts upgraded Kraft Heinz stock.
During the period, the Fund held currency forwards and futures seeking to hedge most of the currency risk of the portfolio’s non-U.S. dollar investments. The hedges had a positive overall impact on the Fund’s performance.
Thank you for your participation in Franklin Mutual Shares VIP Fund. We look forward to serving your future investment needs.
FRANKLIN MUTUAL SHARES VIP FUND
The foregoing information reflects our analysis, opinions and portfolio holdings as of June 30, 2020, the end of the reporting period. The way we implement our main investment strategies and the resulting portfolio holdings may change depending on factors such as market and economic conditions. These opinions may not be relied upon as investment advice or an offer for a particular security. The information is not a complete analysis of every aspect of any market, country, industry, security or the Fund. Statements of fact are from sources considered reliable, but the investment manager makes no representation or warranty as to their completeness or accuracy. Although historical performance is no guarantee of future results, these insights may help you understand our investment management philosophy.
FRANKLIN MUTUAL SHARES VIP FUND
Class 4 Fund Expenses
As an investor in a variable insurance contract (Contract) that indirectly provides for investment in an underlying mutual fund, you can incur transaction and/or ongoing expenses at both the Fund level and the Contract Level: (1) transaction expenses can include sales charges (loads) on purchases, surrender fees, transfer fees and premium taxes; and (2) ongoing expenses can include management fees, distribution and service (12b-1) fees, contract fees, annual maintenance fees, mortality and expense risk fees and other fees and expenses. All mutual funds and Contracts have some types of ongoing expenses. The table below shows Fund-level ongoing expenses and can help you understand these costs and compare them with those of other mutual funds offered through the Contract. The table assumes a $1,000 investment held for the six months indicated. Please refer to the Fund prospectus for additional information on operating expenses.
Actual Fund Expenses
The table below provides information about the actual account values and actual expenses in the columns under the heading “Actual.” In these columns the Fund’s actual return, which includes the effect of ongoing Fund expenses but does not include the effect of ongoing Contract expenses, is used to calculate the “Ending Account Value.” You can estimate the Fund-level expenses you paid during the period by following these steps (of course, your account value and expenses will differ from those in this illustration): Divide your account value by $1,000 (if your account had an $8,600 value, then $8,600 ÷ $1,000 = 8.6). Then multiply the result by the number under the headings “Actual” and “Fund-Level Expenses Paid During Period” (if Fund-Level Expenses Paid During Period were $ 7.50, then 8.6 x $ 7.50 = $64.50). In this illustration, the estimated expenses paid this period at the Fund level are $64.50.
Hypothetical Example for Comparison with Other Mutual Funds
Under the heading “Hypothetical” in the table, information is provided about hypothetical account values and hypothetical expenses based on the Fund’s actual expense ratio and an assumed rate of return of 5% per year before expenses, which is not the Fund’s actual return. This information may not be used to estimate the actual ending account balance or expenses you paid for the period, but it can help you compare ongoing costs of investing in the Fund with those of other mutual funds offered through the Contract. To do so, compare this 5% hypothetical example with the 5% hypothetical examples that appear in the shareholder reports of other funds offered through the Contract.
Please note that expenses shown in the table are meant to highlight ongoing costs at the Fund level only and do not reflect any ongoing expenses at the Contract level, or transaction expenses at either the Fund or Contract levels. In addition, while the Fund does not have transaction expenses, if the transaction and ongoing expenses at the Contract level were included, the expenses shown below would be higher. You should consult your Contract prospectus or disclosure document for more information.
| | | | | | | | | | | | | | | | | | |
| | | | | | | |
| | | | | | | Actual (actual return after expenses) | | | | Hypothetical (5% annual return before expenses) | | | | |
Share Class | | Beginning
Account
Value 1/1/20 | | | | Ending Account Value 6/30/20 | | Fund-Level
Expenses
Paid During
Period
1/1/20–6/30/201, 2 | | | | Ending Account Value 6/30/20 | | Fund-Level
Expenses Paid During Period 1/1/20–6/30/201, 2 | | | | Net
Annualized
Expense
Ratio2 |
Class 4 | | $1,000 | | | | $787.80 | | $4.85 | | | | $1,019.44 | | $5.47 | | | | 1.09% |
1. Expenses are equal to the annualized expense ratio for the six-month period as indicated above—in the far right column—multiplied by the simple average account value over the period indicated, and then multiplied by 182/366 to reflect the one-half year period.
2. Reflects expenses after fee waivers and expense reimbursements. Does not include any ongoing expenses of the Contract for which the Fund is an investment option or acquired fund fees and expenses.
FRANKLIN TEMPLETON VARIABLE INSURANCE PRODUCTS TRUST
Financial Highlights
Franklin Mutual Shares VIP Fund
| | | | | | | | | | | | | | | | | | | | | | | | |
| | |
| | | Six Months Ended
June 30, 2020 (unaudited) | | | Year Ended December 31, | |
| | | 2019 | | | 2018 | | | 2017 | | | 2016 | | | 2015 | |
| | | | | | |
Class 1 | | | | | | | | | | | | | | | | | | | | | | | | |
| | | | | | |
Per share operating performance (for a share outstanding throughout the period) | | | | | | | | | | | | | | | | | | | | | | | | |
| | | | | | |
Net asset value, beginning of period | | | $19.19 | | | | $17.71 | | | | $20.71 | | | | $20.40 | | | | $19.48 | | | | $22.91 | |
| | | | |
| | | | | | |
| Income from investment operationsa: | | | | | | | | | | | | | | | | | | | | | | | | |
| | | | | | |
Net investment incomeb | | | 0.35c | | | | 0.46 | | | | 0.36 | | | | 0.49 | | | | 0.50 | | | | 0.44 | |
| | | | | | |
Net realized and unrealized gains (losses) | | | (4.40 | ) | | | 3.39 | | | | (2.04 | ) | | | 1.22 | | | | 2.56 | | | | (1.54 | ) |
| | | | |
| | | | | | |
Total from investment operations | | | (4.05 | ) | | | 3.85 | | | | (1.68 | ) | | | 1.71 | | | | 3.06 | | | | (1.10 | ) |
| | | | |
| | | | | | |
| Less distributions from: | | | | | | | | | | | | | | | | | | | | | | | | |
| | | | | | |
Net investment income | | | — | | | | (0.42 | ) | | | (0.55 | ) | | | (0.53 | ) | | | (0.46 | ) | | | (0.77 | ) |
| | | | | | |
Net realized gains | | | — | | | | (1.95 | ) | | | (0.77 | ) | | | (0.87 | ) | | | (1.68 | ) | | | (1.56 | ) |
| | | | |
| | | | | | |
Total distributions | | | — | | | | (2.37 | ) | | | (1.32 | ) | | | (1.40 | ) | | | (2.14 | ) | | | (2.33 | ) |
| | | | |
| | | | | | |
Net asset value, end of period | | | $15.14 | | | | $19.19 | | | | $17.71 | | | | $20.71 | | | | $20.40 | | | | $19.48 | |
| | | | |
| | | | | | |
Total returnd | | | (21.10)% | | | | 22.92% | | | | (8.86)% | | | | 8.64% | | | | 16.35% | | | | (4.69)% | |
| | | | | | |
| Ratios to average net assetse | | | | | | | | | | | | | | | | | | | | | | | | |
| | | | | | |
Expensesf,g | | | 0.74% | | | | 0.71% | | | | 0.71% | | | | 0.72% | | | | 0.72% | | | | 0.73% | |
| | | | | | |
Expenses incurred in connection with securities sold short | | | 0.03% | | | | 0.02% | | | | 0.01% | | | | —% | | | | 0.01% | | | | 0.02% | |
| | | | | | |
Net investment income | | | 4.48%c | | | | 2.35% | | | | 1.77% | | | | 2.34% | | | | 2.57% | | | | 2.00% | |
| | | | | | |
| Supplemental data | | | | | | | | | | | | | | | | | | | | | | | | |
| | | | | | |
Net assets, end of period (000’s) | | | $130,207 | | | | $158,431 | | | | $537,324 | | | | $653,700 | | | | $610,395 | | | | $643,438 | |
| | | | | | |
Portfolio turnover rate | | | 19.67% | | | | 38.50% | | | | 24.67% | | | | 18.32% | | | | 24.45% | | | | 19.88% | |
aThe amount shown for a share outstanding throughout the period may not correlate with the Statement of Operations for the period due to the timing of sales and repurchases of the Fund’s shares in relation to income earned and/or fluctuating fair value of the investments of the Fund.
bBased on average daily shares outstanding.
cNet investment income per share includes approximately $0.18 per share related to income received in the form of special dividends in connection with certain Fund holdings. Excluding this amount, the ratio of net investment income to average net assets would have been 2.23%.
dTotal return does not include fees, charges or expenses imposed by the variable annuity and life insurance contracts for which Franklin Templeton Variable Insurance Products Trust serves as an underlying investment vehicle. Total return is not annualized for periods less than one year.
eRatios are annualized for periods less than one year.
fIncludes dividend and/or interest expense on securities sold short and security borrowing fees, if any. See below for the ratios of such expenses to average net assets for the periods presented. See Note 1(f).
gBenefit of waiver and payments by affiliates and expense reduction rounds to less than 0.01%.
| | | | |
| | | |
| MS-8 | | Semiannual Report | The accompanying notes are an integral part of these financial statements. | | |
FRANKLIN TEMPLETON VARIABLE INSURANCE PRODUCTS TRUST
FINANCIAL HIGHLIGHTS
Franklin Mutual Shares VIP Fund (continued)
| | | | | | | | | | | | | | | | | | | | | | | | |
| | |
| | | Six Months Ended June 30, 2020
(unaudited) | | | Year Ended December 31, | |
| | | 2019 | | | 2018 | | | 2017 | | | 2016 | | | 2015 | |
| | | | | | |
Class 2 | | | | | | | | | | | | | | | | | | | | | | | | |
| | | | | | |
Per share operating performance (for a share outstanding throughout the period) | | | | | | | | | | | | | | | | | | | | | | | | |
| | | | | | |
Net asset value, beginning of period | | | $18.81 | | | | $17.40 | | | | $20.36 | | | | $20.08 | | | | $19.20 | | | | $22.60 | |
| | | | |
| | | | | | |
| Income from investment operationsa: | | | | | | | | | | | | | | | | | | | | | | | | |
| | | | | | |
Net investment incomeb | | | 0.33c | | | | 0.40 | | | | 0.31 | | | | 0.43 | | | | 0.45 | | | | 0.38 | |
| | | | | | |
Net realized and unrealized gains (losses) | | | (4.32 | ) | | | 3.32 | | | | (2.00 | ) | | | 1.20 | | | | 2.52 | | | | (1.51 | ) |
| | | | |
| | | | | | |
Total from investment operations | | | (3.99 | ) | | | 3.72 | | | | (1.69 | ) | | | 1.63 | | | | 2.97 | | | | (1.13 | ) |
| | | | |
| | | | | | |
| Less distributions from: | | | | | | | | | | | | | | | | | | | | | | | | |
| | | | | | |
Net investment income | | | — | | | | (0.36 | ) | | | (0.50 | ) | | | (0.48 | ) | | | (0.41 | ) | | | (0.71 | ) |
| | | | | | |
Net realized gains | | | — | | | | (1.95 | ) | | | (0.77 | ) | | | (0.87 | ) | | | (1.68 | ) | | | (1.56 | ) |
| | | | |
| | | | | | |
Total distributions | | | — | | | | (2.31 | ) | | | (1.27 | ) | | | (1.35 | ) | | | (2.09 | ) | | | (2.27 | ) |
| | | | |
| | | | | | |
Net asset value, end of period | | | $14.82 | | | | $18.81 | | | | $17.40 | | | | $20.36 | | | | $20.08 | | | | $19.20 | |
| | | | |
| | | | | | |
Total returnd | | | (21.21)% | | | | 22.57% | | | | (9.07)% | | | | 8.35% | | | | 16.06% | | | | (4.94)% | |
| | | | | | |
| Ratios to average net assetse | | | | | | | | | | | | | | | | | | | | | | | | |
| | | | | | |
Expensesf,g | | | 0.99% | | | | 0.96% | | | | 0.96% | | | | 0.97% | | | | 0.97% | | | | 0.98% | |
| | | | | | |
Expenses incurred in connection with securities sold short | | | 0.03% | | | | 0.02% | | | | 0.01% | | | | —% | | | | 0.01% | | | | 0.02% | |
| | | | | | |
Net investment income | | | 4.23%c | | | | 2.10% | | | | 1.52% | | | | 2.09% | | | | 2.32% | | | | 1.75% | |
| | | | | | |
| Supplemental data | | | | | | | | | | | | | | | | | | | | | | | | |
| | | | | | |
Net assets, end of period (000’s) | | | $2,138,640 | | | | $2,931,753 | | | | $2,516,834 | | | | $3,476,913 | | | | $3,621,358 | | | | $3,353,505 | |
| | | | | | |
Portfolio turnover rate | | | 19.67% | | | | 38.50% | | | | 24.67% | | | | 18.32% | | | | 24.45% | | | | 19.88% | |
aThe amount shown for a share outstanding throughout the period may not correlate with the Statement of Operations for the period due to the timing of sales and repurchases of the Fund’s shares in relation to income earned and/or fluctuating fair value of the investments of the Fund.
bBased on average daily shares outstanding.
cNet investment income per share includes approximately $0.18 per share related to income received in the form of special dividends in connection with certain Fund holdings. Excluding this amount, the ratio of net investment income to average net assets would have been 1.98%.
dTotal return does not include fees, charges or expenses imposed by the variable annuity and life insurance contracts for which Franklin Templeton Variable Insurance Products Trust serves as an underlying investment vehicle. Total return is not annualized for periods less than one year.
eRatios are annualized for periods less than one year.
fIncludes dividend and/or interest expense on securities sold short and security borrowing fees, if any. See below for the ratios of such expenses to average net assets for the periods presented. See Note 1(f).
gBenefit of waiver and payments by affiliates and expense reduction rounds to less than 0.01%.
| | | | | | |
| | | |
| | The accompanying notes are an integral part of these financial statements. | Semiannual Report | | | MS-9 | |
FRANKLIN TEMPLETON VARIABLE INSURANCE PRODUCTS TRUST
FINANCIAL HIGHLIGHTS
Franklin Mutual Shares VIP Fund (continued)
| | | | | | | | | | | | | | | | | | | | | | | | |
| | |
| | | Six Months Ended June 30, 2020
(unaudited) | | | Year Ended December 31, | |
| | | 2019 | | | 2018 | | | 2017 | | | 2016 | | | 2015 | |
| | | | | | |
Class 4 | | | | | | | | | | | | | | | | | | | | | | | | |
| | | | | | |
Per share operating performance (for a share outstanding throughout the period) | | | | | | | | | | | | | | | | | | | | | | | | |
| | | | | | |
Net asset value, beginning of period | | | $18.99 | | | | $17.55 | | | | $20.53 | | | | $20.23 | | | | $19.32 | | | | $22.72 | |
| | | | |
| | | | | | |
| Income from investment operationsa: | | | | | | | | | | | | | | | | | | | | | | | | |
| | | | | | |
Net investment incomeb | | | 0.31c | | | | 0.38 | | | | 0.29 | | | | 0.41 | | | | 0.44 | | | | 0.36 | |
| | | | | | |
Net realized and unrealized gains (losses) | | | (4.34 | ) | | | 3.36 | | | | (2.02 | ) | | | 1.21 | | | | 2.53 | | | | (1.52 | ) |
| | | | |
| | | | | | |
Total from investment operations | | | (4.03 | ) | | | 3.74 | | | | (1.73 | ) | | | 1.62 | | | | 2.97 | | | | (1.16 | ) |
| | | | |
| | | | | | |
| Less distributions from: | | | | | | | | | | | | | | | | | | | | | | | | |
| | | | | | |
Net investment income | | | — | | | | (0.35 | ) | | | (0.48 | ) | | | (0.45 | ) | | | (0.38 | ) | | | (0.68 | ) |
| | | | | | |
Net realized gains | | | — | | | | (1.95 | ) | | | (0.77 | ) | | | (0.87 | ) | | | (1.68 | ) | | | (1.56 | ) |
| | | | |
| | | | | | |
Total distributions | | | — | | | | (2.30 | ) | | | (1.25 | ) | | | (1.32 | ) | | | (2.06 | ) | | | (2.24 | ) |
| | | | |
| | | | | | |
Net asset value, end of period | | | $14.96 | | | | $18.99 | | | | $17.55 | | | | $20.53 | | | | $20.23 | | | | $19.32 | |
| | | | |
| | | | | | |
Total returnd | | | (21.22)% | | | | 22.44% | | | | (9.16)% | | | | 8.25% | | | | 15.94% | | | | (5.05)% | |
| | | | | | |
| Ratios to average net assetse | | | | | | | | | | | | | | | | | | | | | | | | |
| | | | | | |
Expensesf,g | | | 1.09% | | | | 1.06% | | | | 1.06% | | | | 1.07% | | | | 1.07% | | | | 1.08% | |
| | | | | | |
Expenses incurred in connection with securities sold short | | | 0.03% | | | | 0.02% | | | | 0.01% | | | | —% | | | | 0.01% | | | | 0.02% | |
| | | | | | |
Net investment income | | | 4.13%c | | | | 2.00% | | | | 1.42% | | | | 1.99% | | | | 2.22% | | | | 1.65% | |
| | | | | | |
| Supplemental data | | | | | | | | | | | | | | | | | | | | | | | | |
| | | | | | |
Net assets, end of period (000’s) | | | $101,013 | | | | $120,345 | | | | $105,047 | | | | $122,942 | | | | $122,476 | | | | $130,978 | |
| | | | | | |
Portfolio turnover rate | | | 19.67% | | | | 38.50% | | | | 24.67% | | | | 18.32% | | | | 24.45% | | | | 19.88% | |
aThe amount shown for a share outstanding throughout the period may not correlate with the Statement of Operations for the period due to the timing of sales and repurchases of the Fund’s shares in relation to income earned and/or fluctuating fair value of the investments of the Fund.
bBased on average daily shares outstanding.
cNet investment income per share includes approximately $0.18 per share related to income received in the form of special dividends in connection with certain Fund holdings. Excluding this amount, the ratio of net investment income to average net assets would have been 1.88%.
dTotal return does not include fees, charges or expenses imposed by the variable annuity and life insurance contracts for which Franklin Templeton Variable Insurance Products Trust serves as an underlying investment vehicle. Total return is not annualized for periods less than one year.
eRatios are annualized for periods less than one year.
fIncludes dividend and/or interest expense on securities sold short and security borrowing fees, if any. See below for the ratios of such expenses to average net assets for the periods presented. See Note 1(f).
gBenefit of waiver and payments by affiliates and expense reduction rounds to less than 0.01%.
| | | | |
| | | |
| MS-10 | | Semiannual Report | The accompanying notes are an integral part of these financial statements. | | |
FRANKLIN TEMPLETON VARIABLE INSURANCE PRODUCTS TRUST
Statement of Investments, June 30, 2020 (unaudited)
Franklin Mutual Shares VIP Fund
| | | | | | | | | | | | | | |
| | | | | Country | | | Shares/
Warrants | | | Value | |
| | | | |
| | Common Stocks and Other Equity Interests 90.2% | | | | | | | | | | | | |
| | Aerospace & Defense 2.4% | | | | | | | | | | | | |
| | BAE Systems PLC | | | United Kingdom | | | | 4,310,599 | | | $ | 25,774,011 | |
| | Huntington Ingalls Industries Inc. | | | United States | | | | 175,130 | | | | 30,558,434 | |
| | | | | | | | | | | | | | |
| | | | |
| | | | | | | | | | | | | 56,332,445 | |
| | | | | | | | | | | | | | |
| | | | |
| | Auto Components 0.0%† | | | | | | | | | | | | |
| a,b,c | | International Automotive Components Group Brazil LLC | | | Brazil | | | | 1,730,515 | | | | 32,541 | |
| | | | | | | | | | | | | | |
| | | | |
| | Automobiles 0.6% | | | | | | | | | | | | |
| | General Motors Co. | | | United States | | | | 514,345 | | | | 13,012,928 | |
| | | | | | | | | | | | | | |
| | | | |
| | Banks 6.7% | | | | | | | | | | | | |
| | Bank of America Corp. | | | United States | | | | 1,045,618 | | | | 24,833,428 | |
| | Citigroup Inc. | | | United States | | | | 861,639 | | | | 44,029,753 | |
| | JPMorgan Chase & Co. | | | United States | | | | 458,954 | | | | 43,169,214 | |
| | Synovus Financial Corp. | | | United States | | | | 802,733 | | | | 16,480,108 | |
| | Wells Fargo & Co. | | | United States | | | | 1,187,539 | | | | 30,400,998 | |
| | | | | | | | | | | | | | |
| | | | |
| | | | | | | | | | | | | 158,913,501 | |
| | | | | | | | | | | | | | |
| | | | |
| | Beverages 0.5% | | | | | | | | | | | | |
| | Heineken NV | | | Netherlands | | | | 129,934 | | | | 11,978,122 | |
| | | | | | | | | | | | | | |
| | | | |
| | Building Products 1.3% | | | | | | | | | | | | |
| | Johnson Controls International PLC | | | United States | | | | 908,430 | | | | 31,013,800 | |
| | | | | | | | | | | | | | |
| | | | |
| | Capital Markets 1.1% | | | | | | | | | | | | |
| | Credit Suisse Group AG | | | Switzerland | | | | 2,373,162 | | | | 24,692,435 | |
| | | | | | | | | | | | | | |
| | | | |
| | Communications Equipment 1.1% | | | | | | | | | | | | |
| | Cisco Systems Inc. | | | United States | | | | 576,119 | | | | 26,870,190 | |
| | | | | | | | | | | | | | |
| | | | |
| | Consumer Finance 1.3% | | | | | | | | | | | | |
| | Capital One Financial Corp. | | | United States | | | | 478,537 | | | | 29,951,631 | |
| | | | | | | | | | | | | | |
| | | | |
| | Containers & Packaging 1.8% | | | | | | | | | | | | |
| | International Paper Co. | | | United States | | | | 1,235,477 | | | | 43,501,145 | |
| | | | | | | | | | | | | | |
| | | | |
| | Diversified Financial Services 2.9% | | | | | | | | | | | | |
| a | | Berkshire Hathaway Inc., B | | | United States | | | | 186,373 | | | | 33,269,444 | |
| | Voya Financial Inc. | | | United States | | | | 758,210 | | | | 35,370,497 | |
| | | | | | | | | | | | | | |
| | | | | | | | | | | | | 68,639,941 | |
| | | | | | | | | | | | | | |
| | | | |
| | Electric Utilities 1.0% | | | | | | | | | | | | |
| | Pinnacle West Capital Corp. | | | United States | | | | 315,200 | | | | 23,101,008 | |
| | | | | | | | | | | | | | |
| | | | |
| | Electrical Equipment 1.7% | | | | | | | | | | | | |
| | a Sensata Technologies Holding PLC | | | United States | | | | 1,045,059 | | | | 38,907,547 | |
| | | | | | | | | | | | | | |
| | | | |
| | Electronic Equipment, Instruments & Components 1.2% | | | | | | | | | | | | |
| | Corning Inc. | | | United States | | | | 1,133,402 | | | | 29,355,112 | |
| | | | | | | | | | | | | | |
| | | | |
| | Energy Equipment & Services 1.1% | | | | | | | | | | | | |
| | Baker Hughes Co., A | | | United States | | | | 663,295 | | | | 10,208,110 | |
| | Schlumberger Ltd. | | | United States | | | | 893,500 | | | | 16,431,465 | |
| | | | | | | | | | | | | | |
| | | | |
| | | | | | | | | | | | | 26,639,575 | |
| | | | | | | | | | | | | | |
| | | | |
| | Entertainment 2.0% | | | | | | | | | | | | |
| | The Walt Disney Co. | | | United States | | | | 419,567 | | | | 46,785,916 | |
| | | | | | | | | | | | | | |
FRANKLIN TEMPLETON VARIABLE INSURANCE PRODUCTS TRUST
STATEMENT OF INVESTMENTS (UNAUDITED)
Franklin Mutual Shares VIP Fund (continued)
| | | | | | | | | | | | | | |
| | | | | Country | | | Shares/
Warrants | | | Value | |
| | | | |
| | Common Stocks and Other Equity Interests (continued) | | | | | | | | | | | | |
| | | | |
| | Equity Real Estate Investment Trusts (REITs) 1.1% | | | | | | | | | | | | |
| | Alexander’s Inc. | | | United States | | | | 31,168 | | | $ | 7,508,371 | |
| | Vornado Realty Trust | | | United States | | | | 496,497 | | | | 18,971,151 | |
| | | | | | | | | | | | | | |
| | | | | | | | | | | | | 26,479,522 | |
| | | | | | | | | | | | | | |
| | Food & Staples Retailing 3.3% | | | | | | | | | | | | |
| | The Kroger Co. | | | United States | | | | 1,566,436 | | | | 53,023,859 | |
| | Walgreens Boots Alliance Inc. | | | United States | | | | 586,960 | | | | 24,881,234 | |
| | | | | | | | | | | | | | |
| | | | | | | | | | | | | 77,905,093 | |
| | | | | | | | | | | | | | |
| | Food Products 4.2% | | | | | | | | | | | | |
| | Archer-Daniels-Midland Co. | | | United States | | | | 682,506 | | | | 27,231,989 | |
| | Conagra Brands Inc. | | | United States | | | | 530,565 | | | | 18,659,971 | |
| | The Kraft Heinz Co. | | | United States | | | | 1,704,590 | | | | 54,359,375 | |
| | | | | | | | | | | | | | |
| | | | | | | | | | | | | 100,251,335 | |
| | | | | | | | | | | | | | |
| | Health Care Equipment & Supplies 2.8% | | | | | | | | | | | | |
| | Medtronic PLC | | | United States | | | | 720,205 | | | | 66,042,798 | |
| | | | | | | | | | | | | | |
| | | | |
| | Health Care Providers & Services 3.2% | | | | | | | | | | | | |
| | Anthem Inc. | | | United States | | | | 107,617 | | | | 28,301,119 | |
| | CVS Health Corp. | | | United States | | | | 723,969 | | | | 47,036,266 | |
| | | | | | | | | | | | | | |
| | | | | | | | | | | | | 75,337,385 | |
| | | | | | | | | | | | | | |
| | Household Durables 2.8% | | | | | | | | | | | | |
| | Lennar Corp., A | | | United States | | | | 573,137 | | | | 35,316,702 | |
| | Newell Brands Inc. | | | United States | | | | 1,923,718 | | | | 30,548,642 | |
| | | | | | | | | | | | | | |
| | | | | | | | | | | | | 65,865,344 | |
| | | | | | | | | | | | | | |
| | Household Products 0.9% | | | | | | | | | | | | |
| | Energizer Holdings Inc. | | | United States | | | | 427,547 | | | | 20,304,207 | |
| | | | | | | | | | | | | | |
| | | | |
| | Industrial Conglomerates 1.0% | | | | | | | | | | | | |
| | General Electric Co. | | | United States | | | | 3,340,001 | | | | 22,812,207 | |
| | | | | | | | | | | | | | |
| | | | |
| | Insurance 5.4% | | | | | | | | | | | | |
| | Alleghany Corp. | | | United States | | | | 92,702 | | | | 45,344,256 | |
| | Everest Re Group Ltd. | | | United States | | | | 122,329 | | | | 25,224,240 | |
| | The Hartford Financial Services Group Inc. | | | United States | | | | 904,853 | | | | 34,882,083 | |
| | MetLife Inc. | | | United States | | | | 624,803 | | | | 22,817,806 | |
| | | | | | | | | | | | | | |
| | | | | | | | | | | | | 128,268,385 | |
| | | | | | | | | | | | | | |
| | IT Services 1.9% | | | | | | | | | | | | |
| | Cognizant Technology Solutions Corp., A | | | United States | | | | 796,201 | | | | 45,240,141 | |
| | | | | | | | | | | | | | |
| | | | |
| | Machinery 0.7% | | | | | | | | | | | | |
| a | | CNH Industrial NV | | | United Kingdom | | | | 605,230 | | | | 4,251,730 | |
| a | | CNH Industrial NV, special voting | | | United Kingdom | | | | 1,844,814 | | | | 12,959,787 | |
| | | | | | | | | | | | | | |
| | | | | | | | | | | | | 17,211,517 | |
| | | | | | | | | | | | | | |
| | | | |
| | Media 6.2% | | | | | | | | | | | | |
| a | | Charter Communications Inc., A | | | United States | | | | 136,923 | | | | 69,836,207 | |
| | Comcast Corp., A | | | United States | | | | 1,245,578 | | | | 48,552,630 | |
| a | | Discovery Inc., C | | | United States | | | | 1,157,710 | | | | 22,297,495 | |
FRANKLIN TEMPLETON VARIABLE INSURANCE PRODUCTS TRUST
STATEMENT OF INVESTMENTS (UNAUDITED)
Franklin Mutual Shares VIP Fund (continued)
| | | | | | | | | | | | | | |
| | | | | Country | | | Shares/
Warrants | | | Value | |
| | | | |
| | Common Stocks and Other Equity Interests (continued) | | | | | | | | | | | | |
| | Media (continued) | | | | | | | | | | | | |
| a,d | | iHeartMedia Inc., A | | | United States | | | | 717,645 | | | $ | 5,992,336 | |
| a,b | | iHeartMedia Inc., B | | | United States | | | | 12,783 | | | | 90,727 | |
| | | | | | | | | | | | | | |
| | | | | | | | | | | | | 146,769,395 | |
| | | | | | | | | | | | | | |
| | | | |
| | Oil, Gas & Consumable Fuels 5.8% | | | | | | | | | | | | |
| | BP PLC | | | United Kingdom | | | | 7,407,845 | | | | 28,378,611 | |
| | Kinder Morgan Inc. | | | United States | | | | 1,612,768 | | | | 24,465,690 | |
| | Marathon Oil Corp. | | | United States | | | | 2,662,301 | | | | 16,293,282 | |
| | Royal Dutch Shell PLC, A (EUR Traded) | | | United Kingdom | | | | 450,591 | | | | 7,375,230 | |
| | Royal Dutch Shell PLC, A (GBP Traded) | | | United Kingdom | | | | 611,623 | | | | 9,792,461 | |
| | The Williams Cos. Inc. | | | United States | | | | 2,738,781 | | | | 52,091,615 | |
| | | | | | | | | | | | | | |
| | | | | | | | | | | | | 138,396,889 | |
| | | | | | | | | | | | | | |
| | Pharmaceuticals 10.7% | | | | | | | | | | | | |
| a | | Elanco Animal Health Inc. | | | United States | | | | 283,578 | | | | 6,082,748 | |
| | Eli Lilly and Co. | | | United States | | | | 317,463 | | | | 52,121,075 | |
| | GlaxoSmithKline PLC | | | United Kingdom | | | | 2,773,828 | | | | 56,028,172 | |
| | Merck & Co. Inc. | | | United States | | | | 783,295 | | | | 60,572,202 | |
| | Novartis AG, ADR | | | Switzerland | | | | 607,663 | | | | 53,073,287 | |
| | Perrigo Co. PLC | | | United States | | | | 469,260 | | | | 25,936,000 | |
| | | | | | | | | | | | | | |
| | | | | | | | | | | | | 253,813,484 | |
| | | | | | | | | | | | | | |
| | Software 3.4% | | | | | | | | | | | | |
| a | | Avaya Holdings Corp. | | | United States | | | | 116 | | | | 1,434 | |
| a | | Avaya Holdings Corp., wts., 12/15/22 | | | United States | | | | 91,551 | | | | 114,439 | |
| | NortonLifeLock Inc. | | | United States | | | | 1,432,555 | | | | 28,407,565 | |
| | Oracle Corp. | | | United States | | | | 954,596 | | | | 52,760,521 | |
| | | | | | | | | | | | | | |
| | | | | | | | | | | | | 81,283,959 | |
| | | | | | | | | | | | | | |
| | Specialty Retail 1.2% | | | | | | | | | | | | |
| | Tiffany & Co. | | | United States | | | | 179,400 | | | | 21,876,036 | |
| a,b | | TRU Kids Parent LLC | | | United States | | | | 2,040 | | | | 6,571,584 | |
| a,b | | Wayne Services Legacy Inc. | | | United States | | | | 2,039 | | | | — | |
| | | | | | | | | | | | | | |
| | | | | | | | | | | | | 28,447,620 | |
| | | | | | | | | | | | | | |
| | | | |
| | Technology Hardware, Storage & Peripherals 4.3% | | | | | | | | | | | | |
| | Hewlett Packard Enterprise Co. | | | United States | | | | 1,292,621 | | | | 12,577,202 | |
| | Samsung Electronics Co. Ltd. | | | South Korea | | | | 1,321,135 | | | | 58,640,009 | |
| | Western Digital Corp. | | | United States | | | | 701,884 | | | | 30,988,179 | |
| | | | | | | | | | | | | | |
| | | | | | | | | | | | | 102,205,390 | |
| | | | | | | | | | | | | | |
| | Textiles, Apparel & Luxury Goods 0.7% | | | | | | | | | | | | |
| | PVH Corp. | | | United States | | | | 363,421 | | | | 17,462,379 | |
| | | | | | | | | | | | | | |
| | | | |
| | Tobacco 3.3% | | | | | | | | | | | | |
| | Altria Group Inc. | | | United States | | | | 571,600 | | | | 22,435,300 | |
| | British American Tobacco PLC | | | United Kingdom | | | | 1,095,258 | | | | 42,004,520 | |
| | British American Tobacco PLC, ADR | | | United Kingdom | | | | 372,933 | | | | 14,477,259 | |
| | | | | | | | | | | | | | |
| | | | | | | | | | | | | 78,917,079 | |
| | | | | | | | | | | | | | |
FRANKLIN TEMPLETON VARIABLE INSURANCE PRODUCTS TRUST
STATEMENT OF INVESTMENTS (UNAUDITED)
Franklin Mutual Shares VIP Fund (continued)
| | | | | | | | | | | | | | |
| | | | | Country | | | Shares/
Warrants | | | Value | |
| | | | |
| | Common Stocks and Other Equity Interests (continued) | | | | | | | | | | | | |
| | Wireless Telecommunication Services 0.6% | | | | | | | | | | | | |
| | Vodafone Group PLC | | | United Kingdom | | | | 8,420,931 | | | $ | 13,386,708 | |
| | | | | | | | | | | | | | |
| | | | |
| | Total Common Stocks and Other Equity Interests
(Cost $1,929,798,525) | | | | | | | | | | | 2,136,128,674 | |
| | | | | | | | | | | | | | |
| | | | |
| | | | | | | | Principal
Amount | | | | |
| |
| | Corporate Bonds, Notes and Senior Floating Rate Interests 5.8% | |
| e | | American Airlines Inc., senior secured note, 144A, 11.75%, 7/15/25 | | | United States | | | $ | 21,072,000 | | | | 19,855,935 | |
| e | | Banff Merger Sub Inc., senior note, 144A, 9.75%, 9/01/26 | | | United States | | | | 18,444,000 | | | | 18,601,881 | |
| e | | Boxer Parent Co. Inc., senior secured note, first lien, 144A, 7.125%, 10/02/25 | | | United States | | | | 4,027,500 | | | | 4,237,635 | |
| e | | Delta Air Lines Inc., senior note, first lien, 144A, 7.00%, 5/01/25 | | | United States | | | | 1,198,000 | | | | 1,237,916 | |
| e | | Frontier Communications Corp., senior secured note, first lien, 144A, 8.00%, 4/01/27 | | | United States | | | | 6,148,000 | | | | 6,250,549 | |
| e | | Macy’s Inc., senior secured note, first lien, 144A, 8.375%, 6/15/25 | | | United States | | | | 4,438,000 | | | | 4,424,131 | |
| f,g,h | | Mileage Plus Holdings LLC, Term Loan B, TBD, 6/25/27 | | | United States | | | | 2,866,000 | | | | 2,849,624 | |
| e,i | | Mileage Plus Holdings LLC/Mileage Plus Intellectual Property Assets Ltd., senior secured note, first lien, 144A, 6.50%, 6/20/27 | | | United States | | | | 11,070,000 | | | | 11,125,350 | |
| e | | Navistar International Corp., senior secured note, 144A, 9.50%, 5/01/25 | | | United States | | | | 4,878,200 | | | | 5,247,114 | |
| | Occidental Petroleum Corp., | | | | | | | | | | | | |
| | senior note, 4.85%, 3/15/21 | | | United States | | | | 917,000 | | | | 914,134 | |
| | h,j senior note, FRN, 1.842%, (3-month USD LIBOR + 1.45%), 8/15/22 | | | United States | | | | 2,933,600 | | | | 2,700,036 | |
| h | | Veritas U.S. Inc., Term Loan B1, 5.50%, (3-month USD LIBOR + 4.50%), 1/27/23 | | | United States | | | | 17,234,903 | | | | 15,985,372 | |
| e | | Veritas U.S. Inc./Veritas Bermuda Ltd., | | | | | | | | | | | | |
| | senior note, 144A, 7.50%, 2/01/23 | | | United States | | | | 2,856,000 | | | | 2,823,570 | |
| | senior note, 144A, 10.50%, 2/01/24 | | | United States | | | | 23,445,000 | | | | 21,068,732 | |
| h | | Windstream Services LLC, | | | | | | | | | | | | |
| | PSA Holder Revolving Commitment, 6.25%, (Prime + 3.00%), 2/20/49 | | | United States | | | | 26,279,371 | | | | 16,161,813 | |
| | PSA Holder Term Loan B6, 8.25%, (Prime + 5.00%), 3/30/21 | | | United States | | | | 6,671,000 | | | | 4,202,730 | |
| | | | | | | | | | | | | | |
| | Total Corporate Bonds, Notes and Senior Floating Rate Interests (Cost $149,686,671) | | | | | | | | | | | 137,686,522 | |
| | | | | | | | | | | | | | |
| | | | |
| | Corporate Notes in Reorganization 0.7% | | | | | | | | | | | | |
| k | | Frontier Communications Corp., | | | | | | | | | | | | |
| | senior note, 10.50%, 9/15/22 | | | United States | | | | 22,633,000 | | | | 7,887,940 | |
| | senior note, 11.00%, 9/15/25 | | | United States | | | | 25,535,000 | | | | 8,910,949 | |
| | | | | | | | | | | | | | |
| | | | |
| | Total Corporate Notes in Reorganization
(Cost $44,895,501) | | | | | | | | | | | 16,798,889 | |
| | | | | | | | | | | | | | |
| | | | |
| | | | | | | | Shares | | | | |
| |
| | Companies in Liquidation 0.0%† | |
| a,b,l | | Bosgen Liquidating Trust c/o Verdolino and Lowey P.C., Contingent Distribution | | | United States | | | | 347,093 | | | | — | |
| a,b,l | | Tribune Media Co., Litigation Trust, Contingent Distribution | | | United States | | | | 396,923 | | | | — | |
| a,b,l | | Vistra Energy Corp., Litigation Trust, Contingent Distribution | | | United States | | | | 90,618,405 | | | | 49,840 | |
FRANKLIN TEMPLETON VARIABLE INSURANCE PRODUCTS TRUST
STATEMENT OF INVESTMENTS (UNAUDITED)
Franklin Mutual Shares VIP Fund (continued)
| | | | | | | | | | | | | | |
| | | | | Country | | | Shares | | | Value | |
| | | | |
| | Companies in Liquidation (continued) | | | | | | | | | | | | |
| a,b,l | | Walter Energy Inc., Litigation Trust, Contingent Distribution | | | United States | | | | 6,301,000 | | | $ | — | |
| | | | | | | | | | | | | | |
| | | | |
| | Total Companies in Liquidation (Cost $2,834,275) | | | | | | | | | | | 49,840 | |
| | | | | | | | | | | | | | |
| | | | |
| | Total Investments before Short Term Investments
(Cost $2,127,214,972) | | | | | | | | | | | 2,290,663,925 | |
| | | | | | | | | | | | | | |
| | | | |
| | | | | | | | Principal
Amount | | | | |
| |
| | Short Term Investments 3.5% | |
| | | | |
| | | U.S. Government and Agency Securities 3.4% | | | | | | | | | |
| m | | FHLB, 7/01/20 | | | United States | | | $ | 14,300,000 | | | | 14,300,000 | |
| m | | U.S. Treasury Bill, 7/02/20 | | | United States | | | | 40,500,000 | | | | 40,499,904 | |
| | n 7/16/20 - 11/27/20 | | | United States | | | | 27,000,000 | | | | 26,995,005 | |
| | | | | | | | | | | | | | |
| | | | |
| | Total U.S. Government and Agency Securities
(Cost $81,782,086) | | | | | | | | | | | 81,794,909 | |
| | | | | | | | | | | | | | |
| | | | |
| | Investments from Cash Collateral Received for Loaned
Securities 0.1% | | | | | | | | | | | | |
| | | | |
| | | | | | | | Shares | | | | |
| | Money Market Funds (Cost $1,077,000) 0.1% | | | | | | | | | | | | |
| o,p | | Institutional Fiduciary Trust Money Market Portfolio, 0.00% | | | United States | | | | 1,077,000 | | | | 1,077,000 | |
| | | | | | | | | | | | | | |
| | | | |
| | | | | | | | Principal
Amount | | | | |
| | Repurchase Agreements (Cost $219,396) 0.0%† | | | | | | | | | | | | |
| q | | Joint Repurchase Agreement, 0.07%, 7/01/20 (Maturity Value $219,396) | | | | | | | | | | | | |
| | BNP Paribas Securities Corp. | | | | | | | | | | | | |
| | Collateralized by U.S. Treasury Bonds, 7.875%, 2/15/21; U.S. Treasury Notes, 0.125% - 2.875%, 12/31/20 - 1/31/24; U.S. Treasury Strips, 8/15/20 - 11/15/22 (Valued at $223,784) | | | United States | | | $ | 219,396 | | | | 219,396 | |
| | | | | | | | | | | | | | |
| | | | |
| | Total Investments from Cash Collateral Received for Loaned Securities (Cost $1,296,396) | | | | | | | | | | | 1,296,396 | |
| | | | | | | | | | | | | | |
| | | | |
| | Total Investments (Cost $2,210,293,454) 100.2% | | | | | | | | | | | 2,373,755,230 | |
| | | | |
| | Other Assets, less Liabilities (0.2)% | | | | | | | | | | | (3,894,943 | ) |
| | | | | | | | | | | | | | |
| | | | |
| | Net Assets 100.0% | | | | | | | | | | $ | 2,369,860,287 | |
| | | | | | | | | | | | | | |
FRANKLIN TEMPLETON VARIABLE INSURANCE PRODUCTS TRUST
STATEMENT OF INVESTMENTS (UNAUDITED)
Franklin Mutual Shares VIP Fund (continued)
†Rounds to less than 0.1% of net assets.
aNon-income producing.
bFair valued using significant unobservable inputs. See Note 12 regarding fair value measurements.
cSee Note 9 regarding restricted securities.
dA portion or all of the security is on loan at June 30, 2020. See Note 1(g).
eSecurity was purchased pursuant to Rule 144A under the Securities Act of 1933 and may be sold in transactions exempt from registration only to qualified institutional buyers or in a public offering registered under the Securities Act of 1933. At June 30, 2020, the aggregate value of these securities was $94,872,813, representing 4.0% of net assets.
fSecurity purchased on a delayed delivery basis. See Note 1(d).
gA portion or all of the security represents an unsettled loan commitment. The coupon rate is to-be determined (TBD) at the time of settlement and will be based upon a reference index/floor plus a spread.
hSee Note 1(h) regarding senior floating rate interests.
iSecurity purchased on a when-issued basis. See Note 1(d).
jThe coupon rate shown represents the rate at period end.
kSee Note 7 regarding credit risk and defaulted securities.
lContingent distributions represent the right to receive additional distributions, if any, during the reorganization of the underlying company. Shares represent total underlying principal of debt securities.
mThe security was issued on a discount basis with no stated coupon rate.
nA portion or all of the security has been segregated as collateral for open forward exchange contracts. At June 30, 2020, the aggregate value of these securities pledged amounted to $779,948, representing less than 0.1% of net assets.
oSee Note 3(e) regarding investments in affiliated management investment companies.
pThe rate shown is the annualized seven-day effective yield at period end.
qSee Note 1(c) regarding joint repurchase agreement.
At June 30, 2020, the Fund had the following futures contracts outstanding. See Note 1(e).
Futures Contracts
| | | | | | | | | | | | | | | | | | | | |
| | | | | |
| Description | | Type | | | Number of Contracts | | | Notional Amount* | | | Expiration Date | | | Value/ Unrealized Appreciation (Depreciation) | |
| Currency Contracts | | | | | | | | | | | | | | | | | | | | |
EUR/USD | | | Short | | | | 104 | | | | $14,629,550 | | | | 9/14/20 | | | | $ 94,640 | |
GBP/USD | | | Short | | | | 498 | | | | 38,585,663 | | | | 9/14/20 | | | | 1,058,539 | |
| | | | | | | | | | | | | | | | | | | | |
Total Futures Contracts | | | | $1,153,179 | |
| | | | | | | | | | | | | | | | | | | | |
*As of period end.
FRANKLIN TEMPLETON VARIABLE INSURANCE PRODUCTS TRUST
STATEMENT OF INVESTMENTS (UNAUDITED)
Franklin Mutual Shares VIP Fund (continued)
At June 30, 2020, the Fund had the following forward exchange contracts outstanding. See Note 1(e).
| | | | | | | | | | | | | | | | | | | | | | | | | | | | |
| Forward Exchange Contracts | | | | | | | | | | | | | | | | |
| | | | | | | |
| Currency | | Counterpartya | | | Type | | | Quantity | | | Contract
Amount | | | Settlement
Date | | | Unrealized
Appreciation | | | Unrealized
Depreciation | |
| OTC Forward Exchange Contracts | |
Euro | | | BOFA | | | | Sell | | | | 52,781 | | | | $ 59,024 | | | | 7/15/20 | | | | $ — | | | | $ (292) | |
Euro | | | BONY | | | | Sell | | | | 240,119 | | | | 270,209 | | | | 7/15/20 | | | | 360 | | | | — | |
Euro | | | HSBK | | | | Buy | | | | 117,981 | | | | 132,353 | | | | 7/15/20 | | | | 236 | | | | — | |
Euro | | | HSBK | | | | Sell | | | | 975,093 | | | | 1,087,692 | | | | 7/15/20 | | | | — | | | | (8,134 | ) |
Euro | | | HSBK | | | | Sell | | | | 988,764 | | | | 1,120,263 | | | | 7/15/20 | | | | 9,076 | | | | — | |
Euro | | | SSBT | | | | Buy | | | | 368,000 | | | | 414,326 | | | | 7/15/20 | | | | — | | | | (763 | ) |
Euro | | | SSBT | | | | Sell | | | | 251,842 | | | | 279,091 | | | | 7/15/20 | | | | — | | | | (3,931) | |
Euro | | | SSBT | | | | Sell | | | | 416,849 | | | | 469,687 | | | | 7/15/20 | | | | 1,227 | | | | — | |
Euro | | | UBSW | | | | Sell | | | | 1,073,915 | | | | 1,214,198 | | | | 7/15/20 | | | | 7,319 | | | | — | |
Euro | | | UBSW | | | | Sell | | | | 10,885,583 | | | | 11,930,557 | | | | 7/15/20 | | | | — | | | | (302,822 | ) |
South Korean Won | | | HSBK | | | | Buy | | | | 4,117,458,251 | | | | 3,385,044 | | | | 7/17/20 | | | | 47,832 | | | | — | |
South Korean Won | | | HSBK | | | | Sell | | | | 2,833,834,575 | | | | 2,378,935 | | | | 7/17/20 | | | | 16,262 | | | | — | |
South Korean Won | | | HSBK | | | | Sell | | | | 52,977,559,922 | | | | 43,329,740 | | | | 7/17/20 | | | | — | | | | (839,612 | ) |
South Korean Won | | | UBSW | | | | Sell | | | | 18,061,991,754 | | | | 14,769,803 | | | | 7/17/20 | | | | — | | | | (289,148 | ) |
British Pound | | | HSBK | | | | Buy | | | | 1,060,036 | | | | 1,318,112 | | | | 8/14/20 | | | | — | | | | (4,350 | ) |
British Pound | | | UBSW | | | | Sell | | | | 21,659,195 | | | | 27,176,006 | | | | 8/14/20 | | | | 332,547 | | | | — | |
Swiss Franc | | | UBSW | | | | Sell | | | | 22,420,635 | | | | 23,858,592 | | | | 8/17/20 | | | | 159,781 | | | | — | |
| | | | | | | | | | | | | | | | | | | | | | | | |
Total Forward Exchange Contracts | | | | $ 574,640 | | | | $ (1,449,052) | |
| | | | | | | | | | | | | | | | | | | | | | | | |
Net unrealized appreciation (depreciation) | | | | | | | | $ (874,412) | |
| | | | | | | | | | | | | | | | | | | | | | | | | | | | |
aMay be comprised of multiple contracts with the same counterparty, currency and settlement date.
See Note 10 regarding other derivative information.
See Abbreviations on page MS-34.
| | | | | | |
| | | |
| | The accompanying notes are an integral part of these financial statements. | Semiannual Report | | | MS-17 | |
FRANKLIN TEMPLETON VARIABLE INSURANCE PRODUCTS TRUST
FINANCIAL STATEMENTS
Statement of Assets and Liabilities
June 30, 2020 (unaudited)
| | | | |
| |
| | | Franklin Mutual
Shares VIP Fund | |
Assets: | | | | |
Investments in securities: | | | | |
Cost - Unaffiliated issuers | | $ | 2,208,997,058 | |
Cost - Non-controlled affiliates (Note 3e) | | | 1,077,000 | |
Cost - Unaffiliated repurchase agreements | | | 219,396 | |
| | | | |
Value - Unaffiliated issuers + | | $ | 2,372,458,834 | |
Value - Non-controlled affiliates (Note 3e) | | | 1,077,000 | |
Value - Unaffiliated repurchase agreements | | | 219,396 | |
Cash | | | 1,082,196 | |
Receivables: | | | | |
Investment securities sold | | | 1,873,122 | |
Capital shares sold | | | 2,055,434 | |
Dividends and interest | | | 7,354,382 | |
European Union tax reclaims | | | 1,585,281 | |
Deposits with brokers for: | | | | |
Futures contracts | | | 1,681,639 | |
Unrealized appreciation on OTC forward exchange contracts | | | 574,640 | |
Other assets | | | 2,461 | |
| | | | |
| |
Total assets | | | 2,389,964,385 | |
| | | | |
Liabilities: | | | | |
Payables: | | | | |
Investment securities purchased | | | 13,740,305 | |
Capital shares redeemed | | | 978,819 | |
Management fees | | | 1,340,273 | |
Distribution fees | | | 478,767 | |
Trustees’ fees and expenses | | | 1,877 | |
Variation margin on futures contracts | | | 332,388 | |
Payable upon return of securities loaned | | | 1,296,396 | |
Unrealized depreciation on OTC forward exchange contracts | | | 1,449,052 | |
Accrued expenses and other liabilities | | | 486,221 | |
| | | | |
| |
Total liabilities | | | 20,104,098 | |
| | | | |
| |
Net assets, at value | | $ | 2,369,860,287 | |
| | | | |
| |
Net assets consist of: | | | | |
Paid-in capital | | $ | 2,079,928,651 | |
Total distributable earnings (losses) | | | 289,931,636 | |
| | | | |
| |
Net assets, at value | | $ | 2,369,860,287 | |
| | | | |
| | | | |
+Includes securities loaned | | $ | 1,228,285 | |
| | | | |
| | | |
| MS-18 | | Semiannual Report | The accompanying notes are an integral part of these financial statements. | | |
FRANKLIN TEMPLETON VARIABLE INSURANCE PRODUCTS TRUST
FINANCIAL STATEMENTS
Statement of Assets and Liabilities (continued)
June 30, 2020 (unaudited)
| | | | |
| |
| | | Franklin Mutual
Shares VIP Fund | |
| |
| Class 1: | | | | |
Net assets, at value | | $ | 130,207,182 | |
| | | | |
Shares outstanding | | | 8,600,638 | |
| | | | |
Net asset value and maximum offering price per share | | $ | 15.14 | |
| | | | |
| |
| Class 2: | | | | |
Net assets, at value | | $ | 2,138,639,758 | |
| | | | |
Shares outstanding | | | 144,299,487 | |
| | | | |
Net asset value and maximum offering price per share | | $ | 14.82 | |
| | | | |
| |
| Class 4: | | | | |
Net assets, at value | | $ | 101,013,347 | |
| | | | |
Shares outstanding | | | 6,753,463 | |
| | | | |
Net asset value and maximum offering price per share | | $ | 14.96 | |
| | | | |
| | | | | | |
| | | |
| | The accompanying notes are an integral part of these financial statements. | Semiannual Report | | | MS-19 | |
FRANKLIN TEMPLETON VARIABLE INSURANCE PRODUCTS TRUST
FINANCIAL STATEMENTS
Statement of Operations
for the six months ended June 30, 2020 (unaudited)
| | | | |
| | | Franklin Mutual
Shares VIP Fund | |
| |
Investment income: | | | | |
Dividends:(net of foreign taxes)* | | | | |
Unaffiliated issuers | | $ | 61,592,792 | |
Interest: | | | | |
Unaffiliated issuers | | | 7,480,408 | |
Adjustment for uncollectible interest (Note 7) | | | (2,537,110 | ) |
Income from securities loaned: | | | | |
Unaffiliated entities (net of fees and rebates) | | | 23 | |
Non-controlled affiliates (Note 3e) | | | 3,234 | |
| | | | |
Total investment income | | | 66,539,347 | |
| | | | |
Expenses: | | | | |
Management fees (Note 3a) | | | 8,624,596 | |
Distribution fees: (Note 3c) | | | | |
Class 2 | | | 2,901,106 | |
Class 4 | | | 178,823 | |
Custodian fees (Note 4) | | | 22,082 | |
Reports to shareholders | | | 240,415 | |
Professional fees | | | 62,309 | |
Trustees’ fees and expenses | | | 9,809 | |
Dividends on securities sold short | | | 389,896 | |
Other | | | 42,199 | |
| | | | |
Total expenses | | | 12,471,235 | |
Expense reductions (Note 4) | | | (12,520 | ) |
Expenses waived/paid by affiliates (Note 3e) | | | (1,232 | ) |
| | | | |
Net expenses | | | 12,457,483 | |
| | | | |
Net investment income | | | 54,081,864 | |
| | | | |
Realized and unrealized gains (losses): | | | | |
Net realized gain (loss) from: | | | | |
Investments: | | | | |
Unaffiliated issuers | | | (74,533,904 | ) |
Written options | | | (262,792 | ) |
Realized gain distributions from REITs | | | 866,978 | |
Foreign currency transactions | | | (168,235 | ) |
Forward exchange contracts | | | 2,269,806 | |
Futures contracts | | | 1,796,871 | |
Securities sold short | | | (1,409,935 | ) |
| | | | |
Net realized gain (loss) | | | (71,441,211 | ) |
| | | | |
Net change in unrealized appreciation (depreciation) on: | | | | |
Investments: | | | | |
Unaffiliated issuers | | | (647,502,878 | ) |
Translation of other assets and liabilities denominated in foreign currencies | | | (58,450 | ) |
Forward exchange contracts | | | 1,511,444 | |
Futures contracts | | | 1,873,446 | |
Securities sold short | | | 1,972,704 | |
| | | | |
| | | | |
| | | |
| MS-20 | | Semiannual Report | The accompanying notes are an integral part of these financial statements. | | |
FRANKLIN TEMPLETON VARIABLE INSURANCE PRODUCTS TRUST
FINANCIAL STATEMENTS
Statement of Operations (continued)
for the six months ended June 30, 2020 (unaudited)
| | | | |
| | | Franklin Mutual
Shares VIP Fund | |
Net change in unrealized appreciation (depreciation) | | $ | (642,203,734 | ) |
| | | | |
Net realized and unrealized gain (loss) | | | (713,644,945 | ) |
| | | | |
Net increase (decrease) in net assets resulting from operations | | $ | (659,563,081 | ) |
| | | | |
| | | | |
*Foreign taxes withheld on dividends | | $ | 601,911 | |
| | | | | | |
| | | |
| | The accompanying notes are an integral part of these financial statements. | Semiannual Report | | | MS-21 | |
FRANKLIN TEMPLETON VARIABLE INSURANCE PRODUCTS TRUST
FINANCIAL STATEMENTS
Statements of Changes in Net Assets
| | | | | | | | |
| | | Franklin Mutual Shares VIP Fund | |
| | | Six Months Ended
June 30, 2020
(unaudited) | | | Year Ended
December 31, 2019 | |
| |
Increase (decrease) in net assets: | | | | | | | | |
Operations: | | | | | | | | |
Net investment income | | $ | 54,081,864 | | | $ | 70,482,893 | |
Net realized gain (loss) | | | (71,441,211 | ) | | | 95,516,825 | |
Net change in unrealized appreciation (depreciation) | | | (642,203,734 | ) | | | 497,609,167 | |
| | | | |
Net increase (decrease) in net assets resulting from operations | | | (659,563,081 | ) | | | 663,608,885 | |
| | | | |
| | |
Distributions to shareholders: | | | | | | | | |
Class 1 | | | — | | | | (35,828,591 | ) |
Class 2 | | | — | | | | (330,340,832 | ) |
Class 4 | | | — | | | | (13,089,406 | ) |
| | | | |
| | |
Total distributions to shareholders | | | — | | | | (379,258,829 | ) |
| | | | |
| | |
Capital share transactions: (Note 2) | | | | | | | | |
Class 1 | | | 4,852,965 | | | | (436,530,771 | ) |
Class 2 | | | (190,863,192 | ) | | | 198,182,849 | |
Class 4 | | | 4,904,214 | | | | 5,322,730 | |
| | | | |
| | |
Total capital share transactions | | | (181,106,013 | ) | | | (233,025,192 | ) |
| | | | |
| | |
Net increase (decrease) in net assets | | | (840,669,094 | ) | | | 51,324,864 | |
Net assets: | | | | | | | | |
Beginning of period | | | 3,210,529,381 | | | | 3,159,204,517 | |
| | | | |
| | |
End of period | | $ | 2,369,860,287 | | | $ | 3,210,529,381 | |
| | | | |
| | | | |
| | | |
| MS-22 | | Semiannual Report | The accompanying notes are an integral part of these financial statements. | | |
FRANKLIN TEMPLETON VARIABLE INSURANCE PRODUCTS TRUST
Notes to Financial Statements (unaudited)
Franklin Mutual Shares VIP Fund
1. Organization and Significant Accounting Policies
Franklin Templeton Variable Insurance Products Trust (Trust) is registered under the Investment Company Act of 1940 (1940 Act) as an open-end management investment company, consisting of eighteen separate funds and applies the specialized accounting and reporting guidance in U.S. Generally Accepted Accounting Principles (U.S. GAAP). Franklin Mutual Shares VIP Fund (Fund) is included in this report. Shares of the Fund are generally sold only to insurance company separate accounts to fund the benefits of variable life insurance policies or variable annuity contracts. The Fund offers three classes of shares: Class 1, Class 2 and Class 4. Each class of shares may differ by its distribution fees, voting rights on matters affecting a single class and its exchange privilege.
The following summarizes the Fund’s significant accounting policies.
a. Financial Instrument Valuation
The Fund’s investments in financial instruments are carried at fair value daily. Fair value is the price that would be received to sell an asset or paid to transfer a liability in an orderly transaction between market participants on the measurement date. The Fund calculates the net asset value (NAV) per share each business day as of 4 p.m. Eastern time or the regularly scheduled close of the New York Stock Exchange (NYSE), whichever is earlier. Under compliance policies and procedures approved by the Trust’s Board of Trustees (the Board), the Fund’s administrator has responsibility for oversight of valuation, including leading the cross-functional Valuation Committee (VC). The Fund may utilize independent pricing services, quotations from securities and financial instrument dealers, and other market sources to determine fair value.
Equity securities and derivative financial instruments listed on an exchange or on the NASDAQ National Market System are valued at the last quoted sale price or the official closing price of the day, respectively. Foreign equity securities are valued as of the close of trading on the foreign stock exchange on which the security is primarily traded, or as of 4 p.m. Eastern time. The value is then converted into its U.S. dollar equivalent at the foreign exchange rate in effect at 4 p.m. Eastern time on the day that the value of the security is determined. Over-the-counter (OTC) securities are valued within the range of the most recent quoted bid and ask prices. Securities that trade in multiple markets or on multiple
exchanges are valued according to the broadest and most representative market. Certain equity securities are valued based upon fundamental characteristics or relationships to similar securities.
Debt securities generally trade in the OTC market rather than on a securities exchange. The Fund’s pricing services use multiple valuation techniques to determine fair value. In instances where sufficient market activity exists, the pricing services may utilize a market-based approach through which quotes from market makers are used to determine fair value. In instances where sufficient market activity may not exist or is limited, the pricing services also utilize proprietary valuation models which may consider market characteristics such as benchmark yield curves, credit spreads, estimated default rates, anticipated market interest rate volatility, coupon rates, anticipated timing of principal repayments, underlying collateral, and other unique security features in order to estimate the relevant cash flows, which are then discounted to calculate the fair value.
Investments in open-end mutual funds are valued at the closing NAV. Investments in repurchase agreements are valued at cost, which approximates fair value.
Certain derivative financial instruments trade in the OTC market. The Fund’s pricing services use various techniques including industry standard option pricing models and proprietary discounted cash flow models to determine the fair value of those instruments. The Fund’s net benefit or obligation under the derivative contract, as measured by the fair value of the contract, is included in net assets.
The Fund has procedures to determine the fair value of financial instruments for which market prices are not reliable or readily available. Under these procedures, the Fund primarily employs a market-based approach which may use related or comparable assets or liabilities, recent transactions, market multiples, book values, and other relevant information for the investment to determine the fair value of the investment. An income-based valuation approach may also be used in which the anticipated future cash flows of the investment are discounted to calculate fair value. Discounts may also be applied due to the nature or duration of any restrictions on the disposition of the investments. Due to the inherent uncertainty of valuations of such investments, the fair values may differ significantly from the values that would have been used had an active market existed.
FRANKLIN TEMPLETON VARIABLE INSURANCE PRODUCTS TRUST
NOTES TO FINANCIAL STATEMENTS (UNAUDITED)
Franklin Mutual Shares VIP Fund (continued)
1. Organization and Significant Accounting
Policies (continued)
a. Financial Instrument Valuation (continued)
Trading in securities on foreign securities stock exchanges and OTC markets may be completed before 4 p.m. Eastern time. In addition, trading in certain foreign markets may not take place on every Fund’s business day. Events can occur between the time at which trading in a foreign security is completed and 4 p.m. Eastern time that might call into question the reliability of the value of a portfolio security held by the Fund. As a result, differences may arise between the value of the Fund’s portfolio securities as determined at the foreign market close and the latest indications of value at 4 p.m. Eastern time. In order to minimize the potential for these differences, an independent pricing service may be used to adjust the value of the Fund’s portfolio securities to the latest indications of fair value at 4 p.m. Eastern time. At June 30, 2020, certain securities may have been fair valued using these procedures, in which case the securities were categorized as Level 2 inputs within the fair value hierarchy. See the Fair Value Measurements note for more information.
When the last day of the reporting period is a non-business day, certain foreign markets may be open on those days that the Fund’s NAV is not calculated, which could result in differences between the value of the Fund’s portfolio securities on the last business day and the last calendar day of the reporting period. Any significant security valuation changes due to an open foreign market are adjusted and reflected by the Fund for financial reporting purposes.
b. Foreign Currency Translation
Portfolio securities and other assets and liabilities denominated in foreign currencies are translated into U.S. dollars based on the exchange rate of such currencies against U.S. dollars on the date of valuation. The Fund may enter into foreign currency exchange contracts to facilitate transactions denominated in a foreign currency. Purchases and sales of securities, income and expense items denominated in foreign currencies are translated into U.S. dollars at the exchange rate in effect on the transaction date. Portfolio securities and assets and liabilities denominated in foreign currencies contain risks that those currencies will decline in value relative to the U.S. dollar. Occasionally, events may impact the availability or reliability of foreign exchange rates used to convert the U.S. dollar equivalent
value. If such an event occurs, the foreign exchange rate will be valued at fair value using procedures established and approved by the Board.
The Fund does not separately report the effect of changes in foreign exchange rates from changes in market prices on securities held. Such changes are included in net realized and unrealized gain or loss from investments in the Statement of Operations.
Realized foreign exchange gains or losses arise from sales of foreign currencies, currency gains or losses realized between the trade and settlement dates on securities transactions and the difference between the recorded amounts of dividends, interest, and foreign withholding taxes and the U.S. dollar equivalent of the amounts actually received or paid. Net unrealized foreign exchange gains and losses arise from changes in foreign exchange rates on foreign denominated assets and liabilities other than investments in securities held at the end of the reporting period.
c. Repurchase Agreements
The Fund enters into repurchase agreements, which are accounted for as a loan by the Fund to the seller, collateralized by securities which are delivered to the Fund’s custodian. The fair value, including accrued interest, of the initial collateralization is required to be at least 102% of the dollar amount invested by the Fund, with the value of the underlying securities marked to market daily to maintain coverage of at least 100%. Repurchase agreements are subject to the terms of Master Repurchase Agreements (MRAs) with approved counterparties (sellers). The MRAs contain various provisions, including but not limited to events of default and maintenance of collateral for repurchase agreements. In the event of default by either the seller or the Fund, certain MRAs may permit the non-defaulting party to net and close-out all transactions, if any, traded under such agreements. The Fund may sell securities it holds as collateral and apply the proceeds towards the repurchase price and any other amounts owed by the seller to the Fund in the event of default by the seller. This could involve costs or delays in addition to a loss on the securities if their value falls below the repurchase price owed by the seller. All repurchase agreements held by the Fund at period end, as indicated in the Statement of Investments, had been entered into on June 30, 2020.
FRANKLIN TEMPLETON VARIABLE INSURANCE PRODUCTS TRUST
NOTES TO FINANCIAL STATEMENTS (UNAUDITED)
Franklin Mutual Shares VIP Fund (continued)
d. Securities Purchased on a When-Issued or Delayed Delivery Basis
The Fund purchases securities on a when-issued or delayed delivery basis, with payment and delivery scheduled for a future date. These transactions are subject to market fluctuations and are subject to the risk that the value at delivery may be more or less than the trade date purchase price. Although the Fund will generally purchase these securities with the intention of holding the securities, it may sell the securities before the settlement date. Sufficient assets have been segregated for these securities.
e. Derivative Financial Instruments
The Fund invested in derivative financial instruments in order to manage risk or gain exposure to various other investments or markets. Derivatives are financial contracts based on an underlying or notional amount, require no initial investment or an initial net investment that is smaller than would normally be required to have a similar response to changes in market factors, and require or permit net settlement. Derivatives contain various risks including the potential inability of the counterparty to fulfill their obligations under the terms of the contract, the potential for an illiquid secondary market, and/or the potential for market movements which expose the Fund to gains or losses in excess of the amounts shown in the Statement of Assets and Liabilities. Realized gain and loss and unrealized appreciation and depreciation on these contracts for the period are included in the Statement of Operations.
Derivative counterparty credit risk is managed through a formal evaluation of the creditworthiness of all potential counterparties. The Fund attempts to reduce its exposure to counterparty credit risk on OTC derivatives, whenever possible, by entering into International Swaps and Derivatives Association (ISDA) master agreements with certain counterparties. These agreements contain various provisions, including but not limited to collateral requirements, events of default, or early termination. Termination events applicable to the counterparty include certain deteriorations in the credit quality of the counterparty. Termination events applicable to the Fund include failure of the Fund to maintain certain net asset levels and/or limit the decline in net assets over various periods of time. In the event of default or early termination, the ISDA master agreement gives the non-defaulting party the right to net and close-out all transactions traded, whether or not arising under the ISDA agreement, to one net amount payable by one counterparty to the other. However, absent an
event of default or early termination, OTC derivative assets and liabilities are presented gross and not offset in the Statement of Assets and Liabilities. Early termination by the counterparty may result in an immediate payment by the Fund of any net liability owed to that counterparty under the ISDA agreement. At June 30, 2020, the Fund had OTC derivatives in a net liability position of $874,772 and the aggregate value of collateral pledged for such contracts was $779,948.
Collateral requirements differ by type of derivative. Collateral or initial margin requirements are set by the broker or exchange clearing house for exchange traded and centrally cleared derivatives. Initial margin deposited is held at the exchange and can be in the form of cash and/or securities. For OTC derivatives traded under an ISDA master agreement, posting of collateral is required by either the Fund or the applicable counterparty if the total net exposure of all OTC derivatives with the applicable counterparty exceeds the minimum transfer amount, which typically ranges from $100,000 to $250,000, and can vary depending on the counterparty and the type of the agreement. Generally, collateral is determined at the close of Fund business each day and any additional collateral required due to changes in derivative values may be delivered by the Fund or the counterparty the next business day, or within a few business days. Collateral pledged and/or received by the Fund for OTC derivatives, if any, is held in segregated accounts with the Fund’s custodian/counterparty broker and can be in the form of cash and/or securities. Unrestricted cash may be invested according to the Fund’s investment objectives. To the extent that the amounts due to the Fund from its counterparties are not subject to collateralization or are not fully collateralized, the Fund bears the risk of loss from counterparty non-performance.
The Fund entered into exchange traded futures contracts primarily to manage exposure to certain foreign currencies. A futures contract is an agreement between the Fund and a counterparty to buy or sell an asset at a specified price on a future date. Required initial margins are pledged by the Fund, and the daily change in fair value is accounted for as a variation margin payable or receivable in the Statement of Assets and Liabilities.
FRANKLIN TEMPLETON VARIABLE INSURANCE PRODUCTS TRUST
NOTES TO FINANCIAL STATEMENTS (UNAUDITED)
Franklin Mutual Shares VIP Fund (continued)
1. Organization and Significant Accounting
Policies (continued)
e. Derivative Financial Instruments (continued)
The Fund entered into OTC forward exchange contracts primarily to manage exposure to certain foreign currencies. A forward exchange contract is an agreement between the Fund and a counterparty to buy or sell a foreign currency at a specific exchange rate on a future date.
The Fund purchased or wrote exchange traded option contracts primarily to manage and/or gain exposure to equity price risk. An option is a contract entitling the holder to purchase or sell a specific amount of shares or units of an asset or notional amount of a swap (swaption), at a specified price. When an option is purchased or written, an amount equal to the premium paid or received is recorded as an asset or liability, respectively. Upon exercise of an option, the acquisition cost or sales proceeds of the underlying investment is adjusted by any premium received or paid. Upon expiration of an option, any premium received or paid is recorded as a realized gain or loss. Upon closing an option other than through expiration or exercise, the difference between the premium received or paid and the cost to close the position is recorded as a realized gain or loss. The Fund did not hold any option contracts at period end.
See Note 10 regarding other derivative information.
f. Securities Sold Short
The Fund is engaged in selling securities short, which obligates the Fund to replace a borrowed security with the same security at current fair value. The Fund incurs a loss if the price of the security increases between the date of the short sale and the date on which the Fund replaces the borrowed security. The Fund realizes a gain if the price of the security declines between those dates. Gains are limited to the price at which the Fund sold the security short, while losses are potentially unlimited in size.
The Fund is required to establish a margin account with the broker lending the security sold short. While the short sale is outstanding, the broker retains the proceeds of the short sale to the extent necessary to meet margin requirements until the short position is closed out. A deposit must also be maintained with the Fund’s custodian/counterparty broker consisting of cash and/or securities having a value equal to a specified percentage of the value of the securities sold short. The Fund is obligated to pay fees for borrowing the securities
sold short and is required to pay the counterparty any dividends and/or interest due on securities sold short. Such dividends and/or interest and any security borrowing fees are recorded as an expense to the Fund. At June 30, 2020, the Fund had no securities sold short.
g. Securities Lending
The Fund participates in an agency based securities lending program to earn additional income. The Fund receives cash collateral against the loaned securities in an amount equal to at least 102% of the fair value of the loaned securities. Collateral is maintained over the life of the loan in an amount not less than 100% of the fair value of loaned securities, as determined at the close of Fund business each day; any additional collateral required due to changes in security values is delivered to the Fund on the next business day. The collateral is deposited into a joint cash account with other funds and is used to invest in a money market fund managed by Franklin Advisers, Inc., an affiliate of the Fund and a joint repurchase agreement. The Fund may receive income from the investment of cash collateral, in addition to lending fees and rebates paid by the borrower. Income from securities loaned, net of fees paid to the securities lending agent and/or third-party vendor, is reported separately in the Statement of Operations. The Fund bears the market risk with respect to the collateral investment, securities loaned, and the risk that the agent may default on its obligations to the Fund. If the borrower defaults on its obligation to return the securities loaned, the Fund has the right to repurchase the securities in the open market using the collateral received. The securities lending agent has agreed to indemnify the Fund in the event of default by a third party borrower.
h. Senior Floating Rate Interests
The Fund invests in senior secured corporate loans that pay interest at rates which are periodically reset by reference to a base lending rate plus a spread. These base lending rates are generally the prime rate offered by a designated U.S. bank or the London InterBank Offered Rate (LIBOR). Senior secured corporate loans often require prepayment of principal from excess cash flows or at the discretion of the borrower. As a result, actual maturity may be substantially less than the stated maturity. Senior secured corporate loans in which the Fund invests are generally readily marketable, but may be subject to certain restrictions on resale. On July 27, 2017, the United Kingdom’s Financial Conduct Authority announced its intention to cease sustaining LIBOR
FRANKLIN TEMPLETON VARIABLE INSURANCE PRODUCTS TRUST
NOTES TO FINANCIAL STATEMENTS (UNAUDITED)
Franklin Mutual Shares VIP Fund (continued)
after 2021. There remains uncertainty regarding the future utilization of LIBOR and the nature of any replacement rate. As such, the potential effect of a transition away from LIBOR on the Fund or the Fund’s investments that use or may use a floating rate based on LIBOR cannot yet be determined.
i. Income and Deferred Taxes
It is the Fund’s policy to qualify as a regulated investment company under the Internal Revenue Code. The Fund intends to distribute to shareholders substantially all of its taxable income and net realized gains to relieve it from federal income and if applicable, excise taxes. As a result, no provision for U.S. federal income taxes is required.
The Fund may be subject to foreign taxation related to income received, capital gains on the sale of securities and certain foreign currency transactions in the foreign jurisdictions in which it invests. Foreign taxes, if any, are recorded based on the tax regulations and rates that exist in the foreign markets in which the Fund invests. When a capital gain tax is determined to apply, the Fund records an estimated deferred tax liability in an amount that would be payable if the securities were disposed of on the valuation date.
As a result of several court cases, in certain countries across the European Union, the Fund filed additional tax reclaims for previously withheld taxes on dividends earned in those countries (EU reclaims). These additional filings are subject to various administrative proceedings by the local jurisdictions’ tax authorities within the European Union, as well as a number of related judicial proceedings. Income recognized, if any, for EU reclaims is reflected as other income in the Statement of Operations and any related receivable, if any, is reflected as European Union tax reclaims in the Statement of Assets and Liabilities. When uncertainty exists as to the ultimate resolution of these proceedings, the likelihood of receipt of these EU reclaims, and the potential timing of payment, no amounts are reflected in the financial statements. For U.S. income tax purposes, when EU reclaims are received by the Fund and the Fund previously passed foreign tax credit on to its shareholders, the Fund must either amend historic tax reporting to shareholders or enter into a closing agreement with the Internal Revenue Service (IRS) in order to pay the associated tax liability on behalf of the Fund’s shareholders.
The Fund may recognize an income tax liability related to its uncertain tax positions under U.S. GAAP when the uncertain tax position has a less than 50% probability that it will be sustained upon examination by the tax authorities based on its technical merits. As of June 30, 2020, the Fund has determined that no tax liability is required in its financial statements related to uncertain tax positions for any open tax years (or expected to be taken in future tax years). Open tax years are those that remain subject to examination and are based on the statute of limitations in each jurisdiction in which the Fund invests.
j. Security Transactions, Investment Income, Expenses and Distributions
Security transactions are accounted for on trade date. Realized gains and losses on security transactions are determined on a specific identification basis. Interest income and estimated expenses are accrued daily. Amortization of premium and accretion of discount on debt securities are included in interest income. Dividend income and dividends declared on securities sold short are recorded on the ex-dividend date except for certain dividends from securities where the dividend rate is not available. In such cases, the dividend is recorded as soon as the information is received by the Fund. Distributions to shareholders are recorded on the ex-dividend date. Distributable earnings are determined according to income tax regulations (tax basis) and may differ from earnings recorded in accordance with U.S. GAAP. These differences may be permanent or temporary. Permanent differences are reclassified among capital accounts to reflect their tax character. These reclassifications have no impact on net assets or the results of operations. Temporary differences are not reclassified, as they may reverse in subsequent periods.
Common expenses incurred by the Trust are allocated among the Funds based on the ratio of net assets of each Fund to the combined net assets of the Trust or based on the ratio of number of shareholders of each Fund to the combined number of shareholders of the Trust. Fund specific expenses are charged directly to the Fund that incurred the expense.
Realized and unrealized gains and losses and net investment income, excluding class specific expenses, are allocated daily to each class of shares based upon the relative proportion of net assets of each class. Differences in per share distributions by class are generally due to differences in class specific expenses.
FRANKLIN TEMPLETON VARIABLE INSURANCE PRODUCTS TRUST
NOTES TO FINANCIAL STATEMENTS (UNAUDITED)
Franklin Mutual Shares VIP Fund (continued)
1. Organization and Significant Accounting
Policies (continued)
k. Accounting Estimates
The preparation of financial statements in accordance with U.S. GAAP requires management to make estimates and assumptions that affect the reported amounts of assets and liabilities at the date of the financial statements and the amounts of income and expenses during the reporting period. Actual results could differ from those estimates.
l. Guarantees and Indemnifications
Under the Trust’s organizational documents, its officers and trustees are indemnified by the Trust against certain liabilities arising out of the performance of their duties to the Trust.
Additionally, in the normal course of business, the Trust, on behalf of the Fund, enters into contracts with service providers that contain general indemnification clauses. The Trust’s maximum exposure under these arrangements is unknown as this would involve future claims that may be made against the Trust that have not yet occurred. Currently, the Trust expects the risk of loss to be remote.
2. Shares of Beneficial Interest
At June 30, 2020, there were an unlimited number of shares authorized (without par value). Transactions in the Fund’s shares were as follows:
| | | | | | | | | | | | | | | | | | |
| | | |
| | | Six Months Ended June 30, 2020 | | | | | Year Ended December 31, 2019 | |
| | | | | |
| | | Shares | | | Amount | | | | | Shares | | | Amount | |
| | | | | |
| Class 1 Shares: | | | | | | | | | | | | | | | | | | |
Shares sold | | | 641,139 | | | $ | 9,529,737 | | | | | | 765,653 | | | $ | 14,772,259 | |
Shares issued in reinvestment of distributions | | | — | | | | — | | | | | | 2,031,099 | | | | 35,828,591 | |
Shares redeemed | | | (297,471 | ) | | | (4,676,772 | ) | | | | | (24,880,289 | ) | | | (487,131,621) | |
| | | | |
| | | | | |
Net increase (decrease) | | | 343,668 | | | $ | 4,852,965 | | | | | | (22,083,537 | ) | | $ | (436,530,771) | |
| | | | |
| | | | | |
| Class 2 Shares: | | | | | | | | | | | | | | | | | | |
Shares sold | | | 9,774,365 | | | $ | 135,425,822 | | | | | | 29,854,091 | | | $ | 583,466,693 | |
Shares issued in reinvestment of distributions | | | — | | | | — | | | | | | 19,094,846 | | | | 330,340,832 | |
Shares redeemed | | | (21,356,959 | ) | | | (326,289,014 | ) | | | | | (37,705,675 | ) | | | (715,624,676) | |
| | | | |
| | | | | |
Net increase (decrease) | | | (11,582,594 | ) | | $ | (190,863,192 | ) | | | | | 11,243,262 | | | $ | 198,182,849 | |
| | | | |
| | | | | |
| Class 4 Shares: | | | | | | | | | | | | | | | | | | |
Shares sold | | | 893,404 | | | $ | 12,663,468 | | | | | | 625,179 | | | $ | 11,842,479 | |
Shares issued in reinvestment of distributions | | | — | | | | — | | | | | | 749,250 | | | | 13,089,406 | |
Shares redeemed | | | (477,331 | ) | | | (7,759,254 | ) | | | | | (1,022,438 | ) | | | (19,609,155) | |
| | | | |
| | | | | |
Net increase (decrease) | | | 416,073 | | | $ | 4,904,214 | | | | | | 351,991 | | | $ | 5,322,730 | |
| | | | |
FRANKLIN TEMPLETON VARIABLE INSURANCE PRODUCTS TRUST
NOTES TO FINANCIAL STATEMENTS (UNAUDITED)
Franklin Mutual Shares VIP Fund (continued)
3. Transactions with Affiliates
Franklin Resources, Inc. is the holding company for various subsidiaries that together are referred to as Franklin Templeton. Certain officers and trustees of the Fund are also officers and/or directors of the following subsidiaries:
| | |
| |
| Subsidiary | | Affiliation |
Franklin Mutual Advisers, LLC (Franklin Mutual) | | Investment manager |
Franklin Templeton Services, LLC (FT Services) | | Administrative manager |
Franklin Templeton Distributors, Inc. (Distributors) | | Principal underwriter |
Franklin Templeton Investor Services, LLC (Investor Services) | | Transfer agent |
a. Management Fees
The Fund pays an investment management fee to Franklin Mutual based on the average daily net assets of the Fund as follows:
| | |
| |
| Annualized Fee Rate | | Net Assets |
0.675% | | Up to and including $5 billion |
0.645% | | Over $5 billion, up to and including $10 billion |
0.625% | | Over $10 billion, up to and including $15 billion |
0.595% | | Over $15 billion, up to and including $20 billion |
0.585% | | Over $20 billion, up to and including $25 billion |
0.565% | | Over $25 billion, up to and including $30 billion |
0.555% | | Over $30 billion, up to and including $35 billion |
0.545% | | In excess of $35 billion |
b. Administrative Fees
Under an agreement with Franklin Mutual, FT Services provides administrative services to the Fund. The fee is paid by Franklin Mutual based on the Fund’s average daily net assets, and is not an additional expense of the Fund.
c. Distribution Fees
The Board has adopted distribution plans for Class 2 and Class 4 shares pursuant to Rule 12b-1 under the 1940 Act. Under the Fund’s compensation distribution plans, the Fund pays Distributors for costs incurred in connection with the servicing, sale and distribution of the Fund’s shares up to 0.35% per year of its average daily net assets of each class. The Board has agreed to limit the current rate to 0.25% per year for Class 2. The plan year, for purposes of monitoring compliance with the maximum annual plan rates, is February 1 through January 31.
d. Transfer Agent Fees
Investor Services, under terms of an agreement, performs shareholder servicing for the Fund and is not paid by the Fund for the services.
FRANKLIN TEMPLETON VARIABLE INSURANCE PRODUCTS TRUST
NOTES TO FINANCIAL STATEMENTS (UNAUDITED)
Franklin Mutual Shares VIP Fund (continued)
3. Transactions with Affiliates (continued)
e. Investments in Affiliated Management Investment Companies
The Fund invests in one or more affiliated management investment companies for purposes other than exercising a controlling influence over the management or policies. Management fees paid by the Fund are waived on assets invested in the affiliated management investment companies, as noted in the Statement of Operations, in an amount not to exceed the management and administrative fees paid directly or indirectly by each affiliate. During the period ended June 30, 2020, the Fund held investments in affiliated management investment companies as follows:
| | | | | | | | | | | | | | | | | | | | | | | | | | | | | | | | |
| | | | | | | | |
| | | Value at
Beginning
of Period | | | Purchases | | | Sales | | | Realized
Gain (Loss) | | | Net Change in
Unrealized
Appreciation
(Depreciation) | | | Value at End of
Period | | | Number of
Shares
Held at End
of Period | | | Income from
securities loaned | |
| | | | | |
| Non-Controlled Affiliates | | | | | | | | | | | | | | | | | | | | | |
| | | | | | | | |
Institutional Fiduciary Trust Money Market Portfolio, 0.00% | | $ | — | | | $ | 19,467,000 | | | $ | (18,390,000 | ) | | $ | — | | | $ | — | | | $ | 1,077,000 | | | | 1,077,000 | | | $ | 3,234 | |
| | | | |
f. Interfund Transactions
The Fund engaged in purchases and sales of investments with funds or other accounts that have common investment managers (or affiliated investment managers), directors, trustees or officers. During the period ended June 30, 2020, these purchase and sale transactions aggregated $0 and $1,702,055, respectively.
4. Expense Offset Arrangement
The Fund has entered into an arrangement with its custodian whereby credits realized as a result of uninvested cash balances are used to reduce a portion of the Fund’s custodian expenses. During the period ended June 30, 2020, the custodian fees were reduced as noted in the Statement of Operations.
5. Income Taxes
At June 30, 2020, the cost of investments and net unrealized appreciation (depreciation) for income tax purposes were as follows:
| | | | |
Cost of investments | | | $2,238,998,309 | |
| | | | |
| |
Unrealized appreciation | | | $441,530,157 | |
Unrealized depreciation | | | (306,492,983 | ) |
| | | | |
| |
Net unrealized appreciation (depreciation) | | | $135,037,174 | |
| | | | |
Differences between income and/or capital gains as determined on a book basis and a tax basis are primarily due to differing treatments of foreign currency transactions and wash sales.
6. Investment Transactions
Purchases and sales of investments (excluding short term securities and securities sold short) for the period ended June 30, 2020, aggregated $485,118,984 and $484,261,996, respectively.
FRANKLIN TEMPLETON VARIABLE INSURANCE PRODUCTS TRUST
NOTES TO FINANCIAL STATEMENTS (UNAUDITED)
Franklin Mutual Shares VIP Fund (continued)
At June 30, 2020, in connection with securities lending transactions, the Fund loaned equity investments and received $1,296,396 of cash collateral. The gross amount of recognized liability for such transactions is included in payable upon return of securities loaned in the Statement of Assets and Liabilities. The agreements can be terminated at any time.
7. Credit Risk and Defaulted Securities
The Fund may purchase the pre-default or defaulted debt of distressed companies. Distressed companies are financially troubled and could be or are already involved in financial restructuring or bankruptcy. Risks associated with purchasing these securities include the possibility that the bankruptcy or other restructuring process takes longer than expected, or that distributions in restructuring are less than anticipated, either or both of which may result in unfavorable consequences to the Fund. If it becomes probable that the income on debt securities, including those of distressed companies, will not be collected, the Fund discontinues accruing income and recognizes an adjustment for uncollectible interest. For the period ended June 30, 2020, the Fund recorded an adjustment for uncollectible interest of $2,537,110 as noted in the Statement of Operations.
At June 30, 2020, the aggregate long value of distressed company securities for which interest recognition has been discontinued was $16,798,889, representing 0.7% of the Fund’s net assets. For information as to specific securities, see the accompanying Statement of Investments.
8. Novel Coronavirus Pandemic
The global outbreak of the novel coronavirus disease, known as COVID-19, has caused adverse effects on many companies, sectors, nations, regions and the markets in general, and may continue for an unpredictable duration. The effects of this pandemic may materially impact the value and performance of the Fund, its ability to buy and sell fund investments at appropriate valuations and its ability to achieve its investment objectives.
9. Restricted Securities
The Fund invests in securities that are restricted under the Securities Act of 1933 (1933 Act). Restricted securities are often purchased in private placement transactions, and cannot be sold without prior registration unless the sale is pursuant to an exemption under the 1933 Act. Disposal of these securities may require greater effort and expense, and prompt sale at an acceptable price may be difficult. The Fund may have registration rights for restricted securities. The issuer generally incurs all registration costs.
At June 30, 2020, investments in restricted securities, excluding securities exempt from registration under the 1933 Act, were as follows:
| | | | | | | | | | | | | | |
| | | | |
| Shares | | Issuer | | Acquisition
Date | | | Cost | | | Value | |
1,730,515 | | International Automotive Components Group Brazil LLC (Value is 0.0%† of Net Assets) | | | 4/13/06-12/26/08 | | | $ | 1,149,241 | | | $ | 32,541 | |
| | | | | | | | | | |
†Rounds to less than 0.1% of net assets.
FRANKLIN TEMPLETON VARIABLE INSURANCE PRODUCTS TRUST
NOTES TO FINANCIAL STATEMENTS (UNAUDITED)
Franklin Mutual Shares VIP Fund (continued)
10. Other Derivative Information
At June 30, 2020, investments in derivative contracts are reflected in the Statement of Assets and Liabilities as follows:
| | | | | | | | | | | | | | | | |
| | | |
| | | Asset Derivatives | | | | | | Liability Derivatives | |
| | | | | |
Derivative Contracts Not Accounted for as
Hedging Instruments | | Statement of Assets and Liabilities Location | | Fair Value | | | | | | Statement of Assets and
Liabilities Location | | Fair Value | |
| | | | | |
Foreign exchange contracts | | Variation margin on futures contracts | | $ | 1,153,179 | a | | | | | | Variation margin on futures contracts | | $ | — | |
| | | | | |
| | Unrealized appreciation on OTC forward exchange contracts | | | 574,640 | | | | | | | Unrealized depreciation on OTC forward exchange contracts | | | 1,449,052 | |
| | | | | |
Totals | | | | $ | 1,727,819 | | | | | | | | | $ | 1,449,052 | |
aThis amount reflects the cumulative appreciation (depreciation) of futures contracts as reported in the Statement of Investments. Only the variation margin receivable/ payable at period end is separately reported within the Statement of Assets and Liabilities. Prior variation margin movements were recorded to cash upon receipt or payment.
For the period ended June 30, 2020, the effect of derivative contracts in the Statement of Operations was as follows:
| | | | | | | | | | | | |
| | | | | |
Derivative Contracts Not Accounted for as
Hedging Instruments | | Statement of
Operations Location | | Net Realized
Gain (Loss) for
the Period | | | | | Statement of Operations Location | | Net Change in
Unrealized
Appreciation
(Depreciation)
for the Period |
| | | |
| | Net realized gain (loss) from: | | | | | Net change in unrealized appreciation (depreciation) on: |
| | | | | |
Foreign exchange contracts | | Forward exchange contracts | | $ | 2,269,806 | | | | | Forward exchange contracts | | $1,511,444 |
| | | | | |
| | Futures contracts | | | 1,796,871 | | | | | Futures contracts | | 1,873,446 |
| | | | | |
Equity contracts | | Written options | | | (262,792 | ) | | | | Written options | | — |
| | | | | |
Totals | | | | $ | 3,803,885 | | | | | | | $3,384,890 |
For the period ended June 30, 2020, the average month end notional amount of futures contracts and options represented $64,725,121 and 1,643 shares, respectively. The average month end contract value of forward exchange contracts was $145,753,358.
See Note 1(e) regarding derivative financial instruments.
11. Credit Facility
The Fund, together with other U.S. registered and foreign investment funds (collectively, Borrowers), managed by Franklin Templeton, are borrowers in a joint syndicated senior unsecured credit facility totaling $2 billion (Global Credit Facility) which matures on February 5, 2021. This Global Credit Facility provides a source of funds to the Borrowers for temporary and emergency purposes, including the ability to meet future unanticipated or unusually large redemption requests.
Under the terms of the Global Credit Facility, the Fund shall, in addition to interest charged on any borrowings made by the Fund and other costs incurred by the Fund, pay its share of fees and expenses incurred in connection with the implementation and maintenance of the Global Credit Facility, based upon its relative share of the aggregate net assets of all of the Borrowers, including an annual commitment fee of 0.15% based upon the unused portion of the Global Credit Facility. These fees are reflected in other expenses in the Statement of Operations. During the period ended June 30, 2020, the Fund did not use the Global Credit Facility.
FRANKLIN TEMPLETON VARIABLE INSURANCE PRODUCTS TRUST
NOTES TO FINANCIAL STATEMENTS (UNAUDITED)
Franklin Mutual Shares VIP Fund (continued)
12. Fair Value Measurements
The Fund follows a fair value hierarchy that distinguishes between market data obtained from independent sources
(observable inputs) and the Fund’s own market assumptions (unobservable inputs). These inputs are used in determining the value of the Fund’s financial instruments and are summarized in the following fair value hierarchy:
| | • | | Level 1 – quoted prices in active markets for identical financial instruments |
| | • | | Level 2 – other significant observable inputs (including quoted prices for similar financial instruments, interest rates, prepayment speed, credit risk, etc.) |
| | • | | Level 3 – significant unobservable inputs (including the Fund’s own assumptions in determining the fair value of financial instruments) |
The input levels are not necessarily an indication of the risk or liquidity associated with financial instruments at that level.
A summary of inputs used as of June 30, 2020, in valuing the Fund’s assets and liabilities carried at fair value, is as follows:
| | | | | | | | | | | | | | | | |
| | | | |
| | | Level 1 | | | Level 2 | | | Level 3 | | | Total | |
| Assets: | | | | | | | | | | | | | | | | |
Investments in Securities:a | | | | | | | | | | | | | | | | |
Equity Investments:b | | | | | | | | | | | | | | | | |
Aerospace & Defense | | $ | 30,558,434 | | | $ | 25,774,011 | | | $ | — | | | $ | 56,332,445 | |
Auto Components | | | — | | | | — | | | | 32,541 | | | | 32,541 | |
Capital Markets | | | — | | | | 24,692,435 | | | | — | | | | 24,692,435 | |
Machinery | | | — | | | | 17,211,517 | | | | — | | | | 17,211,517 | |
Media | | | 146,678,668 | | | | — | | | | 90,727 | | | | 146,769,395 | |
Oil, Gas & Consumable Fuels | | | 92,850,587 | | | | 45,546,302 | | | | — | | | | 138,396,889 | |
Pharmaceuticals | | | 197,785,312 | | | | 56,028,172 | | | | — | | | | 253,813,484 | |
Software | | | 81,169,520 | | | | 114,439 | | | | — | | | | 81,283,959 | |
Specialty Retail | | | 21,876,036 | | | | — | | | | 6,571,584c | | | | 28,447,620 | |
Technology Hardware, Storage & Peripherals | | | 43,565,381 | | | | 58,640,009 | | | | — | | | | 102,205,390 | |
Tobacco | | | 36,912,559 | | | | 42,004,520 | | | | — | | | | 78,917,079 | |
Wireless Telecommunication Services | | | — | | | | 13,386,708 | | | | — | | | | 13,386,708 | |
All Other Equity Investments | | | 1,194,639,212 | | | | — | | | | — | | | | 1,194,639,212 | |
Corporate Bonds, Notes and Senior Floating Rate Interests | | | — | | | | 137,686,522 | | | | — | | | | 137,686,522 | |
Corporate Notes in Reorganization | | | — | | | | 16,798,889 | | | | — | | | | 16,798,889 | |
Companies in Liquidation | | | — | | | | — | | | | 49,840c | | | | 49,840 | |
Short Term Investments | | | 68,571,909 | | | | 14,519,396 | | | | — | | | | 83,091,305 | |
| | | | |
Total Investments in Securities | | $ | 1,914,607,618 | | | $ | 452,402,920 | | | $ | 6,744,692 | | | $ | 2,373,755,230 | |
| | | | |
Other Financial Instruments: | | | | | | | | | | | | | | | | |
Futures Contracts | | $ | 1,153,179 | | | $ | — | | | $ | — | | | $ | 1,153,179 | |
Forward Exchange Contracts | | | — | | | | 574,640 | | | | — | | | | 574,640 | |
| | | | |
Total Other Financial Instruments | | $ | 1,153,179 | | | $ | 574,640 | | | $ | — | | | $ | 1,727,819 | |
| | | | |
FRANKLIN TEMPLETON VARIABLE INSURANCE PRODUCTS TRUST
NOTES TO FINANCIAL STATEMENTS (UNAUDITED)
Franklin Mutual Shares VIP Fund (continued)
12. Fair Value Measurements (continued)
| | | | | | | | | | | | | | | | |
| | | | |
| | | Level 1 | | | Level 2 | | | Level 3 | | | Total | |
| | | | |
| Liabilities: | | | | | | | | | | | | | | | | |
Other Financial Instruments: | | | | | | | | | | | | | | | | |
Forward Exchange Contracts | | $ | — | | | $ | 1,449,052 | | | $ | — | | | $ | 1,449,052 | |
| | | | |
aFor detailed categories, see the accompanying Statement of Investments.
bIncludes common stocks as well as other equity interests.
cIncludes securities determined to have no value at June 30, 2020.
A reconciliation in which Level 3 inputs are used in determining fair value is presented when there are significant Level 3 assets and liabilities at the beginning and/or end of the period.
13. New Accounting Pronouncements
In March 2020, the Financial Accounting Standards Board issued Accounting Standards Update (ASU) No. 2020-04, Reference Rate Reform (Topic 848) – Facilitation of the Effects of Reference Rate Reform on Financial Reporting. The amendments in the ASU provides optional temporary financial reporting relief from the effect of certain types of contract modifications due to the planned discontinuation of LIBOR and other interbank-offered based reference rates as of the end of 2021. The ASU is effective for certain reference rate-related contract modifications that occur during the period March 12, 2020 through December 31, 2022. Management is currently evaluating the impact, if any, of applying this ASU.
14. Subsequent Events
The Fund has evaluated subsequent events through the issuance of the financial statements and determined that no events have occurred that require disclosure.
Abbreviations
| | | | | | | | | | |
| | |
| Counterparty | | Currency | | Selected Portfolio |
| | | | | |
| BOFA | | Bank of America Corp. | | EUR | | Euro | | ADR | | American Depositary Receipt |
| | | | | |
| BONY | | Bank of New York | | GBP | | British Pound | | FHLB | | Federal Home Loan Bank |
| | | | | |
| HSBK | | HSBC Bank PLC | | USD | | United States Dollar | | LIBOR | | London InterBank Offered Rate |
| | | | | |
| SSBT | | State Street Bank and Trust Co., N.A. | | | | | | | | |
| | | | | |
| UBSW | | UBS AG | | | | | | | | |
Franklin Rising Dividends VIP Fund
This semiannual report for Franklin Rising Dividends VIP Fund covers the period ended June 30, 2020.
Class 4 Performance Summary as of June 30, 2020
The Fund’s Class 4 Shares posted a -4.93% total return for the six-month period ended June 30, 2020.
Performance reflects the Fund’s Class 4 operating expenses, but does not include any contract fees, expenses or sales charges. If they had been included, performance would be lower. These charges and deductions, particularly for variable life policies, can have a significant effect on contract values and insurance benefits. See the contract prospectus for a complete description of these expenses, including sales charges.
Performance data represent past performance, which does not guarantee future results. Investment return and principal value will fluctuate, and you may have a gain or loss when you sell your shares. Current performance may differ from figures shown.
FRANKLIN RISING DIVIDENDS VIP FUND
Fund Goal and Main Investments
The Fund seeks long-term capital appreciation, with preservation of capital as an important consideration. Under normal market conditions, the Fund invests at least 80% of its net assets in equity securities of financially sound companies that have paid consistently rising dividends.
Fund Risks
All investments involve risks, including possible loss of principal. Unexpected events and their aftermaths, such as the spread of deadly diseases; natural, environmental or man-made disasters; financial, political or social disruptions; terrorism and war; and other tragedies or catastrophes, can cause investor fear and panic, which can adversely affect the economies of many companies, sectors, nations, regions and the market in general, in ways that cannot necessarily be foreseen. Value securities may not increase in price as anticipated or may decline further in value. For stocks paying dividends, dividends are not guaranteed, and can increase, decrease or be totally eliminated without notice. Securities issued by smaller and midsize companies may be more volatile in price than those of larger companies, involve substantial risks and should be considered relatively more speculative. To the extent that the Fund focuses on particular countries, regions, industries, sectors or types of investment from time to time, the Fund may be subject to greater risks of adverse developments in such areas of focus than a fund that invests in a wider variety of countries, regions, industries, sectors or investments. Foreign investing carries additional risks such as currency and market volatility and political or social instability, risks that are heightened in developing countries. The Fund is actively managed but there is no guarantee that the manager’s investment decisions will produce the desired results. The Fund’s prospectus also includes a description of the main investment risks.
Performance Overview
You can find the Fund’s six-month total return in the Performance Summary. In comparison, the Standard & Poor’s® 500 Index (S&P 500®) posted a -3.08% total return for the same period.1 Please note the Fund employs a bottom-up stock selection process, and the managers invest in securities without regard to benchmark comparisons.
Economic and Market Overview
U.S. equities, as measured by the S&P 500, nearly reversed earlier losses but declined modestly during the six-month period. A sharp selloff began in late February 2020 amid investor fears of a global economic slowdown due to the novel coronavirus (COVID-19) pandemic.
Government-issued restrictions to mitigate the pandemic severely curtailed U.S. economic activity beginning in March 2020. As a result, the unemployment rate surged to 14.7% in April as many businesses, particularly in hospitality, retail and travel, announced mass layoffs.2 Within just two months, the unemployment rate went from a 50-year low to an 80-year high.2 The longest U.S. economic expansion in history ended in February, according to the National Bureau of Economic Research, and the country slipped into a deep recession.
In an effort to buffer the sharp drop in economic activity, the Fed implemented two emergency rate cuts in March 2020, lowering the federal funds target rate to a range of 0.00%–0.25%. Additionally, the Fed announced broad quantitative easing measures aimed at ensuring the flow of credit to borrowers and supporting credit markets with unlimited amounts of bond purchasing. Meanwhile, Congress passed the Coronavirus Aid, Relief and Economic Security Act to provide economic relief for individuals and businesses and additional funding for small businesses.
Benefiting from these fiscal and monetary measures, equities began to advance at the end of March 2020. As states gradually reopened, economic activity resumed, leading to declining initial jobless claims and record-high increases in job additions and existing home sales. Optimism about potential COVID-19 vaccines and treatments and rising retail sales further supported equities, which rebounded from multi-year lows to post the strongest second-quarter returns in more than 20 years. Nevertheless, surging infection rates in several states near the end of June led to concerns that economic recovery could be hindered if reopening measures are paused or rolled back.
Investment Strategy
We are a research-driven, fundamental investment adviser, pursuing a disciplined value-oriented strategy. As bottom-up
1. Source: Morningstar. One cannot invest directly in an index, and an index is not representative of the Fund’s portfolio. Please see Index Descriptions following the Fund Summaries.
2. Source: Bureau of Labor Statistics.
The dollar value, number of shares or principal amount, and names of all portfolio holdings are listed in the Fund’s Statement of Investments (SOI).
FRANKLIN RISING DIVIDENDS VIP FUND
investors concentrating primarily on individual securities, we seek fundamentally sound companies that we believe meet our screening criteria, which include consistent, substantial dividend increases; reinvested earnings; and strong balance sheets. We attempt to acquire such stocks at attractive prices, often when they are out of favor with other investors. In following these criteria, we do not necessarily focus on companies whose securities pay a high dividend but rather on companies that consistently raise their dividends.
Manager’s Discussion
During the six-month period ended June 30, 2020, some companies that contributed to absolute performance included Microsoft, West Pharmaceutical Services and Lowe’s.
Enterprise software firm Microsoft boosted performance following a strong earnings report and based on investor optimism its cloud-based services could realize additional benefits as more people work from home going forward. Its workflow collaboration product, Teams, has seen excellent results. The company has seen strength in its commercial cloud services and in sales of Windows as customers migrated away from Windows 7 in recent quarters. We believe that the trends of helping business customers move to the cloud and providing workers with productivity tools could support attractive growth over the medium to longer term.
West Pharmaceutical Services, which makes packaging for pharmaceuticals and health care products, supported fund performance after reporting robust quarterly financial results due to continued strong demand for its products. The company is also marketing products for COVID-19 diagnostics and anti-viral therapies and vaccines that could provide an additional lift to growth over the coming quarters.
Home improvement retailer Lowe’s contributed following a strong first-quarter financial report which highlighted excellent demand for its products. During the pandemic, with people spending more time at home, consumers have looked to complete more do-it-yourself home renovation projects. Lowe’s is also seeing benefits from changes aimed at improving its operational performance through increased sales productivity, new technology systems and supply chain improvements. We see significant opportunity for Lowe’s to improve sales in stores and online while increasing its operating margin.
In contrast, some companies that detracted from absolute performance included Raytheon Technologies, Honeywell International and Occidental Petroleum.
Portfolio Composition
Based on Total Net Assets as of 6/30/20
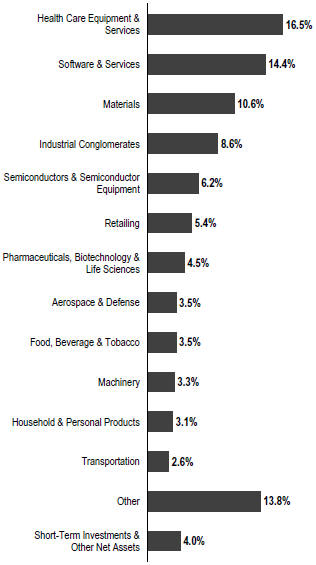
In industrials, aerospace and defense companies United Technologies and Raytheon merged in April to create Raytheon Technologies. These businesses detracted due to concerns about the weakness in the commercial aviation market following the global lockdowns aimed at stemming the spread of COVID-19. We continue to like the prospects for Raytheon, particularly for its leading defense business.
Honeywell International curbed performance as cyclical stocks struggled amid the global economic downturn and based on concerns about its exposure to aerospace and oil and gas markets that could remain weak over the next few quarters. We recognize that some of these markets may take time to recover, but we continue to believe Honeywell is a quality company with strong positions in attractive markets.
FRANKLIN RISING DIVIDENDS VIP FUND
Top 10 Holdings
6/30/20
| | | | |
| |
Company
Sector/Industry | | % of Total
Net Assets | |
Microsoft Corp.
Software & Services | | | 8.7 | % |
Roper Technologies Inc.
Industrial Conglomerates | | | 5.3 | % |
Accenture PLC
Software & Services | | | 3.8 | % |
Linde PLC (United Kingdom)
Materials | | | 3.5 | % |
Stryker Corp.
Health Care Equipment & Services | | | 3.4 | % |
Air Products and Chemicals Inc.
Materials | | | 3.3 | % |
Becton Dickinson and Co.
Health Care Equipment & Services | | | 3.2 | % |
Texas Instruments Inc.
Semiconductors & Semiconductor Equipment | | | 3.1 | % |
Analog Devices Inc.
Semiconductors & Semiconductor Equipment | | | 3.1 | % |
West Pharmaceutical Services Inc.
Health Care Equipment & Services | | | 2.8 | % |
Steps taken to cut costs and realign its business should also be helpful.
Energy company Occidental Petroleum weighed on Fund performance due to falling oil prices. The company significantly increased its debt to finance its recent purchase of Anadarko Petroleum, which has led to investor concerns about its ability to meet its debt obligations. We exited the position during the review period.
Thank you for your participation in Franklin Rising Dividends VIP Fund. We look forward to continuing to serve your investment needs.
The foregoing information reflects our analysis, opinions and portfolio holdings as of June 30, 2020, the end of the reporting period. The way we implement our main investment strategies and the resulting portfolio holdings may change depending on factors such as market and economic conditions. These opinions may not be relied upon as investment advice or an offer for a particular security. The information is not a complete analysis of every aspect of any market, country, industry, security or the Fund. Statements of fact are from sources considered reliable, but the investment manager makes no representation or warranty as to their completeness or accuracy. Although historical performance is no guarantee of future results, these insights may help you understand our investment management philosophy.
FRANKLIN RISING DIVIDENDS VIP FUND
Class 4 Fund Expenses
As an investor in a variable insurance contract (Contract) that indirectly provides for investment in an underlying mutual fund, you can incur transaction and/or ongoing expenses at both the Fund level and the Contract Level: (1) transaction expenses can include sales charges (loads) on purchases, surrender fees, transfer fees and premium taxes; and (2) ongoing expenses can include management fees, distribution and service (12b-1) fees, contract fees, annual maintenance fees, mortality and expense risk fees and other fees and expenses. All mutual funds and Contracts have some types of ongoing expenses. The table below shows Fund-level ongoing expenses and can help you understand these costs and compare them with those of other mutual funds offered through the Contract. The table assumes a $1,000 investment held for the six months indicated. Please refer to the Fund prospectus for additional information on operating expenses.
Actual Fund Expenses
The table below provides information about the actual account values and actual expenses in the columns under the heading “Actual.” In these columns the Fund’s actual return, which includes the effect of ongoing Fund expenses but does not include the effect of ongoing Contract expenses, is used to calculate the “Ending Account Value.” You can estimate the Fund-level expenses you paid during the period by following these steps (of course, your account value and expenses will differ from those in this illustration): Divide your account value by $1,000 (if your account had an $8,600 value, then $8,600 ÷ $1,000 = 8.6). Then multiply the result by the number under the headings “Actual” and “Fund-Level Expenses Paid During Period” (if Fund-Level Expenses Paid During Period were $ 7.50, then 8.6 x $ 7.50 = $64.50). In this illustration, the estimated expenses paid this period at the Fund level are $64.50.
Hypothetical Example for Comparison with Other Mutual Funds
Under the heading “Hypothetical” in the table, information is provided about hypothetical account values and hypothetical expenses based on the Fund’s actual expense ratio and an assumed rate of return of 5% per year before expenses, which is not the Fund’s actual return. This information may not be used to estimate the actual ending account balance or expenses you paid for the period, but it can help you compare ongoing costs of investing in the Fund with those of other mutual funds offered through the Contract. To do so, compare this 5% hypothetical example with the 5% hypothetical examples that appear in the shareholder reports of other funds offered through the Contract.
Please note that expenses shown in the table are meant to highlight ongoing costs at the Fund level only and do not reflect any ongoing expenses at the Contract level, or transaction expenses at either the Fund or Contract levels. In addition, while the Fund does not have transaction expenses, if the transaction and ongoing expenses at the Contract level were included, the expenses shown below would be higher. You should consult your Contract prospectus or disclosure document for more information.
| | | | | | | | | | | | | | | | | | |
| | | | | | | |
| | | | | | | Actual (actual return after expenses) | | | | Hypothetical (5% annual return before expenses) | | | | |
Share Class | | Beginning
Account Value 1/1/20 | | | | Ending
Account
Value 6/30/20 | | Fund-Level
Expenses Paid
During Period
1/1/20–6/30/201, 2 | | | | Ending Account
Value 6/30/20 | | Fund-Level
Expenses
Paid During
Period 1/1/20–6/30/201, 2 | | | | Net
Annualized
Expense
Ratio2 |
Class 4 | | $1,000 | | | | $950.70 | | $4.90 | | | | $1,019.84 | | $5.07 | | | | 1.01% |
1. Expenses are equal to the annualized expense ratio for the six-month period as indicated above—in the far right column—multiplied by the simple average account value over the period indicated, and then multiplied by 182/366 to reflect the one-half year period.
2. Reflects expenses after fee waivers and expense reimbursements. Does not include any ongoing expenses of the Contract for which the Fund is an investment option or acquired fund fees and expenses.
FRANKLIN TEMPLETON VARIABLE INSURANCE PRODUCTS TRUST
Financial Highlights
Franklin Rising Dividends VIP Fund
| | | | | | | | | | | | | | | | | | | | | | | | |
| | |
| | | Six Months Ended June 30, 2020
(unaudited) | | | Year Ended December 31, | |
| | | 2019 | | | 2018 | | | 2017 | | | 2016 | | | 2015 | |
| | | | | | |
Class 1 | | | | | | | | | | | | | | | | | | | | | | | | |
| | | | | | |
Per share operating performance
(for a share outstanding throughout the period) | | | | | | | | | | | | | | | | | | | | | | | | |
| | | | | | |
Net asset value, beginning of period | | | $27.90 | | | | $25.75 | | | | $29.21 | | | | $25.51 | | | | $25.26 | | | | $29.63 | |
| | | | |
| | | | | | |
| Income from investment operationsa: | | | | | | | | | | | | | | | | | | | | | | | | |
| | | | | | |
Net investment incomeb | | | 0.16 | | | | 0.37 | | | | 0.39 | | | | 0.40 | | | | 0.42 | | | | 0.45 | |
| | | | | | |
Net realized and unrealized gains (losses) | | | (1.52 | ) | | | 6.77 | | | | (1.65 | ) | | | 4.76 | | | | 3.45 | | | | (1.33 | ) |
| | | | |
| | | | | | |
Total from investment operations | | | (1.36 | ) | | | 7.14 | | | | (1.26 | ) | | | 5.16 | | | | 3.87 | | | | (0.88 | ) |
| | | | |
| | | | | | |
| Less distributions from: | | | | | | | | | | | | | | | | | | | | | | | | |
| | | | | | |
Net investment income | | | (0.41 | ) | | | (0.45 | ) | | | (0.44 | ) | | | (0.48 | ) | | | (0.44 | ) | | | (0.48 | ) |
| | | | | | |
Net realized gains | | | (1.41 | ) | | | (4.54 | ) | | | (1.76 | ) | | | (0.98 | ) | | | (3.18 | ) | | | (3.01 | ) |
| | | | |
| | | | | | |
Total distributions | | | (1.82 | ) | | | (4.99 | ) | | | (2.20 | ) | | | (1.46 | ) | | | (3.62 | ) | | | (3.49 | ) |
| | | | |
| | | | | | |
Net asset value, end of period | | | $24.72 | | | | $27.90 | | | | $25.75 | | | | $29.21 | | | | $25.51 | | | | $25.26 | |
| | | | |
| | | | | | |
Total returnc | | | (4.77)% | | | | 29.58% | | | | (4.84)% | | | | 20.85% | | | | 16.33% | | | | (3.42)% | |
| | | | | | |
| Ratios to average net assetsd | | | | | | | | | | | | | | | | | | | | | | | | |
| | | | | | |
Expenses before waiver and payments by affiliates | | | 0.66% | | | | 0.63% | | | | 0.62% | | | | 0.62% | | | | 0.63% | | | | 0.63% | |
| | | | | | |
Expenses net of waiver and payments by affiliates | | | 0.66%e,f | | | | 0.63%e,f | | | | 0.62%e,f | | | | 0.62%e,f | | | | 0.62%e | | | | 0.63%f | |
| | | | | | |
Net investment income | | | 1.30% | | | | 1.34% | | | | 1.38% | | | | 1.49% | | | | 1.67% | | | | 1.65% | |
| | | | | | |
| Supplemental data | | | | | | | | | | | | | | | | | | | | | | | | |
| | | | | | |
Net assets, end of period (000’s) | | | $136,120 | | | | $150,864 | | | | $157,838 | | | | $216,015 | | | | $181,072 | | | | $143,376 | |
| | | | | | |
Portfolio turnover rate | | | 9.21% | | | | 7.26%g | | | | 3.09%g | | | | 3.36% | | | | 6.66% | | | | 4.74% | |
aThe amount shown for a share outstanding throughout the period may not correlate with the Statement of Operations for the period due to the timing of sales and repurchases of the Fund’s shares in relation to income earned and/or fluctuating fair value of the investments of the Fund.
bBased on average daily shares outstanding.
cTotal return does not include fees, charges or expenses imposed by the variable annuity and life insurance contracts for which Franklin Templeton Variable Insurance Products Trust serves as an underlying investment vehicle. Total return is not annualized for periods less than one year.
dRatios are annualized for periods less than one year.
eBenefit of expense reduction rounds to less than 0.01%.
fBenefit of waiver and payments by affiliates rounds to less than 0.01%.
gExcludes the value of portfolio securities delivered as a result of redemptions in-kind. See Note 9.
| | | | |
| | | |
| FRD-6 | | Semiannual Report | The accompanying notes are an integral part of these financial statements. | | |
FRANKLIN TEMPLETON VARIABLE INSURANCE PRODUCTS TRUST
FINANCIAL HIGHLIGHTS
Franklin Rising Dividends VIP Fund (continued)
| | | | | | | | | | | | | | | | | | | | | | | | |
| | |
| | | Six Months Ended
June 30, 2020 (unaudited) | | | Year Ended December 31, | |
| | | 2019 | | | 2018 | | | 2017 | | | 2016 | | | 2015 | |
| | | | | | |
Class 2 | | | | | | | | | | | | | | | | | | | | | | | | |
| | | | | | |
Per share operating performance (for a share outstanding throughout the period) | | | | | | | | | | | | | | | | | | | | | | | | |
| | | | | | |
Net asset value, beginning of period | | | $26.99 | | | | $25.04 | | | | $28.46 | | | | $24.89 | | | | $24.72 | | | | $29.06 | |
| | | | |
| | | | | | |
| Income from investment operationsa: | | | | | | | | | | | | | | | | | | | | | | | | |
| | | | | | |
Net investment incomeb | | | 0.13 | | | | 0.29 | | | | 0.31 | | | | 0.33 | | | | 0.35 | | | | 0.37 | |
| | | | | | |
Net realized and unrealized gains (losses) | | | (1.47 | ) | | | 6.57 | | | | (1.61 | ) | | | 4.63 | | | | 3.37 | | | | (1.29 | ) |
| | | | |
| | | | | | |
Total from investment operations | | | (1.34 | ) | | | 6.86 | | | | (1.30 | ) | | | 4.96 | | | | 3.72 | | | | (0.92 | ) |
| | | | |
| | | | | | |
| Less distributions from: | | | | | | | | | | | | | | | | | | | | | | | | |
| | | | | | |
Net investment income | | | (0.33 | ) | | | (0.37 | ) | | | (0.36 | ) | | | (0.41 | ) | | | (0.37 | ) | | | (0.41 | ) |
| | | | | | |
Net realized gains | | | (1.41 | ) | | | (4.54 | ) | | | (1.76 | ) | | | (0.98 | ) | | | (3.18 | ) | | | (3.01 | ) |
| | | | |
| | | | | | |
Total distributions | | | (1.74 | ) | | | (4.91 | ) | | | (2.12 | ) | | | (1.39 | ) | | | (3.55 | ) | | | (3.42 | ) |
| | | | |
| | | | | | |
Net asset value, end of period | | | $23.91 | | | | $26.99 | | | | $25.04 | | | | $28.46 | | | | $24.89 | | | | $24.72 | |
| | | | |
| | | | | | |
Total returnc | | | (4.84)% | | | | 29.23% | | | | (5.07)% | | | | 20.56% | | | | 16.04% | | | | (3.65)% | |
| | | | | | |
| Ratios to average net assetsd | | | | | | | | | | | | | | | | | | | | | | | | |
| | | | | | |
Expenses before waiver and payments by affiliates | | | 0.91% | | | | 0.88% | | | | 0.87% | | | | 0.87% | | | | 0.88% | | | | 0.88% | |
| | | | | | |
Expenses net of waiver and payments by affiliates | | | 0.91%e,f | | | | 0.88%e,f | | | | 0.87%e,f | | | | 0.87%e,f | | | | 0.87%e | | | | 0.88%f | |
| | | | | | |
Net investment income | | | 1.05% | | | | 1.09% | | | | 1.13% | | | | 1.24% | | | | 1.42% | | | | 1.40% | |
| | | | | | |
| Supplemental data | | | | | | | | | | | | | | | | | | | | | | | | |
| | | | | | |
Net assets, end of period (000’s) | | | $1,174,601 | | | | $1,387,688 | | | | $1,106,334 | | | | $1,640,883 | | | | $1,530,374 | | | | $1,310,783 | |
| | | | | | |
Portfolio turnover rate | | | 9.21% | | | | 7.26%g | | | | 3.09%g | | | | 3.36% | | | | 6.66% | | | | 4.74% | |
aThe amount shown for a share outstanding throughout the period may not correlate with the Statement of Operations for the period due to the timing of sales and repurchases of the Fund’s shares in relation to income earned and/or fluctuating fair value of the investments of the Fund.
bBased on average daily shares outstanding.
cTotal return does not include fees, charges or expenses imposed by the variable annuity and life insurance contracts for which Franklin Templeton Variable Insurance Products Trust serves as an underlying investment vehicle. Total return is not annualized for periods less than one year.
dRatios are annualized for periods less than one year.
eBenefit of expense reduction rounds to less than 0.01%.
fBenefit of waiver and payments by affiliates rounds to less than 0.01%.
gExcludes the value of portfolio securities delivered as a result of redemptions in-kind. See Note 9.
| | | | | | |
| | | |
| | The accompanying notes are an integral part of these financial statements. | Semiannual Report | | | FRD-7 | |
FRANKLIN TEMPLETON VARIABLE INSURANCE PRODUCTS TRUST
FINANCIAL HIGHLIGHTS
Franklin Rising Dividends VIP Fund (continued)
| | | | | | | | | | | | | | | | | | | | | | | | |
| | |
| | | Six Months Ended
June 30, 2020 (unaudited) | | | Year Ended December 31, | |
| | | 2019 | | | 2018 | | | 2017 | | | 2016 | | | 2015 | |
| | | | | | |
Class 4 | | | | | | | | | | | | | | | | | | | | | | | | |
| | | | | | |
Per share operating performance (for a share outstanding throughout the period) | | | | | | | | | | | | | | | | | | | | | | | | |
| | | | | | |
Net asset value, beginning of period | | | $27.08 | | | | $25.11 | | | | $28.54 | | | | $24.98 | | | | $24.81 | | | | $29.19 | |
| | | | |
| | | | | | |
| Income from investment operationsa: | | | | | | | | | | | | | | | | | | | | | | | | |
| | | | | | |
Net investment incomeb | | | 0.12 | | | | 0.26 | | | | 0.29 | | | | 0.30 | | | | 0.32 | | | | 0.35 | |
| | | | | | |
Net realized and unrealized gains (losses) | | | (1.49 | ) | | | 6.60 | | | | (1.62 | ) | | | 4.65 | | | | 3.39 | | | | (1.31 | ) |
| | | | |
| | | | | | |
Total from investment operations | | | (1.37 | ) | | | 6.86 | | | | (1.33 | ) | | | 4.95 | | | | 3.71 | | | | (0.96 | ) |
| | | | |
| | | | | | |
| Less distributions from: | | | | | | | | | | | | | | | | | | | | | | | | |
| | | | | | |
Net investment income | | | (0.32 | ) | | | (0.35 | ) | | | (0.34 | ) | | | (0.41 | ) | | | (0.36 | ) | | | (0.41 | ) |
| | | | | | |
Net realized gains | | | (1.41 | ) | | | (4.54 | ) | | | (1.76 | ) | | | (0.98 | ) | | | (3.18 | ) | | | (3.01 | ) |
| | | | |
| | | | | | |
Total distributions | | | (1.73 | ) | | | (4.89 | ) | | | (2.10 | ) | | | (1.39 | ) | | | (3.54 | ) | | | (3.42 | ) |
| | | | |
| | | | | | |
Net asset value, end of period | | | $23.98 | | | | $27.08 | | | | $25.11 | | | | $28.54 | | | | $24.98 | | | | $24.81 | |
| | | | |
| | | | | | |
Total returnc | | | (4.93)% | | | | 29.16% | | | | (5.16)% | | | | 20.40% | | | | 15.93% | | | | (3.75)% | |
| | | | | | |
| Ratios to average net assetsd | | | | | | | | | | | | | | | | | | | | | | | | |
| | | | | | |
Expenses before waiver and payments by affiliates | | | 1.01% | | | | 0.98% | | | | 0.97% | | | | 0.97% | | | | 0.98% | | | | 0.98% | |
Expenses net of waiver and payments by affiliates | | | 1.01%e,f | | | | 0.98%e,f | | | | 0.97%e,f | | | | 0.97%e,f | | | | 0.97%e | | | | 0.98%f | |
| | | | | | |
Net investment income | | | 0.95% | | | | 0.99% | | | | 1.03% | | | | 1.14% | | | | 1.32% | | | | 1.30% | |
| | | | | | |
| Supplemental data | | | | | | | | | | | | | | | | | | | | | | | | |
| | | | | | |
Net assets, end of period (000’s) | | | $42,892 | | | | $46,539 | | | | $32,825 | | | | $36,407 | | | | $28,579 | | | | $20,453 | |
| | | | | | |
Portfolio turnover rate | | | 9.21% | | | | 7.26%g | | | | 3.09%g | | | | 3.36% | | | | 6.66% | | | | 4.74% | |
aThe amount shown for a share outstanding throughout the period may not correlate with the Statement of Operations for the period due to the timing of sales and repurchases of the Fund’s shares in relation to income earned and/or fluctuating fair value of the investments of the Fund.
bBased on average daily shares outstanding.
cTotal return does not include fees, charges or expenses imposed by the variable annuity and life insurance contracts for which Franklin Templeton Variable Insurance Products Trust serves as an underlying investment vehicle. Total return is not annualized for periods less than one year.
dRatios are annualized for periods less than one year.
eBenefit of expense reduction rounds to less than 0.01%.
fBenefit of waiver and payments by affiliates rounds to less than 0.01%.
gExcludes the value of portfolio securities delivered as a result of redemptions in-kind. See Note 9.
| | | | |
| | | |
| FRD-8 | | Semiannual Report | The accompanying notes are an integral part of these financial statements. | | |
FRANKLIN TEMPLETON VARIABLE INSURANCE PRODUCTS TRUST
Statement of Investments, June 30, 2020 (unaudited)
Franklin Rising Dividends VIP Fund
| | | | | | | | | | |
| | | | | Shares | | | Value | |
| | Common Stocks 96.0% | | | | | | | | |
| | Aerospace & Defense 3.5% | | | | | | | | |
| | General Dynamics Corp. | | | 139,852 | | | $ | 20,902,280 | |
| | Raytheon Technologies Corp. | | | 428,746 | | | | 26,419,329 | |
| | | | | | | | | | |
| | | |
| | | | | | | | | 47,321,609 | |
| | | | | | | | | | |
| | Building Products 1.2% | | | | | | | | |
| | Johnson Controls International PLC | | | 486,910 | | | | 16,623,107 | |
| | | | | | | | | | |
| | | |
| | Commercial & Professional Services 1.8% | | | | | | | | |
| | Cintas Corp. | | | 84,272 | | | | 22,446,690 | |
| | Matthews International Corp., A | | | 124,917 | | | | 2,385,915 | |
| | | | | | | | | | |
| | | |
| | | | | | | | | 24,832,605 | |
| | | | | | | | | | |
| | Consumer Durables & Apparel 2.0% | | | | | | | | |
| | NIKE Inc., B | | | 280,384 | | | | 27,491,651 | |
| | | | | | | | | | |
| | | |
| | Consumer Services 1.7% | | | | | | | | |
| | McDonald’s Corp. | | | 125,099 | | | | 23,077,013 | |
| | | | | | | | | | |
| | | |
| | Diversified Financials 0.7% | | | | | | | | |
| | Nasdaq Inc. | | | 45,140 | | | | 5,392,876 | |
| | State Street Corp. | | | 57,541 | | | | 3,656,730 | |
| | | | | | | | | | |
| | | |
| | | | | | | | | 9,049,606 | |
| | | | | | | | | | |
| | Electrical Equipment 0.5% | | | | | | | | |
| | nVent Electric PLC | | | 346,626 | | | | 6,492,305 | |
| | | | | | | | | | |
| | | |
| | Energy 1.9% | | | | | | | | |
| | Chevron Corp. | | | 141,294 | | | | 12,607,664 | |
| | EOG Resources Inc. | | | 142,861 | | | | 7,237,338 | |
| | Exxon Mobil Corp. | | | 143,861 | | | | 6,433,464 | |
| | | | | | | | | | |
| | | | | | | | | 26,278,466 | |
| | | | | | | | | | |
| | Food & Staples Retailing 1.6% | | | | | | | | |
| | Walmart Inc. | | | 176,908 | | | | 21,190,040 | |
| | | | | | | | | | |
| | | |
| | Food, Beverage & Tobacco 3.5% | | | | | | | | |
| | McCormick & Co. Inc. | | | 124,447 | | | | 22,327,036 | |
| | PepsiCo Inc. | | | 186,030 | | | | 24,604,328 | |
| | | | | | | | | | |
| | | |
| | | | | | | | | 46,931,364 | |
| | | | | | | | | | |
| | Health Care Equipment & Services 16.5% | | | | | | | | |
| | Abbott Laboratories | | | 278,695 | | | | 25,481,084 | |
| | Becton Dickinson and Co. | | | 181,815 | | | | 43,502,875 | |
| | CVS Health Corp. | | | 160,793 | | | | 10,446,721 | |
| | Dentsply Sirona Inc. | | | 124,192 | | | | 5,471,899 | |
| | Medtronic PLC | | | 399,554 | | | | 36,639,102 | |
| | Stryker Corp. | | | 256,745 | | | | 46,262,882 | |
| | UnitedHealth Group Inc. | | | 59,400 | | | | 17,520,030 | |
| | West Pharmaceutical Services Inc. | | | 166,901 | | | | 37,914,900 | |
| | | | | | | | | | |
| | | | | | | | | 223,239,493 | |
| | | | | | | | | | |
FRANKLIN TEMPLETON VARIABLE INSURANCE PRODUCTS TRUST
STATEMENT OF INVESTMENTS (UNAUDITED)
Franklin Rising Dividends VIP Fund (continued)
| | | | | | | | | | |
| | | |
| | | | | Shares | | | Value | |
| | | |
| | Common Stocks (continued) | | | | | | | | |
| | Household & Personal Products 3.1% | | | | | | | | |
| | Colgate-Palmolive Co. | | | 248,540 | | | $ | 18,208,040 | |
| | The Procter & Gamble Co. | | | 202,094 | | | | 24,164,380 | |
| | | | | | | | | | |
| | | |
| | | | | | | | | 42,372,420 | |
| | | | | | | | | | |
| | Industrial Conglomerates 8.6% | | | | | | | | |
| | Carlisle Cos. Inc. | | | 74,202 | | | | 8,879,753 | |
| | Honeywell International Inc. | | | 248,075 | | | | 35,869,164 | |
| | Roper Technologies Inc. | | | 183,883 | | | | 71,394,414 | |
| | | | | | | | | | |
| | | |
| | | | | | | | | 116,143,331 | |
| | | | | | | | | | |
| | Insurance 1.4% | | | | | | | | |
| | Aflac Inc. | | | 192,904 | | | | 6,950,331 | |
| | Erie Indemnity Co., A | | | 62,670 | | | | 12,026,373 | |
| | | | | | | | | | |
| | | |
| | | | | | | | | 18,976,704 | |
| | | | | | | | | | |
| | Machinery 3.3% | | | | | | | | |
| | Donaldson Co. Inc. | | | 190,497 | | | | 8,861,921 | |
| | Dover Corp. | | | 191,888 | | | | 18,528,705 | |
| | Otis Worldwide Corp. | | | 98,553 | | | | 5,603,723 | |
| | Pentair PLC | | | 308,694 | | | | 11,727,285 | |
| | | | | | | | | | |
| | | |
| | | | | | | | | 44,721,634 | |
| | | | | | | | | | |
| | Materials 10.6% | | | | | | | | |
| | Air Products and Chemicals Inc. | | | 188,467 | | | | 45,507,242 | |
| | Albemarle Corp. | | | 345,610 | | | | 26,684,548 | |
| | Ecolab Inc. | | | 120,309 | | | | 23,935,476 | |
| | Linde PLC (United Kingdom) | | | 222,432 | | | | 47,180,051 | |
| | | | | | | | | | |
| | | |
| | | | | | | | | 143,307,317 | |
| | | | | | | | | | |
| | Pharmaceuticals, Biotechnology & Life Sciences 4.5% | | | | | | | | |
| | AbbVie Inc. | | | 152,236 | | | | 14,946,530 | |
| | Johnson & Johnson | | | 195,929 | | | | 27,553,495 | |
| | Perrigo Co. PLC | | | 108,863 | | | | 6,016,858 | |
| | Pfizer Inc. | | | 379,815 | | | | 12,419,951 | |
| | | | | | | | | | |
| | | |
| | | | | | | | | 60,936,834 | |
| | | | | | | | | | |
| | Retailing 5.4% | | | | | | | | |
| | Lowe’s Cos. Inc. | | | 195,372 | | | | 26,398,665 | |
| | Ross Stores Inc. | | | 234,930 | | | | 20,025,433 | |
| | Target Corp. | | | 223,737 | | | | 26,832,778 | |
| | | | | | | | | | |
| | | |
| | | | | | | | | 73,256,876 | |
| | | | | | | | | | |
| | Semiconductors & Semiconductor Equipment 6.2% | | | | | | | | |
| | Analog Devices Inc. | | | 338,519 | | | | 41,515,970 | |
| | Texas Instruments Inc. | | | 332,168 | | | | 42,175,371 | |
| | | | | | | | | | |
| | | |
| | | | | | | | | 83,691,341 | |
| | | | | | | | | | |
FRANKLIN TEMPLETON VARIABLE INSURANCE PRODUCTS TRUST
STATEMENT OF INVESTMENTS (UNAUDITED)
Franklin Rising Dividends VIP Fund (continued)
| | | | | | | | | | |
| | | |
| | | | | Shares | | | Value | |
| | Common Stocks (continued) | | | | | | | | |
| | Software & Services 14.4% | | | | | | | | |
| | Accenture PLC, A | | | 243,078 | | | $ | 52,193,708 | |
| | Microsoft Corp. | | | 576,928 | | | | 117,410,617 | |
| | Visa Inc., A | | | 134,562 | | | | 25,993,342 | |
| | | | | | | | | | |
| | | | | | | | | 195,597,667 | |
| | | | | | | | | | |
| | Trading Companies & Distributors 1.0% | | | | | | | | |
| | W.W. Grainger Inc. | | | 40,993 | | | | 12,878,361 | |
| | | | | | | | | | |
| | Transportation 2.6% | | | | | | | | |
| | Norfolk Southern Corp. | | | 95,647 | | | | 16,792,744 | |
| | United Parcel Service Inc., B | | | 161,367 | | | | 17,940,783 | |
| | | | | | | | | | |
| | | | | | | | | 34,733,527 | |
| | | | | | | | | | |
| | | |
| | Total Common Stocks (Cost $643,793,684) | | | | | | | 1,299,143,271 | |
| | | | | | | | | | |
| | | |
| | Short Term Investments (Cost $52,452,937) 3.9% | | | | | | | | |
| | | |
| | Money Market Funds 3.9% | | | | | | | | |
| a,b | | Institutional Fiduciary Trust Money Market Portfolio, 0.00% | | | 52,452,937 | | | | 52,452,937 | |
| | | | | | | | | | |
| | | |
| | Total Investments (Cost $696,246,621) 99.9% | | | | | | | 1,351,596,208 | |
| | | |
| | Other Assets, less Liabilities 0.1% | | | | | | | 2,017,259 | |
| | | | | | | | | | |
| | | |
| | Net Assets 100.0% | | | | | | $ | 1,353,613,467 | |
| | | | | | | | | | |
aSee Note 3(e) regarding investments in affiliated management investment companies.
bThe rate shown is the annualized seven-day effective yield at period end.
| | | | | | |
| | |
| The accompanying notes are an integral part of these financial statements. | Semiannual Report | | | FRD-11 | |
FRANKLIN TEMPLETON VARIABLE INSURANCE PRODUCTS TRUST
FINANCIAL STATEMENTS
Statement of Assets and Liabilities
June 30, 2020 (unaudited)
| | | | |
| | | Franklin Rising
Dividends VIP
Fund | |
Assets: | | | | |
Investments in securities: | | | | |
Cost - Unaffiliated issuers | | $ | 643,793,684 | |
Cost - Non-controlled affiliates (Note 3e) | | | 52,452,937 | |
| | | | |
Value - Unaffiliated issuers | | $ | 1,299,143,271 | |
Value - Non-controlled affiliates (Note 3e) | | | 52,452,937 | |
Receivables: | | | | |
Investment securities sold | | | 22,915 | |
Capital shares sold | | | 2,289,977 | |
Dividends | | | 1,048,381 | |
Other assets | | | 1,245 | |
| | | | |
Total assets | | | 1,354,958,726 | |
| | | | |
Liabilities: | | | | |
Payables: | | | | |
Capital shares redeemed | | | 251,866 | |
Management fees | | | 680,573 | |
Distribution fees | | | 247,101 | |
Trustees’ fees and expenses | | | 540 | |
Reports to shareholders | | | 115,164 | |
Accrued expenses and other liabilities | | | 50,015 | |
| | | | |
Total liabilities | | | 1,345,259 | |
| | | | |
Net assets, at value | | $ | 1,353,613,467 | |
| | | | |
Net assets consist of: | | | | |
Paid-in capital | | | $ 654,522,169 | |
Total distributable earnings (losses) | | | 699,091,298 | |
| | | | |
Net assets, at value | | $ | 1,353,613,467 | |
| | | | |
| Class 1: | | | | |
Net assets, at value | | $ | 136,120,264 | |
| | | | |
Shares outstanding | | | 5,505,798 | |
| | | | |
Net asset value and maximum offering price per share | | $ | 24.72 | |
| | | | |
| Class 2: | | | | |
Net assets, at value | | $ | 1,174,600,707 | |
| | | | |
Shares outstanding | | | 49,131,938 | |
| | | | |
Net asset value and maximum offering price per share | | $ | 23.91 | |
| | | | |
| Class 4: | | | | |
Net assets, at value | | $ | 42,892,496 | |
| | | | |
Shares outstanding | | | 1,788,598 | |
| | | | |
Net asset value and maximum offering price per share | | | $ 23.98 | |
| | | | |
| | | | |
| | | |
| FRD-12 | | Semiannual Report | The accompanying notes are an integral part of these financial statements. | | |
FRANKLIN TEMPLETON VARIABLE INSURANCE PRODUCTS TRUST
FINANCIAL STATEMENTS
Statement of Operations
for the six months ended June 30, 2020 (unaudited)
| | | | |
| | | Franklin Rising
Dividends VIP
Fund | |
Investment income: | | | | |
Dividends: | | | | |
Unaffiliated issuers | | $ | 12,933,421 | |
Non-controlled affiliates (Note 3e) | | | 38,590 | |
| | | | |
| |
Total investment income | | | 12,972,011 | |
| | | | |
Expenses: | | | | |
Management fees (Note 3a) | | | 4,258,919 | |
Distribution fees: (Note 3c) | | | | |
Class 2 | | | 1,445,175 | |
Class 4 | | | 73,767 | |
Custodian fees (Note 4) | | | 5,353 | |
Reports to shareholders | | | 80,050 | |
Professional fees | | | 32,063 | |
Trustees’ fees and expenses | | | 4,541 | |
Other | | | 17,054 | |
| | | | |
| |
Total expenses | | | 5,916,922 | |
Expense reductions (Note 4) | | | (2,984 | ) |
Expenses waived/paid by affiliates (Note 3e) | | | (32,299 | ) |
| | | | |
| |
Net expenses | | | 5,881,639 | |
| | | | |
| |
Net investment income | | | 7,090,372 | |
| | | | |
Realized and unrealized gains (losses): | | | | |
Net realized gain (loss) from: | | | | |
Investments: | | | | |
Unaffiliated issuers | | | 39,470,417 | |
| | | | |
Net change in unrealized appreciation (depreciation) on: | | | | |
Investments: | | | | |
Unaffiliated issuers | | | (149,518,047 | ) |
| | | | |
| |
Net realized and unrealized gain (loss) | | | (110,047,630 | ) |
| | | | |
| |
Net increase (decrease) in net assets resulting from operations | | $ | (102,957,258 | ) |
| | | | |
| | | | | | |
| | | |
| | The accompanying notes are an integral part of these financial statements. | Semiannual Report | | | FRD-13 | |
FRANKLIN TEMPLETON VARIABLE INSURANCE PRODUCTS TRUST
FINANCIAL STATEMENTS
Statements of Changes in Net Assets
| | | | | | | | |
| | | Franklin Rising Dividends VIP Fund | |
| | |
| | | Six Months Ended
June 30, 2020
(unaudited) | | | Year Ended
December 31, 2019 | |
Increase (decrease) in net assets: | | | | | | | | |
Operations: | | | | | | | | |
Net investment income | | $ | 7,090,372 | | | $ | 17,322,041 | |
Net realized gain (loss) | | | 39,470,417 | | | | 82,812,044 | |
Net change in unrealized appreciation (depreciation) | | | (149,518,047 | ) | | | 279,796,675 | |
| | | | |
Net increase (decrease) in net assets resulting from operations | | | (102,957,258 | ) | | | 379,930,760 | |
| | | | |
Distributions to shareholders: | | | | | | | | |
Class 1 | | | (9,363,148 | ) | | | (28,799,833 | ) |
Class 2 | | | (76,921,978 | ) | | | (227,983,493 | ) |
Class 4 | | | (2,888,655 | ) | | | (6,300,776 | ) |
| | | | |
Total distributions to shareholders | | | (89,173,781 | ) | | | (263,084,102 | ) |
| | | | |
Capital share transactions: (Note 2) | | | | | | | | |
Class 1 | | | 1,777,365 | | | | (21,678,109 | ) |
Class 2 | | | (42,629,500 | ) | | | 182,626,753 | |
Class 4 | | | 1,505,341 | | | | 10,299,225 | |
| | | | |
Total capital share transactions | | | (39,346,794 | ) | | | 171,247,869 | |
| | | | |
Net increase (decrease) in net assets | | | (231,477,833 | ) | | | 288,094,527 | |
Net assets: | | | | | | | | |
Beginning of period | | | 1,585,091,300 | | | | 1,296,996,773 | |
| | | | |
End of period | | $ | 1,353,613,467 | | | $ | 1,585,091,300 | |
| | | | |
| | | | |
| | | |
| FRD-14 | | Semiannual Report | The accompanying notes are an integral part of these financial statements. | | |
FRANKLIN TEMPLETON VARIABLE INSURANCE PRODUCTS TRUST
Notes to Financial Statements (unaudited)
Franklin Rising Dividends VIP Fund
1. Organization and Significant Accounting Policies
Franklin Templeton Variable Insurance Products Trust (Trust) is registered under the Investment Company Act of 1940 (1940 Act) as an open-end management investment company, consisting of eighteen separate funds and applies the specialized accounting and reporting guidance in U.S. Generally Accepted Accounting Principles (U.S. GAAP). Franklin Rising Dividends VIP Fund (Fund) is included in this report. Shares of the Fund are generally sold only to insurance company separate accounts to fund the benefits of variable life insurance policies or variable annuity contracts. The Fund offers three classes of shares: Class 1, Class 2 and Class 4. Each class of shares may differ by its distribution fees, voting rights on matters affecting a single class and its exchange privilege.
The following summarizes the Fund’s significant accounting policies.
a. Financial Instrument Valuation
The Fund’s investments in financial instruments are carried at fair value daily. Fair value is the price that would be received to sell an asset or paid to transfer a liability in an orderly transaction between market participants on the measurement date. The Fund calculates the net asset value (NAV) per share each business day as of 4 p.m. Eastern time or the regularly scheduled close of the New York Stock Exchange (NYSE), whichever is earlier. Under compliance policies and procedures approved by the Trust’s Board of Trustees (the Board), the Fund’s administrator has responsibility for oversight of valuation, including leading the cross-functional Valuation Committee (VC). The Fund may utilize independent pricing services, quotations from securities and financial instrument dealers, and other market sources to determine fair value.
Equity securities listed on an exchange or on the NASDAQ National Market System are valued at the last quoted sale price or the official closing price of the day, respectively. Foreign equity securities are valued as of the close of trading on the foreign stock exchange on which the security is primarily traded, or as of 4 p.m. Eastern time. The value is then converted into its U.S. dollar equivalent at the foreign exchange rate in effect at 4 p.m. Eastern time on the day that the value of the security is determined. Over-the-counter (OTC) securities are valued within the range of the most recent quoted bid and ask prices. Securities that trade in multiple markets or on multiple exchanges are valued
according to the broadest and most representative market. Certain equity securities are valued based upon fundamental characteristics or relationships to similar securities.
Investments in open-end mutual funds are valued at the closing NAV.
The Fund has procedures to determine the fair value of financial instruments for which market prices are not reliable or readily available. Under these procedures, the Fund primarily employs a market-based approach which may use related or comparable assets or liabilities, recent transactions, market multiples, book values, and other relevant information for the investment to determine the fair value of the investment. An income-based valuation approach may also be used in which the anticipated future cash flows of the investment are discounted to calculate fair value. Discounts may also be applied due to the nature or duration of any restrictions on the disposition of the investments. Due to the inherent uncertainty of valuations of such investments, the fair values may differ significantly from the values that would have been used had an active market existed.
Trading in securities on foreign securities stock exchanges and OTC markets may be completed before 4 p.m. Eastern time. In addition, trading in certain foreign markets may not take place on every Fund’s business day. Events can occur between the time at which trading in a foreign security is completed and 4 p.m. Eastern time that might call into question the reliability of the value of a portfolio security held by the Fund. As a result, differences may arise between the value of the Fund’s portfolio securities as determined at the foreign market close and the latest indications of value at 4 p.m. Eastern time. In order to minimize the potential for these differences, an independent pricing service may be used to adjust the value of the Fund’s portfolio securities to the latest indications of fair value at 4 p.m Eastern time.
When the last day of the reporting period is a non-business day, certain foreign markets may be open on those days that the Fund’s NAV is not calculated, which could result in differences between the value of the Fund’s portfolio securities on the last business day and the last calendar day of the reporting period. Any significant security valuation changes due to an open foreign market are adjusted and reflected by the Fund for financial reporting purposes.
FRANKLIN TEMPLETON VARIABLE INSURANCE PRODUCTS TRUST
NOTES TO FINANCIAL STATEMENTS (UNAUDITED)
Franklin Rising Dividends VIP Fund (continued)
1. Organization and Significant Accounting
Policies (continued)
b. Foreign Currency Translation
Portfolio securities and other assets and liabilities denominated in foreign currencies are translated into U.S. dollars based on the exchange rate of such currencies against U.S. dollars on the date of valuation. The Fund may enter into foreign currency exchange contracts to facilitate transactions denominated in a foreign currency. Purchases and sales of securities, income and expense items denominated in foreign currencies are translated into U.S. dollars at the exchange rate in effect on the transaction date. Portfolio securities and assets and liabilities denominated in foreign currencies contain risks that those currencies will decline in value relative to the U.S. dollar. Occasionally, events may impact the availability or reliability of foreign exchange rates used to convert the U.S. dollar equivalent value. If such an event occurs, the foreign exchange rate will be valued at fair value using procedures established and approved by the Board.
The Fund does not separately report the effect of changes in foreign exchange rates from changes in market prices on securities held. Such changes are included in net realized and unrealized gain or loss from investments in the Statement of Operations.
Realized foreign exchange gains or losses arise from sales of foreign currencies, currency gains or losses realized between the trade and settlement dates on securities transactions and the difference between the recorded amounts of dividends, interest, and foreign withholding taxes and the U.S. dollar equivalent of the amounts actually received or paid. Net unrealized foreign exchange gains and losses arise from changes in foreign exchange rates on foreign denominated assets and liabilities other than investments in securities held at the end of the reporting period.
c. Income and Deferred Taxes
It is the Fund’s policy to qualify as a regulated investment company under the Internal Revenue Code. The Fund intends to distribute to shareholders substantially all of its taxable income and net realized gains to relieve it from federal income and if applicable, excise taxes. As a result, no provision for U.S. federal income taxes is required.
The Fund may be subject to foreign taxation related to income received, capital gains on the sale of securities and certain foreign currency transactions in the foreign jurisdictions in which it invests. Foreign taxes, if any, are recorded based on the tax regulations and rates that exist in the foreign markets in which the Fund invests. When a capital gain tax is determined to apply, the Fund records an estimated deferred tax liability in an amount that would be payable if the securities were disposed of on the valuation date.
The Fund may recognize an income tax liability related to its uncertain tax positions under U.S. GAAP when the uncertain tax position has a less than 50% probability that it will be sustained upon examination by the tax authorities based on its technical merits. As of June 30, 2020, the Fund has determined that no tax liability is required in its financial statements related to uncertain tax positions for any open tax years (or expected to be taken in future tax years). Open tax years are those that remain subject to examination and are based on the statute of limitations in each jurisdiction in which the Fund invests.
d. Security Transactions, Investment Income, Expenses and Distributions
Security transactions are accounted for on trade date. Realized gains and losses on security transactions are determined on a specific identification basis. Estimated expenses are accrued daily. Dividend income is recorded on the ex-dividend date except for certain dividends from securities where the dividend rate is not available. In such cases, the dividend is recorded as soon as the information is received by the Fund. Distributions to shareholders are recorded on the ex-dividend date. Distributable earnings are determined according to income tax regulations (tax basis) and may differ from earnings recorded in accordance with U.S. GAAP. These differences may be permanent or temporary. Permanent differences are reclassified among capital accounts to reflect their tax character. These reclassifications have no impact on net assets or the results of operations. Temporary differences are not reclassified, as they may reverse in subsequent periods.
Common expenses incurred by the Trust are allocated among the Funds based on the ratio of net assets of each Fund to the combined net assets of the Trust or based on the ratio of
FRANKLIN TEMPLETON VARIABLE INSURANCE PRODUCTS TRUST
NOTES TO FINANCIAL STATEMENTS (UNAUDITED)
Franklin Rising Dividends VIP Fund (continued)
number of shareholders of each Fund to the combined number of shareholders of the Trust. Fund specific expenses are charged directly to the Fund that incurred the expense.
Realized and unrealized gains and losses and net investment income, excluding class specific expenses, are allocated daily to each class of shares based upon the relative proportion of net assets of each class. Differences in per share distributions by class are generally due to differences in class specific expenses.
e. Accounting Estimates
The preparation of financial statements in accordance with U.S. GAAP requires management to make estimates and assumptions that affect the reported amounts of assets and liabilities at the date of the financial statements and the amounts of income and expenses during the reporting period. Actual results could differ from those estimates.
f. Guarantees and Indemnifications
Under the Trust’s organizational documents, its officers and trustees are indemnified by the Trust against certain liabilities arising out of the performance of their duties to the Trust. Additionally, in the normal course of business, the Trust, on behalf of the Fund, enters into contracts with service providers that contain general indemnification clauses. The Trust’s maximum exposure under these arrangements is unknown as this would involve future claims that may be made against the Trust that have not yet occurred. Currently, the Trust expects the risk of loss to be remote.
2. Shares of Beneficial Interest
At June 30, 2020, there were an unlimited number of shares authorized (without par value). Transactions in the Fund’s shares were as follows:
| | | | | | | | | | | | | | | | |
| | | Six Months Ended | | | Year Ended | |
| | |
| | | June 30, 2020 | | | December 31, 2019 | |
| | | | |
| | | Shares | | | Amount | | | Shares | | | Amount | |
| | | | |
| Class 1 Shares: | | | | | | | | | | | | | | | | |
Shares sold | | | 91,477 | | | $ | 2,138,662 | | | | 238,379 | | | $ | 6,420,546 | |
Shares issued in reinvestment of distributions | | | 386,747 | | | | 9,363,148 | | | | 1,132,514 | | | | 28,799,833 | |
Shares redeemed | | | (380,059 | ) | | | (9,724,445 | ) | | | (2,092,688 | ) | | | (56,898,488) | |
| | | | |
Net increase (decrease) | | | 98,165 | | | $ | 1,777,365 | | | | (721,795 | ) | | $ | (21,678,109) | |
| | | | |
| Class 2 Shares: | | | | | | | | | | | | | | | | |
Shares sold | | | 5,031,301 | | | $ | 123,392,526 | | | | 7,298,801 | | | $ | 200,248,939 | |
Shares issued in reinvestment of distributions | | | 3,284,457 | | | | 76,921,978 | | | | 9,252,577 | | | | 227,983,493 | |
Shares redeemed in-kind (Note 9) | | | — | | | | — | | | | (897,175 | ) | | | (22,646,135) | |
Shares redeemed | | | (10,591,496 | ) | | | (242,944,004 | ) | | | (8,430,854 | ) | | | (222,959,544) | |
| | | | |
Net increase (decrease) | | | (2,275,738 | ) | | $ | (42,629,500 | ) | | | 7,223,349 | | | $ | 182,626,753 | |
| | | | |
| Class 4 Shares: | | | | | | | | | | | | | | | | |
Shares sold | | | 144,348 | | | $ | 3,435,582 | | | | 415,831 | | | $ | 10,934,186 | |
Shares issued in reinvestment of distributions | | | 122,974 | | | | 2,888,655 | | | | 254,783 | | | | 6,300,776 | |
Shares redeemed | | | (197,420 | ) | | | (4,818,896 | ) | | | (258,933 | ) | | | (6,935,737) | |
| | | | |
Net increase (decrease) | | | 69,902 | | | $ | 1,505,341 | | | | 411,681 | | | $ | 10,299,225 | |
| | | | |
FRANKLIN TEMPLETON VARIABLE INSURANCE PRODUCTS TRUST
NOTES TO FINANCIAL STATEMENTS (UNAUDITED)
Franklin Rising Dividends VIP Fund (continued)
3. Transactions with Affiliates
Franklin Resources, Inc. is the holding company for various subsidiaries that together are referred to as Franklin Templeton. Certain officers and trustees of the Fund are also officers and/or directors of the following subsidiaries:
| | |
| |
| Subsidiary | | Affiliation |
Franklin Advisers, Inc. (Advisers) | | Investment manager |
Franklin Templeton Services, LLC (FT Services) | | Administrative manager |
Franklin Templeton Distributors, Inc. (Distributors) | | Principal underwriter |
Franklin Templeton Investor Services, LLC (Investor Services) | | Transfer agent |
a. Management Fees
The Fund pays an investment management fee to Advisers based on the average daily net assets of the Fund as follows:
| | |
| |
| Annualized Fee Rate | | Net Assets |
0.750% | | Up to and including $500 million |
0.625% | | Over $500 million, up to and including $1 billion |
0.500% | | Over $1 billion, up to and including $5 billion |
0.490% | | In excess of $5 billion |
For the period ended June 30, 2020, the annualized gross effective investment management fee rate was 0.641% of the Fund’s average daily net assets.
b. Administrative Fees
Under an agreement with Advisers, FT Services provides administrative services to the Fund. The fee is paid by Advisers based on the Fund’s average daily net assets, and is not an additional expense of the Fund.
c. Distribution Fees
The Board has adopted distribution plans for Class 2 and Class 4 shares pursuant to Rule 12b-1 under the 1940 Act. Under the Fund’s compensation distribution plans, the Fund pays Distributors for costs incurred in connection with the servicing, sale and distribution of the Fund’s shares up to 0.35% per year of its average daily net assets of each class. The Board has agreed to limit the current rate to 0.25% per year for Class 2. The plan year, for purposes of monitoring compliance with the maximum annual plan rates, is February 1 through January 31.
d. Transfer Agent Fees
Investor Services, under terms of an agreement, performs shareholder servicing for the Fund and is not paid by the Fund for the services.
FRANKLIN TEMPLETON VARIABLE INSURANCE PRODUCTS TRUST
NOTES TO FINANCIAL STATEMENTS (UNAUDITED)
Franklin Rising Dividends VIP Fund (continued)
e. Investments in Affiliated Management Investment Companies
The Fund invests in one or more affiliated management investment companies for purposes other than exercising a controlling influence over the management or policies. Management fees paid by the Fund are waived on assets invested in the affiliated management investment companies, as noted in the Statement of Operations, in an amount not to exceed the management and administrative fees paid directly or indirectly by each affiliate. During the period ended June 30, 2020, the Fund held investments in affiliated management investment companies as follows:
| | | | | | | | | | | | | | | | | | | | | | | | | | | | | | | | |
| | | | | | | | |
| | | Value at
Beginning
of Period | | | Purchases | | | Sales | | | Realized
Gain (Loss) | | | Net Change in
Unrealized
Appreciation
(Depreciation) | | | Value at
End of
Period | | | Number of
Shares
Held at End
of Period | | | Dividend
Income | |
| Non-Controlled Affiliates | | | | | | | | | | | | | | | | | | | | | | | | | | | | | |
| | | | | | | | |
Institutional Fiduciary Trust Money Market Portfolio, 0.00% | | | $17,735,928 | | | | $166,499,752 | | | | $(131,782,743) | | | | $ — | | | | $ — | | | | $52,452,937 | | | | 52,452,937 | | | | $38,590 | |
| | | | |
4. Expense Offset Arrangement
The Fund has entered into an arrangement with its custodian whereby credits realized as a result of uninvested cash balances are used to reduce a portion of the Fund’s custodian expenses. During the period ended June 30, 2020, the custodian fees were reduced as noted in the Statement of Operations.
5. Income Taxes
At June 30, 2020, the cost of investments and net unrealized appreciation (depreciation) for income tax purposes were as follows:
| | | | |
Cost of investments | | $ | 699,061,403 | |
| | | | |
| |
Unrealized appreciation | | $ | 686,228,892 | |
Unrealized depreciation | | | (33,694,087) | |
| | | | |
| |
Net unrealized appreciation (depreciation) | | $ | 652,534,805 | |
| | | | |
Differences between income and/or capital gains as determined on a book basis and a tax basis are primarily due to differing treatment of gains realized on in-kind shareholder redemptions.
6. Investment Transactions
Purchases and sales of investments (excluding short term securities) for the period ended June 30, 2020, aggregated $122,274,094 and $276,995,819, respectively.
7. Novel Coronavirus Pandemic
The global outbreak of the novel coronavirus disease, known as COVID-19, has caused adverse effects on many companies, sectors, nations, regions and the markets in general, and may continue for an unpredictable duration. The effects of this pandemic may materially impact the value and performance of the Fund, its ability to buy and sell fund investments at appropriate valuations and its ability to achieve its investment objectives.
FRANKLIN TEMPLETON VARIABLE INSURANCE PRODUCTS TRUST
NOTES TO FINANCIAL STATEMENTS (UNAUDITED)
Franklin Rising Dividends VIP Fund (continued)
8. Credit Facility
The Fund, together with other U.S. registered and foreign investment funds (collectively, Borrowers), managed by Franklin Templeton, are borrowers in a joint syndicated senior unsecured credit facility totaling $2 billion (Global Credit Facility) which matures on February 5, 2021. This Global Credit Facility provides a source of funds to the Borrowers for temporary and emergency purposes, including the ability to meet future unanticipated or unusually large redemption requests.
Under the terms of the Global Credit Facility, the Fund shall, in addition to interest charged on any borrowings made by the Fund and other costs incurred by the Fund, pay its share of fees and expenses incurred in connection with the implementation and maintenance of the Global Credit Facility, based upon its relative share of the aggregate net assets of all of the Borrowers, including an annual commitment fee of 0.15% based upon the unused portion of the Global Credit Facility. These fees are reflected in other expenses in the Statement of Operations. During the period ended June 30, 2020, the Fund did not use the Global Credit Facility.
9. Redemption In-Kind
During the year ended December 31, 2019, the Fund realized $10,655,992 of net gains resulting from redemptions in-kind in which a shareholder redeemed fund shares for cash and securities held by the Fund. Because such gains are not taxable to the Fund and are not distributed to remaining shareholders, they are reclassified from accumulated net realized gains to paid-in capital.
10. Fair Value Measurements
The Fund follows a fair value hierarchy that distinguishes between market data obtained from independent sources (observable inputs) and the Fund’s own market assumptions (unobservable inputs). These inputs are used in determining the value of the Fund’s financial instruments and are summarized in the following fair value hierarchy:
| | • | | Level 1 – quoted prices in active markets for identical financial instruments |
| | • | | Level 2 – other significant observable inputs (including quoted prices for similar financial instruments, interest rates, prepayment speed, credit risk, etc.) |
| | • | | Level 3 – significant unobservable inputs (including the Fund’s own assumptions in determining the fair value of financial instruments) |
The input levels are not necessarily an indication of the risk or liquidity associated with financial instruments at that level.
At June 30, 2020, all of the Fund’s investments in financial instruments carried at fair value were valued using Level 1 inputs. For detailed categories, see the accompanying Statement of Investments.
11. New Accounting Pronouncements
In March 2020, the Financial Accounting Standards Board (FASB) issued Accounting Standards Update (ASU) No. 2020-04, Reference Rate Reform (Topic 848) – Facilitation of the Effects of Reference Rate Reform on Financial Reporting. The amendments in the ASU provides optional temporary financial reporting relief from the effect of certain types of contract modifications due to the planned discontinuation of the London Interbank Offered Rate (LIBOR) and other interbank-offered based reference rates as of the end of 2021. The ASU is effective for certain reference rate-related contract modifications that occur during the period March 12, 2020 through December 31, 2022. Management is currently evaluating the impact, if any, of applying this ASU.
FRANKLIN TEMPLETON VARIABLE INSURANCE PRODUCTS TRUST
NOTES TO FINANCIAL STATEMENTS (UNAUDITED)
Franklin Rising Dividends VIP Fund (continued)
12. Subsequent Events
The Fund has evaluated subsequent events through the issuance of the financial statements and determined that no events have occurred that require disclosure.
This page intentionally left blank.
Franklin Small Cap Value VIP Fund
This semiannual report for Franklin Small Cap Value VIP Fund covers the period ended June 30, 2020.
Class 4 Performance Summary as of June 30, 2020
The Fund’s Class 4 Shares posted a -18.43% total return for the six-month period ended June 30, 2020.
Performance reflects the Fund’s Class 4 operating expenses, but does not include any contract fees, expenses or sales charges. If they had been included, performance would be lower. These charges and deductions, particularly for variable life policies, can have a significant effect on contract values and insurance benefits. See the contract prospectus for a complete description of these expenses, including sales charges.
Performance data represent past performance, which does not guarantee future results. Investment return and principal value will fluctuate, and you may have a gain or loss when you sell your shares. Current performance may differ from figures shown.
FRANKLIN SMALL CAP VALUE VIP FUND
Fund Goal and Main Investments
The Fund seeks long-term total return. Under normal market conditions, the Fund invests at least 80% of its net assets in investments of small capitalization companies. For this Fund, small capitalization companies are those with market capitalizations not exceeding either the highest market capitalization in the Russell 2000® Index or the 12-month average of the highest market capitalization in the Russell 2000® Index, whichever is greater, at the time of purchase. The Fund generally invests in equity securities of companies that the manager believes are undervalued at the time of purchase and have the potential for capital appreciation.
Fund Risks
All investments involve risks, including possible loss of principal. Unexpected events and their aftermaths, such as the spread of deadly diseases; natural, environmental or man-made disasters; financial, political or social disruptions; terrorism and war; and other tragedies or catastrophes, can cause investor fear and panic, which can adversely affect the economies of many companies, sectors, nations, regions and the market in general, in ways that cannot necessarily be foreseen. The Fund’s investments in smaller company stocks carry special risks as such stocks have historically exhibited greater price volatility than large-company stocks, particularly over the short term. Additionally, smaller companies often have relatively small revenues, limited product lines and a small market share. Value securities may not increase in price as anticipated, or may decline further in value. In addition, the Fund may invest up to 25% of its total assets in foreign securities, which involve special risks, including currency fluctuations and economic and political uncertainty. The Fund also may invest in equity real estate investment trusts (REITs). The Fund is actively managed but there is no guarantee that the manager’s investment decisions will produce the desired results. The Fund’s prospectus also includes a description of the main investment risks.
Performance Overview
You can find the Fund’s six-month total return in the Performance Summary. In comparison, the Russell 2000® Value Index posted a -23.50% total return for the same period.1 Please note the Fund employs a bottom-up stock
selection process, and the managers invest in securities without regard to benchmark comparisons.
Economic and Market Overview
U.S. equities, as measured by the Standard & Poor’s® 500 Index, nearly reversed earlier losses but declined modestly during the six-month period. A sharp selloff began in late February 2020 amid investor fears of a global economic slowdown due to the novel coronavirus (COVID-19) pandemic.
Government-issued restrictions to mitigate the pandemic severely curtailed U.S. economic activity beginning in March 2020. As a result, the unemployment rate surged to 14.7% in April as many businesses, particularly in hospitality, retail and travel, announced mass layoffs.2 Within just two months, the unemployment rate went from a 50-year low to an 80-year high.2 The longest U.S. economic expansion in history ended in February, according to the National Bureau of Economic Research, and the country slipped into a deep recession.
In an effort to buffer the sharp drop in economic activity, the Fed implemented two emergency rate cuts in March 2020, lowering the federal funds target rate to a range of 0.00%–0.25%. Additionally, the Fed announced broad quantitative easing measures aimed at ensuring the flow of credit to borrowers and supporting credit markets with unlimited amounts of bond purchasing. Meanwhile, Congress passed the Coronavirus Aid, Relief and Economic Security Act to provide economic relief for individuals and businesses and additional funding for small businesses.
Benefiting from these fiscal and monetary measures, equities began to advance at the end of March 2020. As states gradually reopened, economic activity resumed, leading to declining initial jobless claims and record-high increases in job additions and existing home sales. Optimism about potential COVID-19 vaccines and treatments and rising retail sales further supported equities, which rebounded from multi-year lows to post the strongest second-quarter returns in more than 20 years. Nevertheless, surging infection rates in several states near the end of June led to concerns that economic recovery could be hindered if reopening measures are paused or rolled back.
1. Source: Morningstar. One cannot invest directly in an index, and an index is not representative of the Fund’s portfolio. Please see Index Descriptions following the Fund Summaries.
2. Source: Bureau of Labor Statistics.
The dollar value, number of shares or principal amount, and names of all portfolio holdings are listed in the Fund’s Statement of Investments (SOI).
FRANKLIN SMALL CAP VALUE VIP FUND
Investment Strategy
Our strategy is to invest in small-cap companies that we believe are undervalued at the time of purchase and have the potential for capital appreciation. A stock is undervalued, or is a “value,” when it trades at less than the price at which the investment manager believes it would trade if the market reflected all factors relating to the company’s worth.
Following this strategy, the Fund invests in companies that the investment manager believes have, for example: stock prices that are low relative to current, or historical or future earnings, book value, cash flow or sales; recent sharp price declines but the potential for good long-term earnings prospects; and valuable intangibles not reflected in the stock price. The Fund also may invest in equity real estate investment trusts (REITs).
The Fund may invest up to 25% of its total assets in foreign securities.
Manager’s Discussion
For the six months ended June 30, 2020, detractors from performance included Retail Properties of America, First Horizon National and Toll Brothers.
Retail Properties of America, a shopping center operator, underperformed as stay-at-home and closure guidelines issued to prevent the spread of COVID-19 exacerbated a challenging environment for the company’s brick-and-mortar retail tenants. During the first-quarter 2020 earnings call, management reported that it had collected just 52% of April rent as many non-essential retailers were shuttered. Although mandatory closure orders were being rescinded at period-end, some watch-list tenants were not expected to reopen. Also, previously stable sectors, such as fitness and casual dining, may face new pressures as consumer behavior shifts in response to new social distancing and spacing regulations. We exited the position.
Shares of First Horizon, a regional bank with a southeastern U.S. footprint, retreated as expectations for lower spread income and rising credit losses, attributable to the economic effect of the spread of COVID-19, contributed to negative sentiment. Rate cuts by the Fed to mitigate economic uncertainty could lead to a decline in spread income, the difference between interest received from interest-earning assets and interest paid on interest-bearing liabilities. Also, many sectors of the economy appear challenged to us, which may result in higher credit losses.
Shares of Toll Brothers, a builder of luxury homes, declined as the spread of COVID-19 contributed to a deterioration in the near-term outlook for the housing market. Unemployment
Portfolio Composition
Based on Total Net Assets as of 6/30/20
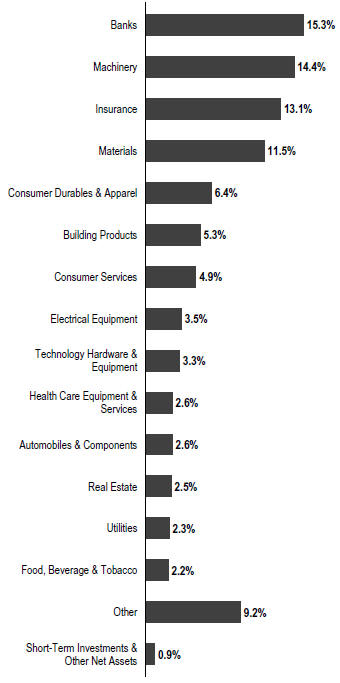
increased as businesses quickly responded to lockdown and social distancing directives. We believe that housing demand may shift toward single family homes in lower density markets because of these directives and the potential longer-lasting shift to working from home versus commuting. Consequently, Toll Brothers, which is a luxury builder with longer construction timelines and an urban infill segment focused on multifamily housing, may be less favorably positioned relative to peers. We exited our position before period-end.
FRANKLIN SMALL CAP VALUE VIP FUND
Top 10 Holdings
6/30/20
| | | | |
| |
Company Sector/Industry | | % of Total
Net Assets | |
Old Republic International Corp. Insurance | | | 3.3% | |
The Hanover Insurance Group Inc. Insurance | | | 3.2% | |
Regal Beloit Corp. Electrical Equipment | | | 3.2% | |
Horace Mann Educators Corp. Insurance | | | 3.0% | |
First Horizon National Corp. Banks | | | 2.9% | |
Rexnord Corp. Machinery | | | 2.7% | |
Jack in the Box Inc. Consumer Services | | | 2.6% | |
Columbia Banking System Inc. Banks | | | 2.5% | |
Oshkosh Corp. Machinery | | | 2.4% | |
Carter’s Inc. Consumer Durables & Apparel | | | 2.4% | |
Contributors to Fund performance included BJ’s Wholesale Club, Thor Industries and II-IV.
BJ’s Wholesale Club, a warehouse club retailer, benefited from accelerated purchases of consumer staples as the economy shut down in response to the COVID-19 pandemic. Longer term, we believe the company’s membership model may provide it with a longer benefit and an earnings advantage, if shoppers continue to sign up.
Shares of Thor Industries, a manufacturer of recreational vehicles, were bid up on investor expectations of increased consumer spending on domestic travel. International tourism has declined significantly as countries have closed borders to limit the spread of COVID-19. Thor also benefited from an anticipated acceleration in consumer discretionary spending tied to Congress passing the fiscal stimulus package.
Shares of II-VI, a provider of engineered materials and optoelectronic components, rose during the period, due to stronger-than-expected quarterly earnings in its fiscal third quarter in May and an improved outlook for the subsequent period. Results were driven by strong revenue growth in all end markets and the benefit of synergies from an acquisition occurring ahead of schedule. Furthermore, the company recorded a record backlog of orders, and its facility in
Sherman, TX, was qualified by a customer as an authorized provider of compound semiconductors.
Thank you for your participation in Franklin Small Cap Value VIP Fund. We look forward to serving your future investment needs.
The foregoing information reflects our analysis, opinions and portfolio holdings as of June 30, 2020, the end of the reporting period. The way we implement our main investment strategies and the resulting portfolio holdings may change depending on factors such as market and economic conditions. These opinions may not be relied upon as investment advice or an offer for a particular security. The information is not a complete analysis of every aspect of any market, country, industry, security or the Fund. Statements of fact are from sources considered reliable, but the investment manager makes no representation or warranty as to their completeness or accuracy. Although historical performance is no guarantee of future results, these insights may help you understand our investment management philosophy.
FRANKLIN SMALL CAP VALUE VIP FUND
Class 4 Fund Expenses
As an investor in a variable insurance contract (Contract) that indirectly provides for investment in an underlying mutual fund, you can incur transaction and/or ongoing expenses at both the Fund level and the Contract Level: (1) transaction expenses can include sales charges (loads) on purchases, surrender fees, transfer fees and premium taxes; and (2) ongoing expenses can include management fees, distribution and service (12b-1) fees, contract fees, annual maintenance fees, mortality and expense risk fees and other fees and expenses. All mutual funds and Contracts have some types of ongoing expenses. The table below shows Fund-level ongoing expenses and can help you understand these costs and compare them with those of other mutual funds offered through the Contract. The table assumes a $1,000 investment held for the six months indicated. Please refer to the Fund prospectus for additional information on operating expenses.
Actual Fund Expenses
The table below provides information about the actual account values and actual expenses in the columns under the heading “Actual.” In these columns the Fund’s actual return, which includes the effect of ongoing Fund expenses but does not include the effect of ongoing Contract expenses, is used to calculate the “Ending Account Value.” You can estimate the Fund-level expenses you paid during the period by following these steps (of course, your account value and expenses will differ from those in this illustration): Divide your account value by $1,000 (if your account had an $8,600 value, then $8,600 ÷ $1,000 = 8.6). Then multiply the result by the number under the headings “Actual” and “Fund-Level Expenses Paid During Period” (if Fund-Level Expenses Paid During Period were $ 7.50, then 8.6 x $ 7.50 = $64.50). In this illustration, the estimated expenses paid this period at the Fund level are $64.50.
Hypothetical Example for Comparison with Other Mutual Funds
Under the heading “Hypothetical” in the table, information is provided about hypothetical account values and hypothetical expenses based on the Fund’s actual expense ratio and an assumed rate of return of 5% per year before expenses, which is not the Fund’s actual return. This information may not be used to estimate the actual ending account balance or expenses you paid for the period, but it can help you compare ongoing costs of investing in the Fund with those of other mutual funds offered through the Contract. To do so, compare this 5% hypothetical example with the 5% hypothetical examples that appear in the shareholder reports of other funds offered through the Contract.
Please note that expenses shown in the table are meant to highlight ongoing costs at the Fund level only and do not reflect any ongoing expenses at the Contract level, or transaction expenses at either the Fund or Contract levels. In addition, while the Fund does not have transaction expenses, if the transaction and ongoing expenses at the Contract level were included, the expenses shown below would be higher. You should consult your Contract prospectus or disclosure document for more information.
| | | | | | | | | | | | | | | | | | |
| | | | | | | |
| | | | | | | Actual (actual return after expenses) | | | | Hypothetical
(5% annual return before expenses) | | | | |
| | | | | | | | | Fund-Level | | | | | | Fund-Level | | | | |
| | | | | | | | | Expenses | | | | | | Expenses | | | | Net |
| | | Beginning | | | | Ending | | Paid During | | | | Ending | | Paid During | | | | Annualized |
| Share | | Account | | | | Account | | Period | | | | Account | | Period | | | | Expense |
| Class | | Value 1/1/20 | | | | Value 6/30/20 | | 1/1/20–6/30/201, 2 | | | | Value 6/30/20 | | 1/1/20–6/30/201, 2 | | | | Ratio2 |
Class 4 | | $1,000 | | | | $815.70 | | $4.65 | | | | $1,019.74 | | $5.17 | | | | 1.03% |
1. Expenses are equal to the annualized expense ratio for the six-month period as indicated above—in the far right column—multiplied by the simple average account value over the period indicated, and then multiplied by 182/366 to reflect the one-half year period.
2. Reflects expenses after fee waivers and expense reimbursements. Does not include any ongoing expenses of the Contract for which the Fund is an investment option or acquired fund fees and expenses.
FRANKLIN TEMPLETON VARIABLE INSURANCE PRODUCTS TRUST
Financial Highlights
Franklin Small Cap Value VIP Fund
| | | | | | | | | | | | | | | | | | | | | | | | |
| | |
| | | Six Months Ended
June 30, 2020 (unaudited) | | | Year Ended December 31, | |
| | | 2019 | | | 2018 | | | 2017 | | | 2016 | | | 2015 | |
| | | | | | |
Class 1 | | | | | | | | | | | | | | | | | | | | | | | | |
Per share operating performance (for a share outstanding throughout the period) | | | | | | | | | | | | | | | | | | | | | | | | |
| | | | | | |
Net asset value, beginning of period | | | $15.73 | | | | $15.14 | | | | $20.43 | | | | $19.93 | | | | $18.12 | | | | $22.81 | |
| | | | |
| | | | | | |
| Income from investment operationsa: | | | | | | | | | | | | | | | | | | | | | | | | |
| | | | | | |
Net investment incomeb | | | 0.10 | | | | 0.24 | c | | | 0.21 | | | | 0.21 | d | | | 0.15 | | | | 0.21 | |
| | | | | | |
Net realized and unrealized gains (losses) | | | (3.01 | ) | | | 3.35 | | | | (2.29 | ) | | | 1.82 | | | | 4.79 | | | | (1.53 | ) |
| | | | |
| | | | | | |
Total from investment operations | | | (2.91 | ) | | | 3.59 | | | | (2.08 | ) | | | 2.03 | | | | 4.94 | | | | (1.32 | ) |
| | | | |
| | | | | | |
| Less distributions from: | | | | | | | | | | | | | | | | | | | | | | | | |
| | | | | | |
Net investment income | | | (0.23 | ) | | | (0.22 | ) | | | (0.23 | ) | | | (0.15 | ) | | | (0.21 | ) | | | (0.20 | ) |
| | | | | | |
Net realized gains | | | (0.81 | ) | | | (2.78 | ) | | | (2.98 | ) | | | (1.38 | ) | | | (2.92 | ) | | | (3.17 | ) |
| | | | |
| | | | | | |
Total distributions | | | (1.04 | ) | | | (3.00 | ) | | | (3.21 | ) | | | (1.53 | ) | | | (3.13 | ) | | | (3.37 | ) |
| | | | |
| | | | | | |
Net asset value, end of period | | | $11.78 | | | | $15.73 | | | | $15.14 | | | | $20.43 | | | | $19.93 | | | | $18.12 | |
| | | | |
| | | | | | |
Total returne | | | (18.31)% | | | | 26.72% | | | | (12.69)% | | | | 10.92% | | | | 30.54% | | | | (7.18)% | |
| | | | | | |
| Ratios to average net assetsf | | | | | | | | | | | | | | | | | | | | | | | | |
| | | | | | |
Expenses before waiver and payments by affiliates and expense reduction | | | 0.68% | | | | 0.67% | | | | 0.66% | | | | 0.66% | | | | 0.66% | | | | 0.65% | |
| | | | | | |
Expenses net of waiver and payments by affiliates and expense reductiong | | | 0.68% | h | | | 0.67% | h | | | 0.65% | | | | 0.65% | | | | 0.64% | | | | 0.64% | |
| | | | | | |
Net investment income | | | 1.50% | | | | 1.58% | c | | | 1.13% | | | | 1.06% | d | | | 0.84% | | | | 1.04% | |
| | | | | | |
| Supplemental data | | | | | | | | | | | | | | | | | | | | | | | | |
| | | | | | |
Net assets, end of period (000’s) | | | $38,887 | | | | $46,980 | | | | $40,644 | | | | $51,245 | | | | $47,831 | | | | $45,897 | |
| | | | | | |
Portfolio turnover rate | | | 33.77% | | | | 54.36% | | | | 47.82% | | | | 33.36% | | | | 34.60% | | | | 27.05% | |
aThe amount shown for a share outstanding throughout the period may not correlate with the Statement of Operations for the period due to the timing of sales and repurchases of the Fund’s shares in relation to income earned and/or fluctuating fair value of the investments of the Fund.
bBased on average daily shares outstanding.
cNet investment income per share includes approximately $0.05 per share related to income received in the form of special dividends in connection with certain Fund holdings. Excluding this amount, the ratio of net investment income to average net assets would have been 1.23%.
dNet investment income per share includes approximately $0.06 per share related to income received in the form of special dividends in connection with certain Fund holdings. Excluding this amount, the ratio of net investment income to average net assets would have been 0.75%.
eTotal return does not include fees, charges or expenses imposed by the variable annuity and life insurance contracts for which Franklin Templeton Variable Insurance Products Trust serves as an underlying investment vehicle. Total return is not annualized for periods less than one year.
fRatios are annualized for periods less than one year.
gBenefit of expense reduction rounds to less than 0.01%.
hBenefit of waiver and payments by affiliates rounds to less than 0.01%.
| | | | |
| | | |
| FSV-6 | | Semiannual Report | The accompanying notes are an integral part of these financial statements. | | |
FRANKLIN TEMPLETON VARIABLE INSURANCE PRODUCTS TRUST
FINANCIAL HIGHLIGHTS
Franklin Small Cap Value VIP Fund (continued)
| | | | | | | | | | | | | | | | | | | | | | | | |
| | |
| | | Six Months Ended
June 30, 2020 (unaudited) | | | Year Ended December 31, | |
| | | 2019 | | | 2018 | | | 2017 | | | 2016 | | | 2015 | |
| | | | | | |
Class 2 | | | | | | | | | | | | | | | | | | | | | | | | |
Per share operating performance (for a share outstanding throughout the period) | | | | | | | | | | | | | | | | | | | | | | | | |
| | | | | | |
Net asset value, beginning of period | | | $15.05 | | | | $14.60 | | | | $19.80 | | | | $19.36 | | | | $17.68 | | | | $22.32 | |
| | | | |
| | | | | | |
| Income from investment operationsa: | | | | | | | | | | | | | | | | | | | | | | | | |
| | | | | | |
Net investment incomeb | | | 0.08 | | | | 0.20 | c | | | 0.16 | | | | 0.15 | d | | | 0.10 | | | | 0.16 | |
| | | | | | |
Net realized and unrealized gains (losses) | | | (2.88 | ) | | | 3.20 | | | | (2.20 | ) | | | 1.77 | | | | 4.66 | | | | (1.49 | ) |
| | | | |
| | | | | | |
Total from investment operations | | | (2.80 | ) | | | 3.40 | | | | (2.04 | ) | | | 1.92 | | | | 4.76 | | | | (1.33 | ) |
| | | | |
| | | | | | |
| Less distributions from: | | | | | | | | | | | | | | | | | | | | | | | | |
| | | | | | |
Net investment income | | | (0.19 | ) | | | (0.17 | ) | | | (0.18 | ) | | | (0.10 | ) | | | (0.16 | ) | | | (0.14 | ) |
| | | | | | |
Net realized gains | | | (0.81 | ) | | | (2.78 | ) | | | (2.98 | ) | | | (1.38 | ) | | | (2.92 | ) | | | (3.17 | ) |
| | | | |
| | | | | | |
Total distributions | | | (1.00 | ) | | | (2.95 | ) | | | (3.16 | ) | | | (1.48 | ) | | | (3.08 | ) | | | (3.31 | ) |
| | | | |
| | | | | | |
Net asset value, end of period | | | $11.25 | | | | $15.05 | | | | $14.60 | | | | $19.80 | | | | $19.36 | | | | $17.68 | |
| | | | |
| | | | | | |
Total returne | | | (18.39)% | | | | 26.35% | | | | (12.88)% | | | | 10.65% | | | | 30.19% | | | | (7.39)% | |
| | | | | | |
| Ratios to average net assetsf | | | | | | | | | | | | | | | | | | | | | | | | |
| | | | | | |
Expenses before waiver and payments by affiliates and expense reduction | | | 0.93% | | | | 0.92% | | | | 0.91% | | | | 0.91% | | | | 0.91% | | | | 0.90% | |
| | | | | | |
Expenses net of waiver and payments by affiliates and expense reductiong | | | 0.93% | h | | | 0.92% | h | | | 0.90% | | | | 0.90% | | | | 0.89% | | | | 0.89% | |
| | | | | | |
Net investment income | | | 1.25% | | | | 1.33% | c | | | 0.88% | | | | 0.81% | d | | | 0.59% | | | | 0.79% | |
| | | | | | |
| Supplemental data | | | | | | | | | | | | | | | | | | | | | | | | |
| | | | | | |
Net assets, end of period (000’s) | | | $904,935 | | | | $1,123,093 | | | | $978,675 | | | | $1,302,055 | | | | $1,366,807 | | | | $1,172,173 | |
| | | | | | |
Portfolio turnover rate | | | 33.77% | | | | 54.36% | | | | 47.82% | | | | 33.36% | | | | 34.60% | | | | 27.05% | |
aThe amount shown for a share outstanding throughout the period may not correlate with the Statement of Operations for the period due to the timing of sales and repurchases of the Fund’s shares in relation to income earned and/or fluctuating fair value of the investments of the Fund.
bBased on average daily shares outstanding.
cNet investment income per share includes approximately $0.05 per share related to income received in the form of special dividends in connection with certain Fund holdings. Excluding this amount, the ratio of net investment income to average net assets would have been 0.98%.
dNet investment income per share includes approximately $0.06 per share related to income received in the form of special dividends in connection with certain Fund holdings. Excluding this amount, the ratio of net investment income to average net assets would have been 0.50%.
eTotal return does not include fees, charges or expenses imposed by the variable annuity and life insurance contracts for which Franklin Templeton Variable Insurance Products Trust serves as an underlying investment vehicle. Total return is not annualized for periods less than one year.
fRatios are annualized for periods less than one year.
gBenefit of expense reduction rounds to less than 0.01%.
hBenefit of waiver and payments by affiliates rounds to less than 0.01%.
| | | | | | |
| | | |
| | The accompanying notes are an integral part of these financial statements. | Semiannual Report | | | FSV-7 | |
FRANKLIN TEMPLETON VARIABLE INSURANCE PRODUCTS TRUST
FINANCIAL HIGHLIGHTS
Franklin Small Cap Value VIP Fund (continued)
| | | | | | | | | | | | | | | | | | | | | | | | |
| | |
| | | Six Months Ended
June 30, 2020 (unaudited) | | | Year Ended December 31, | |
| | | 2019 | | | 2018 | | | 2017 | | | 2016 | | | 2015 | |
| | | | | | |
Class 4 | | | | | | | | | | | | | | | | | | | | | | | | |
Per share operating performance (for a share outstanding throughout the period) | | | | | | | | | | | | | | | | | | | | | | | | |
| | | | | | |
Net asset value, beginning of period | | | $15.51 | | | | $14.96 | | | | $20.22 | | | | $19.74 | | | | $17.96 | | | | $22.63 | |
| | | | |
| | | | | | |
| Income from investment operationsa: | | | | | | | | | | | | | | | | | | | | | | | | |
| | | | | | |
Net investment incomeb | | | 0.07 | | | | 0.19 | c | | | 0.15 | | | | 0.14 | d | | | 0.09 | | | | 0.14 | |
| | | | | | |
Net realized and unrealized gains (losses) | | | (2.96 | ) | | | 3.30 | | | | (2.28 | ) | | | 1.81 | | | | 4.75 | | | | (1.52 | ) |
| | | | |
| | | | | | |
Total from investment operations | | | (2.89 | ) | | | 3.49 | | | | (2.13 | ) | | | 1.95 | | | | 4.84 | | | | (1.38 | ) |
| | | | |
| | | | | | |
| Less distributions from: | | | | | | | | | | | | | | | | | | | | | | | | |
| | | | | | |
Net investment income | | | (0.18 | ) | | | (0.16 | ) | | | (0.15 | ) | | | (0.09 | ) | | | (0.14 | ) | | | (0.12 | ) |
| | | | | | |
Net realized gains | | | (0.81 | ) | | | (2.78 | ) | | | (2.98 | ) | | | (1.38 | ) | | | (2.92 | ) | | | (3.17 | ) |
| | | | |
| | | | | | |
Total distributions | | | (0.99 | ) | | | (2.94 | ) | | | (3.13 | ) | | | (1.47 | ) | | | (3.06 | ) | | | (3.29 | ) |
| | | | |
| | | | | | |
Net asset value, end of period | | | $11.63 | | | | $15.51 | | | | $14.96 | | | | $20.22 | | | | $19.74 | | | | $17.96 | |
| | | | |
| | | | | | |
Total returne | | | (18.43)% | | | | 26.23% | | | | (13.01)% | | | | 10.56% | | | | 30.12% | | | | (7.52)% | |
| | | | | | |
| Ratios to average net assetsf | | | | | | | | | | | | | | | | | | | | | | | | |
| | | | | | |
Expenses before waiver and payments by affiliates and expense reduction | | | 1.03% | | | | 1.02% | | | | 1.01% | | | | 1.01% | | | | 1.01% | | | | 1.00% | |
| | | | | | |
Expenses net of waiver and payments by affiliates and expense reductiong | | | 1.03% | h | | | 1.02% | h | | | 1.00% | | | | 1.00% | | | | 0.99% | | | | 0.99% | |
| | | | | | |
Net investment income | | | 1.15% | | | | 1.23% | c | | | 0.78% | | | | 0.71% | d | | | 0.49% | | | | 0.69% | |
| | | | | | |
| Supplemental data | | | | | | | | | | | | | | | | | | | | | | | | |
| | | | | | |
Net assets, end of period (000’s) | | | $24,866 | | | | $29,238 | | | | $24,592 | | | | $32,053 | | | | $32,751 | | | | $26,128 | |
| | | | | | |
Portfolio turnover rate | | | 33.77% | | | | 54.36% | | | | 47.82% | | | | 33.36% | | | | 34.60% | | | | 27.05% | |
aThe amount shown for a share outstanding throughout the period may not correlate with the Statement of Operations for the period due to the timing of sales and repurchases of the Fund’s shares in relation to income earned and/or fluctuating fair value of the investments of the Fund.
bBased on average daily shares outstanding.
cNet investment income per share includes approximately $0.05 per share related to income received in the form of special dividends in connection with certain Fund holdings. Excluding this amount, the ratio of net investment income to average net assets would have been 0.88%.
dNet investment income per share includes approximately $0.06 per share related to income received in the form of special dividends in connection with certain Fund holdings. Excluding this amount, the ratio of net investment income to average net assets would have been 0.40%.
eTotal return does not include fees, charges or expenses imposed by the variable annuity and life insurance contracts for which Franklin Templeton Variable Insurance Products Trust serves as an underlying investment vehicle. Total return is not annualized for periods less than one year.
fRatios are annualized for periods less than one year.
gBenefit of expense reduction rounds to less than 0.01%.
hBenefit of waiver and payments by affiliates rounds to less than 0.01%.
| | | | |
| | | |
| FSV-8 | | Semiannual Report | The accompanying notes are an integral part of these financial statements. | | |
FRANKLIN TEMPLETON VARIABLE INSURANCE PRODUCTS TRUST
Statement of Investments, June 30, 2020 (unaudited)
Franklin Small Cap Value VIP Fund
| | | | | | | | | | |
| | | |
| | | | | Shares | | | Value | |
| | Common Stocks 98.9% | | | | | | | | |
| | Automobiles & Components 2.6% | | | | | | | | |
| | Gentex Corp. | | | 36,000 | | | $ | 927,720 | |
| | LCI Industries | | | 17,908 | | | | 2,059,062 | |
| | Thor Industries Inc. | | | 205,121 | | | | 21,851,540 | |
| | | | | | | | | | |
| | | |
| | | | | | | | | 24,838,322 | |
| | | | | | | | | | |
| | Banks 15.3% | | | | | | | | |
| | Atlantic Union Bankshares Corp. | | | 309,748 | | | | 7,173,764 | |
| | Bryn Mawr Bank Corp. | | | 484,783 | | | | 13,409,098 | |
| | Columbia Banking System Inc. | | | 858,758 | | | | 24,341,496 | |
| | First Horizon National Corp. | | | 2,777,349 | | | | 27,662,396 | |
| | First of Long Island Corp. | | | 614,355 | | | | 10,038,561 | |
| | German American Bancorp Inc. | | | 196,123 | | | | 6,099,425 | |
| | Glacier Bancorp Inc. | | | 162,950 | | | | 5,750,506 | |
| | Lakeland Financial Corp. | | | 438,031 | | | | 20,407,864 | |
| | Peoples Bancorp Inc. | | | 289,712 | | | | 6,165,071 | |
| | South State Corp. | | | 254,073 | | | | 12,109,119 | |
| | TCF Financial Corp. | | | 29,642 | | | | 872,068 | |
| | TriCo. Bancshares | | | 53,403 | | | | 1,626,121 | |
| | TrustCo. Bank Corp. NY | | | 782,700 | | | | 4,954,491 | |
| | Washington Trust Bancorp Inc. | | | 221,091 | | | | 7,240,730 | |
| | | | | | | | | | |
| | | |
| | | | | | | | | 147,850,710 | |
| | | | | | | | | | |
| | Building Products 5.3% | | | | | | | | |
| | Fortune Brands Home & Security Inc. | | | 63,010 | | | | 4,028,229 | |
| a | | Gibraltar Industries Inc. | | | 277,522 | | | | 13,323,831 | |
| | Insteel Industries Inc. | | | 390,746 | | | | 7,451,526 | |
| a | | Masonite International Corp. | | | 100,048 | | | | 7,781,734 | |
| | UFP Industries Inc. | | | 389,687 | | | | 19,293,403 | |
| | | | | | | | | | |
| | | |
| | | | | | | | | 51,878,723 | |
| | | | | | | | | | |
| | Commercial & Professional Services 1.7% | | | | | | | | |
| a | | Huron Consulting Group Inc. | | | 34,036 | | | | 1,506,093 | |
| | McGrath RentCorp. | | | 277,667 | | | | 14,996,795 | |
| | | | | | | | | | |
| | | |
| | | | | | | | | 16,502,888 | |
| | | | | | | | | | |
| | Consumer Durables & Apparel 6.4% | | | | | | | | |
| | BRP Inc. | | | 87,879 | | | | 3,748,071 | |
| | Brunswick Corp. | | | 327,234 | | | | 20,946,248 | |
| | Callaway Golf Co. | | | 358,465 | | | | 6,276,722 | |
| | Carter’s Inc. | | | 287,654 | | | | 23,213,678 | |
| a | | M/I Homes Inc. | | | 173,900 | | | | 5,989,116 | |
| a | | Unifi Inc. | | | 171,800 | | | | 2,212,784 | |
| | | | | | | | | | |
| | | |
| | | | | | | | | 62,386,619 | |
| | | | | | | | | | |
| | Consumer Services 4.9% | | | | | | | | |
| | Jack in the Box Inc. | | | 337,791 | | | | 25,026,935 | |
| | Wyndham Hotels and Resorts Inc. | | | 518,769 | | | | 22,109,935 | |
| | | | | | | | | | |
| | | |
| | | | | | | | | 47,136,870 | |
| | | | | | | | | | |
FRANKLIN TEMPLETON VARIABLE INSURANCE PRODUCTS TRUST
STATEMENT OF INVESTMENTS (UNAUDITED)
Franklin Small Cap Value VIP Fund (continued)
| | | | | | | | | | |
| | | |
| | | | | Shares | | | Value | |
| | Common Stocks (continued) | | | | | | | | |
| | Diversified Financials 1.6% | | | | | | | | |
| | Houlihan Lokey Inc. | | | 276,700 | | | $ | 15,395,588 | |
| | | | | | | | | | |
| | Electrical Equipment 3.5% | | | | | | | | |
| | Encore Wire Corp. | | | 75,262 | | | | 3,674,291 | |
| | Regal Beloit Corp. | | | 350,500 | | | | 30,605,660 | |
| | | | | | | | | | |
| | | |
| | | | | | | | | 34,279,951 | |
| | | | | | | | | | |
| | Energy 1.3% | | | | | | | | |
| | Crescent Point Energy Corp. (Canada) | | | 5,117,200 | | | | 8,292,763 | |
| | Hunting PLC (United Kingdom) | | | 1,227,096 | | | | 3,210,134 | |
| a | | Natural Gas Services Group Inc. | | | 173,987 | | | | 1,090,898 | |
| | | | | | | | | | |
| | | |
| | | | | | | | | 12,593,795 | |
| | | | | | | | | | |
| | Food & Staples Retailing 1.9% | | | | | | | | |
| a | | BJ’s Wholesale Club Holdings Inc. | | | 487,266 | | | | 18,160,404 | |
| | | | | | | | | | |
| | Food, Beverage & Tobacco 2.2% | | | | | | | | |
| | Glanbia PLC (Ireland) | | | 1,420,461 | | | | 16,140,483 | |
| | Maple Leaf Foods Inc. (Canada) | | | 237,357 | | | | 4,984,751 | |
| | | | | | | | | | |
| | | |
| | | | | | | | | 21,125,234 | |
| | | | | | | | | | |
| | Health Care Equipment & Services 2.6% | | | | | | | | |
| | Envista Holdings Corp. | | | 684,217 | | | | 14,430,137 | |
| a | | Integer Holdings Corp. | | | 148,924 | | | | 10,878,898 | |
| | | | | | | | | | |
| | | |
| | | | | | | | | 25,309,035 | |
| | | | | | | | | | |
| | Insurance 13.1% | | | | | | | | |
| | CNO Financial Group Inc. | | | 1,471,114 | | | | 22,905,245 | |
| | The Hanover Insurance Group Inc. | | | 306,850 | | | | 31,093,111 | |
| | Horace Mann Educators Corp. | | | 786,717 | | | | 28,896,115 | |
| | Old Republic International Corp. | | | 1,964,216 | | | | 32,036,363 | |
| | Selective Insurance Group Inc. | | | 235,011 | | | | 12,394,480 | |
| | | | | | | | | | |
| | | |
| | | | | | | | | 127,325,314 | |
| | | | | | | | | | |
| | Machinery 14.2% | | | | | | | | |
| | Astec Industries Inc. | | | 235,808 | | | | 10,920,269 | |
| | Columbus McKinnon Corp. | | | 211,441 | | | | 7,072,701 | |
| | Federal Signal Corp. | | | 55,397 | | | | 1,646,953 | |
| | The Greenbrier Cos. Inc. | | | 396,647 | | | | 9,023,719 | |
| | Hillenbrand Inc. | | | 250,434 | | | | 6,779,248 | |
| | John Bean Technologies Corp. | | | 52,500 | | | | 4,516,050 | |
| | Mueller Industries Inc. | | | 266,662 | | | | 7,087,876 | |
| | Mueller Water Products Inc., A | | | 2,103,549 | | | | 19,836,467 | |
| | Oshkosh Corp. | | | 326,000 | | | | 23,348,120 | |
| | Rexnord Corp. | | | 914,800 | | | | 26,666,420 | |
| a | | SPX Flow Inc. | | | 367,522 | | | | 13,760,024 | |
| | Wabash National Corp. | | | 617,341 | | | | 6,556,161 | |
| | | | | | | | | | |
| | | |
| | | | | | | | | 137,214,008 | |
| | | | | | | | | | |
FRANKLIN TEMPLETON VARIABLE INSURANCE PRODUCTS TRUST
STATEMENT OF INVESTMENTS (UNAUDITED)
Franklin Small Cap Value VIP Fund (continued)
| | | | | | | | | | |
| | | |
| | | | | Shares | | | Value | |
| | Common Stocks (continued) | | | | | | | | |
| | Materials 11.5% | | | | | | | | |
| | Cabot Corp. | | | 311,530 | | | $ | 11,542,186 | |
| | Carpenter Technology Corp. | | | 57,324 | | | | 1,391,827 | |
| | Eagle Materials Inc. | | | 144,100 | | | | 10,118,702 | |
| a | | Livent Corp. (Argentina) | | | 139,604 | | | | 859,961 | |
| | Louisiana-Pacific Corp. | | | 320,477 | | | | 8,220,235 | |
| | Minerals Technologies Inc. | | | 370,641 | | | | 17,394,182 | |
| a | | OceanaGold Corp. (Australia) | | | 5,901,906 | | | | 13,738,001 | |
| | P H Glatfelter Co. | | | 943,594 | | | | 15,144,684 | |
| | PolyOne Corp. | | | 706,207 | | | | 18,523,809 | |
| | Reliance Steel & Aluminum Co. | | | 151,900 | | | | 14,419,867 | |
| | | | | | | | | | |
| | | |
| | | | | | | | | 111,353,454 | |
| | | | | | | | | | |
| | Real Estate 2.5% | | | | | | | | |
| | Healthcare Realty Trust Inc. | | | 284,773 | | | | 8,341,001 | |
| | Highwoods Properties Inc. | | | 307,215 | | | | 11,468,336 | |
| | Sunstone Hotel Investors Inc. | | | 532,949 | | | | 4,343,534 | |
| | | | | | | | | | |
| | | |
| | | | | | | | | 24,152,871 | |
| | | | | | | | | | |
| | Retailing 1.3% | | | | | | | | |
| a | | Boot Barn Holdings Inc. | | | 293,875 | | | | 6,335,945 | |
| | Group 1 Automotive Inc. | | | 97,679 | | | | 6,443,884 | |
| | | | | | | | | | |
| | | |
| | | | | | | | | 12,779,829 | |
| | | | | | | | | | |
| | Semiconductors & Semiconductor Equipment 1.3% | | | | | | | | |
| a | | Advanced Energy Industries Inc. | | | 111,064 | | | | 7,529,029 | |
| | MKS Instruments Inc. | | | 22,414 | | | | 2,538,161 | |
| a | | Synaptics Inc. | | | 42,067 | | | | 2,529,068 | |
| | | | | | | | | | |
| | | |
| | | | | | | | | 12,596,258 | |
| | | | | | | | | | |
| | Technology Hardware & Equipment 3.3% | | | | | | | | |
| a | | Coherent Inc. | | | 5,067 | | | | 663,676 | |
| a | | FARO Technologies Inc. | | | 3,667 | | | | 196,551 | |
| a | | II-VI Inc. | | | 72,442 | | | | 3,420,711 | |
| a | | NetScout Systems Inc. | | | 565,600 | | | | 14,456,736 | |
| a | | Plexus Corp. | | | 186,573 | | | | 13,164,591 | |
| | | | | | | | | | |
| | | |
| | | | | | | | | 31,902,265 | |
| | | | | | | | | | |
| | Transportation 0.1% | | | | | | | | |
| | Heartland Express Inc. | | | 30,600 | | | | 637,092 | |
| | | | | | | | | | |
| | Utilities 2.3% | | | | | | | | |
| | Black Hills Corp. | | | 152,161 | | | | 8,621,442 | |
| | IDACORP Inc. | | | 130,145 | | | | 11,370,769 | |
| | Spire Inc. | | | 39,355 | | | | 2,586,017 | |
| | | | | | | | | | |
| | | |
| | | | | | | | | 22,578,228 | |
| | | | | | | | | | |
| | | |
| | Total Common Stocks (Cost $941,805,010) | | | | | | | 957,997,458 | |
| | | | | | | | | | |
FRANKLIN TEMPLETON VARIABLE INSURANCE PRODUCTS TRUST
STATEMENT OF INVESTMENTS (UNAUDITED)
Franklin Small Cap Value VIP Fund (continued)
| | | | | | | | | | |
| | | |
| | | | | Principal
Amount | | | Value | |
| | Corporate Bonds (Cost $2,378,000) 0.2% | | | | | | | | |
| | Machinery 0.2% | | | | | | | | |
| | Mueller Industries Inc., sub. bond, 6.00%, 3/01/27 | | $ | 2,378,000 | | | $ | 2,332,961 | |
| | | | | | | | | | |
| | | |
| | Total Investments before Short Term Investments (Cost $944,183,010) | | | | | | | 960,330,419 | |
| | | | | | | | | | |
| | | |
| | | | | Shares | | | | |
| | | |
| | Short Term Investments (Cost $10,387,607) 1.1% | | | | | | | | |
| | | |
| | Money Market Funds 1.1% | | | | | | | | |
| b,c | | Institutional Fiduciary Trust Money Market Portfolio, 0.00% | | | 10,387,607 | | | | 10,387,607 | |
| | | | | | | | | | |
| | | |
| | Total Investments (Cost $954,570,617) 100.2% | | | | | | | 970,718,026 | |
| | | |
| | Other Assets, less Liabilities (0.2)% | | | | | | | (2,030,223 | ) |
| | | | | | | | | | |
| | | |
| | Net Assets 100.0% | | | | | | $ | 968,687,803 | |
| | | | | | | | | | |
aNon-income producing.
bSee Note 3(e) regarding investments in affiliated management investment companies.
cThe rate shown is the annualized seven-day effective yield at period end.
| | | | |
| | | |
| FSV-12 | | Semiannual Report | The accompanying notes are an integral part of these financial statements. | | |
FRANKLIN TEMPLETON VARIABLE INSURANCE PRODUCTS TRUST
FINANCIAL STATEMENTS
Statement of Assets and Liabilities
June 30, 2020 (unaudited)
| | | | |
| |
| | | Franklin Small Cap Value VIP Fund | |
Assets: | | | | |
Investments in securities: | | | | |
Cost - Unaffiliated issuers | | $ | 944,183,010 | |
Cost - Non-controlled affiliates (Note 3e) | | | 10,387,607 | |
| | | | |
| |
Value - Unaffiliated issuers | | $ | 960,330,419 | |
Value - Non-controlled affiliates (Note 3e) | | | 10,387,607 | |
Receivables: | | | | |
Capital shares sold | | | 27,255 | |
Dividends and interest | | | 1,037,160 | |
Other assets | | | 906 | |
| | | | |
| |
Total assets | | | 971,783,347 | |
| | | | |
Liabilities: | | | | |
Payables: | | | | |
Investment securities purchased | | | 1,674,124 | |
Capital shares redeemed | | | 494,359 | |
Management fees | | | 512,287 | |
Distribution fees | | | 193,714 | |
Trustees’ fees and expenses | | | 148 | |
Reports to shareholders | | | 168,665 | |
Accrued expenses and other liabilities | | | 52,247 | |
| | | | |
Total liabilities | | | 3,095,544 | |
| | | | |
| |
Net assets, at value | | $ | 968,687,803 | |
| | | | |
Net assets consist of: | | | | |
Paid-in capital | | $ | 981,796,626 | |
Total distributable earnings (losses) | | | (13,108,823 | ) |
| | | | |
| |
Net assets, at value | | $ | 968,687,803 | |
| | | | |
| |
| Class 1: | | | | |
Net assets, at value | | $ | 38,886,656 | |
| | | | |
Shares outstanding | | | 3,300,848 | |
| | | | |
Net asset value and maximum offering price per share | | | $11.78 | |
| | | | |
| Class 2: | | | | |
Net assets, at value | | $ | 904,935,168 | |
Shares outstanding | | | 80,432,315 | |
| | | | |
Net asset value and maximum offering price per share | | | $11.25 | |
| | | | |
| Class 4: | | | | |
Net assets, at value | | $ | 24,865,979 | |
| | | | |
Shares outstanding | | | 2,137,335 | |
| | | | |
Net asset value and maximum offering price per share | | | $11.63 | |
| | | | |
| | | | | | |
| | | |
| | The accompanying notes are an integral part of these financial statements. | Semiannual Report | | | FSV-13 | |
FRANKLIN TEMPLETON VARIABLE INSURANCE PRODUCTS TRUST
FINANCIAL STATEMENTS
Statement of Operations
for the six months ended June 30, 2020 (unaudited)
| | | | |
| |
| | | Franklin Small
Cap Value VIP Fund | |
Investment income: | | | | |
Dividends: (net of foreign taxes)* | | | | |
Unaffiliated issuers | | $ | 10,379,635 | |
Non-controlled affiliates (Note 3e) | | | 53,323 | |
Interest: | | | | |
Unaffiliated issuers | | | 71,340 | |
| | | | |
Total investment income | | | 10,504,298 | |
| | | | |
Expenses: | | | | |
Management fees (Note 3a) | | | 3,131,539 | |
Distribution fees: (Note 3c) | | | | |
Class 2 | | | 1,130,350 | |
Class 4 | | | 42,561 | |
Custodian fees (Note 4) | | | 6,533 | |
Reports to shareholders | | | 120,955 | |
Professional fees | | | 31,308 | |
Trustees’ fees and expenses | | | 3,081 | |
Other | | | 12,150 | |
| | | | |
Total expenses | | | 4,478,477 | |
Expense reductions (Note 4) | | | (879 | ) |
Expenses waived/paid by affiliates (Note 3e) | | | (29,040 | ) |
| | | | |
Net expenses | | | 4,448,558 | |
| | | | |
Net investment income | | | 6,055,740 | |
| | | | |
Realized and unrealized gains (losses): | | | | |
Net realized gain (loss) from: | | | | |
Investments: | | | | |
Unaffiliated issuers | | | (31,006,545 | ) |
Realized gain distributions from REITs | | | 237,639 | |
Foreign currency transactions | | | (14,667 | ) |
| | | | |
Net realized gain (loss) | | | (30,783,573 | ) |
| | | | |
Net change in unrealized appreciation (depreciation) on: | | | | |
Investments: | | | | |
Unaffiliated issuers | | | (187,775,796 | ) |
Translation of other assets and liabilities denominated in foreign currencies | | | (192 | ) |
| | | | |
| |
Net change in unrealized appreciation (depreciation) | | | (187,775,988 | ) |
| | | | |
| |
Net realized and unrealized gain (loss) | | | (218,559,561 | ) |
| | | | |
| |
Net increase (decrease) in net assets resulting from operations | | $ | (212,503,821 | ) |
| | | | |
| |
| | | | |
*Foreign taxes withheld on dividends | | $ | 15,244 | |
| | | | |
| | | |
| FSV-14 | | Semiannual Report | The accompanying notes are an integral part of these financial statements. | | |
FRANKLIN TEMPLETON VARIABLE INSURANCE PRODUCTS TRUST
FINANCIAL STATEMENTS
Statements of Changes in Net Assets
| | | | | | | | |
| |
| | | Franklin Small Cap Value VIP Fund | |
| | |
| | | Six Months Ended
June 30, 2020
(unaudited) | | | Year Ended
December 31, 2019 | |
Increase (decrease) in net assets: | | | | | | | | |
Operations: | | | | | | | | |
Net investment income | | $ | 6,055,740 | | | | $ 15,229,928 | |
Net realized gain (loss) | | | (30,783,573 | ) | | | 61,068,326 | |
Net change in unrealized appreciation (depreciation) | | | (187,775,988 | ) | | | 187,554,772 | |
| | | | |
| | |
Net increase (decrease) in net assets resulting from operations | | | (212,503,821 | ) | | | 263,853,026 | |
| | | | |
Distributions to shareholders: | | | | | | | | |
Class 1 | | | (3,163,057 | ) | | | (7,896,338 | ) |
Class 2 | | | (74,826,607 | ) | | | (189,976,242 | ) |
Class 4 | | | (1,993,247 | ) | | | (4,683,798 | ) |
| | | | |
| | |
Total distributions to shareholders | | | (79,982,911 | ) | | | (202,556,378 | ) |
| | | | |
Capital share transactions: (Note 2) | | | | | | | | |
Class 1 | | | 3,506,280 | | | | 3,898,876 | |
Class 2 | | | 55,901,879 | | | | 87,139,038 | |
Class 4 | | | 2,454,945 | | | | 3,066,346 | |
| | | | |
| | |
Total capital share transactions | | | 61,863,104 | | | | 94,104,260 | |
| | | | |
Net increase (decrease) in net assets | | | (230,623,628 | ) | | | 155,400,908 | |
Net assets: | | | | | | | | |
Beginning of period | | | 1,199,311,431 | | | | 1,043,910,523 | |
| | | | |
| | |
End of period | | $ | 968,687,803 | | | | $1,199,311,431 | |
| | | | |
| | | | | | |
| | | |
| | The accompanying notes are an integral part of these financial statements. | Semiannual Report | | | FSV-15 | |
FRANKLIN TEMPLETON VARIABLE INSURANCE PRODUCTS TRUST
Notes to Financial Statements (unaudited)
Franklin Small Cap Value VIP Fund
1. Organization and Significant Accounting Policies
Franklin Templeton Variable Insurance Products Trust (Trust) is registered under the Investment Company Act of 1940 (1940 Act) as an open-end management investment company, consisting of eighteen separate funds and applies the specialized accounting and reporting guidance in U.S. Generally Accepted Accounting Principles (U.S. GAAP). Franklin Small Cap Value VIP Fund (Fund) is included in this report. Shares of the Fund are generally sold only to insurance company separate accounts to fund the benefits of variable life insurance policies or variable annuity contracts. The Fund offers three classes of shares: Class 1, Class 2 and Class 4. Each class of shares may differ by its distribution fees, voting rights on matters affecting a single class and its exchange privilege.
The following summarizes the Fund’s significant accounting policies.
a. Financial Instrument Valuation
The Fund’s investments in financial instruments are carried at fair value daily. Fair value is the price that would be received to sell an asset or paid to transfer a liability in an orderly transaction between market participants on the measurement date. The Fund calculates the net asset value (NAV) per share each business day as of 4 p.m. Eastern time or the regularly scheduled close of the New York Stock Exchange (NYSE), whichever is earlier. Under compliance policies and procedures approved by the Trust’s Board of Trustees (the Board), the Fund’s administrator has responsibility for oversight of valuation, including leading the cross-functional Valuation Committee (VC). The Fund may utilize independent pricing services, quotations from securities and financial instrument dealers, and other market sources to determine fair value.
Equity securities listed on an exchange or on the NASDAQ National Market System are valued at the last quoted sale price or the official closing price of the day, respectively. Foreign equity securities are valued as of the close of trading on the foreign stock exchange on which the security is primarily traded, or as of 4 p.m. Eastern time. The value is then converted into its U.S. dollar equivalent at the foreign exchange rate in effect at 4 p.m. Eastern time on the day that the value of the security is determined. Over-the-counter (OTC) securities are valued within the range of the most recent quoted bid and ask prices. Securities that trade in multiple markets or on multiple exchanges are valued
according to the broadest and most representative market. Certain equity securities are valued based upon fundamental characteristics or relationships to similar securities.
Debt securities generally trade in the OTC market rather than on a securities exchange. The Fund’s pricing services use multiple valuation techniques to determine fair value. In instances where sufficient market activity exists, the pricing services may utilize a market-based approach through which quotes from market makers are used to determine fair value. In instances where sufficient market activity may not exist or is limited, the pricing services also utilize proprietary valuation models which may consider market characteristics such as benchmark yield curves, credit spreads, estimated default rates, anticipated market interest rate volatility, coupon rates, anticipated timing of principal repayments, underlying collateral, and other unique security features in order to estimate the relevant cash flows, which are then discounted to calculate the fair value.
Investments in open-end mutual funds are valued at the closing NAV.
The Fund has procedures to determine the fair value of financial instruments for which market prices are not reliable or readily available. Under these procedures, the Fund primarily employs a market-based approach which may use related or comparable assets or liabilities, recent transactions, market multiples, book values, and other relevant information for the investment to determine the fair value of the investment. An income-based valuation approach may also be used in which the anticipated future cash flows of the investment are discounted to calculate fair value. Discounts may also be applied due to the nature or duration of any restrictions on the disposition of the investments. Due to the inherent uncertainty of valuations of such investments, the fair values may differ significantly from the values that would have been used had an active market existed.
Trading in securities on foreign securities stock exchanges and OTC markets may be completed before 4 p.m. Eastern time. In addition, trading in certain foreign markets may not take place on every Fund’s business day. Events can occur between the time at which trading in a foreign security is completed and 4 p.m. Eastern time that might call into question the reliability of the value of a portfolio security held by the Fund. As a result, differences may arise between the value of the Fund’s portfolio securities as determined at the foreign market close and the latest indications of value at
FRANKLIN TEMPLETON VARIABLE INSURANCE PRODUCTS TRUST
NOTES TO FINANCIAL STATEMENTS (UNAUDITED)
Franklin Small Cap Value VIP Fund (continued)
4 p.m. Eastern time. In order to minimize the potential for these differences, an independent pricing service may be used to adjust the value of the Fund’s portfolio securities to the latest indications of fair value at 4 p.m. Eastern time. At June 30, 2020, certain securities may have been fair valued using these procedures, in which case the securities were categorized as Level 2 inputs within the fair value hierarchy. See the Fair Value Measurements note for more information.
When the last day of the reporting period is a non-business day, certain foreign markets may be open on those days that the Fund’s NAV is not calculated, which could result in differences between the value of the Fund’s portfolio securities on the last business day and the last calendar day of the reporting period. Any significant security valuation changes due to an open foreign market are adjusted and reflected by the Fund for financial reporting purposes.
b. Foreign Currency Translation
Portfolio securities and other assets and liabilities denominated in foreign currencies are translated into U.S. dollars based on the exchange rate of such currencies against U.S. dollars on the date of valuation. The Fund may enter into foreign currency exchange contracts to facilitate transactions denominated in a foreign currency. Purchases and sales of securities, income and expense items denominated in foreign currencies are translated into U.S. dollars at the exchange rate in effect on the transaction date. Portfolio securities and assets and liabilities denominated in foreign currencies contain risks that those currencies will decline in value relative to the U.S. dollar. Occasionally, events may impact the availability or reliability of foreign exchange rates used to convert the U.S. dollar equivalent value. If such an event occurs, the foreign exchange rate will be valued at fair value using procedures established and approved by the Board.
The Fund does not separately report the effect of changes in foreign exchange rates from changes in market prices on securities held. Such changes are included in net realized and unrealized gain or loss from investments in the Statement of Operations.
Realized foreign exchange gains or losses arise from sales of foreign currencies, currency gains or losses realized between the trade and settlement dates on securities transactions and the difference between the recorded amounts of dividends, interest, and foreign withholding taxes and the U.S. dollar equivalent of the amounts actually received or paid. Net
unrealized foreign exchange gains and losses arise from changes in foreign exchange rates on foreign denominated assets and liabilities other than investments in securities held at the end of the reporting period.
c. Income and Deferred Taxes
It is the Fund’s policy to qualify as a regulated investment company under the Internal Revenue Code. The Fund intends to distribute to shareholders substantially all of its taxable income and net realized gains to relieve it from federal income and if applicable, excise taxes. As a result, no provision for U.S. federal income taxes is required.
The Fund may be subject to foreign taxation related to income received, capital gains on the sale of securities and certain foreign currency transactions in the foreign jurisdictions in which it invests. Foreign taxes, if any, are recorded based on the tax regulations and rates that exist in the foreign markets in which the Fund invests. When a capital gain tax is determined to apply, the Fund records an estimated deferred tax liability in an amount that would be payable if the securities were disposed of on the valuation date.
The Fund may recognize an income tax liability related to its uncertain tax positions under U.S. GAAP when the uncertain tax position has a less than 50% probability that it will be sustained upon examination by the tax authorities based on its technical merits. As of June 30, 2020, the Fund has determined that no tax liability is required in its financial statements related to uncertain tax positions for any open tax years (or expected to be taken in future tax years). Open tax years are those that remain subject to examination and are based on the statute of limitations in each jurisdiction in which the Fund invests.
d. Security Transactions, Investment Income, Expenses and Distributions
Security transactions are accounted for on trade date. Realized gains and losses on security transactions are determined on a specific identification basis. Interest income and estimated expenses are accrued daily. Amortization of premium and accretion of discount on debt securities are included in interest income. Dividend income and capital gain distributions are recorded on the ex-dividend date except for certain dividends from securities where the dividend rate is not available. In such cases, the dividend is recorded as soon as the information is received by the Fund. Distributions to
FRANKLIN TEMPLETON VARIABLE INSURANCE PRODUCTS TRUST
NOTES TO FINANCIAL STATEMENTS (UNAUDITED)
Franklin Small Cap Value VIP Fund (continued)
1. Organization and Significant Accounting Policies (continued)
d. Security Transactions, Investment Income, Expenses and Distributions (continued)
shareholders are recorded on the ex-dividend date. Distributable earnings are determined according to income tax regulations (tax basis) and may differ from earnings recorded in accordance with U.S. GAAP. These differences may be permanent or temporary. Permanent differences are reclassified among capital accounts to reflect their tax character. These reclassifications have no impact on net assets or the results of operations. Temporary differences are not reclassified, as they may reverse in subsequent periods.
Common expenses incurred by the Trust are allocated among the Funds based on the ratio of net assets of each Fund to the combined net assets of the Trust or based on the ratio of number of shareholders of each Fund to the combined number of shareholders of the Trust. Fund specific expenses are charged directly to the Fund that incurred the expense.
Realized and unrealized gains and losses and net investment income, excluding class specific expenses, are allocated daily to each class of shares based upon the relative proportion of
net assets of each class. Differences in per share distributions by class are generally due to differences in class specific expenses.
e. Accounting Estimates
The preparation of financial statements in accordance with U.S. GAAP requires management to make estimates and assumptions that affect the reported amounts of assets and liabilities at the date of the financial statements and the amounts of income and expenses during the reporting period. Actual results could differ from those estimates.
f. Guarantees and Indemnifications
Under the Trust’s organizational documents, its officers and trustees are indemnified by the Trust against certain liabilities arising out of the performance of their duties to the Trust. Additionally, in the normal course of business, the Trust, on behalf of the Fund, enters into contracts with service providers that contain general indemnification clauses. The Trust’s maximum exposure under these arrangements is unknown as this would involve future claims that may be made against the Trust that have not yet occurred. Currently, the Trust expects the risk of loss to be remote.
2. Shares of Beneficial Interest
At June 30, 2020, there were an unlimited number of shares authorized (without par value). Transactions in the Fund’s shares were as follows:
| | | | | | | | | | | | | | | | |
| | |
| | | Six Months Ended June 30, 2020 | | | Year Ended December 31, 2019 | |
| | | | |
| | | Shares | | | Amount | | | Shares | | | Amount | |
| | | | |
| Class 1 Shares: | | | | | | | | | | | | | | | | |
Shares sold | | | 232,220 | | | $ | 2,871,963 | | | | 262,210 | | | $ | 4,085,267 | |
Shares issued in reinvestment of distributions | | | 275,768 | | | | 3,163,057 | | | | 578,063 | | | | 7,896,338 | |
Shares redeemed | | | (194,542 | ) | | | (2,528,740 | ) | | | (537,480 | ) | | | (8,082,729) | |
| | | | |
| | | | |
Net increase (decrease) | | | 313,446 | | | $ | 3,506,280 | | | | 302,793 | | | $ | 3,898,876 | |
| | | | |
| Class 2 Shares: | | | | | | | | | | | | | | | | |
Shares sold | | | 6,101,838 | | | $ | 66,834,784 | | | | 5,696,678 | | | $ | 84,262,242 | |
Shares issued in reinvestment of distributions | | | 6,827,245 | | | | 74,826,607 | | | | 14,513,082 | | | | 189,976,242 | |
Shares redeemed | | | (7,116,902 | ) | | | (85,759,512 | ) | | | (12,637,486 | ) | | | (187,099,446) | |
| | | | |
| | | | |
Net increase (decrease) | | | 5,812,181 | | | $ | 55,901,879 | | | | 7,572,274 | | | $ | 87,139,038 | |
| | | | |
FRANKLIN TEMPLETON VARIABLE INSURANCE PRODUCTS TRUST
NOTES TO FINANCIAL STATEMENTS (UNAUDITED)
Franklin Small Cap Value VIP Fund (continued)
| | | | | | | | | | | | | | | | |
| | |
| | | Six Months Ended June 30, 2020 | | | Year Ended December 31, 2019 | |
| | | | |
| | | Shares | | | Amount | | | Shares | | | Amount | |
| | | | |
| Class 4 Shares: | | | | | | | | | | | | | | | | |
Shares sold | | | 324,826 | | | $ | 3,527,819 | | | | 279,692 | | | $ | 4,200,102 | |
Shares issued in reinvestment of distributions | | | 175,926 | | | | 1,993,247 | | | | 346,948 | | | | 4,683,798 | |
Shares redeemed | | | (248,204 | ) | | | (3,066,121 | ) | | | (385,667 | ) | | | (5,817,554) | |
| | | | |
| | | | |
Net increase (decrease) | | | 252,548 | | | $ | 2,454,945 | | | | 240,973 | | | $ | 3,066,346 | |
| | | | |
3. Transactions with Affiliates
Franklin Resources, Inc. is the holding company for various subsidiaries that together are referred to as Franklin Templeton. Certain officers and trustees of the Fund are also officers and/or directors of the following subsidiaries:
| | |
| |
| Subsidiary | | Affiliation |
Franklin Mutual Advisers, LLC (Franklin Mutual) | | Investment manager |
Franklin Templeton Services, LLC (FT Services) | | Administrative manager |
Franklin Templeton Distributors, Inc. (Distributors) | | Principal underwriter |
Franklin Templeton Investor Services, LLC (Investor Services) | | Transfer agent |
a. Management Fees
The Fund pays an investment management fee to Franklin Mutual based on the average daily net assets of the Fund as follows:
| | |
| |
| Annualized Fee Rate | | Net Assets |
0.750% | | Up to and including $200 million |
0.635% | | Over $200 million, up to and including $700 million |
0.600% | | Over $700 million, up to and including $1.2 billion |
0.575% | | Over $1.2 billion, up to and including $1.3 billion |
0.475% | | In excess of $1.3 billion |
For the period ended June 30, 2020, the annualized gross effective investment management fee rate was 0.650% of the Fund’s average daily net assets.
b. Administrative Fees
Under an agreement with Franklin Mutual, FT Services provides administrative services to the Fund. The fee is paid by Franklin Mutual based on the Fund’s average daily net assets, and is not an additional expense of the Fund.
c. Distribution Fees
The Board has adopted distribution plans for Class 2 and Class 4 shares pursuant to Rule 12b-1 under the 1940 Act. Under the Fund’s compensation distribution plans, the Fund pays Distributors for costs incurred in connection with the servicing, sale and distribution of the Fund’s shares up to 0.35% per year of its average daily net assets of each class. The Board has agreed to limit the current rate to 0.25% per year for Class 2. The plan year, for purposes of monitoring compliance with the maximum annual plan rates, is February 1 through January 31.
FRANKLIN TEMPLETON VARIABLE INSURANCE PRODUCTS TRUST
NOTES TO FINANCIAL STATEMENTS (UNAUDITED)
Franklin Small Cap Value VIP Fund (continued)
3. Transactions with Affiliates (continued)
d. Transfer Agent Fees
Investor Services, under terms of an agreement, performs shareholder servicing for the Fund and is not paid by the Fund for the services.
e. Investments in Affiliated Management Investment Companies
The Fund invests in one or more affiliated management investment companies for purposes other than exercising a controlling influence over the management or policies. Management fees paid by the Fund are waived on assets invested in the affiliated management investment companies, as noted in the Statement of Operations, in an amount not to exceed the management and administrative fees paid directly or indirectly by each affiliate. During the period ended June 30, 2020, the Fund held investments in affiliated management investment companies as follows:
| | | | | | | | | | | | | | | | | | | | | | | | | | | | | | | | |
| | | | | | | | |
| | | Value at
Beginning of Period | | | Purchases | | | Sales | | | Realized
Gain (Loss) | | | Net Change in
Unrealized
Appreciation
(Depreciation) | | | Value at
End of
Period | | | Number of
Shares
Held at End
of Period | | | Dividend
Income | |
| Non-Controlled Affiliates | | | | | | | | | | | | | | | | | | | | | | | | | |
Institutional Fiduciary Trust Money Market Portfolio, 0.00% | | | $24,977,897 | | | $ | 121,447,762 | | | $ | (136,038,052 | ) | | | $ — | | | | $ — | | | $ | 10,387,607 | | | | 10,387,607 | | | $ | 53,323 | |
| | | | | | | | | | | | |
4. Expense Offset Arrangement
The Fund has entered into an arrangement with its custodian whereby credits realized as a result of uninvested cash balances are used to reduce a portion of the Fund’s custodian expenses. During the period ended June 30, 2020, the custodian fees were reduced as noted in the Statement of Operations.
5. Income Taxes
At June 30, 2020, the cost of investments and net unrealized appreciation (depreciation) for income tax purposes were as follows:
| | | | |
Cost of investments | | $ | 958,675,749 | |
| | | | |
| |
Unrealized appreciation | | $ | 110,184,176 | |
Unrealized depreciation | | | (98,141,899) | |
| | | | |
| |
Net unrealized appreciation (depreciation) | | $ | 12,042,277 | |
| | | | |
Differences between income and/or capital gains as determined on a book basis and a tax basis are primarily due to differing treatment of wash sales.
6. Investment Transactions
Purchases and sales (excluding short term securities) for the period ended June 30, 2020, aggregated $333,217,768 and $327,659,566, respectively.
FRANKLIN TEMPLETON VARIABLE INSURANCE PRODUCTS TRUST
NOTES TO FINANCIAL STATEMENTS (UNAUDITED)
Franklin Small Cap Value VIP Fund (continued)
7. Novel Coronavirus Pandemic
The global outbreak of the novel coronavirus disease, known as COVID-19, has caused adverse effects on many companies, sectors, nations, regions and the markets in general, and may continue for an unpredictable duration. The effects of this pandemic may materially impact the value and performance of the Fund, its ability to buy and sell fund investments at appropriate valuations and its ability to achieve its investment objectives.
8. Credit Facility
The Fund, together with other U.S. registered and foreign investment funds (collectively, Borrowers), managed by Franklin Templeton, are borrowers in a joint syndicated senior unsecured credit facility totaling $2 billion (Global Credit Facility) which matures on February 5, 2021. This Global Credit Facility provides a source of funds to the Borrowers for temporary and emergency purposes, including the ability to meet future unanticipated or unusually large redemption requests.
Under the terms of the Global Credit Facility, the Fund shall, in addition to interest charged on any borrowings made by the Fund and other costs incurred by the Fund, pay its share of fees and expenses incurred in connection with the implementation and maintenance of the Global Credit Facility, based upon its relative share of the aggregate net assets of all of the Borrowers, including an annual commitment fee of 0.15% based upon the unused portion of the Global Credit Facility. These fees are reflected in other expenses in the Statement of Operations. During the period ended June 30, 2020, the Fund did not use the Global Credit Facility.
9. Fair Value Measurements
The Fund follows a fair value hierarchy that distinguishes between market data obtained from independent sources (observable inputs) and the Fund’s own market assumptions (unobservable inputs). These inputs are used in determining the value of the Fund’s financial instruments and are summarized in the following fair value hierarchy:
| | • | | Level 1 – quoted prices in active markets for identical financial instruments |
| | • | | Level 2 – other significant observable inputs (including quoted prices for similar financial instruments, interest rates, prepayment speed, credit risk, etc.) |
| | • | | Level 3 – significant unobservable inputs (including the Fund’s own assumptions in determining the fair value of financial instruments) |
The input levels are not necessarily an indication of the risk or liquidity associated with financial instruments at that level.
FRANKLIN TEMPLETON VARIABLE INSURANCE PRODUCTS TRUST
NOTES TO FINANCIAL STATEMENTS (UNAUDITED)
Franklin Small Cap Value VIP Fund (continued)
9. Fair Value Measurements (continued)
A summary of inputs used as of June 30, 2020, in valuing the Fund’s assets carried at fair value, is as follows:
| | | | | | | | | | | | | | | | |
| | | | |
| | | Level 1 | | | Level 2 | | | Level 3 | | | Total | |
| | | | |
| Assets: | | | | | | | | | | | | | | | | |
Investments in Securities:a | | | | | | | | | | | | | | | | |
Equity Investments: | | | | | | | | | | | | | | | | |
Energy | | $ | 9,383,661 | | | $ | 3,210,134 | | | $ | — | | | $ | 12,593,795 | |
Food, Beverage & Tobacco | | | 4,984,751 | | | | 16,140,483 | | | | — | | | | 21,125,234 | |
All Other Equity Investments | | | 924,278,429 | | | | — | | | | — | | | | 924,278,429 | |
Corporate Bonds | | | — | | | | 2,332,961 | | | | — | | | | 2,332,961 | |
Short Term Investments | | | 10,387,607 | | | | — | | | | — | | | | 10,387,607 | |
| | | | |
Total Investments in Securities | | $ | 949,034,448 | | | $ | 21,683,578 | | | $ | — | | | $ | 970,718,026 | |
| | | | |
aFor detailed categories, see the accompanying Statement of Investments.
10. New Accounting Pronouncements
In March 2020, the Financial Accounting Standards Board issued Accounting Standards Update (ASU) No. 2020-04, Reference Rate Reform (Topic 848) – Facilitation of the Effects of Reference Rate Reform on Financial Reporting. The amendments in the ASU provides optional temporary financial reporting relief from the effect of certain types of contract modifications due to the planned discontinuation of the London Interbank Offered Rate and other interbank-offered based reference rates as of the end of 2021. The ASU is effective for certain reference rate-related contract modifications that occur during the period March 12, 2020 through December 31, 2022. Management is currently evaluating the impact, if any, of applying this ASU.
11. Subsequent Events
The Fund has evaluated subsequent events through the issuance of the financial statements and determined that no events have occurred that require disclosure other than those already disclosed in the financial statements.
Franklin Small-Mid Cap Growth VIP Fund
This semiannual report for Franklin Small-Mid Cap Growth VIP Fund covers the period ended June 30, 2020.
Class 4 Performance Summary as of June 30, 2020
The Fund’s Class 4 Shares posted a +16.86% total return* for the six-month period ended June 30, 2020.
*The Fund has a fee waiver associated with any investment it makes in a Franklin Templeton money fund and/or other Franklin Templeton fund, contractually guaranteed through 4/30/21. Fund investment results reflect the fee waiver; without this waiver, the results would have been lower.
Performance reflects the Fund’s Class 4 operating expenses, but does not include any contract fees, expenses or sales charges. If they had been included, performance would be lower. These charges and deductions, particularly for variable life policies, can have a significant effect on contract values and insurance benefits. See the contract prospectus for a complete description of these expenses, including sales charges.
Performance data represent past performance, which does not guarantee future results. Investment return and principal value will fluctuate, and you may have a gain or loss when you sell your shares. Current performance may differ from figures shown.
FRANKLIN SMALL-MID CAP GROWTH VIP FUND
Fund Goal and Main Investments
The Fund seeks long-term capital growth. Under normal market conditions, the Fund invests at least 80% of its net assets in equity securities of small-capitalization and mid-capitalization companies. For this Fund, small-cap companies are those within the market capitalization range of companies in the Russell 2500TM Index at the time of purchase, and midcap companies are those within the market capitalization range of companies in the Russell Midcap® Index at the time of purchase.1
Fund Risks
All investments involve risks, including possible loss of principal. Unexpected events and their aftermaths, such as the spread of deadly diseases; natural, environmental or man-made disasters; financial, political or social disruptions; terrorism and war; and other tragedies or catastrophes, can cause investor fear and panic, which can adversely affect the economies of many companies, sectors, nations, regions and the market in general, in ways that cannot necessarily be foreseen. Growth stock prices reflect projections of future earnings or revenues, and can, therefore, fall dramatically if the company fails to meet those projections. Smaller, midsized and relatively new or unseasoned companies can be particularly sensitive to changing economic conditions, and their prospects for growth are less certain than those of larger, more established companies. Historically, these securities have experienced more price volatility than larger-company stocks, especially over the short term. To the extent the Fund focuses on particular countries, regions, industries, sectors or types of investment from time to time, it may be subject to greater risk of adverse developments in such areas of focus than a fund that invests in a wider variety of countries, regions, industries, sectors or investments. From time to time, the trading market for a particular security or type of security in which the Fund invests may become less liquid or even illiquid. The Fund is actively managed but there is no guarantee that the manager’s investment decisions will produce the desired results. The Fund’s prospectus also includes a description of the main investment risks.
Portfolio Composition
Based on Total Net Assets as of 6/30/20
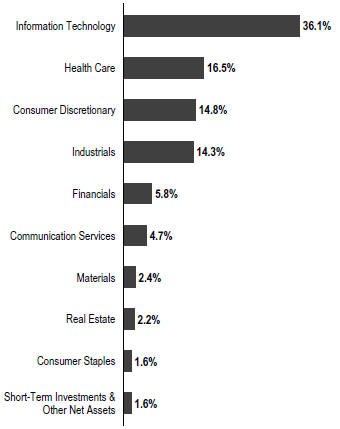
Performance Overview
You can find the Fund’s six-month total return in the Performance Summary. In comparison, the Fund’s narrow benchmark, the Russell Midcap Growth® Index, posted a +4.16% total return, and its broad benchmark, the Standard & Poor’s® 500 Index (S&P 500®) posted a -3.08% total return for the same period.2
Economic and Market Overview
U.S. equities, as measured by the S&P 500, nearly reversed earlier losses but declined modestly during the six-month period. A sharp selloff began in late February 2020 amid investor fears of a global economic slowdown due to the novel coronavirus (COVID-19) pandemic.
Government-issued restrictions to mitigate the pandemic severely curtailed U.S. economic activity beginning in March 2020. As a result, the unemployment rate surged to 14.7% in
1. Please see Index Descriptions following the Fund Summaries.
2. Source: Morningstar. One cannot invest directly in an index, and an index is not representative of the Fund’s portfolio. Please see Index Descriptions following the Fund Summaries.
The dollar value, number of shares or principal amount, and names of all portfolio holdings are listed in the Fund’s Statement of Investments (SOI).
FRANKLIN SMALL-MID CAP GROWTH VIP FUND
April as many businesses, particularly in hospitality, retail and travel, announced mass layoffs.3 Within just two months, the unemployment rate went from a 50-year low to an 80-year high.3 The longest U.S. economic expansion in history ended in February, according to the National Bureau of Economic Research, and the country slipped into a deep recession.
In an effort to buffer the sharp drop in economic activity, the Fed implemented two emergency rate cuts in March 2020, lowering the federal funds target rate to a range of 0.00%–0.25%. Additionally, the Fed announced broad quantitative easing measures aimed at ensuring the flow of credit to borrowers and supporting credit markets with unlimited amounts of bond purchasing. Meanwhile, Congress passed the Coronavirus Aid, Relief and Economic Security Act to provide economic relief for individuals and businesses and additional funding for small businesses.
Benefiting from these fiscal and monetary measures, equities began to advance at the end of March 2020. As states gradually reopened, economic activity resumed, leading to declining initial jobless claims and record-high increases in job additions and existing home sales. Optimism about potential COVID-19 vaccines and treatments and rising retail sales further supported equities, which rebounded from multi-year lows to post the strongest second-quarter returns in more than 20 years. Nevertheless, surging infection rates in several states near the end of June led to concerns that economic recovery could be hindered if reopening measures are paused or rolled back.
Investment Strategy
We use fundamental, bottom-up research to seek companies meeting our criteria of growth potential, quality and valuation. In seeking sustainable growth characteristics, we look for companies we believe can produce sustainable earnings and cash flow growth, evaluating the long-term market opportunity and competitive structure of an industry to target leaders and emerging leaders. We define quality companies as those with strong and improving competitive positions in attractive markets. We also believe important attributes of quality are experienced and talented management teams as well as financial strength reflected in the capital structure, gross and operating margins, free cash flow generation and returns on capital employed. In assessing value, we consider whether security prices fully reflect the balance of the sustainable growth opportunities relative to business and financial risks.
| | | | |
| Top 10 Holdings | | | |
| 6/30/20 | | | |
| |
Company Sector/Industry | | % of Total
Net Assets | |
DocuSign Inc.
Information Technology | | | 2.7% | |
Twilio Inc.
Information Technology | | | 2.5% | |
CoStar Group Inc.
Industrials | | | 2.3% | |
Synopsys Inc.
Information Technology | | | 2.1% | |
SBA Communications Corp.
Real Estate | | | 2.1% | |
Verisk Analytics Inc.
Industrials | | | 2.0% | |
DexCom Inc.
Health Care | | | 1.8% | |
MarketAxess Holdings Inc.
Financials | | | 1.7% | |
DraftKings Inc.
Consumer Discretionary | | | 1.8% | |
IDEXX Laboratories Inc.
Health Care | | | 1.7% | |
Manager’s Discussion
During the period under review, nearly all sectors represented in the portfolio contributed to the Fund’s absolute returns. Relative to the Russell Midcap® Growth Index, the Fund outperformed. Contributors included stock selection in the information technology (IT), consumer discretionary and industrials sectors. In contrast, relative detractors included materials, the only sector to significantly hurt Fund performance.
In IT, cloud-based electronic signature solutions provider DocuSign contributed to relative results. The company’s revenue and earnings were boosted by broadened product offerings after introducing the DocuSign Agreement Cloud last year and maintaining strong growth from its eSignature products. DocuSign has also benefited from the increase in work-from-home arrangements brought on by COVID-19. Cloud communications services provider Twilio also helped performance. Shares of the company rose after first-quarter earnings and guidance came in above expectations. COVID-19 related increases in its use by call centers and telehealth providers offset declines in ride-share activity. Website design platform Wix.com contributed as well.
3. Source: Bureau of Labor Statistics.
FRANKLIN SMALL-MID CAP GROWTH VIP FUND
In consumer discretionary, digital sports entertainment and gaming company DraftKings contributed to relative results. DraftKings has generated revenue from online gambling and has created new products such as simulated sports events, though the company’s operations have been impacted by the suspension, postponement or cancelation of sports seasons and events due to the novel coronavirus (COVID-19) pandemic. Exercise equipment and media company Peloton Interactive and fast-casual restaurant operator Wingstop also boosted performance.
In industrials, an underweighted position in poorly performing defense contractor L3Harris Technologies contributed to relative results.
In materials, specialty chemicals manufacturer Ingevity and building materials provider Martin Marietta detracted from relative performance.
Elsewhere, satellite communications operator ViaSat hurt relative results as the company was negatively affected by emerging competition and the economic impact associated with the COVID-19 pandemic. Advanced materials company Hexcel detracted from performance as well. The company provides materials to the aerospace industry and has been hit hard by the collapse in air travel caused by COVID-19, which resulted in airplane production cuts at Airbus (one of its clients) and the calling off of a merger with aerospace systems company Woodward. Oil exploration and production company Diamondback Energy also hurt results due to the collapse of oil prices brought on by the global economic shutdown and Russia-Saudi price war. We liquidated our position due to uncertainty about when oil prices will recover to the level needed for the company to be profitable.
Thank you for your participation in Franklin Small-Mid Cap Growth VIP Fund. We look forward to serving your future investment needs.
The foregoing information reflects our analysis, opinions and portfolio holdings as of June 30, 2020, the end of the reporting period. The way we implement our main investment strategies and the resulting portfolio holdings may change depending on factors such as market and economic conditions. These opinions may not be relied upon as investment advice or an offer for a particular security. The information is not a complete analysis of every aspect of any market, country, industry, security or the Fund. Statements of fact are from sources considered reliable, but the investment manager makes no representation or warranty as to their completeness or accuracy. Although historical performance is no guarantee of future results, these insights may help you understand our investment management philosophy.
FRANKLIN SMALL-MID CAP GROWTH VIP FUND
Class 4 Fund Expenses
As an investor in a variable insurance contract (Contract) that indirectly provides for investment in an underlying mutual fund, you can incur transaction and/or ongoing expenses at both the Fund level and the Contract Level: (1) transaction expenses can include sales charges (loads) on purchases, surrender fees, transfer fees and premium taxes; and (2) ongoing expenses can include management fees, distribution and service (12b-1) fees, contract fees, annual maintenance fees, mortality and expense risk fees and other fees and expenses. All mutual funds and Contracts have some types of ongoing expenses. The table below shows Fund-level ongoing expenses and can help you understand these costs and compare them with those of other mutual funds offered through the Contract. The table assumes a $1,000 investment held for the six months indicated. Please refer to the Fund prospectus for additional information on operating expenses.
Actual Fund Expenses
The table below provides information about the actual account values and actual expenses in the columns under the heading “Actual.” In these columns the Fund’s actual return, which includes the effect of ongoing Fund expenses but does not include the effect of ongoing Contract expenses, is used to calculate the “Ending Account Value.” You can estimate the Fund-level expenses you paid during the period by following these steps (of course, your account value and expenses will differ from those in this illustration): Divide your account value by $1,000 (if your account had an $8,600 value, then $8,600 ÷ $1,000 = 8.6). Then multiply the result by the number under the headings “Actual” and “Fund-Level Expenses Paid During Period” (if Fund-Level Expenses Paid During Period were $ 7.50, then 8.6 x $ 7.50 = $64.50). In this illustration, the estimated expenses paid this period at the Fund level are $64.50.
Hypothetical Example for Comparison with Other Mutual Funds
Under the heading “Hypothetical” in the table, information is provided about hypothetical account values and hypothetical expenses based on the Fund’s actual expense ratio and an assumed rate of return of 5% per year before expenses, which is not the Fund’s actual return. This information may not be used to estimate the actual ending account balance or expenses you paid for the period, but it can help you compare ongoing costs of investing in the Fund with those of other mutual funds offered through the Contract. To do so, compare this 5% hypothetical example with the 5% hypothetical examples that appear in the shareholder reports of other funds offered through the Contract.
Please note that expenses shown in the table are meant to highlight ongoing costs at the Fund level only and do not reflect any ongoing expenses at the Contract level, or transaction expenses at either the Fund or Contract levels. In addition, while the Fund does not have transaction expenses, if the transaction and ongoing expenses at the Contract level were included, the expenses shown below would be higher. You should consult your Contract prospectus or disclosure document for more information.
| | | | | | | | | | | | | | | | | | |
| | | | | | | |
| | | | | | | Actual
(actual return after expenses) | | | | Hypothetical
(5% annual return before expenses) | | | | |
| | | | | | | | | |
| Share Class | | Beginning
Account
Value 1/1/20 | | | | Ending
Account
Value 6/30/20 | | Fund-Level
Expenses
Paid DuringPeriod
1/1/20–6/30/201, 2 | | | | Ending
Account
Value 6/30/20 | | Fund-Level
Expenses Paid
DuringPeriod
1/1/20–6/30/201, 2 | | | | Net
Annualized
Expense
Ratio2 |
Class 4 | | $1,000 | | | | $1,168.60 | | $6.42 | | | | $1,018.95 | | $5.97 | | | | 1.19% |
1. Expenses are equal to the annualized expense ratio for the six-month period as indicated above—in the far right column—multiplied by the simple average account value over the period indicated, and then multiplied by 182/366 to reflect the one-half year period.
2. Reflects expenses after fee waivers and expense reimbursements. Does not include any ongoing expenses of the Contract for which the Fund is an investment option or acquired fund fees and expenses.
FRANKLIN TEMPLETON VARIABLE INSURANCE PRODUCTS TRUST
Financial Highlights
Franklin Small-Mid Cap Growth VIP Fund
| | | | | | | | | | | | | | | | | | | | | | | | |
| | |
| | | Six Months Ended
June 30, 2020 (unaudited) | | | Year Ended December 31, | |
| | | 2019 | | | 2018 | | | 2017 | | | 2016 | | | 2015 | |
| | | | | | |
Class 1 | | | | | | | | | | | | | | | | | | | | | | | | |
| | | | | | |
Per share operating performance (for a share outstanding throughout the period) | | | | | | | | | | | | | | | | | | | | | | | | |
| | | | | | |
Net asset value, beginning of period | | | $19.74 | | | | $17.04 | | | | $19.71 | | | | $17.77 | | | | $19.09 | | | | $24.95 | |
| | | | |
| | | | | | |
| Income from investment operationsa: | | | | | | | | | | | | | | | | | | | | | | | | |
| | | | | | |
Net investment income (loss)b | | | (0.03 | ) | | | (0.04 | ) | | | (0.05 | ) | | | (0.04 | ) | | | (0.03 | ) | | | — | c,d |
| | | | | | |
Net realized and unrealized gains (losses) | | | 3.24 | | | | 5.31 | | | | (0.70 | ) | | | 3.74 | | | | 0.77 | | | | (0.03 | ) |
| | | | |
| | | | | | |
Total from investment operations | | | 3.21 | | | | 5.27 | | | | (0.75 | ) | | | 3.70 | | | | 0.74 | | | | (0.03 | ) |
| | | | |
| | | | | | |
| Less distributions from: | | | | | | | | | | | | | | | | | | | | | | | | |
| | | | | | |
Net realized gains | | | (2.64 | ) | | | (2.57 | ) | | | (1.92 | ) | | | (1.76 | ) | | | (2.06 | ) | | | (5.83 | ) |
| | | | |
| | | | | | |
Net asset value, end of period | | | $20.31 | | | | $19.74 | | | | $17.04 | | | | $19.71 | | | | $17.77 | | | | $19.09 | |
| | | | |
| | | | | | |
Total returne | | | 17.03% | | | | 31.80% | | | | (5.15)% | | | | 21.75% | | | | 4.40% | | | | (2.44)% | |
| | | | | | |
| Ratios to average net assetsf | | | | | | | | | | | | | | | | | | | | | | | | |
| | | | | | |
Expenses before waiver and payments by affiliates | | | 0.85% | | | | 0.84% | | | | 0.86% | | | | 0.85% | | | | 0.84% | | | | 0.81% | |
| | | | | | |
Expenses net of waiver and payments by affiliates | | | 0.84% | g | | | 0.83% | g | | | 0.85% | g | | | 0.84% | g | | | 0.82% | g | | | 0.81% | h |
| | | | | | |
Net investment income (loss) | | | (0.26)% | | | | (0.19)% | | | | (0.24)% | | | | (0.24)% | | | | (0.16)% | | | | 0.01% | d |
| | | | | | |
| Supplemental data | | | | | | | | | | | | | | | | | | | | | | | | |
| | | | | | |
Net assets, end of period (000’s) | | | $48,490 | | | | $43,169 | | | | $33,518 | | | | $36,864 | | | | $31,756 | | | | $87,866 | |
| | | | | | |
Portfolio turnover rate | | | 21.12% | | | | 59.07% | | | | 44.78% | | | | 40.49% | | | | 32.23% | i | | | 37.85% | |
aThe amount shown for a share outstanding throughout the period may not correlate with the Statement of Operations for the period due to the timing of sales and repurchases of the Fund’s shares in relation to income earned and/or fluctuating fair value of the investments of the Fund.
bBased on average daily shares outstanding.
cAmount rounds to less than $0.01 per share.
dNet investment income per share includes approximately $0.05 per share related to income received in the form of special dividends in connection with certain fund holdings. Excluding this amount, the ratio of net investment income to average net assets would have been (0.24)%.
eTotal return does not include fees, charges or expenses imposed by the variable annuity and life insurance contracts for which Franklin Templeton Variable Insurance Products Trust serves as an underlying investment vehicle. Total return is not annualized for periods less than one year.
fRatios are annualized for periods less than one year.
gBenefit of expense reduction rounds to less than 0.01%.
hBenefit of waiver and payments by affiliates rounds to less than 0.01%.
iExcludes the value of portfolio securities delivered as a result of a redemption in-kind.
| | | | |
| | | |
| FSC-6 | | Semiannual Report | The accompanying notes are an integral part of these financial statements. | | |
FRANKLIN TEMPLETON VARIABLE INSURANCE PRODUCTS TRUST
FINANCIAL HIGHLIGHTS
Franklin Small-Mid Cap Growth VIP Fund (continued)
| | | | | | | | | | | | | | | | | | | | | | | | |
| | |
| | | Six Months Ended
June 30, 2020 (unaudited) | | | Year Ended December 31, | |
| | | 2019 | | | 2018 | | | 2017 | | | 2016 | | | 2015 | |
| | | | | | |
Class 2 | | | | | | | | | | | | | | | | | | | | | | | | |
| | | | | | |
Per share operating performance (for a share outstanding throughout the period) | | | | | | | | | | | | | | | | | | | | | | | | |
| | | | | | |
Net asset value, beginning of period | | | $17.29 | | | | $15.22 | | | | $17.83 | | | | $16.27 | | | | $17.69 | | | | $23.56 | |
| | | | |
| | | | | | |
| Income from investment operationsa: | | | | | | | | | | | | | | | | | | | | | | | | |
| | | | | | |
Net investment income (loss)b | | | (0.04 | ) | | | (0.08 | ) | | | (0.09 | ) | | | (0.08 | ) | | | (0.07 | ) | | | (0.05 | )c |
| | | | | | |
Net realized and unrealized gains (losses) | | | 2.80 | | | | 4.72 | | | | (0.60 | ) | | | 3.40 | | | | 0.71 | | | | 0.01 | |
| | | | |
| | | | | | |
Total from investment operations | | | 2.76 | | | | 4.64 | | | | (0.69 | ) | | | 3.32 | | | | 0.64 | | | | (0.04 | ) |
| | | | |
| | | | | | |
| Less distributions from: | | | | | | | | | | | | | | | | | | | | | | | | |
| | | | | | |
Net realized gains | | | (2.64 | ) | | | (2.57 | ) | | | (1.92 | ) | | | (1.76 | ) | | | (2.06 | ) | | | (5.83 | ) |
| | | | |
| | | | | | |
Net asset value, end of period | | | $17.41 | | | | $17.29 | | | | $15.22 | | | | $17.83 | | | | $16.27 | | | | $17.69 | |
| | | | |
| | | | | | |
Total returnd | | | 16.84% | | | | 31.44% | | | | (5.37)% | | | | 21.40% | | | | 4.17% | | | | (2.66)% | |
| | | | | | |
| Ratios to average net assetse | | | | | | | | | | | | | | | | | | | | | | | | |
| | | | | | |
Expenses before waiver and payments by affiliates | | | 1.10% | | | | 1.09% | | | | 1.11% | | | | 1.10% | | | | 1.09% | | | | 1.06% | |
| | | | | | |
Expenses net of waiver and payments by affiliates | | | 1.09% | f | | | 1.08% | f | | | 1.10% | f | | | 1.09% | f | | | 1.07% | f | | | 1.06% | g |
| | | | | | |
Net investment income (loss) | | | (0.51)% | | | | (0.44)% | | | | (0.49)% | | | | (0.49)% | | | | (0.41)% | | | | (0.24)% | c |
| | | | | | |
| Supplemental data | | | | | | | | | | | | | | | | | | | | | | | | |
| | | | | | |
Net assets, end of period (000’s) | | | $405,193 | | | | $372,442 | | | | $310,300 | | | | $390,094 | | | | $392,777 | | | | $478,649 | |
| | | | | | |
Portfolio turnover rate | | | 21.12% | | | | 59.07% | | | | 44.78% | | | | 40.49% | | | | 32.23% | h | | | 37.85% | |
aThe amount shown for a share outstanding throughout the period may not correlate with the Statement of Operations for the period due to the timing of sales and repurchases of the Fund’s shares in relation to income earned and/or fluctuating fair value of the investments of the Fund.
bBased on average daily shares outstanding.
cNet investment income per share includes approximately $0.05 per share related to income received in the form of special dividends in connection with certain Fund holdings. Excluding this amount, the ratio of net investment income to average net assets would have been (0.49)%.
dTotal return does not include fees, charges or expenses imposed by the variable annuity and life insurance contracts for which Franklin Templeton Variable Insurance Products Trust serves as an underlying investment vehicle. Total return is not annualized for periods less than one year.
eRatios are annualized for periods less than one year.
fBenefit of expense reduction rounds to less than 0.01%.
gBenefit of waiver and payments by affiliates rounds to less than 0.01%.
hExcludes the value of portfolio securities delivered as a result of a redemption in-kind.
| | | | | | |
| | | |
| | The accompanying notes are an integral part of these financial statements. | Semiannual Report | | | FSC-7 | |
FRANKLIN TEMPLETON VARIABLE INSURANCE PRODUCTS TRUST
FINANCIAL HIGHLIGHTS
Franklin Small-Mid Cap Growth VIP Fund (continued)
| | | | | | | | | | | | | | | | | | | | | | | | |
| | |
| | | Six Months Ended
June 30, 2020 (unaudited) | | | Year Ended December 31, | |
| | | 2019 | | | 2018 | | | 2017 | | | 2016 | | | 2015 | |
| | | | | | |
Class 4 | | | | | | | | | | | | | | | | | | | | | | | | |
| | | | | | |
Per share operating performance (for a share outstanding throughout the period) | | | | | | | | | | | | | | | | | | | | | | | | |
| | | | | | |
Net asset value, beginning of period | | | $18.04 | | | | $15.81 | | | | $18.47 | | | | $16.81 | | | | $18.23 | | | | $24.14 | |
| | | | |
| | | | | | |
| Income from investment operationsa: | | | | | | | | | | | | | | | | | | | | | | | | |
| | | | | | |
Net investment income (loss)b | | | (0.05 | ) | | | (0.10 | ) | | | (0.11 | ) | | | (0.10 | ) | | | (0.09 | ) | | | (0.07 | )c |
| | | | | | |
Net realized and unrealized gains (losses) | | | 2.94 | | | | 4.90 | | | | (0.63 | ) | | | 3.52 | | | | 0.73 | | | | (0.01 | ) |
| | | | |
| | | | | | |
Total from investment operations | | | 2.89 | | | | 4.80 | | | | (0.74 | ) | | | 3.42 | | | | 0.64 | | | | (0.08 | ) |
| | | | |
| | | | | | |
| Less distributions from: | | | | | | | | | | | | | | | | | | | | | | | | |
| | | | | | |
Net realized gains | | | (2.64 | ) | | | (2.57 | ) | | | (1.92 | ) | | | (1.76 | ) | | | (2.06 | ) | | | (5.83 | ) |
| | | | |
| | | | | | |
Net asset value, end of period | | | $18.29 | | | | $18.04 | | | | $15.81 | | | | $18.47 | | | | $16.81 | | | | $18.23 | |
| | | | |
| | | | | | |
Total returnd | | | 16.86% | | | | 31.26% | | | | (5.46)% | | | | 21.30% | | | | 4.04% | | | | (2.77)% | |
| | | | | | |
| Ratios to average net assetse | | | | | | | | | | | | | | | | | | | | | | | | |
| | | | | | |
Expenses before waiver and payments by affiliates | | | 1.20% | | | | 1.19% | | | | 1.21% | | | | 1.20% | | | | 1.19% | | | | 1.16% | |
| | | | | | |
Expenses net of waiver and payments by affiliates | | | 1.19% | f | | | 1.18% | f | | | 1.20% | f | | | 1.19% | f | | | 1.17% | f | | | 1.16% | g |
| | | | | | |
Net investment income (loss) | | | (0.61)% | | | | (0.54)% | | | | (0.59)% | | | | (0.59)% | | | | (0.51)% | | | | (0.34)% | c |
| | | | | | |
| Supplemental data | | | | | | | | | | | | | | | | | | | | | | | | |
| | | | | | |
Net assets, end of period (000’s) | | | $18,816 | | | | $17,662 | | | | $13,759 | | | | $15,829 | | | | $13,825 | | | | $15,105 | |
| | | | | | |
Portfolio turnover rate | | | 21.12% | | | | 59.07% | | | | 44.78% | | | | 40.49% | | | | 32.23% | h | | | 37.85% | |
aThe amount shown for a share outstanding throughout the period may not correlate with the Statement of Operations for the period due to the timing of sales and repurchases of the Fund’s shares in relation to income earned and/or fluctuating fair value of the investments of the Fund.
bBased on average daily shares outstanding.
cNet investment income per share includes approximately $0.05 per share related to income received in the form of special dividends in connection with certain Fund holdings. Excluding this amount, the ratio of net investment income to average net assets would have been (0.59)%.
dTotal return does not include fees, charges or expenses imposed by the variable annuity and life insurance contracts for which Franklin Templeton Variable Insurance Products Trust serves as an underlying investment vehicle. Total return is not annualized for periods less than one year.
eRatios are annualized for periods less than one year.
fBenefit of expense reduction rounds to less than 0.01%.
gBenefit of waiver and payments by affiliates rounds to less than 0.01%.
hExcludes the value of portfolio securities delivered as a result of a redemption in-kind.
| | | | |
| | | |
| FSC-8 | | Semiannual Report | The accompanying notes are an integral part of these financial statements. | | |
FRANKLIN TEMPLETON VARIABLE INSURANCE PRODUCTS TRUST
Statement of Investments, June 30, 2020 (unaudited)
Franklin Small-Mid Cap Growth VIP Fund
| | | | | | | | | | |
| | | | | Shares | | | Value | |
| | Common Stocks 98.4% | | | | | | | | |
| | Communication Services 4.7% | | | | | | | | |
| a | | Match Group Inc. | | | 17,200 | | | $ | 5,562,480 | |
| a | | Pinterest Inc., A | | | 181,300 | | | | 4,019,421 | |
| a | | Roku Inc. | | | 26,856 | | | | 3,129,530 | |
| a | | Spotify Technology SA | | | 20,000 | | | | 5,163,800 | |
| a | | ZoomInfo Technologies Inc. | | | 13,500 | | | | 688,905 | |
| a | | Zynga Inc. | | | 367,500 | | | | 3,505,950 | |
| | | | | | | | | | |
| | | |
| | | | | | | | | 22,070,086 | |
| | | | | | | | | | |
| | Consumer Discretionary 14.8% | | | | | | | | |
| | Aptiv PLC | | | 29,227 | | | | 2,277,368 | |
| a | | Burlington Stores Inc. | | | 29,400 | | | | 5,789,742 | |
| a | | Chipotle Mexican Grill Inc. | | | 6,530 | | | | 6,871,911 | |
| | Domino’s Pizza Inc. | | | 10,750 | | | | 3,971,480 | |
| a | | DraftKings Inc., A | | | 22,900 | | | | 761,654 | |
| a,b,c | | DraftKings Inc., A | | | 251,933 | | | | 7,432,562 | |
| a | | Five Below Inc. | | | 31,650 | | | | 3,383,702 | |
| | Levi Strauss & Co., A | | | 175,000 | | | | 2,345,000 | |
| | Marriott International Inc., A | | | 18,050 | | | | 1,547,427 | |
| a | | NVR Inc. | | | 1,282 | | | | 4,177,717 | |
| a | | O’Reilly Automotive Inc. | | | 12,157 | | | | 5,126,242 | |
| a | | Peloton Interactive Inc., A | | | 64,250 | | | | 3,711,722 | |
| a | | RH | | | 14,300 | | | | 3,559,270 | |
| | Tractor Supply Co. | | | 37,737 | | | | 4,973,359 | |
| a | | Ulta Beauty Inc. | | | 18,400 | | | | 3,742,928 | |
| | Vail Resorts Inc. | | | 24,400 | | | | 4,444,460 | |
| | VF Corp. | | | 19,900 | | | | 1,212,706 | |
| | Wingstop Inc. | | | 33,700 | | | | 4,683,289 | |
| | | | | | | | | | |
| | | |
| | | | | | | | | 70,012,539 | |
| | | | | | | | | | |
| | Consumer Staples 1.6% | | | | | | | | |
| a | | BellRing Brands Inc., A | | | 94,100 | | | | 1,876,354 | |
| | Church & Dwight Co. Inc. | | | 53,500 | | | | 4,135,550 | |
| a | | Grocery Outlet Holding Corp. | | | 38,200 | | | | 1,558,560 | |
| | | | | | | | | | |
| | | |
| | | | | | | | | 7,570,464 | |
| | | | | | | | | | |
| | Financials 5.8% | | | | | | | | |
| | Ares Management Corp., A | | | 82,000 | | | | 3,255,400 | |
| | MarketAxess Holdings Inc. | | | 16,600 | | | | 8,315,272 | |
| | MSCI Inc. | | | 18,900 | | | | 6,309,198 | |
| a,c | | Selectquote Inc. | | | 10,900 | | | | 276,097 | |
| | TCF Financial Corp. | | | 63,500 | | | | 1,868,170 | |
| | Tradeweb Markets Inc. | | | 92,200 | | | | 5,360,508 | |
| | Western Alliance Bancorp | | | 52,500 | | | | 1,988,175 | |
| | | | | | | | | | |
| | | |
| | | | | | | | | 27,372,820 | |
| | | | | | | | | | |
| | Health Care 16.5% | | | | | | | | |
| a | | 10X Genomics Inc., A | | | 24,100 | | | | 2,152,371 | |
| a | | Argenx SE, ADR (Netherlands) | | | 9,000 | | | | 2,027,070 | |
| | Bio-Techne Corp. | | | 13,340 | | | | 3,522,694 | |
FRANKLIN TEMPLETON VARIABLE INSURANCE PRODUCTS TRUST
STATEMENT OF INVESTMENTS (UNAUDITED)
Franklin Small-Mid Cap Growth VIP Fund (continued)
| | | | | | | | | | |
| | | | | Shares | | | Value | |
| | Common Stocks (continued) | | | | | | | | |
| | Health Care (continued) | | | | | | | | |
| a | | Centene Corp. | | | 56,250 | | | $ | 3,574,687 | |
| a | | Deciphera Pharmaceuticals Inc. | | | 18,000 | | | | 1,074,960 | |
| a | | DexCom Inc. | | | 20,688 | | | | 8,386,915 | |
| a | | Global Blood Therapeutics Inc. | | | 18,000 | | | | 1,136,340 | |
| a | | Guardant Health Inc. | | | 44,100 | | | | 3,577,833 | |
| a | | GW Pharmaceuticals PLC, ADR (United Kingdom) | | | 23,300 | | | | 2,859,376 | |
| a | | HealthEquity Inc. | | | 41,200 | | | | 2,417,204 | |
| a | | Heron Therapeutics Inc. | | | 143,900 | | | | 2,116,769 | |
| a | | Horizon Therapeutics PLC | | | 51,000 | | | | 2,834,580 | |
| a | | IDEXX Laboratories Inc. | | | 24,750 | | | | 8,171,460 | |
| a | | Inari Medical Inc. | | | 10,100 | | | | 489,244 | |
| a | | Iovance Biotherapeutics Inc. | | | 65,000 | | | | 1,784,250 | |
| a | | iRhythm Technologies Inc. | | | 17,450 | | | | 2,022,281 | |
| a | | Legend Biotech Corp., ADR | | | 9,300 | | | | 395,808 | |
| a | | Livongo Health Inc. | | | 36,900 | | | | 2,774,511 | |
| a | | Mettler-Toledo International Inc. | | | 9,780 | | | | 7,878,279 | |
| a | | Penumbra Inc. | | | 22,900 | | | | 4,094,978 | |
| a | | PTC Therapeutics Inc. | | | 44,500 | | | | 2,257,930 | |
| a | | Reata Pharmaceuticals Inc. | | | 18,300 | | | | 2,855,166 | |
| a | | Revance Therapeutics Inc. | | | 74,001 | | | | 1,807,104 | |
| a | | Veeva Systems Inc. | | | 32,700 | | | | 7,665,534 | |
| | | | | | | | | | |
| | | |
| | | | | | | | | 77,877,344 | |
| | | | | | | | | | |
| | Industrials 14.3% | | | | | | | | |
| a | | Axon Enterprise Inc. | | | 12,300 | | | | 1,206,999 | |
| a | | CoStar Group Inc. | | | 15,135 | | | | 10,755,990 | |
| | Fastenal Co. | | | 83,100 | | | | 3,560,004 | |
| | Fortive Corp. | | | 74,400 | | | | 5,033,904 | |
| | IDEX Corp. | | | 32,650 | | | | 5,160,006 | |
| | Kansas City Southern | | | 13,200 | | | | 1,970,628 | |
| a | | Kratos Defence & Security Solutions Inc. | | | 48,600 | | | | 759,618 | |
| a | | Lyft Inc., A | | | 18,500 | | | | 610,685 | |
| a | | Mercury Systems Inc. | | | 43,700 | | | | 3,437,442 | |
| | Old Dominion Freight Line Inc. | | | 17,850 | | | | 3,027,182 | |
| | Republic Services Inc. | | | 63,100 | | | | 5,177,355 | |
| | Roper Technologies Inc. | | | 17,593 | | | | 6,830,658 | |
| | Southwest Airlines Co. | | | 50,500 | | | | 1,726,090 | |
| | Stanley Black & Decker Inc. | | | 29,346 | | | | 4,090,246 | |
| | TransUnion | | | 57,300 | | | | 4,987,392 | |
| | Verisk Analytics Inc. | | | 54,961 | | | | 9,354,362 | |
| | | | | | | | | | |
| | | |
| | | | | | | | | 67,688,561 | |
| | | | | | | | | | |
| | Information Technology 36.1% | | | | | | | | |
| a | | Adyen NV (Netherlands) | | | 2,350 | | | | 3,420,107 | |
| a | | Agora Inc., ADR (China) | | | 6,600 | | | | 291,522 | |
| a | | Alteryx Inc. | | | 35,500 | | | | 5,831,940 | |
| | Amphenol Corp., A | | | 54,700 | | | | 5,240,807 | |
| a | | ANSYS Inc. | | | 22,500 | | | | 6,563,925 | |
FRANKLIN TEMPLETON VARIABLE INSURANCE PRODUCTS TRUST
STATEMENT OF INVESTMENTS (UNAUDITED)
Franklin Small-Mid Cap Growth VIP Fund (continued)
| | | | | | | | | | |
| | | | | Shares | | | Value | |
| | Common Stocks (continued) | | | | | | | | |
| | Information Technology (continued) | | | | | | | | |
| a | | Atlassian Corp. PLC | | | 36,150 | | | $ | 6,516,760 | |
| a | | Bill.Com Holdings Inc. | | | 62,048 | | | | 5,597,350 | |
| a | | Black Knight Inc. | | | 104,000 | | | | 7,546,240 | |
| | Booz Allen Hamilton Holding Corp. | | | 14,800 | | | | 1,151,292 | |
| a | | CloudFlare Inc., A | | | 127,300 | | | | 4,576,435 | |
| a | | DocuSign Inc. | | | 73,700 | | | | 12,691,877 | |
| | Entegris Inc. | | | 13,500 | | | | 797,175 | |
| a | | EPAM Systems Inc. | | | 19,500 | | | | 4,914,195 | |
| a | | GoDaddy Inc., A | | | 81,617 | | | | 5,984,975 | |
| | Jack Henry & Associates Inc. | | | 19,350 | | | | 3,560,981 | |
| a | | Keysight Technologies Inc. | | | 48,800 | | | | 4,918,064 | |
| | KLA Corp. | | | 35,737 | | | | 6,950,132 | |
| a | | Lattice Semiconductor Corp. | | | 152,555 | | | | 4,331,036 | |
| | Microchip Technology Inc. | | | 28,927 | | | | 3,046,302 | |
| | Monolithic Power Systems | | | 19,750 | | | | 4,680,750 | |
| | NXP Semiconductors NV (Netherlands) | | | 22,600 | | | | 2,577,304 | |
| a | | Okta Inc., A | | | 31,000 | | | | 6,207,130 | |
| a | | Paylocity Holding Corp. | | | 42,450 | | | | 6,193,031 | |
| a | | Q2 Holdings Inc. | | | 38,496 | | | | 3,302,572 | |
| a | | Semtech Corp. | | | 43,000 | | | | 2,245,460 | |
| a | | Shift4 Payments Inc. | | | 16,500 | | | | 585,750 | |
| a | | SiTime Corp. | | | 60,000 | | | | 2,844,600 | |
| a | | Square Inc., A | | | 46,100 | | | | 4,837,734 | |
| a | | Synopsys Inc. | | | 51,750 | | | | 10,091,250 | |
| a | | Twilio Inc., A | | | 54,775 | | | | 12,018,730 | |
| a | | WEX Inc. | | | 16,300 | | | | 2,689,663 | |
| a | | Wix.com Ltd. (Israel) | | | 20,600 | | | | 5,278,132 | |
| a | | Workday Inc., A | | | 20,650 | | | | 3,868,984 | |
| | Xilinx Inc. | | | 41,600 | | | | 4,093,024 | |
| a | | Yeahka Ltd. (China) | | | 14,200 | | | | 31,513 | |
| a | | Zendesk Inc. | | | 55,200 | | | | 4,886,856 | |
| | | | | | | | | | |
| | | |
| | | | | | | | | 170,363,598 | |
| | | | | | | | | | |
| | Materials 2.4% | | | | | | | | |
| | Ball Corp. | | | 69,700 | | | | 4,843,453 | |
| a | | Ingevity Corp. | | | 43,841 | | | | 2,304,721 | |
| | Martin Marietta Materials Inc. | | | 20,200 | | | | 4,172,714 | |
| | | | | | | | | | |
| | | |
| | | | | | | | | 11,320,888 | |
| | | | | | | | | | |
| | Real Estate 2.2% | | | | | | | | |
| | SBA Communications Corp., A | | | 32,957 | | | | 9,818,550 | |
| | Terreno Realty Corp. | | | 15,550 | | | | 818,552 | |
| | | | | | | | | | |
| | | |
| | | | | | | | | 10,637,102 | |
| | | | | | | | | | |
| | | |
| | Total Common Stocks (Cost $291,738,732) | | | | | | | 464,913,402 | |
| | | | | | | | | | |
FRANKLIN TEMPLETON VARIABLE INSURANCE PRODUCTS TRUST
STATEMENT OF INVESTMENTS (UNAUDITED)
Franklin Small-Mid Cap Growth VIP Fund (continued)
| | | | | | | | | | |
| | | | | Shares | | | Value | |
| | Short Term Investments 2.7% | | | | | | | | |
| | | |
| | Money Market Funds (Cost $11,705,249) 2.5% | | | | | | | | |
| d,e | | Institutional Fiduciary Trust Money Market Portfolio, 0.00% | | | 11,705,249 | | | $ | 11,705,249 | |
| | | | | | | | | | |
| f | | Investments from Cash Collateral Received for Loaned Securities 0.2% | | | | | | | | |
| | Money Market Funds (Cost $1,011,025) 0.2% | | | | | | | | |
| d,e | | Institutional Fiduciary Trust Money Market Portfolio, 0.00% | | | 1,011,025 | | | | 1,011,025 | |
| | | | | | | | | | |
| | | |
| | Total Investments (Cost $304,455,006) 101.1% | | | | | | | 477,629,676 | |
| | | |
| | Other Assets, less Liabilities (1.1)% | | | | | | | (5,131,154 | ) |
| | | | | | | | | | |
| | | |
| | Net Assets 100.0% | | | | | | $ | 472,498,522 | |
| | | | | | | | | | |
See Abbreviations on page FSC-23.
aNon-income producing.
bFair valued using significant unobservable inputs. See regarding fair value measurements.
cA portion or all of the security is on loan at June 30, 2020. See Note 1(c).
dSee Note 3(e) regarding investments in affiliated management investment companies.
eThe rate shown is the annualized seven-day effective yield at period end.
fSee Note 1(c) regarding securities on loan.
| | | | |
| | | |
| FSC-12 | | Semiannual Report | The accompanying notes are an integral part of these financial statements. | | |
FRANKLIN TEMPLETON VARIABLE INSURANCE PRODUCTS TRUST
FINANCIAL STATEMENTS
Statement of Assets and Liabilities
June 30, 2020 (unaudited)
| | | | |
| |
| | | Franklin Small-Mid
Cap Growth VIP Fund | |
| |
Assets: | | | | |
Investments in securities: | | | | |
Cost - Unaffiliated issuers | | | $291,738,732 | |
Cost - Non-controlled affiliates (Note 3e) | | | 12,716,274 | |
| | | | |
| |
Value - Unaffiliated issuers+ | | | $464,913,402 | |
Value - Non-controlled affiliates (Note 3e) | | | 12,716,274 | |
Receivables: | | | | |
Capital shares sold | | | 743,853 | |
Dividends and interest | | | 67,119 | |
Other assets | | | 350 | |
| | | | |
| |
Total assets | | | 478,440,998 | |
| | | | |
Liabilities: | | | | |
Payables: | | | | |
Investment securities purchased | | | 4,155,466 | |
Capital shares redeemed. | | | 275,143 | |
Management fees | | | 299,962 | |
Distribution fees | | | 87,512 | |
Trustees’ fees and expenses | | | 137 | |
Payable upon return of securities loaned | | | 1,011,025 | |
Accrued expenses and other liabilities | | | 113,231 | |
| | | | |
| |
Total liabilities. | | | 5,942,476 | |
| | | | |
| |
Net assets, at value | | | $472,498,522 | |
| | | | |
Net assets consist of: | | | | |
Paid-in capital | | | $298,120,667 | |
Total distributable earnings (losses) | | | 174,377,855 | |
| | | | |
| |
Net assets, at value | | | $472,498,522 | |
| | | | |
| Class 1: | | | | |
Net assets, at value | | | $ 48,489,500 | |
| | | | |
Shares outstanding | | | 2,387,538 | |
| | | | |
Net asset value and maximum offering price per share | | | $20.31 | |
| | | | |
| Class 2: | | | | |
Net assets, at value | | | $405,192,999 | |
| | | | |
Shares outstanding | | | 23,268,683 | |
| | | | |
Net asset value and maximum offering price per share | | | $17.41 | |
| | | | |
| Class 4: | | | | |
Net assets, at value | | | $ 18,816,023 | |
| | | | |
Shares outstanding | | | 1,028,965 | |
| | | | |
Net asset value and maximum offering price per share | | | $18.29 | |
| | | | |
| | | | |
+Includes securities loaned | | $ | 982,641 | |
| | | | | | |
| | | |
| | The accompanying notes are an integral part of these financial statements. | Semiannual Report | | | FSC-13 | |
FRANKLIN TEMPLETON VARIABLE INSURANCE PRODUCTS TRUST
FINANCIAL STATEMENTS
Statement of Operations
for the six months ended June 30, 2020 (unaudited)
| | | | |
| |
| | | Franklin Small-Mid
Cap Growth VIP Fund | |
| |
Investment income: | | | | |
Dividends: (net of foreign taxes)* | | | | |
Unaffiliated issuers | | | $ 974,338 | |
Non-controlled affiliates (Note 3e) | | | 32,720 | |
Income from securities loaned: | | | | |
Unaffiliated entities (net of fees and rebates) | | | 180,670 | |
Non-controlled affiliates (Note 3e) | | | 11,432 | |
| | | | |
| |
Total investment income | | | 1,199,160 | |
| | | | |
Expenses: | | | | |
Management fees (Note 3a) | | | 1,653,044 | |
Distribution fees: (Note 3c) | | | | |
Class 2 | | | 444,423 | |
Class 4 | | | 29,584 | |
Custodian fees (Note 4) | | | 1,635 | |
Reports to shareholders | | | 65,461 | |
Professional fees | | | 29,928 | |
Trustees’ fees and expenses | | | 1,282 | |
Other | | | 8,804 | |
| | | | |
| |
Total expenses | | | 2,234,161 | |
Expense reductions (Note 4) | | | (8 | ) |
Expenses waived/paid by affiliates (Note 3e) | | | (21,747 | ) |
| | | | |
| |
Net expenses | | | 2,212,406 | |
| | | | |
| |
Net investment income (loss) | | | (1,013,246 | ) |
| | | | |
Realized and unrealized gains (losses): | | | | |
Net realized gain (loss) from: | | | | |
Investments: | | | | |
Unaffiliated issuers | | | 2,537,546 | |
Foreign currency transactions | | | (4,129 | ) |
| | | | |
| |
Net realized gain (loss) | | | 2,533,417 | |
| | | | |
Net change in unrealized appreciation (depreciation) on: | | | | |
Investments: | | | | |
| |
Unaffiliated issuers | | | 61,958,609 | |
| | | | |
| |
Net realized and unrealized gain (loss) | | | 64,492,026 | |
| | | | |
| |
Net increase (decrease) in net assets resulting from operations | | | $63,478,780 | |
| | | | |
| | | | |
*Foreign taxes withheld on dividends | | | $ 1,522 | |
| | | | |
| | | |
| FSC-14 | | Semiannual Report | The accompanying notes are an integral part of these financial statements. | | |
FRANKLIN TEMPLETON VARIABLE INSURANCE PRODUCTS TRUST
FINANCIAL STATEMENTS
Statements of Changes in Net Assets
| | | | | | | | |
| | | Franklin Small-Mid Cap Growth VIP
Fund | |
| | |
| | | Six Months Ended
June 30, 2020
(unaudited) | | | Year Ended
December 31, 2019 | |
Increase (decrease) in net assets: | | | | | | | | |
Operations: | | | | | | | | |
Net investment income (loss) | | | $ (1,013,246 | ) | | | $ (1,784,697 | ) |
Net realized gain (loss) | | | 2,533,417 | | | | 63,675,302 | |
Net change in unrealized appreciation (depreciation) | | | 61,958,609 | | | | 48,782,330 | |
| | | | |
| | |
Net increase (decrease) in net assets resulting from operations | | | 63,478,780 | | | | 110,672,935 | |
| | | | |
Distributions to shareholders: | | | | | | | | |
Class 1 | | | (5,568,768 | ) | | | (5,113,428 | ) |
Class 2 | | | (53,710,860 | ) | | | (51,808,967 | ) |
Class 4 | | | (2,461,041 | ) | | | (2,209,122 | ) |
| | | | |
| | |
Total distributions to shareholders | | | (61,740,669 | ) | | | (59,131,517 | ) |
| | | | |
Capital share transactions: (Note 2) | | | | | | | | |
Class 1 | | | 4,189,299 | | | | 4,136,766 | |
Class 2 | | | 32,464,137 | | | | 18,159,781 | |
Class 4 | | | 834,466 | | | | 1,857,466 | |
| | | | |
| | |
Total capital share transactions | | | 37,487,902 | | | | 24,154,013 | |
| | | | |
| | |
Net increase (decrease) in net assets | | | 39,226,013 | | | | 75,695,431 | |
Net assets: | | | | | | | | |
Beginning of period | | | 433,272,509 | | | | 357,577,078 | |
| | | | |
| | |
End of period | | | $472,498,522 | | | | $433,272,509 | |
| | | | |
| | | | | | |
| | | |
| | The accompanying notes are an integral part of these financial statements. | Semiannual Report | | | FSC-15 | |
FRANKLIN TEMPLETON VARIABLE INSURANCE PRODUCTS TRUST
Notes to Financial Statements (unaudited)
Franklin Small-Mid Cap Growth VIP Fund
1. Organization and Significant Accounting Policies
Franklin Templeton Variable Insurance Products Trust (Trust) is registered under the Investment Company Act of 1940 (1940 Act) as an open-end management investment company, consisting of eighteen separate funds and applies the specialized accounting and reporting guidance in U.S. Generally Accepted Accounting Principles (U.S. GAAP). Franklin Small-Mid Cap Growth VIP Fund (Fund) is included in this report. Shares of the Fund are generally sold only to insurance company separate accounts to fund the benefits of variable life insurance policies or variable annuity contracts. At June 30, 2020, 42.5% of the Fund’s shares were held through one insurance company. Investment activities of these insurance company separate accounts could have a material impact on the Fund. The Fund offers three classes of shares: Class 1, Class 2 and Class 4. Each class of shares may differ by its distribution fees, voting rights on matters affecting a single class and its exchange privilege.
The following summarizes the Fund’s significant accounting policies.
a. Financial Instrument Valuation
The Fund’s investments in financial instruments are carried at fair value daily. Fair value is the price that would be received to sell an asset or paid to transfer a liability in an orderly transaction between market participants on the measurement date. The Fund calculates the net asset value (NAV) per share each business day as of 4 p.m. Eastern time or the regularly scheduled close of the New York Stock Exchange (NYSE), whichever is earlier. Under compliance policies and procedures approved by the Trust’s Board of Trustees (the Board), the Fund’s administrator has responsibility for oversight of valuation, including leading the cross-functional Valuation Committee (VC). The Fund may utilize independent pricing services, quotations from securities and financial instrument dealers, and other market sources to determine fair value.
Equity securities listed on an exchange or on the NASDAQ National Market System are valued at the last quoted sale price or the official closing price of the day, respectively. Foreign equity securities are valued as of the close of trading on the foreign stock exchange on which the security is primarily traded, or as of 4 p.m. Eastern time. The value is then converted into its U.S. dollar equivalent at the foreign exchange rate in effect at 4 p.m. Eastern time on the day that the value of the security is determined. Over-the-counter
(OTC) securities are valued within the range of the most recent quoted bid and ask prices. Securities that trade in multiple markets or on multiple exchanges are valued according to the broadest and most representative market. Certain equity securities are valued based upon fundamental characteristics or relationships to similar securities.
Investments in open-end mutual funds are valued at the closing NAV.
The Fund has procedures to determine the fair value of financial instruments for which market prices are not reliable or readily available. Under these procedures, the Fund primarily employs a market-based approach which may use related or comparable assets or liabilities, recent transactions, market multiples, book values, and other relevant information for the investment to determine the fair value of the investment. An income-based valuation approach may also be used in which the anticipated future cash flows of the investment are discounted to calculate fair value. Discounts may also be applied due to the nature or duration of any restrictions on the disposition of the investments. Due to the inherent uncertainty of valuations of such investments, the fair values may differ significantly from the values that would have been used had an active market existed.
Trading in securities on foreign securities stock exchanges and OTC markets may be completed before 4 p.m. Eastern time. In addition, trading in certain foreign markets may not take place on every Fund’s business day. Events can occur between the time at which trading in a foreign security is completed and 4 p.m. Eastern time that might call into question the reliability of the value of a portfolio security held by the Fund. As a result, differences may arise between the value of the Fund’s portfolio securities as determined at the foreign market close and the latest indications of value at 4 p.m. Eastern time. In order to minimize the potential for these differences, an independent pricing service may be used to adjust the value of the Fund’s portfolio securities to the latest indications of fair value at 4 p.m. Eastern time.
When the last day of the reporting period is a non-business day, certain foreign markets may be open on those days that the Fund’s NAV is not calculated, which could result in differences between the value of the Fund’s portfolio securities on the last business day and the last calendar day of the reporting period. Any significant security valuation changes due to an open foreign market are adjusted and reflected by the Fund for financial reporting purposes.
FRANKLIN TEMPLETON VARIABLE INSURANCE PRODUCTS TRUST
NOTES TO FINANCIAL STATEMENTS (UNAUDITED)
Franklin Small-Mid Cap Growth VIP Fund (continued)
b. Foreign Currency Translation
Portfolio securities and other assets and liabilities denominated in foreign currencies are translated into U.S. dollars based on the exchange rate of such currencies against U.S. dollars on the date of valuation. The Fund may enter into foreign currency exchange contracts to facilitate transactions denominated in a foreign currency. Purchases and sales of securities, income and expense items denominated in foreign currencies are translated into U.S. dollars at the exchange rate in effect on the transaction date. Portfolio securities and assets and liabilities denominated in foreign currencies contain risks that those currencies will decline in value relative to the U.S. dollar. Occasionally, events may impact the availability or reliability of foreign exchange rates used to convert the U.S. dollar equivalent value. If such an event occurs, the foreign exchange rate will be valued at fair value using procedures established and approved by the Board.
The Fund does not separately report the effect of changes in foreign exchange rates from changes in market prices on securities held. Such changes are included in net realized and unrealized gain or loss from investments in the Statement of Operations.
Realized foreign exchange gains or losses arise from sales of foreign currencies, currency gains or losses realized between the trade and settlement dates on securities transactions and the difference between the recorded amounts of dividends, interest, and foreign withholding taxes and the U.S. dollar equivalent of the amounts actually received or paid. Net unrealized foreign exchange gains and losses arise from changes in foreign exchange rates on foreign denominated assets and liabilities other than investments in securities held at the end of the reporting period.
c. Securities Lending
The Fund participates in an agency based securities lending program to earn additional income. The Fund receives cash collateral against the loaned securities in an amount equal to at least 102% of the fair value of the loaned securities. Collateral is maintained over the life of the loan in an amount not less than 100% of the fair value of loaned securities, as determined at the close of Fund business each day; any additional collateral required due to changes in security values is delivered to the Fund on the next business day. The collateral is deposited into a joint cash account with other funds and is used to invest in a money market fund managed
by Franklin Advisers, Inc., an affiliate of the Fund. The Fund may receive income from the investment of cash collateral, in addition to lending fees and rebates paid by the borrower. Income from securities loaned, net of fees paid to the securities lending agent and/or third-party vendor, is reported separately in the Statement of Operations. The Fund bears the market risk with respect to the collateral investment, securities loaned, and the risk that the agent may default on its obligations to the Fund. If the borrower defaults on its obligation to return the securities loaned, the Fund has the right to repurchase the securities in the open market using the collateral received. The securities lending agent has agreed to indemnify the Fund in the event of default by a third party borrower.
d. Income and Deferred Taxes
It is the Fund’s policy to qualify as a regulated investment company under the Internal Revenue Code. The Fund intends to distribute to shareholders substantially all of its taxable income and net realized gains to relieve it from federal income and if applicable, excise taxes. As a result, no provision for U.S. federal income taxes is required.
The Fund may be subject to foreign taxation related to income received, capital gains on the sale of securities and certain foreign currency transactions in the foreign jurisdictions in which it invests. Foreign taxes, if any, are recorded based on the tax regulations and rates that exist in the foreign markets in which the Fund invests. When a capital gain tax is determined to apply, the Fund records an estimated deferred tax liability in an amount that would be payable if the securities were disposed of on the valuation date.
The Fund may recognize an income tax liability related to its uncertain tax positions under U.S. GAAP when the uncertain tax position has a less than 50% probability that it will be sustained upon examination by the tax authorities based on its technical merits. As of June 30, 2020, the Fund has determined that no tax liability is required in its financial statements related to uncertain tax positions for any open tax years (or expected to be taken in future tax years). Open tax years are those that remain subject to examination and are based on the statute of limitations in each jurisdiction in which the Fund invests.
FRANKLIN TEMPLETON VARIABLE INSURANCE PRODUCTS TRUST
NOTES TO FINANCIAL STATEMENTS (UNAUDITED)
Franklin Small-Mid Cap Growth VIP Fund (continued)
1. Organization and Significant Accounting Policies (continued)
e. Security Transactions, Investment Income, Expenses and Distributions
Security transactions are accounted for on trade date. Realized gains and losses on security transactions are determined on a specific identification basis. Estimated expenses are accrued daily. Dividend income is recorded on the ex-dividend date except for certain dividends from securities where the dividend rate is not available. In such cases, the dividend is recorded as soon as the information is received by the Fund. Distributions to shareholders are recorded on the ex-dividend date. Distributable earnings are determined according to income tax regulations (tax basis) and may differ from earnings recorded in accordance with U.S. GAAP. These differences may be permanent or temporary. Permanent differences are reclassified among capital accounts to reflect their tax character. These reclassifications have no impact on net assets or the results of operations. Temporary differences are not reclassified, as they may reverse in subsequent periods.
Common expenses incurred by the Trust are allocated among the Funds based on the ratio of net assets of each Fund to the combined net assets of the Trust or based on the ratio of number of shareholders of each Fund to the combined number of shareholders of the Trust. Fund specific expenses are charged directly to the Fund that incurred the expense.
Realized and unrealized gains and losses and net investment income, excluding class specific expenses, are allocated daily to each class of shares based upon the relative proportion of net assets of each class. Differences in per share distributions by class are generally due to differences in class specific expenses.
f. Accounting Estimates
The preparation of financial statements in accordance with U.S. GAAP requires management to make estimates and assumptions that affect the reported amounts of assets and liabilities at the date of the financial statements and the amounts of income and expenses during the reporting period. Actual results could differ from those estimates.
g. Guarantees and Indemnifications
Under the Trust’s organizational documents, its officers and trustees are indemnified by the Trust against certain liabilities arising out of the performance of their duties to the Trust. Additionally, in the normal course of business, the Trust, on behalf of the Fund, enters into contracts with service providers that contain general indemnification clauses. The Trust’s maximum exposure under these arrangements is unknown as this would involve future claims that may be made against the Trust that have not yet occurred. Currently, the Trust expects the risk of loss to be remote.
2. Shares of Beneficial Interest
At June 30, 2020, there were an unlimited number of shares authorized (without par value). Transactions in the Fund’s shares were as follows:
| | | | | | | | | | | | | | | | |
| | |
| | | Six Months Ended
June 30, 2020 | | | Year Ended
December 31, 2019 | |
| | | | |
| | | Shares | | | Amount | | | Shares | | | Amount | |
| | | | |
| Class 1 Shares: | | | | | | | | | | | | | | | | |
Shares sold | | | 171,421 | | | $ | 3,540,721 | | | | 318,754 | | | $ | 6,251,939 | |
Shares issued in reinvestment of distributions | | | 289,889 | | | | 5,568,768 | | | | 273,885 | | | | 5,113,428 | |
Shares redeemed | | | (260,895 | ) | | | (4,920,190 | ) | | | (372,027 | ) | | | (7,228,601) | |
| | | | |
| | | | |
Net increase (decrease) | | | 200,415 | | | $ | 4,189,299 | | | | 220,612 | | | $ | 4,136,766 | |
| | | | |
FRANKLIN TEMPLETON VARIABLE INSURANCE PRODUCTS TRUST
NOTES TO FINANCIAL STATEMENTS (UNAUDITED)
Franklin Small-Mid Cap Growth VIP Fund (continued)
| | | | | | | | | | | | | | | | |
| | |
| | | Six Months Ended
June 30, 2020 | | | Year Ended
December 31, 2019 | |
| | | | |
| | | Shares | | | Amount | | | Shares | | | Amount | |
| | | | |
| Class 2 Shares: | | | | | | | | | | | | | | | | |
Shares sold | | | 1,620,427 | | | $ | 29,073,424 | | | | 1,911,894 | | | $ | 33,367,659 | |
Shares issued in reinvestment of distributions | | | 3,261,133 | | | | 53,710,860 | | | | 3,162,941 | | | | 51,808,967 | |
Shares redeemed | | | (3,154,393 | ) | | | (50,320,147 | ) | | | (3,921,307 | ) | | | (67,016,845) | |
| | | | |
| | | | |
Net increase (decrease) | | | 1,727,167 | | | $ | 32,464,137 | | | | 1,153,528 | | | $ | 18,159,781 | |
| | | | |
| | | | |
| Class 4 Shares: | | | | | | | | | | | | | | | | |
Shares sold | | | 112,014 | | | $ | 2,007,443 | | | | 191,080 | | | $ | 3,405,783 | |
Shares issued in reinvestment of distributions | | | 142,257 | | | | 2,461,041 | | | | 129,188 | | | | 2,209,122 | |
Shares redeemed | | | (204,168 | ) | | | (3,634,018 | ) | | | (211,768 | ) | | | (3,757,439) | |
| | | | |
| | | | |
Net increase (decrease) | | | 50,103 | | | $ | 834,466 | | | | 108,500 | | | $ | 1,857,466 | |
| | | | |
3. Transactions with Affiliates
Franklin Resources, Inc. is the holding company for various subsidiaries that together are referred to as Franklin Templeton. Certain officers and trustees of the Fund are also officers and/or directors of the following subsidiaries:
| | |
| |
| Subsidiary | | Affiliation |
Franklin Advisers, Inc. (Advisers) | | Investment manager |
Franklin Templeton Services, LLC (FT Services) | | Administrative manager |
Franklin Templeton Distributors, Inc. (Distributors) | | Principal underwriter |
Franklin Templeton Investor Services, LLC (Investor Services) | | Transfer agent |
a. Management Fees
The Fund pays an investment management fee to Advisers based on the average daily net assets of the Fund as follows:
| | |
| |
| Annualized Fee Rate | | Net Assets |
0.800% | | Up to and including $500 million |
0.700% | | Over $500 million, up to and including $1 billion |
0.650% | | Over $1 billion, up to and including $1.5 billion |
0.600% | | Over $1.5 billion, up to and including $6.5 billion |
0.575% | | Over $6.5 billion, up to and including $11.5 billion |
0.550% | | Over $11.5 billion, up to and including $16.5 billion |
0.540% | | Over $16.5 billion, up to and including $19 billion |
0.530% | | Over $19 billion, up to and including $21.5 billion |
0.520% | | In excess of $21.5 billion |
b. Administrative Fees
Under an agreement with Advisers, FT Services provides administrative services to the Fund. The fee is paid by Advisers based on the Fund’s average daily net assets, and is not an additional expense of the Fund.
FRANKLIN TEMPLETON VARIABLE INSURANCE PRODUCTS TRUST
NOTES TO FINANCIAL STATEMENTS (UNAUDITED)
Franklin Small-Mid Cap Growth VIP Fund (continued)
3. Transactions with Affiliates (continued)
c. Distribution Fees
The Board has adopted distribution plans for Class 2 and Class 4 shares pursuant to Rule 12b-1 under the 1940 Act. Under the Fund’s compensation distribution plans, the Fund pays Distributors for costs incurred in connection with the servicing, sale and distribution of the Fund’s shares up to 0.35% per year of its average daily net assets of each class. The Board has agreed to limit the current rate to 0.25% per year for Class 2. The plan year, for purposes of monitoring compliance with the maximum annual plan rates, is February 1 through January 31.
d. Transfer Agent Fees
Investor Services, under terms of an agreement, performs shareholder servicing for the Fund and is not paid by the Fund for the services.
e. Investments in Affiliated Management Investment Companies
The Fund invests in one or more affiliated management investment companies for purposes other than exercising a controlling influence over the management or policies. Management fees paid by the Fund are waived on assets invested in the affiliated management investment companies, as noted in the Statement of Operations, in an amount not to exceed the management and administrative fees paid directly or indirectly by each affiliate. During the period ended June 30, 2020, the Fund held investments in affiliated management investment companies as follows:
| | | | | | | | | | | | | | | | | | | | | | | | | | | | | | | | |
| | | | | | | | |
| | | Value at
Beginning
of Period | | | Purchases | | | Sales | | | Realized
Gain (Loss) | | | Net Change in
Unrealized
Appreciation
(Depreciation) | | | Value at
End of
Period | | | Number of
Shares
Held at End
of Period | | | Investment
Income | |
| Non-Controlled Affiliates | | | | | | | | | | | | | | | | | | | | | | | | | | | | | |
| | | | | | | | | | | | | | | | | | | | | | | | | | | | | | | Dividends | |
| | | | | | | | | | | | | | | | | | | | | | | | | | | | | | | | |
Institutional Fiduciary Trust Money Market Portfolio, 0.00% | | | $10,406,987 | | | | $48,735,867 | | | | $(47,437,605) | | | | $ — | | | | $ — | | | | $11,705,249 | | | | 11,705,249 | | | | $32,720 | |
| | | | | | | | | | | | | | | | | | | | | | | | | | | | | |
| Income from
securities
loaned |
|
| | | | | | | | | | | | | | | | | | | | | | | | | | | | | | | | |
Institutional Fiduciary Trust Money Market Portfolio, 0.00% | | | 4,879,541 | | | | 23,457,988 | | | | (27,326,504 | ) | | | — | | | | — | | | | 1,011,025 | | | | 1,011,025 | | | | 11,432 | |
| | | | | | | | | | | | |
Total Affiliated Securities | | | $15,286,528 | | | | $72,193,855 | | | | $(74,764,109) | | | | $ — | | | | $ — | | | | $12,716,274 | | | | | | | | $44,152 | |
| | | | | | | | | | | | |
f. Interfund Transactions
The Fund engaged in purchases and sales of investments with funds or other accounts that have common investment managers (or affiliated investment managers), directors, trustees or officers. During the period ended June 30, 2020, these purchase and sale transactions aggregated $380,765 and $0, respectively.
4. Expense Offset Arrangement
The Fund has entered into an arrangement with its custodian whereby credits realized as a result of uninvested cash balances are used to reduce a portion of the Fund’s custodian expenses. During the period ended June 30, 2020, the custodian fees were reduced as noted in the Statement of Operations.
FRANKLIN TEMPLETON VARIABLE INSURANCE PRODUCTS TRUST
NOTES TO FINANCIAL STATEMENTS (UNAUDITED)
Franklin Small-Mid Cap Growth VIP Fund (continued)
5. Income Taxes
At June 30, 2020, the cost of investments and net unrealized appreciation (depreciation) for income tax purposes were as follows:
| | | | |
Cost of investments | | $ | 304,769,327 | |
| | | | |
| |
Unrealized appreciation | | $ | 179,898,996 | |
Unrealized depreciation | | | (7,038,647) | |
| | | | |
| |
Net unrealized appreciation (depreciation) | | $ | 172,860,349 | |
| | | | |
Differences between income and/or capital gains as determined on a book basis and a tax basis are primarily due to differing treatment of wash sales.
6. Investment Transactions
Purchases and sales of investments (excluding short term securities) for the period ended June 30, 2020, aggregated $86,528,253 and $109,489,566, respectively.
At June 30, 2020, in connection with securities lending transactions, the Fund loaned equity investments and received $1,011,025 of cash collateral. The gross amount of recognized liability for such transactions is included in payable upon return of securities loaned in the Statement of Assets and Liabilities. The agreements can be terminated at any time.
7. Novel Coronavirus Pandemic
The global outbreak of the novel coronavirus disease, known as COVID-19, has caused adverse effects on many companies, sectors, nations, regions and the markets in general, and may continue for an unpredictable duration. The effects of this pandemic may materially impact the value and performance of the Fund, its ability to buy and sell fund investments at appropriate valuations and its ability to achieve its investment objectives.
8. Credit Facility
The Fund, together with other U.S. registered and foreign investment funds (collectively, Borrowers), managed by Franklin Templeton, are borrowers in a joint syndicated senior unsecured credit facility totaling $2 billion (Global Credit Facility) which matures on February 5, 2021. This Global Credit Facility provides a source of funds to the Borrowers for temporary and emergency purposes, including the ability to meet future unanticipated or unusually large redemption requests.
Under the terms of the Global Credit Facility, the Fund shall, in addition to interest charged on any borrowings made by the Fund and other costs incurred by the Fund, pay its share of fees and expenses incurred in connection with the implementation and maintenance of the Global Credit Facility, based upon its relative share of the aggregate net assets of all of the Borrowers, including an annual commitment fee of 0.15% based upon the unused portion of the Global Credit Facility. These fees are reflected in other expenses in the Statement of Operations. During the period ended June 30, 2020, the Fund did not use the Global Credit Facility.
FRANKLIN TEMPLETON VARIABLE INSURANCE PRODUCTS TRUST
NOTES TO FINANCIAL STATEMENTS (UNAUDITED)
Franklin Small-Mid Cap Growth VIP Fund (continued)
9. Fair Value Measurements
The Fund follows a fair value hierarchy that distinguishes between market data obtained from independent sources (observable inputs) and the Fund’s own market assumptions (unobservable inputs). These inputs are used in determining the value of the Fund’s financial instruments and are summarized in the following fair value hierarchy:
| | • | | Level 1 – quoted prices in active markets for identical financial instruments |
| | • | | Level 2 – other significant observable inputs (including quoted prices for similar financial instruments, interest rates, prepayment speed, credit risk, etc.) |
| | • | | Level 3 – significant unobservable inputs (including the Fund’s own assumptions in determining the fair value of financial instruments) |
The input levels are not necessarily an indication of the risk or liquidity associated with financial instruments at that level.
A summary of inputs used as of June 30, 2020, in valuing the Fund’s assets carried at fair value, is as follows:
| | | | | | | | | | | | | | | | |
| | | | |
| | | Level 1 | | | Level 2 | | | Level 3 | | | Total | |
| Assets: | | | | | | | | | | | | | | | | |
Investments in Securities:a | | | | | | | | | | | | | | | | |
Equity Investments: | | | | | | | | | | | | | | | | |
Consumer Discretionary | | $ | 62,579,977 | | | $ | — | | | $ | 7,432,562 | | | $ | 70,012,539 | |
All Other Equity Investments | | | 394,900,863 | | | | — | | | | — | | | | 394,900,863 | |
Short Term Investments | | | 12,716,274 | | | | — | | | | — | | | | 12,716,274 | |
| | | | |
Total Investments in Securities | | $ | 470,197,114 | | | $ | — | | | $ | 7,432,562 | | | $ | 477,629,676 | |
| | | | |
aFor detailed categories, see the accompanying Statement of Investments.
A reconciliation in which Level 3 inputs are used in determining fair value is presented when there are significant Level 3 assets and/or liabilities at the beginning and/or end of the period. At June 30, 2020, the reconciliation is as follows:
| | | | | | | | | | | | | | | | | | | | | | | | | | | | | | | | | | | | | | | | |
| | | | | | | | | | |
| | | Balance at
Beginning of
Period | | | Purchases | | | Sales | | | Transfer
Into
Level 3 | | | Transfer
Out of
Level 3a | | | Cost Basis
Adjustments | | | Net
Realized
Gain
(Loss) | | | Net
Unrealized
Appreciation
(Depreciation) | | | Balance at End
of Period | | | Net Change in
Unrealized
Appreciation
(Depreciation)
on Assets
Held at
Period End | |
| Assets: | | | | | | | | | | | | | | | | | | | | | | | | | | | | | | | | | | | | | | | | |
Investments in Securities: | | | | | | | | | | | | | | | | | | | | | | | | | | | | | | | | | | | | | | | | |
Equity Investments: | | | | | | | | | | | | | | | | | | | | | | | | | | | | | | | | | | | | | | | | |
Consumer Discretionary | | | $2,241,958 | | | | $— | | | | $(494,299 | ) | | | $— | | | | $— | | | | $— | | | | $378,558 | | | | $5,306,345 | | | | $7,432,562 | | | | $5,304,762 | |
Information Technology | | | 1,763,456 | | | | — | | | | — | | | | — | | | | (3,099,287 | ) | | | — | | | | — | | | | 1,335,831 | | | | — | | | | — | |
| | | | |
Total | | | $4,005,414 | | | | $— | | | | $(494,299 | ) | | | $— | | | | $(3,099,287 | ) | | | $— | | | | $378,558 | | | | $6,642,176 | | | | $7,432,562 | | | | $5,304,762 | |
| | | | |
aThe investment was transferred out of Level 3 as a result of the availability of a quoted price in an active market for identical securities.
FRANKLIN TEMPLETON VARIABLE INSURANCE PRODUCTS TRUST
NOTES TO FINANCIAL STATEMENTS (UNAUDITED)
Franklin Small-Mid Cap Growth VIP Fund (continued)
Significant unobservable valuation inputs for material Level 3 assets and/or liabilities and impact to fair value as a result of changes in unobservable valuation inputs as of June 30, 2020, are as follows:
| | | | | | | | | | | | | | | | | | | | |
| | | | | |
| Description | | Fair Value
at End of Period | | | Valuation
Technique | | | Unobservable
Inputs | | | Amount | | | Impact to Fair
Value if Input
Increasesa | |
| Assets: | | | | | | | | | | | | | | | | | | | | |
Investments in Securities: | | | | | | | | | | | | | | | | | | | | |
Common Stocks | | | | | | | | | | | | | | | | | | | | |
Consumer Discretionary | | | $7,432,562 | | | | Market comparables | | |
| Discount for lack of
marketability |
| | | 11.3% | | | | Decreaseb | |
All Other Investments | | | — | | | | | | | | | | | | | | | | | |
Total | | | $7,432,562 | | | | | | | | | | | | | | | | | |
aRepresents the directional change in the fair value that would result from a significant and reasonable increase in the corresponding input. A significant and reasonable decrease in the input would have the opposite effect. Significant impacts, if any, to fair value and/or net assets have been indicated.
bRepresents a significant impact to fair value but not net assets.
10. New Accounting Pronouncements
In March 2020, the Financial Accounting Standards Board issued Accounting Standards Update (ASU) No. 2020-04, Reference Rate Reform (Topic 848) – Facilitation of the Effects of Reference Rate Reform on Financial Reporting. The amendments in the ASU provides optional temporary financial reporting relief from the effect of certain types of contract modifications due to the planned discontinuation of the London Interbank Offered Rate (LIBOR) and other interbank-offered based reference rates as of the end of 2021. The ASU is effective for certain reference rate-related contract modifications that occur during the period March 12, 2020 through December 31, 2022. Management is currently evaluating the impact, if any, of applying this ASU.
11. Subsequent Events
The Fund has evaluated subsequent events through the issuance of the financial statements and determined that no events have occurred that require disclosure.
Abbreviations
|
Selected Portfolio |
| ADR American Depositary Receipt |
This page intentionally left blank.
Franklin Strategic Income VIP Fund
This semiannual report for Franklin Strategic Income VIP Fund covers the period ended June 30, 2020.
Class 4 Performance Summary as of June 30, 2020
The Fund’s Class 4 Shares posted a -2.96% total return* for the six-month period ended June 30, 2020.
*The Fund has a fee waiver associated with any investment in a Franklin Templeton money fund and/or other Franklin Templeton fund, contractually guaranteed through 4/30/21. Fund investment results reflect the fee waiver; without this waiver, the results would have been lower.
Performance reflects the Fund’s Class 4 operating expenses, but does not include any contract fees, expenses or sales charges. If they had been included, performance would be lower. These charges and deductions, particularly for variable life policies, can have a significant effect on contract values and insurance benefits. See the contract prospectus for a complete description of these expenses, including sales charges.
Performance data represent past performance, which does not guarantee future results. Investment return and principal value will fluctuate, and you may have a gain or loss when you sell your shares. Current performance may differ from figures shown.
FRANKLIN STRATEGIC INCOME VIP FUND
Fund Goal and Main Investments
The Fund seeks a high level of current income, with capital appreciation over the long term as a secondary goal. Under normal market conditions, the Fund invests primarily to predominantly in U.S. and foreign debt securities, including those in emerging markets.
Fund Risks
All investments involve risks, including possible loss of principal. Unexpected events and their aftermaths, such as the spread of deadly diseases; natural, environmental or man-made disasters; financial, political or social disruptions; terrorism and war; and other tragedies or catastrophes, can cause investor fear and panic, which can adversely affect the economies of many companies, sectors, nations, regions and the market in general, in ways that cannot necessarily be foreseen. Bond prices generally move in the opposite direction of interest rates. Thus, as prices of bonds in the Fund adjust to a rise in interest rates, the Fund’s share price may decline. Changes in the financial strength of a bond issuer or in a bond’s credit rating may affect its value. High yields reflect the higher credit risks associated with certain lower rated securities held in the portfolio. Floating rate loans and high yield corporate bonds are rated below investment grade and are subject to greater risk of default, which could result in loss of principal—a risk that may be heightened in a slowing economy. The risks of foreign securities include currency fluctuations and political uncertainty. Investments in developing markets involve heightened risks related to the same factors, in addition to those associated with their relatively small size and lesser liquidity. Investing in derivative securities and the use of foreign currency techniques involve special risks as such may not achieve the anticipated benefits and/or may result in losses to the Fund. The Fund is actively managed but there is no guarantee that the manager’s investment decisions will produce the desired results. The Fund’s prospectus also includes a description of the main investment risks.
Performance Overview
You can find the Fund’s six-month total return in the Performance Summary. For comparison, the Fund’s benchmark, the Bloomberg Barclays U.S. Aggregate Bond
Index, posted a +6.14% total return for the period under review.1 The Fund’s peers, as measured by the Lipper Multi-Sector Income Funds Classification Average, posted a -1.26% return.2
Economic and Market Overview
The U.S. bond market, as measured by the Bloomberg Barclays U.S. Aggregate Bond Index, advanced during the six-month period despite significant economic disruption in the wake of the novel coronavirus (COVID-19) pandemic. In late February 2020, as more countries adopted social distancing and lockdown measures to slow the global pandemic, the U.S. bond market began pricing in the adverse impact on economic activity. Higher-quality, longer-term bonds rallied, while riskier, lower-rated corporate bonds declined sharply, reflecting a reversal in many investors’ risk appetite. During the last quarter of the reporting period, however, as generally slowing infection rates and phased business reopenings by states drove hopes for an economic rebound, corporate bond valuations advanced significantly. Nevertheless, an increase in infection rates toward period-end prompted concern among investors, hindering lower-rated bonds.
The U.S. Federal Reserve (Fed) enacted two emergency rate cuts in response to the COVID-19 pandemic in March 2020, lowering the federal funds target rate to a range of 0.00%–0.25%. In addition, the Fed announced unlimited, open-ended purchasing of government-backed and corporate bonds to help keep markets functioning, significantly expanding its balance sheet.
U.S. Treasury bonds, as measured by the Bloomberg Barclays U.S. Treasury Index, rose significantly during the reporting period. Bond purchasing by the Fed and robust demand for investments perceived as safe drove the U.S. Treasury market higher despite the widening U.S. federal budget deficit and the massive increase in issuance. Mortgage-backed securities (MBS), as measured by the Bloomberg Barclays MBS Index, also posted positive returns, aided by declining Treasury rates and the Fed’s decision to purchase agency MBS.
U.S. corporate bond performance varied significantly based on credit rating, as investors became concerned about the
1. Source: Morningstar.
2. Source: Lipper, a Thomson Reuters Company.
One cannot invest directly in an index, and an index is not representative of the Fund’s portfolio. Please see Index Descriptions following the Fund Summaries. See.www.franklintempletondatasources.com for additional data provider information.
The dollar value, number of shares or principal amount, and names of all portfolio holdings are listed in the Fund’s Statement of Investments (SOI).
FRANKLIN STRATEGIC INCOME VIP FUND
pandemic-related economic disruption and the potential credit downgrades of many companies. Investment-grade corporate bonds, as represented by the Bloomberg Barclays U.S. Corporate Bond Index, rebounded significantly after mid-March 2020 to post positive overall returns for the reporting period. In contrast, high-yield corporate bonds, as represented by the Bloomberg Barclays U.S. Corporate High Yield Bond Index, declined due to investor concerns about a potential increase in credit defaults.
Investment Strategy
We allocate our investments among the various types of debt available based on our assessment of changing economic, global market, industry and issuer conditions. We use a top-down analysis of macroeconomic trends, combined with a bottom-up fundamental analysis of market sectors, industries and issuers, seeking to take advantage of varying sector reactions to economic events. For example, we may evaluate business cycles, yield curves, country risk, and the relative interest rates among currencies, and values between and within markets. In selecting debt securities, we generally conduct our own analysis of the security’s intrinsic value rather than simply relying on the coupon rate or rating. We may also enter into various transactions involving certain currency-, interest rate- or credit-related derivative instruments.
Manager’s Discussion
The Fund allocated assets across the broad fixed income markets with an emphasis on spread sectors, both corporate and securitized. From an investment standpoint, we continued to focus on fundamentals and maintaining sufficient liquidity in the portfolio. At period end, our largest allocations were in investment-grade corporate bonds, high-yield corporate credit, non-local currency emerging market bonds and non-agency residential mortgage-backed securities (RMBS), with smaller exposures to agency mortgage-backed securities and senior secured floating-rate loans. After the significant market volatility in March 2020, we had been seeing opportunities in higher-quality sectors and added to investment-grade corporate credit, while we pared exposure to collateralized loan obligations (CLOs) and senior secured floating-rate loans. In our RMBS exposure we remain allocated to the seasoned credit risk transfer (CRTs) and have continued to stress test the portfolio under various scenarios including multiples of the global financial crisis. While the macroeconomic environment remains uncertain, we continue to believe the sector offers value. Our foreign-currency exposure was held through a basket of shorts with major positions in the Australian dollar, Singapore dollar, euro and Canadian dollar versus a basket of longs
| | | | |
| Portfolio Composition* | | | |
| Based on Consolidated Net Assets | | | |
| |
| | | 6/30/20 | |
| |
| Investment-Grade Corporate Bonds | | | 21.85% | |
| High-Yield Corporate Bonds | | | 18.81% | |
| |
| Interest-Rate Derivatives | | | 18.45% | |
| Non-Local Currency Emerging Market Bonds | | | 14.04% | |
| Residential Mortgage-Backed Securities | | | 12.22% | |
| Agency Mortgage-Backed Securities | | | 7.72% | |
| Floating-Rate Loans | | | 7.52% | |
| Collateralized Loan Obligations | | | 6.72% | |
| Treasury Inflation-Protected Securities | | | 5.93% | |
| Municipal Bonds | | | 3.55% | |
| Non-U.S. Developed Bonds | | | 2.94% | |
| Local Currency Emerging Market Bonds | | | 2.36% | |
| Other | | | 1.82% | |
| Marketplace Loans | | | 1.55% | |
| U.S. Treasuries | | | 0.96% | |
| Asset-Backed Securities | | | 0.38% | |
| Covered Bonds | | | 0.14% | |
| Commercial Mortgage-Backed Securities | | | 0.08% | |
| Short-Term Investments & Other Net Assets | | | -0.07% | |
| Currency Derivatives | | | -0.45% | |
*Notional exposure figures are intended to estimate the portfolio’s exposure, including any hedged or increased exposure through certain derivatives held in the portfolio (or their underlying reference assets). Portfolio breakdown percentages may not total 100% or may be negative due to rounding, use of any derivatives, unsettled trades or other factors. Interest-rate derivatives sector consists of Treasury, interest-rate and other derivatives that are primarily used for duration management.
with major positions in the Japanese yen. Over the period, we closed out our short New Zealand dollar and long Norwegian krona positions, reduced our euro short, added to our Singapore dollar short and long Japanese yen positions.
Allocation to investment-grade corporate credit was the most significant contributor to returns. Additionally, commercial mortgage-backed securities and asset-backed securities also benefitted performance. In contrast, the Fund’s exposure to high-yield corporate credit, sovereign emerging market securities and senior secured floating-rate loans as well as RMBS and foreign currencies detracted from performance. Foreign currency gains mainly from our short New Zealand and Canadian dollar exposures were more than offset by negative returns from long Norwegian krona, South African rand and short Australian dollar positions.
The Fund utilized derivatives, including credit default swaps, currency forwards and government bond futures, primarily as a tool for efficient portfolio management and to manage
FRANKLIN STRATEGIC INCOME VIP FUND
overall portfolio risk. These derivative transactions may provide the same, or similar, net long or short exposure to select currencies, interest rates, countries, duration or credit risks compared to holding securities.
Thank you for your participation in Franklin Strategic Income VIP Fund. We look forward to serving your future investment needs.
The foregoing information reflects our analysis, opinions and portfolio holdings as of June 30, 2020, the end of the reporting period. The way we implement our main investment strategies and the resulting portfolio holdings may change depending on factors such as market and economic conditions. These opinions may not be relied upon as investment advice or an offer for a particular security. The information is not a complete analysis of every aspect of any market, country, industry, security or the Fund. Statements of fact are from sources considered reliable, but the investment manager makes no representation or warranty as to their completeness or accuracy. Although historical performance is no guarantee of future results, these insights may help you understand our investment management philosophy.
FRANKLIN STRATEGIC INCOME VIP FUND
Class 4 Fund Expenses
As an investor in a variable insurance contract (Contract) that indirectly provides for investment in an underlying mutual fund, you can incur transaction and/or ongoing expenses at both the Fund level and the Contract Level: (1) transaction expenses can include sales charges (loads) on purchases, surrender fees, transfer fees and premium taxes; and (2) ongoing expenses can include management fees, distribution and service (12b-1) fees, contract fees, annual maintenance fees, mortality and expense risk fees and other fees and expenses. All mutual funds and Contracts have some types of ongoing expenses. The table below shows Fund-level ongoing expenses and can help you understand these costs and compare them with those of other mutual funds offered through the Contract. The table assumes a $1,000 investment held for the six months indicated. Please refer to the Fund prospectus for additional information on operating expenses.
Actual Fund Expenses
The table below provides information about the actual account values and actual expenses in the columns under the heading “Actual.” In these columns the Fund’s actual return, which includes the effect of ongoing Fund expenses but does not include the effect of ongoing Contract expenses, is used to calculate the “Ending Account Value.” You can estimate the Fund-level expenses you paid during the period by following these steps (of course, your account value and expenses will differ from those in this illustration): Divide your account value by $1,000 (if your account had an $8,600 value, then $8,600 ÷ $1,000 = 8.6). Then multiply the result by the number under the headings “Actual” and “Fund-Level Expenses Paid During Period” (if Fund-Level Expenses Paid During Period were $ 7.50, then 8.6 x $ 7.50 = $64.50). In this illustration, the estimated expenses paid this period at the Fund level are $64.50.
Hypothetical Example for Comparison with Other Mutual Funds
Under the heading “Hypothetical” in the table, information is provided about hypothetical account values and hypothetical expenses based on the Fund’s actual expense ratio and an assumed rate of return of 5% per year before expenses, which is not the Fund’s actual return. This information may not be used to estimate the actual ending account balance or expenses you paid for the period, but it can help you compare ongoing costs of investing in the Fund with those of other mutual funds offered through the Contract. To do so, compare this 5% hypothetical example with the 5% hypothetical examples that appear in the shareholder reports of other funds offered through the Contract.
Please note that expenses shown in the table are meant to highlight ongoing costs at the Fund level only and do not reflect any ongoing expenses at the Contract level, or transaction expenses at either the Fund or Contract levels. In addition, while the Fund does not have transaction expenses, if the transaction and ongoing expenses at the Contract level were included, the expenses shown below would be higher. You should consult your Contract prospectus or disclosure document for more information.
| | | | | | | | | | | | | | | | | | |
| | | | | | | |
| | | | | | | Actual (actual return after expenses) | | | | Hypothetical (5% annual return before expenses) | | | | |
Share Class | | Beginning
Account
Value 1/1/20 | | | | Ending
Account
Value 6/30/20 | | Fund-Level
Expenses
Paid During
Period
1/1/20–6/30/201, 2 | | | | Ending
Account
Value 6/30/20 | | Fund-Level
Expenses
Paid During
Period
1/1/20–6/30/201, 2 | | | | Net
Annualized
Expense
Ratio2 |
Class 4 | | $1,000 | | | | $970.40 | | $5.10 | | | | $1,019.69 | | $5.22 | | | | 1.04% |
1. Expenses are equal to the annualized expense ratio for the six-month period as indicated above—in the far right column—multiplied by the simple average account value over the period indicated, and then multiplied by 182/366 to reflect the one-half year period.
2. Reflects expenses after fee waivers and expense reimbursements. Does not include any ongoing expenses of the Contract for which the Fund is an investment option or acquired fund fees and expenses.
FRANKLIN TEMPLETON VARIABLE INSURANCE PRODUCTS TRUST
Consolidated Financial Highlights
Franklin Strategic Income VIP Fund
| | | | | | | | | | | | | | | | | | | | | | | | |
| | |
| | | Six Months Ended
June 30, 2020 (unaudited) | | | Year Ended December 31, | |
| | | 2019 | | | 2018 | | | 2017 | | | 2016 | | | 2015 | |
| | | | | | |
Class 1 | | | | | | | | | | | | | | | | | | | | | | | | |
| | | | | | |
Per share operating performance
(for a share outstanding throughout the period) | | | | | | | | | | | | | | | | | | | | | | | | |
| | | | | | |
Net asset value, beginning of period | | | $10.93 | | | | $10.65 | | | | $11.15 | | | | $11.01 | | | | $10.55 | | | | $11.90 | |
| | | | |
| | | | | | |
| Income from investment operationsa: | | | | | | | | | | | | | | | | | | | | | | | | |
| | | | | | |
Net investment incomeb | | | 0.17 | | | | 0.45 | | | | 0.47 | | | | 0.45 | | | | 0.48 | | | | 0.53 | |
| | | | | | |
Net realized and unrealized gains (losses) | | | (0.48 | ) | | | 0.43 | | | | (0.65 | ) | | | 0.04 | | | | 0.37 | | | | (0.91 | ) |
| | | | |
| | | | | | |
Total from investment operations | | | (0.31 | ) | | | 0.88 | | | | (0.18 | ) | | | 0.49 | | | | 0.85 | | | | (0.38 | ) |
| | | | |
| | | | | | |
| Less distributions from: | | | | | | | | | | | | | | | | | | | | | | | | |
| | | | | | |
Net investment income and net foreign currency gains | | | (0.54 | ) | | | (0.60 | ) | | | (0.32 | ) | | | (0.35 | ) | | | (0.39 | ) | | | (0.77 | ) |
| | | | | | |
Net realized gains | | | — | | | | — | | | | — | | | | — | | | | — | | | | (0.20 | ) |
| | | | |
| | | | | | |
Total distributions | | | (0.54 | ) | | | (0.60 | ) | | | (0.32 | ) | | | (0.35 | ) | | | (0.39 | ) | | | (0.97 | ) |
| | | | |
| | | | | | |
Net asset value, end of period | | | $10.08 | | | | $10.93 | | | | $10.65 | | | | $11.15 | | | | $11.01 | | | | $10.55 | |
| | | | |
| | | | | | |
Total returnc | | | (2.80)% | | | | 8.41% | | | | (1.65)% | | | | 4.46% | | | | 8.25% | | | | (3.62)% | |
| | | | | | |
| Ratios to average net assetsd | | | | | | | | | | | | | | | | | | | | | | | | |
| | | | | | |
Expenses before waiver and payments by affiliates | | | 0.71% | | | | 0.71% | | | | 0.67% | | | | 0.68% | | | | 0.67% | | | | 0.63% | |
| | | | | | |
Expenses net of waiver and payments by affiliatese | | | 0.69% | | | | 0.68% | | | | 0.63% | | | | 0.63% | | | | 0.60% | | | | 0.62% | |
| | | | | | |
Net investment income | | | 3.32% | | | | 4.09% | | | | 4.28% | | | | 4.00% | | | | 4.42% | | | | 4.71% | |
| | | | | | |
| Supplemental data | | | | | | | | | | | | | | | | | | | | | | | | |
| | | | | | |
Net assets, end of period (000’s) | | | $259,057 | | | | $285,437 | | | | $302,610 | | | | $361,465 | | | | $396,170 | | | | $441,658 | |
| | | | | | |
Portfolio turnover rate | | | 58.44% | | | | 114.89% | f | | | 107.90% | g | | | 108.73% | | | | 128.51% | | | | 85.85% | |
| | | | | | |
Portfolio turnover rate excluding mortgage dollar rollsh | | | 42.77% | | | | 72.45% | f | | | 40.38% | g | | | 48.11% | | | | 77.93% | | | | 51.47% | |
aThe amount shown for a share outstanding throughout the period may not correlate with the Consolidated Statement of Operations for the period due to the timing of sales and repurchases of the Fund’s shares in relation to income earned and/or fluctuating fair value of the investments of the Fund.
bBased on average daily shares outstanding.
cTotal return does not include fees, charges or expenses imposed by the variable annuity and life insurance contracts for which Franklin Templeton Variable Insurance Products Trust serves as an underlying investment vehicle. Total return is not annualized for periods less than one year.
dRatios are annualized for periods less than one year.
eBenefit of expense reduction rounds to less than 0.01%.
fExcludes the value of portfolio activity as a result of in-kind transactions.
gExcludes the value of portfolio securities delivered as a result of a redemption in-kind.
hSee Note 1(g) regarding mortgage dollar rolls.
| | | | |
| | | |
| FSI-6 | | Semiannual Report | The accompanying notes are an integral part of these consolidated financial statements. | | |
FRANKLIN TEMPLETON VARIABLE INSURANCE PRODUCTS TRUST
CONSOLIDATED FINANCIAL HIGHLIGHTS
Franklin Strategic Income VIP Fund (continued)
| | | | | | | | | | | | | | | | | | | | | | | | |
| | |
| | | Six Months Ended
June 30, 2020 (unaudited) | | | Year Ended December 31, | |
| | | 2019 | | | 2018 | | | 2017 | | | 2016 | | | 2015 | |
Class 2 | | | | | | | | | | | | | | | | | | | | | | | | |
| | | | | | |
Per share operating performance
(for a share outstanding throughout the period) | | | | | | | | | | | | | | | | | | | | | | | | |
| | | | | | |
Net asset value, beginning of period | | | $10.55 | | | | $10.28 | | | | $10.76 | | | | $10.64 | | | | $10.21 | | | | $11.55 | |
| | | | |
| | | | | | |
| Income from investment operationsa: | | | | | | | | | | | | | | | | | | | | | | | | |
| | | | | | |
Net investment incomeb | | | 0.15 | | | | 0.40 | | | | 0.42 | | | | 0.40 | | | | 0.43 | | | | 0.49 | |
| | | | | | |
Net realized and unrealized gains (losses) | | | (0.45 | ) | | | 0.42 | | | | (0.61 | ) | | | 0.04 | | | | 0.36 | | | | (0.89 | ) |
| | | | |
| | | | | | |
Total from investment operations | | | (0.30 | ) | | | 0.82 | | | | (0.19 | ) | | | 0.44 | | | | 0.79 | | | | (0.40 | ) |
| | | | |
| | | | | | |
| Less distributions from: | | | | | | | | | | | | | | | | | | | | | | | | |
| | | | | | |
Net investment income and net foreign currency gains | | | (0.52 | ) | | | (0.55 | ) | | | (0.29 | ) | | | (0.32 | ) | | | (0.36 | ) | | | (0.74 | ) |
| | | | | | |
Net realized gains | | | — | | | | — | | | | — | | | | — | | | | — | | | | (0.20 | ) |
| | | | |
| | | | | | |
Total distributions | | | (0.52 | ) | | | (0.55 | ) | | | (0.29 | ) | | | (0.32 | ) | | | (0.36 | ) | | | (0.94 | ) |
| | | | |
| | | | | | |
Net asset value, end of period | | | $ 9.73 | | | | $10.55 | | | | $10.28 | | | | $10.76 | | | | $10.64 | | | | $10.21 | |
| | | | |
| | | | | | |
Total returnc | | | (2.86)% | | | | 8.05% | | | | (1.77)% | | | | 4.17% | | | | 7.94% | | | | (3.87)% | |
| | | | | | |
| Ratios to average net assetsd | | | | | | | | | | | | | | | | | | | | | | | | |
| | | | | | |
Expenses before waiver and payments by affiliates | | | 0.96% | | | | 0.96% | | | | 0.92% | | | | 0.93% | | | | 0.92% | | | | 0.88% | |
| | | | | | |
Expenses net of waiver and payments by affiliatese | | | 0.94% | | | | 0.93% | | | | 0.88% | | | | 0.88% | | | | 0.85% | | | | 0.87% | |
| | | | | | |
Net investment income | | | 3.07% | | | | 3.84% | | | | 4.03% | | | | 3.75% | | | | 4.17% | | | | 4.46% | |
| | | | | | |
| Supplemental data | | | | | | | | | | | | | | | | | | | | | | | | |
| | | | | | |
Net assets, end of period (000’s) | | | $92,857 | | | | $94,928 | | | | $89,264 | | | | $214,271 | | | | $203,418 | | | | $202,192 | |
| | | | | | |
Portfolio turnover rate | | | 58.44% | | | | 114.89% | f | | | 107.90% | g | | | 108.73% | | | | 128.51% | | | | 85.85% | |
| | | | | | |
Portfolio turnover rate excluding mortgage dollar rollsh | | | 42.77% | | | | 72.45% | f | | | 40.38% | g | | | 48.11% | | | | 77.93% | | | | 51.47% | |
aThe amount shown for a share outstanding throughout the period may not correlate with the Consolidated Statement of Operations for the period due to the timing of sales
and repurchases of the Fund’s shares in relation to income earned and/or fluctuating fair value of the investments of the Fund.
bBased on average daily shares outstanding.
cTotal return does not include fees, charges or expenses imposed by the variable annuity and life insurance contracts for which Franklin Templeton Variable Insurance
Products Trust serves as an underlying investment vehicle. Total return is not annualized for periods less than one year.
dRatios are annualized for periods less than one year.
eBenefit of expense reduction rounds to less than 0.01%.
fExcludes the value of portfolio activity as a result of in-kind transactions.
gExcludes the value of portfolio securities delivered as a result of a redemption in-kind.
hSee Note 1(g) regarding mortgage dollar rolls.
| | | | | | |
| | | |
| | The accompanying notes are an integral part of these consolidated financial statements. | Semiannual Report | | | FSI-7 | |
FRANKLIN TEMPLETON VARIABLE INSURANCE PRODUCTS TRUST
CONSOLIDATED FINANCIAL HIGHLIGHTS
Franklin Strategic Income VIP Fund (continued)
| | | | | | | | | | | | | | | | | | | | | | | | |
| | |
| | | Six Months Ended
June 30, 2020 (unaudited) | | | Year Ended December 31, | |
| | | 2019 | | | 2018 | | | 2017 | | | 2016 | | | 2015 | |
Class 4 | | | | | | | | | | | | | | | | | | | | | | | | |
| | | | | | |
Per share operating performance
(for a share outstanding throughout the period) | | | | | | | | | | | | | | | | | | | | | | | | |
| | | | | | |
Net asset value, beginning of period | | | $10.83 | | | | $10.56 | | | | $11.04 | | | | $10.90 | | | | $10.44 | | | | $11.78 | |
| | | | |
| | | | | | |
| Income from investment operationsa: | | | | | | | | | | | | | | | | | | | | | | | | |
| | | | | | |
Net investment incomeb | | | 0.15 | | | | 0.41 | | | | 0.43 | | | | 0.40 | | | | 0.43 | | | | 0.49 | |
| | | | | | |
Net realized and unrealized gains (losses) | | | (0.47 | ) | | | 0.42 | | | | (0.64 | ) | | | 0.04 | | | | 0.38 | | | | (0.91 | ) |
| | | | |
| | | | | | |
Total from investment operations | | | (0.32 | ) | | | 0.83 | | | | (0.21 | ) | | | 0.44 | | | | 0.81 | | | | (0.42 | ) |
| | | | |
| | | | | | |
| Less distributions from: | | | | | | | | | | | | | | | | | | | | | | | | |
| | | | | | |
Net investment income and net foreign currency gains | | | (0.50 | ) | | | (0.56 | ) | | | (0.27 | ) | | | (0.30 | ) | | | (0.35 | ) | | | (0.72 | ) |
| | | | | | |
Net realized gains | | | — | | | | — | | | | — | | | | — | | | | — | | | | (0.20 | ) |
| | | | |
| | | | | | |
Total distributions | | | (0.50 | ) | | | (0.56 | ) | | | (0.27 | ) | | | (0.30 | ) | | | (0.35 | ) | | | (0.92 | ) |
| | | | |
| | | | | | |
Net asset value, end of period | | | $10.01 | | | | $10.83 | | | | $10.56 | | | | $11.04 | | | | $10.90 | | | | $10.44 | |
| | | | |
| | | | | | |
Total returnc | | | (2.96)% | | | | 7.93% | | | | (1.88)% | | | | 4.08% | | | | 7.86% | | | | (3.98)% | |
| | | | | | |
| Ratios to average net assetsd | | | | | | | | | | | | | | | | | | | | | | | | |
| | | | | | |
Expenses before waiver and payments by affiliates | | | 1.06% | | | | 1.06% | | | | 1.02% | | | | 1.03% | | | | 1.02% | | | | 0.98% | |
| | | | | | |
Expenses net of waiver and payments by affiliatese | | | 1.04% | | | | 1.03% | | | | 0.98% | | | | 0.98% | | | | 0.95% | | | | 0.97% | |
| | | | | | |
Net investment income | | | 2.97% | | | | 3.74% | | | | 3.93% | | | | 3.65% | | | | 4.07% | | | | 4.36% | |
| | | | | | |
| Supplemental data | | | | | | | | | | | | | | | | | | | | | | | | |
| | | | | | |
Net assets, end of period (000’s) | | | $48,237 | | | | $54,485 | | | | $60,763 | | | | $74,013 | | | | $80,175 | | | | $92,965 | |
| | | | | | |
Portfolio turnover rate | | | 58.44% | | | | 114.89% | f | | | 107.90% | g | | | 108.73% | | | | 128.51% | | | | 85.85% | |
| | | | | | |
Portfolio turnover rate excluding mortgage dollar rollsh | | | 42.77% | | | | 72.45% | f | | | 40.38% | g | | | 48.11% | | | | 77.93% | | | | 51.47% | |
aThe amount shown for a share outstanding throughout the period may not correlate with the Consolidated Statement of Operations for the period due to the timing of sales and repurchases of the Fund’s shares in relation to income earned and/or fluctuating fair value of the investments of the Fund.
bBased on average daily shares outstanding.
cTotal return does not include fees, charges or expenses imposed by the variable annuity and life insurance contracts for which Franklin Templeton Variable Insurance Products Trust serves as an underlying investment vehicle. Total return is not annualized for periods less than one year.
dRatios are annualized for periods less than one year.
eBenefit of expense reduction rounds to less than 0.01%.
fExcludes the value of portfolio activity as a result of in-kind transactions.
gExcludes the value of portfolio securities delivered as a result of a redemption in-kind.
hSee Note 1(g) regarding mortgage dollar rolls.
| | | | |
| | | |
| FSI-8 | | Semiannual Report | The accompanying notes are an integral part of these consolidated financial statements. | | |
FRANKLIN TEMPLETON VARIABLE INSURANCE PRODUCTS TRUST
Consolidated Statement of Investments, June 30, 2020 (unaudited)
Franklin Strategic Income VIP Fund
| | | | | | | | | | | | | | |
| | | | | Country/
Organization | | | Shares/
Warrants | | | Value | |
| | Common Stocks and Other Equity Interests 0.2% | | | | | | | | | | | | |
| | Capital Goods 0.0% | | | | | | | | | | | | |
| a,aa,b | | Onsite Rental Group Operations Pty. Ltd. | | | Australia | | | | 143,820 | | | $ | — | |
| | | | | | | | | | | | | | |
| | | | |
| | Commercial & Professional Services 0.0%† | | | | | | | | | | | | |
| a | | Remington Outdoor Co. Inc. | | | United States | | | | 74,576 | | | | 37,288 | |
| | | | | | | | | | | | | | |
| | | | |
| | Consumer Services 0.0%† | | | | | | | | | | | | |
| a,aa,c | | Turtle Bay Resort | | | United States | | | | 1,901,449 | | | | 41,832 | |
| | | | | | | | | | | | | | |
| | | | |
| | Energy 0.1% | | | | | | | | | | | | |
| | Amplify Energy Corp. | | | United States | | | | 431 | | | | 530 | |
| a,aa | | Battalion Oil Corp., wts., A, 10/08/22 | | | United States | | | | 879 | | | | 2,331 | |
| a,aa | | Battalion Oil Corp., wts., B, 10/08/22 | | | United States | | | | 1,098 | | | | 2,643 | |
| a,aa | | Battalion Oil Corp., wts., C, 10/08/22 | | | United States | | | | 1,412 | | | | 2,987 | |
| a,aa | | Birch Permian Holdings Inc. | | | United States | | | | 4,478 | | | | 21,271 | |
| a,aa | | Birch Permian Holdings Inc. | | | United States | | | | 34,907 | | | | 161,445 | |
| | Riviera Resources Inc. | | | United States | | | | 6,620 | | | | 11,883 | |
| a | | Weatherford International PLC | | | United States | | | | 13,794 | | | | 27,174 | |
| | | | | | | | | | | | | | |
| | | | |
| | | | | | | | | | | | | 230,264 | |
| | | | | | | | | | | | | | |
| | Materials 0.1% | | | | | | | | | | | | |
| a,aa,b | | Appvion Operations Inc. | | | United States | | | | 18,684 | | | | 353,175 | |
| | Verso Corp., A | | | United States | | | | 5,620 | | | | 67,215 | |
| a | | Verso Corp., wts., 7/25/23 | | | United States | | | | 592 | | | | 607 | |
| | | | | | | | | | | | | | |
| | | | |
| | | | | | | | | | | | | 420,997 | |
| | | | | | | | | | | | | | |
| | Media & Entertainment 0.0%† | | | | | | | | | | | | |
| a | | Clear Channel Outdoor Holdings Inc. | | | United States | | | | 20,804 | | | | 21,636 | |
| a | | iHeartMedia Inc., A | | | United States | | | | 8,384 | | | | 70,006 | |
| a,aa | | iHeartMedia Inc., B | | | United States | | | | 142 | | | | 1,008 | |
| | | | | | | | | | | | | | |
| | | | |
| | | | | | | | | | | | | 92,650 | |
| | | | | | | | | | | | | | |
| | Retailing 0.0% | | | | | | | | | | | | |
| a,aa,b | | K2016470219 South Africa Ltd., A | | | South Africa | | | | 14,792,309 | | | | — | |
| a,aa,b | | K2016470219 South Africa Ltd., B | | | South Africa | | | | 1,472,041 | | | | — | |
| | | | | | | | | | | | | | |
| | | | |
| | | | | | | | | | | | | — | |
| | | | | | | | | | | | | | |
| | | | |
| | Total Common Stocks and Other Equity Interests
(Cost $4,648,529) | | | | | | | | | | | 823,031 | |
| | | | | | | | | | | | | | |
| | | | |
| | Management Investment Companies (Cost $11,072,145) 2.0% | | | | | | | | | | | | |
| | Diversified Financials 2.0% | | | | | | | | | | | | |
| d | | Franklin Floating Rate Income Fund | | | United States | | | | 1,118,951 | | | | 8,067,640 | |
| | | | | | | | | | | | | | |
| | | | |
| | | | | | | | Principal
Amount* | | | | |
| | Convertible Bonds (Cost $4,770) 0.0%† | | | | | | | | | | | | |
| | Telecommunication Services 0.0%† | | | | | | | | | | | | |
| e,f | | Digicel Group 0.5 Ltd., cvt., sub. bond, 144A, PIK, 7.00%, 10/01/68 | | | Jamaica | | | | 25,758 | | | | 2,189 | |
| | | | | | | | | | | | | | |
| | | | | | |
| | | |
| | . Semiannual Report | | | FSI-9 | |
FRANKLIN TEMPLETON VARIABLE INSURANCE PRODUCTS TRUST
CONSOLIDATED STATEMENT OF INVESTMENTS (UNAUDITED)
Franklin Strategic Income VIP Fund (continued)
| | | | | | | | | | | | | | | | | | |
| | | | | Country/
Organization | | | Principal
Amount* | | | | | | Value | |
| | Corporate Bonds 44.0% | | | | | | | | | | | | | | | | |
| | Automobiles & Components 0.4% | | | | | | | | | | | | | | | | |
| e | | Allison Transmission Inc., senior bond, 144A, 5.875%, 6/01/29 | | | United States | | | | 800,000 | | | | | | | $ | 834,324 | |
| | Dana Inc., senior note, 5.625%, 6/15/28 | | | United States | | | | 700,000 | | | | | | | | 696,633 | |
| | | | | | | | | | | | | | | | | | |
| | | | | |
| | | | | | | | | | | | | | | | | 1,530,957 | |
| | | | | | | | | | | | | | | | | | |
| | Banks 4.8% | | | | | | | | | | | | | | | | |
| e | | Akbank T.A.S., senior note, 144A, 5.125%, 3/31/25 | | | Turkey | | | | 1,200,000 | | | | | | | | 1,135,195 | |
| | Bank of America Corp., | | | | | | | | | | | | | | | | |
| | senior bond, 3.248%, 10/21/27 | | | United States | | | | 647,000 | | | | | | | | 713,969 | |
| | senior note, 3.50%, 4/19/26 | | | United States | | | | 2,480,000 | | | | | | | | 2,793,821 | |
| g | | BDO Unibank Inc., senior note, Reg S, 2.95%, 3/06/23 | | | Philippines | | | | 200,000 | | | | | | | | 204,978 | |
| e | | BNP Paribas SA, senior note, 144A, 2.219% to 6/09/25, FRN | | | | | | | | | | | | | | | | |
| | thereafter, 6/09/26 | | | France | | | | 500,000 | | | | | | | | 511,417 | |
| g | | China Construction Bank Corp., sub. note, Reg S, 4.25% to 2/26/24, FRN thereafter, 2/27/29 | | | China | | | | 800,000 | | | | | | | | 855,361 | |
| | Citigroup Inc., senior note, 3.30%, 4/27/25 | | | United States | | | | 243,000 | | | | | | | | 267,038 | |
| | senior note, 3.40%, 5/01/26 | | | United States | | | | 1,106,000 | | | | | | | | 1,227,321 | |
| h | | Comerica Inc., junior sub. bond, 5.625% to 10/01/25, FRN thereafter, Perpetual | | | United States | | | | 300,000 | | | | | | | | 305,190 | |
| | Fifth Third Bancorp, senior note, 2.55%, 5/05/27 | | | United States | | | | 500,000 | | | | | | | | 535,360 | |
| | HSBC Holdings PLC, senior bond, 2.848% to 6/04/30, FRN thereafter, 6/04/31 | | | United Kingdom | | | | 800,000 | | | | | | | | 819,847 | |
| | Industrial & Commercial Bank of China Ltd., senior note, 3.538%, 11/08/27 | | | China | | | | 900,000 | | | | | | | | 991,582 | |
| | JPMorgan Chase & Co., | | | | | | | | | | | | | | | | |
| | hjunior sub. bond, R, 6.00% to 8/01/23, FRN thereafter, Perpetual | | | United States | | | | 213,000 | | | | | | | | 215,272 | |
| | senior bond, 3.20%, 6/15/26 | | | United States | | | | 1,213,000 | | | | | | | | 1,347,437 | |
| | senior bond, 2.522% to 4/22/30, FRN thereafter, 4/22/31 | | | United States | | | | 1,000,000 | | | | | | | | 1,058,410 | |
| | sub. note, 3.375%, 5/01/23 | | | United States | | | | 809,000 | | | | | | | | 865,855 | |
| | sub. note, 3.875%, 9/10/24 | | | United States | | | | 809,000 | | | | | | | | 897,481 | |
| | Lloyds Banking Group PLC, senior note, 3.87%, 7/09/25 | | | United Kingdom | | | | 200,000 | | | | | | | | 217,832 | |
| | Regions Financial Corp., senior note, 2.25%, 5/18/25 | | | United States | | | | 500,000 | | | | | | | | 523,630 | |
| | SVB Financial Group, senior note, 3.125%, 6/05/30 | | | United States | | | | 300,000 | | | | | | | | 321,935 | |
| g | | Turkiye Vakiflar Bankasi TAO, secured note, Reg S, 2.375%, 11/04/22 | | | Turkey | | | | 500,000 | | | | EUR | | | | 557,294 | |
| | Wells Fargo & Co., | | | | | | | | | | | | | | | | |
| | senior note, 3.00%, 4/22/26 | | | United States | | | | 2,021,000 | | | | | | | | 2,208,711 | |
| | senior note, 2.188% to 4/30/25, FRN thereafter, 4/30/26 | | | United States | | | | 700,000 | | | | | | | | 724,606 | |
| | | | | | | | | | | | | | | | | | |
| | | | | |
| | | | | | | | | | | | | | | | | 19,299,542 | |
| | | | | | | | | | | | | | | | | | |
| | Capital Goods 1.8% | | | | | | | | | | | | | | | | |
| e | | Beacon Roofing Supply Inc., senior note, 144A, 4.875%, 11/01/25 | | | United States | | | | 1,094,000 | | | | | | | | 979,316 | |
| | CNH Industrial NV, senior bond, 3.85%, 11/15/27 | | | United Kingdom | | | | 566,000 | | | | | | | | 598,277 | |
| | Emerson Electric Co., senior bond, 2.75%, 10/15/50 | | | United States | | | | 200,000 | | | | | | | | 200,617 | |
| e | | Herc Holdings Inc., senior note, 144A, 5.50%, 7/15/27 | | | United States | | | | 1,000,000 | | | | | | | | 1,004,680 | |
| | Honeywell International Inc., senior bond, 1.95%, 6/01/30 | | | United States | | | | 700,000 | | | | | | | | 732,342 | |
| e | | Navistar International Corp., senior secured note, 144A, 9.50%, 5/01/25 | | | United States | | | | 400,000 | | | | | | | | 430,250 | |
FRANKLIN TEMPLETON VARIABLE INSURANCE PRODUCTS TRUST
CONSOLIDATED STATEMENT OF INVESTMENTS (UNAUDITED)
Franklin Strategic Income VIP Fund (continued)
| | | | | | | | | | | | | | |
| | | | | Country/
Organization | | | Principal
Amount* | | | Value | |
| | Corporate Bonds (continued) | | | | | | | | | | | | |
| | Capital Goods (continued) | | | | | | | | | | | | |
| e | | NCI Building Systems Inc., senior secured note, 144A, 8.00%, 4/15/26 | | | United States | | | | 800,000 | | | $ | 808,524 | |
| aa,b,f | | Onsite Rental Group Operations Pty. Ltd., secured note, PIK, 6.10%, | | | | | | | | | | | | |
| | 10/26/23 | | | Australia | | | | 262,519 | | | | 213,088 | |
| e | | Resideo Funding Inc., senior note, 144A, 6.125%, 11/01/26 | | | United States | | | | 800,000 | | | | 784,524 | |
| e | | Rutas 2 and 7 Finance Ltd., senior secured bond, first lien, 144A, zero cpn., 9/30/36 | | | United States | | | | 200,000 | | | | 131,000 | |
| e,i | | Vertical U.S. Newco Inc., senior note, 144A, 5.25%, 7/15/27 | | | United States | | | | 400,000 | | | | 400,000 | |
| e | | WESCO Distribution Inc., | | | | | | | | | | | | |
| | senior note, 144A, 7.125%, 6/15/25 | | | United States | | | | 300,000 | | | | 317,160 | |
| | senior note, 144A, 7.25%, 6/15/28 | | | United States | | | | 200,000 | | | | 211,414 | |
| | Westinghouse Air Brake Technologies Corp., senior note, 3.20%, 6/15/25 | | | United States | | | | 200,000 | | | | 204,403 | |
| | | | | | | | | | | | | | |
| | | | |
| | | | | | | | | | | | | 7,015,595 | |
| | | | | | | | | | | | | | |
| | Consumer Durables & Apparel 1.0% | | | | | | | | | | | | |
| e | | Hanesbrands Inc., senior bond, 144A, 4.875%, 5/15/26 | | | United States | | | | 1,382,000 | | | | 1,395,564 | |
| | KB Home, senior note, 7.00%, 12/15/21 | | | United States | | | | 570,000 | | | | 598,030 | |
| | Mohawk Industries Inc., senior bond, 3.625%, 5/15/30 | | | United States | | | | 1,300,000 | | | | 1,418,699 | |
| | Toll Brothers Finance Corp., senior bond, 5.625%, 1/15/24 | | | United States | | | | 689,000 | | | | 739,742 | |
| | | | | | | | | | | | | | |
| | | | |
| | | | | | | | | | | | | 4,152,035 | |
| | | | | | | | | | | | | | |
| | Consumer Services 1.2% | | | | | | | | | | | | |
| e | | 1011778 BC ULC/New Red Finance Inc., secured note, second lien, 144A, 5.00%, 10/15/25 | | | Canada | | | | 970,000 | | | | 966,794 | |
| e,i | | Colt Merger Sub Inc., | | | | | | | | | | | | |
| | senior note, 144A, 5.75%, 7/01/25 | | | United States | | | | 200,000 | | | | 201,500 | |
| | senior secured note, 144A, 6.25%, 7/01/25 | | | United States | | | | 400,000 | | | | 397,880 | |
| e | | Golden Nugget Inc., senior note, 144A, 6.75%, 10/15/24 | | | United States | | | | 1,132,000 | | | | 815,040 | |
| e | | International Game Technology PLC, senior secured note, first lien, 144A, 5.25%, 1/15/29 | | | United States | | | | 700,000 | | | | 684,250 | |
| e | | KFC Holding Co./Pizza Hut Holdings LLC/Taco Bell of America LLC, senior note, 144A, 5.00%, 6/01/24 | | | United States | | | | 728,000 | | | | 743,546 | |
| e | | Wynn Las Vegas LLC/Wynn Las Vegas Capital Corp., | | | | | | | | | | | | |
| | senior bond, 144A, 5.50%, 3/01/25 | | | United States | | | | 670,000 | | | | 615,191 | |
| | senior bond, 144A, 5.25%, 5/15/27 | | | United States | | | | 200,000 | | | | 173,326 | |
| | | | | | | | | | | | | | |
| | | | |
| | | | | | | | | | | | | 4,597,527 | |
| | | | | | | | | | | | | | |
| | Diversified Financials 2.7% | | | | | | | | | | | | |
| | Capital One Financial Corp., senior note, 3.20%, 2/05/25 | | | United States | | | | 1,617,000 | | | | 1,732,506 | |
| | The Goldman Sachs Group Inc., | | | | | | | | | | | | |
| | senior note, 3.50%, 1/23/25 | | | United States | | | | 1,725,000 | | | | 1,880,200 | |
| | senior note, 3.75%, 2/25/26 | | | United States | | | | 1,213,000 | | | | 1,353,859 | |
| | Morgan Stanley, | | | | | | | | | | | | |
| | senior bond, 3.591% to 7/22/27, FRN thereafter, 7/22/28 | | | United States | | | | 809,000 | | | | 910,970 | |
| | senior note, 3.875%, 1/27/26 | | | United States | | | | 2,395,000 | | | | 2,711,294 | |
FRANKLIN TEMPLETON VARIABLE INSURANCE PRODUCTS TRUST
CONSOLIDATED STATEMENT OF INVESTMENTS (UNAUDITED)
Franklin Strategic Income VIP Fund (continued)
| | | | | | | | | | | | | | |
| | | | | Country/
Organization | | | Principal
Amount* | | | Value | |
| | Corporate Bonds (continued) | | | | | | | | | | | | |
| | Diversified Financials (continued) | | | | | | | | | | | | |
| e | | MSCI Inc., senior bond, 144A, 4.00%, 11/15/29 | | | United States | | | | 700,000 | | | $ | 715,183 | |
| | Springleaf Finance Corp., senior note, 6.625%, 1/15/28 | | | United States | | | | 1,000,000 | | | | 991,690 | |
| g | | TNB Global Ventures Capital Bhd., senior note, Reg S, 3.244%, 10/19/26 | | | Malaysia | | | | 400,000 | | | | 426,065 | |
| | | | | | | | | | | | | | |
| | | | |
| | | | | | | | | | | | | 10,721,767 | |
| | | | | | | | | | | | | | |
| | Energy 2.5% | | | | | | | | | | | | |
| e | | Aker BP ASA, senior note, 144A, 4.75%, 6/15/24 | | | Norway | | | | 600,000 | | | | 604,845 | |
| | Baker Hughes a GE Co. LLC/Baker Hughes Co-Obligor Inc., senior note, 4.486%, 5/01/30 | | | United States | | | | 50,000 | | | | 57,616 | |
| | Canadian Natural Resources Ltd., senior bond, 2.95%, 7/15/30 | | | Canada | | | | 450,000 | | | | 447,460 | |
| | Cheniere Energy Partners LP, senior secured note, first lien, 5.25%, 10/01/25 | | | United States | | | | 970,000 | | | | 967,769 | |
| | Comstock Resources Inc., senior note, 9.75%, 8/15/26 | | | United States | | | | 200,000 | | | | 187,250 | |
| | CONSOL Energy Inc., senior note, 5.875%, 4/15/22 | | | United States | | | | 167,000 | | | | 164,599 | |
| | Ecopetrol SA, senior bond, 4.125%, 1/16/25 | | | Colombia | | | | 800,000 | | | | 804,924 | |
| | Energy Transfer Operating LP, senior bond, 4.05%, 3/15/25 | | | United States | | | | 200,000 | | | | 212,975 | |
| | EnLink Midstream LLC, senior bond, 5.375%, 6/01/29 | | | United States | | | | 300,000 | | | | 225,871 | |
| e,f,g | | EnQuest PLC, senior note, 144A, Reg S, PIK, 7.00%, 10/15/23 | | | United Kingdom | | | | 849,275 | | | | 510,737 | |
| | Enterprise Products Operating LLC, senior bond, 4.80%, 2/01/49 | | | United States | | | | 150,000 | | | | 178,162 | |
| | EOG Resources Inc., senior bond, 4.375%, 4/15/30 | | | United States | | | | 100,000 | | | | 119,276 | |
| | Equinor ASA, senior note, 2.375%, 5/22/30 | | | Norway | | | | 700,000 | | | | 728,506 | |
| | Exxon Mobil Corp., senior bond, 2.61%, 10/15/30 | | | United States | | | | 500,000 | | | | 534,227 | |
| | Martin Midstream Partners LP/Martin Midstream Finance Corp., senior note, 7.25%, 2/15/21 | | | United States | | | | 1,617,000 | | | | 1,218,612 | |
| e | | Nabors Industries Ltd., senior note, 144A, 7.25%, 1/15/26 | | | United States | | | | 800,000 | | | | 494,000 | |
| | Occidental Petroleum Corp., | | | | | | | | | | | | |
| | i senior bond, 8.875%, 7/15/30 | | | United States | | | | 400,000 | | | | 400,500 | |
| | senior bond, 6.45%, 9/15/36 | | | United States | | | | 500,000 | | | | 430,540 | |
| e | | Schlumberger Holdings Corp., senior note, 144A, 3.90%, 5/17/28 | | | United States | | | | 400,000 | | | | 431,895 | |
| | Sunoco LP/Sunoco Finance Corp., | | | | | | | | | | | | |
| | senior note, 4.875%, 1/15/23 | | | United States | | | | 485,000 | | | | 479,493 | |
| | senior note, 6.00%, 4/15/27 | | | United States | | | | 500,000 | | | | 496,140 | |
| e | | Weatherford International Ltd., senior note, 144A, 11.00%, 12/01/24 | | | United States | | | | 417,000 | | | | 291,900 | |
| | The Williams Cos Inc., senior bond, 3.50%, 11/15/30 | | | United States | | | | 200,000 | | | | 210,832 | |
| | | | | | | | | | | | | | |
| | | | |
| | | | | | | | | | | | | 10,198,129 | |
| | | | | | | | | | | | | | |
| | Food & Staples Retailing 0.9% | | | | | | | | | | | | |
| e | | Cencosud SA, senior note, 144A, 4.375%, 7/17/27 | | | Chile | | | | 800,000 | | | | 816,550 | |
| | Costco Wholesale Corp., senior bond, 1.75%, 4/20/32 | | | United States | | | | 100,000 | | | | 101,889 | |
| | The Kroger Co., senior bond, 4.45%, 2/01/47 | | | United States | | | | 150,000 | | | | 182,278 | |
| | Walgreens Boots Alliance Inc., senior note, 3.80%, 11/18/24 | | | United States | | | | 2,087,000 | | | | 2,300,202 | |
| | | | | | | | | | | | | | |
| | | | |
| | | | | | | | | | | | | 3,400,919 | |
| | | | | | | | | | | | | | |
| | Food, Beverage & Tobacco 1.9% | | | | | | | | | | | | |
| | Altria Group Inc., senior note, 3.40%, 5/06/30 | | | United States | | | | 1,200,000 | | | | 1,293,492 | |
| | Anheuser-Busch InBev Worldwide Inc., senior bond, 3.50%, 6/01/30 | | | Belgium | | | | 1,300,000 | | | | 1,464,448 | |
| | B&G Foods Inc., senior note, 5.25%, 9/15/27 | | | United States | | | | 900,000 | | | | 903,096 | |
FRANKLIN TEMPLETON VARIABLE INSURANCE PRODUCTS TRUST
CONSOLIDATED STATEMENT OF INVESTMENTS (UNAUDITED)
Franklin Strategic Income VIP Fund (continued)
| | | | | | | | | | | | | | |
| | | | |
| | | | | Country/
Organization | | | Principal
Amount* | | | Value | |
| | Corporate Bonds (continued) | | | | | | | | | | | | |
| | Food, Beverage & Tobacco (continued) | | | | | | | | | | | | |
| | BAT Capital Corp., | | | | | | | | | | | | |
| | senior bond, 4.54%, 8/15/47 | | | United Kingdom | | | | 50,000 | | | $ | 54,512 | |
| | senior note, 3.557%, 8/15/27 | | | United Kingdom | | | | 300,000 | | | | 324,801 | |
| | Bunge Ltd. Finance Corp., senior note, 3.25%, 8/15/26 | | | United States | | | | 200,000 | | | | 206,665 | |
| | Diageo Capital PLC., senior note, 2.00%, 4/29/30 | | | United Kingdom | | | | 800,000 | | | | 828,819 | |
| e | | Kraft Heinz Foods Co., senior note, 144A, 3.875%, 5/15/27 | | | United States | | | | 800,000 | | | | 837,071 | |
| e | | MHP Lux SA, senior note, 144A, 6.95%, 4/03/26 | | | Ukraine | | | | 800,000 | | | | 815,410 | |
| e | | Post Holdings Inc., senior bond, 144A, 4.625%, 4/15/30 | | | United States | | | | 700,000 | | | | 688,205 | |
| | Reynolds American Inc., senior note, 4.45%, 6/12/25 | | | United Kingdom | | | | 200,000 | | | | 225,464 | |
| | | | | | | | | | | | | | |
| | | | |
| | | | | | | | | | | | | 7,641,983 | |
| | | | | | | | | | | | | | |
| | Health Care Equipment & Services 1.9% | | | | | | | | | | | | |
| | Abbott Laboratories, senior bond, 4.75%, 11/30/36 | | | United States | | | | 1,000,000 | | | | 1,346,716 | |
| | Anthem Inc., | | | | | | | | | | | | |
| | senior bond, 2.25%, 5/15/30 | | | United States | | | | 400,000 | | | | 412,054 | |
| | senior bond, 3.70%, 9/15/49 | | | United States | | | | 150,000 | | | | 171,043 | |
| | Centene Corp., | | | | | | | | | | | | |
| | senior bond, 4.625%, 12/15/29 | | | United States | | | | 200,000 | | | | 212,254 | |
| | senior bond, 3.375%, 2/15/30 | | | United States | | | | 600,000 | | | | 606,765 | |
| | senior note, 4.75%, 5/15/22 | | | United States | | | | 400,000 | | | | 406,406 | |
| | senior note, 4.25%, 12/15/27 | | | United States | | | | 300,000 | | | | 310,267 | |
| e | | senior note, 144A, 5.375%, 6/01/26 | | | United States | | | | 324,000 | | | | 337,195 | |
| | CHS/Community Health Systems Inc., senior secured note, first lien, 6.25%, 3/31/23 | | | United States | | | | 805,000 | | | | 759,848 | |
| | Cigna Corp., senior bond, 4.90%, 12/15/48 | | | United States | | | | 150,000 | | | | 198,603 | |
| | DaVita Inc., | | | | | | | | | | | | |
| | senior bond, 5.125%, 7/15/24 | | | United States | | | | 305,000 | | | | 310,642 | |
| | senior bond, 5.00%, 5/01/25 | | | United States | | | | 728,000 | | | | 745,108 | |
| | HCA Inc., senior note, 5.375%, 9/01/26 | | | United States | | | | 713,000 | | | | 778,026 | |
| e | | MPH Acquisition Holdings LLC, senior note, 144A, 7.125%, 6/01/24 | | | United States | | | | 300,000 | | | | 280,120 | |
| | Quest Diagnostics Inc., senior bond, 2.80%, 6/30/31 | | | United States | | | | 200,000 | | | | 210,099 | |
| | Stryker Corp., senior bond, 3.50%, 3/15/26 | | | United States | | | | 405,000 | | | | 456,170 | |
| | | | | | | | | | | | | | |
| | | | |
| | | | | | | | | | | | | 7,541,316 | |
| | | | | | | | | | | | | | |
| | Household & Personal Products 0.1% | | | | | | | | | | | | |
| e,i | | Kimberly-Clark de Mexico SAB de CV, senior bond, 144A, 2.431%, 7/01/31 | | | Mexico | | | | 300,000 | | | | 302,475 | |
| e | | Spectrum Brands Inc., senior bond, 144A, 5.50%, 7/15/30 | | | United States | | | | 200,000 | | | | 200,750 | |
| | | | | | | | | | | | | | |
| | | | |
| | | | | | | | | | | | | 503,225 | |
| | | | | | | | | | | | | | |
| | Insurance 1.5% | | | | | | | | | | | | |
| | Aflac Inc., senior note, 3.60%, 4/01/30 | | | United States | | | | 1,300,000 | | | | 1,519,439 | |
| | Arch Capital Group Ltd., senior bond, 3.635%, 6/30/50 | | | United States | | | | 1,000,000 | | | | 1,051,210 | |
| e | | Five Corners Funding Trust II, senior note, 144A, 2.85%, 5/15/30 | | | United States | | | | 900,000 | | | | 929,213 | |
| | Manulife Financial Corp., senior note, 2.484%, 5/19/27 | | | Canada | | | | 800,000 | | | | 838,406 | |
| | Marsh & McLennan Cos Inc., senior bond, 2.25%, 11/15/30 | | | United States | | | | 1,200,000 | | | | 1,249,561 | |
| | Willis North America Inc., senior bond, 2.95%, 9/15/29 | | | United States | | | | 400,000 | | | | 424,616 | |
| | | | | | | | | | | | | | |
| | | | |
| | | | | | | | | | | | | 6,012,445 | |
| | | | | | | | | | | | | | |
FRANKLIN TEMPLETON VARIABLE INSURANCE PRODUCTS TRUST
CONSOLIDATED STATEMENT OF INVESTMENTS (UNAUDITED)
Franklin Strategic Income VIP Fund (continued)
| | | | | | | | | | | | | | |
| | | | | Country/
Organization | | | Principal
Amount* | | | Value | |
| | Corporate Bonds (continued) | | | | | | | | | | | | |
| | Materials 5.4% | | | | | | | | | | | | |
| | Air Products and Chemicals Inc., senior bond, 2.05%, 5/15/30 | | | United States | | | | 400,000 | | | $ | 420,873 | |
| e | | Alpek SAB de CV, senior note, 144A, 4.25%, 9/18/29 | | | Mexico | | | | 1,600,000 | | | | 1,582,496 | |
| e | | Ardagh Packaging Finance PLC/Ardagh Holdings USA Inc., | | | | | | | | | | | | |
| | senior note, 144A, 6.00%, 2/15/25 | | | Luxembourg | | | | 248,000 | | | | 254,138 | |
| | senior note, 144A, 5.25%, 8/15/27 | | | Luxembourg | | | | 300,000 | | | | 294,993 | |
| | Bemis Co Inc., senior note, 2.63%, 6/19/30 | | | United States | | | | 200,000 | | | | 205,270 | |
| e | | Braskem Netherlands Finance BV, senior bond, 144A, 4.50%, 1/31/30 | | | Brazil | | | | 1,100,000 | | | | 1,008,425 | |
| e | | CCL Industries Inc., senior note, 144A, 3.05%, 6/01/30 | | | Canada | | | | 500,000 | | | | 512,577 | |
| e | | Cemex Finance LLC, senior secured note, first lien, 144A, 6.00%, 4/01/24 | | | Mexico | | | | 299,000 | | | | 296,850 | |
| e | | Cemex SAB de CV, senior secured bond, first lien, 144A, 5.70%, 1/11/25 | | | Mexico | | | | 1,013,000 | | | | 993,358 | |
| g | | CNAC HK Finbridge Co. Ltd., senior note, Reg S, 4.875%, 3/14/25 | | | China | | | | 800,000 | | | | 889,441 | |
| | Crown Americas LLC/Crown Americas Capital Corp. VI, senior note, 4.75%, 2/01/26 | | | United States | | | | 1,066,000 | | | | 1,090,081 | |
| | EI du Pont de Nemours and Co., senior bond, 2.30%, 7/15/30 | | | United States | | | | 1,300,000 | | | | 1,354,025 | |
| e | | FMG Resources (August 2006) Pty. Ltd., | | | | | | | | | | | | |
| | senior note, 144A, 5.125%, 3/15/23 | | | Australia | | | | 324,000 | | | | 333,919 | |
| | senior note, 144A, 5.125%, 5/15/24 | | | Australia | | | | 647,000 | | | | 668,095 | |
| e | | Gates Global LLC / Gates Corp., senior note, 144A, 6.25%, 1/15/26 | | | United States | | | | 700,000 | | | | 694,456 | |
| e | | Glencore Funding LLC, | | | | | | | | | | | | |
| | senior note, 144A, 4.125%, 5/30/23 | | | Switzerland | | | | 485,000 | | | | 518,908 | |
| | senior note, 144A, 4.625%, 4/29/24 | | | Switzerland | | | | 250,000 | | | | 276,152 | |
| | LYB International Finance BV, senior note, 4.00%, 7/15/23 | | | United States | | | | 1,698,000 | | | | 1,842,820 | |
| e | | Mauser Packaging Solutions Holding Co., senior note, 144A, 7.25%, 4/15/25 | | | United States | | | | 1,278,000 | | | | 1,162,648 | |
| e | | Novelis Corp., senior bond, 144A, 5.875%, 9/30/26 | | | United States | | | | 1,059,000 | | | | 1,060,239 | |
| | Olin Corp., senior note, 5.125%, 9/15/27 | | | United States | | | | 400,000 | | | | 375,162 | |
| e | | Owens-Brockway Glass Container Inc., | | | | | | | | | | | | |
| | senior note, 144A, 5.00%, 1/15/22 | | | United States | | | | 120,000 | | | | 120,267 | |
| | senior note, 144A, 5.875%, 8/15/23 | | | United States | | | | 566,000 | | | | 585,869 | |
| | senior note, 144A, 6.625%, 5/13/27 | | | United States | | | | 100,000 | | | | 104,188 | |
| e | | Reynolds Group Issuer Inc./Reynolds Group Issuer LLC/Reynolds Group Issuer Luxembourg SA, | | | | | | | | | | | | |
| | senior note, 144A, 7.00%, 7/15/24 | | | United States | | | | 105,000 | | | | 105,541 | |
| | senior secured note, first lien, 144A, 5.125%, 7/15/23 | | | United States | | | | 566,000 | | | | 573,468 | |
| e | | SABIC Capital II BV, senior note, 144A, 4.50%, 10/10/28 | | | Saudi Arabia | | | | 600,000 | | | | 680,730 | |
| e | | Sealed Air Corp., | | | | | | | | | | | | |
| | senior bond, 144A, 5.125%, 12/01/24 | | | United States | | | | 809,000 | | | | 866,136 | |
| | senior bond, 144A, 5.50%, 9/15/25 | | | United States | | | | 124,000 | | | | 133,752 | |
| | senior note, 144A, 4.875%, 12/01/22 | | | United States | | | | 85,000 | | | | 87,636 | |
| e | | SunCoke Energy Partners LP/SunCoke Energy Partners Finance Corp., senior note, 144A, 7.50%, 6/15/25 | | | United States | | | | 1,100,000 | | | | 933,146 | |
| e | | TPC Group Inc., secured note, 144A, 10.50%, 8/01/24 | | | United States | | | | 900,000 | | | | 807,282 | |
| | Westlake Chemical Corp., senior bond, 3.375%, 6/15/30 | | | United States | | | | 200,000 | | | | 204,691 | |
| | WRKCo Inc., senior bond, 3.00%, 6/15/33 | | | United States | | | | 400,000 | | | | 418,219 | |
FRANKLIN TEMPLETON VARIABLE INSURANCE PRODUCTS TRUST
CONSOLIDATED STATEMENT OF INVESTMENTS (UNAUDITED)
Franklin Strategic Income VIP Fund (continued)
| | | | | | | | | | | | | | |
| | | | | Country/
Organization | | | Principal
Amount* | | | Value | |
| | Corporate Bonds (continued) | | | | | | | | | | | | |
| | Materials (continued) | | | | | | | | | | | | |
| e | | Yara International ASA, senior note, 144A, 3.148%, 6/04/30 | | | Norway | | | | 100,000 | | | $ | 104,177 | |
| | | | | | | | | | | | | | |
| | | | |
| | | | | | | | | | | | | 21,560,028 | |
| | | | | | | | | | | | | | |
| | Media & Entertainment 3.3% | | | | | | | | | | | | |
| e | | Altice Financing SA, secured bond, 144A, 7.50%, 5/15/26 | | | Luxembourg | | | | 600,000 | | | | 631,515 | |
| | AMC Entertainment Holdings Inc., senior sub. bond, 5.75%, 6/15/25 | | | United States | | | | 800,000 | | | | 258,000 | |
| e | | CCO Holdings LLC/CCO Holdings Capital Corp., | | | | | | | | | | | | |
| | senior bond, 144A, 5.375%, 5/01/25 | | | United States | | | | 728,000 | | | | 748,096 | |
| | senior bond, 144A, 4.50%, 8/15/30 | | | United States | | | | 300,000 | | | | 307,247 | |
| | Charter Communications Operating LLC/Charter Communications Operating Capital, senior bond, 2.80%, 4/01/31 | | | United States | | | | 300,000 | | | | 304,796 | |
| | Clear Channel Worldwide Holdings Inc., | | | | | | | | | | | | |
| | senior note, 9.25%, 2/15/24 | | | United States | | | | 256,000 | | | | 238,140 | |
| e | | senior secured note, first lien, 144A, 5.125%, 8/15/27 | | | United States | | | | 600,000 | | | | 577,056 | |
| e | | CSC Holdings LLC, senior secured note, first lien, 144A, 5.50%, 5/15/26 | | | United States | | | | 1,378,000 | | | | 1,418,341 | |
| e | | Diamond Sports Group LLC/Diamond Sports Finance Co., | | | | | | | | | | | | |
| | first lien, 144A, 5.375%, 8/15/26 | | | United States | | | | 400,000 | | | | 291,968 | |
| | senior note, 144A, 6.625%, 8/15/27 | | | United States | | | | 300,000 | | | | 161,559 | |
| | DISH DBS Corp., | | | | | | | | | | | | |
| | senior bond, 6.75%, 6/01/21 | | | United States | | | | 5,000 | | | | 5,102 | |
| | senior note, 5.875%, 11/15/24 | | | United States | | | | 570,000 | | | | 567,597 | |
| e,i | | DISH Network Corp., senior note, 144A, 7.375%, 7/01/28 | | | United States | | | | 300,000 | | | | 299,625 | |
| | Fox Corp, senior bond, 3.50%, 4/08/30 | | | United States | | | | 400,000 | | | | 447,486 | |
| | iHeartCommunications Inc., senior note, 8.375%, 5/01/27 | | | United States | | | | 87,378 | | | | 80,229 | |
| e | | Live Nation Entertainment Inc., senior note, 144A, 4.75%, 10/15/27 | | | United States | | | | 800,000 | | | | 690,084 | |
| | Netflix Inc., | | | | | | | | | | | | |
| | senior bond, 5.875%, 2/15/25 | | | United States | | | | 1,000,000 | | | | 1,114,795 | |
| | senior bond, 4.375%, 11/15/26 | | | United States | | | | 300,000 | | | | 312,744 | |
| e | | Nexstar Broadcasting Inc., senior note, 144A, 5.625%, 8/01/24 | | | United States | | | | 1,417,000 | | | | 1,431,319 | |
| | RELX Capital Inc., senior note, 3.00%, 5/22/30 | | | United Kingdom | | | | 100,000 | | | | 108,423 | |
| e | | Tencent Holdings Ltd., senior note, 144A, 2.39%, 6/03/30 | | | China | | | | 1,100,000 | | | | 1,102,555 | |
| | The Walt Disney Co., senior note, 2.20%, 1/13/28 | | | United States | | | | 400,000 | | | | 418,197 | |
| e | | Univision Communications Inc., senior secured note, first lien, 144A, 5.125%, 2/15/25 | | | United States | | | | 1,321,000 | | | | 1,248,352 | |
| e | | Virgin Media Secured Finance PLC, senior secured bond, 144A, 4.50%, 8/15/30 | | | United Kingdom | | | | 600,000 | | | | 601,875 | |
| | | | | | | | | | | | | | |
| | | | |
| | | | | | | | | | | | | 13,365,101 | |
| | | | | | | | | | | | | | |
| | Pharmaceuticals, Biotechnology & Life Sciences 1.8% | | | | | | | | | | | | |
| e | | AbbVie Inc., | | | | | | | | | | | | |
| | senior bond, 144A, 3.80%, 3/15/25 | | | United States | | | | 1,778,000 | | | | 1,984,586 | |
| | senior note, 144A, 2.95%, 11/21/26 | | | United States | | | | 600,000 | | | | 657,093 | |
| | senior note, 144A, 3.20%, 11/21/29 | | | United States | | | | 700,000 | | | | 781,587 | |
| e | | Bausch Health Cos. Inc., | | | | | | | | | | | | |
| | senior bond, 144A, 6.125%, 4/15/25 | | | United States | | | | 243,000 | | | | 246,810 | |
| | senior note, 144A, 8.50%, 1/31/27 | | | United States | | | | 809,000 | | | | 860,149 | |
FRANKLIN TEMPLETON VARIABLE INSURANCE PRODUCTS TRUST
CONSOLIDATED STATEMENT OF INVESTMENTS (UNAUDITED)
Franklin Strategic Income VIP Fund (continued)
| | | | | | | | | | | | | | |
| | | | | Country/
Organization | | | Principal
Amount* | | | Value | |
| | Corporate Bonds (continued) | | | | | | | | | | | | |
| | Pharmaceuticals, Biotechnology & Life Sciences (continued) | | | | | | | | | | | | |
| e | | Bayer U.S. Finance II LLC, senior bond, 144A, 4.375%, 12/15/28 | | | Germany | | | | 889,000 | | | $ | 1,039,460 | |
| | Biogen Inc., senior bond, 2.25%, 5/01/30 | | | United States | | | | 300,000 | | | | 303,395 | |
| e | | Endo Dac/Endo Finance LLC/Endo Finco Inc., | | | | | | | | | | | | |
| | secured note, second lien, 144A, 9.50%, 7/31/27 | | | United States | | | | 452,000 | | | | 480,340 | |
| | senior note, 144A, 6.00%, 6/30/28 | | | United States | | | | 659,000 | | | | 428,350 | |
| e | | Par Pharmaceutical Inc., senior secured note, 144A, 7.50%, 4/01/27 | | | United States | | | | 184,000 | | | | 189,436 | |
| | Perrigo Finance Unlimited Co., senior note, 3.15%, 6/15/30 | | | United States | | | | 400,000 | | | | 404,187 | |
| | | | | | | | | | | | | | |
| | | | |
| | | | | | | | | | | | | 7,375,393 | |
| | | | | | | | | | | | | | |
| | Real Estate 1.3% | | | | | | | | | | | | |
| | AvalonBay Communities Inc., senior bond, 2.45%, 1/15/31 | | | United States | | | | 500,000 | | | | 533,740 | |
| | g China Overseas Finance Cayman VI Ltd., senior note, Reg S, 5.95%, 5/08/24 | | | China | | | | 700,000 | | | | 801,287 | |
| | Equinix Inc., senior bond, 5.875%, 1/15/26 | | | United States | | | | 100,000 | | | | 105,471 | |
| e | | Five Point Operating Co. LP/Five Point Capital Corp., senior note, 144A, 7.875%, 11/15/25 | | | United States | | | | 800,000 | | | | 758,492 | |
| | MPT Operating Partnership LP/MPT Finance Corp., | | | | | | | | | | | | |
| | senior bond, 5.25%, 8/01/26 | | | United States | | | | 247,000 | | | | 256,980 | |
| | senior bond, 5.00%, 10/15/27 | | | United States | | | | 889,000 | | | | 916,252 | |
| e | | SBA Communications Corp., senior note, 144A, 3.875%, 2/15/27 | | | United States | | | | 600,000 | | | | 598,323 | |
| e | | VICI Properties LP/VICI Note Co. Inc., senior note, 144A, 3.75%, 2/15/27 | | | United States | | | | 1,400,000 | | | | 1,318,408 | |
| | | | | | | | | | | | | | |
| | | | |
| | | | | | | | | | | | | 5,288,953 | |
| | | | | | | | | | | | | | |
| | Retailing 0.2% | | | | | | | | | | | | |
| | AutoNation Inc., senior bond, 4.75%, 6/01/30 | | | United States | | | | 200,000 | | | | 217,101 | |
| | Dollar Tree Inc., senior bond, 4.20%, 5/15/28 | | | United States | | | | 300,000 | | | | 349,343 | |
| aa,e,f | | K2016470219 South Africa Ltd., senior secured note, 144A, PIK, 3.00%, 12/31/22 | | | South Africa | | | | 976,441 | | | | — | |
| aa,e,f | | K2016470260 South Africa Ltd., senior secured note, 144A, PIK, 25.00%, 12/31/22 | | | South Africa | | | | 352,537 | | | | 1,763 | |
| e | | Party City Holdings Inc., senior note, 144A, 6.625%, 8/01/26 | | | United States | | | | 1,085,000 | | | | 244,125 | |
| | | | | | | | | | | | | | |
| | | | | | | | | | | | | 812,332 | |
| | | | | | | | | | | | | | |
| | Semiconductors & Semiconductor Equipment 0.0%† | | | | | | | | | | | | |
| | Maxim Integrated Products Inc., senior note, 3.375%, 3/15/23 | | | United States | | | | 100,000 | | | | 103,937 | |
| | | | | | | | | | | | | | |
| | Software & Services 0.5% | | | | | | | | | | | | |
| | Fiserv Inc., senior bond, 2.65%, 6/01/30 | | | United States | | | | 600,000 | | | | 634,325 | |
| e | | Gartner Inc., senior note, 144A, 4.50%, 7/01/28 | | | United States | | | | 200,000 | | | | 202,840 | |
| e | | NortonLifeLock Inc., senior note, 144A, 5.00%, 4/15/25 | | | United States | | | | 978,000 | | | | 997,560 | |
| | | | | | | | | | | | | | |
| | | | |
| | | | | | | | | | | | | 1,834,725 | |
| | | | | | | | | | | | | | |
| | Technology Hardware & Equipment 0.8% | | | | | | | | | | | | |
| e | | Blackboard Inc., secured note, second lien, 144A, 10.375%, 11/15/24 | | | United States | | | | 200,000 | | | | 195,625 | |
| e | | CommScope Technologies LLC, senior bond, 144A, 5.00%, 3/15/27 | | | United States | | | | 1,374,000 | | | | 1,241,697 | |
| | Flex Ltd., senior note, 3.75%, 2/01/26 | | | United States | | | | 1,100,000 | | | | 1,167,133 | |
| e | | Presidio Holdings Inc., senior secured note, 144A, 4.875%, 2/01/27 | | | United States | | | | 700,000 | | | | 685,454 | |
| | | | | | | | | | | | | | |
| | | | |
| | | | | | | | | | | | | 3,289,909 | |
| | | | | | | | | | | | | | |
FRANKLIN TEMPLETON VARIABLE INSURANCE PRODUCTS TRUST
CONSOLIDATED STATEMENT OF INVESTMENTS (UNAUDITED)
Franklin Strategic Income VIP Fund (continued)
| | | | | | | | | | | | | | |
| | | | | Country/
Organization | | | Principal
Amount* | | | Value | |
| | Corporate Bonds (continued) | | | | | | | | | | | | |
| | Telecommunication Services 2.2% | | | | | | | | | | | | |
| e | | Altice France Holding SA, senior note, 144A, 6.00%, 2/15/28 | | | Luxembourg | | | | 700,000 | | | $ | 665,879 | |
| e | | Altice France SA/France, senior secured note, 144A, 5.50%, 1/15/28 | | | France | | | | 200,000 | | | | 202,338 | |
| | AT&T Inc., | | | | | | | | | | | | |
| | senior Bond, 4.30%, 2/15/30 | | | United States | | | | 1,300,000 | | | | 1,519,998 | |
| | senior note, 2.30%, 6/01/27 | | | United States | | | | 300,000 | | | | 310,220 | |
| | Bell Canada Inc., senior bond, 4.464%, 4/01/48 | | | Canada | | | | 150,000 | | | | 190,354 | |
| e,f | | Digicel Group 0.5 Ltd., senior note, 144A, PIK, 8.00%, 4/01/25 | | | Jamaica | | | | 155,520 | | | | 42,768 | |
| | Hughes Satellite Systems Corp., senior bond, 6.625%, 8/01/26 | | | United States | | | | 800,000 | | | | 833,152 | |
| | Sprint Communications Inc., senior note, 6.00%, 11/15/22 | | | United States | | | | 405,000 | | | | 427,727 | |
| | Sprint Corp., senior bond, 7.875%, 9/15/23 | | | United States | | | | 405,000 | | | | 456,635 | |
| | Telefonica Emisiones SA, | | | | | | | | | | | | |
| | senior bond, 4.895%, 3/06/48 | | | Spain | | | | 150,000 | | | | 182,633 | |
| | senior note, 4.103%, 3/08/27 | | | Spain | | | | 500,000 | | | | 571,202 | |
| | TELUS Corp., senior bond, 4.60%, 11/16/48 | | | Canada | | | | 150,000 | | | | 183,481 | |
| | T-Mobile USA Inc., | | | | | | | | | | | | |
| | senior bond, 6.50%, 1/15/24 | | | United States | | | | 405,000 | | | | 415,050 | |
| | senior bond, 6.375%, 3/01/25 | | | United States | | | | 1,051,000 | | | | 1,080,953 | |
| | senior note, 6.00%, 4/15/24 | | | United States | | | | 200,000 | | | | 204,963 | |
| e | | senior secured bond, 144A, 3.875%, 4/15/30 | | | United States | | | | 1,300,000 | | | | 1,451,378 | |
| | | | | | | | | | | | | | |
| | | | |
| | | | | | | | | | | | | 8,738,731 | |
| | | | | | | | | | | | | | |
| | Transportation 3.0% | | | | | | | | | | | | |
| | Burlington Northern Santa Fe LLC, senior bond, 4.15%, 4/01/45 | | | United States | | | | 400,000 | | | | 496,835 | |
| | CSX Corp., senior bond, 4.10%, 3/15/44 | | | United States | | | | 150,000 | | | | 183,459 | |
| e | | DAE Funding LLC, senior note, 144A, 5.00%, 8/01/24 | | | United Arab Emirates | | | | 1,294,000 | | | | 1,217,156 | |
| | FedEx Corp., | | | | | | | | | | | | |
| | senior bond, 4.05%, 2/15/48 | | | United States | | | | 150,000 | | | | 154,352 | |
| | senior note, 3.80%, 5/15/25 | | | United States | | | | 1,400,000 | | | | 1,557,935 | |
| g | | ICTSI Treasury BV, senior note, Reg S, 4.625%, 1/16/23 | | | Philippines | | | | 1,200,000 | | | | 1,244,718 | |
| e | | Kazakhstan Temir Zholy Finance BV, senior bond, 144A, 6.95%, 7/10/42 | | | Kazakhstan | | | | 1,700,000 | | | | 2,265,590 | |
| e | | Mexico City Airport Trust, senior secured bond, first lien, 144A, 5.50%, 7/31/47 | | | Mexico | | | | 1,200,000 | | | | 1,059,690 | |
| g,j | | RZD Capital PLC, (Russian Railways), loan participation, senior bond, Reg S, 5.70%, 4/05/22 | | | Russia | | | | 1,700,000 | | | | 1,807,734 | |
| | United Parcel Service Inc., senior bond, 5.30%, 4/01/50 | | | United States | | | | 1,300,000 | | | | 1,865,342 | |
| | | | | | | | | | | | | | |
| | | | |
| | | | | | | | | | | | | 11,852,811 | |
| | | | | | | | | | | | | | |
| | Utilities 4.8% | | | | | | | | | | | | |
| | Calpine Corp., | | | | | | | | | | | | |
| | senior bond, 5.75%, 1/15/25 | | | United States | | | | 1,170,000 | | | | 1,185,110 | |
| | e senior note, 144A, 5.125%, 3/15/28 | | | United States | | | | 200,000 | | | | 195,925 | |
| g | | CGNPC International Ltd., senior note, Reg S, 3.75%, 12/11/27 | | | China | | | | 300,000 | | | | 330,569 | |
| | Clearway Energy Operating LLC, senior note, 5.75%, 10/15/25 | | | United States | | | | 1,132,000 | | | | 1,178,418 | |
| e | | Colbun SA, | | | | | | | | | | | | |
| | senior note, 144A, 3.95%, 10/11/27 | | | Chile | | | | 800,000 | | | | 861,884 | |
| | senior note, 144A, 3.15%, 3/06/30 | | | Chile | | | | 300,000 | | | | 303,900 | |
FRANKLIN TEMPLETON VARIABLE INSURANCE PRODUCTS TRUST
CONSOLIDATED STATEMENT OF INVESTMENTS (UNAUDITED)
Franklin Strategic Income VIP Fund (continued)
| | | | | | | | | | | | | | |
| | | | | Country/
Organization | | | Principal
Amount* | | | Value | |
| | Corporate Bonds (continued) | | | | | | | | | | | | |
| | Utilities (continued) | | | | | | | | | | | | |
| | Dominion Energy Inc., senior note, 3.375%, 4/01/30 | | | United States | | | | 1,300,000 | | | $ | 1,441,050 | |
| | Duke Energy Corp., senior note, 2.45%, 6/01/30 | | | United States | | | | 400,000 | | | | 422,354 | |
| e,h | | EDF SA, junior sub. note, 144A, 5.25% to 1/29/23, FRN thereafter, Perpetual | | | France | | | | 2,425,000 | | | | 2,480,751 | |
| | Exelon Corp., senior bond, 4.05%, 4/15/30 | | | United States | | | | 1,300,000 | | | | 1,503,785 | |
| e | | InterGen NV, secured bond, 144A, 7.00%, 6/30/23 | | | Netherlands | | | | 700,000 | | | | 675,500 | |
| e | | Israel Electric Corp. Ltd., secured bond, 144A, 4.25%, 8/14/28 | | | Israel | | | | 1,000,000 | | | | 1,134,400 | |
| | Piedmont Natural Gas Co. Inc., senior bond, 3.35%, 6/01/50 | | | United States | | | | 300,000 | | | | 328,783 | |
| | The Southern Co., senior bond, 3.25%, 7/01/26 | | | United States | | | | 2,410,000 | | | | 2,672,847 | |
| e | | State Grid Overseas Investment 2016 Ltd., senior note, 144A, 3.50%, 5/04/27 | | | China | | | | 1,651,000 | | | | 1,828,301 | |
| e | | Talen Energy Supply LLC, senior secured note, 144A, 7.25%, 5/15/27 | | | United States | | | | 1,300,000 | | | | 1,295,697 | |
| e | | Three Gorges Finance I Cayman Islands Ltd., senior note, 144A, 3.15%, 6/02/26 | | | China | | | | 1,051,000 | | | | 1,137,844 | |
| | Virginia Electric and Power Co., senior bond, 6.35%, 11/30/37 | | | United States | | | | 85,000 | | | | 123,799 | |
| | | | | | | | | | | | | | |
| | | | |
| | | | | | | | | | | | | 19,100,917 | |
| | | | | | | | | | | | | | |
| | Total Corporate Bonds (Cost $176,493,968) | | | | | | | | | | | 175,938,277 | |
| | | | | | | | | | | | | | |
| | | | |
| k,l | | Senior Floating Rate Interests 5.2% | | | | | | | | | | | | |
| | Automobiles & Components 0.6% | | | | | | | | | | | | |
| | Adient US LLC, | | | | | | | | | | | | |
| | Initial Term Loans, 4.178%, (1-month USD LIBOR + 4.00%), 5/06/24 | | | United States | | | | 865,800 | | | | 835,930 | |
| | Initial Term Loans, 4.474%, (3-month USD LIBOR + 4.00%), 5/06/24 | | | United States | | | | 292,500 | | | | 282,409 | |
| | Thor Industries Inc., Initial USD Term Loans, 3.94%, (1-month USD LIBOR + 3.75%), 2/01/26 | | | United States | | | | 1,238,727 | | | | 1,219,179 | |
| | | | | | | | | | | | | | |
| | | | |
| | | | | | | | | | | | | 2,337,518 | |
| | | | | | | | | | | | | | |
| | Capital Goods 0.1% | | | | | | | | | | | | |
| | f Alloy Finco Ltd., Term Loan B, PIK, 14.00%, 3/06/25 | | | United States | | | | 162,595 | | | | 70,729 | |
| | Altra Industrial Motion Corp., Term Loan, 2.178%, (1-month USD LIBOR + 2.00%), 10/01/25 | | | United States | | | | 272,770 | | | | 260,496 | |
| aa | | Onsite Rental Group Operations Pty. Ltd., Term B Loan, 5.50%, (1-month USD LIBOR + 4.50%), 10/25/22 | | | Australia | | | | 192,010 | | | | 161,048 | |
| | | | | | | | | | | | | | |
| | | | |
| | | | | | | | | | | | | 492,273 | |
| | | | | | | | | | | | | | |
| | Commercial & Professional Services 0.1% | | | | | | | | | | | | |
| | Prime Security Services Borrower, LLC, | | | | | | | | | | | | |
| | Term B-1 Facility, 4.25%, (1-month USD LIBOR + 3.25%), 9/12/26 | | | United States | | | | 43,677 | | | | 42,094 | |
| | Term B-1 Facility, 4.25%, (1-year USD LIBOR + 3.25%), 9/12/26 | | | United States | | | | 40,193 | | | | 38,736 | |
| | Term B-1 Facility, 4.25%, (3-month USD LIBOR + 3.25%), 9/12/26 | | | United States | | | | 20,096 | | | | 19,367 | |
| | Term B-1 Facility, 4.25%, (6-month USD LIBOR + 3.25%), 9/12/26 | | | United States | | | | 20,096 | | | | 19,367 | |
FRANKLIN TEMPLETON VARIABLE INSURANCE PRODUCTS TRUST
CONSOLIDATED STATEMENT OF INVESTMENTS (UNAUDITED)
Franklin Strategic Income VIP Fund (continued)
| | | | | | | | | | | | | | |
| | | | | Country/
Organization | | | Principal
Amount* | | | Value | |
| k,l | | Senior Floating Rate Interests (continued) | | | | | | | | | | | | |
| | Commercial & Professional Services (continued) | | | | | | | | | | | | |
| | Harsco Corp., Term Loan B-2, 3.25%, (1-month USD LIBOR + 2.25%), 12/10/24 | | | United States | | | | 110,062 | | | $ | 108,136 | |
| | Pitney Bowes Inc., Incremental Tranche Term B Loans, 5.68%, (1-month USD LIBOR + 5.50%), 1/07/25 | | | United States | | | | 227,125 | | | | 191,921 | |
| m | | Ventia Pty. Ltd., Term B Loans, 5.00%, (3-month USD LIBOR + 4.00%), 5/21/26 | | | Australia | | | | 157,500 | | | | 154,350 | |
| | | | | | | | | | | | | | |
| | | | |
| | | | | | | | | | | | | 573,971 | |
| | | | | | | | | | | | | | |
| | Consumer Durables & Apparel 0.0%† | | | | | | | | | | | | |
| | Playtika Holding Corp., Term B Loans, 7.072%, (3-month USD LIBOR + 6.00%), 12/10/24 | | | United States | | | | 78,000 | | | | 78,146 | |
| | | | | | | | | | | | | | |
| | Consumer Services 0.5% | | | | | | | | | | | | |
| | Aristocrat Technologies Inc., Term B-3 Loans, 2.859%, (3-month USD LIBOR + 1.75%), 10/19/24 | | | United States | | | | 775,372 | | | | 739,511 | |
| | Caesars Resort Collection LLC, | | | | | | | | | | | | |
| | Term B Loans, 2.928%, (1-month USD LIBOR + 2.75%), 12/22/24 | | | United States | | | | 348,214 | | | | 312,039 | |
| | m,n Term Loan, TBD, 6/19/25 | | | United States | | | | 23,499 | | | | 21,992 | |
| | Eldorado Resorts Inc., Initial Term Loan, 3.25%, (3-month USD LIBOR + 2.25%), 4/17/24 | | | United States | | | | 176,290 | | | | 175,602 | |
| | NASCAR Holdings Inc., Initial Term Loans, 2.93%, (1-month USD LIBOR + 2.75%), 10/18/26 | | | United States | | | | 598,411 | | | | 576,269 | |
| | | | | | | | | | | | | | |
| | | | |
| | | | | | | | | | | | | 1,825,413 | |
| | | | | | | | | | | | | | |
| | Diversified Financials 0.2% | | | | | | | | | | | | |
| | Russell Investments U.S. Institutional Holdco Inc., Term Loan B, 3.822%, (3-month USD LIBOR + 2.75%), 6/01/23 | | | United States | | | | 1,036,127 | | | | 1,009,792 | |
| | | | | | | | | | | | | | |
| | Energy 0.2% | | | | | | | | | | | | |
| o | | Fieldwood Energy LLC, Closing Date Loans, 6.25%, (3-month USD LIBOR + 5.25%), 4/11/22 | | | United States | | | | 2,507,941 | | | | 509,947 | |
| | Utex Industries Inc., | | | | | | | | | | | | |
| | Initial Term Loan (First Lien), 5.311%, (3-month USD LIBOR + 4.00%), 5/21/21 | | | United States | | | | 514,307 | | | | 147,863 | |
| | Second Lien Initial Term Loan, 8.561%, (3-month USD LIBOR + 7.25%), 5/20/22 | | | United States | | | | 53,878 | | | | 7,364 | |
| | | | | | | | | | | | | | |
| | | | |
| | | | | | | | | | | | | 665,174 | |
| | | | | | | | | | | | | | |
| | Food, Beverage & Tobacco 0.2% | | | | | | | | | | | | |
| | B&G Foods Inc., Tranche B-4 Term Loan, 2.678%, (1-month USD LIBOR + 2.50%), 10/10/26 | | | United States | | | | 289,479 | | | | 286,494 | |
| | CSM Bakery Supplies LLC, 2nd Lien Term, 11.00%, (3-month USD LIBOR + 10.00%), 2/04/22 | | | United States | | | | 478,111 | | | | 390,856 | |
| | JBS USA Lux SA, New Term Loans, 3.072%, (3-month USD LIBOR + 2.00%), 5/01/26 | | | United States | | | | 207,984 | | | | 199,404 | |
| | | | | | | | | | | | | | |
| | | | |
| | | | | | | | | | | | | 876,754 | |
| | | | | | | | | | | | | | |
| | Health Care Equipment & Services 0.1% | | | | | | | | | | | | |
| | Catalent Pharma Solutions Inc., Dollar Term B-2 Loan, 3.25%, (1-month USD LIBOR + 2.25%), 5/17/26 | | | United States | | | | 596,977 | | | | 591,008 | |
| | | | | | | | | | | | | | |
FRANKLIN TEMPLETON VARIABLE INSURANCE PRODUCTS TRUST
CONSOLIDATED STATEMENT OF INVESTMENTS (UNAUDITED)
Franklin Strategic Income VIP Fund (continued)
| | | | | | | | | | | | | | |
| | | | | Country/
Organization | | | Principal
Amount* | | | Value | |
| k,l | | Senior Floating Rate Interests (continued) | | | | | | | | | | | | |
| | Household & Personal Products 0.6% | | | | | | | | | | | | |
| aa | | FGI Operating Co. LLC (Freedom Group), | | | | | | | | | | | | |
| f | | Term Loan, PIK, 12.00%, (3-month USD LIBOR + 10.00%), 5/15/22 | | | United States | | | | 851,786 | | | $ | 658,178 | |
| | Term Loan FILO, 9.50%, (3-month USD LIBOR + 7.50%), 5/15/21 | | | United States | | | | 1,616,351 | | | | 1,615,501 | |
| | | | | | | | | | | | | | |
| | | | |
| | | | | | | | | | | | | 2,273,679 | |
| | | | | | | | | | | | | | |
| | Insurance 0.1% | | | | | | | | | | | | |
| | Alliant Holdings Intermediate LLC/Alliant Holdings Co-Issuer, Initial Term Loan, 2.928%, (1-month USD LIBOR + 2.75%), 5/10/25 | | | United States | | | | 274,131 | | | | 260,424 | |
| | | | | | | | | | | | | | |
| | Materials 0.2% | | | | | | | | | | | | |
| | Appvion Operations Inc., Term Loan, 7.00%, (3-month USD LIBOR + 6.00%), 6/15/26 | | | United States | | | | 272,000 | | | | 266,560 | |
| | Axalta Coating Systems U.S. Holdings Inc., Term B-3 Dollar Loan, 2.058%, (3-month USD LIBOR + 1.75%), 6/01/24 | | | United States | | | | 233,140 | | | | 224,299 | |
| | Mauser Packaging Solutions Holding Co., Initial Term Loan, 4.561%, (1-month USD LIBOR + 3.25%), 4/03/24 | | | United States | | | | 149,614 | | | | 135,102 | |
| | | | | | | | | | | | | | |
| | | | |
| | | | | | | | | | | | | 625,961 | |
| | | | | | | | | | | | | | |
| | Media & Entertainment 1.0% | | | | | | | | | | | | |
| | Charter Communications Operating LLC, Term A-2 Loan, 1.68%, (1-month USD LIBOR + 1.50%), 3/31/23 | | | United States | | | | 821,994 | | | | 813,774 | |
| | CSC Holdings LLC, March 2017 Incremental Term Loans, 2.435%, (1-month USD LIBOR + 2.25%), 7/17/25 | | | United States | | | | 1,197,173 | | | | 1,138,512 | |
| | Diamond Sports Group LLC, Term Loan, 3.43%, (1-month USD LIBOR + 3.25%), 8/24/26 | | | United States | | | | 451,700 | | | | 369,830 | |
| | Gray Television Inc., | | | | | | | | | | | | |
| | Term B-2 Loan, 2.423%, (1-month USD LIBOR + 2.25%), 2/07/24 | | | United States | | | | 843,033 | | | | 815,634 | |
| | Term C Loan, 2.673%, (1-month USD LIBOR + 2.50%), 1/02/26 | | | United States | | | | 536,353 | | | | 520,262 | |
| | Mediacom Illinois LLC, Tranche N Term Loan, 1.86%, (1-week USD LIBOR + 1.75%), 2/15/24 | | | United States | | | | 303,696 | | | | 297,622 | |
| | | | | | | | | | | | | | |
| | | | |
| | | | | | | | | | | | | 3,955,634 | |
| | | | | | | | | | | | | | |
| | Pharmaceuticals, Biotechnology & Life Sciences 0.0%† | | | | | | | | | | | | |
| e | | Research Technology Inc., Initial Term Loan, 5.50%, (1-month USD LIBOR + 4.50%), 2/04/27 | | | United States | | | | 58,182 | | | | 57,309 | |
| | | | | | | | | | | | | | |
| | Real Estate 0.0%† | | | | | | | | | | | | |
| | Cushman & Wakefield U.S. Borrower LLC, Replacement Term Loan, 2.928%, (1-month USD LIBOR + 2.75%), 8/21/25 | | | United States | | | | 99,497 | | | | 94,149 | |
| | | | | | | | | | | | | | |
| | Retailing 0.1% | | | | | | | | | | | | |
| o | | General Nutrition Centers Inc., Tranche B-2 Term Loans, 9.50%, (2-month USD LIBOR + 8.75%), 3/04/21 | | | United States | | | | 512,850 | | | | 374,381 | |
| | Harbor Freight Tools USA Inc., Refinancing Loans, 3.25%, (1-month USD LIBOR + 2.50%), 8/19/23 | | | United States | | | | 198,979 | | | | 192,064 | |
| | | | | | | | | | | | | | |
| | | | |
| | | | | | | | | | | | | 566,445 | |
| | | | | | | | | | | | | | |
| | Semiconductors & Semiconductor Equipment 0.3% | | | | | | | | | | | | |
| | ON Semiconductor Corp., 2019 Replacement Term B-4 Loans, 2.178%, (1-month USD LIBOR + 2.00%), 9/18/26 | | | United States | | | | 1,131,407 | | | | 1,089,451 | |
| | | | | | | | | | | | | | |
FRANKLIN TEMPLETON VARIABLE INSURANCE PRODUCTS TRUST
CONSOLIDATED STATEMENT OF INVESTMENTS (UNAUDITED)
Franklin Strategic Income VIP Fund (continued)
| | | | | | | | | | | | | | | | | | |
| | | | | Country/
Organization | | | Principal
Amount* | | | | | | Value | |
| k,l | | Senior Floating Rate Interests (continued) | | | | | | | | | | | | | | | | |
| | Software & Services 0.2% | | | | | | | | | | | | | | | | |
| m,n | | Cardtronics USA Inc., Initial Term Loan, TBD, 6/29/27 | | | United Kingdom | | | | 120,924 | | | | | | | $ | 119,714 | |
| | WEX Inc., Term B-3 Loan, 2.428%, (1-month USD LIBOR + 2.25%), 5/17/26 | | | United States | | | | 636,903 | | | | | | | | 611,427 | |
| | | | | | | | | | | | | | | | | | |
| | | | | | | | | | | | | | | | | 731,141 | |
| | | | | | | | | | | | | | | | | | |
| | Telecommunication Services 0.3% | | | | | | | | | | | | | | | | |
| | Aventiv Technologies LLC, | | | | | | | | | | | | | | | | |
| | Initial Term Loan, 5.50%, (3-month USD LIBOR + 4.50%), 11/01/24 | | | United States | | | | 246,835 | | | | | | | | 206,146 | |
| | Second Lien Initial Loan, 9.25%, (3-month USD LIBOR + 8.25%), 11/01/25 | | | United States | | | | 597,127 | | | | | | | | 373,205 | |
| | Global Tel*Link Corp., | | | | | | | | | | | | | | | | |
| | First Lien Term Loan, 4.428%, (1-month USD LIBOR + 4.25%), 11/29/25 | | | United States | | | | 394,735 | | | | | | | | 344,283 | |
| | Second Lien Term Loan, 8.428%, (1-month USD LIBOR + 8.25%), 11/29/26 | | | United States | | | | 183,038 | | | | | | | | 140,481 | |
| | | | | | | | | | | | | | | | | | |
| | | | | | | | | | | | | | | | | 1,064,115 | |
| | | | | | | | | | | | | | | | | | |
| | Transportation 0.2% | | | | | | | | | | | | | | | | |
| | Avis Budget Car Rental LLC, Tranche B Term, 2.43%, (1-month USD LIBOR + 2.25%), 8/06/27 | | | United States | | | | 720,159 | | | | | | | | 643,942 | |
| | JetBlue Airways Corporation, Term Loan, 6.25%, (3-month USD LIBOR + 5.25%), 6/16/24 | | | United States | | | | 35,548 | | | | | | | | 34,911 | |
| | | | | | | | | | | | | | | | | | |
| | | | | | | | | | | | | | | | | 678,853 | |
| | | | | | | | | | | | | | | | | | |
| | Utilities 0.2% | | | | | | | | | | | | | | | | |
| | EFS Cogen Holdings I LLC (Linden), | | | | | | | | | | | | | | | | |
| | Term B Advance, 4.25%, (1-month USD LIBOR + 3.25%), 6/28/23 | | | United States | | | | 261,216 | | | | | | | | 253,706 | |
| | Term B Advance, 4.25%, (3-month USD LIBOR + 3.25%), 6/28/23 | | | United States | | | | 615,499 | | | | | | | | 597,803 | |
| | | | | | | | | | | | | | | | | | |
| | | | | | | | | | | | | | | | | 851,509 | |
| | | | | | | | | | | | | | | | | | |
| | Total Senior Floating Rate Interests (Cost $24,844,980) | | | | | | | | | | | | | | | 20,698,719 | |
| | | | | | | | | | | | | | | | | | |
| | Marketplace Loans (Cost $1,062,845) 0.2% | | | | | | | | | | | | | | | | |
| | Diversified Financials 0.2% | | | | | | | | | | | | | | | | |
| aa,p | | Lending Club, 6.46% - 25.65%, 8/22/22 - 2/28/25 | | | United States | | | | 1,104,592 | | | | | | | | 964,121 | |
| | | | | | | | | | | | | | | | | | |
| | Foreign Government and Agency Securities 12.4% | | | | | | | | | | | | | | | | |
| e | | The African Export-Import Bank, senior bond, 144A, 3.994%, 9/21/29 | | | Supranationalq | | | | 1,600,000 | | | | | | | | 1,582,872 | |
| e | | Angolan Government International Bond, senior note, 144A, 8.25%, 5/09/28 | | | Angola | | | | 2,900,000 | | | | | | | | 2,400,611 | |
| g | | Banque Centrale de Tunisie International Bond, senior note, Reg S, 5.625%, 2/17/24 | | | Tunisia | | | | 2,400,000 | | | | EUR | | | | 2,487,828 | |
| e | | Banque Ouest Africaine de Developpement, senior note, 144A, 5.00%, 7/27/27 | | | Supranationalq | | | | 1,600,000 | | | | | | | | 1,673,360 | |
| e | | Dominican Republic, senior note, 144A, 8.90%, 2/15/23 | | | Dominican Republic | | | | 81,500,000 | | | | DOP | | | | 1,303,363 | |
| e | | The Export-Import Bank of India, senior note, 144A, 3.875%, 2/01/28 | | | India | | | | 1,655,000 | | | | | | | | 1,721,727 | |
FRANKLIN TEMPLETON VARIABLE INSURANCE PRODUCTS TRUST
CONSOLIDATED STATEMENT OF INVESTMENTS (UNAUDITED)
Franklin Strategic Income VIP Fund (continued)
| | | | | | | | | | | | | | |
| | | | | Country/
Organization | | Principal
Amount* | | | | | Value | |
| | Foreign Government and Agency Securities (continued) | | | | | | | | | | | | |
| e | | Government of Belarus International Bond, | | | | | | | | | | | | |
| | senior bond, 144A, 6.20%, 2/28/30 | | Belarus | | | 1,200,000 | | | | | $ | 1,150,584 | |
| | senior note, 144A, 7.625%, 6/29/27 | | Belarus | | | 1,200,000 | | | | | | 1,241,130 | |
| | Government of Colombia, | | | | | | | | | | | | |
| | senior bond, 3.875%, 4/25/27 | | Colombia | | | 1,400,000 | | | | | | 1,481,998 | |
| | senior bond, 9.85%, 6/28/27 | | Colombia | | | 5,315,000,000 | | | COP | | | 1,787,653 | |
| | senior bond, 4.50%, 3/15/29 | | Colombia | | | 500,000 | | | | | | 550,060 | |
| | senior bond, 5.00%, 6/15/45 | | Colombia | | | 1,900,000 | | | | | | 2,140,910 | |
| e | | Government of Gabon, | | | | | | | | | | | | |
| | 144A, 6.375%, 12/12/24 | | Gabon | | | 1,037,538 | | | | | | 988,748 | |
| | senior note, 144A, 6.625%, 2/06/31 | | Gabon | | | 1,600,000 | | | | | | 1,433,546 | |
| | Government of Indonesia, | | | | | | | | | | | | |
| e | | senior bond, 144A, 4.35%, 1/08/27 | | Indonesia | | | 900,000 | | | | | | 1,001,835 | |
| | senior bond, FR64, 6.125%, 5/15/28 | | Indonesia | | | 26,500,000,000 | | | IDR | | | 1,745,783 | |
| | senior bond, FR70, 8.375%, 3/15/24 | | Indonesia | | | 19,648,000,000 | | | IDR | | | 1,468,604 | |
| e | | Government of Iraq, 144A, 5.80%, 1/15/28 | | Iraq | | | 2,700,000 | | | | | | 2,439,990 | |
| e | | Government of Kazakhstan, senior bond, 144A, 4.875%, 10/14/44 | | Kazakhstan | | | 1,800,000 | | | | | | 2,292,343 | |
| | Government of Mexico, | | | | | | | | | | | | |
| | senior bond, M, 6.50%, 6/10/21 | | Mexico | | | 293,000 | r | | MXN | | | 1,295,915 | |
| | senior note, 4.15%, 3/28/27 | | Mexico | | | 3,200,000 | | | | | | 3,430,000 | |
| | Government of Peru, senior bond, 6.55%, 3/14/37 | | Peru | | | 1,000,000 | | | | | | 1,525,555 | |
| | Government of Russia, | | | | | | | | | | | | |
| g | | Reg S, 4.75%, 5/27/26 | | Russia | | | 1,200,000 | | | | | | 1,369,502 | |
| | e senior note, 144A, 4.875%, 9/16/23 | | Russia | | | 800,000 | | | | | | 889,500 | |
| | Government of South Africa, senior bond, 7.00%, 2/28/31 | | South Africa | | | 36,100,000 | | | ZAR | | | 1,712,765 | |
| | e Government of Ukraine, | | | | | | | | | | | | |
| | 144A, 7.75%, 9/01/22 | | Ukraine | | | 200,000 | | | | | | 208,901 | |
| | 144A, 7.75%, 9/01/23 | | Ukraine | | | 369,000 | | | | | | 387,975 | |
| | 144A, 7.75%, 9/01/24 | | Ukraine | | | 369,000 | | | | | | 386,048 | |
| | a,s 144A, VRI, GDP Linked Security, 5/31/40 | | Ukraine | | | 978,000 | | | | | | 908,051 | |
| | senior bond, 144A, 7.375%, 9/25/32 | | Ukraine | | | 500,000 | | | | | | 503,868 | |
| | Government of Uruguay, | | | | | | | | | | | | |
| | senior bond, 4.375%, 1/23/31 | | Uruguay | | | 800,000 | | | | | | 937,260 | |
| | t senior bond, Index Linked, 4.375%, 12/15/28 | | Uruguay | | | 5,036,655 | | | UYU | | | 126,470 | |
| | t senior bond, Index Linked, 3.70%, 6/26/37 | | Uruguay | | | 84,059,266 | | | UYU | | | 2,001,356 | |
| e | | Indonesia Government International Bond, senior note, 144A, 3.85%, 7/18/27 | | Indonesia | | | 2,200,000 | | | | | | 2,387,458 | |
| e | | Panama Notas del Tesoro, senior note, 144A, 3.75%, 4/17/26 | | Panama | | | 800,000 | | | | | | 838,372 | |
| | | | | | | | | | | | | | |
| | Total Foreign Government and Agency Securities
(Cost $51,874,540) | | | | | | | | | | | 49,801,941 | |
| | | | | | | | | | | | | | |
FRANKLIN TEMPLETON VARIABLE INSURANCE PRODUCTS TRUST
CONSOLIDATED STATEMENT OF INVESTMENTS (UNAUDITED)
Franklin Strategic Income VIP Fund (continued)
| | | | | | | | | | | | | | | | | | |
| | | | | Country/
Organization | | | Principal Amount* | | | | | | Value | |
| | U.S. Government and Agency Securities 3.2% | |
| | U.S. Treasury Bond, 7.875%, 2/15/21 | | | United States | | | | 728,000 | | | | | | | $ | 762,907 | |
| | U.S. Treasury Note, | | | | | | | | | | | | | | | | |
| | 1.50%, 11/30/21 | | | United States | | | | 3,000,000 | | | | | | | | 3,056,777 | |
| | t Index Linked, 0.125%, 7/15/24 | | | United States | | | | 3,872,739 | | | | | | | | 4,050,199 | |
| | t Index Linked, 0.375%, 7/15/25 | | | United States | | | | 4,541,869 | | | | | | | | 4,857,423 | |
| | | | | | | | | | | | | | | | | | |
| | | | | |
| | Total U.S. Government and Agency Securities
(Cost $12,130,746) | | | | | | | | | | | | | | | 12,727,306 | |
| | | | | | | | | | | | | | | | | | |
| | Asset-Backed Securities and Commercial
Mortgage-Backed Securities 20.6% | |
| | Banks 0.2% | |
| u | | Commercial Mortgage Trust, 2006-GG7, AJ, FRN, 5.807%, 7/10/38 | | | United States | | | | 392,168 | | | | | | | | 323,538 | |
| u | | CWABS Asset-Backed Certificates Trust, 2005-11, AF4, FRN, 5.21%, 3/25/34 | | | United States | | | | 384,392 | | | | | | | | 387,442 | |
| v | | Merrill Lynch Mortgage Investors Trust, 2005-A6, 2A3, FRN, 0.565%, (1-month USD LIBOR + 0.38%), 8/25/35 | | | United States | | | | 35,563 | | | | | | | | 35,479 | |
| | | | | | | | | | | | | | | | | | |
| | | | | | | | | | | | | | | | | 746,459 | |
| | | | | | | | | | | | | | | | | | |
| | Diversified Financials 20.4% | |
| e,v | | AMMC CLO XI Ltd., 2012-11A, BR2, 144A, FRN, 2.36%, (3-month USD LIBOR + 1.60%), 4/30/31 | | | United States | | | | 350,000 | | | | | | | | 332,473 | |
| e,v | | Antares CLO Ltd., 2018-1A, B, 144A, FRN, 2.785%, (3-month USD LIBOR + 1.65%), 4/20/31 | | | United States | | | | 1,455,000 | | | | | | | | 1,414,803 | |
| e,u | | ARES L CLO Ltd., 2018-50A, B, 144A, FRN, 2.919%, 1/15/32 | | | United States | | | | 500,000 | | | | | | | | 486,026 | |
| e,u | | ARES LII CLO Ltd., 2019-52A, A2, 144A, FRN, 2.748%, 4/22/31 | | | United States | | | | 250,000 | | | | | | | | 245,236 | |
| e,u | | BCC Middle Market CLO LLC, 2018-1A, A2, 144A, FRN, 3.285%, 10/20/30 | | | United States | | | | 700,000 | | | | | | | | 649,617 | |
| e,u | | BlueMountain CLO Ltd., | | | | | | | | | | | | | | | | |
| | 2012-2A, BR2, 144A, FRN, 1.827%, 11/20/28 | | | United States | | | | 510,000 | | | | | | | | 487,367 | |
| | 2012-2A, CR2, 144A, FRN, 2.377%, 11/20/28 | | | United States | | | | 270,000 | | | | | | | | 253,574 | |
| | 2018-1A, D, 144A, FRN, 3.81%, 7/30/30 | | | United States | | | | 1,000,000 | | | | | | | | 873,371 | |
| e,u | | Bluemountain Fuji Eur CLO V DAC, 5A, A, 144A, FRN, 0.91%, 1/15/33 | | | Ireland | | | | 1,900,000 | | | | EUR | | | | 2,073,866 | |
| e,u | | BlueMountain Fuji Eur CLO V DAC, 5A, B, 144A, FRN, 1.55%, 1/15/33 | | | Ireland | | | | 600,000 | | | | EUR | | | | 647,373 | |
| e | | BRAVO Residential Funding Trust, | | | | | | | | | | | | | | | | |
| | 2019-1, A1C, 144A, 3.50%, 3/25/58 | | | United States | | | | 782,519 | | | | | | | | 808,620 | |
| | u2019-2, A3, 144A, FRN, 3.50%, 10/25/44 | | | United States | | | | 922,424 | | | | | | | | 969,776 | |
| e,u | | Burnham Park CLO Ltd., 2016-1A, BR, 144A, FRN, 2.635%, 10/20/29 | | | United States | | | | 460,000 | | | | | | | | 443,782 | |
| e,u | | Buttermilk Park CLO Ltd., 2018-1A, C, 144A, FRN, 3.319%, 10/15/31 | | | United States | | | | 1,408,860 | | | | | | | | 1,348,736 | |
| e,v | | Carlyle Global Market Strategies CLO Ltd., 2014-4RA, C, 144A, FRN, 4.119%, (3-month USD LIBOR + 2.90%), 7/15/30 | | | United States | | | | 300,000 | | | | | | | | 257,322 | |
| e,u | | Carlyle GMS Finance MM CLO LLC, 2015-1A, A2R, 144A, FRN, 3.419%, 10/15/31 | | | United States | | | | 1,213,000 | �� | | | | | | | 1,116,654 | |
| e,v | | Catamaran CLO Ltd., 2014-2A, BR, 144A, FRN, 4.085%, (3-month | | | | | | | | | | | | | | | | |
| | USD LIBOR + 2.95%), 10/18/26 | | | United States | | | | 1,253,000 | | | | | | | | 1,248,059 | |
| e,u | | CIM Trust, | | | | | | | | | | | | | | | | |
| | 2019-INV1, A1, 144A, FRN, 3.845%, 2/25/49 | | | United States | | | | 930,220 | | | | | | | | 961,163 | |
| | 2019-INV2, A3, 144A, FRN, 4.00%, 5/25/49 | | | United States | | | | 1,336,203 | | | | | | | | 1,381,531 | |
FRANKLIN TEMPLETON VARIABLE INSURANCE PRODUCTS TRUST
CONSOLIDATED STATEMENT OF INVESTMENTS (UNAUDITED)
Franklin Strategic Income VIP Fund (continued)
| | | | | | | | | | | | | | |
| | | | | Country/
Organization | | | Principal Amount* | | | Value | |
| | Asset-Backed Securities and Commercial
Mortgage-Backed Securities (continued) | |
| | Diversified Financials (continued) | |
| u | | Citibank Credit Card Issuance Trust, 2017-A7, A7, FRN, 0.545%, 8/08/24 | | | United States | | | | 1,494,000 | | | $ | 1,500,793 | |
| e,u | | Cole Park CLO Ltd., 2015-1A, BR, 144A, FRN, 2.735%, 10/20/28 | | | United States | | | | 270,000 | | | | 263,073 | |
| e,u | | Consumer Loan Underlying Bond CLUB Certificate Issuer Trust I, | | | | | | | | | | | | |
| | 2019-51, PT, 144A, FRN, 13.176%, 1/15/45 | | | United States | | | | 889,554 | | | | 741,353 | |
| | 2019-52, PT, 144A, FRN, 13.61%, 1/15/45 | | | United States | | | | 930,846 | | | | 785,772 | |
| | 2019-S8, PT, 144A, FRN, 7.955%, 1/15/45 | | | United States | | | | 666,198 | | | | 553,860 | |
| | 2020-2, PT, 144A, FRN, 13.87%, 3/15/45 | | | United States | | | | 907,272 | | | | 773,108 | |
| | 2020-7, PT, 144A, FRN, 14.48%, 4/17/45 | | | United States | | | | 547,371 | | | | 472,981 | |
| e,u | | Dryden 38 Senior Loan Fund, 2015-38A, CR, 144A, FRN, 3.219%, 7/15/30 | | | United States | | | | 863,000 | | | | 818,102 | |
| e,v | | Dryden 55 CLO Ltd., 2018-55A, D, 144A, FRN, 4.069%, (3-month USD LIBOR + 2.85%), 4/15/31 | | | United States | | | | 300,000 | | | | 265,058 | |
| e,u | | Eaton Vance CLO Ltd., 2014-1RA, C, 144A, FRN, 3.319%, 7/15/30 | | | United States | | | | 315,610 | | | | 302,459 | |
| | FHLMC Structured Agency Credit Risk Debt Notes, | | | | | | | | | | | | |
| | v 2013-DN2, M2, FRN, 4.435%, (1-month USD LIBOR + 4.25%), 11/25/23 | | | United States | | | | 1,581,221 | | | | 1,284,192 | |
| | v 2014-DN1, M2, FRN, 2.385%, (1-month USD LIBOR + 2.20%), 2/25/24 | | | United States | | | | 380,272 | | | | 381,574 | |
| | v 2014-DN2, M3, FRN, 3.785%, (1-month USD LIBOR + 3.60%), 4/25/24 | | | United States | | | | 2,290,000 | | | | 2,039,950 | |
| | v 2014-DN3, M3, FRN, 4.185%, (1-month USD LIBOR + 4.00%), 8/25/24 | | | United States | | | | 136,225 | | | | 139,350 | |
| | v 2014-DN4, M3, FRN, 4.735%, (1-month USD LIBOR + 4.55%), 10/25/24 | | | United States | | | | 999,309 | | | | 1,027,105 | |
| | v 2014-HQ1, M3, FRN, 4.285%, (1-month USD LIBOR + 4.10%), 8/25/24 | | | United States | | | | 233,594 | | | | 237,586 | |
| | v 2014-HQ2, M2, FRN, 2.385%, (1-month USD LIBOR + 2.20%), 9/25/24 | | | United States | | | | 293,488 | | | | 296,393 | |
| | v 2014-HQ3, M3, FRN, 4.935%, (1-month USD LIBOR + 4.75%), 10/25/24 | | | United States | | | | 456,423 | | | | 471,002 | |
| | v 2015-DNA1, M3, FRN, 3.485%, (1-month USD LIBOR + 3.30%), 10/25/27 | | | United States | | | | 250,000 | | | | 255,949 | |
| | v 2015-DNA3, M3, FRN, 4.885%, (1-month USD LIBOR + 4.70%), 4/25/28 | | | United States | | | | 1,819,000 | | | | 1,909,844 | |
| | v 2015-HQ1, M3, FRN, 3.985%, (1-month USD LIBOR + 3.80%), 3/25/25 | | | United States | | | | 399,927 | | | | 407,200 | |
| | v 2015-HQA1, M3, FRN, 4.885%, (1-month USD LIBOR + 4.70%), 3/25/28 | | | United States | | | | 1,492,671 | | | | 1,555,122 | |
| | v 2016-DNA2, M3, FRN, 4.835%, (1-month USD LIBOR + 4.65%), 10/25/28 | | | United States | | | | 1,266,774 | | | | 1,330,054 | |
| | u 2017-DNA1, M2, FRN, 3.435%, 7/25/29 | | | United States | | | | 990,000 | | | | 1,007,733 | |
| | u 2017-DNA2, M2, FRN, 3.635%, 10/25/29 | | | United States | | | | 1,340,000 | | | | 1,371,652 | |
| | v 2017-DNA3, M2, FRN, 2.685%, (1-month USD LIBOR + 2.50%), 3/25/30 | | | United States | | | | 2,920,000 | | | | 2,961,351 | |
| | u 2017-HQA1, M2, FRN, 3.735%, 8/25/29 | | | United States | | | | 1,022,463 | | | | 1,048,093 | |
| | u 2017-HQA2, M2, FRN, 2.835%, 12/25/29 | | | United States | | | | 245,443 | | | | 245,285 | |
FRANKLIN TEMPLETON VARIABLE INSURANCE PRODUCTS TRUST
CONSOLIDATED STATEMENT OF INVESTMENTS (UNAUDITED)
Franklin Strategic Income VIP Fund (continued)
| | | | | | | | | | | | | | |
| | | | | Country/
Organization | | | Principal Amount* | | | Value | |
| | Asset-Backed Securities and Commercial
Mortgage-Backed Securities (continued) | |
| | Diversified Financials (continued) | |
| | FNMA Connecticut Avenue Securities, | |
| | v 2013-C01, M2, FRN, 5.435%, (1-month USD LIBOR + 5.25%), 10/25/23 | | | United States | | | | 272,267 | | | $ | 249,438 | |
| | v 2014-C01, M2, FRN, 4.585%, (1-month USD LIBOR + 4.40%), 1/25/24 | | | United States | | | | 429,521 | | | | 384,216 | |
| | v 2014-C02, 1M2, FRN, 2.785%, (1-month USD LIBOR + 2.60%), 5/25/24 | | | United States | | | | 1,186,370 | | | | 1,047,868 | |
| | v 2014-C02, 2M2, FRN, 2.785%, (1-month USD LIBOR + 2.60%), 5/25/24 | | | United States | | | | 570,859 | | | | 508,500 | |
| | v 2014-C03, 1M2, FRN, 3.185%, (1-month USD LIBOR + 3.00%), 7/25/24 | | | United States | | | | 2,375,501 | | | | 2,101,246 | |
| | v 2014-C03, 2M2, FRN, 3.085%, (1-month USD LIBOR + 2.90%), 7/25/24 | | | United States | | | | 110,707 | | | | 102,451 | |
| | v 2015-C01, 1M2, FRN, 4.485%, (1-month USD LIBOR + 4.30%), 2/25/25 | | | United States | | | | 710,113 | | | | 721,856 | |
| | v 2015-C01, 2M2, FRN, 4.735%, (1-month USD LIBOR + 4.55%), 2/25/25 | | | United States | | | | 498,720 | | | | 501,998 | |
| | v 2015-C02, 1M2, FRN, 4.185%, (1-month USD LIBOR + 4.00%), 5/25/25 | | | United States | | | | 1,579,840 | | | | 1,608,524 | |
| | v 2015-C02, 2M2, FRN, 4.185%, (1-month USD LIBOR + 4.00%), 5/25/25 | | | United States | | | | 626,895 | | | | 637,418 | |
| | v 2015-C03, 1M2, FRN, 5.185%, (1-month USD LIBOR + 5.00%), 7/25/25 | | | United States | | | | 2,328,457 | | | | 2,396,308 | |
| | v 2015-C03, 2M2, FRN, 5.185%, (1-month USD LIBOR + 5.00%), 7/25/25 | | | United States | | | | 930,116 | | | | 957,071 | |
| | u 2016-C02, 1M2, FRN, 6.185%, 9/25/28 | | | United States | | | | 611,895 | | | | 639,286 | |
| | u 2016-C04, 1M2, FRN, 4.435%, 1/25/29 | | | United States | | | | 1,310,808 | | | | 1,367,990 | |
| | u 2016-C05, 2M2, FRN, 4.635%, 1/25/29 | | | United States | | | | 1,180,230 | | | | 1,215,686 | |
| | u 2016-C06, 1M2, FRN, 4.435%, 4/25/29 | | | United States | | | | 408,374 | | | | 430,236 | |
| | u 2016-C07, 2M2, FRN, 4.535%, 5/25/29 | | | United States | | | | 776,023 | | | | 809,565 | |
| | v 2017-C01, 1M2, FRN, 3.735%, (1-month USD LIBOR + 3.55%), 7/25/29 | | | United States | | | | 1,630,277 | | | | 1,671,600 | |
| | u 2017-C03, 1M2, FRN, 3.185%, 10/25/29 | | | United States | | | | 2,720,000 | | | | 2,761,566 | |
| | u 2017-C03, 2M2, FRN, 3.035%, 11/25/29 | | | United States | | | | 602,760 | | | | 597,786 | |
| | u 2017-C05, 1M2, FRN, 2.385%, 1/25/30 | | | United States | | | | 1,871,060 | | | | 1,848,479 | |
| e,v | | Galaxy XVIII CLO Ltd., 2018-28A, C, 144A, FRN, 3.169%, (3-month USD LIBOR + 1.95%), 7/15/31 | | | United States | | | | 250,000 | | | | 233,532 | |
| e,v | | Galaxy XXVII CLO Ltd., 2018-27A, C, 144A, FRN, 2.186%, (3-month USD LIBOR + 1.80%), 5/16/31 | | | United States | | | | 400,000 | | | | 382,912 | |
| e,v | | LCM 26 Ltd., 26A, B, 144A, FRN, 2.535%, (3-month USD LIBOR + 1.40%), 1/20/31 | | | United States | | | | 250,000 | | | | 232,229 | |
| e,u | | LCM XVI LP, 2016A, BR2, 144A, FRN, 2.969%, 10/15/31 | | | United States | | | | 351,320 | | | | 331,219 | |
| e,u | | LCM XVII LP, | | | | | | | | | | | | |
| | 2017A, BRR, 144A, FRN, 2.819%, 10/15/31 | | | United States | | | | 350,000 | | | | 326,133 | |
| | 2017A, CRR, 144A, FRN, 3.319%, 10/15/31 | | | United States | | | | 320,000 | | | | 302,355 | |
FRANKLIN TEMPLETON VARIABLE INSURANCE PRODUCTS TRUST
CONSOLIDATED STATEMENT OF INVESTMENTS (UNAUDITED)
Franklin Strategic Income VIP Fund (continued)
| | | | | | | | | | | | | | | | | | |
| | | | | Country/
Organization | | | Principal Amount* | | | | | | Value | |
| | Asset-Backed Securities and Commercial
Mortgage-Backed Securities (continued) | | | | | | | | | | | | | | | | |
| | Diversified Financials (continued) | | | | | | | | | | | | | | | | |
| e,v | | LCM XVIII LP, 2018A, DR, 144A, FRN, 3.935%, (3-month USD LIBOR + 2.80%), 4/20/31 | | | United States | | | | 770,000 | | | | | | | $ | 643,538 | |
| e,u | | Madison Park Euro Funding VIII DAC, 8A, BRN, 144A, FRN, 1.70%, 4/15/32 | | | Ireland | | | | 400,000 | | | | EUR | | | | 434,465 | |
| e,u | | Madison Park Euro Funding XIV DAC, 2014A, A1N, 144A, FRN, 1.12%, 7/15/32 | | | Ireland | | | | 1,000,000 | | | | EUR | | | | 1,112,975 | |
| e,v | | Madison Park Funding XXIII Ltd., 2017-23A, B, 144A, FRN, 2.691%, (3-month USD LIBOR + 1.70%), 7/27/30 | | | United States | | | | 400,000 | | | | | | | | 391,551 | |
| e,u | | Mill City Mortgage Loan Trust, 2018-4, A1B, 144A, FRN, 3.50%, 4/25/66 | | | United States | | | | 1,423,832 | | | | | | | | 1,515,161 | |
| v | | MortgageIT Trust, 2004-1, A2, FRN, 1.085%, (1-month USD LIBOR + 0.90%), 11/25/34 | | | United States | | | | 102,475 | | | | | | | | 101,309 | |
| e,u | | Mountain View Funding CLO XIV Ltd., 2019-1A, C, 144A, FRN, 4.119%, 4/15/29 | | | United States | | | | 500,000 | | | | | | | | 494,009 | |
| e,v | | NZCG Funding Ltd., 2015-1A, A2R, 144A, FRN, 1.91%, (3-month USD LIBOR + 1.55%), 2/26/31 | | | United States | | | | 2,182,000 | | | | | | | | 2,086,762 | |
| e,u | | Octagon Investment Partners 28 Ltd., 2016-1A, BR, 144A, FRN, 2.82%, 10/24/30 | | | United States | | | | 250,000 | | | | | | | | 243,658 | |
| e,v | | Octagon Investment Partners 36 Ltd., 2018-1A, A1, 144A, FRN, 2.189%, (3-month USD LIBOR + 0.97%), 4/15/31 | | | United States | | | | 500,000 | | | | | | | | 487,213 | |
| e,v | | Octagon Investment Partners 37 Ltd., 2018-2A, C, 144A, FRN, 3.841%, (3-month USD LIBOR + 2.85%), 7/25/30 | | | United States | | | | 400,000 | | | | | | | | 352,427 | |
| e,u | | Octagon Investment Partners 38 Ltd., 2018-1A, C, 144A, FRN, 4.085%, 7/20/30 | | | United States | | | | 1,000,000 | | | | | | | | 886,795 | |
| e,v | | Octagon Investment Partners XVI Ltd., 2013-1A, DR, 144A, FRN, 4.135%, (3-month USD LIBOR + 3.00%), 7/17/30 | | | United States | | | | 400,000 | | | | | | | | 356,262 | |
| e,v | | Octagon Investment Partners XXIII Ltd., 2015-1A, BR, 144A, FRN, 2.419%, (3-month USD LIBOR + 1.20%), 7/15/27 | | | United States | | | | 400,000 | | | | | | | | 383,985 | |
| v | | Opteum Mortgage Acceptance Corp. Trust, 2005-4, 1APT, FRN, 0.495%, (1-month USD LIBOR + 0.31%), 11/25/35 | | | United States | | | | 106,516 | | | | | | | | 106,144 | |
| e,u | | Prosper Pass-Thru Trust III, | | | | | | | | | | | | | | | | |
| | 2020-PT1, A, 144A, FRN, 8.796%, 3/15/26 | | | United States | | | | 594,499 | | | | | | | | 583,696 | |
| | 2020-PT2, A, 144A, FRN, 9.444%, 4/15/26 | | | United States | | | | 631,131 | | | | | | | | 625,756 | |
| | 2020-PT3, A, 144A, FRN, 7.183%, 5/15/26 | | | United States | | | | 173,509 | | | | | | | | 179,787 | |
| e,u | | Provident Funding Mortgage Trust, | | | | | | | | | | | | | | | | |
| | 2019-1, A2, 144A, FRN, 3.00%, 12/25/49 | | | United States | | | | 859,166 | | | | | | | | 912,455 | |
| | 2020-1, A3, 144A, FRN, 3.00%, 2/25/50 | | | United States | | | | 921,757 | | | | | | | | 943,262 | |
| e,u | | Strata CLO I Ltd., 2018-1A, B, 144A, FRN, 3.419%, 1/15/31 | | | United States | | | | 1,300,000 | | | | | | | | 1,114,423 | |
| v | | Structured Asset Securities Corp., 2005-2XS, 2A2, FRN, 1.673%, (1-month USD LIBOR + 1.50%), 2/25/35 | | | United States | | | | 116,548 | | | | | | | | 114,619 | |
| u | | Thornburg Mortgage Securities Trust, 2005-1, A3, FRN, 3.647%, 4/25/45 | | | United States | | | | 80,436 | | | | | | | | 76,613 | |
| e,u | | Upgrade Master Pass-Thru Trust, 2019-PT2, A, 144A, FRN, 7.727%, 2/15/26 | | | United States | | | | 513,336 | | | | | | | | 490,176 | |
FRANKLIN TEMPLETON VARIABLE INSURANCE PRODUCTS TRUST
CONSOLIDATED STATEMENT OF INVESTMENTS (UNAUDITED)
Franklin Strategic Income VIP Fund (continued)
| | | | | | | | | | | | | | |
| | | | | Country/
Organization | | | Principal Amount* | | | Value | |
| | Asset-Backed Securities and Commercial
Mortgage-Backed Securities (continued) | | | | | |
| | Diversified Financials (continued) | | | | | | | | | | | | |
| e | | Voya CLO Ltd., | | | | | | | | | | | | |
| | v 2013-2A, BR, 144A, FRN, 2.841%, (3-month USD LIBOR + 1.85%), 4/25/31 | | | United States | | | | 780,000 | | | $ | 723,794 | |
| | v 2014-1A, CR2, 144A, FRN, 3.935%, (3-month USD LIBOR + 2.80%), 4/18/31 | | | United States | | | | 1,000,000 | | | | 878,162 | |
| | u 2015-2A, BR, 144A, FRN, 2.543%, 7/23/27 | | | United States | | | | 820,000 | | | | 797,981 | |
| | | | | | | | | | | | | | |
| | | | | | | | | | | | | 81,849,789 | |
| | | | | | | | | | | | | | |
| | | |
| | Total Asset-Backed Securities and Commercial Mortgage-Backed Securities
(Cost $88,322,543) | | | | | | | | 82,596,248 | |
| | | | | | | | | | | | | | |
| | | | |
| | Mortgage-Backed Securities 7.7% | | | | | | | | | | | | |
| w | | Federal Home Loan Mortgage Corp. (FHLMC) Adjustable Rate 0.0%† | | | | | | | | | | | | |
| | FHLMC, 3.848%, (US 1 Year CMT T-Note +/- MBS Margin), 1/01/33 | | | United States | | | | 5,359 | | | | 5,383 | |
| | | | | | | | | | | | | | |
| | | | |
| | | Federal Home Loan Mortgage Corp. (FHLMC) Fixed Rate 0.1% | | | | | | | | | |
| | FHLMC Gold 30 Year, 5.00%, 4/01/34 - 8/01/35 | | | United States | | | | 181,865 | | | | 208,161 | |
| | FHLMC Gold 30 Year, 5.50%, 3/01/33 - 1/01/35 | | | United States | | | | 109,112 | | | | 122,682 | |
| | FHLMC Gold 30 Year, 6.00%, 4/01/33 - 2/01/36 | | | United States | | | | 80,364 | | | | 91,728 | |
| | FHLMC Gold 30 Year, 6.50%, 11/01/27 - 7/01/32 | | | United States | | | | 14,542 | | | | 16,254 | |
| | FHLMC Gold 30 Year, 7.00%, 9/01/21 - 4/01/30 | | | United States | | | | 3,804 | | | | 4,081 | |
| | FHLMC Gold 30 Year, 7.50%, 8/01/30 | | | United States | | | | 161 | | | | 193 | |
| | | | | | | | | | | | | | |
| | | | | | | | | | | | | 443,099 | |
| | | | | | | | | | | | | | |
| | | | |
| w | | Federal National Mortgage Association (FNMA) Adjustable Rate 0.0%† | | | | | | | | | |
| | FNMA, 4.042%, (US 1 Year CMT T-Note +/- MBS Margin), 12/01/34 | | | United States | | | | 58,079 | | | | 59,738 | |
| | | | | | | | | | | | | | |
| | | | |
| | | Federal National Mortgage Association (FNMA) Fixed Rate 7.5% | | | | | | | | | |
| | FNMA 15 Year, 2.50%, 7/01/22 | | | United States | | | | 4,967 | | | | 5,206 | |
| x | | FNMA 30 Year, 2.50%, 7/01/50 | | | United States | | | | 4,000,000 | | | | 4,168,594 | |
| | FNMA 30 Year, 3.00%, 9/01/48 | | | United States | | | | 2,940,583 | | | | 3,112,446 | |
| | FNMA 30 Year, 3.00%, 11/01/48 | | | United States | | | | 1,099,909 | | | | 1,165,078 | |
| x | | FNMA 30 Year, 3.00%, 6/01/50 | | | United States | | | | 16,019,000 | | | | 16,867,506 | |
| | FNMA 30 Year, 4.50%, 5/01/48 | | | United States | | | | 4,123,196 | | | | 4,514,182 | |
| | FNMA 30 Year, 5.00%, 4/01/30 | | | United States | | | | 36,269 | | | | 40,694 | |
| | FNMA 30 Year, 6.50%, 6/01/28 - 10/01/37 | | | United States | | | | 99,561 | | | | 114,968 | |
| | | | | | | | | | | | | | |
| | | | | | | | | | | | | 29,988,674 | |
| | | | | | | | | | | | | | |
| | | | |
| | | Government National Mortgage Association (GNMA) Fixed Rate 0.1% | | | | | | | | | |
| | GNMA I SF 30 Year, 5.00%, 11/15/33 - 7/15/34 | | | United States | | | | 158,805 | | | | 181,588 | |
| | GNMA I SF 30 Year, 7.00%, 10/15/28 - 6/15/32 | | | United States | | | | 12,825 | | | | 12,958 | |
| | GNMA I SF 30 Year, 7.50%, 9/15/30 | | | United States | | | | 1,089 | | | | 1,292 | |
| | GNMA II SF 30 Year, 5.00%, 9/20/33 - 11/20/33 | | | United States | | | | 41,826 | | | | 47,383 | |
| | GNMA II SF 30 Year, 6.00%, 11/20/34 | | | United States | | | | 58,354 | | | | 67,756 | |
| | GNMA II SF 30 Year, 6.50%, 4/20/31 - 2/20/34 | | | United States | | | | 28,377 | | | | 33,190 | |
FRANKLIN TEMPLETON VARIABLE INSURANCE PRODUCTS TRUST
CONSOLIDATED STATEMENT OF INVESTMENTS (UNAUDITED)
Franklin Strategic Income VIP Fund (continued)
| | | | | | | | | | | | | | | | | | |
| | | | | Country/
Organization | | | Principal Amount* | | | | | | Value | |
| | Mortgage-Backed Securities (continued) | | | | | | | | | | | | | | | | |
| | Government National Mortgage Association (GNMA) Fixed Rate (continued) | | | | | | | | | | | | | | | | |
| | GNMA II SF 30 Year, 7.50%, 1/20/28 - 4/20/32 | | | United States | | | | 7,934 | | | | | | | $ | 9,244 | |
| | | | | | | | | | | | | | | | | | |
| | | | | |
| | | | | | | | | | | | | | | | | 353,411 | |
| | | | | | | | | | | | | | | | | | |
| | | | | |
| | Total Mortgage-Backed Securities
(Cost $30,173,094) | | | | | | | | | | | | | | | 30,850,305 | |
| | | | | | | | | | | | | | | | | | |
| | | | | |
| | Municipal Bonds 3.0% | | | | | | | | | | | | | | | | |
| | Broward County Airport System Revenue, Refunding, Series C, 3.477%, 10/01/43 | | | United States | | | | 310,000 | | | | | | | | 310,175 | |
| | California Health Facilities Financing Authority Revenue, | | | | | | | | | | | | | | | | |
| | Senior, No Place Like Home Program, 2.934%, 6/01/32 | | | United States | | | | 295,000 | | | | | | | | 306,411 | |
| | Senior, No Place Like Home Program, 2.984%, 6/01/33 | | | United States | | | | 250,000 | | | | | | | | 259,360 | |
| | Senior, No Place Like Home Program, 3.034%, 6/01/34 | | | United States | | | | 190,000 | | | | | | | | 196,853 | |
| | City of Austin Electric Utility System Revenue, Travis and Williamson Counties, Refunding, 6.262%, 11/15/32 | | | United States | | | | 580,000 | | | | | | | | 753,327 | |
| | Foothill/Eastern Transportation Corridor Agency Toll Road Revenue, Refunding, Series A, 4.094%, 1/15/49 | | | United States | | | | 150,000 | | | | | | | | 154,263 | |
| | Gilroy USD, GO, Santa Clara County, Refunding, 3.364%, 8/01/47 | | | United States | | | | 630,000 | | | | | | | | 647,457 | |
| | Greenville City School District GO, County of Darke, School Improvement, Refunding, 3.541%, 1/01/51 | | | United States | | | | 715,000 | | | | | | | | 721,864 | |
| | Honolulu City and County Wastewater System Revenue, Second Bond Resolution, Refunding, Junior Series B, 2.585%, 7/01/28 | | | United States | | | | 115,000 | | | | | | | | 122,176 | |
| | Massachusetts State School Building Authority Dedicated Sales Tax Revenue, Subordinated, Refunding, Series B, 3.395%, 10/15/40 | | | United States | | | | 285,000 | | | | | | | | 291,147 | |
| | Metro Wastewater Reclamation District Sewer Revenue, Refunding, Series B, 3.158%, 4/01/41 | | | United States | | | | 475,000 | | | | | | | | 498,550 | |
| | Metropolitan St. Louis Sewer District Wastewater System Revenue, Refunding, Series C, 3.259%, 5/01/45 | | | United States | | | | 1,375,000 | | | | | | | | 1,416,910 | |
| | New Jersey State Transportation Trust Fund Authority Revenue, Transportation System, Series B, 4.131%, 6/15/42 | | | United States | | | | 345,000 | | | | | | | | 322,199 | |
| | New York State Dormitory Authority Revenues, Non State Supported Debt, State University of New York Dormitory Facilities, Series B, 3.142%, 7/01/43 | | | United States | | | | 305,000 | | | | | | | | 315,175 | |
| | Ohio State Hospital Facility Revenue, Cleveland Clinic Health System Obligated Group, Refunding, Series G, 3.276%, 1/01/42 | | | United States | | | | 190,000 | | | | | | | | 201,001 | |
| | Oregon State Department of Transportation Highway User Tax Revenue, senior lien, Refunding, Series B, 3.168%, 11/15/38 | | | United States | | | | 380,000 | | | | | | | | 410,632 | |
| | Orlando Health Obligated Group, 3.777%, 10/01/28 | | | United States | | | | 330,000 | | | | | | | | 371,209 | |
| | Pennsylvania State Turnpike Commission Turnpike Revenue, Motor License Fund-Enhanced, Subordinate, Refunding, First Series, 3.579%, 12/01/43 | | | United States | | | | 955,000 | | | | | | | | 1,002,951 | |
| | Salt Lake City Sales and Excise Tax Revenue, Refunding, Series B, 3.102%, 4/01/38 | | | United States | | | | 270,000 | | | | | | | | 274,844 | |
| | San Bernardino Community College District GO, San Bernadino and Riverside Counties, Election of 2018, Series A-1, 3.271%, 8/01/39 | | | United States | | | | 210,000 | | | | | | | | 228,890 | |
| | San Diego County Regional Transportation Commission Sales Tax Revenue, Limited Tax, Refunding, Series A, 3.248%, 4/01/48 | | | United States | | | | 230,000 | | | | | | | | 245,297 | |
| | San Francisco City and County Public Utilities Commission Water Revenue, Green Bonds, Refunding, Sub-Series A, 3.473%, 11/01/43 | | | United States | | | | 230,000 | | | | | | | | 246,503 | |
FRANKLIN TEMPLETON VARIABLE INSURANCE PRODUCTS TRUST
CONSOLIDATED STATEMENT OF INVESTMENTS (UNAUDITED)
Franklin Strategic Income VIP Fund (continued)
| | | | | | | | | | | | | | | | | | |
| | | | | Country/
Organization | | | Principal Amount* | | | | | | Value | |
| | Municipal Bonds (continued) | | | | | | | | | | | | | | | | |
| | San Jose RDA Successor Agency Tax Allocation, Senior, Refunding, Series A-T, 3.25%, 8/01/29 | | | United States | | | | 440,000 | | | | | | | $ | 486,182 | |
| | Texas State GO, Transportation Commission, Highway Improvement, Refunding, 3.211%, 4/01/44 | | | United States | | | | 575,000 | | | | | | | | 610,098 | |
| | Texas State University System Financing Revenue, | | | | | | | | | | | | | | | | |
| | Refunding, Series B, 2.938%, 3/15/33 | | | United States | | | | 225,000 | | | | | | | | 232,646 | |
| | Refunding, Serise B, 3.289%, 3/15/40 | | | United States | | | | 190,000 | | | | | | | | 195,624 | |
| | University of Pittsburgh of the Commonwealth System of Higher Education Revenue, Refunding, Series C, 3.005%, 9/15/41 | | | United States | | | | 535,000 | | | | | | | | 573,541 | |
| | Utah Transit Authority Sales Tax Revenue, Refunding, Series B, 3.443%, 12/15/42 | | | United States | | | | 380,000 | | | | | | | | 394,459 | |
| | | | | | | | | | | | | | | | | | |
| | | | | |
| | Total Municipal Bonds (Cost $11,262,373) | | | | | | | | | | | | | | | 11,789,744 | |
| | | | | | | | | | | | | | | | | | |
| | | | | |
| | | | | | | | Shares/
Units | | | | | | | |
| | | | | |
| | Escrows and Litigation Trusts 0.0%† | | | | | | | | | | | | | | | | |
o | | Mesquite Energy Inc., Escrow Account | | | United States | | | | 243,000 | | | | | | | | 1,215 | |
a,aa | | Millennium Corporate Claim Trust, Escrow Account | | | United States | | | | 950,432 | | | | | | | | — | |
a,aa | | Millennium Lender Claim Trust, Escrow Account | | | United States | | | | 950,432 | | | | | | | | — | |
a,aa,b | | Remington Outdoor Co. Inc., Litigation Units | | | United States | | | | 7,021 | | | | | | | | — | |
a | | Vistra Energy Corp., Escrow Account | | | United States | | | | 3,000,000 | | | | | | | | 6,000 | |
| | | | | | | | | | | | | | | | | | |
| | | | | |
| | Total Escrows and Litigation Trusts
(Cost $325,648) | | | | | | | | | | | | | | | 7,215 | |
| | | | | | | | | | | | | | | | | | |
| | | | | |
| | Total Investments before Short Term Investments
(Cost $412,216,181) | | | | | | | | | | | | | | | 394,266,736 | |
| | | | | | | | | | | | | | | | | | |
| | | | | |
| | | | | | | | Principal
Amount* | | | | | | | |
| | | | | |
| | Short Term Investments 3.7% | | | | | | | | | | | | | | | | |
| | | | | |
k,l | | Senior Floating Rate Interests (Cost $53,393) 0.0%† | | | | | | | | | | | | | | | | |
| | Retailing 0.0%† | | | | | | | | | | | | | | | | |
y | | General Nutrition Centers Inc., 14.00%, (3-month USD LIBOR + 13.00%), 12/30/20 | | | United States | | | | 59,184 | | | | | | | | 60,072 | |
| | | | | | | | | | | | | | | | | | |
| | | | | |
| | Total Investments before Money Market Funds
(Cost $412,269,574) | | | | | | | | | | | | | | | 394,326,808 | |
| | | | | | | | | | | | | | | | | | |
| | | | | |
| | | | | | | | Shares | | | | | | | |
| | Money Market Funds (Cost $14,480,530) 3.7% | | | | | | | | | | | | | | | | |
| d,z | | Institutional Fiduciary Trust Money Market Portfolio, 0.00% | | | United States | | | | 14,480,530 | | | | | | | | 14,480,530 | |
| | | | | | | | | | | | | | | | | | |
| | | | | |
| | Total Investments (Cost $426,750,104) 102.2% | | | | | | | | | | | | | | | 408,807,338 | |
| | | | | |
| | Other Assets, less Liabilities (2.2)% | | | | | | | | | | | | | | | (8,656,727 | ) |
| | | | | | | | | | | | | | | | | | |
| | | | | |
| | Net Assets 100.0% | | | | | | | | | | | | | | $ | 400,150,611 | |
| | | | | | | | | | | | | | | | | | |
FRANKLIN TEMPLETON VARIABLE INSURANCE PRODUCTS TRUST
CONSOLIDATED STATEMENT OF INVESTMENTS (UNAUDITED)
Franklin Strategic Income VIP Fund (continued)
†Rounds to less than 0.1% of net assets.
*The principal amount is stated in U.S. dollars unless otherwise indicated.
aNon-income producing.
aaFair valued using significant unobservable inputs. See Note 13 regarding fair value measurements.
bSee Note 9 regarding restricted securities.
cThe security is owned by FT Holdings Corporation III, a wholly-owned subsidiary of the Fund. See Note 1(f).
dSee Note 3(e) regarding investments in affiliated management investment companies.
eSecurity was purchased pursuant to Rule 144A under the Securities Act of 1933 and may be sold in transactions exempt from registration only to qualified institutional buyers or in a public offering registered under the Securities Act of 1933. At June 30, 2020, the aggregate value of these securities was $140,960,840, representing 35.2% of net assets.
fIncome may be received in additional securities and/or cash.
gSecurity was purchased pursuant to Regulation S under the Securities Act of 1933, which exempts from registration securities offered and sold outside of the United States. Such a security cannot be sold in the United States without either an effective registration statement filed pursuant to the Securities Act of 1933, or pursuant to an exemption from registration. At June 30, 2020, the aggregate value of these securities was $11,485,514, representing 2.9% of net assets.
hPerpetual security with no stated maturity date.
iSecurity purchased on a when-issued basis. See Note 1(c).
jSee Note 1(e) regarding loan participation notes.
kThe coupon rate shown represents the rate at period end.
lSee Note 1(h) regarding senior floating rate interests.
mSecurity purchased on a delayed delivery basis. See Note 1(c).
nA portion or all of the security represents an unsettled loan commitment. The coupon rate is to-be determined (TBD) at the time of settlement and will be based upon a reference index/floor plus a spread.
oSee Note 7 regarding defaulted securities.
pSee Note 1(i) regarding Marketplace lending.
qA supranational organization is an entity formed by two or more central governments through international treaties.
rPrincipal amount is stated in 100 Mexican Peso Units.
sThe principal represents the notional amount. See Note 1(d) regarding value recovery instruments.
tPrincipal amount of security is adjusted for inflation. See Note 1(k).
uAdjustable rate security with an interest rate that is not based on a published reference index and spread. The rate is based on the structure of the agreement and current market conditions. The coupon rate shown represents the rate at period end.
vThe coupon rate shown represents the rate inclusive of any caps or floors, if applicable, in effect at period end.
wAdjustable Rate Mortgage-Backed Security (ARM); the rate shown is the effective rate at period end. ARM rates are not based on a published reference rate and spread, but instead pass-through weighted average interest income inclusive of any caps or floors, if applicable, from the underlying mortgage loans in which the majority of mortgages pay interest based on the index shown at their designated reset dates plus a spread, less the applicable servicing and guaranty fee (MBS margin).
xSecurity purchased on a to-be-announced (TBA) basis. See Note 1(c).
ySee Note 10 regarding unfunded loan commitments.
zThe rate shown is the annualized seven-day effective yield at period end.
FRANKLIN TEMPLETON VARIABLE INSURANCE PRODUCTS TRUST
CONSOLIDATED STATEMENT OF INVESTMENTS (UNAUDITED)
Franklin Strategic Income VIP Fund (continued)
At June 30, 2020, the Fund had the following futures contracts outstanding. See Note 1(d).
Futures Contracts
| | | | | | | | | | | | | | | | | | | | |
| | | | | |
| Description | | Type | | | Number of
Contracts | | | Notional
Amount* | | | Expiration
Date | | | Value/
Unrealized
Appreciation
(Depreciation) | |
| Interest Rate Contracts | | | | | | | | | | | | | | | | | | | | |
Australian 3 Yr. Bond | | | Long | | | | 114 | | | $ | 9,207,922 | | | | 9/15/20 | | | $ | 2,440 | |
Australian 10 Yr. Bond | | | Long | | | | 66 | | | | 6,775,822 | | | | 9/15/20 | | | | 69,527 | |
Canada 10 Yr. Bond | | | Long | | | | 54 | | | | 6,118,581 | | | | 9/21/20 | | | | 15,531 | |
Euro-OAT | | | Long | | | | 86 | | | | 16,197,069 | | | | 9/08/20 | | | | 267,467 | |
U.S. Treasury 5 Yr. Note | | | Long | | | | 100 | | | | 12,574,219 | | | | 9/30/20 | | | | 26,435 | |
U.S. Treasury 10 Yr. Note | | | Long | | | | 165 | | | | 22,963,359 | | | | 9/21/20 | | | | 92,352 | |
| | | | | | | | | | | | | | | | | | | | |
Total Futures Contracts | | | | | | | | | | | | | | | | | | $ | 473,752 | |
| | | | | | | | | | | | | | | | | | | | |
*As of period end.
At June 30, 2020, the Fund had the following forward exchange contracts outstanding. See Note 1(d).
Forward Exchange Contracts
| | | | | | | | | | | | | | | | | | | | | | | | | | | | |
| | | | | | | |
| Currency | | Counterpartya | | | Type | | | Quantity | | | Contract
Amount | | | Settlement
Date | | | Unrealized
Appreciation | | | Unrealized Depreciation
| |
| OTC Forward Exchange Contracts | |
Turkish Lira | | | JPHQ | | | | Buy | | | | 5,800,000 | | | $ | 841,861 | | | | 7/14/20 | | | $ | 1,261 | | | $ | — | |
Canadian Dollar | | | JPHQ | | | | Sell | | | | 3,500,000 | | | | 2,506,113 | | | | 7/15/20 | | | | — | | | | (72,224 | ) |
Japanese Yen | | | CITI | | | | Buy | | | | 558,485,200 | | | | 5,200,000 | | | | 7/16/20 | | | | — | | | | (26,547 | ) |
Euro | | | JPHQ | | | | Buy | | | | 2,381,059 | | | | 2,585,580 | | | | 7/23/20 | | | | 90,816 | | | | — | |
Euro | | | JPHQ | | | | Buy | | | | 3,207,561 | | | | 3,634,809 | | | | 7/23/20 | | | | — | | | | (29,395 | ) |
Euro | | | JPHQ | | | | Sell | | | | 5,588,621 | | | | 6,217,843 | | | | 7/23/20 | | | | — | | | | (63,967 | ) |
Norwegian Krone | | | JPHQ | | | | Buy | | | | 26,200,000 | | | | 2,896,972 | | | | 7/23/20 | | | | — | | | | (174,025 | ) |
Norwegian Krone | | | JPHQ | | | | Sell | | | | 26,200,000 | | | | 2,570,644 | | | | 7/23/20 | | | | — | | | | (152,304 | ) |
Australian Dollar | | | JPHQ | | | | Sell | | | | 8,610,000 | | | | 5,408,205 | | | | 7/27/20 | | | | — | | | | (534,431 | ) |
Mexican Peso | | | JPHQ | | | | Sell | | | | 400,000 | | | | 16,136 | | | | 7/27/20 | | | | — | | | | (1,206 | ) |
Canadian Dollar | | | JPHQ | | | | Sell | | | | 2,100,000 | | | | 1,479,618 | | | | 7/28/20 | | | | — | | | | (67,469 | ) |
Euro | | | JPHQ | | | | Buy | | | | 2,500,000 | | | | 2,833,830 | | | | 8/05/20 | | | | — | | | | (22,894 | ) |
Euro | | | JPHQ | | | | Sell | | | | 2,500,000 | | | | 2,814,875 | | | | 8/05/20 | | | | 3,939 | | | | — | |
Australian Dollar | | | JPHQ | | | | Sell | | | | 2,900,000 | | | | 1,752,354 | | | | 8/06/20 | | | | — | | | | (249,327 | ) |
Australian Dollar | | | JPHQ | | | | Sell | | | | 1,350,000 | | | | 871,844 | | | | 8/10/20 | | | | — | | | | (59,982 | ) |
Japanese Yen | | | JPHQ | | | | Buy | | | | 1,043,000,000 | | | | 9,977,375 | | | | 8/13/20 | | | | — | | | | (312,217 | ) |
Japanese Yen | | | JPHQ | | | | Sell | | | | 90,000,000 | | | | 842,849 | | | | 8/13/20 | | | | 8,847 | | | | — | |
Singapore Dollar | | | JPHQ | | | | Sell | | | | 11,700,000 | | | | 8,390,254 | | | | 8/13/20 | | | | — | | | | (6,414 | ) |
South African Rand | | | JPHQ | | | | Buy | | | | 19,600,000 | | | | 1,057,288 | | | | 8/17/20 | | | | 65,817 | | | | — | |
Chinese Yuan Renminbi | | | JPHQ | | | | Buy | | | | 18,050,000 | | | | 2,586,219 | | | | 8/21/20 | | | | — | | | | (40,634 | ) |
Chinese Yuan Renminbi | | | JPHQ | | | | Sell | | | | 18,050,000 | | | | 2,563,702 | | | | 8/21/20 | | | | 18,116 | | | | — | |
Japanese Yen | | | JPHQ | | | | Buy | | | | 430,000,000 | | | | 4,113,632 | | | | 9/14/20 | | | | — | | | | (127,071 | ) |
Canadian Dollar | | | JPHQ | | | | Sell | | | | 300,000 | | | | 216,638 | | | | 9/15/20 | | | | — | | | | (4,391 | ) |
Euro | | | DBAB | | | | Buy | | | | 650,000 | | | | 737,022 | | | | 9/15/20 | | | | — | | | | (5,511 | ) |
Euro | | | DBAB | | | | Sell | | | | 650,000 | | | | 731,341 | | | | 9/15/20 | | | | — | | | | (170 | ) |
Euro | | | JPHQ | | | | Buy | | | | 650,000 | | | | 737,467 | | | | 9/15/20 | | | | — | | | | (5,957 | ) |
FRANKLIN TEMPLETON VARIABLE INSURANCE PRODUCTS TRUST
CONSOLIDATED STATEMENT OF INVESTMENTS (UNAUDITED)
Franklin Strategic Income VIP Fund (continued)
Forward Exchange Contracts (continued)
| | | | | | | | | | | | | | | | | | | | | | | | | | | | |
| | | | | | | |
| Currency | | Counterpartya | | | Type | | | Quantity | | | Contract
Amount | | | Settlement
Date | | | Unrealized
Appreciation | | | Unrealized Depreciation
| |
OTC Forward Exchange Contracts (continued) | | | | | | | | | | | | | | | | | |
Euro | | | JPHQ | | | | Sell | | | | 12,100,082 | | | $ | 13,611,383 | | | | 9/15/20 | | | $ | — | | | $ | (6,060 | ) |
Norwegian Krone | | | JPHQ | | | | Buy | | | | 39,200,000 | | | | 3,881,265 | | | | 9/15/20 | | | | 193,540 | | | | — | |
Norwegian Krone | | | JPHQ | | | | Sell | | | | 39,200,000 | | | | 3,843,137 | | | | 9/15/20 | | | | — | | | | (231,668 | ) |
Indonesian Rupiah | | | JPHQ | | | | Sell | | | | 7,200,000,000 | | | | 468,658 | | | | 11/30/20 | | | | — | | | | (12,985 | ) |
| | | | | | | | | | | | | | | | | | | | | | | | |
Total Forward Exchange Contracts | | | $ | 382,336 | | | $ | (2,206,849 | ) |
| | | | | | | | | | | | | | | | | | | | | | | | |
Net unrealized appreciation (depreciation) | | | | | | | $ | (1,824,513 | ) |
| | | | | | | | | | | | | | | | | | | | | | | | | | | | |
aMay be comprised of multiple contracts with the same counterparty, currency and settlement date.
At June 30, 2020, the Fund had the following credit default swap contracts outstanding. See Note 1(d).
Credit Default Swap Contracts
| | | | | | | | | | | | | | | | | | | | | | | | | | | | | | | | | | | | |
| | | | | | | | | |
| Description | | Annual
Payment Rate
Received
(Paid) | | | Payment
Frequency | | | Counter-
party | | | Maturity
Date | | | Notional Amounta | | | Value | | | Unamortized
Upfront
Payments
(Receipts) | | | Unrealized
Appreciation
(Depreciation) | | | Ratingb | |
| Centrally Cleared Swap Contracts | | | | | | | | | | | | | | | | | | | | | | | | | |
| | | | | | |
| Contracts to Sell Protectionc,d | | | | | | | | | | | | | | | | | | | | | | | | | |
| | | | | | | | | |
| Traded Index | | | | | | | | | | | | | | | | | | | | | | | | | | | | | | | | | | | | |
CDX.EM.31 | | | 1.00 | % | | | Quarterly | | | | | | | | 6/20/24 | | | $ | 4,230,000 | | | $ | (122,442 | ) | | $ | (88,005 | ) | | $ | (34,437 | ) | | | Investment | |
| | | | | | | | | | | | | | | | | | | | | | | | | | | | | | | | | | | Grade | |
CDX.EM.32 | | | 1.00 | % | | | Quarterly | | | | | | | | 12/20/24 | | | | 3,766,500 | | | | (134,407 | ) | | | (138,744 | ) | | | 4,337 | | |
| Non-
Investment
Grade |
|
CDX.NA.IG.33 | | | 1.00 | % | | | Quarterly | | | | | | | | 12/20/24 | | | | 4,400,000 | | | | 53,914 | | | | 61,415 | | | | (7,501 | ) | |
| Investment
Grade |
|
| | | | | | | | | | | | | | | | | | | | | | | | | | | | |
Total Centrally Cleared Swap Contracts | | | | | | | | | | | | | | | | | | | | | | $ | (202,935 | ) | | $ | (165,334 | ) | | $ | (37,601 | ) | | | | |
| | | | | | | | | | | | | | | | | | | | | | | | | | | | |
| | | | | | | | | |
| OTC Swap Contracts | | | | | | | | | | | | | | | | | | | | | | | | | | | | | | | | | | | | |
| | | | | | | | | |
| Contracts to Buy Protectionc | | | | | | | | | | | | | | | | | | | | | | | | | | | | | | | | | | | | |
| | | | | | | | | |
| Single Name | | | | | | | | | | | | | | | | | | | | | | | | | | | | | | | | | | | | |
Ally Financial Inc. | | | (5.00 | )% | | | Quarterly | | | | JPHQ | | | | 12/20/24 | | | $ | 1,810,000 | | | $ | (290,273 | ) | | $ | (302,696 | ) | | $ | 12,423 | | | | | |
Government of Italy | | | (1.00 | )% | | | Quarterly | | | | BZWS | | | | 6/20/23 | | | | 1,500,000 | | | | (346 | ) | | | 9,709 | | | | (10,055 | ) | | | | |
| | | | | | | | | |
| Contracts to Sell Protectionc,d | | | | | | | | | | | | | | | | | | | | | | | | | | | | | | | | | | | | |
| | | | | | | | | |
| Single Name | | | | | | | | | | | | | | | | | | | | | | | | | | | | | | | | | | | | |
Government of Italy | | | 1.00 | % | | | Quarterly | | | | BZWS | | | | 6/20/23 | | | | 1,500,000 | | | | (15,705 | ) | | | (42,576 | ) | | | 26,871 | | | | BBB | |
| | | | | | | | | |
| Traded Index | | | | | | | | | | | | | | | | | | | | | | | | | | | | | | | | | | | | |
eBNP Paribas Bespoke Rodez2 | | | | | | | | | | | | | | | | | | | | | | | | | | | | | | | | | | | | |
Index, Mezzanine Tranche 5-7% | | | 3.20 | % | | | Quarterly | | | | BNDP | | | | 12/20/20 | | | | 300,000 | | | | (25,680 | ) | | | — | | | | (25,680 | ) | |
| Investment
Grade |
|
eCitibank Bespoke Palma Index, | | | | | | | | | | | | | | | | | | | | | | | | | | | | | | | | | | | | |
Mezzanine Tranche 5-7% | | | 2.30 | % | | | Quarterly | | | | CITI | | | | 6/20/21 | | | | 620,000 | | | | (63,234 | ) | | | — | | | | (63,234 | ) | |
| Non-
Investment
Grade |
|
FRANKLIN TEMPLETON VARIABLE INSURANCE PRODUCTS TRUST
CONSOLIDATED STATEMENT OF INVESTMENTS (UNAUDITED)
Franklin Strategic Income VIP Fund (continued)
Credit Default Swap Contracts (continued)
| | | | | | | | | | | | | | | | | | | | | | | | | | | | | | | | | | | | |
| | | | | | | | | |
| Description | | Annual
Payment Rate
Received
(Paid) | | | Payment
Frequency | | | Counter-
party | | | Maturity
Date | | | Notional Amounta | | | Value | | | Unamortized
Upfront
Payments
(Receipts) | | | Unrealized
Appreciation
(Depreciation) | | | Ratingb | |
| OTC Swap Contracts (continued) | | | | | | | | | | | | | | | | | | | | | | | | | | | | | |
| | | | | | | |
| Contracts to Sell Protectionc,d (continued) | | | | | | | | | | | | | | | | | | | | | | | | | | | | | |
| | | | | | | |
| Traded Index (continued) | | | | | | | | | | | | | | | | | | | | | | | | | | | | | |
MCDX.NA.31 | | | 1.00 | % | | | Quarterly | | | | CITI | | | | 12/20/23 | | | $ | 2,270,000 | | | $ | (10,271 | ) | | $ | 15,965 | | | $ | (26,236 | ) | | | Investment | |
| | | | | | | | | | | | | | | | | | | | | | | | | | | | | | | | | | | Grade | |
eMorganStanley Bespoke Pecan Index, MezzanineTranche 5-10% | | | 3.98 | % | | | Quarterly | | | | MSCO | | | | 12/20/21 | | | | 850,000 | | | | (353,802 | ) | | | — | | | | (353,802 | ) | |
| Non-
Investment
Grade |
|
eMorganStanley Bespoke Pecan Index, MezzanineTranche 5-10% | | | 4.10 | % | | | Quarterly | | | | MSCO | | | | 12/20/21 | | | | 850,000 | | | | (296,266 | ) | | | — | | | | (296,266 | ) | |
| Non-
Investment
Grade |
|
| | | | | | | | | | | | | | | | | | | | | | | | | | | | |
| | | | | | | | | |
Total OTC Swap Contracts | | | | | | | | | | | | | | | | | | | | | | $ | (1,055,577 | ) | | $ | (319,598 | ) | | $ | (735,979 | ) | | | | |
| | | | | | | | | | | | | | | | | | | | | | | | | | | | |
Total Credit Default Swap Contracts | | | | | | | | | | | | | | | | | | | | | | $ | (1,258,512 | ) | | $ | (484,932 | ) | | $ | (773,580 | ) | | | | |
| | | | | | | | | | | | | | | | | | | | | | | | | | | | |
aFor contracts to sell protection, the notional amount is equal to the maximum potential amount of the future payments and no recourse provisions have been entered into in association with the contracts.
bBased on Standard and Poor’s (S&P) Rating for single name swaps and internal ratings for index swaps. Internal ratings based on mapping into equivalent ratings from external vendors.
cPerformance triggers for settlement of contract include default, bankruptcy or restructuring for single name swaps. and failure to pay or bankruptcy of the underlying securities for traded index swaps.
dThe fund enters contracts to sell protection to create a long credit position.
eRepresents a custom index comprised of a basket of underlying instruments.
At June 30, 2020, the Fund had the following cross-currency swap contracts outstanding. See Note 1(d).
Cross-Currency Swap Contracts
| | | | | | | | | | | | | | | | | | | | |
| | | | | |
| Description | | Payment
Frequency | | | Coun-
terparty | | | Maturity
Date | | | Notional
Amount | | | Value/
Unrealized
Appreciation
(Depreciation) | |
| OTC Swap Contracts | | | | | | | | | | | | | | | | | | | | |
Receive Floating 3-month USD LIBOR + 2.87% | | | Quarterly | | | | | | | | | | | | 464,800 | USD | | | | |
Pay Fixed 2.50% | | | Annual | | | | CITI | | | | 5/04/21 | | | | 400,000 | EUR | | | $15,980 | |
Receive Floating 3-month USD LIBOR + 1.334% | | | Quarterly | | | | | | | | | | | | 1,120,000 | USD | | | | |
Pay Floating 3-month EUR LIBOR + 1.12% | | | Quarterly | | | | CITI | | | | 7/10/21 | | | | 1,000,000 | EUR | | | 1,555 | |
| | | | | | | | | | | | | | | | | | | | |
Total Cross Currency Swap Contracts | | | | | | | | | | | | | | | | | | | $17,535 | |
| | | | | | | | | | | | | | | | | | | | |
FRANKLIN TEMPLETON VARIABLE INSURANCE PRODUCTS TRUST
CONSOLIDATED STATEMENT OF INVESTMENTS (UNAUDITED)
Franklin Strategic Income VIP Fund (continued)
At June 30, 2020, the Fund had the following inflation index swap contracts outstanding. See Note 1(d).
Inflation Index Swap Contracts
| | | | | | | | | | | | | | | | |
| | | | |
| Description | | Payment
Frequency | | | Maturity
Date | | | Notional
Amount | | | Value/
Unrealized
Appreciaton
(Depreciation) | |
| Centrally Cleared Swap Contracts | | | | | | | | | | | | | | | | |
Receive variable change in USA-CPI-U | | | At maturity | | | | | | | | | | | | | |
Pay Fixed 1.943% | | | At maturity | | | | 1/15/29 | | | $ | 13,600,000 | | | $ | (746,230 | ) |
| | | | | | | | | | | | | | | | |
Total Inflation Index Swap Contracts | | | | | | | | | | | | | | $ | (746,230 | ) |
| | | | | | | | | | | | | | | | |
At June 30, 2020, the Fund had the following total return swap contracts outstanding. See Note 1(d).
Total Return Swap Contracts
| | | | | | | | | | | | | | | | | | | | | | | | | | | | | | |
| | | | | | |
| Underlying Instruments | | Financing Rate | | Payment
Frequency | | Counter-
party | | Maturity
Date | | Notional
Value | | Value/
Unrealized
Appreciation
(Depreciation) |
| OTC Swap Contracts | | | | | | | | | | | | | | | | | | | | | | | | | | | | | | |
| Longa | | | | | | | | | | | | | | | | | | | | | | | | | | | | | | |
Markit iBoxx USD Liquid Leveraged Loan Index | | | | 3-month USD LIBOR | | | | | Quarterly | | | | | GSCO | | | | | 9/20/20 | | | | $ | 1,300,000 | | | | $ | (86,648 | ) |
| | | | | | | | | | | | | | | | | | | | | | | | | | | | | | |
aThe Fund receives the total return on the underlying instrument and pays a variable financing rate.
See Note 11 regarding other derivative information.
See Abbreviations on page FSI-56.
| | | | |
| | | |
| FSI-34 | | Semiannual Report | The accompanying notes are an integral part of these consolidated financial statements. | | |
FRANKLIN TEMPLETON VARIABLE INSURANCE PRODUCTS TRUST
CONSOLIDATED FINANCIAL STATEMENTS
Consolidated Statement of Assets and Liabilities
June 30, 2020 (unaudited)
| | | | |
| |
| | | Franklin Strategic
Income VIP Fund | |
Assets: | | | | |
Investments in securities: | | | | |
Cost - Unaffiliated issuers | | $ | 401,197,429 | |
Cost - Non-controlled affiliates (Note 3e) | | | 25,552,675 | |
| | | | |
Value - Unaffiliated issuers | | $ | 386,259,168 | |
Value - Non-controlled affiliates (Note 3e) | | | 22,548,170 | |
Cash | | | 6,264,935 | |
Receivables: | | | | |
Investment securities sold | | | 2,058,553 | |
Capital shares sold | | | 120,417 | |
Dividends and interest | | | 3,438,260 | |
Deposits with brokers for: | | | | |
OTC derivative contracts | | | 2,720,000 | |
Futures contracts | | | 1,015,215 | |
Centrally cleared swap contracts | | | 2,373,536 | |
Variation margin on centrally cleared swap contracts | | | 68,529 | |
OTC swap contracts (upfront payments $38,802) | | | 25,674 | |
Unrealized appreciation on OTC forward exchange contracts | | | 382,336 | |
Unrealized appreciation on OTC swap contracts | | | 56,829 | |
Unrealized appreciation on unfunded loan commitments (Note 10) | | | 16,008 | |
FT Subsidiary deferred tax benefit (Note 1f) | | | 137,222 | |
Other assets | | | 612 | |
| | | | |
Total assets | | | 427,485,464 | |
| | | | |
Liabilities: | | | | |
Payables: | | | | |
Investment securities purchased | | | 23,349,880 | |
Capital shares redeemed | | | 106,918 | |
Management fees | | | 198,860 | |
Distribution fees | | | 32,917 | |
Trustees’ fees and expenses | | | 145 | |
Variation margin on futures contracts | | | 36,693 | |
OTC swap contracts (upfront receipts $425,743) | | | 345,272 | |
Unrealized depreciation on OTC forward exchange contracts | | | 2,206,849 | |
Unrealized depreciation on OTC swap contracts | | | 861,921 | |
Deferred tax | | | 23,178 | |
Accrued expenses and other liabilities | | | 172,220 | |
| | | | |
Total liabilities | | | 27,334,853 | |
| | | | |
Net assets, at value | | $ | 400,150,611 | |
| | | | |
Net assets consist of: | | | | |
Paid-in capital | | $ | 462,616,382 | |
Total distributable earnings (losses) | | | (62,465,771 | ) |
| | | | |
Net assets, at value | | $ | 400,150,611 | |
| | | | |
| | | | | | |
| | | |
| | The accompanying notes are an integral part of these consolidated financial statements. | Semiannual Report | | | FSI-35 | |
FRANKLIN TEMPLETON VARIABLE INSURANCE PRODUCTS TRUST
CONSOLIDATED FINANCIAL STATEMENTS
Consolidated Statement of Assets and Liabilities (continued)
June 30, 2020 (unaudited)
| | | | |
| |
| | | Franklin Strategic
Income VIP Fund | |
| |
| Class 1: | | | | |
Net assets, at value | | $ | 259,057,000 | |
| | | | |
Shares outstanding | | | 25,691,546 | |
| | | | |
Net asset value and maximum offering price per share | | | $10.08 | |
| | | | |
| |
| Class 2: | | | | |
Net assets, at value | | $ | 92,856,876 | |
| | | | |
Shares outstanding | | | 9,545,697 | |
| | | | |
Net asset value and maximum offering price per share | | | $9.73 | |
| | | | |
| |
| Class 4: | | | | |
Net assets, at value | | $ | 48,236,735 | |
| | | | |
Shares outstanding | | | 4,816,459 | |
| | | | |
Net asset value and maximum offering price per share | | | $10.01 | |
| | | | |
| | | | |
| | | |
| FSI-36 | | Semiannual Report | The accompanying notes are an integral part of these consolidated financial statements. | | |
FRANKLIN TEMPLETON VARIABLE INSURANCE PRODUCTS TRUST
CONSOLIDATED FINANCIAL STATEMENTS
Consolidated Statement of Operations
for the six months ended June 30, 2020 (unaudited)
| | |
| |
| | | Franklin Strategic
Income VIP Fund |
| | | | |
Investment income: | | | | |
Dividends: | | | | |
Non-controlled affiliates (Note 3e) | | $ | 245,699 | |
Interest: (net of foreign taxes)~ | | | | |
Unaffiliated issuers | | | 7,918,259 | |
| | | | |
Total investment income | | | 8,163,958 | |
| | | | |
Expenses: | | | | |
Management fees (Note 3a) | | | 1,272,884 | |
Distribution fees: (Note 3c) | | | | |
Class 2 | | | 114,671 | |
Class 4 | | | 89,045 | |
Custodian fees (Note 4) | | | 5,724 | |
Reports to shareholders | | | 69,917 | |
Professional fees | | | 49,333 | |
Trustees’ fees and expenses | | | 1,329 | |
Marketplace lending fees (Note 1i) | | | 108 | |
Other | | | 46,905 | |
| | | | |
Total expenses | | | 1,649,916 | |
Expense reductions (Note 4) | | | (7,559 | ) |
Expenses waived/paid by affiliates (Note 3e) | | | (40,441 | ) |
| | | | |
Net expenses | | | 1,601,916 | |
| | | | |
Net investment income | | | 6,562,042 | |
| | | | |
Realized and unrealized gains (losses): | | | | |
Net realized gain (loss) from: | | | | |
Investments: | | | | |
Unaffiliated issuers | | | (4,084,766 | ) |
Written options | | | (523,154 | ) |
Foreign currency transactions | | | (41,166 | ) |
Forward exchange contracts | | | (203,042 | ) |
Futures contracts | | | (1,146,064 | ) |
Swap contracts | | | (2,557,934 | ) |
| | | | |
Net realized gain (loss) | | | (8,556,126 | ) |
| | | | |
Net change in unrealized appreciation (depreciation) on: | | | | |
Investments: | | | | |
Unaffiliated issuers | | | (8,253,355 | ) |
Non-controlled affiliates (Note 3e) | | | (1,197,278 | ) |
Translation of other assets and liabilities denominated in foreign currencies | | | (19,965 | ) |
Forward exchange contracts | | | (1,044,217 | ) |
Futures contracts | | | 637,011 | |
Swap contracts | | | (1,676,219 | ) |
Change in deferred taxes on unrealized appreciation | | | 3,022 | |
| | | | |
Net change in unrealized appreciation (depreciation) | | | (11,551,001 | ) |
| | | | |
Net realized and unrealized gain (loss) | | | (20,107,127 | ) |
| | | | |
Net increase (decrease) in net assets resulting from operations | | $ | (13,545,085 | ) |
| | | | |
| |
~Foreign taxes withheld on interest | | $ | 35,603 | |
| | | | | | |
| | | |
| | The accompanying notes are an integral part of these consolidated financial statements. | Semiannual Report | | | FSI-37 | |
FRANKLIN TEMPLETON VARIABLE INSURANCE PRODUCTS TRUST
CONSOLIDATED FINANCIAL STATEMENTS
Consolidated Statements of Changes in Net Assets
for the six months ended June 30, 2020 (unaudited)
| | | | | | | | |
| |
| | | Franklin Strategic
Income VIP Fund | |
| | |
| | | Six Months Ended
June 30, 2020
(unaudited) | | | Year Ended
December 31, 2019 | |
Increase (decrease) in net assets: | | | | | | | | |
Operations: | | | | | | | | |
Net investment income | | | $ 6,562,042 | | | $ | 17,904,759 | |
Net realized gain (loss) | | | (8,556,126 | ) | | | (907,193 | ) |
Net change in unrealized appreciation (depreciation) | | | (11,551,001 | ) | | | 18,715,962 | |
| | | | |
Net increase (decrease) in net assets resulting from operations | | | (13,545,085 | ) | | | 35,713,528 | |
| | | | |
Distributions to shareholders: | | | | | | | | |
Class 1 | | | (13,266,506 | ) | | | (16,055,733 | ) |
Class 2 | | | (4,661,916 | ) | | | (4,608,498 | ) |
Class 4 | | | (2,304,505 | ) | | | (2,951,572 | ) |
| | | | |
Total distributions to shareholders | | | (20,232,927 | ) | | | (23,615,803 | ) |
| | | | |
Capital share transactions: (Note 2) | | | | | | | | |
Class 1 | | | (4,445,733 | ) | | | (25,284,669 | ) |
Class 2 | | | 5,529,772 | | | | 3,227,556 | |
Class 4 | | | (2,005,542 | ) | | | (7,826,645 | ) |
| | | | |
Total capital share transactions | | | (921,503 | ) | | | (29,883,758 | ) |
| | | | |
Net increase (decrease) in net assets | | | (34,699,515 | ) | | | (17,786,033 | ) |
Net assets: | | | | | | | | |
Beginning of period | | | 434,850,126 | | | | 452,636,159 | |
| | | | |
End of period | | | $400,150,611 | | | $ | 434,850,126 | |
| | | | |
| | | | |
| | | |
| FSI-38 | | Semiannual Report | The accompanying notes are an integral part of these consolidated financial statements. | | |
FRANKLIN TEMPLETON VARIABLE INSURANCE PRODUCTS TRUST
Notes to Consolidated Financial Statements (unaudited)
Franklin Strategic Income VIP Fund
1. Organization and Significant Accounting Policies
Franklin Templeton Variable Insurance Products Trust (Trust) is registered under the Investment Company Act of 1940 (1940 Act) as an open-end management investment company, consisting of eighteen separate funds and applies the specialized accounting and reporting guidance in U.S. Generally Accepted Accounting Principles (U.S. GAAP). Franklin Strategic Income VIP Fund (Fund) is included in this report. Shares of the Fund are generally sold only to insurance company separate accounts to fund the benefits of variable life insurance policies or variable annuity contracts. At June 30, 2020, 77.3% of the Fund’s shares were held through one insurance company. Investment activities of these insurance company separate accounts could have a material impact on the Fund. The Fund offers three classes of shares: Class 1, Class 2 and Class 4. Each class of shares may differ by its distribution fees, voting rights on matters affecting a single class and its exchange privilege.
The following summarizes the Fund’s significant accounting policies.
a. Financial Instrument Valuation
The Fund’s investments in financial instruments are carried at fair value daily. Fair value is the price that would be received to sell an asset or paid to transfer a liability in an orderly transaction between market participants on the measurement date. The Fund calculates the net asset value (NAV) per share each business day as of 4 p.m. Eastern time or the regularly scheduled close of the New York Stock Exchange (NYSE), whichever is earlier. Under compliance policies and procedures approved by the Trust’s Board of Trustees (the Board), the Fund’s administrator has responsibility for oversight of valuation, including leading the cross-functional Valuation Committee (VC). The Fund may utilize independent pricing services, quotations from securities and financial instrument dealers, and other market sources to determine fair value.
Equity securities and derivative financial instruments listed on an exchange or on the NASDAQ National Market System are valued at the last quoted sale price or the official closing price of the day, respectively. Foreign equity securities are valued as of the close of trading on the foreign stock exchange on which the security is primarily traded, or as of 4 p.m. Eastern time. The value is then converted into its U.S. dollar equivalent at the foreign exchange rate in effect at 4 p.m. Eastern time on the day that the value of the security is
determined. Over-the-counter (OTC) securities are valued within the range of the most recent quoted bid and ask prices. Securities that trade in multiple markets or on multiple exchanges are valued according to the broadest and most representative market. Certain equity securities are valued based upon fundamental characteristics or relationships to similar securities.
Debt securities generally trade in the OTC market rather than on a securities exchange. The Fund’s pricing services use multiple valuation techniques to determine fair value. In instances where sufficient market activity exists, the pricing services may utilize a market-based approach through which quotes from market makers are used to determine fair value. In instances where sufficient market activity may not exist or is limited, the pricing services also utilize proprietary valuation models which may consider market characteristics such as benchmark yield curves, credit spreads, estimated default rates, anticipated market interest rate volatility, coupon rates, anticipated timing of principal repayments, underlying collateral, and other unique security features in order to estimate the relevant cash flows, which are then discounted to calculate the fair value. Securities denominated in a foreign currency are converted into their U.S. dollar equivalent at the foreign exchange rate in effect at 4 p.m. Eastern time on the date that the values of the foreign debt securities are determined.
Investments in open-end mutual funds are valued at the closing NAV.
Certain derivative financial instruments are centrally cleared or trade in the OTC market. The Fund’s pricing services use various techniques including industry standard option pricing models and proprietary discounted cash flow models to determine the fair value of those instruments. The Fund’s net benefit or obligation under the derivative contract, as measured by the fair value of the contract, is included in net assets.
The Fund has procedures to determine the fair value of financial instruments for which market prices are not reliable or readily available. Under these procedures, the Fund primarily employs a market-based approach which may use related or comparable assets or liabilities, recent transactions, market multiples, book values, and other relevant information for the investment to determine the fair value of the investment. An income-based valuation approach may also be used in which the anticipated future cash flows of the
FRANKLIN TEMPLETON VARIABLE INSURANCE PRODUCTS TRUST
NOTES TO CONSOLIDATED FINANCIAL STATEMENTS (UNAUDITED)
Franklin Strategic Income VIP Fund (continued)
1. Organization and Significant Accounting Policies (continued)
a. Financial Instrument Valuation (continued)
investment are discounted to calculate fair value. Discounts may also be applied due to the nature or duration of any restrictions on the disposition of the investments. Due to the inherent uncertainty of valuations of such investments, the fair values may differ significantly from the values that would have been used had an active market existed.
Trading in securities on foreign securities stock exchanges and OTC markets may be completed before 4 p.m. Eastern time. In addition, trading in certain foreign markets may not take place on every Fund’s business day. Events can occur between the time at which trading in a foreign security is completed and 4 p.m. Eastern time that might call into question the reliability of the value of a portfolio security held by the Fund. As a result, differences may arise between the value of the Fund’s portfolio securities as determined at the foreign market close and the latest indications of value at 4 p.m. Eastern time. In order to minimize the potential for these differences, an independent pricing service may be used to adjust the value of the Fund’s portfolio securities to the latest indications of fair value at 4 p.m. Eastern time.
When the last day of the reporting period is a non-business day, certain foreign markets may be open on those days that the Fund’s NAV is not calculated, which could result in differences between the value of the Fund’s portfolio securities on the last business day and the last calendar day of the reporting period. Any significant security valuation changes due to an open foreign market are adjusted and reflected by the Fund for financial reporting purposes.
b. Foreign Currency Translation
Portfolio securities and other assets and liabilities denominated in foreign currencies are translated into U.S. dollars based on the exchange rate of such currencies against U.S. dollars on the date of valuation. The Fund may enter into foreign currency exchange contracts to facilitate transactions denominated in a foreign currency. Purchases and sales of securities, income and expense items denominated in foreign currencies are translated into U.S. dollars at the exchange rate in effect on the transaction date. Portfolio securities and assets and liabilities denominated in foreign currencies contain risks that those currencies will decline in value relative to the U.S. dollar. Occasionally,
events may impact the availability or reliability of foreign exchange rates used to convert the U.S. dollar equivalent value. If such an event occurs, the foreign exchange rate will be valued at fair value using procedures established and approved by the Board.
The Fund does not separately report the effect of changes in foreign exchange rates from changes in market prices on securities held. Such changes are included in net realized and unrealized gain or loss from investments in the Consolidated Statement of Operations.
Realized foreign exchange gains or losses arise from sales of foreign currencies, currency gains or losses realized between the trade and settlement dates on securities transactions and the difference between the recorded amounts of dividends, interest, and foreign withholding taxes and the U.S. dollar equivalent of the amounts actually received or paid. Net unrealized foreign exchange gains and losses arise from changes in foreign exchange rates on foreign denominated assets and liabilities other than investments in securities held at the end of the reporting period.
c. Securities Purchased on a When-Issued or Delayed Delivery and TBA Basis
The Fund purchases securities on a when-issued or delayed delivery and to-be-announced (TBA) basis, with payment and delivery scheduled for a future date. These transactions are subject to market fluctuations and are subject to the risk that the value at delivery may be more or less than the trade date purchase price. Although the Fund will generally purchase these securities with the intention of holding the securities, it may sell the securities before the settlement date. Sufficient assets have been segregated for these securities and collateral has been pledged and/or received for open TBA trades.
d. Derivative Financial Instruments
The Fund invested in derivative financial instruments in order to manage risk or gain exposure to various other investments or markets. Derivatives are financial contracts based on an underlying or notional amount, require no initial investment or an initial net investment that is smaller than would normally be required to have a similar response to changes in market factors, and require or permit net settlement. Derivatives contain various risks including the potential inability of the counterparty to fulfill their obligations under the terms of the contract, the potential for an illiquid secondary market, and/or
FRANKLIN TEMPLETON VARIABLE INSURANCE PRODUCTS TRUST
NOTES TO CONSOLIDATED FINANCIAL STATEMENTS (UNAUDITED)
Franklin Strategic Income VIP Fund (continued)
the potential for market movements which expose the Fund to gains or losses in excess of the amounts shown in the Consolidated Statement of Assets and Liabilities. Realized gain and loss and unrealized appreciation and depreciation on these contracts for the period are included in the Consolidated Statement of Operations.
Derivative counterparty credit risk is managed through a formal evaluation of the creditworthiness of all potential counterparties. The Fund attempts to reduce its exposure to counterparty credit risk on OTC derivatives, whenever possible, by entering into International Swaps and Derivatives Association (ISDA) master agreements with certain counterparties. These agreements contain various provisions, including but not limited to collateral requirements, events of default, or early termination. Termination events applicable to the counterparty include certain deteriorations in the credit quality of the counterparty. Termination events applicable to the Fund include failure of the Fund to maintain certain net asset levels and/or limit the decline in net assets over various periods of time. In the event of default or early termination, the ISDA master agreement gives the non-defaulting party the right to net and close-out all transactions traded, whether or not arising under the ISDA agreement, to one net amount payable by one counterparty to the other. However, absent an event of default or early termination, OTC derivative assets and liabilities are presented gross and not offset in the Consolidated Statement of Assets and Liabilities. Early termination by the counterparty may result in an immediate payment by the Fund of any net liability owed to that counterparty under the ISDA agreement.
Collateral requirements differ by type of derivative. Collateral or initial margin requirements are set by the broker or exchange clearing house for exchange traded and centrally cleared derivatives. Initial margin deposited is held at the exchange and can be in the form of cash and/or securities. For OTC derivatives traded under an ISDA master agreement, posting of collateral is required by either the Fund or the applicable counterparty if the total net exposure of all OTC derivatives with the applicable counterparty exceeds the minimum transfer amount, which typically ranges from $100,000 to $250,000, and can vary depending on the counterparty and the type of the agreement. Generally, collateral is determined at the close of Fund business each day and any additional collateral required due to changes in derivative values may be delivered by the Fund or the counterparty the next business day, or within a few business days. Collateral pledged and/or received by the Fund for OTC
derivatives, if any, is held in segregated accounts with the Fund’s custodian/counterparty broker and can be in the form of cash and/or securities. Unrestricted cash may be invested according to the Fund’s investment objectives. To the extent that the amounts due to the Fund from its counterparties are not subject to collateralization or are not fully collateralized, the Fund bears the risk of loss from counterparty non-performance.
The Fund entered into exchange traded futures contracts primarily to manage and/or gain exposure to interest rate risk. A futures contract is an agreement between the Fund and a counterparty to buy or sell an asset at a specified price on a future date. Required initial margins are pledged by the Fund, and the daily change in fair value is accounted for as a variation margin payable or receivable.
The Fund entered into OTC forward exchange contracts primarily to manage and/or gain exposure to certain foreign currencies. A forward exchange contract is an agreement between the Fund and a counterparty to buy or sell a foreign currency at a specific exchange rate on a future date.
The Fund entered into credit default swap contracts primarily to manage and/or gain exposure to credit risk. A credit default swap is an agreement between the Fund and a counterparty whereby the buyer of the contract receives credit protection and the seller of the contract guarantees the credit worthiness of a referenced debt obligation. These agreements may be privately negotiated in the over-the-counter market (OTC credit default swaps) or may be executed in a multilateral trade facility platform, such as a registered exchange (centrally cleared credit default swaps). The underlying referenced debt obligation may be a single issuer of corporate or sovereign debt, a credit index, a basket of issuers or indices, or a tranche of a credit index or basket of issuers or indices. In the event of a default of the underlying referenced debt obligation, the buyer is entitled to receive the notional amount of the credit default swap contract from the seller in exchange for the referenced debt obligation, a net settlement amount equal to the notional amount of the credit default swap less the recovery value of the referenced debt obligation, or other agreed upon amount. For centrally cleared credit default swaps, required initial margins are pledged by the Fund, and the daily change in fair value is accounted for as a variation margin payable or receivable in the Consolidated Statement of Assets and Liabilities. Over the term of the contract, the buyer pays the seller a periodic stream of payments, provided that no event
FRANKLIN TEMPLETON VARIABLE INSURANCE PRODUCTS TRUST
NOTES TO CONSOLIDATED FINANCIAL STATEMENTS (UNAUDITED)
Franklin Strategic Income VIP Fund (continued)
1. Organization and Significant Accounting Policies (continued)
d. Derivative Financial Instruments (continued)
of default has occurred. Such periodic payments are accrued daily as an unrealized appreciation or depreciation until the payments are made, at which time they are realized. Upfront payments and receipts are reflected in the Consolidated Statement of Assets and Liabilities and represent compensating factors between stated terms of the credit default swap agreement and prevailing market conditions (credit spreads and other relevant factors). These upfront payments and receipts are amortized over the term of the contract as a realized gain or loss in the Consolidated Statement of Operations.
The Fund entered into OTC cross currency swap contracts primarily to manage and/or gain exposure to certain foreign currencies. A cross currency swap is an agreement between the Fund and a counterparty to exchange cash flows (determined using either a fixed or floating rate) based on the notional amounts of two different currencies. The notional amounts are typically determined based on the spot exchange rates at the opening of the contract. Cross currency swaps may require the exchange of notional amounts at the opening and/or closing of the contract. Over the term of the contract, contractually required payments to be paid and to be received are accrued daily and recorded as unrealized depreciation and appreciation until the payments are made, at which time they are realized. Upfront payments and receipts are reflected in the Consolidated Statement of Assets and Liabilities and represent compensating factors between stated terms of the cross currency swap contract and prevailing market conditions (interest rate spreads and other relevant factors). These upfront payments and receipts are amortized over the term of the contract as a realized gain or loss in the Consolidated Statement of Operations.
The Fund entered into inflation index swap contracts primarily to manage and/or gain exposure to inflation risk. An inflation index swap is an agreement between the Fund and a counterparty to exchange cash flows whereby one party makes payments based on the percentage change in an index that serves as a measure of inflation and the other party makes a regular payment based on a compounded fixed rate, applied to a notional amount. These agreements may be privately negotiated in the over-the-counter market (OTC inflation index swap) or may be executed on a registered exchange (centrally cleared inflation index swap).
For centrally cleared inflation index swaps, required initial margins are pledged by the Fund, and the daily change in fair value is accounted for as a variation margin payable or receivable. Over the term of the contract, contractually required payments to be paid and to be received are accrued daily and recorded as unrealized depreciation and appreciation until the payments are made, at which time they are realized. Typically, an inflation index swap has payment obligations netted and exchanged upon maturity.
The Fund entered into interest rate swap contracts primarily to manage interest rate risk. An interest rate swap is an agreement between the Fund and a counterparty to exchange cash flows based on the difference between two interest rates, applied to a notional amount. These agreements may be privately negotiated in the over-the-counter market (OTC interest rate swaps) or may be executed on a registered exchange (centrally cleared interest rate swaps). For centrally cleared interest rate swaps, required initial margins are pledged by the Fund, and the daily change in fair value is accounted for as a variation margin payable or receivable in the Consolidated Statement of Assets and Liabilities. Over the term of the contract, contractually required payments to be paid and to be received are accrued daily and recorded as unrealized depreciation and appreciation until the payments are made, at which time they are realized. The Fund did not hold any interest rate swap contracts at period end.
The Fund entered into OTC total return swap contracts primarily to manage and/or gain exposure to credit and other market risks of an underlying instrument such as a stock, bond, index or basket of securities or indices. A total return swap is an agreement between the Fund and a counterparty to exchange a return linked to an underlying instrument for a floating or fixed rate payment, both based upon a notional amount. Over the term of the contract, contractually required payments to be paid or received are accrued daily and recorded as unrealized appreciation or depreciation until the payments are made, at which time they are recognized as realized gain or loss.
The Fund purchased or wrote OTC option contracts primarily to manage and/or gain exposure to interest rate and credit risk. An option is a contract entitling the holder to purchase or sell a specific amount of shares or units of an asset or notional amount of a swap (swaption), at a specified price. When an option is purchased or written, an amount equal to the premium paid or received is recorded as an asset or
FRANKLIN TEMPLETON VARIABLE INSURANCE PRODUCTS TRUST
NOTES TO CONSOLIDATED FINANCIAL STATEMENTS (UNAUDITED)
Franklin Strategic Income VIP Fund (continued)
liability, respectively. Upon exercise of an option, the acquisition cost or sales proceeds of the underlying investment is adjusted by any premium received or paid. Upon expiration of an option, any premium received or paid is recorded as a realized gain or loss. Upon closing an option other than through expiration or exercise, the difference between the premium received or paid and the cost to close the position is recorded as a realized gain or loss. The Fund did not hold any option contracts at period end.
The Fund invests in value recovery instruments (VRI) primarily to gain exposure to economic growth. Periodic payments from VRI are dependent on established benchmarks for underlying variables. VRI has a notional amount, which is used to calculate amounts of payments to holders. Payments are recorded upon receipt as realized gains in the Consolidated Statement of Operations. The risks of investing in VRI include growth risk, liquidity, and the potential loss of investment.
See Note 11 regarding other derivative information.
e. Loan Participation Notes
The Fund invests in loan participation notes (Participations). Participations are loans originally issued to a borrower by one or more financial institutions (the Lender) and subsequently sold to other investors, such as the Fund. Participations typically result in the Fund having a contractual relationship only with the Lender and not with the borrower. The Fund has the right to receive from the Lender any payments of principal, interest and fees which the Lender received from the borrower. The Fund generally has no rights to either enforce compliance by the borrower with the terms of the loan agreement or to any collateral relating to the original loan. As a result, the Fund assumes the credit risk of both the borrower and the Lender that is selling the Participation. The Participations may also involve interest rate risk and liquidity risk, including the potential default or insolvency of the borrower and/or the Lender.
f. Investments in FT Holdings Corporation III (FT Subsidiary)
The Fund invests in certain financial instruments through its investment in FT Subsidiary. FT Subsidiary is a Delaware Corporation, is a wholly-owned subsidiary of the Fund, and is able to invest in certain financial instruments consistent with the investment objective of the Fund. At June 30, 2020, FT Subsidiary’s investment, Turtle Bay Resort, as well as any
other assets and liabilities of FT Subsidiary are reflected in the Fund’s Consolidated Statement of Investments and Consolidated Statement of Assets and Liabilities.
At June 30, 2020, FT Subsidiary, which is a tax paying entity, recognized an unrealized loss on its Turtle Bay investment. An estimated deferred tax asset based on such unrealized loss is reflected as FT Subsidiary deferred tax benefit in the Consolidated Statement of Assets and Liabilities. The estimated benefit was calculated using a federal rate of 21%. When the Turtle Bay investment liquidates, the FT Subsidiary will recognize a capital loss. This loss may be carried back to offset prior year capital gains, subject to carryback limitation rules. If there are no limitations, the carryback will result in a tax refund which will relieve the deferred tax asset.
The financial statements have been consolidated and include the accounts of the Fund and FT Subsidiary. All intercompany transactions and balances have been eliminated. At June 30, 2020, the net assets of FT Subsidiary were $6,347,180, representing 1.6% of the Fund’s consolidated net assets. The Fund’s investment in FT Subsidiary is limited to 25% of consolidated assets.
g. Mortgage Dollar Rolls
The Fund enters into mortgage dollar rolls, typically on a TBA basis. Mortgage dollar rolls are agreements between the Fund and a financial institution where the Fund sells (or buys) mortgage-backed securities for delivery on a specified date and simultaneously contracts to repurchase (or sell) substantially similar (same type, coupon, and maturity) securities at a future date and at a predetermined price. Gains or losses are realized on the initial sale, and the difference between the repurchase price and the sale price is recorded as an unrealized gain or loss to the Fund upon entering into the mortgage dollar roll. In addition, the Fund may invest the cash proceeds that are received from the initial sale. During the period between the sale and repurchase, the Fund is not entitled to principal and interest paid on the mortgage backed securities. Transactions in mortgage dollar rolls are accounted for as purchases and sales and may result in an increase to the Fund’s portfolio turnover rate. The risks of mortgage dollar roll transactions include the potential inability of the counterparty to fulfill its obligations.
FRANKLIN TEMPLETON VARIABLE INSURANCE PRODUCTS TRUST
NOTES TO CONSOLIDATED FINANCIAL STATEMENTS (UNAUDITED)
Franklin Strategic Income VIP Fund (continued)
1. Organization and Significant Accounting Policies (continued)
h. Senior Floating Rate Interests
The Fund invests in senior secured corporate loans that pay interest at rates which are periodically reset by reference to a base lending rate plus a spread. These base lending rates are generally the prime rate offered by a designated U.S. bank or the London InterBank Offered Rate (LIBOR). Senior secured corporate loans often require prepayment of principal from excess cash flows or at the discretion of the borrower. As a result, actual maturity may be substantially less than the stated maturity. Senior secured corporate loans in which the Fund invests are generally readily marketable, but may be subject to certain restrictions on resale. On July 27, 2017, the United Kingdom’s Financial Conduct Authority announced its intention to cease sustaining LIBOR after 2021. There remains uncertainty regarding the future utilization of LIBOR and the nature of any replacement rate. As such, the potential effect of a transition away from LIBOR on the Fund or the Fund’s investments that use or may use a floating rate based on LIBOR cannot yet be determined.
i. Marketplace Lending
The Fund invests in loans obtained through marketplace lending. Marketplace lending, sometimes referred to as peer-to-peer lending, is a method of financing in which a platform facilitates the borrowing and lending of money. It is considered an alternative to more traditional forms of debt financing. Prospective borrowers are required to provide certain financial information to the platform, including, but not limited to, the intended purpose of the loan, income, employment information, credit score, debt-to-income ratio, credit history (including defaults and delinquencies) and home ownership status. Based on this and other information, the platform assigns its own credit rating to the borrower and sets the interest rate for the requested loan. The platform then posts the borrowing requests online, giving investors the opportunity to purchase the loans based on factors such as the interest rates and expected yields of the loans, the borrower background data, and the credit rating assigned by the platform.
When the Fund invests in these loans, it usually purchase all rights, title and interest in the loans pursuant to a loan purchase agreement directly from the platform. The platform or a third-party servicer typically continues to service the loans, collecting payments and distributing them to the Fund,
less any servicing fees assessed. The servicer is typically responsible for taking actions against a borrower in the event of a default on the loan. Servicing fees, along with other administration fees, are included in marketplace lending fees in the Consolidated Statement of Operations. The Fund, as an investor in a loan, would be entitled to receive payment only from the borrower and would not be able to recover any deficiency from the platform, except under very narrow circumstances. The loans in which the Fund may invest are unsecured.
j. Income and Deferred Taxes
It is the Fund’s policy to qualify as a regulated investment company under the Internal Revenue Code. The Fund intends to distribute to shareholders substantially all of its taxable income and net realized gains to relieve it from federal income and if applicable, excise taxes. As a result, no provision for U.S. federal income taxes is required.
The Fund may be subject to foreign taxation related to income received, capital gains on the sale of securities and certain foreign currency transactions in the foreign jurisdictions in which it invests. Foreign taxes, if any, are recorded based on the tax regulations and rates that exist in the foreign markets in which the Fund invests. When a capital gain tax is determined to apply, the Fund records an estimated deferred tax liability in an amount that would be payable if the securities were disposed of on the valuation date.
The Fund may recognize an income tax liability related to its uncertain tax positions under U.S. GAAP when the uncertain tax position has a less than 50% probability that it will be sustained upon examination by the tax authorities based on its technical merits. As of June 30, 2020, the Fund has determined that no tax liability is required in its financial statements related to uncertain tax positions for any open tax years (or expected to be taken in future tax years). Open tax years are those that remain subject to examination and are based on the statute of limitations in each jurisdiction in which the Fund invests.
k. Security Transactions, Investment Income, Expenses and Distributions
Security transactions are accounted for on trade date. Realized gains and losses on security transactions are determined on a specific identification basis. Interest income and estimated expenses are accrued daily. Amortization of
FRANKLIN TEMPLETON VARIABLE INSURANCE PRODUCTS TRUST
NOTES TO CONSOLIDATED FINANCIAL STATEMENTS (UNAUDITED)
Franklin Strategic Income VIP Fund (continued)
premium and accretion of discount on debt securities are included in interest income. Paydown gains and losses are recorded as an adjustment to interest income. Facility fees are recognized as income over the expected term of the loan. Dividend income is recorded on the ex-dividend date except for certain dividends from securities where the dividend rate is not available. In such cases, the dividend is recorded as soon as the information is received by the Fund. Distributions to shareholders are recorded on the ex-dividend date. Distributable earnings are determined according to income tax regulations (tax basis) and may differ from earnings recorded in accordance with U.S. GAAP. These differences may be permanent or temporary. Permanent differences are reclassified among capital accounts to reflect their tax character. These reclassifications have no impact on net assets or the results of operations. Temporary differences are not reclassified, as they may reverse in subsequent periods.
Common expenses incurred by the Trust are allocated among the Funds based on the ratio of net assets of each Fund to the combined net assets of the Trust or based on the ratio of number of shareholders of each Fund to the combined number of shareholders of the Trust. Fund specific expenses are charged directly to the Fund that incurred the expense.
Realized and unrealized gains and losses and net investment income, excluding class specific expenses, are allocated daily to each class of shares based upon the relative proportion of net assets of each class. Differences in per share distributions by class are generally due to differences in class specific expenses.
Inflation-indexed bonds are adjusted for inflation through periodic increases or decreases in the security’s interest accruals, face amount, or principal redemption value, by amounts corresponding to the rate of inflation as measured by an index. Any increase or decrease in the face amount or principal redemption value will be included as interest income in the Consolidated Statement of Operations.
l. Accounting Estimates
The preparation of financial statements in accordance with U.S. GAAP requires management to make estimates and assumptions that affect the reported amounts of assets and liabilities at the date of the financial statements and the amounts of income and expenses during the reporting period. Actual results could differ from those estimates.
m. Guarantees and Indemnifications
Under the Trust’s organizational documents, its officers and trustees are indemnified by the Trust against certain liabilities arising out of the performance of their duties to the Trust. Additionally, in the normal course of business, the Trust, on behalf of the Fund, enters into contracts with service providers that contain general indemnification clauses. The Trust’s maximum exposure under these arrangements is unknown as this would involve future claims that may be made against the Trust that have not yet occurred. Currently, the Trust expects the risk of loss to be remote.
2. Shares of Beneficial Interest
At June 30, 2020, there were an unlimited number of shares authorized (without par value). Transactions in the Fund’s shares were as follows:
| | | | | | | | | | | | | | | | |
| | |
| | | Six Months Ended June 30, 2020 | | | Year Ended
December 31, 2019 | |
| | | | |
| | | Shares | | | Amount | | | Shares | | | Amount |
| | | | |
| Class 1 Shares: | | | | | | | | | | | | | | | | |
Shares sold | | | 837,599 | | | $ | 9,025,672 | | | | 671,682 | | | $ | 7,349,679 | |
Shares issued in reinvestment of distributions | | | 1,318,738 | | | | 13,266,506 | | | | 1,499,135 | | | | 16,055,733 | |
Shares redeemed | | | (2,581,967 | ) | | | (26,737,911 | ) | | | (4,454,817 | ) | | | (48,690,081) | |
| | | | |
| | | | |
Net increase (decrease) | | | (425,630 | ) | | $ | (4,445,733 | ) | | | (2,284,000 | ) | | $ | (25,284,669) | |
| | | | |
FRANKLIN TEMPLETON VARIABLE INSURANCE PRODUCTS TRUST
NOTES TO CONSOLIDATED FINANCIAL STATEMENTS (UNAUDITED)
Franklin Strategic Income VIP Fund (continued)
2. Shares of Beneficial Interest (continued)
| | | | | | | | | | | | | | | | |
| | |
| | | Six Months Ended June 30, 2020 | | | Year Ended
December 31, 2019 | |
| | | | |
| | | Shares | | | Amount | | | Shares | | | Amount |
| Class 2 Shares: | | | | | | | | | | | | | | | | |
Shares sold | | | 1,476,226 | | | $ | 14,944,694 | | | | 1,948,126 | | | $ | 20,598,257 | |
Shares issued in reinvestment of distributions | | | 480,115 | | | | 4,661,916 | | | | 445,266 | | | | 4,608,498 | |
Shares redeemed | | | (1,408,509 | ) | | | (14,076,838 | ) | | | (2,080,736 | ) | | | (21,979,199) | |
| | | | |
| | | | |
Net increase (decrease) | | | 547,832 | | | $ | 5,529,772 | | | | 312,656 | | | $ | 3,227,556 | |
| | | | |
| Class 4 Shares: | | | | | | | | | | | | | | | | |
Shares sold | | | 259,830 | | | $ | 2,824,937 | | | | 332,522 | | | $ | 3,653,954 | |
Shares issued in reinvestment of distributions | | | 230,681 | | | | 2,304,505 | | | | 277,403 | | | | 2,951,572 | |
Shares redeemed | | | (703,841 | ) | | | (7,134,984 | ) | | | (1,334,939 | ) | | | (14,432,171) | |
| | | | |
| | | | |
Net increase (decrease) | | | (213,330 | ) | | $ | (2,005,542 | ) | | | (725,014 | ) | | $ | (7,826,645) | |
| | | | |
3. Transactions with Affiliates
Franklin Resources, Inc. is the holding company for various subsidiaries that together are referred to as Franklin Templeton. Certain officers and trustees of the Fund are also officers and/or directors of the following subsidiaries:
| | |
| |
| Subsidiary | | Affiliation |
Franklin Advisers, Inc. (Advisers) | | Investment manager |
Franklin Templeton Services, LLC (FT Services) | | Administrative manager |
Franklin Templeton Distributors, Inc. (Distributors) | | Principal underwriter |
Franklin Templeton Investor Services, LLC (Investor Services) | | Transfer agent |
a. Management Fees
The Fund pays an investment management fee to Advisers based on the average daily net assets of the Fund as follows:
| | |
| |
| Annualized Fee Rate | | Net Assets |
0.625% | | Up to and including $500 million |
0.525% | | Over $500 million, up to and including $1 billion |
0.480% | | Over $1 billion, up to and including $1.5 billion |
0.435% | | Over $1.5 billion, up to and including $6.5 billion |
0.415% | | Over $6.5 billion, up to and including $11.5 billion |
0.400% | | Over $11.5 billion, up to and including $16.5 billion |
0.390% | | Over $16.5 billion, up to and including $19 billion |
0.380% | | Over $19 billion, up to and including $21.5 billion |
0.370% | | In excess of $21.5 billion |
b. Administrative Fees
Under an agreement with Advisers, FT Services provides administrative services to the Fund. The fee is paid by Advisers based on the Fund’s average daily net assets, and is not an additional expense of the Fund.
FRANKLIN TEMPLETON VARIABLE INSURANCE PRODUCTS TRUST
NOTES TO CONSOLIDATED FINANCIAL STATEMENTS (UNAUDITED)
Franklin Strategic Income VIP Fund (continued)
c. Distribution Fees
The Board has adopted distribution plans for Class 2 and Class 4 shares pursuant to Rule 12b-1 under the 1940 Act. Under the Fund’s compensation distribution plans, the Fund pays Distributors for costs incurred in connection with the servicing, sale and distribution of the Fund’s shares up to 0.25% and 0.35% per year of its average daily net assets of Class 2 and Class 4, respectively. The plan year, for purposes of monitoring compliance with the maximum annual plan rates, is February 1 through January 31.
d. Transfer Agent Fees
Investor Services, under terms of an agreement, performs shareholder servicing for the Fund and is not paid by the Fund for the services.
e. Investments in Affiliated Management Investment Companies
The Fund invests in one or more affiliated management investment companies for purposes other than exercising a controlling influence over the management or policies. Management fees paid by the Fund are waived on assets invested in the affiliated management investment companies, as noted in the Consolidated Statement of Operations, in an amount not to exceed the management and administrative fees paid directly or indirectly by each affiliate. During the period ended June 30, 2020, the Fund held investments in affiliated management investment companies as follows:
| | | | | | | | | | | | | | | | | | | | | | | | | | | | | | | | |
| | | | | | | | |
| | | Value at
Beginning
of Period | | | Purchases | | | Sales | | | Realized
Gain (Loss) | | | Net Change in
Unrealized
Appreciation
(Depreciation) | | | Value at
End of
Period | | | Number of
Shares
Held at End
of Period | | | Dividend
Income | |
| Non-Controlled Affiliates | | | | | | | | | | | | | | | | | | | | | | | | | | | | | |
Franklin Floating Rate Income Fund | | $ | 9,264,918 | | | $ | — | | | $ | — | | | | $ — | | | $ | (1,197,278) | | | $ | 8,067,640 | | | | 1,118,951 | | | $ | 216,312 | |
Institutional Fiduciary Trust Money Market Portfolio, 0.00% | | | 11,463,714 | | | | 102,930,148 | | | | (99,913,332) | | | | — | | | | — | | | | 14,480,530 | | | | 14,480,530 | | | | 29,387 | |
| | | | | | | | | | | | |
Total Affiliated Securities | | $ | 20,728,632 | | | $ | 102,930,148 | | | $ | (99,913,332) | | | | $ — | | | $ | (1,197,278) | | | $ | 22,548,170 | | | | | | | $ | 245,699 | |
| | | | | | | | | | | | |
4. Expense Offset Arrangement
The Fund has entered into an arrangement with its custodian whereby credits realized as a result of uninvested cash balances are used to reduce a portion of the Fund’s custodian expenses. During the period ended June 30, 2020, the custodian fees were reduced as noted in the Consolidated Statement of Operations.
5. Income Taxes
For tax purposes, capital losses may be carried over to offset future capital gains.
At December 31, 2019, the capital loss carryforwards were as follows:
| | | | |
Capital loss carryforwards not subject to expiration: | | | | |
Short term | | $ | 271,803 | |
Long term | | | 44,135,035 | |
| | | | |
| |
Total capital loss carryforwards | | $ | 44,406,838a | |
| | | | |
aSubject to certain limitations under Internal Revenue Code Section 382.
FRANKLIN TEMPLETON VARIABLE INSURANCE PRODUCTS TRUST
NOTES TO CONSOLIDATED FINANCIAL STATEMENTS (UNAUDITED)
Franklin Strategic Income VIP Fund (continued)
5. Income Taxes (continued)
At June 30, 2020, the cost of investments and net unrealized appreciation (depreciation) for income tax purposes were as follows:
| | | | |
Cost of investments | | $ | 427,600,415 | |
| | | | |
| |
Unrealized appreciation | | $ | 12,448,801 | |
Unrealized depreciation | | | (34,674,613) | |
| | | | |
| |
Net unrealized appreciation (depreciation) | | $ | (22,225,812) | |
| | | | |
Differences between income and/or capital gains as determined on a book basis and a tax basis are primarily due to differing treatments of foreign currency transactions, paydown losses, bond discounts and premiums and swaps.
6. Investment Transactions
Purchases and sales of investments (excluding short term securities) for the period ended June 30, 2020, aggregated $239,526,193 and $253,945,343, respectively.
7. Credit Risk and Defaulted Securities
At June 30, 2020, the Fund had 31.4% of its portfolio invested in high yield, senior secured floating rate loans, or other securities rated below investment grade and unrated securities, if any. These securities may be more sensitive to economic conditions causing greater price volatility and are potentially subject to a greater risk of loss due to default than higher rated securities.
The Fund held defaulted securities and/or other securities for which the income has been deemed uncollectible. At June 30, 2020, the aggregate value of these securities was $885,543, representing 0.2% of the Fund’s net assets. The Fund discontinues accruing income on securities for which income has been deemed uncollectible and provides an estimate for losses on interest receivable. The securities have been identified in the accompanying Consolidated Statement of Investments.
8. Novel Coronavirus Pandemic
The global outbreak of the novel coronavirus disease, known as COVID-19, has caused adverse effects on many companies, sectors, nations, regions and the markets in general, and may continue for an unpredictable duration. The effects of this pandemic may materially impact the value and performance of the Fund, its ability to buy and sell fund investments at appropriate valuations and its ability to achieve its investment objectives.
9. Restricted Securities
The Fund invests in securities that are restricted under the Securities Act of 1933 (1933 Act). Restricted securities are often purchased in private placement transactions, and cannot be sold without prior registration unless the sale is pursuant to an exemption under the 1933 Act. Disposal of these securities may require greater effort and expense, and prompt sale at an acceptable price may be difficult. The Fund may have registration rights for restricted securities. The issuer generally incurs all registration costs.
FRANKLIN TEMPLETON VARIABLE INSURANCE PRODUCTS TRUST
NOTES TO CONSOLIDATED FINANCIAL STATEMENTS (UNAUDITED)
Franklin Strategic Income VIP Fund (continued)
At June 30, 2020, investments in restricted securities, excluding securities exempt from registration under the 1933 Act, were as follows:
| | | | | | | | | | | | | | |
| | | | |
Principal
Amount/
Shares/
Units | | Issuer | | Acquisition
Date | | | Cost | | | Value | |
| 18,684 | | a Appvion Operations Inc. | | | 4/12/19 | | | $ | 252,711 | | | $ | 353,175 | |
| 14,792,309 | | b K2016470219 South Africa Ltd., A | | | 2/08/13 - 2/01/17 | | | | 114,768 | | | | — | |
| 1,472,041 | | b K2016470219 South Africa Ltd., B | | | 2/01/17 | | | | 1,093 | | | | — | |
| 143,820 | | c Onsite Rental Group Operations Pty. Ltd. | | | 5/20/20 | | | | — | | | | — | |
| 262,519 | | c Onsite Rental Group Operations Pty. Ltd., secured note, PIK, 6.10%, 10/26/23 | | | 4/12/19 | | | | 238,236 | | | | 213,088 | |
| 7,021 | | d Remington Outdoor Co. Inc., Litigation Units | | | 4/12/19 | | | | — | | | | — | |
| | | | | | | | | | |
| | | | |
| | Total Restricted Securities (Value is 0.1% of Net Assets) | | | | | | $ | 606,808 | | | $ | 566,263 | |
| | | | | | | | | | |
aThe Fund also invests in unrestricted securities of the issuer, valued at $266,560 as of June 30, 2020.
bThe Fund also invests in unrestricted securities of the issuer, valued at $0 as of June 30, 2020.
cThe Fund also invests in unrestricted securities of the issuer, valued at $161,048 as of June 30, 2020.
dThe Fund also invests in unrestricted securities of the issuer, valued at $37,288 as of June 30, 2020.
10. Unfunded Loan Commitments
The Fund enters into certain credit agreements, all or a portion of which may be unfunded. The Fund is obligated to fund these loan commitments at the borrowers’ discretion. Unfunded loan commitments and funded portions of credit agreements are marked to market daily and any unrealized appreciation or depreciation is included in the Consolidated Statement of Assets and Liabilities and the Consolidated Statement of Operations. Funded portions of credit agreements are presented in the Consolidated Statement of Investments.
At June 30, 2020, unfunded commitments were as follows:
| | | | |
| |
| Borrower | | Unfunded
Commitment | |
General Nutrition Centers, Inc., DIP | | $ | 138,096 | |
| | | | |
11. Other Derivative Information
At June 30, 2020, investments in derivative contracts are reflected in the Consolidated Statement of Assets and Liabilities as follows:
| | | | | | | | | | | | |
| | |
| | | Asset Derivatives | | | Liability Derivatives | |
| | | | |
Derivative Contracts
Not Accounted for as
Hedging Instruments | | Consolidated Statement of Assets and Liabilities Location | | Fair Value | | | Consolidated Statement of Assets and Liabilities
Location | | Fair Value | |
Interest rate contracts | | Variation margin on futures contracts | | $
| 473,752
| a
| | Variation margin on futures contracts | | $ | — | |
| | Unrealized appreciation on OTC swap contracts | | | 17,535 | | | Unrealized depreciation on OTC swap contracts | | | — | |
FRANKLIN TEMPLETON VARIABLE INSURANCE PRODUCTS TRUST
NOTES TO CONSOLIDATED FINANCIAL STATEMENTS (UNAUDITED)
Franklin Strategic Income VIP Fund (continued)
11. Other Derivative Information (continued)
| | | | | | | | | | | | |
| | |
| | | Asset Derivatives | | | Liability Derivatives | |
| | | | |
Derivative Contracts
Not Accounted for as
Hedging Instruments | | Consolidated Statement of Assets and Liabilities Location | | Fair Value | | | Consolidated Statement of Assets and Liabilities
Location | | Fair Value | |
Foreign exchange contracts | | Unrealized appreciation on OTC forward exchange contracts | | $ | 382,336 | | | Unrealized depreciation on OTC forward exchange contracts | | $ | 2,206,849 | |
Credit contracts | | Variation margin on centrally cleared swap contracts | | | 4,337 | a | | Variation margin on centrally cleared swap contracts | | | 41,938 | a |
| | OTC swap contracts (upfront payments) | | | 25,674 | | | OTC swap contracts (upfront receipts) | | | 345,272 | |
| | Unrealized appreciation on OTC swap contracts | | | 39,294 | | | Unrealized depreciation on OTC swap contracts | | | 861,921 | |
Inflation contracts | | Variation margin on centrally cleared swap contracts | | | — | | | Variation margin on centrally cleared swap contracts | | | 746,230 | |
Value recovery instruments | | Investments in securities, at value | | | 908,051 | b | | | | | | |
| | | | | | | | | | | | |
Totals | | | | $ | 1,850,979 | | | | | $ | 4,202,210 | |
| | | | | | | | | | | | |
aThis amount reflects the cumulative appreciation (depreciation) of futures contracts and centrally cleared swap contracts as reported in the Consolidated Statement of Investments. Only the variation margin receivable/payable at period end is separately reported within the Consolidated Statement of Assets and Liabilities. Prior variation margin movements were recorded to cash upon receipt or payment.
bVRI are included in investments in securities, at value in the Consolidated Statement of Assets and Liabilities.
For the period ended June 30, 2020, the effect of derivative contracts in the Consolidated Statement of Operations was as follows:
| | | | | | | | | | | | |
| | | | |
Derivative Contracts Not Accounted for as Hedging Instruments | | Consolidated Statement of
Operations Location | | Net Realized
Gain (Loss) for
the Period | | | Consolidated Statement of
Operations Location | | Net Change in
Unrealized
Appreciation
(Depreciation)
for the Period | |
| | Net realized gain (loss) from: | | | | | | Net change in unrealized appreciation (depreciation) on: | | | | |
Interest rate contracts | | Investments | | $ | (474,306) | a | | Investments | | $ | — | |
| | Written options | | | 190,296 | | | Written options | | | — | |
| | Futures contracts | | | (1,146,064) | | | Futures contracts | | | 637,011 | |
| | Swap contracts | | | 158,151 | | | Swap contracts | | | 55,296 | |
Foreign exchange contracts | | Investments | | | 86,372 | a | | Investments | | | — | |
| | Forward exchange contracts | | | (203,042) | | | Forward exchange contracts | | | (1,044,217) | |
Credit contracts | | Written options | | | (713,450) | | | Written options | | | — | |
| | Swap contracts | | | (2,343,797) | | | Swap contracts | | | (985,285) | |
Inflation contracts | | Swap contracts | | | (372,288) | | | Swap contracts | | | (746,230) | |
Value recovery instruments | | Investments | | | — | | | Investments | | | (29,606) | a |
| | | | | | | | | | | | |
Totals | | | | $ | (4,818,128) | | | | | $ | (2,113,031) | |
| | | | | | | | | | | | |
aPurchased option contracts and VRI are included in net realized gain (loss) from investments and net change in unrealized appreciation (depreciation) on investments in the Consolidated Statement of Operations.
FRANKLIN TEMPLETON VARIABLE INSURANCE PRODUCTS TRUST
NOTES TO CONSOLIDATED FINANCIAL STATEMENTS (UNAUDITED)
Franklin Strategic Income VIP Fund (continued)
For the period ended June 30, 2020, the average month end notional amount of futures contracts, swap contracts and options, and the average month end contract value for forward exchange contracts, and average month end fair value of VRI, were as follows:
| | | | |
Futures Contracts | | $ | 108,113,720 | |
Swap contracts | | $ | 55,934,361 | |
Forward exchange contracts | | $ | 90,676,322 | |
VRI | | $ | 868,671 | |
Options. | | $ | 7,214,286 | |
| | | | | | | | |
| |
| | | Gross Amounts of
Assets and Liabilities Presented
in the Consolidated Statement of Assets and Liabilities | |
| | |
| | | Assetsa | | | Liabilitiesa | |
| Derivatives | | | | | | | | |
Forward exchange contracts | | | $382,336 | | | | $2,206,849 | |
Swap contracts | | | 82,503 | | | | 1,207,193 | |
| | | | |
Total | | | $464,839 | | | | $3,414,042 | |
| | | | |
aAbsent an event of default or early termination, OTC derivative assets and liabilities are presented gross and not offset in the Consolidated Statement of Assets and Liabilities.
At June 30, 2020, OTC derivative assets, which may be offset against OTC derivative liabilities and collateral received from the counterparty, are as follows:
| | | | | | | | | | | | | | | | | | | | |
| | | |
| | | | | | Amounts Not Offset in the
Consolidated Statement of Assets and Liabilities | | | | |
| | | | | |
| | |
| Gross
Amounts of Assets Presented in
the Consolidated Statement of
Assets and Liabilities |
| |
| Financial
Instruments
Available
for Offset |
| |
| Financial
Instruments
Collateral
Received |
| |
| Cash
Collateral
Received |
| |
| Net Amount
(Not less
than zero) |
|
| Counterparty | | | | | | | | | | | | | | | | | | | | |
BNDP | | | $ — | | | | $ — | | | | $ — | | | | $ — | | | | $ — | |
BZWS | | | 36,580 | | | | (36,580 | ) | | | — | | | | — | | | | — | |
CITI | | | 33,500 | | | | (33,500 | ) | | | — | | | | — | | | | — | |
DBAB | | | — | | | | — | | | | — | | | | — | | | | — | |
GSCO | | | — | | | | — | | | | — | | | | — | | | | — | |
JPHQ | | | 394,759 | | | | (394,759 | ) | | | — | | | | — | | | | — | |
MSCO | | | — | | | | — | | | | — | | | | — | | | | — | |
| | | | |
Total | | | $464,839 | | | | $(464,839 | ) | | | $ — | | | | $ — | | | | $ — | |
| | | | |
FRANKLIN TEMPLETON VARIABLE INSURANCE PRODUCTS TRUST
NOTES TO CONSOLIDATED FINANCIAL STATEMENTS (UNAUDITED)
Franklin Strategic Income VIP Fund (continued)
11. Other Derivative Information (continued)
At June 30, 2020, OTC derivative liabilities, which may be offset against OTC derivative assets and collateral pledged to the counterparty, are as follows:
| | | | | | | | | | | | | | | | | | | | |
| | | |
| | | | | | Amounts Not Offset in the
Consolidated Statement of Assets and Liabilities | | | | |
| | | | | |
| | |
| Gross
Amounts of Liabilities Presented in
the Consolidated Statement of
Assets and Liabilities |
| |
| Financial
Instruments
Available
for Offset |
| |
| Financial
Instruments
Collateral
Pledged |
| |
| Cash
Collateral
Pledgeda |
| |
| Net Amount
(Not less
than zero) |
|
| Counterparty | | | | | | | | | | | | | | | | | | | | |
BNDP | | | $ 25,680 | | | | $ — | | | | $ — | | | | $ (25,680 | ) | | | $ — | |
BZWS | | | 52,631 | | | | (36,580 | ) | | | — | | | | — | | | | 16,051 | |
CITI | | | 116,017 | | | | (33,500 | ) | | | — | | | | (82,517 | ) | | | — | |
DBAB | | | 5,681 | | | | — | | | | — | | | | — | | | | 5,681 | |
GSCO | | | 86,648 | | | | — | | | | — | �� | | | (70,000 | ) | | | 16,648 | |
JPHQ | | | 2,477,317 | | | | (394,759 | ) | | | — | | | | (1,850,000 | ) | | | 232,558 | |
MSCO | | | 650,068 | | | | — | | | | — | | | | (590,000 | ) | | | 60,068 | |
| | | | |
Total | | | $3,414,042 | | | | $(464,839 | ) | | | $ — | | | | $(2,618,197 | ) | | | $331,006 | |
| | | | |
aIn some instances, the collateral amounts disclosed in the table above were adjusted due to the requirement to limit the collateral amounts to avoid the effect of overcollateralization. Actual collateral received and/or pledged may be more than the amounts disclosed herein.
See Note 1(d) regarding derivative financial instruments.
See Abbreviations on page FSI-56.
12. Credit Facility
The Fund, together with other U.S. registered and foreign investment funds (collectively, Borrowers), managed by Franklin Templeton, are borrowers in a joint syndicated senior unsecured credit facility totaling $2 billion (Global Credit Facility) which matures on February 5, 2021. This Global Credit Facility provides a source of funds to the Borrowers for temporary and emergency purposes, including the ability to meet future unanticipated or unusually large redemption requests.
Under the terms of the Global Credit Facility, the Fund shall, in addition to interest charged on any borrowings made by the Fund and other costs incurred by the Fund, pay its share of fees and expenses incurred in connection with the implementation and maintenance of the Global Credit Facility, based upon its relative share of the aggregate net assets of all of the Borrowers, including an annual commitment fee of 0.15% based upon the unused portion of the Global Credit Facility. These fees are reflected in other expenses in the Consolidated Statement of Operations. During the period ended June 30, 2020, the Fund did not use the Global Credit Facility.
13. Fair Value Measurements
The Fund follows a fair value hierarchy that distinguishes between market data obtained from independent sources (observable inputs) and the Fund’s own market assumptions (unobservable inputs). These inputs are used in determining the value of the Fund’s financial instruments and are summarized in the following fair value hierarchy:
| | • | | Level 1 – quoted prices in active markets for identical financial instruments |
FRANKLIN TEMPLETON VARIABLE INSURANCE PRODUCTS TRUST
NOTES TO CONSOLIDATED FINANCIAL STATEMENTS (UNAUDITED)
Franklin Strategic Income VIP Fund (continued)
| | • | | Level 2 – other significant observable inputs (including quoted prices for similar financial instruments, interest rates, prepayment speed, credit risk, etc.) |
| | • | | Level 3 – significant unobservable inputs (including the Fund’s own assumptions in determining the fair value of financial instruments) |
The input levels are not necessarily an indication of the risk or liquidity associated with financial instruments at that level.
A summary of inputs used as of June 30, 2020, in valuing the Fund’s assets and liabilities carried at fair value, is as follows:
| | | | | | | | | | | | | | | | |
| | | | |
| | | Level 1 | | | Level 2 | | | Level 3 | | | Total | |
| Assets: | | | | | | | | | | | | | | | | |
Investments in Securities:a | | | | | | | | | | | | | | | | |
Equity Investments:b | | | | | | | | | | | | | | | | |
Commercial & Professional Services | | $ | — | | | $ | 37,288 | | | $ | — | | | $ | 37,288 | |
Consumer Services | | | — | | | | — | | | | 41,832 | | | | 41,832 | |
Energy | | | 39,587 | | | | — | | | | 190,677 | | | | 230,264 | |
Materials | | | 67,822 | | | | — | | | | 353,175 | | | | 420,997 | |
Media & Entertainment | | | 91,642 | | | | — | | | | 1,008 | | | | 92,650 | |
All Other Equity Investments | | | 8,067,640 | | | | — | | | | —c | | | | 8,067,640 | |
Convertible Bonds | | | — | | | | 2,189 | | | | — | | | | 2,189 | |
Corporate Bonds: | | | | | | | | | | | | | | | | |
Capital Goods | | | — | | | | 6,802,507 | | | | 213,088 | | | | 7,015,595 | |
Retailing | | | — | | | | 810,569 | | | | 1,763c | | | | 812,332 | |
All Other Corporate Bonds | | | — | | | | 168,110,350 | | | | — | | | | 168,110,350 | |
Senior Floating Rate Interests: | | | | | | | | | | | | | | | | |
Capital Goods | | | — | | | | 331,225 | | | | 161,048 | | | | 492,273 | |
Household & Personal Products | | | — | | | | — | | | | 2,273,679 | | | | 2,273,679 | |
All Other Senior Floating Rate Interests | | | — | | | | 17,932,767 | | | | — | | | | 17,932,767 | |
Marketplace Loans | | | — | | | | — | | | | 964,121 | | | | 964,121 | |
Foreign Government and Agency Securities | | | — | | | | 49,801,941 | | | | — | | | | 49,801,941 | |
U.S. Government and Agency Securities | | | — | | | | 12,727,306 | | | | — | | | | 12,727,306 | |
Asset-Backed Securities and Commercial Mortgage-Backed Securities | | | — | | | | 82,596,248 | | | | — | | | | 82,596,248 | |
Mortgage-Backed Securities | | | — | | | | 30,850,305 | | | | — | | | | 30,850,305 | |
Municipal Bonds | | | — | | | | 11,789,744 | | | | — | | | | 11,789,744 | |
Escrows and Litigation Trusts | | | — | | | | 7,215 | | | | —c | | | | 7,215 | |
Short Term Investments | | | 14,480,530 | | | | 60,072 | | | | — | | | | 14,540,602 | |
| | | | |
Total Investments in Securities | | $ | 22,747,221 | | | $ | 381,859,726 | | | $ | 4,200,391 | | | $ | 408,807,338 | |
| | | | |
Other Financial Instruments: | | | | | | | | | | | | | | | | |
Futures Contracts | | $ | 473,752 | | | $ | — | | | $ | — | | | $ | 473,752 | |
Forward Exchange Contracts | | | — | | | | 382,336 | | | | — | | | | 382,336 | |
Swap Contracts | | | — | | | | 61,166 | | | | — | | | | 61,166 | |
Unfunded Loan Commitments | | | — | | | | 16,008 | | | | — | | | | 16,008 | |
| | | | |
Total Other Financial Instruments | | $ | 473,752 | | | $ | 459,510 | | | $ | — | | | $ | 933,262 | |
| | | | |
FRANKLIN TEMPLETON VARIABLE INSURANCE PRODUCTS TRUST
NOTES TO CONSOLIDATED FINANCIAL STATEMENTS (UNAUDITED)
Franklin Strategic Income VIP Fund (continued)
13. Fair Value Measurements (continued)
| | | | | | | | | | | | | | | | |
| | | | |
| | | Level 1 | | | Level 2 | | | Level 3 | | | Total | |
| Liabilities: | | | | | | | | | | | | | | | | |
Other Financial Instruments: | | | | | | | | | | | | | | | | |
Forward Exchange Contracts | | $ | — | | | $ | 2,206,849 | | | $ | — | | | $ | 2,206,849 | |
Swap Contracts. | | | — | | | | 1,650,089 | | | | — | | | | 1,650,089 | |
| | | | |
Total Other Financial Instruments | | $ | — | | | $ | 3,856,938 | | | $ | — | | | $ | 3,856,938 | |
| | | | |
aFor detailed categories, see the accompanying Consolidated Statement of Investments.
bIncludes common stocks and management investment companies as well as other equity interests.
cIncludes securities determined to have no value at June 30, 2020.
A reconciliation in which Level 3 inputs are used in determining fair value is presented when there are significant Level 3 assets and/or liabilities at the beginning and/or end of the period. At June 30, 2020, the reconciliation is as follows:
| | | | | | | | | | | | | | | | | | | | | | | | | | | | | | | | | | | | | | | | |
| | | | | | | | | | |
| | | Balance at
Beginning of
Period | | | Purchases | | | Sales | | | Transfer
Into
Level 3a | | | Transfer
Out of
Level 3b | | | Cost Basis
Adjustmentsc
| | | Net
Realized
Gain
(Loss) | | | Net
Unrealized
Appreciation
(Depreciation) | | | Balance
at End
of Period | | | Net Change in
Unrealized
Appreciation
(Depreciation)
on Assets
Held at
Period End | |
| Assets: | | | | | | | | | | | | | | | | | | | | | | | | | | | | | | | | | | | | | | | | |
Investments in Securities: | | | | | | | | | | | | | | | | | | | | | | | | | | | | | | | | | | | | | | | | |
Equity Investments:d | | | | | | | | | | | | | | | | | | | | | | | | | | | | | | | | | | | | | | | | |
Commercial & Professional Services | | $ | 46,610 | | | | $ — | | | | $— | | | | $ — | | | $ | (37,288 | ) | | | $ — | | | | $— | | | $ | (9,322 | ) | | $ | — | | | $ | — | |
Consumer Services | | | 41,832 | | | | — | | | | — | | | | — | | | | — | | | | — | | | | — | | | | — | | | | 41,832 | | | | — | |
Energy | | | 2,073e | | | | — | | | | — | | | | 182,716 | | | | — | | | | — | | | | — | | | | 5,888 | | | | 190,677 | | | | 5,888 | |
Materials | | | 254,512 | | | | — | | | | — | | | | — | | | | — | | | | — | | | | — | | | | 98,663 | | | | 353,175 | | | | 98,663 | |
Media & Entertainment | | | 2,040 | | | | — | | | | — | | | | — | | | | — | | | | — | | | | — | | | | (1,032 | ) | | | 1,008 | | | | (1,032 | ) |
Retailing | | | 11,614 | | | | — | | | | — | | | | — | | | | — | | | | — | | | | — | | | | (11,614 | ) | | | — e | | | | (11,614 | ) |
Corporate Bonds: | | | | | | | | | | | | | | | | | | | | | | | | | | | | | | | | | | | | | | | | |
Capital Goods | | | — | | | | — | | | | — | | | | 219,039 | | | | — | | | | — | | | | — | | | | (5,951 | ) | | | 213,088 | | | | (5,951 | ) |
Retailing | | | 2,769 | | | | 196 | | | | — | | | | — | | | | — | | | | (69,796 | ) | | | — | | | | 68,594 | | | | 1,763e | | | | 68,594 | |
Senior Floating Rate Interests: | | | | | | | | | | | | | | | | | | | | | | | | | | | | | | | | | | | | | | | | |
Capital Goods | | | — | | | | — | | | | — | | | | 161,048 | | | | — | | | | — | | | | — | | | | — | | | | 161,048 | | | | — | |
Household & Personal Products | | | 2,416,190 | | | | — | | | | — | | | | — | | | | — | | | | 8,318 | | | | — | | | | (150,829 | ) | | | 2,273,679 | | | | (150,829 | ) |
Marketplace Loans | | | — | | | | 1,149,952 | | | | — | | | | — | | | | — | | | | — | | | | — | | | | (185,831 | ) | | | 964,121 | | | | (185,831 | ) |
Escrows and Litigation Trusts | | | —e | | | | — | | | | — | | | | — | | | | — | | | | — | | | | — | | | | — | | | | —e | | | | — | |
| | | | |
Total Investments in Securities | | $ | 2,777,640 | | | $ | 1,150,148 | | | | $— | | | $ | 562,803 | | | $ | (37,288 | ) | | $ | (61,478 | ) | | | $— | | | $ | (191,434 | ) | | $ | 4,200,391 | | | $ | (182,112 | ) |
| | | | |
aTransferred into Level 3 as a result of the unavailability of a quoted market price in an active market for identical securities or as a result of the unreliability of the foreign exchange rate and other significant observable valuation inputs.
bTransferred out Level 3 as a result of the availability of a quoted price in an active market for identical securities and other significant observable valuation inputs.
cMay include accretion, amortization, partnership adjustments, and/or other cost basis adjustments.
dIncludes common stocks as well as other equity interests.
eIncludes securities determined to have no value.
FRANKLIN TEMPLETON VARIABLE INSURANCE PRODUCTS TRUST
NOTES TO CONSOLIDATED FINANCIAL STATEMENTS (UNAUDITED)
Franklin Strategic Income VIP Fund (continued)
Significant unobservable valuation inputs for material Level 3 assets and/or liabilities and impact to fair value as a result of changes in unobservable valuation inputs as of June 30, 2020, are as follows:
| | | | | | | | | | | | | | | | | | |
| | | | | |
| Description | | Fair Value
at End of Period | | | Valuation
Technique | | | Unobservable
Inputs | | | Amount/ Range
(Weighted Averagea) | | Impact to Fair
Value if Input
Increasesb | |
| Assets: | | | | | | | | | | | | | | | | | | |
Investments in Securities: | | | | | | | | | | | | | | | | | | |
Senior Floating Rate Interests | | | | | | | | | | | | | | | | | | |
Household & Personal Products | | | $2,273,679 | | | | Discounted cash flow | | | | Discount rate | | | 9.7% - 30.3% (15.7%) | | | Decreasec | |
| | | | | | | | | | | | Free cash flow | | | $1.0 - $1.8 mil ($1.6 mil) | | | Increased | |
Marketplace Loans – Lending Club | | | 964,121 | | | | Discounted cash flow | | |
| Loss-Adjusted
Discount rate |
| | 8.7% | |
| Decreasec
|
|
| | | | | | | | | | |
| Projected Loss
rate |
| | 21.1% | |
| Decreasec
|
|
All other Investmentse | | | 962,591f | | | | | | | | | | | | | | | |
Total | | | $4,200,391 | | | | | | | | | | | | | | | |
aWeighted based on the relative fair value of the financial instruments.
bRepresents the directional change in the fair value that would result from a significant and reasonable increase in the corresponding input. A significant and reasonable decrease in the input would have the opposite effect. Significant impacts, if any, to fair value and/or net assets have been indicated.
cRepresents a significant impact to fair value but not net assets.
dRepresents a significant impact to fair value and net assets.
eIncludes fair value of immaterial assets and/or liabilities developed using various valuation techniques and unobservable inputs. May also include values derived using private transaction prices or non-public third party pricing information which is unobservable.
fIncludes securities determined to have no value at June 30, 2020.
14. New Accounting Pronouncements
In March 2020, the Financial Accounting Standards Board issued Accounting Standards Update (ASU) No. 2020-04, Reference Rate Reform (Topic 848) – Facilitation of the Effects of Reference Rate Reform on Financial Reporting. The amendments in the ASU provides optional temporary financial reporting relief from the effect of certain types of contract modifications due to the planned discontinuation of the London Interbank Offered Rate (LIBOR) and other interbank-offered based reference rates as of the end of 2021. The ASU is effective for certain reference rate-related contract modifications that occur during the period March 12, 2020 through December 31, 2022. Management is currently evaluating the impact, if any, of applying this ASU.
15. Subsequent Events
The Fund has evaluated subsequent events through the issuance of the consolidated financial statements and determined that no events have occurred that require disclosure.
FRANKLIN TEMPLETON VARIABLE INSURANCE PRODUCTS TRUST
NOTES TO CONSOLIDATED FINANCIAL STATEMENTS (UNAUDITED)
Franklin Strategic Income VIP Fund (continued)
Abbreviations
| | | | | | | | | | |
| | |
| Counterparty | | Currency | | Selected Portfolio |
| | | | | |
| BNDP | | BNP Paribas SA | | COP | | Colombian Peso | | ARM | | Adjustable Rate Mortgage |
| | | | | |
| BZWS | | Barclays Bank PLC | | DOP | | Dominican Peso | | CLO | | Collateralized Loan Obligation |
| | | | | |
| CITI | | Citigroup, Inc. | | EUR | | Euro | | CMT | | 1 year Constant Maturity Treasury Index |
| | | | | |
| DBAB | | Deutsche Bank AG | | IDR | | Indonesian Rupiah | | FHLMC | | Federal Home Loan Mortgage Corp. |
| | | | | |
| GSCO | | The Goldman Sachs Group, Inc. | | MXN | | Mexican Peso | | FNMA | | Federal National Mortgage Association |
| | | | | |
| JPHQ | | JP Morgan Chase & Co. | | USD | | United States Dollar | | FRN | | Floating Rate Note |
| | | | | |
| MSCO | | Morgan Stanley | | UYU | | Uruguayan peso | | GDP | | Gross Domestic Product |
| | | | | |
| | | | ZAR | | South African rand | | GNMA | | Government National Mortgage Association |
| | | | | |
| | | | | | | | GO | | General Obligation |
| | | | | |
| | | | | | | | LIBOR | | London InterBank Offered Rate |
| | | | | |
| | | | | | | | MBS | | Mortgage-Backed Security |
| | | | | |
| | | | | | | | OAT | | Obligation Assumable by the Treasurer |
| | | | | |
| | | | | | | | PIK | | Payment-In-Kind |
| | | | | |
| | | | | | | | RDA | | Redevelopment Agency/Authority |
| | | | | |
| | | | | | | | SF | | Single Family |
| | | | | |
| | | | | | | | T-Note | | Treasury Note |
| | | | | |
| | | | | | | | USD | | United School District |
| | |
|
| Index Abbreviation |
| |
| CDX.EM.Series number | | CDX Emerging Markets Index |
| |
| MCDX.NA.Series number | | MCDX North America Index |
| |
| CDX.NA.IG.Series number | | CDX North America Investment Grade Index |
Templeton Developing Markets VIP Fund
This semiannual report for Templeton Developing Markets VIP Fund covers the period ended June 30, 2020.
Class 4 Performance Summary as of June 30, 2020
The Fund’s Class 4 Shares posted a -11.04% total return for the six-month period ended June 30, 2020.
Performance reflects the Fund’s Class 4 operating expenses, but does not include any contract fees, expenses or sales charges. If they had been included, performance would be lower. These charges and deductions, particularly for variable life policies, can have a significant effect on contract values and insurance benefits. See the contract prospectus for a complete description of these expenses, including sales charges.
Performance data represent past performance, which does not guarantee future results. Investment return and principal value will fluctuate, and you may have a gain or loss when you sell your shares. Current performance may differ from figures shown.
TEMPLETON DEVELOPING MARKETS VIP FUND
Fund Goal and Main Investments
The Fund seeks long-term capital appreciation. Under normal market conditions, the Fund invests at least 80% of its net assets in emerging market investments.
Fund Risks
All investments involve risks, including possible loss of principal. Unexpected events and their aftermaths, such as the spread of deadly diseases; natural, environmental or man-made disasters; financial, political or social disruptions; terrorism and war; and other tragedies or catastrophes, can cause investor fear and panic, which can adversely affect the economies of many companies, sectors, nations, regions and the market in general, in ways that cannot necessarily be foreseen. Special risks are associated with foreign investing, including currency fluctuations, economic instability and political developments. Investments in developing markets, of which frontier markets are a subset, involve heightened risks related to the same factors, in addition to those associated with these markets’ smaller size, lesser liquidity and lack of established legal, political, business and social frameworks to support securities markets. Because these frameworks are typically even less developed in frontier markets, as well as various factors including the increased potential for extreme price volatility, illiquidity, trade barriers and exchange controls, the risks associated with developing markets are magnified in frontier markets. The Fund is actively managed but there is no guarantee that the manager’s investment decisions will produce the desired results. The Fund’s prospectus also includes a description of the main investment risks.
Performance Overview
You can find the Fund’s six-month total return in the Performance Summary. In comparison, the MSCI Emerging Markets (EM) Index posted a -9.67% total return, for the same period.1 Please note, index performance numbers are for reference and we do not attempt to track an index but rather undertake investments on the basis of fundamental research.
Economic and Market Overview
The novel coronavirus (COVID-19) pandemic and resulting lockdown measures caused many emerging market
Geographic Composition
Based on Total Net Assets as of 6/30/20
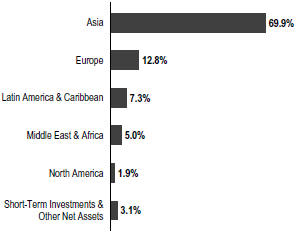
economies to slow significantly in 2020’s first quarter, as the virus outbreak compounded already weak global economic activity hobbled by U.S.-China trade tensions. In response, many emerging market central banks adopted more accommodative monetary policies. Emerging market equities fell during the period, though losses were limited by a second-quarter rebound as some countries began reopening their economies.
Regarding individual countries, China’s gross domestic product contracted in 2020’s first quarter for the first time on record, reflecting the significant disruption caused by the pandemic after the government shut down nonessential businesses for nearly two months. Taiwan’s year-on-year growth rate slowed as the country’s export-dependent economy was hit by decreased global demand. South Korea’s year-on-year growth rate moderated due largely to slowing services sector activity. India’s year-on-year growth rate moderated to its lowest point since the data became available in 2004, with contractions seen in gross fixed capital formation, exports and manufacturing. Russia’s year-on-year growth rate also moderated in the first quarter, while Brazil’s year-on-year growth rate contracted as the services sector and industrial output shrank.
Turning to monetary policies, the People’s Bank of China (PBOC) cut the benchmark loan prime rate once. Taiwan’s central bank lowered its benchmark interest rate for the first time in four years, while South Korea’s central bank cut its
1. Source: Morningstar. One cannot invest directly in an index, and an index is not representative of the Fund’s portfolio. Please see Index Descriptions following the Fund Summaries.
The dollar value, number of shares or principal amount, and names of all portfolio holdings are listed in the Fund’s Statement of Investments (SOI).
TEMPLETON DEVELOPING MARKETS VIP FUND
benchmark rate twice, ending at an all-time low. India’s central bank also cut its benchmark interest rate twice. The central banks of Russia and Brazil both cut their benchmark rates multiple times to record lows.
In this environment, emerging market stocks, as measured by the MSCI EM Index, posted a -9.67% total return for the six months ended June 30, 2020.1 Chinese equities rose during the period, as investors were reassured by the government’s aggressive actions to contain the pandemic and encouraging second-quarter economic data. Equities in export-oriented Taiwan declined slightly, with losses limited by stimulus measures and low rates of COVID-19 infections. Russian equities fell as a price war with Saudi Arabia led to a collapse in oil prices, which weighed heavily on Russia’s energy export-dependent economy. Brazilian equities fell significantly due largely to the country’s emergence as the epicenter of the pandemic in Latin America as well as the Brazilian real’s depreciation against the U.S. dollar.
Investment Strategy
We employ a fundamental research, value-oriented, long-term investment approach. We focus on the market price of a company’s securities relative to our evaluation of its long-term earnings, asset value and cash flow potential. This includes an assessment of the potential impacts of material environmental, social and governance factors on the long-term risk and return profile of a company. We also consider a company’s profit and loss outlook, balance sheet strength, cash flow trends and asset value in relation to the current price of the company’s securities. Our analysis considers the company’s position in its sector, the economic framework and political environment.
Manager’s Discussion
Key stock contributors to absolute performance during the reporting period were Tencent Holdings, Naver and Naspers.
Tencent is one of the largest internet services companies in China. The company provides online gaming, social network, financial technology, cloud and other entertainment-related services. Expectations that COVID-19 would have a short-term negative impact on Tencent’s advertising, payments and cloud services as a result of a decline in business activities led shares to reach a period-low in March. Shares subsequently rose, however, on expectations of solid growth in the mobile gaming and financial technology businesses. Tencent reported above-consensus first-quarter corporate results, with double-digit revenue and earnings growth driven by an increase in online gaming and better-than-expected performances in its online advertising
| | | | |
| Top 10 Countries | | | |
| 6/30/20 | | | |
| |
| | | % of Total
Net Assets | |
| China | | | 30.4% | |
| South Korea | | | 19.2% | |
| Taiwan | | | 11.4% | |
| Russia | | | 8.5% | |
| Brazil | | | 5.5% | |
| India | | | 5.4% | |
| South Africa | | | 4.8% | |
| U.K. | | | 3.0% | |
| U.S. | | | 1.9% | |
| Thailand | | | 1.5% | |
and financial technology operations. Expectations of continued growth in online gaming and improved monetization of its social application WeChat further supported sentiment in the stock.
Naver is South Korea’s largest search engine and a major e-commerce company. The company also provides services including LINE messenger, the largest messenger app in Japan, image messaging and multimedia mobile application Snow, digital comics platform Naver Webtoon and group social media platform Naver Band. Concerns in March that COVID-19 would negatively impact Naver’s advertising business in the short term weighed on shares, but the company’s earnings rose due to increased online shopping on its platform amid the pandemic. Investors also remained confident of Naver’s penetration into e-commerce and businesses in other areas such as digital content and financial services, which could contribute to its longer-term growth.
Naspers is a global internet and entertainment group and a majority shareholder in Prosus, which holds stakes in major internet companies globally in areas such as online gaming, social media, food delivery, online classifieds and electronic payments. Shares in Naspers benefited from the strong performance of Prosus’ largest underlying investment, Tencent. Naspers reported double-digit revenue and earnings growth for the fiscal year ended March 2020, driven by e-commerce operations and growth at Tencent. While lockdowns across key markets in early 2020 weighed on Naspers’ interests in the classified segment, investors expect market consolidation to help reduce losses and allow companies to focus on monetization as economies reopen. Management’s commitment to reducing Nasper’s share price discount to net asset value was also viewed positively by investors.
TEMPLETON DEVELOPING MARKETS VIP FUND
In contrast, key performance detractors included ICICI Bank, Banco Bradesco and Itau Unibanco Holding. Banking stocks around the world faced selling pressure, as expectations for a global economic slowdown weakened the outlook for loan growth, net interest margins and asset quality.
ICICI Bank is one of the largest private-sector banks in India. Investors were concerned about the interim impact of economic disruptions caused by COVID-19 on the bank’s loans and margins. Indian financials stocks were broadly hurt by a crisis at a notable private-sector bank, which resulted in a bailout. Investors also reacted negatively when the Indian central bank extended loan repayment relief while not allowing a one-time restructuring of loans, which sparked fears about bad debts in the banking system. Although ICICI Bank reported a double-digit increase in its March quarter profits, higher-than-expected COVID-19-related costs weighed on profitability. Investors did support the bank’s stake sale of its insurance subsidiaries to raise capital to strengthen its balance sheet, but the bank’s plan to raise money via the issuance of new shares raised concerns of dilution.
Expectations that the Brazilian economy would fall into a recession as a result of COVID-19-related lockdowns weighed on sentiment in leading commercial banks such as Banco Bradesco and Itau Unibanco. Shares in the two banks declined significantly due to market expectations of a decline in asset quality and revenue generation. Both banks reported weak first-quarter corporate results largely due to higher-than-expected costs related to COVID-19 and suspended guidance for 2020. Shares did rebound off their lows as investors used the market correction as a buying opportunity in view of the banks’ sound fundamentals, attractive valuations and dominant market share, which in our view makes them well-positioned to recover once the COVID-19 outbreak is contained and domestic economic activity improves.
We used the market correction as an opportunity to add to our existing high-conviction holdings. Existing positions were increased in Samsung Life Insurance, one of the largest insurance companies in South Korea; Bajaj Holdings & Investment, which owns significant stakes in Indian auto and financial services companies; and the aforementioned Itau Unibanco and Prosus.
The Fund reduced its investments in China, Taiwan and the U.S. to raise funds for redemptions received during the reporting period. Sectors which experienced the largest sales were information technology, financials, health care and consumer discretionary. Key reductions included Cognizant Technology Solutions, a global information
| | | | |
| Top 10 Holdings | | | |
6/30/20 | | | |
| |
Company Sector/Industry, Country | | % of Total Net Assets | |
Taiwan Semiconductor Manufacturing Co. Ltd.
Semiconductors & Semiconductor Equipment, Taiwan | | | 9.3 | % |
Tencent Holdings Ltd.
Interactive Media & Services, China | | | 9.1 | % |
Samsung Electronics Co. Ltd.
Technology Hardware, Storage & Peripherals, South Korea | | | 8.6 | % |
Alibaba Group Holding Ltd.
Internet & Direct Marketing Retail, China | | | 7.6 | % |
Naver Corp.
Interactive Media & Services, South Korea | | | 4.6 | % |
Naspers Ltd.
Internet & Direct Marketing Retail, South Africa | | | 4.5 | % |
Unilever PLC
Personal Products, U.K. | | | 3.0 | % |
ICICI Bank Ltd.
Banks, India | | | 2.8 | % |
Brilliance China Automotive Holdings Ltd.
Automobiles, China | | | 2.7 | % |
LUKOIL PJSC
Oil, Gas & Consumable Fuels, Russia | | | 2.6 | % |
technology services company, and Glenmark Pharmaceuticals, a mid-size Indian pharmaceutical company. The Fund liquidated its positions in Chinese commercial bank China Construction Bank, Indian biopharmaceutical company Biocon, and Macau resort and casino operator Sands China.
It is important to recognize the effect of currency movements on the Fund’s performance. In general, if the value of the U.S. dollar goes up compared with a foreign currency, an investment traded in that foreign currency will go down in value because it will be worth fewer U.S. dollars. This can have a negative effect on Fund performance. Conversely, when the U.S. dollar weakens in relation to a foreign currency, an investment traded in that foreign currency will increase in value, which can contribute to Fund performance. For the six months ended June 30, 2020, the U.S. dollar rose in value relative to most currencies. As a result, the Fund’s performance was negatively affected by the portfolio’s predominantly in securities with non-U.S. currency exposure.
Thank you for your participation in Templeton Developing Markets VIP Fund. We look forward to serving your future investment needs.
TEMPLETON DEVELOPING MARKETS VIP FUND
The foregoing information reflects our analysis, opinions and portfolio holdings as of June 30, 2020, the end of the reporting period. The way we implement our main investment strategies and the resulting portfolio holdings may change depending on factors such as market and economic conditions. These opinions may not be relied upon as investment advice or an offer for a particular security. The information is not a complete analysis of every aspect of any market, country, industry, security or the Fund. Statements of fact are from sources considered reliable, but the investment manager makes no representation or warranty as to their completeness or accuracy. Although historical performance is no guarantee of future results, these insights may help you understand our investment management philosophy.
TEMPLETON DEVELOPING MARKETS VIP FUND
Class 4 Fund Expenses
As an investor in a variable insurance contract (Contract) that indirectly provides for investment in an underlying mutual fund, you can incur transaction and/or ongoing expenses at both the Fund level and the Contract Level: (1) transaction expenses can include sales charges (loads) on purchases, surrender fees, transfer fees and premium taxes; and (2) ongoing expenses can include management fees, distribution and service (12b-1) fees, contract fees, annual maintenance fees, mortality and expense risk fees and other fees and expenses. All mutual funds and Contracts have some types of ongoing expenses. The table below shows Fund-level ongoing expenses and can help you understand these costs and compare them with those of other mutual funds offered through the Contract. The table assumes a $1,000 investment held for the six months indicated. Please refer to the Fund prospectus for additional information on operating expenses.
Actual Fund Expenses
The table below provides information about the actual account values and actual expenses in the columns under the heading “Actual.” In these columns the Fund’s actual return, which includes the effect of ongoing Fund expenses but does not include the effect of ongoing Contract expenses, is used to calculate the “Ending Account Value.” You can estimate the Fund-level expenses you paid during the period by following these steps (of course, your account value and expenses will differ from those in this illustration): Divide your account value by $1,000 (if your account had an $8,600 value, then $8,600 ÷ $1,000 = 8.6). Then multiply the result by the number under the headings “Actual” and “Fund-Level Expenses Paid During Period” (if
Fund-Level Expenses Paid During Period were $ 7.50, then 8.6 x $ 7.50 = $64.50). In this illustration, the estimated expenses paid this period at the Fund level are $64.50.
Hypothetical Example for Comparison with Other Mutual Funds
Under the heading “Hypothetical” in the table, information is provided about hypothetical account values and hypothetical expenses based on the Fund’s actual expense ratio and an assumed rate of return of 5% per year before expenses, which is not the Fund’s actual return. This information may not be used to estimate the actual ending account balance or expenses you paid for the period, but it can help you compare ongoing costs of investing in the Fund with those of other mutual funds offered through the Contract. To do so, compare this 5% hypothetical example with the 5% hypothetical examples that appear in the shareholder reports of other funds offered through the Contract.
Please note that expenses shown in the table are meant to highlight ongoing costs at the Fund level only and do not reflect any ongoing expenses at the Contract level, or transaction expenses at either the Fund or Contract levels. In addition, while the Fund does not have transaction expenses, if the transaction and ongoing expenses at the Contract level were included, the expenses shown below would be higher. You should consult your Contract prospectus or disclosure document for more information.
| | | | | | | | | | | | | | | | | | |
| | | | | | | |
| | | | | | | Actual (actual return after expenses) | | | | Hypothetical
(5% annual return before expenses) | | | | |
Share Class | | Beginning Account
Value 1/1/20 | | | | Ending
Account
Value 6/30/20 | | Fund-Level
Expenses
Paid During
Period
1/1/20–6/30/201, 2 | | | | Ending
Account
Value 6/30/20 | | Fund-Level
Expenses
Paid During
Period
1/1/20–6/30/201, 2 | | | | Net
Annualized
Expense
Ratio2 |
Class 4 | | $1,000 | | | | $889.60 | | $7.14 | | | | $1,017.30 | | $7.62 | | | | 1.52% |
1. Expenses are equal to the annualized expense ratio for the six-month period as indicated above—in the far right column—multiplied by the simple average account value over the period indicated, and then multiplied by 182/366 to reflect the one-half year period.
2. Reflects expenses after fee waivers and expense reimbursements. Does not include any ongoing expenses of the Contract for which the Fund is an investment option or acquired fund fees and expenses.
TD P1 P2 P4 05/20
SUPPLEMENT DATED MAY 15, 2020
TO THE PROSPECTUSES DATED MAY 1, 2020
OF
TEMPLETON DEVELOPING MARKETS VIP FUND
(A series of Franklin Templeton Variable Insurance Products Trust)
The Prospectus is amended as follows:
I.The Board ofTrustees of Franklin Templeton Variable Insurance Products Trust (Board) recently approved, subject to shareholder approval, a change in the classification of the Templeton Developing Markets VIP Fund (Fund) under the Investment Company Act of 1940 from a “diversified” fund to a “non-diversified” fund. It is anticipated that in July 2020 shareholders of the Fund will receivea proxy statement requesting their votes on such proposal and other matters. If such proposals are approved by the Fund’s shareholders, it is expected that such changes will be effective in early 2021.
The Fund reserves the right to change the above at any time.
Please keep this supplement with your prospectus for future reference.
FRANKLIN TEMPLETON VARIABLE INSURANCE PRODUCTS TRUST
FINANCIAL HIGHLIGHTS
Templeton Developing Markets VIP Fund
| | | | | | | | | | | | | | | | | | | | | | | | |
| | |
| | | Six Months Ended
June 30, 2020 (unaudited) | | | Year Ended December 31, | |
| | | 2019 | | | 2018 | | | 2017 | | | 2016 | | | 2015 | |
| | | | | | |
| Class 1 | | | | | | | | | | | | | | | | | | | | | | | | |
| | | | | | |
Per share operating performance
(for a share outstanding throughout the period) | | | | | | | | | | | | | | | | | | | | | | | | |
| | | | | | |
Net asset value, beginning of period | | | $10.80 | | | | $ 8.62 | | | | $10.31 | | | | $ 7.42 | | | | $ 6.37 | | | | $ 9.27 | |
| | | | |
| | | | | | |
| Income from investment operationsa: | | | | | | | | | | | | | | | | | | | | | | | | |
| | | | | | |
Net investment incomeb | | | 0.01 | | | | 0.18 | | | | 0.09 | | | | 0.08 | | | | 0.05 | | | | 0.06 | |
| | | | | | |
Net realized and unrealized gains (losses) | | | (1.19 | ) | | | 2.12 | | | | (1.67 | ) | | | 2.92 | | | | 1.08 | | | | (1.63 | ) |
| | | | |
| | | | | | |
Total from investment operations | | | (1.18 | ) | | | 2.30 | | | | (1.58 | ) | | | 3.00 | | | | 1.13 | | | | (1.57 | ) |
| | | | |
| | | | | | |
| Less distributions from: | | | | | | | | | | | | | | | | | | | | | | | | |
| | | | | | |
Net investment income | | | (0.45 | ) | | | (0.12 | ) | | | (0.11 | ) | | | (0.11 | ) | | | (0.08 | ) | | | (0.20 | ) |
| | | | | | |
Net realized gains | | | (0.26 | ) | | | — | | | | — | | | | — | | | | — | | | | (1.13 | ) |
| | | | |
| | | | | | |
Total distributions | | | (0.71 | ) | | | (0.12 | ) | | | (0.11 | ) | | | (0.11 | ) | | | (0.08 | ) | | | (1.33 | ) |
| | | | |
| | | | | | |
| Net asset value, end of period | | | $ 8.91 | | | | $10.80 | | | | $ 8.62 | | | | $10.31 | | | | $ 7.42 | | | | $ 6.37 | |
| | | | |
| | | | | | |
Total returnc | | | (10.83 | )% | | | 26.92% | | | | (15.44)% | | | | 40.65% | | | | 17.79% | | | | (19.42)% | |
| | | | | | |
| Ratios to average net assetsd | | | | | | | | | | | | | | | | | | | | | | | | |
| | | | | | |
Expenses before waiver and payments by affiliates | | | 1.17% | | | | 1.15% | | | | 1.24% | | | | 1.36% | | | | 1.38% | | | | 1.33% | |
| | | | | | |
Expenses net of waiver and payments by affiliates | | | 1.17% | e | | | 1.15% | e | | | 1.24% | e | | | 1.35% | f | | | 1.36% | | | | 1.32% | |
| | | | | | |
Net investment income | | | 0.28% | | | | 1.83% | | | | 0.99% | | | | 0.86% | | | | 0.79% | | | | 0.74% | |
| | | | | | |
| Supplemental data | | | | | | | | | | | | | | | | | | | | | | | | |
| | | | | | |
Net assets, end of period (000’s) | | | $71,752 | | | | $97,271 | | | | $85,397 | | | | $105,493 | | | | $82,596 | | | | $77,000 | |
| | | | | | |
Portfolio turnover rate | | | 2.41% | | | | 18.04% | | | | 9.22% | | | | 10.76% | | | | 26.78% | | | | 71.69% | |
aThe amount shown for a share outstanding throughout the period may not correlate with the Statement of Operations for the period due to the timing of sales and repurchases of the Fund’s shares in relation to income earned and/or fluctuating fair value of the investments of the Fund.
bBased on average daily shares outstanding.
cTotal return does not include fees, charges or expenses imposed by the variable annuity and life insurance contracts for which Franklin Templeton Variable Insurance Products Trust serves as an underlying investment vehicle. Total return is not annualized for periods less than one year.
dRatios are annualized for periods less than one year.
eBenefit of waiver and payments by affiliates rounds to less than 0.01%.
fBenefit of expense reduction rounds to less than 0.01%.
| | | | |
| | | |
| TD-8 | | Semiannual Report | The accompanying notes are an integral part of these financial statements. | | |
FRANKLIN TEMPLETON VARIABLE INSURANCE PRODUCTS TRUST
FINANCIAL HIGHLIGHTS
Templeton Developing Markets VIP Fund (continued)
| | | | | | | | | | | | | | | | | | | | | | | | |
| | |
| | | Six Months Ended
June 30, 2020 (unaudited) | | | Year Ended December 31, | |
| | | 2019 | | | 2018 | | | 2017 | | | 2016 | | | 2015 | |
| | | | | | |
Class 2 | | | | | | | | | | | | | | | | | | | | | | | | |
| | | | | | |
Per share operating performance
(for a share outstanding throughout the period) | | | | | | | | | | | | | | | | | | | | | | | | |
| | | | | | |
Net asset value, beginning of period | | | $10.71 | | | | $ 8.54 | | | | $10.23 | | | | $ 7.36 | | | | $ 6.32 | | | | $ 9.20 | |
| | | | |
| | | | | | |
| Income from investment operationsa: | | | | | | | | | | | | | | | | | | | | | | | | |
| | | | | | |
Net investment incomeb | | | — | c | | | 0.15 | | | | 0.07 | | | | 0.05 | | | | 0.04 | | | | 0.04 | |
| | | | | | |
Net realized and unrealized gains (losses) | | | (1.18 | ) | | | 2.11 | | | | (1.68 | ) | | | 2.91 | | | | 1.06 | | | | (1.61 | ) |
| | | | |
| | | | | | |
Total from investment operations | | | (1.18 | ) | | | 2.26 | | | | (1.61 | ) | | | 2.96 | | | | 1.10 | | | | (1.57 | ) |
| | | | |
| | | | | | |
| Less distributions from: | | | | | | | | | | | | | | | | | | | | | | | | |
| | | | | | |
Net investment income | | | (0.42 | ) | | | (0.09 | ) | | | (0.08 | ) | | | (0.09 | ) | | | (0.06 | ) | | | (0.18 | ) |
| | | | | | |
Net realized gains | | | (0.26 | ) | | | — | | | | — | | | | — | | | | — | | | | (1.13 | ) |
| | | | |
| | | | | | |
Total distributions | | | (0.68 | ) | | | (0.09 | ) | | | (0.08 | ) | | | (0.09 | ) | | | (0.06 | ) | | | (1.31 | ) |
| | | | |
| | | | | | |
| Net asset value, end of period | | | $ 8.85 | | | | $10.71 | | | | $ 8.54 | | | | $10.23 | | | | $ 7.36 | | | | $ 6.32 | |
| | | | |
| | | | | | |
Total returnd | | | (11.00 | )% | | | 26.70% | | | | (15.79)% | | | | 40.41% | | | | 17.44% | | | | (19.60)% | |
| | | | | | |
| Ratios to average net assetse | | | | | | | | | | | | | | | | | | | | | | | | |
| | | | | | |
Expenses before waiver and payments by affiliates | | | 1.42% | | | | 1.40% | | | | 1.49% | | | | 1.61% | | | | 1.63% | | | | 1.58% | |
| | | | | | |
Expenses net of waiver and payments by affiliates | | | 1.42% | f | | | 1.40% | f | | | 1.49% | f | | | 1.60% | g | | | 1.61% | | | | 1.57% | |
| | | | | | |
Net investment income | | | 0.03% | | | | 1.58% | | | | 0.74% | | | | 0.61% | | | | 0.54% | | | | 0.49% | |
| | | | | | |
| Supplemental data | | | | | | | | | | | | | | | | | | | | | | | | |
| | | | | | |
Net assets, end of period (000’s) | | | $189,208 | | | | $231,645 | | | | $195,305 | | | | $270,433 | | | | $205,151 | | | | $192,120 | |
| | | | | | |
Portfolio turnover rate | | | 2.41% | | | | 18.04% | | | | 9.22% | | | | 10.76% | | | | 26.78% | | | | 71.69% | |
aThe amount shown for a share outstanding throughout the period may not correlate with the Statement of Operations for the period due to the timing of sales and repurchases of the Fund’s shares in relation to income earned and/or fluctuating fair value of the investments of the Fund.
bBased on average daily shares outstanding.
cAmount rounds to less than $0.01 per share.
dTotal return does not include fees, charges or expenses imposed by the variable annuity and life insurance contracts for which Franklin Templeton Variable Insurance Products Trust serves as an underlying investment vehicle. Total return is not annualized for periods less than one year.
eRatios are annualized for periods less than one year.
fBenefit of waiver and payments by affiliates rounds to less than 0.01%.
gBenefit of expense reduction rounds to less than 0.01%.
| | | | | | |
| | | |
| | The accompanying notes are an integral part of these financial statements. | Semiannual Report | | | TD-9 | |
FRANKLIN TEMPLETON VARIABLE INSURANCE PRODUCTS TRUST
FINANCIAL HIGHLIGHTS
Templeton Developing Markets VIP Fund (continued)
| | | | | | | | | | | | | | | | | | | | | | | | |
| | |
| | | Six Months Ended
June 30, 2020 (unaudited) | | | Year Ended December 31, | |
| | | 2019 | | | 2018 | | | 2017 | | | 2016 | | | 2015 | |
| | | | | | |
Class 4 | | | | | | | | | | | | | | | | | | | | | | | | |
| | | | | | |
Per share operating performance
(for a share outstanding throughout the period) | | | | | | | | | | | | | | | | | | | | | | | | |
| | | | | | |
Net asset value, beginning of period | | | $10.77 | | | | $ 8.59 | | | | $10.28 | | | | $ 7.39 | | | | $ 6.34 | | | | $ 9.22 | |
| | | | |
| | | | | | |
| Income from investment operationsa: | | | | | | | | | | | | | | | | | | | | | | | | |
| | | | | | |
Net investment incomeb | | | — | c | | | 0.15 | | | | 0.06 | | | | 0.05 | | | | 0.03 | | | | 0.03 | |
| | | | | | |
Net realized and unrealized gains (losses) | | | (1.20 | ) | | | 2.11 | | | | (1.68 | ) | | | 2.92 | | | | 1.06 | | | | (1.62 | ) |
| | | | |
| | | | | | |
Total from investment operations | | | (1.20 | ) | | | 2.26 | | | | (1.62 | ) | | | 2.97 | | | | 1.09 | | | | (1.59 | ) |
| | | | |
| | | | | | |
| Less distributions from: | | | | | | | | | | | | | | | | | | | | | | | | |
| | | | | | |
Net investment income | | | (0.41 | ) | | | (0.08 | ) | | | (0.07 | ) | | | (0.08 | ) | | | (0.04 | ) | | | (0.16 | ) |
| | | | | | |
Net realized gains | | | (0.26 | ) | | | — | | | | — | | | | — | | | | — | | | | (1.13 | ) |
| | | | |
| | | | | | |
Total distributions | | | (0.67 | ) | | | (0.08 | ) | | | (0.07 | ) | | | (0.08 | ) | | | (0.04 | ) | | | (1.29 | ) |
| | | | |
| | | | | | |
| Net asset value, end of period | | | $ 8.90 | | | | $10.77 | | | | $ 8.59 | | | | $10.28 | | | | $ 7.39 | | | | $ 6.34 | |
| | | | |
| | | | | | |
Total returnd | | | (11.04 | )% | | | 26.49% | | | | (15.81)% | | | | 40.30% | | | | 17.32% | | | | (19.70)% | |
| | | | | | |
| Ratios to average net assetse | | | | | | | | | | | | | | | | | | | | | | | | |
| | | | | | |
Expenses before waiver and payments by affiliates | | | 1.52% | | | | 1.50% | | | | 1.59% | | | | 1.71% | | | | 1.73% | | | | 1.68% | |
| | | | | | |
Expenses net of waiver and payments by affiliates | | | 1.52% | f | | | 1.50% | f | | | 1.59% | f | | | 1.70% | g | | | 1.71% | | | | 1.67% | |
| | | | | | |
Net investment income (loss) | | | (0.07)% | | | | 1.48% | | | | 0.64% | | | | 0.51% | | | | 0.44% | | | | 0.39% | |
| | | | | | |
| Supplemental data | | | | | | | | | | | | | | | | | | | | | | | | |
| | | | | | |
Net assets, end of period (000’s) | | | $4,593 | | | | $5,590 | | | | $5,203 | | | | $7,199 | | | | $6,377 | | | | $7,109 | |
| | | | | | |
Portfolio turnover rate | | | 2.41% | | | | 18.04% | | | | 9.22% | | | | 10.76% | | | | 26.78% | | | | 71.69% | |
aThe amount shown for a share outstanding throughout the period may not correlate with the Statement of Operations for the period due to the timing of sales and repurchases of the Fund’s shares in relation to income earned and/or fluctuating fair value of the investments of the Fund.
bBased on average daily shares outstanding.
cAmount rounds to less than $0.01 per share.
dTotal return does not include fees, charges or expenses imposed by the variable annuity and life insurance contracts for which Franklin Templeton Variable Insurance Products Trust serves as an underlying investment vehicle. Total return is not annualized for periods less than one year.
eRatios are annualized for periods less than one year.
fBenefit of waiver and payments by affiliates rounds to less than 0.01%.
gBenefit of expense reduction rounds to less than 0.01%.
| | | | |
| | | |
| TD-10 | | Semiannual Report | The accompanying notes are an integral part of these financial statements. | | |
FRANKLIN TEMPLETON VARIABLE INSURANCE PRODUCTS TRUST
Statement of Investments, June 30, 2020 (unaudited)
Templeton Developing Markets VIP Fund
| | | | | | | | | | | | | | |
| | | | | Industry | | | Shares | | | Value | |
| | Common Stocks 93.9% | | | | | | | | | | | | |
| | Brazil 2.5% | | | | | | | | | | | | |
| a | | B2W Cia Digital | | | Internet & Direct Marketing Retail | | | | 76,800 | | | $ | 1,512,184 | |
| | B3 SA - Brasil Bolsa Balcao | | | Capital Markets | | | | 61,400 | | | | 622,154 | |
| | Lojas Americanas SA | | | Multiline Retail | | | | 170,860 | | | | 857,003 | |
| | M Dias Branco SA | | | Food Products | | | | 106,200 | | | | 793,257 | |
| | Vale SA | | | Metals & Mining | | | | 278,500 | | | | 2,864,501 | |
| | | | | | | | | | | | | | |
| | | | |
| | | | | | | | | | | | | 6,649,099 | |
| | | | | | | | | | | | | | |
| | Cambodia 0.7% | | | | | | | | | | | | |
| | NagaCorp Ltd. | | | Hotels, Restaurants & Leisure | | | | 1,525,400 | | | | 1,779,444 | |
| | | | | | | | | | | | | | |
| | China 30.4% | | | | | | | | | | | | |
| a | | Alibaba Group Holding Ltd., ADR | | | Internet & Direct Marketing Retail | | | | 93,210 | | | | 20,105,397 | |
| | BAIC Motor Corp. Ltd., H | | | Automobiles | | | | 1,686,100 | | | | 737,882 | |
| a | | Baidu Inc., ADR | | | Interactive Media & Services | | | | 9,411 | | | | 1,128,285 | |
| | Brilliance China Automotive Holdings Ltd. | | | Automobiles | | | | 7,970,600 | | | | 7,214,024 | |
| | China Merchants Bank Co. Ltd., A | | | Banks | | | | 392,600 | | | | 1,881,855 | |
| | China Merchants Bank Co. Ltd., H | | | Banks | | | | 507,700 | | | | 2,352,738 | |
| | China Mobile Ltd. | | | Wireless Telecommunication Services | | | | 447,000 | | | | 3,018,149 | |
| | China Resources Cement Holdings Ltd. | | | Construction Materials | | | | 2,429,000 | | | | 2,995,722 | |
| | CNOOC Ltd. | | | Oil, Gas & Consumable Fuels | | | | 2,008,500 | | | | 2,254,180 | |
| | COSCO SHIPPING Ports Ltd. | | | Transportation Infrastructure | | | | 433,196 | | | | 233,665 | |
| b | | Health & Happiness H&H International Holdings Ltd. | | | Food Products | | | | 418,400 | | | | 1,901,710 | |
| b | | MGM China Holdings Ltd. | | | Hotels, Restaurants & Leisure | | | | 254,400 | | | | 330,620 | |
| | NetEase Inc., ADR | | | Entertainment | | | | 4,253 | | | | 1,826,153 | |
| | Ping An Bank Co. Ltd., A | | | Banks | | | | 802,600 | | | | 1,459,736 | |
| | Ping An Insurance Group Co. of China Ltd., A | | | Insurance | | | | 202,225 | | | | 2,049,211 | |
| a | | Prosus NV | | | Internet & Direct Marketing Retail | | | | 32,057 | | | | 2,979,702 | |
| | Sunny Optical Technology Group Co. Ltd. | |
| Electronic Equipment, Instruments &
Components |
| | | 161,000 | | | | 2,591,195 | |
| | Tencent Holdings Ltd. | | | Interactive Media & Services | | | | 376,700 | | | | 24,137,977 | |
| | Uni-President China Holdings Ltd. | | | Food Products | | | | 940,300 | | | | 940,581 | |
| | Weifu High-Technology Co. Ltd., B | | | Auto Components | | | | 306,139 | | | | 522,443 | |
| | | | | | | | | | | | | | |
| | | | | | | | | | | | | 80,661,225 | |
| | | | | | | | | | | | | | |
| | Czech Republic 0.3% | | | | | | | | | | | | |
| | Moneta Money Bank AS | | | Banks | | | | 390,403 | | | | 883,994 | |
| | | | | | | | | | | | | | |
| | Hungary 1.0% | | | | | | | | | | | | |
| | Richter Gedeon Nyrt | | | Pharmaceuticals | | | | 131,650 | | | | 2,730,392 | |
| | | | | | | | | | | | | | |
| | India 5.4% | | | | | | | | | | | | |
| | Bajaj Holdings & Investment Ltd. | | | Diversified Financial Services | | | | 60,776 | | | | 2,048,194 | |
| | Coal India Ltd. | | | Oil, Gas & Consumable Fuels | | | | 442,535 | | | | 781,335 | |
| | Glenmark Pharmaceuticals Ltd | | | Pharmaceuticals | | | | 18,613 | | | | 111,027 | |
| | ICICI Bank Ltd. | | | Banks | | | | 1,630,254 | | | | 7,596,332 | |
| | Infosys Ltd. | | | IT Services | | | | 306,365 | | | | 2,976,458 | |
| | Tata Chemicals Ltd. | | | Chemicals | | | | 165,900 | | | | 683,455 | |
| | | | | | | | | | | | | | |
| | | | | | | | | | | | | 14,196,801 | |
| | | | | | | | | | | | | | |
| | | | |
| | Indonesia 0.9% | | | | | | | | | | | | |
| | Astra International Tbk PT | | | Automobiles | | | | 7,340,300 | | | | 2,487,990 | |
| | | | | | | | | | | | | | |
FRANKLIN TEMPLETON VARIABLE INSURANCE PRODUCTS TRUST
STATEMENT OF INVESTMENTS (UNAUDITED)
Templeton Developing Markets VIP Fund (continued)
| | | | | | | | | | | | | | |
| | | | | Industry | | | Shares | | | Value | |
| | Common Stocks (continued) | | | | | | | | | | | | |
| | Kenya 0.2% | | | | | | | | | | | | |
| a | | Equity Group Holdings PLC | | | Banks | | | | 1,528,708 | | | $ | 494,983 | |
| | | | | | | | | | | | | | |
| | Mexico 1.5% | | | | | | | | | | | | |
| | Banco Santander Mexico SA Institucion de Banca Multiple Grupo Financiero Santander, ADR | | | Banks | | | | 949,761 | | | | 3,428,637 | |
| | Nemak SAB de CV | | | Auto Components | | | | 2,014,800 | | | | 421,778 | |
| | | | | | | | | | | | | | |
| | | | | | | | | | | | | 3,850,415 | |
| | | | | | | | | | | | | | |
| | Pakistan 0.2% | | | | | | | | | | | | |
| | Habib Bank Ltd. | | | Banks | | | | 1,116,900 | | | | 640,418 | |
| | | | | | | | | | | | | | |
| | Peru 0.3% | | | | | | | | | | | | |
| | Intercorp Financial Services Inc. | | | Banks | | | | 31,950 | | | | 845,078 | |
| | | | | | | | | | | | | | |
| | Philippines 0.2% | | | | | | | | | | | | |
| | BDO Unibank Inc. | | | Banks | | | | 327,469 | | | | 647,421 | |
| | | | | | | | | | | | | | |
| | Russia 8.5% | | | | | | | | | | | | |
| | Gazprom PJSC, ADR | | | Oil, Gas & Consumable Fuels | | | | 312,600 | | | | 1,688,018 | |
| | LUKOIL PJSC, ADR | | | Oil, Gas & Consumable Fuels | | | | 95,250 | | | | 7,080,324 | |
| a | | Mail.Ru Group Ltd., GDR | | | Interactive Media & Services | | | | 81,525 | | | | 1,838,918 | |
| a | | Sberbank of Russia PJSC, ADR | | | Banks | | | | 498,847 | | | | 5,670,765 | |
| a | | Yandex NV, A | | | Interactive Media & Services | | | | 126,319 | | | | 6,318,476 | |
| | | | | | | | | | | | | | |
| | | | |
| | | | | | | | | | | | | 22,596,501 | |
| | | | | | | | | | | | | | |
| | South Africa 4.8% | | | | | | | | | | | | |
| a | | Massmart Holdings Ltd. | | | Food & Staples Retailing | | | | 580,084 | | | | 769,260 | |
| | Naspers Ltd., N | | | Internet & Direct Marketing Retail | | | | 64,938 | | | | 11,929,100 | |
| | | | | | | | | | | | | | |
| | | | |
| | | | | | | | | | | | | 12,698,360 | |
| | | | | | | | | | | | | | |
| | South Korea 19.2% | | | | | | | | | | | | |
| | Fila Holdings Corp. | | | Textiles, Apparel & Luxury Goods | | | | 64,280 | | | | 1,901,969 | |
| | Hankook Tire & Technology Co. Ltd. | | | Auto Components | | | | 15,300 | | | | 317,500 | |
| | KT Skylife Co. Ltd. | | | Media | | | | 166,071 | | | | 1,101,986 | |
| | LG Corp. | | | Industrial Conglomerates | | | | 96,342 | | | | 5,765,192 | |
| | Naver Corp. | | | Interactive Media & Services | | | | 53,983 | | | | 12,177,767 | |
| | POSCO | | | Metals & Mining | | | | 15,429 | | | | 2,253,347 | |
| | Samsung Electronics Co. Ltd. | | | Technology Hardware, Storage & Peripherals | | | | 513,903 | | | | 22,810,142 | |
| | Samsung Life Insurance Co. Ltd. | | | Insurance | | | | 76,937 | | | | 2,900,434 | |
| | SK Hynix Inc. | | | Semiconductors & Semiconductor Equipment | | | | 24,040 | | | | 1,721,012 | |
| | | | | | | | | | | | | | |
| | | | | | | | | | | | | 50,949,349 | |
| | | | | | | | | | | | | | |
| | Taiwan 11.4% | | | | | | | | | | | | |
| | Catcher Technology Co. Ltd. | | | Technology Hardware, Storage & Peripherals | | | | 114,000 | | | | 866,423 | |
| | CTBC Financial Holding Co. Ltd. | | | Banks | | | | 350,500 | | | | 243,616 | |
| a | | FIT Hon Teng Ltd. | | | Electronic Equipment, Instruments & Components | | | | 990,600 | | | | 386,111 | |
| | Hon Hai Precision Industry Co. Ltd. | | | Electronic Equipment, Instruments & Components | | | | 1,185,000 | | | | 3,489,454 | |
| | Largan Precision Co. Ltd. | | | Electronic Equipment, Instruments & Components | | | | 5,300 | | | | 739,053 | |
| | Taiwan Semiconductor Manufacturing Co. Ltd. | | | Semiconductors & Semiconductor Equipment | | | | 2,299,000 | | | | 24,623,553 | |
| | | | | | | | | | | | | | |
| | | | |
| | | | | | | | | | | | | 30,348,210 | |
| | | | | | | | | | | | | | |
FRANKLIN TEMPLETON VARIABLE INSURANCE PRODUCTS TRUST
STATEMENT OF INVESTMENTS (UNAUDITED)
Templeton Developing Markets VIP Fund (continued)
| | | | | | | | | | | | | | |
| | | | | Industry | | | Shares | | | Value | |
| | Common Stocks (continued) | | | | | | | | | | | | |
| | Thailand 1.5% | | | | | | | | | | | | |
| | Kasikornbank PCL, fgn | | | Banks | | | | 705,000 | | | $ | 2,142,460 | |
| | Kiatnakin Bank PCL, fgn | | | Banks | | | | 859,600 | | | | 1,118,932 | |
| | Thai Beverage PCL, fgn | | | Beverages | | | | 1,450,900 | | | | 708,301 | |
| | | | | | | | | | | | | | |
| | | | |
| | | | | | | | | | | | | 3,969,693 | |
| | | | | | | | | | | | | | |
| | United Kingdom 3.0% | | | | | | | | | | | | |
| | Unilever PLC | | | Personal Products | | | | 146,186 | | | | 7,885,110 | |
| | | | | | | | | | | | | | |
| | United States 1.9% | | | | | | | | | | | | |
| | Cognizant Technology Solutions Corp., A | | | IT Services | | | | 64,484 | | | | 3,663,981 | |
| a | | IMAX Corp | | | Entertainment | | | | 118,755 | | | | 1,331,243 | |
| | | | | | | | | | | | | | |
| | | | |
| | | | | | | | | | | | | 4,995,224 | |
| | | | | | | | | | | | | | |
| | | | |
| | Total Common Stocks (Cost $185,963,504) | | | | | | | | | | | 249,309,707 | |
| | | | | | | | | | | | | | |
| | | | |
| | Preferred Stocks 3.0% | | | | | | | | | | | | |
| | Brazil 3.0% | | | | | | | | | | | | |
| c | | Banco Bradesco SA, 13.248%, ADR, pfd | | | Banks | | | | 1,026,866 | | | | 3,912,359 | |
| c | | Itau Unibanco Holding SA, 10.51%, ADR, pfd | | | Banks | | | | 897,443 | | | | 4,209,008 | |
| | | | | | | | | | | | | | |
| | | | |
| | Total Preferred Stocks (Cost $7,746,131) | | | | | | | | | | | 8,121,367 | |
| | | | | | | | | | | | | | |
| | Total Investments before Short Term
Investments (Cost $193,709,635) | | | | | | | | | | | 257,431,074 | |
| | | | | | | | | | | | | | |
| | | | |
| | Short Term Investments 2.9% | | | | | | | | | | | | |
| | | | |
| | Money Market Funds (Cost $6,684,070) 2.5% | | | | | | | | | | | | |
| | United States 2.5% | | | | | | | | | | | | |
| d,e | | Institutional Fiduciary Trust Money Market Portfolio, 0.00% | | | | | | | 6,684,070 | | | | 6,684,070 | |
| | | | | | | | | | | | | | |
| | | | |
| | Investments from Cash Collateral Received for Loaned
Securities 0.4% | | | | | | | | | | | | |
| | Money Market Funds (Cost $960,000) 0.4% | | | | | | | | | | | | |
| | United States 0.4% | | | | | | | | | | | | |
| d,e | | Institutional Fiduciary Trust Money Market Portfolio, 0.00% | | | | | | | 960,000 | | | | 960,000 | |
| | | | | | | | | | | | | | |
| | Total Investments (Cost $201,353,705) 99.8% | | | | | | | | | | | 265,075,144 | |
| | Other Assets, less Liabilities 0.2% | | | | | | | | | | | 477,889 | |
| | | | | | | | | | | | | | |
| | | | |
| | Net Assets 100.0% | | | | | | | | | | $ | 265,553,033 | |
| | | | | | | | | | | | | | |
See Abbreviations on page TD-24.
aNon-income producing.
bA portion or all of the security is on loan at June 30, 2020. See Note 1(c).
cVariable rate security. The rate shown represents the yield at period end.
dSee Note 3(e) regarding investments in affiliated management investment companies.
eThe rate shown is the annualized seven-day effective yield at period end.
| | | | | | |
| | | |
| The accompanying notes are an integral part of these financial statements. | | | Semiannual Report | | | TD-13 | |
FRANKLIN TEMPLETON VARIABLE INSURANCE PRODUCTS TRUST
FINANCIAL STATEMENTS
Statement of Assets and Liabilities
June 30, 2020 (unaudited)
| | | | |
| | | Templeton
Developing Markets
VIP Fund | |
Assets: | | | | |
Investments in securities: | | | | |
Cost - Unaffiliated issuers | | | $193,709,635 | |
Cost - Non-controlled affiliates (Note 3e) | | | 7,644,070 | |
| | | | |
| |
Value - Unaffiliated issuers+ | | | $257,431,074 | |
Value - Non-controlled affiliates (Note 3e) | | | 7,644,070 | |
Receivables: | | | | |
Investment securities sold | | | 653,901 | |
Capital shares sold | | | 599,038 | |
Dividends | | | 795,076 | |
Other assets | | | 255 | |
| | | | |
| |
Total assets | | | 267,123,414 | |
| | | | |
| |
Liabilities: | | | | |
Payables: | | | | |
Capital shares redeemed | | | 167,083 | |
Management fees | | | 223,081 | |
Distribution fees | | | 39,327 | |
Trustees’ fees and expenses | | | 94 | |
Reports to shareholders | | | 102,061 | |
Payable upon return of securities loaned | | | 960,000 | |
Accrued expenses and other liabilities | | | 78,735 | |
| | | | |
| |
Total liabilities | | | 1,570,381 | |
| | | | |
| |
Net assets, at value | | | $265,553,033 | |
| | | | |
| |
Net assets consist of: | | | | |
Paid-in capital | | | $207,856,171 | |
Total distributable earnings (losses) | | | 57,696,862 | |
| | | | |
| |
Net assets, at value | | | $265,553,033 | |
| | | | |
Class 1: | | | | |
Net assets, at value | | | $ 71,751,609 | |
| | | | |
Shares outstanding | | | 8,054,721 | |
| | | | |
Net asset value and maximum offering price per share | | | $8.91 | |
| | | | |
Class 2: | | | | |
Net assets, at value | | | $189,208,015 | |
| | | | |
Shares outstanding | | | 21,388,950 | |
| | | | |
Net asset value and maximum offering price per share | | | $8.85 | |
| | | | |
Class 4: | | | | |
Net assets, at value | | | $ 4,593,409 | |
| | | | |
Shares outstanding | | | 515,826 | |
| | | | |
Net asset value and maximum offering price per share | | | $8.90 | |
| | | | |
| |
+Includes securities loaned | | | $ 1,057,818 | |
| | | | |
| | | | |
| | | |
| TD-14 | | Semiannual Report | The accompanying notes are an integral part of these financial statements. | | |
FRANKLIN TEMPLETON VARIABLE INSURANCE PRODUCTS TRUST
FINANCIAL STATEMENTS
Statement of Operations
for the six months ended June 30, 2020 (unaudited)
| | | | |
| | | Templeton
Developing Markets
VIP Fund | |
Investment income: | | | | |
Dividends:(net of foreign taxes)* | | | | |
Unaffiliated issuers | | | $ 1,949,098 | |
Non-controlled affiliates (Note 3e) | | | 9,562 | |
Income from securities loaned: | | | | |
Unaffiliated entities (net of fees and rebates) | | | 7,753 | |
Non-controlled affiliates (Note 3e) | | | 1,521 | |
| | | | |
| |
Total investment income | | | 1,967,934 | |
| | | | |
| |
Expenses: | | | | |
Management fees (Note 3a) | | | 1,425,717 | |
Distribution fees: (Note 3c) | | | | |
Class 2 | | | 240,375 | |
Class 4 | | | 8,184 | |
Custodian fees (Note 4) | | | 43,751 | |
Reports to shareholders | | | 67,422 | |
Professional fees | | | 46,728 | |
Trustees’ fees and expenses | | | 906 | |
Other | | | 13,674 | |
| | | | |
| |
Total expenses | | | 1,846,757 | |
Expenses waived/paid by affiliates (Note 3e) | | | (5,530 | ) |
| | | | |
| |
Net expenses | | | 1,841,227 | |
| | | | |
| |
Net investment income | | | 126,707 | |
| | | | |
| |
Realized and unrealized gains (losses): | | | | |
Net realized gain (loss) from: | | | | |
Investments:# | | | | |
Unaffiliated issuers | | | 1,449,392 | |
Foreign currency transactions | | | (41,807 | ) |
| | | | |
| |
Net realized gain (loss) | | | 1,407,585 | |
| | | | |
| |
Net change in unrealized appreciation (depreciation) on: | | | | |
Investments: | | | | |
Unaffiliated issuers | | | (40,080,079 | ) |
Translation of other assets and liabilities denominated in foreign currencies | | | 2,367 | |
Change in deferred taxes on unrealized appreciation | | | 559,174 | |
| | | | |
| |
Net change in unrealized appreciation (depreciation) | | | (39,518,538 | ) |
| | | | |
| |
Net realized and unrealized gain (loss) | | | (38,110,953 | ) |
| | | | |
| |
Net increase (decrease) in net assets resulting from operations | | | $(37,984,246 | ) |
| | | | |
| |
*Foreign taxes withheld on dividends | | | $ 441,127 | |
#Net of foreign taxes | | | $ 180,958 | |
| | | | | | |
| | | |
| | The accompanying notes are an integral part of these financial statements. | Semiannual Report | | | TD-15 | |
FRANKLIN TEMPLETON VARIABLE INSURANCE PRODUCTS TRUST
FINANCIAL STATEMENTS
Statements of Changes in Net Assets
| | | | | | | | |
| | | Templeton Developing
Markets VIP Fund | |
| | |
| | | Six Months Ended
June 30, 2020
(unaudited) | | | Year Ended
December 31, 2019 | |
Increase (decrease) in net assets: | | | | | | | | |
Operations: | | | | | | | | |
Net investment income | | $ | 126,707 | | | $ | 5,141,772 | |
Net realized gain (loss) | | | 1,407,585 | | | | 16,774,357 | |
Net change in unrealized appreciation (depreciation) | | | (39,518,538 | ) | | | 50,174,103 | |
| | | | |
| | |
Net increase (decrease) in net assets resulting from operations | | | (37,984,246 | ) | | | 72,090,232 | |
| | | | |
| | |
Distributions to shareholders: | | | | | | | | |
Class 1 | | | (5,313,566 | ) | | | (1,134,638 | ) |
Class 2 | | | (13,445,802 | ) | | | (2,113,534 | ) |
Class 4 | | | (329,902 | ) | | | (46,961 | ) |
| | | | |
| | |
Total distributions to shareholders | | | (19,089,270 | ) | | | (3,295,133 | ) |
| | | | |
| |
Capital share transactions: (Note 2) | | | | |
Class 1 | | | (11,001,413 | ) | | | (8,627,549 | ) |
Class 2 | | | (817,504 | ) | | | (10,720,631 | ) |
Class 4 | | | (60,712 | ) | | | (845,695 | ) |
| | | | |
| | |
Total capital share transactions | | | (11,879,629 | ) | | | (20,193,875 | ) |
| | | | |
| | |
Net increase (decrease) in net assets | | | (68,953,145 | ) | | | 48,601,224 | |
Net assets: | | | | | | | | |
Beginning of period | | | 334,506,178 | | | | 285,904,954 | |
| | | | |
| | |
End of period | | $ | 265,553,033 | | | $ | 334,506,178 | |
| | | | |
| | | | |
| | | |
| TD-16 | | Semiannual Report | The accompanying notes are an integral part of these financial statements. | | |
FRANKLIN TEMPLETON VARIABLE INSURANCE PRODUCTS TRUST
Notes to Financial Statements (unaudited)
Templeton Developing Markets VIP Fund
1. Organization and Significant Accounting Policies
Franklin Templeton Variable Insurance Products Trust (Trust) is registered under the Investment Company Act of 1940 (1940 Act) as an open-end management investment company, consisting of eighteen separate funds and applies the specialized accounting and reporting guidance in U.S. Generally Accepted Accounting Principles (U.S. GAAP). Templeton Developing Markets VIP Fund (Fund) is included in this report. Shares of the Fund are generally sold only to insurance company separate accounts to fund the benefits of variable life insurance policies or variable annuity contracts. The Fund offers three classes of shares: Class 1, Class 2 and Class 4. Each class of shares may differ by its distribution fees, voting rights on matters affecting a single class and its exchange privilege.
The following summarizes the Fund’s significant accounting policies.
a. Financial Instrument Valuation
The Fund’s investments in financial instruments are carried at fair value daily. Fair value is the price that would be received to sell an asset or paid to transfer a liability in an orderly transaction between market participants on the measurement date. The Fund calculates the net asset value (NAV) per share each business day as of 4 p.m. Eastern time or the regularly scheduled close of the New York Stock Exchange (NYSE), whichever is earlier. Under compliance policies and procedures approved by the Trust’s Board of Trustees (the Board), the Fund’s administrator has responsibility for oversight of valuation, including leading the cross-functional Valuation Committee (VC). The Fund may utilize independent pricing services, quotations from securities and financial instrument dealers, and other market sources to determine fair value.
Equity securities listed on an exchange or on the NASDAQ National Market System are valued at the last quoted sale price or the official closing price of the day, respectively. Foreign equity securities are valued as of the close of trading on the foreign stock exchange on which the security is primarily traded, or as of 4 p.m. Eastern time. The value is then converted into its U.S. dollar equivalent at the foreign exchange rate in effect at 4 p.m. Eastern time on the day that the value of the security is determined. Over-the-counter (OTC) securities are valued within the range of the most recent quoted bid and ask prices. Securities that trade in multiple markets or on multiple exchanges are valued
according to the broadest and most representative market. Certain equity securities are valued based upon fundamental characteristics or relationships to similar securities.
Investments in open-end mutual funds are valued at the closing NAV.
The Fund has procedures to determine the fair value of financial instruments for which market prices are not reliable or readily available. Under these procedures, the Fund primarily employs a market-based approach which may use related or comparable assets or liabilities, recent transactions, market multiples, book values, and other relevant information for the investment to determine the fair value of the investment. An income-based valuation approach may also be used in which the anticipated future cash flows of the investment are discounted to calculate fair value. Discounts may also be applied due to the nature or duration of any restrictions on the disposition of the investments. Due to the inherent uncertainty of valuations of such investments, the fair values may differ significantly from the values that would have been used had an active market existed.
Trading in securities on foreign securities stock exchanges and OTC markets may be completed before 4 p.m. Eastern time. In addition, trading in certain foreign markets may not take place on every Fund’s business day. Events can occur between the time at which trading in a foreign security is completed and 4 p.m. Eastern time that might call into question the reliability of the value of a portfolio security held by the Fund. As a result, differences may arise between the value of the Fund’s portfolio securities as determined at the foreign market close and the latest indications of value at 4 p.m. Eastern time. In order to minimize the potential for these differences, an independent pricing service may be used to adjust the value of the Fund’s portfolio securities to the latest indications of fair value at 4 p.m. Eastern time. At June 30, 2020, certain securities may have been fair valued using these procedures, in which case the securities were categorized as Level 2 inputs within the fair value hierarchy. See the Fair Value Measurements note for more information.
When the last day of the reporting period is a non-business day, certain foreign markets may be open on those days that the Fund’s NAV is not calculated, which could result in differences between the value of the Fund’s portfolio securities on the last business day and the last calendar day
FRANKLIN TEMPLETON VARIABLE INSURANCE PRODUCTS TRUST
NOTES TO FINANCIAL STATEMENTS (UNAUDITED)
Templeton Developing Markets VIP Fund (continued)
1. Organization and Significant Accounting
Policies (continued)
a. Financial Instrument Valuation (continued)
of the reporting period. Any significant security valuation changes due to an open foreign market are adjusted and reflected by the Fund for financial reporting purposes.
b. Foreign Currency Translation
Portfolio securities and other assets and liabilities denominated in foreign currencies are translated into U.S. dollars based on the exchange rate of such currencies against U.S. dollars on the date of valuation. The Fund may enter into foreign currency exchange contracts to facilitate transactions denominated in a foreign currency. Purchases and sales of securities, income and expense items denominated in foreign currencies are translated into U.S. dollars at the exchange rate in effect on the transaction date. Portfolio securities and assets and liabilities denominated in foreign currencies contain risks that those currencies will decline in value relative to the U.S. dollar. Occasionally, events may impact the availability or reliability of foreign exchange rates used to convert the U.S. dollar equivalent value. If such an event occurs, the foreign exchange rate will be valued at fair value using procedures established and approved by the Board.
The Fund does not separately report the effect of changes in foreign exchange rates from changes in market prices on securities held. Such changes are included in net realized and unrealized gain or loss from investments in the Statement of Operations.
Realized foreign exchange gains or losses arise from sales of foreign currencies, currency gains or losses realized between the trade and settlement dates on securities transactions and the difference between the recorded amounts of dividends, interest, and foreign withholding taxes and the U.S. dollar equivalent of the amounts actually received or paid. Net unrealized foreign exchange gains and losses arise from changes in foreign exchange rates on foreign denominated assets and liabilities other than investments in securities held at the end of the reporting period.
c. Securities Lending
Certain or all Funds participate in an agency based securities lending program to earn additional income. The Fund receives collateral in the form of cash and/or U.S.
Government and Agency securities against the loaned securities in an amount equal to at least 102% of the fair value of the loaned securities. Collateral is maintained over the life of the loan in an amount not less than 100% of the fair value of loaned securities, as determined at the close of Fund business each day; any additional collateral required due to changes in security values is delivered to the Fund on the next business day. Any cash collateral received is deposited into a joint cash account with other funds and is used to invest in a money market fund managed by Franklin Advisers, Inc., an affiliate of the Funds. Additionally, the Fund received $156,817 in U.S. Government and Agency securities as collateral. The Fund may receive income from the investment of cash collateral, in addition to lending fees and rebates paid by the borrower. Income from securities loaned, net of fees paid to the securities lending agent and/or third-party vendor, is reported separately in the Statements of Operations. The Fund bears the market risk with respect to any cash collateral investment, securities loaned, and the risk that the agent may default on its obligations to the Fund. If the borrower defaults on its obligation to return the securities loaned, the Fund has the right to repurchase the securities in the open market using the collateral received. The securities lending agent has agreed to indemnify the Fund in the event of default by a third party borrower.
d. Income and Deferred Taxes
It is the Fund’s policy to qualify as a regulated investment company under the Internal Revenue Code. The Fund intends to distribute to shareholders substantially all of its taxable income and net realized gains to relieve it from federal income and if applicable, excise taxes. As a result, no provision for U.S. federal income taxes is required.
The Fund may be subject to foreign taxation related to income received, capital gains on the sale of securities and certain foreign currency transactions in the foreign jurisdictions in which it invests. Foreign taxes, if any, are recorded based on the tax regulations and rates that exist in the foreign markets in which the Fund invests. When a capital gain tax is determined to apply, the Fund records an estimated deferred tax liability in an amount that would be payable if the securities were disposed of on the valuation date.
The Fund may recognize an income tax liability related to its uncertain tax positions under U.S. GAAP when the uncertain tax position has a less than 50% probability that it will be
FRANKLIN TEMPLETON VARIABLE INSURANCE PRODUCTS TRUST
NOTES TO FINANCIAL STATEMENTS (UNAUDITED)
Templeton Developing Markets VIP Fund (continued)
sustained upon examination by the tax authorities based on its technical merits. As of June 30, 2020, the Fund has determined that no tax liability is required in its financial statements related to uncertain tax positions for any open tax years (or expected to be taken in future tax years). Open tax years are those that remain subject to examination and are based on the statute of limitations in each jurisdiction in which the Fund invests.
e. Security Transactions, Investment Income, Expenses and Distributions
Security transactions are accounted for on trade date. Realized gains and losses on security transactions are determined on a specific identification basis. Estimated expenses are accrued daily. Dividend income is recorded on the ex-dividend date except for certain dividends from securities where the dividend rate is not available. In such cases, the dividend is recorded as soon as the information is received by the Fund. Distributions to shareholders are recorded on the ex-dividend date. Distributable earnings are determined according to income tax regulations (tax basis) and may differ from earnings recorded in accordance with U.S. GAAP. These differences may be permanent or temporary. Permanent differences are reclassified among capital accounts to reflect their tax character. These reclassifications have no impact on net assets or the results of operations. Temporary differences are not reclassified, as they may reverse in subsequent periods.
Common expenses incurred by the Trust are allocated among the Funds based on the ratio of net assets of each Fund to the combined net assets of the Trust or based on the ratio of
number of shareholders of each Fund to the combined number of shareholders of the Trust. Fund specific expenses are charged directly to the Fund that incurred the expense.
Realized and unrealized gains and losses and net investment income, excluding class specific expenses, are allocated daily to each class of shares based upon the relative proportion of net assets of each class. Differences in per share distributions by class are generally due to differences in class specific expenses.
f. Accounting Estimates
The preparation of financial statements in accordance with U.S. GAAP requires management to make estimates and assumptions that affect the reported amounts of assets and liabilities at the date of the financial statements and the amounts of income and expenses during the reporting period. Actual results could differ from those estimates.
g. Guarantees and Indemnifications
Under the Trust’s organizational documents, its officers and trustees are indemnified by the Trust against certain liabilities arising out of the performance of their duties to the Trust. Additionally, in the normal course of business, the Trust, on behalf of the Fund, enters into contracts with service providers that contain general indemnification clauses. The Trust’s maximum exposure under these arrangements is unknown as this would involve future claims that may be made against the Trust that have not yet occurred. Currently, the Trust expects the risk of loss to be remote.
2. Shares of Beneficial Interest
At June 30, 2020, there were an unlimited number of shares authorized (without par value). Transactions in the Fund’s shares were as follows:
| | | | | | | | | | | | | | | | |
| | |
| | | Six Months Ended
June 30, 2020 | | | Year Ended
December 31, 2019 | |
| | | | |
| | | Shares | | | Amount | | | Shares | | | Amount | |
| | | | |
| Class 1 Shares: | | | | | | | | | | | | | | | | |
Shares sold | | | 297,789 | | | $ | 2,572,312 | | | | 544,413 | | | $ | 5,344,264 | |
Shares issued in reinvestment of distributions | | | 605,880 | | | | 5,313,566 | | | | 121,873 | | | | 1,134,638 | |
Shares redeemed | | | (1,856,447 | ) | | | (18,887,291 | ) | | | (1,570,097 | ) | | | (15,106,451) | |
| | | | |
| | | | |
Net increase (decrease) | | | (952,778 | ) | | $ | (11,001,413 | ) | | | (903,811 | ) | | $ | (8,627,549) | |
| | | | |
FRANKLIN TEMPLETON VARIABLE INSURANCE PRODUCTS TRUST
NOTES TO FINANCIAL STATEMENTS (UNAUDITED)
Templeton Developing Markets VIP Fund (continued)
2. Shares of Beneficial Interest (continued)
| | | | | | | | | | | | | | | | |
| | |
| | | Six Months Ended
June 30, 2020 | | | Year Ended
December 31, 2019 | |
| | | | |
| | | Shares | | | Amount | | | Shares | | | Amount | |
| | | | |
| Class 2 Shares: | | | | | | | | | | | | | | | | |
Shares sold | | | 2,237,390 | | | $ | 21,428,014 | | | | 5,803,158 | | | $ | 55,845,696 | |
Shares issued in reinvestment of distributions | | | 1,543,720 | | | | 13,445,802 | | | | 228,490 | | | | 2,113,534 | |
Shares redeemed | | | (4,019,076 | ) | | | (35,691,320 | ) | | | (7,263,336 | ) | | | (68,679,861) | |
| | | | |
Net increase (decrease) | | | (237,966 | ) | | $ | (817,504 | ) | | | (1,231,688 | ) | | $ | (10,720,631) | |
| | | | |
| | | | |
| Class 4 Shares: | | | | | | | | | | | | | | | | |
Shares sold | | | 21,730 | | | $ | 190,119 | | | | 26,510 | | | $ | 252,720 | |
Shares issued in reinvestment of distributions | | | 37,660 | | | | 329,902 | | | | 5,050 | | | | 46,961 | |
Shares redeemed | | | (62,602 | ) | | | (580,733 | ) | | | (118,358 | ) | | | (1,145,376) | |
| | | | |
Net increase (decrease) | | | (3,212 | ) | | $ | (60,712 | ) | | | (86,798 | ) | | $ | (845,695) | |
| | | | |
3. Transactions with Affiliates
Franklin Resources, Inc. is the holding company for various subsidiaries that together are referred to as Franklin Templeton. Certain officers and trustees of the Fund are also officers and/or trustees of the following subsidiaries:
| | |
| |
| Subsidiary | | Affiliation |
Templeton Asset Management Ltd. (Asset Management) | | Investment manager |
Franklin Templeton Services, LLC (FT Services) | | Administrative manager |
Franklin Templeton Distributors, Inc. (Distributors) | | Principal underwriter |
Franklin Templeton Investor Services, LLC (Investor Services) | | Transfer agent |
a. Management Fees
The Fund pays an investment management fee to Asset Management based on the average daily net assets of the Fund as follows:
| | |
| |
| Annualized Fee Rate | | Net Assets |
1.050% | | Up to and including $1 billion |
1.000% | | Over $1 billion, up to and including $5 billion |
0.950% | | Over $5 billion, up to and including $10 billion |
0.900% | | Over $10 billion, up to and including $15 billion |
0.850% | | Over $15 billion, up to and including $20 billion |
0.800% | | In excess of $20 billion |
b. Administrative Fees
Under an agreement with Asset Management, FT Services provides administrative services to the Fund. The fee is paid by Asset Management based on the Fund’s average daily net assets, and is not an additional expense of the Fund.
FRANKLIN TEMPLETON VARIABLE INSURANCE PRODUCTS TRUST
NOTES TO FINANCIAL STATEMENTS (UNAUDITED)
Templeton Developing Markets VIP Fund (continued)
c. Distribution Fees
The Board has adopted distribution plans for Class 2 and Class 4 shares pursuant to Rule 12b-1 under the 1940 Act. Under the Fund’s compensation distribution plans, the Fund pays Distributors for costs incurred in connection with the servicing, sale and distribution of the Fund’s shares up to 0.25% and 0.35% per year of its average daily net assets of Class 2 and Class 4 respectively. The plan year, for purposes of monitoring compliance with the maximum annual plan rates, is February 1 through January 31.
d. Transfer Agent Fees
Investor Services, under terms of an agreement, performs shareholder servicing for the Fund and is not paid by the Fund for the services.
e. Investments in Affiliated Management Investment Companies
The Fund invests in one or more affiliated management investment companies for purposes other than exercising a controlling influence over the management or policies. Management fees paid by the Fund are waived on assets invested in the affiliated management investment companies, as noted in the Statement of Operations, in an amount not to exceed the management and administrative fees paid directly or indirectly by each affiliate. During the period ended June 30, 2020, the Fund held investments in affiliated management investment companies as follows:
| | | | | | | | | | | | | | | | | | | | | | | | | | | | | | | | |
| | | | | | | | |
| | | Value at
Beginning
of Period | | | Purchases | | | Sales | | | Realized
Gain (Loss) | | | Net Change in
Unrealized
Appreciation
(Depreciation) | | | Value at End of
Period | | | Number of
Shares
Held at End
of Period | | | Investment
Income | |
| Non-Controlled Affiliates | | | | | | | | | | | | | | | | | | | | | | | | | | | | | | | | |
| | | | | | | | |
| | | | | | | | | | | | | | | | | | | | | | | | | | | | | | | Dividends | |
| | | | | | | | | | | | | | | | | | | | | | | | | | | | | | | | |
| | | | | | | | |
Institutional Fiduciary Trust Money Market Portfolio, 0.00% | | | $3,522,232 | | | | $21,477,452 | | | | $(18,315,614) | | | | $ — | | | | $ — | | | | $6,684,070 | | | | 6,684,070 | | | | $ 9,562 | |
| | | | | | | | | | | | | | | | | | | | | | | | | | | | | |
| Income from
securities
loaned |
|
| | | | | | | | | | | | | | | | | | | | | | | | | | | | | | | | |
Institutional Fiduciary Trust Money Market Portfolio, 0.00% | | | — | | | | 12,732,370 | | | | (11,772,370 | ) | | | — | | | | — | | | | 960,000 | | | | 960,000 | | | | 1,521 | |
| | | | | | | | | | | | |
| | | | | | | | |
Total Affiliated Securities | | | $3,522,232 | | | | $34,209,822 | | | | $(30,087,984) | | | | $ — | | | | $ — | | | | $7,644,070 | | | | | | | | $11,083 | |
| | | | | | | | | | | | |
4. Expense Offset Arrangement
The Fund has entered into an arrangement with its custodian whereby credits realized as a result of uninvested cash balances are used to reduce a portion of the Fund’s custodian expenses. During the period ended June 30, 2020, there were no credits earned.
FRANKLIN TEMPLETON VARIABLE INSURANCE PRODUCTS TRUST
NOTES TO FINANCIAL STATEMENTS (UNAUDITED)
Templeton Developing Markets VIP Fund (continued)
5. Income Taxes
At June 30, 2020, the cost of investments and net unrealized appreciation (depreciation) for income tax purposes were as follows:
| | | | |
Cost of investments | | $ | 208,884,501 | |
| | | | |
| |
Unrealized appreciation | | $ | 91,324,396 | |
Unrealized depreciation | | | (35,133,753) | |
| | | | |
| |
Net unrealized appreciation (depreciation) | | $ | 56,190,643 | |
| | | | |
Differences between income and/or capital gains as determined on a book basis and a tax basis are primarily due to differing treatment of corporate actions.
6. Investment Transactions
Purchases and sales of investments (excluding short term securities) for the period ended June 30, 2020, aggregated $6,536,950 and $39,857,980, respectively.
At June 30, 2020, in connection with securities lending transactions, the Fund loaned equity investments and received $960,000 of cash collateral. The gross amount of recognized liability for such transactions is included in payable upon return of securities loaned in the Statement of Assets and Liabilities. The agreements can be terminated at any time.
7. Concentration of Risk
Investing in foreign securities may include certain risks and considerations not typically associated with investing in U.S. securities, such as fluctuating currency values and changing local, regional and global economic, political and social conditions, which may result in greater market volatility. Current political and financial uncertainty surrounding the European Union may increase market volatility and the economic risk of investing in securities in Europe. In addition, certain foreign securities may not be as liquid as U.S. securities.
The United States and other nations have imposed and could impose additional sanctions on certain issuers in Russia due to regional conflicts. These sanctions could result in the devaluation of Russia’s currency, a downgrade in Russian issuers’ credit ratings, or a decline in the value and liquidity of Russian stocks or other securities. Such sanctions could also adversely affect Russia’s economy. The Fund may be prohibited from investing in securities issued by companies subject to such sanctions. In addition, if the Fund holds the securities of an issuer that is subject to such sanctions, an immediate freeze of that issuer’s securities could result, impairing the ability of the Fund to buy, sell, receive or deliver those securities. There is also the risk that countermeasures could be taken by Russia’s government, which could involve the seizure of the Fund’s assets. These risks could affect the value of the Fund’s portfolio. While the Fund holds securities of certain issuers impacted by the sanctions, existing investments do not presently violate the applicable terms and conditions of the sanctions. The sanctions currently do not affect the Fund’s ability to sell these securities. At June 30, 2020, the Fund had 8.5% of its net assets invested in Russia.
8. Novel Coronavirus Pandemic
The global outbreak of the novel coronavirus disease, known as COVID-19, has caused adverse effects on many companies, sectors, nations, regions and the markets in general, and may continue for an unpredictable duration. The effects of this pandemic may materially impact the value and performance of the Fund, its ability to buy and sell fund investments at appropriate valuations and its ability to achieve its investment objectives.
FRANKLIN TEMPLETON VARIABLE INSURANCE PRODUCTS TRUST
NOTES TO FINANCIAL STATEMENTS (UNAUDITED)
Templeton Developing Markets VIP Fund (continued)
9. Credit Facility
The Fund, together with other U.S. registered and foreign investment funds (collectively, Borrowers), managed by Franklin Templeton, are borrowers in a joint syndicated senior unsecured credit facility totaling $2 billion (Global Credit Facility) which matures on February 5, 2021. This Global Credit Facility provides a source of funds to the Borrowers for temporary and emergency purposes, including the ability to meet future unanticipated or unusually large redemption requests.
Under the terms of the Global Credit Facility, the Fund shall, in addition to interest charged on any borrowings made by the Fund and other costs incurred by the Fund, pay its share of fees and expenses incurred in connection with the implementation and maintenance of the Global Credit Facility, based upon its relative share of the aggregate net assets of all of the Borrowers, including an annual commitment fee of 0.15% based upon the unused portion of the Global Credit Facility. These fees are reflected in other expenses in the Statement of Operations. During the period ended June 30, 2020, the Fund did not use the Global Credit Facility.
10. Fair Value Measurements
The Fund follows a fair value hierarchy that distinguishes between market data obtained from independent sources (observable inputs) and the Fund’s own market assumptions (unobservable inputs). These inputs are used in determining the value of the Fund’s financial instruments and are summarized in the following fair value hierarchy:
| | • | | Level 1 – quoted prices in active markets for identical financial instruments |
| | • | | Level 2 – other significant observable inputs (including quoted prices for similar financial instruments, interest rates, prepayment speed, credit risk, etc.) |
| | • | | Level 3 – significant unobservable inputs (including the Fund’s own assumptions in determining the fair value of financial instruments) |
The input levels are not necessarily an indication of the risk or liquidity associated with financial instruments at that level.
FRANKLIN TEMPLETON VARIABLE INSURANCE PRODUCTS TRUST
NOTES TO FINANCIAL STATEMENTS (UNAUDITED)
Templeton Developing Markets VIP Fund (continued)
10. Fair Value Measurements (continued)
A summary of inputs used as of June 30, 2020, in valuing the Fund’s assets carried at fair value, is as follows:
| | | | | | | | | | | | | | | | |
| | | | |
| | | Level 1 | | | Level 2 | | | Level 3 | | | Total | |
Assets: | | | | | | | | | | | | | | | | |
Investments in Securities:a | | | | | | | | | | | | | | | | |
Equity Investments:b | | | | | | | | | | | | | | | | |
Cambodia | | $ | — | | | $ | 1,779,444 | | | $ | — | | | $ | 1,779,444 | |
China | | | 26,039,537 | | | | 54,621,688 | | | | — | | | | 80,661,225 | |
Czech Republic | | | — | | | | 883,994 | | | | — | | | | 883,994 | |
Hungary | | | — | | | | 2,730,392 | | | | — | | | | 2,730,392 | |
India | | | — | | | | 14,196,801 | | | | — | | | | 14,196,801 | |
Indonesia | | | — | | | | 2,487,990 | | | | — | | | | 2,487,990 | |
Philippines | | | — | | | | 647,421 | | | | — | | | | 647,421 | |
Russia | | | 6,318,476 | | | | 16,278,025 | | | | — | | | | 22,596,501 | |
South Africa | | | — | | | | 12,698,360 | | | | — | | | | 12,698,360 | |
South Korea | | | — | | | | 50,949,349 | | | | — | | | | 50,949,349 | |
Taiwan | | | — | | | | 30,348,210 | | | | — | | | | 30,348,210 | |
Thailand | | | — | | | | 3,969,693 | | | | — | | | | 3,969,693 | |
United Kingdom | | | — | | | | 7,885,110 | | | | — | | | | 7,885,110 | |
All Other Equity Investments | | | 25,596,584 | | | | — | | | | — | | | | 25,596,584 | |
Short Term Investments | | | 7,644,070 | | | | — | | | | — | | | | 7,644,070 | |
| | | | |
Total Investments in Securities | | $ | 65,598,667 | | | $ | 199,476,477 | | | $ | — | | | $ | 265,075,144 | |
| | | | |
aFor detailed categories, see the accompanying Statement of Investments.
bIncludes common and preferred stocks as well as other equity interests.
11. New Accounting Pronouncements
In March 2020, the Financial Accounting Standards Board issued Accounting Standards Update (ASU) No. 2020-04, Reference Rate Reform (Topic 848) – Facilitation of the Effects of Reference Rate Reform on Financial Reporting. The amendments in the ASU provides optional temporary financial reporting relief from the effect of certain types of contract modifications due to the planned discontinuation of LIBOR and other interbank-offered based reference rates as of the end of 2021. The ASU is effective for certain reference rate-related contract modifications that occur during the period March 12, 2020 through December 31, 2022. Management is currently evaluating the impact, if any, of applying this ASU.
12. Subsequent Events
The Fund has evaluated subsequent events through the issuance of the financial statements and determined that no events have occurred that require disclosure.
Abbreviations
| | |
|
| Selected Portfolio |
| |
| ADR | | American Depositary Receipt |
| |
| GDR | | Global Depositary Receipt |
FRANKLIN TEMPLETON VARIABLE INSURANCE PRODUCTS TRUST
Tax Information (unaudited)
Templeton Developing Markets VIP Fund
At December 31, 2019, more than 50% of the Fund’s total assets were invested in securities of foreign issuers. In most instances, foreign taxes were withheld from income paid to the Fund on these investments. As shown in the table below, the Fund hereby reports to shareholders the foreign source income and foreign taxes paid, pursuant to Section 853 of the Internal Revenue Code. This written statement will allow shareholders of record on June 11, 2020, to treat their proportionate share of foreign taxes paid by the Fund as having been paid directly by them. The shareholder shall consider these amounts as foreign taxes paid in the tax year in which they receive the Fund distribution.
The following table provides a detailed analysis of foreign tax paid and foreign source income as reported by the Fund to shareholders of record.
| | | | | | | | |
| | |
| Class | | Foreign Tax Paid
Per Share | | | Foreign Source
Income Per Share | |
Class 1 | | | $0.0543 | | | | $0.4959 | |
Class 2 | | | $0.0543 | | | | $0.4688 | |
Class 4 | | | $0.0543 | | | | $0.4576 | |
Foreign Tax Paid Per Share is the amount per share available to you, as a tax credit (assuming you held your shares in the Fund for a minimum of 16 days during the 31-day period beginning 15 days before the ex-dividend date of the Fund’s distribution to which the foreign taxes relate), or, as a tax deduction.
Foreign Source Income Per Share is the amount per share of income dividends attributable to foreign securities held by the Fund, plus any foreign taxes withheld on these dividends. The amounts reported include foreign source qualified dividends that have not been adjusted for the rate differential applicable to such dividend income.
This page intentionally left blank.
Templeton Foreign VIP Fund
This semiannual report for Templeton Foreign VIP Fund covers the period ended June 30, 2020.
Class 4 Performance Summary as of June 30, 2020
The Fund’s Class 4 Shares posted a -18.39% total return* for the six-month period ended June 30, 2020.
*The Fund has a fee waiver associated with any investment it makes in a Franklin Templeton money fund and/or other Franklin Templeton fund, contractually guaranteed through 4/30/21. Fund investment results reflect the fee waiver; without this waiver, the results would have been lower.
Performance reflects the Fund’s Class 4 operating expenses, but does not include any contract fees, expenses or sales charges. If they had been included, performance would be lower. These charges and deductions, particularly for variable life policies, can have a significant effect on contract values and insurance benefits. See the contract prospectus for a complete description of these expenses, including sales charges.
Performance data represent past performance, which does not guarantee future results. Investment return and principal value will fluctuate, and you may have a gain or loss when you sell your shares. Current performance may differ from figures shown.
TEMPLETON FOREIGN VIP FUND
Fund Goal and Main Investments
The Fund seeks long-term capital growth. Under normal market conditions, the Fund invests at least 80% of its net assets in investments of issuers located outside the U.S., including those in emerging markets.
Fund Risks
All investments involve risks, including possible loss of principal. Unexpected events and their aftermaths, such as the spread of deadly diseases; natural, environmental or man-made disasters; financial, political or social disruptions; terrorism and war; and other tragedies or catastrophes, can cause investor fear and panic, which can adversely affect the economies of many companies, sectors, nations, regions and the market in general, in ways that cannot necessarily be foreseen. Special risks are associated with foreign investing, including currency fluctuations, economic instability and political developments; investments in developing markets involve heightened risks related to the same factors. Currency rates may fluctuate significantly over short periods of time, and can reduce returns. Because the Fund may invest its assets in companies in a specific region, including Europe, it is subject to greater risks of adverse developments in that region and/or the surrounding regions than a fund that is more broadly diversified geographically. Current political uncertainty concerning the economic consequences of the departure of the U.K. from the European Union may increase market volatility. Derivatives, including currency management strategies, involve costs and can create economic leverage in the portfolio which may result in significant volatility and cause the Fund to participate in losses (as well as enable gains) on an amount that exceeds the Fund’s initial investment. The Fund may not achieve the anticipated benefits, and may realize losses when a counterparty fails to perform as promised. The Fund is actively managed but there is no guarantee that the manager’s investment decisions will produce the desired results. The Fund’s prospectus also includes a description of the main investment risks.
Performance Overview
You can find the Fund’s six-month total return in the Performance Summary. In comparison, the Fund’s benchmark, the MSCI All Country World Index (ACWI) ex
Geographic Composition
Based on Total Net Assets as of 6/30/20
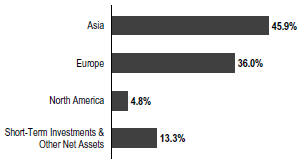
USA Index, posted a -10.76% total return for the same period.1 Please note, index performance information is provided for reference and we do not attempt to track the index but rather undertake investments on the basis of fundamental research.
Economic and Market Overview
Global developed and emerging market equities, as measured by the MSCI ACWI (USD), posted a -5.99% total return during the six months under review.1 Stocks fell sharply in early 2020 as countries around the world implemented lockdown measures in an effort to slow the spread of the novel coronavirus (COVID-19). Global supply chain disruptions, business and personal restrictions, and subdued consumer spending drove many investors to sell equity holdings in favor of perceived safe investments such as government bonds and cash. While global equities, notably in the U.S., rebounded in April and May amid optimism about easing lockdown restrictions, concerns about a second wave of infections hindered equities in June, as investors weighed the possibility of renewed restrictions.
In the U.S., government mandates to mitigate the COVID-19 pandemic severely impacted the economy beginning in March 2020. As a result, the unemployment rate surged to 14.7% in April, as many businesses, particularly those involved in hospitality, retail and travel, announced mass layoffs.2 According to the National Bureau of Economic Research, the longest U.S. economic expansion in history ended in February 2020 as the country slipped into a severe recession. Nonetheless, near period-end, there were signs that a recovery was underway, as jobless claims fell
1. Source: Morningstar. One cannot invest directly in an index, and an index is not representative of the Fund’s portfolio. Please see Index Descriptions following the Fund Summaries.
2. Source: U.S. Bureau of Labor Statistics.
The dollar value, number of shares or principal amount, and names of all portfolio holdings are listed in the Fund’s Statement of Investments (SOI).
TEMPLETON FOREIGN VIP FUND
considerably from their peak in early April, retail sales rose sharply in May, and the unemployment rate fell to 11.1% in June.2 Along with optimism about improved treatments and potential vaccines for COVID-19, the positive economic signals contributed to a significant equity rebound in April and May. However, an increase in COVID-19 infections in many states throughout June pressured U.S. stocks.
The U.S. Federal Reserve (Fed) made significant efforts to support the U.S. economy. In March 2020, as the pandemic began to severely impact the economy and financial markets, the Fed implemented two emergency rate cuts, lowering the federal funds target rate to a range of 0.00%–0.25%, and announced sweeping quantitative easing measures aimed at ensuring credit flow to borrowers and supporting credit markets with unlimited amounts of bond purchasing.
In the eurozone, some analysts forecasted a significant contraction in 2020, particularly in southern European countries, as the magnitude of the economic disruption caused by the pandemic became apparent. European developed market equities, as measured by the MSCI Europe Index (USD), posted a -12.43% total return for the period.1 To stimulate growth, the European Central Bank implemented a broad bond-buying program, and many countries passed fiscal stimulus measures.
Asian developed and emerging market equities, as measured by the MSCI All Country Asia Index (USD), posted a -5.51% total return during the six-month period.1 The onset of the pandemic brought dramatically slower economic activity in Asia, as businesses halted operations and manufacturing and export activity declined sharply in the region’s major economies. Asian markets generally advanced toward period-end, bolstered by fiscal stimulus measures and economies reopening throughout the region.
Emerging market stocks, as measured by the MSCI Emerging Markets Index (USD), posted a -9.67% total return due primarily to the COVID-19 pandemic.1 A sharp decrease in prices for oil and other natural resources also hurt emerging market economies reliant on these exports. In the last quarter of the reporting period, however, investor optimism led to a stock rally, particularly in emerging market countries that had successfully lowered infection rates.
Investment Strategy
Our investment philosophy is bottom up, value oriented and long term. When choosing investments for the Fund, we generally focus on the market price of a company’s securities relative to our evaluation of the company’s
Top 10 Holdings
6/30/20
| | | | |
| |
Company
Sector/Industry, Country | | % of Total
Net Assets | |
Samsung Electronics Co. Ltd.
Technology Hardware, Storage & Peripherals,
South Korea | | | 3.6% | |
Bayer AG
Pharmaceuticals, Germany | | | 3.5% | |
Takeda Pharmaceutical Co. Ltd.
Pharmaceuticals, Japan | | | 3.1% | |
Wheaton Precious Metals Corp.
Metals & Mining, Canada | | | 2.9% | |
Taiwan Semiconductor Manufacturing Co. Ltd.
Semiconductors & Semiconductor Equipment, Taiwan | | | 2.5% | |
KB Financial Group Inc.
Banks, South Korea | | | 2.4% | |
NXP Semiconductors NV
Semiconductors & Semiconductor Equipment, Netherlands | | | 2.3% | |
CK Hutchison Holdings Ltd.
Industrial Conglomerates, Hong Kong | | | 2.3% | |
Kirin Holdings Co. Ltd.
Beverages, Japan | | | 2.2% | |
Sanofi
Pharmaceuticals, France | | | 2.1% | |
potential long-term earnings, asset value and cash flow. Our analysis includes an assessment of the potential impacts of material environmental, social and governance (ESG) factors on the long-term risk and return profile of a company. We also consider a company’s price/earnings ratio, price/cash flow ratio, profit margins and liquidation value.
The Fund may, from time to time, engage in currency-related derivatives to seek to hedge (protect) against currency risks. The Fund may also use a variety of equity-related derivatives for various purposes including enhancing Fund returns, increasing liquidity and gaining exposure to particular markets in more efficient or less expensive ways.
Manager’s Discussion
During the six months under review, key contributors to the Fund’s performance relative to the MSCI ACWI ex USA Index included stock selection in the materials and utilities sectors.
Within materials, Canadian mining companies Wheaton Precious Metals and Alamos Gold (not part of the index) aided relative results. Their stocks performed particularly
TEMPLETON FOREIGN VIP FUND
well in the first half of 2020 as the price of gold reached multi-year highs.
In the utilities sector, German energy solutions company E.ON benefited relative performance.
Other key notable contributors included Swiss pharmaceuticals firm Roche Holding and German industrial conglomerate Siemens. Roche performed well as its business is largely unaffected by the COVID-19 pandemic, with its cancer, hemophilia and multiple sclerosis medicines and treatments continuing to be administered.
In contrast, key detractors from the Fund’s relative performance included stock selection in the financials and communication services sectors and an overweighting in the energy sector.
Within financials, our positions in Standard Chartered, ING Groep and Bank of Ireland (not held at period-end) hindered relative results. U.K.-domiciled, Asia-focused lender Standard Chartered was negatively impacted by escalating turmoil in Hong Kong. We believe management’s recent efforts to de-risk the balance sheet, combined with the bank’s solid core franchise in trade finance and high net worth retail client base, position it well to withstand macro adversity and emerge with its growth strategy intact. The shares of Dutch banking services firm ING Groep and Bank of Ireland declined due to broad-based economic fears and low interest rates. ING’s shares were further pressured by management’s suspension of dividend payments.
In the communication services sector, our holding in Luxembourg-based communication satellite owner SES (not held at period-end) hindered relative results.
Within energy, our positions in U.K.-based integrated energy firm BP and U.K.-listed oil and natural gas producer Royal Dutch Shell (not held at period-end) dampened relative results.
From a regional perspective, stock selection and an underweighting in North America, particularly in Canada, contributed to the Fund’s relative performance. In contrast, stock selection in Asia, notably in China, Hong Kong and South Korea, detracted from relative performance. In Europe, stock selection and an overweighting hindered relative performance, as relative weakness in the Netherlands and the U.K. more than offset relative strength in Germany.
Thank you for your participation in Templeton Foreign VIP Fund. We look forward to serving your future investment needs.
The foregoing information reflects our analysis, opinions and portfolio holdings as of June 30, 2020, the end of the reporting period. The way we implement our main investment strategies and the resulting portfolio holdings may change depending on factors such as market and economic conditions. These opinions may not be relied upon as investment advice or an offer for a particular security. The information is not a complete analysis of every aspect of any market, country, industry, security or the Fund. Statements of fact are from sources considered reliable, but the investment manager makes no representation or warranty as to their completeness or accuracy. Although historical performance is no guarantee of future results, these insights may help you understand our investment management philosophy.
TEMPLETON FOREIGN VIP FUND
Class 4 Fund Expenses
As an investor in a variable insurance contract (Contract) that indirectly provides for investment in an underlying mutual fund, you can incur transaction and/or ongoing expenses at both the Fund level and the Contract Level: (1) transaction expenses can include sales charges (loads) on purchases, surrender fees, transfer fees and premium taxes; and (2) ongoing expenses can include management fees, distribution and service (12b-1) fees, contract fees, annual maintenance fees, mortality and expense risk fees and other fees and expenses. All mutual funds and Contracts have some types of ongoing expenses. The table below shows Fund-level ongoing expenses and can help you understand these costs and compare them with those of other mutual funds offered through the Contract. The table assumes a $1,000 investment held for the six months indicated. Please refer to the Fund prospectus for additional information on operating expenses.
Actual Fund Expenses
The table below provides information about the actual account values and actual expenses in the columns under the heading “Actual.” In these columns the Fund’s actual return, which includes the effect of ongoing Fund expenses but does not include the effect of ongoing Contract expenses, is used to calculate the “Ending Account Value.” You can estimate the Fund-level expenses you paid during the period by following these steps (of course, your account value and expenses will differ from those in this illustration): Divide your account value by $1,000 (if your account had an $8,600 value, then $8,600 ÷ $1,000 = 8.6). Then multiply the result by the number under the headings “Actual” and “Fund-Level Expenses Paid During Period” (if Fund-Level Expenses Paid During Period were $ 7.50, then 8.6 x $ 7.50 = $64.50). In this illustration, the estimated expenses paid this period at the Fund level are $64.50.
Hypothetical Example for Comparison with Other Mutual Funds
Under the heading “Hypothetical” in the table, information is provided about hypothetical account values and hypothetical expenses based on the Fund’s actual expense ratio and an assumed rate of return of 5% per year before expenses, which is not the Fund’s actual return. This information may not be used to estimate the actual ending account balance or expenses you paid for the period, but it can help you compare ongoing costs of investing in the Fund with those of other mutual funds offered through the Contract. To do so, compare this 5% hypothetical example with the 5% hypothetical examples that appear in the shareholder reports of other funds offered through the Contract.
Please note that expenses shown in the table are meant to highlight ongoing costs at the Fund level only and do not reflect any ongoing expenses at the Contract level, or transaction expenses at either the Fund or Contract levels. In addition, while the Fund does not have transaction expenses, if the transaction and ongoing expenses at the Contract level were included, the expenses shown below would be higher. You should consult your Contract prospectus or disclosure document for more information.
| | | | | | | | | | | | | | | | | | |
| | | | | | | |
| | | | | | | Actual (actual return after expenses) | | | | Hypothetical
(5% annual return before expenses) | | | | |
Share Class | | Beginning
Account
Value 1/1/20 | | | | Ending
Account
Value 6/30/20 | | Fund-Level
Expenses
Paid During
Period
1/1/20–6/30/201, 2 | | | | Ending Account Value 6/30/20 | | Fund-Level
Expenses
Paid During
Period 1/1/20–6/30/201, 2 | | | | Net
Annualized
Expense
Ratio2 |
Class 4 | | $1,000 | | | | $816.10 | | $5.33 | | | | $1,019.00 | | $5.92 | | | | 1.18% |
1. Expenses are equal to the annualized expense ratio for the six-month period as indicated above—in the far right column—multiplied by the simple average account value over the period indicated, and then multiplied by 182/366 to reflect the one-half year period.
2. Reflects expenses after fee waivers and expense reimbursements. Does not include any ongoing expenses of the Contract for which the Fund is an investment option or acquired fund fees and expenses.
FRANKLIN TEMPLETON VARIABLE INSURANCE PRODUCTS TRUST
Financial Highlights
Templeton Foreign VIP Fund
| | | | | | | | | | | | | | | | | | | | | | | | |
| | |
| | | Six Months Ended June 30, 2020 (unaudited) | | | Year Ended December 31, | |
| | | 2019 | | | 2018 | | | 2017 | | | 2016 | | | 2015 | |
| | | | | | |
Class 1 | | | | | | | | | | | | | | | | | | | | | | | | |
| | | | | | |
Per share operating performance
(for a share outstanding throughout the period) | | | | | | | | | | | | | | | | | | | | | | | | |
| | | | | | |
Net asset value, beginning of period | | | $14.23 | | | | $13.01 | | | | $15.80 | | | | $13.89 | | | | $13.46 | | | | $15.34 | |
| | | | |
| | | | | | |
| Income from investment operationsa: | | | | | | | | | | | | | | | | | | | | | | | | |
| | | | | | |
Net investment incomeb | | | 0.14 | | | | 0.44 | | | | 0.29 | | | | 0.30 | | | | 0.33 | | | | 0.31 | |
| | | | | | |
Net realized and unrealized gains (losses) | | | (2.73 | ) | | | 1.19 | | | | (2.64 | ) | | | 2.03 | | | | 0.62 | | | | (1.16 | ) |
| | | | |
| | | | | | |
Total from investment operations | | | (2.59 | ) | | | 1.63 | | | | (2.35 | ) | | | 2.33 | | | | 0.95 | | | | (0.85 | ) |
| | | | |
| | | | | | |
| Less distributions from: | | | | | | | | | | | | | | | | | | | | | | | | |
| | | | | | |
Net investment income | | | (0.44 | ) | | | (0.27 | ) | | | (0.44 | ) | | | (0.42 | ) | | | (0.29 | ) | | | (0.53 | ) |
| | | | | | |
Net realized gains | | | — | | | | (0.14 | ) | | | — | | | | — | | | | (0.23 | ) | | | (0.50 | ) |
| | | | |
| | | | | | |
Total distributions | | | (0.44 | ) | | | (0.41 | ) | | | (0.44 | ) | | | (0.42 | ) | | | (0.52 | ) | | | (1.03 | ) |
| | | | |
| | | | | | |
Net asset value, end of period | | | $11.20 | | | | $14.23 | | | | $13.01 | | | | $15.80 | | | | $13.89 | | | | $13.46 | |
| | | | |
| | | | | | |
Total returnc | | | (18.22)% | | | | 12.84% | | | | (15.27)% | | | | 17.02% | | | | 7.49% | | | | (6.31)% | |
| | | | | | |
| Ratios to average net assetsd | | | | | | | | | | | | | | | | | | | | | | | | |
| | | | | | |
Expenses before waiver and payments by affiliates | | | 0.86% | | | | 0.85% | | | | 0.83% | | | | 0.82% | | | | 0.80% | | | | 0.78% | |
| | | | | | |
Expenses net of waiver and payments by affiliates | | | 0.83% | | | | 0.83% | | | | 0.81% | | | | 0.81%e | | | | 0.78% | | | | 0.78%f | |
| | | | | | |
Net investment income | | | 2.34% | | | | 3.25% | | | | 1.96% | | | | 1.99% | | | | 2.38% | | | | 2.05% | |
| | | | | | |
| Supplemental data | | | | | | | | | | | | | | | | | | | | | | | | |
| | | | | | |
Net assets, end of period (000’s) | | | $97,104 | | | | $121,948 | | | | $114,784 | | | | $152,684 | | | | $133,218 | | | | $214,172 | |
| | | | | | |
Portfolio turnover rate | | | 23.71% | | | | 28.52% | | | | 21.38% | | | | 26.81% | | | | 20.93% | | | | 15.15% | |
aThe amount shown for a share outstanding throughout the period may not correlate with the Statement of Operations for the period due to the timing of sales and repurchases of the Fund’s shares in relation to income earned and/or fluctuating fair value of the investments of the Fund.
bBased on average daily shares outstanding.
cTotal return does not include fees, charges or expenses imposed by the variable annuity and life insurance contracts for which Franklin Templeton Variable Insurance Products Trust serves as an underlying investment vehicle. Total return is not annualized for periods less than one year.
dRatios are annualized for periods less than one year.
eBenefit of expense reduction rounds to less than 0.01%.
fBenefit of waiver and payments by affiliates rounds to less than 0.01%.
| | | | |
| | | |
| TF-6 | | Semiannual Report | The accompanying notes are an integral part of these financial statements. | | |
FRANKLIN TEMPLETON VARIABLE INSURANCE PRODUCTS TRUST
FINANCIAL HIGHLIGHTS
Templeton Foreign VIP Fund (continued)
| | | | | | | | | | | | | | | | | | | | | | | | |
| | |
| | | Six Months Ended
June 30, 2020 (unaudited) | | | Year Ended December 31, | |
| | | 2019 | | | 2018 | | | 2017 | | | 2016 | | | 2015 | |
| | | | | | |
Class 2 | | | | | | | | | | | | | | | | | | | | | | | | |
| | | | | | |
Per share operating performance
(for a share outstanding throughout the period) | | | | | | | | | | | | | | | | | | | | | | | | |
| | | | | | |
Net asset value, beginning of period | | | $13.93 | | | | $12.74 | | | | $15.47 | | | | $13.61 | | | | $13.20 | | | | $15.05 | |
| | | | |
| | | | | | |
| Income from investment operationsa: | | | | | | | | | | | | | | | | | | | | | | | | |
| | | | | | |
Net investment incomeb | | | 0.12 | | | | 0.40 | | | | 0.25 | | | | 0.26 | | | | 0.28 | | | | 0.27 | |
| | | | | | |
Net realized and unrealized gains (losses) | | | (2.67 | ) | | | 1.16 | | | | (2.58 | ) | | | 1.98 | | | | 0.62 | | | | (1.13 | ) |
| | | | |
| | | | | | |
Total from investment operations | | | (2.55 | ) | | | 1.56 | | | | (2.33 | ) | | | 2.24 | | | | 0.90 | | | | (0.86 | ) |
| | | | |
| | | | | | |
| Less distributions from: | | | | | | | | | | | | | | | | | | | | | | | | |
| | | | | | |
Net investment income | | | (0.40 | ) | | | (0.23 | ) | | | (0.40 | ) | | | (0.38 | ) | | | (0.26 | ) | | | (0.49 | ) |
| | | | | | |
Net realized gains | | | — | | | | (0.14 | ) | | | — | | | | — | | | | (0.23 | ) | | | (0.50 | ) |
| | | | |
| | | | | | |
Total distributions | | | (0.40 | ) | | | (0.37 | ) | | | (0.40 | ) | | | (0.38 | ) | | | (0.49 | ) | | | (0.99 | ) |
| | | | |
| | | | | | |
Net asset value, end of period | | | $10.98 | | | | $13.93 | | | | $12.74 | | | | $15.47 | | | | $13.61 | | | | $13.20 | |
| | | | |
| | | | | | |
Total returnc | | | (18.35)% | | | | 12.53% | | | | (15.44)% | | | | 16.69% | | | | 7.18% | | | | (6.49)% | |
| | | | | | |
| Ratios to average net assetsd | | | | | | | | | | | | | | | | | | | | | | | | |
| | | | | | |
Expenses before waiver and payments by affiliates | | | 1.11% | | | | 1.10% | | | | 1.08% | | | | 1.07% | | | | 1.05% | | | | 1.03% | |
| | | | | | |
Expenses net of waiver and payments by affiliates | | | 1.08% | | | | 1.08% | | | | 1.06% | | | | 1.06%e | | | | 1.03% | | | | 1.03%f | |
| | | | | | |
Net investment income | | | 2.09% | | | | 3.00% | | | | 1.71% | | | | 1.74% | | | | 2.13% | | | | 1.80% | |
| | | | | | |
| Supplemental data | | | | | | | | | | | | | | | | | | | | | | | | |
| | | | | | |
Net assets, end of period (000’s) | | | $917,866 | | | | $1,117,813 | | | | $1,060,101 | | | | $1,394,475 | | | | $1,436,518 | | | | $1,456,854 | |
| | | | | | |
Portfolio turnover rate | | | 23.71% | | | | 28.52% | | | | 21.38% | | | | 26.81% | | | | 20.93% | | | | 15.15% | |
aThe amount shown for a share outstanding throughout the period may not correlate with the Statement of Operations for the period due to the timing of sales and repurchases of the Fund’s shares in relation to income earned and/or fluctuating fair value of the investments of the Fund.
bBased on average daily shares outstanding.
cTotal return does not include fees, charges or expenses imposed by the variable annuity and life insurance contracts for which Franklin Templeton Variable Insurance Products Trust serves as an underlying investment vehicle. Total return is not annualized for periods less than one year.
dRatios are annualized for periods less than one year.
eBenefit of expense reduction rounds to less than 0.01%.
fBenefit of waiver and payments by affiliates rounds to less than 0.01%.
| | | | | | |
| | | |
| | The accompanying notes are an integral part of these financial statements. | Semiannual Report | | | TF-7 | |
FRANKLIN TEMPLETON VARIABLE INSURANCE PRODUCTS TRUST
FINANCIAL HIGHLIGHTS
Templeton Foreign VIP Fund (continued)
| | | | | | | | | | | | | | | | | | | | | | | | |
| | |
| | | Six Months Ended
June 30, 2020 (unaudited) | | | Year Ended December 31, | |
| | | 2019 | | | 2018 | | | 2017 | | | 2016 | | | 2015 | |
| | | | | | |
Class 4 | | | | | | | | | | | | | | | | | | | | | | | | |
| | | | | | |
Per share operating performance
(for a share outstanding throughout the period) | | | | | | | | | | | | | | | | | | | | | | | | |
| | | | | | |
Net asset value, beginning of period | | | $14.20 | | | | $12.96 | | | | $15.71 | | | | $13.71 | | | | $13.29 | | | | $15.16 | |
| | | | |
| | | | | | |
| Income from investment operationsa: | | | | | | | | | | | | | | | | | | | | | | | | |
| | | | | | |
Net investment incomeb | | | 0.12 | | | | 0.39 | | | | 0.24 | | | | 0.23 | | | | 0.26 | | | | 0.25 | |
| | | | | | |
Net realized and unrealized gains (losses) | | | (2.73 | ) | | | 1.20 | | | | (2.63 | ) | | | 2.03 | | | | 0.63 | | | | (1.14 | ) |
| | | | |
| | | | | | |
Total from investment operations | | | (2.61 | ) | | | 1.59 | | | | (2.39 | ) | | | 2.26 | | | | 0.89 | | | | (0.89 | ) |
| | | | |
| | | | | | |
| Less distributions from: | | | | | | | | | | | | | | | | | | | | | | | | |
| | | | | | |
Net investment income | | | (0.39 | ) | | | (0.21 | ) | | | (0.36 | ) | | | (0.26 | ) | | | (0.24 | ) | | | (0.48 | ) |
| | | | | | |
Net realized gains | | | — | | | | (0.14 | ) | | | — | | | | — | | | | (0.23 | ) | | | (0.50 | ) |
| | | | |
| | | | | | |
Total distributions | | | (0.39 | ) | | | (0.35 | ) | | | (0.36 | ) | | | (0.26 | ) | | | (0.47 | ) | | | (0.98 | ) |
| | | | |
| | | | | | |
Net asset value, end of period | | | $11.20 | | | | $14.20 | | | | $12.96 | | | | $15.71 | | | | $13.71 | | | | $13.29 | |
| | | | |
| | | | | | |
Total returnc | | | (18.39)% | | | | 12.49% | | | | (15.54)% | | | | 16.62% | | | | 7.09% | | | | (6.65)% | |
| | | | | | |
| Ratios to average net assetsd | | | | | | | | | | | | | | | | | | | | | | | | |
| | | | | | |
Expenses before waiver and payments by affiliates | | | 1.21% | | | | 1.20% | | | | 1.18% | | | | 1.17% | | | | 1.15% | | | | 1.13% | |
| | | | | | |
Expenses net of waiver and payments by affiliates | | | 1.18% | | | | 1.18% | | | | 1.16% | | | | 1.16%e | | | | 1.13% | | | | 1.13%f | |
| | | | | | |
Net investment income | | | 1.99% | | | | 2.90% | | | | 1.61% | | | | 1.64% | | | | 2.03% | | | | 1.70% | |
| | | | | | |
| Supplemental data | | | | | | | | | | | | | | | | | | | | | | | | |
| | | | | | |
Net assets, end of period (000’s) | | | $94,464 | | | | $113,681 | | | | $125,265 | | | | $159,944 | | | | $484,763 | | | | $472,189 | |
| | | | | | |
Portfolio turnover rate | | | 23.71% | | | | 28.52% | | | | 21.38% | | | | 26.81% | | | | 20.93% | | | | 15.15% | |
aThe amount shown for a share outstanding throughout the period may not correlate with the Statement of Operations for the period due to the timing of sales and repurchases of the Fund’s shares in relation to income earned and/or fluctuating fair value of the investments of the Fund.
bBased on average daily shares outstanding.
cTotal return does not include fees, charges or expenses imposed by the variable annuity and life insurance contracts for which Franklin Templeton Variable Insurance Products Trust serves as an underlying investment vehicle. Total return is not annualized for periods less than one year.
dRatios are annualized for periods less than one year.
eBenefit of expense reduction rounds to less than 0.01%.
fBenefit of waiver and payments by affiliates rounds to less than 0.01%.
| | | | |
| | | |
| TF-8 | | Semiannual Report | The accompanying notes are an integral part of these financial statements. | | |
FRANKLIN TEMPLETON VARIABLE INSURANCE PRODUCTS TRUST
Statement of Investments, June 30, 2020 (unaudited)
Templeton Foreign VIP Fund
| | | | | | | | | | | | | | |
| | | | |
| | | | | Country | | | Shares | | | Value | |
| | | | |
| | Common Stocks 86.7% | | | | | | | | | | | | |
| | Aerospace & Defense 1.1% | | | | | | | | | | | | |
| | BAE Systems PLC | | | United Kingdom | | | | 1,961,611 | | | $ | 11,728,900 | |
| | | | | | | | | | | | | | |
| | | | |
| | Auto Components 2.4% | | | | | | | | | | | | |
| a | | Cie Generale des Etablissements Michelin SCA | | | France | | | | 158,794 | | | | 16,550,108 | |
| | Toyota Industries Corp. | | | Japan | | | | 186,300 | | | | 9,902,335 | |
| | | | | | | | | | | | | | |
| | | | |
| | | | | | | | | | | | | 26,452,443 | |
| | | | | | | | | | | | | | |
| | | | |
| | Automobiles 3.9% | | | | | | | | | | | | |
| | Bayerische Motoren Werke AG | | | Germany | | | | 205,506 | | | | 13,118,469 | |
| | Honda Motor Co. Ltd. | | | Japan | | | | 517,600 | | | | 13,381,886 | |
| | Isuzu Motors Ltd. | | | Japan | | | | 1,813,100 | | | | 16,476,249 | |
| | | | | | | | | | | | | | |
| | | | |
| | | | | | | | | | | | | 42,976,604 | |
| | | | | | | | | | | | | | |
| | | | |
| | Banks 9.3% | | | | | | | | | | | | |
| b | | BNP Paribas SA | | | France | | | | 276,049 | | | | 11,028,284 | |
| | ING Groep NV | | | Netherlands | | | | 1,953,931 | | | | 13,619,453 | |
| | Kasikornbank PCL, fgn | | | Thailand | | | | 1,860,000 | | | | 5,652,448 | |
| a | | KB Financial Group Inc., ADR | | | South Korea | | | | 956,806 | | | | 26,618,343 | |
| | Shinhan Financial Group Co. Ltd. | | | South Korea | | | | 366,922 | | | | 8,890,839 | |
| | Standard Chartered PLC | | | United Kingdom | | | | 3,651,049 | | | | 19,790,786 | |
| | Sumitomo Mitsui Financial Group Inc. | | | Japan | | | | 606,500 | | | | 17,116,516 | |
| | | | | | | | | | | | | | |
| | | | |
| | | | | | | | | | | | | 102,716,669 | |
| | | | | | | | | | | | | | |
| | | | |
| | Beverages 2.7% | | | | | | | | | | | | |
| a | | Kirin Holdings Co. Ltd. | | | Japan | | | | 1,159,100 | | | | 24,433,531 | |
| | Suntory Beverage & Food Ltd. | | | Japan | | | | 153,600 | | | | 5,993,200 | |
| | | | | | | | | | | | | | |
| | | | |
| | | | | | | | | | | | | 30,426,731 | |
| | | | | | | | | | | | | | |
| | | | |
| | Chemicals 2.4% | | | | | | | | | | | | |
| | Covestro AG | | | Germany | | | | 199,631 | | | | 7,602,917 | |
| | Johnson Matthey PLC | | | United Kingdom | | | | 537,960 | | | | 14,010,021 | |
| | Tosoh Corp. | | | Japan | | | | 389,100 | | | | 5,345,028 | |
| | | | | | | | | | | | | | |
| | | | |
| | | | | | | | | | | | | 26,957,966 | |
| | | | | | | | | | | | | | |
| | | | |
| | Construction & Engineering 0.5% | | | | | | | | | | | | |
| | Sinopec Engineering Group Co. Ltd. | | | China | | | | 11,734,000 | | | | 5,038,255 | |
| | | | | | | | | | | | | | |
| | | | |
| | Diversified Telecommunication Services 0.8% | | | | | | | | | | | | |
| | China Telecom Corp. Ltd., H. | | | China | | | | 29,703,557 | | | | 8,343,576 | |
| | | | | | | | | | | | | | |
| | | | |
| | Electronic Equipment, Instruments & Components 2.3% | | | | | | | | | | | | |
| | Hitachi Ltd. | | | Japan | | | | 542,500 | | | | 17,243,267 | |
| | Landis+Gyr Group AG | | | Switzerland | | | | 120,834 | | | | 7,827,652 | |
| | | | | | | | | | | | | | |
| | | | |
| | | | | | | | | | | | | 25,070,919 | |
| | | | | | | | | | | | | | |
| | | | |
| | Energy Equipment & Services 1.3% | | | | | | | | | | | | |
| | SBM Offshore NV | | | Netherlands | | | | 960,511 | | | | 14,152,364 | |
| | | | | | | | | | | | | | |
| | | | |
| | Food & Staples Retailing 3.6% | | | | | | | | | | | | |
| | Matsumotokiyoshi Holdings Co. Ltd. | | | Japan | | | | 388,300 | | | | 14,110,277 | |
| | Seven & i Holdings Co. Ltd. | | | Japan | | | | 360,100 | | | | 11,780,139 | |
| | Sundrug Co. Ltd. | | | Japan | | | | 410,400 | | | | 13,582,480 | |
| | | | | | | | | | | | | | |
| | | | |
| | | | | | | | | | | | | 39,472,896 | |
| | | | | | | | | | | | | | |
FRANKLIN TEMPLETON VARIABLE INSURANCE PRODUCTS TRUST
STATEMENT OF INVESTMENTS (UNAUDITED)
Templeton Foreign VIP Fund (continued)
| | | | | | | | | | | | | | |
| | | | |
| | | | | Country | | | Shares | | | Value | |
| | | | |
| | Common Stocks (continued) | | | | | | | | | | | | |
| | | | |
| | Health Care Providers & Services 0.6% | | | | | | | | | | | | |
| | Sinopharm Group Co. Ltd., H | | | China | | | | 2,794,800 | | | $ | 7,185,265 | |
| | | | | | | | | | | | | | |
| | | | |
| | Household Durables 2.3% | | | | | | | | | | | | |
| | Panasonic Corp. | | | Japan | | | | 1,239,300 | | | | 10,867,479 | |
| | Sony Corp. | | | Japan | | | | 219,300 | | | | 15,138,306 | |
| | | | | | | | | | | | | | |
| | | | |
| | | | | | | | | | | | | 26,005,785 | |
| | | | | | | | | | | | | | |
| | | | |
| | Industrial Conglomerates 3.8% | | | | | | | | | | | | |
| | CK Hutchison Holdings Ltd. | | | Hong Kong | | | | 3,873,500 | | | | 25,083,025 | |
| | Siemens AG | | | Germany | | | | 140,525 | | | | 16,571,641 | |
| | | | | | | | | | | | | | |
| | | | |
| | | | | | | | | | | | | 41,654,666 | |
| | | | | | | | | | | | | | |
| | | | |
| | Insurance 2.0% | | | | | | | | | | | | |
| | AIA Group Ltd. | | | Hong Kong | | | | 2,416,800 | | | | 22,615,303 | |
| | | | | | | | | | | | | | |
| | | | |
| | Interactive Media & Services 1.5% | | | | | | | | | | | | |
| b | | Baidu Inc., ADR | | | China | | | | 138,230 | | | | 16,572,395 | |
| | | | | | | | | | | | | | |
| | | | |
| | Internet & Direct Marketing Retail 0.5% | | | | | | | | | | | | |
| b | | Alibaba Group Holding Ltd., ADR | | | China | | | | 25,100 | | | | 5,414,070 | |
| | | | | | | | | | | | | | |
| | | | |
| | Machinery 1.2% | | | | | | | | | | | | |
| | Komatsu Ltd. | | | Japan | | | | 655,000 | | | | 13,414,740 | |
| | | | | | | | | | | | | | |
| | | | |
| | Marine 0.5% | | | | | | | | | | | | |
| | AP Moeller-Maersk A/S, B | | | Denmark | | | | 5,208 | | | | 6,103,211 | |
| | | | | | | | | | | | | | |
| | | | |
| | Media 0.7% | | | | | | | | | | | | |
| | Nippon Television Holdings Inc. | | | Japan | | | | 338,900 | | | | 3,670,618 | |
| | Tokyo Broadcasting System Holdings Inc. | | | Japan | | | | 262,400 | | | | 4,197,442 | |
| | | | | | | | | | | | | | |
| | | | |
| | | | | | | | | | | | | 7,868,060 | |
| | | | | | | | | | | | | | |
| | | | |
| | Metals & Mining 7.0% | | | | | | | | | | | | |
| | Alamos Gold Inc., A | | | Canada | | | | 1,982,052 | | | | 18,591,648 | |
| b | | ArcelorMittal SA | | | France | | | | 1,011,540 | | | | 10,713,140 | |
| | Sumitomo Metal Mining Co. Ltd. | | | Japan | | | | 603,700 | | | | 17,006,099 | |
| | Wheaton Precious Metals Corp. | | | Canada | | | | 718,100 | | | | 31,584,657 | |
| | | | | | | | | | | | | | |
| | | | |
| | | | | | | | | | | | | 77,895,544 | |
| | | | | | | | | | | | | | |
| | | | |
| | Multi-Utilities 1.8% | | | | | | | | | | | | |
| | E.ON SE | | | Germany | | | | 1,722,486 | | | | 19,441,137 | |
| | | | | | | | | | | | | | |
| | | | |
| | Oil, Gas & Consumable Fuels 4.9% | | | | | | | | | | | | |
| | BP PLC | | | United Kingdom | | | | 4,677,890 | | | | 17,920,464 | |
| | Eni SpA | | | Italy | | | | 535,991 | | | | 5,137,556 | |
| | Equinor ASA | | | Norway | | | | 1,232,274 | | | | 17,756,065 | |
| | Galp Energia SGPS SA, B | | | Portugal | | | | 844,528 | | | | 9,795,642 | |
| | Husky Energy Inc. | | | Canada | | | | 1,163,600 | | | | 3,822,810 | |
| | | | | | | | | | | | | | |
| | | | |
| | | | | | | | | | | | | 54,432,537 | |
| | | | | | | | | | | | | | |
| | | | |
| | Pharmaceuticals 11.7% | | | | | | | | | | | | |
| | Bayer AG | | | Germany | | | | 527,187 | | | | 39,073,470 | |
| | Novartis AG | | | Switzerland | | | | 128,920 | | | | 11,231,641 | |
| | Roche Holding AG | | | Switzerland | | | | 63,327 | | | | 21,939,610 | |
| | Sanofi | | | France | | | | 228,345 | | | | 23,285,600 | |
FRANKLIN TEMPLETON VARIABLE INSURANCE PRODUCTS TRUST
STATEMENT OF INVESTMENTS (UNAUDITED)
Templeton Foreign VIP Fund (continued)
| | | | | | | | | | | | | | |
| | | | |
| | | | | Country | | | Shares | | | Value | |
| | | | |
| | Common Stocks (continued) | | | | | | | | | | | | |
| | Pharmaceuticals (continued) | | | | | | | | | | | | |
| | Takeda Pharmaceutical Co. Ltd. | | | Japan | | | | 966,094 | | | $ | 34,709,763 | |
| | | | | | | | | | | | | | |
| | | | | | | | | | | | | 130,240,084 | |
| | | | | | | | | | | | | | |
| | | | |
| | Real Estate Management & Development 4.0% | | | | | | | | | | | | |
| | CK Asset Holdings Ltd. | | | Hong Kong | | | | 3,560,500 | | | | 21,351,434 | |
| | Mitsui Fudosan Co. Ltd. | | | Japan | | | | 811,000 | | | | 14,407,192 | |
| | Swire Pacific Ltd., A | | | Hong Kong | | | | 1,628,500 | | | | 8,655,052 | |
| | | | | | | | | | | | | | |
| | | | |
| | | | | | | | | | | | | 44,413,678 | |
| | | | | | | | | | | | | | |
| | | | |
| | Semiconductors & Semiconductor Equipment 6.0% | | | | | | | | | | | | |
| | Infineon Technologies AG | | | Germany | | | | 590,665 | | | | 13,839,342 | |
| | NXP Semiconductors NV | | | Netherlands | | | | 221,300 | | | | 25,237,052 | |
| | Taiwan Semiconductor Manufacturing Co. Ltd. | | | Taiwan | | | | 2,587,000 | | | | 27,708,192 | |
| | | | | | | | | | | | | | |
| | | | |
| | | | | | | | | | | | | 66,784,586 | |
| | | | | | | | | | | | | | |
| | | | |
| | Technology Hardware, Storage & Peripherals 3.6% | | | | | | | | | | | | |
| | Samsung Electronics Co. Ltd. | | | South Korea | | | | 909,188 | | | | 40,355,295 | |
| | | | | | | | | | | | | | |
| | | | |
| | Thrifts & Mortgage Finance 1.5% | | | | | | | | | | | | |
| | Housing Development Finance Corp. Ltd. | | | India | | | | 737,453 | | | | 17,137,981 | |
| | | | | | | | | | | | | | |
| | | | |
| | Tobacco 1.3% | | | | | | | | | | | | |
| | Imperial Brands PLC | | | United Kingdom | | | | 756,727 | | | | 14,404,955 | |
| | | | | | | | | | | | | | |
| | | | |
| | Wireless Telecommunication Services 1.5% | | | | | | | | | | | | |
| | Vodafone Group PLC, ADR | | | United Kingdom | | | | 1,062,403 | | | | 16,934,704 | |
| | | | | | | | | | | | | | |
| | | | |
| | Total Common Stocks (Cost $956,638,414) | | | | | | | | | | | 962,211,319 | |
| | | | | | | | | | | | | | |
| | | | |
| | Short Term Investments 16.4% | | | | | | | | | | | | |
| | | | |
| | Money Market Funds (Cost $141,540,103) 12.8% | | | | | | | | | | | | |
| c,d | | Institutional Fiduciary Trust Money Market Portfolio, 0.00% | | | United States | | | | 141,540,103 | | | | 141,540,103 | |
| | | | | | | | | | | | | | |
| | | | |
| e | | Investments from Cash Collateral Received for Loaned Securities 3.6% | | | | | | | | | | | | |
| | Money Market Funds (Cost $39,731,419) 3.6% | | | | | | | | | | | | |
| c,d | | Institutional Fiduciary Trust Money Market Portfolio, 0.00% | | | United States | | | | 39,731,419 | | | | 39,731,419 | |
| | | | | | | | | | | | | | |
| | | | |
| | Total Investments (Cost $1,137,909,936) 103.1% | | | | | | | | | | | 1,143,482,841 | |
| | | | |
| | Other Assets, less Liabilities (3.1)% | | | | | | | | | | | (34,048,249 | ) |
| | | | | | | | | | | | | | |
| | | | |
| | Net Assets 100.0% | | | | | | | | | | $ | 1,109,434,592 | |
| | | | | | | | | | | | | | |
See Abbreviations on page TF-23.
aA portion or all of the security is on loan at June 30, 2020. See Note 1(c).
bNon-income producing.
cSee Note 3(e) regarding investments in affiliated management investment companies.
dThe rate shown is the annualized seven-day effective yield at period end.
eSee Note 1(c) regarding securities on loan.
| | | | | | |
| | | |
| | The accompanying notes are an integral part of these financial statements. | Semiannual Report | | | TF-11 | |
FRANKLIN TEMPLETON VARIABLE INSURANCE PRODUCTS TRUST
FINANCIAL STATEMENTS
Statement of Assets and Liabilities
June 30, 2020 (unaudited)
| | | | |
| |
| | | Templeton
Foreign
VIP Fund | |
Assets: | | | | |
Investments in securities: | | | | |
Cost - Unaffiliated issuers | | $ | 956,638,414 | |
Cost - Non-controlled affiliates (Note 3e) | | | 181,271,522 | |
| | | | |
| |
Value - Unaffiliated issuers+ | | $ | 962,211,319 | |
Value - Non-controlled affiliates (Note 3e) | | | 181,271,522 | |
Cash | | | 25,093 | |
Receivables: | | | | |
Investment securities sold | | | 269,828 | |
Capital shares sold | | | 1,391,446 | |
Dividends | | | 4,999,326 | |
European Union tax reclaims | | | 856,368 | |
Other assets | | | 1,024 | |
| | | | |
| |
Total assets | | | 1,151,025,926 | |
| | | | |
Liabilities: | | | | |
Payables: | | | | |
Capital shares redeemed | | | 549,936 | |
Management fees | | | 718,128 | |
Distribution fees | | | 217,666 | |
Trustees’ fees and expenses | | | 500 | |
Payable upon return of securities loaned | | | 39,731,419 | |
Deferred tax | | | 22,519 | |
Accrued expenses and other liabilities | | | 351,166 | |
| | | | |
| |
Total liabilities | | | 41,591,334 | |
| | | | |
| |
Net assets, at value | | $ | 1,109,434,592 | |
| | | | |
Net assets consist of: | | | | |
Paid-in capital | | $ | 1,237,636,914 | |
Total distributable earnings (losses) | | | (128,202,322 | ) |
| | | | |
| |
Net assets, at value | | $ | 1,109,434,592 | |
| | | | |
| Class 1: | | | | |
Net assets, at value | | $ | 97,104,260 | |
| | | | |
Shares outstanding | | | 8,670,295 | |
| | | | |
Net asset value and maximum offering price per share | | | $11.20 | |
| | | | |
| Class 2: | | | | |
Net assets, at value | | $ | 917,866,180 | |
| | | | |
Shares outstanding | | | 83,628,570 | |
| | | | |
Net asset value and maximum offering price per share | | | $10.98 | |
| | | | |
| Class 4: | | | | |
Net assets, at value | | $ | 94,464,152 | |
| | | | |
Shares outstanding | | | 8,435,462 | |
| | | | |
Net asset value and maximum offering price per share | | | $11.20 | |
| | | | |
| |
+Includes securities loaned | | $ | 37,647,516 | |
| | | | |
| | | |
| TF-12 | | Semiannual Report | The accompanying notes are an integral part of these financial statements. | | |
FRANKLIN TEMPLETON VARIABLE INSURANCE PRODUCTS TRUST
FINANCIAL STATEMENTS
Statement of Operations
for the six months ended June 30, 2020 (unaudited)
| | | | |
| |
| | | Templeton
Foreign
VIP Fund | |
Investment income: | | | | |
Dividends:(net of foreign taxes)* | | | | |
Unaffiliated issuers | | $ | 17,583,181 | |
Non-controlled affiliates (Note 3e) | | | 183,236 | |
Interest: | | | | |
Unaffiliated issuers | | | 11 | |
Income from securities loaned: | | | | |
Unaffiliated entities (net of fees and rebates) | | | 89,713 | |
Non-controlled affiliates (Note 3e) | | | 14,818 | |
| | | | |
| |
Total investment income | | | 17,870,959 | |
| | | | |
Expenses: | | | | |
Management fees (Note 3a) | | | 4,576,857 | |
Distribution fees: (Note 3c) | | | | |
Class 2 | | | 1,167,848 | |
Class 4 | | | 166,719 | |
Custodian fees (Note 4) | | | 66,366 | |
Reports to shareholders | | | 134,247 | |
Professional fees | | | 51,591 | |
Trustees’ fees and expenses | | | 3,862 | |
Other | | | 3,693 | |
| | | | |
Total expenses | | | 6,171,183 | |
Expenses waived/paid by affiliates (Note 3e) | | | (168,562 | ) |
| | | | |
| |
Net expenses | | | 6,002,621 | |
| | | | |
| |
Net investment income | | | 11,868,338 | |
| | | | |
Realized and unrealized gains (losses): | | | | |
Net realized gain (loss) from: | | | | |
Investments: | | | | |
Unaffiliated issuers | | | (99,310,057 | ) |
Foreign currency transactions | | | (380,080 | ) |
| | | | |
| |
Net realized gain (loss) | | | (99,690,137 | ) |
| | | | |
Net change in unrealized appreciation (depreciation) on: | | | | |
Investments: | | | | |
Unaffiliated issuers | | | (154,935,444 | ) |
Translation of other assets and liabilities denominated in foreign currencies | | | (20,633 | ) |
Change in deferred taxes on unrealized appreciation | | | (22,519 | ) |
| | | | |
| |
Net change in unrealized appreciation (depreciation) | | | (154,978,596 | ) |
| | | | |
| |
Net realized and unrealized gain (loss) | | | (254,668,733 | ) |
| | | | |
| |
Net increase (decrease) in net assets resulting from operations | | $ | (242,800,395 | ) |
| | | | |
| |
*Foreign taxes withheld on dividends | | $ | 2,085,780 | |
| | | | | | |
| | | |
| | The accompanying notes are an integral part of these financial statements. | Semiannual Report | | | TF-13 | |
FRANKLIN TEMPLETON VARIABLE INSURANCE PRODUCTS TRUST
FINANCIAL STATEMENTS
Statements of Changes in Net Assets
| | | | | | | | |
| |
| | | Templeton Foreign VIP Fund | |
| | |
| | | Six Months Ended
June 30, 2020
(unaudited) | | | Year Ended
December 31, 2019 | |
Increase (decrease) in net assets: | | | | | | | | |
Operations: | | | | | | | | |
Net investment income | | $ | 11,868,338 | | | $ | 39,750,754 | |
Net realized gain (loss) | | | (99,690,137 | ) | | | (42,940,121 | ) |
Net change in unrealized appreciation (depreciation) | | | (154,978,596 | ) | | | 161,044,541 | |
| | | | |
| | |
Net increase (decrease) in net assets resulting from operations | | | (242,800,395 | ) | | | 157,855,174 | |
| | | | |
Distributions to shareholders: | | | | | | | | |
Class 1 | | | (3,651,171 | ) | | | (3,542,825 | ) |
Class 2 | | | (32,735,824 | ) | | | (29,727,357 | ) |
Class 4 | | | (3,189,135 | ) | | | (2,819,837 | ) |
| | | | |
| | |
Total distributions to shareholders | | | (39,576,130 | ) | | | (36,090,019 | ) |
| | | | |
Capital share transactions: (Note 2) | | | | | | | | |
Class 1 | | | 756,121 | | | | (3,622,678 | ) |
Class 2 | | | 33,518,547 | | | | (41,982,881 | ) |
Class 4 | | | 4,094,883 | | | | (22,867,835 | ) |
| | | | |
| | |
Total capital share transactions | | | 38,369,551 | | | | (68,473,394 | ) |
| | | | |
Net increase (decrease) in net assets | | | (244,006,974 | ) | | | 53,291,761 | |
Net assets: | | | | | | | | |
Beginning of period | | | 1,353,441,566 | | | | 1,300,149,805 | |
| | | | |
| | |
End of period | | $ | 1,109,434,592 | | | $ | 1,353,441,566 | |
| | | | |
| | | | |
| | | |
| TF-14 | | Semiannual Report | The accompanying notes are an integral part of these financial statements. | | |
FRANKLIN TEMPLETON VARIABLE INSURANCE PRODUCTS TRUST
Notes to Financial Statements (unaudited)
Templeton Foreign VIP Fund
1. Organization and Significant Accounting Policies
Franklin Templeton Variable Insurance Products Trust (Trust) is registered under the Investment Company Act of 1940 (1940 Act) as an open-end management investment company, consisting of eighteen separate funds and applies the specialized accounting and reporting guidance in U.S. Generally Accepted Accounting Principles (U.S. GAAP). Templeton Foreign VIP Fund (Fund) is included in this report. Shares of the Fund are generally sold only to insurance company separate accounts to fund the benefits of variable life insurance policies or variable annuity contracts. The Fund offers three classes of shares: Class 1, Class 2, and Class 4. Each class of shares may differ by its distribution fees, voting rights on matters affecting a single class and its exchange privilege.
The following summarizes the Fund’s significant accounting policies.
a. Financial Instrument Valuation
The Fund’s investments in financial instruments are carried at fair value daily. Fair value is the price that would be received to sell an asset or paid to transfer a liability in an orderly transaction between market participants on the measurement date. The Fund calculates the net asset value (NAV) per share each business day as of 4 p.m. Eastern time or the regularly scheduled close of the New York Stock Exchange (NYSE), whichever is earlier. Under compliance policies and procedures approved by the Trust’s Board of Trustees (the Board), the Fund’s administrator has responsibility for oversight of valuation, including leading the cross-functional Valuation Committee (VC). The Fund may utilize independent pricing services, quotations from securities and financial instrument dealers, and other market sources to determine fair value.
Equity securities listed on an exchange or on the NASDAQ National Market System are valued at the last quoted sale price or the official closing price of the day, respectively. Foreign equity securities are valued as of the close of trading on the foreign stock exchange on which the security is primarily traded, or as of 4 p.m. Eastern time. The value is then converted into its U.S. dollar equivalent at the foreign exchange rate in effect at 4 p.m. Eastern time on the day that the value of the security is determined. Over-the-counter (OTC) securities are valued within the range of the most recent quoted bid and ask prices. Securities that trade in multiple markets or on multiple exchanges are valued
according to the broadest and most representative market. Certain equity securities are valued based upon fundamental characteristics or relationships to similar securities.
Investments in open-end mutual funds are valued at the closing NAV.
The Fund has procedures to determine the fair value of financial instruments for which market prices are not reliable or readily available. Under these procedures, the Fund primarily employs a market-based approach which may use related or comparable assets or liabilities, recent transactions, market multiples, book values, and other relevant information for the investment to determine the fair value of the investment. An income-based valuation approach may also be used in which the anticipated future cash flows of the investment are discounted to calculate fair value. Discounts may also be applied due to the nature or duration of any restrictions on the disposition of the investments. Due to the inherent uncertainty of valuations of such investments, the fair values may differ significantly from the values that would have been used had an active market existed.
Trading in securities on foreign securities stock exchanges and OTC markets may be completed before 4 p.m. Eastern time. In addition, trading in certain foreign markets may not take place on every Fund’s business day. Events can occur between the time at which trading in a foreign security is completed and 4 p.m. Eastern time that might call into question the reliability of the value of a portfolio security held by the Fund. As a result, differences may arise between the value of the Fund’s portfolio securities as determined at the foreign market close and the latest indications of value at 4 p.m. Eastern time. In order to minimize the potential for these differences, an independent pricing service may be used to adjust the value of the Fund’s portfolio securities to the latest indications of fair value at 4 p.m. Eastern time. At June 30, 2020, certain securities may have been fair valued using these procedures, in which case the securities were categorized as Level 2 inputs within the fair value hierarchy. See the Fair Value Measurements note for more information.
When the last day of the reporting period is a non-business day, certain foreign markets may be open on those days that the Fund’s NAV is not calculated, which could result in differences between the value of the Fund’s portfolio securities on the last business day and the last calendar day
FRANKLIN TEMPLETON VARIABLE INSURANCE PRODUCTS TRUST
NOTES TO FINANCIAL STATEMENTS (UNAUDITED)
Templeton Foreign VIP Fund (continued)
1. Organization and Significant Accounting Policies (continued)
a. Financial Instrument Valuation (continued)
of the reporting period. Any significant security valuation changes due to an open foreign market are adjusted and reflected by the Fund for financial reporting purposes.
b. Foreign Currency Translation
Portfolio securities and other assets and liabilities denominated in foreign currencies are translated into U.S. dollars based on the exchange rate of such currencies against U.S. dollars on the date of valuation. The Fund may enter into foreign currency exchange contracts to facilitate transactions denominated in a foreign currency. Purchases and sales of securities, income and expense items denominated in foreign currencies are translated into U.S. dollars at the exchange rate in effect on the transaction date. Portfolio securities and assets and liabilities denominated in foreign currencies contain risks that those currencies will decline in value relative to the U.S. dollar. Occasionally, events may impact the availability or reliability of foreign exchange rates used to convert the U.S. dollar equivalent value. If such an event occurs, the foreign exchange rate will be valued at fair value using procedures established and approved by the Board.
The Fund does not separately report the effect of changes in foreign exchange rates from changes in market prices on securities held. Such changes are included in net realized and unrealized gain or loss from investments in the Statement of Operations.
Realized foreign exchange gains or losses arise from sales of foreign currencies, currency gains or losses realized between the trade and settlement dates on securities transactions and the difference between the recorded amounts of dividends, interest, and foreign withholding taxes and the U.S. dollar equivalent of the amounts actually received or paid. Net unrealized foreign exchange gains and losses arise from changes in foreign exchange rates on foreign denominated assets and liabilities other than investments in securities held at the end of the reporting period.
c. Securities Lending
The Fund participates in an agency based securities lending program to earn additional income. The Fund receives collateral in the form of cash and/or U.S. Government and
Agency securities against the loaned securities in an amount equal to at least 102% of the fair value of the loaned securities. Collateral is maintained over the life of the loan in an amount not less than 100% of the fair value of loaned securities, as determined at the close of Fund business each day; any additional collateral required due to changes in security values is delivered to the Fund on the next business day. Any cash collateral received is deposited into a joint cash account with other funds and is used to invest in a money market fund managed by Franklin Advisers, Inc., an affiliate of the Fund. The Fund may receive income from the investment of cash collateral, in addition to lending fees and rebates paid by the borrower. Income from securities loaned, net of fees paid to the securities lending agent and/or third-party vendor, is reported separately in the Statement of Operations. The Fund bears the market risk with respect to any cash collateral investment, securities loaned, and the risk that the agent may default on its obligations to the Fund. If the borrower defaults on its obligation to return the securities loaned, the Fund has the right to repurchase the securities in the open market using the collateral received. The securities lending agent has agreed to indemnify the Fund in the event of default by a third party borrower.
d.�� Income and Deferred Taxes
It is the Fund’s policy to qualify as a regulated investment company under the Internal Revenue Code. The Fund intends to distribute to shareholders substantially all of its taxable income and net realized gains to relieve it from federal income and if applicable, excise taxes. As a result, no provision for U.S. federal income taxes is required.
The Fund may be subject to foreign taxation related to income received, capital gains on the sale of securities and certain foreign currency transactions in the foreign jurisdictions in which it invests. Foreign taxes, if any, are recorded based on the tax regulations and rates that exist in the foreign markets in which the Fund invests. When a capital gain tax is determined to apply, the Fund records an estimated deferred tax liability in an amount that would be payable if the securities were disposed of on the valuation date.
As a result of several court cases, in certain countries across the European Union, the Fund filed additional tax reclaims for previously withheld taxes on dividends earned in those countries (EU reclaims). These additional filings are subject to various administrative proceedings by the local
FRANKLIN TEMPLETON VARIABLE INSURANCE PRODUCTS TRUST
NOTES TO FINANCIAL STATEMENTS (UNAUDITED)
Templeton Foreign VIP Fund (continued)
jurisdictions’ tax authorities within the European Union, as well as a number of related judicial proceedings. Income recognized, if any, for EU reclaims is reflected as other income in the Statement of Operations and any related receivable, if any, is reflected as European Union tax reclaims in the Statement of Assets and Liabilities. When uncertainty exists as to the ultimate resolution of these proceedings, the likelihood of receipt of these EU reclaims, and the potential timing of payment, no amounts are reflected in the financial statements. For U.S. income tax purposes, when EU reclaims are received by the Fund and the Fund previously passed foreign tax credit on to its shareholders, the Fund must either amend historic tax reporting to shareholders or enter into a closing agreement with the Internal Revenue Service (IRS) in order to pay the associated tax liability on behalf of the Fund’s shareholders.
The Fund may recognize an income tax liability related to its uncertain tax positions under U.S. GAAP when the uncertain tax position has a less than 50% probability that it will be sustained upon examination by the tax authorities based on its technical merits. As of June 30, 2020, the Fund has determined that no tax liability is required in its financial statements related to uncertain tax positions for any open tax years (or expected to be taken in future tax years). Open tax years are those that remain subject to examination and are based on the statute of limitations in each jurisdiction in which the Fund invests.
e. Security Transactions, Investment Income, Expenses and Distributions
Security transactions are accounted for on trade date. Realized gains and losses on security transactions are determined on a specific identification basis. Interest income and estimated expenses are accrued daily. Dividend income is recorded on the ex-dividend date except for certain dividends from securities where the dividend rate is not available. In such cases, the dividend is recorded as soon as the information is received by the Fund. Distributions to shareholders are recorded on the ex-dividend date. Distributable earnings are determined according to income tax regulations (tax basis) and may differ from earnings
recorded in accordance with U.S. GAAP. These differences may be permanent or temporary. Permanent differences are reclassified among capital accounts to reflect their tax character. These reclassifications have no impact on net assets or the results of operations. Temporary differences are not reclassified, as they may reverse in subsequent periods.
Common expenses incurred by the Trust are allocated among the Funds based on the ratio of net assets of each Fund to the combined net assets of the Trust or based on the ratio of number of shareholders of each Fund to the combined number of shareholders of the Trust. Fund specific expenses are charged directly to the Fund that incurred the expense.
Realized and unrealized gains and losses and net investment income, excluding class specific expenses, are allocated daily to each class of shares based upon the relative proportion of net assets of each class. Differences in per share distributions by class are generally due to differences in class specific expenses.
f. Accounting Estimates
The preparation of financial statements in accordance with U.S. GAAP requires management to make estimates and assumptions that affect the reported amounts of assets and liabilities at the date of the financial statements and the amounts of income and expenses during the reporting period. Actual results could differ from those estimates.
g. Guarantees and Indemnifications
Under the Trust’s organizational documents, its officers and trustees are indemnified by the Trust against certain liabilities arising out of the performance of their duties to the Trust. Additionally, in the normal course of business, the Trust, on behalf of the Fund, enters into contracts with service providers that contain general indemnification clauses. The Trust’s maximum exposure under these arrangements is unknown as this would involve future claims that may be made against the Trust that have not yet occurred. Currently, the Trust expects the risk of loss to be remote.
FRANKLIN TEMPLETON VARIABLE INSURANCE PRODUCTS TRUST
NOTES TO FINANCIAL STATEMENTS (UNAUDITED)
Templeton Foreign VIP Fund (continued)
2. Shares of Beneficial Interest
At June 30, 2020, there were an unlimited number of shares authorized (without par value). Transactions in the Fund’s shares were as follows:
| | | | | | | | | | | | | | | | |
| | |
| | | Six Months Ended June 30, 2020 | | | Year Ended December 31, 2019 | |
| | | | |
| | | Shares | | | Amount | | | Shares | | | Amount | |
| | | | |
| Class 1 Shares: | | | | | | | | | | | | | | | | |
Shares sold | | | 433,172 | | | $ | 4,826,402 | | | | 315,303 | | | $ | 4,277,207 | |
Shares issued in reinvestment of distributions | | | 325,706 | | | | 3,651,171 | | | | 273,789 | | | | 3,542,825 | |
Shares redeemed | | | (656,723 | ) | | | (7,721,452 | ) | | | (844,252 | ) | | | (11,442,710) | |
| | | | |
| | | | |
Net increase (decrease) | | | 102,155 | | | $ | 756,121 | | | | (255,160 | ) | | $ | (3,622,678) | |
| | | | |
| | | | |
| Class 2 Shares: | | | | | | | | | | | | | | | | |
Shares sold | | | 7,223,300 | | | $ | 79,940,518 | | | | 7,564,257 | | | $ | 99,786,234 | |
Shares issued in reinvestment of distributions | | | 2,981,405 | | | | 32,735,824 | | | | 2,342,581 | | | | 29,727,357 | |
Shares redeemed | | | (6,792,654 | ) | | | (79,157,795 | ) | | | (12,910,655 | ) | | | (171,496,472) | |
| | | | |
| | | | |
Net increase (decrease) | | | 3,412,051 | | | $ | 33,518,547 | | | | (3,003,817 | ) | | $ | (41,982,881) | |
| | | | |
| | | | |
| Class 4 Shares: | | | | | | | | | | | | | | | | |
Shares sold | | | 909,581 | | | $ | 10,094,838 | | | | 784,963 | | | $ | 10,500,046 | |
Shares issued in reinvestment of distributions | | | 284,490 | | | | 3,189,135 | | | | 218,085 | | | | 2,819,837 | |
Shares redeemed | | | (766,654 | ) | | | (9,189,090 | ) | | | (2,661,084 | ) | | | (36,187,718) | |
| | | | |
| | | | |
Net increase (decrease) | | | 427,417 | | | $ | 4,094,883 | | | | (1,658,036 | ) | | $ | (22,867,835) | |
| | | | |
3. Transactions with Affiliates
Franklin Resources, Inc. is the holding company for various subsidiaries that together are referred to as Franklin Templeton. Certain officers and trustees of the Fund are also officers and/or directors of the following subsidiaries:
| | |
| |
| Subsidiary | | Affiliation |
Templeton Investment Counsel, LLC (TIC) | | Investment manager |
Franklin Templeton Services, LLC (FT Services) | | Administrative manager |
Franklin Templeton Distributors, Inc. (Distributors) | | Principal underwriter |
Franklin Templeton Investor Services, LLC (Investor Services) | | Transfer agent |
FRANKLIN TEMPLETON VARIABLE INSURANCE PRODUCTS TRUST
NOTES TO FINANCIAL STATEMENTS (UNAUDITED)
Templeton Foreign VIP Fund (continued)
a. Management Fees
The Fund pays an investment management fee to TIC based on the average daily net assets of the Fund as follows:
| | |
| |
| Annualized Fee Rate | | Net Assets |
0.900% | | Up to and including $200 million |
0.810% | | Over $200 million, up to and including $700 million |
0.775% | | Over $700 million, up to and including $1.2 billion |
0.750% | | Over $1.2 billion, up to and including $1.3 billion |
0.675% | | Over $1.3 billion, up to and including $10 billion |
0.655% | | Over $10 billion, up to and including $15 billion |
0.635% | | Over $15 billion, up to and including $20 billion |
0.615% | | In excess of $20 billion |
For the period ended June 30, 2020, the annualized gross effective investment management fee rate was 0.812% of the Fund’s average daily net assets.
b. Administrative Fees
Under an agreement with TIC, FT Services provides administrative services to the Fund. The fee is paid by TIC based on the Fund’s average daily net assets, and is not an additional expense of the Fund.
c. Distribution Fees
The Board has adopted distribution plans for Class 2 and Class 4 shares pursuant to Rule 12b-1 under the 1940 Act. Under the Fund’s compensation distribution plans, the Fund pays Distributors for costs incurred in connection with the servicing, sale and distribution of the Fund’s shares up to 0.25% and 0.35% per year of its average daily net assets of Class 2 and Class 4, respectively. The plan year, for purposes of monitoring compliance with the maximum annual plan rates, is February 1 through January 31.
d. Transfer Agent Fees
Investor Services, under terms of an agreement, performs shareholder servicing for the Fund and is not paid by the Fund for the services.
FRANKLIN TEMPLETON VARIABLE INSURANCE PRODUCTS TRUST
NOTES TO FINANCIAL STATEMENTS (UNAUDITED)
Templeton Foreign VIP Fund (continued)
3. Transactions with Affiliates (continued)
e. Investments in Affiliated Management Investment Companies
The Fund invests in one or more affiliated management investment companies for purposes other than exercising a controlling influence over the management or policies. Management fees paid by the Fund are waived on assets invested in the affiliated management investment companies, as noted in the Statement of Operations, in an amount not to exceed the management and administrative fees paid directly or indirectly by each affiliate. During the period ended June 30, 2020, the Fund held investments in affiliated management investment companies as follows:
| | | | | | | | | | | | | | | | | | | | | | | | | | | | | | | | |
| | | | | | | | |
| | | Value at
Beginning
of Period | | | Purchases | | | Sales | | | Realized
Gain (Loss) | | | Net Change in
Unrealized
Appreciation
(Depreciation) | | | Value at End of Period | | | Number of
Shares
Held at End
of Period | | | Investment
Income | |
| Non-Controlled Affiliates | | | | | | | | | | | | | | | | | | | | | | | | | | | | | | | | |
| | | | | | | | |
| | | | | | | | | | | | | | | | | | | | | | | | | | | | | | | Dividends | |
| | | | | | | | | | | | | | | | | | | | | | | | | | | | | | | | |
| | | | | | | | |
Institutional Fiduciary Trust Money Market Portfolio, 0.00% | | | $70,825,763 | | | | $199,707,826 | | | | $(128,993,486) | | | | $ — | | | | $ — | | | | $141,540,103 | | | | 141,540,103 | | | | $183,236 | |
| | | | | | | | | | | | | | | | | | | | | | | | | | | | | |
| Income from
securities
loaned |
|
| | | | | | | | | | | | | | | | | | | | | | | | | | | | | | | | |
Institutional Fiduciary Trust Money Market Portfolio, 0.00% | | | — | | | | 149,211,823 | | | | (109,480,404 | ) | | | — | | | | — | | | | 39,731,419 | | | | 39,731,419 | | | | 14,818 | |
| | | | | | | | | | | | |
| | | | | | | | |
Total Affiliated Securities | | | $70,825,763 | | | | $348,919,649 | | | | $(238,473,890) | | | | $ — | | | | $ — | | | | $181,271,522 | | | | | | | | $198,054 | |
| | | | | | | | | | | | |
4. Expense Offset Arrangement
The Fund has entered into an arrangement with its custodian whereby credits realized as a result of uninvested cash balances are used to reduce a portion of the Fund’s custodian expenses. During the period ended June 30, 2020, there were no credits earned.
5. Income Taxes
For tax purposes, capital losses may be carried over to offset future capital gains.
At December 31, 2019, the capital loss carryforwards were as follows:
| | | | |
Capital loss carryforwards not subject to expiration: | | | | |
Long term | | $ | 43,306,383 | |
At June 30, 2020, the cost of investments and net unrealized appreciation (depreciation) for income tax purposes were as follows:
| | | | |
Cost of investments | | $ | 1,141,410,946 | |
| | | | |
| |
Unrealized appreciation | | $ | 152,558,258 | |
Unrealized depreciation | | | (150,486,363 | ) |
| | | | |
Net unrealized appreciation (depreciation) | | $ | 2,071,895 | |
| | | | |
FRANKLIN TEMPLETON VARIABLE INSURANCE PRODUCTS TRUST
NOTES TO FINANCIAL STATEMENTS (UNAUDITED)
Templeton Foreign VIP Fund (continued)
Differences between income and/or capital gains as determined on a book basis and a tax basis are primarily due to differing treatment of foreign currency transactions.
6. Investment Transactions
Purchases and sales of investments (excluding short term securities) for the period ended June 30, 2020, aggregated $244,680,631 and $304,740,900, respectively.
At June 30, 2020, in connection with securities lending transactions, the Fund loaned equity investments and received $39,731,419 of cash collateral. The gross amount of recognized liability for such transactions is included in payable upon return of securities loaned in the Statement of Assets and Liabilities. The agreements can be terminated at any time.
7. Concentration of Risk
Investing in foreign securities may include certain risks and considerations not typically associated with investing in U.S. securities, such as fluctuating currency values and changing local, regional and global economic, political and social conditions, which may result in greater market volatility. Current political and financial uncertainty surrounding the European Union may increase market volatility and the economic risk of investing in securities in Europe. In addition, certain foreign securities may not be as liquid as U.S. securities.
8. Novel Coronavirus Pandemic
The global outbreak of the novel coronavirus disease, known as COVID-19, has caused adverse effects on many companies, sectors, nations, regions and the markets in general, and may continue for an unpredictable duration. The effects of this pandemic may materially impact the value and performance of the Fund, its ability to buy and sell fund investments at appropriate valuations and its ability to achieve its investment objectives.
9. Credit Facility
The Fund, together with other U.S. registered and foreign investment funds (collectively, Borrowers), managed by Franklin Templeton, are borrowers in a joint syndicated senior unsecured credit facility totaling $2 billion (Global Credit Facility) which matures on February 5, 2021. This Global Credit Facility provides a source of funds to the Borrowers for temporary and emergency purposes, including the ability to meet future unanticipated or unusually large redemption requests.
Under the terms of the Global Credit Facility, the Fund shall, in addition to interest charged on any borrowings made by the Fund and other costs incurred by the Fund, pay its share of fees and expenses incurred in connection with the implementation and maintenance of the Global Credit Facility, based upon its relative share of the aggregate net assets of all of the Borrowers, including an annual commitment fee of 0.15% based upon the unused portion of the Global Credit Facility. These fees are reflected in other expenses in the Statement of Operations. During the period ended June 30, 2020, the Fund did not use the Global Credit Facility.
10. Fair Value Measurements
The Fund follows a fair value hierarchy that distinguishes between market data obtained from independent sources (observable inputs) and the Fund’s own market assumptions (unobservable inputs). These inputs are used in determining the value of the Fund’s financial instruments and are summarized in the following fair value hierarchy:
| | • | | Level 1 – quoted prices in active markets for identical financial instruments |
FRANKLIN TEMPLETON VARIABLE INSURANCE PRODUCTS TRUST
NOTES TO FINANCIAL STATEMENTS (UNAUDITED)
Templeton Foreign VIP Fund (continued)
10. Fair Value Measurements (continued)
| | • | | Level 2 – other significant observable inputs (including quoted prices for similar financial instruments, interest rates, prepayment speed, credit risk, etc.) |
| | • | | Level 3 – significant unobservable inputs (including the Fund’s own assumptions in determining the fair value of financial instruments) |
The input levels are not necessarily an indication of the risk or liquidity associated with financial instruments at that level. A summary of inputs used as of June 30, 2020, in valuing the Fund’s assets carried at fair value, is as follows:
| | | | | | | | | | | | | | | | |
| | | Level 1 | | | Level 2 | | | Level 3 | | | Total | |
| |
| Assets: | | | | | | | | | | | | | | | | |
Investments in Securities:a | | | | | | | | | | | | | | | | |
Equity Investments: | | | | | | | | | | | | | | | | |
Aerospace & Defense | | $ | — | | | $ | 11,728,900 | | | $ | — | | | $ | 11,728,900 | |
Auto Components | | | — | | | | 26,452,443 | | | | — | | | | 26,452,443 | |
Automobiles | | | — | | | | 42,976,604 | | | | — | | | | 42,976,604 | |
Banks | | | 26,618,343 | | | | 76,098,326 | | | | — | | | | 102,716,669 | |
Beverages | | | — | | | | 30,426,731 | | | | — | | | | 30,426,731 | |
Chemicals | | | — | | | | 26,957,966 | | | | — | | | | 26,957,966 | |
Construction & Engineering | | | — | | | | 5,038,255 | | | | — | | | | 5,038,255 | |
Diversified Telecommunication Services | | | — | | | | 8,343,576 | | | | — | | | | 8,343,576 | |
Electronic Equipment, Instruments & | | | | | | | | | | | | | | | | |
Components | | | — | | | | 25,070,919 | | | | — | | | | 25,070,919 | |
Energy Equipment & Services | | | — | | | | 14,152,364 | | | | — | | | | 14,152,364 | |
Food & Staples Retailing | | | — | | | | 39,472,896 | | | | — | | | | 39,472,896 | |
Health Care Providers & Services | | | — | | | | 7,185,265 | | | | — | | | | 7,185,265 | |
Household Durables | | | — | | | | 26,005,785 | | | | — | | | | 26,005,785 | |
Industrial Conglomerates | | | — | | | | 41,654,666 | | | | — | | | | 41,654,666 | |
Insurance | | | — | | | | 22,615,303 | | | | — | | | | 22,615,303 | |
Machinery | | | — | | | | 13,414,740 | | | | — | | | | 13,414,740 | |
Marine | | | — | | | | 6,103,211 | | | | — | | | | 6,103,211 | |
Media | | | — | | | | 7,868,060 | | | | — | | | | 7,868,060 | |
Metals & Mining | | | 50,176,305 | | | | 27,719,239 | | | | — | | | | 77,895,544 | |
Multi-Utilities | | | — | | | | 19,441,137 | | | | — | | | | 19,441,137 | |
Oil, Gas & Consumable Fuels | | | 3,822,810 | | | | 50,609,727 | | | | — | | | | 54,432,537 | |
Pharmaceuticals | | | — | | | | 130,240,084 | | | | — | | | | 130,240,084 | |
Real Estate Management & Development | | | — | | | | 44,413,678 | | | | — | | | | 44,413,678 | |
Semiconductors & Semiconductor Equipment | | | 25,237,052 | | | | 41,547,534 | | | | — | | | | 66,784,586 | |
Technology Hardware, Storage & Peripherals | | | — | | | | 40,355,295 | | | | — | | | | 40,355,295 | |
Thrifts & Mortgage Finance | | | — | | | | 17,137,981 | | | | — | | | | 17,137,981 | |
Tobacco | | | — | | | | 14,404,955 | | | | — | | | | 14,404,955 | |
All Other Equity Investments | | | 38,921,169 | | | | — | | | | — | | | | 38,921,169 | |
Short Term Investments | | | 181,271,522 | | | | — | | | | — | | | | 181,271,522 | |
| | | | |
Total Investments in Securities | | $ | 326,047,201 | | | $ | 817,435,640 | | | $ | — | | | $ | 1,143,482,841 | |
| | | | |
aFor detailed categories, see the accompanying Statement of Investments.
FRANKLIN TEMPLETON VARIABLE INSURANCE PRODUCTS TRUST
NOTES TO FINANCIAL STATEMENTS (UNAUDITED)
Templeton Foreign VIP Fund (continued)
11. New Accounting Pronouncements
In March 2020, the Financial Accounting Standards Board (FASB) issued Accounting Standards Update (ASU) No. 2020-04, Reference Rate Reform (Topic 848) – Facilitation of the Effects of Reference Rate Reform on Financial Reporting. The amendments in the ASU provides optional temporary financial reporting relief from the effect of certain types of contract modifications due to the planned discontinuation of the London Interbank Offered Rate (LIBOR) and other interbank-offered based reference rates as of the end of 2021. The ASU is effective for certain reference rate-related contract modifications that occur during the period March 12, 2020 through December 31, 2022. Management is currently evaluating the impact, if any, of applying this ASU.
12. Subsequent Events
The Fund has evaluated subsequent events through the issuance of the financial statements and determined that no events have occurred that require disclosure.
| | |
Abbreviations |
|
| Selected Portfolio |
| |
| ADR | | American Depositary Receipt |
FRANKLIN TEMPLETON VARIABLE INSURANCE PRODUCTS TRUST
Tax Information (unaudited)
Templeton Foreign VIP Fund
At December 31, 2019, more than 50% of the Fund’s total assets were invested in securities of foreign issuers. In most instances, foreign taxes were withheld from income paid to the Fund on these investments. As shown in the table below, the Fund hereby reports to shareholders the foreign source income and foreign taxes paid, pursuant to Section 853 of the Internal Revenue Code. This written statement will allow shareholders of record on June 11, 2020, to treat their proportionate share of foreign taxes paid by the Fund as having been paid directly by them. The shareholder shall consider these amounts as foreign taxes paid in the tax year in which they receive the Fund distribution.
The following table provides a detailed analysis of foreign tax paid and foreign source income as reported by the Fund to shareholders of record.
| | | | | | | | |
| | |
| Class | | Foreign Tax Paid
Per Share | | | Foreign Source
Income Per Share | |
Class 1 | | | $0.0362 | | | | $0.4651 | |
Class 2 | | | $0.0362 | | | | $0.4323 | |
Class 4 | | | $0.0362 | | | | $0.4177 | |
Foreign Tax Paid Per Share is the amount per share available to you, as a tax credit (assuming you held your shares in the Fund for a minimum of 16 days during the 31-day period beginning 15 days before the ex-dividend date of the Fund’s distribution to which the foreign taxes relate), or, as a tax deduction.
Foreign Source Income Per Share is the amount per share of income dividends attributable to foreign securities held by the Fund, plus any foreign taxes withheld on these dividends.
Templeton Global Bond VIP Fund
This semiannual report for Templeton Global Bond VIP Fund covers the period ended June 30, 2020.
Class 4 Performance Summary as of June 30, 2020
The Fund’s Class 4 Shares posted a -5.35% total return*,** for the six-month period ended June 30, 2020.
*The Fund has a fee waiver associated with any investment it makes in a Franklin Templeton money fund and/or other Franklin Templeton fund, contractually guaranteed through 4/30/21. Fund investment results reflect the fee waiver; without this waiver, the results would have been lower.
**Total return information is based on net asset values calculated for shareholder transactions. Certain adjustments were made to the net asset values of the Fund at 12/31/19 for financial reporting purposes. Accordingly, adjusted total returns have been disclosed in the Financial Highlights and differ from those reported here.
Performance reflects the Fund’s Class 4 operating expenses, but does not include any contract fees, expenses or sales charges. If they had been included, performance would be lower. These charges and deductions, particularly for variable life policies, can have a significant effect on contract values and insurance benefits. See the contract prospectus for a complete description of these expenses, including sales charges.
Performance data represent past performance, which does not guarantee future results. Investment return and principal value will fluctuate, and you may have a gain or loss when you sell your shares. Current performance may differ from figures shown.
TEMPLETON GLOBAL BOND VIP FUND
Fund Goal and Main Investments
The Fund seeks high current income, consistent with preservation of capital, with capital appreciation as a secondary consideration. Under normal market conditions, the Fund invests at least 80% of its net assets in bonds, which include debt securities of any maturity, such as bonds, notes, bills and debentures.
Fund Risks
All investments involve risks, including possible loss of principal. Unexpected events and their aftermaths, such as the spread of deadly diseases; natural, environmental or man-made disasters; financial, political or social disruptions; terrorism and war; and other tragedies or catastrophes, can cause investor fear and panic, which can adversely affect the economies of many companies, sectors, nations, regions and the market in general, in ways that cannot necessarily be foreseen. Foreign securities involve special risks, including currency fluctuations and economic and political uncertainties. Currency rates may fluctuate significantly over short periods of time, and can reduce returns. Sovereign debt securities are subject to various risks in addition to those relating to debt securities and foreign securities generally, including, but not limited to, the risk that a governmental entity may be unwilling or unable to pay interest and repay principal on its sovereign debt, or otherwise meet its obligations when due. Adverse conditions in a certain region or country can adversely affect securities of issuers in other countries whose economies appear to be unrelated. Investments in developing markets involve heightened risks related to the same factors, in addition to those associated with these markets’ smaller size, lesser liquidity and lack of established legal, political, business and social frameworks to support securities market. The Fund is actively managed but there is no guarantee that the manager’s investment decisions will produce the desired results. The Fund’s prospectus also includes a description of the main investment risks.
Performance Overview
You can find the Fund’s six-month total return in the Performance Summary. For comparison, the J.P. Morgan Global Government Bond Index posted a +4.60% total return
Geographic Composition*
Based on Total Net Assets as of 6/30/20
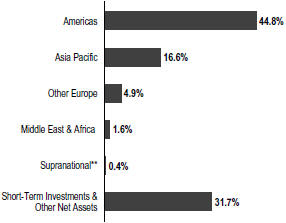
*Figures represent the net Fund exposure and include certain derivatives held in the portfolio (or their underlying reference assets) and may not total 100% or may be negative due to rounding, use of any derivatives or other factors.
**The Fund’s supranational investment was denominated in the Mexican peso.
and the FTSE World Government Bond Index posted a +4.08% total return for the same period.1
Economic and Market Overview
The novel coronavirus (COVID-19) pandemic profoundly impacted economies and global financial markets during the six-month period. Lockdown orders from governments trying to “flatten the curve” (i.e., stem the rate of infection) brought entire countries, regions and continents to an economic standstill in March and April. The speed and pervasiveness of the economic shocks were unprecedented. There is no historical comparison for the magnitude of aggregate demand that was destroyed, nor the magnitude of job losses in such a compressed timescale.
Risk aversion rapidly escalated to crisis levels and deepened throughout March, driving correlations to 1.0 across multiple asset classes as investors shed risk and moved into perceived safe havens. Credit markets experienced substantial price volatility, with the lower-rated credit tiers bearing the brunt of the selloffs. Sovereign bond yields declined in higher-rated countries but rose in more vulnerable ones as volatility escalated. The yield on the 10-year U.S. Treasury (UST) note quickly dropped from 2.00% at the start of the period to a low of 0.54% on March
.
1. Source: Morningstar. One cannot invest directly in an index, and an index is not representative of the Fund’s portfolio. Please see Index Descriptions following the Fund Summaries.
The dollar value, number of shares or principal amount, and names of all portfolio holdings are listed in the Fund’s Statement of Investments (SOI).
TEMPLETON GLOBAL BOND VIP FUND
9. It finished the six-month period at 0.66%, 134 basis points (bps) lower that where it began. The yield on the 10-year German Bund dropped 27 bps further into negative territory during the period, finishing at -0.46%.
The U.S. Federal Reserve (Fed) responded quickly to the deepening crisis with two emergency rate cuts in March, the second of which dropped the federal funds target rate 100 bps to the zero bound that was used during the 2008 global financial crisis (GFC). The Fed also cut reserve requirements and encouraged financial institutions to borrow directly from the discount window. Growing liquidity strains throughout financial markets prompted the Fed to re-start liquidity programs that had been created during the GFC, such as the Commercial Paper Funding Facility and the Primary Dealer Credit Facility.
On March 23, the Fed took its financial market interventions beyond the scope of the GFC programs by creating corporate lending programs, and announcing its intentions to support lending to small- and medium-sized businesses through the newly created Main Street Business Lending Program. The Fed also pledged to buy unlimited government bonds, abandoning the previous quantitative easing targets it had announced a week earlier on March 15.
The heightened demand for U.S. dollars (USD) around the world also led the Fed to expand its liquidity swaps program with foreign central banks beyond the five banks in its standing facility including the European Central Bank (ECB), Bank of Japan (BOJ), Bank of England, Bank of Canada and Swiss National Bank. The swap program was expanded on March 19 to include the Reserve Bank of Australia, Reserve Bank of New Zealand, Danmarks Nationalbank, Norges Bank, Sveriges Riksbank, Bank of Korea, Monetary Authority of Singapore, Banco de Mexico and Banco Central do Brasil. The program enables a foreign central bank to borrow USD directly from the Fed to lend to its own local institutions, facilitating the flow of the world’s reserve currency. The USD notably strengthened from mid-March to mid-May before broadly weakening over the final six weeks of the period.
On the U.S. fiscal side, Congress passed the Coronavirus Aid, Relief, and Economic Security Act on March 26, a USD$2.2 trillion fiscal relief program designed to provide loans to businesses, income support and unemployment benefits to individuals, and funding for hospitals and public health services. It was the largest economic relief bill in U.S. history and was designed as a stopgap for social distancing policies.
On March 18, ECB President Christine Lagarde unveiled the €750 billion Pandemic Emergency Purchase Programme (PEPP) in an unscheduled mid-week announcement. Lagarde commented that, “there are no limits to our commitment to the euro. We are determined to use the full potential of our tools, within our mandate.” PEPP appeared geared to support the more vulnerable states, as the program has unprecedented flexibility to buy a wide range of eligible securities, including Greek and Italian sovereign debt, as well as corporate commercial paper.
In the second quarter of 2020, global financial markets began to rebound from the extreme lows in March, as central banks and governments deployed massive monetary and fiscal measures to respond to the crisis. Regional economies began to incrementally reopen and improving economic data appeared to bolster optimism that the worst of the economic shocks had passed. Credit spreads tightened in many sectors during the second quarter, returning to levels last seen in early March and late February.
However, sharp resurgences in COVID-19 cases in several regions, including the U.S., Latin America and China amongst others, prompted governments to return to shutdown policies in June. Though several economic measures improved in May and June, the stronger figures reflected a rebound from the extreme low points in March and April, and were not trends that could be extrapolated into the upcoming months, in our assessment.
Unprecedented interventions from the Fed and central banks around the world widened the disconnect between financial markets and real economies during the period. Central bank efforts to bolster liquidity in financial markets have been effective, but they do not replace lost revenues or cure insolvencies; they only deepen the debt burdens. We expected corporate bankruptcies to be the next challenge policymakers will have to face, as business insolvencies appeared likely to worsen with each passing month of stifled economic activity. We saw risks for an upcoming second leg down in financial markets.
Rallies in risk assets during the final months of the period appeared to underappreciate the ongoing economic damage and the risks for successive waves of infections that could further suppress economic activity going forward, in our view. Massive unemployment, deepening economic hardship and growing insolvencies will not be fully remedied by partial reopenings or government interventions alone. The longer that economic activity remains suppressed and the longer that workers go without incomes, the more entrenched the economic damage will become.
TEMPLETON GLOBAL BOND VIP FUND
On the policy front, the Fed maintained its monetary stance at its April and June meetings, and reaffirmed its commitment to using its “full range of tools to support the U.S. economy.” The updated dot plot survey in June indicated that Fed officials expected rates to remain unchanged through 2022. The Fed also updated its projections for U.S. GDP (gross domestic product) growth to -6.5% for 2020 and +5.0% for 2021. It also projected unemployment to be 9.3% at the end of 2020. Fed Chair Jay Powell commented at the end of June during testimony to the House financial services committee that, “the path forward for the economy is extraordinarily uncertain and will depend in large part on our success in containing the virus.” He also continued to emphasize the importance of fiscal support for workers. Powell also indicated that yield curve control was not in imminent consideration and likely not an appropriate tool for U.S. financial markets. In previous comments, he had also ruled out the potential for negative policy rates.
In Europe, the European Commission proposed a €750 billion financing program in May that would deliver up to €500 billion in grants and €250 billion in loans to member states in need of financial support. The program was still in policy discussions at the end of June. On the monetary side, the ECB increased the size of the PEPP by €600 billion to €1.35 trillion at its June 4 policy meeting. Italian bonds rallied on the news, as did the euro, which appreciated 1.2% against the USD in the month of June. The ECB also updated its growth forecast for the eurozone in 2020 to -8.7%, which would be the largest contraction in the post-war era. In May, Lagarde acknowledged that a recovery to previous GDP levels would take at least two to three years.
In Japan, monetary policy responses to the crisis focused more on ensuring businesses had ample access to capital through various loan programs than on lowering the cost of capital. At its April 27 meeting, the BOJ quadrupled the size of its corporate debt purchases. It also announced that it would remove quantitative easing caps. On the price stability front, deflation returned during the period, despite years of persistent efforts from the BOJ to drive inflation higher. Core inflation dropped to -0.2% year-over-year in April and May. The BOJ offered no indications on whether the return of deflation would alter monetary policy in the months ahead, but it remained a concern that officials continued to monitor. The BOJ kept overnight interest rates at -0.1% and the yield target on the 10-year Japanese government bond at 0.0% throughout the period.
Nearly every country in the world declared some form of fiscal response to the crisis, with most countries pursuing
programs that went beyond the measures they deployed during the GFC. Debt-to-GDP ratios rose significantly in just about every country. On the monetary front, many central banks aggressively cut policy rates during the peaks in financial market volatility in March, but paused on making additional cuts in April, similar to the approaches taken by the Fed and the ECB. Several central banks returned to rate cuts in May and June, with many indicating they intended to respond with additional accommodation as needed. During the period, Brazil cut its policy rate by 225 bps to 2.25%, Mexico by 225 bps to 5.00%, Colombia by 175 bps to 2.50%, India by 115 bps to 4.00%, Indonesia by 75 bps to 4.25%, South Korea by 75 bps to 0.50%, Australia by 50 bps to 0.25%, Norway by 150 bps to 0.00%, Canada by 150 bps to 0.25% and the United Kingdom by 65 bps to 0.10%.
Investment Strategy
We invest selectively in bonds around the world based upon our assessment of changing market, political and economic conditions. While seeking opportunities, we monitor various factors including changes in interest rates, currency exchange rates and credit risks. We seek to manage the Fund’s exposure to various currencies and regularly utilize currency and cross currency forward contracts and may also use currency and currency index futures contracts, currency options and other derivative instruments.
Manager’s Discussion
The fixed income sleeve of the strategy was structured around four key pillars during the reporting period: (1) maintaining high liquidity through elevated cash balances and risk-adjusted position weights; (2) holding long exposures to perceived safe-haven assets such as the Japanese yen, Swiss franc, Norwegian krone and Swedish krona; (3) targeting appropriate risk-adjusted returns in a select subset of emerging markets; and (4) underweighting overvalued developed fixed income markets, notably longer-term USTs. The strategy continued to emphasize select duration exposures in countries that have attractive risk-adjusted yields, resilient economic fundamentals and prudent fiscal and monetary policies. Several emerging markets continued to offer significantly higher yields than those available in the developed markets. The strategy entered the reporting period in a de-risked state as the investment team saw elevated global financial market risks that it believed were significantly underappreciated by markets. While the team was not explicitly anticipating the COVID-19 crisis or the collapse in oil prices in the first quarter of 2020, it was concerned that overvalued risk assets were vulnerable to a geopolitical, economic or financial market shock. The team adjusted the risk-sizing of
TEMPLETON GLOBAL BOND VIP FUND
various positions and hedged (using currency forwards) a substantial amount of local-currency emerging market beta risk through proxy hedges (net-negative Australian dollar) and direct hedges (Indian rupee, South Korean won, Mexican peso and Brazilian real). The team also continued to broadly avoid credit sectors, which it believed were overvalued leading up to the crisis and increasingly vulnerable to insolvencies as the economic crisis progressed. The strategy also maintained negative duration exposure to longer-term USTs before the COVID-19 crisis erupted in March 2020, as the team believed that inflation pressures, rising deficit spending and surging levels of debt issuance were significantly underpriced in the longer-term range of the U.S. Treasury yield curve. The team unwound its net-negative positioning in longer-term USTs into curve steepening in March. The strategy continued to hold undervalued safe-haven assets that it had previously added in the third quarter of 2019, notably the Japanese yen, Swiss franc, Swedish krona and Norwegian krone. These positions were intended to hedge against global financial market risks associated with rising geopolitical tensions as well as price distortions from ongoing loose monetary policies across the developed world. The strategy also continued to hold a net-negative position in the euro to hedge against broad-based USD strength and unresolved structural risks across Europe, and a net-negative position in the Australian dollar to hedge against broad emerging market risks. During the period, the team used forward currency exchange contracts and currency options to actively manage currencies, and used interest-rate swaps to tactically manage duration exposures.
During the period, the Fund’s negative absolute performance was primarily due to currency positions. Interest-rate strategies contributed to absolute results, while sovereign credit exposures had a largely neutral effect. Among currencies, positions in Latin America (the Brazilian real, Mexican peso and Argentine peso) detracted from absolute performance, as did currency positions in northern Europe (Norwegian krone). The Fund maintained a defensive approach regarding interest rates in developed markets, while holding duration exposures in select emerging markets. Select duration exposures in Latin America (Mexico and Argentina) and Asia (India) contributed to absolute results, while negative duration exposure to USTs during the first quarter detracted.
On a relative basis, the Fund underperformed its benchmark due to interest-rate strategies, followed by currency positions. Sovereign credit exposures had a largely neutral effect on relative results. Among currencies, overweighted positions in Latin America (the Brazilian real, Mexican peso
and Argentine peso) detracted from relative performance, as did overweighted positions in northern European currencies (the Norwegian krone). Underweighted duration exposure in the U.S. detracted from relative performance, as did select underweighted duration exposures in Europe. However, select overweighted duration exposures in Latin America (Mexico and Argentina) contributed to relative results.
Thank you for your participation in Templeton Global Bond VIP Fund. We look forward to serving your future investment needs.
The foregoing information reflects our analysis, opinions and portfolio holdings as of June 30, 2020, the end of the reporting period. The way we implement our main investment strategies and the resulting portfolio holdings may change depending on factors such as market and economic conditions. These opinions may not be relied upon as investment advice or an offer for a particular security. The information is not a complete analysis of every aspect of any market, country, industry, security or the Fund.
Statements of fact are from sources considered reliable, but the investment manager makes no representation or warranty as to their completeness or accuracy. Although historical performance is no guarantee of future results, these insights may help you understand our investment management philosophy.
TEMPLETON GLOBAL BOND VIP FUND
Class 4 Fund Expenses
As an investor in a variable insurance contract (Contract) that indirectly provides for investment in an underlying mutual fund, you can incur transaction and/or ongoing expenses at both the Fund level and the Contract Level: (1) transaction expenses can include sales charges (loads) on purchases, surrender fees, transfer fees and premium taxes; and (2) ongoing expenses can include management fees, distribution and service (12b-1) fees, contract fees, annual maintenance fees, mortality and expense risk fees and other fees and expenses. All mutual funds and Contracts have some types of ongoing expenses. The table below shows Fund-level ongoing expenses and can help you understand these costs and compare them with those of other mutual funds offered through the Contract. The table assumes a $1,000 investment held for the six months indicated. Please refer to the Fund prospectus for additional information on operating expenses.
Actual Fund Expenses
The table below provides information about the actual account values and actual expenses in the columns under the heading “Actual.” In these columns the Fund’s actual return, which includes the effect of ongoing Fund expenses but does not include the effect of ongoing Contract expenses, is used to calculate the “Ending Account Value.” You can estimate the Fund-level expenses you paid during the period by following these steps (of course, your account value and expenses will differ from those in this illustration): Divide your account value by $1,000 (if your account had an $8,600 value, then $8,600 ÷ $1,000 = 8.6). Then multiply the result by the number under the headings “Actual” and “Fund-Level Expenses Paid During Period” (if Fund-Level Expenses Paid During Period were $ 7.50, then 8.6 x $ 7.50 = $64.50). In this illustration, the estimated expenses paid this period at the Fund level are $64.50.
Hypothetical Example for Comparison with Other Mutual Funds
Under the heading “Hypothetical” in the table, information is provided about hypothetical account values and hypothetical expenses based on the Fund’s actual expense ratio and an assumed rate of return of 5% per year before expenses, which is not the Fund’s actual return. This information may not be used to estimate the actual ending account balance or expenses you paid for the period, but it can help you compare ongoing costs of investing in the Fund with those of other mutual funds offered through the Contract. To do so, compare this 5% hypothetical example with the 5% hypothetical examples that appear in the shareholder reports of other funds offered through the Contract.
Please note that expenses shown in the table are meant to highlight ongoing costs at the Fund level only and do not reflect any ongoing expenses at the Contract level, or transaction expenses at either the Fund or Contract levels. In addition, while the Fund does not have transaction expenses, if the transaction and ongoing expenses at the Contract level were included, the expenses shown below would be higher. You should consult your Contract prospectus or disclosure document for more information.
| | | | | | | | | | | | | | | | | | |
| | | | | | | |
| | | | | | | Actual (actual return after expenses) | | | | Hypothetical
(5% annual return before expenses) | | | | |
| | | | | | | | | Fund-Level | | | | | | Fund-Level | | | | |
| | | | | | | | | Expenses | | | | | | Expenses | | | | Net |
| | | Beginning | | | | Ending | | Paid During | | | | Ending | | Paid During | | | | Annualized |
| Share | | Account | | | | Account | | Period | | | | Account | | Period | | | | Expense |
| Class | | Value 1/1/20 | | | | Value 6/30/20 | | 1/1/20–6/30/201, 2 | | | | Value 6/30/20 | | 1/1/20–6/30/201, 2 | | | | Ratio2 |
Class 4 | | $1,000 | | | | $950.00 | | $3.78 | | | | $1,020.98 | | $3.92 | | | | 0.78% |
1. Expenses are equal to the annualized expense ratio for the six-month period as indicated above—in the far right column—multiplied by the simple average account value over the period indicated, and then multiplied by 182/366 to reflect the one-half year period.
2. Reflects expenses after fee waivers and expense reimbursements. Does not include any ongoing expenses of the Contract for which the Fund is an investment option or acquired fund fees and expenses.
FRANKLIN TEMPLETON VARIABLE INSURANCE PRODUCTS TRUST
Financial Highlights
Templeton Global Bond VIP Fund
| | | | | | | | | | | | | | | | | | | | | | | | |
| | |
| | | Six Months Ended
June 30, 2020 (unaudited) | | | Year Ended December 31, | |
| | | 2019 | | | 2018 | | | 2017 | | | 2016 | | | 2015 | |
| | | | | | |
Class 1 | | | | | | | | | | | | | | | | | | | | | | | | |
| | | | | | |
Per share operating performance
(for a share outstanding throughout the period) | | | | | | | | | | | | | | | | | | | | | | | | |
| | | | | | |
Net asset value, beginning of period | | | $16.63 | | | | $17.54 | | | | $17.17 | | | | $16.85 | | | | $16.34 | | | | $18.56 | |
| | | | |
| | | | | | |
| Income from investment operationsa: | | | | | | | | | | | | | | | | | | | | | | | | |
| | | | | | |
Net investment incomeb | | | 0.30 | | | | 0.89 | | | | 0.88 | | | | 0.83 | | | | 0.62 | | | | 0.52 | |
| | | | | | |
Net realized and unrealized gains (losses) | | | (1.11 | ) | | | (0.54 | ) | | | (0.51 | ) | | | (0.46 | ) | | | (0.10 | ) | | | (1.22 | ) |
| | | | |
| | | | | | |
Total from investment operations | | | (0.81 | ) | | | 0.35 | | | | 0.37 | | | | 0.37 | | | | 0.52 | | | | (0.70 | ) |
| | | | |
| | | | | | |
Less distributions from: | | | | | | | | | | | | | | | | | | | | | | | | |
| | | | | | |
Net investment income and net foreign currency gains | | | (1.35 | ) | | | (1.26 | ) | | | — | | | | — | | | | — | | | | (1.43 | ) |
| | | | | | |
Net realized gains | | | — | | | | — | | | | — | | | | (0.05 | ) | | | (0.01 | ) | | | (0.09 | ) |
| | | | |
| | | | | | |
Total distributions | | | (1.35 | ) | | | (1.26 | ) | | | — | | | | (0.05 | ) | | | (0.01 | ) | | | (1.52 | ) |
| | | | |
| | | | | | |
Net asset value, end of period | | | $14.47 | | | | $16.63 | | | | $17.54 | | | | $17.17 | | | | $16.85 | | | | $16.34 | |
| | | | |
| | | | | | |
Total returnc | | | (4.80)% | | | | 1.89% | | | | 2.15% | | | | 2.15% | | | | 3.21% | | | | (4.10)% | |
| | | | | | |
| Ratios to average net assetsd | | | | | | | | | | | | | | | | | | | | | | | | |
| | | | | | |
Expenses before waiver and payments by affiliates and expense reduction | | | 0.52% | | | | 0.53% | | | | 0.56% | | | | 0.53% | | | | 0.53% | | | | 0.52% | |
| | | | | | |
Expenses net of waiver and payments by affiliates | | | 0.45% | | | | 0.44% | | | | 0.47% | | | | 0.46% | | | | 0.48% | | | | 0.52% | e |
| | | | | | |
Expenses net of waiver and payments by affiliates and expense reduction | | | 0.43% | | | | 0.42% | | | | 0.45% | | | | 0.46%f | | | | 0.48% | f | | | 0.52% | e,f |
| | | | | | |
Net investment income | | | 3.79% | | | | 5.22% | | | | 5.09% | | | | 4.81% | | | | 3.88% | | | | 2.99% | |
| | | | | | |
| Supplemental data | | | | | | | | | | | | | | | | | | | | | | | | |
| | | | | | |
Net assets, end of period (000’s) | | | $255,388 | | | | $322,794 | | | | $285,046 | | | | $286,502 | | | | $241,792 | | | | $292,802 | |
| | | | | | |
Portfolio turnover rate | | | 39.24% | | | | 22.58% | | | | 18.22% | | | | 37.97% | | | | 59.00% | | | | 51.58% | |
aThe amount shown for a share outstanding throughout the period may not correlate with the Statement of Operations for the period due to the timing of sales and repurchases of the Fund’s shares in relation to income earned, adjustments to interest income for the inflation-indexed bonds, and/or fluctuating fair value of the investments of the Fund.
bBased on average daily shares outstanding.
cTotal return does not include fees, charges or expenses imposed by the variable annuity and life insurance contracts for which Franklin Templeton Variable Insurance Products Trust serves as an underlying investment vehicle. Total return is not annualized for periods less than one year.
dRatios are annualized for periods less than one year.
eBenefit of waiver and payments by affiliates rounds to less than 0.01%.
fBenefit of expense reduction rounds to less than 0.01%.
| | | | | | |
| | | |
| | The accompanying notes are an integral part of these financial statements. | Semiannual Report | | | TGB-7 | |
FRANKLIN TEMPLETON VARIABLE INSURANCE PRODUCTS TRUST
FINANCIAL HIGHLIGHTS
Templeton Global Bond VIP Fund (continued)
| | | | | | | | | | | | | | | | | | | | | | | | |
| | |
| | | Six Months Ended
June 30, 2020 (unaudited) | | | Year Ended December 31, | |
| | | 2019 | | | 2018 | | | 2017 | | | 2016 | | | 2015 | |
| | | | | | |
Class 2 | | | | | | | | | | | | | | | | | | | | | | | | |
| | | | | | |
Per share operating performance
(for a share outstanding throughout the period) | | | | | | | | | | | | | | | | | | | | | | | | |
| | | | | | |
Net asset value, beginning of period | | | $15.91 | | | | $16.83 | | | | $16.51 | | | | $16.25 | | | | $15.80 | | | | $17.99 | |
| | | | |
| | | | | | |
| Income from investment operationsa: | | | | | | | | | | | | | | | | | | | | | | | | |
| | | | | | |
Net investment incomeb | | | 0.27 | | | | 0.82 | | | | 0.81 | | | | 0.76 | | | | 0.56 | | | | 0.46 | |
| | | | | | |
Net realized and unrealized gains (losses) | | | (1.06 | ) | | | (0.53 | ) | | | (0.49 | ) | | | (0.45 | ) | | | (0.10 | ) | | | (1.17 | ) |
| | | | |
| | | | | | |
Total from investment operations | | | (0.79 | ) | | | 0.29 | | | | 0.32 | | | | 0.31 | | | | 0.46 | | | | (0.71 | ) |
| | | | |
| | | | | | |
| Less distributions from: | | | | | | | | | | | | | | | | | | | | | | | | |
| | | | | | |
Net investment income and net foreign currency gains | | | (1.31 | ) | | | (1.21 | ) | | | — | | | | — | | | | — | | | | (1.39 | ) |
| | | | | | |
Net realized gains | | | — | | | | — | | | | — | | | | (0.05 | ) | | | (0.01 | ) | | | (0.09 | ) |
| | | | |
| | | | | | |
Total distributions | | | (1.31 | ) | | | (1.21 | ) | | | — | | | | (0.05 | ) | | | (0.01 | ) | | | (1.48 | ) |
| | | | |
| | | | | | |
Net asset value, end of period | | | $13.81 | | | | $15.91 | | | | $16.83 | | | | $16.51 | | | | $16.25 | | | | $15.80 | |
| | | | |
| | | | | | |
Total returnc | | | (4.99)% | | | | 1.63% | | | | 1.94% | | | | 1.93% | | | | 2.94% | | | | (4.30)% | |
| | | | | | |
| Ratios to average net assetsd | | | | | | | | | | | | | | | | | | | | | | | | |
| | | | | | |
Expenses before waiver and payments by affiliates and expense reduction | | | 0.77% | | | | 0.78% | | | | 0.81% | | | | 0.78% | | | | 0.78% | | | | 0.77% | |
| | | | | | |
Expenses net of waiver and payments by affiliates | | | 0.70% | | | | 0.69% | | | | 0.72% | | | | 0.71% | | | | 0.73% | | | | 0.77% | e |
| | | | | | |
Expenses net of waiver and payments by affiliates and expense reduction | | | 0.68% | | | | 0.67% | | | | 0.70% | | | | 0.71% | f | | | 0.73% | f | | | 0.77% | e,f |
| | | | | | |
Net investment income | | | 3.54% | | | | 4.97% | | | | 4.84% | | | | 4.56% | | | | 3.63% | | | | 2.74% | |
| | | | | | |
| Supplemental data | | | | | | | | | | | | | | | | | | | | | | | | |
| | | | | | |
Net assets, end of period (000’s) | | | $2,060,001 | | | | $2,389,610 | | | | $2,544,900 | | | | $2,730,081 | | | | $2,812,535 | | | | $2,971,667 | |
| | | | | | |
Portfolio turnover rate | | | 39.24% | | | | 22.58% | | | | 18.22% | | | | 37.97% | | | | 59.00% | | | | 51.58% | |
aThe amount shown for a share outstanding throughout the period may not correlate with the Statement of Operations for the period due to the timing of sales and repurchases of the Fund’s shares in relation to income earned, adjustments to interest income for the inflation-indexed bonds, and/or fluctuating fair value of the investments of the Fund.
bBased on average daily shares outstanding.
cTotal return does not include fees, charges or expenses imposed by the variable annuity and life insurance contracts for which Franklin Templeton Variable Insurance Products Trust serves as an underlying investment vehicle. Total return is not annualized for periods less than one year.
dRatios are annualized for periods less than one year.
eBenefit of waiver and payments by affiliates rounds to less than 0.01%.
fBenefit of expense reduction rounds to less than 0.01%.
| | | | |
| | | |
| TGB-8 | | Semiannual Report | The accompanying notes are an integral part of these financial statements. | | |
FRANKLIN TEMPLETON VARIABLE INSURANCE PRODUCTS TRUST
FINANCIAL HIGHLIGHTS
Templeton Global Bond VIP Fund (continued)
| | | | | | | | | | | | | | | | | | | | | | | | |
| | |
| | | Six Months Ended
June 30, 2020 (unaudited) | | | Year Ended December 31, | |
| | | 2019 | | | 2018 | | | 2017 | | | 2016 | | | 2015 | |
| | | | | | |
Class 4 | | | | | | | | | | | | | | | | | | | | | | | | |
| | | | | | |
Per share operating performance
(for a share outstanding throughout the period) | | | | | | | | | | | | | | | | | | | | | | | | |
| | | | | | |
Net asset value, beginning of period | | | $16.27 | | | | $17.19 | | | | $16.88 | | | | $16.62 | | | | $16.18 | | | | $18.38 | |
| | | | |
| | | | | | |
| Income from investment operationsa: | | | | | | | | | | | | | | | | | | | | | | | | |
| | | | | | |
Net investment incomeb | | | 0.27 | | | | 0.82 | | | | 0.81 | | | | 0.76 | | | | 0.56 | | | | 0.46 | |
| | | | | | |
Net realized and unrealized gains (losses) | | | (1.08 | ) | | | (0.55 | ) | | | (0.50 | ) | | | (0.45 | ) | | | (0.11 | ) | | | (1.21 | ) |
| | | | |
| | | | | | |
Total from investment operations | | | (0.81 | ) | | | 0.27 | | | | 0.31 | | | | 0.31 | | | | 0.45 | | | | (0.75 | ) |
| | | | |
| | | | | | |
| Less distributions from: | | | | | | | | | | | | | | | | | | | | | | | | |
| | | | | | |
Net investment income and net foreign currency gains | | | (1.29 | ) | | | (1.19 | ) | | | — | | | | — | | | | — | | | | (1.36 | ) |
| | | | | | |
Net realized gains | | | — | | | | — | | | | — | | | | (0.05 | ) | | | (0.01 | ) | | | (0.09 | ) |
| | | | |
| | | | | | |
Total distributions | | | (1.29 | ) | | | (1.19 | ) | | | — | | | | (0.05 | ) | | | (0.01 | ) | | | (1.45 | ) |
| | | | |
| | | | | | |
Net asset value, end of period | | | $14.17 | | | | $16.27 | | | | $17.19 | | | | $16.88 | | | | $16.62 | | | | $16.18 | |
| | | | |
| | | | | | |
Total returnc | | | (5.00)% | | | | 1.48% | | | | 1.84% | | | | 1.76% | | | | 2.87% | | | | (4.39)% | |
| | | | | | |
| Ratios to average net assetsd | | | | | | | | | | | | | | | | | | | | | | | | |
| | | | | | |
Expenses before waiver and payments by affiliates and expense reduction | | | 0.87% | | | | 0.88% | | | | 0.91% | | | | 0.88% | | | | 0.88% | | | | 0.87% | |
| | | | | | |
Expenses net of waiver and payments by affiliates | | | 0.80% | | | | 0.79% | | | | 0.82% | | | | 0.81% | | | | 0.83% | | | | 0.87% | e |
| | | | | | |
Expenses net of waiver and payments by affiliates and expense reduction | | | 0.78% | | | | 0.77% | | | | 0.80% | | | | 0.81% | f | | | 0.83% | f | | | 0.87% | e,f |
| | | | | | |
Net investment income | | | 3.44% | | | | 4.87% | | | | 4.74% | | | | 4.46% | | | | 3.53% | | | | 2.64% | |
| | | | | | |
| Supplemental data | | | | | | | | | | | | | | | | | | | | | | | | |
| | | | | | |
Net assets, end of period (000’s) | | | $76,889 | | | | $90,272 | | | | $94,312 | | | | $98,934 | | | | $96,798 | | | | $103,045 | |
| | | | | | |
Portfolio turnover rate | | | 39.24% | | | | 22.58% | | | | 18.22% | | | | 37.97% | | | | 59.00% | | | | 51.58% | |
aThe amount shown for a share outstanding throughout the period may not correlate with the Statement of Operations for the period due to the timing of sales and repurchases of the Fund’s shares in relation to income earned, adjustments to interest income for the inflation-indexed bonds, and/or fluctuating fair value of the investments of the Fund.
bBased on average daily shares outstanding.
cTotal return does not include fees, charges or expenses imposed by the variable annuity and life insurance contracts for which Franklin Templeton Variable Insurance Products Trust serves as an underlying investment vehicle. Total return is not annualized for periods less than one year.
dRatios are annualized for periods less than one year.
eBenefit of waiver and payments by affiliates rounds to less than 0.01%.
fBenefit of expense reduction rounds to less than 0.01%.
| | | | | | |
| | | |
| | The accompanying notes are an integral part of these financial statements. | Semiannual Report | | | TGB-9 | |
FRANKLIN TEMPLETON VARIABLE INSURANCE PRODUCTS TRUST
Statement of Investments, June 30, 2020 (unaudited)
| | | | | | | | | | | | | | |
Templeton Global Bond VIP Fund | | | | | | | | | |
| | | | | Principal Amount* | | | | | | Value | |
| | Foreign Government and Agency Securities 47.8% | | | | | | | | | | | | |
| | Argentina 1.9% | | | | | | | | | | | | |
| a,b | | Argentina Treasury Bond BONCER, | | | | | | | | | | | | |
| | Index Linked, 1.20%, 3/18/22 | | | 1,476,595,148 | | | | ARS | | | $ | 13,968,764 | |
| | Index Linked, 1.40%, 3/25/23 | | | 892,881,163 | | | | ARS | | | | 7,555,529 | |
| | Index Linked, 1.50%, 3/25/24 | | | 892,881,166 | | | | ARS | | | | 7,054,517 | |
| a | | Argentine Bonos del Tesoro, | | | | | | | | | | | | |
| | 18.20%, 10/03/21 | | | 820,823,000 | | | | ARS | | | | 5,964,086 | |
| | 16.00%, 10/17/23 | | | 844,288,000 | | | | ARS | | | | 4,236,420 | |
| | senior note, 15.50%, 10/17/26 | | | 1,668,306,000 | | | | ARS | | | | 5,998,914 | |
| a,c | | Government of Argentina, FRN, 26.415%, (ARS Badlar + 2.00%), 4/03/22 | | | 24,036,000 | | | | ARS | | | | 217,324 | |
| | | | | | | | | | | | | | |
| | | | |
| | | | | | | | | | | | | 44,995,554 | |
| | | | | | | | | | | | | | |
| | Brazil 6.9% | | | | | | | | | | | | |
| | Letra Tesouro Nacional, | | | | | | | | | | | | |
| | Strip, 7/01/20 | | | 719,675d | | | | BRL | | | | 132,360,143 | |
| | Strip, 4/01/21 | | | 25,610d | | | | BRL | | | | 4,635,595 | |
| | Strip, 7/01/21 | | | 34,210d | | | | BRL | | | | 6,147,342 | |
| | Nota do Tesouro Nacional, 10.00%, 1/01/21 | | | 117,516d | | | | BRL | | | | 22,438,395 | |
| | | | | | | | | | | | | | |
| | | | |
| | | | | | | | | | | | | 165,581,475 | |
| | | | | | | | | | | | | | |
| | Colombia 1.6% | | | | | | | | | | | | |
| | Government of Colombia, | | | | | | | | | | | | |
| | senior bond, 7.75%, 4/14/21 | | | 2,386,000,000 | | | | COP | | | | 652,155 | |
| | senior bond, 4.375%, 3/21/23 | | | 362,000,000 | | | | COP | | | | 96,872 | |
| | senior bond, 9.85%, 6/28/27 | | | 576,000,000 | | | | COP | | | | 193,733 | |
| | Titulos de Tesoreria, | | | | | | | | | | | | |
| | senior bond, B, 11.00%, 7/24/20 | | | 9,167,000,000 | | | | COP | | | | 2,451,055 | |
| | senior bond, B, 7.00%, 5/04/22 | | | 10,237,000,000 | | | | COP | | | | 2,913,236 | |
| | senior bond, B, 10.00%, 7/24/24 | | | 40,977,000,000 | | | | COP | | | | 13,432,810 | |
| | senior bond, B, 7.50%, 8/26/26 | | | 35,134,200,000 | | | | COP | | | | 10,655,342 | |
| | senior bond, B, 6.00%, 4/28/28 | | | 29,113,600,000 | | | | COP | | | | 7,889,794 | |
| | | | | | | | | | | | | | |
| | | | |
| | | | | | | | | | | | | 38,284,997 | |
| | | | | | | | | | | | | | |
| | Ghana 1.6% | | | | | | | | | | | | |
| | Government of Ghana, | | | | | | | | | | | | |
| | 24.75%, 3/01/21 | | | 690,000 | | | | GHS | | | | 125,135 | |
| | 16.25%, 5/17/21 | | | 7,250,000 | | | | GHS | | | | 1,245,419 | |
| | 24.50%, 6/21/21 | | | 80,000 | | | | GHS | | | | 14,686 | |
| | 24.75%, 7/19/21 | | | 1,190,000 | | | | GHS | | | | 219,100 | |
| | 18.75%, 1/24/22 | | | 26,840,000 | | | | GHS | | | | 4,704,739 | |
| | 17.60%, 11/28/22 | | | 370,000 | | | | GHS | | | | 63,366 | |
| | 19.75%, 3/25/24 | | | 26,840,000 | | | | GHS | | | | 4,730,705 | |
| | 19.00%, 11/02/26 | | | 80,510,000 | | | | GHS | | | | 12,903,808 | |
| | senior bond, 19.75%, 3/15/32 | | | 80,510,000 | | | | GHS | | | | 13,008,949 | |
| | senior note, 18.25%, 9/21/20 | | | 480,000 | | | | GHS | | | | 83,850 | |
| | senior note, 16.50%, 3/22/21 | | | 1,730,000 | | | | GHS | | | | 298,706 | |
| | | | | | | | | | | | | | |
| | | | |
| | | | | | | | | | | | | 37,398,463 | |
| | | | | | | | | | | | | | |
FRANKLIN TEMPLETON VARIABLE INSURANCE PRODUCTS TRUST
STATEMENT OF INVESTMENTS (UNAUDITED)
Templeton Global Bond VIP Fund (continued)
| | | | | | | | | | | | | | |
| | | | | Principal Amount* | | | | | | Value | |
| | | | |
| | Foreign Government and Agency Securities (continued) | | | | | | | | | | | | |
| | India 2.8% | | | | | | | | | | | | |
| | Government of India, | | | | | | | | | | | | |
| | senior bond, 8.20%, 2/15/22 | | | 500,000,000 | | | | INR | | | $ | 7,030,227 | |
| | senior bond, 8.35%, 5/14/22 | | | 212,700,000 | | | | INR | | | | 2,981,170 | |
| | senior note, 8.79%, 11/08/21 | | | 653,000,000 | | | | INR | | | | 9,171,674 | |
| | senior note, 8.15%, 6/11/22 | | | 1,621,000,000 | | | | INR | | | | 22,990,586 | |
| | senior note, 6.84%, 12/19/22 | | | 98,000,000 | | | | INR | | | | 1,376,372 | |
| | senior note, 7.16%, 5/20/23 | | | 133,700,000 | | | | INR | | | | 1,894,284 | |
| | senior note, 8.83%, 11/25/23 | | | 1,468,100,000 | | | | INR | | | | 21,780,740 | |
| | | | | | | | | | | | | | |
| | | | |
| | | | | | | | | | | | | 67,225,053 | |
| | | | | | | | | | | | | | |
| | Indonesia 4.2% | | | | | | | | | | | | |
| | Government of Indonesia, | | | | | | | | | | | | |
| | senior bond, FR34, 12.80%, 6/15/21 | | | 324,406,000,000 | | | | IDR | | | | 24,453,919 | |
| | senior bond, FR35, 12.90%, 6/15/22 | | | 71,229,000,000 | | | | IDR | | | | 5,664,842 | |
| | senior bond, FR39, 11.75%, 8/15/23 | | | 5,491,000,000 | | | | IDR | | | | 445,598 | |
| | senior bond, FR40, 11.00%, 9/15/25 | | | 46,856,000,000 | | | | IDR | | | | 3,898,368 | |
| | senior bond, FR43, 10.25%, 7/15/22 | | | 147,832,000,000 | | | | IDR | | | | 11,280,040 | |
| | senior bond, FR44, 10.00%, 9/15/24 | | | 4,454,000,000 | | | | IDR | | | | 353,070 | |
| | senior bond, FR46, 9.50%, 7/15/23 | | | 226,780,000,000 | | | | IDR | | | | 17,380,374 | |
| | senior bond, FR61, 7.00%, 5/15/22 | | | 244,849,000,000 | | | | IDR | | | | 17,597,175 | |
| | senior bond, FR63, 5.625%, 5/15/23 | | | 258,951,000,000 | | | | IDR | | | | 17,962,162 | |
| | senior bond, FR70, 8.375%, 3/15/24 | | | 32,315,000,000 | | | | IDR | | | | 2,415,407 | |
| | | | | | | | | | | | | | |
| | | | |
| | | | | | | | | | | | | 101,450,955 | |
| | | | | | | | | | | | | | |
| | Mexico 13.7% | | | | | | | | | | | | |
| | Government of Mexico, | | | | | | | | | | | | |
| | senior bond, M, 6.50%, 6/10/21 | | | 18,568,200e | | | | MXN | | | | 82,125,630 | |
| | senior bond, M, 6.50%, 6/09/22 | | | 21,479,940e | | | | MXN | | | | 96,690,517 | |
| | senior bond, M, 6.75%, 3/09/23 | | | 2,291,440e | | | | MXN | | | | 10,491,439 | |
| | senior bond, M, 8.00%, 12/07/23 | | | 8,364,900e | | | | MXN | | | | 40,141,108 | |
| | senior note, M, 7.25%, 12/09/21 | | | 21,545,600e | | | | MXN | | | | 97,115,742 | |
| f | | Mexican Udibonos, Index Linked, 2.50%, 12/10/20 | | | 392,943g | | | | MXN | | | | 1,722,665 | |
| | | | | | | | | | | | | | |
| | | | |
| | | | | | | | | | | | | 328,287,101 | |
| | | | | | | | | | | | | | |
| | Norway 4.9% | | | | | | | | | | | | |
| h,i | | Government of Norway, | | | | | | | | | | | | |
| | 144A, Reg S, 3.75%, 5/25/21 | | | 335,990,000 | | | | NOK | | | | 36,067,133 | |
| | 144A, Reg S, 2.00%, 5/24/23 | | | 315,007,000 | | | | NOK | | | | 34,443,753 | |
| | 144A, Reg S, 3.00%, 3/14/24 | | | 265,052,000 | | | | NOK | | | | 30,365,034 | |
| | 144A, Reg S, 1.75%, 3/13/25 | | | 89,312,000 | | | | NOK | | | | 9,912,855 | |
| | 144A, Reg S, 1.50%, 2/19/26 | | | 52,969,000 | | | | NOK | | | | 5,854,514 | |
| | | | | | | | | | | | | | |
| | | | |
| | | | | | | | | | | | | 116,643,289 | |
| | | | | | | | | | | | | | |
| | South Korea 9.8% | | | | | | | | | | | | |
| | Korea Treasury Bond, | | | | | | | | | | | | |
| | senior note, 3.00%, 3/10/23 | | | 3,919,000,000 | | | | KRW | | | | 3,452,698 | |
| | senior note, 2.25%, 9/10/23 | | | 88,312,000,000 | | | | KRW | | | | 76,685,619 | |
| | senior note, 1.875%, 3/10/24 | | | 33,811,000,000 | | | | KRW | | | | 29,095,346 | |
| | senior note, 1.375%, 9/10/24 | | | 75,881,910,000 | | | | KRW | | | | 64,103,846 | |
FRANKLIN TEMPLETON VARIABLE INSURANCE PRODUCTS TRUST
STATEMENT OF INVESTMENTS (UNAUDITED)
Templeton Global Bond VIP Fund (continued)
| | | | | | | | | | | | | | | | | | |
| | | | | | | | Principal Amount* | | | | | | Value | |
| | Foreign Government and Agency Securities (continued) | | | | | | | | | | | | | | | | |
| | South Korea (continued) | | | | | | | | | | | | | | | | |
| | Korea Treasury Bond, (continued) | | | | | | | | | | | | | | | | |
| | senior note, 3.00%, 9/10/24 | | | | | | | 18,500,000,000 | | | | KRW | | | $ | 16,655,382 | |
| | senior note, 1.375%, 12/10/29 | | | | | | | 53,382,000,000 | | | | KRW | | | | 44,517,796 | |
| | | | | | | | | | | | | | | | | | |
| | | | | |
| | | | | | | | | | | | | | | | | 234,510,687 | |
| | | | | | | | | | | | | | | | | | |
| j | | Supranational 0.4% | | | | | | | | | | | | | | | | |
| | Inter-American Development Bank, senior bond, 7.50%, 12/05/24 | | | | | | | 200,000,000 | | | | MXN | | | | 9,382,165 | |
| | | | | | | | | | | | | | | | | | |
| | | | | |
| | Total Foreign Government and Agency Securities
(Cost $1,438,265,663) | | | | | | | | | | | | | | | 1,143,759,739 | |
| | | | | | | | | | | | | | | | | | |
| | U.S. Government and Agency Securities 20.3% | | | | | | | | | | | | | | | | |
| | United States 20.3% | | | | | | | | | | | | | | | | |
| | U.S. Treasury Note, | | | | | | | | | | | | | | | | |
| | 1.125%, 9/30/21 | | | | | | | 3,497,000 | | | | | | | | 3,538,392 | |
| | 1.50%, 9/30/21 | | | | | | | 15,768,000 | | | | | | | | 16,030,389 | |
| | 2.125%, 12/31/21 | | | | | | | 3,953,000 | | | | | | | | 4,069,042 | |
| | 1.50%, 10/31/24 | | | | | | | 64,160,000 | | | | | | | | 67,642,434 | |
| | 1.50%, 11/30/24 | | | | | | | 50,420,000 | | | | | | | | 53,199,009 | |
| | 1.75%, 12/31/24 | | | | | | | 22,672,000 | | | | | | | | 24,192,618 | |
| | 2.00%, 2/15/25 | | | | | | | 49,140,000 | | | | | | | | 53,069,281 | |
| | 2.125%, 5/15/25 | | | | | | | 58,760,000 | | | | | | | | 63,994,460 | |
| | 2.875%, 5/31/25 | | | | | | | 76,680,000 | | | | | | | | 86,356,357 | |
| | 2.625%, 12/31/25 | | | | | | | 44,803,000 | | | | | | | | 50,361,372 | |
| | 1.625%, 2/15/26 | | | | | | | 24,220,000 | | | | | | | | 25,916,819 | |
| | 2.125%, 5/31/26 | | | | | | | 11,063,000 | | | | | | | | 12,185,722 | |
| | 1.625%, 10/31/26 | | | | | | | 24,220,000 | | | | | | | | 26,023,255 | |
| | | | | | | | | | | | | | | | | | |
| | | | | |
| | Total U.S. Government and Agency Securities
(Cost $465,062,407) | | | | | | | | | | | | | | | 486,579,150 | |
| | | | | | | | | | | | | | | | | | |
| | | | | Number of
Contracts | | | Notional
Amount# | | | | | | | |
| | Options Purchased 1.5% | | | | | | | | | | | | | | | | |
| | Calls - Over-the-Counter | | | | | | | | | | | | | | | | |
| | Currency Options 1.1% | | | | | | | | | | | | | | | | |
| | AUD/JPY, Counterparty CITI, September Strike Price 79.45 JPY, Expires 9/11/20 | | | 1 | | | | 19,760,000 | | | | AUD | | | | 38,694 | |
| | AUD/JPY, Counterparty CITI, October Strike Price 77.95 JPY, Expires 10/22/20 | | | 1 | | | | 39,519,000 | | | | AUD | | | | 252,366 | |
| | AUD/JPY, Counterparty CITI, October Strike Price 79.00 JPY, Expires 10/29/20 | | | 1 | | | | 16,302,000 | | | | AUD | | | | 75,702 | |
| | AUD/JPY, Counterparty CITI, November Strike Price 84.33 JPY, Expires 11/12/20 | | | 1 | | | | 8,878,000 | | | | AUD | | | | 7,663 | |
| | AUD/JPY, Counterparty CITI, December Strike Price 82.15 JPY, Expires 12/21/20 | | | 1 | | | | 35,514,000 | | | | AUD | | | | 86,477 | |
| | AUD/JPY, Counterparty CITI, January Strike Price 79.00 JPY, Expires 1/22/2 | | | 1 | | | | 26,674,000 | | | | AUD | | | | 212,247 | |
| | AUD/JPY, Counterparty CITI, April Strike Price 72.90 JPY, Expires 4/29/21 | | | 1 | | | | 15,018,000 | | | | AUD | | | | 563,529 | |
| | AUD/JPY, Counterparty CITI, April Strike Price 81.00 JPY, Expires 4/29/21 | | | 1 | | | | 19,266,000 | | | | AUD | | | | 125,770 | |
FRANKLIN TEMPLETON VARIABLE INSURANCE PRODUCTS TRUST
STATEMENT OF INVESTMENTS (UNAUDITED)
Templeton Global Bond VIP Fund (continued)
| | | | | | | | | | | | | | | | | | |
| | | | | Number of
Contracts | | | Notional
Amount# | | | | | | Value | |
| | | | | |
| | Options Purchased (continued) | | | | | | | | | | | | | | | | |
| | Calls - Over-the-Counter (continued) | | | | | | | | | | | | | | | | |
| | Currency Options (continued) | | | | | | | | | | | | | | | | |
| | AUD/JPY, Counterparty CITI, June Strike Price 81.00 JPY, Expires 6/21/21 | | | 1 | | | | 29,640,000 | | | | AUD | | | $ | 237,648 | |
| | AUD/USD, Counterparty HSBK, January Strike Price $0.71, Expires 1/22/21 | | | 1 | | | | 7,904,000 | | | | AUD | | | | 121,019 | |
| | AUD/USD, Counterparty HSBK, February Strike Price $0.75, Expires 2/08/21 | | | 1 | | | | 15,808,000 | | | | AUD | | | | 78,589 | |
| | AUD/USD, Counterparty HSBK, February Strike Price $0.74, Expires 2/10/21 | | | 1 | | | | 18,969,000 | | | | AUD | | | | 111,306 | |
| | AUD/USD, Counterparty MSCO, October Strike Price $0.75, Expires 10/28/20 | | | 1 | | | | 7,904,000 | | | | AUD | | | | 12,838 | |
| | AUD/USD, Counterparty MSCO, May Strike Price $0.77, Expires 5/12/21 | | | 1 | | | | 21,309,000 | | | | AUD | | | | 94,880 | |
| | USD/JPY, Counterparty CITI, September Strike Price 112.24 JPY, Expires 9/22/20 | | | 1 | | | | 38,210,000 | | | | | | | | 48,909 | |
| | USD/JPY, Counterparty CITI, February Strike Price 115.00 JPY, Expires 2/24/21 | | | 1 | | | | 98,607,000 | | | | | | | | 261,309 | |
| | USD/MXN, Counterparty CITI, July Strike Price 21.03 MXN, Expires 7/30/20 | | | 1 | | | | 12,204,000 | | | | | | | | 1,096,297 | |
| | USD/MXN, Counterparty CITI, September Strike Price 21.94 MXN, Expires 9/03/20 | | | 1 | | | | 3,050,000 | | | | | | | | 187,846 | |
| | USD/MXN, Counterparty CITI, September Strike Price 23.21 MXN, Expires 9/03/20 | | | 1 | | | | 6,941,000 | | | | | | | | 203,836 | |
| | USD/MXN, Counterparty CITI, September Strike Price 23.34 MXN, Expires 9/03/20 | | | 1 | | | | 4,083,000 | | | | | | | | 107,534 | |
| | USD/MXN, Counterparty CITI, September Strike Price 31.04 MXN, Expires 9/03/20 | | | 1 | | | | 11,917,000 | | | | | | | | 7,734 | |
| | USD/MXN, Counterparty CITI, September Strike Price 21.91 MXN, Expires 9/08/20 | | | 1 | | | | 21,237,000 | | | | | | | | 1,351,289 | |
| | USD/MXN, Counterparty CITI, September Strike Price 27.34 MXN, Expires 9/24/20 | | | 1 | | | | 37,848,000 | | | | | | | | 158,394 | |
| | USD/MXN, Counterparty CITI, November Strike Price 26.72 MXN, Expires 11/09/20 | | | 1 | | | | 34,941,000 | | | | | | | | 368,313 | |
| | USD/MXN, Counterparty CITI, December Strike Price 23.97 MXN, Expires 12/07/20 | | | 1 | | | | 26,279,000 | | | | | | | | 912,249 | |
| | USD/MXN, Counterparty CITI, February Strike Price 25.49 MXN, Expires 2/11/21 | | | 1 | | | | 49,104,000 | | | | | | | | 1,351,244 | |
| | USD/MXN, Counterparty CITI, March Strike Price 24.62 MXN, Expires 3/24/21 | | | 1 | | | | 22,167,000 | | | | | | | | 897,564 | |
| | USD/MXN, Counterparty CITI, April Strike Price 23.75 MXN, Expires 4/09/21 | | | 1 | | | | 11,742,000 | | | | | | | | 649,943 | |
| | USD/MXN, Counterparty CITI, April Strike Price 25.48 MXN, Expires 4/09/21 | | | 1 | | | | 22,442,000 | | | | | | | | 751,964 | |
| | USD/MXN, Counterparty CITI, April Strike Price 27.45 MXN, Expires 4/28/21 | | | 1 | | | | 69,992,000 | | | | | | | | 1,538,634 | |
| | USD/MXN, Counterparty CITI, June Strike Price 26.09 MXN, Expires 6/18/21 | | | 1 | | | | 23,833,000 | | | | | | | | 831,295 | |
| | USD/MXN, Counterparty CITI, June Strike Price 24.81 MXN, Expires 6/30/21 | | | 1 | | | | 35,754,000 | | | | | | | | 1,857,134 | |
| | USD/MXN, Counterparty CITI, December Strike Price 29.73 MXN, Expires 12/07/21 | | | 1 | | | | 31,535,000 | | | | | | | | 880,552 | |
| | USD/MXN, Counterparty GSCO, July Strike Price 20.00 MXN, Expires 7/31/20 | | | 1 | | | | 11,665,000 | | | | | | | | 1,560,649 | |
| | USD/MXN, Counterparty GSCO, July Strike Price 24.18 MXN, Expires 7/31/20 | | | 1 | | | | 11,665,000 | | | | | | | | 96,330 | |
| | USD/MXN, Counterparty GSCO, March Strike Price 20.62 MXN, Expires 3/03/21 | | | 1 | | | | 7,624,000 | | | | | | | | 1,029,263 | |
| | USD/MXN, Counterparty GSCO, June Strike Price 22.83 MXN, Expires 6/09/21 | | | 1 | | | | 7,291,000 | | | | | | | | 589,543 | |
| | USD/MXN, Counterparty JPHQ, July Strike Price 20.90 MXN, Expires 7/27/20 | | | 1 | | | | 12,571,000 | | | | | | | | 1,187,809 | |
| | USD/MXN, Counterparty JPHQ, September Strike Price 23.25 MXN, Expires 9/22/20 | | | 1 | | | | 16,908,000 | | | | | | | | 539,686 | |
| | USD/MXN, Counterparty JPHQ, December Strike Price 22.30 MXN, Expires 12/04/20 | | | 1 | | | | 25,925,000 | | | | | | | | 1,763,263 | |
FRANKLIN TEMPLETON VARIABLE INSURANCE PRODUCTS TRUST
STATEMENT OF INVESTMENTS (UNAUDITED)
Templeton Global Bond VIP Fund (continued)
| | | | | | | | | | | | | | | | | | |
| | | | | Number of
Contracts | | | Notional
Amount# | | | | | | Value | |
| | | | | |
| | Options Purchased (continued) | | | | | | | | | | | | | | | | |
| | Calls - Over-the-Counter (continued) | | | | | | | | | | | | | | | | |
| | Currency Options (continued) | | | | | | | | | | | | | | | | |
| | USD/MXN, Counterparty JPHQ, December Strike Price 23.25 MXN, Expires 12/23/20 | | | 1 | | | | 19,020,000 | | | | | | | $ | 935,366 | |
| | USD/MXN, Counterparty MSCO, September Strike Price 22.82 MXN, Expires 9/02/20 | | | 1 | | | | 24,211,000 | | | | | | | | 876,172 | |
| | USD/MXN, Counterparty MSCO, September Strike Price 25.02 MXN, Expires 9/02/20 | | | 1 | | | | 8,051,000 | | | | | | | | 72,829 | |
| | USD/MXN, Counterparty MSCO, March Strike Price 28.75 MXN, Expires 3/30/21 | | | 1 | | | | 49,338,000 | | | | | | | | 711,553 | |
| | | | | | | | | | | | | | | | | | |
| | | | | |
| | | | | | | | | | | | | | | | | 24,843,231 | |
| | | | | | | | | | | | | | | | | | |
| | Puts - Over-the-Counter | | | | | | | | | | | | | | | | |
| | Currency Options 0.4% | | | | | | | | | | | | | | | | |
| | AUD/JPY, Counterparty CITI, October Strike Price 67.10 JPY, Expires 10/29/20 | | | 1 | | | | 43,471,000 | | | | AUD | | | | 222,503 | |
| | AUD/JPY, Counterparty CITI, November Strike Price 66.78 JPY, Expires 11/12/20 | | | 1 | | | | 4,439,000 | | | | AUD | | | | 24,534 | |
| | AUD/JPY, Counterparty CITI, November Strike Price 69.18 JPY, Expires 11/12/20 | | | 1 | | | | 2,664,000 | | | | AUD | | | | 22,227 | |
| | AUD/JPY, Counterparty CITI, December Strike Price 65.85 JPY, Expires 12/21/20 | | | 1 | | | | 17,757,000 | | | | AUD | | | | 113,604 | |
| | AUD/JPY, Counterparty CITI, March Strike Price 68.50 JPY, Expires 3/24/21 | | | 1 | | | | 17,783,000 | | | | AUD | | | | 242,657 | |
| | AUD/JPY, Counterparty CITI, April Strike Price 71.00 JPY, Expires 4/29/21 | | | 1 | | | | 51,376,000 | | | | AUD | | | | 1,075,146 | |
| | AUD/JPY, Counterparty CITI, June Strike Price 58.95 JPY, Expires 6/21/21 | | | 1 | | | | 39,520,000 | | | | AUD | | | | 261,235 | |
| | AUD/JPY, Counterparty CITI, June Strike Price 71.44 JPY, Expires 6/21/21 | | | 1 | | | | 39,520,000 | | | | AUD | | | | 981,077 | |
| | AUD/JPY, Counterparty CITI, June Strike Price 69.20 JPY, Expires 6/24/21 | | | 1 | | | | 31,616,000 | | | | AUD | | | | 615,271 | |
| | AUD/USD, Counterparty HSBK, October Strike Price $0.63, Expires 10/27/20 | | | 1 | | | | 15,808,000 | | | | AUD | | | | 53,043 | |
| | AUD/USD, Counterparty HSBK, January Strike Price $0.61, Expires 1/22/21 | | | 1 | | | | 24,503,000 | | | | AUD | | | | 123,743 | |
| | AUD/USD, Counterparty HSBK, February Strike Price $0.65, Expires 2/08/21 | | | 1 | | | | 31,616,000 | | | | AUD | | | | 379,756 | |
| | AUD/USD, Counterparty HSBK, February Strike Price $0.65, Expires 2/10/21 | | | 1 | | | | 37,939,000 | | | | AUD | | | | 404,658 | |
| | AUD/USD, Counterparty HSBK, March Strike Price $0.64, Expires 3/22/21 | | | 1 | | | | 20,946,000 | | | | AUD | | | | 226,055 | |
| | AUD/USD, Counterparty MSCO, October Strike Price $0.67, Expires 10/28/20 | | | 1 | | | | 15,808,000 | | | | AUD | | | | 157,145 | |
| | AUD/USD, Counterparty MSCO, November Strike Price $0.65, Expires 11/19/20 | | | 1 | | | | 33,541,000 | | | | AUD | | | | 235,136 | |
| | AUD/USD, Counterparty MSCO, December Strike Price $0.65, Expires 12/18/20 | | | 1 | | | | 28,653,000 | | | | AUD | | | | 269,058 | |
| | USD/JPY, Counterparty CITI, September Strike Price 100.70 JPY, Expires 9/16/20 | | | 1 | | | | 69,025,000 | | | | | | | | 78,896 | |
| | USD/JPY, Counterparty CITI, September Strike Price 106.75 JPY, Expires 9/22/20 | | | 1 | | | | 76,420,000 | | | | | | | | 630,771 | |
| | USD/JPY, Counterparty CITI, October Strike Price 103.60 JPY, Expires 10/29/20 | | | 1 | | | | 49,304,000 | | | | | | | | 251,450 | |
| | USD/JPY, Counterparty CITI, February Strike Price 105.70 JPY, Expires 2/24/21 | | | 1 | | | | 49,303,000 | | | | | | | | 869,951 | |
| | USD/MXN, Counterparty CITI, September Strike Price 19.11 MXN, Expires 9/03/20 | | | 1 | | | | 23,836,000 | | | | | | | | 4,147 | |
| | USD/MXN, Counterparty CITI, September Strike Price 21.33 MXN, Expires 9/03/20 | | | 1 | | | | 35,756,000 | | | | | | | | 125,361 | |
| | USD/MXN, Counterparty CITI, September Strike Price 20.85 MXN, Expires 9/17/20 | | | 1 | | | | 43,738,000 | | | | | | | | 99,242 | |
FRANKLIN TEMPLETON VARIABLE INSURANCE PRODUCTS TRUST
STATEMENT OF INVESTMENTS (UNAUDITED)
Templeton Global Bond VIP Fund (continued)
| | | | | | | | | | | | | | | | | | |
| | | | | Number of
Contracts | | | Notional
Amount# | | | | | | Value | |
| | | | | |
| | Options Purchased (continued) | | | | | | | | | | | | | | | | |
| | Puts - Over-the-Counter (continued) | | | | | | | | | | | | | | | | |
| | Currency Options (continued) | | | | | | | | | | | | | | | | |
| | USD/MXN, Counterparty CITI, November Strike Price 22.45 MXN, Expires 11/09/20 | | | 1 | | | | 17,471,000 | | | | | | | $ | 352,093 | |
| | USD/MXN, Counterparty CITI, February Strike Price 20.88 MXN, Expires 2/11/21 | | | 1 | | | | 24,552,000 | | | | | | | | 179,328 | |
| | USD/MXN, Counterparty CITI, March Strike Price 20.66 MXN, Expires 3/24/21 | | | 1 | | | | 10,516,000 | | | | | | | | 72,287 | |
| | USD/MXN, Counterparty CITI, April Strike Price 21.20 MXN, Expires 4/09/21 | | | 1 | | | | 24,495,000 | | | | | | | | 272,139 | |
| | USD/MXN, Counterparty GSCO, July Strike Price 20.83 MXN, Expires 7/31/20 | | | 1 | | | | 23,330,000 | | | | | | | | 15,164 | |
| | USD/MXN, Counterparty GSCO, July Strike Price 22.03 MXN, Expires 7/31/20 | | | 1 | | | | 10,459,000 | | | | | | | | 54,565 | |
| | USD/MXN, Counterparty GSCO, August Strike Price 22.45 MXN, Expires 8/31/20 | | | 1 | | | | 8,163,000 | | | | | | | | 113,433 | |
| | USD/MXN, Counterparty GSCO, August Strike Price 20.30 MXN, Expires 8/31/20 | | | 1 | | | | 8,730,000 | | | | | | | | 6,713 | |
| | USD/MXN, Counterparty GSCO, September Strike Price 23.73 MXN, Expires 9/30/20 | | | 1 | | | | 23,330,000 | | | | | | | | 1,012,755 | |
| | USD/MXN, Counterparty GSCO, March Strike Price 18.65 MXN, Expires 3/03/21 | | | 1 | | | | 7,624,000 | | | | | | | | 8,325 | |
| | USD/MXN, Counterparty GSCO, June Strike Price 22.83 MXN, Expires 6/09/21 | | | 1 | | | | 7,291,000 | | | | | | | | 254,711 | |
| | USD/MXN, Counterparty MSCO, September Strike Price 20.11 MXN, Expires 9/02/20 | | | 1 | | | | 24,211,000 | | | | | | | | 15,447 | |
| | USD/MXN, Counterparty MSCO, September Strike Price 20.64 MXN, Expires 9/10/20 | | | 1 | | | | 14,301,000 | | | | | | | | 22,495 | |
| | USD/MXN, Counterparty MSCO, September Strike Price 20.13 MXN, Expires 9/22/20 | | | 1 | | | | 25,142,000 | | | | | | | | 24,061 | |
| | USD/MXN, Counterparty MSCO, September Strike Price 22.46 MXN, Expires 9/22/20 | | | 1 | | | | 7,678,000 | | | | | | | | 124,645 | |
| | | | | | | | | | | | | | | | | | |
| | | | | |
| | | | | | | | | | | | | | | | | 9,994,827 | |
| | | | | | | | | | | | | | | | | | |
| | | | | |
| | Total Options Purchased
(Cost $41,855,242) | | | | | | | | | | | | | | | 34,838,058 | |
| | | | | | | | | | | | | | | | | | |
| | | | | |
| | Total Investments before Short Term Investments
(Cost $1,945,183,312) | | | | | | | | | | | | | | | 1,665,176,947 | |
| | | | | | | | | | | | | | | | | | |
| | | | | | | | Principal
Amount* | | | | | | | |
| | Short Term Investments 30.8% | | | | | | | | | | | | | | | | |
| | | | | |
| | Foreign Government and Agency Securities 7.4% | | | | | | | | | | | | | | | | |
| | | | | |
| | Argentina 0.3% | | | | | | | | | | | | | | | | |
| a,b | | Argentina Treasury Bond BONCER, Index Linked, 1.10%, 4/17/21 | | | | | | | 279,926,000 | | | | ARS | | | | 2,724,843 | |
| a,b | | Letras de la Nacion Argentina con Ajuste por CER, Index Linked, 0.00%, 12/04/20 | | | | | | | 345,512,200 | | | | ARS | | | | 3,401,141 | |
| | | | | | | | | | | | | | | | | | |
| | | | | |
| | | | | | | | | | | | | | | | | 6,125,984 | |
| | | | | | | | | | | | | | | | | | |
| | | | | |
| | Brazil 1.3% | | | | | | | | | | | | | | | | |
| | Letra Tesouro Nacional, Strip, 10/01/20 | | | | | | | 166,070d | | | | BRL | | | | 30,385,330 | |
| | | | | | | | | | | | | | | | | | |
FRANKLIN TEMPLETON VARIABLE INSURANCE PRODUCTS TRUST
STATEMENT OF INVESTMENTS (UNAUDITED)
Templeton Global Bond VIP Fund (continued)
| | | | | | | | | | | | | | | | | | |
| | | | | | | | Principal
Amount* | | | | | | Value | |
| | | | | |
| | Short Term Investments (continued) | | | | | | | | | | | | | | | | |
| | | | | |
| | Foreign Government and Agency Securities (continued) | | | | | | | | | | | | | | | | |
| | | | | |
| | Japan 5.2% | | | | | | | | | | | | | | | | |
| k | | Japan Treasury Discount Bill, | | | | | | | | | | | | | | | | |
| | 7/06/20 | | | | | | | 5,427,000,000 | | | | JPY | | | $ | 50,262,439 | |
| | 7/10/20 - 10/12/20 | | | | | | | 7,969,900,000 | | | | JPY | | | | 73,833,146 | |
| | | | | | | | | | | | | | | | | | |
| | | | | | | | | | | | | | | | | 124,095,585 | |
| | | | | | | | | | | | | | | | | | |
| | Mexico 0.5% | | | | | | | | | | | | | | | | |
| k | | Mexico Treasury Bill, 7/16/20 - 10/22/20 | | | | | | | 28,120,440l | | | | MXN | | | | 12,128,917 | |
| | | | | | | | | | | | | | | | | | |
| | Norway 0.1% | | | | | | | | | | | | | | | | |
| h,i,k | | Norway Treasury Bill, 144A, Reg S, 9/16/20 | | | | | | | 28,866,000 | | | | NOK | | | | 2,997,979 | |
| | | | | | | | | | | | | | | | | | |
| | | | | |
| | Total Foreign Government and Agency Securities
(Cost $177,699,512) | | | | | | | | | | | | | | | 175,733,795 | |
| | | | | | | | | | | | | | | | | | |
| | | | | |
| | U.S. Government and Agency Securities 10.1% | | | | | | | | | | | | | | | | |
| | United States 10.1% | | | | | | | | | | | | | | | | |
| k | | U.S. Treasury Bill, | | | | | | | | | | | | | | | | |
| | 7/16/20 | | | | | | | 64,460,000 | | | | | | | | 64,457,213 | |
| | 8/06/20 | | | | | | | 113,820,000 | | | | | | | | 113,806,626 | |
| | 9/10/20 | | | | | | | 64,460,000 | | | | | | | | 64,444,427 | |
| | | | | | | | | | | | | | | | | | |
| | | | | |
| | Total U.S. Government and Agency Securities
(Cost $242,709,226) | | | | | | | | | | | | | | | 242,708,266 | |
| | | | | | | | | | | | | | | | | | |
| | | | | |
| | Total Investments before Money Market Funds
(Cost $2,365,592,050) | | | | | | | | | | | | | | | 2,083,619,008 | |
| | | | | | | | | | | | | | | | | | |
| | | | | | | | Shares | | | | | | | |
| | Money Market Funds (Cost $318,975,444) 13.3% | | | | | | | | | | | | | | | | |
| | United States 13.3% | | | | | | | | | | | | | | | | |
| m,n | | Institutional Fiduciary Trust Money Market Portfolio, 0.00% | | | | | | | 318,975,444 | | | | | | | | 318,975,444 | |
| | | | | | | | | | | | | | | | | | |
| | | | | |
| | Total Investments (Cost $2,684,567,494) 100.4% | | | | | | | | | | | | | | | 2,402,594,452 | |
| | | | | |
| | Options Written (1.3)% | | | | | | | | | | | | | | | (30,318,364 | ) |
| | | | | |
| | Other Assets, less Liabilities 0.9% | | | | | | | | | | | | | | | 20,001,366 | |
| | | | | | | | | | | | | | | | | | |
| | | | | |
| | Net Assets 100.0% | | | | | | | | | | | | | | $ | 2,392,277,454 | |
| | | | | | | | | | | | | | | | | | |
| | | | | Number of
Contracts | | | Notional
Amount# | | | | | | | |
| o | | Options Written (1.3)% | | | | | | | | | | | | | | | | |
| | Calls - Over-the-Counter | | | | | | | | | | | | | | | | |
| | Currency Options (0.8)% | | | | | | | | | | | | | | | | |
| | AUD/JPY, Counterparty CITI, September Strike Price 75.80 JPY, Expires 9/11/20 | | | 1 | | | | 19,760,000 | | | | AUD | | | | (194,617 | ) |
| | AUD/JPY, Counterparty CITI, October Strike Price 71.60 JPY, Expires 10/29/20 | | | 1 | | | | 32,603,000 | | | | AUD | | | | (1,231,052 | ) |
| | AUD/JPY, Counterparty CITI, December Strike Price 75.70 JPY, Expires 12/21/20 | | | 1 | | | | 35,514,000 | | | | AUD | | | | (620,213 | ) |
FRANKLIN TEMPLETON VARIABLE INSURANCE PRODUCTS TRUST
STATEMENT OF INVESTMENTS (UNAUDITED)
Templeton Global Bond VIP Fund (continued)
| | | | | | | | | | | | | | | | | | |
| | | | | Number of
Contracts | | | Notional
Amount# | | | | | | Value | |
| | | | | |
| o | | Options Written (continued) | | | | | | | | | | | | | | | | |
| | Calls - Over-the-Counter (continued) | | | | | | | | | | | | | | | | |
| | Currency Options (continued) | | | | | | | | | | | | | | | | |
| | AUD/JPY, Counterparty CITI, January Strike Price 76.00 JPY, Expires 1/22/21 | | | 1 | | | | 26,674,000 | | | | AUD | | | $ | (473,323 | ) |
| | AUD/JPY, Counterparty CITI, January Strike Price 76.95 JPY, Expires 1/22/21 | | | 1 | | | | 31,616,000 | | | | AUD | | | | (442,475 | ) |
| | AUD/JPY, Counterparty CITI, April Strike Price 71.75 JPY, Expires 4/29/21 | | | 1 | | | | 38,532,000 | | | | AUD | | | | (1,722,736 | ) |
| | AUD/JPY, Counterparty CITI, June Strike Price 78.00 JPY, Expires 6/21/21 | | | 1 | | | | 29,640,000 | | | | AUD | | | | (465,826 | ) |
| | AUD/USD, Counterparty HSBK, October Strike Price $0.67, Expires 10/27/20 | | | 1 | | | | 23,712,000 | | | | AUD | | | | (760,734 | ) |
| | AUD/USD, Counterparty HSBK, November Strike Price $0.71, Expires 11/05/20 | | | 1 | | | | 11,838,000 | | | | AUD | | | | (98,566 | ) |
| | AUD/USD, Counterparty HSBK, January Strike Price $0.67, Expires 1/22/21 | | | 1 | | | | 24,503,000 | | | | AUD | | | | (823,222 | ) |
| | AUD/USD, Counterparty HSBK, February Strike Price $0.69, Expires 2/08/21 | | | 1 | | | | 15,808,000 | | | | AUD | | | | (362,577 | ) |
| | AUD/USD, Counterparty HSBK, February Strike Price $0.69, Expires 2/10/21 | | | 1 | | | | 18,969,000 | | | | AUD | | | | (496,831 | ) |
| | AUD/USD, Counterparty HSBK, May Strike Price $0.78, Expires 5/05/21 | | | 1 | | | | 19,730,000 | | | | AUD | | | | (68,817 | ) |
| | AUD/USD, Counterparty MSCO, August Strike Price $0.69, Expires 8/12/20 | | | 1 | | | | 14,674,000 | | | | AUD | | | | (121,400 | ) |
| | AUD/USD, Counterparty MSCO, August Strike Price $0.70, Expires 8/12/20 | | | 1 | | | | 10,236,000 | | | | AUD | | | | (82,310 | ) |
| | AUD/USD, Counterparty MSCO, October Strike Price $0.72, Expires 10/28/20 | | | 1 | | | | 7,904,000 | | | | AUD | | | | (45,577 | ) |
| | AUD/USD, Counterparty MSCO, May Strike Price $0.74, Expires 5/12/21 | | | 1 | | | | 42,617,000 | | | | AUD | | | | (390,126 | ) |
| | USD/JPY, Counterparty CITI, September Strike Price 107.50 JPY, Expires 9/16/20 | | | 1 | | | | 39,442,000 | | | | | | | | (529,351 | ) |
| | USD/JPY, Counterparty CITI, September Strike Price 108.77 JPY, Expires 9/22/20 | | | 1 | | | | 76,420,000 | | | | | | | | (602,495 | ) |
| | USD/JPY, Counterparty CITI, February Strike Price 110.50 JPY, Expires 2/24/21 | | | 1 | | | | 98,607,000 | | | | | | | | (1,020,583 | ) |
| | USD/MXN, Counterparty CITI, November Strike Price 31.74 MXN, Expires 11/09/20 | | | 1 | | | | 17,471,000 | | | | | | | | (47,224 | ) |
| | USD/MXN, Counterparty CITI, December Strike Price 23.46 MXN, Expires 12/07/20 | | | 1 | | | | 8,760,000 | | | | | | | | (373,623 | ) |
| | USD/MXN, Counterparty CITI, December Strike Price 25.43 MXN, Expires 12/07/20 | | | 1 | | | | 8,760,000 | | | | | | | | (174,359 | ) |
| | USD/MXN, Counterparty CITI, February Strike Price 29.11 MXN, Expires 2/11/21 | | | 1 | | | | 36,827,000 | | | | | | | | (398,137 | ) |
| | USD/MXN, Counterparty CITI, March Strike Price 25.87 MXN, Expires 3/24/21 | | | 1 | | | | 17,883,000 | | | | | | | | (505,821 | ) |
| | USD/MXN, Counterparty CITI, March Strike Price 31.07 MXN, Expires 3/24/21 | | | 1 | | | | 8,867,000 | | | | | | | | (77,125 | ) |
| | USD/MXN, Counterparty CITI, April Strike Price 27.24 MXN, Expires 4/09/21 | | | 1 | | | | 22,442,000 | | | | | | | | (480,393 | ) |
| | USD/MXN, Counterparty CITI, June Strike Price 28.24 MXN, Expires 6/18/21 | | | 1 | | | | 23,833,000 | | | | | | | | (522,086 | ) |
| | USD/MXN, Counterparty CITI, June Strike Price 28.40 MXN, Expires 6/30/21 | | | 1 | | | | 23,836,000 | | | | | | | | (547,990 | ) |
| | USD/MXN, Counterparty CITI, December Strike Price 27.93 MXN, Expires 12/07/21 | | | 1 | | | | 10,512,000 | | | | | | | | (394,105 | ) |
| | USD/MXN, Counterparty GSCO, July Strike Price 22.03 MXN, Expires 7/31/20 | | | 1 | | | | 10,459,000 | | | | | | | | (534,675 | ) |
| | USD/MXN, Counterparty GSCO, July Strike Price 22.94 MXN, Expires 7/31/20 | | | 1 | | | | 11,665,000 | | | | | | | | (291,613 | ) |
| | USD/MXN, Counterparty GSCO, July Strike Price 23.32 MXN, Expires 7/31/20 | | | 1 | | | | 11,665,000 | | | | | | | | (209,585 | ) |
| | USD/MXN, Counterparty GSCO, August Strike Price 22.45 MXN, Expires 8/31/20 | | | 1 | | | | 8,163,000 | | | | | | | | (368,037 | ) |
| | USD/MXN, Counterparty GSCO, August Strike Price 24.62 MXN, Expires 8/31/20 | | | 1 | | | | 8,730,000 | | | | | | | | (96,702 | ) |
| | USD/MXN, Counterparty GSCO, June Strike Price 30.36 MXN, Expires 6/09/21 | | | 1 | | | | 7,291,000 | | | | | | | | (104,524 | ) |
| | USD/MXN, Counterparty JPHQ, July Strike Price 22.30 MXN, Expires 7/27/20 | | | 1 | | | | 12,571,000 | | | | | | | | (508,660 | ) |
FRANKLIN TEMPLETON VARIABLE INSURANCE PRODUCTS TRUST
STATEMENT OF INVESTMENTS (UNAUDITED)
Templeton Global Bond VIP Fund (continued)
| | | | | | | | | | | | | | | | | | |
| | | | | Number of
Contracts | | | Notional
Amount# | | | | | | Value | |
| | | | | |
| o | | Options Written (continued) | | | | | | | | | | | | | | | | |
| | Calls - Over-the-Counter (continued) | | | | | | | | | | | | | | | | |
| | Currency Options (continued) | | | | | | | | | | | | | | | | |
| | USD/MXN, Counterparty JPHQ, September Strike Price 24.90 MXN, Expires 9/22/20 | | | 1 | | | | 8,454,000 | | | | | | | $ | (107,873 | ) |
| | USD/MXN, Counterparty MSCO, September Strike Price 23.31 MXN, Expires 9/02/20 | | | 1 | | | | 24,211,000 | | | | | | | | (640,526 | ) |
| | USD/MXN, Counterparty MSCO, September Strike Price 22.46 MXN, Expires 9/10/20 | | | 1 | | | | 4,767,000 | | | | | | | | (225,803 | ) |
| | USD/MXN, Counterparty MSCO, September Strike Price 22.46 MXN, Expires 9/22/20 | | | 1 | | | | 7,678,000 | | | | | | | | (380,645 | ) |
| | USD/MXN, Counterparty MSCO, March Strike Price 34.23 MXN, Expires 3/30/21 | | | 1 | | | | 32,892,000 | | | | | | | | (178,242 | ) |
| | | | | | | | | | | | | | | | | | |
| | | | | | | | | | | | | | | | | (17,720,579 | ) |
| | | | | | | | | | | | | | | | | | |
| | Puts - Over-the-Counter | | | | | | | | | | | | | | | | |
| | Currency Options (0.5)% | | | | | | | | | | | | | | | | |
| | AUD/JPY, Counterparty CITI, October Strike Price 62.80 JPY, Expires 10/29/20 | | | 1 | | | | 21,735,000 | | | | AUD | | | | (53,375 | ) |
| | AUD/JPY, Counterparty CITI, April Strike Price 66.00 JPY, Expires 4/29/21 | | | 1 | | | | 25,688,000 | | | | AUD | | | | (297,970 | ) |
| | AUD/JPY, Counterparty CITI, April Strike Price 72.90 JPY, Expires 4/29/21 | | | 1 | | | | 15,018,000 | | | | AUD | | | | (397,451 | ) |
| | AUD/JPY, Counterparty CITI, June Strike Price 64.86 JPY, Expires 6/21/21 | | | 1 | | | | 59,280,000 | | | | AUD | | | | (716,256 | ) |
| | AUD/USD, Counterparty HSBK, January Strike Price $0.52, Expires 1/22/21 | | | 1 | | | | 11,856,000 | | | | AUD | | | | (11,502 | ) |
| | AUD/USD, Counterparty HSBK, January Strike Price $0.63, Expires 1/27/21 | | | 1 | | | | 10,457,000 | | | | AUD | | | | (68,315 | ) |
| | AUD/USD, Counterparty HSBK, March Strike Price $0.59, Expires 3/22/21 | | | 1 | | | | 8,497,000 | | | | AUD | | | | (33,683 | ) |
| | AUD/USD, Counterparty MSCO, August Strike Price $0.63, Expires 8/12/20 | | | 1 | | | | 10,482,000 | | | | AUD | | | | (8,108 | ) |
| | AUD/USD, Counterparty MSCO, August Strike Price $0.64, Expires 8/12/20 | | | 1 | | | | 8,386,000 | | | | AUD | | | | (9,524 | ) |
| | AUD/USD, Counterparty MSCO, August Strike Price $0.68, Expires 8/12/20 | | | 1 | | | | 10,276,000 | | | | AUD | | | | (61,502 | ) |
| | USD/JPY, Counterparty CITI, September Strike Price 89.80 JPY, Expires 9/16/20 | | | 1 | | | | 34,512,000 | | | | | | | | (3,555 | ) |
| | USD/JPY, Counterparty CITI, September Strike Price 102.25 JPY, Expires 9/22/20 | | | 1 | | | | 38,210,000 | | | | | | | | (76,917 | ) |
| | USD/JPY, Counterparty CITI, October Strike Price 106.00 JPY, Expires 10/29/20 | | | 1 | | | | 49,304,000 | | | | | | | | (458,034 | ) |
| | USD/MXN, Counterparty CITI, July Strike Price 23.10 MXN, Expires 7/30/20 | | | 1 | | | | 8,749,000 | | | | | | | | (184,455 | ) |
| | USD/MXN, Counterparty CITI, September Strike Price 22.93 MXN, Expires 9/03/20 | | | 1 | | | | 23,838,000 | | | | | | | | (549,895 | ) |
| | USD/MXN, Counterparty CITI, September Strike Price 23.21 MXN, Expires 9/03/20 | | | 1 | | | | 6,941,000 | | | | | | | | (203,836 | ) |
| | USD/MXN, Counterparty CITI, September Strike Price 23.34 MXN, Expires 9/03/20 | | | 1 | | | | 4,083,000 | | | | | | | | (134,323 | ) |
| | USD/MXN, Counterparty CITI, September Strike Price 21.91 MXN, Expires 9/08/20 | | | 1 | | | | 21,237,000 | | | | | | | | (169,259 | ) |
| | USD/MXN, Counterparty CITI, September Strike Price 20.06 MXN, Expires 9/17/20 | | | 1 | | | | 21,869,000 | | | | | | | | (17,714 | ) |
| | USD/MXN, Counterparty CITI, September Strike Price 22.40 MXN, Expires 9/17/20 | | | 1 | | | | 21,869,000 | | | | | | | | (321,124 | ) |
| | USD/MXN, Counterparty CITI, September Strike Price 24.20 MXN, Expires 9/24/20 | | | 1 | | | | 10,516,000 | | | | | | | | (630,907 | ) |
| | USD/MXN, Counterparty CITI, November Strike Price 23.88 MXN, Expires 11/09/20 | | | 1 | | | | 34,941,000 | | | | | | | | (1,868,819 | ) |
FRANKLIN TEMPLETON VARIABLE INSURANCE PRODUCTS TRUST
STATEMENT OF INVESTMENTS (UNAUDITED)
Templeton Global Bond VIP Fund (continued)
| | | | | | | | | | | | | | | | | | |
| | | | | Number of
Contracts | | | Notional
Amount# | | | | | | Value | |
| | | | | |
| o | | Options Written (continued) | | | | | | | | | | | | | | | | |
| | Puts - Over-the-Counter (continued) | | | | | | | | | | | | | | | | |
| | Currency Options (continued) | | | | | | | | | | | | | | | | |
| | USD/MXN, Counterparty CITI, February Strike Price 22.92 MXN, Expires 2/11/21 | | | 1 | | | | 36,827,000 | | | | | | | $ | (1,241,328 | ) |
| | USD/MXN, Counterparty CITI, April Strike Price 22.71 MXN, Expires 4/09/21 | | | 1 | | | | 24,495,000 | | | | | | | | (767,306 | ) |
| | USD/MXN, Counterparty CITI, April Strike Price 23.02 MXN, Expires 4/28/21 | | | 1 | | | | 34,996,000 | | | | | | | | (1,328,623 | ) |
| | USD/MXN, Counterparty CITI, June Strike Price 20.24 MXN, Expires 6/30/21 | | | 1 | | | | 11,918,000 | | | | | | | | (74,523 | ) |
| | USD/MXN, Counterparty GSCO, August Strike Price 21.54 MXN, Expires 8/31/20 | | | 1 | | | | 8,730,000 | | | | | | | | (38,648 | ) |
| | USD/MXN, Counterparty GSCO, September Strike Price 22.40 MXN, Expires 9/30/20 | | | 1 | | | | 46,660,000 | | | | | | | | (670,971 | ) |
| | USD/MXN, Counterparty GSCO, March Strike Price 19.80 MXN, Expires 3/03/21 | | | 1 | | | | 7,624,000 | | | | | | | | (23,070 | ) |
| | USD/MXN, Counterparty GSCO, June Strike Price 19.61 MXN, Expires 6/09/21 | | | 1 | | | | 7,291,000 | | | | | | | | (28,260 | ) |
| | USD/MXN, Counterparty JPHQ, December Strike Price 22.30 MXN, Expires 12/04/20 | | | 1 | | | | 25,925,000 | | | | | | | | (498,615 | ) |
| | USD/MXN, Counterparty JPHQ, December Strike Price 23.25 MXN, Expires 12/23/20 | | | 1 | | | | 19,020,000 | | | | | | | | (743,454 | ) |
| | USD/MXN, Counterparty MSCO, September Strike Price 21.23 MXN, Expires 9/02/20 | | | 1 | | | | 18,669,000 | | | | | | | | (56,436 | ) |
| | USD/MXN, Counterparty MSCO, September Strike Price 21.50 MXN, Expires 9/10/20 | | | 1 | | | | 14,301,000 | | | | | | | | (69,203 | ) |
| | USD/MXN, Counterparty MSCO, September Strike Price 21.68 MXN, Expires 9/22/20 | | | 1 | | | | 25,142,000 | | | | | | | | (171,418 | ) |
| | USD/MXN, Counterparty MSCO, March Strike Price 23.03 MXN, Expires 3/30/21 | | | 1 | | | | 16,446,000 | | | | | | | | (609,406 | ) |
| | | | | | | | | | | | | | | | | | |
| | | | | | | | | | | | | | | | | (12,597,785 | ) |
| | | | | | | | | | | | | | | | | | |
| | | | | |
| | Total Options Written (Premiums received $27,270,984) | | | | | | | | | | | | | | | (30,318,364 | ) |
| | | | | | | | | | | | | | | | | | |
FRANKLIN TEMPLETON VARIABLE INSURANCE PRODUCTS TRUST
STATEMENT OF INVESTMENTS (UNAUDITED)
Templeton Global Bond VIP Fund (continued)
*The principal amount is stated in U.S. dollars unless otherwise indicated.
#Notional amount is the number of units specified in the contract, and can include currency units, bushels, shares, pounds, barrels or other units. Currency units are stated in U.S. dollars unless otherwise indicated.
aSecurities denominated in Argentine Peso have been designated as Level 3 investments. See Note 12 regarding fair value measurements.
bRedemption price at maturity is adjusted for inflation. See Note 1(g).
cThe coupon rate shown represents the rate at period end.
dPrincipal amount is stated in 1,000 Brazilian Real Units.
ePrincipal amount is stated in 100 Mexican Peso Units.
fPrincipal amount of security is adjusted for inflation. See Note 1(g).
gPrincipal amount is stated in 100 Unidad de Inversion Units.
hSecurity was purchased pursuant to Rule 144A under the Securities Act of 1933 and may be sold in transactions exempt from registration only to qualified institutional buyers or in a public offering registered under the Securities Act of 1933. At June 30, 2020, the aggregate value of these securities was $119,641,268, representing 5.0% of net assets.
iSecurity was purchased pursuant to Regulation S under the Securities Act of 1933, which exempts from registration securities offered and sold outside of the United States. Such a security cannot be sold in the United States without either an effective registration statement filed pursuant to the Securities Act of 1933, or pursuant to an exemption from registration. At June 30, 2020, the aggregate value of these securities was $119,641,268, representing 5.0% of net assets.
jA supranational organization is an entity formed by two or more central governments through international treaties.
kThe security was issued on a discount basis with no stated coupon rate.
lPrincipal amount is stated in 10 Mexican Peso Units.
mSee Note 3(e) regarding investments in affiliated management investment companies.
nThe rate shown is the annualized seven-day effective yield at period end.
oSee Note 1(c) regarding written options.
At June 30, 2020, the Fund had the following forward exchange contracts outstanding. See 1(c).
| | | | | | | | | | | | | | | | | | | | | | | | | | | | |
| Forward Exchange Contracts | |
| | | | | | | |
| Currency | | Counterpartya | | | Type | | | Quantity | | | Contract Amount* | | | Settlement
Date | | | Unrealized
Appreciation | | | Unrealized
Depreciation | |
|
| OTC Forward Exchange Contracts | |
Brazilian Real | | | CITI | | | | Buy | | | | 107,801,461 | | | | 19,885,899 | | | | 7/02/20 | | | $ | — | | | $ | (59,590 | ) |
Brazilian Real | | | CITI | | | | Buy | | | | 206,375,000 | | | | 36,375,253 | EUR | | | 7/02/20 | | | | — | | | | (2,910,504 | ) |
Brazilian Real | | | CITI | | | | Sell | | | | 42,892,761 | | | | 7,406,375 | | | | 7/02/20 | | | | — | | | | (482,249 | ) |
Brazilian Real | | | CITI | | | | Sell | | | | 64,908,700 | | | | 12,516,622 | | | | 7/02/20 | | | | 578,936 | | | | — | |
Brazilian Real | | | CITI | | | | Sell | | | | 206,375,000 | | | | 33,607,185 | EUR | | | 7/02/20 | | | | — | | | | (199,298 | ) |
Brazilian Real | | | HSBK | | | | Buy | | | | 93,532,700 | | | | 17,146,233 | | | | 7/02/20 | | | | 55,837 | | | | — | |
Brazilian Real | | | HSBK | | | | Sell | | | | 93,532,700 | | | | 18,459,843 | | | | 7/02/20 | | | | 1,257,773 | | | | — | |
Brazilian Real | | | JPHQ | | | | Buy | | | | 147,867,600 | | | | 27,251,677 | | | | 7/02/20 | | | | — | | | | (56,602 | ) |
Brazilian Real | | | JPHQ | | | | Sell | | | | 147,867,600 | | | | 29,149,224 | | | | 7/02/20 | | | | 1,954,148 | | | | — | |
South Korean Won | | | DBAB | | | | Sell | | | | 13,919,000,000 | | | | 11,570,241 | | | | 7/06/20 | | | | — | | | | (33,161 | ) |
Brazilian Real | | | JPHQ | | | | Sell | | | | 147,867,600 | | | | 27,241,134 | | | | 7/09/20 | | | | 54,692 | | | | — | |
Australian Dollar | | | HSBK | | | | Sell | | | | 14,684,959 | | | | 1,102,253,022 | JPY | | | 7/13/20 | | | | 76,121 | | | | — | |
Australian Dollar | | | JPHQ | | | | Sell | | | | 22,450,754 | | | | 1,688,925,318 | JPY | | | 7/13/20 | | | | 151,313 | | | | — | |
Australian Dollar | | | JPHQ | | | | Sell | | | | 25,330,000 | | | | 1,891,479,755 | JPY | | | 7/14/20 | | | | 40,658 | | | | — | |
Brazilian Real | | | CITI | | | | Sell | | | | 107,801,461 | | | | 19,875,267 | | | | 7/15/20 | | | | 60,643 | | | | — | |
Brazilian Real | | | HSBK | | | | Sell | | | | 93,532,700 | | | | 17,138,064 | | | | 7/15/20 | | | | — | | | | (53,867 | ) |
Swedish Krona | | | DBAB | | | | Buy | | | | 416,064,650 | | | | 38,822,999 | EUR | | | 7/15/20 | | | | 1,024,135 | | | | — | |
Norwegian Krone | | | JPHQ | | | | Buy | | | | 198,445,700 | | | | 18,305,288 | EUR | | | 7/16/20 | | | | 51,432 | | | | — | |
South Korean Won | | | HSBK | | | | Sell | | | | 13,984,825,441 | | | | 12,171,831 | | | | 7/17/20 | | | | 512,165 | | | | — | |
Euro | | | UBSW | | | | Buy | | | | 1,922,305 | | | | 2,166,765 | | | | 7/23/20 | | | | — | | | | (6,025 | ) |
Euro | | | UBSW | | | | Sell | | | | 1,922,305 | | | | 2,182,681 | | | | 7/23/20 | | | | 21,942 | | | | — | |
South Korean Won | | | HSBK | | | | Sell | | | | 39,774,174,559 | | | | 32,296,029 | | | | 7/28/20 | | | | — | | | | (869,126 | ) |
South Korean Won | | | HSBK | | | | Sell | | | | 24,029,880,977 | | | | 19,597,032 | | | | 7/29/20 | | | | — | | | | (440,175 | ) |
Euro | | | CITI | | | | Sell | | | | 40,213,773 | | | | 4,737,280,517 | JPY | | | 7/31/20 | | | | — | | | | (1,318,635 | ) |
FRANKLIN TEMPLETON VARIABLE INSURANCE PRODUCTS TRUST
STATEMENT OF INVESTMENTS (UNAUDITED)
Templeton Global Bond VIP Fund (continued)
| | | | | | | | | | | | | | | | | | | | | | | | | | | | |
| Forward Exchange Contracts (continued) | |
| | | | | | | |
| Currency | | Counterpartya | | | Type | | | Quantity | | | Contract Amount* | | | Settlement
Date | | | Unrealized
Appreciation | | | Unrealized
Depreciation | |
|
| OTC Forward Exchange Contracts (continued) | |
Brazilian Real | | | CITI | | | | Sell | | | | 42,960,900 | | | | 7,406,375 | | | | 8/04/20 | | | $ | — | | | $ | (483,054 | ) |
Brazilian Real | | | HSBK | | | | Sell | | | | 40,142,900 | | | | 7,652,972 | | | | 8/04/20 | | | | 281,046 | | | | — | |
Brazilian Real | | | HSBK | | | | Sell | | | | 54,206,239 | | | | 9,497,869 | | | | 8/04/20 | | | | — | | | | (456,677 | ) |
Brazilian Real | | | JPHQ | | | | Sell | | | | 193,543,900 | | | | 38,701,031 | | | | 8/04/20 | | | | 3,158,227 | | | | — | |
South Korean Won | | | DBAB | | | | Sell | | | | 13,920,000,000 | | | | 11,743,862 | | | | 8/07/20 | | | | 137,240 | | | | — | |
Swiss Franc | | | UBSW | | | | Buy | | | | 8,689,106 | | | | 8,259,018 | EUR | | | 8/10/20 | | | | — | | | | (104,649 | ) |
Swiss Franc | | | UBSW | | | | Buy | | | | 34,756,424 | | | | 32,085,555 | EUR | | | 8/10/20 | | | | 650,254 | | | | — | |
South Korean Won | �� | | HSBK | | | | Sell | | | | 75,818,000,000 | | | | 62,145,902 | | | | 8/11/20 | | | | — | | | | (1,070,112 | ) |
Swiss Franc | | | GSCO | | | | Buy | | | | 34,110,076 | | | | 31,546,498 | EUR | | | 8/12/20 | | | | 573,953 | | | | — | |
Swedish Krona | | | DBAB | | | | Buy | | | | 416,064,600 | | | | 39,213,964 | EUR | | | 8/13/20 | | | | 571,158 | | | | — | |
Swiss Franc | | | GSCO | | | | Buy | | | | 17,055,038 | | | | 16,229,755 | EUR | | | 8/13/20 | | | | — | | | | (226,249 | ) |
Euro | | | HSBK | | | | Buy | | | | 1,800,000 | | | | 2,035,908 | | | | 8/14/20 | | | | — | | | | (11,642 | ) |
Euro | | | HSBK | | | | Sell | | | | 1,800,000 | | | | 1,961,352 | | | | 8/14/20 | | | | — | | | | (62,914 | ) |
Australian Dollar | | | JPHQ | | | | Sell | | | | 45,472,501 | | | | 3,268,860,463 | JPY | | | 8/21/20 | | | | — | | | | (1,093,242 | ) |
Australian Dollar | | | CITI | | | | Sell | | | | 35,607,467 | | | | 2,527,369,963 | JPY | | | 8/24/20 | | | | — | | | | (1,154,961 | ) |
Australian Dollar | | | JPHQ | | | | Sell | | | | 52,305,500 | | | | 3,724,936,182 | JPY | | | 8/24/20 | | | | — | | | | (1,582,003 | ) |
Euro | | | HSBK | | | | Sell | | | | 50,507,118 | | | | 5,965,867,876 | JPY | | | 8/24/20 | | | | — | | | | (1,520,739 | ) |
Australian Dollar | | | JPHQ | | | | Sell | | | | 52,305,500 | | | | 3,860,368,198 | JPY | | | 8/25/20 | | | | — | | | | (326,463 | ) |
Euro | | | HSBK | | | | Sell | | | | 25,253,559 | | | | 3,061,640,442 | JPY | | | 8/25/20 | | | | — | | | | (31,181 | ) |
Australian Dollar | | | CITI | | | | Sell | | | | 3,372,533 | | | | 239,109,190 | JPY | | | 8/26/20 | | | | — | | | | (111,836 | ) |
Indian Rupee | | | HSBK | | | | Sell | | | | 640,300,000 | | | | 8,350,069 | | | | 8/26/20 | | | | — | | | | (73,989 | ) |
Japanese Yen | | | JPHQ | | | | Buy | | | | 2,297,117,500 | | | | 21,362,275 | | | | 8/26/20 | | | | — | | | | (72,169 | ) |
Indian Rupee | | | SCNY | | | | Sell | | | | 945,558,000 | | | | 12,949,745 | | | | 8/27/20 | | | | 510,975 | | | | — | |
Japanese Yen | | | JPHQ | | | | Buy | | | | 2,297,161,600 | | | | 20,973,377 | | | | 8/27/20 | | | | 317,401 | | | | — | |
Indian Rupee | | | SCNY | | | | Sell | | | | 1,135,539,000 | | | | 15,483,004 | | | | 8/28/20 | | | | 546,713 | | | | — | |
Euro | | | BOFA | | | | Buy | | | | 27,627,938 | | | | 31,263,775 | | | | 8/31/20 | | | | — | | | | (182,138 | ) |
Euro | | | BOFA | | | | Sell | | | | 27,627,938 | | | | 30,471,129 | | | | 8/31/20 | | | | — | | | | (610,508 | ) |
Japanese Yen | | | CITI | | | | Buy | | | | 2,796,566,000 | | | | 27,059,295 | | | | 8/31/20 | | | | — | | | | (1,138,357 | ) |
Brazilian Real | | | CITI | | | | Sell | | | | 69,291,613 | | | | 12,956,062 | | | | 9/02/20 | | | | 246,708 | | | | — | |
Brazilian Real | | | CITI | | | | Sell | | | | 104,390,000 | | | | 18,621,110 | | | | 9/02/20 | | | | — | | | | (525,933 | ) |
Brazilian Real | | | HSBK | | | | Sell | | | | 67,353,775 | | | | 11,574,031 | | | | 9/02/20 | | | | — | | | | (779,890 | ) |
Indian Rupee | | | SCNY | | | | Sell | | | | 2,362,358,000 | | | | 30,773,494 | | | | 9/03/20 | | | | — | | | | (278,227 | ) |
Euro | | | JPHQ | | | | Buy | | | | 6,775,311 | | | | 7,663,872 | | | | 9/04/20 | | | | — | | | | (40,886 | ) |
Euro | | | JPHQ | | | | Sell | | | | 6,775,311 | | | | 7,582,149 | | | | 9/04/20 | | | | — | | | | (40,837 | ) |
Euro | | | SCNY | | | | Buy | | | | 17,972,751 | | | | 20,343,510 | | | | 9/08/20 | | | | — | | | | (120,260 | ) |
Euro | | | SCNY | | | | Sell | | | | 17,972,751 | | | | 20,208,741 | | | | 9/08/20 | | | | — | | | | (14,508 | ) |
South Korean Won | | | GSCO | | | | Sell | | | | 44,346,000,000 | | | | 36,942,686 | | | | 9/09/20 | | | | — | | | | (38,782 | ) |
Australian Dollar | | | CITI | | | | Sell | | | | 23,089,500 | | | | 1,766,923,987 | JPY | | | 9/10/20 | | | | 441,955 | | | | — | |
Australian Dollar | | | HSBK | | | | Sell | | | | 14,685,041 | | | | 1,101,157,799 | JPY | | | 9/11/20 | | | | 71,600 | | | | — | |
Australian Dollar | | | HSBK | | | | Sell | | | | 19,340,000 | | | | 1,310,343,020 | JPY | | | 9/14/20 | | | | — | | | | (1,201,770 | ) |
Australian Dollar | | | JPHQ | | | | Sell | | | | 22,449,246 | | | | 1,687,049,615 | JPY | | | 9/14/20 | | | | 144,447 | | | | — | |
Australian Dollar | | | JPHQ | | | | Sell | | | | 22,880,000 | | | | 1,553,370,104 | JPY | | | 9/14/20 | | | | — | | | | (1,392,247 | ) |
Swedish Krona | | | DBAB | | | | Buy | | | | 208,032,350 | | | | 19,832,248 | EUR | | | 9/15/20 | | | | 24,764 | | | | — | |
Australian Dollar | | | HSBK | | | | Sell | | | | 81,620,000 | | | | 6,022,698,990 | JPY | | | 9/16/20 | | | | — | | | | (502,144 | ) |
Norwegian Krone | | | JPHQ | | | | Buy | | | | 198,445,700 | | | | 18,283,198 | EUR | | | 9/16/20 | | | | 51,923 | | | | — | |
Swedish Krona | | | DBAB | | | | Buy | | | | 208,032,400 | | | | 19,801,766 | EUR | | | 9/16/20 | | | | 58,836 | | | | — | |
FRANKLIN TEMPLETON VARIABLE INSURANCE PRODUCTS TRUST
STATEMENT OF INVESTMENTS (UNAUDITED)
Templeton Global Bond VIP Fund (continued)
| | | | | | | | | | | | | | | | | | | | | | | | | | | | |
| Forward Exchange Contracts (continued) | |
| | | | | | | |
| Currency | | Counterpartya | | | Type | | | Quantity | | | Contract Amount* | | | Settlement
Date | | | Unrealized
Appreciation | | | Unrealized
Depreciation | |
| OTC Forward Exchange Contracts (continued) | |
Australian Dollar | | | HSBK | | | | Sell | | | | 9,830,000 | | | | 716,970,710 | JPY | | | 9/17/20 | | | $ | — | | | $ | (138,064 | ) |
Norwegian Krone | | | JPHQ | | | | Buy | | | | 177,591,200 | | | | 19,683,519 | | | | 9/21/20 | | | | — | | | | (1,222,664 | ) |
Norwegian Krone | | | JPHQ | | | | Buy | | | | 202,667,400 | | | | 18,878,646 | EUR | | | 9/21/20 | | | | — | | | | (181,455 | ) |
South Korean Won | | | CITI | | | | Sell | | | | 4,215,000,000 | | | | 3,491,406 | | | | 9/22/20 | | | | — | | | | (24,836 | ) |
Japanese Yen | | | JPHQ | | | | Buy | | | | 1,180,260,000 | | | | 11,065,422 | | | | 9/23/20 | | | | — | | | | (121,458 | ) |
Japanese Yen | | | BNDP | | | | Buy | | | | 2,244,657,680 | | | | 21,028,125 | | | | 9/24/20 | | | | — | | | | (214,173 | ) |
Euro | | | HSBK | | | | Sell | | | | 25,254,215 | | | | 3,044,092,592 | JPY | | | 9/25/20 | | | | — | | | | (200,417 | ) |
Euro | | | CITI | | | | Sell | | | | 74,682,227 | | | | 8,935,683,733 | JPY | | | 9/30/20 | | | | — | | | | (1,210,326 | ) |
Norwegian Krone | | | JPHQ | | | | Buy | | | | 230,077,650 | | | | 21,080,208 | EUR | | | 9/30/20 | | | | 185,504 | | | | — | |
Brazilian Real | | | HSBK | | | | Sell | | | | 93,155,800 | | | | 17,474,358 | | | | 10/02/20 | | | | 405,686 | | | | — | |
Brazilian Real | | | JPHQ | | | | Sell | | | | 78,488,300 | | | | 15,049,046 | | | | 10/02/20 | | | | 667,859 | | | | — | |
Euro | | | GSCO | | | | Buy | | | | 17,044,025 | | | | 19,273,383 | | | | 10/05/20 | | | | — | | | | (82,505 | ) |
Euro | | | GSCO | | | | Sell | | | | 17,044,025 | | | | 19,070,901 | | | | 10/05/20 | | | | — | | | | (119,978 | ) |
South Korean Won | | | HSBK | | | | Sell | | | | 42,561,000,000 | | | | 34,840,373 | | | | 10/07/20 | | | | — | | | | (674,717 | ) |
Mexican Peso | | | CITI | | | | Sell | | | | 157,383,000 | | | | 6,167,287 | | | | 10/08/20 | | | | — | | | | (592,506 | ) |
Mexican Peso | | | CITI | | | | Sell | | | | 161,485,000 | | | | 7,836,491 | | | | 10/08/20 | | | | 900,512 | | | | — | |
Mexican Peso | | | CITI | | | | Sell | | | | 121,288,000 | | | | 5,877,353 | | | | 10/09/20 | | | | 668,505 | | | | — | |
Euro | | | HSBK | | | | Buy | | | | 33,800,018 | | | | 38,282,239 | | | | 10/13/20 | | | | — | | | | (216,395 | ) |
Euro | | | HSBK | | | | Sell | | | | 33,800,018 | | | | 37,982,433 | | | | 10/13/20 | | | | — | | | | (83,411 | ) |
Mexican Peso | | | CITI | | | | Sell | | | | 404,375,000 | | | | 19,555,619 | | | | 10/13/20 | | | | 2,197,551 | | | | — | |
Mexican Peso | | | CITI | | | | Sell | | | | 595,223,000 | | | | 28,888,991 | | | | 10/15/20 | | | | 3,344,724 | | | | — | |
Euro | | | BOFA | | | | Buy | | | | 3,900,000 | | | | 4,416,052 | | | | 10/16/20 | | | | — | | | | (23,478 | ) |
Euro | | | BOFA | | | | Sell | | | | 5,251,819 | | | | 5,944,009 | | | | 10/16/20 | | | | 28,880 | | | | — | |
Euro | | | HSBK | | | | Buy | | | | 5,439,447 | | | | 6,119,357 | | | | 10/16/20 | | | | 7,097 | | | | — | |
Euro | | | HSBK | | | | Sell | | | | 8,692,000 | | | | 9,833,042 | | | | 10/16/20 | | | | 43,234 | | | | — | |
Mexican Peso | | | CITI | | | | Sell | | | | 545,017,000 | | | | 26,695,974 | | | | 10/16/20 | | | | 3,309,103 | | | | — | |
South Korean Won | | | HSBK | | | | Sell | | | | 7,007,000,000 | | | | 5,737,799 | | | | 10/20/20 | | | | — | | | | (110,175 | ) |
Japanese Yen | | | BNDP | | | | Buy | | | | 8,410,370,000 | | | | 77,686,199 | | | | 10/26/20 | | | | 358,041 | | | | — | |
Euro | | | BOFA | | | | Buy | | | | 11,635,109 | | | | 13,192,189 | | | | 10/30/20 | | | | — | | | | (82,491 | ) |
Euro | | | BOFA | | | | Buy | | | | 15,750,554 | | | | 17,727,720 | | | | 10/30/20 | | | | 18,997 | | | | — | |
Euro | | | BOFA | | | | Sell | | | | 27,385,662 | | | | 29,817,509 | | | | 10/30/20 | | | | — | | | | (1,038,906 | ) |
Euro | | | HSBK | | | | Buy | | | | 25,974,891 | | | | 29,458,291 | | | | 10/30/20 | | | | — | | | | (191,443 | ) |
Euro | | | HSBK | | | | Sell | | | | 25,974,891 | | | | 28,262,500 | | | | 10/30/20 | | | | — | | | | (1,004,348 | ) |
Japanese Yen | | | CITI | | | | Buy | | | | 1,511,588,790 | | | | 14,131,356 | | | | 10/30/20 | | | | — | | | | (103,184 | ) |
Japanese Yen | | | JPHQ | | | | Buy | | | | 4,187,000,000 | | | | 39,263,309 | | | | 10/30/20 | | | | — | | | | (406,210 | ) |
Brazilian Real | | | CITI | | | | Sell | | | | 177,213,700 | | | | 32,316,503 | | | | 11/04/20 | | | | — | | | | (119,209 | ) |
Swiss Franc | | | UBSW | | | | Buy | | | | 8,689,106 | | | | 8,265,853 | EUR | | | 11/09/20 | | | | — | | | | (105,630 | ) |
Swiss Franc | | | UBSW | | | | Buy | | | | 17,378,212 | | | | 15,853,718 | EUR | | | 11/09/20 | | | | 552,865 | | | | — | |
Swiss Franc | | | GSCO | | | | Buy | | | | 17,055,038 | | | | 15,564,006 | EUR | | | 11/12/20 | | | | 537,363 | | | | — | |
Japanese Yen | | | CITI | | | | Buy | | | | 727,486,679 | | | | 6,790,754 | | | | 11/16/20 | | | | — | | | | (36,621 | ) |
Euro | | | BOFA | | | | Sell | | | | 10,878,191 | | | | 11,840,584 | | | | 11/20/20 | | | | — | | | | (423,373 | ) |
Euro | | | GSCO | | | | Sell | | | | 1,898,500 | | | | 2,069,593 | | | | 11/20/20 | | | | — | | | | (70,756 | ) |
Euro | | | BOFA | | | | Sell | | | | 7,066,000 | | | | 7,766,311 | | | | 11/23/20 | | | | — | | | | (200,483 | ) |
Euro | | | GSCO | | | | Sell | | | | 1,230,811 | | | | 1,350,975 | | | | 11/23/20 | | | | — | | | | (36,743 | ) |
Euro | | | JPHQ | | | | Buy | | | | 18,850,000 | | | | 21,264,308 | | | | 11/23/20 | | | | — | | | | (11,256 | ) |
Euro | | | JPHQ | | | | Sell | | | | 48,239,690 | | | | 53,079,523 | | | | 11/23/20 | | | | — | | | | (1,309,902 | ) |
FRANKLIN TEMPLETON VARIABLE INSURANCE PRODUCTS TRUST
STATEMENT OF INVESTMENTS (UNAUDITED)
Templeton Global Bond VIP Fund (continued)
| | | | | | | | | | | | | | | | | | | | | | | | | | | | |
| Forward Exchange Contracts (continued) | |
| | | | | | | |
| Currency | | Counterpartya | | | Type | | | Quantity | | | Contract Amount* | | | Settlement
Date | | | Unrealized
Appreciation | | | Unrealized
Depreciation | |
|
| OTC Forward Exchange Contracts (continued) | |
Australian Dollar | | | JPHQ | | | | Sell | | | | 15,157,499 | | | | 1,110,777,880 | JPY | | | 11/24/20 | | | $ | — | | | | $ (147,965 | ) |
Euro | | | HSBK | | | | Sell | | | | 25,253,559 | | | | 2,982,874,592 | JPY | | | 11/24/20 | | | | — | | | | (774,817 | ) |
Euro | | | MSCO | | | | Sell | | | | 30,744,500 | | | | 33,641,247 | | | | 11/27/20 | | | | — | | | | (1,026,480 | ) |
Japanese Yen | | | MSCO | | | | Buy | | | | 12,189,000,000 | | | | 115,214,473 | | | | 12/18/20 | | | | — | | | | (1,962,391 | ) |
Japanese Yen | | | JPHQ | | | | Buy | | | | 1,180,260,000 | | | | 11,082,774 | | | | 12/22/20 | | | | — | | | | (115,529 | ) |
Japanese Yen | | | BNDP | | | | Buy | | | | 2,244,657,680 | | | | 21,061,272 | | | | 12/24/20 | | | | — | | | | (202,400 | ) |
Japanese Yen | | | CITI | | | | Buy | | | | 4,212,680,000 | | | | 39,535,263 | | | | 12/24/20 | | | | — | | | | (388,202 | ) |
Euro | | | CITI | | | | Sell | | | | 33,700,000 | | | | 37,987,988 | | | | 1/04/21 | | | | — | | | | (50,894 | ) |
Mexican Peso | | | CITI | | | | Sell | | | | 539,656,000 | | | | 23,963,623 | | | | 3/11/21 | | | | 1,200,531 | | | | — | |
| | | | | | | | | | | | | | | | | | | | | | | | |
Total Forward Exchange Contracts | | | | | | | | | | | | | | | | | | | $ | 28,053,447 | | | | $ (36,703,390 | ) |
| | | | | | | | | | | | | | | | | | | | | | | | |
Net unrealized appreciation (depreciation) | | | | | | | | | | | | | | | | | | | | | | | | $ (8,649,943 | ) |
| | | | | | | | | | | | | | | | | | | | | | | | | | | | |
*In U.S. dollars unless otherwise indicated.
aMay be comprised of multiple contracts with the same counterparty, currency and settlement date.
See Note 10 regarding other derivative information.
See Abbreviations on page TGB-40.
| | | | | | |
| | | |
| | The accompanying notes are an integral part of these financial statements. | Semiannual Report | | | TGB-23 | |
FRANKLIN TEMPLETON VARIABLE INSURANCE PRODUCTS TRUST
FINANCIAL STATEMENTS
Statement of Assets and Liabilities
June 30, 2020 (unaudited)
| | | | |
| | | Templeton Global Bond VIP Fund | |
Assets: | | | | |
Investments in securities: | | | | |
Cost - Unaffiliated issuers | | $ | 2,365,592,050 | |
Cost - Non-controlled affiliates (Note 3e) | | | 318,975,444 | |
| | | | |
| |
Value - Unaffiliated issuers | | $ | 2,083,619,008 | |
Value - Non-controlled affiliates (Note 3e) | | | 318,975,444 | |
Restricted cash for OTC derivative contracts (Note 1d) | | | 11,409,000 | |
Restricted currency, at value (cost $84,852) (Note 1e) | | | 91,508 | |
Foreign currency, at value (cost $1,448,101) | | | 1,412,177 | |
Receivables: | | | | |
Investment securities sold | | | 8,539,316 | |
Capital shares sold | | | 3,671,185 | |
Interest | | | 12,967,979 | |
Deposits with brokers for: | | | | |
OTC derivative contracts | | | 13,018,000 | |
Unrealized appreciation on OTC forward exchange contracts | | | 28,053,447 | |
Other assets | | | 2,208 | |
| | | | |
| |
Total assets | | | 2,481,759,272 | |
| | | | |
Liabilities: | | | | |
Payables: | | | | |
Investment securities purchased | | | 7,067,962 | |
Capital shares redeemed | | | 446,814 | |
Management fees | | | 840,842 | |
Distribution fees | | | 443,513 | |
Trustees’ fees and expenses | | | 1,030 | |
Deposits from brokers for: | | | | |
OTC derivative contracts | | | 11,409,000 | |
Options written, at value (premiums received $27,270,984) | | | 30,318,364 | |
Unrealized depreciation on OTC forward exchange contracts | | | 36,703,390 | |
Deferred tax. | | | 916,073 | |
Accrued expenses and other liabilities. | | | 1,334,830 | |
| | | | |
| |
Total liabilities | | | 89,481,818 | |
| | | | |
| |
Net assets, at value | | $ | 2,392,277,454 | |
| | | | |
Net assets consist of: | | | | |
Paid-in capital | | $ | 2,865,789,115 | |
Total distributable earnings (losses) | | | (473,511,661 | ) |
| | | | |
| |
Net assets, at value | | $ | 2,392,277,454 | |
| | | | |
| | | | |
| | | |
| TGB-24 | | Semiannual Report | The accompanying notes are an integral part of these financial statements. | | |
FRANKLIN TEMPLETON VARIABLE INSURANCE PRODUCTS TRUST
FINANCIAL STATEMENTS
Statement of Assets and Liabilities (continued)
June 30, 2020 (unaudited)
| | | | |
| | | Templeton Global Bond VIP Fund | |
| Class 1: | | | | |
Net assets, at value | | $ | 255,387,738 | |
| | | | |
| |
Shares outstanding | | | 17,644,597 | |
| | | | |
| |
Net asset value and maximum offering price per share | | | $14.47 | |
| | | | |
| Class 2: | | | | |
Net assets, at value | | $ | 2,060,001,073 | |
| | | | |
| |
Shares outstanding | | | 149,131,897 | |
| | | | |
| |
Net asset value and maximum offering price per share | | | $13.81 | |
| | | | |
| Class 4: | | | | |
Net assets, at value | | $ | 76,888,643 | |
| | | | |
| |
Shares outstanding | | | 5,425,612 | |
| | | | |
| |
Net asset value and maximum offering price per share | | | $14.17 | |
| | | | |
| | | | | | |
| | | |
| | The accompanying notes are an integral part of these financial statements. | Semiannual Report | | | TGB-25 | |
FRANKLIN TEMPLETON VARIABLE INSURANCE PRODUCTS TRUST
FINANCIAL STATEMENTS
Statement of Operations
for the six months ended June 30, 2020 (unaudited)
| | | | |
| | | Templeton Global Bond
VIP Fund | |
Investment income: | | | | |
Dividends: | | | | |
Non-controlled affiliates (Note 3e) | | $ | 1,688,573 | |
Interest:(net of foreign taxes)~ | | | | |
Unaffiliated issuers | | | 52,385,893 | |
| | | | |
| |
Total investment income | | | 54,074,466 | |
| | | | |
Expenses: | | | | |
Management fees (Note 3a) | | | 5,894,522 | |
Distribution fees: (Note 3c) | | | | |
Class 2 | | | 2,753,167 | |
Class 4 | | | 145,714 | |
Custodian fees (Note 4) | | | 413,940 | |
Reports to shareholders | | | 164,117 | |
Professional fees | | | 48,535 | |
Trustees’ fees and expenses | | | 8,523 | |
Other | | | 65,559 | |
| | | | |
| |
Total expenses | | | 9,494,077 | |
Expense reductions (Note 4) | | | (234,633 | ) |
Expenses waived/paid by affiliates (Note 3e) | | | (839,756 | ) |
| | | | |
| |
Net expenses | | | 8,419,688 | |
| | | | |
| |
Net investment income | | | 45,654,778 | |
| | | | |
Realized and unrealized gains (losses): | | | | |
Net realized gain (loss) from: | | | | |
Investments:# | | | | |
Unaffiliated issuers | | | (49,504,370 | ) |
Written options | | | (7,136,540 | ) |
Foreign currency transactions | | | (10,461,978 | ) |
Forward exchange contracts | | | 17,116,778 | |
Swap contracts | | | (117,098,171 | ) |
| | | | |
| |
Net realized gain (loss) | | | (167,084,281 | ) |
| | | | |
Net change in unrealized appreciation (depreciation) on: | | | | |
Investments: | | | | |
Unaffiliated issuers | | | (60,372,744 | ) |
Translation of other assets and liabilities denominated in foreign currencies | | | (220,470 | ) |
Forward exchange contracts | | | 27,429,748 | |
Written options | | | (8,433,743 | ) |
Swap contracts | | | 28,588,210 | |
Change in deferred taxes on unrealized appreciation | | | 164,682 | |
| | | | |
| |
Net change in unrealized appreciation (depreciation) | | | (12,844,317 | ) |
| | | | |
| |
Net realized and unrealized gain (loss) | | | (179,928,598 | ) |
| | | | |
| |
Net increase (decrease) in net assets resulting from operations | | $ | (134,273,820 | ) |
| | | | |
| |
~Foreign taxes withheld on interest | | $ | 1,390,733 | |
#Net of foreign taxes | | $ | 446,028 | |
| | | | |
| | | |
| TGB-26 | | Semiannual Report | The accompanying notes are an integral part of these financial statements. | | |
FRANKLIN TEMPLETON VARIABLE INSURANCE PRODUCTS TRUST
FINANCIAL STATEMENTS
Statements of Changes in Net Assets
| | | | | | | | |
| | | Templeton Global
Bond VIP Fund | |
| | |
| | | Six Months Ended
June 30, 2020
(unaudited) | | | Year Ended
December 31, 2019 | |
Increase (decrease) in net assets: | | | | | | | | |
Operations: | | | | | | | | |
Net investment income | | $ | 45,654,778 | | | $ | 143,948,395 | |
Net realized gain (loss) | | | (167,084,281 | ) | | | 40,922,392 | |
Net change in unrealized appreciation (depreciation) | | | (12,844,317 | ) | | | (136,420,695 | ) |
| | | | |
| | |
Net increase (decrease) in net assets resulting from operations | | | (134,273,820 | ) | | | 48,450,092 | |
| | | | |
Distributions to shareholders: | | | | | | | | |
Class 1 | | | (22,007,754 | ) | | | (22,427,340 | ) |
Class 2 | | | (177,367,048 | ) | | | (175,601,316 | ) |
Class 4 | | | (6,339,040 | ) | | | (6,224,019 | ) |
| | | | |
Total distributions to shareholders | | | (205,713,842 | ) | | | (204,252,675 | ) |
| | | | |
Capital share transactions: (Note 2) | | | | | | | | |
Class 1 | | | (30,908,254 | ) | | | 55,417,128 | |
Class 2 | | | (36,916,825 | ) | | | (21,954,185 | ) |
Class 4 | | | (2,586,311 | ) | | | 758,324 | |
| | | | |
| | |
Total capital share transactions | | | (70,411,390 | ) | | | 34,221,267 | |
| | | | |
| | |
Net increase (decrease) in net assets | | | (410,399,052 | ) | | | (121,581,316 | ) |
Net assets: | | | | | | | | |
Beginning of period | | | 2,802,676,506 | | | | 2,924,257,822 | |
| | | | |
| | |
End of period | | $ | 2,392,277,454 | | | $ | 2,802,676,506 | |
| | | | |
| | | | | | |
| | | |
| | The accompanying notes are an integral part of these financial statements. | Semiannual Report | | | TGB-27 | |
FRANKLIN TEMPLETON VARIABLE INSURANCE PRODUCTS TRUST
Notes to Financial Statements (unaudited)
Templeton Global Bond VIP Fund
1. Organization and Significant Accounting Policies
Franklin Templeton Variable Insurance Products Trust (Trust) is registered under the Investment Company Act of 1940 (1940 Act) as an open-end management investment company, consisting of eighteen separate funds and applies the specialized accounting and reporting guidance in U.S. Generally Accepted Accounting Principles (U.S. GAAP). Templeton Global Bond VIP Fund (Fund) is included in this report. Shares of the Fund are generally sold only to insurance company separate accounts to fund the benefits of variable life insurance policies or variable annuity contracts. The Fund offers three classes of shares: Class 1, Class 2 and Class 4. Each class of shares may differ by its distribution fees, voting rights on matters affecting a single class and its exchange privilege.
The following summarizes the Fund’s significant accounting policies.
a. Financial Instrument Valuation
The Fund’s investments in financial instruments are carried at fair value daily. Fair value is the price that would be received to sell an asset or paid to transfer a liability in an orderly transaction between market participants on the measurement date. The Fund calculates the net asset value (NAV) per share each business day as of 4 p.m. Eastern time or the regularly scheduled close of the New York Stock Exchange (NYSE), whichever is earlier. Under compliance policies and procedures approved by the Trust’s Board of Trustees (the Board), the Fund’s administrator has responsibility for oversight of valuation, including leading the cross-functional Valuation Committee (VC). The Fund may utilize independent pricing services, quotations from securities and financial instrument dealers, and other market sources to determine fair value.
Debt securities generally trade in the over-the-counter (OTC) market rather than on a securities exchange. The Fund’s pricing services use multiple valuation techniques to determine fair value. In instances where sufficient market activity exists, the pricing services may utilize a market-based approach through which quotes from market makers are used to determine fair value. In instances where sufficient market activity may not exist or is limited, the pricing services also utilize proprietary valuation models which may consider market characteristics such as benchmark yield curves, credit spreads, estimated default rates, anticipated market interest rate volatility, coupon rates, anticipated timing of principal
repayments, underlying collateral, and other unique security features in order to estimate the relevant cash flows, which are then discounted to calculate the fair value. Securities denominated in a foreign currency are converted into their U.S. dollar equivalent at the foreign exchange rate in effect at 4 p.m. Eastern time on the date that the values of the foreign debt securities are determined.
Investments in open-end mutual funds are valued at the closing NAV.
Certain derivative financial instruments are centrally cleared or trade in the OTC market. The Fund’s pricing services use various techniques including industry standard option pricing models and proprietary discounted cash flow models to determine the fair value of those instruments. The Fund’s net benefit or obligation under the derivative contract, as measured by the fair value of the contract, is included in net assets.
The Fund has procedures to determine the fair value of financial instruments for which market prices are not reliable or readily available. Under these procedures, the Fund primarily employs a market-based approach which may use related or comparable assets or liabilities, recent transactions, market multiples, book values, and other relevant information for the investment to determine the fair value of the investment. An income-based valuation approach may also be used in which the anticipated future cash flows of the investment are discounted to calculate fair value. Discounts may also be applied due to the nature or duration of any restrictions on the disposition of the investments. Due to the inherent uncertainty of valuations of such investments, the fair values may differ significantly from the values that would have been used had an active market existed.
b. Foreign Currency Translation
Portfolio securities and other assets and liabilities denominated in foreign currencies are translated into U.S. dollars based on the exchange rate of such currencies against U.S. dollars on the date of valuation. The Fund may enter into foreign currency exchange contracts to facilitate transactions denominated in a foreign currency. Purchases and sales of securities, income and expense items denominated in foreign currencies are translated into U.S. dollars at the exchange rate in effect on the transaction date. Portfolio securities and assets and liabilities denominated in foreign currencies contain risks that those currencies will decline in value relative to the U.S. dollar. Occasionally,
FRANKLIN TEMPLETON VARIABLE INSURANCE PRODUCTS TRUST
FINANCIAL STATEMENTS
Templeton Global Bond VIP Fund (continued)
events may impact the availability or reliability of foreign exchange rates used to convert the U.S. dollar equivalent value. If such an event occurs, the foreign exchange rate will be valued at fair value using procedures established and approved by the Board.
The Fund does not separately report the effect of changes in foreign exchange rates from changes in market prices on securities held. Such changes are included in net realized and unrealized gain or loss from investments in the Statement of Operations.
Realized foreign exchange gains or losses arise from sales of foreign currencies, currency gains or losses realized between the trade and settlement dates on securities transactions and the difference between the recorded amounts of dividends, interest, and foreign withholding taxes and the U.S. dollar equivalent of the amounts actually received or paid. Net unrealized foreign exchange gains and losses arise from changes in foreign exchange rates on foreign denominated assets and liabilities other than investments in securities held at the end of the reporting period.
c. Derivative Financial Instruments
The Fund invested in derivative financial instruments in order to manage risk or gain exposure to various other investments or markets. Derivatives are financial contracts based on an underlying or notional amount, require no initial investment or an initial net investment that is smaller than would normally be required to have a similar response to changes in market factors, and require or permit net settlement. Derivatives contain various risks including the potential inability of the counterparty to fulfill their obligations under the terms of the contract, the potential for an illiquid secondary market, and/or the potential for market movements which expose the Fund to gains or losses in excess of the amounts shown in the Statement of Assets and Liabilities. Realized gain and loss and unrealized appreciation and depreciation on these contracts for the period are included in the Statement of Operations.
Derivative counterparty credit risk is managed through a formal evaluation of the creditworthiness of all potential counterparties. The Fund attempts to reduce its exposure to counterparty credit risk on OTC derivatives, whenever possible, by entering into International Swaps and Derivatives Association (ISDA) master agreements with certain counterparties. These agreements contain various provisions, including but not limited to collateral requirements, events of
default, or early termination. Termination events applicable to the counterparty include certain deteriorations in the credit quality of the counterparty. Termination events applicable to the Fund include failure of the Fund to maintain certain net asset levels and/or limit the decline in net assets over various periods of time. In the event of default or early termination, the ISDA master agreement gives the non-defaulting party the right to net and close-out all transactions traded, whether or not arising under the ISDA agreement, to one net amount payable by one counterparty to the other. However, absent an event of default or early termination, OTC derivative assets and liabilities are presented gross and not offset in the Statement of Assets and Liabilities. Early termination by the counterparty may result in an immediate payment by the Fund of any net liability owed to that counterparty under the ISDA agreement.
Collateral requirements differ by type of derivative. Collateral terms are contract specific for OTC derivatives. For OTC derivatives traded under an ISDA master agreement, posting of collateral is required by either the Fund or the applicable counterparty if the total net exposure of all OTC derivatives with the applicable counterparty exceeds the minimum transfer amount, which typically ranges from $100,000 to $250,000, and can vary depending on the counterparty and the type of the agreement. Generally, collateral is determined at the close of Fund business each day and any additional collateral required due to changes in derivative values may be delivered by the Fund or the counterparty the next business day, or within a few business days. Collateral pledged and/or received by the Fund, if any, is held in segregated accounts with the Fund’s custodian/counterparty broker and can be in the form of cash and/or securities. Unrestricted cash may be invested according to the Fund’s investment objectives. To the extent that the amounts due to the Fund from its counterparties are not subject to collateralization or are not fully collateralized, the Fund bears the risk of loss from counterparty non-performance.
The Fund entered into OTC forward exchange contracts primarily to manage and/or gain exposure to certain foreign currencies. A forward exchange contract is an agreement between the Fund and a counterparty to buy or sell a foreign currency at a specific exchange rate on a future date.
The Fund entered into interest rate swap contracts primarily to manage interest rate risk. An interest rate swap is an agreement between the Fund and a counterparty to exchange cash flows based on the difference between two
FRANKLIN TEMPLETON VARIABLE INSURANCE PRODUCTS TRUST
FINANCIAL STATEMENTS
Templeton Global Bond VIP Fund (continued)
1. Organization and Significant Accounting Policies (continued)
c. Derivative Financial Instruments (continued)
interest rates, applied to a notional amount. These agreements may be privately negotiated in the over-the-counter market (OTC interest rate swaps) or may be executed on a registered exchange (centrally cleared interest rate swaps). For centrally cleared interest rate swaps, required initial margins are pledged by the Fund, and the daily change in fair value is accounted for as a variation margin payable or receivable in the Statement of Assets and Liabilities. Over the term of the contract, contractually required payments to be paid and to be received are accrued daily and recorded as unrealized depreciation and appreciation until the payments are made, at which time they are realized.
The Fund purchased or wrote OTC option contracts primarily to manage and/or gain exposure to foreign exchange rate risk. An option is a contract entitling the holder to purchase or sell a specific amount of shares or units of an asset or notional amount of a swap (swaption), at a specified price. When an option is purchased or written, an amount equal to the premium paid or received is recorded as an asset or liability, respectively. Upon exercise of an option, the acquisition cost or sales proceeds of the underlying investment is adjusted by any premium received or paid. Upon expiration of an option, any premium received or paid is recorded as a realized gain or loss. Upon closing an option other than through expiration or exercise, the difference between the premium received or paid and the cost to close the position is recorded as a realized gain or loss.
See Note 10 regarding other derivative information.
d. Restricted Cash
At June 30, 2020, the Fund held restricted cash in connection with investments in certain derivative securities. Restricted cash is held in a segregated account with the Fund’s custodian and is reflected in the Statement of Assets and Liabilities.
e. Restricted Currency
At June 30, 2020 the fund held currencies in certain markets in which the ability to repatriate such currency is limited. As a result of such limitations on repatriation, the Fund may incur substantial delays in gaining access to these assets and may be exposed to potential adverse movements in currency value.
f. Income and Deferred Taxes
It is the Fund’s policy to qualify as a regulated investment company under the Internal Revenue Code. The Fund intends to distribute to shareholders substantially all of its taxable income and net realized gains to relieve it from federal income and if applicable, excise taxes. As a result, no provision for U.S. federal income taxes is required.
The Fund may be subject to foreign taxation related to income received, capital gains on the sale of securities and certain foreign currency transactions in the foreign jurisdictions in which it invests. Foreign taxes, if any, are recorded based on the tax regulations and rates that exist in the foreign markets in which the Fund invests. When a capital gain tax is determined to apply, the Fund records an estimated deferred tax liability in an amount that would be payable if the securities were disposed of on the valuation date.
The Fund may recognize an income tax liability related to its uncertain tax positions under U.S. GAAP when the uncertain tax position has a less than 50% probability that it will be sustained upon examination by the tax authorities based on its technical merits. As of June 30, 2020, the Fund has determined that no tax liability is required in its financial statements related to uncertain tax positions for any open tax years (or expected to be taken in future tax years). Open tax years are those that remain subject to examination and are based on the statute of limitations in each jurisdiction in which the Fund invests.
g. Security Transactions, Investment Income, Expenses and Distributions
Security transactions are accounted for on trade date. Realized gains and losses on security transactions are determined on a specific identification basis. Interest income and estimated expenses are accrued daily. Amortization of premium and accretion of discount on debt securities are included in interest income. Dividend income is recorded on the ex-dividend date. Distributions to shareholders are
FRANKLIN TEMPLETON VARIABLE INSURANCE PRODUCTS TRUST
FINANCIAL STATEMENTS
Templeton Global Bond VIP Fund (continued)
recorded on the ex-dividend date. Distributable earnings are determined according to income tax regulations (tax basis) and may differ from earnings recorded in accordance with U.S. GAAP. These differences may be permanent or temporary. Permanent differences are reclassified among capital accounts to reflect their tax character. These reclassifications have no impact on net assets or the results of operations. Temporary differences are not reclassified, as they may reverse in subsequent periods.
Common expenses incurred by the Trust are allocated among the Funds based on the ratio of net assets of each Fund to the combined net assets of the Trust or based on the ratio of number of shareholders of each Fund to the combined number of shareholders of the Trust. Fund specific expenses are charged directly to the Fund that incurred the expense.
Realized and unrealized gains and losses and net investment income, excluding class specific expenses, are allocated daily to each class of shares based upon the relative proportion of net assets of each class. Differences in per share distributions by class are generally due to differences in class specific expenses.
Inflation-indexed bonds are adjusted for inflation through periodic increases or decreases in the security’s interest accruals, face amount, or principal redemption value, by
amounts corresponding to the rate of inflation as measured by an index. Any increase or decrease in the face amount or principal redemption value will be included as interest income in the Statement of Operations.
h. Accounting Estimates
The preparation of financial statements in accordance with U.S. GAAP requires management to make estimates and assumptions that affect the reported amounts of assets and liabilities at the date of the financial statements and the amounts of income and expenses during the reporting period. Actual results could differ from those estimates.
i. Guarantees and Indemnifications
Under the Trust’s organizational documents, its officers and trustees are indemnified by the Trust against certain liabilities arising out of the performance of their duties to the Trust. Additionally, in the normal course of business, the Trust, on behalf of the Fund, enters into contracts with service providers that contain general indemnification clauses. The Trust’s maximum exposure under these arrangements is unknown as this would involve future claims that may be made against the Trust that have not yet occurred. Currently, the Trust expects the risk of loss to be remote.
2. Shares of Beneficial Interest
At June 30, 2020, there were an unlimited number of shares authorized (without par value). Transactions in the Fund’s shares were as follows:
| | | | | | | | | | | | | | | | |
| | |
| | | Six Months Ended June 30, 2020 | | | Year Ended December 31, 2019 | |
| | | | |
| | | Shares | | | Amount | | | Shares | | | Amount | |
| | | | |
| Class 1 Shares: | | | | | | | | | | | | | | | | |
| | | | |
Shares sold | | | 2,470,753 | | | $ | 38,475,650 | | | | 5,087,795 | | | $ | 89,164,653 | |
| | | | |
Shares issued in reinvestment of distributions | | | 1,520,923 | | | | 22,007,754 | | | | 1,330,210 | | | | 22,427,340 | |
| | | | |
Shares redeemed | | | (5,755,199 | ) | | | (91,391,658 | ) | | | (3,257,868 | ) | | | (56,174,865) | |
| | | | |
Net increase (decrease) | | | (1,763,523 | ) | | $ | (30,908,254 | ) | | | 3,160,137 | | | $ | 55,417,128 | |
| | | | |
| Class 2 Shares: | | | | | | | | | | | | | | | | |
| | | | |
Shares sold | | | 4,093,946 | | | $ | 61,612,521 | | | | 7,233,859 | | | $ | 119,112,193 | |
| | | | |
Shares issued in reinvestment of distributions | | | 12,843,378 | | | | 177,367,048 | | | | 10,873,146 | | | | 175,601,316 | |
| | | | |
Shares redeemed | | | (18,006,272 | ) | | | (275,896,394 | ) | | | (19,122,225 | ) | | | (316,667,694) | |
| | | | |
Net increase (decrease) | | | (1,068,948 | ) | | $ | (36,916,825 | ) | | | (1,015,220 | ) | | $ | (21,954,185) | |
FRANKLIN TEMPLETON VARIABLE INSURANCE PRODUCTS TRUST
FINANCIAL STATEMENTS
Templeton Global Bond VIP Fund (continued)
2. Shares of Beneficial Interest (continued)
| | | | | | | | | | | | | | | | |
| | |
| | | Six Months Ended June 30, 2020 | | | Year Ended December 31, 2019 | |
| | | | |
| | | Shares | | | Amount | | | Shares | | | Amount | |
| | | | |
| Class 4 Shares: | | | | | | | | | | | | | | | | |
| | | | |
Shares sold | | | 316,381 | | | $ | 4,929,156 | | | | 692,994 | | | $ | 11,712,750 | |
| | | | |
Shares issued in reinvestment of distributions | | | 447,356 | | | | 6,339,040 | | | | 376,529 | | | | 6,224,019 | |
| | | | |
Shares redeemed | | | (885,254 | ) | | | (13,854,507 | ) | | | (1,010,027 | ) | | | (17,178,445) | |
| | | | |
Net increase (decrease) | | | (121,517 | ) | | $ | (2,586,311 | ) | | | 59,496 | | | $ | 758,324 | |
3. Transactions with Affiliates
Franklin Resources, Inc. is the holding company for various subsidiaries that together are referred to as Franklin Templeton. Certain officers and trustees of the Fund are also officers and/or directors of the following subsidiaries:
| | |
| |
| Subsidiary | | Affiliation |
| |
Franklin Advisers, Inc. (Advisers) | | Investment manager |
| |
Franklin Templeton Services, LLC (FT Services) | | Administrative manager |
| |
Franklin Templeton Distributors, Inc. (Distributors) | | Principal underwriter |
| |
Franklin Templeton Investor Services, LLC (Investor Services) | | Transfer agent |
a. Management Fees
The Fund pays an investment management fee to Advisers based on the average daily net assets of the Fund as follows:
| | |
| |
| Annualized Fee Rate | | Net Assets |
| |
0.625% | | Up to and including $100 million |
| |
0.500% | | Over $100 million, up to and including $250 million |
| |
0.450% | | Over $250 million, up to and including $7.5 billion |
| |
0.440% | | Over $7.5 billion, up to and including $10 billion |
| |
0.430% | | Over $10 billion, up to and including $12.5 billion |
| |
0.420% | | Over $12.5 billion, up to and including $15 billion |
| |
0.400% | | In excess of $15 billion |
For the period ended June 30, 2020, the annualized gross effective investment management fee rate was 0.460% of the Fund’s average daily net assets.
b. Administrative Fees
Under an agreement with Advisers, FT Services provides administrative services to the Fund. The fee is paid by Advisers based on the Fund’s average daily net assets, and is not an additional expense of the Fund.
FRANKLIN TEMPLETON VARIABLE INSURANCE PRODUCTS TRUST
FINANCIAL STATEMENTS
Templeton Global Bond VIP Fund (continued)
c. Distribution Fees
The Board has adopted distribution plans for Class 2 and Class 4 shares pursuant to Rule 12b-1 under the 1940 Act. Under the Fund’s compensation distribution plans, the Fund pays Distributors for costs incurred in connection with the servicing, sale and distribution of the Fund’s shares up to 0.25% and 0.35% per year of its average daily net assets of Class 2 and Class 4, respectively. The plan year, for purposes of monitoring compliance with the maximum annual plan rates, is February 1 through January 31.
d. Transfer Agent Fees
Investor Services, under terms of an agreement, performs shareholder servicing for the Fund and is not paid by the Fund for the services.
e. Investments in Affiliated Management Investment Companies
The Fund invests in one or more affiliated management investment companies for purposes other than exercising a controlling influence over the management or policies. Management fees paid by the Fund are waived on assets invested in the affiliated management investment companies, as noted in the Statement of Operations, in an amount not to exceed the management and administrative fees paid directly or indirectly by each affiliate. During the period ended June 30, 2020, the Fund held investments in affiliated management investment companies as follows:
| | | | | | | | | | | | | | | | | | | | | | | | | | | | | | | | |
| | | | | | | | |
| | | Value at
Beginning
of Period | | | Purchases | | | Sales | | | Realized
Gain (Loss) | | | Net Change in
Unrealized
Appreciation
(Depreciation) | | | Value at
End of
Period | | | Number of
Shares
Held at End
of Period | | | Dividend
Income | |
Non-Controlled Affiliates | | | | | | | | | | | | | | | | | | | | | | | | | | | | | | | | |
| | | | | | | | |
Institutional Fiduciary Trust Money Market Portfolio, 0.00% | | $ | 691,092,548 | | | $ | 336,305,086 | | | $ | (708,422,190 | ) | | | $ — | | | | $ — | | | $ | 318,975,444 | | | | 318,975,444 | | | $ | 1,688,573 | |
| | | | | | | | | | | | |
4. Expense Offset Arrangement
The Fund has entered into an arrangement with its custodian whereby credits realized as a result of uninvested cash balances are used to reduce a portion of the Fund’s custodian expenses. During the period ended June 30, 2020, the custodian fees were reduced as noted in the Statement of Operations.
5. Income Taxes
For tax purposes, capital losses may be carried over to offset future capital gains.
At December 31, 2019, the capital loss carryforwards were as follows:
| | | | |
Capital loss carryforwards not subject to expiration: | | | | |
| |
Short term | | $ | 1,874,982 | |
| |
Long term | | | 56,256,007 | |
| | | | |
| |
Total capital loss carryforwards | | $ | 58,130,989 | |
| | | | |
FRANKLIN TEMPLETON VARIABLE INSURANCE PRODUCTS TRUST
FINANCIAL STATEMENTS
Templeton Global Bond VIP Fund (continued)
5. Income Taxes (continued)
At June 30, 2020, the cost of investments and net unrealized appreciation (depreciation) for income tax purposes were as follows:
| | | | |
Cost of investments | | $ | 2,705,229,978 | |
| | | | |
| |
Unrealized appreciation | | $ | 108,946,474 | |
| |
Unrealized depreciation | | | (450,259,313) | |
| | | | |
| |
Net unrealized appreciation (depreciation) | | $ | (341,312,839) | |
| | | | |
Differences between income and/or capital gains as determined on a book basis and a tax basis are primarily due to differing treatments of foreign currency transactions and tax straddles.
6. Investment Transactions
Purchases and sales of investments (excluding short term securities) for the period ended June 30, 2020, aggregated $685,549,046 and $742,772,129, respectively.
7. Credit Risk
At June 30, 2020, the Fund had 11.8% of its portfolio invested in high yield or other securities rated below investment grade and unrated securities, if any. These securities may be more sensitive to economic conditions causing greater price volatility and are potentially subject to a greater risk of loss due to default than higher rated securities.
8. Concentration of Risk
Investments in issuers domiciled or with significant operations in developing or emerging market countries may be subject to higher risks than investments in developed countries. These risks include fluctuating currency values, underdeveloped legal or business systems, and changing local and regional economic, political and social conditions, which may result in greater market volatility. In addition, certain foreign securities may not be as liquid as U.S. securities. Currencies of developing or emerging market countries may be subject to significantly greater risks than currencies of developed countries, including the potential inability to repatriate those currencies into U.S. dollars.
At June 30, 2020, the Fund had 2.2% of its net assets denominated in Argentine Pesos, which has restricted currency repatriation since September 2019, and had restructured certain issues of its debt. Political and economic conditions in Argentina could continue to affect the value of the Fund’s holdings.
9. Novel Coronavirus Pandemic
The global outbreak of the novel coronavirus disease, known as COVID-19, has caused adverse effects on many companies, sectors, nations, regions and the markets in general, and may continue for an unpredictable duration. The effects of this pandemic may materially impact the value and performance of the Fund, its ability to buy and sell fund investments at appropriate valuations and its ability to achieve its investment objectives.
FRANKLIN TEMPLETON VARIABLE INSURANCE PRODUCTS TRUST
FINANCIAL STATEMENTS
Templeton Global Bond VIP Fund (continued)
10. Other Derivative Information
At June 30, 2020, investments in derivative contracts are reflected in the Statement of Assets and Liabilities as follows:
| | | | | | | | | | | | |
| | |
| | | Asset Derivatives | | | Liability Derivatives | |
| | | | |
Derivative Contracts
Not Accounted for as
Hedging Instruments | | Statement of
Assets and Liabilities
Location | | Fair Value | | | Statement of
Assets and Liabilities
Location | | Fair Value | |
| | | | |
Foreign exchange contracts | | Investments in securities, at value | | $ | 34,838,058 | a | | Options written, at value | | $ | 30,318,364 | |
| | Unrealized appreciation on OTC forward exchange contracts | | | 28,053,447 | | | Unrealized depreciation on OTC forward exchange contracts | | | 36,703,390 | |
| | | | | | | | | | | | |
Totals | | | | $ | 62,891,505 | | | | | $ | 67,021,754 | |
| | | | | | | | | | | | |
aPurchased option contracts are included in investments in securities, at value in the Statement of Assets and Liabilities.
For the period ended June 30, 2020, the effect of derivative contracts in the Statement of Operations was as follows:
| | | | | | | | | | | | |
| | | | |
Derivative Contracts
Not Accounted for as
Hedging Instruments | | Statement of
Operations Location | | Net Realized
Gain (Loss) for
the Period | | | Statement of
Operations Location | | Net Change in
Unrealized
Appreciation
(Depreciation)
for the Period
| |
| | | | |
| | Net realized gain (loss) from: | | | | | | Net change in unrealized appreciation (depreciation) on: | | | | |
| | | | |
Interest rate contracts | | Swap contracts | | $ | (117,098,171 | ) | | Swap contracts | | $ | 28,588,210 | |
| | | | |
Foreign exchange contracts | | Investments | | | 41,669,494 | a | | Investments | | | 11,586,887 | a |
| | | | |
| | Written options | | | (7,136,540 | ) | | Written options | | | (8,433,743 | ) |
| | | | |
| | Forward exchange contracts | | | 17,116,778 | | | Forward exchange contracts | | | 27,429,748 | |
| | | | | | | | | | | | |
| | | | |
Totals | | | | $ | (65,448,439 | ) | | | | $ | 59,171,102 | |
| | | | | | | | | | | | |
aPurchased option contracts are included in net realized gain (loss) from investments and net change in unrealized appreciation (depreciation) on investments in the Statement of Operations.
For the period ended June 30, 2020, the average month end notional amount of swap contracts and options represented $112,474,571 and $2,914,680,736, respectively. The average month end contract value of forward exchange contracts was $3,074,304,590.
See Note 1(c) regarding derivative financial instruments.
FRANKLIN TEMPLETON VARIABLE INSURANCE PRODUCTS TRUST
FINANCIAL STATEMENTS
Templeton Global Bond VIP Fund (continued)
10. Other Derivative Information (continued)
At June 30, 2020, OTC derivative assets and liabilities are as follows:
| | | | | | | | | | | | | | | | |
| |
| | | Gross Amounts of
Assets and Liabilities Presented
in the Statement of Assets and Liabilities | |
| | | | |
| | | | | | Assetsa | | | | | | Liabilitiesa | |
| | | | |
| Derivatives | | | | | | | | | | | | | | | | |
Forward exchange contracts | | | | | | $ | 28,053,447 | | | | | | | $ | 36,703,390 | |
Options purchased | | | | | | | 34,838,058 | | | | | | | | — | |
Options written | | | | | | | — | | | | | | | | 30,318,364 | |
| | | | |
| | | | |
Total | | | | | | $ | 62,891,505 | | | | | | | $ | 67,021,754 | |
| | | | |
aAbsent an event of default or early termination, OTC derivative assets and liabilities are presented gross and not offset in the Statement of Assets and Liabilities.
At June 30, 2020, OTC derivative assets, which may be offset against OTC derivative liabilities and collateral received from the counterparty, are as follows:
| | | | | | | | | | | | | | | | | | | | |
| | | |
| | | | | | Amounts Not Offset in the
Statement of Assets and Liabilities | | | | |
| | | | | |
| | | Gross
Amounts of
Assets Presented in
the Statement of
Assets and Liabilities | | | Financial
Instruments
Available for
Offset | | | Financial
Instruments
Collateral
Receiveda,b | | | Cash
Collateral
Receivedb | | | Net Amount
(Not less
than zero)
| |
| | | | | |
| Counterparty | | | | | | | | | | | | | | | | | | | | |
BNDP | | $ | 358,041 | | | $ | (358,041 | ) | | | $— | | | | $— | | | | $— | |
BOFA | | | 47,877 | | | | (47,877 | ) | | | — | | | | — | | | | — | |
CITI | | | 34,505,223 | | | | (31,229,399 | ) | | | — | | | | (3,275,824 | ) | | | — | |
DBAB | | | 1,816,133 | | | | (33,161 | ) | | | (1,696,771 | ) | | | — | | | | 86,201 | |
GSCO | | | 5,852,767 | | | | (2,941,098 | ) | | | — | | | | (2,911,669 | ) | | | — | |
HSBK | | | 4,208,728 | | | | (4,208,728 | ) | | | — | | | | — | | | | — | |
JPHQ | | | 11,203,728 | | | | (9,979,490 | ) | | | (1,224,238 | ) | | | — | | | | — | |
MSCO | | | 2,616,259 | | | | (2,616,259 | ) | | | — | | | | — | | | | — | |
SCNY | | | 1,057,688 | | | | (412,995 | ) | | | — | | | | (644,693 | ) | | | — | |
UBSW | | | 1,225,061 | | | | (216,304 | ) | | | (888,209 | ) | | | — | | | | 120,548 | |
| | | | |
| | | | | |
Total | | $ | 62,891,505 | | | $ | (52,043,352 | ) | | $ | (3,809,218 | ) | | $ | (6,832,186 | ) | | $ | 206,749 | |
| | | | |
FRANKLIN TEMPLETON VARIABLE INSURANCE PRODUCTS TRUST
FINANCIAL STATEMENTS
Templeton Global Bond VIP Fund (continued)
At June 30, 2020, OTC derivative liabilities, which may be offset against OTC derivative assets and collateral pledged to the counterparty, are as follows:
| | | | | | | | | | | | | | | | | | | | |
| | | |
| | | | | | Amounts Not Offset in the
Statement of Assets and Liabilities | | | | |
| | | | | |
| | | Gross
Amounts of
Liabilities Presented in
the Statement of
Assets and Liabilities | | | Financial
Instruments
Available for
Offset | | | Financial
Instruments
Collateral
Pledged | | | Cash
Collateral
Pledgedb | | | Net Amount (Not less than zero) | |
| | | | | |
| Counterparty | | | | | | | | | | | | | | | | | | | | |
BNDP | | | $ 416,573 | | | | $ (358,041 | ) | | | $— | | | | $— | | | | $ 58,532 | |
BOFA | | | 2,561,377 | | | | (47,877 | ) | | | — | | | | (2,500,000 | ) | | | 13,500 | |
CITI | | | 31,229,399 | | | | (31,229,399 | ) | | | — | | | | — | | | | — | |
DBAB | | | 33,161 | | | | (33,161 | ) | | | — | | | | — | | | | — | |
GSCO | | | 2,941,098 | | | | (2,941,098 | ) | | | — | | | | — | | | | — | |
HSBK | | | 13,192,260 | | | | (4,208,728 | ) | | | — | | | | (7,468,000 | ) | | | 1,515,532 | |
JPHQ | | | 9,979,490 | | | | (9,979,490 | ) | | | — | | | | — | | | | — | |
MSCO | | | 6,039,097 | | | | (2,616,259 | ) | | | — | | | | (2,750,000 | ) | | | 672,838 | |
SCNY | | | 412,995 | | | | (412,995 | ) | | | — | | | | — | | | | — | |
UBSW | | | 216,304 | | | | (216,304 | ) | | | — | | | | — | | | | — | |
| | | | |
| | | | | |
Total | | | $67,021,754 | | | | $(52,043,352 | ) | | | $— | | | | $(12,718,000 | ) | | | $2,260,402 | |
| | | | |
aAt June 30, 2020, the Fund received U.S. Treasury Bills, Bonds and Notes as collateral for derivatives.
bIn some instances, the collateral amounts disclosed in the table above were adjusted due to the requirement to limit the collateral amounts to avoid the effect of overcollateralization. Actual collateral received and/or pledged may be more than the amounts disclosed herein.
See Abbreviations on page TGB-40.
11. Credit Facility
The Fund, together with other U.S. registered and foreign investment funds (collectively, Borrowers), managed by Franklin Templeton, are borrowers in a joint syndicated senior unsecured credit facility totaling $2 billion (Global Credit Facility) which matures on February 5, 2021. This Global Credit Facility provides a source of funds to the Borrowers for temporary and emergency purposes, including the ability to meet future unanticipated or unusually large redemption requests.
Under the terms of the Global Credit Facility, the Fund shall, in addition to interest charged on any borrowings made by the Fund and other costs incurred by the Fund, pay its share of fees and expenses incurred in connection with the implementation and maintenance of the Global Credit Facility, based upon its relative share of the aggregate net assets of all of the Borrowers, including an annual commitment fee of 0.15% based upon the unused portion of the Global Credit Facility. These fees are reflected in other expenses in the Statement of Operations. During the period ended June 30, 2020, the Fund did not use the Global Credit Facility.
12. Fair Value Measurements
The Fund follows a fair value hierarchy that distinguishes between market data obtained from independent sources (observable inputs) and the Fund’s own market assumptions (unobservable inputs). These inputs are used in determining the value of the Fund’s financial instruments and are summarized in the following fair value hierarchy:
| | • | | Level 1 – quoted prices in active markets for identical financial instruments |
FRANKLIN TEMPLETON VARIABLE INSURANCE PRODUCTS TRUST
FINANCIAL STATEMENTS
Templeton Global Bond VIP Fund (continued)
12. Fair Value Measurements (continued)
| | • | | Level 2 – other significant observable inputs (including quoted prices for similar financial instruments, interest rates, prepayment speed, credit risk, etc.) |
| | • | | Level 3 – significant unobservable inputs (including the Fund’s own assumptions in determining the fair value of financial instruments) |
The input levels are not necessarily an indication of the risk or liquidity associated with financial instruments at that level.
A summary of inputs used as of June 30, 2020, in valuing the Fund’s assets and liabilities carried at fair value, is as follows:
| | | | | | | | | | | | | | | | |
| | | | |
| | | Level 1 | | | Level 2 | | | Level 3 | | | Total | |
| | | | |
| Assets: | | | | | | | | | | | | | | | | |
| | | | |
Investments in Securities:a | | | | | | | | | | | | | | | | |
| | | | |
Foreign Government and Agency Securities: | | | | | | | | | | | | | | | | |
| | | | |
Argentina | | $ | — | | | $ | — | | | $ | 44,995,554 | | | $ | 44,995,554 | |
| | | | |
All Other Foreign Government and Agency Securities | | | — | | | | 1,098,764,185 | | | | — | | | | 1,098,764,185 | |
| | | | |
U.S. Government and Agency Securities | | | — | | | | 486,579,150 | | | | — | | | | 486,579,150 | |
| | | | |
Options Purchased | | | — | | | | 34,838,058 | | | | — | | | | 34,838,058 | |
| | | | |
Short Term Investments: | | | | | | | | | | | | | | | | |
| | | | |
Argentina | | | — | | | | — | | | | 6,125,984 | | | | 6,125,984 | |
| | | | |
All Other Short Term Investments | | | 561,683,710 | | | | 169,607,811 | | | | — | | | | 731,291,521 | |
| | | | |
| | | | |
Total Investments in Securities | | $ | 561,683,710 | | | $ | 1,789,789,204 | | | $ | 51,121,538 | | | $ | 2,402,594,452 | |
| | | | |
| | | | |
Other Financial Instruments: | | | | | | | | | | | | | | | | |
| | | | |
Forward Exchange Contracts | | $ | — | | | $ | 28,053,447 | | | $ | — | | | $ | 28,053,447 | |
| | | | |
Restricted Currency (ARS) | | | — | | | | — | | | | 91,508 | | | | 91,508 | |
| | | | |
| | | | |
Total Other Financial Instruments | | $ | — | | | $ | 28,053,447 | | | $ | 91,508 | | | $ | 28,144,955 | |
| | | | |
| | | | |
Receivables: | | | | | | | | | | | | | | | | |
| | | | |
Interest (ARS) | | $ | — | | | $ | — | | | $ | 1,240,246 | | | $ | 1,240,246 | |
| | | | |
| | | | |
| Liabilities: | | | | | | | | | | | | | | | | |
| | | | |
Other Financial Instruments: | | | | | | | | | | | | | | | | |
| | | | |
Options Written | | $ | — | | | $ | 30,318,364 | | | $ | — | | | $ | 30,318,364 | |
| | | | |
Forward Exchange Contracts | | | — | | | | 36,703,390 | | | | — | | | | 36,703,390 | |
| | | | |
| | | | |
Total Other Financial Instruments | | $ | — | | | $ | 67,021,754 | | | $ | — | | | $ | 67,021,754 | |
| | | | |
| | | | |
Payables: | | | | | | | | | | | | | | | | |
| | | | |
Deferred Tax (ARS) | | $ | — | | | $ | — | | | $ | 2,884 | | | $ | 2,884 | |
| | | | |
aFor detailed categories, see the accompanying Statement of Investments.
FRANKLIN TEMPLETON VARIABLE INSURANCE PRODUCTS TRUST
FINANCIAL STATEMENTS
Templeton Global Bond VIP Fund (continued)
A reconciliation in which Level 3 inputs are used in determining fair value is presented when there are significant Level 3 assets and/or liabilities at the beginning and/or end of the period. At June 30, 2020, the reconciliation is as follows:
| | | | | | | | | | | | | | | | | | | | | | | | | | | | | | | | | | | | | | | | |
| | | Balance at
Beginning
of Period | | | Purchases | | | Sales | | | Transfer
Into/Out of
Level 3 | | | Cost Basis
Adjustmentsa | | | Net
Realized
Gain (Loss) | | | Net
Unrealized
Appreciation
(Depreciation) | | | Balance
at End of Period | | | Net Change
in Unrealized
Appreciation
(Depreciation)
on Assets
Held at
Period End | |
| |
Assets: | | | | | | | | | | | | | | | | | | | | | | | | | | | | | | | | | | | | | | | | |
Investments in Securities: | | | | | | | | | | | | | | | | | | | | | | | | | | | | | | | | | | | | | | | | |
Foreign Government and | | | | | | | | | | | | | | | | | | | | | | | | | | | | | | | | | | | | | | | | |
Agency Securities: | | | | | | | | | | | | | | | | | | | | | | | | | | | | | | | | | | | | | | | | |
Argentina | | | | | | $ | 35,675,197 | | | $ | 19,260,092 | | | $ | (10,217,792 | ) | | | $— | | | | $4,900,882 | | | | $(18,641,512 | ) | | | $14,018,687 | | | $ | 44,995,554 | | | | $6,508,509 | |
Short Term Investments: | | | | | | | | | | | | | | | | | | | | | | | | | | | | | | | | | | | | | | | | |
Argentina | | | | | | | 3,394,233 | | | | 6,610,964 | | | | (2,160,508 | ) | | | — | | | | 752,471 | | | | (817,458 | ) | | | (1,653,718 | ) | | | 6,125,984 | | | | (644,903 | ) |
| | | | | | | | |
Total Investments in Securities | | | | | | $ | 39,069,430 | | | $ | 25,871,056 | | | $ | (12,378,300 | ) | | | $— | | | | $5,653,353 | | | | $(19,458,970 | ) | | | $12,364,969 | | | $ | 51,121,538 | | | | $5,863,606 | |
| | | | | | | | |
Other Financial Instruments: | | | | | | | | | | | | | | | | | | | | | | | | | | | | | | | | | | | | | | | | |
Restricted Currency (ARS) | | | | | | $ | 8,460,563 | | | $ | 8,913,882 | | | $ | (15,804,994 | ) | | | $— | | | | $ — | | | | $(1,714,126) | | | | $ 236,183 | | | $ | 91,508 | | | | $ 6,656 | |
| | | | | | | | |
Receivables: | | | | | | | | | | | | | | | | | | | | | | | | | | | | | | | | | | | | | | | | |
Interest (ARS) | | | | | | $ | 1,601,869 | | | $ | 3,080,353 | | | $ | (2,879,272 | ) | | | $— | | | | $ — | | | | $ (761,876) | | | | $ 199,172 | | | $ | 1,240,246 | | | | $ 78,763 | |
| | | | | | | | |
Liabilities: | | | | | | | | | | | | | | | | | | | | | | | | | | | | | | | | | | | | | | | | |
Payables: | | | | | | | | | | | | | | | | | | | | | | | | | | | | | | | | | | | | | | | | |
Deferred Tax (ARS) | | | | | | $ | 4,066 | | | $ | — | | | $ | — | | | | $— | | | | $ — | | | | $ — | | | | $ (1,182 | ) | | $ | 2,884 | | | | $ (1,182 | ) |
| | | | | | | | |
aMay include accretion, amortization, partnership adjustments, and/or other cost basis adjustments.
Significant unobservable valuation inputs for material Level 3 assets and/or liabilities and impact to fair value as a result of changes in unobservable valuation inputs as of June 30, 2020, are as follows:
| | | | | | | | | | |
| Description | | Fair Value at End of Period | | Valuation Technique | | Unobservable
Inputs | | Amount | | Impact to Fair
Value if Input
Increasesa |
| Assets: | | | | | | | | | | |
| Investments in Securities: | | | | | | | | | | |
Foreign Government and Agency Securities | | | | | | | | | | |
Argentina | | $44,995,554 | | Market comparables | | Implied Foreign exchange rate | | 105.9 ARS/USD | | Decreaseb |
Short Term Investments | | | | | | | | | | |
Argentina | | 6,125,984 | | Market comparables | | Implied Foreign exchange rate | | 105.9 ARS/USD | | Decreasec |
Other Financial Instruments: | | | | | | | | | | |
Restricted Currency (ARS) | | 91,508 | | Market comparables | | Implied Foreign exchange rate | | 105.9 ARS/USD | | Decreasec |
All otherd | | 1,240,246 | | | | | | | | |
FRANKLIN TEMPLETON VARIABLE INSURANCE PRODUCTS TRUST
FINANCIAL STATEMENTS
Templeton Global Bond VIP Fund (continued)
12. Fair Value Measurements (continued)
| | | | | | | | | | |
| Description | | Fair Value at End of Period | | Valuation
Technique | | Unobservable
Inputs | | Amount | | Impact to Fair
Value if Input
Increasesa |
| Liabilities: | | | | | | | | | | |
All otherd | | 2,884 | | | | | | | | |
aRepresents the directional change in the fair value that would result from a significant and reasonable increase in the corresponding input. A significant and reasonable decrease in the input would have the opposite effect. Significant impacts, if any, to fair value and/or net assets have been indicated.
bRepresents a significant impact to fair value and net assets.
cRepresents a significant impact to fair value but not net assets.
dIncludes fair value of immaterial assets and/or liabilities developed using various valuation techniques and unobservable inputs. May also include with values derived using private transaction prices or non-public third party pricing information which is unobservable.
13. New Accounting Pronouncements
In March 2020, the Financial Accounting Standards Board issued Accounting Standards Update (ASU) No. 2020-04, Reference Rate Reform (Topic 848) – Facilitation of the Effects of Reference Rate Reform on Financial Reporting. The amendments in the ASU provides optional temporary financial reporting relief from the effect of certain types of contract modifications due to the planned discontinuation of the London Interbank Offered Rate (LIBOR) and other interbank-offered based reference rates as of the end of 2021. The ASU is effective for certain reference rate-related contract modifications that occur during the period March 12, 2020 through December 31, 2022. Management is currently evaluating the impact, if any, of applying this ASU.
14. Subsequent Events
The Fund has evaluated subsequent events through the issuance of the financial statements and determined that no events have occurred that require disclosure.
Abbreviations
| | | | | | | | | | |
| | |
| Counterparty | | Currency | | Selected Portfolio |
| | | | | |
| BNDP | | BNP Paribas SA | | ARS | | Argentine Peso | | BADLAR | | Argentina Deposit Rates Badlar Private Banks ARS |
| | | | | |
| BOFA | | Bank of America Corp. | | AUD | | Australian Dollar | | FRN | | Floating Rate Note |
| | | | | |
| CITI | | Citigroup, Inc. | | BRL | | Brazilian Real | | | | |
| | | | | |
| DBAB | | Deutsche Bank AG | | COP | | Colombian Peso | | | | |
| | | | | |
| GSCO | | The Goldman Sachs Group, Inc. | | EUR | | Euro | | | | |
| | | | | |
| HSBK | | HSBC Bank PLC | | GHS | | Ghanaian Cedi | | | | |
| | | | | |
| JPHQ | | JP Morgan Chase & Co. | | IDR | | Indonesian Rupiah | | | | |
| | | | | |
| MSCO | | Morgan Stanley | | INR | | Indian Rupee | | | | |
| | | | | |
| SCNY | | Standard Chartered Bank | | JPY | | Japanese Yen | | | | |
| | | | | |
| UBSW | | UBS AG | | KRW | | South Korean Won | | | | |
| | | | | |
| | | | MXN | | Mexican Peso | | | | |
| | | | | |
| | | | NOK | | Norwegian Krone | | | | |
| | | | | |
| | | | USD | | United States Dollar | | | | |
FRANKLIN TEMPLETON VARIABLE INSURANCE PRODUCTS TRUST
Tax Information (unaudited)
Templeton Global Bond VIP Fund
At December 31, 2019, more than 50% of the Fund’s total assets were invested in securities of foreign issuers. In most instances, foreign taxes were withheld from income paid to the Fund on these investments. As shown in the table below, the Fund hereby reports to shareholders the foreign source income and foreign taxes paid, pursuant to Section 853 of the Internal Revenue Code. This written statement will allow shareholders of record on June 11, 2020, to treat their proportionate share of foreign taxes paid by the Fund as having been paid directly by them. The shareholder shall consider these amounts as foreign taxes paid in the tax year in which they receive the Fund distribution.
The following table provides a detailed analysis of foreign tax paid and foreign source income as reported by the Fund to shareholders of record.
| | | | | | | | |
| | |
| Class | | Foreign Tax Paid
Per Share | | | Foreign Source
Income Per Share | |
| | |
Class 1 | | | $0.0241 | | | | $0.8881 | |
| | |
Class 2 | | | $0.0241 | | | | $0.8586 | |
| | |
Class 4 | | | $0.0241 | | | | $0.8460 | |
Foreign Tax Paid Per Share is the amount per share available to you, as a tax credit (assuming you held your shares in the Fund for a minimum of 16 days during the 31-day period beginning 15 days before the ex-dividend date of the Fund’s distribution to which the foreign taxes relate), or, as a tax deduction.
Foreign Source Income Per Share is the amount per share of income dividends attributable to foreign securities held by the Fund, plus any foreign taxes withheld on these dividends.
This page intentionally left blank.
Templeton Growth VIP Fund
This semiannual report for Templeton Growth VIP Fund covers the period ended June 30, 2020.
Class 4 Performance Summary as of June 30, 2020
The Fund’s Class 4 Shares posted a -13.52% total return for the six-month period ended June 30, 2020.
Performance reflects the Fund’s Class 4 operating expenses, but does not include any contract fees, expenses or sales charges. If they had been included, performance would be lower. These charges and deductions, particularly for variable life policies, can have a significant effect on contract values and insurance benefits. See the contract prospectus for a complete description of these expenses, including sales charges.
Performance data represent past performance, which does not guarantee future results. Investment return and principal value will fluctuate, and you may have a gain or loss when you sell your shares. Current performance may differ from figures shown.
TEMPLETON GROWTH VIP FUND
Fund Goal and Main Investments
The Fund seeks long-term capital growth. Under normal market conditions, the Fund invests predominantly in equity securities (primarily common stocks) of companies located anywhere in the world, including developing markets.
Fund Risks
All investments involve risks, including possible loss of principal. Unexpected events and their aftermaths, such as the spread of deadly diseases; natural, environmental or man-made disasters; financial, political or social disruptions; terrorism and war; and other tragedies or catastrophes, can cause investor fear and panic, which can adversely affect the economies of many companies, sectors, nations, regions and the market in general, in ways that cannot necessarily be foreseen. Special risks are associated with foreign investing, including currency fluctuations, economic instability and political developments; investments in developing markets involve heightened risks related to the same factors. Because the Fund may invest its assets in companies in a specific region, including Europe, it is subject to greater risks of adverse developments in that region and/or the surrounding regions than a fund that is more broadly diversified geographically. Political, social or economic disruptions in the region, even in countries in which the Fund is not invested, may adversely affect the value of securities held by the Fund. Current political uncertainty concerning the economic consequences of the departure of the U.K. from the European Union may increase market volatility. Derivatives involve costs and can create economic leverage which may result in significant volatility and cause the Fund to participate in losses (and enable gains) on an amount that exceeds the Fund’s initial investment. In addition, securities issued by small- and mid-capitalization companies have historically experienced more price volatility than larger-company stocks, especially over the short term and may involve additional risks. The Fund is actively managed but there is no guarantee that the manager’s investment decisions will produce the desired results. The Fund’s prospectus also includes a description of the main investment risks.
Geographic Composition
Based on Total Net Assets as of 6/30/20
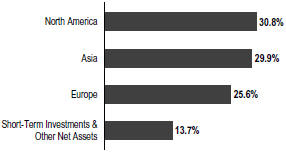
Performance Overview
You can find the Fund’s six-month total return in the Performance Summary. For comparison, the Fund’s benchmark, the MSCI All Country World Index (ACWI), posted a -5.99% total return for the period under review.1
Economic and Market Overview
Global developed and emerging market equities, as measured by the MSCI ACWI (USD), posted a -5.99% total return during the six months under review.1 Stocks fell sharply in early 2020 as countries around the world implemented lockdown measures in an effort to slow the spread of the novel coronavirus (COVID-19). Global supply chain disruptions, business and personal restrictions, and subdued consumer spending drove many investors to sell equity holdings in favor of perceived safe investments such as government bonds and cash. While global equities, notably in the U.S., rebounded in April and May amid optimism about easing lockdown restrictions, concerns about a second wave of infections hindered equities in June, as investors weighed the possibility of renewed restrictions.
In the U.S., government mandates to mitigate the COVID-19 pandemic severely impacted the economy beginning in March 2020. As a result, the unemployment rate surged to 14.7% in April, as many businesses, particularly those involved in hospitality, retail and travel, announced mass layoffs.2 According to the National Bureau of Economic Research, the longest U.S. economic expansion in history ended in February 2020 as the country slipped into a severe recession. Nonetheless, near period-end, there were signs that a recovery was underway, as jobless claims fell
1. Source: Morningstar. One cannot invest directly in an index, and an index is not representative of the Fund’s portfolio. Please see Index Descriptions following the Fund Summaries.
2. Source: U.S. Bureau of Labor Statistics.
The dollar value, number of shares or principal amount, and names of all portfolio holdings are listed in the Fund’s Statement of Investments (SOI).
TEMPLETON GROWTH VIP FUND
considerably from their peak in early April, retail sales rose sharply in May, and the unemployment rate fell to 11.1% in June.2 Along with optimism about improved treatments and potential vaccines for COVID-19, the positive economic signals contributed to a significant equity rebound in April and May. However, an increase in COVID-19 infections in many states throughout June pressured U.S. stocks.
The U.S. Federal Reserve (Fed) made significant efforts to support the U.S. economy. In March 2020, as the pandemic began to severely impact the economy and financial markets, the Fed implemented two emergency rate cuts, lowering the federal funds target rate to a range of 0.00%–0.25%, and announced sweeping quantitative easing measures aimed at ensuring credit flow to borrowers and supporting credit markets with unlimited amounts of bond purchasing.
In the eurozone, some analysts forecasted a significant contraction in 2020, particularly in southern European countries, as the magnitude of the economic disruption caused by the pandemic became apparent. European developed market equities, as measured by the MSCI Europe Index (USD), posted a -12.43% total return for the period.1 To stimulate growth, the European Central Bank implemented a broad bond-buying program, and many countries passed fiscal stimulus measures.
Asian developed and emerging market equities, as measured by the MSCI All Country Asia Index (USD), posted a -5.51% total return during the six-month period.1 The onset of the pandemic brought dramatically slower economic activity in Asia, as businesses halted operations and manufacturing and export activity declined sharply in the region’s major economies. Asian markets generally advanced toward period-end, bolstered by fiscal stimulus measures and economies reopening throughout the region.
Emerging market stocks, as measured by the MSCI Emerging Markets Index (USD), posted a -9.67% total return due primarily to the COVID-19 pandemic.1 A sharp decrease in prices for oil and other natural resources also hurt emerging market economies reliant on these exports. In the last quarter of the reporting period, however, investor optimism led to a stock rally, particularly in emerging market countries that had successfully lowered infection rates.
Investment Strategy
Our investment philosophy is bottom up, value oriented and long term. When choosing equity investments for the Fund, we focus on the market price of a company’s securities relative to our evaluation of the company’s potential
long-term earnings, asset value and cash flow. Our analysis includes an assessment of the potential impacts of material environmental, social and governance (ESG) factors on the long-term risk and return profile of a company. We also consider a company’s price/earnings ratio, price/cash flow ratio, profit margins and liquidation value.
The Fund may, from time to time, seek to hedge (protect) against currency risks, using certain currency-related derivative instruments. The Fund may also use a variety of equity-related derivatives for various purposes including enhancing Fund returns, increasing liquidity and gaining exposure to particular markets in more efficient or less expensive ways.
Manager’s Discussion
During the six months under review, key contributors to the Fund’s performance relative to the MSCI ACWI included stock selection in the materials, health care and industrials sectors, as well as underweighted allocations in the materials and industrials sectors and an overweighted allocation in the health care sector.
Within materials, Canadian mining company Wheaton Precious Metals aided relative results. Its stock performed particularly well in the first half of 2020 as the price of gold reached multi-year highs.
In the health care sector, U.S. biotechnology firm Gilead Sciences, U.S.-listed pharmaceutical products company Allergan (not held at period-end) and French pharmaceuticals firm Sanofi boosted relative performance. Gilead Sciences performed well due to indications that its remdesivir drug was a leading candidate for coronavirus treatment. The drug has received approval from the U.S. Food and Drug Administration.
In the industrials sector, U.S. diesel engine and military truck manufacturer Navistar International (not part of the index; not held at period-end) supported relative results.
Other key individual contributors to relative performance included U.S. supermarket operator Kroger, which benefited from consumer stockpiling ahead of an extended period of stay-at-home measures.
In contrast, key detractors from the Fund’s relative performance included stock selection and an underweighting in the information technology (IT) sector and stock selection in the communication services and consumer discretionary sectors.
TEMPLETON GROWTH VIP FUND
| | | | |
| Top 10 Holdings | | | |
| 6/30/20 | | | |
| |
Company Sector/Industry, Country | | % of Total Net Assets | |
Wheaton Precious Metals Corp. Metals & Mining, Canada | | | 3.2% | |
Sanofi Pharmaceuticals, France | | | 2.9% | |
Samsung Electronics Co. Ltd. Technology Hardware, Storage & Peripherals, South Korea | | | 2.7% | |
Roche Holding AG Pharmaceuticals, Switzerland | | | 2.4% | |
Verizon Communications Inc. Diversified Telecommunication Services, U.S. | | | 2.1% | |
Comcast Corp. Media, U.S. | | | 2.1% | |
E.ON SE Multi-Utilities, Germany | | | 2.1% | |
Dollar Tree Inc. Multiline Retail, U.S. | | | 2.0% | |
Siemens AG Industrial Conglomerates, Germany | | | 1.9% | |
Oracle Corp. Software, U.S. | | | 1.8% | |
Within IT, our position in Japanese electronic equipment manufacturer Kyocera hindered relative results.
In the communication services sector, our positions in Luxembourg-based communication satellite owner SES and diversified telecommunication services provider Singapore Telecommunications (not held at period-end) hindered relative results.
In consumer discretionary, our position in U.K. specialty retailer Kingfisher (not held at period-end) hurt relative performance.
Other key individual detractors from relative performance included shares in U.S. energy exploration and production firm Apache (not held at period-end), U.K.-domiciled, Asia-focused lender Standard Chartered (not held at period-end) and French banking and financial services provider BNP Paribas (not held at period-end). Apache’s shares declined as sharply lower oil prices raised concerns about cash flow pressures and balance sheet dynamics. Standard Chartered was negatively impacted by escalating turmoil in Hong Kong. BNP Paribas declined due to broad-based economic fears and low interest rates.
From a geographic perspective, stock selection and an underweighting in the Middle East and Africa, namely in Israel, contributed to the Fund’s relative performance. In North America, stock selection and an underweighting in the U.S. detracted from relative results, while stock selection in Canada contributed. In Europe, relative weakness in the U.K., France and the Netherlands more than offset relative strength in Germany and Switzerland. In Asia, our positions in China, Hong Kong and Japan hindered relative results.
Thank you for your participation in Templeton Growth VIP Fund. We look forward to serving your future investment needs.
The foregoing information reflects our analysis, opinions and portfolio holdings as of June 30, 2020, the end of the reporting period. The way we implement our main investment strategies and the resulting portfolio holdings may change depending on factors such as market and economic conditions. These opinions may not be relied upon as investment advice or an offer for a particular security. The information is not a complete analysis of every aspect of any market, country, industry, security or the Fund. Statements of fact are from sources considered reliable, but the investment manager makes no representation or warranty as to their completeness or accuracy. Although historical performance is no guarantee of future results, these insights may help you understand our investment management philosophy.
TEMPLETON GROWTH VIP FUND
Class 4 Fund Expenses
As an investor in a variable insurance contract (Contract) that indirectly provides for investment in an underlying mutual fund, you can incur transaction and/or ongoing expenses at both the Fund level and the Contract Level: (1) transaction expenses can include sales charges (loads) on purchases, surrender fees, transfer fees and premium taxes; and (2) ongoing expenses can include management fees, distribution and service (12b-1) fees, contract fees, annual maintenance fees, mortality and expense risk fees and other fees and expenses. All mutual funds and Contracts have some types of ongoing expenses. The table below shows Fund-level ongoing expenses and can help you understand these costs and compare them with those of other mutual funds offered through the Contract. The table assumes a $1,000 investment held for the six months indicated. Please refer to the Fund prospectus for additional information on operating expenses.
Actual Fund Expenses
The table below provides information about the actual account values and actual expenses in the columns under the heading “Actual.” In these columns the Fund’s actual return, which includes the effect of ongoing Fund expenses but does not include the effect of ongoing Contract expenses, is used to calculate the “Ending Account Value.” You can estimate the Fund-level expenses you paid during the period by following these steps (of course, your account value and expenses will differ from those in this illustration): Divide your account value by $1,000 (if your account had an $8,600 value, then $8,600 ÷ $1,000 = 8.6). Then multiply the result by the number under the headings “Actual” and “Fund-Level Expenses Paid During Period” (if Fund-Level Expenses Paid During Period were $ 7.50, then 8.6 x $ 7.50 = $64.50). In this illustration, the estimated expenses paid this period at the Fund level are $64.50.
Hypothetical Example for Comparison with Other Mutual Funds
Under the heading “Hypothetical” in the table, information is provided about hypothetical account values and hypothetical expenses based on the Fund’s actual expense ratio and an assumed rate of return of 5% per year before expenses, which is not the Fund’s actual return. This information may not be used to estimate the actual ending account balance or expenses you paid for the period, but it can help you compare ongoing costs of investing in the Fund with those of other mutual funds offered through the Contract. To do so, compare this 5% hypothetical example with the 5% hypothetical examples that appear in the shareholder reports of other funds offered through the Contract.
Please note that expenses shown in the table are meant to highlight ongoing costs at the Fund level only and do not reflect any ongoing expenses at the Contract level, or transaction expenses at either the Fund or Contract levels. In addition, while the Fund does not have transaction expenses, if the transaction and ongoing expenses at the Contract level were included, the expenses shown below would be higher. You should consult your Contract prospectus or disclosure document for more information.
| | | | | | | | | | | | | | | | | | |
| | | | | | | |
| | | | | | | Actual (actual return after expenses) | | | | Hypothetical (5% annual return before expenses) | | | | |
Share Class | | Beginning
Account
Value 1/1/20 | | | | Ending
Account
Value 6/30/20 | | Fund-Level
Expenses
Paid During
Period
1/1/20–6/30/201, 2 | | | | Ending Account
Value 6/30/20 | | Fund-Level
Expenses
Paid During
Period
1/1/20–6/30/201, 2 | | | | Net
Annualized
Expense
Ratio2 |
Class 4 | | $1,000 | | | | $864.80 | | $5.80 | | | | $1,018.65 | | $6.27 | | | | 1.25% |
1. Expenses are equal to the annualized expense ratio for the six-month period as indicated above—in the far right column—multiplied by the simple average account value over the period indicated, and then multiplied by 182/366 to reflect the one-half year period.
2. Reflects expenses after fee waivers and expense reimbursements. Does not include any ongoing expenses of the Contract for which the Fund is an investment option or acquired fund fees and expenses.
FRANKLIN TEMPLETON VARIABLE INSURANCE PRODUCTS TRUST
Financial Highlights
Templeton Growth VIP Fund
| | | | | | | | | | | | | | | | | | | | | | | | | | | | |
| | | |
| | | Six Months Ended June 30, 2020 (unaudited) | | | | | | Year Ended December 31, | |
| | | 2019 | | | 2018 | | | 2017 | | | 2016 | | | 2015 | |
| | | | | | | |
Class 1 | | | | | | | | | | | | | | | | | | | | | | | | | | | | |
| | | | | | | |
Per share operating performance (for a share outstanding throughout the period) | | | | | | | | | | | | | | | | | | | | | | | | | | | | |
| | | | | | | |
Net asset value, beginning of period | | | $11.15 | | | | | | | | $12.44 | | | | $16.24 | | | | $13.93 | | | | $13.54 | | | | $14.85 | |
| | | | |
| | | | | | | |
| Income from investment operationsa: | | | | | | | | | | | | | | | | | | | | | | | | | | | | |
| | | | | | | |
Net investment incomeb | | | 0.10 | | | | | | | | 0.30 | | | | 0.28 | | | | 0.29 | | | | 0.26 | | | | 0.28 | |
| | | | | | | |
Net realized and unrealized gains (losses) | | | (1.59 | ) | | | | | | | 1.30 | | | | (2.42 | ) | | | 2.30 | | | | 0.96 | | | | (1.17 | ) |
| | | | |
| | | | | | | |
Total from investment operations | | | (1.49 | ) | | | | | | | 1.60 | | | | (2.14 | ) | | | 2.59 | | | | 1.22 | | | | (0.89 | ) |
| | | | |
| | | | | | | |
| Less distributions from: | | | | | | | | | | | | | | | | | | | | | | | | | | | | |
| | | | | | | |
Net investment income | | | (0.33 | ) | | | | | | | (0.40 | ) | | | (0.35 | ) | | | (0.28 | ) | | | (0.31 | ) | | | (0.42 | ) |
| | | | | | | |
Net realized gains | | | — | | | | | | | | (2.49 | ) | | | (1.31 | ) | | | — | | | | (0.52 | ) | | | — | |
| | | | |
| | | | | | | |
Total distributions | | | (0.33 | ) | | | | | | | (2.89 | ) | | | (1.66 | ) | | | (0.28 | ) | | | (0.83 | ) | | | (0.42 | ) |
| | | | |
| | | | | | | |
Net asset value, end of period | | | $ 9.33 | | | | | | | | $11.15 | | | | $12.44 | | | | $16.24 | | | | $13.93 | | | | $13.54 | |
| | | | |
| | | | | | | |
Total returnc | | | (13.41)% | | | | | | | | 15.43% | | | | (14.61)% | | | | 18.77% | | | | 9.90% | | | | (6.24)% | |
| | | | | | | |
| Ratios to average net assetsd | | | | | | | | | | | | | | | | | | | | | | | | | | | | |
| | | | | | | |
Expensese | | | 0.90% | | | | | | | | 0.86% | | | | 0.83% | | | | 0.82%f | | | | 0.82% | | | | 0.80% | |
| | | | | | | |
Net investment income | | | 1.95% | | | | | | | | 2.52% | | | | 1.90% | | | | 1.94% | | | | 2.01% | | | | 1.96% | |
| | | | | | | |
| Supplemental data | | | | | | | | | | | | | | | | | | | | | | | | | | | | |
| | | | | | | |
Net assets, end of period (000’s) | | | $79,370 | | | | | | | | $97,988 | | | | $354,164 | | | | $466,207 | | | | $453,997 | | | | $468,548 | |
| | | | | | | |
Portfolio turnover rate | | | 46.03% | | | | | | | | 19.69% | | | | 29.25% | | | | 26.46% | | | | 22.88% | | | | 20.92% | |
aThe amount shown for a share outstanding throughout the period may not correlate with the Statement of Operations for the period due to the timing of sales and repurchases of the Fund’s shares in relation to income earned and/or fluctuating fair value of the investments of the Fund.
bBased on average daily shares outstanding.
cTotal return does not include fees, charges or expenses imposed by the variable annuity and life insurance contracts for which Franklin Templeton Variable Insurance Products Trust serves as an underlying investment vehicle. Total return is not annualized for periods less than one year.
dRatios are annualized for periods less than one year.
eBenefit of waiver and payments by affiliates rounds to less than 0.01%.
fBenefit of expense reduction rounds to less than 0.01%.
| | | | |
| | | |
| TG-6 | | Semiannual Report | The accompanying notes are an integral part of these financial statements. | | |
FRANKLIN TEMPLETON VARIABLE INSURANCE PRODUCTS TRUST
FINANCIAL HIGHLIGHTS
Templeton Growth VIP Fund (continued)
| | | | | | | | | | | | | | | | | | | | | | | | | | | | |
| | | |
| | | Six Months Ended June 30, 2020 (unaudited) | | | | | | Year Ended December 31, | |
| | | 2019 | | | 2018 | | | 2017 | | | 2016 | | | 2015 | |
| | | | | | | |
Class 2 | | | | | | | | | | | | | | | | | | | | | | | | | | | | |
| | | | | | | |
Per share operating performance
(for a share outstanding throughout the period) | | | | | | | | | | | | | | | | | | | | | | | | | | | | |
| | | | | | | |
Net asset value, beginning of period | | | $10.90 | | | | | | | | $12.21 | | | | $15.97 | | | | $13.70 | | | | $13.32 | | | | $14.61 | |
| | | | |
| | | | | | | |
| Income from investment operationsa: | | | | | | | | | | | | | | | | | | | | | | | | | | | | |
| | | | | | | |
Net investment incomeb | | | 0.08 | | | | | | | | 0.26 | | | | 0.24 | | | | 0.25 | | | | 0.23 | | | | 0.25 | |
| | | | | | | |
Net realized and unrealized gains (losses) | | | (1.55 | ) | | | | | | | 1.28 | | | | (2.38 | ) | | | 2.26 | | | | 0.94 | | | | (1.16 | ) |
| | | | |
| | | | | | | |
Total from investment operations | | | (1.47 | ) | | | | | | | 1.54 | | | | (2.14 | ) | | | 2.51 | | | | 1.17 | | | | (0.91 | ) |
| | | | |
| | | | | | | |
| Less distributions from: | | | | | | | | | | | | | | | | | | | | | | | | | | | | |
| | | | | | | |
Net investment income | | | (0.30 | ) | | | | | | | (0.36 | ) | | | (0.31 | ) | | | (0.24 | ) | | | (0.27 | ) | | | (0.38 | ) |
| | | | | | | |
Net realized gains | | | — | | | | | | | | (2.49 | ) | | | (1.31 | ) | | | — | | | | (0.52 | ) | | | — | |
| | | | |
| | | | | | | |
Total distributions | | | (0.30 | ) | | | | | | | (2.85 | ) | | | (1.62 | ) | | | (0.24 | ) | | | (0.79 | ) | | | (0.38 | ) |
| | | | |
| | | | | | | |
Net asset value, end of period | | | $ 9.13 | | | | | | | | $10.90 | | | | $12.21 | | | | $15.97 | | | | $13.70 | | | | $13.32 | |
| | | | |
| | | | | | | |
Total returnc | | | (13.52)% | | | | | | | | 15.15% | | | | (14.85)% | | | | 18.50% | | | | 9.62% | | | | (6.49)% | |
| | | | | | | |
| Ratios to average net assetsd | | | | | | | | | | | | | | | | | | | | | | | | | | | | |
| | | | | | | |
Expensese | | | 1.15% | | | | | | | | 1.11% | | | | 1.08% | | | | 1.07%f | | | | 1.07% | | | | 1.05% | |
| | | | | | | |
Net investment income | | | 1.70% | | | | | | | | 2.27% | | | | 1.65% | | | | 1.69% | | | | 1.76% | | | | 1.71% | |
| | | | | | | |
| Supplemental data | | | | | | | | | | | | | | | | | | | | | | | | | | | | |
| | | | | | | |
Net assets, end of period (000’s) | | | $521,323 | | | | | | | | $659,412 | | | | $625,311 | | | | $879,521 | | | | $876,128 | | | | $921,895 | |
| | | | | | | |
Portfolio turnover rate | | | 46.03% | | | | | | | | 19.69% | | | | 29.25% | | | | 26.46% | | | | 22.88% | | | | 20.92% | |
aThe amount shown for a share outstanding throughout the period may not correlate with the Statement of Operations for the period due to the timing of sales and repurchases of the Fund’s shares in relation to income earned and/or fluctuating fair value of the investments of the Fund.
bBased on average daily shares outstanding.
cTotal return does not include fees, charges or expenses imposed by the variable annuity and life insurance contracts for which Franklin Templeton Variable Insurance Products Trust serves as an underlying investment vehicle. Total return is not annualized for periods less than one year.
dRatios are annualized for periods less than one year.
eBenefit of waiver and payments by affiliates rounds to less than 0.01%.
fBenefit of expense reduction rounds to less than 0.01%.
| | | | | | |
| | | |
| | The accompanying notes are an integral part of these financial statements. | Semiannual Report | | | TG-7 | |
FRANKLIN TEMPLETON VARIABLE INSURANCE PRODUCTS TRUST
FINANCIAL HIGHLIGHTS
Templeton Growth VIP Fund (continued)
| | | | | | | | | | | | | | | | | | | | | | | | | | | | |
| | | |
| | | Six Months Ended June 30, 2020 (unaudited) | | | | | | Year Ended December 31, | |
| | | 2019 | | | 2018 | | | 2017 | | | 2016 | | | 2015 | |
| | | | | | | |
Class 4 | | | | | | | | | | | | | | | | | | | | | | | | | | | | |
| | | | | | | |
Per share operating performance
(for a share outstanding throughout the period) | | | | | | | | | | | | | | | | | | | | | | | | | | | | |
| | | | | | | |
Net asset value, beginning of period | | | $11.07 | | | | | | | | $12.36 | | | | $16.13 | | | | $13.83 | | | | $13.44 | | | | $14.73 | |
| | | | |
| | | | | | | |
| Income from investment operationsa: | | | | | | | | | | | | | | | | | | | | | | | | | | | | |
| | | | | | | |
Net investment incomeb | | | 0.08 | | | | | | | | 0.26 | | | | 0.23 | | | | 0.24 | | | | 0.22 | | | | 0.23 | |
| | | | | | | |
Net realized and unrealized gains (losses) | | | (1.58 | ) | | | | | | | 1.29 | | | | (2.40 | ) | | | 2.28 | | | | 0.94 | | | | (1.16 | ) |
| | | | |
| | | | | | | |
Total from investment operations | | | (1.50 | ) | | | | | | | 1.55 | | | | (2.17 | ) | | | 2.52 | | | | 1.16 | | | | (0.93 | ) |
| | | | |
| | | | | | | |
| Less distributions from: | | | | | | | | | | | | | | | | | | | | | | | | | | | | |
| | | | | | | |
Net investment income | | | (0.28 | ) | | | | | | | (0.35 | ) | | | (0.29 | ) | | | (0.22 | ) | | | (0.25 | ) | | | (0.36 | ) |
| | | | | | | |
Net realized gains | | | — | | | | | | | | (2.49 | ) | | | (1.31 | ) | | | — | | | | (0.52 | ) | | | — | |
| | | | |
| | | | | | | |
Total distributions | | | (0.28 | ) | | | | | | | (2.84 | ) | | | (1.60 | ) | | | (0.22 | ) | | | (0.77 | ) | | | (0.36 | ) |
| | | | |
| | | | | | | |
Net asset value, end of period | | | $ 9.29 | | | | | | | | $11.07 | | | | $12.36 | | | | $16.13 | | | | $13.83 | | | | $13.44 | |
| | | | |
| | | | | | | |
Total returnc | | | (13.52)% | | | | | | | | 14.97% | | | | (14.88)% | | | | 18.38% | | | | 9.47% | | | | (6.54)% | |
| | | | | | | |
| Ratios to average net assetsd | | | | | | | | | | | | | | | | | | | | | | | | | | | | |
| | | | | | | |
Expensese | | | 1.25% | | | | | | | | 1.21% | | | | 1.18% | | | | 1.17%f | | | | 1.17% | | | | 1.15% | |
| | | | | | | |
Net investment income | | | 1.60% | | | | | | | | 2.17% | | | | 1.55% | | | | 1.59% | | | | 1.66% | | | | 1.61% | |
| | | | | | | |
| Supplemental data | | | | | | | | | | | | | | | | | | | | | | | | | | | | |
| | | | | | | |
Net assets, end of period (000’s) | | | $22,083 | | | | | | | | $27,330 | | | | $28,238 | | | | $38,798 | | | | $43,286 | | | | $47,777 | |
| | | | | | | |
Portfolio turnover rate | | | 46.03% | | | | | | | | 19.69% | | | | 29.25% | | | | 26.46% | | | | 22.88% | | | | 20.92% | |
aThe amount shown for a share outstanding throughout the period may not correlate with the Statement of Operations for the period due to the timing of sales and repurchases of the Fund’s shares in relation to income earned and/or fluctuating fair value of the investments of the Fund.
bBased on average daily shares outstanding.
cTotal return does not include fees, charges or expenses imposed by the variable annuity and life insurance contracts for which Franklin Templeton Variable Insurance Products Trust serves as an underlying investment vehicle. Total return is not annualized for periods less than one year.
dRatios are annualized for periods less than one year.
eBenefit of waiver and payments by affiliates rounds to less than 0.01%.
fBenefit of expense reduction rounds to less than 0.01%.
| | | | |
| | | |
| TG-8 | | Semiannual Report | The accompanying notes are an integral part of these financial statements. | | |
FRANKLIN TEMPLETON VARIABLE INSURANCE PRODUCTS TRUST
Statement of Investments, June 30, 2020 (unaudited)
| | | | | | | | | | | | | | |
| | | |
Templeton Growth VIP Fund | | | | | | | | | |
| | | | | Country | | | Shares | | | Value | |
| | | | |
| | Common Stocks 86.3% | | | | | | | | | | | | |
| | Aerospace & Defense 0.9% | | | | | | | | | | | | |
| | BAE Systems PLC | | | United Kingdom | | | | 936,202 | | | $ | 5,597,756 | |
| | | | | | | | | | | | | | |
| | Air Freight & Logistics 1.3% | | | | | | | | | | | | |
| | United Parcel Service Inc., B | | | United States | | | | 70,479 | | | | 7,835,855 | |
| | | | | | | | | | | | | | |
| | Airlines 0.6% | | | | | | | | | | | | |
| | Japan Airlines Co. Ltd. | | | Japan | | | | 197,900 | | | | 3,571,208 | |
| | | | | | | | | | | | | | |
| | Auto Components 1.0% | | | | | | | | | | | | |
| | BorgWarner Inc. | | | United States | | | | 93,910 | | | | 3,315,023 | |
| | Lear Corp. | | | United States | | | | 27,913 | | | | 3,043,075 | |
| | | | | | | | | | | | | | |
| | | | |
| | | | | | | | | | | | | 6,358,098 | |
| | | | | | | | | | | | | | |
| | Automobiles 1.8% | | | | | | | | | | | | |
| | Honda Motor Co. Ltd. | | | Japan | | | | 316,000 | | | | 8,169,776 | |
| | Isuzu Motors Ltd. | | | Japan | | | | 304,100 | | | | 2,763,459 | |
| | | | | | | | | | | | | | |
| | | | |
| | | | | | | | | | | | | 10,933,235 | |
| | | | | | | | | | | | | | |
| | Banks 2.6% | | | | | | | | | | | | |
| | Bangkok Bank PCL, fgn | | | Thailand | | | | 1,552,060 | | | | 5,418,671 | |
| | KB Financial Group Inc. | | | South Korea | | | | 159,595 | | | | 4,530,159 | |
| | Sumitomo Mitsui Financial Group Inc. | | | Japan | | | | 226,060 | | | | 6,379,818 | |
| | | | | | | | | | | | | | |
| | | | |
| | | | | | | | | | | | | 16,328,648 | |
| | | | | | | | | | | | | | |
| | Beverages 5.4% | | | | | | | | | | | | |
| | Anheuser-Busch InBev SA/NV | | | Belgium | | | | 229,367 | | | | 11,305,966 | |
| a | | Kirin Holdings Co. Ltd. | | | Japan | | | | 497,400 | | | | 10,485,065 | |
| | Pernod Ricard SA | | | France | | | | 31,230 | | | | 4,917,237 | |
| | Suntory Beverage & Food Ltd. | | | Japan | | | | 185,560 | | | | 7,240,223 | |
| | | | | | | | | | | | | | |
| | | | |
| | | | | | | | | | | | | 33,948,491 | |
| | | | | | | | | | | | | | |
| | Biotechnology 2.3% | | | | | | | | | | | | |
| | AbbVie Inc. | | | United States | | | | 45,763 | | | | 4,493,011 | |
| | Gilead Sciences Inc. | | | United States | | | | 125,136 | | | | 9,627,964 | |
| | | | | | | | | | | | | | |
| | | | |
| | | | | | | | | | | | | 14,120,975 | |
| | | | | | | | | | | | | | |
| | Chemicals 0.7% | | | | | | | | | | | | |
| | DuPont de Nemours Inc. | | | United States | | | | 86,981 | | | | 4,621,301 | |
| | | | | | | | | | | | | | |
| | Diversified Telecommunication Services 2.1% | | | | | | | | | | | | |
| | Verizon Communications Inc. | | | United States | | | | 240,340 | | | | 13,249,944 | |
| | | | | | | | | | | | | | |
| | Electrical Equipment 1.2% | | | | | | | | | | | | |
| | Mitsubishi Electric Corp. | | | Japan | | | | 565,700 | | | | 7,388,758 | |
| | | | | | | | | | | | | | |
| | Electronic Equipment, Instruments & Components 1.7% | | | | | | | | | | | | |
| | Kyocera Corp. | | | Japan | | | | 192,100 | | | | 10,485,694 | |
| | | | | | | | | | | | | | |
| | Entertainment 1.0% | | | | | | | | | | | | |
| | The Walt Disney Co. | | | United States | | | | 56,090 | | | | 6,254,596 | |
| | | | | | | | | | | | | | |
| | Food & Staples Retailing 4.0% | | | | | | | | | | | | |
| | The Kroger Co. | | | United States | | | | 262,521 | | | | 8,886,336 | |
| | Seven & i Holdings Co. Ltd. | | | Japan | | | | 233,500 | | | | 7,638,607 | |
| | Sysco Corp. | | | United States | | | | 150,174 | | | | 8,208,511 | |
| | | | | | | | | | | | | | |
| | | | |
| | | | | | | | | | | | | 24,733,454 | |
| | | | | | | | | | | | | | |
FRANKLIN TEMPLETON VARIABLE INSURANCE PRODUCTS TRUST
STATEMENT OF INVESTMENTS (UNAUDITED)
Templeton Growth VIP Fund (continued)
| | | | | | | | | | | | | | |
| | | | | Country | | | Shares | | | Value | |
| | | | |
| | Common Stocks (continued) | | | | | | | | | | | | |
| | Food Products 1.5% | | | | | | | | | | | | |
| | Kellogg Co. | | | United States | | | | 144,817 | | | $ | 9,566,611 | |
| | | | | | | | | | | | | | |
| | Gas Utilities 0.5% | | | | | | | | | | | | |
| | Kunlun Energy Co. Ltd. | | | China | | | | 4,364,470 | | | | 2,858,389 | |
| | | | | | | | | | | | | | |
| | Health Care Equipment & Supplies 1.5% | | | | | | | | | | | | |
| | Medtronic PLC | | | United States | | | | 46,160 | | | | 4,232,872 | |
| | Zimmer Biomet Holdings Inc | | | United States | | | | 40,829 | | | | 4,873,349 | |
| | | | | | | | | | | | | | |
| | | | |
| | | | | | | | | | | | | 9,106,221 | |
| | | | | | | | | | | | | | |
| | Health Care Providers & Services 0.5% | | | | | | | | | | | | |
| b | | Laboratory Corp. of America Holdings | | | United States | | | | 19,533 | | | | 3,244,627 | |
| | | | | | | | | | | | | | |
| | Hotels, Restaurants & Leisure 4.8% | | | | | | | | | | | | |
| | Compass Group PLC | | | United Kingdom | | | | 366,778 | | | | 5,046,095 | |
| | Galaxy Entertainment Group Ltd. | | | Macau | | | | 1,031,300 | | | | 7,074,411 | |
| | InterContinental Hotels Group PLC | | | United Kingdom | | | | 96,760 | | | | 4,271,311 | |
| | Starbucks Corp. | | | United States | | | | 46,480 | | | | 3,420,463 | |
| | Whitbread PLC | | | United Kingdom | | | | 45,548 | | | | 1,253,089 | |
| | Yum China Holdings Inc. | | | China | | | | 181,361 | | | | 8,718,023 | |
| | | | | | | | | | | | | | |
| | | | |
| | | | | | | | | | | | | 29,783,392 | |
| | | | | | | | | | | | | | |
| | Household Durables 3.2% | | | | | | | | | | | | |
| | Gree Electric Appliances Inc. of Zhuhai | | | China | | | | 379,820 | | | | 3,054,252 | |
| | Panasonic Corp. | | | Japan | | | | 1,127,450 | | | | 9,886,661 | |
| | Sony Corp. | | | Japan | | | | 98,620 | | | | 6,807,751 | |
| | | | | | | | | | | | | | |
| | | | |
| | | | | | | | | | | | | 19,748,664 | |
| | | | | | | | | | | | | | |
| | Industrial Conglomerates 1.9% | | | | | | | | | | | | |
| | Siemens AG | | | Germany | | | | 100,557 | | | | 11,858,349 | |
| | | | | | | | | | | | | | |
| | Insurance 1.5% | | | | | | | | | | | | |
| | AIA Group Ltd. | | | Hong Kong | | | | 977,000 | | | | 9,142,317 | |
| | | | | | | | | | | | | | |
| | Interactive Media & Services 1.0% | | | | | | | | | | | | |
| b | | Baidu Inc., ADR | | | China | | | | 50,650 | | | | 6,072,429 | |
| | | | | | | | | | | | | | |
| | Internet & Direct Marketing Retail 2.7% | | | | | | | | | | | | |
| b | | Alibaba Group Holding Ltd. | | | China | | | | 280,370 | | | | 7,565,395 | |
| b | | Booking Holdings Inc. | | | United States | | | | 5,950 | | | | 9,474,423 | |
| | | | | | | | | | | | | | |
| | | | |
| | | | | | | | | | | | | 17,039,818 | |
| | | | | | | | | | | | | | |
| | IT Services 0.4% | | | | | | | | | | | | |
| b | | EPAM Systems Inc. | | | United States | | | | 11,016 | | | | 2,776,142 | |
| | | | | | | | | | | | | | |
| | Machinery 2.7% | | | | | | | | | | | | |
| | Komatsu Ltd. | | | Japan | | | | 440,500 | | | | 9,021,669 | |
| | Makita Corp. | | | Japan | | | | 137,200 | | | | 4,989,203 | |
| | Stanley Black & Decker Inc. | | | United States | | | | 22,400 | | | | 3,122,112 | |
| | | | | | | | | | | | | | |
| | | | |
| | | | | | | | | | | | | 17,132,984 | |
| | | | | | | | | | | | | | |
| | Marine 1.4% | | | | | | | | | | | | |
| | AP Moeller-Maersk A/S, B | | | Denmark | | | | 7,724 | | | | 9,051,690 | |
| | | | | | | | | | | | | | |
FRANKLIN TEMPLETON VARIABLE INSURANCE PRODUCTS TRUST
STATEMENT OF INVESTMENTS (UNAUDITED)
Templeton Growth VIP Fund (continued)
| | | | | | | | | | | | | | |
| | | | | Country | | | Shares | | | Value | |
| | Common Stocks (continued) | | | | | | | | | | | | |
| | Media 3.0% | | | | | | | | | | | | |
| | Comcast Corp., A | | | United States | | | | 333,281 | | | $ | 12,991,293 | |
| | SES SA, IDR | | | Luxembourg | | | | 881,520 | | | | 6,022,792 | |
| | | | | | | | | | | | | | |
| | | | |
| | | | | | | | | | | | | 19,014,085 | |
| | | | | | | | | | | | | | |
| | Metals & Mining 5.4% | | | | | | | | | | | | |
| b | | ArcelorMittal SA | | | France | | | | 505,963 | | | | 5,358,614 | |
| | Freeport-McMoRan Inc. | | | United States | | | | 734,044 | | | | 8,492,889 | |
| | Wheaton Precious Metals Corp. | | | Canada | | | | 453,417 | | | | 19,942,933 | |
| | | | | | | | | | | | | | |
| | | | |
| | | | | | | | | | | | | 33,794,436 | |
| | | | | | | | | | | | | | |
| | Multiline Retail 2.1% | | | | | | | | | | | | |
| b | | Dollar Tree Inc. | | | United States | | | | 138,022 | | | | 12,791,879 | |
| | | | | | | | | | | | | | |
| | Multi-Utilities 3.2% | | | | | | | | | | | | |
| | E.ON SE | | | Germany | | | | 1,144,619 | | | | 12,918,941 | |
| | Veolia Environnement SA | | | France | | | | 299,720 | | | | 6,767,422 | |
| | | | | | | | | | | | | | |
| | | | |
| | | | | | | | | | | | | 19,686,363 | |
| | | | | | | | | | | | | | |
| | Oil, Gas & Consumable Fuels 2.8% | | | | | | | | | | | | |
| | BP PLC | | | United Kingdom | | | | 2,100,831 | | | | 8,048,044 | |
| | Husky Energy Inc. | | | Canada | | | | 686,221 | | | | 2,254,463 | |
| | Royal Dutch Shell PLC, B | | | United Kingdom | | | | 467,119 | | | | 7,081,374 | |
| | | | | | | | | | | | | | |
| | | | |
| | | | | | | | | | | | | 17,383,881 | |
| | | | | | | | | | | | | | |
| | Pharmaceuticals 8.6% | | | | | | | | | | | | |
| | Bayer AG | | | Germany | | | | 150,406 | | | | 11,147,627 | |
| | Roche Holding AG | | | Switzerland | | | | 42,833 | | | | 14,839,473 | |
| | Sanofi | | | France | | | | 177,087 | | | | 18,058,539 | |
| | Takeda Pharmaceutical Co. Ltd. | | | Japan | | | | 261,562 | | | | 9,397,383 | |
| | | | | | | | | | | | | | |
| | | | |
| | | | | | | | | | | | | 53,443,022 | |
| | | | | | | | | | | | | | |
| | Real Estate Management & Development 1.1% | | | | | | | | | | | | |
| | CK Asset Holdings Ltd. | | | Hong Kong | | | | 824,190 | | | | 4,942,463 | |
| | Sun Hung Kai Properties Ltd. | | | Hong Kong | | | | 145,260 | | | | 1,855,718 | |
| | | | | | | | | | | | | | |
| | | | |
| | | | | | | | | | | | | 6,798,181 | |
| | | | | | | | | | | | | | |
| | Road & Rail 0.6% | | | | | | | | | | | | |
| | East Japan Railway Co. | | | Japan | | | | 31,800 | | | | 2,203,589 | |
| | Keisei Electric Railway Co. Ltd. | | | Japan | | | | 44,600 | | | | 1,397,782 | |
| | | | | | | | | | | | | | |
| | | | |
| | | | | | | | | | | | | 3,601,371 | |
| | | | | | | | | | | | | | |
| | Semiconductors & Semiconductor Equipment 1.0% | | | | | | | | | | | | |
| | NXP Semiconductors NV | | | Netherlands | | | | 55,236 | | | | 6,299,113 | |
| | | | | | | | | | | | | | |
| | Software 1.8% | | | | | | | | | | | | |
| | Oracle Corp. | | | United States | | | | 208,438 | | | | 11,520,368 | |
| | | | | | | | | | | | | | |
| | Specialty Retail 2.1% | | | | | | | | | | | | |
| | Ross Stores Inc. | | | United States | | | | 72,630 | | | | 6,190,981 | |
| | The TJX Cos. Inc. | | | United States | | | | 132,377 | | | | 6,692,981 | |
| | | | | | | | | | | | | | |
| | | | |
| | | | | | | | | | | | | 12,883,962 | |
| | | | | | | | | | | | | | |
| | Technology Hardware, Storage & Peripherals 2.7% | | | | | | | | | | | | |
| | Samsung Electronics Co. Ltd. | | | South Korea | | | | 373,630 | | | | 16,583,973 | |
| | | | | | | | | | | | | | |
FRANKLIN TEMPLETON VARIABLE INSURANCE PRODUCTS TRUST
STATEMENT OF INVESTMENTS (UNAUDITED)
Templeton Growth VIP Fund (continued)
| | | | | | | | | | | | | | |
| | | | | Country | | | Shares | | | Value | |
| | | | |
| | Common Stocks (continued) | | | | | | | | | | | | |
| | Textiles, Apparel & Luxury Goods 1.7% | | | | | | | | | | | | |
| b | | Adidas AG | | | Germany | | | | 14,503 | | | $ | 3,823,399 | |
| | Burberry Group PLC | | | United Kingdom | | | | 355,780 | | | | 7,029,960 | |
| | | | | | | | | | | | | | |
| | | | |
| | | | | | | | | | | | | 10,853,359 | |
| | | | | | | | | | | | | | |
| | | | |
| | Total Common Stocks (Cost $502,481,970) | | | | | | | | | | | 537,463,639 | |
| | | | | | | | | | | | | | |
| | | | |
| | | | | | | | Principal
Amount* | | | | |
| | Short Term Investments 9.5% | | | | | | | | | | | | |
| | | | |
| | U.S. Government and Agency Securities (Cost $400,000) 0.1% | | | | | | | | | | | | |
| c | | FFCB, 7/01/20 | | | United States | | | $ | 400,000 | | | | 400,000 | |
| | | | | | | | | | | | | | |
| | Time Deposits 7.7% | | | | | | | | | | | | |
| | BNP Paribas SA/New York NY, 0.06%, 7/01/20 | | | France | | | | 28,000,000 | | | | 28,000,000 | |
| | Royal Bank of Canada, 0.08%, 7/01/20 | | | Canada | | | | 20,000,000 | | | | 20,000,000 | |
| | | | | | | | | | | | | | |
| | | | |
| | Total Time Deposits (Cost $48,000,000) | | | | | | | | | | | 48,000,000 | |
| | | | | | | | | | | | | | |
| | | | |
| | | | | | | | Shares | | | | |
| | Investments from Cash Collateral Received for Loaned Securities 1.7% | | | | | | | | | | | | |
| | | | |
| | Money Market Funds (Cost $10,490,166) 1.7% | | | | | | | | | | | | |
| d,e | | Institutional Fiduciary Trust Money Market Portfolio, 0.00% | | | United States | | | | 10,490,166 | | | | 10,490,166 | |
| | | | | | | | | | | | | | |
| | | | |
| | Total Investments (Cost $561,372,136) 95.8% | | | | | | | | | | | 596,353,805 | |
| | | | |
| | Other Assets, less Liabilities 4.2% | | | | | | | | | | | 26,422,056 | |
| | | | | | | | | | | | | | |
| | | | |
| | Net Assets 100.0% | | | | | | | | | | $ | 622,775,861 | |
| | | | | | | | | | | | | | |
See Abbreviations on page TG-24.
*The principal amount is stated in U.S. dollars unless otherwise indicated.
aA portion or all of the security is on loan at June 30, 2020. See Note 1(c).
bNon-income producing.
cThe security was issued on a discount basis with no stated coupon rate.
dSee Note 3(e) regarding investments in affiliated management investment companies.
eThe rate shown is the annualized seven-day effective yield at period end.
| | | | |
| | | |
| TG-12 | | Semiannual Report | The accompanying notes are an integral part of these financial statements. | | |
FRANKLIN TEMPLETON VARIABLE INSURANCE PRODUCTS TRUST
FINANCIAL STATEMENTS
Statement of Assets and Liabilities
June 30, 2020 (unaudited)
| | | | |
Assets: | | | | |
Investments in securities: | | | | |
Cost - Unaffiliated issuers | | $ | 550,881,970 | |
Cost - Non-controlled affiliates (Note 3e) | | | 10,490,166 | |
| | | | |
Value - Unaffiliated issuers+ | | $ | 585,863,639 | |
Value - Non-controlled affiliates (Note 3e) | | | 10,490,166 | |
Cash | | | 6,514 | |
Foreign currency, at value (cost $34,109,277) | | | 33,994,768 | |
Receivables: | | | | |
Investment securities sold | | | 1,577,822 | |
Capital shares sold | | | 600,726 | |
Dividends and interest | | | 1,697,996 | |
European Union tax reclaims | | | 787,852 | |
Other assets | | | 594 | |
| | | | |
| |
Total assets | | | 635,020,077 | |
| | | | |
Liabilities: | | | | |
Payables: | | | | |
Investment securities purchased | | | 532,391 | |
Capital shares redeemed | | | 410,181 | |
Management fees | | | 436,346 | |
Distribution fees | | | 114,738 | |
Payable upon return of securities loaned | | | 10,490,166 | |
Accrued expenses and other liabilities | | | 260,394 | |
| | | | |
| |
Total liabilities | | | 12,244,216 | |
| | | | |
| |
Net assets, at value | | $ | 622,775,861 | |
| | | | |
Net assets consist of: | | | | |
Paid-in capital | | $ | 670,491,362 | |
Total distributable earnings (losses) | | | (47,715,501 | ) |
| | | | |
| |
Net assets, at value | | $ | 622,775,861 | |
| | | | |
| |
| Class 1: | | | | |
Net assets, at value | | $ | 79,369,895 | |
| | | | |
Shares outstanding | | | 8,504,503 | |
| | | | |
| |
Net asset value and maximum offering price per share | | | $9.33 | |
| | | | |
| |
| Class 2: | | | | |
Net assets, at value | | $ | 521,322,739 | |
| | | | |
Shares outstanding | | | 57,079,661 | |
| | | | |
| |
Net asset value and maximum offering price per share | | | $9.13 | |
| | | | |
| |
| Class 4: | | | | |
Net assets, at value | | $ | 22,083,227 | |
| | | | |
| |
Shares outstanding | | | 2,377,705 | |
| | | | |
| |
Net asset value and maximum offering price per share | | | $9.29 | |
| | | | |
| |
+Includes securities loaned | | $ | 9,960,811 | |
| | | | | | |
| | | |
| | The accompanying notes are an integral part of these financial statements. | Semiannual Report | | | TG-13 | |
FRANKLIN TEMPLETON VARIABLE INSURANCE PRODUCTS TRUST
FINANCIAL STATEMENTS
Statement of Operations
for the six months ended June 30, 2020 (unaudited)
| | | | |
| |
| | | Templeton Growth VIP Fund | |
Investment income: | | | | |
Dividends:(net of foreign taxes)* | | | | |
Unaffiliated issuers | | $ | 9,136,701 | |
Interest: | | | | |
Unaffiliated issuers | | | 138,349 | |
Income from securities loaned: | | | | |
Unaffiliated entities (net of fees and rebates) | | | 9,982 | |
Non-controlled affiliates (Note 3e) | | | 1,609 | |
| | | | |
| |
Total investment income | | | 9,286,641 | |
| | | | |
Expenses: | | | | |
Management fees (Note 3a) | | | 2,742,841 | |
Distribution fees: (Note 3c) | | | | |
Class 2 | | | 683,322 | |
Class 4 | | | 40,255 | |
Custodian fees (Note 4) | | | 66,119 | |
Reports to shareholders | | | 83,758 | |
Professional fees | | | 53,098 | |
Trustees’ fees and expenses | | | 2,617 | |
Other | | | (2,366 | ) |
| | | | |
| |
Total expenses | | | 3,669,644 | |
Expenses waived/paid by affiliates (Note 3e) | | | (4,997 | ) |
| | | | |
| |
Net expenses | | | 3,664,647 | |
| | | | |
| |
Net investment income | | | 5,621,994 | |
| | | | |
Realized and unrealized gains (losses): | | | | |
Net realized gain (loss) from: | | | | |
Investments:# | | | | |
Unaffiliated issuers | | | (69,975,086 | ) |
Foreign currency transactions | | | 312,185 | |
| | | | |
| |
Net realized gain (loss) | | | (69,662,901 | ) |
| | | | |
Net change in unrealized appreciation (depreciation) on: | | | | |
Investments: | | | | |
Unaffiliated issuers | | | (40,871,435 | ) |
Translation of other assets and liabilities denominated in foreign currencies | | | (162,654 | ) |
Change in deferred taxes on unrealized appreciation | | | 388,289 | |
| | | | |
| |
Net change in unrealized appreciation (depreciation) | | | (40,645,800 | ) |
| | | | |
| |
Net realized and unrealized gain (loss) | | | (110,308,701 | ) |
| | | | |
| |
Net increase (decrease) in net assets resulting from operations | | $ | (104,686,707 | ) |
| | | | |
| |
*Foreign taxes withheld on dividends | | $ | 852,011 | |
#Net of foreign taxes | | $ | 523,662 | |
| | | | |
| | | |
| TG-14 | | Semiannual Report | The accompanying notes are an integral part of these financial statements. | | |
FRANKLIN TEMPLETON VARIABLE INSURANCE PRODUCTS TRUST
FINANCIAL STATEMENTS
Statements of Changes in Net Assets
| | | | | | | | |
| |
| | | Templeton Growth
VIP Fund | |
| | |
| | | Six Months Ended June 30, 2020 (unaudited) | | | Year Ended December 31, 2019 | |
Increase (decrease) in net assets: | | | | | | | | |
Operations: | | | | | | | | |
Net investment income | | $ | 5,621,994 | | | | $ 19,938,552 | |
Net realized gain (loss) | | | (69,662,901 | ) | | | (13,584,687 | ) |
Net change in unrealized appreciation (depreciation) | | | (40,645,800 | ) | | | 128,174,019 | |
| | | | |
| | |
Net increase (decrease) in net assets resulting from operations | | | (104,686,707 | ) | | | 134,527,884 | |
| | | | |
| | |
Distributions to shareholders: | | | | | | | | |
Class 1 | | | (2,680,578 | ) | | | (20,901,613 | ) |
Class 2 | | | (16,492,099 | ) | | | (139,418,589 | ) |
Class 4 | | | (659,619 | ) | | | (6,044,047 | ) |
| | | | |
| | |
Total distributions to shareholders | | | (19,832,296 | ) | | | (166,364,249 | ) |
| | | | |
| | |
Capital share transactions: (Note 2) | | | | | | | | |
Class 1 | | | (3,075,020 | ) | | | (275,115,440 | ) |
Class 2 | | | (33,359,573 | ) | | | 82,734,600 | |
Class 4 | | | (1,000,215 | ) | | | 1,233,451 | |
| | | | |
| | |
Total capital share transactions | | | (37,434,808 | ) | | | (191,147,389 | ) |
| | | | |
| | |
Net increase (decrease) in net assets | | | (161,953,811 | ) | | | (222,983,754 | ) |
Net assets: | | | | | | | | |
Beginning of period | | | 784,729,672 | | | | 1,007,713,426 | |
| | | | |
| | |
End of period | | $ | 622,775,861 | | | | $ 784,729,672 | |
| | | | |
| | | | | | |
| | | |
| | The accompanying notes are an integral part of these financial statements. | Semiannual Report | | | TG-15 | |
FRANKLIN TEMPLETON VARIABLE INSURANCE PRODUCTS TRUST
Notes to Financial Statements (unaudited)
Templeton Growth VIP Fund
1. Organization and Significant Accounting Policies
Franklin Templeton Variable Insurance Products Trust (Trust) is registered under the Investment Company Act of 1940 (1940 Act) as an open-end management investment company, consisting of eighteen separate funds and applies the specialized accounting and reporting guidance in U.S. Generally Accepted Accounting Principles (U.S. GAAP). Templeton Growth VIP Fund (Fund) is included in this report. Shares of the Fund are generally sold only to insurance company separate accounts to fund the benefits of variable life insurance policies or variable annuity contracts. The Fund offers three classes of shares: Class 1, Class 2 and Class 4. Each class of shares may differ by its distribution fees, voting rights on matters affecting a single class and its exchange privilege.
The following summarizes the Fund’s significant accounting policies.
a. Financial Instrument Valuation
The Fund’s investments in financial instruments are carried at fair value daily. Fair value is the price that would be received to sell an asset or paid to transfer a liability in an orderly transaction between market participants on the measurement date. The Fund calculates the net asset value (NAV) per share each business day as of 4 p.m. Eastern time or the regularly scheduled close of the New York Stock Exchange (NYSE), whichever is earlier. Under compliance policies and procedures approved by the Trust’s Board of Trustees (the Board), the Fund’s administrator has responsibility for oversight of valuation, including leading the cross-functional Valuation Committee (VC). The Fund may utilize independent pricing services, quotations from securities and financial instrument dealers, and other market sources to determine fair value.
Equity securities listed on an exchange or on the NASDAQ National Market System are valued at the last quoted sale price or the official closing price of the day, respectively. Foreign equity securities are valued as of the close of trading on the foreign stock exchange on which the security is primarily traded, or as of 4 p.m. Eastern time. The value is then converted into its U.S. dollar equivalent at the foreign exchange rate in effect at 4 p.m. Eastern time on the day that the value of the security is determined. Over-the-counter (OTC) securities are valued within the range of the most recent quoted bid and ask prices. Securities that trade in multiple markets or on multiple exchanges are valued
according to the broadest and most representative market. Certain equity securities are valued based upon fundamental characteristics or relationships to similar securities.
Debt securities generally trade in the OTC market rather than on a securities exchange. The Fund’s pricing services use multiple valuation techniques to determine fair value. In instances where sufficient market activity exists, the pricing services may utilize a market-based approach through which quotes from market makers are used to determine fair value. In instances where sufficient market activity may not exist or is limited, the pricing services also utilize proprietary valuation models which may consider market characteristics such as benchmark yield curves, credit spreads, estimated default rates, anticipated market interest rate volatility, coupon rates, anticipated timing of principal repayments, underlying collateral, and other unique security features in order to estimate the relevant cash flows, which are then discounted to calculate the fair value.
Investments in open-end mutual funds are valued at the closing NAV. Investments in time deposits are valued at cost, which approximates fair value.
The Fund has procedures to determine the fair value of financial instruments for which market prices are not reliable or readily available. Under these procedures, the Fund primarily employs a market-based approach which may use related or comparable assets or liabilities, recent transactions, market multiples, book values, and other relevant information for the investment to determine the fair value of the investment. An income-based valuation approach may also be used in which the anticipated future cash flows of the investment are discounted to calculate fair value. Discounts may also be applied due to the nature or duration of any restrictions on the disposition of the investments. Due to the inherent uncertainty of valuations of such investments, the fair values may differ significantly from the values that would have been used had an active market existed.
Trading in securities on foreign securities stock exchanges and OTC markets may be completed before 4 p.m. Eastern time. In addition, trading in certain foreign markets may not take place on every Fund’s business day. Events can occur between the time at which trading in a foreign security is completed and 4 p.m. Eastern time that might call into question the reliability of the value of a portfolio security held by the Fund. As a result, differences may arise between the value of the Fund’s portfolio securities as determined at the
FRANKLIN TEMPLETON VARIABLE INSURANCE PRODUCTS TRUST
NOTES TO FINANCIAL STATEMENTS (UNAUDITED)
Templeton Growth VIP Fund (continued)
foreign market close and the latest indications of value at 4 p.m. Eastern time. In order to minimize the potential for these differences, an independent pricing service may be used to adjust the value of the Fund’s portfolio securities to the latest indications of fair value at 4 p.m Eastern time. At June 30, 2020, certain securities may have been fair valued using these procedures, in which case the securities were categorized as Level 2 inputs within the fair value hierarchy. See the Fair Value Measurements note for more information.
When the last day of the reporting period is a non-business day, certain foreign markets may be open on those days that the Fund’s NAV is not calculated, which could result in differences between the value of the Fund’s portfolio securities on the last business day and the last calendar day of the reporting period. Any significant security valuation changes due to an open foreign market are adjusted and reflected by the Fund for financial reporting purposes.
b. Foreign Currency Translation
Portfolio securities and other assets and liabilities denominated in foreign currencies are translated into U.S. dollars based on the exchange rate of such currencies against U.S. dollars on the date of valuation. The Fund may enter into foreign currency exchange contracts to facilitate transactions denominated in a foreign currency. Purchases and sales of securities, income and expense items denominated in foreign currencies are translated into U.S. dollars at the exchange rate in effect on the transaction date. Portfolio securities and assets and liabilities denominated in foreign currencies contain risks that those currencies will decline in value relative to the U.S. dollar. Occasionally, events may impact the availability or reliability of foreign exchange rates used to convert the U.S. dollar equivalent value. If such an event occurs, the foreign exchange rate will be valued at fair value using procedures established and approved by the Board.
The Fund does not separately report the effect of changes in foreign exchange rates from changes in market prices on securities held. Such changes are included in net realized and unrealized gain or loss from investments in the Statement of Operations.
Realized foreign exchange gains or losses arise from sales of foreign currencies, currency gains or losses realized between the trade and settlement dates on securities transactions and the difference between the recorded amounts of dividends, interest, and foreign withholding taxes and the U.S. dollar
equivalent of the amounts actually received or paid. Net unrealized foreign exchange gains and losses arise from changes in foreign exchange rates on foreign denominated assets and liabilities other than investments in securities held at the end of the reporting period.
c. Securities Lending
The Fund participates in an agency based securities lending program to earn additional income. The Fund receives cash collateral against the loaned securities in an amount equal to at least 102% of the fair value of the loaned securities. Collateral is maintained over the life of the loan in an amount not less than 100% of the fair value of loaned securities, as determined at the close of Fund business each day; any additional collateral required due to changes in security values is delivered to the Fund on the next business day. The collateral is deposited into a joint cash account with other funds and is used to invest in a money market fund managed by Franklin Advisers, Inc., an affiliate of the Fund. The Fund may receive income from the investment of cash collateral, in addition to lending fees and rebates paid by the borrower. Income from securities loaned, net of fees paid to the securities lending agent and/or third-party vendor, is reported separately in the Statement of Operations. The Fund bears the market risk with respect to the collateral investment, securities loaned, and the risk that the agent may default on its obligations to the Fund. If the borrower defaults on its obligation to return the securities loaned, the Fund has the right to repurchase the securities in the open market using the collateral received. The securities lending agent has agreed to indemnify the Fund in the event of default by a third party borrower.
d. Income and Deferred Taxes
It is the Fund’s policy to qualify as a regulated investment company under the Internal Revenue Code. The Fund intends to distribute to shareholders substantially all of its taxable income and net realized gains to relieve it from federal income and if applicable, excise taxes. As a result, no provision for U.S. federal income taxes is required.
The Fund may be subject to foreign taxation related to income received, capital gains on the sale of securities and certain foreign currency transactions in the foreign jurisdictions in which it invests. Foreign taxes, if any, are recorded based on the tax regulations and rates that exist in the foreign markets in which the Fund invests. When a capital
FRANKLIN TEMPLETON VARIABLE INSURANCE PRODUCTS TRUST
NOTES TO FINANCIAL STATEMENTS (UNAUDITED)
Templeton Growth VIP Fund (continued)
1. Organization and Significant Accounting Policies (continued)
d. Income and Deferred Taxes (continued)
gain tax is determined to apply, the Fund records an estimated deferred tax liability in an amount that would be payable if the securities were disposed of on the valuation date.
As a result of several court cases, in certain countries across the European Union, the Fund filed additional tax reclaims for previously withheld taxes on dividends earned in those countries (EU reclaims). These additional filings are subject to various administrative proceedings by the local jurisdictions’ tax authorities within the European Union, as well as a number of related judicial proceedings. Income recognized, if any, for EU reclaims is reflected as other income in the Statement of Operations and any related receivable, if any, is reflected as European Union tax reclaims in the Statement of Assets and Liabilities. When uncertainty exists as to the ultimate resolution of these proceedings, the likelihood of receipt of these EU reclaims, and the potential timing of payment, no amounts are reflected in the financial statements. For U.S. income tax purposes, when EU reclaims are received by the Fund and the Fund previously passed foreign tax credit on to its shareholders, the Fund must either amend historic tax reporting to shareholders or enter into a closing agreement with the Internal Revenue Service (IRS) in order to pay the associated tax liability on behalf of the Fund’s shareholders.
The Fund may recognize an income tax liability related to its uncertain tax positions under U.S. GAAP when the uncertain tax position has a less than 50% probability that it will be sustained upon examination by the tax authorities based on its technical merits. As of June 30, 2020, the Fund has determined that no tax liability is required in its financial statements related to uncertain tax positions for any open tax years (or expected to be taken in future tax years). Open tax years are those that remain subject to examination and are based on the statute of limitations in each jurisdiction in which the Fund invests.
e. Security Transactions, Investment Income, Expenses and Distributions
Security transactions are accounted for on trade date. Realized gains and losses on security transactions are determined on a specific identification basis. Interest income
and estimated expenses are accrued daily. Dividend income and capital gain distributions are recorded on the ex-dividend date except for certain dividends from securities where the dividend rate is not available. In such cases, the dividend is recorded as soon as the information is received by the Fund. Distributions to shareholders are recorded on the ex-dividend date. Distributable earnings are determined according to income tax regulations (tax basis) and may differ from earnings recorded in accordance with U.S. GAAP. These differences may be permanent or temporary. Permanent differences are reclassified among capital accounts to reflect their tax character. These reclassifications have no impact on net assets or the results of operations. Temporary differences are not reclassified, as they may reverse in subsequent periods.
Common expenses incurred by the Trust are allocated among the Funds based on the ratio of net assets of each Fund to the combined net assets of the Trust or based on the ratio of number of shareholders of each Fund to the combined number of shareholders of the Trust. Fund specific expenses are charged directly to the Fund that incurred the expense.
Realized and unrealized gains and losses and net investment income, excluding class specific expenses, are allocated daily to each class of shares based upon the relative proportion of net assets of each class. Differences in per share distributions by class are generally due to differences in class specific expenses.
f. Accounting Estimates
The preparation of financial statements in accordance with U.S. GAAP requires management to make estimates and assumptions that affect the reported amounts of assets and liabilities at the date of the financial statements and the amounts of income and expenses during the reporting period. Actual results could differ from those estimates.
g. Guarantees and Indemnifications
Under the Trust’s organizational documents, its officers and trustees are indemnified by the Trust against certain liabilities arising out of the performance of their duties to the Trust. Additionally, in the normal course of business, the Trust, on behalf of the Fund, enters into contracts with service providers that contain general indemnification clauses. The Trust’s maximum exposure under these arrangements is
FRANKLIN TEMPLETON VARIABLE INSURANCE PRODUCTS TRUST
NOTES TO FINANCIAL STATEMENTS (UNAUDITED)
Templeton Growth VIP Fund (continued)
unknown as this would involve future claims that may be made against the Trust that have not yet occurred. Currently, the Trust expects the risk of loss to be remote.
2. Shares of Beneficial Interest
At June 30, 2020, there were an unlimited number of shares authorized (without par value). Transactions in the Fund’s shares were as follows:
| | | | | | | | | | | | | | | | |
| | |
| | | Six Months Ended June 30, 2020 | | | Year Ended December 31, 2019 | |
| | | | |
| | | Shares | | | Amount | | | Shares | | | Amount | |
| | | | |
| Class 1 Shares: | | | | | | | | | | | | | | | | |
| | | | |
Shares sold | | | 47,404 | | | $ | 449,446 | | | | 68,873 | | | $ | 790,173 | |
| | | | |
Shares issued in reinvestment of distributions | | | 287,000 | | | | 2,680,578 | | | | 2,083,910 | | | | 20,901,613 | |
| | | | |
Shares redeemed | | | (614,433 | ) | | | (6,205,044 | ) | | | (21,838,635 | ) | | | (296,807,226 | ) |
| | | | |
| | | | |
Net increase (decrease) | | | (280,029 | ) | | $ | (3,075,020 | ) | | | (19,685,852 | ) | | $ | (275,115,440 | ) |
| | | | |
| | | | |
| Class 2 Shares: | | | | | | | | | | | | | | | | |
| | | | |
Shares sold | | | 2,219,982 | | | $ | 19,766,911 | | | | 3,619,417 | | | $ | 39,550,989 | |
| | | | |
Shares issued in reinvestment of distributions | | | 1,804,387 | | | | 16,492,099 | | | | 14,197,412 | | | | 139,418,589 | |
| | | | |
Shares redeemed | | | (7,418,146 | ) | | | (69,618,583 | ) | | | (8,538,686 | ) | | | (96,234,978 | ) |
| | | | |
| | | | |
Net increase (decrease) | | | (3,393,777 | ) | | $ | (33,359,573 | ) | | | 9,278,143 | | | $ | 82,734,600 | |
| | | | |
| | | | |
| Class 4 Shares: | | | | | | | | | | | | | | | | |
| | | | |
Shares sold | | | 86,631 | | | $ | 804,235 | | | | 148,576 | | | $ | 1,690,506 | |
| | | | |
Shares issued in reinvestment of distributions | | | 71,003 | | | | 659,619 | | | | 605,616 | | | | 6,044,047 | |
| | | | |
Shares redeemed | | | (248,136 | ) | | | (2,464,069 | ) | | | (571,458 | ) | | | (6,501,102 | ) |
| | | | |
| | | | |
Net increase (decrease) | | | (90,502 | ) | | $ | (1,000,215 | ) | | | 182,734 | | | $ | 1,233,451 | |
| | | | |
3. Transactions with Affiliates
Franklin Resources, Inc. is the holding company for various subsidiaries that together are referred to as Franklin Templeton. Certain officers and trustees of the Fund are also officers and/or directors of the following subsidiaries:
| | |
| |
| Subsidiary | | Affiliation |
Templeton Global Advisors Limited (Global Advisors) | | Investment manager |
Franklin Templeton Services, LLC (FT Services) | | Administrative manager |
Franklin Templeton Distributors, Inc. (Distributors) | | Principal underwriter |
Franklin Templeton Investor Services, LLC (Investor Services) | | Transfer agent |
FRANKLIN TEMPLETON VARIABLE INSURANCE PRODUCTS TRUST
NOTES TO FINANCIAL STATEMENTS (UNAUDITED)
Templeton Growth VIP Fund (continued)
3. Transactions with Affiliates (continued)
a. Management Fees
The Fund pays an investment management fee to Global Advisors based on the average daily net assets of the Fund as follows:
| | |
| |
| Annualized Fee Rate | | Net Assets |
1.000% | | Up to and including $100 million |
0.900% | | Over $100 million, up to and including $250 million |
0.800% | | Over $250 million, up to and including $500 million |
0.750% | | Over $500 million, up to and including $1 billion |
0.700% | | Over $1 billion, up to and including $5 billion |
0.675% | | Over $5 billion, up to and including $10 billion |
0.655% | | Over $10 billion, up to and including $15 billion |
0.635% | | Over $15 billion, up to and including $20 billion |
0.615% | | In excess of $20 billion |
For the period ended June 30, 2020, the annualized gross effective investment management fee rate was 0.843% of the Fund’s average daily net assets.
b. Administrative Fees
Under an agreement with Global Advisors, FT Services provides administrative services to the Fund. The fee is paid by Global Advisors based on the Fund’s average daily net assets, and is not an additional expense of the Fund.
c. Distribution Fees
The Board has adopted distribution plans for Class 2 and Class 4 shares pursuant to Rule 12b-1 under the 1940 Act. Under the Fund’s compensation distribution plans, the Fund pays Distributors for costs incurred in connection with the servicing, sale and distribution of the Fund’s shares up to 0.35% per year of its average daily net assets of each class. The Board has agreed to limit the current rate to 0.25% per year for Class 2. The plan year, for purposes of monitoring compliance with the maximum annual plan rates, is February 1 through January 31.
d. Transfer Agent Fees
Investor Services, under terms of an agreement, performs shareholder servicing for the Fund and is not paid by the Fund for the services.
FRANKLIN TEMPLETON VARIABLE INSURANCE PRODUCTS TRUST
NOTES TO FINANCIAL STATEMENTS (UNAUDITED)
Templeton Growth VIP Fund (continued)
e. Investments in Affiliated Management Investment Companies
The Fund invests in one or more affiliated management investment companies for purposes other than exercising a controlling influence over the management or policies. Management fees paid by the Fund are waived on assets invested in the affiliated management investment companies, as noted in the Statement of Operations, in an amount not to exceed the management and administrative fees paid directly or indirectly by each affiliate. During the period ended June 30, 2020, the Fund held investments in affiliated management investment companies as follows:
| | | | | | | | | | | | | | | | | | | | | | | | | | | | | | | | |
| | | | | | | | |
| | | Value at Beginning of Period | | | Purchases | | | Sales | | | Realized Gain (Loss) | | | Net Change in Unrealized Appreciation (Depreciation) | | | Value at End of Period | | | Number of Shares Held at End of Period | | | Income from
securities loaned | |
| Non-Controlled Affiliates | | | | | | | | | | | | | | | | | | | | | | | | | | | | | | | | |
| | | | | | | | |
Institutional Fiduciary Trust Money Market Portfolio, 0.00% | | | $ — | | | | $41,621,171 | | | | $(31,131,005 | ) | | | $ — | | | | $ — | | | | $10,490,166 | | | | 10,490,166 | | | | $1,609 | |
| | | | | | | | | | | | |
4. Expense Offset Arrangement
The Fund has entered into an arrangement with its custodian whereby credits realized as a result of uninvested cash balances are used to reduce a portion of the Fund’s custodian expenses. During the period ended June 30, 2020, there were no credits earned.
5. Income Taxes
For tax purposes, capital losses may be carried over to offset future capital gains.
At December 31, 2019, the capital loss carryforwards were as follows:
| | | | |
Capital loss carryforwards not subject to expiration: | | | | |
Short term | | $ | 1,856,399 | |
Long term | | | 3,209,150 | |
| |
| | | | |
| |
Total capital loss carryforwards | | $ | 5,065,549 | |
| | | | |
At June 30, 2020, the cost of investments and net unrealized appreciation (depreciation) for income tax purposes were as follows:
| | | | |
Cost of investments | | $ | 575,582,222 | |
| | | | |
| |
Unrealized appreciation | | $ | 79,117,116 | |
Unrealized depreciation | | | (58,345,533) | |
| |
| | | | |
| |
Net unrealized appreciation (depreciation) | | $ | 20,771,583 | |
| | | | |
Differences between income and/or capital gains as determined on a book basis and a tax basis are primarily due to differing treatment of wash sales.
6. Investment Transactions
Purchases and sales of investments (excluding short term securities) for the period ended June 30, 2019, aggregated $268,297,262 and $335,926,574, respectively.
FRANKLIN TEMPLETON VARIABLE INSURANCE PRODUCTS TRUST
NOTES TO FINANCIAL STATEMENTS (UNAUDITED)
Templeton Growth VIP Fund (continued)
6. Investment Transactions (continued)
At June 30, 2020, in connection with securities lending transactions, the Fund loaned equity investments and received $10,490,166 of cash collateral. The gross amount of recognized liability for such transactions is included in payable upon return of securities loaned in the Statement of Assets and Liabilities. The agreements can be terminated at any time.
7. Concentration of Risk
Investing in foreign securities may include certain risks and considerations not typically associated with investing in U.S. securities, such as fluctuating currency values and changing local, regional and global economic, political and social conditions, which may result in greater market volatility. Current political and financial uncertainty surrounding the European Union may increase market volatility and the economic risk of investing in securities in Europe. In addition, certain foreign securities may not be as liquid as U.S. securities.
8. Novel Coronavirus Pandemic
The global outbreak of the novel coronavirus disease, known as COVID-19, has caused adverse effects on many companies, sectors, nations, regions and the markets in general, and may continue for an unpredictable duration. The effects of this pandemic may materially impact the value and performance of the Fund, its ability to buy and sell fund investments at appropriate valuations and its ability to achieve its investment objectives.
9. Credit Facility
The Fund, together with other U.S. registered and foreign investment funds (collectively, Borrowers), managed by Franklin Templeton, are borrowers in a joint syndicated senior unsecured credit facility totaling $2 billion (Global Credit Facility) which matures on February 5, 2021. This Global Credit Facility provides a source of funds to the Borrowers for temporary and emergency purposes, including the ability to meet future unanticipated or unusually large redemption requests.
Under the terms of the Global Credit Facility, the Fund shall, in addition to interest charged on any borrowings made by the Fund and other costs incurred by the Fund, pay its share of fees and expenses incurred in connection with the implementation and maintenance of the Global Credit Facility, based upon its relative share of the aggregate net assets of all of the Borrowers, including an annual commitment fee of 0.15% based upon the unused portion of the Global Credit Facility. These fees are reflected in other expenses in the Statement of Operations. During the period ended June 30, 2020, the Fund did not use the Global Credit Facility.
10. Fair Value Measurements
The Fund follows a fair value hierarchy that distinguishes between market data obtained from independent sources (observable inputs) and the Fund’s own market assumptions (unobservable inputs). These inputs are used in determining the value of the Fund’s financial instruments and are summarized in the following fair value hierarchy:
| | • | | Level 1 – quoted prices in active markets for identical financial instruments |
| | • | | Level 2 – other significant observable inputs (including quoted prices for similar financial instruments, interest rates, prepayment speed, credit risk, etc.) |
| | • | | Level 3 – significant unobservable inputs (including the Fund’s own assumptions in determining the fair value of financial instruments) |
The input levels are not necessarily an indication of the risk or liquidity associated with financial instruments at that level.
FRANKLIN TEMPLETON VARIABLE INSURANCE PRODUCTS TRUST
NOTES TO FINANCIAL STATEMENTS (UNAUDITED)
Templeton Growth VIP Fund (continued)
A summary of inputs used as of June 30, 2020, in valuing the Fund’s assets carried at fair value, is as follows:
| | | | | | | | | | | | | | | | |
| | | | |
| | | Level 1 | | | Level 2 | | | Level 3 | | | Total | |
| | | | |
| Assets: | | | | | | | | | | | | | | | | |
| | | | |
Investments in Securities:a | | | | | | | | | | | | | | | | |
| | | | |
Equity Investments: | | | | | | | | | | | | | | | | |
| | | | |
Aerospace & Defense | | $ | — | | | $ | 5,597,756 | | | $ | — | | | $ | 5,597,756 | |
| | | | |
Airlines | | | — | | | | 3,571,208 | | | | — | | | | 3,571,208 | |
| | | | |
Automobiles | | | — | | | | 10,933,235 | | | | — | | | | 10,933,235 | |
| | | | |
Banks | | | — | | | | 16,328,648 | | | | — | | | | 16,328,648 | |
| | | | |
Beverages | | | — | | | | 33,948,491 | | | | — | | | | 33,948,491 | |
| | | | |
Electrical Equipment | | | — | | | | 7,388,758 | | | | — | | | | 7,388,758 | |
| | | | |
Electronic Equipment, Instruments & | | | | | | | | | | | | | | | | |
| | | | |
Components | | | — | | | | 10,485,694 | | | | — | | | | 10,485,694 | |
| | | | |
Food & Staples Retailing | | | 17,094,847 | | | | 7,638,607 | | | | — | | | | 24,733,454 | |
| | | | |
Gas Utilities | | | — | | | | 2,858,389 | | | | — | | | | 2,858,389 | |
| | | | |
Hotels, Restaurants & Leisure | | | 12,138,486 | | | | 17,644,906 | | | | — | | | | 29,783,392 | |
| | | | |
Household Durables | | | — | | | | 19,748,664 | | | | — | | | | 19,748,664 | |
| | | | |
Industrial Conglomerates | | | — | | | | 11,858,349 | | | | — | | | | 11,858,349 | |
| | | | |
Insurance | | | — | | | | 9,142,317 | | | | — | | | | 9,142,317 | |
| | | | |
Internet & Direct Marketing Retail | | | 9,474,423 | | | | 7,565,395 | | | | — | | | | 17,039,818 | |
| | | | |
Machinery | | | 3,122,112 | | | | 14,010,872 | | | | — | | | | 17,132,984 | |
| | | | |
Marine | | | — | | | | 9,051,690 | | | | — | | | | 9,051,690 | |
| | | | |
Media | | | 12,991,293 | | | | 6,022,792 | | | | — | | | | 19,014,085 | |
| | | | |
Metals & Mining | | | 28,435,822 | | | | 5,358,614 | | | | — | | | | 33,794,436 | |
| | | | |
Multi-Utilities | | | — | | | | 19,686,363 | | | | — | | | | 19,686,363 | |
| | | | |
Oil, Gas & Consumable Fuels | | | 2,254,463 | | | | 15,129,418 | | | | — | | | | 17,383,881 | |
| | | | |
Pharmaceuticals | | | — | | | | 53,443,022 | | | | — | | | | 53,443,022 | |
| | | | |
Real Estate Management & Development | | | — | | | | 6,798,181 | | | | — | | | | 6,798,181 | |
| | | | |
Road & Rail | | | — | | | | 3,601,371 | | | | — | | | | 3,601,371 | |
| | | | |
Technology Hardware, Storage & Peripherals | | | — | | | | 16,583,973 | | | | — | | | | 16,583,973 | |
| | | | |
Textiles, Apparel & Luxury Goods | | | — | | | | 10,853,359 | | | | — | | | | 10,853,359 | |
| | | | |
All Other Equity Investments | | | 126,702,121 | | | | — | | | | — | | | | 126,702,121 | |
| | | | |
Short Term Investments | | | 10,490,166 | | | | 48,400,000 | | | | — | | | | 58,890,166 | |
| | | | |
| | | | |
Total Investments in Securities | | $ | 222,703,733 | | | $ | 373,650,072 | | | $ | — | | | $ | 596,353,805 | |
| | | | |
aFor detailed categories, see the accompanying Statement of Investments.
11. New Accounting Pronouncements
In March 2020, the Financial Accounting Standards Board issued Accounting Standards Update (ASU) No. 2020-04, Reference Rate Reform (Topic 848) – Facilitation of the Effects of Reference Rate Reform on Financial Reporting. The amendments in the ASU provides optional temporary financial reporting relief from the effect of certain types of contract modifications due to the planned discontinuation of the London Interbank Offered Rate (LIBOR) and other interbank-offered based reference rates as of the end of 2021. The ASU is effective for certain reference rate-related contract modifications that occur during the period March 12, 2020 through December 31, 2022. Management is currently evaluating the impact, if any, of applying this ASU.
FRANKLIN TEMPLETON VARIABLE INSURANCE PRODUCTS TRUST
NOTES TO FINANCIAL STATEMENTS (UNAUDITED)
Templeton Growth VIP Fund (continued)
12. Subsequent Events
The Fund has evaluated subsequent events through the issuance of the financial statements and determined that no events have occurred that require disclosure.
Abbreviations
| | |
|
| Selected Portfolio |
| |
| ADR | | American Depositary Receipt |
| |
| FFCB | | Federal Farm Credit Bank |
| |
| IDR | | International Depositary Receipt |
FRANKLIN TEMPLETON VARIABLE INSURANCE PRODUCTS TRUST
Tax Information (unaudited)
Templeton Growth VIP Fund
At December 31, 2019, more than 50% of the Fund’s total assets were invested in securities of foreign issuers. In most instances, foreign taxes were withheld from income paid to the Fund on these investments. As shown in the table below, the Fund hereby reports to shareholders the foreign source income and foreign taxes paid, pursuant to Section 853 of the Internal Revenue Code. This written statement will allow shareholders of record on June 11, 2020, to treat their proportionate share of foreign taxes paid by the Fund as having been paid directly by them. The shareholder shall consider these amounts as foreign taxes paid in the tax year in which they receive the Fund distribution.
The following table provides a detailed analysis of foreign tax paid, and foreign source income as reported by the Fund to shareholders of record.
| | | | | | | | |
| | |
| Class | | Foreign Tax Paid Per Share | | | Foreign Source Income Per Share | |
Class 1 | | | $0.0280 | | | | $0.2741 | |
Class 2 | | | $0.0280 | | | | $0.2517 | |
Class 4 | | | $0.0280 | | | | $0.2415 | |
Foreign Tax Paid Per Share (Column 1) is the amount per share available to you, as a tax credit (assuming you held your shares in the Fund for a minimum of 16 days during the 31-day period beginning 15 days before the ex-dividend date of the Fund’s distribution to which the foreign taxes relate), or, as a tax deduction.
Foreign Source Income Per Share (Column 2) is the amount per share of income dividends attributable to foreign securities held by the Fund, plus any foreign taxes withheld on these dividends.
This page intentionally left blank.
FRANKLIN TEMPLETON VARIABLE INSURANCE PRODUCTS TRUST
Index Descriptions
The indexes are unmanaged and include reinvestment of any income or distributions (after the deduction of certain withholding taxes for the NR or Net Return Index). They do not reflect any fees, expenses or sales charges.
For Russell Indexes: Frank Russell Company is the source and owner of the trademarks, service marks and copyrights related to the Russell Indexes. Russell® is a trademark of Frank Russell Company.
See www.franklintempletondatasources.com for additional data provider information.
Bloomberg Barclays 1-3 Month U.S. Treasury Bill Index measures the performance of U.S. Treasury bills that have a remaining maturity of greater than or equal to one month and less than three months.
Bloomberg Barclays U.S. Aggregate Bond Index is a market capitalization-weighted index representing the U.S. investment-grade, fixed-rate, taxable bond market with index components for government and corporate, mortgage pass-through and asset-backed securities. All issues included are SEC registered, taxable, dollar denominated and nonconvertible, must have at least one year to final maturity and must be rated investment grade (Baa3/ BBB-/BBB- or higher) using the middle rating of Moody’s, Standard & Poor’s and Fitch, respectively.
Bloomberg Barclays U.S. Corporate Bond Index measures the investment grade, fixed-rate, taxable corporate bond market. It includes U.S. dollar-denominated securities publicly issued by U.S. and non-U.S. industrial, utility and financial issuers.
Bloomberg Barclays U.S. Corporate High Yield Bond Index measures the U.S. dollar-denominated, high yield, fixed-rate corporate bond market. Securities are classified as high yield if the middle rating of Moody’s, Fitch and Standard & Poor’s is Ba1/BB+/BB+ or below.
Bloomberg Barclays U.S. Corporate Investment Grade Index is a broad-based benchmark that measures the investment-grade, fixed-rate, taxable corporate bond market.
Bloomberg Barclays U.S. Government Index: Intermediate Component is the intermediate component of the Barclays U.S. Government Index, which includes public obligations of the U.S. Treasury with at least one year to final maturity and publicly issued debt of U.S. government agencies, quasi-federal corporations, and corporate or foreign debt guaranteed by the U.S. government.
Bloomberg Barclays U.S. High Yield Very Liquid Index is a component of the U.S. Corporate High Yield Index that is designed to track a more liquid component of the U.S. dollar-denominated, high-yield fixed-rate corporate bond market.
Bloomberg Barclays U.S. Treasury Index measures U.S. dollar-denominated, fixed-rate, nominal debt issued by the U.S. Treasury with at least one year until final maturity.
FTSE® EPRA®/NAREIT® Developed Index
is a free float-adjusted index designed to measure the performance of publicly traded real estate securities in the North American, European and Asian real estate markets.
FTSE World Government Bond Index
is a market capitalization-weighted index consisting of investment-grade world government bond markets.
J.P. Morgan (JPM) Global Government Bond Index (GGBI) tracks total returns for liquid, fixed-rate, domestic government bonds with maturities greater than one year issued by developed countries globally.
Lipper Multi-Sector Income Funds Classification Average is calculated by averaging the total returns of all funds within the Lipper Multi-Sector Income Funds Classification in the Lipper Open-End underlying funds universe. Lipper Multi-Sector Income Funds are defined as funds that seek current income by allocation of assets among different fixed income securities sectors (not primarily in one sector except for defensive purposes), including U.S. and foreign governments, with a significant portion rated below investment grade. For the six-month period ended 6/30/20, there were 37 funds in this category. Lipper calculations do not include contract fees, expenses or sales charges, and may have been different if such charges had been considered.
Lipper VIP General U.S. Government Funds Classification Average is an equally weighted average calculation of performance figures for all funds within the Lipper General U.S. Government Funds classification in the Lipper VIP underlying funds universe. Lipper General U.S. Government Funds invest primarily in U.S. government and agency issues. For the six-month period ended 6/30/20, there were 26 funds in this category. Lipper calculations do not include contract fees, expenses or sales charges, and may have been different if such charges had been considered.
FRANKLIN TEMPLETON VARIABLE INSURANCE PRODUCTS TRUST
INDEX DESCRIPTIONS
MSCI All Country Asia Index is a free float-adjusted, market capitalization-weighted index designed to measure equity market performance in developed and emerging markets in Asia.
MSCI All Country World Index (ACWI) is a free float-adjusted, market capitalization-weighted index designed to measure equity market performance in global developed and emerging markets.
MSCI All Country World Index (ACWI) ex USA Index is a free float-adjusted, market capitalization-weighted index designed to measure equity market performance in global developed and emerging markets, excluding the U.S.
MSCI Europe Index is a free float-adjusted market capitalization-weighted index designed to measure the equity market performance of developed markets in Europe.
MSCI Europe, Australasia, Far East (EAFE) Index is a free float-adjusted market capitalization-weighted index designed to measure the equity market performance of developed markets, excluding the U.S. and Canada.
MSCI Emerging Markets (EM) Index is a free float-adjusted, market capitalization-weighted index designed to measure equity market performance in global emerging markets.
MSCI USA High Dividend Yield Index is based on the MSCI USA Index, its parent index, and includes large- and mid-capitalization stocks. The index is designed to reflect the performance of equities in the parent index (excluding real estate investment trusts) with higher dividend income and quality characteristics than average dividend yields that are both sustainable and persistent.
MSCI World ex USA Index-NR is a free float-adjusted, market capitalization-weighted index designed to measure equity market performance in global developed markets, excluding the U.S. Net Returns (NR) include income net of tax withholding when dividends are paid.
MSCI World Index is a free float-adjusted, market capitalization-weighted index designed to measure equity market performance in global developed markets.
Russell 1000® Growth Index is market capitalization weighted and measures performance of those Russell 1000® Index companies with relatively higher price-to-book ratios and higher forecasted growth values.
Russell 1000® Index is market capitalization weighted and measures performance of the largest companies in the Russell 3000® Index, which represents the majority of the U.S. market’s total capitalization.
Russell 1000® Value Index is market capitalization weighted and measures performance of those Russell 1000® Index companies with relatively lower price-to-book ratios and lower forecasted growth values.
Russell 2000® Index is market capitalization weighted and measures performance of the 2,000 smallest companies in the Russell 3000® Index, which represent a small amount of the total market capitalization of the Russell 3000® Index.
Russell 2000® Value Index is market capitalization weighted and measures performance of those Russell 2000® Index companies with relatively lower price-to-book ratios and lower forecasted growth values.
Russell 3000® Index is market capitalization weighted and represents the majority of the U.S. market’s total capitalization.
Russell 3000® Growth Index is market capitalization weighted and measures performance of those Russell 3000® Index companies with relatively higher price-to-book ratios and higher forecasted growth values.
Russell Midcap® Growth Index is market capitalization weighted and measures performance of those Russell Midcap® Index companies with relatively higher price-to-book ratios and higher forecasted growth values.
Russell Midcap® Index is market capitalization weighted and measures performance of the smallest companies in the Russell 1000® Index, which represents a modest amount of the Russell 1000® Index’s total market capitalization.
Standard & Poor’s® 500 Index (S&P 500®)
is a market capitalization-weighted index of 500 stocks designed to measure total U.S. equity market performance.
Standard & Poor’s®/International Finance Corporation Investable (S&P/IFCI) Composite Index is a free float-adjusted, market capitalization-weighted index designed to measure equity performance in global emerging markets.
FRANKLIN TEMPLETON VARIABLE INSURANCE PRODUCTS TRUST
SHAREHOLDER INFORMATION
Shareholder Information
Board Approval of Investment
Management Agreements
FRANKLIN TEMPLETON VARIABLE INSURANCE PRODUCTS TRUST
Franklin Allocation VIP Fund
Franklin Flex Cap Growth VIP Fund
Franklin Global Real Estate VIP Fund
Franklin Growth and Income VIP Fund
Franklin Income VIP Fund
Franklin Large Cap Growth VIP Fund
Franklin Mutual Global Discovery VIP Fund
Franklin Mutual Shares VIP Fund
Franklin Rising Dividends VIP Fund
Franklin Small Cap Value VIP Fund
Franklin Small-Mid Cap Growth VIP Fund
Franklin Strategic Income VIP Fund
Franklin U.S. Government Securities VIP Fund
Franklin VolSmart Allocation VIP Fund
Templeton Developing Markets VIP Fund
Templeton Foreign VIP Fund
Templeton Global Bond VIP Fund
Templeton Growth VIP Fund
(each a Fund)
At a meeting held on April 7, 2020 (Meeting), the Board of Trustees (Board) of Franklin Templeton Variable Insurance Products Trust (Trust), including a majority of the trustees who are not “interested persons” as defined in the Investment Company Act of 1940 (Independent Trustees), reviewed and approved the continuance of the (i) investment management agreement between Franklin Advisers, Inc. (FAI) and the Trust, on behalf of each of Franklin Allocation VIP Fund, Franklin Flex Cap Growth VIP Fund, Franklin Growth and Income VIP Fund, Franklin Income VIP Fund, Franklin Large Cap Growth VIP Fund, Franklin Rising Dividends VIP Fund, Franklin Small-Mid Cap Growth VIP Fund, Franklin Strategic Income VIP Fund, Franklin U.S. Government Securities VIP Fund, Franklin VolSmart Allocation VIP Fund, and Templeton Global Bond VIP Fund; (ii) the investment sub-advisory agreement between FAI and Franklin Templeton Institutional, LLC (FTIL), an affiliate of FAI, on behalf of Franklin Allocation VIP Fund; (iii) the investment sub-advisory agreement between FAI and Templeton Global Advisors Limited (TGAL), an affiliate of FAI, on behalf of Franklin Allocation VIP Fund; (iv) the investment management agreement between FTIL and the Trust, on behalf of Franklin Global Real Estate VIP Fund; (v) the investment management agreement between Franklin
Mutual Advisers, LLC (FMA) and the Trust, on behalf of each of Franklin Mutual Global Discovery VIP Fund, Franklin Mutual Shares VIP Fund and Franklin Small Cap Value VIP Fund; (vi) the investment management agreement between Templeton Asset Management Ltd. (TAML) and the Trust, on behalf of Templeton Developing Markets VIP Fund; (vii) the investment management agreement between Templeton Investment Counsel, LLC (TICL) and the Trust, on behalf of Templeton Foreign VIP Fund; and (viii) the investment management agreement between TGAL and the Trust, on behalf of Templeton Growth VIP Fund (each a Management Agreement) for an additional one-year period. The Independent Trustees received advice from and met separately with Independent Trustee counsel in considering whether to approve the continuation of each Management Agreement. Although the Management Agreements for the Funds were considered at the same Board meeting, the Board considered the information provided to it about the Funds together and with respect to each Fund separately as the Board deemed appropriate. FAI, FTIL, FMA, TAML, TICL and TGAL are each referred to herein as a Manager.
In considering the continuation of each Management Agreement, the Board reviewed and considered information provided by each Manager at the Meeting and throughout the year at meetings of the Board and its committees. The Board also reviewed and considered information provided in response to a detailed set of requests for information submitted to each Manager by Independent Trustee counsel on behalf of the Independent Trustees in connection with the annual contract renewal process. In addition, prior to the Meeting, the Independent Trustees held a telephonic contract renewal meeting at which the Independent Trustees conferred amongst themselves and Independent Trustee counsel about contract renewal matters and, in some cases, requested additional information from the Managers relating to the contract. The Board reviewed and considered all of the factors it deemed relevant in approving the continuance of each Management Agreement, including, but not limited to: (i) the nature, extent and quality of the services provided by each Manager; (ii) the investment performance of each Fund; (iii) the costs of the services provided and profits realized by each Manager and its affiliates from the relationship with each Fund; (iv) the extent to which economies of scale are realized as each Fund grows; and (v) whether fee levels reflect these economies of scale for the benefit of Fund investors.
In approving the continuance of each Management Agreement, the Board, including a majority of the
FRANKLIN TEMPLETON VARIABLE INSURANCE PRODUCTS TRUST
SHAREHOLDER INFORMATION
Independent Trustees, determined that the terms of each Management Agreement are fair and reasonable and that the continuance of such Management Agreement is in the interests of the applicable Fund and its shareholders. While attention was given to all information furnished, the following discusses some primary factors relevant to the Board’s determination.
Nature, Extent and Quality of Services
The Board reviewed and considered information regarding the nature, extent and quality of investment management services provided by each Manager and its affiliates to the Funds and their shareholders. This information included, among other things, the qualifications, background and experience of the senior management and investment personnel of each Manager; as well as information on succession planning where appropriate; the structure of investment personnel compensation; oversight of third-party service providers; investment performance reports and related financial information for each Fund; reports on expenses and shareholder services; legal and compliance matters; risk controls; pricing and other services provided by each Manager and its affiliates; and management fees charged by each Manager and its affiliates to US funds and other accounts, including management’s explanation of differences among accounts where relevant. The Board also reviewed and considered an annual report on payments made by Franklin Templeton (FT) or the Funds to financial intermediaries, as well as a memorandum relating to third-party servicing arrangements, which included discussion of the changing distribution landscape for the Funds. The Board noted management’s continuing efforts and expenditures in establishing effective business continuity plans and developing strategies to address areas of heightened concern in the mutual fund industry, such as cybersecurity and liquidity risk management.
The Board also reviewed and considered the benefits provided to Fund shareholders of investing in a fund that is part of the FT family of funds. The Board noted the financial position of Franklin Resources, Inc. (FRI), the Managers’ parent, and its commitment to the mutual fund business as evidenced by its continued introduction of new funds, reassessment of the fund offerings in response to the market environment and project initiatives and capital investments relating to the services provided to the Funds by the FT organization. The Board specifically noted FT’s commitment to enhancing services and controlling costs, as reflected in its plan to outsource certain administrative functions, and growth opportunities, as evidenced by its
upcoming acquisition of the Legg Mason companies. The Board acknowledged the change in leadership at FRI and the opportunity to hear from Jennifer Johnson, President and Chief Executive Officer of FRI, about goals she has for the company that will benefit the Funds.
Following consideration of such information, the Board was satisfied with the nature, extent and quality of services provided by each Manager and its affiliates to the Funds and their shareholders.
Fund Performance
The Board reviewed and considered the performance results of each Fund over various time periods ended January 31, 2020. The Board considered the performance returns for each Fund in comparison to the performance returns of mutual funds deemed comparable to the Fund included in a universe (Performance Universe) selected by Broadridge Financial Solutions, Inc. (Broadridge), an independent provider of investment company data. The Board received a description of the methodology used by Broadridge to select the mutual funds included in a Performance Universe. The Board also considered the performance returns for the Franklin Income VIP Fund and Franklin VolSmart Allocation VIP Fund in comparison to the performance returns of a customized peer group (Performance Customized Peer Group) selected by the Manager. The Board also reviewed and considered Fund performance reports provided and discussions that occurred with portfolio managers at Board meetings throughout the year. A summary of each Fund’s performance results is below.
Franklin Allocation VIP Fund - The Performance Universe for this Fund included the Fund and all mixed-asset target allocation growth funds underlying variable insurance products (VIPs). The Board noted that the Fund’s annualized income return for the one-, three-, five- and 10-year periods was above the median and in the first quintile (best) of its Performance Universe. The Board also noted that the Fund’s annualized total return for the one-, three-, five- and 10-year periods was below the median of its Performance Universe. The Board discussed this performance with management and management explained that the Performance Universe was not directly comparable to the Fund as the Performance Universe includes funds with equity exposures between 60%-80% and the Fund maintains a strategic asset allocation of 60% equities. Management further explained that the Fund’s strategic allocation has served as a headwind for peer-relative returns since the Fund’s repositioning on May 1, 2019 to a direct investment fund with
FRANKLIN TEMPLETON VARIABLE INSURANCE PRODUCTS TRUST
SHAREHOLDER INFORMATION
an actively managed dynamic allocation strategy. The Board noted management’s explanations and determined that, in light of the recent strategy changes, additional time will be needed to evaluate the effectiveness of management’s actions. The Board concluded that the Fund’s Management Agreement should be continued for an additional one-year period, and management’s efforts should continue to be monitored.
Franklin Flex Cap Growth VIP Fund - The Performance Universe for this Fund included the Fund and all large-cap growth funds underlying VIPs. The Board noted that the Fund’s annualized total return for the three-year period was above the median of its Performance Universe, but for the one-, five- and 10-year periods was below the median of its Performance Universe. The Board discussed this performance with management and management explained that during the one-year period, Information Technology and Industrials were the two largest sectors of underperformance for the Fund. Management further explained that the Fund’s cash position was also a detractor from the Fund’s performance. The Board noted management’s steps to address the underperformance of the Fund. The Board concluded that the Fund’s Management Agreement should be continued for an additional one-year period, and management’s efforts should continue to be monitored. In doing so, the Board noted that, while below median, the Fund’s annualized total return for the one-, five- and 10-year periods was 23.48%, 12.99% and 12.87%, respectively.
Franklin Growth and Income VIP Fund - The Performance Universe for the Fund included the Fund and all equity income funds underlying VIPs. The Board noted that the Fund’s annualized income return and annualized total return for the one-, three-, five- and 10-year periods were above the medians of its Performance Universe. The Board concluded that the Fund’s performance was satisfactory.
Franklin Income VIP Fund - The Performance Universe for the Fund included the Fund and all mixed-asset target allocation moderate funds underlying VIPs. The Performance Customized Peer Group for the Fund consisted of funds sorted by trailing 12-month yield and set to be top quartile (highest yield). The Board noted that the Fund’s annualized income return for the one-, three-, five- and 10-year periods was above the medians and in the first quintile (best) of its Performance Universe and Performance Customized Peer Group. The Board also noted that the Fund’s annualized total return for the one-, three-, five- and 10-year periods was below the medians of its Performance Universe and
Performance Customized Peer Group. Given the Fund’s income-oriented investment objective, the Board concluded that the Fund’s performance was satisfactory.
Franklin Strategic Income VIP Fund - The Performance Universe for the Fund included the Fund and all multi-sector income funds underlying VIPs. The Board noted that the Fund’s annualized income return for the one-, three-, five-and 10-year periods was above the median and in the first quintile (best) of its Performance Universe. The Board also noted that the Fund’s annualized total return for the one-, three-, five- and 10-year periods was below the median of its Performance Universe. The Board discussed this performance with management and management explained that the Fund’s relative underperformance was due, in part, to a shorter duration profile of its portfolio holdings and a reduced exposure to credit risk. The Board also noted management’s continued enhancements to the Fund’s investment process, which includes a greater role for macroeconomics and incorporates more quantitative techniques to assist with portfolio construction. Given the Fund’s income-oriented investment objective and the considerations noted above, the Board concluded that the Fund’s performance was satisfactory.
Franklin Large Cap Growth VIP Fund - The Performance Universe for the Fund included the Fund and all multi-cap growth funds underlying VIPs. The Board noted that the Fund’s annualized total return for the 10-year period was below the median of its Performance Universe, but for the one-, three- and five-year periods was above the median of its Performance Universe. The Board concluded that the Fund’s performance was satisfactory.
Franklin Mutual Global Discovery VIP Fund -The Performance Universe for the Fund included the Fund and all global multi-cap value funds underlying VIPs. The Board noted that the Fund’s annualized total return for the one- and 10-year periods was above the median and in the first quintile (best) of its Performance Universe, but for the three-year period was slightly below the median of its Performance Universe and for the five-year period was equal to the median of its Performance Universe. The Board concluded that the Fund’s performance was satisfactory.
Franklin Mutual Shares VIP Fund - The Performance Universe for the Fund included the Fund and all multi-cap value funds underlying VIPs. The Board noted that the Fund’s annualized total return for the one-, three-, five- and 10-year periods was below the median of its Performance Universe. The Board discussed this performance with
FRANKLIN TEMPLETON VARIABLE INSURANCE PRODUCTS TRUST
SHAREHOLDER INFORMATION
management and management explained that the Fund’s underperformance in 2017 was material and continues to adversely impact the Fund’s ranking over longer-term periods. Management reminded the Board of the primary factors that impacted the 2017 performance, including, among factors, exposure to non-US equities and stock selection. Management then explained that, over the one-year period, the Fund’s non-equity investments and stock selection weighed on the Fund’s relative performance. Management also explained that approximately 15% of the Fund’s portfolio was in non-equity investments which relatively underperformed the robust 2019 equity market performance. Management further explained that the Fund’s cash position also weighed on relative performance. Management then discussed with the Board the actions that continue to be taken in an effort to address the sources of the Fund’s underperformance, including enhancements to the Fund’s investment process, particularly with respect to portfolio and quantitative analytics. The Board concluded that the Fund’s Management Agreement should be continued for an additional one-year period, and management’s efforts should continue to be monitored.
Franklin Small-Mid Cap Growth VIP Fund - The Performance Universe for the Fund included the Fund and all mid-cap growth funds underlying VIPs. The Board noted that the Fund’s annualized total return for the one-, three-, five- and 10-year periods was below the median of its Performance Universe. The Board discussed this performance with management and management explained that the Fund’s positioning in the energy, healthcare, consumer, materials, industrial and information technology sectors was a primary detractor from relative performance over the one-, three- and five-year periods. Management further explained that, during the one-, three- and five-year periods, the Fund had more exposure to smaller cap stocks in comparison to its peers, noting that these stocks meaningfully underperformed during the requisite periods. Management then discussed with the Board the actions that are being taken in an effort to address the sources of the Fund’s underperformance, including consolidating the Fund into fewer positions which have demonstrated certain attributes and working closely with the Investment Risk Management Group to limit the amount of risk in the Fund’s portfolio and minimize permanent loss of capital. The Board concluded that the Fund’s Management Agreement should be continued for an additional one-year period, and management’s efforts should continue to be monitored. In doing so, the Board noted that, while below median, the Fund’s annualized total return for the one-,
three-, five- and 10-year periods was 20.96%, 14.29%, 9.99% and 12.87%, respectively.
Franklin Global Real Estate VIP Fund - The Performance Universe for the Fund included the Fund and all global real estate funds underlying VIPs. The Board noted that the Fund’s annualized total return for the three-, five- and 10-year periods was above the median of its Performance Universe, but for the one-year period was below the median of its Performance Universe. The Board further noted that, while below the median, the Fund’s one-year annualized total return was 12.02% and only slightly below the Performance Universe median of 13.11%. The Board concluded that the Fund’s performance was acceptable.
Franklin Rising Dividends VIP Fund - The Performance Universe for the Franklin Rising Dividends VIP Fund included the Fund and all large-cap core funds underlying VIPs. The Board noted that the Fund’s annualized total return for the three-, five- and 10-year periods was above the median of its Performance Universe, but for the one-year period was below the median of its Performance Universe. The Board further noted that, while below the median, the Fund’s one-year annualized total return was 20.55% and only slightly below the Performance Universe median of 20.92%. The Board concluded that the Fund’s performance was acceptable.
Franklin Small Cap Value VIP Fund and Templeton Developing Markets VIP Fund - The Performance Universe for the Franklin Small Cap Value VIP Fund included the Fund and all small-cap value funds underlying VIPs. The Performance Universe for the Templeton Developing Markets VIP Fund included the Fund and all emerging markets funds underlying VIPs. The Board noted that each Fund’s annualized total return for the one-, three-, five- and 10-year periods was above the median of its Performance Universe. The Board concluded that each Fund’s performance was satisfactory.
Franklin U.S. Government Securities VIP Fund - The Performance Universe for the Fund included the Fund and all intermediate US government funds underlying VIPs. The Board noted that the Fund’s annualized income return for the one-, three-, five- and 10-year periods was above the median and in the first quintile (best) of its Performance Universe. The Board also noted that the Fund’s annualized total return for the one-, three-, five- and 10-year periods was below the median of its Performance Universe. Given the Fund’s income-oriented investment objective and conservative policy of investing a significant to substantial amount in
FRANKLIN TEMPLETON VARIABLE INSURANCE PRODUCTS TRUST
SHAREHOLDER INFORMATION
Ginnie Mae obligations, the Board concluded that the Fund’s performance was satisfactory.
Franklin VolSmart Allocation VIP Fund - The Performance Universe for the Fund included the Fund and all flexible portfolio funds underlying VIPs. The Performance Customized Peer Group for the Fund consisted of the Fund and all retail and institutional mixed-asset target allocation moderate funds. The Fund has been in operation for less than 10 years. The Board noted that the Fund’s annualized total return for the three- and five-year periods was below the medians of its Performance Universe and Performance Customized Peer Group, but for the one-year period was above the medians of its Performance Universe and Performance Customized Peer Group. The Board further noted that the Fund’s annualized total return for the three-year period was only 0.02% below the median of its Performance Universe and that the Fund’s annualized total return for the one-year period was 13.90% and in the second quintile of its Performance Universe. The Board concluded that the Fund’s performance was satisfactory.
Templeton Foreign VIP Fund - The Performance Universe for the Fund included the Fund and all international multi-cap value funds underlying VIPs. The Board noted that the Fund’s annualized total return for the one-, three-, five- and 10-year periods was below the median of its Performance Universe. The Board discussed this performance with management and management explained that, even though the Fund’s peer group is comprised of multi-cap value funds, the Fund has a more intense value tilt than the Performance Universe, which has negatively impacted the Fund’s relative returns during a period of historic and sustained outperformance of growth over value. Management further explained that over the one-, three- and five-year periods, the Fund’s performance was also negatively impacted by stock selection among overweight health care holdings and underweight industrials and consumer discretionary stocks. Management then discussed with the Board the actions that are being taken in an effort to address the sources of the Fund’s underperformance, including a focus on constructing a more diversified and high-conviction portfolio. The Board concluded that the Fund’s Management Agreement should be continued for an additional one-year period, and management’s efforts should continue to be monitored.
Templeton Global Bond VIP Fund - The Performance Universe for the Fund included the Fund and all global income funds underlying VIPs. The Board noted that the
Fund’s annualized income return for the one-, three-, five-and 10-year periods was above the median of its Performance Universe. The Board also noted that the Fund’s annualized total return for the one-, three- and five-year periods was below the median of its Performance Universe, but for the 10-year period was above the median of its Performance Universe. The Board discussed this performance with management and management explained that during the one-, three- and five- year periods, management largely positioned the Fund’s strategies for rising rates by maintaining low portfolio duration and aiming at a negative correlation with US Treasury returns. Management further explained that the interest-rate strategies detracted from the Fund’s relative return, while currency positions contributed to the return. Management then discussed with the Board the portfolio manager’s outlook going forward and expectation that the risk management strategies that had weighted on return would be valuable in a diversifying portfolio going forward. The Board concluded that the Fund’s Management Agreement should be continued for an additional one-year period, and management’s efforts should continue to be monitored.
Templeton Growth VIP Fund - The Performance Universe for this Fund included the Fund and all global multi-cap value funds underlying VIPs. The Board noted that the Fund’s annualized total return for the one-, three-, five- and 10-year periods was below the median of its Performance Universe. The Board discussed this performance with management and management explained that the Fund’s higher exposure to value stocks, which have experienced a period of historic underperformance, and underweight position in US stocks, as compared to peers contributed to the Fund’s relative underperformance. Management also explained that weightings in particular sectors (such as information technology, communications services, cyclical energy and financials) and overall stock selection contributed to the Fund’s relative underperformance. Management then discussed with the Board the actions that are being taken in an effort to address the sources of the Fund’s underperformance, including a focus on constructing a more diversified and high-conviction portfolio. The Board concluded that the Fund’s Management Agreement should be continued for an additional one-year period, and management’s efforts should continue to be monitored.
Comparative Fees and Expenses
The Board reviewed and considered information regarding each Fund’s actual total expense ratio and its various components, including, as applicable, management fees;
FRANKLIN TEMPLETON VARIABLE INSURANCE PRODUCTS TRUST
SHAREHOLDER INFORMATION
transfer agent expenses; underlying fund expenses; Rule 12b-1 and non-Rule 12b-1 service fees; and other non-management fees. The Board also noted the quarterly and annual reports it receives on all marketing support payments made by FT to financial intermediaries. The Board considered the actual total expense ratio and, separately, the contractual management fee rate, without the effect of fee waivers, if any (Management Rate) of each Fund in comparison to the median expense ratio and median Management Rate, respectively, of other mutual funds deemed comparable to and with a similar expense structure to the Fund selected by Broadridge (Expense Group). Broadridge fee and expense data is based upon information taken from each fund’s most recent annual report, which reflects historical asset levels that may be quite different from those currently existing, particularly in a period of market volatility. While recognizing such inherent limitation and the fact that expense ratios and Management Rates generally increase as assets decline and decrease as assets grow, the Board believed the independent analysis conducted by Broadridge to be an appropriate measure of comparative fees and expenses. The Broadridge Management Rate includes administrative charges. The Board received a description of the methodology used by Broadridge to select the mutual funds included in an Expense Group.
Franklin Flex Cap Growth VIP Fund, Templeton Foreign VIP Fund and Templeton Growth VIP Fund - The Expense Group for the Franklin Flex Cap Growth VIP Fund included the Fund and 11 other large-cap growth funds underlying VIPs. The Expense Group for the Templeton Foreign VIP Fund included the Fund, eight other international multi-cap value funds underlying VIPs and three international large-cap value funds underlying VIPs. The Expense Group for the Templeton Growth VIP Fund included the Fund, two other global multi-cap value funds underlying VIPs, two global multi-cap core funds underlying VIPs and five global multi-cap growth funds underlying VIPs. The Board noted that the Management Rates for these Funds were above the medians of their respective Expense Groups, but their actual total expense ratios were below the medians of their respective Expense Groups. The Board further noted that the Management Rate for the Templeton Foreign VIP Fund was approximately six basis points above the median of its Expense Group and the Management Rate for the Templeton Growth VIP Fund was approximately nine basis points above the median of its Expense Group. The Board concluded that the Management Rates charged to these Funds are reasonable. In doing so, the Board noted that the
Franklin Flex Cap Growth Fund’s actual total expense ratio reflected a fee waiver from management.
Franklin Mutual Shares VIP Fund - The Expense Group for the Fund included the Fund and 10 other multi-cap value funds underlying VIPs. The Board noted that the Management Rate for the Fund was approximately 7.5 basis points above the median of its Expense Group, but its actual total expense ratio was equal to the median of its Expense Group. The Board further noted management’s explanation that the portfolio management team makes investments in distressed securities and merger arbitrage situations that are specialized in nature and therefore require additional expertise and resources, whereas the Fund’s Expense Group generally does not make such investments. The Board concluded that the Management Rate charged to the Fund is reasonable.
Franklin Strategic Income VIP Fund and Templeton Developing Markets VIP Fund - The Expense Group for the Franklin Strategic Income VIP Fund included the Fund and 10 other multi-sector income funds underlying VIPs. The Expense Group for the Templeton Developing Markets VIP Fund included the Fund and 13 other emerging markets funds underlying VIPs. The Board noted that the Management Rates for the Funds were equal to the medians of their respective Expense Groups, and their actual total expense ratios were below the medians of their respective Expense Groups. The Board concluded that the Management Rate charged to each Fund is reasonable.
Franklin Small-Mid Cap Growth VIP Fund - The Expense Group for the Franklin Small-Mid Cap Growth VIP Fund included the Fund and 12 other mid-cap growth funds underlying VIPs. The Board noted that the Management Rate for the Fund was below the median of its Expense Group, and the actual total expense ratio for the Fund was equal to the median of its Expense Group. The Board concluded that the Management Rate charged to the Fund is reasonable.
Franklin Allocation VIP Fund, Franklin Global Real Estate VIP Fund, Franklin Large Cap Growth VIP Fund and Franklin Mutual Global Discovery VIP Fund – The Expense Group for the Franklin Allocation VIP Fund included the Fund and 10 other mixed-asset target allocation growth affiliated funds of funds underlying VIPs. The Expense Group for the Franklin Global Real Estate VIP Fund included the Fund and seven other global real estate funds underlying VIPs. The Expense Group for the Franklin Large Cap Growth VIP Fund included the Fund and 11 other multi-cap growth funds underlying
FRANKLIN TEMPLETON VARIABLE INSURANCE PRODUCTS TRUST
SHAREHOLDER INFORMATION
VIPs. The Expense Group for the Franklin Mutual Global Discovery VIP Fund included the Fund, two other global multi-cap value funds underlying VIPs, two global multi-cap core funds underlying VIPs and five global multi-cap growth funds underlying VIPs. The Board noted that the Management Rates and actual total expense ratios for these Funds were above the medians of their respective Expense Groups. With respect to the Franklin Allocation VIP Fund, the Board discussed with management the reasons for the increase in the contractual management fee over the past year. Management reminded the Board that prior to May 1, 2019, the Fund was a static allocation fund of funds and did not have an investment manager or pay direct investment management fees, and that effective May 1, 2019, the Fund began investing directly in securities, entered into the Management Agreement with FAI and began paying the contractual management fee. Management also explained that Broadridge did not account for the change in the Fund’s structure and continued to use a peer group of funds of funds to compare expenses. With respect to the Franklin Mutual Global Discovery VIP Fund, the Board noted management’s explanation that the portfolio management team makes investments in distressed securities and merger arbitrage situations that are specialized in nature and therefore require additional expertise and resources, whereas the Fund’s Expense Group generally does not make such investments. The Board also noted that the Fund’s actual total expense ratio was only slightly above (less than 5 basis points) the median of the Fund’s Expense Group. With respect to the Franklin Global Real Estate VIP Fund, the Board noted management’s explanation that the portfolio managers’ rigorous fundamental analysis and active risk controls elevate management costs. The Board also noted that the Fund’s actual total expense ratio reflected a fee waiver from management. With respect to the Franklin Large Cap Growth VIP Fund, the Board noted that the Fund’s Management Rate and actual total expense ratio were only slightly above (approximately 2 basis points or less) the medians of the Fund’s Expense Group. The Board concluded that the Management Rates charged to these Funds are reasonable. In doing so, the Board noted that the Franklin Allocation VIP Fund’s sub-advisers, FTIL and TGAL, are paid by FAI out of the management fee FAI receives from the Fund.
Franklin Growth and Income VIP Fund, Franklin Income VIP Fund, Franklin Rising Dividends VIP Fund, Franklin Small Cap Value VIP Fund, Franklin U.S. Government Securities VIP Fund and Templeton Global Bond VIP Fund –The Expense Group for the Franklin Growth and Income VIP
Fund included the Fund and 10 other equity income funds underlying VIPs. The Expense Group for the Franklin Income VIP Fund included the Fund and nine other mixed-asset target allocation moderate funds underlying VIPs. The Expense Group for Franklin Rising Dividends VIP Fund included the Fund and 11 other large-cap core funds underlying VIPs. The Expense Group for the Franklin Small Cap Value VIP Fund included the Fund and eight other small-cap value funds underlying VIPs. The Expense Group for the Franklin U.S. Government Securities VIP Fund included the Fund, three other intermediate US government funds underlying VIPs and eight inflation-protected bond funds underlying VIPs. The Expense Group for the Templeton Global Bond VIP Fund included the Fund and 10 other global income funds underlying VIPs. The Board noted that the Management Rates and actual total expense ratios for these Funds were below the medians of their respective Expense Groups. The Board concluded that the Management Rates charged to these Funds are reasonable. The Board also noted that the Franklin Growth and Income VIP Fund’s actual total expense ratio reflected a fee waiver from management.
Franklin VolSmart Allocation VIP Fund – The Expense Group for this Fund included the Fund, three other flexible portfolio funds underlying VIPs and one mixed-asset target allocation growth fund underlying VIP. The Board noted the small size of the Expense Group. The Board also noted that the Management Rate for the Fund was below the median of its Expense Group and its actual total expense ratio was above the median of its Expense Group. The Board concluded that the Management Rate charged to the Fund is reasonable. In doing so, the Board noted that the Fund’s actual total expense ratio reflected a fee waiver from management.
Profitability
The Board reviewed and considered information regarding the profits realized by each Manager and its affiliates in connection with the operation of each Fund. In this respect, the Board considered the Fund profitability analysis that addresses the overall profitability of FT’s US fund business, as well as its profits in providing investment management and other services to each of the individual funds during the 12-month period ended September 30, 2019, being the most recent fiscal year-end for FRI. The Board noted that although management continually makes refinements to its methodologies used in calculating profitability in response to organizational and product-related changes, the overall methodology has remained consistent with that used in the
FRANKLIN TEMPLETON VARIABLE INSURANCE PRODUCTS TRUST
SHAREHOLDER INFORMATION
Funds’ profitability report presentations from prior years. Additionally, PricewaterhouseCoopers LLP, auditor to FRI and certain FT funds, was engaged to review and assess the allocation methodologies to be used solely by the Funds’ Board with respect to the profitability analysis.
The Board noted management’s belief that costs incurred in establishing the infrastructure necessary for the type of mutual fund operations conducted by each Manager and its affiliates may not be fully reflected in the expenses allocated to each Fund in determining its profitability, as well as the fact that the level of profits, to a certain extent, reflected operational cost savings and efficiencies initiated by management. As part of this evaluation, the Board considered the initiative currently underway to outsource certain operations, which effort would require considerable up-front expenditures by the Managers but, over the long run is expected to result in greater efficiencies. The Board also noted management’s expenditures in improving shareholder services provided to the Funds, as well as the need to implement systems and meet additional regulatory and compliance requirements resulting from recent US Securities and Exchange Commission and other regulatory requirements, notably in the area of cybersecurity protections.
The Board also considered the extent to which each Manager and its affiliates might derive ancillary benefits from fund operations, including revenues generated from transfer agent services, potential benefits resulting from personnel and systems enhancements necessitated by fund growth, as well as increased leverage with service providers and counterparties. Based upon its consideration of all these factors, the Board concluded that the level of profits realized by each Manager and its affiliates from providing services to each Fund was not excessive in view of the nature, extent and quality of services provided to each Fund.
Economies of Scale
The Board reviewed and considered the extent to which each Manager may realize economies of scale, if any, as each Fund grows larger and whether each Fund’s management fee structure reflects any economies of scale for the benefit of shareholders. With respect to possible economies of scale, the Board noted the existence of management fee breakpoints for each Fund (except for the Franklin Allocation VIP Fund and the Franklin VolSmart Allocation VIP Fund), which operate generally to share any economies of scale with a Fund’s shareholders by reducing the Fund’s effective management fees as the Fund grows in
size. The Board considered management’s view that any analyses of potential economies of scale in managing a particular fund are inherently limited in light of the joint and common costs and investments each Manager incurs across the FT family of funds as a whole. The Board concluded that to the extent economies of scale may be realized by each Manager and its affiliates, each Fund’s management fee structure (except for the Franklin Allocation VIP Fund and the Franklin VolSmart Allocation VIP Fund) provided a sharing of benefits with the Fund and its shareholders as the Fund grows. The Board recognized that there would not likely be any economies of scale for the Franklin Flex Cap Growth VIP Fund, Franklin Global Real Estate VIP Fund, Franklin Growth and Income VIP Fund, Franklin Large Cap Growth VIP Fund and Franklin VolSmart Allocation VIP Fund until each Fund’s assets grow. The Board also recognized that given the decline in assets over the past three calendar years for each of the Franklin Income VIP Fund, Franklin Rising Dividends VIP Fund, Franklin Small Cap Value VIP Fund, Franklin Strategic Income VIP Fund, Franklin U.S. Government Securities VIP Fund, Templeton Foreign VIP Fund and Templeton Growth VIP Fund, these Funds are not expected to experience additional economies of scale in the foreseeable future.
Conclusion
Based on its review, consideration and evaluation of all factors it believed relevant, including the above-described factors and conclusions, the Board unanimously approved the continuation of each Management Agreement for an additional one-year period.
Board Approval of Investment Management Agreements
FRANKLIN TEMPLETON VARIABLE INSURANCE PRODUCTS TRUST
Templeton Developing Markets VIP Fund (Fund)
At a meeting held on May 13, 2020 (Meeting), the Board of Trustees (Board) of Franklin Templeton Variable Insurance Products Trust (Trust), including a majority of the trustees who are not “interested persons” as defined in the Investment Company Act of 1940 (Independent Trustees), reviewed and approved a new investment sub-advisory agreement between Templeton Asset Management Ltd. (Manager), the Fund’s investment manager, and Franklin Templeton Investment Management Limited (Sub-Adviser),
FRANKLIN TEMPLETON VARIABLE INSURANCE PRODUCTS TRUST
SHAREHOLDER INFORMATION
on behalf of the Fund (Sub-Advisory Agreement) for an initial two-year period. The Independent Trustees received advice from and met separately with Independent Trustee counsel in considering whether to approve the Sub-Advisory Agreement.
The Board reviewed and considered information provided by the Manager at the Meeting with respect to the Sub-Advisory Agreement. The Board also reviewed and considered the factors it deemed relevant in approving the Sub-Advisory Agreement, including, but not limited to: (i) the nature, extent, and quality of the services to be provided by the Sub-Adviser; and (ii) the costs of the services to be provided by the Sub-Adviser. The Board further reviewed and considered information provided by management showing the expected impact of hiring the Sub-Adviser on the Manager’s profitability consistent with the Order (as defined below). The Board also considered that management proposed that the Board approve the Sub-Advisory Agreement in order to facilitate certain portfolio management team enhancements. The Board reviewed and further considered the form of Sub-Advisory Agreement and the terms of the Sub-Advisory Agreement which were discussed at the Meeting, noting that the terms and conditions of the Sub-Advisory Agreement were substantially identical to the terms and conditions of sub-advisory agreements for other Franklin Templeton (FT) mutual funds.
In approving the Sub-Advisory Agreement, the Board, including a majority of the Independent Trustees, determined that the hiring of the Sub-Adviser is in the best interests of the Fund and its shareholders and does not involve a conflict of interest from which the Manager or Sub-Adviser derives an inappropriate advantage. The Board also determined that the terms of the Sub-Advisory Agreement are fair and reasonable and that the approval of such Sub-Advisory Agreement is in the interests of the Fund and its shareholders. While attention was given to all information furnished, the following discusses some primary factors relevant to the Board’s determination.
Nature, Extent and Quality of Services
The Board reviewed and considered information regarding the nature, extent and quality of investment management services to be provided by the Sub-Adviser and currently being provided by the Manager and its affiliates to the Fund and its shareholders. In doing so, the Board noted that the Fund employs a “manager of managers” structure pursuant to an exemptive order (Order) granted to the Manager by the U.S. Securities and Exchange Commission, whereby the
Manager and the Fund may, without shareholder approval, enter into sub-advisory agreements with sub-advisers that are indirect or direct wholly owned subsidiaries of Franklin Resources, Inc. (FRI). In particular, with respect to the Sub-Adviser, the Board took into account that the Sub-Advisory Agreement would not affect how the Fund is managed or the Fund’s investment goal, principal investment strategies or principal risks associated with an investment in the Fund. The Board reviewed and considered information regarding the nature, quality and extent of investment subadvisory services to be provided by the Sub-Adviser to the Fund and its shareholders under the Sub-Advisory Agreement; the Sub-Adviser’s experience as manager of other funds and accounts, including those within the FT organization; the personnel, operations, financial condition, and investment management capabilities, methodologies and resources of the Sub-Adviser and the Sub-Adviser’s capabilities, as demonstrated by, among other things, its policies and procedures designed to prevent violations of the federal securities laws, which had previously been approved by the Board in connection with its oversight of other funds in the FT organization.
The Board also reviewed and considered the benefits provided to Fund shareholders of investing in a fund that is part of the FT family of funds. The Board noted the financial position of FRI, the parent of the Manager and Sub-Adviser, and its commitment to the mutual fund business as evidenced by its continued introduction of new funds, reassessment of the fund offerings in response to the market environment and project initiatives and capital investments relating to the services provided to the Fund by the FT organization. The Board specifically noted FT’s commitment to enhancing services and controlling costs, as reflected in its plan to outsource certain administrative functions, and growth opportunities, as evidenced by its upcoming acquisition of the Legg Mason companies. The Board acknowledged the change in leadership at FRI and the opportunity to hear from Jennifer Johnson, President and Chief Executive Officer of FRI, about goals she has for the company that will benefit the Fund.
Following consideration of such information, the Board was satisfied with the nature, extent and quality of services to be provided by the Sub-Adviser and its affiliates to the Fund and its shareholders.
Fund Performance
The Board noted its review and consideration of the performance results of the Fund in connection with the April
FRANKLIN TEMPLETON VARIABLE INSURANCE PRODUCTS TRUST
SHAREHOLDER INFORMATION
2020 annual contract renewal (Annual Contract Renewal) of the Fund’s investment management agreement. The Board recalled its conclusion at that time that the Fund’s performance was satisfactory. The Board also noted the proposed portfolio management team enhancements for the Fund, and determined that, in light of these changes, additional time will be needed to evaluate the effectiveness of management’s actions.
Comparative Fees and Expenses
The Board reviewed and considered information regarding the investment subadvisory fee to be charged by the Sub-Adviser. The Board noted that the addition of the Sub-Adviser will have no impact on the amount of management fees that are currently paid by the Fund as the Sub-Adviser will be paid by the Manager out of the management fee that the Manager receives from the Fund. The Board further noted that the allocation of the fee between the Manager and the Sub-Adviser reflected the services to be provided by each. The Board concluded that the proposed investment subadvisory fee is reasonable.
Management Profitability and Economies of Scale
The Board noted that it reviewed and considered information showing the expected impact of retaining the Sub-Adviser on the profitability of the Manager consistent with the conditions of the Order. The Board determined that its conclusions regarding profitability and economies of scale reached in connection with the Annual Contract Renewal of the investment management agreement with the Manager had not changed as a result of the proposal to approve the Sub-Advisory Agreement.
Conclusion
Based on its review, consideration and evaluation of all factors it believed relevant, including the above-described factors and conclusions, the Board unanimously approved the Sub-Advisory Agreement for an initial two-year period.
Liquidity Risk Management Program
The Funds have adopted and implemented a written Liquidity Risk Management Program (the “LRMP”) as required by Rule 22e-4 under the Investment Company Act of 1940. The program is designed to assess and manage each Fund’s liquidity risk, taking into consideration the Fund’s investment strategy and the liquidity of its portfolio investments during normal and reasonably foreseeable stressed conditions; its short and long-term cash flow projections; and its cash holdings and access to other
funding sources including the Funds’ interfund lending facility and line of credit. The Funds’ Board of Trustees approved the appointment of the Director of Liquidity Risk within the Investment Risk Management Group (the “IRMG”) as the Administrator of the LRMP. The IRMG maintains the Investment Liquidity Committee (the “ILC”) to provide oversight and administration of policies and procedures governing liquidity risk management for FT products and portfolios. The ILC includes representatives from Franklin Templeton’s Risk, Trading, Global Compliance, Investment Compliance, Investment Operations, Valuation Committee and Product Management groups.
The LRMP Administrator Annual Report was presented to the Fund(s) Board of Trustees at their meetings in May 2020. The report covered the adequacy and effectiveness of the program during the period December 1, 2018 to December 31, 2019 (the “covered period”). The report concluded that (i.) the LRMP, as adopted and implemented, remains reasonably designed to assess and manage each Fund’s liquidity risk; (ii.) the LRMP, including the Highly Liquid Investment Minimum (“HLIM”) where applicable, was implemented and operated effectively to achieve the goal of assessing and managing each Fund’s liquidity risk; and (iii.) each fund was able to meet requests for redemption without significant dilution of remaining investors’ interests in the Fund. In addition, the LRMP Administrator presented the Fund Board of Trustees an update on liquidity during the first quarter of 2020 in relation to the COVID-19 pandemic.
During the reporting period, the Fund maintained a high level of liquid assets that are defined under the Liquidity Rule as “Highly Liquid Investments.” As a result, the Fund was designated a “Primarily Highly Liquid Fund” as defined under the Liquidity Rule and has not adopted a “Highly Liquid Investment Minimum.” A Highly Liquid Investment is defined as cash and any investment reasonably expected to be convertible to cash in current market conditions in three business days or less without the conversion to cash significantly changing the market value of the investment.
There can be no assurance that the program will achieve its objectives in the future. Please refer to your Fund’s prospectus for more information regarding the Fund’s exposure to liquidity risk and other principal risks to which an investment in the Fund may be subject.
FRANKLIN TEMPLETON VARIABLE INSURANCE PRODUCTS TRUST
SHAREHOLDER INFORMATION
Proxy Voting Policies and Procedures
The Trust’s investment manager has established Proxy Voting Policies and Procedures (Policies) that the Trust uses to determine how to vote proxies relating to portfolio securities. Shareholders may view the Trust’s complete Policies online at franklintempleton.com. Alternatively, shareholders may request copies of the Policies free of charge by calling the Proxy Group collect at (954) 527-7678 or by sending a written request to: Franklin Templeton Companies, LLC, 300 S.E. 2nd Street, Fort Lauderdale, FL 33301, Attention: Proxy Group. Copies of the Trust’s proxy voting records are also made available online at franklintempleton.com and posted on the U.S. Securities and Exchange Commission’s website at sec.gov and reflect the most recent 12-month period ended June 30.
Quarterly Statement of Investments
The Trust files a complete statement of investments with the U.S. Securities and Exchange Commission for the first and third quarters for each fiscal year as an exhibit to its report on Form N-PORT. Shareholders may view the filed Form N-PORT by visiting the Commission’s website at sec.gov. The filed form may also be viewed and copied at the Commission’s Public Reference Room in Washington, DC. Information regarding the operations of the Public Reference Room may be obtained by calling (800) SEC-0330.
This page intentionally left blank.
This page intentionally left blank.
This page intentionally left blank.
Franklin Templeton Variable Insurance Products Trust (FTVIP) shares are not offered to the public; they are offered and sold only to: (1) insurance company separate accounts (Separate Account) to serve as the underlying investment vehicle for variable contracts; (2) certain qualified plans; and (3) other mutual funds (funds of funds).
Authorized for distribution to investors in Separate Accounts only when accompanied or preceded by the current prospectus for the applicable contract, which includes the Separate Account and the FTVIP prospectuses. Investors should carefully consider a fund’s investment goals, risks, charges and expenses before investing. The prospectus contains this and other information; please read it carefully before investing.
To help ensure we provide you with quality service, all calls to and from our service areas are monitored and/or recorded.
| | | | | | |
 | | Semiannual Report |
| | Franklin Templeton Variable Insurance Products Trust |
| | Investment Managers | | Fund Administrator | | Distributor |
| | Franklin Advisers, Inc. Franklin Mutual Advisers, LLC Templeton Asset Management Ltd. Templeton Global Advisors Limited Templeton Investment Counsel, LLC | | Franklin Templeton Services, LLC | | Franklin Templeton Distributors, Inc. |
| | |
| © 2020 Franklin Templeton Investments. All rights reserved. | | VIP4 S 08/20 |
| (a) | The Registrant has adopted a code of ethics that applies to its principal executive officers and principal financial and accounting officer. |
| (f) | Pursuant to Item 13(a)(1), the Registrant is attaching as an exhibit a copy of its code of ethics that applies to its principal executive officers and principal financial and accounting officer. |
| Item 3. | Audit Committee Financial Expert. |
(a)(1) The Registrant has an audit committee financial expert serving on its audit committee.
| (2) | The audit committee financial expert is Mary C. Choksi and she is “independent” as defined under the relevant Securities and Exchange Commission Rules and Releases. |
| Item 4. | Principal Accountant Fees and Services. N/A |
| Item 5. | Audit Committee of Listed Registrants. N/A |
| Item 6. | Schedule of Investments. N/A |
| Item 7. | Disclosure of Proxy Voting Policies and Procedures for Closed-End Management Investment Companies. N/A |
| Item 8. | Portfolio Managers of Closed-End Management Investment Companies. N/A |
| Item 9. | Purchases of Equity Securities by Closed-End Management Investment Company and Affiliated Purchasers. N/A |
| Item 10. | Submission of Matters to a Vote of Security Holders. |
There have been no changes to the procedures by which shareholders may recommend nominees to the Registrant’s Board of Trustees that would require disclosure herein.
| Item 11. | Controls and Procedures. |
(a) Evaluation of Disclosure Controls and Procedures. The Registrant maintains disclosure controls and procedures that are designed to provide reasonable assurance that information required to be disclosed in the Registrant’s filings under the Securities Exchange Act of 1934, as amended, and the Investment Company Act of 1940 is recorded, processed, summarized and reported within the periods specified in the rules and forms of the Securities and Exchange Commission. Such information is accumulated and communicated to the Registrant’s management, including its principal executive officer and principal financial officer, as appropriate, to allow timely decisions regarding required disclosure. The Registrant’s management, including the principal executive officer and the principal financial officer, recognizes that any set of controls and procedures, no matter how well designed and operated, can provide only reasonable assurance of achieving the desired control objectives.
Within 90 days prior to the filing date of this Shareholder Report on Form N-CSR, the Registrant had carried out an evaluation, under the supervision and with the participation of the Registrant’s management, including the Registrant’s principal executive officer and the Registrant’s principal financial officer, of the effectiveness of the design and operation of the Registrant’s disclosure controls and procedures. Based on such evaluation, the Registrant’s principal executive officer and principal financial officer concluded that the Registrant’s disclosure controls and procedures are effective.
(b) Changes in Internal Controls. There have been no changes in the Registrant’s internal control over financial reporting that occurred during the period covered by this report that has materially affected, or is reasonably likely to materially affect the internal control over financial reporting.
| Item 12. | Disclosure of Securities Lending Activities for Closed-End Management Investment Company. N/A |
(a)(1) Code of Ethics
(a)(2) Certifications pursuant to Section 302 of the Sarbanes-Oxley Act of 2002 of Matthew T. Hinkle, Chief Executive Officer - Finance and Administration, and Gaston Gardey, Chief Financial Officer and Chief Accounting Officer
(b) Certifications pursuant to Section 906 of the Sarbanes-Oxley Act of 2002 of Matthew T. Hinkle, Chief Executive Officer - Finance and Administration, and Gaston Gardey, Chief Financial Officer and Chief Accounting Officer
SIGNATURES
Pursuant to the requirements of the Securities Exchange Act of 1934 and the Investment Company Act of 1940, the registrant has duly caused this report to be signed on its behalf by the undersigned, thereunto duly authorized.
Franklin Templeton Variable Insurance Products Trust
| | |
| By | | /S/ MATTHEW T. HINKLE |
| | Matthew T. Hinkle |
| | Chief Executive Officer – Finance and Administration |
Date August 25, 2020
Pursuant to the requirements of the Securities Exchange Act of 1934 and the Investment Company Act of 1940, this report has been signed below by the following persons on behalf of the registrant and in the capacities and on the dates indicated.
| | |
| By | | /S/ MATTHEW T. HINKLE |
| | Matthew T. Hinkle |
| | Chief Executive Officer – Finance and Administration |
| Date August 25, 2020 |
| |
| By | | /S/ GASTON GARDEY |
| | Gaston Gardey |
| | Chief Financial Officer and Chief Accounting Officer |
| Date August 25, 2020 |