UNITED STATES
SECURITIES AND EXCHANGE COMMISSION
Washington, DC 20549
FORM N-CSRS
CERTIFIED SHAREHOLDER REPORT OF REGISTERED
MANAGEMENT INVESTMENT COMPANIES
Investment Company Act file number 811-05583
Franklin Templeton Variable Insurance Products Trust
(Exact name of registrant as specified in charter)
One Franklin Parkway, San Mateo, CA 94403-1906
(Address of principal executive offices) (Zip code)
Craig S. Tyle, One Franklin Parkway, San Mateo, CA 94403-1906
(Name and address of agent for service)
Registrant’s telephone number, including area code: (650) 312-2000
Date of fiscal year end: 12/31
Date of reporting period: 06/30/20
| Item 1. | Reports to Stockholders. |
Internet Delivery of Shareholder Reports: Effective January 1, 2021, as permitted by regulations adopted by the SEC, you may not be receiving paper copies of the Fund’s annual or semiannual shareholder reports by mail, unless you specifically request them from the insurance company that offers your variable annuity or variable life insurance contract or your financial intermediary. Instead of delivering paper copies of the report, the insurance company may choose to make the reports available on a website, and will notify you by mail each time a shareholder report is posted and provide you with a website link to access the report. Instructions for requesting paper copies will be provided by your insurance company.
If you already elected to receive shareholder reports electronically, you will not be affected by this change and you need not take any action. You may elect to receive shareholder reports and other communications from the insurance company or your financial intermediary electronically by following the instructions provided by the insurance company or by contacting your financial intermediary.
You may elect to receive all future Fund shareholder reports in paper free of charge from the insurance company. You can inform the insurance company or your financial intermediary that you wish to continue receiving paper copies of your shareholder reports by following the instructions provided by the insurance company or by contacting your financial intermediary. Your election to receive reports in paper will apply to all portfolio companies available under your contract with the insurance company.
This notice is not legally a part of the shareholder report.
Franklin Templeton Variable Insurance
Products Trust Semiannual Report
Table of Contents
| | |
| | |
Not FDIC Insured | May Lose Value | No Bank Guarantee | | |
MASTER CLASS – 5
FRANKLIN TEMPLETON VARIABLE INSURANCE PRODUCTS TRUST
Important Notes to
Performance Information
Performance data is historical and cannot predict or guarantee future results. Principal value and investment return will fluctuate with market conditions, and you may have a gain or loss when you withdraw your money. Inception dates of the funds may have preceded the effective dates of the subaccounts, contracts or their availability in all states.
When reviewing the index comparisons, please keep in mind that indexes have a number of inherent performance differentials over the funds. First, unlike the funds, which must hold a minimum amount of cash to maintain liquidity,
indexes do not have a cash component. Second, the funds are actively managed and, thus, are subject to management fees to cover salaries of securities analysts or portfolio managers in addition to other expenses. Indexes are unmanaged and do not include any commissions or other expenses typically associated with investing in securities. Third, indexes often contain a different mix of securities than the fund to which they are compared. Additionally, please remember that indexes are simply a measure of performance and cannot be invested in directly.
Franklin VolSmart Allocation VIP Fund
This semiannual report for Franklin VolSmart Allocation VIP Fund covers the period ended June 30, 2020.
Class 5 Performance Summary as of June 30, 2020
The Fund’s Class 5 Shares posted a +4.40% total return* for the six-month period ended June 30, 2020.
*Prior to 5/1/15, the Fund followed different investment strategies, had different subadvisory arrangements, allocated its core portfolio differently, had a different current target volatility goal and made different use of derivative instruments. As a result, the Fund generally held different investments and had a different investment profile. The Fund has an expense reduction contractually guaranteed through 4/30/21. Fund investment results reflect the expense reduction, without this reduction, the results would have been lower.
Performance reflects the Fund’s Class 5 operating expenses, but does not include any contract fees, expenses or sales charges. If they had been included, performance would be lower. These charges and deductions, particularly for variable life policies, can have a significant effect on contract values and insurance benefits. See the contract prospectus for a complete description of these expenses, including sales charges.
Performance data represent past performance, which does not guarantee future results. Investment return and principal value will fluctuate, and you may have a gain or loss when you sell your shares. Current performance may differ from figures shown.
FRANKLIN VOLSMART ALLOCATION VIP FUND
Fund Goal and Main Investments
The Fund seeks total return (including income and capital gains) while seeking to manage volatility. The Fund is structured as a limited “fund-of-funds” that seeks to achieve its investment goal by investing its assets partially in other mutual funds, which include other Franklin Templeton mutual funds as well as Franklin Templeton and third-party exchange-traded funds (ETFs) (underlying funds). Each underlying fund is allocated to the equity, fixed income, multi-class or cash asset class based on its predominant asset class and strategies. These underlying funds, in turn, invest in a variety of U.S. and foreign equity, fixed-income and money market securities. The Fund also obtains exposure to certain strategies and investments in its core portfolio by directly investing in the securities and instruments in that strategy.
Fund Risks
All investments involve risks, including possible loss of principal. Unexpected events and their aftermaths, such as the spread of deadly diseases; natural, environmental or man-made disasters; financial, political or social disruptions; terrorism and war; and other tragedies or catastrophes, can cause investor fear and panic, which can adversely affect the economies of many companies, sectors, nations, regions and the market in general, in ways that cannot necessarily be foreseen. There can be no guarantee that the Fund will stay within its target volatility. Also, the managed volatility and tail risk protection strategies could negatively impact the Fund’s return and expose the Fund to additional costs. Generally, investors should be comfortable with fluctuation in the value of their investments, especially over the short term. Stock prices fluctuate, sometimes rapidly and dramatically, due to factors affecting individual companies, particular industries or sectors, or general market conditions. Bond prices generally move in the opposite direction of interest rates. Changes in the financial strength of a bond issuer or in a bond’s credit rating may affect its value. Derivatives involve costs and can create economic leverage in the portfolio, which may result in significant volatility and cause the Fund to participate in losses (as well as gains) in an amount that exceeds the Fund’s initial investment. The Fund
may not achieve the anticipated benefits, and may realize losses when a counterparty fails to perform. Because the Fund allocates assets to a variety of investment strategies, ETFs and other mutual funds, which involve certain risks, it may be subject to those same risks. The Fund is actively managed but there is no guarantee that the manager’s investment decisions will produce the desired results. The Fund’s prospectus also includes a description of the main investment risks.
Performance Overview
You can find the Fund’s six-month total return in the Performance Summary. For comparison, the Fund’s equity benchmark, the Standard & Poor’s® 500 Index (S&P 500®), posted a -3.08% total return, while the Fund’s fixed income benchmark, the Bloomberg Barclays U.S. Aggregate Bond Index, posted a +6.14% total return for the period under review.1,2 The Fund’s Blended Benchmark, a combination of leading stock and bond indexes that better reflects the asset allocation of the Fund’s portfolio, posted a +0.44% total return for the same period.2
Economic and Market Overview
U.S. equities, as measured by the S&P 500, nearly reversed earlier losses but declined modestly during the six-month period. A sharp selloff began in late February 2020 amid investor fears of a global economic slowdown due to the novel coronavirus (COVID-19) pandemic.
Government-issued restrictions to mitigate the pandemic severely curtailed U.S. economic activity beginning in March 2020. As a result, the unemployment rate surged to 14.7% in April as many businesses, particularly in hospitality, retail and travel, announced mass layoffs.3 Within just two months, the unemployment rate went from a 50-year low to an 80-year high.3 The longest U.S. economic expansion in history ended in February, according to the National Bureau of Economic Research, and the country slipped into a deep recession.
In an effort to buffer the sharp drop in economic activity, the Fed implemented two emergency rate cuts in March 2020, lowering the federal funds target rate to a range of
1. Source: Morningstar.
2. Source: FactSet. The Fund’s Blended Benchmark was calculated internally and rebalanced monthly and was composed of 60% S&P 500, 30% Bloomberg Barclays U.S. Aggregate Bond Index and 10% Bloomberg Barclays 1-3 Month U.S. Treasury Bill Index.
One cannot invest directly in an index, and an index is not representative of the Fund’s portfolio. Please see Index Descriptions following the Fund Summaries.
3. Source: Bureau of Labor Statistics.
The dollar value, number of shares or principal amount, and names of all portfolio holdings are listed in the Fund’s Statement of Investments (SOI).
FRANKLIN VOLSMART ALLOCATION VIP FUND
0.00%–0.25%. Additionally, the Fed announced broad quantitative easing measures aimed at ensuring the flow of credit to borrowers and supporting credit markets with unlimited amounts of bond purchasing. Meanwhile, Congress passed the Coronavirus Aid, Relief and Economic Security Act to provide economic relief for individuals and businesses and additional funding for small businesses.
Benefiting from these fiscal and monetary measures, equities began to advance at the end of March 2020. As states gradually reopened, economic activity resumed, leading to declining initial jobless claims and record-high increases in job additions and existing home sales. Optimism about potential COVID-19 vaccines and treatments and rising retail sales further supported equities, which rebounded from multi-year lows to post the strongest second-quarter returns in more than 20 years. Nevertheless, surging infection rates in several states near the end of June led to concerns that economic recovery could be hindered if reopening measures are paused or rolled back.
The U.S. bond market, as measured by the Bloomberg Barclays U.S. Aggregate Bond Index, advanced during the six-month period despite significant economic disruption in the wake of the novel coronavirus (COVID-19) pandemic. In late February 2020, as more countries adopted social distancing and lockdown measures to slow the global pandemic, the U.S. bond market began pricing in the adverse impact on economic activity. Higher-quality, longer-term bonds rallied, while riskier, lower-rated corporate bonds declined sharply, reflecting a reversal in many investors’ risk appetite. During the last quarter of the reporting period, however, as generally slowing infection rates and phased business reopenings by states drove hopes for an economic rebound, corporate bond valuations advanced significantly. Nevertheless, an increase in infection rates toward period-end prompted concern among investors, hindering lower-rated bonds.
U.S. Treasury bonds, as measured by the Bloomberg Barclays U.S. Treasury Index, rose significantly during the reporting period. Bond purchasing by the Fed and robust demand for investments perceived as safe drove the U.S. Treasury market higher despite the widening U.S. federal budget deficit and the massive increase in issuance. Mortgage-backed securities (MBS), as measured by the Bloomberg Barclays MBS Index, also posted positive returns, aided by declining Treasury rates and the Fed’s decision to purchase agency MBS.
U.S. corporate bond performance varied significantly based on credit rating, as investors became concerned about the pandemic-related economic disruption and the potential
Asset Allocation*
Based on Total Net Assets as of 6/30/20
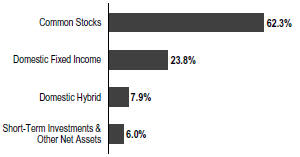
*The asset allocation is based on the Statement of Investments (SOI), which classifies each underlying fund into a broad asset class.
credit downgrades of many companies. Investment-grade corporate bonds, as represented by the Bloomberg Barclays U.S. Corporate Bond Index, rebounded significantly after mid-March 2020 to post positive overall returns for the reporting period. In contrast, high-yield corporate bonds, as represented by the Bloomberg Barclays U.S. Corporate High Yield Bond Index, declined due to investor concerns about a potential increase in credit defaults.
Investment Strategy
Under normal market conditions, the Fund seeks to achieve its investment goal by allocating its assets across certain asset classes, sectors and strategies in an attempt to produce a diversified portfolio that will generate returns, while minimizing the expected volatility of the Fund’s returns so that volatility does not exceed a target of 10% per year. (Volatility within the 10% target is referred to as “Target Volatility.”) The Fund’s assets are primarily invested in its “core portfolio,” which is principally composed of various U.S. equity and fixed income investments and strategies, including other mutual funds and ETFs that provide exposure to such investments and strategies.
In addition, the Fund employs a volatility management strategy, which is designed to manage the expected volatility of the Fund’s returns so that volatility remains within the Fund’s Target Volatility. Thus, the Fund may utilize certain derivative instruments (primarily futures contracts on indexes) in an effort to adjust the Fund’s expected volatility to within the Target Volatility. There is no guarantee that the Fund will stay within its Target Volatility.
Manager’s Discussion
As of the end of the reporting period, at the asset allocation level, the Fund held roughly 62.3% in equities, 23.8% in fixed
FRANKLIN VOLSMART ALLOCATION VIP FUND
income, 7.9% in multi-asset class consisting of equities and fixed income, and 6.0% in cash.
Equities
The Fund’s underlying equity allocation benefited from an overweight to the asset class as global equity markets surged during the second quarter of 2020, recovering some of the sharp losses incurred in the first quarter. The overweight to equity reflected our belief that while concerns about the economy remain, they have been offset in part by a comprehensive monetary and fiscal policy response from the Fed and other central banks.
The Franklin Rising Dividends strategy, the largest underlying equity strategy in the Fund, slightly detracted from relative performance. The strategy’s focus on dividend paying equities dampened returns as investors became less risk-averse during the second quarter and the strategy fell out of favor. The Franklin Smart Beta equity strategy also lagged the broader U.S. equity market as its focus on the quality and value factors were out of favor relative to growth.
Fixed Income
The Fund’s fixed income exposures contributed to relative returns. Franklin Low Duration Fund and Franklin Strategic Income Fund both outperformed their respective indexes as positioning in corporate and securitized debt rallied in a risk-on environment for credit-related assets. The Franklin Liberty U.S. Core Bond ETF also outperformed its index as an overweight and security selection enhanced returns relative to the Bloomberg Barclays U.S. Aggregate Bond Index.
Multi-Asset
A small allocation to the Franklin Income Fund generated positive absolute returns for the period as high-yield and investment-grade corporate debt allocations were additive to performance. However, overweightings and stock selection in the energy and financials sectors detracted from relative returns.
Hedging
Several metrics of market volatility fell from record levels in March after the Fed’s stimulus efforts helped equities rally in the second quarter. However, the underlying portfolio’s standard deviation remained elevated above the 10% threshold. The VolSmart volatility management strategy was active during the period but detracted from relative results.
Toward the end of the period we repositioned some of our equity holdings. This involved exiting Franklin DynaTech
Portfolio Strategy Holdings*
6/30/20
| | |
| | | % of Total |
| | | Net Assets |
| |
Franklin Rising Dividends Strategy | | 32.4% |
| |
U.S. Smart Beta Strategy | | 31.0% |
| |
Franklin Liberty U.S. Core Bond ETF | | 14.5% |
| |
Franklin Income Fund | | 8.2% |
| |
Franklin Low Duration Total Return Fund | | 5.8% |
| |
Franklin Strategic Income Fund | | 3.7% |
| |
Tail Risk Protection | | 2.0% |
| |
Equity ETFs | | 0.1% |
| |
Equity Volatility Hedge | | -13.7% |
| |
Short-Term Investments & Other Net Assets | | 16.0% |
| *The | breakdown may not match the SOI. |
Fund and initiating a new U.S. Smart Beta strategy. In fixed income, we initiated a new position in Franklin Liberty U.S. Core Bond ETF.
Thank you for your participation in Franklin VolSmart Allocation VIP Fund. We look forward to serving your future investment needs.
The foregoing information reflects our analysis, opinions and portfolio holdings as of June 30, 2020, the end of the reporting period. The way we implement our main investment strategies and the resulting portfolio holdings may change depending on factors such as market and economic conditions. These opinions may not be relied upon as investment advice or an offer for a particular security. The information is not a complete analysis of every aspect of any market, country, industry, security or the Fund. Statements of fact are from sources considered reliable, but the investment manager makes no representation or warranty as to their completeness or accuracy. Although historical performance is no guarantee of future results, these insights may help you understand our investment management philosophy.
FRANKLIN VOLSMART ALLOCATION VIP FUND
Class 5 Fund Expenses
As an investor in a variable insurance contract (Contract) that indirectly provides for investment in an underlying mutual fund, you can incur transaction and/or ongoing expenses at both the Fund level and the Contract Level: (1) transaction expenses can include sales charges (loads) on purchases, surrender fees, transfer fees and premium taxes; and (2) ongoing expenses can include management fees, distribution and service (12b-1) fees, contract fees, annual maintenance fees, mortality and expense risk fees and other fees and expenses. All mutual funds and Contracts have some types of ongoing expenses. The table below shows Fund-level ongoing expenses and can help you understand these costs and compare them with those of other mutual funds offered through the Contract. The table assumes a $1,000 investment held for the six months indicated. Please refer to the Fund prospectus for additional information on operating expenses.
Actual Fund Expenses
The table below provides information about the actual account values and actual expenses in the columns under the heading “Actual.” In these columns the Fund’s actual return, which includes the effect of ongoing Fund expenses but does not include the effect of ongoing Contract expenses, is used to calculate the “Ending Account Value.” You can estimate the Fund-level expenses you paid during the period by following these steps (of course, your account value and expenses will differ from those in this illustration): Divide your account value by $1,000 (if your account had an $8,600 value, then $8,600 ÷ $1,000 = 8.6). Then multiply the result by the number under the headings “Actual” and “Fund-Level Expenses Paid During Period” (if Fund-Level Expenses Paid During Period were $ 7.50, then 8.6 x $ 7.50 = $64.50). In this illustration, the estimated expenses paid this period at the Fund level are $64.50.
Hypothetical Example for Comparison with Other Mutual Funds
Under the heading “Hypothetical” in the table, information is provided about hypothetical account values and hypothetical expenses based on the Fund’s actual expense ratio and an assumed rate of return of 5% per year before expenses, which is not the Fund’s actual return. This information may not be used to estimate the actual ending account balance or expenses you paid for the period, but it can help you compare ongoing costs of investing in the Fund with those of other mutual funds offered through the Contract. To do so, compare this 5% hypothetical example with the 5% hypothetical examples that appear in the shareholder reports of other funds offered through the Contract.
Please note that expenses shown in the table are meant to highlight ongoing costs at the Fund level only and do not reflect any ongoing expenses at the Contract level, or transaction expenses at either the Fund or Contract levels. In addition, while the Fund does not have transaction expenses, if the transaction and ongoing expenses at the Contract level were included, the expenses shown below would be higher. You should consult your Contract prospectus or disclosure document for more information.
| | | | | | | | | | | | | | | | | | |
| | | | | | | |
| | | | | | | Actual (actual return after expenses) | | | | Hypothetical
(5% annual return before expenses) | | | | |
| | | | | | | | | |
Share Class | | Beginning
Account
Value 1/1/20 | | | | Ending
Account
Value 6/30/20 | | Fund-Level
ExpensesPaid During
Period
1/1/20–6/30/201, 2 | | | | Ending
Account
Value 6/30/20 | | Fund-Level
ExpensesPaid During
Period
1/1/20–6/30/201, 2 | | | | Net
Annualized
Expense
Ratio2 |
Class 5 | | $1,000 | | | | $1,044.00 | | $4.07 | | | | $1,020.89 | | $4.02 | | | | 0.80% |
1. Expenses are equal to the annualized expense ratio for the six-month period as indicated above—in the far right column—multiplied by the simple average account value over the period indicated, and then multiplied by 182/366 to reflect the one-half year period.
2. Reflects expenses after fee waivers and expense reimbursements. Does not include any ongoing expenses of the Contract for which the Fund is an investment option or acquired fund fees and expenses.
FRANKLIN TEMPLETON VARIABLE INSURANCE PRODUCTS TRUST
Financial Highlights
Franklin VolSmart Allocation VIP Fund
| | | | | | | | | | | | | | | | | | | | | | | | |
| | |
| | | Six Months Ended
June 30, 2020 (unaudited) | | | Year Ended December 31, | |
| | | 2019 | | | 2018 | | | 2017 | | | 2016 | | | 2015 | |
| | | | | | |
Class 2 | | | | | | | | | | | | | | | | | | | | | | | | |
| | | | | | |
| Per share operating performance | | | | | | | | | | | | | | | | | | | | | | | | |
(for a share outstanding throughout the period) | | | | | | | | | | | | | | | | | | | | | | | | |
| | | | | | |
Net asset value, beginning of period | | | $12.60 | | | | $10.82 | | | | $11.67 | | | | $10.10 | | | | $ 9.68 | | | | $10.20 | |
| | | | | | |
| Income from investment operationsa: | | | | | | | | | | | | | | | | | | | | | | | | |
| | | | | | |
Net investment incomeb,c | | | 0.11 | | | | 0.22 | | | | 0.21 | | | | 0.16 | | | | 0.16 | | | | 0.10 | |
| | | | | | |
Net realized and unrealized gains (losses) | | | 0.43 | | | | 1.70 | | | | (1.02 | ) | | | 1.41 | | | | 0.28 | | | | (0.42 | ) |
| | | | | | |
Total from investment operations | | | 0.54 | | | | 1.92 | | | | (0.81 | ) | | | 1.57 | | | | 0.44 | | | | (0.32 | ) |
| | | | | | |
| Less distributions from: | | | | | | | | | | | | | | | | | | | | | | | | |
| | | | | | |
Net investment income and net foreign currency gains | | | (0.15 | ) | | | — | | | | (0.04 | ) | | | — | | | | (— | )d | | | (0.05 | ) |
| | | | | | |
Net realized gains | | | — | | | | (0.14 | ) | | | — | | | | — | | | | (0.02 | ) | | | (0.15 | ) |
| | | | | | |
| Total distributions | | | (0.15 | ) | | | (0.14 | ) | | | (0.04 | ) | | | — | | | | (0.02 | ) | | | (0.20 | ) |
| | | | | | |
| Net asset value, end of period | | | $12.99 | | | | $12.60 | | | | $10.82 | | | | $11.67 | | | | $10.10 | | | | $ 9.68 | |
| | | | | | |
Total returne | | | 4.32% | | | | 17.82% | | | | (6.93)% | | | | 15.54% | | | | 4.39% | | | | (3.12)% | |
| | | | | | |
| Ratios to average net assetsf | | | | | | | | | | | | | | | | | | | | | | | | |
| | | | | | |
Expenses before waiver and payments by affiliatesg | | | 1.12% | | | | 1.12% | | | | 1.10% | | | | 1.14% | | | | 1.25% | | | | 1.77% | |
| | | | | | |
Expenses net of waiver and payments by affiliatesg | | | 0.90% | h | | | 0.90% | h | | | 0.75% | h | | | 0.73% | h | | | 0.73% | h | | | 0.93% | |
| | | | | | |
Net investment incomec | | | 1.72% | | | | 1.87% | | | | 1.85% | | | | 1.44% | | | | 1.50% | | | | 1.30% | |
| | | | | | |
| Supplemental data | | | | | | | | | | | | | | | | | | | | | | | | |
| | | | | | |
Net assets, end of period (000’s) | | | $40 | | | | $39 | | | | $33 | | | | $36 | | | | $31 | | | | $8,703 | |
| | | | | | |
Portfolio turnover rate | | | 61.63% | | | | 4.99% | | | | 6.28% | | | | 5.69% | | | | 1.00% | | | | 95.15% | |
aThe amount shown for a share outstanding throughout the period may not correlate with the Statement of Operations for the period due to the timing of sales and repurchases of the Fund’s shares in relation to income earned and/or fluctuating fair value of the investments of the Fund.
bBased on average daily shares outstanding.
cRecognition of net investment income by the Fund is affected by the timing of declaration of dividends by the Underlying Funds and exchange traded funds in which the Fund invests.
dAmount rounds to less than $0.01 per share.
eTotal return does not include fees, charges or expenses imposed by the variable annuity and life insurance contracts for which Franklin Templeton Variable Insurance Products Trust serves as an underlying investment vehicle. Total return is not annualized for periods less than one year.
fRatios are annualized for periods less than one year.
gDoes not include expenses of the Underlying Funds in which the Fund invests. The weighted average indirect expenses of the Underlying Funds was 0.21% for the period ended June 30, 2020.
hBenefit of expense reduction rounds to less than 0.01%.
| | |
| | |
| FVA-6 | | Semiannual Report | The accompanying notes are an integral part of these financial statements. |
FRANKLIN TEMPLETON VARIABLE INSURANCE PRODUCTS TRUST
FINANCIAL HIGHLIGHTS
Franklin VolSmart Allocation VIP Fund (continued)
| | | | | | | | | | | | | | | | | | | | | | | | |
| | |
| | | Six Months Ended
June 30, 2020 (unaudited) | | | Year Ended December 31, | |
| | | 2019 | | | 2018 | | | 2017 | | | 2016 | | | 2015 | |
| | | | | | |
Class 5 | | | | | | | | | | | | | | | | | | | | | | | | |
| | | | | | |
| Per share operating performance | | | | | | | | | | | | | | | | | | | | | | | | |
(for a share outstanding throughout the period) | | | | | | | | | | | | | | | | | | | | | | | | |
| | | | | | |
Net asset value, beginning of period | | | $12.59 | | | | $10.80 | | | | $11.65 | | | | $10.07 | | | | $ 9.67 | | | | $10.20 | |
| | | | | | |
| Income from investment operationsa: | | | | | | | | | | | | | | | | | | | | | | | | |
| | | | | | |
Net investment incomeb,c | | | 0.11 | | | | 0.23 | | | | 0.22 | | | | 0.17 | | | | 0.16 | | | | 0.16 | |
| | | | | | |
Net realized and unrealized gains (losses) | | | 0.43 | | | | 1.70 | | | | (1.01 | ) | | | 1.41 | | | | 0.29 | | | | (0.47 | ) |
| | | | | | |
Total from investment operations | | | 0.54 | | | | 1.93 | | | | (0.79 | ) | | | 1.58 | | | | 0.45 | | | | (0.31 | ) |
| | | | | | |
| Less distributions from: | | | | | | | | | | | | | | | | | | | | | | | | |
| | | | | | |
Net investment income and net foreign currency gains | | | (0.16 | ) | | | — | | | | (0.06 | ) | | | — | | | | (0.03 | ) | | | (0.07 | ) |
| | | | | | |
Net realized gains | | | — | | | | (0.14 | ) | | | — | | | | — | | | | (0.02 | ) | | | (0.15 | ) |
| | | | | | |
| Total distributions | | | (0.16 | ) | | | (0.14 | ) | | | (0.06 | ) | | | — | | | | (0.05 | ) | | | (0.22 | ) |
| | | | | | |
| Net asset value, end of period | | | $12.97 | | | | $12.59 | | | | $10.80 | | | | $11.65 | | | | $10.07 | | | | $ 9.67 | |
| | | | | | |
Total returnd | | | 4.40% | | | | 17.95% | | | | (6.85)% | | | | 15.69% | | | | 4.59% | | | | (3.10)% | |
| | | | | | |
| Ratios to average net assetse | | | | | | | | | | | | | | | | | | | | | | | | |
| | | | | | |
Expenses before waiver and payments by affiliatesf | | | 1.02% | | | | 1.02% | | | | 1.00% | | | | 1.04% | | | | 1.15% | | | | 1.66% | |
| | | | | | |
Expenses net of waiver and payments by affiliatesf | | | 0.80% | g | | | 0.80% | g | | | 0.65% | g | | | 0.63% | g | | | 0.63% | g | | | 0.82% | |
| | | | | | |
Net investment incomec | | | 1.82% | | | | 1.97% | | | | 1.95% | | | | 1.54% | | | | 1.60% | | | | 1.41% | |
| | | | | | |
| Supplemental data | | | | | | | | | | | | | | | | | | | | | | | | |
| | | | | | |
Net assets, end of period (000’s) | | | $172,735 | | | | $185,381 | | | | $171,173 | | | | $188,240 | | | | $124,581 | | | | $54,816 | |
| | | | | | |
Portfolio turnover rate | | | 61.63% | | | | 4.99% | | | | 6.28% | | | | 5.69% | | | | 1.00% | | | | 95.15% | |
aThe amount shown for a share outstanding throughout the period may not correlate with the Statement of Operations for the period due to the timing of sales and repurchases of the Fund’s shares in relation to income earned and/or fluctuating fair value of the investments of the Fund.
bBased on average daily shares outstanding.
cRecognition of net investment income by the Fund is affected by the timing of declaration of dividends by the Underlying Funds and exchange traded funds in which the Fund invests.
dTotal return does not include fees, charges or expenses imposed by the variable annuity and life insurance contracts for which Franklin Templeton Variable Insurance Products Trust serves as an underlying investment vehicle. Total return is not annualized for periods less than one year.
eRatios are annualized for periods less than one year.
fDoes not include expenses of the Underlying Funds in which the Fund invests. The weighted average indirect expenses of the Underlying Funds was 0.21% for the period ended June 30, 2020.
gBenefit of expense reduction rounds to less than 0.01%.
| | | | | | |
| | | |
| | The accompanying notes are an integral part of these financial statements. | Semiannual Report | | | FVA-7 | |
FRANKLIN TEMPLETON VARIABLE INSURANCE PRODUCTS TRUST
Statement of Investments, June 30, 2020 (unaudited)
Franklin VolSmart Allocation VIP Fund
| | | | | | | | |
| | |
| | | Shares | | | Value | |
| | |
Common Stocks 62.3% | | | | | | | | |
| Automobiles & Components 0.1% | | | | | | | | |
| Gentex Corp. | | | 3,102 | | | $ | 79,938 | |
| | | | | | | | |
| | |
| Capital Goods 8.5% | | | | | | | | |
| 3M Co. | | | 3,384 | | | | 527,870 | |
| Allegion PLC | | | 419 | | | | 42,830 | |
| Allison Transmission Holdings Inc. | | | 922 | | | | 33,911 | |
| BWX Technologies Inc. | | | 253 | | | | 14,330 | |
| Carlisle Cos. Inc. | | | 3,160 | | | | 378,157 | |
| Cummins Inc. | | | 1,702 | | | | 294,888 | |
| Donaldson Co. Inc. | | | 7,830 | | | | 364,252 | |
| Dover Corp. | | | 7,944 | | | | 767,073 | |
| Emerson Electric Co. | | | 6,566 | | | | 407,289 | |
| Fastenal Co. | | | 7,001 | | | | 299,923 | |
| a Generac Holdings Inc. | | | 150 | | | | 18,289 | |
| General Dynamics Corp. | | | 5,600 | | | | 836,976 | |
| Graco Inc. | | | 1,799 | | | | 86,334 | |
| GrafTech International Ltd. | | | 406 | | | | 3,240 | |
| Honeywell International Inc. | | | 13,829 | | | | 1,999,535 | |
| Huntington Ingalls Industries Inc. | | | 441 | | | | 76,950 | |
| Illinois Tool Works Inc. | | | 2,239 | | | | 391,489 | |
| Johnson Controls International PLC | | | 20,492 | | | | 699,597 | |
| Lennox International Inc. | | | 224 | | | | 52,190 | |
| Lincoln Electric Holdings Inc. | | | 140 | | | | 11,794 | |
| Lockheed Martin Corp. | | | 1,363 | | | | 497,386 | |
| Masco Corp. | | | 1,286 | | | | 64,570 | |
| MSC Industrial Direct Co. Inc., A | | | 470 | | | | 34,221 | |
| Northrop Grumman Corp. | | | 735 | | | | 225,968 | |
| nVent Electric PLC | | | 14,200 | | | | 265,966 | |
| A O Smith Corp. | | | 341 | | | | 16,068 | |
| Otis Worldwide Corp. | | | 5,221 | | | | 296,866 | |
| PACCAR Inc. | | | 2,182 | | | | 163,323 | |
| Pentair PLC | | | 12,500 | | | | 474,875 | |
| Raytheon Technologies Corp. | | | 17,445 | | | | 1,074,961 | |
| Rockwell Automation Inc. | | | 1,345 | | | | 286,485 | |
| Roper Technologies Inc. | | | 8,040 | | | | 3,121,610 | |
| Snap-on Inc. | | | 427 | | | | 59,144 | |
| Toro Co. | | | 1,287 | | | | 85,380 | |
| a Trex Co. Inc. | | | 160 | | | | 20,811 | |
| W.W. Grainger Inc. | | | 2,194 | | | | 689,267 | |
| Watsco Inc. | | | 326 | | | | 57,930 | |
| | | | | | | | |
| | |
| | | | | | | 14,741,748 | |
| | | | | | | | |
| | |
| Commercial & Professional Services 1.0% | | | | | | | | |
| Cintas Corp. | | | 4,283 | | | | 1,140,820 | |
| a Copart Inc. | | | 2,274 | | | | 189,356 | |
| a FTI Consulting Inc. | | | 91 | | | | 10,424 | |
| a IAA Inc. | | | 642 | | | | 24,762 | |
| Matthews International Corp., A | | | 5,570 | | | | 106,387 | |
FRANKLIN TEMPLETON VARIABLE INSURANCE PRODUCTS TRUST
STATEMENT OF INVESTMENTS (UNAUDITED)
Franklin VolSmart Allocation VIP Fund (continued)
| | | | | | | | |
| | |
| | | Shares | | | Value | |
| | |
Common Stocks (continued) | | | | | | | | |
Commercial & Professional Services (continued) | | | | | | | | |
Robert Half International Inc. | | | 1,521 | | | $ | 80,355 | |
Rollins Inc. | | | 1,731 | | | | 73,377 | |
Verisk Analytics Inc. | | | 392 | | | | 66,718 | |
| | | | | | | | |
| | |
| | | | | | | 1,692,199 | |
| | | | | | | | |
| | |
| Consumer Durables & Apparel 1.5% | | | | | | | | |
Carter’s Inc. | | | 485 | | | | 39,139 | |
D.R. Horton Inc. | | | 1,486 | | | | 82,399 | |
Garmin Ltd. | | | 1,614 | | | | 157,365 | |
Hanesbrands Inc. | | | 2,240 | | | | 25,290 | |
a Lululemon Athletica Inc. | | | 1,299 | | | | 405,301 | |
NIKE Inc., B | | | 17,571 | | | | 1,722,836 | |
a NVR Inc. | | | 34 | | | | 110,797 | |
PulteGroup Inc. | | | 1,722 | | | | 58,600 | |
| | | | | | | | |
| | |
| | | | | | | 2,601,727 | |
| | | | | | | | |
| | |
| Consumer Services 1.6% | | | | | | | | |
Darden Restaurants Inc. | | | 1,505 | | | | 114,034 | |
Domino’s Pizza Inc. | | | 498 | | | | 183,981 | |
a Grand Canyon Education Inc. | | | 118 | | | | 10,683 | |
H&R Block Inc. | | | 2,641 | | | | 37,713 | |
Las Vegas Sands Corp. | | | 3,219 | | | | 146,593 | |
McDonald’s Corp. | | | 8,021 | | | | 1,479,634 | |
Starbucks Corp. | | | 5,932 | | | | 436,536 | |
Yum! Brands Inc. | | | 3,952 | | | | 343,468 | |
| | | | | | | | |
| | |
| | | | | | | 2,752,642 | |
| | | | | | | | |
| | |
| Diversified Financials 1.2% | | | | | | | | |
Equitable Holdings Inc. | | | 1,059 | | | | 20,428 | |
Evercore Inc. | | | 98 | | | | 5,774 | |
FactSet Research Systems Inc. | | | 433 | | | | 142,228 | |
Invesco Ltd. | | | 3,095 | | | | 33,302 | |
Jefferies Financial Group Inc. | | | 564 | | | | 8,770 | |
Lazard Ltd., A | | | 1,246 | | | | 35,673 | |
MarketAxess Holdings Inc. | | | 432 | | | | 216,397 | |
Moody’s Corp. | | | 1,147 | | | | 315,115 | |
Morningstar Inc. | | | 208 | | | | 29,322 | |
MSCI Inc. | | | 888 | | | | 296,432 | |
Nasdaq Inc. | | | 1,470 | | | | 175,621 | |
S&P Global Inc. | | | 1,181 | | | | 389,116 | |
Santander Consumer USA Holdings Inc. | | | 1,059 | | | | 19,496 | |
SEI Investments Co. | | | 1,165 | | | | 64,052 | |
State Street Corp. | | | 1,450 | | | | 92,148 | |
T. Rowe Price Group Inc. | | | 1,106 | | | | 136,591 | |
| | | | | | | | |
| | |
| | | | | | | 1,980,465 | |
| | | | | | | | |
FRANKLIN TEMPLETON VARIABLE INSURANCE PRODUCTS TRUST
STATEMENT OF INVESTMENTS (UNAUDITED)
Franklin VolSmart Allocation VIP Fund (continued)
| | | | | | | | |
| | |
| | | Shares | | | Value | |
Common Stocks (continued) | | | | | | | | |
| Energy 0.6% | | | | | | | | |
Cabot Oil & Gas Corp., A | | | 2,896 | | | $ | 49,753 | |
Chevron Corp. | | | 5,790 | | | | 516,642 | |
EOG Resources Inc. | | | 5,130 | | | | 259,886 | |
Exxon Mobil Corp. | | | 5,700 | | | | 254,904 | |
| | | | | | | | |
| | |
| | | | | | | 1,081,185 | |
| | | | | | | | |
| | |
| Food & Staples Retailing 1.5% | | | | | | | | |
Casey’s General Stores Inc. | | | 371 | | | | 55,472 | |
Costco Wholesale Corp. | | | 1,717 | | | | 520,612 | |
The Kroger Co. | | | 6,180 | | | | 209,193 | |
a Sprouts Farmers Market Inc. | | | 1,032 | | | | 26,409 | |
Walgreens Boots Alliance Inc. | | | 7,092 | | | | 300,630 | |
Walmart Inc. | | | 11,557 | | | | 1,384,297 | |
| | | | | | | | |
| | |
| | | | | | | 2,496,613 | |
| | | | | | | | |
| | |
| Food, Beverage & Tobacco 3.3% | | | | | | | | |
Altria Group Inc. | | | 12,957 | | | | 508,562 | |
a Boston Beer Inc., A | | | 23 | | | | 12,343 | |
Brown-Forman Corp., A | | | 567 | | | | 32,642 | |
Brown-Forman Corp., B | | | 860 | | | | 54,748 | |
Campbell Soup Co. | | | 472 | | | | 23,425 | |
The Coca-Cola Co. | | | 11,342 | | | | 506,761 | |
Flowers Foods Inc. | | | 2,078 | | | | 46,464 | |
General Mills Inc. | | | 6,974 | | | | 429,947 | |
The Hershey Co. | | | 1,942 | | | | 251,722 | |
Hormel Foods Corp. | | | 3,322 | | | | 160,353 | |
Ingredion Inc. | | | 700 | | | | 58,100 | |
J M Smucker Co/The | | | 931 | | | | 98,509 | |
Kellogg Co. | | | 1,912 | | | | 126,307 | |
McCormick & Co. Inc. | | | 5,350 | | | | 959,844 | |
a Monster Beverage Corp. | | | 3,707 | | | | 256,969 | |
PepsiCo Inc. | | | 11,724 | | | | 1,550,616 | |
Philip Morris International Inc. | | | 7,217 | | | | 505,623 | |
Tyson Foods Inc. | | | 3,092 | | | | 184,623 | |
| | | | | | | | |
| | |
| | | | | | | 5,767,558 | |
| | | | | | | | |
| | |
| Health Care Equipment & Services 6.2% | | | | | | | | |
Abbott Laboratories | | | 12,160 | | | | 1,111,789 | |
a ABIOMED Inc. | | | 111 | | | | 26,813 | |
a Align Technology Inc. | | | 220 | | | | 60,377 | |
Becton Dickinson and Co. | | | 7,400 | | | | 1,770,598 | |
Cerner Corp. | | | 2,976 | | | | 204,005 | |
Chemed Corp. | | | 149 | | | | 67,209 | |
CVS Health Corp. | | | 6,350 | | | | 412,559 | |
Dentsply Sirona Inc. | | | 5,900 | | | | 259,954 | |
Humana Inc. | | | 340 | | | | 131,835 | |
Medtronic PLC | | | 16,100 | | | | 1,476,370 | |
a Premier Inc., A | | | 352 | | | | 12,067 | |
FRANKLIN TEMPLETON VARIABLE INSURANCE PRODUCTS TRUST
STATEMENT OF INVESTMENTS (UNAUDITED)
Franklin VolSmart Allocation VIP Fund (continued)
| | | | | | | | |
| | |
| | | Shares | | | Value | |
Common Stocks (continued) | | | | | | | | |
| Health Care Equipment & Services (continued) | | | | | | | | |
ResMed Inc. | | | 1,522 | | | $ | 292,224 | |
Stryker Corp. | | | 10,300 | | | | 1,855,957 | |
UnitedHealth Group Inc. | | | 4,137 | | | | 1,220,208 | |
a Veeva Systems Inc. | | | 348 | | | | 81,578 | |
West Pharmaceutical Services Inc. | | | 7,505 | | | | 1,704,911 | |
| | | | | | | | |
| | |
| | | | | | | 10,688,454 | |
| | | | | | | | |
| | |
| Household & Personal Products 2.5% | | | | | | | | |
Church & Dwight Co. Inc. | | | 2,749 | | | | 212,498 | |
Clorox Co. | | | 1,670 | | | | 366,348 | |
Colgate-Palmolive Co. | | | 17,720 | | | | 1,298,167 | |
Estee Lauder Cos. Inc., A | | | 2,552 | | | | 481,511 | |
Kimberly-Clark Corp. | | | 2,997 | | | | 423,626 | |
Nu Skin Enterprises Inc., A | | | 546 | | | | 20,874 | |
The Procter & Gamble Co. | | | 12,846 | | | | 1,535,996 | |
| | | | | | | | |
| | |
| | | | | | | 4,339,020 | |
| | | | | | | | |
| | |
| Insurance 0.6% | | | | | | | | |
Aflac Inc. | | | 8,240 | | | | 296,887 | |
American National Insurance Co. | | | 87 | | | | 6,270 | |
Erie Indemnity Co., A | | | 2,888 | | | | 554,207 | |
The Progressive Corp. | | | 1,505 | | | | 120,566 | |
| | | | | | | | |
| | |
| | | | | | | 977,930 | |
| | | | | | | | |
| | |
| Materials 4.3% | | | | | | | | |
Air Products and Chemicals Inc. | | | 9,705 | | | | 2,343,369 | |
Albemarle Corp. | | | 14,310 | | | | 1,104,875 | |
Avery Dennison Corp. | | | 210 | | | | 23,959 | |
Celanese Corp. | | | 769 | | | | 66,395 | |
Eastman Chemical Co. | | | 1,124 | | | | 78,275 | |
Ecolab Inc. | | | 5,260 | | | | 1,046,477 | |
Huntsman Corp. | | | 491 | | | | 8,823 | |
Linde PLC (United Kingdom) | | | 9,700 | | | | 2,057,467 | |
LyondellBasell Industries NV, A | | | 3,783 | | | | 248,619 | |
NewMarket Corp. | | | 85 | | | | 34,041 | |
Newmont Corp. | | | 2,106 | | | | 130,024 | |
Nucor Corp. | | | 1,912 | | | | 79,176 | |
Packaging Corp. of America | | | 891 | | | | 88,922 | |
Reliance Steel & Aluminum Co. | | | 305 | | | | 28,954 | |
Royal Gold Inc. | | | 296 | | | | 36,799 | |
Sonoco Products Co. | | | 1,081 | | | | 56,526 | |
Steel Dynamics Inc. | | | 1,642 | | | | 42,840 | |
Valvoline Inc. | | | 1,182 | | | | 22,848 | |
| | | | | | | | |
| | |
| | | | | | | 7,498,389 | |
| | | | | | | | |
| | |
| Media & Entertainment 1.2% | | | | | | | | |
Activision Blizzard Inc. | | | 1,946 | | | | 147,701 | |
a Alphabet Inc., A | | | 186 | | | | 263,757 | |
a Alphabet Inc., C | | | 184 | | | | 260,104 | |
FRANKLIN TEMPLETON VARIABLE INSURANCE PRODUCTS TRUST
STATEMENT OF INVESTMENTS (UNAUDITED)
Franklin VolSmart Allocation VIP Fund (continued)
| | | | | | | | |
| | |
| | | Shares | | | Value | |
Common Stocks (continued) | | | | | | | | |
| Media & Entertainment (continued) | | | | | | | | |
Cable One Inc. | | | 32 | | | $ | 56,795 | |
Comcast Corp., A | | | 13,370 | | | | 521,163 | |
a Electronic Arts Inc. | | | 813 | | | | 107,357 | |
a Facebook Inc., A | | | 2,353 | | | | 534,296 | |
The Interpublic Group of Cos. Inc. | | | 3,301 | | | | 56,645 | |
a Match Group Inc. | | | 575 | | | | 61,554 | |
Omnicom Group Inc. | | | 2,393 | | | | 130,658 | |
| | | | | | | | |
| | |
| | | | | | | 2,140,030 | |
| | | | | | | | |
| | |
| Pharmaceuticals, Biotechnology & Life Sciences 4.5% | | | | | | | | |
AbbVie Inc. | | | 11,152 | | | | 1,094,903 | |
Amgen Inc. | | | 2,305 | | | | 543,657 | |
a Biogen Inc. | | | 1,724 | | | | 461,256 | |
Bristol-Myers Squibb Co. | | | 8,865 | | | | 521,262 | |
Eli Lilly and Co. | | | 2,483 | | | | 407,659 | |
a Exelixis Inc. | | | 2,933 | | | | 69,630 | |
Gilead Sciences Inc. | | | 6,802 | | | | 523,346 | |
a Horizon Therapeutics PLC | | | 461 | | | | 25,622 | |
Johnson & Johnson | | | 11,458 | | | | 1,611,339 | |
Merck & Co. Inc. | | | 6,558 | | | | 507,130 | |
a Mettler-Toledo International Inc. | | | 274 | | | | 220,721 | |
Perrigo Co. PLC | | | 4,440 | | | | 245,399 | |
Pfizer Inc. | | | 27,998 | | | | 915,535 | |
a Regeneron Pharmaceuticals Inc. | | | 471 | | | | 293,739 | |
a Vertex Pharmaceuticals Inc. | | | 720 | | | | 209,023 | |
a Waters Corp. | | | 180 | | | | 32,472 | |
Zoetis Inc. | | | 1,224 | | | | 167,737 | |
| | | | | | | | |
| | |
| | | | | | | 7,850,430 | |
| | | | | | | | |
| | |
| Real Estate 1.0% | | | | | | | | |
American Tower Corp. | | | 2,051 | | | | 530,266 | |
Coresite Realty Corp. | | | 101 | | | | 12,227 | |
EPR Properties | | | 827 | | | | 27,398 | |
Gaming and Leisure Properties Inc. | | | 1,991 | | | | 68,889 | |
Kimco Realty Corp. | | | 3,939 | | | | 50,577 | |
National Retail Properties Inc. | | | 1,921 | | | | 68,157 | |
Public Storage | | | 1,954 | | | | 374,953 | |
Realty Income Corp. | | | 3,530 | | | | 210,035 | |
Simon Property Group Inc. | | | 2,839 | | | | 194,131 | |
Spirit Realty Capital Inc. | | | 1,130 | | | | 39,392 | |
STORE Capital Corp. | | | 2,172 | | | | 51,715 | |
WP Carey Inc. | | | 1,513 | | | | 102,354 | |
| | | | | | | | |
| | |
| | | | | | | 1,730,094 | |
| | | | | | | | |
| | |
| Retailing 4.3% | | | | | | | | |
a AutoZone Inc. | | | 223 | | | | 251,571 | |
Best Buy Co. Inc. | | | 2,821 | | | | 246,189 | |
a Booking Holdings Inc. | | | 193 | | | | 307,322 | |
FRANKLIN TEMPLETON VARIABLE INSURANCE PRODUCTS TRUST
STATEMENT OF INVESTMENTS (UNAUDITED)
Franklin VolSmart Allocation VIP Fund (continued)
| | | | | | | | |
| | |
| | | Shares | | | Value | |
Common Stocks (continued) | | | | | | | | |
| Retailing (continued) | | | | | | | | |
Dollar General Corp. | | | 2,636 | | | $ | 502,184 | |
Foot Locker Inc. | | | 1,485 | | | | 43,303 | |
The Gap Inc. | | | 2,793 | | | | 35,248 | |
The Home Depot Inc. | | | 2,131 | | | | 533,837 | |
Lowe’s Cos. Inc. | | | 8,400 | | | | 1,135,008 | |
Nordstrom Inc. | | | 1,315 | | | | 20,369 | |
a O’Reilly Automotive Inc. | | | 869 | | | | 366,431 | |
Pool Corp. | | | 437 | | | | 118,807 | |
Ross Stores Inc. | | | 15,231 | | | | 1,298,290 | |
Target Corp. | | | 13,468 | | | | 1,615,217 | |
The TJX Cos. Inc. | | | 9,756 | | | | 493,263 | |
Tractor Supply Co. | | | 1,410 | | | | 185,824 | |
a Ulta Beauty Inc. | | | 654 | | | | 133,037 | |
Williams-Sonoma Inc. | | | 991 | | | | 81,272 | |
| | | | | | | | |
| | |
| | | | | | | 7,367,172 | |
| | | | | | | | |
| | |
| Semiconductors & Semiconductor Equipment 4.6% | | | | | | | | |
Analog Devices Inc. | | | 14,714 | | | | 1,804,525 | |
Applied Materials Inc. | | | 9,423 | | | | 569,620 | |
a Cirrus Logic Inc. | | | 146 | | | | 9,020 | |
a Enphase Energy Inc. | | | 276 | | | | 13,129 | |
Intel Corp. | | | 8,413 | | | | 503,350 | |
KLA Corp. | | | 1,699 | | | | 330,422 | |
Lam Research Corp. | | | 1,580 | | | | 511,067 | |
Maxim Integrated Products Inc. | | | 3,046 | | | | 184,618 | |
Monolithic Power Systems | | | 115 | | | | 27,255 | |
NVIDIA Corp. | | | 1,491 | | | | 566,446 | |
QUALCOMM Inc. | | | 6,096 | | | | 556,016 | |
Skyworks Solutions Inc. | | | 2,204 | | | | 281,804 | |
a SolarEdge Technologies Inc. | | | 127 | | | | 17,625 | |
Texas Instruments Inc. | | | 18,258 | | | | 2,318,218 | |
Xilinx Inc. | | | 2,844 | | | | 279,821 | |
| | | | | | | | |
| | |
| | | | | | | 7,972,936 | |
| | | | | | | | |
| | |
| Software & Services 8.5% | | | | | | | | |
Accenture PLC, A | | | 12,726 | | | | 2,732,527 | |
a Adobe Inc. | | | 1,301 | | | | 566,338 | |
a Akamai Technologies Inc. | | | 413 | | | | 44,228 | |
Amdocs Ltd. | | | 1,556 | | | | 94,729 | |
a Aspen Technology Inc. | | | 564 | | | | 58,436 | |
Automatic Data Processing Inc. | | | 3,526 | | | | 524,986 | |
Booz Allen Hamilton Holding Corp. | | | 913 | | | | 71,022 | |
Broadridge Financial Solutions Inc. | | | 1,348 | | | | 170,104 | |
a Cadence Design Systems Inc. | | | 1,984 | | | | 190,385 | |
Citrix Systems Inc. | | | 918 | | | | 135,781 | |
Cognizant Technology Solutions Corp., A | | | 4,687 | | | | 266,315 | |
a Fair Isaac Corp. | | | 69 | | | | 28,845 | |
a Fortinet Inc. | | | 354 | | | | 48,594 | |
FRANKLIN TEMPLETON VARIABLE INSURANCE PRODUCTS TRUST
STATEMENT OF INVESTMENTS (UNAUDITED)
Franklin VolSmart Allocation VIP Fund (continued)
| | | | | | | | |
| | |
| | | Shares | | | Value | |
| | |
Common Stocks (continued) | | | | | | | | |
| Software & Services (continued) | | | | | | | | |
| International Business Machines Corp. | | | 4,239 | | | $ | 511,944 | |
| Intuit Inc. | | | 1,824 | | | | 540,251 | |
| Jack Henry & Associates Inc. | | | 892 | | | | 164,155 | |
| Mastercard Inc., A | | | 1,759 | | | | 520,136 | |
| Microsoft Corp. | | | 28,090 | | | | 5,716,596 | |
| Oracle Corp. | | | 5,026 | | | | 277,787 | |
| Paychex Inc. | | | 3,934 | | | | 298,001 | |
| a Tyler Technologies Inc. | | | 101 | | | | 35,035 | |
| Visa Inc., A | | | 8,711 | | | | 1,682,704 | |
| a VMware Inc., A | | | 193 | | | | 29,888 | |
| | | | | | | | |
| | |
| | | | | | | 14,708,787 | |
| | | | | | | | |
| | |
| Technology Hardware & Equipment 1.1% | | | | | | | | |
| Apple Inc. | | | 1,665 | | | | 607,392 | |
| a Arista Networks Inc. | | | 152 | | | | 31,925 | |
| a Ciena Corp. | | | 398 | | | | 21,556 | |
| Cisco Systems Inc. | | | 11,071 | | | | 516,351 | |
| a F5 Networks Inc. | | | 732 | | | | 102,099 | |
| HP Inc. | | | 18,369 | | | | 320,172 | |
| Motorola Solutions Inc. | | | 1,704 | | | | 238,781 | |
| NetApp Inc. | | | 2,534 | | | | 112,434 | |
| Ubiquiti Inc. | | | 112 | | | | 19,551 | |
| Xerox Holdings Corp. | | | 445 | | | | 6,804 | |
| | | | | | | | |
| | |
| | | | | | | 1,977,065 | |
| | | | | | | | |
| | |
| Telecommunication Services 0.6% | | | | | | | | |
AT&T Inc. | | | 17,157 | | | | 518,656 | |
| Verizon Communications Inc. | | | 9,226 | | | | 508,629 | |
| | | | | | | | |
| | |
| | | | | | | 1,027,285 | |
| | | | | | | | |
| | |
| �� Transportation 1.8% | | | | | | | | |
| C.H. Robinson Worldwide Inc. | | | 1,647 | | | | 130,212 | |
| Expeditors International of Washington Inc. | | | 1,910 | | | | 145,236 | |
| JB Hunt Transport Services Inc. | | | 996 | | | | 119,859 | |
| Landstar System Inc. | | | 427 | | | | 47,956 | |
| Norfolk Southern Corp. | | | 4,000 | | | | 702,280 | |
| Old Dominion Freight Line Inc. | | | 508 | | | | 86,152 | |
| Schneider National Inc., B | | | 152 | | | | 3,750 | |
| Union Pacific Corp. | | | 3,116 | | | | 526,822 | |
| United Parcel Service Inc., B | | | 11,391 | | | | 1,266,451 | |
| | | | | | | | |
| | |
| | | | | | | 3,028,718 | |
| | | | | | | | |
| | |
| Utilities 1.8% | | | | | | | | |
| Alliant Energy Corp. | | | 2,388 | | | | 114,242 | |
| Ameren Corp. | | | 1,850 | | | | 130,166 | |
| American Electric Power Co. Inc. | | | 2,181 | | | | 173,695 | |
| Atmos Energy Corp. | | | 1,177 | | | | 117,206 | |
| Consolidated Edison Inc. | | | 3,291 | | | | 236,722 | |
| Dominion Energy Inc. | | | 5,271 | | | | 427,900 | |
FRANKLIN TEMPLETON VARIABLE INSURANCE PRODUCTS TRUST
STATEMENT OF INVESTMENTS (UNAUDITED)
Franklin VolSmart Allocation VIP Fund (continued)
| | | | | | | | |
| | |
| | | Shares | | | Value | |
Common Stocks (continued) | | | | | | | | |
| Utilities (continued) | | | | | | | | |
Evergy Inc. | | | 1,744 | | | $ | 103,402 | |
Eversource Energy | | | 3,046 | | | | 253,640 | |
Hawaiian Electric Industries Inc. | | | 1,121 | | | | 40,423 | |
NextEra Energy Inc. | | | 2,071 | | | | 497,392 | |
PPL Corp. | | | 5,766 | | | | 148,993 | |
Public Service Enterprise Group Inc. | | | 5,648 | | | | 277,656 | |
The Southern Co. | | | 8,091 | | | | 419,518 | |
WEC Energy Group Inc. | | | 781 | | | | 68,455 | |
Xcel Energy Inc. | | | 2,409 | | | | 150,562 | |
| | | | | | | | |
| | |
| | | | | | | 3,159,972 | |
| | | | | | | | |
| | |
| Total Common Stocks (Cost $79,675,710) | | | | | | | 107,660,357 | |
| | | | | | | | |
| | |
| Investments in Underlying Funds 31.7% | | | | | | | | |
Domestic Fixed Income 23.8% | | | | | | | | |
b Franklin Liberty U.S. Core Bond ETF | | | 962,200 | | | | 25,209,640 | |
b Franklin Low Duration Total Return Fund, Class R6 | | | 1,054,002 | | | | 10,013,020 | |
b Franklin Strategic Income Fund, Class R6 | | | 654,054 | | | | 5,964,967 | |
| | | | | | | | |
| | |
| | | | | | | 41,187,627 | |
| | | | | | | | |
| | |
| Domestic Hybrid 7.9% | | | | | | | | |
b Franklin Income Fund, Class R6 | | | 6,641,314 | | | | 13,548,280 | |
| | | | | | | | |
| | |
Total Investments in Underlying Funds (Cost $55,464,869) | | | | | | | 54,735,907 | |
| | | | | | | | |
| | |
Total Investments before Short Term Investments (Cost $135,140,579) | | | | | | | 162,396,264 | |
| | | | | | | | |
| | |
Short Term Investments (Cost $9,817,156) 5.7% | | | | | | | | |
| | |
| Money Market Funds 5.7% | | | | | | | | |
b,c Institutional Fiduciary Trust Money Market Portfolio, 0.00% | | | 9,817,156 | | | | 9,817,156 | |
| | | | | | | | |
| | |
Total Investments (Cost $144,957,735) 99.7% | | | | | | | 172,213,420 | |
Other Assets, less Liabilities 0.3% | | | | | | | 561,252 | |
| | | | | | | | |
| | |
Net Assets 100.0% | | | | | | $ | 172,774,672 | |
| | | | | | | | |
aNon-income producing.
bSee Note 3(e) regarding investments in FT Underlying Funds.
cThe rate shown is the annualized seven-day effective yield at period end.
FRANKLIN TEMPLETON VARIABLE INSURANCE PRODUCTS TRUST
STATEMENT OF INVESTMENTS (UNAUDITED)
Franklin VolSmart Allocation VIP Fund (continued)
At June 30, 2020, the Fund had the following futures contracts outstanding. See Note 1(c).
Futures Contracts
| | | | | | | | | | | | | | | | | | | | |
| Description | | Type | | | Number of
Contracts | | | Notional
Amount* | | | Expiration
Date | | | Value/
Unrealized
Appreciation
(Depreciation) | |
| | | | | |
| Equity Contracts | | | | | | | | | | | | | | | | | | | | |
| | | | | |
S&P 500 E-Mini | | | Short | | | | 154 | | | | $23,794,540 | | | | 9/18/20 | | | | $(214,710) | |
| | | | | | | | | | | | | | | | | | | | |
| | | | | |
Total Futures Contracts | | | | | | | | | | | $23,794,540 | | | | | | | | $(214,710) | |
| | | | | | | | | | | | | | | | | | | | |
*As of period end.
At June 30, 2020, the Fund had the following total return swap contracts outstanding. See Note 1(c).
Total Return Swap Contracts
| | | | | | | | | | | | | | | | | | | | | | | | |
| Underlying Instruments | | Financing
Rate | | | Payment
Frequency | | | Counter-
party | | | Maturity Date | | | Notional
Value | | | Value/
Unrealized
Appreciation
(Depreciation) | |
| | | | | | |
| OTC Swap Contracts | | | | | | | | | | | | | | | | | | | | | | | | |
| | | | | | |
| Longa | | | | | | | | | | | | | | | | | | | | | | | | |
| | | | | | |
Dynamic VIX Backwardation (BEFSDVB1) | | | — | | | | Monthly | | | | BZWS | | | | 8/28/20 | | | | $3,500,000 | | | | $(15,340) | |
| | | | | | | | | | | | | | | | | | | | | | | | |
aThe Fund receives the total return on the underlying instrument.
See Note 8 regarding other derivative information.
See Abbreviations on page FVA-28.
| | |
| | |
| FVA-16 | | Semiannual Report | The accompanying notes are an integral part of these financial statements. |
FRANKLIN TEMPLETON VARIABLE INSURANCE PRODUCTS TRUST
FINANCIAL STATEMENTS
Statement of Assets and Liabilities
June 30, 2020 (unaudited)
| | | | |
| |
| | | Franklin VolSmart
Allocation VIP
Fund | |
| |
Assets: | | | | |
Investments in securities: | | | | |
Cost - Unaffiliated issuers | | | $ 79,675,710 | |
Cost - Non-controlled affiliates (Note 3e) | | | 65,282,025 | |
| | | | |
| |
Value - Unaffiliated issuers | | | $107,660,357 | |
Value - Non-controlled affiliates (Note 3e) | | | 64,553,063 | |
Cash | | | 1,201 | |
Receivables: | | | | |
Investment securities sold | | | 7,404,674 | |
Capital shares sold | | | 51,285 | |
Dividends | | | 170,588 | |
Deposits with brokers for: | | | | |
Futures contracts | | | 1,848,000 | |
Other assets | | | 146 | |
| | | | |
| |
Total assets | | | 181,689,314 | |
| | | | |
Liabilities: | | | | |
Payables: | | | | |
Investment securities purchased | | | 7,667,349 | |
Capital shares redeemed | | | 744,992 | |
Management fees | | | 83,241 | |
Distribution fees | | | 21,371 | |
Trustees’ fees and expenses | | | 68 | |
Variation margin on futures contracts | | | 327,250 | |
Unrealized depreciation on OTC swap contracts | | | 15,340 | |
Accrued expenses and other liabilities | | | 55,031 | |
| | | | |
| |
Total liabilities | | | 8,914,642 | |
| | | | |
| |
Net assets, at value | | | $172,774,672 | |
| | | | |
Net assets consist of: | | | | |
Paid-in capital | | | $126,820,671 | |
Total distributable earnings (losses) | | | 45,954,001 | |
| | | | |
| |
Net assets, at value | | | $172,774,672 | |
| | | | |
| |
| Class 2: | | | | |
Net assets, at value | | | $ 39,759 | |
| | | | |
Shares outstanding | | | 3,061 | |
| | | | |
Net asset value and maximum offering price per share | | | $12.99 | |
| | | | |
| |
| Class 5: | | | | |
Net assets, at value | | | $172,734,913 | |
| | | | |
Shares outstanding | | | 13,315,345 | |
| | | | |
Net asset value and maximum offering price per share | | | $12.97 | |
| | | | |
| | | | | | |
| | | |
| | The accompanying notes are an integral part of these financial statements. | Semiannual Report | | | FVA-17 | |
FRANKLIN TEMPLETON VARIABLE INSURANCE PRODUCTS TRUST
FINANCIAL STATEMENTS
Statement of Operations
for the six months ended June 30, 2020 (unaudited)
| | | | |
| | | Franklin VolSmart
Allocation VIP
Fund | |
| |
Investment income: | | | | |
Dividends: | | | | |
Unaffiliated issuers | | | $ 1,047,408 | |
Non-controlled affiliates (Note 3e) | | | 1,257,717 | |
| | | | |
| |
Total investment income | | | 2,305,125 | |
| | | | |
| |
Expenses: | | | | |
Management fees (Note 3a) | | | 704,198 | |
Distribution fees: (Note 3c) | | | | |
Class 2 | | | 48 | |
Class 5 | | | 131,233 | |
Custodian fees (Note 4) | | | 296 | |
Reports to shareholders | | | 11,530 | |
Professional fees | | | 40,657 | |
Trustees’ fees and expenses | | | 559 | |
Other | | | 5,837 | |
| | | | |
| |
Total expenses | | | 894,358 | |
Expense reductions (Note 4) | | | (322 | ) |
Expenses waived/paid by affiliates (Note 3e and 3f) | | | (190,604 | ) |
| | | | |
Net expenses | | | 703,432 | |
| | | | |
| |
Net investment income | | | 1,601,693 | |
| | | | |
| |
Realized and unrealized gains (losses): | | | | |
Net realized gain (loss) from: | | | | |
Investments: | | | | |
Unaffiliated issuers | | | 3,964,135 | |
Non-controlled affiliates (Note 3e) | | | 1,539,352 | |
Futures contracts | | | (2,844,958 | ) |
Swap contracts | | | 15,493,285 | |
| | | | |
| |
Net realized gain (loss) | | | 18,151,814 | |
| | | | |
| |
Net change in unrealized appreciation (depreciation) on: | | | | |
Investments: | | | | |
Unaffiliated issuers | | | (6,598,887 | ) |
Non-controlled affiliates (Note 3e) | | | (5,838,994 | ) |
Futures contracts | | | (214,710 | ) |
Swap contracts | | | (11,527 | ) |
| | | | |
| |
Net change in unrealized appreciation (depreciation) | | | (12,664,118 | ) |
| | | | |
Net realized and unrealized gain (loss) | | | 5,487,696 | |
| | | | |
| |
Net increase (decrease) in net assets resulting from operations | | | $ 7,089,389 | |
| | | | |
| | | | |
| | | |
| FVA-18 | | Semiannual Report | The accompanying notes are an integral part of these financial statements. | | |
FRANKLIN TEMPLETON VARIABLE INSURANCE PRODUCTS TRUST
FINANCIAL STATEMENTS
Statements of Changes in Net Assets
| | | | | | | | |
| | | Franklin VolSmart Allocation VIP Fund | |
| | |
| | | Six Months Ended
June 30, 2020
(unaudited) | | | Year Ended
December 31, 2019 | |
| | |
Increase (decrease) in net assets: | | | | | | | | |
Operations: | | | | | | | | |
Net investment income | | | $ 1,601,693 | | | | $ 3,607,372 | |
Net realized gain (loss) | | | 18,151,814 | | | | (2,663,428 | ) |
Net change in unrealized appreciation (depreciation) | | | (12,664,118 | ) | | | 28,799,406 | |
| | | | |
| | |
Net increase (decrease) in net assets resulting from operations | | | 7,089,389 | | | | 29,743,350 | |
| | | | |
| | |
Distributions to shareholders: | | | | | | | | |
Class 2 | | | (469 | ) | | | (429 | ) |
Class 5 | | | (2,132,196 | ) | | | (2,160,339 | ) |
| | | | |
| | |
Total distributions to shareholders | | | (2,132,665 | ) | | | (2,160,768 | ) |
| | | | |
| | |
Capital share transactions: (Note 2) | | | | | | | | |
Class 5 | | | (17,601,474 | ) | | | (13,368,874 | ) |
| | | | |
| | |
Total capital share transactions | | | (17,601,474 | ) | | | (13,368,874 | ) |
| | | | |
| | |
Net increase (decrease) in net assets | | | (12,644,750 | ) | | | 14,213,708 | |
Net assets: | | | | | | | | |
Beginning of period | | | 185,419,422 | | | | 171,205,714 | |
| | | | |
| | |
End of period | | | $172,774,672 | | | | $185,419,422 | |
| | | | |
| | | | | | |
| | | |
| | The accompanying notes are an integral part of these financial statements. | Semiannual Report | | | FVA-19 | |
FRANKLIN TEMPLETON VARIABLE INSURANCE PRODUCTS TRUST
Notes to Financial Statements (unaudited)
Franklin VolSmart Allocation VIP Fund
1. Organization and Significant Accounting Policies
Franklin Templeton Variable Insurance Products Trust (Trust) is registered under the Investment Company Act of 1940 (1940 Act) as an open-end management investment company, consisting of eighteen separate funds and applies the specialized accounting and reporting guidance in U.S. Generally Accepted Accounting Principles (U.S. GAAP). Franklin VolSmart Allocation VIP Fund (Fund) is included in this report. The Fund invests a large percentage of its assets in mutual funds (Underlying Funds) and exchange traded funds (ETFs), including affiliated funds managed by Franklin Templeton (FT Underlying Funds). Shares of the Fund are generally sold only to insurance company separate accounts to fund the benefits of variable life insurance policies or variable annuity contracts. At June 30, 2020, 98.4% of the Fund’s shares were held through one insurance company. Investment activities of these insurance company separate accounts could have a material impact on the Fund. The Fund offers two classes of shares: Class 2 and Class 5. Each class of shares may differ by its distribution fees, voting rights on matters affecting a single class and its exchange privilege.
The accounting policies of the Underlying Funds are outlined in their respective shareholder reports. A copy of the Underlying Funds’ shareholder reports is available on the U.S. Securities and Exchange Commission (SEC) website at sec.gov. The Underlying Funds’ shareholder reports are not covered by this report.
The following summarizes the Fund’s significant accounting policies.
a. Financial Instrument Valuation
The Fund’s investments in financial instruments are carried at fair value daily. Fair value is the price that would be received to sell an asset or paid to transfer a liability in an orderly transaction between market participants on the measurement date. The Fund calculates the net asset value (NAV) per share each business day as of 4 p.m. Eastern time or the regularly scheduled close of the New York Stock Exchange (NYSE), whichever is earlier. Under compliance policies and procedures approved by the Trust’s Board of Trustees (the Board), the Fund’s administrator has responsibility for oversight of valuation, including leading the cross-functional Valuation Committee (VC). The Fund may utilize independent pricing services, quotations from securities and financial instrument dealers, and other market sources to determine fair value.
Investments in the Underlying Funds are valued at their closing NAV each trading day.
Equity securities, ETFs and derivative financial instruments listed on an exchange or on the NASDAQ National Market System are valued at the last quoted sale price or the official closing price of the day, respectively. Foreign equity securities are valued as of the close of trading on the foreign stock exchange on which the security is primarily traded, or as of 4 p.m. Eastern time. The value is then converted into its U.S. dollar equivalent at the foreign exchange rate in effect at 4 p.m. Eastern time on the day that the value of the security is determined. Over-the-counter (OTC) securities are valued within the range of the most recent quoted bid and ask prices. Securities that trade in multiple markets or on multiple exchanges are valued according to the broadest and most representative market. Certain equity securities are valued based upon fundamental characteristics or relationships to similar securities.
Certain derivative financial instruments trade in the OTC market. The Fund’s pricing services use various techniques including industry standard option pricing models and proprietary discounted cash flow models to determine the fair value of those instruments. The Fund’s net benefit or obligation under the derivative contract, as measured by the fair value of the contract, is included in net assets.
The Fund has procedures to determine the fair value of financial instruments for which market prices are not reliable or readily available. Under these procedures, the Fund primarily employs a market-based approach which may use related or comparable assets or liabilities, recent transactions, market multiples, book values, and other relevant information for the investment to determine the fair value of the investment. An income-based valuation approach may also be used in which the anticipated future cash flows of the investment are discounted to calculate fair value. Discounts may also be applied due to the nature or duration of any restrictions on the disposition of the investments. Due to the inherent uncertainty of valuations of such investments, the fair values may differ significantly from the values that would have been used had an active market existed.
Trading in securities on foreign securities stock exchanges and OTC markets may be completed before 4 p.m. Eastern time. In addition, trading in certain foreign markets may not take place on every Fund’s business day. Events can occur between the time at which trading in a foreign security is
FRANKLIN TEMPLETON VARIABLE INSURANCE PRODUCTS TRUST
NOTES TO FINANCIAL STATEMENTS (UNAUDITED)
Franklin VolSmart Allocation VIP Fund (continued)
completed and 4 p.m. Eastern time that might call into question the reliability of the value of a portfolio security held by the Fund. As a result, differences may arise between the value of the Fund’s portfolio securities as determined at the foreign market close and the latest indications of value at 4 p.m. Eastern time. In order to minimize the potential for these differences, an independent pricing service may be used to adjust the value of the Fund’s portfolio securities to the latest indications of fair value at 4 p.m. Eastern time.
When the last day of the reporting period is a non-business day, certain foreign markets may be open on those days that the Fund’s NAV is not calculated, which could result in differences between the value of the Fund’s portfolio securities on the last business day and the last calendar day of the reporting period. Any significant security valuation changes due to an open foreign market are adjusted and reflected by the Fund for financial reporting purposes.
b. Foreign Currency Translation
Portfolio securities and other assets and liabilities denominated in foreign currencies are translated into U.S. dollars based on the exchange rate of such currencies against U.S. dollars on the date of valuation. The Fund may enter into foreign currency exchange contracts to facilitate transactions denominated in a foreign currency. Purchases and sales of securities, income and expense items denominated in foreign currencies are translated into U.S. dollars at the exchange rate in effect on the transaction date. Portfolio securities and assets and liabilities denominated in foreign currencies contain risks that those currencies will decline in value relative to the U.S. dollar. Occasionally, events may impact the availability or reliability of foreign exchange rates used to convert the U.S. dollar equivalent value. If such an event occurs, the foreign exchange rate will be valued at fair value using procedures established and approved by the Board.
The Fund does not separately report the effect of changes in foreign exchange rates from changes in market prices on securities held. Such changes are included in net realized and unrealized gain or loss from investments in the Statement of Operations.
Realized foreign exchange gains or losses arise from sales of foreign currencies, currency gains or losses realized between the trade and settlement dates on securities transactions and the difference between the recorded amounts of dividends, interest, and foreign withholding taxes and the U.S. dollar
equivalent of the amounts actually received or paid. Net unrealized foreign exchange gains and losses arise from changes in foreign exchange rates on foreign denominated assets and liabilities other than investments in securities held at the end of the reporting period.
c. Derivative Financial Instruments
The Fund invested in derivative financial instruments in order to manage risk or gain exposure to various other investments or markets. Derivatives are financial contracts based on an underlying or notional amount, require no initial investment or an initial net investment that is smaller than would normally be required to have a similar response to changes in market factors, and require or permit net settlement. Derivatives contain various risks including the potential inability of the counterparty to fulfill their obligations under the terms of the contract, the potential for an illiquid secondary market, and/or the potential for market movements which expose the Fund to gains or losses in excess of the amounts shown in the Statement of Assets and Liabilities. Realized gain and loss and unrealized appreciation and depreciation on these contracts for the period are included in the Statement of Operations.
Derivative counterparty credit risk is managed through a formal evaluation of the creditworthiness of all potential counterparties. The Fund attempts to reduce its exposure to counterparty credit risk on OTC derivatives, whenever possible, by entering into International Swaps and Derivatives Association (ISDA) master agreements with certain counterparties. These agreements contain various provisions, including but not limited to collateral requirements, events of default, or early termination. Termination events applicable to the counterparty include certain deteriorations in the credit quality of the counterparty. Termination events applicable to the Fund include failure of the Fund to maintain certain net asset levels and/or limit the decline in net assets over various periods of time. In the event of default or early termination, the ISDA master agreement gives the non-defaulting party the right to net and close-out all transactions traded, whether or not arising under the ISDA agreement, to one net amount payable by one counterparty to the other. However, absent an event of default or early termination, OTC derivative assets and liabilities are presented gross and not offset in the Statement of Assets and Liabilities. Early termination by the counterparty may result in an immediate payment by the
FRANKLIN TEMPLETON VARIABLE INSURANCE PRODUCTS TRUST
NOTES TO FINANCIAL STATEMENTS (UNAUDITED)
Franklin VolSmart Allocation VIP Fund (continued)
1. Organization and Significant Accounting Policies (continued)
c. Derivative Financial Instruments (continued)
Fund of any net liability owed to that counterparty under the ISDA agreement. At June 30, 2020, the Fund had OTC derivatives in a net liability position of $15,340.
Collateral requirements differ by type of derivative. Collateral or initial margin requirements are set by the broker or exchange clearing house for exchange traded and centrally cleared derivatives. Initial margin deposited is held at the exchange and can be in the form of cash and/or securities. For OTC derivatives traded under an ISDA master agreement, posting of collateral is required by either the Fund or the applicable counterparty if the total net exposure of all OTC derivatives with the applicable counterparty exceeds the minimum transfer amount, which typically ranges from $100,000 to $250,000, and can vary depending on the counterparty and the type of the agreement. Generally, collateral is determined at the close of Fund business each day and any additional collateral required due to changes in derivative values may be delivered by the Fund or the counterparty the next business day, or within a few business days. Collateral pledged and/or received by the Fund for OTC derivatives, if any, is held in segregated accounts with the Fund’s custodian/counterparty broker and can be in the form of cash and/or securities. Unrestricted cash may be invested according to the Fund’s investment objectives. To the extent that the amounts due to the Fund from its counterparties are not subject to collateralization or are not fully collateralized, the Fund bears the risk of loss from counterparty non-performance.
The Fund entered into exchange traded futures contracts primarily to manage and/or gain exposure to equity price risk. A futures contract is an agreement between the Fund and a counterparty to buy or sell an asset at a specified price on a future date. Required initial margins are pledged by the Fund, and the daily change in fair value is accounted for as a variation margin payable or receivable in the Statement of Assets and Liabilities.
The Fund entered into OTC total return swap contracts primarily to manage and/or gain exposure to equity price risk of an underlying instrument such as a stock, bond, index or basket of securities or indices. A total return swap is an agreement between the Fund and a counterparty to exchange a return linked to an underlying instrument for a
floating or fixed rate payment, both based upon a notional amount. Over the term of the contract, contractually required payments to be paid or received are accrued daily and recorded as unrealized appreciation or depreciation until the payments are made, at which time they are recognized as realized gain or loss.
See Note 8 regarding other derivative information.
d. Income and Deferred Taxes
It is the Fund’s policy to qualify as a regulated investment company under the Internal Revenue Code. The Fund intends to distribute to shareholders substantially all of its taxable income and net realized gains to relieve it from federal income and if applicable, excise taxes. As a result, no provision for U.S. federal income taxes is required.
The Fund may be subject to foreign taxation related to income received, capital gains on the sale of securities and certain foreign currency transactions in the foreign jurisdictions in which it invests. Foreign taxes, if any, are recorded based on the tax regulations and rates that exist in the foreign markets in which the Fund invests. When a capital gain tax is determined to apply, the Fund records an estimated deferred tax liability in an amount that would be payable if the securities were disposed of on the valuation date.
The Fund may recognize an income tax liability related to its uncertain tax positions under U.S. GAAP when the uncertain tax position has a less than 50% probability that it will be sustained upon examination by the tax authorities based on its technical merits. As of June 30, 2020, the Fund has determined that no tax liability is required in its financial statements related to uncertain tax positions for any open tax years (or expected to be taken in future tax years). Open tax years are those that remain subject to examination and are based on the statute of limitations in each jurisdiction in which the Fund invests.
e. Security Transactions, Investment Income, Expenses and Distributions
Security transactions are accounted for on trade date. Realized gains and losses on security transactions are determined on a specific identification basis. Estimated expenses are accrued daily. Dividend income and capital gain distributions by Underlying Funds and ETFs are recorded on the ex-dividend date except for certain dividends from
FRANKLIN TEMPLETON VARIABLE INSURANCE PRODUCTS TRUST
NOTES TO FINANCIAL STATEMENTS (UNAUDITED)
Franklin VolSmart Allocation VIP Fund (continued)
securities where the dividend rate is not available. In such cases, the dividend is recorded as soon as the information is received by the Fund. Distributions to shareholders are recorded on the ex-dividend date. Distributable earnings are determined according to income tax regulations (tax basis) and may differ from earnings recorded in accordance with U.S. GAAP. These differences may be permanent or temporary. Permanent differences are reclassified among capital accounts to reflect their tax character. These reclassifications have no impact on net assets or the results of operations. Temporary differences are not reclassified, as they may reverse in subsequent periods.
Common expenses incurred by the Trust are allocated among the Funds based on the ratio of net assets of each Fund to the combined net assets of the Trust or based on the ratio of number of shareholders of each Fund to the combined number of shareholders of the Trust. Fund specific expenses are charged directly to the Fund that incurred the expense.
The Fund indirectly bears its proportionate share of expenses from the Underlying Funds and ETFs. Since the Underlying Funds and ETFs have varied expense levels and the Fund may own different proportions of the Underlying Funds and ETFs at different times, the amount of expenses incurred indirectly by the Fund will vary.
Realized and unrealized gains and losses and net investment income, excluding class specific expenses, are allocated daily to each class of shares based upon the relative proportion of
net assets of each class. Differences in per share distributions by class are generally due to differences in class specific expenses.
f. Accounting Estimates
The preparation of financial statements in accordance with U.S. GAAP requires management to make estimates and assumptions that affect the reported amounts of assets and liabilities at the date of the financial statements and the amounts of income and expenses during the reporting period. Actual results could differ from those estimates.
g. Guarantees and Indemnifications
Under the Trust’s organizational documents, its officers and trustees are indemnified by the Trust against certain liabilities arising out of the performance of their duties to the Trust. Additionally, in the normal course of business, the Trust, on behalf of the Fund, enters into contracts with service providers that contain general indemnification clauses. The Trust’s maximum exposure under these arrangements is unknown as this would involve future claims that may be made against the Trust that have not yet occurred. Currently, the Trust expects the risk of loss to be remote.
2. Shares of Beneficial Interest
At June 30, 2020, there were an unlimited number of shares authorized (without par value). During the period ended June 30, 2020 and the year ended December 31, 2019, there were no transactions of the Fund’s Class 2 shares. Transactions in the Fund’s Class 5 shares were as follows:
| | | | | | | | | | | | | | | | | | |
| | | |
| | | Six Months Ended June 30, 2020 | | | | | Year Ended December 31, 2019 | |
| | | | | |
| | | Shares | | | Amount | | | | | Shares | | | Amount | |
| | | | | |
| Class 5 Shares: | | | | | | | | | | | | | | | | | | |
Shares sold | | | 682,416 | | | $ | 8,696,973 | | | | | | 1,083,696 | | | $ | 12,810,981 | |
Shares issued in reinvestment of distributions | | | 165,415 | | | | 2,132,196 | | | | | | 181,847 | | | | 2,160,339 | |
Shares redeemed | | | (2,262,275 | ) | | | (28,430,643 | ) | | | | | (2,383,442 | ) | | | (28,340,194) | |
| | | | | |
Net increase (decrease) | | | (1,414,444 | ) | | $ | (17,601,474 | ) | | | | | (1,117,899 | ) | | $ | (13,368,874) | |
FRANKLIN TEMPLETON VARIABLE INSURANCE PRODUCTS TRUST
NOTES TO FINANCIAL STATEMENTS (UNAUDITED)
Franklin VolSmart Allocation VIP Fund (continued)
3. Transactions with Affiliates
Franklin Resources, Inc. is the holding company for various subsidiaries that together are referred to as Franklin Templeton. Certain officers and trustees of the Fund are also officers, directors and/or trustees of certain of the Underlying Funds and of the following subsidiaries:
| | |
| |
| Subsidiary | | Affiliation |
Franklin Advisers, Inc. (Advisers) | | Investment manager |
K2/D&S Management Co., LLC (K2 Advisors) | | Investment manager |
Franklin Templeton Services, LLC (FT Services) | | Administrative manager |
Franklin Templeton Distributors, Inc. (Distributors) | | Principal underwriter |
Franklin Templeton Investor Services, LLC (Investor Services) | | Transfer agent |
a. Management Fees
The Fund pays an investment management fee to Advisers of 0.80% per year of the average daily net assets of the Fund.
Under a subadvisory agreement, K2 Advisors, an affiliate of Advisers, provides subadvisory services to the Fund. The subadvisory fee is paid by Advisers based on the Fund’s average daily net assets, and is not an additional expense of the Fund. Effective May 1, 2020, the subadvisory agreement was terminated with K2 Advisors.
b. Administrative Fees
Under an agreement with Advisers, FT Services provides administrative services to the Fund. The fee is paid by Advisers based on the Fund’s average daily net assets, and is not an additional expense of the Fund.
c. Distribution Fees
The Board has adopted distribution plans for Class 2 and Class 5 shares pursuant to Rule 12b-1 under the 1940 Act. Under the Fund’s compensation distribution plans, the Fund pays Distributors for costs incurred in connection with the servicing, sale and distribution of the Fund’s shares up to 0.35% and 0.15% per year of its average daily net assets of Class 2 and Class 5, respectively. The Board has agreed to limit the current rate to 0.25% per year for Class 2. The plan year, for purposes of monitoring compliance with the maximum annual plan rates, is February 1 through January 31.
d. Transfer Agent Fees
Investor Services, under terms of an agreement, performs shareholder servicing for the Fund and is not paid by the Fund for the services.
e. Investments in Underlying Funds
The Fund invests in Underlying Funds which are managed by affiliates of the Fund’s administrative manager, Franklin Templeton Services, LLC. The Fund does not invest in Underlying Funds for the purpose of exercising a controlling influence over the management or policies. Management fees paid by the Fund are waived on assets invested in the Underlying Funds, as noted in the Statement of Operations, in an amount not to exceed the management and administrative fees paid directly or indirectly by the Underlying Funds.
FRANKLIN TEMPLETON VARIABLE INSURANCE PRODUCTS TRUST
NOTES TO FINANCIAL STATEMENTS (UNAUDITED)
Franklin VolSmart Allocation VIP Fund (continued)
Investments in Underlying Funds for the ended June 30, 2020, were as follows:
| | | | | | | | | | | | | | | | | | | | | | | | | | | | | | | | |
| | | | | | | | |
| | | Value at
Beginning of
Period | | | Purchases | | | Sales | | | Realized
Gain
(Loss) | | | Net Change in
Unrealized
Appreciation
(Depreciation) | | | Value at
End of
Period | | | Number of
Shares
Held at End
of Period | | | Dividend
Income | |
| | | | | | | | |
| Non-Controlled Affiliates | | | | | | | | | | | | | | | | | | | | | | | | | | | | | | | | |
| | | | | | | | |
Franklin DynaTech Fund, Class R6 | | $ | 9,701,447 | | | $ | 1,700,000 | | | $ | (11,942,385 | ) | | $ | 5,149,340 | | | | $(4,608,402 | ) | | $ | —a | | | | — | | | $ | — | |
| | | | | | | | |
Franklin Income Fund, Class R6 | | | 15,600,923 | | | | 1,413,692 | | | | (1,552,000 | ) | | | (211,629 | ) | | | (1,702,706 | ) | | $ | 13,548,280 | | | | 6,641,314 | | | | 413,692 | |
| | | | | | | | |
Franklin Liberty U.S. Core Bond ETF | | | — | | | | 25,897,256 | | | | (1,032,131 | ) | | | 5,340 | | | | 339,175 | | | | 25,209,640 | | | | 962,200 | | | | 108,221 | |
| | | | | | | | |
Franklin Low Duration Total Return Fund, Class R6 | | | 32,117,065 | | | | 354,110 | | | | (20,948,000 | ) | | | (1,792,981 | ) | | | 282,826 | | | | 10,013,020 | | | | 1,054,002 | | | | 354,111 | |
| | | | | | | | |
Franklin Strategic Income Fund, Class R6 | | | 22,028,255 | | | | 366,317 | | | | (14,669,000 | ) | | | (1,610,718 | ) | | | (149,887 | ) | | | 5,964,967 | | | | 654,054 | | | | 366,317 | |
| | | | | | | | |
Institutional Fiduciary Trust Money Market Portfolio, 0.00% | | | 4,131,506 | | | | 108,751,004 | | | | (103,065,354 | ) | | | — | | | | — | | | | 9,817,156 | | | | 9,817,156 | | | | 15,376 | |
| | | | | | | | |
Total Affiliated Securities | | $ | 83,579,196 | | | $ | 138,482,379 | | | $ | (153,208,870 | ) | | $ | 1,539,352 | | | | $(5,838,994 | ) | | $ | 64,553,063 | | | | | | | $ | 1,257,717 | |
aAs of June 30, 2020, no longer held by the fund.
f. Waiver and Expense Reimbursements
Advisers has contractually agreed in advance to waive or limit its fees and to assume as its own expense certain expenses otherwise payable by the Fund so that the operating expenses (excluding distribution fees, acquired fund fees and expenses and certain non-routine expenses or costs, including those relating to litigation, indemnification, reorganizations, and liquidations) for each class of the Fund do not exceed 0.65%, based on the average net assets of each class until April 30, 2021. Total expenses waived or paid are not subject to recapture subsequent to the Fund’s fiscal year end.
4. Expense Offset Arrangement
The Fund has entered into an arrangement with its custodian whereby credits realized as a result of uninvested cash balances are used to reduce a portion of the Fund’s custodian expenses. During the period ended June 30, 2020, the custodian fees were reduced as noted in the Statement of Operations.
5. Income Taxes
For tax purposes, capital losses may be carried over to offset future capital gains.
At December 31, 2019, the capital loss carryforwards were as follows:
| | | | |
Capital loss carryforwards not subject to expiration: | | | | |
Short term | | | $416,421 | |
FRANKLIN TEMPLETON VARIABLE INSURANCE PRODUCTS TRUST
NOTES TO FINANCIAL STATEMENTS (UNAUDITED)
Franklin VolSmart Allocation VIP Fund (continued)
5. Income Taxes (continued)
At June 30, 2020, the cost of investments and net unrealized appreciation (depreciation) for income tax purposes were as follows:
| | | | |
Cost of investments | | | $145,370,423 | |
| | | | |
| |
Unrealized appreciation | | | $ 29,085,839 | |
Unrealized depreciation | | | (2,472,627) | |
| | | | |
| |
Net unrealized appreciation (depreciation) | | | $ 26,613,212 | |
| | | | |
Differences between income and/or capital gains as determined on a book basis and a tax basis are primarily due to differing treatment of swaps and foreign currency transactions.
6. Investment Transactions
Purchases and sales of investments (excluding short term securities) for the period ended June 30, 2020, aggregated $103,817,135 and $115,755,214, respectively.
7. Novel Coronavirus Pandemic
The global outbreak of the novel coronavirus disease, known as COVID-19, has caused adverse effects on many companies, sectors, nations, regions and the markets in general, and may continue for an unpredictable duration. The effects of this pandemic may materially impact the value and performance of the Fund, its ability to buy and sell fund investments at appropriate valuations and its ability to achieve its investment objectives.
8. Other Derivative Information
At June 30, 2020, investments in derivative contracts are reflected in the Statement of Assets and Liabilities as follows:
| | | | | | | | | | | | | | | | |
| | | |
| | | Asset Derivatives | | | | | | Liability Derivatives | |
| | | | | |
Derivative Contracts Not Accounted for as Hedging Instruments | | Statement of
Assets and Liabilities Location | | Fair Value | | | | | | Statement of
Assets and Liabilities Location | | Fair Value | |
| | | | | |
Equity contracts | | Variation margin on futures contracts | | | $ — | | | | | | | Variation margin on futures contracts | |
| $214,710
| a
|
| | | | | |
| | Unrealized appreciation on OTC swap contracts | | | — | | | | | | | Unrealized depreciation on OTC swap contracts | | | 15,340 | |
| | | | | | | | | | | | | | | | |
| | | | | |
Totals | | | | | $ — | | | | | | | | | | $230,050 | |
| | | | | | | | | | | | | | | | |
aThis amount reflects the cumulative appreciation (depreciation) of futures contracts as reported in the Statement of Investments. Only the variation margin receivable/ payable at period end is separately reported within the Statement of Assets and Liabilities. Prior variation margin movements were recorded to cash upon receipt or payment.
FRANKLIN TEMPLETON VARIABLE INSURANCE PRODUCTS TRUST
NOTES TO FINANCIAL STATEMENTS (UNAUDITED)
Franklin VolSmart Allocation VIP Fund (continued)
For the period ended June 30, 2020, the effect of derivative contracts in the Statement of Operations was as follows:
| | | | | | | | | | | | | | | | |
| | | | | |
Derivative Contracts
Not Accounted for as
Hedging Instruments | | Statement of
Operations Location | | Net Realized
Gain (Loss) for
the Period | | | | | | Statement of
Operations Location | | Net Change in
Unrealized
Appreciation
(Depreciation)
for the Period | |
| | | | | |
| | Net realized gain (loss) from: | | | | | | | | | | Net change in unrealized appreciation (depreciation) on: | | | | |
| | | | | |
Equity contracts | | Futures contracts | | | $ (2,844,958 | ) | | | | | | Futures contracts | | | $(214,710) | |
| | | | | |
| | Swap contracts | | | 15,493,285 | | | | | | | Swap contracts | | | (11,527) | |
| | | | | | | | | | | | | | | | |
Totals | | | | | $12,648,327 | | | | | | | | | | $(226,237) | |
| | | | | | | | | | | | | | | | |
For the period ended June 30, 2020, the average month end notional amount of futures contracts and swap contracts represented $28,330,391 and $10,185,714, respectively.
See Note 1(c) regarding derivative financial instruments.
9. Credit Facility
The Fund, together with other U.S. registered and foreign investment funds (collectively, Borrowers), managed by Franklin Templeton, are borrowers in a joint syndicated senior unsecured credit facility totaling $2 billion (Global Credit Facility) which matures on February 5, 2021. This Global Credit Facility provides a source of funds to the Borrowers for temporary and emergency purposes, including the ability to meet future unanticipated or unusually large redemption requests.
Under the terms of the Global Credit Facility, the Fund shall, in addition to interest charged on any borrowings made by the Fund and other costs incurred by the Fund, pay its share of fees and expenses incurred in connection with the implementation and maintenance of the Global Credit Facility, based upon its relative share of the aggregate net assets of all of the Borrowers, including an annual commitment fee of 0.15% based upon the unused portion of the Global Credit Facility. These fees are reflected in other expenses in the Statement of Operations. During the period ended June 30, 2020, the Fund did not use the Global Credit Facility.
10. Fair Value Measurements
The Fund follows a fair value hierarchy that distinguishes between market data obtained from independent sources (observable inputs) and the Fund’s own market assumptions (unobservable inputs). These inputs are used in determining the value of the Fund’s financial instruments and are summarized in the following fair value hierarchy:
| | • | | Level 1 – quoted prices in active markets for identical financial instruments |
| | • | | Level 2 – other significant observable inputs (including quoted prices for similar financial instruments, interest rates, prepayment speed, credit risk, etc.) |
| | • | | Level 3 – significant unobservable inputs (including the Fund’s own assumptions in determining the fair value of financial instruments) |
The input levels are not necessarily an indication of the risk or liquidity associated with financial instruments at that level.
FRANKLIN TEMPLETON VARIABLE INSURANCE PRODUCTS TRUST
NOTES TO FINANCIAL STATEMENTS (UNAUDITED)
Franklin VolSmart Allocation VIP Fund (continued)
10. Fair Value Measurements (continued)
A summary of inputs used as of June 30, 2020, in valuing the Fund’s assets and liabilities carried at fair value, is as follows:
| | | | | | | | | | | | | | | | |
| | | Level 1 | | | Level 2 | | | Level 3 | | | Total | |
| Assets: | | | | | | | | | | | | | | | | |
Investments in Securities:a | | | | | | | | | | | | | | | | |
Equity Investments | | $ | 107,660,357 | | | $ | — | | | $ | — | | | $ | 107,660,357 | |
Investments in Underlying Funds | | | 54,735,907 | | | | — | | | | — | | | | 54,735,907 | |
Short Term Investments | | | 9,817,156 | | | | — | | | | — | | | | 9,817,156 | |
Total Investments in Securities | | $ | 172,213,420 | | | $ | — | | | $ | — | | | $ | 172,213,420 | |
| Liabilities: | | | | | | | | | | | | | | | | |
Other Financial Instruments: | | | | | | | | | | | | | | | | |
Futures Contracts | | $ | 214,710 | | | $ | — | | | $ | — | | | $ | 214,710 | |
Swap Contracts | | | — | | | | 15,340 | | | | — | | | | 15,340 | |
Total Other Financial Instruments | | $ | 214,710 | | | $ | 15,340 | | | $ | — | | | $ | 230,050 | |
aFor detailed categories, see the accompanying Statement of Investments. | | | | | | | | | | | | | | | | |
11. New Accounting Pronouncements
In March 2020, the Financial Accounting Standards Board issued Accounting Standards Update (ASU) No. 2020-04, Reference Rate Reform (Topic 848) – Facilitation of the Effects of Reference Rate Reform on Financial Reporting. The amendments in the ASU provides optional temporary financial reporting relief from the effect of certain types of contract modifications due to the planned discontinuation of the London Interbank Offered Rate and other interbank-offered based reference rates as of the end of 2021. The ASU is effective for certain reference rate-related contract modifications that occur during the period March 12, 2020 through December 31, 2022. Management is currently evaluating the impact, if any, of applying this ASU.
12. Subsequent Events
The Fund has evaluated subsequent events through the issuance of the financial statements and determined that no events have occurred that require disclosure.
| | |
Abbreviations | | |
| Counterparty | | Selected Portfolio |
| BZWS Barclays Bank PLC | | ETF Exchange Traded Fund |
| | VIX Market Volatility Index |
FRANKLIN TEMPLETON VARIABLE INSURANCE PRODUCTS TRUST
Index Descriptions
The indexes are unmanaged and include reinvestment of any income or distributions (after the deduction of certain withholding taxes for the NR or Net Return Index). They do not reflect any fees, expenses or sales charges.
For Russell Indexes: Frank Russell Company is the source and owner of the trademarks, service marks and copyrights related to the Russell Indexes. Russell® is a trademark of Frank Russell Company.
See www.franklintempletondatasources.com for additional data provider information.
Bloomberg Barclays 1-3 Month U.S. Treasury Bill Index measures the performance of U.S. Treasury bills that have a remaining maturity of greater than or equal to one month and less than three months.
Bloomberg Barclays U.S. Aggregate Bond Index is a market capitalization-weighted index representing the U.S. investment-grade, fixed-rate, taxable bond market with index components for government and corporate, mortgage pass-through and asset-backed securities. All issues included are SEC registered, taxable, dollar denominated and nonconvertible, must have at least one year to final maturity and must be rated investment grade (Baa3/BBB-/BBB- or higher) using the middle rating of Moody’s, Standard & Poor’s and Fitch, respectively.
Bloomberg Barclays U.S. Corporate Bond Index measures the investment grade, fixed-rate, taxable corporate bond market. It includes U.S. dollar-denominated securities publicly issued by U.S. and non-U.S. industrial, utility and financial issuers.
Bloomberg Barclays U.S. Corporate High Yield Bond Index measures the U.S. dollar-denominated, high yield, fixed-rate corporate bond market. Securities are classified as high yield if the middle rating of Moody’s, Fitch and Standard & Poor’s is Ba1/BB+/BB+ or below.
Bloomberg Barclays U.S. Corporate Investment Grade Index is a broad-based benchmark that measures the investment-grade, fixed-rate, taxable corporate bond market.
Bloomberg Barclays U.S. Government Index: Intermediate Component is the intermediate component of the Barclays U.S. Government Index, which includes public obligations of the U.S. Treasury with at least one year to final maturity and publicly issued debt of U.S. government agencies, quasi-federal corporations, and corporate or foreign debt guaranteed by the U.S. government.
Bloomberg Barclays U.S. High Yield Very Liquid Index is a component of the U.S. Corporate High Yield Index that is designed to track a more liquid component of the U.S. dollar-denominated, high-yield fixed-rate corporate bond market.
Bloomberg Barclays U.S. Treasury Index measures U.S. dollar-denominated, fixed-rate, nominal debt issued by the U.S. Treasury with at least one year until final maturity.
FTSE® EPRA®/NAREIT® Developed Index is a free float-adjusted index designed to measure the performance of publicly traded real estate securities in the North American, European and Asian real estate markets.
FTSE World Government Bond Index is a market capitalization-weighted index consisting of investment-grade world government bond markets.
J.P. Morgan (JPM) Global Government Bond Index (GGBI) tracks total returns for liquid, fixed-rate, domestic government bonds with maturities greater than one year issued by developed countries globally.
Lipper Multi-Sector Income Funds Classification Average is calculated by averaging the total returns of all funds within the Lipper Multi-Sector Income Funds Classification in the Lipper Open-End underlying funds universe. Lipper Multi-Sector Income Funds are defined as funds that seek current income by allocation of assets among different fixed income securities sectors (not primarily in one sector except for defensive purposes), including U.S. and foreign governments, with a significant portion rated below investment grade. For the six-month period ended 6/30/20, there were 37 funds in this category. Lipper calculations do not include contract fees, expenses or sales charges, and may have been different if such charges had been considered.
Lipper VIP General U.S. Government Funds Classification Average is an equally weighted average calculation of performance figures for all funds within the Lipper General U.S. Government Funds classification in the Lipper VIP underlying funds universe. Lipper General U.S. Government Funds invest primarily in U.S. government and agency issues. For the six-month period ended 6/30/20, there were 26 funds in this category. Lipper calculations do not include contract fees, expenses or sales charges, and may have been different if such charges had been considered.
FRANKLIN TEMPLETON VARIABLE INSURANCE PRODUCTS TRUST
INDEX DESCRIPTIONS
MSCI All Country Asia Index is a free float-adjusted, market capitalization-weighted index designed to measure equity market performance in developed and emerging markets in Asia.
MSCI All Country World Index (ACWI) is a free float-adjusted, market capitalization-weighted index designed to measure equity market performance in global developed and emerging markets.
MSCI All Country World Index (ACWI) ex USA Index is a free float-adjusted, market capitalization-weighted index designed to measure equity market performance in global developed and emerging markets, excluding the U.S.
MSCI Europe Index is a free float-adjusted market capitalization-weighted index designed to measure the equity market performance of developed markets in Europe.
MSCI Europe, Australasia, Far East (EAFE) Index is a free float-adjusted market capitalization-weighted index designed to measure the equity market performance of developed markets, excluding the U.S. and Canada.
MSCI Emerging Markets (EM) Index is a free float-adjusted, market capitalization-weighted index designed to measure equity market performance in global emerging markets.
MSCI USA High Dividend Yield Index is based on the MSCI USA Index, its parent index, and includes large- and mid-capitalization stocks. The index is designed to reflect the performance of equities in the parent index (excluding real estate investment trusts) with higher dividend income and quality characteristics than average dividend yields that are both sustainable and persistent.
MSCI World ex USA Index-NR is a free float-adjusted, market capitalization-weighted index designed to measure equity market performance in global developed markets, excluding the U.S. Net Returns (NR) include income net of tax withholding when dividends are paid.
MSCI World Index is a free float-adjusted, market capitalization-weighted index designed to measure equity market performance in global developed markets.
Russell 1000® Growth Index is market capitalization weighted and measures performance of those Russell 1000® Index companies with relatively higher price-to-book ratios and higher forecasted growth values.
Russell 1000® Index is market capitalization weighted and measures performance of the largest companies in the Russell 3000® Index, which represents the majority of the U.S. market’s total capitalization.
Russell 1000® Value Index is market capitalization weighted and measures performance of those Russell 1000® Index companies with relatively lower price-to-book ratios and lower forecasted growth values.
Russell 2000® Index is market capitalization weighted and measures performance of the 2,000 smallest companies in the Russell 3000® Index, which represent a small amount of the total market capitalization of the Russell 3000® Index.
Russell 2000® Value Index is market capitalization weighted and measures performance of those Russell 2000® Index companies with relatively lower price-to-book ratios and lower forecasted growth values.
Russell 3000® Index is market capitalization weighted and represents the majority of the U.S. market’s total capitalization.
Russell 3000® Growth Index is market capitalization weighted and measures performance of those Russell 3000® Index companies with relatively higher price-to-book ratios and higher forecasted growth values.
Russell Midcap® Growth Index is market capitalization weighted and measures performance of those Russell Midcap® Index companies with relatively higher price-to-book ratios and higher forecasted growth values.
Russell Midcap® Index is market capitalization weighted and measures performance of the smallest companies in the Russell 1000® Index, which represents a modest amount of the Russell 1000® Index’s total market capitalization.
Standard & Poor’s® 500 Index (S&P 500®) is a market capitalization-weighted index of 500 stocks designed to measure total U.S. equity market performance.
Standard & Poor’s®/International Finance Corporation Investable (S&P/IFCI) Composite Index is a free float-adjusted, market capitalization-weighted index designed to measure equity performance in global emerging markets.
FRANKLIN TEMPLETON VARIABLE INSURANCE PRODUCTS TRUST
SHAREHOLDER INFORMATION
Shareholder Information
Board Approval of Investment
Management Agreements
FRANKLIN TEMPLETON VARIABLE INSURANCE PRODUCTS TRUST
Franklin Allocation VIP Fund
Franklin Flex Cap Growth VIP Fund
Franklin Global Real Estate VIP Fund
Franklin Growth and Income VIP Fund
Franklin Income VIP Fund
Franklin Large Cap Growth VIP Fund
Franklin Mutual Global Discovery VIP Fund
Franklin Mutual Shares VIP Fund
Franklin Rising Dividends VIP Fund
Franklin Small Cap Value VIP Fund
Franklin Small-Mid Cap Growth VIP Fund
Franklin Strategic Income VIP Fund
Franklin U.S. Government Securities VIP Fund
Franklin VolSmart Allocation VIP Fund
Templeton Developing Markets VIP Fund
Templeton Foreign VIP Fund
Templeton Global Bond VIP Fund
Templeton Growth VIP Fund
(each a Fund)
At a meeting held on April 7, 2020 (Meeting), the Board of Trustees (Board) of Franklin Templeton Variable Insurance Products Trust (Trust), including a majority of the trustees who are not “interested persons” as defined in the Investment Company Act of 1940 (Independent Trustees), reviewed and approved the continuance of the (i) investment management agreement between Franklin Advisers, Inc. (FAI) and the Trust, on behalf of each of Franklin Allocation VIP Fund, Franklin Flex Cap Growth VIP Fund, Franklin Growth and Income VIP Fund, Franklin Income VIP Fund, Franklin Large Cap Growth VIP Fund, Franklin Rising Dividends VIP Fund, Franklin Small-Mid Cap Growth VIP Fund, Franklin Strategic Income VIP Fund, Franklin U.S. Government Securities VIP Fund, Franklin VolSmart Allocation VIP Fund, and Templeton Global Bond VIP Fund; (ii) the investment sub-advisory agreement between FAI and Franklin Templeton Institutional, LLC (FTIL), an affiliate of FAI, on behalf of Franklin Allocation VIP Fund; (iii) the investment sub-advisory agreement between FAI and Templeton Global Advisors Limited (TGAL), an affiliate of FAI, on behalf of Franklin Allocation VIP Fund; (iv) the investment management agreement between FTIL and the Trust, on behalf of Franklin Global Real Estate VIP Fund; (v) the investment management agreement between Franklin
Mutual Advisers, LLC (FMA) and the Trust, on behalf of each of Franklin Mutual Global Discovery VIP Fund, Franklin Mutual Shares VIP Fund and Franklin Small Cap Value VIP Fund; (vi) the investment management agreement between Templeton Asset Management Ltd. (TAML) and the Trust, on behalf of Templeton Developing Markets VIP Fund; (vii) the investment management agreement between Templeton Investment Counsel, LLC (TICL) and the Trust, on behalf of Templeton Foreign VIP Fund; and (viii) the investment management agreement between TGAL and the Trust, on behalf of Templeton Growth VIP Fund (each a Management Agreement) for an additional one-year period. The Independent Trustees received advice from and met separately with Independent Trustee counsel in considering whether to approve the continuation of each Management Agreement. Although the Management Agreements for the Funds were considered at the same Board meeting, the Board considered the information provided to it about the Funds together and with respect to each Fund separately as the Board deemed appropriate. FAI, FTIL, FMA, TAML, TICL and TGAL are each referred to herein as a Manager.
In considering the continuation of each Management Agreement, the Board reviewed and considered information provided by each Manager at the Meeting and throughout the year at meetings of the Board and its committees. The Board also reviewed and considered information provided in response to a detailed set of requests for information submitted to each Manager by Independent Trustee counsel on behalf of the Independent Trustees in connection with the annual contract renewal process. In addition, prior to the Meeting, the Independent Trustees held a telephonic contract renewal meeting at which the Independent Trustees conferred amongst themselves and Independent Trustee counsel about contract renewal matters and, in some cases, requested additional information from the Managers relating to the contract. The Board reviewed and considered all of the factors it deemed relevant in approving the continuance of each Management Agreement, including, but not limited to: (i) the nature, extent and quality of the services provided by each Manager; (ii) the investment performance of each Fund; (iii) the costs of the services provided and profits realized by each Manager and its affiliates from the relationship with each Fund; (iv) the extent to which economies of scale are realized as each Fund grows; and (v) whether fee levels reflect these economies of scale for the benefit of Fund investors.
In approving the continuance of each Management Agreement, the Board, including a majority of the
FRANKLIN TEMPLETON VARIABLE INSURANCE PRODUCTS TRUST
SHAREHOLDER INFORMATION
Independent Trustees, determined that the terms of each Management Agreement are fair and reasonable and that the continuance of such Management Agreement is in the interests of the applicable Fund and its shareholders. While attention was given to all information furnished, the following discusses some primary factors relevant to the Board’s determination.
Nature, Extent and Quality of Services
The Board reviewed and considered information regarding the nature, extent and quality of investment management services provided by each Manager and its affiliates to the Funds and their shareholders. This information included, among other things, the qualifications, background and experience of the senior management and investment personnel of each Manager; as well as information on succession planning where appropriate; the structure of investment personnel compensation; oversight of third-party service providers; investment performance reports and related financial information for each Fund; reports on expenses and shareholder services; legal and compliance matters; risk controls; pricing and other services provided by each Manager and its affiliates; and management fees charged by each Manager and its affiliates to US funds and other accounts, including management’s explanation of differences among accounts where relevant. The Board also reviewed and considered an annual report on payments made by Franklin Templeton (FT) or the Funds to financial intermediaries, as well as a memorandum relating to third-party servicing arrangements, which included discussion of the changing distribution landscape for the Funds. The Board noted management’s continuing efforts and expenditures in establishing effective business continuity plans and developing strategies to address areas of heightened concern in the mutual fund industry, such as cybersecurity and liquidity risk management.
The Board also reviewed and considered the benefits provided to Fund shareholders of investing in a fund that is part of the FT family of funds. The Board noted the financial position of Franklin Resources, Inc. (FRI), the Managers’ parent, and its commitment to the mutual fund business as evidenced by its continued introduction of new funds, reassessment of the fund offerings in response to the market environment and project initiatives and capital investments relating to the services provided to the Funds by the FT organization. The Board specifically noted FT’s commitment to enhancing services and controlling costs, as reflected in its plan to outsource certain administrative functions, and growth opportunities, as evidenced by its
upcoming acquisition of the Legg Mason companies. The Board acknowledged the change in leadership at FRI and the opportunity to hear from Jennifer Johnson, President and Chief Executive Officer of FRI, about goals she has for the company that will benefit the Funds.
Following consideration of such information, the Board was satisfied with the nature, extent and quality of services provided by each Manager and its affiliates to the Funds and their shareholders.
Fund Performance
The Board reviewed and considered the performance results of each Fund over various time periods ended January 31, 2020. The Board considered the performance returns for each Fund in comparison to the performance returns of mutual funds deemed comparable to the Fund included in a universe (Performance Universe) selected by Broadridge Financial Solutions, Inc. (Broadridge), an independent provider of investment company data. The Board received a description of the methodology used by Broadridge to select the mutual funds included in a Performance Universe. The Board also considered the performance returns for the Franklin Income VIP Fund and Franklin VolSmart Allocation VIP Fund in comparison to the performance returns of a customized peer group (Performance Customized Peer Group) selected by the Manager. The Board also reviewed and considered Fund performance reports provided and discussions that occurred with portfolio managers at Board meetings throughout the year. A summary of each Fund’s performance results is below.
Franklin Allocation VIP Fund - The Performance Universe for this Fund included the Fund and all mixed-asset target allocation growth funds underlying variable insurance products (VIPs). The Board noted that the Fund’s annualized income return for the one-, three-, five- and 10-year periods was above the median and in the first quintile (best) of its Performance Universe. The Board also noted that the Fund’s annualized total return for the one-, three-, five- and 10-year periods was below the median of its Performance Universe. The Board discussed this performance with management and management explained that the Performance Universe was not directly comparable to the Fund as the Performance Universe includes funds with equity exposures between 60%-80% and the Fund maintains a strategic asset allocation of 60% equities. Management further explained that the Fund’s strategic allocation has served as a headwind for peer-relative returns since the Fund’s repositioning on May 1, 2019 to a direct investment fund with
FRANKLIN TEMPLETON VARIABLE INSURANCE PRODUCTS TRUST
SHAREHOLDER INFORMATION
an actively managed dynamic allocation strategy. The Board noted management’s explanations and determined that, in light of the recent strategy changes, additional time will be needed to evaluate the effectiveness of management’s actions. The Board concluded that the Fund’s Management Agreement should be continued for an additional one-year period, and management’s efforts should continue to be monitored.
Franklin Flex Cap Growth VIP Fund - The Performance Universe for this Fund included the Fund and all large-cap growth funds underlying VIPs. The Board noted that the Fund’s annualized total return for the three-year period was above the median of its Performance Universe, but for the one-, five- and 10-year periods was below the median of its Performance Universe. The Board discussed this performance with management and management explained that during the one-year period, Information Technology and Industrials were the two largest sectors of underperformance for the Fund. Management further explained that the Fund’s cash position was also a detractor from the Fund’s performance. The Board noted management’s steps to address the underperformance of the Fund. The Board concluded that the Fund’s Management Agreement should be continued for an additional one-year period, and management’s efforts should continue to be monitored. In doing so, the Board noted that, while below median, the Fund’s annualized total return for the one-, five- and 10-year periods was 23.48%, 12.99% and 12.87%, respectively.
Franklin Growth and Income VIP Fund - The Performance Universe for the Fund included the Fund and all equity income funds underlying VIPs. The Board noted that the Fund’s annualized income return and annualized total return for the one-, three-, five- and 10-year periods were above the medians of its Performance Universe. The Board concluded that the Fund’s performance was satisfactory.
Franklin Income VIP Fund - The Performance Universe for the Fund included the Fund and all mixed-asset target allocation moderate funds underlying VIPs. The Performance Customized Peer Group for the Fund consisted of funds sorted by trailing 12-month yield and set to be top quartile (highest yield). The Board noted that the Fund’s annualized income return for the one-, three-, five- and 10-year periods was above the medians and in the first quintile (best) of its Performance Universe and Performance Customized Peer Group. The Board also noted that the Fund’s annualized total return for the one-, three-, five- and 10-year periods was below the medians of its Performance Universe and
Performance Customized Peer Group. Given the Fund’s income-oriented investment objective, the Board concluded that the Fund’s performance was satisfactory.
Franklin Strategic Income VIP Fund - The Performance Universe for the Fund included the Fund and all multi-sector income funds underlying VIPs. The Board noted that the Fund’s annualized income return for the one-, three-, five-and 10-year periods was above the median and in the first quintile (best) of its Performance Universe. The Board also noted that the Fund’s annualized total return for the one-, three-, five- and 10-year periods was below the median of its Performance Universe. The Board discussed this performance with management and management explained that the Fund’s relative underperformance was due, in part, to a shorter duration profile of its portfolio holdings and a reduced exposure to credit risk. The Board also noted management’s continued enhancements to the Fund’s investment process, which includes a greater role for macroeconomics and incorporates more quantitative techniques to assist with portfolio construction. Given the Fund’s income-oriented investment objective and the considerations noted above, the Board concluded that the Fund’s performance was satisfactory.
Franklin Large Cap Growth VIP Fund - The Performance Universe for the Fund included the Fund and all multi-cap growth funds underlying VIPs. The Board noted that the Fund’s annualized total return for the 10-year period was below the median of its Performance Universe, but for the one-, three- and five-year periods was above the median of its Performance Universe. The Board concluded that the Fund’s performance was satisfactory.
Franklin Mutual Global Discovery VIP Fund - The Performance Universe for the Fund included the Fund and all global multi-cap value funds underlying VIPs. The Board noted that the Fund’s annualized total return for the one- and 10-year periods was above the median and in the first quintile (best) of its Performance Universe, but for the three-year period was slightly below the median of its Performance Universe and for the five-year period was equal to the median of its Performance Universe. The Board concluded that the Fund’s performance was satisfactory.
Franklin Mutual Shares VIP Fund - The Performance Universe for the Fund included the Fund and all multi-cap value funds underlying VIPs. The Board noted that the Fund’s annualized total return for the one-, three-, five- and 10-year periods was below the median of its Performance Universe. The Board discussed this performance with
FRANKLIN TEMPLETON VARIABLE INSURANCE PRODUCTS TRUST
SHAREHOLDER INFORMATION
management and management explained that the Fund’s underperformance in 2017 was material and continues to adversely impact the Fund’s ranking over longer-term periods. Management reminded the Board of the primary factors that impacted the 2017 performance, including, among factors, exposure to non-US equities and stock selection. Management then explained that, over the one-year period, the Fund’s non-equity investments and stock selection weighed on the Fund’s relative performance. Management also explained that approximately 15% of the Fund’s portfolio was in non-equity investments which relatively underperformed the robust 2019 equity market performance. Management further explained that the Fund’s cash position also weighed on relative performance. Management then discussed with the Board the actions that continue to be taken in an effort to address the sources of the Fund’s underperformance, including enhancements to the Fund’s investment process, particularly with respect to portfolio and quantitative analytics. The Board concluded that the Fund’s Management Agreement should be continued for an additional one-year period, and management’s efforts should continue to be monitored.
Franklin Small-Mid Cap Growth VIP Fund - The Performance Universe for the Fund included the Fund and all mid-cap growth funds underlying VIPs. The Board noted that the Fund’s annualized total return for the one-, three-, five- and 10-year periods was below the median of its Performance Universe. The Board discussed this performance with management and management explained that the Fund’s positioning in the energy, healthcare, consumer, materials, industrial and information technology sectors was a primary detractor from relative performance over the one-, three- and five-year periods. Management further explained that, during the one-, three- and five-year periods, the Fund had more exposure to smaller cap stocks in comparison to its peers, noting that these stocks meaningfully underperformed during the requisite periods. Management then discussed with the Board the actions that are being taken in an effort to address the sources of the Fund’s underperformance, including consolidating the Fund into fewer positions which have demonstrated certain attributes and working closely with the Investment Risk Management Group to limit the amount of risk in the Fund’s portfolio and minimize permanent loss of capital. The Board concluded that the Fund’s Management Agreement should be continued for an additional one-year period, and management’s efforts should continue to be monitored. In doing so, the Board noted that, while below median, the Fund’s annualized total return for the one-,
three-, five- and 10-year periods was 20.96%, 14.29%, 9.99% and 12.87%, respectively.
Franklin Global Real Estate VIP Fund - The Performance Universe for the Fund included the Fund and all global real estate funds underlying VIPs. The Board noted that the Fund’s annualized total return for the three-, five- and 10-year periods was above the median of its Performance Universe, but for the one-year period was below the median of its Performance Universe. The Board further noted that, while below the median, the Fund’s one-year annualized total return was 12.02% and only slightly below the Performance Universe median of 13.11%. The Board concluded that the Fund’s performance was acceptable.
Franklin Rising Dividends VIP Fund - The Performance Universe for the Franklin Rising Dividends VIP Fund included the Fund and all large-cap core funds underlying VIPs. The Board noted that the Fund’s annualized total return for the three-, five- and 10-year periods was above the median of its Performance Universe, but for the one-year period was below the median of its Performance Universe. The Board further noted that, while below the median, the Fund’s one-year annualized total return was 20.55% and only slightly below the Performance Universe median of 20.92%. The Board concluded that the Fund’s performance was acceptable.
Franklin Small Cap Value VIP Fund and Templeton Developing Markets VIP Fund - The Performance Universe for the Franklin Small Cap Value VIP Fund included the Fund and all small-cap value funds underlying VIPs. The Performance Universe for the Templeton Developing Markets VIP Fund included the Fund and all emerging markets funds underlying VIPs. The Board noted that each Fund’s annualized total return for the one-, three-, five- and 10-year periods was above the median of its Performance Universe. The Board concluded that each Fund’s performance was satisfactory.
Franklin U.S. Government Securities VIP Fund - The Performance Universe for the Fund included the Fund and all intermediate US government funds underlying VIPs. The Board noted that the Fund’s annualized income return for the one-, three-, five- and 10-year periods was above the median and in the first quintile (best) of its Performance Universe. The Board also noted that the Fund’s annualized total return for the one-, three-, five- and 10-year periods was below the median of its Performance Universe. Given the Fund’s income-oriented investment objective and conservative policy of investing a significant to substantial amount in
FRANKLIN TEMPLETON VARIABLE INSURANCE PRODUCTS TRUST
SHAREHOLDER INFORMATION
Ginnie Mae obligations, the Board concluded that the Fund’s performance was satisfactory.
Franklin VolSmart Allocation VIP Fund - The Performance Universe for the Fund included the Fund and all flexible portfolio funds underlying VIPs. The Performance Customized Peer Group for the Fund consisted of the Fund and all retail and institutional mixed-asset target allocation moderate funds. The Fund has been in operation for less than 10 years. The Board noted that the Fund’s annualized total return for the three- and five-year periods was below the medians of its Performance Universe and Performance Customized Peer Group, but for the one-year period was above the medians of its Performance Universe and Performance Customized Peer Group. The Board further noted that the Fund’s annualized total return for the three-year period was only 0.02% below the median of its Performance Universe and that the Fund’s annualized total return for the one-year period was 13.90% and in the second quintile of its Performance Universe. The Board concluded that the Fund’s performance was satisfactory.
Templeton Foreign VIP Fund - The Performance Universe for the Fund included the Fund and all international multi-cap value funds underlying VIPs. The Board noted that the Fund’s annualized total return for the one-, three-, five- and 10-year periods was below the median of its Performance Universe. The Board discussed this performance with management and management explained that, even though the Fund’s peer group is comprised of multi-cap value funds, the Fund has a more intense value tilt than the Performance Universe, which has negatively impacted the Fund’s relative returns during a period of historic and sustained outperformance of growth over value. Management further explained that over the one-, three- and five-year periods, the Fund’s performance was also negatively impacted by stock selection among overweight health care holdings and underweight industrials and consumer discretionary stocks. Management then discussed with the Board the actions that are being taken in an effort to address the sources of the Fund’s underperformance, including a focus on constructing a more diversified and high-conviction portfolio. The Board concluded that the Fund’s Management Agreement should be continued for an additional one-year period, and management’s efforts should continue to be monitored.
Templeton Global Bond VIP Fund - The Performance Universe for the Fund included the Fund and all global income funds underlying VIPs. The Board noted that the
Fund’s annualized income return for the one-, three-, five-and 10-year periods was above the median of its Performance Universe. The Board also noted that the Fund’s annualized total return for the one-, three- and five-year periods was below the median of its Performance Universe, but for the 10-year period was above the median of its Performance Universe. The Board discussed this performance with management and management explained that during the one-, three- and five- year periods, management largely positioned the Fund’s strategies for rising rates by maintaining low portfolio duration and aiming at a negative correlation with US Treasury returns. Management further explained that the interest-rate strategies detracted from the Fund’s relative return, while currency positions contributed to the return. Management then discussed with the Board the portfolio manager’s outlook going forward and expectation that the risk management strategies that had weighted on return would be valuable in a diversifying portfolio going forward. The Board concluded that the Fund’s Management Agreement should be continued for an additional one-year period, and management’s efforts should continue to be monitored.
Templeton Growth VIP Fund - The Performance Universe for this Fund included the Fund and all global multi-cap value funds underlying VIPs. The Board noted that the Fund’s annualized total return for the one-, three-, five- and 10-year periods was below the median of its Performance Universe. The Board discussed this performance with management and management explained that the Fund’s higher exposure to value stocks, which have experienced a period of historic underperformance, and underweight position in US stocks, as compared to peers contributed to the Fund’s relative underperformance. Management also explained that weightings in particular sectors (such as information technology, communications services, cyclical energy and financials) and overall stock selection contributed to the Fund’s relative underperformance. Management then discussed with the Board the actions that are being taken in an effort to address the sources of the Fund’s underperformance, including a focus on constructing a more diversified and high-conviction portfolio. The Board concluded that the Fund’s Management Agreement should be continued for an additional one-year period, and management’s efforts should continue to be monitored.
Comparative Fees and Expenses
The Board reviewed and considered information regarding each Fund’s actual total expense ratio and its various components, including, as applicable, management fees;
FRANKLIN TEMPLETON VARIABLE INSURANCE PRODUCTS TRUST
SHAREHOLDER INFORMATION
transfer agent expenses; underlying fund expenses; Rule 12b-1 and non-Rule 12b-1 service fees; and other non-management fees. The Board also noted the quarterly and annual reports it receives on all marketing support payments made by FT to financial intermediaries. The Board considered the actual total expense ratio and, separately, the contractual management fee rate, without the effect of fee waivers, if any (Management Rate) of each Fund in comparison to the median expense ratio and median Management Rate, respectively, of other mutual funds deemed comparable to and with a similar expense structure to the Fund selected by Broadridge (Expense Group). Broadridge fee and expense data is based upon information taken from each fund’s most recent annual report, which reflects historical asset levels that may be quite different from those currently existing, particularly in a period of market volatility. While recognizing such inherent limitation and the fact that expense ratios and Management Rates generally increase as assets decline and decrease as assets grow, the Board believed the independent analysis conducted by Broadridge to be an appropriate measure of comparative fees and expenses. The Broadridge Management Rate includes administrative charges. The Board received a description of the methodology used by Broadridge to select the mutual funds included in an Expense Group.
Franklin Flex Cap Growth VIP Fund, Templeton Foreign VIP Fund and Templeton Growth VIP Fund - The Expense Group for the Franklin Flex Cap Growth VIP Fund included the Fund and 11 other large-cap growth funds underlying VIPs. The Expense Group for the Templeton Foreign VIP Fund included the Fund, eight other international multi-cap value funds underlying VIPs and three international large-cap value funds underlying VIPs. The Expense Group for the Templeton Growth VIP Fund included the Fund, two other global multi-cap value funds underlying VIPs, two global multi-cap core funds underlying VIPs and five global multi-cap growth funds underlying VIPs. The Board noted that the Management Rates for these Funds were above the medians of their respective Expense Groups, but their actual total expense ratios were below the medians of their respective Expense Groups. The Board further noted that the Management Rate for the Templeton Foreign VIP Fund was approximately six basis points above the median of its Expense Group and the Management Rate for the Templeton Growth VIP Fund was approximately nine basis points above the median of its Expense Group. The Board concluded that the Management Rates charged to these Funds are reasonable. In doing so, the Board noted that the
Franklin Flex Cap Growth Fund’s actual total expense ratio reflected a fee waiver from management.
Franklin Mutual Shares VIP Fund - The Expense Group for the Fund included the Fund and 10 other multi-cap value funds underlying VIPs. The Board noted that the Management Rate for the Fund was approximately 7.5 basis points above the median of its Expense Group, but its actual total expense ratio was equal to the median of its Expense Group. The Board further noted management’s explanation that the portfolio management team makes investments in distressed securities and merger arbitrage situations that are specialized in nature and therefore require additional expertise and resources, whereas the Fund’s Expense Group generally does not make such investments. The Board concluded that the Management Rate charged to the Fund is reasonable.
Franklin Strategic Income VIP Fund and Templeton Developing Markets VIP Fund - The Expense Group for the Franklin Strategic Income VIP Fund included the Fund and 10 other multi-sector income funds underlying VIPs. The Expense Group for the Templeton Developing Markets VIP Fund included the Fund and 13 other emerging markets funds underlying VIPs. The Board noted that the Management Rates for the Funds were equal to the medians of their respective Expense Groups, and their actual total expense ratios were below the medians of their respective Expense Groups. The Board concluded that the Management Rate charged to each Fund is reasonable.
Franklin Small-Mid Cap Growth VIP Fund - The Expense Group for the Franklin Small-Mid Cap Growth VIP Fund included the Fund and 12 other mid-cap growth funds underlying VIPs. The Board noted that the Management Rate for the Fund was below the median of its Expense Group, and the actual total expense ratio for the Fund was equal to the median of its Expense Group. The Board concluded that the Management Rate charged to the Fund is reasonable.
Franklin Allocation VIP Fund, Franklin Global Real Estate VIP Fund, Franklin Large Cap Growth VIP Fund and Franklin Mutual Global Discovery VIP Fund – The Expense Group for the Franklin Allocation VIP Fund included the Fund and 10 other mixed-asset target allocation growth affiliated funds of funds underlying VIPs. The Expense Group for the Franklin Global Real Estate VIP Fund included the Fund and seven other global real estate funds underlying VIPs. The Expense Group for the Franklin Large Cap Growth VIP Fund included the Fund and 11 other multi-cap growth funds underlying
FRANKLIN TEMPLETON VARIABLE INSURANCE PRODUCTS TRUST
SHAREHOLDER INFORMATION
VIPs. The Expense Group for the Franklin Mutual Global Discovery VIP Fund included the Fund, two other global multi-cap value funds underlying VIPs, two global multi-cap core funds underlying VIPs and five global multi-cap growth funds underlying VIPs. The Board noted that the Management Rates and actual total expense ratios for these Funds were above the medians of their respective Expense Groups. With respect to the Franklin Allocation VIP Fund, the Board discussed with management the reasons for the increase in the contractual management fee over the past year. Management reminded the Board that prior to May 1, 2019, the Fund was a static allocation fund of funds and did not have an investment manager or pay direct investment management fees, and that effective May 1, 2019, the Fund began investing directly in securities, entered into the Management Agreement with FAI and began paying the contractual management fee. Management also explained that Broadridge did not account for the change in the Fund’s structure and continued to use a peer group of funds of funds to compare expenses. With respect to the Franklin Mutual Global Discovery VIP Fund, the Board noted management’s explanation that the portfolio management team makes investments in distressed securities and merger arbitrage situations that are specialized in nature and therefore require additional expertise and resources, whereas the Fund’s Expense Group generally does not make such investments. The Board also noted that the Fund’s actual total expense ratio was only slightly above (less than 5 basis points) the median of the Fund’s Expense Group. With respect to the Franklin Global Real Estate VIP Fund, the Board noted management’s explanation that the portfolio managers’ rigorous fundamental analysis and active risk controls elevate management costs. The Board also noted that the Fund’s actual total expense ratio reflected a fee waiver from management. With respect to the Franklin Large Cap Growth VIP Fund, the Board noted that the Fund’s Management Rate and actual total expense ratio were only slightly above (approximately 2 basis points or less) the medians of the Fund’s Expense Group. The Board concluded that the Management Rates charged to these Funds are reasonable. In doing so, the Board noted that the Franklin Allocation VIP Fund’s sub-advisers, FTIL and TGAL, are paid by FAI out of the management fee FAI receives from the Fund.
Franklin Growth and Income VIP Fund, Franklin Income VIP Fund, Franklin Rising Dividends VIP Fund, Franklin Small Cap Value VIP Fund, Franklin U.S. Government Securities VIP Fund and Templeton Global Bond VIP Fund –The Expense Group for the Franklin Growth and Income VIP
Fund included the Fund and 10 other equity income funds underlying VIPs. The Expense Group for the Franklin Income VIP Fund included the Fund and nine other mixed-asset target allocation moderate funds underlying VIPs. The Expense Group for Franklin Rising Dividends VIP Fund included the Fund and 11 other large-cap core funds underlying VIPs. The Expense Group for the Franklin Small Cap Value VIP Fund included the Fund and eight other small-cap value funds underlying VIPs. The Expense Group for the Franklin U.S. Government Securities VIP Fund included the Fund, three other intermediate US government funds underlying VIPs and eight inflation-protected bond funds underlying VIPs. The Expense Group for the Templeton Global Bond VIP Fund included the Fund and 10 other global income funds underlying VIPs. The Board noted that the Management Rates and actual total expense ratios for these Funds were below the medians of their respective Expense Groups. The Board concluded that the Management Rates charged to these Funds are reasonable. The Board also noted that the Franklin Growth and Income VIP Fund’s actual total expense ratio reflected a fee waiver from management.
Franklin VolSmart Allocation VIP Fund – The Expense Group for this Fund included the Fund, three other flexible portfolio funds underlying VIPs and one mixed-asset target allocation growth fund underlying VIP. The Board noted the small size of the Expense Group. The Board also noted that the Management Rate for the Fund was below the median of its Expense Group and its actual total expense ratio was above the median of its Expense Group. The Board concluded that the Management Rate charged to the Fund is reasonable. In doing so, the Board noted that the Fund’s actual total expense ratio reflected a fee waiver from management.
Profitability
The Board reviewed and considered information regarding the profits realized by each Manager and its affiliates in connection with the operation of each Fund. In this respect, the Board considered the Fund profitability analysis that addresses the overall profitability of FT’s US fund business, as well as its profits in providing investment management and other services to each of the individual funds during the 12-month period ended September 30, 2019, being the most recent fiscal year-end for FRI. The Board noted that although management continually makes refinements to its methodologies used in calculating profitability in response to organizational and product-related changes, the overall methodology has remained consistent with that used in the
FRANKLIN TEMPLETON VARIABLE INSURANCE PRODUCTS TRUST
SHAREHOLDER INFORMATION
Funds’ profitability report presentations from prior years. Additionally, PricewaterhouseCoopers LLP, auditor to FRI and certain FT funds, was engaged to review and assess the allocation methodologies to be used solely by the Funds’ Board with respect to the profitability analysis.
The Board noted management’s belief that costs incurred in establishing the infrastructure necessary for the type of mutual fund operations conducted by each Manager and its affiliates may not be fully reflected in the expenses allocated to each Fund in determining its profitability, as well as the fact that the level of profits, to a certain extent, reflected operational cost savings and efficiencies initiated by management. As part of this evaluation, the Board considered the initiative currently underway to outsource certain operations, which effort would require considerable up-front expenditures by the Managers but, over the long run is expected to result in greater efficiencies. The Board also noted management’s expenditures in improving shareholder services provided to the Funds, as well as the need to implement systems and meet additional regulatory and compliance requirements resulting from recent US Securities and Exchange Commission and other regulatory requirements, notably in the area of cybersecurity protections.
The Board also considered the extent to which each Manager and its affiliates might derive ancillary benefits from fund operations, including revenues generated from transfer agent services, potential benefits resulting from personnel and systems enhancements necessitated by fund growth, as well as increased leverage with service providers and counterparties. Based upon its consideration of all these factors, the Board concluded that the level of profits realized by each Manager and its affiliates from providing services to each Fund was not excessive in view of the nature, extent and quality of services provided to each Fund.
Economies of Scale
The Board reviewed and considered the extent to which each Manager may realize economies of scale, if any, as each Fund grows larger and whether each Fund’s management fee structure reflects any economies of scale for the benefit of shareholders. With respect to possible economies of scale, the Board noted the existence of management fee breakpoints for each Fund (except for the Franklin Allocation VIP Fund and the Franklin VolSmart Allocation VIP Fund), which operate generally to share any economies of scale with a Fund’s shareholders by reducing the Fund’s effective management fees as the Fund grows in
size. The Board considered management’s view that any analyses of potential economies of scale in managing a particular fund are inherently limited in light of the joint and common costs and investments each Manager incurs across the FT family of funds as a whole. The Board concluded that to the extent economies of scale may be realized by each Manager and its affiliates, each Fund’s management fee structure (except for the Franklin Allocation VIP Fund and the Franklin VolSmart Allocation VIP Fund) provided a sharing of benefits with the Fund and its shareholders as the Fund grows. The Board recognized that there would not likely be any economies of scale for the Franklin Flex Cap Growth VIP Fund, Franklin Global Real Estate VIP Fund, Franklin Growth and Income VIP Fund, Franklin Large Cap Growth VIP Fund and Franklin VolSmart Allocation VIP Fund until each Fund’s assets grow. The Board also recognized that given the decline in assets over the past three calendar years for each of the Franklin Income VIP Fund, Franklin Rising Dividends VIP Fund, Franklin Small Cap Value VIP Fund, Franklin Strategic Income VIP Fund, Franklin U.S. Government Securities VIP Fund, Templeton Foreign VIP Fund and Templeton Growth VIP Fund, these Funds are not expected to experience additional economies of scale in the foreseeable future.
Conclusion
Based on its review, consideration and evaluation of all factors it believed relevant, including the above-described factors and conclusions, the Board unanimously approved the continuation of each Management Agreement for an additional one-year period.
Board Approval of Investment
Management Agreements
FRANKLIN TEMPLETON VARIABLE INSURANCE PRODUCTS TRUST
Templeton Developing Markets VIP Fund
(Fund)
At a meeting held on May 13, 2020 (Meeting), the Board of Trustees (Board) of Franklin Templeton Variable Insurance Products Trust (Trust), including a majority of the trustees who are not “interested persons” as defined in the Investment Company Act of 1940 (Independent Trustees), reviewed and approved a new investment sub-advisory agreement between Templeton Asset Management Ltd. (Manager), the Fund’s investment manager, and Franklin Templeton Investment Management Limited (Sub-Adviser),
FRANKLIN TEMPLETON VARIABLE INSURANCE PRODUCTS TRUST
SHAREHOLDER INFORMATION
on behalf of the Fund (Sub-Advisory Agreement) for an initial two-year period. The Independent Trustees received advice from and met separately with Independent Trustee counsel in considering whether to approve the Sub-Advisory Agreement.
The Board reviewed and considered information provided by the Manager at the Meeting with respect to the Sub-Advisory Agreement. The Board also reviewed and considered the factors it deemed relevant in approving the Sub-Advisory Agreement, including, but not limited to: (i) the nature, extent, and quality of the services to be provided by the Sub-Adviser; and (ii) the costs of the services to be provided by the Sub-Adviser. The Board further reviewed and considered information provided by management showing the expected impact of hiring the Sub-Adviser on the Manager’s profitability consistent with the Order (as defined below). The Board also considered that management proposed that the Board approve the Sub-Advisory Agreement in order to facilitate certain portfolio management team enhancements. The Board reviewed and further considered the form of Sub-Advisory Agreement and the terms of the Sub-Advisory Agreement which were discussed at the Meeting, noting that the terms and conditions of the Sub-Advisory Agreement were substantially identical to the terms and conditions of sub-advisory agreements for other Franklin Templeton (FT) mutual funds.
In approving the Sub-Advisory Agreement, the Board, including a majority of the Independent Trustees, determined that the hiring of the Sub-Adviser is in the best interests of the Fund and its shareholders and does not involve a conflict of interest from which the Manager or Sub-Adviser derives an inappropriate advantage. The Board also determined that the terms of the Sub-Advisory Agreement are fair and reasonable and that the approval of such Sub-Advisory Agreement is in the interests of the Fund and its shareholders. While attention was given to all information furnished, the following discusses some primary factors relevant to the Board’s determination.
Nature, Extent and Quality of Services
The Board reviewed and considered information regarding the nature, extent and quality of investment management services to be provided by the Sub-Adviser and currently being provided by the Manager and its affiliates to the Fund and its shareholders. In doing so, the Board noted that the Fund employs a “manager of managers” structure pursuant to an exemptive order (Order) granted to the Manager by the U.S. Securities and Exchange Commission, whereby the
Manager and the Fund may, without shareholder approval, enter into sub-advisory agreements with sub-advisers that are indirect or direct wholly owned subsidiaries of Franklin Resources, Inc. (FRI). In particular, with respect to the Sub-Adviser, the Board took into account that the Sub-Advisory Agreement would not affect how the Fund is managed or the Fund’s investment goal, principal investment strategies or principal risks associated with an investment in the Fund. The Board reviewed and considered information regarding the nature, quality and extent of investment subadvisory services to be provided by the Sub-Adviser to the Fund and its shareholders under the Sub-Advisory Agreement; the Sub-Adviser’s experience as manager of other funds and accounts, including those within the FT organization; the personnel, operations, financial condition, and investment management capabilities, methodologies and resources of the Sub-Adviser and the Sub-Adviser’s capabilities, as demonstrated by, among other things, its policies and procedures designed to prevent violations of the federal securities laws, which had previously been approved by the Board in connection with its oversight of other funds in the FT organization.
The Board also reviewed and considered the benefits provided to Fund shareholders of investing in a fund that is part of the FT family of funds. The Board noted the financial position of FRI, the parent of the Manager and Sub-Adviser, and its commitment to the mutual fund business as evidenced by its continued introduction of new funds, reassessment of the fund offerings in response to the market environment and project initiatives and capital investments relating to the services provided to the Fund by the FT organization. The Board specifically noted FT’s commitment to enhancing services and controlling costs, as reflected in its plan to outsource certain administrative functions, and growth opportunities, as evidenced by its upcoming acquisition of the Legg Mason companies. The Board acknowledged the change in leadership at FRI and the opportunity to hear from Jennifer Johnson, President and Chief Executive Officer of FRI, about goals she has for the company that will benefit the Fund.
Following consideration of such information, the Board was satisfied with the nature, extent and quality of services to be provided by the Sub-Adviser and its affiliates to the Fund and its shareholders.
Fund Performance
The Board noted its review and consideration of the performance results of the Fund in connection with the April
FRANKLIN TEMPLETON VARIABLE INSURANCE PRODUCTS TRUST
SHAREHOLDER INFORMATION
2020 annual contract renewal (Annual Contract Renewal) of the Fund’s investment management agreement. The Board recalled its conclusion at that time that the Fund’s performance was satisfactory. The Board also noted the proposed portfolio management team enhancements for the Fund, and determined that, in light of these changes, additional time will be needed to evaluate the effectiveness of management’s actions.
Comparative Fees and Expenses
The Board reviewed and considered information regarding the investment subadvisory fee to be charged by the Sub-Adviser. The Board noted that the addition of the Sub-Adviser will have no impact on the amount of management fees that are currently paid by the Fund as the Sub-Adviser will be paid by the Manager out of the management fee that the Manager receives from the Fund. The Board further noted that the allocation of the fee between the Manager and the Sub-Adviser reflected the services to be provided by each. The Board concluded that the proposed investment subadvisory fee is reasonable.
Management Profitability and Economies of Scale
The Board noted that it reviewed and considered information showing the expected impact of retaining the Sub-Adviser on the profitability of the Manager consistent with the conditions of the Order. The Board determined that its conclusions regarding profitability and economies of scale reached in connection with the Annual Contract Renewal of the investment management agreement with the Manager had not changed as a result of the proposal to approve the Sub-Advisory Agreement.
Conclusion
Based on its review, consideration and evaluation of all factors it believed relevant, including the above-described factors and conclusions, the Board unanimously approved the Sub-Advisory Agreement for an initial two-year period.
Liquidity Risk Management Program
The Funds have adopted and implemented a written Liquidity Risk Management Program (the “LRMP”) as required by Rule 22e-4 under the Investment Company Act of 1940. The program is designed to assess and manage each Fund’s liquidity risk, taking into consideration the Fund’s investment strategy and the liquidity of its portfolio investments during normal and reasonably foreseeable stressed conditions; its short and long-term cash flow projections; and its cash holdings and access to other
funding sources including the Funds’ interfund lending facility and line of credit. The Funds’ Board of Trustees approved the appointment of the Director of Liquidity Risk within the Investment Risk Management Group (the “IRMG”) as the Administrator of the LRMP. The IRMG maintains the Investment Liquidity Committee (the “ILC”) to provide oversight and administration of policies and procedures governing liquidity risk management for FT products and portfolios. The ILC includes representatives from Franklin Templeton’s Risk, Trading, Global Compliance, Investment Compliance, Investment Operations, Valuation Committee and Product Management groups.
The LRMP Administrator Annual Report was presented to the Fund(s) Board of Trustees at their meetings in May 2020. The report covered the adequacy and effectiveness of the program during the period December 1, 2018 to December 31, 2019 (the “covered period”). The report concluded that (i.) the LRMP, as adopted and implemented, remains reasonably designed to assess and manage each Fund’s liquidity risk; (ii.) the LRMP, including the Highly Liquid Investment Minimum (“HLIM”) where applicable, was implemented and operated effectively to achieve the goal of assessing and managing each Fund’s liquidity risk; and (iii.) each fund was able to meet requests for redemption without significant dilution of remaining investors’ interests in the Fund. In addition, the LRMP Administrator presented the Fund Board of Trustees an update on liquidity during the first quarter of 2020 in relation to the COVID-19 pandemic.
During the reporting period, the Fund maintained a high level of liquid assets that are defined under the Liquidity Rule as “Highly Liquid Investments.” As a result, the Fund was designated a “Primarily Highly Liquid Fund” as defined under the Liquidity Rule and has not adopted a “Highly Liquid Investment Minimum.” A Highly Liquid Investment is defined as cash and any investment reasonably expected to be convertible to cash in current market conditions in three business days or less without the conversion to cash significantly changing the market value of the investment.
There can be no assurance that the program will achieve its objectives in the future. Please refer to your Fund’s prospectus for more information regarding the Fund’s exposure to liquidity risk and other principal risks to which an investment in the Fund may be subject.
FRANKLIN TEMPLETON VARIABLE INSURANCE PRODUCTS TRUST
SHAREHOLDER INFORMATION
Proxy Voting Policies and Procedures
The Trust’s investment manager has established Proxy Voting Policies and Procedures (Policies) that the Trust uses to determine how to vote proxies relating to portfolio securities. Shareholders may view the Trust’s complete Policies online at franklintempleton.com. Alternatively, shareholders may request copies of the Policies free of charge by calling the Proxy Group collect at (954) 527-7678 or by sending a written request to: Franklin Templeton Companies, LLC, 300 S.E. 2nd Street, Fort Lauderdale, FL 33301, Attention: Proxy Group. Copies of the Trust’s proxy voting records are also made available online at franklintempleton.com and posted on the U.S. Securities and Exchange Commission’s website at sec.gov and reflect the most recent 12-month period ended June 30.
Quarterly Statement of Investments
The Trust files a complete statement of investments with the U.S. Securities and Exchange Commission for the first and third quarters for each fiscal year as an exhibit to its report on Form N-PORT. Shareholders may view the filed Form N-PORT by visiting the Commission’s website at sec.gov. The filed form may also be viewed and copied at the Commission’s Public Reference Room in Washington, DC. Information regarding the operations of the Public Reference Room may be obtained by calling (800) SEC-0330.
This page intentionally left blank.
Franklin Templeton Variable Insurance Products Trust (FTVIP) shares are not offered to the public; they are offered and sold only to: (1) insurance company separate accounts (Separate Account) to serve as the underlying investment vehicle for variable contracts; (2) certain qualified plans; and (3) other mutual funds (funds of funds).
Authorized for distribution to investors in Separate Accounts only when accompanied or preceded by the current prospectus for the applicable contract, which includes the Separate Account and the FTVIP prospectuses. Investors should carefully consider a fund’s investment goals, risks, charges and expenses before investing. The prospectus contains this and other information; please read it carefully before investing.
To help ensure we provide you with quality service, all calls to and from our service areas are monitored and/or recorded.
| | | | | | |
| | | | | | | |
 | | Semiannual Report |
| | Franklin Templeton Variable Insurance Products Trust |
| | Investment Manager | | Fund Administrator | | Distributor |
| | Franklin Advisers, Inc. | | Franklin Templeton Services, LLC | | Franklin Templeton Distributors, Inc. |
| | |
| © 2020 Franklin Templeton Investments. All rights reserved. | | VIP5 S 08/20 |
| (a) | The Registrant has adopted a code of ethics that applies to its principal executive officers and principal financial and accounting officer. |
| (f) | Pursuant to Item 13(a)(1), the Registrant is attaching as an exhibit a copy of its code of ethics that applies to its principal executive officers and principal financial and accounting officer. |
| Item 3. | Audit Committee Financial Expert. |
| (a) (1) | The Registrant has an audit committee financial expert serving on its audit committee. |
| (2) | The audit committee financial expert is Mary C. Choksi and she is “independent” as defined under the relevant Securities and Exchange Commission Rules and Releases. |
| Item 4. | Principal Accountant Fees and Services. N/A |
| Item 5. | Audit Committee of Listed Registrants. N/A |
| Item 6. | Schedule of Investments. N/A |
| Item 7. | Disclosure of Proxy Voting Policies and Procedures for Closed-End Management Investment Companies. N/A |
| Item 8. | Portfolio Managers of Closed-End Management Investment Companies. N/A |
| Item 9. | Purchases of Equity Securities by Closed-End Management Investment Company and Affiliated Purchasers. N/A |
| Item 10. | Submission of Matters to a Vote of Security Holders. |
There have been no changes to the procedures by which shareholders may recommend nominees to the Registrant’s Board of Trustees that would require disclosure herein.
| Item 11. | Controls and Procedures. |
(a) Evaluation of Disclosure Controls and Procedures. The Registrant maintains disclosure controls and procedures that are designed to
provide reasonable assurance that information required to be disclosed in the Registrant’s filings under the Securities Exchange Act of 1934, as amended, and the Investment Company Act of 1940 is recorded, processed, summarized and reported within the periods specified in the rules and forms of the Securities and Exchange Commission. Such information is accumulated and communicated to the Registrant’s management, including its principal executive officer and principal financial officer, as appropriate, to allow timely decisions regarding required disclosure. The Registrant’s management, including the principal executive officer and the principal financial officer, recognizes that any set of controls and procedures, no matter how well designed and operated, can provide only reasonable assurance of achieving the desired control objectives.
Within 90 days prior to the filing date of this Shareholder Report on Form N-CSR, the Registrant had carried out an evaluation, under the supervision and with the participation of the Registrant’s management, including the Registrant’s principal executive officer and the Registrant’s principal financial officer, of the effectiveness of the design and operation of the Registrant’s disclosure controls and procedures. Based on such evaluation, the Registrant’s principal executive officer and principal financial officer concluded that the Registrant’s disclosure controls and procedures are effective.
(b) Changes in Internal Controls. There have been no changes in the Registrant’s internal control over financial reporting that occurred during the period covered by this report that has materially affected, or is reasonably likely to materially affect the internal control over financial reporting.
| Item 12. | Disclosure of Securities Lending Activities for Closed-End Management Investment Company. N/A |
(a)(1) Code of Ethics
(a)(2) Certifications pursuant to Section 302 of the Sarbanes-Oxley Act of 2002 of Matthew T. Hinkle, Chief Executive Officer - Finance and Administration, and Gaston Gardey, Chief Financial Officer and Chief Accounting Officer
(b) Certifications pursuant to Section 906 of the Sarbanes-Oxley Act of 2002 of Matthew T. Hinkle, Chief Executive Officer - Finance and Administration, and Gaston Gardey, Chief Financial Officer and Chief Accounting Officer
SIGNATURES
Pursuant to the requirements of the Securities Exchange Act of 1934 and the Investment Company Act of 1940, the registrant has duly caused this report to be signed on its behalf by the undersigned, thereunto duly authorized.
Franklin Templeton Variable Insurance Products Trust
| | | | |
| By | | S\MATTHEW T. HINKLE |
| | Matthew T. Hinkle |
| | Chief Executive Officer – Finance and Administration |
Date August 25, 2020
Pursuant to the requirements of the Securities Exchange Act of 1934 and the Investment Company Act of 1940, this report has been signed below by the following persons on behalf of the registrant and in the capacities and on the dates indicated.
| | |
| By | | S\MATTHEW T. HINKLE |
| | Matthew T. Hinkle |
| | Chief Executive Officer – Finance and Administration |
Date August 25, 2020
| | |
| By | | S\GASTON GARDEY |
| | Gaston Gardey |
| | Chief Financial Officer and Chief Accounting Officer |
Date August 25, 2020