[ING FUNDS LOGO]
August 9, 2007
VIA ELECTRONIC MAIL AND EDGAR
Ms. Alison White
U.S. Securities and Exchange Commission
100 F Street, NE
Washington, D.C. 20549
Re: |
| ING Investors Trust |
|
| (File Nos. 033-23512; 811-05629) |
Dear Ms. White:
This letter responds to comments provided to Robin Nesbitt and Jason Boblick on July 18, 2007 for Post-Effective Amendment No. 78 to the Registration Statement for ING Focus 5 Portfolio (the “Portfolio”), a new series of ING Investors Trust (“Registrant”). Our summaries of the comments and our responses thereto are provided below.
The discussion below focuses on the Adviser, Institutional (“Class I”) and Service Class Prospectuses and their related Statements of Additional Information (“SAI”). Where applicable, conforming changes were made to the Prospectuses and SAI of the various share classes. In addition, attached is the requested Tandy Letter (Attachment A), as well as the marked pages from the Portfolio’s Prospectuses and SAI, reflecting certain changes made in response to the comments.
GENERAL COMMENT
Supplement Dated August 20, 2007 – Other Regulatory Matters (pages 3-4)
1. Comment: The Staff requested additional information relating to the last sentence of the first paragraph. Specifically, the Staff request the identity of the affiliates of the Portfolio’s Investment Adviser, Directed Services, LLC (“DSL”), were named in a petition for relief and cease and desist order filed by the New Hampshire Bureau of Securities Regulation (the “NH Bureau”) concerning their administration of the New Hampshire state employees deferred compensation plan.
Response: With respect to the matter filed by the NH Bureau, the affiliates of DSL named in the petition were ING Life Insurance and Annuity Company and ING Financial Advisors, LLC.
2. Comment: The Staff also requested information relating to the proposed timing of the release of the One-Page Disclosure document that an affiliate of DSL’s agreed to provide in connection with a matter relating to the New York State United Teachers Union Member Benefits Trust.
Response: The One-Page Disclosure document will begin being delivered to new customers beginning on or about August 31, 2007, pending continuing discussions with regulators.
GENERAL COMMENT
Description of the Portfolio - Principal Investment Strategies (pages 3-6)
3. Comment: The Staff requested that disclosure be added relating to the market capitalization range of each index referenced in each of the individual strategies of the Portfolio.
Response: The requested disclosure has been added where applicable (Please refer to Attachment B).
GENERAL COMMENT
Description of the Portfolios - More on the Sub-Adviser (pages 5- 6)
4. Comment: The Staff commented that any discussion of the Sub-Advisers should not immediately follow the Principal Risks Summary for the Portfolio and requested that Sub-Adviser discussions be moved to the back of the Prospectus.
Response: The format of the registration for the Portfolio is consistent with other registration statements under the Registrant and at this time the Registrant believes that it would be an extremely cumbersome and expensive undertaking to change the current historical format. The Registrant would like to keep the current format and requests the option to address this issue at a later time.
CLASS I PROSPECTUS
Annual Portfolio Operating Expenses (page 7)
5. Comment: The Staff requested that the column in the Annual Portfolio Operating Expenses table titled “Distribution (12b-1) Fees” be removed since Class I shares are not subject to 12b-1 fees.
Response: The Registrant has reviewed other registration statements within the ING complex and has confirmed that the inclusion of the column titled “12b-1 Fees” has been included in other registration statements. For purposes of consistency across the registration statements under the Registrant as well as the ING complex, we respectfully decline the Staffs request.
GENERAL COMMENT
More Information – How ING Compensates Entities Offering Its Portfolios as Investment Options in their Insurance Products (page 12)
6. Comment: The Staff asked that the Registrant explain how the disclosure contained in the last sentence of the first paragraph is appropriate in light of Section 17(e) of the Investment Company Act of 1940, as amended.
Response: Section 17(e)(1) prohibits a first- or second-tier affiliate of an investment company, acting as agent, from accepting any compensation for the purchase or sale of property to or from an investment company, except in the course of such person’s business as an underwriter or broker. As an initial matter, we believe that the restrictions imposed by Section 17(e)(1) are not relevant to all insurance companies offering Variable Contracts, because many insurance companies should not necessarily be deemed first- or second-tier affiliates as contemplated under Section 17(e)(1). Even with respect to an affiliated insurance company, we believe that the payments discussed above are consistent with the payment methods under existing structures endorsed by the SEC, and that Section 17(e)(1) of the 1940 Act is not implicated.
Section 17(e)(1)’s prohibition applies to receipt of compensation in the recipient’s capacity as “agent .. . . for the purchase or sale of any property to or for” a registered investment company. The insurance company recipient of the Portfolio’s 12b-1 proceeds or revenue sharing payments will not act as “agent” in connection with the purchases of underlying fund shares. Furthermore, the insurance company will receive payments in exchange for the provision of bona fide services, which would not be deemed to be “property” for purposes of Section 17(e)(1). See, e.g., Steadman Sec. Corp., Investment Company Act Rel. No. 9830 (June 29, 1977) (commercial banks sell services, not property, to their demand depositors); and Norwest Bank Minnesota, N.A. (pub. avail. May 25, 1995) (administrative and recordkeeping services should not be characterized as “property”). Also, the insurance company does not receive the payment “for” the purchase or sale of property to or for an investment company, which is the subject matter addressed by Section 17(e)(1). See, e.g., Decker v. Securities and Exchange Commission, 631 F.2d 1380, 1384-85 (10th Cir. 1980) (“In order to prove a violation of [Section] 17(e)(1), the Enforcement Division must show that some form of compensation was received in exchange for the purchase or sale of investment company property . . . .”). Furthermore, for more than ten years, it has generally been accepted in the industry that the SEC staff has accepted this interpretation of Section 17(e)(1). See Plans Adopted Under Rule 12b-1 of the Investment Company Act of 1940 (pub. avail. May 30, 1996) (The SEC staff noted that insurance companies can receive 12b-1 payments from underlying funds and that no provision of the 1940 Act prohibits the insurer’s receipt of these payments in connection with investments in underlying funds and distribution of variable insurance contracts).
ADDITIONAL NOTICE
The Registrant wishes to notify the Staff that some minor changes have been made to the disclosure for the Portfolio, including: (1) the investment strategy of the Portfolio has been updated to expand on the disclosure relating to situations where the Sub-Adviser may make changes to the Portfolio’s holdings outside of the annual Portfolio Construction Date, as defined in the Prospectus (Please see Attachment C); (2) the risk disclosures have been update to reflect the Portfolio’s ability to engage in securities lending and to invest in derivatives (Please see Attachment D); and (3) the presentation relating to the hypothetical performance has been rearranged and updated (Please see Attachment E).
* * * *
Should you have any questions or comments regarding this letter, please contact the undersigned at 480-477-2649.
Very truly yours,
/s/ Paul A. Caldarelli |
|
| |
Paul A. Caldarelli | |
Counsel | |
ING U.S. Legal Services | |
Attachments
cc: |
| Huey P. Falgout, Jr., Esq. |
|
| ING Investments, LLC |
|
|
|
|
| Jeffrey S. Puretz, Esq. |
|
| Dechert LLP |
Attachment A
August 9, 2007
VIA ELECTRONIC MAIL AND EDGAR
Ms. Alison White
Division of Investment Management
U.S. Securities and Exchange Commission
100 F Street, NE
Washington, D.C. 20549
RE: |
| ING Investors Trust |
|
| (File Nos. 033-23512; 811-05629) |
Dear Ms. White:
ING Investors Trust (“Registrant”) is responsible for the adequacy and accuracy of the disclosure in this filing. Further, the Registrant recognizes that the Staff’s comments, or changes to disclosure in response to the Staff’s comments, do not foreclose the Securities and Exchange Commission (“SEC”) from taking any action with respect to the filing. Lastly, if, to our knowledge, an inquiry or investigation is currently pending or threatened by the SEC and if the SEC subsequently, in order to protect its investigative position, so requests, the Registrant will not assert Staff comments with respect to the inquiry or investigation as a defense in any proceeding initiated by the SEC or any person under the federal securities laws of the United States. This representation should not be construed as confirming that there is, or is not, in fact, any inquiry or investigation currently pending or threatened.
Please direct any questions or additional comments you may have concerning this letter to the undersigned at 480.477.2666. Thank you.
Regards,
/s/ Huey P. Falgout, Jr. |
|
| |
Huey P. Falgout, Jr. | |
Chief Counsel | |
ING U.S. Legal Services | |
Attachments
cc: |
| Jeffrey Puretz, Esq. |
|
| Dechert LLP |
Attachment B
Attachment B
Description of the Portfolio (continued)
The Portfolio expects to invest in the securities determined by each of the strategies with an approximately equal amount initially invested pursuant to each strategy.
The Portfolio may engage in active trading of portfolio securities annually to achieve its investment objective.
The securities which comprise the above strategies are selected as follows:
The U.S. LargeCap Market 10 Strategy
The U.S. LargeCap Market 10 Strategy invests approximately equal amounts in the common stocks of 10 companies selected from the Standard & Poor’s® Composite Stock Price 500 Index (“S&P 500® Index”). At June 30, 2007, the smallest company in the S&P 500® Index had a market capitalization of $1.7 billion and the largest company had a market capitalization of $472.5 billion. These companies are selected using the following process:
· the 250 companies with the largest market capitalizations as of the last business day prior to the Portfolio Construction Date in the S&P 500® Index are chosen and ranked by price-to-sales ratios;
· from the selected companies, the 125 companies with the lowest price-to-sales ratios as of the last business day prior to the Portfolio Construction Date are then ranked by share price appreciation in the last year; and
· from those companies, the common stocks of the 10 companies with the greatest share price appreciation over the prior year are purchased.
The U.S. LargeCap Market 10 Strategy is not expected to track the performance of the S&P 500® Index.
The U.S. Blue-Chip 10 Strategy
The U.S. Blue-Chip 10 Strategy invests approximately equal amounts in the common stocks of 10 companies selected from the Dow Jones Industrial Average (“DJIA”) with the highest dividend yield over the prior year.
The U.S. Blue-Chip 10 Strategy is not expected to reflect the entire DJIA nor track the performance of the DJIA.
The International Blue-Chip 75 Strategy
The International Blue-Chip 75 Strategy invests approximately equal amounts in the common stocks of 75 companies selected from the Morgan Stanley Capital International Europe, Australasia and Far East Index (“MSCI EAFE Index”). At June 30, 2007, the smallest company in the MSCI EAFE Index had a market capitalization of $679 million and the largest company had a market capitalization of $231.5 billion. These companies are selected using the following process:
· the 500 companies with the largest market capitalizations (excluding all financial and utility companies in the MSCI EAFE Index as of the last day prior to the Portfolio Construction Date are chosen and ranked by dividend yield over the prior year;
· from the selected companies, the 200 companies with the highest dividend yield over the prior year are retained; and
· from those companies, the common stocks of the 75 companies with the lowest dividend yield over the prior year are purchased.
The International Blue-Chip 75 Strategy is not expected to track the performance of the MSCI EAFE Index.
The Small Cap 40 Strategy
The Small Cap 40 Strategy invests in the common stocks of 40 companies selected from the New York Stock Exchange (“NYSE”), the American Stock Exchange (“AMEX”) and the NASDAQ Stock Market (“NASDAQ”). These companies are selected using the following process:
· companies with market capitalizations between $150 million and $1 billion as of the last day prior to the Portfolio Construction Date are selected from the NYSE, AMEX and NASDAQ;
· limited partnerships, American Depositary Receipts (“ADRs”) of foreign companies, mineral trusts, oil royalty trusts and companies whose shares have appreciated in price more than 75% in the last year are excluded;
4
Attachment C
Attachment C
Description of the Portfolio
ING FOCUS 5 PORTFOLIO
Sub-Adviser
ING Investment Management Co. (“ING IM”)
Investment Objective
Total return through capital appreciation and dividend income. The Portfolio’s investment objective is not fundamental and may be changed without a shareholder vote.
Principal Investment Strategies
ING Focus 5 Portfolio seeks to achieve its investment objective by investing in the common stocks of companies that are identified through 5 distinct strategies:
· the U.S. LargeCap Market 10 Strategy;
· the U.S. Blue-Chip 10 Strategy;
· the International Blue-Chip 75 Strategy;
· the Small Cap 40 Strategy; and
· the 25 Fund Strategy.
Each of these strategies involves investment approaches that are based on formulas as described below. The Sub-Adviser follows those formulas in determining which securities to buy, retain, and sell. The formulas are objective and the Portfolio is different from many other mutual funds in that the Sub-Adviser does not apply subjective judgment in stock selection, retention, and sale decisions.
The combination of the five strategies is intended to seek total return through a portfolio that is highly diversified in many respects:
· in providing exposure to both U.S. and foreign issuers,
· in providing exposure to both large- and small-capitalization stocks,
· in providing exposure to stocks that exhibit growth and value style characteristics or a combination of those characteristics, and
· in providing exposure to stocks selected on the basis of their recent dividends and to stocks selected without regard to their dividend history.
The common stocks are selected through each of these strategies only once annually on each Portfolio Construction Date. The initial Portfolio Construction Date will be on or about August 20, 2007. Thereafter, the Portfolio Construction Date will be on or about the first business day after January 1 of each year. Common stocks will be bought or sold in accordance with the strategies within 5 days before or after the Portfolio Construction Date, which is referred to as the Trading Period. During the rest of the year, the Sub-Adviser will not make changes in the Portfolio’s holdings except for extraordinary events such as a merger, acquisition, or bankruptcy. Under such circumstances, the Sub-Advisor will allocate the proceeds from the sale of common stock affected by an extraordinary event to a company in the same industry sector as the common stock being sold (the “Replacement Stock”). The Sub-Advisor will select this Replacement Stock from a list of companies derived from the strategy that originally identified the common stock being sold on the same day that the affected common stock is sold.
Throughout the year the Sub-Adviser may also trade to invest cash inflows to the Portfolio and for dividend reinvestment. Purchases and sales of common stocks made at times other than during the Trading Period will generally be made in approximately the same proportion that stocks are then held by the Portfolio (or, in the case of dividend reinvestment, in the same proportion that stocks are held pursuant to the strategy that generated the dividends).
To effectively manage cash inflows and outflows, the Portfolio may maintain a cash position, which normally will not exceed 5% of net assets. This 5% limitation may also include the use of derivatives. The Portfolio may invest in other investment companies to the extent permitted under the Investment Company Act of 1940, as amended (the “1940 Act”), and the rules and regulations thereunder.
3
Attachment D
Attachment D
Description of the Portfolio (continued)
· from the remaining universe of companies, those companies with daily trading volumes of at least $500,000, companies with positive sales growth in each of the last 3 years and companies with positive earnings in the last year are retained; and
· from the selected companies, the common stock of the 40 companies with the greatest share price appreciation in the last year are purchased in proportion to each company’s market capitalization.
The Small Cap 40 Strategy is not expected to track the performance of the NYSE, AMEX or NASDAQ.
The 25 Fund Strategy
The 25 Fund Strategy invests approximately equal amounts in the common stocks of 25 companies selected from the NYSE. These companies are selected using the following process:
· all companies (excluding financial, transportation and utility companies, limited partnerships and ADRs of foreign companies) that pay dividends and are traded on the NYSE are ranked by capitalization;
· from the selected companies, the 400 companies with the largest market capitalizations as of the last day prior to the Portfolio Construction Date are ranked by dividend yield;
· of those companies, the 75 companies with the highest dividend yield over the prior year are retained; and
· from the remaining universe of companies, the common stock of the 25 companies with the lowest dividend yields over the prior year are purchased.
The 25 Fund Strategy is not expected to track the performance of the NYSE.
Principal Risks
As with any mutual fund, you could lose money on your investment in the Portfolio. The share price of the Portfolio normally changes daily based on changes in the value of the securities that the Portfolio holds. The investment strategies that the Sub-Adviser uses may not produce the intended results. The principal risks of investing in the Portfolio and the circumstances reasonably likely to cause the value of your investment in the Portfolio to decline are listed below.
Currency Risk
Derivatives Risk
Equity Securities Risk
Foreign Investment Risk
Growth Investing Risk
Investment Strategy Risk
Investment Models Risk
Limited Management Risk
Liquidity Risk
Market and Company Risk
Market Capitalization Risk
Portfolio Turnover Risk
Price Volatility Risk
Securities Lending Risk
Small-Capitalization Company Risk
Value Investing Risk
Please see “Summary of Principal Risks” following the “Description of the Portfolio” section for a description of these risks. There may be other risks that are not listed above that could cause the value of your investment in the Portfolio to decline and that could prevent the Portfolio from achieving its stated investment objective. This Prospectus does not describe all of the risks of every technique, investment strategy or temporary defensive position that the Portfolio may use. For additional information regarding the risks of investing in the Portfolio, please refer to the Statement of Additional Information (“SAI”).
Performance
Since the Portfolio has not commenced operations as of the date of this Prospectus, annual performance information is not provided.
5
Summary of Principal Risks
The value of your investment in the Portfolio changes with the value of the Portfolio’s investments. Many factors can affect those values. The factors that are most likely to have a material effect on the Portfolio’s investment portfolio as a whole are called “principal risks.” The principal risks of the Portfolio are identified in the “Description of the Portfolio” section and are described below. The Portfolio may be subject to additional principal risks and risks other than those described below because the types of investments made by the Portfolio can change over time.
Currency Risk. Because the Portfolio may invest directly in foreign currencies or in securities denominated in or that trade in foreign (non-U.S.) currencies it is subject to the risk that those currencies will decline in value relative to the U.S. dollar, or, in the case of hedging positions, that the U.S. dollar will decline in value relative to the currency being hedged.
Currency rates may fluctuate significantly over short periods of time. Currency rates may be affected by changes in interest rates, intervention (or the failure to intervene) by U.S. or foreign governments, central banks or supranational entities such as the International Monetary Fund, or by the imposition of currency controls, or other political or economic developments in the U.S. or abroad. As a result, the Portfolio’s investments in foreign currency-denominated securities may reduce the value of the Portfolio’s assets.
Derivatives Risk. The Portfolio may use futures, options, swaps and other derivative instruments to hedge or protect the Portfolio from adverse movements in underlying securities prices and interest rates or as an investment strategy to help attain the Portfolio’s investment objective. The Portfolio may also use a variety of currency hedging techniques, including foreign currency contracts, to attempt to hedge exchange rate risk or to gain exposure to a particular currency. The Portfolio’s use of derivatives could reduce returns, may not be liquid, and may not correlate precisely to the underlying securities or index. Derivative securities are subject to market risk, which could be significant for those derivatives that have a leveraging effect that could increase the volatility of the Portfolio and may reduce returns for the Portfolio. Derivatives are also subject to credit risks related to the counterparty’s ability to perform, and any deterioration in the counterparty’s creditworthiness could adversely affect the instrument. A risk of using derivatives is that the Sub-Adviser might imperfectly judge the market’s direction, which could render a hedging strategy ineffective or have an adverse effect on the value of the derivative.
Equity Securities Risk. Equity securities include common, preferred and convertible preferred stocks and securities with values that are tied to the price of the stocks, such as rights, warrants and convertible debt securities. Common and preferred stocks represent equity ownership in a company. Stock markets are volatile. The price of equity securities will fluctuate and can decline and reduce the value of an investment in equities. The price of equity securities fluctuates based on changes in a company’s financial condition and overall market condition and economic conditions. The value of equity securities purchased by the Portfolio could decline if the financial condition of the companies decline or if overall market and economic conditions deteriorate. Even investment in high quality or “blue chip” equity securities or securities of established companies with large market capitalizations (which generally have strong financial characteristics) can be negatively impacted by poor overall market and economic conditions. Companies with large market capitalizations may also have less growth potential than smaller companies and may be able to react less quickly to change in the marketplace.
Foreign Investment Risk. Foreign investments may be riskier than U.S. investments for many reasons, including changes in currency exchange rates; unstable political, social, and economic conditions; possible security illiquidity: a lack of adequate or accurate company information; differences in the way securities markets operate; less secure foreign banks or securities depositaries than those in the U.S.; less standardization of accounting standards and market regulations in certain foreign countries; foreign taxation issues; and varying foreign controls on investments. Foreign investments may also be affected by administrative difficulties, such as delays in clearing and settling transactions. In addition, securities of foreign companies may be denominated in foreign currencies and the costs of buying, selling and holding foreign securities, including brokerage, tax and custody costs, may be higher than those involved in domestic transactions. American Depositary Receipts (“ADRs”), European Depositary Receipts (“EDRs”) and Global Depositary Receipts (“GDRs”) are subject to risks of foreign investments, and they may not always track the price of the underlying foreign security. These factors may make foreign investments more volatile and potentially less liquid than U.S. investments.
Growth Investing Risk. Growth-oriented stocks typically sell at relatively high valuations as compared to other types of securities. Securities of growth companies may be more volatile than other stocks because they are more sensitive to investor perceptions of the issuing company’s growth potential, they usually invest a high portion of earnings in their business, and they may lack the dividends of value stocks that can cushion stock prices in a falling
8
Summary of Principal Risks (continued)
Portfolio Turnover Risk. The Portfolio will typically sell and purchase all of its investments once a year which may result in a high portfolio turnover rate. A high portfolio turnover rate generally involves greater expenses, including brokerage commissions and other transactional costs, which may have an adverse impact on performance.
Price Volatility Risk. The value of the Portfolio changes as the prices of its investments go up or down. Equity and debt securities face market, issuer, and other risks, and their values may fluctuate, sometimes rapidly and unpredictably. Market risk is the risk that securities may decline in value due to factors affecting the securities markets generally or particular industries. Issuer risk is the risk that the value of a security may decline for reasons relating to the issuer, such as changes in the financial condition of the issuer. While equities may offer the potential for greater long-term growth than most debt securities, they generally have higher volatility.
Securities Lending Risk. A Portfolio may lend securities to financial institutions that provide cash or securities issued or guaranteed by the U.S. government as collateral. Securities lending involves the risk that the borrower may fail to return the securities in a timely manner or at all. As a result, a Portfolio may lose money and there may be a delay in recovering the loaned securities. A Portfolio could also lose money if it does not recover the securities and/or the value of the collateral falls, including the value of investments made with cash collateral. These events could trigger adverse tax consequences to the Portfolio. Engaging in securities lending could have a leveraging effect, which may intensify the market risk, credit risk and other risks associated with investments in the Portfolio. When a Portfolio lends its securities, it is responsible for investing the cash collateral it receives from the borrower of the securities, and the Portfolio could incur losses in connection with the investment of such cash collateral.
Small-Capitalization Company Risk. Investment in securities of small companies may entail greater risk than investments in larger, more established companies. Smaller companies may have limited product lines and market diversification or fewer financial resources, and may be dependent on a few key managers. Their securities may trade less frequently and in more limited volume than the securities of larger companies. Consequently, the prices of small company stocks tend to rise and fall in value more than other stocks, and/or may be less liquid. When selling a large quantity of a particular stock, the Portfolio may have to sell at a discount from quoted prices or may have to make a series of small sales over an extended period of time due to the more limited trading volume of smaller company stocks. Although investing in small companies offers potential for above-average returns, the companies may not succeed, and the value of stock shares could decline significantly. Securities of smaller companies tend to be more volatile and less liquid than stocks of larger companies.
Value Investing Risk. The Portfolio may invest in “value” stocks. The Sub-Adviser may be wrong in its assessment of a company’s value and the stocks the Portfolio holds may not reach what the Sub-Adviser believes are their full values. A particular risk of the Portfolio’s value approach is that some holdings may not recover and provide the capital growth anticipated or a stock judged to be undervalued may actually be appropriately priced. Further, because the prices of value-oriented securities tend to correlate more closely with economic cycles than growth-oriented securities, they generally are more sensitive to changing economic conditions, such as changes in interest rates, corporate earnings, and industrial production. The market may not favor value-oriented stocks and may not favor equities at all. During these periods, the Portfolio’s relative performance may suffer.
10
Attachment E
Attachment E
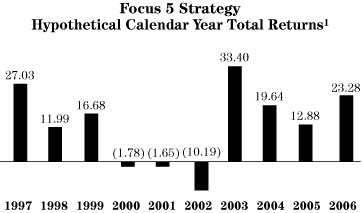
Returns for a Hypothetical Portfolio
The following bar chart and table provide the hypothetical, computer-generated results for a model portfolio constructed by retroactively applying the various quantitative strategies used by the ING Focus 5 Portfolio (the “Portfolio”) to the periods prior to the inception dates of the Portfolio. Also presented for comparison purposes is the performance of the Standard & Poor’s 500® Composite Stock Price Index (“S&P 500® Index”).
The hypothetical returns shown below are not indicative of future performance. The hypothetical returns shown below do indicate the significant variation in returns in relation to the S&P 500® Index, over a period of years. In fact, the hypothetical portfolio may have under-performed the S&P 500® Index in certain years.
THE BELOW DATA IS HYPOTHETICAL AND IS NOT A REFLECTION OF ACTUAL TRADING. NO REPRESENTATION IS MADE THAT SIMILAR RESULTS COULD HAVE BEEN OBTAINED BY ACTUAL TRADING OF A PORTFOLIO OF SECURITIES.
Hypothetical Average Annual Total Returns for Period Ending December 31, 2006
|
| One Year |
| Three Year |
| Five Year |
| Ten Year |
|
ING Focus 5 Portfolio(1) |
| 23.28 |
| 18.52 |
| 14.81 |
| 14.40 |
|
S&P 500® Index(2) |
| 15.79 |
| 10.44 |
| 6.19 |
| 8.42 |
|
Note: The treatment of dividends in the hypothetical rate of return calculations is such that they are reinvested in the stock that paid them at the end of the month in which the stock went ex-dividend. In managing the portfolios, all cash flows (including both net sales and dividends when they are received) will be reinvested proportionately into all of the stocks in the portfolio.
The returns for the hypothetical portfolios above and below do not represent the actual performance of the Portfolio or the underlying strategies, are designed merely to show the mathematical basis for the strategy and are not intended to predict or project the performance of the investment strategy. Please note that the Indices do not reflect any deduction for fees, expenses or taxes and would be lower if they did. Similarly, while the hypothetical performance information does take into consideration portfolio operating expenses, as estimated in the annual Portfolio operating expense table in this prospectus, it does not take into consideration any sales charges, commissions, insurance fees or charges imposed on the sale of the Portfolio shares, nor taxes. The results for the hypothetical portfolio also do not reflect portfolio transaction costs, which may be material. Any of such charges will lower the returns shown. The tables also show how hypothetical data varies from year to year. Please note that return data was generated mechanically and should not be considered a reflection of the Sub-Adviser’s skills.
The hypothetical information for the Portfolio relies on certain assumptions:
· That each investment strategy was fully invested as of the beginning of each year and that each Portfolio Construction Date was the first business day of the year.
(1) The hypothetical total return shown does not take into consideration any sales charges, commissions, portfolio trading costs or taxes. The historical information reflects the expenses charged each year and the hypothetical information reflects the expenses charged at the rates currently in effect. The hypothetical returns, net of Portfolio expenses, are computed monthly. Total return assumes that all dividends are reinvested.
(2) The S&P 500® Index is an unmanaged index that measures the performance of securities of approximately 500 of the largest companies in the United States.
18
Returns for a Hypothetical Portfolio (continued)
· That the asset level for each model portfolio remained static, with no inflows or outflows.
· That all dividends are reinvested in the stock that paid the dividend at the end of the month in which the stock went ex-dividend.
· In preparing the hypothetical data, the Sub-Adviser made various assumptions about how the strategies would have been implemented historically. The Sub-Adviser’s intent was to faithfully replicate the historical performance of the strategies; however, there can be no assurances that the hypothetical data shown could have been achieved with actual trading or that other assumptions would have produced identical results.
· The hypothetical portfolios were not subject to the requirements of the Investment Company Act or the Internal Revenue Code, including diversification requirements thereunder.
Furthermore, actual performance will always differ from (and typically be less than) the hypothetical information provided for a number of reasons, including the following:
· The hypothetical data do not reflect that the Portfolio may maintain a cash position of up to 5% of its assets to effectively manage cash inflows and outflows. The results would be different if the cash positions were reflected.
· The hypothetical data do not reflect the effects of cash flows in and out of the Portfolio; in practice, all cash flows (including both net sales and dividends when they are received) will be reinvested proportionately into all of the stocks in the portfolio.
· An investment strategy may not become fully invested until five business days into a calendar year.
· The hypothetical data do not reflect fees, commissions, certain expenses and taxes. Actual performance may be materially lower after such fees, commissions, expenses and taxes are deducted.
· The hypothetical data shown below do not represent the results of actual trading of a portfolio of securities and may not reflect the impact that any material market or economic factors might have had if the investment strategies had been used.
· The actual strategies used by the Portfolio may need to be adjusted in response to regulatory changes.
The information provided below has been stated in U.S. dollars and therefore has been adjusted to reflect currency exchange rate fluctuations.
Performance information has been compiled from various sources believed to be accurate. However, such information has not been audited.
19
Returns for a Hypothetical Portfolio (continued)
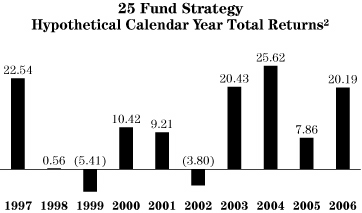
25 Fund Strategy
The following bar chart and table provide the hypothetical, computer-generated results for a model portfolio constructed by retroactively applying the quantitative 25 Fund Strategy used by the Portfolio to the periods prior to the inception dates of the Portfolio. Also presented for comparison purposes is the performance of the S&P 500® Index.
The hypothetical returns shown below are not indicative of future performance. The hypothetical returns shown below do indicate the significant variation in returns in relation to the S&P 500® Index, over a period of years. In fact, the hypothetical portfolio may have under-performed the S&P 500® Index in certain years.
THE BELOW DATA IS HYPOTHETICAL AND IS NOT A REFLECTION OF ACTUAL TRADING. NO REPRESENTATION IS MADE THAT SIMILAR RESULTS COULD HAVE BEEN OBTAINED BY ACTUAL TRADING OF A PORTFOLIO OF SECURITIES.
Hypothetical Average Annual Total Returns for Period Ending December 31, 2006
|
| One Year |
| Three Year |
| Five Year |
| Ten Year |
|
25 Fund Strategy(1) |
| 20.19 |
| 17.65 |
| 13.54 |
| 12.18 |
|
S&P 500® Index(2) |
| 15.79 |
| 10.44 |
| 6.19 |
| 8.42 |
|
Note: The treatment of dividends in the hypothetical rate of return calculations is such that they are reinvested in the stock that paid them at the end of the month in which the stock went ex-dividend. In managing the portfolios, all cash flows (including both net sales and dividends when they are received) will be reinvested proportionately into all of the stocks in the portfolio.
(1) The hypothetical total return shown does not take into consideration any sales charges, commissions, portfolio trading costs or taxes. The historical information reflects the expenses charged each year and the hypothetical information reflects the expenses charged at the rates currently in effect. The hypothetical returns, net of Fund expenses, are computed monthly. Total return assumes that all dividends are reinvested.
(2) The S&P 500® Index is an unmanaged index that measures the performance of securities of approximately 500 of the largest companies in the United States.
20
Returns for a Hypothetical Portfolio (continued)
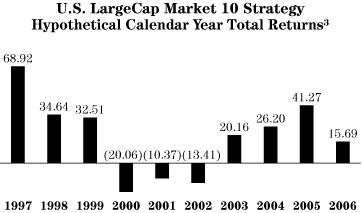
U.S. LargeCap Market 10 Strategy
The following bar chart and table provides the hypothetical, computer-generated results for a model portfolio constructed by retroactively applying the quantitative U.S. LargeCap Market 10 Strategy used by the Portfolio to the periods prior to the inception dates of the Portfolio. Also presented for comparison purposes is the performance of the S&P 500® Index.
The hypothetical returns shown below are not indicative of future performance. The hypothetical returns shown below do indicate the significant variation in returns in relation to the S&P 500® Index, over a period of years. In fact, the hypothetical portfolio may have under-performed the S&P 500® Index in certain years.
THE BELOW DATA IS HYPOTHETICAL AND IS NOT A REFLECTION OF ACTUAL TRADING. NO REPRESENTATION IS MADE THAT SIMILAR RESULTS COULD HAVE BEEN OBTAINED BY ACTUAL TRADING OF A PORTFOLIO OF SECURITIES.
Hypothetical Average Annual Total Returns for Period Ending December 31, 2006
|
| One Year |
| Three Year |
| Five Year |
| Ten Year |
|
U.S. LargeCap Market 10 Strategy(1) |
| 15.69 |
| 27.29 |
| 16.50 |
| 20.38 |
|
S&P 500® Index(2) |
| 15.78 |
| 10.44 |
| 6.19 |
| 8.42 |
|
Note: The treatment of dividends in the hypothetical rate of return calculations is such that they are reinvested in the stock that paid them at the end of the month in which the stock went ex-dividend. In managing the portfolios, all cash flows (including both net sales and dividends when they are received) will be reinvested proportionately into all of the stocks in the portfolio.
(1) The hypothetical total return shown does not take into consideration any sales charges, commissions, portfolio trading costs or taxes. The historical information reflects the expenses charged each year and the hypothetical information reflects the expenses charged at the rates currently in effect. The hypothetical returns, net of Portfolio expenses, are computed monthly. Total return assumes that all dividends are reinvested
(2) The S&P 500® Index is an unmanaged index that measures the performance of securities of approximately 500 of the largest companies in the United States.
21
Returns for a Hypothetical Portfolio (continued)
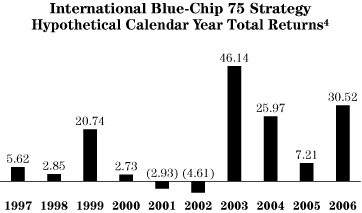
International Blue-Chip 75 Strategy
The following bar chart and table provides the hypothetical, computer-generated results for a model portfolio constructed by retroactively applying the quantitative International Blue-Chip 75 Strategy used by the Portfolio to the periods prior to the inception dates of the Portfolio. Also presented for comparison purposes is the performance of the Morgan Stanley Capital International — Europe, Australasia and Far East® Index (“MSCI EAFE® Index”).
The hypothetical returns shown below are not indicative of future performance. The hypothetical returns shown below do indicate the significant variation in returns in relation to the MSCI EAFE® Index, over a period of years. In fact, the hypothetical portfolio may have under-performed the MSCI EAFE® Index in certain years.
THE BELOW DATA IS HYPOTHETICAL AND IS NOT A REFLECTION OF ACTUAL TRADING. NO REPRESENTATION IS MADE THAT SIMILAR RESULTS COULD HAVE BEEN OBTAINED BY ACTUAL TRADING OF A PORTFOLIO OF SECURITIES.
Hypothetical Average Annual Total Returns for Period Ending December 31, 2006
|
| One Year |
| Three Year |
| Five Year |
| Ten Year |
|
International Blue-Chip 75 Strategy(1) |
| 30.52 |
| 20.80 |
| 19.70 |
| 12.44 |
|
MSCI EAFE Index(2) |
| 26.34 |
| 19.93 |
| 14.98 |
| 17.71 |
|
Note: The treatment of dividends in the hypothetical rate of return calculations is such that they are reinvested in the stock that paid them at the end of the month in which the stock went ex-dividend. In managing the portfolios, all cash flows (including both net sales and dividends when they are received) will be reinvested proportionately into all of the stocks in the portfolio.
(1) The hypothetical total return shown does not take into consideration any sales charges, commissions, portfolio trading costs or taxes. The historical information reflects the expenses charged each year and the hypothetical information reflects the expenses charged at the rates currently in effect. The hypothetical returns, net of Portfolio expenses, are computed monthly. Total return assumes that all dividends are reinvested.
(2) The MSCI EAFE® Index is an unmanaged index that measures the performance of securities listed on exchanges in markets in Europe, Australasia and the Far East. It includes the reinvestment of dividends and distributions net of withholding taxes, but does not reflect fees, brokerage commissions or other expenses of investing.
22
Returns for a Hypothetical Portfolio (continued)
Small Cap 40 Strategy
The following bar chart and table provides the hypothetical, computer-generated results for a model portfolio constructed by retroactively applying the quantitative Small Cap 40 Strategy used by the Portfolio to the periods prior to the inception dates of the Portfolio. Also presented for comparison purposes is the performance of the Standard & Poor’s SmallCap 600 Index (“S&P SmallCap 600 Index”).
The hypothetical returns shown below are not indicative of future performance. The hypothetical returns shown below do indicate the significant variation in returns in relation to the S&P SmallCap 600 Index, over a period of years. In fact, the hypothetical portfolio may have under-performed the S&P SmallCap 600 Index in certain years.
THE BELOW DATA IS HYPOTHETICAL AND IS NOT A REFLECTION OF ACTUAL TRADING. NO REPRESENTATION IS MADE THAT SIMILAR RESULTS COULD HAVE BEEN OBTAINED BY ACTUAL TRADING OF A PORTFOLIO OF SECURITIES.

Hypothetical Average Annual Total Returns for Period Ending December 31, 2006
|
| One Year |
| Three Year |
| Five Year |
| Ten Year |
|
Small Cap 40 Strategy(1) |
| 16.84 |
| 17.13 |
| 15.78 |
| 15.54 |
|
S&P SmallCap 600 Index(2) |
| 15.12 |
| 14.99 |
| 12.49 |
| 11.57 |
|
Note: The treatment of dividends in the hypothetical rate of return calculations is such that they are reinvested in the stock that paid them at the end of the month in which the stock went ex-dividend. In managing the portfolios, all cash flows (including both net sales and dividends when they are received) will be reinvested proportionately into all of the stocks in the portfolio.
(1) The hypothetical total return shown does not take into consideration any sales charges, commissions, portfolio trading costs or taxes. The historical information reflects the expenses charged each year and the hypothetical information reflects the expenses charged at the rates currently in effect. The hypothetical returns, net of Portfolio expenses, are computed monthly. Total return assumes that all dividends are reinvested.
(2) The S&P SmallCap 600 Index is an unmanaged index used to measure stock market performance composed of companies with a weighted average market value of approximately $630 million.
23
Returns for a Hypothetical Portfolio (continued)
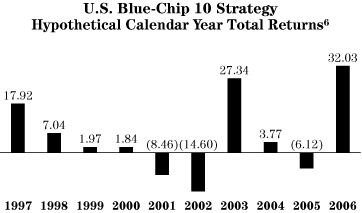
U.S. Blue-Chip 10 Strategy
The following bar chart and table provides the hypothetical, computer-generated results for a model portfolio constructed by retroactively applying the quantitative U.S. Blue-Chip 10 Strategy used by the Portfolio to the periods prior to the inception dates of the Portfolio. Also presented for comparison purposes is the performance of the Dow Jones Industrial Average (“DJIA”).
The hypothetical returns shown below are not indicative of future performance. The hypothetical returns shown below do indicate the significant variation in returns in relation to the DJIA, over a period of years. In fact, the hypothetical portfolio may have under-performed the DJIA in certain years.
THE BELOW DATA IS HYPOTHETICAL AND IS NOT A REFLECTION OF ACTUAL TRADING. NO REPRESENTATION IS MADE THAT SIMILAR RESULTS COULD HAVE BEEN OBTAINED BY ACTUAL TRADING OF A PORTFOLIO OF SECURITIES.
Hypothetical Average Annual Total Returns for Period Ending December 31, 2006
|
| One Year |
| Three Year |
| Five Year |
| Ten Year |
|
U.S. Blue-Chip 10 Strategy(1) |
| 32.03 |
| 8.75 |
| 6.94 |
| 7.59 |
|
DJIA(2) |
| 19.05 |
| 8.04 |
| 6.81 |
| 8.92 |
|
Note: The treatment of dividends in the hypothetical rate of return calculations is such that they are reinvested in the stock that paid them at the end of the month in which the stock went ex-dividend. In managing the portfolios, all cash flows (including both net sales and dividends when they are received) will be reinvested proportionately into all of the stocks in the portfolio.
(1) The hypothetical total return shown does not take into consideration any sales charges, commissions, portfolio trading costs or taxes. The historical information reflects the expenses charged each year and the hypothetical information reflects the expenses charged at the rates currently in effect. The hypothetical returns, net of Portfolio expenses, are computed monthly. Total return assumes that all dividends are reinvested.
(2) The DJIA measures the stock performance of thirty leading blue-chip U.S. companies.
24