August 28, 2007
VIA EDGAR
Ms. Allison White
Division of Investment Management
U.S. Securities and Exchange Commission
100 F Street, N.E.
Washington, D.C. 20549
Re: |
| ING Investors Trust (on behalf of ING VP Index Plus International Equity Portfolio) |
|
| (File Nos. 333-144939; 811-05629) |
Dear Ms. White:
This letter responds to comments that you provided to Christopher C. Okoroegbe via telephone conversation on August 10, 2007, in connection with your review of the Registration Statement filed on Form N-14 on behalf of ING VP Index Plus International Equity Portfolio (the “Acquiring Portfolio”), a series of ING Investors Trust (the “Registrant”), on July 28, 2007. The comments, and the Registrant’s responses, are as follows:
I. GENERAL PROXY STATEMENT/PROSPECTUS COMMENTS
1) Comment: Please explain why the Proxy Statement/Prospectus omits information relating to the ADV Class and Class S2 shares of both ING VP International Equity Portfolio (the “Target Portfolio”) and the Acquiring Portfolio.
Response: The Proxy Statement/Prospectus omits information relating to the ADV Class shares of both the Target and Acquiring Portfolios because both Portfolios had no ADV Class shareholders as of the Record Date. Furthermore, the ADV Class of the Target Portfolio is not offered for sale and was closed to new investors prior to the Record Date.
The Proxy Statement/Prospectus omits information relating to Class S2 shares of both Portfolios because the Target Portfolio does not offer Class S2 shares.
Since the Target Portfolio only has Class I and Class S shareholders who will receive corresponding shares of the Acquiring Portfolio, the Proxy Statement/Prospectus only addresses those two classes.
2) Comment: In the Introduction section on page 1, provide the file numbers for the Annual and Semi-Annual Reports which are incorporated by reference.
Response: The Proxy Statement/Prospectus has been revised to include the file numbers. A marked page reflecting the change is attached as Exhibit A.
1
3) Comment: Disclose within the 2nd bullet point on page 4 that the increased transaction costs will be borne by the shareholders.
Response: The required disclosure has been provided. A marked page reflecting the change is attached as Exhibit B.
4) Comment: Present the fee information on page 4 in the manner required pursuant to Item 3 of Form N-1A.
Response: Pursuant to Item 3(a) of Form N-14, the Registrant has provided a detailed discussion and comparison of the fees and expenses of the Portfolios under the section “Comparison of Fees and Expenses,” which complies with Item 3(a) of Form N-14 as well as Item 3 of Form N-1A.
Item 3(b) of Form N-14 requires the Registrant at the beginning of the Proxy Statement/Prospectus to provide a synopsis of the information contained in the Proxy Statement/Prospectus. Form N-14 requires the Registrant to provide in the synopsis a clear and concise discussion of the key features of the transaction, of the Registrant and of the company being acquired. This clear and concise discussion may include any “significant consideration” a shareholder should consider in evaluating the Reorganization. See Item 3(b)(4).
In addition to comparing, among other things, the size, portfolio management, performance, and the investment objectives and strategies of the Target Portfolio and the Acquiring Portfolio and as required by Item 3(b) of Form N-14, the Registrant also provides a side-by-side comparison summary (in addition to the information provided pursuant to Item 3(a) of Form
N-14) of the gross and net expenses for both Portfolios and the combined Portfolio before and after the Reorganization. We believe that a comparison of expenses before and after the Reorganization should be included in any summary discussion of the key features of the Reorganization, the Acquiring Portfolio and the Target Portfolio since a comparison of expenses borne by shareholders before and after the Reorganization is a significant consideration in assisting shareholders in making an informed decision about the Reorganization.
We also note that the purpose of Form N-14 is to provide essential information about the Registrant and the Reorganization in a clear, concise and understandable manner to assist investors in making informed decisions about whether to purchase the securities being offered. The organization of this Proxy Statement/Prospectus is consistent with those that have been filed by the Registrant as well as other ING registrants in the past and, we believe, is consistent with the overall purpose of Form
N-14.
5) Comment: In the 2nd bullet point on page 5 discussing expense waivers, clarify the date on which the waiver will expire.
Response: The required disclosure has been provided. A marked page reflecting the change is attached as Exhibit C.
2
6) Comment: Provide the discussion of risks before the performance information. The risk factors should immediately follow the synopsis.
Response: The order of presentation has been changed. Marked pages reflecting the change are attached as Exhibit D.
7) Comment: Please revise the risk section to include Price Volatility and Emerging Markets risk as risks of the Acquiring Portfolio.
Response: The Registrant believes that both Price Volatility and Emerging Markets are not principal risks of the Acquiring Portfolio.
Price Volatility Risk is the risk of price volatility of equity and debt securities. The Acquiring Portfolio invests at least 80% of its assets in stocks included in the MSCI EAFE® Index, and therefore is not subject to a principal risk of price volatility of debt securities. The Acquiring Portfolio is subject to Equity Securities Risk, which is the risk of price volatility of equity securities, and this risk has already been described in the Proxy Statement/Prospectus.
Emerging Markets Risk is the risk of investing in less developed markets and economies. The Acquiring Portfolio invests at least 80% of its assets in stocks included in the MSCI EAFE® Index which, according to MSCI Barra, the index creator, is an index representing “developed markets outside of North America.” Therefore, the Registrant believes that Emerging Markets Risk is not a principal risk of the Acquiring Portfolio.
8) Comment: Shareholder transaction fees on page 16 should be changed from “none” to “N/A.”
Response: The disclosure has been revised. A marked page reflecting the change is attached as Exhibit E.
9) Comment: Identify what footnote 3 references within the table on page 18.
Response: The disclosure has been revised to clarify the reference. A marked page reflecting the change is attached as Exhibit F.
10) Comment: The fee table of the Acquiring Portfolio includes acquired fund fees in the prospectus. Explain why acquired fund fees are not included in the Proxy Statement/Prospectus’s fee table on page 18.
Response: The fee table has been revised to include a line item for acquired fund fees.Marked pages reflecting the change are attached as Exhibit G.
11) Comment: In the Expense Example on page 19, include a footnote stating that the example for the combined entity reflects the inclusion of the expense waiver for the one year and three year period and for the first four years of the five and ten year periods.
Response: The disclosure has been revised. A marked page reflecting the change is attached as Exhibit H.
12) Comment: In the 1st bullet point on page 22, clarify the date on which the expense waiver will expire.
Response: The disclosure has been revised. A marked page reflecting the change is attached as Exhibit I.
13) Comment: Update pages B-1 and B-2 of Appendix B with the information sharing requirements per rule 22c-2.
Response: The Registrant believes that it is in compliance with Rule 22c-2 and any necessary disclosure changes will be made on or about October 16, 2007 (final compliance date for Rule 22c-2).
3
14) Comment: Per rule 483(b) of the Securities Act of 1933, file Powers of Attorney that relate specifically to the Registration Statement and not simply the Registrant.
Response: Rule 483(b) provides that the “power of attorney that is filed with the Commission shall relate to a specific filing, an amendment thereto, or a related registration statement . . ..” The Registrant’s Powers of Attorney relate to all Registration Statements filed with the Securities and Exchange Commission under the Securities Act and the Investment Company Act, and each amendment thereto. The Board signs the Powers of Attorney each year in connection with the annual update process. The Powers of Attorney provide the Registrant’s Securities Act file number. The Powers of Attorney relate to the Registrant’s Form N-14 filed on July 27, 2007 and each amendment thereto, and accordingly is consistent with Rule 483(b).
II. STATEMENT OF ADDITIONAL INFORMATION
15) Comment: Provide the file numbers of the documents incorporated by reference on the cover page of the Statement of Additional Information (“SAI”).
Response: The disclosure has been revised to include the file numbers. A marked page reflecting the change is attached as Exhibit J.
16) Comment: Mark the Pro-Forma Statement of Assets and Liabilities as unaudited.
Response: The disclosure has been revised. A marked page reflecting the change is attached as Exhibit K.
17) Comment: Pro-Forma Statement of Assets and Liabilities – Reverse identifiers (A) and (B) in the class level section.
Response: The disclosure has been revised. A marked page reflecting the change is attached as Exhibit L.
18) Comment: Mark the Pro-Forma Statement of Operations as unaudited.
Response: The disclosure has been revised. A marked page reflecting the change is attached as Exhibit M.
19) Comment: Identify the securities of the Target Portfolio, which will be liquidated if the Reorganization is approved by shareholders.
Response: The disclosure has been revised to identify the securities that will be liquidated if the Reorganization is approved. Marked pages reflecting the revision are attached as Exhibit N.
4
III. MISCELLANEOUS
20) Comment: Please provide the required Tandy letter along with your response.
Response: The requested representation letter is attached.
* * *
We hope you find our changes to these materials to be responsive. If you have any additional questions, please do not hesitate to contact me at 480-477-2278.
Sincerely,
/s/ Christopher C. Okoroegbe |
|
|
| |
Christopher C. Okoroegbe |
|
| ||
|
|
| ||
Attachments | ||||
cc: | Jeffrey S. Puretz Esq. |
| ||
| Dechert LLP |
| ||
5
[ING FUNDS LOGO]
August 28, 2007
Via EDGAR
Ms. Allison White, Esq.
Division of Investment Management
United States Securities and Exchange Commission
100 F Street, NE
Washington, D.C. 20549
Re: |
| ING Investors Trust (on behalf of ING VP Index Plus International Equity Portfolio) |
|
| (File Nos. 333-144939; 811-05629) |
Dear Ms. White:
The Registrant is responsible for the adequacy and accuracy of the disclosure in this filing. Further, the Registrant recognizes that the Staff’s comments, or changes to disclosure in response to the Staff’s comments, does not foreclose the Securities and Exchange Commission (“SEC”) from taking any action with respect to the filing. Lastly, if, to our knowledge, an inquiry or investigation is currently pending or threatened by the SEC and if the SEC subsequently, in order to protect its investigative position, so requests, the Registrant will not assert Staff comments with respect to the inquiry or investigation as a defense in any proceeding initiated by the SEC or any person under the federal securities laws of the United States. This representation should not be construed as confirming that there is, or is not, in fact, any inquiry or investigation currently pending or threatened.
Please direct any questions or additional comments you may have concerning this letter to the undersigned at 480-477-2666. Thank you.
Regards,
/s/ Huey P. Falgout |
| ||
Huey P. Falgout, Jr. | |||
Counsel | |||
ING U.S. Legal Services | |||
| |||
Attachments | |||
| |||
cc: |
| Jeffrey S. Puretz Esq. | |
|
| Dechert LLP | |
Exhibit A
PROXY STATEMENT/PROSPECTUS
ING VP INDEX PLUS INTERNATIONAL EQUITY PORTFOLIO
7337 East Doubletree Ranch Road
Scottsdale, Arizona 85258-2034
1-800-992-0180
September 10, 2007
INTRODUCTION
This combined proxy statement and prospectus (“Proxy Statement/Prospectus”) relates to a Special Meeting of shareholders of ING VP International Equity Portfolio (“VP International Equity Portfolio”) to be held on October 30, 2007. As more fully described in this Proxy Statement/Prospectus, the purpose of the Special Meeting is to vote on a proposed reorganization (“Reorganization”) of VP International Equity Portfolio with and into ING VP Index Plus International Equity Portfolio (“VP Index Plus International Equity Portfolio”) (each, a “Portfolio” and collectively, the “Portfolios”).
Shares of VP International Equity Portfolio are not offered directly to the public but are sold to separate accounts (“Separate Accounts”) of certain participating life insurance companies (“Participating Insurance Companies”) and are used to fund variable annuity and/or variable life contracts (each, a “Variable Contract” and collectively, “Variable Contracts”) and qualified pension and retirement plans (each, a “Qualified Plan”). Participants in a Qualified Plan (“Plan Participants”) or Variable Contract owners who select a Portfolio for investment through a Qualified Plan or Variable Contract, respectively, have a beneficial interest in the Portfolio, but do not invest directly in or hold shares of the Portfolio. The Qualified Plan or Participating Insurance Company that uses a Portfolio as a funding vehicle, is, in most cases, the true shareholder of the Portfolio and, as the legal owner of the Portfolio’s shares, has sole voting and investment power with respect to the shares, but generally will pass through any voting rights to Plan Participants and Variable Contract owners. As such and for ease of reference throughout the Proxy Statement/Prospectus, Plan Participants and Variable Contract holders will be referred to as “shareholders” of the Portfolios.
Under an Agreement and Plan of Reorganization (the “Reorganization Agreement”), VP International Equity Portfolio would transfer its assets to VP Index Plus International Equity Portfolio in exchange for shares of beneficial interest of VP Index Plus International Equity Portfolio and the assumption by VP Index Plus International Equity Portfolio of VP International Equity Portfolio’s known liabilities as of the Closing Date (as defined below). VP Index Plus International Equity Portfolio shares would then be distributed to shareholders of VP International Equity Portfolio so that each shareholder would receive a number of full and fractional shares of VP Index Plus International Equity Portfolio equal to the aggregate value of the number of shares of VP International Equity Portfolio held by such shareholder. As a result of the Reorganization, VP International Equity Portfolio will distribute shares of VP Index Plus International Equity Portfolio in liquidation of VP International Equity Portfolio on November 10, 2007, or such other date as the parties may agree (the “Closing Date”).
Because you, as a shareholder of VP International Equity Portfolio, are being asked to approve the Reorganization Agreement that will result in a transaction in which you will ultimately hold shares of VP Index Plus International Equity Portfolio, this Proxy Statement also serves as a Prospectus for VP Index Plus International Equity Portfolio. VP Index Plus International Equity Portfolio is a diversified, open-end management investment company, which seeks to outperform the total return performance of the Morgan Stanley Capital International Europe, Australasia and Far East Index (“MSCI EAFE® Index”), as described more fully below.
This Proxy Statement/Prospectus, which should be read and retained for future reference, sets forth concisely the information that a shareholder should know in considering the Reorganization. A Statement of Additional Information (“SAI”) relating to this Proxy Statement, dated September 10, 2007, containing additional information about the Reorganization and the parties thereto, has been filed with the U.S. Securities and Exchange Commission (the “SEC”) and is incorporated herein by reference. For a more detailed discussion of the investment objectives, strategies and restrictions of the Portfolios, see the Institutional Class (“Class I”) and Service Class (“Class S”) Prospectuses of VP International Equity Portfolio, each dated April 30, 2007, which are incorporated by reference (File No. 333-05173); and the Class I and Class S Prospectuses of VP Index Plus International Equity Portfolio, each dated April 30, 2007. VP International Equity Portfolio’s SAI, dated April 30, 2007 (File No. 333-05173) and VP Index Plus International Equity Portfolio’s SAI, dated April 30, 2007 (File No. 033-23512), are each incorporated herein by reference. Each Portfolio also provides periodic reports to its shareholders, which highlight certain important information about the Portfolios, including investment results
1
Exhibit B
· VP Index Plus International Equity Portfolio has experienced superior calendar year performance for the most recent calendar year, as well as superior total return performance for the year-to-date and one-year period ended May 31, 2007;
· The purchase and redemption of shares of each Portfolio may be made only by Separate Accounts of Participating Insurance Companies and by Plan Participants in a Qualified Plan; consequently, Variable Contract owners and Plan Participants should consult the underlying product prospectus or Qualified Plan documents, respectively, with respect to purchases, exchanges and redemption of shares;
· Each Portfolio is distributed by ING Funds Distributor, LLC (“IFD” or “Distributor”);
· Certain holdings of VP International Equity Portfolio that are to be transferred to VP Index Plus International Equity Portfolio in connection with the Reorganization will be sold prior to the Reorganization; such sales will result in increased transaction costs for VP International Equity Portfolio, which are ultimately borne by VP International Equity Portfolio’s shareholders, and will result in the realization of taxable gains or losses for VP International Equity Portfolio;
· Following the proposed Reorganization, the shareholders of VP International Equity Portfolio will pay a lower advisory fee to ING Investments (0.45% vs. 0.85%) after becoming shareholders of VP Index Plus International Equity Portfolio;
· The proposed Reorganization is expected to result in lower net operating expenses as a percentage of net assets for all classes of shares of VP International Equity Portfolio; and
· The Reorganization is intended to qualify for federal income tax purposes as a tax-free reorganization; accordingly, pursuant to this treatment, neither VP International Equity Portfolio nor its shareholders, nor VP Index Plus International Equity Portfolio nor its shareholders are expected to recognize any gain or loss for federal income tax purposes from the transactions contemplated by the Reorganization Agreement.
Prior to the Closing Date, VP International Equity Portfolio will pay insurance company separate accounts and Qualified Plans that own its shares, a cash distribution which is intended to distribute any undistributed investment company taxable income and any undistributed realized net capital gains, including any net gains realized from any sales of assets prior to the Closing Date.
The gross and net operating expenses before and after the Reorganization, expressed as an annual percentage of the average daily net asset value per share for shares of each Portfolio as of December 31, 2006 are as follows:
| Class I |
| Class S |
| |
Gross Expenses Before the Reorganization: |
|
|
|
|
|
VP International Equity Portfolio |
| 0.99 | % | 1.24 | % |
VP Index Plus International Equity Portfolio(1) |
| 0.64 | % | 0.89 | % |
| Class I |
| Class S |
| |
Net Expenses Before the Reorganization (After Fee Waiver) |
|
|
|
|
|
VP International Equity Portfolio |
| 0.99 | % | 1.24 | % |
VP Index Plus International Equity Portfolio(1) |
| 0.56 | % | 0.81 | % |
| Class I |
| Class S |
| |
After the Reorganization: VP Index Plus International Equity Portfolio Pro Forma |
|
|
|
|
|
Gross estimated expenses of VP Index Plus International Equity Portfolio |
| 0.64 | % | 0.89 | % |
Net estimated expenses of VP Index Plus International Equity Portfolio(1)(2) |
| 0.56 | % | 0.81 | % |
(1) ING Investments, LLC has entered into a written expense limitation agreement with each Portfolio under which it will limit expenses of the Portfolios, excluding interest, brokerage and extraordinary expenses (and acquired fund fees and expenses), subject to possible recoupment by ING Investments, LLC within three years. For each applicable Portfolio, the expense limits will continue through at least May 1, 2008. The expense limitation agreement is contractual and shall renew automatically for one-year terms unless ING Investments, LLC provides written notice of the termination of the expense limitation agreement within 90 days of the
4
Exhibit C
then-current term or upon termination of an investment management agreement. In addition, the expense limitation agreement may be terminated by the Company/Trust upon at least 90 days’ prior written notice to ING Investments, LLC.
(2) In connection with the Reorganization, pending shareholder approval, ING Investments, LLC will extend the expense limit for VP Index Plus International Equity Portfolio through May 1, 2011.
Approval of the Reorganization Agreement requires an affirmative vote of the lesser of (i) 67% or more of the shares, provided that more than 50% of the shares are present in person or represented by proxy at the Special Meeting, or (ii) a majority of the shares entitled to vote. The holders of a majority of outstanding shares present in person or by proxy shall constitute a quorum at any meeting of the shareholders.
AFTER CAREFUL CONSIDERATION, THE BOARD OF DIRECTORS (“BOARD”) OF VP INTERNATIONAL EQUITY PORTFOLIO UNANIMOUSLY APPROVED THE PROPOSED REORGANIZATION. THE BOARD RECOMMENDS THAT YOU VOTE “FOR” THE PROPOSED REORGANIZATION.
5
Exhibit D
Comparison of Investment Techniques and Principal Risks of Investing in the Portfolios
Because of the similarities in the investment objectives and strategies of the Portfolios, many of the risks of investing in VP Index Plus International Equity Portfolio are the same as the risks of investing in VP International Equity Portfolio. You may lose money on your investment in either Portfolio. The value of each Portfolio’s shares may go up or down, sometimes rapidly and unpredictably. Market conditions, financial conditions of issuers represented in the Portfolio, investment strategies, portfolio management, and other factors affect the volatility of each Portfolio’s shares. The following summarizes and compares the principal investment techniques and risks of investing in the Portfolios.
Convertible Securities Risk. Both Portfolios are subject to convertible securities risk. The value of convertible securities may fall when interest rates rise and increase as interest rates fall. Convertible securities with longer maturities tend to be more sensitive to changes in interest rates, usually making them more volatile than convertible securities with shorter maturities. Their value also tends to change whenever the market value of the underlying common or preferred stock fluctuates. A Portfolio could lose money if the issuer of a convertible security is unable to meet its financial obligations or goes bankrupt.
Derivatives Risk. Both Portfolios are subject to derivatives risk. The Portfolios may use futures, options, swaps and other derivative instruments to hedge or protect the Portfolio from adverse movements in underlying securities prices and interest rates or as an investment strategy to help attain the Portfolio’s investment objective. A Portfolio may also use a variety of currency hedging techniques, including foreign currency contracts, to attempt to hedge exchange rate risk or to gain exposure to a particular currency. A Portfolio’s use of derivatives could reduce returns, may not be liquid, and may not correlate precisely to the underlying securities or index. Derivative securities are subject to market risk, which could be significant for those derivatives that have a leveraging effect that could increase the volatility of the Portfolio and may reduce returns for the Portfolio. Derivatives are also subject to credit risks related to the counterparty’s ability to perform, and any deterioration in the counterparty’s creditworthiness could adversely affect the instrument. A risk of using derivatives is that each Portfolio’s sub-adviser might imperfectly judge the market’s direction, which could render a hedging strategy ineffective or have an adverse effect on the value of the derivatives.
Equity Securities Risk. Both Portfolios are subject to equity securities risk. Equity securities include common, preferred and convertible preferred stocks and securities with values that are tied to the price of stocks, such as rights, warrants and convertible debt securities. Common and preferred stocks represent equity ownership in a company. Stock markets are volatile. The price of equity securities will fluctuate and can decline and reduce the value of an investment in equities. The price of equity securities fluctuates based on changes in a company’s financial condition and overall market and economic conditions. The value of equity securities purchased by a Portfolio could decline if the financial condition of the companies declines or if overall market and economic conditions deteriorate. Even investment in high quality or “blue chip” equity securities or securities of established companies with large market capitalizations (which generally have strong financial characteristics) can be negatively impacted by poor overall market and economic conditions. Companies with large market capitalizations may also have less growth potential than smaller companies and may be able to react less quickly to change in the marketplace.
Foreign Investment Risk. Both Portfolios are subject to foreign investment risk. Foreign investments may be riskier than U.S. investments for many reasons, including changes in currency exchange rates; unstable political, social, and economic conditions; possible security illiquidity; a lack of adequate or accurate company information; differences in the way securities markets operate; less secure foreign banks or securities depositaries than those in the U.S.; less standardization of accounting standards and market regulations in certain foreign countries; foreign taxation issues; and varying foreign controls on investments. Foreign investments may also be affected by administrative difficulties, such as delays in clearing and settling transactions. In addition, securities of foreign companies may be denominated in foreign currencies and the costs of buying, selling and holding foreign securities, including brokerage, tax and custody costs, may be higher than those involved in domestic transactions. American Depositary Receipts (“ADRs”), European Depositary Receipts (“EDRs”) and Global Depositary Receipts (“GDRs”) are subject to risks of foreign investments, and they may not always track the price of the underlying foreign security. These factors may make foreign investments more volatile and potentially less liquid than U.S. investments.
Manager Risk. Both Portfolios are subject to manager risk. A Sub-Adviser will apply investment techniques and risk analyses in making investment decisions for a Portfolio, but there can be no assurance that these will achieve the Portfolio’s objective. A Sub-Adviser could do a poor job in executing an investment strategy. A Sub-Adviser may use the investment techniques or invest in securities that are not part of a Portfolio’s principal investment strategy. For example, if market conditions warrant, Portfolios that invest principally in equity securities may temporarily invest in U.S. government
9
securities, high-quality corporate fixed-income securities, mortgage-related and asset-backed securities or money market instruments. Likewise, Portfolios that invest principally in small- to medium-sized companies may shift to preferred stocks and larger-capitalization stocks. These shifts may alter the risk/return characteristics of the Portfolios and cause them to miss investment opportunities. Individuals primarily responsible for managing a Portfolio may leave their firm or be replaced.
Market Capitalization Risk. Both Portfolios are subject to market capitalization risk. Stocks fall into three broad market capitalization categories – large, medium and small. Investing primarily in one category carries the risk that, due to current market conditions, that category may be out of favor with investors. For example, if valuations of large-capitalization companies appear to be greatly out of proportion to the valuations of small- or medium-capitalization companies, investors may migrate to the stocks of small- and mid-sized companies causing a Portfolio that invests in these companies to increase in value more rapidly than a Portfolio that invests in larger, fully-valued companies. Investing in small- and medium-capitalization companies may be subject to special risks associated with narrower product lines, more limited financial resources, small management groups, and a more limited trading market for their stocks as compared with larger companies. As a result, stocks of small- and medium-capitalization companies may decline significantly in market downturns. In addition, the market capitalization of a small- or mid-sized company may change due to appreciation in the stock price so that it may no longer have the attributes of the capitalization category that was considered at the time of purchase.
Market Trends Risk. Both Portfolios are subject to market trends risk. Different types of stocks tend to shift into and out of favor with stock market investors depending on market and economic conditions. For example, from time to time, the stock market may not favor growth-oriented securities. Rather, the market could favor value-oriented securities or may not favor equity securities at all. Accordingly, the performance of a Portfolio may at times be better or worse than the performance of funds that focus on other types of stocks, or that have a broader investment style.
Other Investment Companies Risk. Both Portfolios are subject to other investment companies risk. The Portfolios may invest in other investment companies to the extent permitted by the 1940 Act and the rules and regulations thereunder. These may include exchange-traded funds (“ETFs”) and Holding Company Depositary Receipts (“HOLDRs”), among others. ETFs are exchange traded investment companies that are designed to provide investment results corresponding to an equity index and include, among others, Standard & Poor’s Depositary Receipts (“SPDRs”), PowerShares QQQTM (“QQQ”), Dow Jones Industrial Average Tracking Stocks (“Diamonds”) and iShares exchange-traded funds (“iShares”). The main risk of investing in other investment companies (including ETFs and HOLDRs) is that the value of the underlying securities held by the investment company might decrease. The value of the underlying securities can fluctuate in response to activities of individual companies or in response to general market and/or economic conditions. Because the Portfolios may invest in other investment companies, you will pay a proportionate share of the expenses of that other investment company (including management fees, administration fees and custodial fees) in addition to the expenses of the Portfolio. Additional risks of investments in ETFs include: (i) an active trading market for an ETF’s shares may not develop or be maintained or (ii) trading may be halted if the listing exchange’s officials deem such action appropriate, the shares are delisted from the exchange, or the activation of market-wide “circuit breakers” (which are tied to large decreases in stock prices) halts trading generally. Because HOLDRs concentrate in the stocks of a particular industry, trends in that industry may have a dramatic impact on their value.
Securities Lending Risk. Both Portfolios are subject to securities lending risk. A Portfolio may lend securities to financial institutions that provide cash or securities issued or guaranteed by the U.S. government as collateral. Securities lending involves the risk that the borrower may fail to return the securities in a timely manner or at all. As a result, a Portfolio may lose money and there may be a delay in recovering the loaned securities. A Portfolio could also lose money if it does not recover the securities and/or the value of the collateral falls, including the value of investments made with cash collateral. These events could trigger adverse tax consequences to the Portfolio. Engaging in securities lending could have a leveraging effect, which may intensify the market risk, credit risk and other risks associated with investments in the Portfolio. When a Portfolio lends its securities, it is responsible for investing the cash collateral it receives from the borrower of the securities, and the Portfolio could incur losses in connection with the investment of such cash collateral.
Price Volatility Risk. VP International Equity Portfolio is subject to price volatility risk. The value of the Portfolio changes as the prices of its investments go up or down. Equity securities face market, issuer and other risks and their values may fluctuate, sometimes rapidly and unpredictably. Market risk is the risk that securities may decline in value due to factors affecting the securities markets generally or particular industries. Issuer risk is the risk that the value of a security may decline for reasons relating to the issuer, such as changes in the financial condition of the issuer. While equities may offer the potential for greater long-term growth than most debt securities, they generally have higher volatility. The
10
Portfolio invests in securities of larger companies, which sometimes have more stable prices than smaller companies. However, the Portfolio may also invest in small- and mid-sized companies which may be more susceptible to greater price volatility than larger companies because they typically have fewer financial resources, more limited product and market diversification, and may be dependent on a few key managers.
Inability to Sell Securities Risk. VP Index Plus International Equity Portfolio is subject to inability to sell securities risk. Certain securities generally trade in lower volume and may be less liquid than securities of large established companies. These less liquid securities could include securities of small- and mid-sized U.S. companies, high-yield securities, convertible securities, unrated debt and convertible securities, securities that originate from small offerings, and foreign securities, particularly those from companies in countries with an emerging securities market. The Portfolio could lose money if it cannot sell a security at the time and price that would be most beneficial to the Portfolio.
Index Strategy Risk. VP Index Plus International Equity Portfolio is subject to index strategy risk. The Portfolio may use an indexing strategy that does not attempt to manage market volatility, use defensive strategies or reduce the effects of any long-term periods of poor stock performance. The correlation between the Portfolio and the index performance may be affected by the Portfolio’s expenses, and the timing of purchases and redemptions of the Portfolio’s shares.
Investment Models Risk. VP Index Plus International Equity Portfolio is subject to investment models risk. The proprietary model used by the Sub-Adviser to evaluate securities or securities markets is based on the Sub-Adviser’s understanding of the interplay of market factors and does not assure successful investment. The markets, or the price of individual securities, may be affected by factors not foreseen in developing the models.
Market and Company Risk. VP Index Plus International Equity Portfolio is subject to market and company risk. The price of a security held by the Portfolio may fall due to changing economic, political or market conditions or disappointing earnings or losses. Stock prices in general may decline over short or even extended periods. The stock market tends to be cyclical, with periods when stock prices generally rise and periods when stock prices generally decline. Further, even though the stock market is cyclical in nature, returns from a particular stock market segment in which the Portfolio invests may still trail returns from the overall stock market.
Portfolio Turnover Risk. VP Index Plus International Equity Portfolio is subject to portfolio turnover risk. Changes to the investments of the Portfolio may be made regardless of the length of time particular investments have been held. A high portfolio turnover rate generally involves greater expenses, including brokerage commissions and other transactional costs, which may have an adverse impact on performance. The portfolio turnover rate of the Portfolio will vary from year to year, as well as within a year.
Emerging Markets Investments. VP International Equity Portfolio is subject to the risk of emerging markets investments. Because of less developed markets and economies and, in some countries, less mature governments and governmental institutions, the risks of investing in foreign securities can be intensified in the case of investments in issuers domiciled or doing substantial business in countries with an emerging securities market. These risks include: high concentration of market capitalization and trading volume in a small number of issuers representing a limited number of industries, as well as a high concentration of investors and financial intermediaries; political and social uncertainties; over-dependence on exports, especially with respect to primary commodities, making these economies vulnerable to changes in commodity prices; overburdened infrastructure and obsolete or unseasoned financial systems; environmental problems; less well developed legal systems; and less reliable custodial services and settlement practices.
11
Comparison of Portfolio Performance
Set forth below is the performance information for each Portfolio. The bar charts and table below provide some indication of the risks of investing in each Portfolio by showing changes in the performance of each Portfolio’s Class I shares from year to year and by comparing each Portfolio’s performance to that of a broad measure of market performance for the same period. The bar charts show the performance of the Portfolios for each year since inception. The performance information does not include insurance-related charges which are, or may be imposed, under a Variable Contract or expenses related to a Qualified Plan. Any charges will reduce your return. Thus, you should not compare the Portfolios’ performance directly with the performance information of other products without taking into account all insurance-related charges and expenses payable under your Variable Contract or direct expenses of your Qualified Plan. Past performance is not necessarily an indication of how the Portfolios will perform in the future.
VP International Equity Portfolio
Calendar Year-by-Year Returns (1) (2) (3)
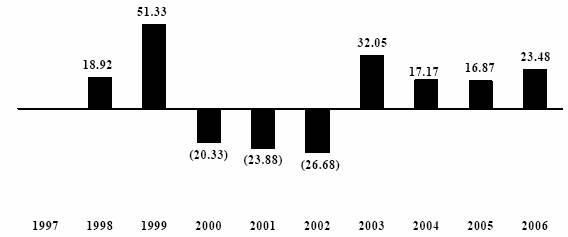
(1) |
| These figures are for the years ended December 31. They do not reflect expenses or charges which are, or may be, imposed under your Variable Contract or Qualified Plan, and would be lower if they did. |
|
|
|
(2) |
| During the period shown in the chart, the Portfolio’s Class I shares’ best quarterly performance was 31.30% for the 4th quarter of 1999, and the Portfolio’s Class I shares’ worst quarterly performance was (22.28)% for the 3rd quarter of 2002. |
|
|
|
(3) |
| Class I shares commenced operations on December 22, 1997. |
12
Exhibit E
If the Reorganization is approved by shareholders, the Adviser will pay the sub-advisory fee to IIMA, at the same fee rate currently in place.
Administration Fees
VP International Equity Portfolio pays an annual administration fee of 0.055% on the first $5 billion of its average daily nets assets and 0.03% thereafter. VP Index Plus International Equity Portfolio pays an annual administration fee of 0.10% of its average daily net assets. If shareholders approve the Reorganization, VP Index Plus International Equity Portfolio will pay an annual administration fee of 0.10% of the Portfolio’s average daily net assets.
Distribution and Service Fees
Each Portfolio pays the distribution (12b-1) and/or service fees as described in the table entitled “Annual Portfolio Operating Expenses” on page 18. Because these fees are paid out of the Portfolios’ assets on an ongoing basis over time these fees will increase the cost of your investment and may cost you more than paying other types of sales charges.
Expense Limitation Arrangements
ING Investments has entered into written expense limitation agreements with the Portfolios, under which it will limit the expenses of each Portfolio, excluding interest, taxes, brokerage and extraordinary expenses (and acquired fund fees and expenses), subject to possible recoupment by ING Investments within three years. Each Portfolio’s expense limitation will continue through at least May 1, 2008. There is no assurance that the expense limitation agreements will remain in effect after this date. The expense limitation agreements are contractual and shall renew automatically for one-year terms, unless ING Investments provides written notice of termination of each expense limitation agreement. Pursuant to the applicable expense limitation agreement, the expense limits for VP International Equity Portfolio are 1.15% and 1.40% for Class I shares and Class S shares, respectively. The expense limits for VP Index Plus International Equity Portfolio are 0.55% and 0.80% for Class I and Class S, respectively. The Board of Trustees of VP Index Plus International Equity Portfolio has approved extending the expense limitation agreement for VP Index Plus International Equity Portfolio if the Reorganization is approved by shareholders until May 1, 2011. There is no assurance that the expense limitation agreement for VP Index Plus International Equity Portfolio will remain in effect after this date.
Expense Tables
As shown in the table below, shares of the Portfolios are not subject to sales charges or shareholder transaction fees. The table below does not reflect surrender charges and other charges assessed by your Insurance Company under your Variable Contact or under your Qualified Plan.
Transaction Fees on New Investments
(fees paid directly from your investment)
| VP International Equity |
| VP Index Plus |
| |
|
|
|
|
|
|
Maximum sales charge (load) imposed on purchases (as a percentage of offering price) |
| N/A |
| N/A |
|
|
|
|
|
|
|
Maximum deferred sales charge (load) (as a percentage of the lower of original purchase price or redemption proceeds) |
| N/A |
| N/A |
|
Neither VP International Equity Portfolio nor VP Index Plus International Equity Portfolio has any redemption fees, exchange fees or sales charges on reinvested dividends.
16
Exhibit F
Annual Portfolio Operating Expenses
As of December 31, 2006 (1)
(expenses that are deducted from Portfolio assets, shown as a ratio of expenses to average daily net assets)
|
| Management |
| Distribution |
| Shareholder |
| Other |
| Acquired Fund |
| Total |
| Waivers, |
| Net |
|
CLASS I |
|
|
|
|
|
|
|
|
|
|
|
|
|
|
|
|
|
VP International Equity Portfolio |
| 0.85 | % | — |
| — |
| 0.14 | % | — |
| 0.99 | % | — |
| 0.99 | % |
VP Index Plus International Equity Portfolio |
| 0.45 | % | — |
| — |
| 0.18 | % | 0.01 | (4) | 0.64 | % | (0.08 | )% | 0.56 | % |
VP Index Plus International Equity Portfolio (Surviving Portfolio After Reorganization) (Estimated Pro Forma)(5) |
| 0.45 | % | — |
| — |
| 0.18 | % | 0.01 | (4) | 0.64 | % | (0.08 | )% | 0.56 | % |
CLASS S |
|
|
|
|
|
|
|
|
|
|
|
|
|
|
|
|
|
VP International Equity Portfolio |
| 0.85 | % | — |
| 0.25 | % | 0.14 | % | — |
| 1.24 | % | — |
| 1.24 | % |
VP Index Plus International Equity Portfolio |
| 0.45 | % | — |
| 0.25 | % | 0.18 | % | 0.01 | (4) | 0.89 | % | (0.08 | )% | 0.81 | % |
VP Index Plus International Equity Portfolio (Surviving Portfolio After Reorganization) (Estimated Pro Forma)(5) |
| 0.45 | % | — |
| 0.25 | % | 0.18 | % | 0.01 | (4) | 0.89 | % | (0.08 | )% | 0.81 | % |
(1) The fiscal year end for each Portfolio is December 31. This table shows the estimated operating expenses for shares of the Portfolios, as a ratio of expenses to average daily net assets. These ratios are based on each Portfolio’s actual operating expenses for year ended December 31, 2006, as adjusted for contractual changes and waivers, if any.
(2) The “Acquired Fund Fees and Expenses” are not fees or expenses incurred by the Portfolios directly. These fees and expenses include each Portfolio’s pro rata share of the cumulative expenses charged by the Acquired Funds in which the Portfolios invest. The fees and expenses will vary based on the Portfolio’s allocation of assets to, and the annualized net expenses of, the particular Acquired Funds. The Impact of these, fees and expenses is shown in “Net Expenses.”
(3) ING Investments, LLC has entered into a written expense limitation agreement with each Portfolio under which it will limit expenses of the Portfolios, excluding interest, brokerage and extraordinary expenses (and acquired fund fees and expenses), subject to possible recoupment by ING Investments, LLC within three years. For each Portfolio, the expense limits will continue through at least May 1, 2008. The expense limitation agreement is contractual and shall renew automatically for one-year terms unless ING Investments, LLC provides written notice of the termination of the expense limitation agreement within 90 days of the then-current term or upon termination of an investment management agreement. In addition, the expense limitation agreement may be terminated by the Company/Trust upon at least 90 days’ prior written notice to ING Investments, LLC.
(4) The “Total Portfolio Operating Expenses” shown may be higher than the Portfolio’s ratio of expenses to average net assets shown in the Financial Highlights, which reflect the operating expenses of the Portfolio and do not include acquired fund fees and expenses.
(5) In connection with the Reorganization, pending shareholder approval, ING Investments, LLC will extend the expense limit for VP Index Plus International Equity Portfolio through May 1, 2011.
18
Exhibit G
Annual Portfolio Operating Expenses
As of December 31, 2006 (1)
(expenses that are deducted from Portfolio assets, shown as a ratio of expenses to average daily net assets)
|
| Management |
| Distribution |
| Shareholder |
| Other |
| Acquired Fund |
| Total |
| Waivers, |
| Net |
|
CLASS I |
|
|
|
|
|
|
|
|
|
|
|
|
|
|
|
|
|
VP International Equity Portfolio |
| 0.85 | % | — |
| — |
| 0.14 | % | — |
| 0.99 | % | — |
| 0.99 | % |
VP Index Plus International Equity Portfolio |
| 0.45 | % | — |
| — |
| 0.18 | % | 0.01 | (4) | 0.64 | % | (0.08 | )% | 0.56 | % |
VP Index Plus International Equity Portfolio (Surviving Portfolio After Reorganization) (Estimated Pro Forma)(5) |
| 0.45 | % | — |
| — |
| 0.18 | % | 0.01 | (4) | 0.64 | % | (0.08 | )% | 0.56 | % |
CLASS S |
|
|
|
|
|
|
|
|
|
|
|
|
|
|
|
|
|
VP International Equity Portfolio |
| 0.85 | % | — |
| 0.25 | % | 0.14 | % | — |
| 1.24 | % | — |
| 1.24 | % |
VP Index Plus International Equity Portfolio |
| 0.45 | % | — |
| 0.25 | % | 0.18 | % | 0.01 | (4) | 0.89 | % | (0.08 | )% | 0.81 | % |
VP Index Plus International Equity Portfolio (Surviving Portfolio After Reorganization) (Estimated Pro Forma)(5) |
| 0.45 | % | — |
| 0.25 | % | 0.18 | % | 0.01 | (4) | 0.89 | % | (0.08 | )% | 0.81 | % |
(1) The fiscal year end for each Portfolio is December 31. This table shows the estimated operating expenses for shares of the Portfolios, as a ratio of expenses to average daily net assets. These ratios are based on each Portfolio’s actual operating expenses for year ended December 31, 2006, as adjusted for contractual changes and waivers, if any.
(2) The “Acquired Fund Fees and Expenses” are not fees or expenses incurred by the Portfolios directly. These fees and expenses include each Portfolio’s pro rata share of the cumulative expenses charged by the Acquired Funds in which the Portfolios invest. The fees and expenses will vary based on the Portfolio’s allocation of assets to, and the annualized net expenses of, the particular Acquired Funds. The Impact of these, fees and expenses is shown in “Net Expenses.”
(3) ING Investments, LLC has entered into a written expense limitation agreement with each Portfolio under which it will limit expenses of the Portfolios, excluding interest, brokerage and extraordinary expenses (and acquired fund fees and expenses), subject to possible recoupment by ING Investments, LLC within three years. For each Portfolio, the expense limits will continue through at least May 1, 2008. The expense limitation agreement is contractual and shall renew automatically for one-year terms unless ING Investments, LLC provides written notice of the termination of the expense limitation agreement within 90 days of the then-current term or upon termination of an investment management agreement. In addition, the expense limitation agreement may be terminated by the Company/Trust upon at least 90 days’ prior written notice to ING Investments, LLC.
(4) The “Total Portfolio Operating Expenses” shown may be higher than the Portfolio’s ratio of expenses to average net assets shown in the Financial Highlights, which reflect the operating expenses of the Portfolio and do not include acquired fund fees and expenses.
(5) In connection with the Reorganization, pending shareholder approval, ING Investments, LLC will extend the expense limit for VP Index Plus International Equity Portfolio through May 1, 2011.
18
Exhibit H
Examples. The following examples are intended to help you compare the cost of investing in each Portfolio and the combined Portfolio. The examples do not reflect expenses and charges which are, or may be, imposed under your Variable Contract or Qualified Plan. The examples assume that you invest $10,000 in each Portfolio and in the combined Portfolio after the Reorganization for the time periods indicated. The examples also assume that your investment has a 5% return each year and that each Portfolio’s operating expenses remain the same. The 5% return is an assumption and is not intended to portray past or future investment results. Based on the above assumptions, you would pay the following expenses if you redeem your shares at the end of each period shown. Your actual costs may be higher or lower.
| VP International Equity Portfolio |
| VP Index Plus International Equity |
| |||||||||||||||||||||
|
| 1 Year |
| 3 Years |
| 5 Years |
| 10 Years |
| 1 Year |
| 3 Years |
| 5 Years |
| 10 Years |
| ||||||||
Class I |
| $ | 101 |
| $ | 315 |
| $ | 547 |
| $ | 1,213 |
| $ | 57 |
| $ | 197 |
| $ | 349 |
| $ | 791 |
|
Class S |
| 126 |
| 393 |
| 681 |
| 1,500 |
| 83 |
| 276 |
| 485 |
| 1,089 |
| ||||||||
| Estimated VP Index Plus International |
| |||||||||||
|
| 1 Year |
| 3 Years |
| 5 Years |
| 10 Years |
| ||||
Class I |
| $ | 57 |
| $ | 179 |
| $ | 322 |
| $ | 765 |
|
Class S |
| 83 |
| 259 |
| 459 |
| 1,064 |
| ||||
* The examples reflect the contractual expense limits for the one-year period and the first year of the three-, five-, and ten-year periods.
** The examples reflect the inclusion of the expense waiver for the one-year and three-year period and for the first four years of the five- and ten-year periods.
(1) Estimated.
General Information
Certain holdings of VP International Equity Portfolio that are to be transferred to VP Index Plus International Equity Portfolio in connection with the Reorganization will be sold prior to the Reorganization. Such sales will result in increased transaction costs for VP International Equity Portfolio, and the realization of taxable gains or losses for VP International Equity Portfolio.
Key Differences in Rights of ING VP International Equity Portfolio’s Shareholders and ING VP Index Plus International Equity Portfolio’s Shareholders
VP International Equity Portfolio is organized as a separate series of ING Variable Portfolios, Inc., a Maryland corporation and is governed by its Articles of Incorporation and Bylaws. VP Index Plus International Equity Portfolio is organized as a separate series of ING Investors Trust, a Massachusetts business trust that is governed by a Declaration of Trust and Bylaws. Key differences under VP International Equity Portfolio’s Articles of Incorporation/Bylaws and VP Index Plus International Equity Portfolio’s Declaration of Trust/Bylaws are presented below.
VP International Equity Portfolio |
| VP Index Plus International Equity Portfolio |
|
|
|
Shareholders have the power to elect and remove Directors. Any or all of the Directors may be removed by the shareholders, who may elect a successor or successors to fill any resulting vacancy or vacancies for the unexpired term. The Corporation reserves the right from time to time to make any amendment to the Articles of Incorporation, except that no action affecting the validity or accessibility of such shares shall be taken without the unanimous approval of the outstanding shares affected thereby. |
| Shareholders have the power to amend the Declaration of Trust, but Trustees are also permitted to do so without a shareholder vote if they deem it necessary to conform the Declaration of Trust to Federal and state laws, to change the name of the Trust or make any other changes which do not materially adversely affect the rights of shareholders.
Shareholders also have the power to vote with respect to the election and removal of Trustees, the investment advisory contract, and the merger, consolidation and sale of assets of the Trust. |
|
|
|
The Board of Directors has the power to amend Bylaws. |
| The Trustees have the power to amend Bylaws. |
19
Exhibit I
superior performance for the most calendar recent year, as well as superior total return performance for the year-to-date and one-year period ended May 31, 2007;
· expense ratios and information regarding fees and total expenses of the Portfolios, including that the shareholders of VP International Equity Portfolio are expected to benefit from a lower expense ratio after the Reorganization and that, if the Reorganization is approved, ING Investments has agreed to a fee waiver/expense reimbursement for VP Index Plus International Equity Portfolio through May 1, 2011;
· the similarities and differences between investment objectives and strategies of VP Index Plus International Equity Portfolio and those of VP International Equity Portfolio;
· all expenses relating to the Reorganization (“Reorganization Expenses”) will be borne equally by ING Investments and VP International Equity Portfolio;
· that while commission costs in connection with the disposition and purchase of certain securities (“Transition Cots”) will be borne by VP International Equity Portfolio, the lower expense ratios are expected to result in VP International Equity Portfolio’s recouping the Transition Costs and its share of the Reorganization Expenses within approximately five months;
· the terms and conditions of the Reorganization Agreement;
· the tax consequences of the Reorganization to VP International Equity Portfolio and its shareholders portfolios (i.e., the separate accounts) or the interests of Variable Contract Owners or Plan Participants, including the tax-free nature of the transaction;
· that the interests of existing shareholders (i.e., the separate accounts) or the interests of Variable Contract Owners or Plan Participants of VP International Equity Portfolio will not be diluted as a result of the Reorganization; and
· the future potential benefits to ING Investments in that its costs to manage VP Index Plus International Equity Portfolio after the Reorganization are expected to be less than its costs to manage both.
The Board of Directors of VP International Equity Portfolio recommends that shareholders approve the Reorganization with VP Index Plus International Equity Portfolio.
Tax Considerations
The Reorganization is intended to qualify for federal income tax purposes as a tax-free reorganization under Section 368 of the Internal Revenue Code of 1986, as amended (the “Code”). Accordingly, pursuant to this treatment, neither VP International Equity Portfolio nor its shareholders, nor VP Index Plus International Equity Portfolio nor its shareholders, are expected to recognize any gain or loss for federal income tax purposes from the transactions contemplated by the Reorganization Agreement. As a condition to the Closing of the Reorganization, the Portfolios will receive an opinion from the law firm of Dechert LLP to the effect that the Reorganization will qualify as a tax-free reorganization for federal income tax purposes. That opinion will be based in part upon certain assumptions and upon certain representations made by the Portfolios.
Prior to the Closing Date, VP International Equity Portfolio will pay to insurance company separate accounts and Qualified Plans that own its shares, a cash distribution which is intended to distribute any undistributed investment company taxable income and any undistributed realized net capital gains, including any net gains realized from any sales of assets prior to the Closing Date.
Expenses of the Reorganization
The expenses relating to the proposed Reorganization will be borne equally by ING Investments, the Adviser to the Portfolios, and VP International Equity Portfolio. The costs of the Reorganization shall include, but not be limited to, costs associated with the preparation of the Registration Statement, printing and distributing the Proxy Statement/Prospectus and proxy materials, legal fees, accounting fees, securities registration fees, and expenses of holding the Special Meeting.
Future Allocation of Premiums
Shares of VP International Equity Portfolio have been purchased at the direction of Variable Contract owners by Participating Life Insurance Companies through separate accounts to fund benefits payable under a Variable Contract. If
22
Exhibit J
PART B
ING INVESTORS TRUST
Statement of Additional Information
September 10, 2007
Acquisition of the Assets and Liabilities of: |
| By and in Exchange for Shares of: |
ING VP International Equity Portfolio |
| ING VP Index Plus International Portfolio |
This Statement of Additional Information of ING Investors Trust (“SAI”) is available to the shareholders of ING VP International Equity Portfolio in connection with a proposed transaction whereby all of the assets and known liabilities of the ING VP International Equity Portfolio will be transferred to ING VP Index Plus International Equity Portfolio, a series of ING Investors Trust, in exchange for shares of ING VP Index Plus International Portfolio.
This SAI consists of: (i) this cover page; (ii) the accompanying Pro Forma Financial Statements; (iii) the Portfolio Manager’s Report for ING VP Index Plus International Equity Fund; and (iv) the following documents, each of which was filed electronically with the U.S. Securities and Exchange Commission and is incorporated by reference herein:
1. The SAI for ING VP Index Plus International Equity Portfolio, dated April 30, 2007, as filed on April 27, 2007 (File No. 033-23512), and the SAI for ING VP International Equity Portfolio, dated April 30, 2007, as filed on April 27, 2007 (File No. 333-05173).
2. The Financial Statements of the ING VP Index Plus International Equity Portfolio are included in the Annual Report, dated December 31, 2006, as filed on March 8, 2007 (File No. 811-05629), and the Financial Statements of the ING VP International Equity Portfolio are included in the Annual Report, dated December 31, 2006 as filed on March 8, 2007 (File No. 811-07651).
This Statement of Additional Information is not a prospectus. A Prospectus/Proxy Statement dated September 10, 2007, relating to the Reorganization of ING VP International Equity Portfolio may be obtained, without charge, by writing to the ING Funds at 7337 East Doubletree Ranch Road, Scottsdale, Arizona 85258-2034 or calling 1-800-992-0180. This Statement of Additional Information should be read in conjunction with the Prospectus/Proxy Statement.
Exhibit K
STATEMENTS OF ASSETS AND LIABILITIES as of December 31, 2006
|
| ING VP International Equity |
| ING VP Index Plus |
| Pro Forma |
| ING VP |
| ||||
|
|
|
|
|
|
|
| (Unaudited) |
| ||||
|
|
|
|
|
|
|
|
|
| ||||
ASSETS: |
|
|
|
|
|
|
|
|
| ||||
Investments in securities at value+* |
| $ | 79,049,579 |
| $ | 376,987,317 |
|
|
| $ | 456,036,896 |
| |
Short-term investments at amortized cost |
| 3,228,095 |
| 8,380,339 |
|
|
| 11,608,434 |
| ||||
Cash |
| 660 |
| 8,613,259 |
|
|
| 8,613,919 |
| ||||
Foreign currencies at value** |
| 58 |
| 1,208,271 |
|
|
| 1,208,329 |
| ||||
Receivables: |
|
|
|
|
|
|
|
|
| ||||
Fund shares sold |
| 1,000 |
| 526,138 |
|
|
| 527,138 |
| ||||
Dividends and interest |
| 156,191 |
| 438,732 |
|
|
| 594,923 |
| ||||
Prepaid expenses |
| 2,040 |
| 2,830 |
|
|
| 4,870 |
| ||||
Reimbursement due from manager |
| — |
| 37,081 |
|
|
| 37,081 |
| ||||
Total assets |
| 82,437,623 |
| 396,193,967 |
| — |
| 478,631,590 |
| ||||
|
|
|
|
|
|
|
|
|
| ||||
LIABILITIES: |
|
|
|
|
|
|
|
|
| ||||
Payable for fund shares redeemed |
| 110,459 |
| 250,932 |
|
|
| 361,391 |
| ||||
Payable upon receipt of securities loaned |
| 2,781,095 |
| 8,380,339 |
|
|
| 11,161,434 |
| ||||
Payable to affiliates |
| 60,545 |
| 199,058 |
|
|
| 259,603 |
| ||||
Payable for trustee fees |
| 2,636 |
| 4,106 |
|
|
| 6,742 |
| ||||
Other accrued expenses and liabilities |
| 33,751 |
| 44,254 |
| 33,800 | (B) | 111,805 |
| ||||
Total liabilities |
| 2,988,486 |
| 8,878,689 |
| 33,800 |
| 11,900,975 |
| ||||
NET ASSETS |
| $ | 79,449,137 |
| $ | 387,315,278 |
| $ | (33,800 | ) | $ | 466,730,615 |
|
|
|
|
|
|
|
|
|
|
| ||||
NET ASSETS WERE COMPRISED OF: |
|
|
|
|
|
|
|
|
| ||||
Paid-in capital |
| $ | 74,897,946 |
| $ | 352,365,438 |
|
|
| $ | 427,263,384 |
| |
Undistributed net investment income |
| 1,627,816 |
| 185,992 |
| (33,800 | )(B) | 1,780,008 |
| ||||
Accumulated net realized gain (loss) on investments and |
|
|
|
|
|
|
| $ | — |
| |||
foreign currency related transactions |
| (10,820,603 | ) | 487,325 |
|
|
| (10,333,278 | ) | ||||
Net unrealized appreciation or depreciation on investments and |
|
|
|
|
|
|
| — |
| ||||
foreign currency related transactions |
| 13,743,978 |
| 34,276,523 |
|
|
| 48,020,501 |
| ||||
NET ASSETS |
| $ | 79,449,137 |
| $ | 387,315,278 |
| $ | (33,800 | ) | $ | 466,730,615 |
|
+ Including securities loaned at value |
| $ | 2,634,993 |
| $ | 7,964,848 |
|
|
| $ | 10,599,841 |
| |
* Cost of investments in securities |
| $ | 65,311,349 |
| $ | 342,718,682 |
|
|
| $ | 408,030,031 |
| |
*’* Cost of foreign currencies |
| $ | 58 |
| $ | 1,208,550 |
|
|
| $ | 1,208,608 |
| |
|
|
|
|
|
|
|
|
|
| ||||
Class ADV: |
|
|
|
|
|
|
|
|
| ||||
Net assets |
| $ | 1,000 |
| $ | 981 |
| $ | (0 | )(B) | $ | 1,981 |
|
Shares authorized |
| 100,000,000 |
| unlimited |
|
|
| unlimited |
| ||||
Par value |
| $ | 0.001 |
| $ | 0.001 |
|
|
| $ | 0.001 |
| |
Shares outstanding |
| 82 |
| 75 |
| (6 | )(A) | 151 |
| ||||
Net asset value and redemption price per share |
| $ | 12.21 |
| $ | 13.08 |
|
|
| $ | 13.08 |
| |
|
|
|
|
|
|
|
|
|
| ||||
Class I: |
|
|
|
|
|
|
|
|
| ||||
Net assets |
| $ | 78,572,931 |
| $ | 272,333,415 |
| $ | (33,428 | )(B) | $ | 350,872,918 |
|
Shares authorized |
| 100,000,000 |
| unlimited |
|
|
| unlimited |
| ||||
Par value |
| $ | 0.001 |
| $ | 0.001 |
|
|
| $ | 0.001 |
| |
Shares outstanding |
| 6,392,041 |
| 20,773,075 |
| (401,197 | )(A) | 26,763,919 |
| ||||
Net asset value and redemption price per share |
| $ | 12.29 |
| $ | 13.11 |
|
|
| $ | 13.11 |
| |
|
|
|
|
|
|
|
|
|
| ||||
Class S: |
|
|
|
|
|
|
|
|
| ||||
Net assets |
| $ | 875,206 |
| $ | 114,292,534 |
| $ | (372 | )(B) | $ | 115,167,368 |
|
Shares authorized |
| 100,000,000 |
| unlimited |
|
|
| unlimited |
| ||||
Par value |
| $ | 0.001 |
| $ | 0.001 |
|
|
| $ | 0.001 |
| |
Shares outstanding |
| 71,706 |
| 8,732,301 |
| (4,866 | )(A) | 8,799,141 |
| ||||
Net asset value and redemption price per share |
| $ | 12.21 |
| $ | 13.09 |
|
|
| $ | 13.09 |
| |
|
|
|
|
|
|
|
|
|
| ||||
Class S2: |
|
|
|
|
|
|
|
|
| ||||
Net assets |
| n/a |
| $ | 688,348 |
|
|
| $ | 688,348 |
| ||
Shares authorized |
| n/a |
| unlimited |
|
|
| unlimited |
| ||||
Par value |
| n/a |
| $ | 0.001 |
|
|
| $ | 0.001 |
| ||
Shares outstanding |
| n/a |
| 52,397 |
|
|
| 52,397 |
| ||||
Net asset value and redemption price per share |
| n/a |
| $ | 13.14 |
|
|
| $ | 13.14 |
| ||
(A) |
| Reflects new shares issued, net of retired shares of ING VP International Equity Portfolio. (Calculation: Net Assets ÷ NAV per share) |
(B) |
| Reflects adjustment for estimated one time merger expenses (See Note 5 in Notes to Unaudited Pro Forma Financial Statements). |
Exhibit L
STATEMENTS OF ASSETS AND LIABILITIES as of December 31, 2006
|
| ING VP International Equity |
| ING VP Index Plus |
| Pro Forma |
| ING VP |
| ||||
|
|
|
|
|
|
|
| (Unaudited) |
| ||||
|
|
|
|
|
|
|
|
|
| ||||
ASSETS: |
|
|
|
|
|
|
|
|
| ||||
Investments in securities at value+* |
| $ | 79,049,579 |
| $ | 376,987,317 |
|
|
| $ | 456,036,896 |
| |
Short-term investments at amortized cost |
| 3,228,095 |
| 8,380,339 |
|
|
| 11,608,434 |
| ||||
Cash |
| 660 |
| 8,613,259 |
|
|
| 8,613,919 |
| ||||
Foreign currencies at value** |
| 58 |
| 1,208,271 |
|
|
| 1,208,329 |
| ||||
Receivables: |
|
|
|
|
|
|
|
|
| ||||
Fund shares sold |
| 1,000 |
| 526,138 |
|
|
| 527,138 |
| ||||
Dividends and interest |
| 156,191 |
| 438,732 |
|
|
| 594,923 |
| ||||
Prepaid expenses |
| 2,040 |
| 2,830 |
|
|
| 4,870 |
| ||||
Reimbursement due from manager |
| — |
| 37,081 |
|
|
| 37,081 |
| ||||
Total assets |
| 82,437,623 |
| 396,193,967 |
| — |
| 478,631,590 |
| ||||
|
|
|
|
|
|
|
|
|
| ||||
LIABILITIES: |
|
|
|
|
|
|
|
|
| ||||
Payable for fund shares redeemed |
| 110,459 |
| 250,932 |
|
|
| 361,391 |
| ||||
Payable upon receipt of securities loaned |
| 2,781,095 |
| 8,380,339 |
|
|
| 11,161,434 |
| ||||
Payable to affiliates |
| 60,545 |
| 199,058 |
|
|
| 259,603 |
| ||||
Payable for trustee fees |
| 2,636 |
| 4,106 |
|
|
| 6,742 |
| ||||
Other accrued expenses and liabilities |
| 33,751 |
| 44,254 |
| 33,800 | (B) | 111,805 |
| ||||
Total liabilities |
| 2,988,486 |
| 8,878,689 |
| 33,800 |
| 11,900,975 |
| ||||
NET ASSETS |
| $ | 79,449,137 |
| $ | 387,315,278 |
| $ | (33,800 | ) | $ | 466,730,615 |
|
|
|
|
|
|
|
|
|
|
| ||||
NET ASSETS WERE COMPRISED OF: |
|
|
|
|
|
|
|
|
| ||||
Paid-in capital |
| $ | 74,897,946 |
| $ | 352,365,438 |
|
|
| $ | 427,263,384 |
| |
Undistributed net investment income |
| 1,627,816 |
| 185,992 |
| (33,800 | )(B) | 1,780,008 |
| ||||
Accumulated net realized gain (loss) on investments and |
|
|
|
|
|
|
| $ | — |
| |||
foreign currency related transactions |
| (10,820,603 | ) | 487,325 |
|
|
| (10,333,278 | ) | ||||
Net unrealized appreciation or depreciation on investments and |
|
|
|
|
|
|
| — |
| ||||
foreign currency related transactions |
| 13,743,978 |
| 34,276,523 |
|
|
| 48,020,501 |
| ||||
NET ASSETS |
| $ | 79,449,137 |
| $ | 387,315,278 |
| $ | (33,800 | ) | $ | 466,730,615 |
|
+ Including securities loaned at value |
| $ | 2,634,993 |
| $ | 7,964,848 |
|
|
| $ | 10,599,841 |
| |
* Cost of investments in securities |
| $ | 65,311,349 |
| $ | 342,718,682 |
|
|
| $ | 408,030,031 |
| |
*’* Cost of foreign currencies |
| $ | 58 |
| $ | 1,208,550 |
|
|
| $ | 1,208,608 |
| |
|
|
|
|
|
|
|
|
|
| ||||
Class ADV: |
|
|
|
|
|
|
|
|
| ||||
Net assets |
| $ | 1,000 |
| $ | 981 |
| $ | (0 | )(B) | $ | 1,981 |
|
Shares authorized |
| 100,000,000 |
| unlimited |
|
|
| unlimited |
| ||||
Par value |
| $ | 0.001 |
| $ | 0.001 |
|
|
| $ | 0.001 |
| |
Shares outstanding |
| 82 |
| 75 |
| (6 | )(A) | 151 |
| ||||
Net asset value and redemption price per share |
| $ | 12.21 |
| $ | 13.08 |
|
|
| $ | 13.08 |
| |
|
|
|
|
|
|
|
|
|
| ||||
Class I: |
|
|
|
|
|
|
|
|
| ||||
Net assets |
| $ | 78,572,931 |
| $ | 272,333,415 |
| $ | (33,428 | )(B) | $ | 350,872,918 |
|
Shares authorized |
| 100,000,000 |
| unlimited |
|
|
| unlimited |
| ||||
Par value |
| $ | 0.001 |
| $ | 0.001 |
|
|
| $ | 0.001 |
| |
Shares outstanding |
| 6,392,041 |
| 20,773,075 |
| (401,197 | )(A) | 26,763,919 |
| ||||
Net asset value and redemption price per share |
| $ | 12.29 |
| $ | 13.11 |
|
|
| $ | 13.11 |
| |
|
|
|
|
|
|
|
|
|
| ||||
Class S: |
|
|
|
|
|
|
|
|
| ||||
Net assets |
| $ | 875,206 |
| $ | 114,292,534 |
| $ | (372 | )(B) | $ | 115,167,368 |
|
Shares authorized |
| 100,000,000 |
| unlimited |
|
|
| unlimited |
| ||||
Par value |
| $ | 0.001 |
| $ | 0.001 |
|
|
| $ | 0.001 |
| |
Shares outstanding |
| 71,706 |
| 8,732,301 |
| (4,866 | )(A) | 8,799,141 |
| ||||
Net asset value and redemption price per share |
| $ | 12.21 |
| $ | 13.09 |
|
|
| $ | 13.09 |
| |
|
|
|
|
|
|
|
|
|
| ||||
Class S2: |
|
|
|
|
|
|
|
|
| ||||
Net assets |
| n/a |
| $ | 688,348 |
|
|
| $ | 688,348 |
| ||
Shares authorized |
| n/a |
| unlimited |
|
|
| unlimited |
| ||||
Par value |
| n/a |
| $ | 0.001 |
|
|
| $ | 0.001 |
| ||
Shares outstanding |
| n/a |
| 52,397 |
|
|
| 52,397 |
| ||||
Net asset value and redemption price per share |
| n/a |
| $ | 13.14 |
|
|
| $ | 13.14 |
| ||
(A) |
| Reflects new shares issued, net of retired shares of ING VP International Equity Portfolio. (Calculation: Net Assets ÷ NAV per share) |
(B) |
| Reflects adjustment for estimated one time merger expenses (See Note 5 in Notes to Unaudited Pro Forma Financial Statements). |
Exhibit M
STATEMENTS OF OPERATIONS for the twelve months ended December 31, 2006
(A) Reflects adjustment in expenses due to effects of new contractual rates.
(B) Reflects adjustment in expenses due to elimination of duplicative services.
Exhibit N
Portfolios of Investments as of December 31, 2006.
ING VP |
| ING VP Index Plus |
| ING VP Index Plus |
|
|
| ING VP |
| ING VP Index |
| ING VP Index |
| |||
|
| Shares |
|
|
|
|
|
|
| Value |
|
|
| |||
COMMON STOCK: 96.3% |
|
|
|
|
|
|
|
|
|
|
| |||||
|
|
|
|
|
| Australia: 4.5% |
|
|
|
|
|
|
| |||
— |
| 108,530 |
| 108,530 |
| Amcor Ltd. |
| $ | — |
| $ | 620,299 |
| $ | 620,299 |
|
— |
| 47,859 |
| 47,859 |
| APN News & Media Ltd. |
| — |
| 228,147 |
| 228,147 |
| |||
55,410 |
| 19,738 |
| 75,148 |
| BHP Billiton Ltd. |
| 1,102,055 |
| 392,571 |
| 1,494,626 |
| |||
110,000 |
| 314,916 |
| 424,916 |
| BlueScope Steel Ltd. |
| 745,933 |
| 2,135,511 |
| 2,881,444 |
| |||
— |
| 30,059 |
| 30,059 |
| Boral Ltd. |
| — |
| 180,237 |
| 180,237 |
| |||
— |
| 33,461 |
| 33,461 | @ | Brambles, Ltd. |
| — |
| 332,597 |
| 332,597 |
| |||
— |
| 222,976 |
| 222,976 |
| Centro Properties Group |
| — |
| 1,600,316 |
| 1,600,316 |
| |||
— |
| 55,657 |
| 55,657 |
| Coca-Cola Amatil Ltd. |
| — |
| 340,221 |
| 340,221 |
| |||
— |
| 6,980 |
| 6,980 |
| Cochlear Ltd. |
| — |
| 318,548 |
| 318,548 |
| |||
— |
| 87,566 |
| 87,566 |
| Coles Myer Ltd. |
| — |
| 965,903 |
| 965,903 |
| |||
— |
| 92,679 |
| 92,679 |
| Commonwealth Property Office Fund |
| — |
| 107,467 |
| 107,467 |
| |||
— |
| 5,839 |
| 5,839 |
| CSL Ltd. |
| — |
| 300,526 |
| 300,526 |
| |||
— |
| 73,204 |
| 73,204 |
| CSR Ltd. |
| — |
| 216,431 |
| 216,431 |
| |||
— |
| 51,909 |
| 51,909 |
| Foster’s Group Ltd. |
| — |
| 283,069 |
| 283,069 |
| |||
— |
| 26,008 |
| 26,008 |
| GPT Group |
| — |
| 114,787 |
| 114,787 |
| |||
— |
| 33,861 |
| 33,861 |
| Harvey Norman Holdings Ltd. |
| — |
| 101,313 |
| 101,313 |
| |||
— |
| 24,167 |
| 24,167 |
| Insurance Australia Group Ltd. |
| — |
| 120,699 |
| 120,699 |
| |||
— |
| 71,600 |
| 71,600 |
| Macquarie Airports Management Ltd. |
| — |
| 203,085 |
| 203,085 |
| |||
— |
| 18,961 |
| 18,961 |
| Macquarie Goodman Group |
| — |
| 113,381 |
| 113,381 |
| |||
— |
| 87,699 |
| 87,699 |
| Macquarie Office Trust |
| — |
| 106,309 |
| 106,309 |
| |||
35,700 |
| — |
| 35,700 |
| National Australia Bank Ltd.** |
| 1,136,571 |
| — |
| 1,136,571 |
| |||
— |
| 61,187 |
| 61,187 |
| OneSteel Ltd. |
| — |
| 225,632 |
| 225,632 |
| |||
— |
| 112,683 |
| 112,683 |
| Pacific Brands Ltd. |
| — |
| 231,802 |
| 231,802 |
| |||
— |
| 125,004 |
| 125,004 |
| Qantas Airways Ltd. |
| — |
| 515,238 |
| 515,238 |
| |||
— |
| 3,254 |
| 3,254 |
| Rio Tinto Ltd. |
| — |
| 189,443 |
| 189,443 |
| |||
62,653 |
| 98,722 |
| 161,375 |
| Santos Ltd. |
| 487,590 |
| 768,292 |
| 1,255,882 |
| |||
— |
| 17,201 |
| 17,201 |
| Stockland |
| — |
| 112,126 |
| 112,126 |
| |||
— |
| 237,376 |
| 237,376 | L | Suncorp-Metway Ltd. |
| — |
| 3,804,369 |
| 3,804,369 |
| |||
— |
| 29,170 |
| 29,170 |
| TABCORP Holdings Ltd. |
| — |
| 387,445 |
| 387,445 |
| |||
— |
| 36,402 |
| 36,402 |
| Tattersall’s Ltd. |
| — |
| 112,089 |
| 112,089 |
| |||
— |
| 49,687 |
| 49,687 |
| Telstra Corp., Ltd. |
| — |
| 162,369 |
| 162,369 |
| |||
— |
| 7,764 |
| 7,764 |
| Wesfarmers Ltd. |
| — |
| 229,819 |
| 229,819 |
| |||
— |
| 108,943 |
| 108,943 |
| Westpac Banking Corp. |
| — |
| 2,078,645 |
| 2,078,645 |
| |||
— |
| 9,393 |
| 9,393 |
| Zinifex Ltd. |
| — |
| 138,446 |
| 138,446 |
| |||
|
|
|
|
|
|
|
| 3,472,149 |
| 17,737,132 |
| 21,209,281 |
| |||
|
|
|
|
|
|
|
|
|
|
|
|
|
| |||
|
|
|
|
|
| Austria: 0.3% |
|
|
|
|
|
|
| |||
— |
| 3,247 |
| 3,247 |
| Boehler-Uddeholm AG |
| — |
| 226,908 |
| 226,908 |
| |||
— |
| 10,313 |
| 10,313 | @ | bwin Interactive Entertainment |
| — |
| 217,728 |
| 217,728 |
| |||
— |
| 31,825 |
| 31,825 | @ | IMMOFINANZ Immobilien Anlagen AG |
| — |
| 453,220 |
| 453,220 |
| |||
— |
| 4,196 |
| 4,196 |
| OMV AG |
| — |
| 237,926 |
| 237,926 |
| |||
— |
| 3,698 |
| 3,698 |
| Voestalpine AG |
| — |
| 208,472 |
| 208,472 |
| |||
|
|
|
|
|
|
|
| — |
| 1,344,254 |
| 1,344,254 |
| |||
|
|
|
|
|
|
|
|
|
|
|
|
|
| |||
|
|
|
|
|
| Belgium: 1.7% |
|
|
|
|
|
|
| |||
— |
| 924 |
| 924 |
| D’ieteren SA |
| — |
| 328,606 |
| 328,606 |
| |||
— |
| 120,862 |
| 120,862 |
| Fortis |
| — |
| 5,144,553 |
| 5,144,553 |
| |||
7,000 |
| 956 |
| 7,956 |
| KBC Groep NV |
| 856,931 |
| 117,032 |
| 973,963 |
| |||
9,126 |
| 1,539 |
| 10,665 |
| Omega Pharma SA |
| 686,742 |
| 115,812 |
| 802,554 |
| |||
— |
| 783 |
| 783 |
| Solvay SA |
| — |
| 119,978 |
| 119,978 |
| |||
4,400 |
| — |
| 4,400 |
| Umicore** |
| 747,637 |
| — |
| 747,637 |
| |||
|
|
|
|
|
|
|
| 2,291,310 |
| 5,825,981 |
| 8,117,291 |
| |||
|
|
|
|
|
|
|
|
|
|
|
|
|
| |||
|
|
|
|
|
| Bermuda: 0.0% |
|
|
|
|
|
|
| |||
— |
| 2,877 |
| 2,877 |
| Frontline Ltd. |
| — |
| 92,559 |
| 92,559 |
| |||
|
|
|
|
|
|
|
| — |
| 92,559 |
| 92,559 |
| |||
|
|
|
|
|
|
|
|
|
|
|
|
|
| |||
|
|
|
|
|
| Brazil: 0.3% |
|
|
|
|
|
|
| |||
6,300 |
| — |
| 6,300 |
| Petroleo Brasileiro SA** |
| 648,837 |
| — |
| 648,837 |
| |||
8,300 |
| — |
| 8,300 | L | Uniao de Bancos Brasileiros SA GDR** |
| 771,568 |
| — |
| 771,568 |
| |||
|
|
|
|
|
|
|
| 1,420,405 |
| — |
| 1,420,405 |
| |||
|
|
|
|
|
|
|
|
|
|
|
|
|
| |||
|
|
|
|
|
| China: 0.2% |
|
|
|
|
|
|
| |||
158,000 |
| — |
| 158,000 |
| China Life Insurance Co., Ltd.** |
| 539,308 |
| — |
| 539,308 |
| |||
— |
| 51,000 |
| 51,000 | @ | Foxconn International Holdings Ltd. |
| — |
| 166,340 |
| 166,340 |
| |||
|
|
|
|
|
|
|
| 539,308 |
| 166,340 |
| 705,648 |
| |||
|
|
|
|
|
|
|
|
|
|
|
|
|
| |||
|
|
|
|
|
| Denmark: 1.2% |
|
|
|
|
|
|
| |||
— |
| 132 |
| 132 |
| AP Moller-Maerk A/S | s | — |
| 1,238,543 |
| 1,238,543 |
| |||
— |
| 1,200 |
| 1,200 |
| Coloplast Group |
| — |
| 108,283 |
| 108,283 |
| |||
— |
| 2,965 |
| 2,965 | @ | East Asiatic Co., Ltd. A/S |
| — |
| 165,697 |
| 165,697 |
| |||
— |
| 49,700 |
| 49,700 |
| Novo-Nordik A/S | s | — |
| 4,138,422 |
| 4,138,422 |
| |||
|
|
|
|
|
|
|
| — |
| 5,650,945 |
| 5,650,945 |
| |||
|
|
|
|
|
|
|
|
|
|
|
|
|
| |||
|
|
|
|
|
| Developed Markets: 1.1% |
|
|
|
|
|
|
| |||
— |
| 72,000 |
| 72,000 |
| iShares MSCI EAFE Index Fund |
| — |
| 5,271,840 |
| 5,271,840 |
| |||
|
|
|
|
|
|
|
| — |
| 5,271,840 |
| 5,271,840 |
| |||
|
|
|
|
|
|
|
|
|
|
|
|
|
| |||
|
|
|
|
|
| Egypt: 0.2% |
|
|
|
|
|
|
| |||
12,700 |
| — |
| 12,700 |
| Orascom Telecom GDR** |
| 839,107 |
| — |
| 839,107 |
| |||
|
|
|
|
|
|
|
| 839,107 |
| — |
| 839,107 |
| |||
|
|
|
|
|
|
|
|
|
|
|
|
|
| |||
|
|
|
|
|
| Finland: 0.6% |
|
|
|
|
|
|
| |||
— |
| 7,326 |
| 7,326 |
| Kesko OYJ |
| — |
| 386,447 |
| 386,447 |
| |||
— |
| 47,027 |
| 47,027 |
| Nokia OYJ |
| — |
| 954,978 |
| 954,978 |
| |||
— |
| 5,067 |
| 5,067 | @ | Orion OYJ |
| — |
| 109,964 |
| 109,964 |
| |||
— |
| 28,809 |
| 28,809 |
| Rautaruukki OYJ |
| — |
| 1,141,116 |
| 1,141,116 |
| |||
|
|
|
|
|
|
|
| — |
| 2,592,505 |
| 2,592,505 |
| |||
|
|
|
|
|
|
|
|
|
|
|
|
|
| |||
|
|
|
|
|
| France: 10.3% |
|
|
|
|
|
|
| |||
— |
| 1,452 |
| 1,452 |
| Accor SA |
| — |
| 112,277 |
| 112,277 |
| |||
— |
| 4,039 |
| 4,039 |
| Air France-KLM |
| — |
| 169,557 |
| 169,557 |
| |||
95,209 |
| 274,197 |
| 369,406 | L | Alcatel SA |
| 1,358,337 |
| 3,911,966 |
| 5,270,303 |
|
10,113 |
| 8,424 |
| 18,537 | @,I | Atos Origin |
| 598,010 |
| 498,134 |
| 1,096,144 |
|
— |
| 45,742 |
| 45,742 |
| AXA SA |
| — |
| 1,843,923 |
| 1,843,923 |
|
— |
| 25,018 |
| 25,018 |
| BNP Paribas |
| — |
| 2,721,665 |
| 2,721,665 |
|
14,100 |
| 24,277 |
| 38,377 |
| Bouygues |
| 902,771 |
| 1,554,366 |
| 2,457,137 |
|
— |
| 2,912 |
| 2,912 | @ | Business Objects SA |
| — |
| 114,228 |
| 114,228 |
|
— |
| 3,213 |
| 3,213 |
| Capgemini SA |
| — |
| 201,021 |
| 201,021 |
|
— |
| 14,458 |
| 14,458 |
| Cie de Saint-Gobain |
| — |
| 1,211,456 |
| 1,211,456 |
|
— |
| 9,912 |
| 9,912 |
| Compagnie Generale des Etablissements Michelin |
| — |
| 946,823 |
| 946,823 |
|
— |
| 103,574 |
| 103,574 |
| Credit Agricole SA |
| — |
| 4,341,606 |
| 4,341,606 |
|
— |
| 44,693 |
| 44,693 |
| France Telecom SA |
| — |
| 1,233,085 |
| 1,233,085 |
|
— |
| 2,497 |
| 2,497 |
| Gaz de France |
| — |
| 114,628 |
| 114,628 |
|
6,114 |
| 26,372 |
| 32,486 |
| Groupe Danone |
| 924,578 |
| 3,988,054 |
| 4,912,632 |
|
— |
| 3,637 |
| 3,637 |
| Lafarge SA |
| — |
| 540,622 |
| 540,622 |
|
— |
| 1,686 |
| 1,686 |
| Neopost SA |
| — |
| 211,522 |
| 211,522 |
|
— |
| 8,647 |
| 8,647 |
| Sanofi-Aventis |
| — |
| 797,259 |
| 797,259 |
|
6,795 |
| 31,763 |
| 38,558 |
| Societe Generale |
| 1,149,511 |
| 5,373,350 |
| 6,522,861 |
|
— |
| 21,748 |
| 21,748 |
| Suez SA |
| — |
| 1,124,014 |
| 1,124,014 |
|
— |
| 3,290 |
| 3,290 |
| Technip SA |
| — |
| 225,668 |
| 225,668 |
|
21,000 |
| 38,831 |
| 59,831 |
| Total SA |
| 1,511,105 |
| 2,794,178 |
| 4,305,283 |
|
— |
| 2,115 |
| 2,115 |
| Unibail |
| — |
| 515,809 |
| 515,809 |
|
15,138 |
| 4,586 |
| 19,724 |
| Veolia Environnement |
| 1,154,482 |
| 349,746 |
| 1,504,228 |
|
8,200 |
| — |
| 8,200 | L | Vinci SA** |
| 1,045,103 |
| — |
| 1,045,103 |
|
24,297 |
| 92,085 |
| 116,382 |
| Vivendi |
| 947,687 |
| 3,591,711 |
| 4,539,398 |
|
|
|
|
|
|
|
|
| 9,591,584 |
| 38,486,668 |
| 48,078,252 |
|
|
|
|
|
|
| Germany: 8.9% |
|
|
|
|
|
|
|
— |
| 5,925 |
| 5,925 |
| Adidas AG |
| — |
| 295,878 |
| 295,878 |
|
— |
| 31,000 |
| 31,000 |
| Allianz AG |
| — |
| 6,307,065 |
| 6,307,065 |
|
— |
| 14,220 |
| 14,220 |
| BASF AG |
| — |
| 1,386,764 |
| 1,386,764 |
|
— |
| 2,099 |
| 2,099 |
| Celesio AG |
| — |
| 111,332 |
| 111,332 |
|
— |
| 2,947 |
| 2,947 |
| Commerzbank AG |
| — |
| 111,052 |
| 111,052 |
|
9,216 |
| 21,400 |
| 30,616 |
| Deutsche Bank AG |
| 1,227,277 |
| 2,849,798 |
| 4,077,075 |
|
— |
| 108,742 |
| 108,742 |
| Deutsche Lufthansa AG |
| — |
| 2,976,635 |
| 2,976,635 |
|
— |
| 7,366 |
| 7,366 |
| Deutsche Post AG |
| — |
| 222,319 |
| 222,319 |
|
— |
| 66,764 |
| 66,764 |
| Deutsche Telekom AG |
| — |
| 1,217,820 |
| 1,217,820 |
|
— |
| 4,122 |
| 4,122 |
| EON AG |
| — |
| 559,143 |
| 559,143 |
|
6,900 |
| 17,094 |
| 23,994 |
| Fresenius Medical Care AG & Co. KGaA |
| 918,559 |
| 2,275,629 |
| 3,194,188 |
|
— |
| 4,439 |
| 4,439 |
| Heidelberger Druckmaschinen |
| — |
| 209,585 |
| 209,585 |
|
6,800 |
| 745 |
| 7,545 |
| Henkel KGaA |
| 999,467 |
| 109,500 |
| 1,108,967 |
|
12,287 |
| 36,430 |
| 48,717 |
| Hochtief AG |
| 890,918 |
| 2,641,502 |
| 3,532,420 |
|
— |
| 4,643 |
| 4,643 | @ | KarstadtQuelle AG |
| — |
| 133,910 |
| 133,910 |
|
— |
| 12,268 |
| 12,268 |
| Merck KGaA |
| — |
| 1,273,195 |
| 1,273,195 |
|
4,669 |
| 15,248 |
| 19,917 |
| Muenchener Rueckversicherungs AG |
| 804,476 |
| 2,627,253 |
| 3,431,729 |
|
— |
| 2,792 |
| 2,792 |
| Rheinmetall AG |
| — |
| 211,107 |
| 211,107 |
|
8,700 |
| 1,127 |
| 9,827 |
| RWE AG |
| 953,668 |
| 123,538 |
| 1,077,206 |
|
— |
| 23,633 |
| 23,633 |
| Salzgitter AG |
| — |
| 3,081,869 |
| 3,081,869 |
|
— |
| 6,028 |
| 6,028 |
| Siemens AG |
| — |
| 595,210 |
| 595,210 |
|
— |
| 104,757 |
| 104,757 |
| ThyssenKrupp AG |
| — |
| 4,920,678 |
| 4,920,678 |
|
— |
| 9,899 |
| 9,899 | L | TUI AG |
| — |
| 198,086 |
| 198,086 |
|
— |
| 11,342 |
| 11,342 |
| Volkswagen AG |
| — |
| 1,286,183 |
| 1,286,183 |
|
|
|
|
|
|
|
|
| 5,794,365 |
| 35,725,051 |
| 41,519,416 |
|
|
|
|
|
|
|
|
|
|
|
|
|
|
|
|
|
|
|
|
| Greece: 0.7% |
|
|
|
|
|
|
|
25,487 |
| 49,778 |
| 75,265 |
| Coca-Cola Hellenic Bottling Co. SA |
| 994,403 |
| 1,942,143 |
| 2,936,546 |
|
— |
| 16,353 |
| 16,353 |
| Hellenic Petroleum SA |
| — |
| 224,271 |
| 224,271 |
|
|
|
|
|
|
|
|
| 994,403 |
| 2,166,414 |
| 3,160,817 |
|
|
|
|
|
|
|
|
|
|
|
|
|
|
|
|
|
|
|
|
| Hong Kong: 2.0% |
|
|
|
|
|
|
|
— |
| 129,200 |
| 129,200 |
| CLP Holdings Ltd. |
| — |
| 953,674 |
| 953,674 |
|
55,000 |
| — |
| 55,000 |
| Cheung Kong Holdings Ltd.** |
| 675,637 |
| — |
| 675,637 |
|
— |
| 10,123 |
| 10,123 |
| Esprit Holdings Ltd. |
| — |
| 112,755 |
| 112,755 |
|
— |
| 40,500 |
| 40,500 | @ | HongKong Electric Holdings |
| — |
| 198,041 |
| 198,041 |
|
— |
| 41,000 |
| 41,000 | @ | Hysan Development Co. |
| — |
| 107,182 |
| 107,182 |
|
— |
| 30,500 |
| 30,500 |
| Kingboard Chemicals Holdings |
| — |
| 119,768 |
| 119,768 |
|
— |
| 295,000 |
| 295,000 |
| Noble Group Ltd. |
| — |
| 210,802 |
| 210,802 |
|
— |
| 125,000 |
| 125,000 |
| Orient Overseas International Ltd. |
| — |
| 793,672 |
| 793,672 |
|
— |
| 190,000 |
| 190,000 |
| PCCW Ltd. |
| — |
| 115,519 |
| 115,519 |
|
— |
| 359,348 |
| 359,348 |
| Swire Pacific Ltd. |
| — |
| 3,853,255 |
| 3,853,255 |
|
— |
| 29,000 |
| 29,000 |
| Television Broadcasts Ltd. |
| — |
| 177,106 |
| 177,106 |
|
— |
| 294,000 |
| 294,000 |
| Texwinca Holdings Ltd. |
| — |
| 203,547 |
| 203,547 |
|
— |
| 513,477 |
| 513,477 | @ | Wharf Holdings Ltd. |
| — |
| 1,893,522 |
| 1,893,522 |
|
— |
| 35,000 |
| 35,000 |
| Yue Yuen Industrial Holdings |
| — |
| 111,046 |
| 111,046 |
|
|
|
|
|
|
|
|
| 675,637 |
| 8,849,889 |
| 9,525,526 |
|
|
|
|
|
|
|
|
|
|
|
|
|
|
|
|
|
|
|
|
| Indonesia: 0.2% |
|
|
|
|
|
|
|
17,600 |
| — |
| 17,600 |
| Telekomunikasi Indonesia Tbk PT ADR** |
| 802,560 |
| — |
| 802,560 |
|
|
|
|
|
|
|
|
| 802,560 |
| — |
| 802,560 |
|
|
|
|
|
|
|
|
|
|
|
|
|
|
|
|
|
|
|
|
| Ireland: 0.7% |
|
|
|
|
|
|
|
39,100 |
| — |
| 39,100 |
| Bank of Ireland** |
| 900,173 |
| — |
| 900,173 |
|
37,308 |
| 89,073 |
| 126,381 |
| Depfa Bank PLC |
| 666,652 |
| 1,591,635 |
| 2,258,287 |
|
— |
| 12,142 |
| 12,142 | @ | Elan Corp. PLC |
| — |
| 175,970 |
| 175,970 |
|
|
|
|
|
|
|
|
| 1,566,825 |
| 1,767,605 |
| 3,334,430 |
|
|
|
|
|
|
| Italy: 5.0% 5.2% |
|
|
|
|
|
|
|
— |
| 165,676 |
| 165,676 |
| Autogrill S.p.A. |
| — |
| 3,040,532 |
| 3,040,532 |
|
136,735 |
| 338,341 |
| 475,076 |
| Banca Intesa S.p.A. |
| 1,053,045 |
| 2,605,686 |
| 3,658,731 |
|
— |
| 10,050 |
| 10,050 |
| Banche Popolari Unite Scpa |
| — |
| 275,650 |
| 275,650 |
|
86,564 |
| 432,979 |
| 519,543 |
| Capitalia S.p.A. |
| 816,782 |
| 4,085,408 |
| 4,902,190 |
|
— |
| 35,560 |
| 35,560 |
| Enel S.p.A. |
| — |
| 366,497 |
| 366,497 |
|
— |
| 66,101 |
| 66,101 |
| ENI S.p.A. |
| — |
| 2,223,316 |
| 2,223,316 |
|
26,600 |
|
|
| 26,600 |
| ERG S.p.A.** |
| 607,259 |
| — |
| 607,259 |
|
— |
| 81,806 |
| 81,806 | @ | Fiat S.p.A. |
| — |
| 1,560,640 |
| 1,560,640 |
|
— |
| 2,340 |
| 2,340 |
| Fondiaria-Sai S.p.A. |
| — |
| 111,631 |
| 111,631 |
|
35,108 |
| 6,878 |
| 41,986 |
| Italcementi S.p.A. |
| 988,109 |
| 193,580 |
| 1,181,689 |
|
— |
| 2,731 |
| 2,731 |
| Lottomatica S.p.A. |
| — |
| 113,365 |
| 113,365 |
|
— |
| 232,016 |
| 232,016 |
| Pirelli & C S.p.A. |
| — |
| 230,679 |
| 230,679 |
|
482,106 |
| 1,450,000 |
| 1,932,106 |
| Telecom Italia S.p.A. |
| 1,220,887 |
| 4,368,542 |
| 5,589,429 |
|
— |
| 56,419 |
| 56,419 |
| Telecom Italia S.p.A. — RNC |
| — |
| 142,876 |
| 142,876 |
|
— |
| 22,449 |
| 22,449 |
| UniCredito Italiano S.p.A. |
| — |
| 196,243 |
| 196,243 |
|
|
|
|
|
|
|
|
| 4,686,082 |
| 19,514,645 |
| 24,200,727 |
|
|
|
|
|
|
|
|
|
|
|
|
|
|
|
|
|
|
|
|
| Japan: 21.6% |
|
|
|
|
|
|
|
— |
| 9,000 |
| 9,000 |
| Aeon Co., Ltd. |
| — |
| 194,655 |
| 194,655 |
|
— |
| 2,800 |
| 2,800 |
| Alfresa Holdings Corp. |
| — |
| 169,358 |
| 169,358 |
|
— |
| 21,000 |
| 21,000 |
| Amada Co., Ltd. |
| — |
| 222,340 |
| 222,340 |
|
— |
| 4,000 |
| 4,000 |
| Aoyama Trading Co., Ltd. |
| — |
| 119,996 |
| 119,996 |
|
— |
| 3,100 |
| 3,100 |
| Autobacs Seven Co., Ltd. |
| — |
| 113,230 |
| 113,230 |
|
— |
| 31,000 |
| 31,000 |
| Bank of Yokohama Ltd. |
| — |
| 242,110 |
| 242,110 |
|
— |
| 11,800 |
| 11,800 |
| Circle K Sunkus Co., Ltd. |
| — |
| 209,381 |
| 209,381 |
|
— |
| 21,000 |
| 21,000 |
| COMSYS Holdings Corp. |
| — |
| 232,026 |
| 232,026 |
|
— |
| 34,000 |
| 34,000 |
| Dai Nippon Printing Co., Ltd. |
| — |
| 524,196 |
| 524,196 |
|
— |
| 7,000 |
| 7,000 |
| Daifuku Co., Ltd. |
| — |
| 110,371 |
| 110,371 |
|
— |
| 6,900 |
| 6,900 |
| Daiichi Sankyo Co., Ltd. |
| — |
| 215,237 |
| 215,237 |
|
28,200 |
| — |
| 28,200 |
| Don Quijote Co., Ltd.** |
| 538,322 |
| — |
| 538,322 |
|
141 |
| 416 |
| 557 |
| East Japan Railway Co. |
| 939,885 |
| 2,772,995 |
| 3,712,880 |
|
— |
| 7,700 |
| 7,700 |
| Edion Corp. |
| — |
| 114,128 |
| 114,128 |
|
— |
| 2,000 |
| 2,000 |
| Eisai Co., Ltd. |
| — |
| 109,870 |
| 109,870 |
|
— |
| 2,300 |
| 2,300 | @ | Elpida Memory, Inc. |
| — |
| 126,317 |
| 126,317 |
|
— |
| 7,600 |
| 7,600 |
| FamilyMart Co., Ltd. |
| — |
| 206,595 |
| 206,595 |
|
— |
| 51 |
| 51 |
| Fuji Television Network, Inc. |
| — |
| 116,292 |
| 116,292 |
|
— |
| 12,000 |
| 12,000 |
| Fujikura Ltd. |
| — |
| 105,492 |
| 105,492 |
|
— |
| 173,000 |
| 173,000 |
| Fujitsu Ltd. |
| — |
| 1,355,537 |
| 1,355,537 |
|
— |
| 3,400 |
| 3,400 |
| Hakuhodo DY Holdings, Inc. |
| — |
| 220,758 |
| 220,758 |
|
238,500 |
| 204,500 |
| 443,000 | @ | Haseko Corp. |
| 851,093 |
| 729,764 |
| 1,580,857 |
|
35,500 |
| — |
| 35,500 | @ | Hitachi Construction Machinery Co., Ltd.** |
| 953,327 |
| — |
| 953,327 |
|
— |
| 5,900 |
| 5,900 | @ | Honda Motor Co., Ltd. |
| — |
| 232,868 |
| 232,868 |
|
16,400 |
| — |
| 16,400 | @ | Hoya Corp.** |
| 639,220 |
| — |
| 639,220 |
|
— |
| 2,200 |
| 2,200 | @ | Ibiden Co., Ltd. |
| — |
| 110,655 |
| 110,655 |
|
— |
| 13 |
| 13 |
| Inpex Holdings, Inc. |
| — |
| 106,792 |
| 106,792 |
|
— |
| 202,000 |
| 202,000 |
| Itochu Corp. |
| — |
| 1,655,805 |
| 1,655,805 |
|
— |
| 7,200 |
| 7,200 |
| JFE Holdings, Inc. |
| — |
| 370,207 |
| 370,207 |
|
93 |
| — |
| 93 | L | Kenedix, Inc.** |
| 419,546 |
| — |
| 419,546 |
|
— |
| 500 |
| 500 |
| Keyence Corp. |
| — |
| 123,420 |
| 123,420 |
|
— |
| 225,000 |
| 225,000 |
| Kobe Steel Ltd. |
| — |
| 769,857 |
| 769,857 |
|
— |
| 134,000 |
| 134,000 |
| Komatsu Ltd. |
| — |
| 2,712,143 |
| 2,712,143 |
|
— |
| 6,000 |
| 6,000 |
| Komori Corp. |
| — |
| 111,748 |
| 111,748 |
|
— |
| 14,500 |
| 14,500 |
| Konica Minolta Holdings, Inc. |
| — |
| 204,634 |
| 204,634 |
|
— |
| 48,000 |
| 48,000 |
| Kubota Corp. |
| — |
| 444,527 |
| 444,527 |
|
— |
| 1,200 |
| 1,200 |
| Kyocera Corp. |
| — |
| 113,439 |
| 113,439 |
|
— |
| 27,000 |
| 27,000 |
| Kyowa Hakko Kogyo Co., Ltd. |
| — |
| 230,758 |
| 230,758 |
|
— |
| 128,700 |
| 128,700 |
| Kyushu Electric Power Co., Inc. |
| — |
| 3,393,956 |
| 3,393,956 |
|
— |
| 6,100 |
| 6,100 |
| Lawson, Inc. |
| — |
| 218,250 |
| 218,250 |
|
— |
| 8,300 |
| 8,300 |
| Marui Co., Ltd. |
| — |
| 96,633 |
| 96,633 |
|
43,000 |
| 240,000 |
| 283,000 |
| Matsushita Electric Industrial Co., Ltd. |
| 862,214 |
| 4,812,357 |
| 5,674,571 |
|
— |
| 78,800 |
| 78,800 |
| Mitsubishi Corp. |
| — |
| 1,480,554 |
| 1,480,554 |
|
— |
| 40,000 |
| 40,000 |
| Mitsubishi Materials Corp. |
| — |
| 150,066 |
| 150,066 |
|
— |
| 16,000 |
| 16,000 |
| Mitsubishi Rayon Co., Ltd. |
| — |
| 107,398 |
| 107,398 |
|
122 |
| 113 |
| 235 |
| Mitsubishi UFJ Financial Group, Inc. |
| 1,513,507 |
| 1,401,855 |
| 2,915,362 |
|
— |
| 43,000 |
| 43,000 |
| Mitsui Mining & Smelting Co., Ltd. |
| — |
| 215,362 |
| 215,362 |
|
96,000 |
| — |
| 96,000 |
| Mitsui OSK Lines Ltd.** |
| 948,161 |
| — |
| 948,161 |
|
— |
| 771 |
| 771 |
| Mizuho Financial Group, Inc. |
| — |
| 5,499,517 |
| 5,499,517 |
|
— |
| 82,000 |
| 82,000 |
| NGK Spark Plug Co., Ltd. |
| — |
| 1,540,715 |
| 1,540,715 |
|
— |
| 19,000 |
| 19,000 |
| Nichirei Corp. |
| — |
| 106,413 |
| 106,413 |
|
— |
| 60,000 |
| 60,000 |
| Nippon Electric Glass Co., Ltd. |
| — |
| 1,258,118 |
| 1,258,118 |
|
— |
| 70,500 |
| 70,500 |
| Nippon Mining Holdings, Inc. |
| — |
| 506,659 |
| 506,659 |
|
— |
| 23,000 |
| 23,000 |
| Nippon Oil Corp. |
| — |
| 153,811 |
| 153,811 |
|
— |
| 670,000 |
| 670,000 |
| Nippon Steel Corp. |
| — |
| 3,843,811 |
| 3,843,811 |
|
198 |
| 474 |
| 672 |
| Nippon Telegraph & Telephone Corp. |
| 976,435 |
| 2,337,525 |
| 3,313,960 |
|
— |
| 10,200 |
| 10,200 |
| Nissan Motor Co., Ltd. |
| — |
| 123,080 |
| 123,080 |
|
— |
| 219,000 |
| 219,000 |
| Nisshin Steel Co., Ltd. |
| — |
| 812,088 |
| 812,088 |
|
— |
| 3,200 |
| 3,200 |
| Nissin Food Products Co., Ltd. |
| — |
| 118,525 |
| 118,525 |
|
— |
| 9,800 |
| 9,800 |
| NOK Corp. |
| — |
| 193,264 |
| 193,264 |
|
— |
| 69 |
| 69 |
| NTT DoCoMo, Inc. |
| — |
| 109,181 |
| 109,181 |
|
— |
| 18,000 |
| 18,000 |
| Obayashi Corp. |
| — |
| 116,690 |
| 116,690 |
|
— |
| 7,000 |
| 7,000 |
| Olympus Corp. |
| — |
| 219,691 |
| 219,691 |
|
— |
| 7,320 |
| 7,320 |
| ORIX Corp. |
| — |
| 2,122,742 |
| 2,122,742 |
|
— |
| 59,000 |
| 59,000 |
| Osaka Gas Co., Ltd. |
| — |
| 219,295 |
| 219,295 |
|
— |
| 11,900 |
| 11,900 |
| Q.P. Corp. |
| — |
| 102,930 |
| 102,930 |
|
— |
| 1,171 |
| 1,171 | L | Resona Holdings, Inc. |
| — |
| 3,194,454 |
| 3,194,454 |
|
— |
| 10,000 |
| 10,000 |
| Ricoh Co., Ltd. |
| — |
| 203,653 |
| 203,653 |
|
— |
| 3,800 |
| 3,800 |
| Rinnai Corp. |
| — |
| 113,472 |
| 113,472 |
|
— |
| 9,000 |
| 9,000 |
| Sanken Electric Co., Ltd. |
| — |
| 110,783 |
| 110,783 |
|
— |
| 2,100 |
| 2,100 |
| Sankyo Co., Ltd. |
| — |
| 115,929 |
| 115,929 |
|
— |
| 10,200 |
| 10,200 |
| Sega Sammy Holdings, Inc. |
| — |
| 274,194 |
| 274,194 |
|
20,700 |
| 72,400 |
| 93,100 |
| Seven & I Holdings Co., Ltd. |
| 643,667 |
| 2,251,279 |
| 2,894,946 |
|
3,360 |
| — |
| 3,360 |
| SFCG Co., Ltd.** |
| 521,907 |
| — |
| 521,907 |
|
20,000 |
| 9,900 |
| 29,900 |
| Shinko Electric Industries |
| 521,195 |
| 257,991 |
| 779,186 |
|
— |
| 164,300 |
| 164,300 | @ | Sojitz Corp. |
| — |
| 498,921 |
| 498,921 |
|
— |
| 71,600 |
| 71,600 |
| Stanley Electric Co., Ltd. |
| — |
| 1,430,410 |
| 1,430,410 |
|
— |
| 18,500 |
| 18,500 |
| Sumco Corp. |
| — |
| 1,563,451 |
| 1,563,451 |
|
111,000 |
| 16,000 |
| 127,000 |
| Sumitomo Chemical Co., Ltd. |
| 858,969 |
| 123,815 |
| 982,784 |
|
52,000 |
| — |
| 52,000 |
| Sumitomo Corp.** |
| 778,426 |
| — |
| 778,426 |
|
269,000 |
| 103,000 |
| 372,000 |
| Sumitomo Metal Industries Ltd. |
| 1,167,923 |
| 447,197 |
| 1,615,120 |
|
— |
| 64,000 |
| 64,000 |
| Sumitomo Metal Mining Co., Ltd. |
| — |
| 820,845 |
| 820,845 |
|
— |
| 444 |
| 444 |
| Sumitomo Mitsui Financial Group, Inc. |
| — |
| 4,545,907 |
| 4,545,907 |
|
41,000 |
| — |
| 41,000 |
| Sumitomo Rubber Industries, Inc.** |
| 528,883 |
| — |
| 528,883 |
|
60,000 |
| — |
| 60,000 |
| Sumitomo Trust & Banking Co., Ltd.** |
| 628,225 |
| — |
| 628,225 |
|
— |
| 12,600 |
| 12,600 |
| Suzuken Co., Ltd. |
| — |
| 473,731 |
| 473,731 |
|
137,000 |
| 625,000 |
| 762,000 | L | Taisei Corp. |
| 417,019 |
| 1,902,459 |
| 2,319,478 |
|
— |
| 51,300 |
| 51,300 |
| Takeda Pharmaceutical Co., Ltd. |
| — |
| 3,515,898 |
| 3,515,898 |
|
— |
| 17,000 |
| 17,000 |
| Tanabe Seiyaku Co., Ltd. |
| — |
| 222,307 |
| 222,307 |
|
— |
| 1,400 |
| 1,400 |
| TDK Corp. |
| — |
| 111,469 |
| 111,469 |
|
— |
| 4,600 |
| 4,600 |
| Tohoku Electric Power Co., Inc. |
| — |
| 114,979 |
| 114,979 |
|
24,900 |
| 3,500 |
| 28,400 |
| Tokyo Electric Power Co., Inc. |
| 804,427 |
| 113,072 |
| 917,499 |
|
— |
| 48,200 |
| 48,200 |
| Tokyo Electron Ltd. |
| — |
| 3,791,295 |
| 3,791,295 |
|
— |
| 55,000 |
| 55,000 |
| Toppan Printing Co., Ltd. |
| — |
| 605,937 |
| 605,937 |
|
129,000 |
| — |
| 129,000 |
| Toshiba Corp.** |
| 838,269 |
| — |
| 838,269 |
|
— |
| 145,000 |
| 145,000 |
| Tosoh Corp. |
| — |
| 639,493 |
| 639,493 |
|
— |
| 198,000 |
| 198,000 |
| Toyobo Co., Ltd. |
| — |
| 597,552 |
| 597,552 |
|
— |
| 54,000 |
| 54,000 |
| Toyota Motor Corp. |
| — |
| 3,614,058 |
| 3,614,058 |
|
— |
| 89,000 |
| 89,000 |
| UNY Co., Ltd. |
| — |
| 1,160,539 |
| 1,160,539 |
|
— |
| 1,730 |
| 1,730 |
| USS Co., Ltd. |
| — |
| 112,616 |
| 112,616 |
|
— |
| 46 |
| 46 |
| West Japan Railway Co. |
| — |
| 196,368 |
| 196,368 |
|
35,200 |
| 78,258 |
| 113,458 |
| Yamaha Motor Co., Ltd. |
| 1,106,468 |
| 2,459,942 |
| 3,566,410 |
|
— |
| 109,000 |
| 109,000 |
| Yaskawa Electric Corp. |
| — |
| 1,259,958 |
| 1,259,958 |
|
|
|
|
|
|
|
|
| 17,457,088 |
| 83,501,961 |
| 100,959,049 |
|
|
|
|
|
|
|
|
|
|
|
|
|
|
|
|
|
|
|
|
| Mexico: 0.2% |
|
|
|
|
|
|
|
7,400 |
| — |
| 7,400 |
| Fomento Economico Mexicano SA de CV ADR** |
| 856,624 |
| — |
| 856,624 |
|
|
|
|
|
|
|
|
| 856,624 |
| — |
| 856,624 |
|
|
|
|
|
|
|
|
|
|
|
|
|
|
|
|
|
|
|
|
| Netherlands: 4.9% |
|
|
|
|
|
|
|
— |
| 63,659 |
| 63,659 |
| Aegon NV |
| — |
| 1,208,040 |
| 1,208,040 |
|
— |
| 1,891 |
| 1,891 |
| Akzo Nobel NV |
| — |
| 115,228 |
| 115,228 |
|
— |
| 4,252 |
| 4,252 | @ | ASML Holding NV |
| — |
| 104,933 |
| 104,933 |
|
— |
| 113,177 |
| 113,177 |
| European Aeronautic Defence and Space Co. NV |
| — |
| 3,883,289 |
| 3,883,289 |
|
— |
| 26,264 |
| 26,264 | @ | Koninklijke Ahold NV |
| — |
| 278,617 |
| 278,617 |
|
— |
| 4,209 |
| 4,209 |
| Koninklijke DSM NV |
| — |
| 207,589 |
| 207,589 |
|
— |
| 1,013 |
| 1,013 |
| Rodamco Europe NV |
| — |
| 134,516 |
| 134,516 |
|
— |
| 158,353 |
| 158,353 |
| Royal Dutch Shell PLC - Class A |
| — |
| 5,521,366 |
| 5,521,366 |
|
49,000 |
| 118,674 |
| 167,674 |
| Royal Dutch Shell PLC - Class B |
| 1,713,177 |
| 4,149,174 |
| 5,862,351 |
|
— |
| 11,759 |
| 11,759 |
| SBM Offshore NV |
| — |
| 403,520 |
| 403,520 |
|
42,265 |
| — |
| 42,265 | @,L | Tele Atlas NV** |
| 888,869 |
| — |
| 888,869 |
|
20,204 |
| — |
| 20,204 | @ | Tomtom, Inc.** |
| 869,916 |
| — |
| 869,916 |
|
— |
| 127,362 |
| 127,362 |
| Unilever NV |
| — |
| 3,473,090 |
| 3,473,090 |
|
|
|
|
|
|
|
|
| 3,471,962 |
| 19,479,362 |
| 22,951,324 |
|
|
|
|
|
|
|
|
|
|
|
|
|
|
|
|
|
|
|
|
| New Zealand: 0.3% |
|
|
|
|
|
|
|
— |
| 21,285 |
| 21,285 |
| Contact Energy Ltd. |
| — |
| 124,731 |
| 124,731 |
|
— |
| 93,192 |
| 93,192 |
| Fletcher Building Ltd. |
| — |
| 725,270 |
| 725,270 |
|
— |
| 61,258 |
| 61,258 |
| Sky City Entertainment Group Ltd. |
| — |
| 222,007 |
| 222,007 |
|
— |
| 35,367 |
| 35,367 |
| Telecom Corp. of New Zealand Ltd. |
| — |
| 119,612 |
| 119,612 |
|
|
|
|
|
|
|
|
| — |
| 1,191,620 |
| 1,191,620 |
|
|
|
|
|
|
|
|
|
|
|
|
|
|
|
|
|
|
|
|
| Norway: 1.5% |
|
|
|
|
|
|
|
— |
| 1,951 |
| 1,951 |
| Aker Kvaerner ASA |
| — |
| 241,986 |
| 241,986 |
|
— |
| 39,244 |
| 39,244 |
| DNB NOR ASA |
| — |
| 555,303 |
| 555,303 |
|
30,280 |
| 87,689 |
| 117,969 |
| Norsk Hydro ASA |
| 934,660 |
| 2,706,717 |
| 3,641,377 |
|
— |
| 244,000 |
| 244,000 | @ | PAN Fish ASA |
| — |
| 221,886 |
| 221,886 |
|
33,850 |
| 31,851 |
| 65,701 | @ | Petroleum Geo-Services |
| 792,317 |
| 745,527 |
| 1,537,844 |
|
— |
| 7,800 |
| 7,800 |
| Statoil ASA |
| — |
| 205,377 |
| 205,377 |
|
— |
| 8,200 |
| 8,200 |
| Tandberg ASA |
| — |
| 123,019 |
| 123,019 |
|
— |
| 14,574 |
| 14,574 |
| Telenor ASA |
| — |
| 273,096 |
| 273,096 |
|
— |
| 6,950 |
| 6,950 |
| Yara International ASA |
| — |
| 157,296 |
| 157,296 |
|
|
|
|
|
|
|
|
| 1,726,977 |
| 5,230,207 |
| 6,957,184 |
|
|
|
|
|
|
|
|
|
|
|
|
|
|
|
|
|
|
|
|
| Portugal: 0.3% |
|
|
|
|
|
|
|
— |
| 31,566 |
| 31,566 |
| Banco Comercial Portugues SA |
| — |
| 116,505 |
| 116,505 |
|
— |
| 12,837 |
| 12,837 |
| Banco Espirito Santo SA |
| — |
| 230,638 |
| 230,638 |
|
— |
| 187,955 |
| 187,955 |
| Electricidade de Portugal SA |
| — |
| 952,472 |
| 952,472 |
|
— |
| 78,291 |
| 78,291 |
| Sonae SGPS SA |
| — |
| 155,793 |
| 155,793 |
|
|
|
|
|
|
|
|
| — |
| 1,455,408 |
| 1,455,408 |
|
|
|
|
|
|
|
|
|
|
|
|
|
|
|
|
|
|
|
|
| Singapore: 0.6% |
|
|
|
|
|
|
|
— |
| 87,000 |
| 87,000 |
| CapitaLand Ltd. |
| — |
| 350,098 |
| 350,098 |
|
— |
| 123,000 |
| 123,000 |
| ComfortDelgro Corp., Ltd. |
| — |
| 128,861 |
| 128,861 |
|
— |
| 146,000 |
| 146,000 |
| Fraser and Neave Ltd. |
| — |
| 426,395 |
| 426,395 |
|
— |
| 303,000 |
| 303,000 |
| Neptune Orient Lines Ltd. |
| — |
| 411,244 |
| 411,244 |
|
— |
| 15,000 |
| 15,000 |
| Singapore Airlines Ltd. |
| — |
| 170,808 |
| 170,808 |
|
— |
| 43,000 |
| 43,000 |
| Singapore Petroleum Co., Ltd. |
| — |
| 122,081 |
| 122,081 |
|
— |
| 220,135 |
| 220,135 |
| Singapore Telecommunications Ltd. |
| — |
| 469,468 |
| 469,468 |
|
— |
| 307,000 |
| 307,000 | @ | STATS ChipPAC Ltd. |
| — |
| 235,876 |
| 235,876 |
|
— |
| 9,000 |
| 9,000 |
| United Overseas Bank Ltd. |
| — |
| 113,515 |
| 113,515 |
|
— |
| 157,000 |
| 157,000 |
| Wing Tai Holdings Ltd. |
| — |
| 232,615 |
| 232,615 |
|
|
|
|
|
|
|
|
| — |
| 2,660,961 |
| 2,660,961 |
|
|
|
|
|
|
|
|
|
|
|
|
|
|
|
|
|
|
|
|
| South Africa: 0.2% |
|
|
|
|
|
|
|
20,000 |
| — |
| 20,000 |
| Sasol, Ltd. ADR** |
| 738,000 |
| — |
| 738,000 |
|
|
|
|
|
|
|
|
| 738,000 |
| — |
| 738,000 |
|
|
|
|
|
|
|
|
|
|
|
|
|
|
|
|
|
|
|
|
| South Korea: 0.1% |
|
|
|
|
|
|
|
7,837 |
| — |
| 7,837 |
| Kookmin Bank ADR** |
| 631,976 |
| — |
| 631,976 |
|
|
|
|
|
|
|
|
| 631,976 |
| — |
| 631,976 |
|
|
|
|
|
|
|
|
|
|
|
|
|
|
|
|
|
|
|
|
| Spain: 2.7% |
|
|
|
|
|
|
|
— |
| 26,778 |
| 26,778 |
| Banco Bilbao Vizcaya Argentaria SA |
| — |
| 643,355 |
| 643,355 |
|
— |
| 236,589 |
| 236,589 |
| Banco Santander Central Hispano SA |
| — |
| 4,405,541 |
| 4,405,541 |
|
— |
| 102,656 |
| 102,656 |
| Endesa SA |
| — |
| 4,855,342 |
| 4,855,342 |
|
— |
| 4,043 |
| 4,043 |
| Inditex SA |
| — |
| 217,485 |
| 217,485 |
|
— |
| 25,177 |
| 25,177 |
| Repsol YPF SA |
| — |
| 867,476 |
| 867,476 |
|
— |
| 80,159 |
| 80,159 |
| Telefonica SA |
| — |
| 1,701,832 |
| 1,701,832 |
|
— |
| 1,999 |
| 1,999 |
| Union Fenosa SA |
| — |
| 98,754 |
| 98,754 |
|
|
|
|
|
|
|
|
| — |
| 12,789,785 |
| 12,789,785 |
|
|
|
|
|
|
|
|
|
|
|
|
|
|
|
|
|
|
|
|
| Sweden: 1.3% |
|
|
|
|
|
|
|
26,500 |
| 16,153 |
| 42,653 |
| Atlas Copco AB |
| 856,442 |
| 522,042 |
| 1,378,484 |
|
— |
| 7,043 |
| 7,043 |
| Getinge AB |
| — |
| 157,662 |
| 157,662 |
|
— |
| 13,727 |
| 13,727 |
| Kungsleden AB |
| — |
| 210,234 |
| 210,234 |
|
— |
| 5,650 |
| 5,650 |
| Nobia AB |
| — |
| 216,826 |
| 216,826 |
|
— |
| 7,967 |
| 7,967 |
| Scania AB |
| — |
| 559,009 |
| 559,009 |
|
— |
| 18,512 |
| 18,512 |
| Ssab Svenskt Stal AB — Series A |
| — |
| 437,052 |
| 437,052 |
|
— |
| 5,400 |
| 5,400 |
| Ssab Svenskt Stal AB — Series B |
| — |
| 121,268 |
| 121,268 |
|
— |
| 6,248 |
| 6,248 |
| Svenska Handelsbanken AB |
| — |
| 188,501 |
| 188,501 |
|
— |
| 53,326 |
| 53,326 |
| Telefonaktiebolaget LM Ericsson |
| — |
| 214,432 |
| 214,432 |
|
— |
| 6,101 |
| 6,101 |
| Trelleborg AB |
| — |
| 145,636 |
| 145,636 |
|
— |
| 36,286 |
| 36,286 |
| Volvo AB |
| — |
| 2,491,818 |
| 2,491,818 |
|
|
|
|
|
|
|
|
| 856,442 |
| 5,264,480 |
| 6,120,922 |
|
|
|
|
|
|
|
|
|
|
|
|
|
|
|
|
|
|
|
|
| Switzerland: 4.1% |
|
|
|
|
|
|
|
— |
| 7,079 |
| 7,079 |
| Credit Suisse Group |
| — |
| 493,533 |
| 493,533 |
|
— |
| 1,918 |
| 1,918 |
| Holcim Ltd. |
| — |
| 175,406 |
| 175,406 |
|
— |
| 6,696 |
| 6,696 |
| Nestle SA |
| — |
| 2,375,119 |
| 2,375,119 |
|
— |
| 38,996 |
| 38,996 |
| Novartis AG |
| — |
| 2,240,174 |
| 2,240,174 |
|
— |
| 1,428 |
| 1,428 |
| Phonak Holding AG |
| — |
| 113,314 |
| 113,314 |
|
9,470 |
| 10,519 |
| 19,989 |
| Roche Holding AG |
| 1,694,312 |
| 1,881,992 |
| 3,576,304 |
|
— |
| 17,498 |
| 17,498 |
| Schindler Holding AG |
| — |
| 1,096,529 |
| 1,096,529 |
|
— |
| 16,278 |
| 16,278 |
| Swatch Group AG |
| — |
| 725,861 |
| 725,861 |
|
25,560 |
| 30,529 |
| 56,089 |
| UBS AG |
| 1,546,833 |
| 1,847,545 |
| 3,394,378 |
|
— |
| 5,488 |
| 5,488 |
| Unaxis Holding AG |
| — |
| 2,705,404 |
| 2,705,404 |
|
3,122 |
| 5,940 |
| 9,062 |
| Zurich Financial Services AG |
| 837,592 |
| 1,593,625 |
| 2,431,217 |
|
|
|
|
|
|
|
|
| 4,078,737 |
| 15,248,502 |
| 19,327,239 |
|
|
|
|
|
|
| United Kingdom: 20.4% |
|
|
|
|
|
|
|
— |
| 149,544 |
| 149,544 |
| 3i Group PLC |
| — |
| 2,948,470 |
| 2,948,470 |
|
— |
| 19,767 |
| 19,767 | @ | Acergy SA |
| — |
| 377,114 |
| 377,114 |
|
— |
| 134,092 |
| 134,092 |
| Amvescap PLC |
| — |
| 1,564,007 |
| 1,564,007 |
|
— |
| 3,053 |
| 3,053 |
| Anglo American PLC |
| — |
| 148,581 |
| 148,581 |
|
22,275 |
| 76,535 |
| 98,810 |
| AstraZeneca PLC |
| 1,193,750 |
| 4,101,622 |
| 5,295,372 |
|
— |
| 32,143 |
| 32,143 |
| Aviva PLC |
| — |
| 515,647 |
| 515,647 |
|
105,043 |
| 103,290 |
| 208,333 |
| Barclays PLC |
| 1,499,802 |
| 1,474,772 |
| 2,974,574 |
|
— |
| 3,759 |
| 3,759 | @ | Berkeley Group Holdings PLC |
| — |
| 125,663 |
| 125,663 |
|
— |
| 166,778 |
| 166,778 |
| BHP Billiton PLC |
| — |
| 3,054,198 |
| 3,054,198 |
|
— |
| 48,272 |
| 48,272 |
| Boots Group PLC |
| — |
| 790,164 |
| 790,164 |
|
— |
| 419,391 |
| 419,391 |
| BP PLC |
| — |
| 4,676,665 |
| 4,676,665 |
|
98,426 |
| 154,461 |
| 252,887 | @ | British Airways PLC |
| 1,014,829 |
| 1,592,582 |
| 2,607,411 |
|
33,121 |
| 50,227 |
| 83,348 |
| British American Tobacco PLC |
| 927,430 |
| 1,406,420 |
| 2,333,850 |
|
— |
| 87,174 |
| 87,174 |
| Brixton PLC |
| — |
| 980,071 |
| 980,071 |
|
— |
| 613,086 |
| 613,086 |
| BT Group PLC |
| — |
| 3,622,129 |
| 3,622,129 |
|
— |
| 103,271 |
| 103,271 |
| Cadbury Schweppes PLC |
| — |
| 1,102,993 |
| 1,102,993 |
|
17,875 |
| 14,657 |
| 32,532 |
| Carnival PLC |
| 902,990 |
| 740,426 |
| 1,643,416 |
|
— |
| 27,843 |
| 27,843 | @ | Collins Stewart PLC |
| — |
| 138,471 |
| 138,471 |
|
— |
| 82,940 |
| 82,940 |
| Corus Group PLC |
| — |
| 857,286 |
| 857,286 |
|
— |
| 63,341 |
| 63,341 |
| Davis Service Group PLC |
| — |
| 624,053 |
| 624,053 |
|
179,195 |
| 24,121 |
| 203,316 |
| First Choice Holidays PLC |
| 995,578 |
| 134,012 |
| 1,129,590 |
|
— |
| 15,819 |
| 15,819 |
| Firstgroup PLC |
| — |
| 177,428 |
| 177,428 |
|
— |
| 117,269 |
| 117,269 |
| FKI PLC |
| — |
| 236,111 |
| 236,111 |
|
— |
| 20,665 |
| 20,665 |
| George Wimpey PLC |
| — |
| 224,925 |
| 224,925 |
|
62,600 |
| 103,064 |
| 165,664 |
| GlaxoSmithKline PLC |
| 1,647,683 |
| 2,712,728 |
| 4,360,411 |
|
— |
| 177,446 |
| 177,446 |
| HBOS PLC |
| — |
| 3,922,697 |
| 3,922,697 |
|
128,503 |
| 236,667 |
| 365,170 |
| HSBC Holdings PLC |
| 2,338,734 |
| 4,307,302 |
| 6,646,036 |
|
— |
| 30,697 |
| 30,697 |
| Imperial Tobacco Group PLC |
| — |
| 1,208,184 |
| 1,208,184 |
|
— |
| 10,413 |
| 10,413 |
| Intercontinental Hotels Group PLC |
| — |
| 257,223 |
| 257,223 |
|
109,393 |
| 106,769 |
| 216,162 |
| International Power PLC |
| 814,786 |
| 795,242 |
| 1,610,028 |
|
— |
| 24,813 |
| 24,813 |
| Ladbrokes PLC |
| — |
| 202,245 |
| 202,245 |
|
— |
| 2,550 |
| 2,550 |
| Land Securities Group PLC |
| — |
| 115,650 |
| 115,650 |
|
360,297 |
| 387,913 |
| 748,210 |
| Legal & General Group PLC |
| 1,107,295 |
| 1,192,167 |
| 2,299,462 |
|
— |
| 9,911 |
| 9,911 |
| Lloyds TSB Group PLC |
| — |
| 111,415 |
| 111,415 |
|
— |
| 107,866 |
| 107,866 |
| LogicaCMG PLC |
| — |
| 391,475 |
| 391,475 |
|
— |
| 217,644 |
| 217,644 |
| Marks & Spencer Group PLC |
| — |
| 3,050,037 |
| 3,050,037 |
|
— |
| 54,079 |
| 54,079 |
| Misys PLC |
| — |
| 228,268 |
| 228,268 |
|
— |
| 231,064 |
| 231,064 |
| National Grid PLC |
| — |
| 3,344,267 |
| 3,344,267 |
|
— |
| 54,198 |
| 54,198 |
| Old Mutual PLC |
| — |
| 184,459 |
| 184,459 |
|
— |
| 58,142 |
| 58,142 |
| Premier Farnell PLC |
| — |
| 224,128 |
| 224,128 |
|
— |
| 2,409 |
| 2,409 |
| Reckitt Benckiser PLC |
| — |
| 109,892 |
| 109,892 |
|
76,482 |
| — |
| 76,482 |
| Reed Elsevier PLC** |
| 838,846 |
| — |
| 838,846 |
|
— |
| 29,092 |
| 29,092 |
| Resolution PLC |
| — |
| 364,760 |
| 364,760 |
|
— |
| 207,557 |
| 207,557 |
| Rexam PLC |
| — |
| 2,131,138 |
| 2,131,138 |
|
— |
| 10,959 |
| 10,959 |
| Rio Tinto PLC |
| — |
| 580,785 |
| 580,785 |
|
— |
| 411,972 |
| 411,972 |
| Royal & Sun Alliance Insurance Group |
| — |
| 1,201,287 |
| 1,201,287 |
|
— |
| 137,095 |
| 137,095 |
| Royal Bank of Scotland Group PLC |
| — |
| 5,335,489 |
| 5,335,489 |
|
— |
| 301,155 |
| 301,155 |
| Scottish & Newcastle PLC |
| — |
| 3,292,812 |
| 3,292,812 |
|
27,880 |
| — |
| 27,880 |
| Scottish & Southern Energy** |
| 846,674 |
| — |
| 846,674 |
|
— |
| 15,506 |
| 15,506 |
| Scottish Power PLC |
| — |
| 226,739 |
| 226,739 |
|
— |
| 32,226 |
| 32,226 |
| SSL International PLC |
| — |
| 233,009 |
| 233,009 |
|
— |
| 102,473 |
| 102,473 |
| Stagecoach Group PLC |
| — |
| 306,274 |
| 306,274 |
|
— |
| 67,178 |
| 67,178 |
| Taylor Woodrow PLC |
| — |
| 558,520 |
| 558,520 |
|
— |
| 435,040 |
| 435,040 |
| Tomkins PLC |
| — |
| 2,088,391 |
| 2,088,391 |
|
— |
| 3,165 |
| 3,165 |
| Travis Perkins PLC |
| — |
| 122,654 |
| 122,654 |
|
— |
| 27,843 |
| 27,843 | @ | Tullett Prebon PLC |
| — |
| 353,791 |
| 353,791 |
|
51,205 |
| 90,792 |
| 141,997 |
| Unilever PLC |
| 1,424,153 |
| 2,525,177 |
| 3,949,330 |
|
— |
| 216,968 |
| 216,968 |
| United Business Media PLC |
| — |
| 2,933,679 |
| 2,933,679 |
|
364,087 |
| 833,148 |
| 1,197,235 |
| Vodafone Group PLC |
| 1,005,488 |
| 2,300,879 |
| 3,306,367 |
|
— |
| 4,822 |
| 4,822 |
| Wolseley PLC |
| — |
| 116,293 |
| 116,293 |
|
|
|
|
|
|
|
|
| 16,558,038 |
| 78,642,866 |
| 95,200,904 |
|
|
|
|
|
|
|
|
|
|
|
|
|
|
|
|
|
|
|
|
| Total Common Stock |
| 79,049,579 |
| 370,656,980 |
| 449,706,559 |
|
|
|
|
|
|
| (Cost $) |
| 65,311,349 |
| 337,879,247 |
| 403,190,596 |
|
|
|
|
|
|
|
|
|
|
|
|
|
|
|
PREFERRED STOCK: 1.4% |
|
|
|
|
|
|
|
|
|
|
| ||
|
|
|
|
|
| Germany: 1.4% |
|
|
|
|
|
|
|
— |
| 30,881 |
| 30,881 |
| RWE AG |
| — |
| 2,921,977 |
| 2,921,977 |
|
— |
| 45,723 |
| 45,723 |
| Volkswagen AG |
| — |
| 3,408,360 |
| 3,408,360 |
|
|
|
|
|
|
|
|
|
|
|
|
|
|
|
|
|
|
|
|
| Total Preferred Stock |
| — |
| 6,330,337 |
| 6,330,337 |
|
|
|
|
|
|
| (Cost $) |
| — |
| 4,839,435 |
| 4,839,435 |
|
|
|
|
|
|
|
|
|
|
|
|
|
|
|
|
|
|
|
|
| Total Long-Term Investments |
| 79,049,579 |
| 376,987,317 |
| 456,036,896 |
|
|
|
|
|
|
| (Cost $) |
| 65,311,349 |
| 342,718,682 |
| 408,030,031 |
|
|
| Principal |
|
|
|
|
|
|
| Value |
|
|
| ||
SHORT-TERM INVESTMENTS: 2.5% |
|
|
|
|
|
|
|
|
|
|
| ||||
|
|
|
|
|
| Repurchase Agreement: 0.1% |
|
|
|
|
|
|
| ||
$ 447,000 |
| $ — |
| $ 447,000 |
| Goldman Sachs Repurchase Agreement dated 12/29/06, 5.220%, due 01/02/07, $447,259 to be received upon repurchase (Collateralized by $455,000 Federal Home Loan Bank, 4.625%, Market Value plus accrued interest $460,398, due 02/08/08)** |
| $ 447,000 |
| $ — |
| $ 447,000 |
| ||
|
|
|
|
|
|
|
|
|
|
|
|
|
| ||
|
|
|
|
|
| Total Repurchase Agreement |
| 447,000 |
| — |
| 447,000 |
| ||
|
|
|
|
|
|
|
|
|
|
|
|
|
| ||
|
|
|
|
|
| Securities Lending Collateralcc: 2.4% |
|
|
|
|
|
|
| ||
2,781,095 |
| 8,380,339 |
| 11,161,434 |
| The Bank of New York Institutional Cash Reserves Fund |
| 2,781,095 |
| 8,380,339 |
| 11,161,434 |
| ||
|
|
|
|
|
|
|
|
|
|
|
|
|
| ||
|
|
|
|
|
| Total Securities Lending Collateral: |
| 2,781,095 |
| 8,380,339 |
| 11,161,434 |
| ||
|
|
|
|
|
| (Cost $) |
| 2,781,095 |
| 8,380,339 |
| 11,161,434 |
| ||
|
|
|
|
|
|
|
|
|
|
|
|
|
| ||
|
|
|
|
|
| Total Short-Term Investments |
| 3,228,095 |
| 8,380,339 |
| 11,608,434 |
| ||
|
|
|
|
|
| (Cost $) |
| 3,228,095 |
| 8,380,339 |
| 11,608,434 |
| ||
|
|
|
|
|
|
|
|
|
|
|
|
|
| ||
|
|
|
|
|
| Total Investments In Securities |
| 100.2 | % | 82,277,674 |
| 385,367,656 |
| 467,645,330 |
|
|
|
|
|
|
| (Cost $)* |
|
|
| 68,539,444 |
| 351,099,021 |
| 419,638,465 |
|
|
|
|
|
|
| Other Assets and Liabilities - Net |
| (0.2 | ) | (2,828,537) |
| 1,947,622 |
| (880,915) |
|
|
|
|
|
|
| Net Assets |
|
|
| 79,449,137 |
| 387,315,278 |
| 466,764,415 |
|
|
|
|
|
|
|
|
|
|
|
|
|
|
|
|
|
|
|
|
|
|
| Pro Forma Adjustments |
| (0.0 | ) |
|
|
|
| (33,800) |
|
|
|
|
|
|
|
|
|
|
|
|
|
|
|
|
|
|
|
|
|
|
| Net Assets after Pro Forma Adjustments |
| 100.0 | % | 79,449,137 |
| 387,315,278 |
| 466,730,615 |
|
|
|
|
|
| Certain foreign securities may have been fair valued in | |
|
|
|
|
|
| accordance with procedures approved by the Board of |
|
|
|
|
|
| Directors /Trustees (note 2A). |
|
|
|
|
|
|
|
|
|
|
|
| @ | Non-income producing security |
|
|
|
|
| cc | Securities purchased with cash collateral for securities loaned. |
|
|
|
|
| ADR | American Depositary Receipt |
|
|
|
|
| GDR | Global Depositary Receipt |
|
|
|
|
| I | Illiquid security |
|
|
|
|
| L | Loaned security, a portion or all of the security is on loan at |
|
|
|
|
|
| December 31, 2006. |
* Cost for federal income tax purposes is |
| $ 68,625,206 |
| $ 352,416,243 |
| $ 421,041,449 |
|
|
|
|
|
|
|
|
|
** If the Reorganization is approved, the Portfolio Security is expected to be sold prior to or shortly after the Reorganization. |
|
|
|
|
|
|
|
|
|
|
|
|
|
|
|
Net unrealized appreciation consists of: |
|
|
|
|
|
|
|
Gross Unrealized Appreciation |
| $ 14,795,549 |
| $ 37,166,241 |
| $ 51,961,790 |
|
Gross Unrealized Depreciation |
| (1,143,081 | ) | (4,214,828 | ) | (5,357,909 | ) |
Net Unrealized Appreciation |
| $ 13,652,468 |
| $ 32,951,413 |
| $ 46,603,881 |
|