UNITED STATES
SECURITIES AND EXCHANGE COMMISSION
Washington, D.C. 20549
FORM N-CSR
CERTIFIED SHAREHOLDER REPORT OF REGISTERED
MANAGEMENT INVESTMENT COMPANIES
Investment Company Act file number: 811-05631
First Pacific Mutual Fund, Inc.
(Exact name of registrant as specified in charter)
3113 Olu Street
Honolulu, HI 96816-1425
(Address of principal executive offices) (Zip code)
Nancy P. O’Hara
Drinker Biddle & Reath LLP
One Logan Square
Suite #2000
Philadelphia, PA 19103-6996
(Name and address of agent for service)
Registrant's telephone number, including area code: 808-988-8088
Date of fiscal year end: September 30
Date of reporting period: March 31, 2014
Item 1. Reports to Stockholders.
First Pacific Low Volatility Fund
May 9, 2014
Dear fellow shareholder,
On June 10, 2011 the First Pacific Low Volatility Fund (“Fund”) commenced operations as a new series of First Pacific Mutual Fund, Inc. The investment objective of the Fund is to achieve long-term capital appreciation and preservation of capital while lowering volatility.
Equity markets have performed strongly in the six months ending March 31, 2014. The Fund had a net asset value (“NAV”) of $11.26 on October 1, 2013 and a NAV of $11.35 on March 31, 2014, which resulted in a 10.19% return* for the six month period. During the same period, the return for the Fund’s benchmark, the Dow Jones Moderately Aggressive Portfolio Index, was 7.77%*.
On December 21, 2013 the Fund paid a capital gain distribution of $1.02 a share and dividend income of $0.01 per share.
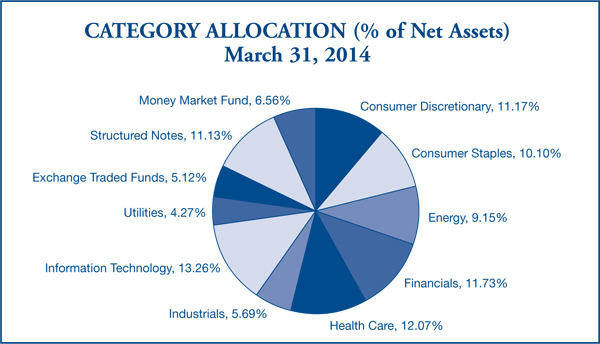
Domestic equity markets remain strong. The portfolio manager continues to invest primarily in equity securities of U.S. companies by investing in large, medium and/or small capitalization securities, mainly with market capitalizations at the time of purchase of $2 billion or greater. At the end of the reporting period, the Fund held 77.44% of net assets in common stocks.
The Fund continues to utilize structured notes in an effort to reduce market volatility. The portfolio’s structured note holdings performed well during the reporting period as the reference equity indices increased. The portfolio manager increased the holdings in structured notes during the period as a result of favorable market and credit conditions. At the end of the reporting period, the Fund held 11.13% of net assets in structured notes.
At March 31, 2014, the portfolio had a cash allocation of 6.56% in the Federated Government Obligation-I money market fund.
On the following pages you will find our March 31, 2014 Semi-Annual Report. If you have any questions or would like us to provide information about the Fund to your family or friends, please call us at (808) 988-8088 or (800) 354-9654.
On a final note, we would like to express our gratitude to our investors. We appreciate your confidence in our firm in the management of your assets.
Warmest Aloha,
Terrence K.H. Lee
President and CEO
* Return is not annualized.
Before investing, read the prospectus carefully. Please carefully consider the Fund’s investment objective, risks, and charges and expenses before investing. The prospectus contains this and other information about the Fund. This Semi-Annual Report must be accompanied or preceded by a prospectus.
The Fund’s yield, share price and investment return fluctuate so that you may receive more or less than your original investment upon redemption. Low volatility investing does not guarantee a profit or protect against a loss in a generally declining market. Past performance is no guarantee of future results. The Fund is a series of First Pacific Mutual Fund, Inc.
Mutual fund investing involves risks. Principal loss is possible. The First Pacific Low Volatility Fund’s investments in structured notes may subject the Fund to greater interest rate, credit and counterparty risks and costs than traditional equity funds. The price of structured notes may be volatile and they may have a limited trading market, making it difficult to value or sell them. Structured notes are also subject to risks of debt instruments, including interest rate and call risks, but may have a greater risk of loss than a typical debt security of the same maturity and credit quality. In exchange for the issuer’s guarantee of full or partial payment of principal on maturity, the upside return the Fund could achieve on its investment may be capped or limited and the issuer’s guarantee is generally available only if the Fund holds the structured note to maturity. The Fund also invests in options which may be more volatile and less liquid, increasing the risk of loss when compared to traditional securities. The Fund may also invest in foreign securities which, especially in emerging markets, involve greater volatility and political, economic, regulatory and currency risks and differences in accounting methods. The Fund may invest in small, mid or large companies. Investment in smaller companies involves additional risks such as limited liquidity and greater volatility than larger companies. The Fund’s investments in other investment companies, including exchange traded funds, subjects the Fund to those risks affecting that investment company, including a possible decrease in the value of the underlying securities. The Fund will also incur brokerage costs when it purchases exchange traded funds and will incur its pro rata share of the underlying investment company’s expenses. Writing call options is a highly specialized activity which involves greater liquidity, counterparty and equity price risks. This is not a complete list of risks that may affect the Fund. For additional information concerning the risks applicable to the Fund, please see the Fund’s prospectus.
Lee Financial Securities, Inc./Distributor
May 28, 2014
This report may contain certain forward-looking statements about factors that may affect the performance of the Fund in the future. These statements are based on the predictions and expectations of Lee Financial Group Inc., the Fund’s investment manager (the “Investment Manager”) concerning certain future events, such as performance of the economy, changes in interest rates and other factors that may impact the performance of the Fund. The Investment Manager believes that these forward looking statements are reasonable, although they are inherently uncertain and difficult to predict. Actual events may cause adjustments in portfolio management strategies from those currently expected to be employed.
YOUR FUND’S EXPENSES
As a Fund shareholder, you can incur the following costs:
| • | Ongoing Fund costs, including management fees, distribution and service (12b-1) fees, and other Fund expenses. All mutual funds have ongoing costs, sometimes referred to as operating expenses. |
The following table shows ongoing costs of investing in the Fund and can help you understand these costs and compare them with those of other mutual funds. The table assumes a $1,000 investment held for the period indicated.
Actual Fund Expenses
The first line (Actual) for the share class listed in the table below provides actual account values and expenses. The “Ending Account Value” is derived from the Fund’s actual return, which includes the effect of Fund expenses.
You can estimate the expenses you paid during the period, by following these steps. Of course, your account value and expenses will differ from those in this illustration:
| 1. | Divide your account value by $1,000. |
If an account had an $8,600 value, the $8,600 ¸ $1,000 = 8.6.
| 2. | Multiply the result by the number under the heading “Expenses Paid During Period.” |
If Expenses Paid During Period were $7.50, then 8.6 x $7.50 = $64.50.
In this illustration, the estimated expenses paid this period are $64.50.
Hypothetical Example for Comparison with Other Funds
Information in the second line (Hypothetical) for each class in the table can help you compare ongoing costs of investing in the Fund with those of other mutual funds. This information may not be used to estimate the actual ending account balance or expenses you paid during the period. The hypothetical “Ending Account Value” is based on the actual expense ratio for the share class and an assumed 5% annual rate of return before expenses, which does not represent the Fund’s actual return. The figure under the heading “Expenses Paid During Period” shows the hypothetical expenses your account would have incurred under this scenario. You can compare this figure with the 5% hypothetical examples that appear in shareholder reports of other funds.
Please note that expenses shown in the table are meant to highlight ongoing costs. Therefore, the second line is useful in comparing ongoing costs only, and will not help you compare total costs of owning different funds. Please refer to the Fund prospectus for additional information on operating expenses.
| | Beginning Account Value 10/01/13 | Ending Account Value 03/31/14 | Expenses Paid During Period* 10/01/13 - 03/31/14 |
| First Pacific Low Volatility Fund | | | |
| Actual | $1,000.00 | $1,101.90 | $7.13 |
| Hypothetical | $1,000.00 | $1,018.15 | $6.84 |
* Expenses are equal to the annualized expense ratio (1.36%), which is net of fee waivers, multiplied by the average account value over the period, multiplied by 182/365 to reflect the one-half year period.
FIRST PACIFIC LOW VOLATILITY FUND
SCHEDULE OF INVESTMENTS
March 31, 2014 (Unaudited)
| COMMON STOCK – 77.44% | | | | | | |
| | | Shares | | | Value | |
| CONSUMER DISCRETIONARY – 11.17% | | | | | | |
| Hanesbrands, Inc. | | | 19,000 | | | | 1,453,120 | |
| The Home Depot, Inc. | | | 21,500 | | | | 1,701,295 | |
| Toyota Motor Corporation - ADR | | | 10,000 | | | | 1,129,000 | |
| | | | | | | | 4,283,415 | |
| | | | | | | | | |
| CONSUMER STAPLES – 10.10% | | | | | | | | |
| CVS Caremark Corporation | | | 13,000 | | | | 973,180 | |
| Cotsco Wholesale Corporation | | | 17,100 | | | | 1,909,728 | |
| Wal-Mart Stores, Inc. | | | 13,000 | | | | 993,590 | |
| | | | | | | | 3,876,498 | |
| | | | | | | | | |
| ENERGY – 9.15% | | | | | | | | |
| Phillips 66 | | | 31,800 | | | | 2,450,508 | |
Southwestern Energy Company (a) | | | 23,000 | | | | 1,058,230 | |
| | | | | | | | 3,508,738 | |
| | | | | | | | | |
| FINANCIALS – 11.73% | | | | | | | | |
| The Goldman Sachs Group, Inc. | | | 11,800 | | | | 1,933,430 | |
| The PNC Financial Services Group, Inc. | | | 12,000 | | | | 1,044,000 | |
| Prudential Financial, Inc. | | | 18,000 | | | | 1,523,700 | |
| | | | | | | | 4,501,130 | |
| | | | | | | | | |
| HEALTH CARE – 12.07% | | | | | | | | |
Mylan, Inc. (a) | | | 61,600 | | | | 3,007,928 | |
| PerkinElmer, Inc. | | | 36,000 | | | | 1,622,160 | |
| | | | | | | | 4,630,088 | |
| | | | | | | | | |
| INDUSTRIALS – 5.69% | | | | | | | | |
| 3M Company | | | 16,100 | | | | 2,184,126 | |
| | | | | | | | 2,184,126 | |
See accompanying notes to financial statements.
FIRST PACIFIC LOW VOLATILITY FUND
SCHEDULE OF INVESTMENTS – (Continued)
March 31, 2014 (Unaudited)
| | | Shares | | | Value | |
| INFORMATION TECHNOLOGY – 13.26% | | | | | | |
| Apple Inc. | | | 2,300 | | | | 1,234,502 | |
| Corning Incorporated | | | 65,000 | | | | 1,353,300 | |
EBAY, Inc. (a) | | | 15,000 | | | | 828,600 | |
Google Inc. (a) | | | 1,500 | | | | 1,671,765 | |
| | | | | | | | 5,088,167 | |
| | | | | | | | | |
| UTILITIES – 4.27% | | | | | | | | |
One Gas, Inc. (a) | | | 6,000 | | | | 215,580 | |
| Oneok, Inc. | | | 24,000 | | | | 1,422,000 | |
| | | | | | | | 1,637,580 | |
| | | | | | | | | |
| Total Common Stocks (Cost $24,854,141) | | | | | | | 29,709,742 | |
| | | | | | | | | |
| EXCHANGE TRADED FUNDS (ETFs) – 5.12% | | | | | | | | |
| iShares U.S. Real Estate | | | 29,000 | | | | 1,962,430 | |
| Total ETFs (Cost $1,904,141) | | | | | | | 1,962,430 | |
See accompanying notes to financial statements.
FIRST PACIFIC LOW VOLATILITY FUND
SCHEDULE OF INVESTMENTS – (Continued)
March 31, 2014 (Unaudited)
| | | Shares | | | Value | |
| STRUCTURED NOTES – 11.13% | | | | | | |
| | | | | | | |
JP Morgan Chase & Co. Capped Buffered Return Enhanced Notes Linked to the Russell 2000 Index Due 10/09/2014 (a) Return at maturity of 150.00% of the appreciation, if any, of the Russell 2000 Index up to cap of 15.00% and losses of 100% of the depreciation of the Russell 2000 Index in excess of 10%. | | | 1,600,000 | | | | 1,776,320 | |
| | | | | | | | | |
The Bank of Nova Scotia Capped Buffered Notes Linked to the S&P 500 Index Due 10/29/2014 (a) Return at maturity of 100.00% of the appreciation, if any, of the S&P 500 Index up to cap of 8.25% and losses of 100% of the depreciation of the S&P 500 Index in excess of 10%. | | | 1,600,000 | | | | 1,686,880 | |
| | | | | | | | | |
Deutsche Bank Capped Buffered Notes Linked to the iShares MSCI Emerging Markets ETF Due 04/29/2015(a) Return at maturity of 100% of the appreciation, if any, of the iShares MSCI Emerging Markets ETF up to cap of 8.30% and losses of 100% of the depreciation of the iShares MSCI Emerging Markets ETF in excess of 15%. | | | 800,000 | | | | 807,200 | |
| | | | | | | | | |
| Total Structured Notes (Cost $4,000,000) | | | | | | | 4,270,400 | |
| | | | | | | | | |
| MONEY MARKET FUND – 6.56% | | | | | | | | |
| | | | | | | | | |
| Federated Government Obligation-I | | | 2,514,624 | | | | 2,514,624 | |
| | | | | | | | | |
| Money Market Fund (Cost $2,514,624) | | | | | | | 2,514,624 | |
| | | | | | | | | |
Total Investments (Cost $33,272,906) (b) | | | 100.25 | % | | | 38,457,196 | |
| | | | | | | | | |
| Other Assets Less Liabilities | | | (0.25 | )% | | | (94,076 | ) |
| | | | | | | | | |
| Net Assets | | | 100.00 | % | | $ | 38,363,120 | |
| | (a) | Non-Income producing security. |
| | (b) | Aggregate cost for federal income tax purposes is $33,272,906. |
At March 31, 2014, unrealized appreciation (depreciation) of securities for federal income tax purposes is as follows:
| Gross unrealized appreciation | | $ | 5,270,173 | |
| Gross unrealized depreciation | | | (85,883 | ) |
| Net unrealized appreciation | | $ | 5,184,290 | |
See accompanying notes to financial statements.
FIRST PACIFIC LOW VOLATILITY FUND
STATEMENT OF ASSETS AND LIABILITIES
March 31, 2014 (Unaudited)
| | | Low Volatility Fund | |
| ASSETS | | | |
| Investments at market value | | | |
(Identified cost $33,272,906) (Note 1 (A)) | | $ | 38,457,196 | |
| Income receivable | | | 18,578 | |
| Subscriptions receivable | | | 34,976 | |
| Other Assets | | | 18,460 | |
| Total assets | | | 38,529,210 | |
| | | | | |
| LIABILITIES | | | | |
| Redemptions payable | | | 113,422 | |
| Management fee payable | | | 21,478 | |
| Administration fee payable | | | 661 | |
| Distribution Plan payable | | | 4,956 | |
| Shareholder Servicing fee payable | | | 3,304 | |
| Transfer Agent fee payable | | | 1,982 | |
| Chief Compliance Officer fee payable | | | 1,752 | |
| Directors fee payable | | | 836 | |
| Directors expenses payable | | | 32 | |
| Accrued Expenses | | | 17,667 | |
| | | | | |
| Total liabilities | | | 166,090 | |
| | | | | |
| NET ASSETS | | $ | 38,363,120 | |
| (Applicable to 3,379,955 shares outstanding, $.01 par value, 20,000,000 shares authorized) | | | | |
| | | | | |
| NET ASSET VALUE, OFFERING AND REPURCHASE PRICE PER SHARE, INVESTOR CLASS SHARES | | $ | 11.35 | |
| | | | | |
| NET ASSETS | | | | |
| At March 31, 2014, net assets consisted of: | | | | |
| Paid-in capital | | $ | 33,655,902 | |
| Undistributed net investment income | | | 676 | |
| Accumulated net realized loss on investments | | | (477,748 | ) |
| Net unrealized appreciation on investments | | | 5,184,290 | |
| | | | | |
| | | $ | 38,363,120 | |
See accompanying notes to financial statements.
FIRST PACIFIC LOW VOLATILITY FUND
STATEMENT OF OPERATIONS
For the six months ended March 31, 2014 (Unaudited)
| | | Low Volatility Fund | |
| INVESTMENT INCOME | | | |
| Dividend Income | | $ | 276,830 | |
| Interest income | | | 250 | |
| Total investment income | | | 277,080 | |
| | | | | |
| Expenses | | | | |
Management fee (Note 2) | | | 192,960 | |
Distribution costs (Notes 2 and 3) | | | 28,944 | |
Transfer Agent fee (Note 2) | | | 11,577 | |
Shareholder Services fee (Note 2) | | | 19,296 | |
Administration fee (Note 2) | | | 3,859 | |
| Accounting fee | | | 21,840 | |
| Legal and Audit fees | | | 13,868 | |
| Custodian fee | | | 4,550 | |
| Insurance | | | 1,232 | |
| Registration fee | | | 13,921 | |
Chief Compliance Officer fee (Note 2) | | | 9,738 | |
| Directors fee | | | 2,687 | |
| Directors expenses | | | 2,593 | |
| Mailing fee | | | 3,094 | |
| | | | | |
| Total expenses | | | 330,159 | |
| | | | | |
Management fees waived (Note 2) | | | (67,536 | ) |
| Net Expenses | | | 262,623 | |
| | | | | |
| Net investment income | | | 14,457 | |
| | | | | |
| NET REALIZED AND UNREALIZED GAIN (LOSS) ON INVESTMENTS | | | | |
| Net realized gain (loss) on transactions from: | | | | |
| Investments | | | 267,995 | |
| Options | | | — | |
| | | | | |
| Net change in unrealized appreciation (depreciation) on transactions from: | | | | |
| Investments | | | 3,450,563 | |
| Options | | | — | |
| | | | | |
| Net realized and unrealized gain on investments | | | 3,718,558 | |
| | | | | |
| NET INCREASE IN NET ASSETS RESULTING FROM OPERATIONS | | $ | 3,733,015 | |
See accompanying notes to financial statements.
FIRST PACIFIC LOW VOLATILITY FUND
STATEMENTS OF CHANGES IN NET ASSETS
| | | For The Six Months Ended March 31, 2014 (Unaudited) | | | For the year end September 30, 2013 | |
| | | | | | | |
| INCREASE (DECREASE) IN NET ASSETS FROM | | | | | | |
| Operations | | | | | | |
| Net investment income | | $ | 14,457 | | | $ | 87,475 | |
| Net realized gain on investments | | | 267,995 | | | | 2,620,918 | |
| Increase in unrealized appreciation of investments | | | 3,450,563 | | | | 234,357 | |
| | | | | | | | | |
| Net increase in net assets resulting from operations | | | 3,733,015 | | | | 2,942,750 | |
| | | | | | | | | |
| Distributions to shareholders from: | | | | | | | | |
| Net investment income | | | | | | | | |
| ($0.01 and $0.02 per share, respectively) | | | (29,513 | ) | | | (71,743 | ) |
| Capital gains | | | | | | | | |
| ($1.02 and $0.10 per share, respectively) | | | (3,350,110 | ) | | | (289,101 | ) |
| | | | | | | | | |
| Total distributions to shareholders | | | (3,379,623 | ) | | | (360,844 | ) |
| | | | | | | | | |
Capital share transactions (a) | | | | | | | | |
| Increase in net assets resulting from capital share transactions | | | 869,699 | | | | 3,863.511 | |
| | | | | | | | | |
| Total increase in net assets | | | 1,223,091 | | | | 6,445,417 | |
| | | | | | | | | |
| NET ASSETS | | | | | | | | |
| Beginning of period | | | 37,140,029 | | | | 30,694,612 | |
| | | | | | | | | |
| End of period | | $ | 38,363,120 | | | $ | 37,140,029 | |
(a) Summary of capital share activity follows:
| | | For The Six Months Ended March 31, 2014 | | | For The Year Ended September 30, 2013 | |
| | | Shares | | | Value | | | Shares | | | Value | |
| Shares sold | | | 188,321 | | | $ | 2,139,670 | | | | 712,508 | | | $ | 7,761,641 | |
| Shares issued on reinvestment of distributions | | | 305,572 | | | | 3,379,623 | | | | 35,869 | | | | 360,844 | |
| | | | 493,893 | | | | 5,519,293 | | | | 748,377 | | | | 8,122,485 | |
| Shares redeemed | | | (413,428 | ) | | | (4,649,594 | ) | | | (394,005 | ) | | | (4,258,974 | ) |
| Net increase | | | 80,465 | | | $ | 869,699 | | | | 354,372 | | | $ | 3,863,511 | |
See accompanying notes to financial statements.
FIRST PACIFIC LOW VOLATILITY FUND
FINANCIAL HIGHLIGHTS
(For a share outstanding throughout each period)
| | | For The Six Months Ended March 31, 2014 | | | Years and Period Ended September 30, | |
| | | (Unaudited) | | | 2013 | | | 2012 | | | | 2011* | |
| Net asset value | | | | | | | | | | | | | |
| Beginning of period | | $ | 11.26 | | | $ | 10.42 | | | $ | 9.17 | | | $ | 10.00 | |
| | | | | | | | | | | | | | | | | |
| Income from investment operations | | | | | | | | | | | | | | | | |
| Net investment income | | | .00 | | | | .03 | | | | (.01 | ) | | | (.03 | ) |
| Net gain (loss) on securities | | | | | | | | | | | | | | | | |
| (both realized and unrealized) | | | 1.12 | | | | .93 | | | | 1.26 | | | | (.80 | ) |
| Total from investment operations | | | 1.12 | | | | .96 | | | | 1.25 | | | | (.83 | ) |
| | | | | | | | | | | | | | | | | |
| Less distributions | | | | | | | | | | | | | | | | |
| Dividends from net investment income | | | (.01 | ) | | | (.02 | ) | | | — | | | | — | |
| Distributions from capital gains | | | (1.02 | ) | | | (.10 | ) | | | — | | | | — | |
| Total distributions | | | (1.03 | ) | | | (.12 | ) | | | — | | | | — | |
| | | | | | | | | | | | | | | | | |
| End of period | | $ | 11.35 | | | $ | 11.26 | | | $ | 10.42 | | | $ | 9.17 | |
| | | | | | | | | | | | | | | | | |
| Total return | | | 10.19 | %+ | | | 9.34 | % | | | 13.63 | % | | | -8.30 | %+ |
| | | | | | | | | | | | | | | | | |
| Ratios/Supplemental Data | | | | | | | | | | | | | | | | |
| Net assets, end of period (in 000’s) | | $ | 38,363 | | | $ | 37,140 | | | $ | 30,695 | | | $ | 20,910 | |
| | | | | | | | | | | | | | | | | |
| Ratio of expenses to average net assets | | | 1.71 | %** | | | 1.77 | % | | | 1.93 | % | | | 2.28 | %** |
before fee waivers (a) | | | | | | | | | | | | | | | | |
| | | | | | | | | | | | | | | | | |
| Ratio of expenses to average net assets | | | 1.36 | %** | | | 1.42 | % | | | 1.77 | % | | | 2.28 | %** |
after fee waivers (a) | | | | | | | | | | | | | | | | |
| | | | | | | | | | | | | | | | | |
| Ratio of net investment income to | | | | | | | | | | | | | | | | |
average net assets before fee waivers (a) | | | -0.27 | %** | | | -0.08 | % | | | -0.30 | % | | | -1.58 | %** |
| | | | | | | | | | | | | | | | | |
| Ratio of net investment income to | | | | | | | | | | | | | | | | |
average net assets after fee waivers (a) | | | 0.08 | %** | | | 0.27 | % | | | -0.14 | % | | | -1.58 | %** |
| | | | | | | | | | | | | | | | | |
| Portfolio turnover | | | 24.43 | %+ | | | 228.93 | % | | | 81.84 | % | | | 18.42 | %+ |
| * | Commenced operations June 10, 2011. |
| (a) | Does not include expenses of the investment companies in which the Fund invests. |
See accompanying notes to financial statements.
FIRST PACIFIC LOW VOLATILITY FUND
NOTES TO FINANCIAL STATEMENTS
March 31, 2014 (Unaudited)
| (1) | ORGANIZATION AND SUMMARY OF SIGNIFICANT ACCOUNTING POLICIES |
First Pacific Low Volatility Fund (“Fund”) is a series of First Pacific Mutual Fund, Inc. which is registered under the Investment Company Act of 1940 as a non-diversified open-end management investment company. First Pacific Mutual Fund, Inc. currently has two investment portfolios, including the Fund which is currently offering one Class of Shares: Investor Shares.
The investment objective of the Fund is to achieve long-term capital appreciation and preservation of capital while lowering volatility. The Fund seeks to achieve its objective by normally investing primarily in equity securities of U.S. companies and allocating a portion of total assets to structured notes. The Fund also may invest in exchange traded funds that invest in domestic or foreign securities, foreign securities, real estate investment trusts, fixed income securities, short-term debt instruments, cash and cash equivalents, and convertible bonds and convertible preferred stock. It also may write and purchase covered call and put options.
Structured notes are specially designed debt instruments whose principal and interest payments are linked to, and whose values rise or fall in response to, the value of an index, basket of securities, interest rate benchmark or other financial asset. Structured notes are subject to interest rate risk. They are also subject to credit risk with respect both to the issuer and, if applicable, to the underlying security. The price of structured notes may be volatile and they may have a limited trading market, making it difficult to value them or sell them at an acceptable price. In exchange for the issuer’s guarantee of full or partial payment of principal on maturity, the upside return the Fund could achieve on its investment may be capped or limited and the issuer’s guarantee is generally available only if the Fund holds the structured note to maturity. There may be higher fees and costs associated with structured notes than other types of investments. In some cases, the Fund may enter into agreements with an issuer of structured notes to purchase a minimum amount of those notes over time. Structured notes are also subject to counterparty risk, which is the risk that the other party to the transaction will not fulfill its contractual obligations.
The Fund may write (sell) covered call options on securities. If the option is exercised by the purchaser prior to the expiration, the Fund is required to deliver the underlying security against payment of the exercise price. Writing call options is a highly specialized activity and entails greater than ordinary investment risks. The successful use of options depends in part on the future price fluctuations and the degree of correlation between the options and the securities markets. The value of the Fund’s positions in options will fluctuate in response to changes in the value of the underlying security or index, as applicable. Portfolio assets covering written options cannot be sold while the option is outstanding, unless replaced with similar assets. As a result there is a possibility that segregation of a large percentage of the Fund’s assets could affect its portfolio management as well as the ability of the Fund to meet redemption requests or other current obligations. Unusual market conditions or the lack of a ready market for any particular option at a specific time may reduce the effectiveness of the Fund’s option strategies. Over-the-counter options may be considered illiquid and are also subject to counterparty risk, which is the risk that the other party to the contract will not fulfill its contractual obligation to complete the transaction with the Fund. The Fund did not enter into any options transactions during the semi-annual period ended March 31, 2014.
FIRST PACIFIC LOW VOLATILITY FUND
NOTES TO FINANCIAL STATEMENTS – (Continued)
March 31, 2014 (Unaudited)
The Fund’s investments in other investment companies subjects it to those risks affecting the investment company, including the possibility that the value of the underlying securities held by the investment company could decrease. The Fund will incur its pro rata share of the underlying investment company’s expenses. The Fund may purchase ETFs which may trade at a discount to its net asset value. Investors in the Fund will indirectly bear fees and expenses charged by the underlying ETFs in which the Fund invests in addition to the Fund’s direct fees and expenses. The Fund will also incur brokerage costs when it purchases shares of ETFs. In addition, the Fund will be affected by losses of the underlying ETF and the level of risk arising from the investment practices of the underlying ETF.
The Fund may purchase fixed income securities which will change in value in response to interest rate changes and other factors, such as the perception of the issuer's creditworthiness. For example, the value of fixed income securities will generally decrease when interest rates rise, which may cause the value of the Fund to decrease. In addition, an underlying fund's investment in fixed income securities with longer maturities will fluctuate more in response to interest rate changes.
Portfolio securities that are fixed income (debt) securities are valued by an independent pricing agent using methodologies that it believes are appropriate, including actual market transactions, broker-dealer supplied valuations, matrix pricing, or other electronic data processing techniques designed to identify market values for such securities, in accordance with procedures established in good faith by the Board of Directors. Structured notes are valued at the closing price or evaluated bid as provided daily by independent pricing agents. Equity securities listed on a securities exchange or an automated quotation system for which quotations are readily available will be valued at the last quoted sale price on the principal exchange on which they are traded on the valuation date (or at approximately 4:00 p.m. Eastern Time if a security’s principal exchange is normally open at that time), or, if there is no such reported sale on the valuation date, at the closing bid price. Securities traded over-the-counter will be valued at the last reported sale price on the Nasdaq Trade Reporting Facility, Alternative Display Facility or other facility that reports trades of over-the-counter securities. If there is no such reported sale on the valuation date, over-the-counter securities will be valued at the most recently quoted bid price. Nasdaq listed securities are valued at the Nasdaq Official Closing Price. Options listed for trading on a securities exchange or board of trade will be valued at the last quoted sale price or, in the absence of a sale, at the mean of the closing bid and ask prices. In the absence of a last quoted sales price or mean price, options are valued at the closing ask price (for short positions). Futures contracts and options thereon, which are traded on commodities exchanges, are valued at their daily settlement value as of the close of such commodities exchanges. Redeemable securities issued by open-end investment companies are valued at the investment company’s applicable net asset value. Exchange-traded open-end investment companies and closed-end investment companies are priced as equity securities. Foreign securities are often principally traded on markets that close at different hours than U.S. markets. Such securities will be valued at their most recent closing prices on the relevant principal exchange even if the close of that exchange is earlier than the time of the Fund’s net asset value (“NAV”) calculation. However, securities traded in foreign markets which remain open as of the time of the NAV calculation will be valued at the most recent sales price as of the time of the NAV calculation. In addition, prices for certain foreign securities may be obtained from the Fund’s approved independent pricing agents. Securities with remaining maturities of 60 days or less are valued on the amortized cost basis as reflecting fair value.
FIRST PACIFIC LOW VOLATILITY FUND
NOTES TO FINANCIAL STATEMENTS – (Continued)
March 31, 2014 (Unaudited)
Securities for which market quotations are not readily available or for which available prices are believed to be suspect will be valued at “fair value” using methods determined in good faith by or at the direction of the Board of Directors. For these purposes, “fair value” means the price that the Investment Manager reasonably expects the Fund could receive from an arm’s-length buyer upon the current sale of the securities within seven (7) days, after considering all appropriate factors and indications of value available to them. Such value will be cost if the Investment Manager determines such valuation is appropriate after considering a multitude of factors in accordance with established procedures.
The Fund utilizes various methods to measure the fair value of most of its investments on a recurring basis. U.S. generally accepted accounting principles (“GAAP”) establishes a hierarchy that prioritizes inputs to valuation methods. The three levels of inputs are:
Level 1 – Unadjusted quoted prices in active markets for identical assets or liabilities that the Fund has the ability to access.
Level 2 – Observable inputs other than quoted prices included in Level 1 that are observable for the asset or liability, either directly or indirectly. These inputs may include quoted prices for the identical instrument on an inactive market, prices for similar instruments, interest rates, prepayment speeds, credit risk, yield curves, default rates and similar data.
Level 3 – Unobservable inputs for the asset or liability, to the extent relevant observable inputs are not available, representing the Fund’s own assumptions about the assumptions a market participant would use in valuing the asset or liability, and would be based on the best information available.
The availability of observable inputs can vary from security to security and is affected by a wide variety of factors, including for example, the type of security, whether the security is new and not yet established in the marketplace, the liquidity of markets, and other characteristics particular to the security. To the extent that valuation is based on models or inputs that are less observable or unobservable in the market, the determination of fair value requires more judgment. Accordingly, the degree of judgment exercised in determining fair value is greatest for instruments categorized in Level 3.
The inputs used to measure fair value may fall into different levels of the fair value hierarchy. In such cases, for disclosure purposes, the level in the fair value hierarchy within which the fair value measurement falls in its entirety, is determined based on the lowest level input that is significant to the fair value measurement in its entirety.
Changes in valuation techniques may result in transfers in/out changing an investment’s assigned level within the hierarchy.
The following is a description of the valuation techniques applied to the Fund’s major categories of financial instruments measured at fair value on a recurring basis:
Common Stocks and Exchange–Traded Funds, to the extent these securities are actively traded and valuation adjustments are not applied, are categorized in Level 1 of the fair value hierarchy. Preferred stock and other equities traded on inactive markets or valued by reference to similar instruments are categorized in Level 2 of the fair value hierarchy.
FIRST PACIFIC LOW VOLATILITY FUND
NOTES TO FINANCIAL STATEMENTS – (Continued)
March 31, 2014 (Unaudited)
Structured Notes are categorized in Level 2 of the fair value hierarchy.
Investment in registered open-end investment management companies are categorized as Level 1 of the fair value hierarchy.
Options listed for trading on a securities exchange or board of trade, and which are actively traded, are categorized in Level 1 of the fair value hierarchy.
The following is a summary of the inputs used in valuing the Fund’s investments, as of March 31, 2014. The inputs or methodology used for valuing securities are not necessarily an indication of the risks associated with investing in those securities.
Valuation Inputs at Reporting Date:
| Description | | Level 1 | | | Level 2 | | | Level 3 | | | Total | |
| Assets | | | | | | | | | | | | |
| Common Stocks | | $ | 29,709,742 | | | $ | -0- | | | $ | -0- | | | $ | 29,709,742 | |
| Exchange Traded Funds | | $ | 1,962,430 | | | $ | -0- | | | $ | -0- | | | $ | 1,962,430 | |
| Structured Notes | | $ | -0- | | | $ | 4,270,400 | | | $ | -0- | | | $ | 4,270,400 | |
| Money Market Fund | | $ | 2,514,624 | | | $ | -0- | | | $ | -0- | | | $ | 2,514,624 | |
| | | | | | | | | | | | | | | | | |
| Total Investments | | $ | 34,186,796 | | | $ | 4,270,400 | | | $ | —0- | | | $ | 38,457,196 | |
| | | | | | | | | | | | | | | | | |
| Liabilities | | | | | | | | | | | | | | | | |
| Written covered call options | | $ | -0- | | | $ | -0- | | | $ | -0- | | | $ | -0- | |
There were no transfers in to and out of Levels 1 and 2 during the current period presented.
The following is a reconciliation of Level 3 assets for which significant unobservable inputs were used to determine fair value during the course of the March 31, 2014 period.
| | | Structured Notes at Value | |
| Balance as of 09/30/2013 | | $ | —0- | |
| Realized gain (loss) | | $ | — | |
| Change in unrealized appreciation (depreciation) | | $ | — | |
| Purchases (sales) | | $ | 800,000 | |
| Transfers in and/or out of Level 3 | | $ | 800,000 | |
| Balance as of 03/31/2014 | | $ | —0- | |
It is the Fund’s policy to comply with the requirements of the Internal Revenue Code applicable to regulated investment companies and to distribute their taxable income, if any, to their shareholders. Therefore, no federal income tax provision is required.
The Fund has reviewed all open tax years for all major jurisdictions, which is the Federal jurisdiction, and concluded that there are no significant uncertain tax positions that would require recognition in the financial statements. As of September 30, 2013, open Federal tax years include the tax year ended September 30, 2011 through September 30, 2013. The Fund has no examination in progress and is also not aware of any tax positions for which it is reasonably possible that the total amounts of unrecognized tax benefits will significantly change in the next twelve months.
FIRST PACIFIC LOW VOLATILITY FUND
NOTES TO FINANCIAL STATEMENTS – (Continued)
March 31, 2014 (Unaudited)
In order to avoid imposition of the excise tax applicable to regulated investment companies, the Fund intends to declare each year as dividends in each calendar year at least 98% of its net investment income (earned during the calendar year) and 98% of its net realized capital gains (earned during the twelve months ended October 31) plus undistributed amounts, if any, from prior years.
On December 22, 2010, the Regulated Investment Company Modernization Act of 2010 (the “Act”) was enacted. The Act modernizes several of the federal income and excise tax provisions related to regulated investment companies such as the Fund, and, with certain exceptions, is effective for taxable years beginning after December 22, 2010. Among the changes made are changes to the capital loss carryforward rules allowing for capital losses to be carried forward indefinitely. At September 30, 2013, the First Pacific Low Volatility Fund did not have any capital loss carryforwards to offset current year gains.
The Fund did not incur any net capital losses after October 31, 2012. Net capital losses incurred after October 31, and within the taxable year are deemed to arise on the first business day of the Fund’s next taxable year.
| | (C) | SECURITY TRANSACTIONS, INVESTMENT INCOME AND DISTRIBUTIONS TO SHAREHOLDERS |
Security transactions are recorded on the trade date. Interest income is recorded on the accrual basis. Net realized gains and losses from investment transactions are reported on an identified cost basis. Interest income is recognized using the accrual method and includes accretion of original issue and market discount and amortization of premium. Dividend income is recognized on the ex-dividend date, except that certain dividends from foreign securities are recorded as soon as the information becomes available after the ex-dividend date. The Fund intends to pay income dividends at least annually.
The preparation of financial statements in conformity with accounting principles generally accepted in the United States of America requires management to make estimates and assumptions that affect the reported amounts of assets and liabilities at the date of the financial statements and the reported amounts of revenues and expenses during the reporting period. Actual results could differ from those estimates.
The net asset value per share for the Fund is determined by calculating the total value of the Fund’s assets, deducting its total liabilities and dividing the result by the number of shares outstanding.
| (2) | INVESTMENT MANAGEMENT FEE AND OTHER TRANSACTIONS WITH AFFILIATES |
Lee Financial Group Inc. (“LFG”) provides the Fund with management and administrative services pursuant to a management agreement and administrative services agreement, respectively. In accordance with the terms of the management agreement and of the administrative services agreement, LFG receives compensation at the annual rate of 1.00% and up to .05% of the Fund’s average daily net assets, respectively. The Investment Manager has voluntarily agreed to waive 0.35% of its 1.00% management fees through January 31, 2015. For the period ended March 31, 2014, the Fund was allocated, and paid LFG, $9,738 for the Chief Compliance Officer fee.
The Fund’s distributor, Lee Financial Securities, Inc. (“LFS”), a wholly-owned subsidiary of LFG, received $28,944 for costs incurred in connection with the sale of the Fund’s shares (See Note 3).
FIRST PACIFIC LOW VOLATILITY FUND
NOTES TO FINANCIAL STATEMENTS – (Continued)
March 31, 2014 (Unaudited)
Lee Financial Recordkeeping, Inc. (“LFR”), a wholly-owned subsidiary of LFG, serves as the transfer agent for the Fund. In accordance with the terms of the transfer agent agreement, LFR receives compensation at the annual rate of .06% of the Fund’s average daily net assets. LFR has delegated certain of its duties and responsibilities to Ultimus Fund Solutions, LLC as sub-transfer agent. LFR also provides the Fund with certain clerical, bookkeeping and shareholder services pursuant to a service agreement approved by the Fund’s directors. As compensation for these services LFR receives a fee, computed daily and payable monthly, at an annualized rate of .10% of the Fund’s average daily net assets.
Certain officers and directors of the Fund are also officers of LFG, LFS and LFR.
The Fund’s Board of Directors, including a majority of the Directors who are not “interested persons” of the Fund, as defined in the Investment Company Act of 1940, adopted a distribution plan pursuant to Rule 12b-1 of the Act. Rule 12b-1 regulates the manner in which a regulated investment company may assume costs of distributing and promoting the sales of its shares.
The Plan provides that the First Pacific Low Volatility Fund Investor Class may incur certain costs, which may not exceed .25% per annum of the Fund’s average daily net assets, for payment to the distributor for items such as advertising expenses, selling expenses, commissions or travel, reasonably intended to result in sales of shares of the Fund.
| (4) | PURCHASES AND SALES OF SECURITIES |
Purchases and sales of securities aggregated $10,911,012 and $8,351,550, respectively, for the Fund during the six month period October 1, 2013 through March 31, 2014.
| (5) | TAX COMPONENTS OF CAPITAL AND DISTRIBUTIONS TO SHAREHOLDERS |
For the period ending September 30, 2013, the Fund distributed $333,484 in ordinary income and $27,360 in long term gains.
The tax character of distributable earnings at September 30, 2013 were as follows:
| | | Undistributed Net Investment | | | Undistributed | | | Capital Loss | | | | | | | | | | |
| | | Income | | | Capital Gains | | | Carryforwards | | | Losses | | | (Loss)* | | | Earnings | |
| First Pacific Low Volatility Fund | | $ | 915,936 | | | $ | 2,004,275 | | | $ | — | | | $ | — | | | $ | 1,433,615 | | | $ | 4,353,826 | |
| | * | The difference between book basis and tax basis unrealized appreciation is attributable to recognition of wash sales. |
FIRST PACIFIC LOW VOLATILITY FUND
NOTES TO FINANCIAL STATEMENTS – (Continued)
March 31, 2014 (Unaudited)
Accounting principles generally accepted in the United States of America require that certain components of net assets be reclassified between financial and tax reporting. These reclassifications have no effect on net assets or net asset value per share.
| (6) | SUBSEQUENT EVENTS DISCLOSURE |
In preparing the Fund’s financial statements as of March 31, 2014, the Fund’s management considered the impact of subsequent events for potential recognition or disclosure in these financial statements.
FIRST PACIFIC LOW VOLATILITY FUND (Unaudited)
Shareholder Information
Household Delivery of Shareholder Documents: Only one Prospectus, Annual and Semi-Annual Report will be sent to shareholders with the same last name and address on their Fund account, unless you request multiple copies. If you would like to receive separate copies, please call us at (808) 988-8088. We will begin sending you additional copies within 30 days. If your shares are held through a service provider, please contact them directly.
Business Continuity Plan Summary Disclosure Statement: First Pacific Mutual Fund, Inc., Lee Financial Group Inc., Lee Financial Securities, Inc. and Lee Financial Recordkeeping, Inc. have developed Business Continuity Plans on how we will respond to events that significantly disrupt our business. Since the timing and impact of disasters and disruptions is unpredictable, we will have to be flexible in responding to actual events as they occur. Contacting Us - If after a significant business disruption you cannot contact us as you usually do at (808) 988-8088, you should go to our website at www.LeeHawaii.com. Please visit our website at www.LeeHawaii.com for the Business Continuity Plan Disclosure Statement.
Proxy Voting Policies and Procedures
The Fund has established Proxy Voting Policies and Procedures (“Policies”) that the Fund uses to determine how to vote proxies relating to portfolio securities. Shareholders may request copies of the Policies free of charge by calling (808) 988-8088 or by sending a written request to Lee Financial Group Inc., 3113 Olu Street, Honolulu, HI 96816-1425. Copies of the Fund’s proxy voting records are posted on the Securities and Exchange Commission’s website at www.sec.gov and the Fund’s website at www.LeeHawaii.com and reflect the 12-month period beginning July 1, 2012 and ending June 30, 2013.
Quarterly Statement of Investments
The Fund files a complete statement of investments with the Securities and Exchange Commission for the first and third quarters for each fiscal year on Form N-Q. Shareholders may view the filed Form N-Q by visiting the Commission’s website at www.sec.gov or the Fund’s website at www.LeeHawaii.com. The filed form may also be viewed and copied at the Commission’s Public Reference Room in Washington, DC. Information regarding the operations of the Public Reference Room may be obtained by calling 1-800-SEC-0330.
INVESTMENT MANAGER
Lee Financial Group Inc.
3113 Olu Street
Honolulu, Hawaii 96816-1425
DISTRIBUTOR
Lee Financial Securities, Inc.
3113 Olu Street
Honolulu, Hawaii 96816-1425
FUND ACCOUNTANT
Ultimus Fund Solutions, LLC
225 Pictoria Drive, Suite 450
Cincinnati, Ohio 45246
CUSTODIAN
Union Bank, N.A.
350 California Street, 6th Floor
San Francisco, California 94104
LEGAL COUNSEL
Drinker Biddle & Reath LLP
One Logan Square
Suite #2000
Philadelphia, Pennsylvania 19103-6996
TRANSFER AGENT
Lee Financial Recordkeeping, Inc.
3113 Olu Street
Honolulu, Hawaii 96816-1425
 | Hawaii Municipal Fund |
May 9, 2014
Dear fellow shareholder,
The April tax season has just passed, and as Hawaii taxpayers, many of us felt the impact of paying high taxes. In fact, as a Hawaii resident, as much as $42 of $100 of our taxable income could go to the government in income taxes.
According to the Tax Foundation, the average employee in Hawaii works until April 15th to pay his taxes. In this tough economy, every dollar we save makes a difference. We believe that investing in tax-free funds such as the Hawaii Municipal Fund can help reduce our tax burden. As shareholders of the Fund, you are earning tax-free income* and supporting local projects designed to enrich our community. The money raised through municipal bonds is commonly used to build schools, hospitals, roads, airports, harbors, and water and electrical systems that serve to create jobs and improve the quality of life here in our islands.
Interest rates are the most important of many factors which can affect bond prices. For the period October 1, 2013 through March 31, 2014 the Federal Reserve left the Fed Funds rate unchanged in the range of 0 - .25%. During this period the yield curve was basically unchanged with the 10 year treasury bond yield rising from 2.66% to 2.73%. At the same time state budget difficulties began to moderate and the credit outlook for Hawaii bonds strengthened. This accounts for the Hawaii Municipal Fund’s six month per share price increase of $0.22 per share. The primary investment strategy of the Hawaii Municipal Fund is to purchase investment grade long-term Hawaii municipal bonds. The past six months performance for the Fund, which is presented in this Semi-Annual Report, was primarily a result of the implementation of this strategy.
We believe that the economy is slowly recovering from a number of crises — housing, credit and financial. However, spending by people and businesses remains weak, and the economy continues to be plagued with high unemployment. This would normally be a positive for the bond market, but because of massive federal stimulus injections, we believe that there continues to be a higher than normal inflationary risk which may impact the municipal bond market in the intermediate term.
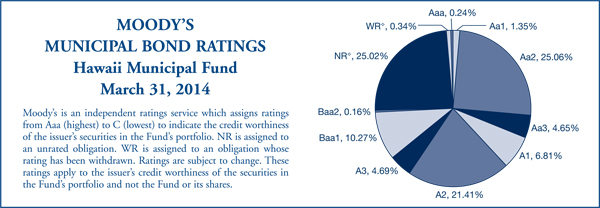
* Primarily all of the investments in the Hawaii Municipal Fund portfolio are investment grade securities. Only 0.34% of the municipal bonds purchased for the portfolio are deemed to be below investment grade by the Investment Manager.
On the following pages you will find our March 31, 2014 Semi-Annual Report. If you have any questions or would like us to provide information about the Fund to your family or friends, please call us at (808) 988-8088.
Thank you for your business. As always, we look forward to providing you with the high level of service that you have come to expect.
Warmest Aloha,
Terrence K.H. Lee
President and CEO
*Some income may be subject to the federal alternative minimum tax for certain investors. Income may also be subject to capital gains taxes.
Before investing, read the prospectus carefully. Please carefully consider the Fund’s investment objective, risks, and charges and expenses before investing. The prospectus contains this and other information about the Fund. This Semi-Annual Report must be accompanied or preceded by a prospectus.
The Fund’s yield, share price and investment return fluctuate so that you may receive more or less than your original investment upon redemption. Past performance is no guarantee of future results. The Fund is a series of First Pacific Mutual Fund, Inc.
Mutual fund investing includes risks. Principal loss is possible. The Fund’s investments in municipal bonds subjects the Fund to interest rate, credit, call and geographic concentration risk. This is not a complete list of risks that may affect the Fund. For additional information concerning the risks applicable to the Fund, please see the Fund’s prospectus.
Lee Financial Securities, Inc./Distributor
May 28, 2014
This report may contain certain forward-looking statements about factors that may affect the performance of the Fund in the future. These statements are based on the predictions and expectations of Lee Financial Group Inc., the Fund’s investment manager, (the “Investment Manager”), concerning certain future events, such as performance of the economy, changes in interest rates and other factors that may impact the performance of the Fund. The Investment Manager believes that these forward looking statements are reasonable, although they are inherently uncertain and difficult to predict. Actual events may cause adjustments in portfolio management strategies from those currently expected to be employed.
YOUR FUND’S EXPENSES
As a Fund shareholder, you can incur the following costs:
| • | Ongoing Fund costs, including management fees, distribution and service (12b-1) fees, and other Fund expenses. All mutual funds have ongoing costs, sometimes referred to as operating expenses. |
The following table shows ongoing costs of investing in the Fund and can help you understand these costs and compare them with those of other mutual funds. The table assumes a $1,000 investment held for the six months indicated.
Actual Fund Expenses
The first line (Actual) for the share class listed in the table below provides actual account values and expenses. The “Ending Account Value” is derived from the Fund’s actual return, which includes the effect of Fund expenses.
You can estimate the expenses you paid during the period, by following these steps. Of course, your account value and expenses will differ from those in this illustration:
| 1. | Divide your account value by $1,000. |
If an account had an $8,600 value, the $8,600 ¸ $1,000 = 8.6.
| 2. | Multiply the result by the number under the heading “Expenses Paid During Period.” |
If Expenses Paid During Period were $7.50, then 8.6 x $7.50 = $64.50.
In this illustration, the estimated expenses paid this period are $64.50.
Hypothetical Example for Comparison with Other Funds
Information in the second line (Hypothetical) for each class in the table can help you compare ongoing costs of investing in the Fund with those of other mutual funds. This information may not be used to estimate the actual ending account balance or expenses you paid during the period. The hypothetical “Ending Account Value” is based on the actual expense ratio for the share class and an assumed 5% annual rate of return before expenses, which does not represent the Fund’s actual return. The figure under the heading “Expenses Paid During Period” shows the hypothetical expenses your account would have incurred under this scenario. You can compare this figure with the 5% hypothetical examples that appear in shareholder reports of other funds.
Please note that expenses shown in the table are meant to highlight ongoing costs. Therefore, the second line is useful in comparing ongoing costs only, and will not help you compare total costs of owning different funds. Please refer to the Fund prospectus for additional information on operating expenses.
| | Beginning Account Value 10/01/13 | Ending Account Value 03/31/2014 | Expenses Paid During Period* 10/01/13 – 03/31/14 |
| Hawaii Municipal Fund Investor Class | | | |
| Actual | $1,000.00 | $1,035.60 | $5.33 |
| Hypothetical | $1,000.00 | $1,019.70 | $5.29 |
*Expenses are equal to the annualized expense ratio (1.05%), multiplied by the average account value over the period, multiplied by 182/365 to reflect the one-half year period.
HAWAII MUNICIPAL FUND
SCHEDULE OF INVESTMENTS
March 31, 2014 (Unaudited)
| Par Value | | | | | | | Value (Note 1 (A)) | |
| | | | | | | | | |
HAWAII MUNICIPAL BONDS – 97.13% | |
| | | | Hawaii County | | | |
| | | | General Obligation Bonds – 3.14% | | | |
| $ | 1,755,000 | | | | 5.000 | %, | 07/15/21 | | $ | 1,942,645 | |
| | 370,000 | | | | 5.000 | %, | 07/15/24 | | | 375,080 | |
| | 1,210,000 | | | | 5.000 | %, | 03/01/25 | | | 1,358,273 | |
| | 1,265,000 | | | | 5.000 | %, | 03/01/26 | | | 1,414,156 | |
| | | | | | | | | | | 5,090,154 | |
| | | | | | | | | | | | |
| | | | | Hawaii State | | | | |
| | | | | General Obligation Bonds – 4.09% | | | | |
| | 4,000,000 | | | | 5.000 | %, | 06/01/25 | | | 4,560,280 | |
| | 1,850,000 | | | | 5.000 | %, | 05/01/27 | | | 2,083,285 | |
| | | | | | | | | | | 6,643,565 | |
| | | | | | | | | | | | |
| | | | | Airport Systems Revenue Bonds – 9.04% | | | | |
| | 1,000,000 | | | | 5.000 | %, | 07/01/24 | | | 1,090,520 | |
| | 665,000 | | | | 5.250 | %, | 07/01/26 | | | 756,903 | |
| | 11,280,000 | | | | 5.250 | %, | 07/01/27 | | | 12,825,022 | |
| | | | | | | | | | | 14,672,445 | |
| | | | | | | | | | | | |
| | | | | Certificates of Participation–State Office Buildings – 4.53% | | | | |
| | 1,500,000 | | | | 5.000 | %, | 05/01/15 | | | 1,576,305 | |
| | 4,200,000 | | | | 5.000 | %, | 05/01/17 | | | 4,672,710 | |
| | 500,000 | | | | 4.000 | %, | 05/01/19 | | | 551,100 | |
| | 500,000 | | | | 4.000 | %, | 05/01/20 | | | 544,690 | |
| | | | | | | | | | | 7,344,805 | |
| | | | | | | | | | | | |
| | | | | Department of Budget & Finance Special Purpose Revenue Bonds
Hawaiian Electric Company, Inc. – 10.00% | | | | |
| | 4,400,000 | | | | 4.800 | %, | 01/01/25 | | | 4,417,600 | |
| | 7,000,000 | | | | 4.600 | %, | 05/01/26 | | | 7,049,000 | |
| | 5,000,000 | | | | 4.650 | %, | 03/01/37 | | | 4,756,150 | |
| | | | | | | | | | | 16,222,750 | |
| | | | | | | | | | | | |
| | | | | Chaminade University – 3.12% | | | | |
| | 2,750,000 | | | | 5.000 | %, | 01/01/26 | | | 2,784,155 | |
| | 1,270,000 | | | | 4.700 | %, | 01/01/31 | | | 1,272,438 | |
| | 1,000,000 | | | | 4.750 | %, | 01/01/36 | | | 1,002,420 | |
| | | | | | | | | | | 5,059,013 | |
See accompanying notes to financial statements.
HAWAII MUNICIPAL FUND
SCHEDULE OF INVESTMENTS – (Continued)
March 31, 2014 (Unaudited)
| Par Value | | | | | | | Value (Note 1 (A)) | |
| | | | | | | | | |
| | | | Hawaii Pacific Health – 4.59% | | | |
| $ | 775,000 | | | | 4.625 | %, | 07/01/21 | | $ | 848,044 | |
| | 6,000,000 | | | | 5.500 | %, | 07/01/40 | | | 6,380,100 | |
| | 200,000 | | | | 5.750 | %, | 07/01/40 | | | 214,814 | |
| | | | | | | | | | | 7,442,958 | |
| | | | | Hawaii Mid-Pacific Institute – 2.21% | | | | |
| | 2,085,000 | | | | 5.000 | %, | 01/01/26 | | | 2,099,032 | |
| | 1,635,000 | | | | 4.625 | %, | 01/01/36 | | | 1,495,387 | |
| | | | | | | | | | | 3,594,419 | |
| | | | | | | | | | | | |
| | | | | Kuakini Hawaii Health System – 0.33% | | | | |
| | 530,000 | | | | 6.300 | %, | 07/01/22 | | | 532,035 | |
| | | | | | | | | | | | |
| | | | | Kahala Nui – 6.88% | | | | |
| | 300,000 | | | | 3.350 | %, | 11/15/19 | | | 300,366 | |
| | 300,000 | | | | 3.600 | %, | 11/15/20 | | | 298,767 | |
| | 250,000 | | | | 3.800 | %, | 11/15/21 | | | 249,665 | |
| | 500,000 | | | | 5.000 | %, | 11/15/21 | | | 542,090 | |
| | 1,065,000 | | | | 4.625 | %, | 11/15/27 | | | 1,070,815 | |
| | 1,200,000 | | | | 5.000 | %, | 11/15/27 | | | 1,273,212 | |
| | 3,200,000 | | | | 5.125 | %, | 11/15/32 | | | 3,295,296 | |
| | 4,055,000 | | | | 5.250 | %, | 11/15/37 | | | 4,139,263 | |
| | | | | | | | | | | 11,169,474 | |
| | | | | | | | | | | | |
| | | | | Department of Hawaiian Homelands – 2.64% | | | | |
| | 1,000,000 | | | | 5.875 | %, | 04/01/34 | | | 1,071,500 | |
| | 3,000,000 | | | | 6.000 | %, | 04/01/39 | | | 3,210,360 | |
| | | | | | | | | | | 4,281,860 | |
| | | | | | | | | | | | |
| | | | | Hawaiian Homelands – COP Kapolei – 3.99% | | | | |
| | 210,000 | | | | 3.750 | %, | 11/01/16 | | | 222,012 | |
| | 950,000 | | | | 4.125 | %, | 11/01/23 | | | 972,030 | |
| | 5,100,000 | | | | 5.000 | %, | 11/01/31 | | | 5,276,664 | |
| | | | | | | | | | | 6,470,706 | |
See accompanying notes to financial statements.
HAWAII MUNICIPAL FUND
SCHEDULE OF INVESTMENTS – (Continued)
March 31, 2014 (Unaudited)
| Par Value | | | | | | | Value (Note 1 (A)) | |
| | | | | | | | | |
| | | | Department of Transportation Airports COP – 4.57% | | | |
| $ | 1,000,000 | | | | 5.000 | %, | 08/01/23 | | $ | 1,086,900 | |
| | 1,000,000 | | | | 5.250 | %, | 08/01/24 | | | 1,103,840 | |
| | 725,000 | | | | 5.250 | %, | 08/01/25 | | | 798,493 | |
| | 2,570,000 | | | | 5.250 | %, | 08/01/26 | | | 2,820,010 | |
| | 1,000,000 | | | | 5.000 | %, | 08/01/27 | | | 1,069,120 | |
| | 500,000 | | | | 5.000 | %, | 08/01/28 | | | 530,975 | |
| | | | | | | | | | | 7,409,338 | |
| | | | | | | | | | | | |
| | | | | Harbor Capital Improvements Revenue Bonds – 3.31% | | | | |
| | 1,580,000 | | | | 5.250 | %, | 01/01/16 | | | 1,597,396 | |
| | 1,665,000 | | | | 5.375 | %, | 01/01/17 | | | 1,683,332 | |
| | 2,005,000 | | | | 5.250 | %, | 01/01/21 | | | 2,089,029 | |
| | | | | | | | | | | 5,369,757 | |
| | | | | | | | | | | | |
| | | | | Hawaii Health Systems – 0.72% | | | | |
| | 1,164,000 | | | | 4.700 | %, | 02/15/19 | | | 1,171,100 | |
| | | | | | | | | | | | |
| | | | | Highway Revenue – 1.16% | | | | |
| | 1,640,000 | | | | 5.000 | %, | 01/01/26 | | | 1,874,832 | |
| | | | | | | | | | | | |
| | | | | Housing Authority | | | | |
| | | | | Single Family Mortgage Special Purpose Revenue Bonds – 0.19% | | | | |
| | 305,000 | | | | 5.000 | %, | 07/01/36 | | | 308,279 | |
| | | | | | | | | | | | |
| | | | | HFDC Rental Housing System Revenue Bonds – 3.90% | | | | |
| | 810,000 | | | | 4.750 | %, | 07/01/22 | | | 836,503 | |
| | 600,000 | | | | 4.750 | %, | 07/01/23 | | | 623,076 | |
| | 895,000 | | | | 5.000 | %, | 07/01/24 | | | 934,756 | |
| | 100,000 | | | | 5.000 | %, | 07/01/25 | | | 104,490 | |
| | 990,000 | | | | 6.000 | %, | 07/01/26 | | | 1,066,270 | |
| | 1,055,000 | | | | 6.000 | %, | 07/01/27 | | | 1,127,605 | |
| | 785,000 | | | | 6.000 | %, | 07/01/28 | | | 834,502 | |
| | 750,000 | | | | 6.000 | %, | 07/01/29 | | | 795,502 | |
| | | | | | | | | | | 6,322,704 | |
See accompanying notes to financial statements.
HAWAII MUNICIPAL FUND
SCHEDULE OF INVESTMENTS – (Continued)
March 31, 2014 (Unaudited)
| Par Value | | | | | | | Value (Note 1 (A)) | |
| | | | | | | | | |
| | | | HFDC Multi-Family-Kuhio Park– 3.59% | | | |
| $ | 2,430,000 | | | | 4.750 | %, | 10/01/27 | | $ | 2,598,326 | |
| | 3,000,000 | | | | 4.950 | %, | 04/01/29 | | | 3,221,580 | |
| | | | | | | | | | | 5,819,906 | |
| | | | | Multi-Family-Iwilei Apartments– 2.52% | | | | |
| | 165,000 | | | | 3.300 | %, | 01/01/26 | | | 162,150 | |
| | 4,000,000 | | | | 3.750 | %, | 01/01/31 | | | 3,922,200 | |
| | | | | | | | | | | 4,084,350 | |
| | | | | Multi-Family-Kooloaula Apartments– 2.11% | | | | |
| | 220,000 | | | | 3.125 | %, | 09/01/22 | | | 215,761 | |
| | 3,435,000 | | | | 4.000 | %, | 09/01/33 | | | 3,205,370 | |
| | | | | | | | | | | 3,421,131 | |
| | | | | University of Hawaii - Revenue Bonds – 6.27% | | | | |
| | 100,000 | | | | 4.000 | %, | 07/15/16 | | | 107,367 | |
| | 1,000,000 | | | | 5.000 | %, | 10/01/18 | | | 1,149,690 | |
| | 1,000,000 | | | | 5.000 | %, | 10/01/19 | | | 1,163,280 | |
| | 1,500,000 | | | | 5.000 | %, | 10/01/23 | | | 1,612,380 | |
| | 3,355,000 | | | | 4.500 | %, | 07/15/26 | | | 3,487,724 | |
| | 2,500,000 | | | | 5.000 | %, | 07/15/29 | | | 2,646,350 | |
| | | | | | | | | | | 10,166,791 | |
| | | | | | | | | | | | |
| | | | | Honolulu City & County | | | | |
| | | | | Multi-Family – Waipahu – 1.16% | | | | |
| | 1,885,000 | | | | 6.900 | %, | 06/20/35 | | | 1,887,828 | |
| | | | | | | | | | | | |
| | | | | Water System Revenue Bonds | | | | |
| | | | | Board of Water Supply – 4.96% | | | | |
| | 3,550,000 | | | | 4.500 | %, | 07/01/23 | | | 3,725,370 | |
| | 1,470,000 | | | | 5.000 | %, | 07/01/26 | | | 1,557,289 | |
| | 2,500,000 | | | | 5.000 | %, | 07/01/32 | | | 2,766,425 | |
| | | | | | | | | | | 8,049,084 | |
| | | | | Waste System Revenue – 1.61% | | | | |
| | 2,380,000 | | | | 5.250 | %, | 07/01/36 | | | 2,609,242 | |
See accompanying notes to financial statements.
HAWAII MUNICIPAL FUND
SCHEDULE OF INVESTMENTS – (Continued)
March 31, 2014 (Unaudited)
| Par Value | | | | | | | Value (Note 1 (A)) | |
| | | | | | | | | |
| | | | Kauai County | | | |
| | | | General Obligation Bonds – 3.16% | | | |
| $ | 400,000 | | | | 3.125 | %, | 08/01/23 | | $ | 378,908 | |
| | 770,000 | | | | 5.000 | %, | 08/01/24 | | | 881,496 | |
| | 880,000 | | | | 3.625 | %, | 08/01/25 | | | 910,633 | |
| | 2,780,000 | | | | 5.000 | %, | 08/01/27 | | | 2,956,836 | |
| | | | | | | | | | | 5,127,873 | |
| | | | | Kukuiula Development – 2.03% | | | | |
| | 1,090,000 | | | | 5.625 | %, | 05/15/33 | | | 1,079,231 | |
| | 2,250,000 | | | | 5.750 | %, | 05/15/42 | | | 2,222,032 | |
| | | | | | | | | | | 3,301,263 | |
| | | | | Maui County | | | | |
| | | | | General Obligation Bonds – 1.31% | | | | |
| | 1,000,000 | | | | 5.000 | %, | 07/01/23 | | | 1,064,810 | |
| | 1,000,000 | | | | 5.000 | %, | 07/01/24 | | | 1,064,580 | |
| | | | | | | | | | | 2,129,390 | |
| | | | | | | | | | | | |
| | | | | Total Hawaii Municipal Bonds (Cost $153,791,480) | | | 157,577,052 | |
See accompanying notes to financial statements.
HAWAII MUNICIPAL FUND
SCHEDULE OF INVESTMENTS – (Continued)
March 31, 2014 (Unaudited)
| Par Value | | | | | | | Value (Note 1 (A)) | |
| | | | | | | | | |
VIRGIN ISLANDS MUNICIPAL BONDS - 0.20% | |
| | | | | | | | | |
| | | Virgin Islands | | | | |
| | | Public Finance Authority, Series A - 0.05% | | | | |
| $ | 65,000 | | | 7.300 | %, | 10/01/18 | | | | | $ | 75,626 | |
| | | | Public Finance Authority, Series A - 0.15% | | | | | |
| | 250,000 | | | 5.000 | %, | 07/01/14 | | | | | | 250,750 | |
| | | | | | | | | | | | | | |
| | | | Total Virgin Islands Municipal Bonds (Cost $314,756) | | | | 326,376 | |
| | | | | | | | | | | | | | |
| | | | | | | | | | | | | | |
| | | | | | | | | | | | | | |
| | | | Total Investments (Cost $154,106,236) (a) | | 97.33 | % | | | 157,903,428 | |
| | | | Other Assets Less Liabilities | | | 2.67 | % | | | 4,330,619 | |
| | | | Net Assets | | | 100.00 | % | | $ | 162,234,047 | |
| | | | | | | | | | | | | | | |
| | | | (a) Aggregate cost for federal income tax purposes is $154,039,563. | |
| | | | | | | | | | | | | | | |
| | | | At March 31, 2014, unrealized appreciation (depreciation) of securities for federal income tax purposes is as follows: | |
| | | | | | | | | | | | | | | |
| | | | Gross unrealized appreciation | | | | | $ | 4,737,282 | |
| | | | Gross unrealized (depreciation) | | | | | | (873,417 | ) |
| | | | Net unrealized appreciation | | | | | $ | 3,863,865 | |
See accompanying notes to financial statements.
HAWAII MUNICIPAL FUND
STATEMENT OF ASSETS AND LIABILITIES
March 31, 2014 (Unaudited)
| | | Municipal Fund | |
| ASSETS | | | |
| Investments at market value | | | |
(Identified cost $154,106,236) (Note 1 (A)) | | $ | 157,903,428 | |
| Cash | | | 2,443,937 | |
| Interest receivable | | | 2,208,346 | |
| Subscription receivable | | | 6,000 | |
| Other assets | | | 7,733 | |
| Total assets | | | 162,569,444 | |
| | | | | |
| LIABILITIES | | | | |
| Distributions payable | | | 125,604 | |
| Redemptions payable | | | 52,450 | |
| Management fee payable | | | 68,577 | |
| Administration fee payable | | | 2,743 | |
| Distribution Plan payable | | | 20,573 | |
| Shareholder Servicing fee payable | | | 13,715 | |
| Transfer Agent fee payable | | | 8,229 | |
| Chief Compliance Officer fee payable | | | 5,308 | |
| Directors fee payable | | | 2,728 | |
| Directors expenses payable | | | 50 | |
| Accrued expenses | | | 35,420 | |
| Total liabilities | | | 335,397 | |
| | | | | |
| NET ASSETS | | $ | 162,234,047 | |
| (Applicable to 14,829,025 shares outstanding, $.01 par value, 40,000,000 shares authorized) | | | | |
| | | | | |
| NET ASSET VALUE, OFFERING AND REPURCHASE PRICE PER SHARE, INVESTOR CLASS SHARES | | $ | 10.94 | |
| | | | | |
| NET ASSETS | | | | |
| At March 31, 2014, net assets consisted of: | | | | |
| Paid-in capital | | $ | 159,593,205 | |
| Undistributed net investment income | | | 223,298 | |
| Accumulated net realized loss on investments | | | (1,379,648 | ) |
| Net unrealized appreciation | | | 3,797,192 | |
| | | $ | 162,234,047 | |
See accompanying notes to financial statements.
HAWAII MUNICIPAL FUND
STATEMENT OF OPERATIONS
For the six months ended March 31, 2014 (Unaudited)
| | | Municipal Fund | |
| INVESTMENT INCOME | | | |
| Interest income | | $ | 3,305,920 | |
| | | | | |
| Expenses | | | | |
Management fee (Note 2) | | | 399,285 | |
Distribution costs (Notes 2 and 3) | | | 119,786 | |
Transfer Agent fee (Note 2) | | | 47,913 | |
Shareholder Services fee (Note 2) | | | 79,856 | |
Administration fee (Note 2) | | | 15,970 | |
| Accounting fee | | | 37,674 | |
| Legal and Audit fees | | | 45,093 | |
| Printing | | | 10,920 | |
| Custodian fee | | | 9,288 | |
| Insurance | | | 5,090 | |
| Registration fee | | | 5,819 | |
| Shareholder Communications | | | 3,060 | |
Chief Compliance Officer fee (Note 2) | | | 29,535 | |
| Directors fee | | | 9,902 | |
| Directors expenses | | | 11,065 | |
| Mailing fee | | | 10,010 | |
| Total expenses | | | 840,266 | |
Fee reductions (Note 5) | | | (2,372 | ) |
| Net expenses | | | 837,894 | |
| Net investment income | | | 2,468,026 | |
| | | | | |
| NET REALIZED AND UNREALIZED GAIN (LOSS) ON INVESTMENTS | | | | |
| Net realized gain from security transactions | | | 201,546 | |
| Change in unrealized appreciation of investments | | | 3,004,935 | |
| Net gain on investments | | | 3,206,481 | |
| | | | | |
| NET INCREASE IN NET ASSETS RESULTING FROM OPERATIONS | | $ | 5,674,507 | |
See accompanying notes to financial statements.
HAWAII MUNICIPAL FUND
STATEMENTS OF CHANGES IN NET ASSETS
| | | For The Six Months Ended March 31, 2014 (Unaudited) | | | For The Year Ended September 30, 2013 | |
| INCREASE (DECREASE) IN NET ASSETS FROM | | | | | | |
| Operations | | | | | | |
| Net investment income | | $ | 2,468,026 | | | $ | 5,229,577 | |
| Net realized gain on investments | | | 201,546 | | | | 115,212 | |
| Increase (decrease) in unrealized appreciation (depreciation) of investments | | | 3,004,935 | | | | (9,269,674 | ) |
| Net increase (decrease) in net assets resulting from operations | | | 5,674,507 | | | | (3,924,885 | ) |
| | | | | | | | | |
| Distributions to shareholders from: | | | | | | | | |
| Net investment income | | | | | | | | |
| Investor Class ($.16 and $.34 per share, respectively) | | | (2,358,785 | ) | | | (5,205,893 | ) |
| Capital gains | | | | | | | | |
| Investor Class ($.00 and $.00 per share, respectively) | | | — | | | | — | |
| Total distributions to shareholders | | | (2,358,785 | ) | | | (5,205,893 | ) |
| | | | | | | | | |
Capital share transactions (a) | | | | | | | | |
| (Decrease) in net assets resulting from capital share transactions | | | (2,291,170 | ) | | | (2,321,090 | ) |
| Total increase (decrease) in net assets | | | 1,024,552 | | | | (11,451,868 | ) |
| | | | | | | | | |
| NET ASSETS | | | | | | | | |
| Beginning of period | | | 161,209,495 | | | | 172,661,363 | |
End of period (including undistributed net investment income of $223,298 and $114,057, respectively) | | $ | 162,234,047 | | | $ | 161,209,495 | |
(a) Summary of capital share activity follows: | | Investor Class | | | Investor Class | |
| | | For The Six Months Ended March 31, 2014 | | | For The Year Ended September 30, 2013 | |
| | | Shares | | | Value | | | Shares | | | Value | |
| Shares sold | | | 359,005 | | | $ | 3,885,862 | | | | 1,090,203 | | | $ | 12,169,538 | |
| Shares issued on reinvestment of distributions | | | 150,404 | | | | 1,626,259 | | | | 330,030 | | | | 3,660,360 | |
| | | | 509,409 | | | | 5,512,121 | | | | 1,420,233 | | | | 15,829,898 | |
| Shares redeemed | | | (724,513 | ) | | | (7,803,291 | ) | | | (1,645,870 | ) | | | (18,150,988 | ) |
| Net (decrease) | | | (215,104 | ) | | $ | (2,291,170 | ) | | | (225,637 | ) | | $ | (2,321,090 | ) |
See accompanying notes to financial statements.
HAWAII MUNICIPAL FUND
FINANCIAL HIGHLIGHTS
(For a share outstanding throughout each period)
| | | INVESTOR CLASS | |
| | | For The Six Months Ended March 31, 2014 (Unaudited) | | | Years Ended September 30, | |
| | | | | | 2013 | | | 2012 | | | 2011 | | | 2010 | | | 2009 | |
| Net asset value | | | | | | | | | | | | | | | | | | |
| Beginning of period | | $ | 10.72 | | | $ | 11.31 | | | $ | 10.83 | | | $ | 10.97 | | | $ | 10.80 | | | $ | 10.31 | |
| | | | | | | | | | | | | | | | | | | | | | | | | |
| Income from investment operations | | | | | | | | | | | | | | | | | | | | | | | | |
| Net investment income | | | .17 | | | | .34 | | | | .34 | | | | .39 | | | | .37 | | | | .38 | |
| Net gain (loss) on securities | | | | | | | | | | | | | | | | | | | | | | | | |
| (both realized and unrealized) | | | .21 | | | | (.59 | ) | | | .48 | | | | (.14 | ) | | | .17 | | | | .51 | |
| Total from investment operations | | | .38 | | | | (.25 | ) | | | .82 | | | | .25 | | | | .54 | | | | .89 | |
| | | | | | | | | | | | | | | | | | | | | | | | | |
| Less distributions | | | | | | | | | | | | | | | | | | | | | | | | |
| Dividends from net investment income | | | (.16 | ) | | | (.34 | ) | | | (.34 | ) | | | (.39 | ) | | | (.37 | ) | | | (.38 | ) |
| Distributions from capital gains | | | — | | | | — | | | | — | | | | — | | | | — | | | | (.02 | ) |
| Total distributions | | | (.16 | ) | | | (.34 | ) | | | (.34 | ) | | | (.39 | ) | | | (.37 | ) | | | (.40 | ) |
| | | | | | | | | | | | | | | | | | | | | | | | | |
| End of period | | $ | 10.94 | | | $ | 10.72 | | | $ | 11.31 | | | $ | 10.83 | | | $ | 10.97 | | | $ | 10.80 | |
| | | | | | | | | | | | | | | | | | | | | | | | | |
| Total return | | | 3.56 | %+ | | | -2.28 | % | | | 7.65 | % | | | 2.45 | % | | | 5.12 | % | | | 8.98 | % |
| | | | | | | | | | | | | | | | | | | | | | | | | |
| Ratios/Supplemental Data | | | | | | | | | | | | | | | | | | | | | | | | |
| Net assets, end of period (in 000’s) | | $ | 162,234 | | | $ | 161,209 | | | $ | 172,661 | | | $ | 158,266 | | | $ | 177,933 | | | $ | 165,893 | |
| | | | | | | | | | | | | | | | | | | | | | | | | |
Ratio of expenses to average net
assets (a) | | | 1.05 | %* | | | 1.01 | % | | | 1.04 | % | | | 1.03 | % | | | 1.03 | % | | | 1.05 | % |
| | | | | | | | | | | | | | | | | | | | | | | | | |
Ratio of net investment income to
average net assets | | | 3.09 | %* | | | 3.07 | % | | | 3.06 | % | | | 3.74 | % | | | 3.49 | % | | | 3.77 | % |
| | | | | | | | | | | | | | | | | | | | | | | | | |
| Portfolio turnover | | | 8.17 | %+ | | | 9.43 | % | | | 22.52 | % | | | 13.68 | % | | | 19.60 | % | | | 25.90 | % |
| (a) | Ratios of expenses to average net assets after the reduction of custodian fees and other expenses under a custodian arrangement were 1.05%, 1.00%, 1.03%, 1.02%, 1.03%, and 1.02%, for the six months ended March 31, 2014 and for the years ended September 30, 2013, 2012, 2011, 2010, and 2009, respectively. |
See accompanying notes to financial statements.
HAWAII MUNICIPAL FUND
NOTES TO FINANCIAL STATEMENTS
March 31, 2014 (Unaudited)
| (1) | ORGANIZATION AND SUMMARY OF SIGNIFICANT ACCOUNTING POLICIES |
Hawaii Municipal Fund (“Fund”) is a series of First Pacific Mutual Fund, Inc. which is registered under the Investment Company Act of 1940, as a non-diversified open-end management investment company. First Pacific Mutual Fund, Inc. currently has two investment portfolios, including the Hawaii Municipal Fund which is currently authorized to offer one Class of Shares: Investor Shares.
The investment objective of the Fund is to provide a high level of current income exempt from federal and Hawaii state income taxes, consistent with preservation of capital and prudent investment management. The Fund seeks to achieve its objective by investing primarily in a portfolio of investment grade municipal securities issued by or on behalf of the State of Hawaii, or any of its political subdivisions, which pay interest that is exempt from regular federal and Hawaii income taxes.
The Fund is subject to the risk of price fluctuation of the municipal securities held in its portfolio which is generally a function of the underlying credit rating of an issuer, the maturity length of the securities, the securities’ yield, and general economic and interest rate conditions.
Since the Fund invests primarily in obligations of issuers located in Hawaii, the Fund is subject to additional concentration of risk. Due to the level of investment in Hawaii municipal obligations, the marketability and market value of these obligations may be affected by certain Hawaiian constitutional provisions, legislative measures, executive orders, administrative regulations, voter initiatives, and other political and economic developments. If any such problems arise, they could adversely affect the ability of various Hawaiian issuers to meet their financial obligation. Therefore, an investment in the Fund may be riskier than investment in other types of municipal bond funds.
Portfolio securities, that are fixed income securities, are valued by an independent pricing service using methodologies that it believes are appropriate including actual market transactions, mean between bid and ask prices, broker-dealer supplied valuations, matrix pricing, or other electronic data processing techniques designed to identify market values for such securities, in accordance with procedures established in good faith by the Board of Directors. Securities with remaining maturities of 60 days or less are valued on the amortized cost basis as reflecting fair value. Securities for which market quotations are not readily available or for which available prices are suspect will be valued at “fair value” using methods determined in good faith by or at the direction of the Board of Directors. For these purposes, “fair value” means the price that the Investment Manager reasonably expects the Fund could receive from an arm’s-length buyer upon the current sale of the securities within seven (7) days, after considering all appropriate factors and indications of value available to them. Such value will be cost if the Investment Manager determines such valuation is appropriate after considering a multitude of factors in accordance with established procedures.
The Fund utilizes various methods to measure the fair value of most of its investments on a recurring basis. U.S. generally accepted accounting principles (“GAAP”) establishes a hierarchy that prioritizes inputs to valuation methods. The three levels of inputs are:
HAWAII MUNICIPAL FUND
NOTES TO FINANCIAL STATEMENTS – (Continued)
March 31, 2014 (Unaudited)
Level 1 – Unadjusted quoted prices in active markets for identical assets or liabilities that the Fund has the ability to access.
Level 2 – Observable inputs other than quoted prices included in Level 1 that are observable for the asset or liability, either directly or indirectly. These inputs may include quoted prices for the identical instrument on an inactive market, prices for similar instruments, interest rates, prepayment speeds, credit risk, yield curves, default rates and similar data.
Level 3 – Unobservable inputs for the asset or liability, to the extent relevant observable inputs are not available, representing the Fund’s own assumptions about the assumptions a market participant would use in valuing the asset or liability, and would be based on the best information available.
The availability of observable inputs can vary from security to security and is affected by a wide variety of factors, including for example, the type of security, whether the security is new and not yet established in the marketplace, the liquidity of markets, and other characteristics particular to the security. To the extent that valuation is based on models or inputs that are less observable or unobservable in the market, the determination of fair value requires more judgment. Accordingly, the degree of judgment exercised in determining fair value is greatest for instruments categorized in Level 3.
The inputs used to measure fair value may fall into different levels of the fair value hierarchy. In such cases, for disclosure purposes, the level in the fair value hierarchy within which the fair value measurement falls in its entirety, is determined based on the lowest level input that is significant to the fair value measurement in its entirety.
Changes in valuation techniques may result in transfers in/out changing an investment’s assigned level within the hierarchy.
The following is a description of the valuation techniques applied to the Fund’s major categories of financial instruments measured at fair value on a recurring basis:
Municipal bonds are categorized in Level 2 of the fair value hierarchy.
The following is a summary of the inputs used in valuing the Fund’s investments, as of March 31, 2014. The inputs or methodology used for valuing securities are not necessarily an indication of the risks associated with investing in those securities.
Valuation Inputs at Reporting Date:
| Description | Level 1 | Level 2 | Level 3 | Total |
| Municipal Bonds | $-0- | $157,903,428 | $-0- | $157,903,428 |
There were no transfers in to and out of Levels 1 and 2 during the current period presented. There were no purchases, sales issuances, and settlements on a gross basis relating to Level 3 measurements during the current period presented.
HAWAII MUNICIPAL FUND
NOTES TO FINANCIAL STATEMENTS – (Continued)
March 31, 2014 (Unaudited)
It is the Fund’s policy to comply with the requirements of the Internal Revenue Code applicable to regulated investment companies and to distribute its taxable income, if any, to its shareholders. Therefore, no federal income tax provision is required.
The Fund has reviewed all open tax years for all major jurisdictions, which is the Federal jurisdiction, and concluded that there are no significant uncertain tax positions that would require recognition in the financial statements. As of September 30, 2013, open Federal tax years include the tax years ended September 30, 2010 through September 30, 2013. The Fund has no examination in progress and is also not aware of any tax positions for which it is reasonably possible that the total amounts of unrecognized tax benefits will significantly change in the next twelve months.
In order to avoid imposition of the excise tax applicable to regulated investment companies, the Fund intends to declare each year as dividends in each calendar year at least 98% of its net investment income (earned during the calendar year) and 98% of its net realized capital gains (earned during the twelve months ended October 31) plus undistributed amounts, if any, from prior years.
On December 22, 2010, the Regulated Investment Company Modernization Act of 2010 (the “Act”) was enacted. The Act modernizes several of the federal income and excise tax provisions related to regulated investment companies such as the Fund, and, with certain exceptions, is effective for taxable years beginning after December 22, 2010. Among the changes made are changes to the capital loss carryforward rules allowing for capital losses to be carried forward indefinitely. Rules in effect as of the report date limit the carryforward period to eight years. Capital loss carryforwards generated in taxable years beginning after effective date of the Act must be fully used before capital loss forwards generated in taxable years prior to effective date of the Act; therefore, under certain circumstances, capital loss carryforwards available as of the report date, if any, may expire unused. At September 30, 2013, the Hawaii Municipal Fund had a capital loss carryforward of $1,581,194 of which $547,947 expires in 2017, $120,704 expires in 2018, and $290,254 short-term capital loss and $622,289 long-term capital loss which do not expire.
The Fund did not incur any net capital losses after October 31, 2012. Net capital losses incurred after October 31, and within the taxable year are deemed to arise on the first business day of the Fund’s next taxable year.
| | (C) | SECURITY TRANSACTIONS, INVESTMENT INCOME AND DISTRIBUTIONS TO SHAREHOLDERS |
Security transactions are recorded on the trade date. Interest income is recorded on the accrual basis. Bond discounts and premiums are amortized using the interest method. Distributions to shareholders are declared daily and reinvested or paid in cash monthly.
The preparation of financial statements in conformity with accounting principles generally accepted in the United States of America requires management to make estimates and assumptions that affect the reported amounts of assets and liabilities at the date of the financial statements and the reported amounts of revenues and expenses during the reporting period. Actual results could differ from those estimates.
HAWAII MUNICIPAL FUND
NOTES TO FINANCIAL STATEMENTS – (Continued)
March 31, 2014 (Unaudited)
The net asset value per share for the Fund is determined by calculating the total value of the Fund’s assets, deducting its total liabilities and dividing the result by the number of shares outstanding.
| (2) | INVESTMENT MANAGEMENT FEE AND OTHER TRANSACTIONS WITH AFFILIATES |
Lee Financial Group Inc. (“LFG”) provides the Fund with management and administrative services pursuant to a management agreement and administrative services agreement, respectively. In accordance with the terms of the management agreement and of the administrative services agreement, LFG receives compensation at the annual rate of .50% and up to .05% of the Fund’s average daily net assets, respectively. For the period ended March 31, 2014, the Fund was allocated, and paid LFG, $29,535 of the Chief Compliance Officer fee.
The Fund’s distributor, Lee Financial Securities, Inc. (“LFS”), a wholly-owned subsidiary of LFG, received $119,786 for costs incurred in connection with the sale of the Fund’s shares (See Note 3).
Lee Financial Recordkeeping, Inc. (“LFR”), a wholly-owned subsidiary of LFG, serves as the transfer agent for the Fund. In accordance with the terms of the transfer agent agreement, LFR receives compensation at the annual rate of .06% of the Fund’s average daily net assets. LFR has delegated certain of its duties and responsibilities to Ultimus Fund Solutions, LLC as sub-transfer agent. LFR also provides the Fund with certain clerical, bookkeeping and shareholder services pursuant to a service agreement approved by the Fund’s directors. As compensation for these services LFR receives a fee, computed daily and payable monthly, at an annualized rate of .10% of the Fund’s average daily net assets.
Certain officers and directors of the Fund are also officers of LFG, LFS and LFR.
The Fund’s Board of Directors, including a majority of the Directors who are not “interested persons” of the Fund, as defined in the Investment Company Act of 1940, adopted a distribution plan pursuant to Rule 12b-1 of the Act. Rule 12b-1 regulates the manner in which a regulated investment company may assume costs of distributing and promoting the sales of its shares.
The Plan provides that the Hawaii Municipal Fund Investor Class may incur certain costs, which may not exceed .25% per annum of the Fund’s average daily net assets, for payment to the distributor for items such as advertising expenses, selling expenses, commissions or travel, reasonably intended to result in sales of shares of the Fund.
| (4) | PURCHASES AND SALES OF SECURITIES |
Purchases and sales of securities aggregated $12,535,684 and $14,796,000, respectively, for the Fund during the period October 1, 2013 through March 31, 2014.
HAWAII MUNICIPAL FUND
NOTES TO FINANCIAL STATEMENTS – (Continued)
March 31, 2014 (Unaudited)
Under an agreement with the Fund’s custodian bank, a portion of the custodian fees are paid by credits for cash balances. Any remaining credits are used to offset expenses of other vendors and service providers. If not for the offset agreement, the assets could have been employed to produce income. During the six months ended March 31, 2014, such reductions amounted to $2,372 for the Hawaii Municipal Fund. Credits used to offset expenses were as follows: Custody fees, $2,372.
| (6) | TAX COMPONENTS OF CAPITAL AND DISTRIBUTIONS TO SHAREHOLDERS |
The tax character of distributions paid during the years ended September 30, 2013 and 2010 were as follows:
| | | Exempt- | | | | | | Long-Term | | | | |
| | | Interest | | | Ordinary | | | Capital | | | Total | |
| | | Dividends | | | Income | | | Gains | | | Distributions | |
| Hawaii Municipal Fund | | | | | | | | | | | | |
| 2013 | | $ | 5,205,893 | | | $ | — | | | $ | — | | | $ | 5,205,893 | |
| 2012 | | $ | 5,039,690 | | | $ | — | | | $ | — | | | $ | 5,039,690 | |
The tax character of distributable earnings at September 30, 2013 were as follows:
| | | | | | Undistributed Capital Gains | | | Capital Loss Carryforwards | | | | | | | | | | |
| Hawaii Municipal Fund | | $ | — | | | $ | — | | | $ | (1,581,194 | ) | | $ | — | | | $ | 906,314 | | | $ | (674,880 | ) |
| | * | The difference between book basis and tax basis unrealized appreciation is attributable to market discount on debt securities. |
Accounting principles generally accepted in the United States of America require that certain components of net assets be reclassified between financial and tax reporting. These reclassifications have no effect on net assets or net asset value per share. The primary difference relates to the different treatment on amortization of discount for financial reporting purposes versus tax reporting purposes. For the year-ended September 30, 2013, the Hawaii Municipal Fund’s undistributed investment income was decreased by $6,578, and accumulated net realized loss on investments was decreased by $6,578.
HAWAII MUNICIPAL FUND
NOTES TO FINANCIAL STATEMENTS – (Continued)
March 31, 2014 (Unaudited)
| (7) | SUBSEQUENT EVENTS DISCLOSURE |
In preparing the Fund’s financial statements as of March 31, 2014, the Fund’s management considered the impact of subsequent events for potential recognition or disclosure in these financial statements.
HAWAII MUNICIPAL FUND INVESTOR CLASS (Unaudited)
Shareholder Information
Household Delivery of Shareholder Documents: Only one Prospectus, Annual and Semi-Annual Report will be sent to shareholders with the same last name and address on their Fund account, unless you request multiple copies. If you would like to receive separate copies, please call us at (808) 988-8088. We will begin sending you additional copies within 30 days. If your shares are held through a service provider, please contact them directly.
Business Continuity Plan Summary Disclosure Statement: First Pacific Mutual Fund, Inc., Lee Financial Group Inc., Lee Financial Securities, Inc. and Lee Financial Recordkeeping, Inc. have developed Business Continuity Plans on how we will respond to events that significantly disrupt our business. Since the timing and impact of disasters and disruptions is unpredictable, we will have to be flexible in responding to actual events as they occur. Contacting Us - If after a significant business disruption you cannot contact us as you usually do at (808) 988-8088, you should go to our website at www.LeeHawaii.com. Please visit our website at www.LeeHawaii.com for the Business Continuity Plan Disclosure Statement.
Proxy Voting Policies and Procedures
The Fund has established Proxy Voting Policies and Procedures (“Policies”) that the Fund uses to determine how to vote proxies relating to portfolio securities. Shareholders may request copies of the Policies free of charge by calling (808) 988-8088 or by sending a written request to Lee Financial Group Inc., 3113 Olu Street, Honolulu, HI 96816-1425. Copies of the Fund’s proxy voting records are posted on the Securities and Exchange Commission’s website at www.sec.gov and the Fund’s website at www.LeeHawaii.com and reflect the 12-month period beginning July 1, 2012 and ending June 30, 2013.
Quarterly Statement of Investments
The Fund files a complete statement of investments with the Securities and Exchange Commission for the first and third quarters for each fiscal year on Form N-Q. Shareholders may view the filed Form N-Q by visiting the Commission’s website at www.sec.gov or the Fund’s website at www.LeeHawaii.com. The filed form may also be viewed and copied at the Commission’s Public Reference Room in Washington, DC. Information regarding the operations of the Public Reference Room may be obtained by calling 1-800-SEC-0330.
INVESTMENT MANAGER
Lee Financial Group Inc.
3113 Olu Street
Honolulu, Hawaii 96816-1425
DISTRIBUTOR
Lee Financial Securities, Inc.
3113 Olu Street
Honolulu, Hawaii 96816-1425
FUND ACCOUNTANT
Ultimus Fund Solutions, LLC
225 Pictoria Drive, Suite 450
Cincinnati, Ohio 45246
CUSTODIAN
Union Bank, N.A.
350 California Street, 6th Floor
San Francisco, California 94104
LEGAL COUNSEL
Drinker Biddle & Reath LLP
One Logan Square
Suite #2000
Philadelphia, Pennsylvania 19103-6996
TRANSFER AGENT
Lee Financial Recordkeeping, Inc.
3113 Olu Street
Honolulu, Hawaii 96816-1425
THIS PAGE INTENTIONALLY LEFT BLANK
Item 2. Code of Ethics.
The information required by this Item is only required in an annual report on this Form N-CSR.
Item 3. Audit Committee Financial Expert
The information required by this Item is only required in an annual report on this Form N-CSR.
Item 4. Principal Accountant Fee and Services.
The information required by this Item is only required in an annual report on this Form N-CSR.
Item 5. Audit Committee of Listed Registrants.
Not applicable.
Item 6. Schedule of Investments.
(a) Schedule I - Investment in securities of unaffiliated issuers is included as part of the reports to shareholders filed under Item 1 of this Form.
(b) Not applicable.
Item 7. Disclosure of Proxy Voting Policies and Procedures for Closed-End Management Investment Companies.
Not applicable.
Item 8. Portfolio Managers of Closed-End Management Investment Companies.
Not applicable.
Item 9. Purchases of Equity Securities by Closed-End Management Investment Company and Affiliated Purchasers.
Not applicable.
Item 10. Submission of Matters to a Vote of Security Holders.
No material changes were made to the procedures by which shareholders recommend nominees to the board.
Item 11. Controls and Procedures. |
| | (a) | The registrant’s principal executive and principal financial officers, or person performing similar functions, has concluded that the registrant’s disclosure controls and procedures (as defined in Rule 30a-3(c) under the Investment Company Act of 1940, as amended (the “1940 Act”) (17 CFR 270.30a-3(c))) are effective, as of a date within 90 days of the filing date of the report that includes the disclosure required by this paragraph, based on their evaluation of these controls and procedures required by Rule 30a-3(b) under the 1940 Act (17 CFR 270.30a-3(b)) and Rules 13a-15(b) or 15d-15(b) under the Securities Exchange Act of 1934, as amended (17 CFR 240.13a-15(b) or 240.15d-15(b)). |
| | (b) | There were no changes in the registrant’s internal control over financial reporting (as defined in Rule 30a-3(d) under the 1940 Act (17 CFR 270.30a-3(d)) that occurred during the registrant’s second fiscal quarter of the period covered by this report that has materially affected, or is reasonably likely to materially affect, the registrant’s internal control over financial reporting. |
| | (a)(2) | Certifications pursuant to Rule 30a-2(a) under the Act (17 CFR 270.30a-2(a)) are furnished herewith. |
| | (b) | Certifications pursuant to Rule 30a-2(a) under the 1940 Act and Section 906 of the Sarbanes-Oxley Act of 2002 are attached hereto. |
SIGNATURES
Pursuant to the requirements of the Securities Exchange Act of 1934 and the Investment Company Act of 1940, the registrant has duly caused this report to be signed on its behalf by the undersigned, thereunto duly authorized.
| (registrant) | First Pacific Mutual Fund, Inc. | |
| | | |
| | | |
| By (Signature and Title)* | /s/ Terrence K.H. Lee | |
| | Terrence K.H. Lee, President and CEO | |
| | (principal executive officer) | |
| | | |
| Date | May 28, 2014 | |
| | | |
| Pursuant to the requirements of the Securities Exchange Act of 1934 and the Investment Company Act of 1940, this report has been signed below by the following persons on behalf of the registrant and in the capacities and on the dates indicated. |
| | | |
| By (Signature and Title)* | /s/ Terrence K.H. Lee | |
| | Terrence K.H. Lee, President and CEO | |
| | (principal executive officer) | |
| | | |
| By (Signature and Title)* | /s/ Nora B. Foley | |
| | Nora B. Foley, Treasurer | |
| | (principal financial officer) | |
| | | |
| Date | May 28, 2014 | |
*Print the name and title of each signing officer under his or her signature.