| OMB APPROVAL |
OMB Number: 3235-0570 Expires: January 31, 2017 Estimated average burden hours per response: 20.6 |
UNITED STATES
SECURITIES AND EXCHANGE COMMISSION
Washington, D.C. 20549
FORM N-CSR
CERTIFIED SHAREHOLDER REPORT OF REGISTERED
MANAGEMENT INVESTMENT COMPANIES
| Investment Company Act file number | 811-05646 |
| New Century Portfolios |
| (Exact name of registrant as specified in charter) |
| 100 William Street, Suite 200 Wellesley, Massachusetts | 02481 |
| (Address of principal executive offices) | (Zip code) |
Nicole M. Tremblay, Esq.
| Weston Financial Group, Inc. 100 William Street, Suite 200 Wellesley, MA 02481 |
| (Name and address of agent for service) |
| Registrant's telephone number, including area code: | (781) 235-7055 |
| Date of fiscal year end: | October 31, 2015 | |
| Date of reporting period: | April 30, 2015 |
Form N-CSR is to be used by management investment companies to file reports with the Commission not later than 10 days after the transmission to stockholders of any report that is required to be transmitted to stockholders under Rule 30e-1 under the Investment Company Act of 1940 (17 CFR 270.30e-1). The Commission may use the information provided on Form N-CSR in its regulatory, disclosure review, inspection, and policymaking roles.
A registrant is required to disclose the information specified by Form N-CSR, and the Commission will make this information public. A registrant is not required to respond to the collection of information contained in Form N-CSR unless the Form displays a currently valid Office of Management and Budget ("OMB") control number. Please direct comments concerning the accuracy of the information collection burden estimate and any suggestions for reducing the burden to Secretary, Securities and Exchange Commission, 450 Fifth Street, NW, Washington, DC 20549-0609. The OMB has reviewed this collection of information under the clearance requirements of 44 U.S.C. § 3507.
Item 1. Reports to Stockholders.
 New Century Capital New Century Balanced New Century International New Century Alternative Strategies SEMI-ANNUAL REPORT Six Months Ended April 30, 2015 (Unaudited) | |||
| 100 William Street, Suite 200, Wellesley MA 02481 | 781-239-0445 | 888-639-0102 | Fax 781-237-1635 |
CONTENTS
| LETTER TO SHAREHOLDERS | 2-5 |
| NEW CENTURY PORTFOLIOS | |
| New Century Capital Portfolio | |
| Portfolio Information | 6 |
| Schedule of Investments | 7-8 |
| New Century Balanced Portfolio | |
| Portfolio Information | 9 |
| Schedule of Investments | 10-11 |
| New Century International Portfolio | |
| Portfolio Information | 12 |
| Schedule of Investments | 13-14 |
| New Century Alternative Strategies Portfolio | |
| Portfolio Information | 15 |
| Schedule of Investments | 16-17 |
| Statements of Assets and Liabilities | 18 |
| Statements of Operations | 19 |
| Statements of Changes in Net Assets | 20-23 |
| Financial Highlights | 24-27 |
| Notes to Financial Statements | 28-37 |
| About Your Portfolios’ Expenses | 38-39 |
| Results of Special Meeting of Shareholders, February 10, 2015 | 40-41 |
| LETTER TO SHAREHOLDERS | April, 2015 |
Dear Fellow Shareholders:
We are pleased to present our Semi-Annual Report for the six-month period ended April 30, 2015. This report presents important financial information for each of the New Century Portfolios. We invite you to visit our website at www.newcenturyportfolios.com for additional information.
Since our last letter in the Fall of 2014, we have seen the start of Quantitative Easing (QE) by the European Central Bank, the continuation of QE by many other central banks, the continued rise of the U.S. Dollar (USD), and movement of interest rates worldwide including some into negative territory. We have seen developed equity markets in Germany and France return more than 25% in local terms, only to see them retract 10%. During Q1 2015, we have seen the China market grow through domestic A-Shares being listed on the Shanghai and Shenzhen exchanges, while at the same time we have seen the U.S. equity market lag. However, the U.S. equity markets still remain in positive territory even with a port strike on the west coast and a historic winter in the northeast sapping growth in Q1 2015. With all these things happening one thing is for sure…Volatility is back, and it’s taking different forms than just equity returns.
We currently see multi-asset macro trades controlling the global markets, including the highly correlated German interest rates, the USD/EUR exchange, oil prices, and Euro-zone equities which we believe will continue for the remainder of 2015. With QE in place, many European sovereign rates turned negative, meaning investors were paying to hold government bonds. The German 10-year Bund hit a low of 5 basis points. These low rates contributed to investors moving money into higher yielding U.S. Treasuries, which in turn added fuel to the USD rally. With the USD rallying, WTI Crude Oil prices plummeted to a low of $43 a barrel, while Euro-zone exporters and equities saw a tailwind from the lower value Euro. The lower price of Oil was also a positive contributor for emerging markets energy importers (China, India) and a negative for energy exporters (Russia, LATAM) during Q1 2015.
These correlated asset groups witnessed a peak and subsequently a reversal in April 2015. USD depreciated (down 9% against the Euro from its March peak through May 15, 2015) on the back of comments from the Federal Reserve, weaker Q1 2015 economic numbers, and rising European rates, which saw the German 10-year Bund’s rate go from 5 basis points to 70 basis points in only a few weeks, making the German bonds more attractive to investors. Oil prices and domestic energy equities saw tailwinds from the weakening dollar and from sector rotation, as investors looked for undervalued U.S. sectors, while European markets depreciated on a stronger Euro. Sector rotation and the weakening dollar also helped U.S. large-cap equities which had previously underperformed small-cap during Q1 2015.
Moving forward for the remainder of 2015, we have the following observations. Domestic equities should continue to grind higher, however developed international equities should have potential for greater appreciation. Consumption in the U.S. is still not moving as briskly as anticipated and this is partially due to higher savings rates by consumers. This trend should start to reverse on continued employment gains and wage inflation in the second half of 2015. USD will continue to be strong as we anticipate second half 2015 economic strength.
2
Oil prices have probably overshot a bit on their recovery from the low $40s to the low $60s. We anticipate rig counts to steady and increase at the new price level and believe the global supply is still ahead of demand for 2015. Fixed income markets are uncertain, and current low yields are making many bonds more risky than their historical profile. We continue to favor short duration, credit, and high yield. Emerging markets will be country specific and we favor energy importing nations in Asia over exporting nations in Latin America.
Finally a note on the Federal Reserve and liftoff in the U.S. We believe the markets would be better served in the medium and long term by a Federal Reserve liftoff sooner rather than later, with a current target of a 25 basis point hike in September 2015. Our thinking is based on the following ideas. First, it’s not about the first rate hike, it’s about the speed and course of future hikes. Starting sooner could enable the Federal Reserve to not follow past rate hike cycles where they were inclined to raise rates at every meeting. Second, liftoff could enable banks to actually loosen credit as they realize a net interest margin and provide upside to individual borrowers and the financial sector equities. Third, markets do not like uncertainty and right now there is uncertainty regarding Federal Reserve timing. Finally, we have seen consumer growth lag in Q1 2015 and savings rates increase even as gas prices have decreased year over year. When rates are kept too low for too long, while equity markets appreciate, investors start to believe that equities appear risky and with fixed income instruments yielding very little the natural reaction is to increase savings. A path of controlled liftoff both in 2015 and 2016 could reassure investors and could see savings move back into investments and consumption as the risk of a bubble developing abates.
New Century Capital Portfolio (NCCPX) gained 4.17% versus 4.40% for the S&P 500® Composite Index and 3.99% for the Morningstar Large Blend Category for the six-months ended April 30, 2015. Heading into 2015, the Portfolio Managers identified several themes we believe could provide outperformance including: a stronger USD creating a headwind for large-cap companies compared to small-cap, international equity markets outperforming domestic equity markets, and companies with growth in either top line revenue or margins gaining strength. We focused on adding to concentrated, active managers with strong stock selection records as we foresee these managers outperforming beta-only index plays moving forward. International allocations were also added with a focus on Europe and Japan making the Portfolio’s international allocation on a “look-through” basis currently around 10%. An overweight to health care and underweight to financials and energy boosted returns in Q1 2015, however, we are closely monitoring the financial sector which should benefit from rising rates. In April 2015, a sector rotation acted as a headwind to our health care, mid- and small-cap holdings. We see this as temporary and do not plan to create unneeded capital gains for our investors by chasing this rotation, instead we remain focused on our themes and developing new medium term views. Finally, the Portfolio continued to integrate Dimensional Fund Advisor investments into the Portfolio’s holdings and was successful in lobbying John Hancock to open their previously closed mid-cap value fund to the Portfolio. We continue to work tirelessly to add what we believe to be great investment managers into the Portfolio for the long term success of our investors.
New Century Balanced Portfolio (NCIPX) gained 2.62% versus 2.78% for the Morningstar Moderate Target Risk Index, and 3.02% for the Morningstar Moderate Allocation Category for the six-months ended April 30, 2015. The Morningstar Moderate Allocation Category can vary widely with some funds allocated 70/30 equities to fixed income and some funds
3
allocated 30/70 equities to fixed income. We have always managed the Portfolio for what we refer to as a “smooth ride” and target the middle of the Morningstar Moderate Allocation Category rankings. We are opportunistic to markets without chasing momentum and subjecting our investors to undue risk. We continue to see heightened risk/reward with many short-term investment grade fixed income opportunities both domestically and internationally due to low rates and uncertainty around Federal Reserve tightening. Instead, we have been focusing on opportunities in credit, and non-traditional fixed income managers, while reducing exposure to international core bond funds. We are paying close attention to geographical holdings, one example being funds with fixed income exposure to energy producing countries such as Canada and Australia. We maintained a tilt from our traditional 60/40 split to equities which make up roughly 64% of the Portfolio with a bias towards growth managers. We increased exposure to international markets which we feel have a tailwind from central bank easing and weakening local currencies. We also added to U.S. equity holdings through a hedged equity manager which reduces our downside exposure in the event of an equity market correction. Additional allocations were made to active managers in the mid-cap space where we feel stock selection will provide alpha moving forward.
New Century International Portfolio (NCFPX) gained 8.11% versus 6.81% for the MSCI EAFE Index, 5.56% for the MSCI ACWI ex USA Index, and 5.89% for the Morningstar Foreign Large Blend Category for the six-months ended April 30, 2015. During the period, the Portfolio saw a large tailwind through holding currency hedged positions against the Yen, Euro, and other developed currencies. The Portfolio continues to tactically hedge portions of the Portfolio against currency risk and although the USD weakened in April 2015, causing a headwind to the Portfolio, we continue to believe hedging portions of the Portfolio will create a tailwind for 2015. We maintained a geographical quality bias overweighting Germany, while underweighting weaker European countries such as France. We also rotated from overweight Switzerland to slightly underweight following their central bank’s decision to de-peg the Swiss Franc from the Euro. We feel the rapid appreciation of the Swiss Franc will create a headwind to domestic companies which have large revenue streams denominated in Euros. We continue to be very bullish on Asia and have an overweight in Japan where structural reforms, central bank action, and investments from the government pension plan into equities are providing tailwinds. A tactical view has been held against energy producing countries since mid-2014 and the Portfolio maintains very little exposure to Canada, Latin America, or Russia, which has been both a tailwind and headwind at varying times. We are bullish energy importing emerging markets including China, where the Portfolio holds both A and H share investments, and India which is on pace to outgrow China in 2015. Emerging markets currently constitutes about 12% of the Portfolio’s holdings versus approximately 15% for the MSCI ACWI ex USA Index.
New Century Alternative Strategies Portfolio (NCHPX) gained 1.13% vs. 2.21% for the Morningstar Multialternative Category from for the six-months ended April 30, 2015. The Portfolio has outperformed the Multialternative Category for the 3-, 5-, 10-year, and inception-to-date periods ended April 30, 2015. The Portfolio maintains a long-term perspective with respect to its broad asset allocation exposures. Since June 1, 2002, the Portfolio has captured 119.10% of the upside of the Morningstar Multialternative Category and 99.28% of the downside. Further, the Portfolio has produced a cumulative return
4
of 76.26% over that time frame vs. the category return of 35.30%, and has produced an annualized alpha of 2.26% based on the category. Over all three year rolling time frames since June 1, 2002, the Portfolio has exceeded the return of the Morningstar Multialternative Category 98% of the time.
The Portfolio has increased exposure to high conviction managers. In the fixed-income category, duration has been kept short, using credit/currency themes to enhance returns. Although exposures to natural resources and commodities have detracted from recent returns, the Portfolio’s decision to use Master Limited Partnerships (MLP’s) for a large portion of this exposure has shielded the Portfolio from a large degree of the decline in oil prices. Management believes the Portfolio is strongly positioned to face potential rising equity market volatility and to potentially hedge against rising interest rates.
We appreciate and thank you for your trust in New Century Portfolios.
Sincerely,
 |  |  |
Nicole M. Tremblay, Esq. President, CEO | Matthew I. Solomon Portfolio Manager | Ronald A. Sugameli Portfolio Manager |
Investors should take into consideration the investment objectives, risks, charges and expenses of the New Century Portfolios carefully before investing. The prospectus contains these details and other information and should be read carefully before investing. Principal value of an investment will fluctuate and shares when redeemed may be worth more or less than your original investment. Past performance is not indicative of future results. Portfolio holdings and opinions expressed herein are subject to change.
5
NEW CENTURY CAPITAL PORTFOLIO
PORTFOLIO INFORMATION
April 30, 2015 (Unaudited)
PORTFOLIO INFORMATION
April 30, 2015 (Unaudited)
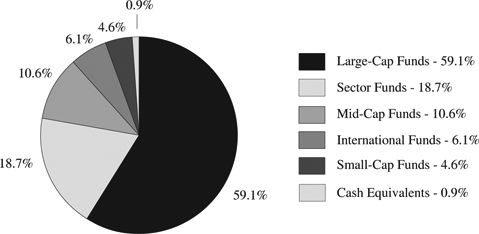
Asset Allocation (% of Net Assets)
| Top Ten Long-Term Holdings |
| Security Description | % of Net Assets | |
| Vanguard Dividend Growth Fund - Investor Shares | 6.8% | |
| Putnam Equity Income Fund - Class Y | 6.2% | |
| Vanguard 500 Index Fund - Admiral Shares | 6.1% | |
| Fidelity Select Health Care Portfolio | 5.2% | |
| Wells Fargo Advantage Growth Fund - Institutional Class | 5.1% | |
| American Funds AMCAP Fund - Class A | 4.7% | |
| PowerShares Dynamic Pharmaceuticals Portfolio | 4.3% | |
| Ivy Science and Technology Fund - Class I | 3.8% | |
| Glenmede Large Cap Growth Portfolio | 3.8% | |
| Putnam Equity Spectrum Fund - Class Y | 3.4% |
6
NEW CENTURY CAPITAL PORTFOLIO SCHEDULE OF INVESTMENTS April 30, 2015 (Unaudited) |
| INVESTMENT COMPANIES — 99.1% | Shares | Value | ||||||
| Large-Cap Funds — 59.1% | ||||||||
American Funds AMCAP Fund - Class A | 184,296 | $ | 5,359,329 | |||||
ClearBridge Aggressive Growth Fund - Class I (b) | 9,452 | 2,167,001 | ||||||
| DFA U.S. Large Cap Value Portfolio - Institutional Class | 57,921 | 1,996,523 | ||||||
Dodge & Cox Stock Fund | 14,340 | 2,599,835 | ||||||
Glenmede Large Cap Core Portfolio | 140,515 | 3,120,847 | ||||||
Glenmede Large Cap Growth Portfolio | 178,975 | 4,322,254 | ||||||
iShares MSCI USA Minimum Volatility ETF (a) | 73,200 | 3,002,664 | ||||||
iShares S&P 500 Growth ETF (a) | 29,200 | 3,343,692 | ||||||
iShares S&P 500 Value ETF (a) | 23,105 | 2,169,328 | ||||||
| JPMorgan Value Advantage Fund - Institutional Class | 127,086 | 3,835,444 | ||||||
MFS Growth Fund - Class I (b) | 45,444 | 3,341,987 | ||||||
Putnam Equity Income Fund - Class Y | 332,317 | 7,091,655 | ||||||
| RidgeWorth Large Cap Value Equity Fund - Class I | 99,516 | 1,680,821 | ||||||
Vanguard 500 Index Fund - Admiral Shares | 36,317 | 6,992,162 | ||||||
| Vanguard Dividend Growth Fund - Investor Shares | 344,291 | 7,887,712 | ||||||
Weitz Partners Value Fund - Institutional Class (b) | 90,959 | 3,172,640 | ||||||
Wells Fargo Advantage Growth Fund - Institutional Class (b) | 112,473 | 5,930,679 | ||||||
| 68,014,573 | ||||||||
| Sector Funds — 18.7% | ||||||||
Fidelity Select Health Care Portfolio | 26,157 | 5,979,850 | ||||||
iShares U.S. Energy ETF (a) | 33,400 | 1,556,106 | ||||||
Ivy Science and Technology Fund - Class I (b) | 71,466 | 4,322,982 | ||||||
Market Vectors Retail ETF (a) | 20,000 | 1,498,200 | ||||||
PowerShares Dynamic Pharmaceuticals Portfolio (a) | 67,000 | 4,982,120 | ||||||
ProShares UltraPro QQQ (a) | 7,000 | 758,100 | ||||||
Vanguard Consumer Discretionary ETF (a) | 20,000 | 2,438,200 | ||||||
| 21,535,558 | ||||||||
| Mid-Cap Funds — 10.6% | ||||||||
iShares S&P MidCap 400 Growth ETF (a) | 12,600 | 2,105,838 | ||||||
iShares S&P MidCap 400 Value ETF (a) | 14,100 | 1,840,755 | ||||||
| John Hancock Disciplined Value Mid Cap Fund - Class I | 120,540 | 2,493,973 | ||||||
Putnam Equity Spectrum Fund - Class Y | 91,103 | 3,875,508 | ||||||
SPDR S&P MidCap 400 ETF Trust (a) | 7,102 | 1,939,912 | ||||||
| 12,255,986 | ||||||||
| International Funds — 6.1% | ||||||||
iShares Currency Hedged MSCI Japan ETF (a) | 25,000 | 773,500 | ||||||
JOHCM International Select Fund - Class I | 97,324 | 2,026,278 | ||||||
Lazard International Strategic Equity Portfolio - Institutional Shares | 141,135 | 2,074,688 | ||||||
MFS International Value Fund - Class I | 57,930 | 2,183,365 | ||||||
| 7,057,831 | ||||||||
See accompanying notes to financial statements.
7
NEW CENTURY CAPITAL PORTFOLIO SCHEDULE OF INVESTMENTS (Continued) |
| INVESTMENT COMPANIES — 99.1% (Continued) | Shares | Value | ||||||
| Small-Cap Funds — 4.6% | ||||||||
Goldman Sachs Small Cap Growth Insights Fund - Institutional Class (b) | 33,008 | $ | 1,189,266 | |||||
Hodges Small Cap Fund - Institutional Class | 111,104 | 2,308,732 | ||||||
iShares S&P SmallCap 600 Value ETF (a) | 15,200 | 1,774,448 | ||||||
| 5,272,446 | ||||||||
Total Investment Companies (Cost $83,367,541) | $ | 114,136,394 | ||||||
| MONEY MARKET FUNDS — 1.0% | Shares | Value | ||||||
Invesco STIT-STIC Prime Portfolio (The) - Institutional Class, 0.04% (c) (Cost $1,149,655) | 1,149,655 | $ | 1,149,655 | |||||
Total Investments at Value — 100.1% (Cost $84,517,196) | $ | 115,286,049 | ||||||
| Liabilities in Excess of Other Assets — (0.1%) | (100,531 | ) | ||||||
Net Assets — 100.0% | $ | 115,185,518 | ||||||
(a) | Exchange-traded fund. |
(b) | Non-income producing security. |
(c) | The rate shown is the 7-day effective yield as of April 30, 2015. |
See accompanying notes to financial statements.
8
NEW CENTURY BALANCED PORTFOLIO
PORTFOLIO INFORMATION
April 30, 2015 (Unaudited)
PORTFOLIO INFORMATION
April 30, 2015 (Unaudited)
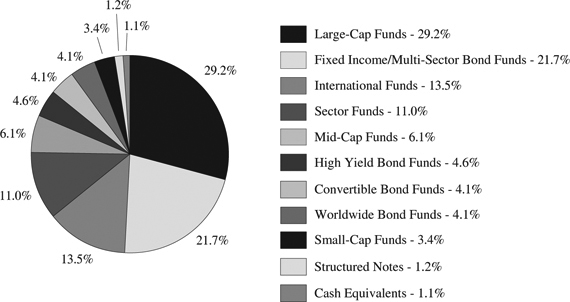
Asset Allocation (% of Net Assets) |
| Top Ten Long-Term Holdings |
| Security Description | % of Net Assets | |
| Loomis Sayles Bond Fund - Institutional Class | 7.0% | |
| American Funds AMCAP Fund - Class A | 5.8% | |
| iShares Core S&P 500 ETF | 5.5% | |
| Dodge & Cox Income Fund | 5.4% | |
| JPMorgan Value Advantage Fund - Institutional Class | 5.2% | |
| PIMCO Income Fund - Institutional Class | 5.1% | |
| Harding, Loevner International Equity Portfolio - Institutional Class | 4.6% | |
| Fidelity Select Health Care Portfolio | 4.4% | |
| AllianzGI Convertible Fund - Institutional Class | 4.1% | |
| John Hancock Disciplined Value Fund - Class I | 4.1% |
9
NEW CENTURY BALANCED PORTFOLIO SCHEDULE OF INVESTMENTS April 30, 2015 (Unaudited) |
| INVESTMENT COMPANIES — 97.7% | Shares | Value | ||||||
| Large-Cap Funds — 29.2% | ||||||||
American Funds AMCAP Fund - Class A | 145,215 | $ | 4,222,864 | |||||
ClearBridge Aggressive Growth Fund - Class I (b) | 10,652 | 2,442,076 | ||||||
iShares Core S&P 500 ETF (a) | 19,100 | 4,008,135 | ||||||
| John Hancock Disciplined Value Fund - Class I | 156,480 | 2,982,506 | ||||||
JPMorgan Hedged Equity Fund - Select Class | 72,976 | 1,208,482 | ||||||
| JPMorgan Value Advantage Fund - Institutional Class | 126,240 | 3,809,914 | ||||||
Wells Fargo Advantage Growth Fund - Administrator Class (b) | 50,790 | 2,575,533 | ||||||
| 21,249,510 | ||||||||
| Fixed Income/Multi-Sector Bond Funds — 21.7% | ||||||||
| BlackRock Strategic Income Opportunities Portfolio - Institutional Shares | 124,955 | 1,273,291 | ||||||
Dodge & Cox Income Fund | 284,203 | 3,939,053 | ||||||
| Legg Mason BW Alternative Credit Fund - Class IS | 165,479 | 1,754,073 | ||||||
| Loomis Sayles Bond Fund - Institutional Class | 346,310 | 5,111,538 | ||||||
PIMCO Income Fund - Institutional Class | 299,216 | 3,725,235 | ||||||
| 15,803,190 | ||||||||
| International Funds — 13.5% | ||||||||
Dodge & Cox International Stock Fund | 24,137 | 1,093,893 | ||||||
First Eagle Global Fund - Class A | 48,265 | 2,637,196 | ||||||
Harding, Loevner International Equity Portfolio - Institutional Class | 173,010 | 3,328,710 | ||||||
Lazard Global Listed Infrastructure Portfolio - Institutional Shares | 113,236 | 1,689,479 | ||||||
| Pear Tree Polaris Foreign Value Small Cap Fund - Institutional Shares | 79,722 | 1,116,111 | ||||||
| 9,865,389 | ||||||||
| Sector Funds — 11.0% | ||||||||
Consumer Staples Select Sector SPDR Fund (a) | 13,700 | 662,669 | ||||||
Fidelity Select Health Care Portfolio | 13,880 | 3,173,079 | ||||||
iShares U.S. Energy ETF (a) | 46,500 | 2,166,435 | ||||||
Oppenheimer SteelPath MLP Select 40 Fund - Class Y (b) | 160,667 | 2,006,734 | ||||||
| 8,008,917 | ||||||||
| Mid-Cap Funds — 6.1% | ||||||||
| John Hancock Disciplined Value Mid Cap Fund - Class I | 72,324 | 1,496,384 | ||||||
SPDR S&P MidCap 400 ETF Trust (a) | 10,780 | 2,944,557 | ||||||
| 4,440,941 | ||||||||
| High Yield Bond Funds — 4.6% | ||||||||
| Loomis Sayles Institutional High Income Fund | 346,268 | 2,558,922 | ||||||
| Oppenheimer Senior Floating Rate Fund - Class A | 98,789 | 808,095 | ||||||
| 3,367,017 | ||||||||
| Convertible Bond Funds — 4.1% | ||||||||
| AllianzGI Convertible Fund - Institutional Class | 86,105 | 2,991,300 | ||||||
See accompanying notes to financial statements.
10
NEW CENTURY BALANCED PORTFOLIO SCHEDULE OF INVESTMENTS (Continued) |
| INVESTMENT COMPANIES — 97.7% (Continued) | Shares | Value | ||||||
| Worldwide Bond Funds — 4.1% | ||||||||
| Loomis Sayles Global Bond Fund - Institutional Class | 41,185 | $ | 640,015 | |||||
Templeton Global Bond Fund - Class A | 186,803 | 2,331,303 | ||||||
| 2,971,318 | ||||||||
| Small-Cap Funds — 3.4% | ||||||||
Brown Capital Management Small Company Fund - Institutional Class (b) | 16,264 | 1,218,688 | ||||||
iShares S&P SmallCap 600 Value ETF (a) | 10,700 | 1,249,118 | ||||||
| 2,467,806 | ||||||||
Total Investment Companies (Cost $56,435,125) | $ | 71,165,388 | ||||||
| STRUCTURED NOTES — 1.2% | Par Value | Value | ||||||
BNP Paribas Return Enhanced Notes Linked to the Performance of PowerShares S&P 500 Low Volatility Portfolio, due 03/31/2017 (b) (Cost $750,000) | $ | 750,000 | $ | 887,555 | ||||
| MONEY MARKET FUNDS — 1.2% | Shares | Value | ||||||
Invesco STIT-STIC Prime Portfolio (The) - Institutional Class, 0.04% (c) (Cost $870,906) | 870,906 | $ | 870,906 | |||||
Total Investments at Value — 100.1% (Cost $58,056,031) | $ | 72,923,849 | ||||||
| Liabilities in Excess of Other Assets — (0.1%) | (68,262 | ) | ||||||
Net Assets — 100.0% | $ | 72,855,587 | ||||||
(a) | Exchange-traded fund. |
(b) | Non-income producing security. |
(c) | The rate shown is the 7-day effective yield as of April 30, 2015. |
See accompanying notes to financial statements.
11
NEW CENTURY INTERNATIONAL PORTFOLIO
PORTFOLIO INFORMATION
April 30, 2015 (Unaudited)
PORTFOLIO INFORMATION
April 30, 2015 (Unaudited)
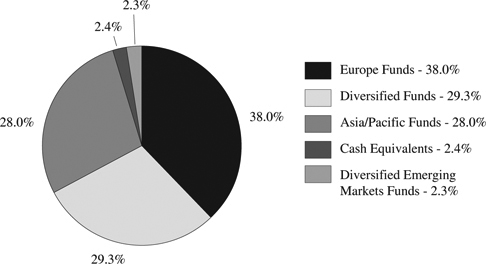
Asset Allocation (% of Net Assets)
| Top Ten Long-Term Holdings |
| Security Description | % of Net Assets | |
| WisdomTree Japan Hedged Equity Fund | 7.5% | |
| Franklin Mutual European Fund - Class A | 6.9% | |
| T. Rowe Price European Stock Fund | 6.8% | |
| Matthews Japan Fund - Institutional Class | 6.1% | |
| Matthews Pacific Tiger Fund - Investor Class | 6.0% | |
| Oakmark International Fund - Class I | 5.8% | |
| iShares MSCI United Kingdon ETF | 5.5% | |
| WisdomTree Europe Hedged Equity Fund | 5.0% | |
| Columbia European Equity Fund - Class A | 4.6% | |
| iShares MSCI Germany ETF | 3.7% |
12
NEW CENTURY INTERNATIONAL PORTFOLIO SCHEDULE OF INVESTMENTS April 30, 2015 (Unaudited) |
| INVESTMENT COMPANIES — 97.6% | Shares | Value | ||||||
| Europe Funds — 38.0% | ||||||||
Columbia European Equity Fund - Class A | 363,187 | $ | 2,625,846 | |||||
| DFA United Kingdom Small Company Portfolio - Institutional Class | 10,133 | 361,146 | ||||||
Franklin Mutual European Fund - Class A | 179,588 | 3,963,512 | ||||||
iShares MSCI Germany ETF (a) | 72,600 | 2,150,412 | ||||||
iShares MSCI Ireland Capped ETF (a) | 15,000 | 588,900 | ||||||
iShares MSCI Switzerland Capped ETF (a) | 45,600 | 1,575,024 | ||||||
iShares MSCI United Kingdom ETF (a) | 165,146 | 3,172,455 | ||||||
T. Rowe Price European Stock Fund | 182,994 | 3,903,257 | ||||||
WisdomTree Europe Hedged Equity Fund (a) | 45,000 | 2,891,700 | ||||||
WisdomTree Europe SmallCap Dividend Fund (a) | 10,000 | 590,100 | ||||||
| 21,822,352 | ||||||||
| Diversified Funds — 29.3% | ||||||||
Deutsche X-Trackers MSCI EAFE Hedged Equity ETF (a) | 50,000 | 1,509,500 | ||||||
DFA International Small Cap Value Portfolio - Institutional Class | 25,265 | 516,675 | ||||||
Dodge & Cox International Stock Fund | 32,631 | 1,478,835 | ||||||
Harding, Loevner International Equity Portfolio - Institutional Class | 44,611 | 858,314 | ||||||
iShares MSCI EAFE Minimum Volatility ETF (a) | 11,000 | 748,000 | ||||||
JOHCM International Select Fund - Class I | 73,457 | 1,529,383 | ||||||
Lazard Global Listed Infrastructure Portfolio - Institutional Shares | 137,497 | 2,051,449 | ||||||
MFS International Value Fund - Class I | 50,918 | 1,919,093 | ||||||
Oakmark International Fund - Class I | 131,989 | 3,344,613 | ||||||
| Pear Tree Polaris Foreign Value Small Cap Fund - Institutional Shares | 69,073 | 967,023 | ||||||
Templeton Institutional Foreign Smaller Companies Series Advisor Fund | 82,442 | 1,912,652 | ||||||
| 16,835,537 | ||||||||
| Asia/Pacific Funds — 28.0% | ||||||||
Deutsche X-Trackers Harvest CSI 300 China A-Shares ETF (a) | 15,000 | 731,400 | ||||||
iShares MSCI Australia ETF (a) | 45,100 | 1,051,732 | ||||||
| Matthews China Dividend Fund - Investor Class | 98,494 | 1,636,962 | ||||||
Matthews India Fund - Investor Class | 34,471 | 952,085 | ||||||
Matthews Japan Fund - Institutional Class | 189,924 | 3,528,786 | ||||||
Matthews Pacific Tiger Fund - Investor Class | 116,344 | 3,437,957 | ||||||
SPDR S&P China ETF (a) | 5,000 | 486,250 | ||||||
WisdomTree Japan Hedged Equity Fund (a) | 76,000 | 4,287,920 | ||||||
| 16,113,092 | ||||||||
| Diversified Emerging Markets Funds — 2.3% | ||||||||
William Blair Emerging Markets Small Cap Growth Fund - Class I | 73,544 | 1,295,842 | ||||||
Total Investment Companies (Cost $46,602,725) | $ | 56,066,823 | ||||||
See accompanying notes to financial statements.
13
NEW CENTURY INTERNATIONAL PORTFOLIO SCHEDULE OF INVESTMENTS (Continued) |
| MONEY MARKET FUNDS — 2.5% | Shares | Value | ||||||
Invesco STIT-STIC Prime Portfolio (The) - Institutional Class, 0.04% (b) (Cost $1,425,154) | 1,425,154 | $ | 1,425,154 | |||||
Total Investments at Value — 100.1% (Cost $48,027,879) | $ | 57,491,977 | ||||||
| Liabilities in Excess of Other Assets — (0.1%) | (56,435 | ) | ||||||
Net Assets — 100.0% | $ | 57,435,542 | ||||||
(a) | Exchange-traded fund. |
(b) | The rate shown is the 7-day effective yield as of April 30, 2015. |
See accompanying notes to financial statements.
14
NEW CENTURY ALTERNATIVE STRATEGIES PORTFOLIO
PORTFOLIO INFORMATION
April 30, 2015 (Unaudited)
PORTFOLIO INFORMATION
April 30, 2015 (Unaudited)
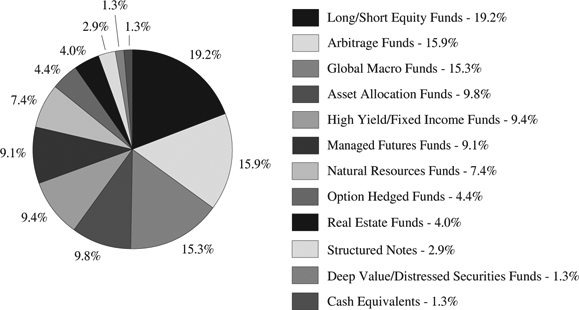
Asset Allocation (% of Net Assets)
| Top Ten Long-Term Holdings |
| Security Description | % of Net Assets | |
| The Merger Fund - Investor Class | 6.2% | |
| Berwyn Income Fund | 5.5% | |
| First Eagle Global Fund - Class A | 5.4% | |
| 361 Managed Futures Strategy Fund - Class I | 5.0% | |
| Touchstone Merger Arbitrage Fund - Institutional Class | 5.0% | |
| Boston Partners Long/Short Research Fund - Institutional Class | 4.8% | |
| Calamos Market Neutral Income Fund - Class A | 4.7% | |
| Weitz Partners III Opportunity Fund - Institutional Class | 4.6% | |
| FPA Crescent Fund | 4.3% | |
| John Hancock Global Absolute Return Strategies Fund - Class I | 3.8% |
15
NEW CENTURY ALTERNATIVE STRATEGIES PORTFOLIO SCHEDULE OF INVESTMENTS April 30, 2015 (Unaudited) |
| INVESTMENT COMPANIES — 95.8% | Shares | Value | ||||||
| Long/Short Equity Funds — 19.2% | ||||||||
| AllianceBernstein Select US Long/Short Portfolio - Class I | 144,839 | $ | 1,711,999 | |||||
Boston Partners Long/Short Research Fund - Institutional Class (b) | 325,044 | 5,015,434 | ||||||
| Gotham Absolute Return Fund - Institutional Class | 162,535 | 2,200,729 | ||||||
MainStay Marketfield Fund - Class I (b) | 146,400 | 2,421,449 | ||||||
TFS Market Neutral Fund | 74,370 | 1,145,301 | ||||||
Vanguard Market Neutral Fund - Investor Shares (b) | 253,516 | 2,885,015 | ||||||
Weitz Partners III Opportunity Fund - Institutional Class (b) | 278,902 | 4,811,057 | ||||||
| 20,190,984 | ||||||||
| Arbitrage Funds — 15.9% | ||||||||
| Calamos Market Neutral Income Fund - Class A | 379,473 | 4,978,679 | ||||||
The Merger Fund - Investor Class | 412,565 | 6,539,157 | ||||||
Touchstone Merger Arbitrage Fund - Institutional Class (b) | 494,937 | 5,266,126 | ||||||
| 16,783,962 | ||||||||
| Global Macro Funds — 15.3% | ||||||||
First Eagle Global Fund - Class A | 103,450 | 5,652,514 | ||||||
| Franklin Mutual Global Discovery Fund - Class Z | 112,192 | 3,940,184 | ||||||
Ivy Asset Strategy Fund - Class A | 98,616 | 2,574,863 | ||||||
| John Hancock Global Absolute Return Strategies Fund - Class I | 353,073 | 3,965,010 | ||||||
| 16,132,571 | ||||||||
| Asset Allocation Funds — 9.8% | ||||||||
Berwyn Income Fund | 426,127 | 5,795,320 | ||||||
FPA Crescent Fund | 132,612 | 4,535,338 | ||||||
| 10,330,658 | ||||||||
| High Yield/Fixed Income Funds — 9.4% | ||||||||
BlackRock Credit Allocation Income Trust (d) | 70,000 | 947,800 | ||||||
| Legg Mason BW Alternative Credit Fund - Class IS | 228,178 | 2,418,690 | ||||||
PIMCO Dynamic Income Fund (d) | 30,000 | 901,200 | ||||||
PIMCO Income Fund - Institutional Class | 151,389 | 1,884,795 | ||||||
Templeton Global Bond Fund - Class A | 81,740 | 1,020,110 | ||||||
Templeton Global Income Fund (d) | 370,000 | 2,708,400 | ||||||
| 9,880,995 | ||||||||
| Managed Futures Funds — 9.1% | ||||||||
361 Managed Futures Strategy Fund - Class I | 453,710 | 5,299,329 | ||||||
| AQR Managed Futures Strategy Fund - Class N | 282,922 | 3,131,948 | ||||||
| PIMCO TRENDS Managed Futures Strategy Fund - Institutional Class | 107,239 | 1,161,394 | ||||||
| 9,592,671 | ||||||||
| Natural Resources Funds — 7.4% | ||||||||
Energy Select Sector SPDR Fund (a) | 14,000 | 1,157,520 | ||||||
First Eagle Gold Fund - Class I (b) | 72,254 | 1,098,266 | ||||||
Oppenheimer SteelPath MLP Select 40 Fund - Class Y (b) | 117,992 | 1,473,721 | ||||||
SPDR Gold Trust (a) (b) (c) | 7,800 | 885,066 | ||||||
| Tortoise MLP & Pipeline Fund - Institutional Class | 189,071 | 3,221,773 | ||||||
| 7,836,346 | ||||||||
See accompanying notes to financial statements.
16
NEW CENTURY ALTERNATIVE STRATEGIES PORTFOLIO SCHEDULE OF INVESTMENTS (Continued) |
| INVESTMENT COMPANIES — 95.8% (Continued) | Shares | Value | ||||||
| Option Hedged Funds — 4.4% | ||||||||
BlackRock Enhanced Equity Dividend Trust (d) | 120,000 | $ | 984,000 | |||||
JPMorgan Hedged Equity Fund - Select Class | 73,065 | 1,209,950 | ||||||
Swan Defined Risk Fund - Class I | 198,298 | 2,387,508 | ||||||
| 4,581,458 | ||||||||
| Real Estate Funds — 4.0% | ||||||||
CBRE Clarion Global Real Estate Income Fund (d) | 134,000 | 1,167,140 | ||||||
Vanguard REIT ETF (a) | 26,400 | 2,095,632 | ||||||
Voya Global Real Estate Fund - Class I | 47,205 | 973,357 | ||||||
| 4,236,129 | ||||||||
| Deep Value/Distressed Securities Funds — 1.3% | ||||||||
| Third Avenue Focused Credit Fund - Institutional Class | 148,059 | 1,390,278 | ||||||
Total Investment Companies (Cost $89,057,386) | $ | 100,956,052 | ||||||
| STRUCTURED NOTES — 2.9% | Par Value | Value | ||||||
BNP Paribas Buffered Return Enhanced Notes Linked to the Performance of WTI Crude Oil, due 03/24/2016 (b) | $ | 1,500,000 | $ | 1,074,286 | ||||
JPMorgan Chase & Co., Dual Directional Contingent Buffered Return Enhanced Notes Linked to the EURO STOXX 50 Index, due 12/14/2016 (b) | 1,800,000 | 1,943,100 | ||||||
Total Structured Notes (Cost $3,300,000) | $ | 3,017,386 | ||||||
| MONEY MARKET FUNDS — 1.4% | Shares | Value | ||||||
Invesco STIT-STIC Prime Portfolio (The) - Institutional Class, 0.04% (e) (Cost $1,438,915) | 1,438,915 | $ | 1,438,915 | |||||
Total Investments at Value — 100.1% (Cost $93,796,301) | $ | 105,412,353 | ||||||
| Liabilities in Excess of Other Assets — (0.1%) | (89,686 | ) | ||||||
Net Assets — 100.0% | $ | 105,322,667 | ||||||
(a) | Exchange-traded fund. |
(b) | Non-income producing security. |
(c) | For federal income tax purposes, structured as a grantor trust. |
(d) | Closed-end fund. |
(e) | The rate shown is the 7-day effective yield as of April 30, 2015. |
See accompanying notes to financial statements.
17
NEW CENTURY PORTFOLIOS STATEMENTS OF ASSETS AND LIABILITIES April 30, 2015 (Unaudited) |
New Century Capital Portfolio | New Century Balanced Portfolio | New Century International Portfolio | New Century Alternative Strategies Portfolio | |||||||||||||
| ASSETS | ||||||||||||||||
| Investments in securities: | ||||||||||||||||
At acquisition cost | $ | 84,517,196 | $ | 58,056,031 | $ | 48,027,879 | $ | 93,796,301 | ||||||||
At value (Note 1A) | $ | 115,286,049 | $ | 72,923,849 | $ | 57,491,977 | $ | 105,412,353 | ||||||||
Cash | — | — | — | 5,604 | ||||||||||||
Dividends receivable | 650 | 25,177 | 803 | 17,978 | ||||||||||||
| Receivable for capital shares sold | 18,192 | 1,456 | 3,381 | 19,874 | ||||||||||||
Other assets | 11,697 | 8,006 | 6,554 | 12,137 | ||||||||||||
TOTAL ASSETS | 115,316,588 | 72,958,488 | 57,502,715 | 105,467,946 | ||||||||||||
| LIABILITIES | ||||||||||||||||
| Payable for investment securities purchased | — | 23,923 | — | 12,649 | ||||||||||||
| Payable for capital shares redeemed | — | — | — | 40,524 | ||||||||||||
| Payable to Adviser (Note 2) | 95,735 | 57,444 | 48,666 | 68,564 | ||||||||||||
| Payable to Distributor (Note 3) | 24,100 | 13,000 | 11,300 | 12,200 | ||||||||||||
| Other accrued expenses and liabilities | 11,235 | 8,534 | 7,207 | 11,342 | ||||||||||||
| TOTAL LIABILITIES | 131,070 | 102,901 | 67,173 | 145,279 | ||||||||||||
NET ASSETS | $ | 115,185,518 | $ | 72,855,587 | $ | 57,435,542 | $ | 105,322,667 | ||||||||
| Net assets consist of: | ||||||||||||||||
Paid-in capital | $ | 76,453,942 | $ | 55,038,223 | $ | 43,135,710 | $ | 94,113,386 | ||||||||
| Accumulated (distributions in excess of) net investment income | 401,356 | 23,603 | 378,568 | (208,872 | ) | |||||||||||
| Accumulated net realized gains (losses) on investments | 7,561,367 | 2,925,943 | 4,457,166 | (197,899 | ) | |||||||||||
Net unrealized appreciation on investments | 30,768,853 | 14,867,818 | 9,464,098 | 11,616,052 | ||||||||||||
Net assets | $ | 115,185,518 | $ | 72,855,587 | $ | 57,435,542 | $ | 105,322,667 | ||||||||
| Shares of beneficial interest outstanding (unlimited number of shares authorized, no par value) | 5,954,885 | 4,589,895 | 4,071,632 | 8,012,112 | ||||||||||||
Net asset value, offering price and redemption price per share (a) | $ | 19.34 | $ | 15.87 | $ | 14.11 | $ | 13.15 | ||||||||
(a) | Redemption price may differ from the net asset value per share depending upon the length of time held (Note 1B). |
See accompanying notes to financial statements.
18
NEW CENTURY PORTFOLIOS STATEMENTS OF OPERATIONS For the Six Months Ended April 30, 2015 (Unaudited) |
New Century Capital Portfolio | New Century Balanced Portfolio | New Century International Portfolio | New Century Alternative Strategies Portfolio | |||||||||||||
| INVESTMENT INCOME | ||||||||||||||||
Dividends | $ | 1,291,732 | $ | 1,311,368 | $ | 1,041,746 | $ | 1,861,165 | ||||||||
| EXPENSES | ||||||||||||||||
| Investment advisory fees (Note 2) | 554,812 | 332,228 | 274,906 | 431,488 | ||||||||||||
| Distribution costs (Note 3) | 137,972 | 75,089 | 59,946 | 111,787 | ||||||||||||
Accounting fees | 25,724 | 20,315 | 18,171 | 25,640 | ||||||||||||
| Trustees’ fees (Note 2) | 27,231 | 17,039 | 13,136 | 26,594 | ||||||||||||
| Administration fees (Note 2) | 20,818 | 13,632 | 10,792 | 20,878 | ||||||||||||
Legal and audit fees | 18,699 | 12,968 | 10,712 | 18,279 | ||||||||||||
Transfer agent fees | 13,728 | 10,846 | 9,698 | 13,728 | ||||||||||||
| Custody and bank service fees | 10,348 | 7,427 | 6,598 | 12,305 | ||||||||||||
Postage & supplies | 4,862 | 3,176 | 2,853 | 5,133 | ||||||||||||
Insurance expense | 4,440 | 2,819 | 2,295 | 4,813 | ||||||||||||
Other expenses | 6,335 | 5,504 | 5,113 | 6,622 | ||||||||||||
Total expenses | 824,969 | 501,043 | 414,220 | 677,267 | ||||||||||||
| NET INVESTMENT INCOME | 466,763 | 810,325 | 627,526 | 1,183,898 | ||||||||||||
| REALIZED AND UNREALIZED GAINS (LOSSES) ON INVESTMENTS | ||||||||||||||||
| Net realized gains on investments | 4,600,712 | 1,337,722 | 3,174,980 | 1,451,041 | ||||||||||||
| Capital gain distributions from regulated investment companies | 3,322,584 | 1,743,208 | 1,282,530 | 1,949,855 | ||||||||||||
| Net change in unrealized appreciation (depreciation) on investments | (3,672,660 | ) | (1,991,458 | ) | (820,569 | ) | (3,294,299 | ) | ||||||||
| NET REALIZED AND UNREALIZED GAINS ON INVESTMENTS | 4,250,636 | 1,089,472 | 3,636,941 | 106,597 | ||||||||||||
| NET INCREASE IN NET ASSETS RESULTING FROM OPERATIONS | $ | 4,717,399 | $ | 1,899,797 | $ | 4,264,467 | $ | 1,290,495 | ||||||||
See accompanying notes to financial statements.
19
NEW CENTURY PORTFOLIOS STATEMENTS OF CHANGES IN NET ASSETS |
New Century Capital Portfolio | ||||||||
Six Months Ended April 30, 2015 (Unaudited) | Year Ended October 31, 2014 | |||||||
| FROM OPERATIONS | ||||||||
| Net investment income (loss) | $ | 466,763 | $ | (65,407 | ) | |||
| Net realized gains from security transactions | 4,600,712 | 12,309,795 | ||||||
| Capital gain distributions from regulated investment companies | 3,322,584 | 2,163,549 | ||||||
| Net change in unrealized appreciation (depreciation) on investments | (3,672,660 | ) | (1,938,516 | ) | ||||
| Net increase in net assets from operations | 4,717,399 | 12,469,421 | ||||||
| DISTRIBUTIONS TO SHAREHOLDERS | ||||||||
| From net realized gains on security transactions (Note 1E) | (14,111,794 | ) | (10,250,145 | ) | ||||
| FROM CAPITAL SHARE TRANSACTIONS | ||||||||
| Proceeds from shares sold | 1,436,335 | 1,834,772 | ||||||
| Proceeds from redemption fees collected (Note 1B) | — | 136 | ||||||
| Net asset value of shares issued in reinvestment of distributions to shareholders | 13,577,593 | 9,899,484 | ||||||
| Payments for shares redeemed | (5,387,786 | ) | (11,828,041 | ) | ||||
| Net increase (decrease) in net assets from capital share transactions | 9,626,142 | (93,649 | ) | |||||
| TOTAL INCREASE IN NET ASSETS | 231,747 | 2,125,627 | ||||||
| NET ASSETS | ||||||||
Beginning of period | 114,953,771 | 112,828,144 | ||||||
End of period �� | $ | 115,185,518 | $ | 114,953,771 | ||||
| ACCUMULATED (DISTRIBUTIONS IN EXCESS OF) NET INVESTMENT INCOME | $ | 401,356 | $ | (65,407 | ) | |||
| CAPITAL SHARE ACTIVITY | ||||||||
Shares sold | 72,874 | 90,311 | ||||||
Shares reinvested | 720,296 | 497,461 | ||||||
Shares redeemed | (272,423 | ) | (576,155 | ) | ||||
| Net increase in shares outstanding | 520,747 | 11,617 | ||||||
| Shares outstanding, beginning of period | 5,434,138 | 5,422,521 | ||||||
| Shares outstanding, end of period | 5,954,885 | 5,434,138 | ||||||
See accompanying notes to financial statements.
20
NEW CENTURY PORTFOLIOS STATEMENTS OF CHANGES IN NET ASSETS |
New Century Balanced Portfolio | ||||||||
Six Months Ended April 30, 2015 (Unaudited) | Year Ended October 31, 2014 | |||||||
| FROM OPERATIONS | ||||||||
| Net investment income | $ | 810,325 | $ | 637,899 | ||||
| Net realized gains from security transactions | 1,337,722 | 3,628,603 | ||||||
| Capital gain distributions from regulated investment companies | 1,743,208 | 1,240,264 | ||||||
| Net change in unrealized appreciation (depreciation) on investments | (1,991,458 | ) | (62,987 | ) | ||||
| Net increase in net assets from operations | 1,899,797 | 5,443,779 | ||||||
| DISTRIBUTIONS TO SHAREHOLDERS | ||||||||
| From net investment income (Note 1E) | (819,672 | ) | (790,570 | ) | ||||
| From net realized gains on security transactions (Note 1E) | (4,869,042 | ) | (3,999,254 | ) | ||||
| Decrease in net assets from distributions to shareholders | (5,688,714 | ) | (4,789,824 | ) | ||||
| FROM CAPITAL SHARE TRANSACTIONS | ||||||||
| Proceeds from shares sold | 1,584,005 | 3,165,864 | ||||||
| Proceeds from redemption fees collected (Note 1B) | 31 | — | ||||||
| Net asset value of shares issued in reinvestment of distributions to shareholders | 5,346,443 | 4,582,522 | ||||||
| Payments for shares redeemed | (4,022,782 | ) | (6,122,526 | ) | ||||
| Net increase in net assets from capital share transactions | 2,907,697 | 1,625,860 | ||||||
| TOTAL INCREASE (DECREASE) IN NET ASSETS | (881,220 | ) | 2,279,815 | |||||
| NET ASSETS | ||||||||
Beginning of period | 73,736,807 | 71,456,992 | ||||||
End of period | $ | 72,855,587 | $ | 73,736,807 | ||||
| ACCUMULATED NET INVESTMENT INCOME | $ | 23,603 | $ | 32,950 | ||||
| CAPITAL SHARE ACTIVITY | ||||||||
Shares sold | 99,707 | 191,900 | ||||||
Shares reinvested | 345,600 | 286,766 | ||||||
Shares redeemed | (245,482 | ) | (373,561 | ) | ||||
| Net increase in shares outstanding | 199,825 | 105,105 | ||||||
| Shares outstanding, beginning of period | 4,390,070 | 4,284,965 | ||||||
| Shares outstanding, end of period | 4,589,895 | 4,390,070 | ||||||
See accompanying notes to financial statements.
21
NEW CENTURY PORTFOLIOS STATEMENTS OF CHANGES IN NET ASSETS |
New Century International Portfolio | ||||||||
Six Months Ended April 30, 2015 (Unaudited) | Year Ended October 31, 2014 | |||||||
| FROM OPERATIONS | ||||||||
| Net investment income | $ | 627,526 | $ | 393,493 | ||||
| Net realized gains from security transactions | 3,174,980 | 5,452,098 | ||||||
| Capital gain distributions from regulated investment companies | 1,282,530 | 589,544 | ||||||
| Net change in unrealized appreciation (depreciation) on investments | (820,569 | ) | (6,883,739 | ) | ||||
| Net increase (decrease) in net assets from operations | 4,264,467 | (448,604 | ) | |||||
| DISTRIBUTIONS TO SHAREHOLDERS | ||||||||
| From net investment income (Note 1E) | (642,401 | ) | (361,371 | ) | ||||
| From net realized gains on security transactions (Note 1E) | (6,041,792 | ) | (4,279,496 | ) | ||||
| Decrease in net assets from distributions to shareholders | (6,684,193 | ) | (4,640,867 | ) | ||||
| FROM CAPITAL SHARE TRANSACTIONS | ||||||||
| Proceeds from shares sold | 1,080,514 | 1,123,604 | ||||||
| Proceeds from redemption fees collected (Note 1B) | — | 2 | ||||||
| Net asset value of shares issued in reinvestment of distributions to shareholders | 6,541,949 | 4,538,606 | ||||||
| Payments for shares redeemed | (3,839,959 | ) | (7,207,518 | ) | ||||
| Net increase (decrease) in net assets from capital share transactions | 3,782,504 | (1,545,306 | ) | |||||
| TOTAL INCREASE (DECREASE) IN NET ASSETS | 1,362,778 | (6,634,777 | ) | |||||
| NET ASSETS | ||||||||
Beginning of period | 56,072,764 | 62,707,541 | ||||||
End of period | $ | 57,435,542 | $ | 56,072,764 | ||||
| ACCUMULATED NET INVESTMENT INCOME | $ | 378,568 | $ | 393,443 | ||||
| CAPITAL SHARE ACTIVITY | ||||||||
Shares sold | 78,266 | 73,873 | ||||||
Shares reinvested | 507,915 | 296,060 | ||||||
Shares redeemed | (276,970 | ) | (467,703 | ) | ||||
| Net increase (decrease) in shares outstanding | 309,211 | (97,770 | ) | |||||
| Shares outstanding, beginning of period | 3,762,421 | 3,860,191 | ||||||
| Shares outstanding, end of period | 4,071,632 | 3,762,421 | ||||||
See accompanying notes to financial statements.
22
NEW CENTURY PORTFOLIOS STATEMENTS OF CHANGES IN NET ASSETS |
New Century Alternative Strategies Portfolio | ||||||||
Six Months Ended April 30, 2015 (Unaudited) | Year Ended October 31, 2014 | |||||||
| FROM OPERATIONS | ||||||||
| Net investment income | $ | 1,183,898 | $ | 817,361 | ||||
| Net realized gains from security transactions | 1,451,041 | 1,346,766 | ||||||
| Capital gain distributions from regulated investment companies | 1,949,855 | 1,612,359 | ||||||
| Net change in unrealized appreciation (depreciation) on investments | (3,294,299 | ) | (1,966,593 | ) | ||||
| Net increase in net assets from operations | 1,290,495 | 1,809,893 | ||||||
| DISTRIBUTIONS TO SHAREHOLDERS | ||||||||
| From net investment income (Note 1E) | (1,227,530 | ) | (748,917 | ) | ||||
| FROM CAPITAL SHARE TRANSACTIONS | ||||||||
| Proceeds from shares sold | 3,985,914 | 12,507,050 | ||||||
| Proceeds from redemption fees collected (Note 1B) | 850 | 335 | ||||||
| Net asset value of shares issued in reinvestment of distributions to shareholders | 1,192,680 | 721,862 | ||||||
| Payments for shares redeemed | (21,466,238 | ) | (16,154,264 | ) | ||||
| Net decrease in net assets from capital share transactions | (16,286,794 | ) | (2,925,017 | ) | ||||
| TOTAL DECREASE IN NET ASSETS | (16,223,829 | ) | (1,864,041 | ) | ||||
| NET ASSETS | ||||||||
Beginning of period | 121,546,496 | 123,410,537 | ||||||
End of period | $ | 105,322,667 | $ | 121,546,496 | ||||
| DISTRIBUTIONS IN EXCESS OF NET INVESTMENT INCOME | $ | (208,872 | ) | $ | (165,240 | ) | ||
| CAPITAL SHARE ACTIVITY | ||||||||
Shares sold | 304,553 | 950,486 | ||||||
Shares reinvested | 92,099 | 55,358 | ||||||
Shares redeemed | (1,637,300 | ) | (1,229,535 | ) | ||||
| Net decrease in shares outstanding | (1,240,648 | ) | (223,691 | ) | ||||
| Shares outstanding, beginning of period | 9,252,760 | 9,476,451 | ||||||
| Shares outstanding, end of period | 8,012,112 | 9,252,760 | ||||||
See accompanying notes to financial statements.
23
NEW CENTURY CAPITAL PORTFOLIO FINANCIAL HIGHLIGHTS |
| Selected Per Share Data and Ratios for a Share Outstanding Throughout Each Period | ||||||||||||||||||||||||
Six Months Ended April 30, 2015 | Years Ended October 31, | |||||||||||||||||||||||
| (Unaudited) | 2014 | 2013 | 2012 | 2011 | 2010 | |||||||||||||||||||
| PER SHARE OPERATING PERFORMANCE | ||||||||||||||||||||||||
| Net asset value, beginning of period | $ | 21.15 | $ | 20.81 | $ | 17.55 | $ | 16.11 | $ | 15.41 | $ | 13.26 | ||||||||||||
| Income (loss) from investment operations: | ||||||||||||||||||||||||
| Net investment income (loss) | 0.08 | (0.01 | ) | (0.00 | )(a) | (0.01 | ) | (0.04 | ) | (0.03 | ) | |||||||||||||
| Net realized and unrealized gains on investments | 0.73 | 2.29 | 4.11 | 1.54 | 0.74 | 2.21 | ||||||||||||||||||
| Total from investment operations | 0.81 | 2.28 | 4.11 | 1.53 | 0.70 | 2.18 | ||||||||||||||||||
| Less distributions: | ||||||||||||||||||||||||
| Distributions from net investment income | — | — | — | — | — | (0.03 | ) | |||||||||||||||||
Distributions from net realized gains | (2.62 | ) | (1.94 | ) | (0.85 | ) | (0.09 | ) | — | — | ||||||||||||||
Total distributions | (2.62 | ) | (1.94 | ) | (0.85 | ) | (0.09 | ) | — | (0.03 | ) | |||||||||||||
| Proceeds from redemption fees collected (Note 1B) | — | 0.00 | (a) | 0.00 | (a) | — | — | 0.00 | (a) | |||||||||||||||
| Net asset value, end of period | $ | 19.34 | $ | 21.15 | $ | 20.81 | $ | 17.55 | $ | 16.11 | $ | 15.41 | ||||||||||||
TOTAL RETURN (b) | 4.17 | %(c) | 11.53 | % | 24.45 | % | 9.57 | % | 4.54 | % | 16.47 | % | ||||||||||||
| RATIOS/SUPPLEMENTAL DATA | ||||||||||||||||||||||||
| Net assets, end of period (000’s) | $ | 115,186 | $ | 114,954 | $ | 112,828 | $ | 87,664 | $ | 88,602 | $ | 93,266 | ||||||||||||
Ratio of expenses to average net assets (d) | 1.44 | %(f) | 1.41 | % | 1.43 | % | 1.46 | % | 1.42 | % | 1.40 | % | ||||||||||||
Ratio of net investment income (loss) to average net assets (e) | 0.81 | %(f) | (0.06 | %) | (0.00 | %)(a) | (0.05 | %) | (0.25 | %) | (0.20 | %) | ||||||||||||
Portfolio turnover | 22 | %(c) | 26 | % | 28 | % | 7 | % | 60 | % | 10 | % | ||||||||||||
(a) | Amount rounds to less than $0.01 per share. |
(b) | Total return is a measure of the change in the value of an investment in the Portfolio over the periods covered, which assumes dividends or capital gains distributions, if any, are reinvested in shares of the Portfolio. Returns shown do not reflect the taxes a shareholder would pay on Portfolio distributions, if any, or the redemption of Portfolio shares |
(c) | Not annualized. |
(d) | The ratios of expenses to average net assets do not reflect the Portfolio’s proportionate share of expenses of the underlying investment companies in which the Portfolio invests (Note 2). |
(e) | Recognition of net investment income (loss) by the Portfolio is affected by the timing of the declaration of dividends by the underlying investment companies in which the Portfolio invests. |
(f) | Annualized. |
See accompanying notes to financial statements.
24
NEW CENTURY BALANCED PORTFOLIO FINANCIAL HIGHLIGHTS |
| Selected Per Share Data and Ratios for a Share Outstanding Throughout Each Period | ||||||||||||||||||||||||
Six Months Ended April 30, 2015 | Years Ended October 31, | |||||||||||||||||||||||
| (Unaudited) | 2014 | 2013 | 2012 | 2011 | 2010 | |||||||||||||||||||
| PER SHARE OPERATING PERFORMANCE | ||||||||||||||||||||||||
| Net asset value, beginning of period | $ | 16.80 | $ | 16.68 | $ | 14.56 | $ | 13.59 | $ | 13.22 | $ | 11.93 | ||||||||||||
| Income from investment operations: | ||||||||||||||||||||||||
| Net investment income | 0.19 | 0.15 | 0.18 | 0.17 | 0.20 | 0.15 | ||||||||||||||||||
| Net realized and unrealized gains on investments | 0.22 | 1.10 | 2.12 | 0.97 | 0.37 | 1.30 | ||||||||||||||||||
| Total from investment operations | 0.41 | 1.25 | 2.30 | 1.14 | 0.57 | 1.45 | ||||||||||||||||||
| Less distributions: | ||||||||||||||||||||||||
| Distributions from net investment income | (0.19 | ) | (0.19 | ) | (0.18 | ) | (0.17 | ) | (0.20 | ) | (0.16 | ) | ||||||||||||
Distributions from net realized gains | (1.15 | ) | (0.94 | ) | — | — | — | — | ||||||||||||||||
Total distributions | (1.34 | ) | (1.13 | ) | (0.18 | ) | (0.17 | ) | (0.20 | ) | (0.16 | ) | ||||||||||||
| Proceeds from redemption fees collected (Note 1B) | 0.00 | (a) | — | 0.00 | (a) | 0.00 | (a) | 0.00 | (a) | — | ||||||||||||||
| Net asset value, end of period | $ | 15.87 | $ | 16.80 | $ | 16.68 | $ | 14.56 | $ | 13.59 | $ | 13.22 | ||||||||||||
TOTAL RETURN (b) | 2.62 | %(c) | 7.81 | % | 15.97 | % | 8.54 | % | 4.29 | % | 12.23 | % | ||||||||||||
| RATIOS/SUPPLEMENTAL DATA | ||||||||||||||||||||||||
| Net assets, end of period (000’s) | $ | 72,856 | $ | 73,737 | $ | 71,457 | $ | 66,826 | $ | 64,582 | $ | 64,880 | ||||||||||||
Ratio of expenses to average net assets (d) | 1.39 | %(f) | 1.40 | % | 1.43 | % | 1.45 | % | 1.43 | % | 1.44 | % | ||||||||||||
Ratio of net investment income to average net assets (e) | 2.25 | %(f) | 0.88 | % | 1.17 | % | 1.18 | % | 1.39 | % | 1.20 | % | ||||||||||||
Portfolio turnover | 12 | %(c) | 16 | % | 21 | % | 13 | % | 17 | % | 7 | % | ||||||||||||
(a) | Amount rounds to less than $0.01 per share. |
(b) | Total return is a measure of the change in the value of an investment in the Portfolio over the periods covered, which assumes dividends or capital gains distributions, if any, are reinvested in shares of the Portfolio. Returns shown do not reflect the taxes a shareholder would pay on Portfolio distributions, if any, or the redemption of Portfolio shares. |
(c) | Not annualized. |
(d) | The ratios of expenses to average net assets do not reflect the Portfolio’s proportionate share of expenses of the underlying investment companies in which the Portfolio invests (Note 2). |
(e) | Recognition of net investment income by the Portfolio is affected by the timing of the declaration of dividends by the underlying investment companies in which the Portfolio invests. |
(f) | Annualized. |
See accompanying notes to financial statements.
25
NEW CENTURY INTERNATIONAL PORTFOLIO FINANCIAL HIGHLIGHTS |
| Selected Per Share Data and Ratios for a Share Outstanding Throughout Each Period | ||||||||||||||||||||||||
Six Months Ended April 30, 2015 | Years Ended October 31, | |||||||||||||||||||||||
| (Unaudited) | 2014 | 2013 | 2012 | 2011 | 2010 | |||||||||||||||||||
| PER SHARE OPERATING PERFORMANCE | ||||||||||||||||||||||||
| Net asset value, beginning of period | $ | 14.90 | $ | 16.24 | $ | 13.92 | $ | 13.41 | $ | 14.53 | $ | 12.70 | ||||||||||||
| Income (loss) from investment operations: | ||||||||||||||||||||||||
| Net investment income | 0.16 | 0.11 | 0.11 | 0.15 | 0.10 | 0.09 | ||||||||||||||||||
| Net realized and unrealized gains (losses) on investments | 0.87 | (0.22 | ) | 2.37 | 0.46 | (1.14 | ) | 1.82 | ||||||||||||||||
| Total from investment operations | 1.03 | (0.11 | ) | 2.48 | 0.61 | (1.04 | ) | 1.91 | ||||||||||||||||
| Less distributions: | ||||||||||||||||||||||||
| Distributions from net investment income | (0.17 | ) | (0.10 | ) | (0.16 | ) | (0.10 | ) | (0.08 | ) | (0.08 | ) | ||||||||||||
Distributions from net realized gains | (1.65 | ) | (1.13 | ) | — | — | — | — | ||||||||||||||||
Total distributions | (1.82 | ) | (1.23 | ) | (0.16 | ) | (0.10 | ) | (0.08 | ) | (0.08 | ) | ||||||||||||
| Proceeds from redemption fees collected (Note 1B) | — | 0.00 | (a) | 0.00 | (a) | 0.00 | (a) | 0.00 | (a) | 0.00 | (a) | |||||||||||||
| Net asset value, end of period | $ | 14.11 | $ | 14.90 | $ | 16.24 | $ | 13.92 | $ | 13.41 | $ | 14.53 | ||||||||||||
TOTAL RETURN (b) | 8.11 | %(c) | (0.89 | %) | 17.95 | % | 4.60 | % | (7.22 | %) | 15.07 | % | ||||||||||||
| RATIOS/SUPPLEMENTAL DATA | ||||||||||||||||||||||||
| Net assets, end of period (000’s) | $ | 57,436 | $ | 56,073 | $ | 62,708 | $ | 57,266 | $ | 61,262 | $ | 68,947 | ||||||||||||
Ratios of expenses to average net assets (d) | 1.50 | %(f) | 1.47 | % | 1.43 | % | 1.50 | % | 1.46 | % | 1.45 | % | ||||||||||||
Ratios of net investment income to average net assets (e) | 2.28 | %(f) | 0.66 | % | 0.67 | % | 1.03 | % | 0.63 | % | 0.57 | % | ||||||||||||
Portfolio turnover | 36 | %(c) | 22 | % | 32 | % | 4 | % | 13 | % | 4 | % | ||||||||||||
(a) | Amount rounds to less than $0.01 per share. |
(b) | Total return is a measure of the change in the value of an investment in the Portfolio over the periods covered, which assumes dividends or capital gains distributions, if any, are reinvested in shares of the Portfolio. Returns shown do not reflect the taxes a shareholder would pay on Portfolio distributions, if any, or the redemption of Portfolio shares. |
(c) | Not annualized. |
(d) | The ratios of expenses to average net assets do not reflect the Portfolio’s proportionate share of expenses of the underlying investment companies in which the Portfolio invests (Note 2). |
(e) | Recognition of net investment income by the Portfolio is affected by the timing of the declaration of dividends by the underlying investment companies in which the Portfolio invests. |
(f) | Annualized. |
See accompanying notes to financial statements.
26
NEW CENTURY ALTERNATIVE STRATEGIES PORTFOLIO FINANCIAL HIGHLIGHTS |
| Selected Per Share Data and Ratios for a Share Outstanding Throughout Each Period | ||||||||||||||||||||||||
Six Months Ended April 30, 2015 | Years Ended October 31, | |||||||||||||||||||||||
| (Unaudited) | 2014 | 2013 | 2012 | 2011 | 2010 | |||||||||||||||||||
| PER SHARE OPERATING PERFORMANCE | ||||||||||||||||||||||||
| Net asset value, beginning of period | $ | 13.14 | $ | 13.02 | $ | 12.24 | $ | 11.80 | $ | 11.87 | $ | 11.11 | ||||||||||||
| Income (loss) from investment operations: | ||||||||||||||||||||||||
| Net investment income | 0.13 | 0.09 | 0.05 | 0.14 | 0.17 | 0.08 | ||||||||||||||||||
| Net realized and unrealized gains (losses) on investments | 0.02 | 0.11 | 0.80 | 0.47 | (0.09 | ) | 0.83 | |||||||||||||||||
| Total from investment operations | 0.15 | 0.20 | 0.85 | 0.61 | 0.08 | 0.91 | ||||||||||||||||||
| Less distributions: | ||||||||||||||||||||||||
| Distributions from net investment income | (0.14 | ) | (0.08 | ) | (0.07 | ) | (0.17 | ) | (0.15 | ) | (0.15 | ) | ||||||||||||
| Proceeds from redemption fees collected (Note 1B) | 0.00 | (a) | 0.00 | (a) | 0.00 | (a) | 0.00 | (a) | 0.00 | (a) | 0.00 | (a) | ||||||||||||
| Net asset value, end of period | $ | 13.15 | $ | 13.14 | $ | 13.02 | $ | 12.24 | $ | 11.80 | $ | 11.87 | ||||||||||||
TOTAL RETURN (b) | 1.13 | %(c) | 1.53 | % | 6.99 | % | 5.26 | % | 0.62 | % | 8.21 | % | ||||||||||||
| RATIOS/SUPPLEMENTAL DATA | ||||||||||||||||||||||||
| Net assets, end of period (000’s) | $ | 105,323 | $ | 121,546 | $ | 123,411 | $ | 117,272 | $ | 114,841 | $ | 135,287 | ||||||||||||
Ratio of expenses to average net assets (d) | 1.18 | %(f) | 1.14 | % | 1.13 | % | 1.11 | % | 1.09 | % | 1.10 | % | ||||||||||||
Ratio of net investment income to average net assets (e) | 2.06 | %(f) | 0.66 | % | 0.39 | % | 1.15 | % | 1.48 | % | 0.74 | % | ||||||||||||
Portfolio turnover | 17 | %(c) | 29 | % | 25 | % | 32 | % | 31 | % | 22 | % | ||||||||||||
(a) | Amount rounds to less than $0.01 per share. |
(b) | Total return is a measure of the change in the value of an investment in the Portfolio over the periods covered, which assumes dividends or capital gains distributions, if any, are reinvested in shares of the Portfolio. Returns shown do not reflect the taxes a shareholder would pay on Portfolio distributions, if any, or the redemption of Portfolio shares. |
(c) | Not annualized. |
(d) | The ratios of expenses to average net assets do not reflect the Portfolio’s proportionate share of expenses of the underlying investment companies in which the Portfolio invests (Note 2). |
(e) | Recognition of net investment income by the Portfolio is affected by the timing of the declaration of dividends by the underlying investment companies in which the Portfolio invests. |
(f) | Annualized. |
See accompanying notes to financial statements.
27
NEW CENTURY PORTFOLIOS
NOTES TO FINANCIAL STATEMENTS
April 30, 2015 (Unaudited)
NOTES TO FINANCIAL STATEMENTS
April 30, 2015 (Unaudited)
| (1) | SIGNIFICANT ACCOUNTING POLICIES |
New Century Portfolios (“New Century”) is organized as a Massachusetts business trust which is registered under the Investment Company Act of 1940, as amended, as an open-end management investment company and currently offers shares of four series: New Century Capital Portfolio, New Century Balanced Portfolio, New Century International Portfolio and New Century Alternative Strategies Portfolio (together, the “Portfolios” and each, a “Portfolio”). New Century Capital Portfolio and New Century Balanced Portfolio commenced operations on January 31, 1989. New Century International Portfolio commenced operations on November 1, 2000, and New Century Alternative Strategies Portfolio commenced operations on May 1, 2002.
Weston Financial Group, Inc. (the “Adviser”), a wholly-owned subsidiary of The Washington Trust Company, serves as the investment adviser to each Portfolio. Weston Securities Corporation (the “Distributor”), a wholly-owned subsidiary of Washington Trust Bancorp, Inc., serves as the distributor and principal underwriter to each Portfolio.
The investment objective of New Century Capital Portfolio is to provide capital growth, with a secondary objective to provide income, while managing risk. This Portfolio seeks to achieve its objective by investing primarily in shares of other registered investment companies, including exchange traded funds (“ETFs”), that emphasize investments in equity securities (domestic and foreign).
The investment objective of New Century Balanced Portfolio is to provide income, with a secondary objective to provide capital growth, while managing risk. This Portfolio seeks to achieve its objective by investing primarily in shares of other registered investment companies, including ETFs, that emphasize investments in equity securities (domestic and foreign), fixed income (domestic and foreign), or in a composite of such securities. This Portfolio maintains at least 25% of its assets in fixed income securities by selecting registered investment companies that invest in such securities.
The investment objective of New Century International Portfolio is to provide capital growth, with a secondary objective to provide income, while managing risk. This Portfolio seeks to achieve its objective by investing primarily in shares of registered investment companies, including ETFs, that emphasize investments in equity and fixed income securities (foreign, with less emphasis on domestic, worldwide and emerging markets).
The investment objective of New Century Alternative Strategies Portfolio is to provide total return, while managing risk.* This Portfolio seeks to achieve its objective by focusing on total return while managing volatility and risk. In addition, the Portfolio will continue to invest primarily in shares of other registered investment companies, including ETFs and closed-end funds, that emphasize alternative strategies which generally have low correlation to the securities in the S&P 500® Composite Index.
| * | See Results of Special Meeting of Shareholders. |
28
NEW CENTURY PORTFOLIOS
NOTES TO FINANCIAL STATEMENTS (Continued)
April 30, 2015 (Unaudited)
NOTES TO FINANCIAL STATEMENTS (Continued)
April 30, 2015 (Unaudited)
The price of shares of each Portfolio fluctuates daily and there is no assurance that the Portfolios will be successful in achieving their stated investment objectives.
As an investment company, as defined in Financial Accounting Standards Board (“FASB”) Accounting Standards Update 2013-08, the Portfolios follow accounting and reporting guidance under FASB Accounting Standards Codification Topic 946, “Financial Services – Investment Companies.” The following is a summary of significant accounting policies followed by the Portfolios in the preparation of their financial statements. These policies are in conformity with accounting principles generally accepted in the United States of America (“GAAP”).
| A. | Investment Valuation |
Investments in shares of other open-end investment companies are valued at their net asset value as reported by such companies. The net asset value as reported by open-end investment companies may be based on fair value pricing; to understand the fair value pricing process used by such companies, consult their most current prospectus. The Portfolios may also invest in closed-end investment companies, ETFs, and to a certain extent, directly in securities when the Adviser deems it appropriate. Investments in closed-end investment companies, ETFs and direct investments in securities are valued at market prices, as described in the paragraph below.
Investments in securities traded on a national securities exchange or included in NASDAQ are generally valued at the last reported sales price, the closing price or the official closing price; and securities traded in the over-the-counter market and listed securities for which no sale is reported on that date are valued at the last reported bid price. It is expected that fixed income securities will ordinarily be traded in the over-the-counter market. When market quotations are not readily available, fixed income securities may be valued on the basis of prices provided by an independent pricing service. Other assets and securities for which no quotations are readily available or for which quotations the Adviser believes do not reflect market value are valued at their fair value as determined in good faith by the Adviser under the procedures established by the Board of Trustees, and will be classified as Level 2 or 3 within the fair value hierarchy (see below), depending on the inputs used. Factors considered in determining the value of portfolio investments subject to fair value determination include, but are not limited to, the following: only a bid price or an asked price is available; the spread between bid and asked prices is substantial; infrequency of sales; thinness of market; the size of reported trades; a temporary lapse in the provision of prices by any reliable pricing source; and actions of the securities or future markets, such as the suspension or limitation of trading.
29
NEW CENTURY PORTFOLIOS NOTES TO FINANCIAL STATEMENTS (Continued) April 30, 2015 (Unaudited) |
GAAP establishes a single authoritative definition of fair value, sets out a framework for measuring fair value and requires additional disclosures about fair value measurements. Various inputs are used in determining the value of the Portfolios’ investments. These inputs are summarized in the three broad levels listed below:
| • | Level 1 – quoted prices in active markets for identical securities |
| • | Level 2 – other significant observable inputs |
| • | Level 3 – significant unobservable inputs |
Structured Notes held by New Century Balanced and New Century Alternative Strategies Portfolios are typically classified as Level 2 since the values for such securities are customarily based on prices provided by an independent pricing service that utilizes various “other significant observable inputs” including bid and ask quotations, prices of similar securities, underlying index values and interest rates, among other factors.
The inputs or methods used for valuing securities are not necessarily an indication of the risks associated with investing in those securities. The inputs used to measure fair value may fall into different levels of the fair value hierarchy. In such cases, for disclosure purposes, the level of the fair value hierarchy within which the fair value measurement of that security is determined to fall in its entirety is the lowest level input that is significant to the fair value measurement.
The following is a summary of the inputs used to value each Portfolio’s investments by security type as of April 30, 2015:
| New Century Capital Portfolio | ||||||||||||||||
| Level 1 | Level 2 | Level 3 | Total | |||||||||||||
Investment Companies | $ | 114,136,394 | $ | — | $ | — | $ | 114,136,394 | ||||||||
Money Market Funds | 1,149,655 | — | — | 1,149,655 | ||||||||||||
Total | $ | 115,286,049 | $ | — | $ | — | $ | 115,286,049 | ||||||||
| New Century Balanced Portfolio | ||||||||||||||||
| Level 1 | Level 2 | Level 3 | Total | |||||||||||||
Investment Companies | $ | 71,165,388 | $ | — | $ | — | $ | 71,165,388 | ||||||||
Structured Notes | — | 887,555 | — | 887,555 | ||||||||||||
Money Market Funds | 870,906 | — | — | 870,906 | ||||||||||||
Total | $ | 72,036,294 | $ | 887,555 | $ | — | $ | 72,923,849 | ||||||||
30
NEW CENTURY PORTFOLIOS NOTES TO FINANCIAL STATEMENTS (Continued) April 30, 2015 (Unaudited) |
| New Century International Portfolio | ||||||||||||||||
| Level 1 | Level 2 | Level 3 | Total | |||||||||||||
Investment Companies | $ | 56,066,823 | $ | — | $ | — | $ | 56,066,823 | ||||||||
Money Market Funds | 1,425,154 | — | — | 1,425,154 | ||||||||||||
Total | $ | 57,491,977 | $ | — | $ | — | $ | 57,491,977 | ||||||||
| New Century Alternative Strategies Portfolio | ||||||||||||||||
| Level 1 | Level 2 | Level 3 | Total | |||||||||||||
Investment Companies | $ | 100,956,052 | $ | — | $ | — | $ | 100,956,052 | ||||||||
Structured Notes | — | 3,017,386 | — | 3,017,386 | ||||||||||||
Money Market Funds | 1,438,915 | — | — | 1,438,915 | ||||||||||||
Total | $ | 102,394,967 | $ | 3,017,386 | $ | — | $ | 105,412,353 | ||||||||
Refer to each Portfolio’s Schedule of Investments for a listing of the securities using Level 1 and Level 2 inputs. As of April 30, 2015, the Portfolios did not have any transfers into and out of any Level. In addition, the Portfolios did not have derivative instruments or any assets or liabilities that were measured at fair value on a recurring basis using significant unobservable inputs (Level 3) as of April 30, 2015. It is the Portfolios’ policy to recognize transfers into and out of any Level at the end of the reporting period.
| B. | Share Valuation |
The net asset value per share of each Portfolio is calculated daily by dividing the total value of its assets, less liabilities, by the number of shares outstanding. The offering price and redemption price per share of each Portfolio is equal to the net asset value per share, except that shares of each Portfolio are subject to a redemption fee of 2% if redeemed within 30 days of the date of purchase. This redemption fee applies to all shareholders and accounts; however, each Portfolio reserves the right to waive such redemption fees on employer sponsored retirement accounts. No redemption fee is imposed on the exchange of shares among the various Portfolios of the Trust, the redemption of shares representing reinvested dividends or capital gain distributions, or on amounts representing capital appreciation of shares. During the periods ended April 30, 2015 and October 31, 2014, proceeds from redemption fees totaled $0 and $136, respectively, for New Century Capital Portfolio; $31 and $0, respectively, for New Century Balanced Portfolio; $0 and $2, respectively, for New Century International Portfolio; and $850 and $335, respectively, for New Century Alternative Strategies Portfolio. Any redemption fees collected are credited to paid-in capital of the applicable Portfolio.
| C. | Investment Transactions |
Investment transactions are recorded on a trade date basis for financial reporting purposes. Gains and losses on securities sold are determined on a specific identification method.
31
NEW CENTURY PORTFOLIOS
NOTES TO FINANCIAL STATEMENTS (Continued)
April 30, 2015 (Unaudited)
NOTES TO FINANCIAL STATEMENTS (Continued)
April 30, 2015 (Unaudited)
| D. | Income Recognition |
Interest, if any, is accrued on portfolio investments daily. Dividend income and capital gain distributions are recorded on the ex-dividend date or as soon as the information is available if after the ex-dividend date.
| E. | Distributions to Shareholders |
Dividends arising from net investment income, if any, are declared and paid semi-annually to shareholders of New Century Balanced and New Century Alternative Strategies Portfolios. Dividends from net investment income, if any, are declared and paid annually to shareholders of New Century Capital and New Century International Portfolios. Net realized short-term capital gains, if any, may be distributed throughout the year and net realized long-term capital gains, if any, are distributed annually. Income distributions and capital gain distributions are determined in accordance with income tax regulations, which may differ from GAAP.
The tax character of distributions paid during the periods ended April 30, 2015 and October 31, 2014 was as follows:
| Period Ended | Ordinary Income | Long-Term Capital Gains | Total Distributions | |||||||||
| New Century Capital Portfolio | ||||||||||||
April 30, 2015 | $ | — | $ | 14,111,794 | $ | 14,111,794 | ||||||
October 31, 2014 | $ | 100,544 | $ | 10,149,601 | $ | 10,250,145 | ||||||
| New Century Balanced Portfolio | ||||||||||||
April 30, 2015 | $ | 912,546 | $ | 4,776,168 | $ | 5,688,714 | ||||||
October 31, 2014 | $ | 790,570 | $ | 3,999,254 | $ | 4,789,824 | ||||||
| New Century International Portfolio | ||||||||||||
April 30, 2015 | $ | 699,568 | $ | 5,984,625 | $ | 6,684,193 | ||||||
October 31, 2014 | $ | 361,371 | $ | 4,279,496 | $ | 4,640,867 | ||||||
| New Century Alternative Strategies Portfolio | ||||||||||||
April 30, 2015 | $ | 1,227,530 | $ | — | $ | 1,227,530 | ||||||
October 31, 2014 | $ | 748,917 | $ | — | $ | 748,917 | ||||||
| F. | Cost of Operations |
The Portfolios bear all costs of their operations other than expenses specifically assumed by the Adviser. Expenses directly attributable to a Portfolio are charged to that Portfolio; other expenses are allocated proportionately among the Portfolios in relation to the net assets of each Portfolio.
32
NEW CENTURY PORTFOLIOS
NOTES TO FINANCIAL STATEMENTS (Continued)
April 30, 2015 (Unaudited)
NOTES TO FINANCIAL STATEMENTS (Continued)
April 30, 2015 (Unaudited)
| G. | Use of Estimates |
In preparing financial statements in accordance with GAAP, management is required to make estimates and assumptions that affect the reported amount of assets and liabilities, the disclosure of contingent assets and liabilities, and revenues and expenses during the reporting period. Actual results could differ from those estimates.
| (2) | INVESTMENT ADVISORY FEES, ADMINISTRATIVE AGREEMENT AND TRUSTEES’ FEES |
Each Portfolio has entered into an Investment Advisory Agreement with the Adviser. Investment advisory fees for each Portfolio are computed daily and paid monthly. The investment advisory fees for New Century Capital and New Century International Portfolios are computed at an annualized rate of 1.00% (100 basis points) on the first $100 million of average daily net assets and 0.75% (75 basis points) of average daily net assets exceeding that amount. The investment advisory fees for New Century Balanced Portfolio are computed at an annualized rate of 1.00% (100 basis points) on the first $50 million of average daily net assets and 0.75% (75 basis points) of average daily net assets exceeding that amount. The investment advisory fees for New Century Alternative Strategies Portfolio are computed at an annualized rate of 0.75% (75 basis points) of average daily net assets. The advisory fees are calculated based on the net assets of each Portfolio separately, and not on the total net assets of the Portfolios combined.
The Adviser has contractually agreed to limit the total expenses (excluding interest, taxes, brokerage, acquired fund fees and expenses and extraordinary expenses) to an annual rate of 1.50% of average net assets for each of the Portfolios. The limitation on total expenses does not include a Portfolio’s proportionate share of expenses of the underlying investment companies (i.e. acquired fund fees and expenses) in which such Portfolio invests. This contractual agreement is in place until March 1, 2016. During the six months ended April 30, 2015, no reduction of advisory fees was necessary with respect to any Portfolio.
Any advisory fee reductions and/or any other operating expenses absorbed by the Adviser pursuant to the expense limitation agreement shall be reimbursed by a Portfolio to the Adviser, if so requested by the Adviser, provided the aggregate amount of the Portfolio’s current total operating expenses for such year does not exceed the applicable existing limitation on Portfolio expenses, and the reimbursement is made within three years after the year in which the Adviser incurred the expense. As of April 30, 2015, there are no such amounts due to the Adviser.
Fees paid by the Portfolios pursuant to an Administration Agreement with the Adviser to administer the ordinary course of the Portfolios’ business are paid monthly based on actual expenses incurred in the overseeing of the Portfolios’ affairs.
33
NEW CENTURY PORTFOLIOS
NOTES TO FINANCIAL STATEMENTS (Continued)
April 30, 2015 (Unaudited)
NOTES TO FINANCIAL STATEMENTS (Continued)
April 30, 2015 (Unaudited)
The Portfolios pay each Trustee who is not affiliated with the Adviser a $12,000 annual retainer, paid quarterly, and a per meeting fee of $6,000 for regularly scheduled meetings, and a per meeting fee of $2,000 for Audit Committee Meetings. The Portfolios will also pay each Trustee who is not affiliated with the Adviser a $6,000 special meeting fee if such meeting is held independently of a regularly scheduled meeting. Any Trustee who is affiliated with the Adviser and any officer of New Century does not receive compensation from the Portfolios at this time.
Certain officers and Trustees of New Century are also officers and/or directors of the Adviser.
| (3) | DISTRIBUTION PLAN AND OTHER TRANSACTIONS WITH RELATED PARTIES |
The Portfolios have adopted a Distribution Plan (the “Plan”) under Section 12(b) of the Investment Company Act of 1940, as amended, and Rule 12b-1 thereunder. Under the Plan, each Portfolio may pay up to 0.25% (25 basis points) of its average daily net assets to the Distributor for activities primarily intended to result in the sale of shares. Under its terms, the Plan shall remain in effect from year to year, provided such continuance is approved annually by a vote of a majority of the Trustees and a majority of those Trustees who are not “interested persons” of the Portfolios and who have no direct or indirect financial interest in the operation of the Plan or in any agreement related to the Plan.
During the six months ended April 30, 2015, the Distributor received $137,972, $75,089, $59,946 and $111,787 from New Century Capital, New Century Balanced, New Century International and New Century Alternative Strategies Portfolios, respectively, pursuant to the Plan. As described below, these net amounts were offset by the sales commissions and other compensation received by the Distributor.
During the six months ended April 30, 2015, the Distributor also received sales commissions and other compensation of $5,680, $14,929, $8,748 and $31,929 in connection with the purchase of investment company shares by New Century Capital, New Century Balanced, New Century International and New Century Alternative Strategies Portfolios, respectively. The Distributor has agreed to reduce payments made by each Portfolio pursuant to the Plan in amounts equal to the sales commissions and other compensation it has received as a result of a Portfolio’s investment in other investment companies.
Certain officers and Trustees of New Century are also officers and/or directors of the Adviser and the Distributor.
34
NEW CENTURY PORTFOLIOS
NOTES TO FINANCIAL STATEMENTS (Continued)
April 30, 2015 (Unaudited)
NOTES TO FINANCIAL STATEMENTS (Continued)
April 30, 2015 (Unaudited)
| (4) | INVESTMENT TRANSACTIONS |
During the six months ended April 30, 2015, the cost of purchases and the proceeds from sales of securities other than short-term investments and U.S. government securities were as follows:
New Century Capital Portfolio | New Century Balanced Portfolio | New Century International Portfolio | New Century Alternative Strategies Portfolio | |||||||||||||
| Purchase of investment securities | $ | 25,746,983 | $ | 8,983,997 | $ | 19,651,214 | $ | 19,836,093 | ||||||||
| Proceeds from sales of investment securities | $ | 25,498,280 | $ | 9,311,028 | $ | 21,393,259 | $ | 34,365,679 | ||||||||
| (5) | TAX MATTERS |
Each Portfolio has qualified and intends to continue to qualify as a regulated investment company under the Internal Revenue Code of 1986, as amended (the “Code”). Qualification generally will relieve the Portfolios of liability for federal income taxes to the extent 100% of their net investment income and net realized gains are distributed in accordance with the Code.
In order to avoid imposition of the excise tax applicable to regulated investment companies, it is also each Portfolio’s intention to declare as dividends in each calendar year at least 98% of its net investment income (earned during the calendar year) and 98.2% of its net realized capital gains (earned during the twelve months ended October 31) plus undistributed amounts from prior years.
The tax character of accumulated earnings at April 30, 2015 was as follows:
New Century Capital Portfolio | New Century Balanced Portfolio | New Century International Portfolio | New Century Alternative Strategies Portfolio | |||||||||||||
| Accumulated (distributions in excess of) ordinary income | $ | 401,356 | $ | 23,603 | $ | 378,568 | $ | (208,872 | ) | |||||||
| Net unrealized appreciation | 30,768,690 | 14,712,084 | 9,452,886 | 11,488,237 | ||||||||||||
| Capital loss carryforwards | (361,481 | ) | — | — | (3,471,844 | ) | ||||||||||
Other gains | 7,923,011 | 3,081,677 | 4,468,378 | 3,401,760 | ||||||||||||
| Total accumulated earnings | $ | 38,731,576 | $ | 17,817,364 | $ | 14,299,832 | $ | 11,209,281 | ||||||||
35
NEW CENTURY PORTFOLIOS
NOTES TO FINANCIAL STATEMENTS (Continued)
April 30, 2015 (Unaudited)
NOTES TO FINANCIAL STATEMENTS (Continued)
April 30, 2015 (Unaudited)
The following information is based upon the federal income tax cost of investment securities as of April 30, 2015:
New Century Capital Portfolio | New Century Balanced Portfolio | New Century International Portfolio | New Century Alternative Strategies Portfolio | |||||||||||||
| Federal income tax cost | $ | 84,517,359 | $ | 58,211,765 | $ | 48,039,091 | $ | 93,924,116 | ||||||||
| Gross unrealized appreciation | $ | 31,021,183 | $ | 14,833,258 | $ | 9,778,378 | $ | 12,992,236 | ||||||||
| Gross unrealized depreciation | (252,493 | ) | (121,174 | ) | (325,492 | ) | (1,503,999 | ) | ||||||||
| Net unrealized appreciation | $ | 30,768,690 | $ | 14,712,084 | $ | 9,452,886 | $ | 11,488,237 | ||||||||
The difference between the federal income tax cost of portfolio investments and the financial statement cost for each Portfolio is due to certain timing differences in the recognition of capital losses under income tax regulations and GAAP. These “book/tax” differences are temporary in nature and are primarily due to the tax deferral of losses on wash sales.
As of October 31, 2014, New Century Capital and New Century Alternative Strategies Portfolios had the following capital loss carryforwards for federal income tax purposes, which may be utilized in the current and future years to offset net realized capital gains, if any, prior to distributing such gains to shareholders.
New Century Capital Portfolio | New Century Alternative Strategies Portfolio | |||||||
| Expires October 31, 2015 - short-term | $ | 361,481 | $ | — | ||||
| Expires October 31, 2017 - short-term | — | 1,640,822 | ||||||
| Expires October 31, 2018 - short-term | — | 1,831,022 | ||||||
| $ | 361,481 | $ | 3,471,844 | |||||
Pre-merger short-term capital loss carryforwards, which were acquired by New Century Capital Portfolio from New Century Opportunistic Portfolio on February 28, 2013.
The Portfolios recognize the tax benefits or expenses of uncertain tax positions only when the positions are “more likely than not” to be sustained assuming examination by tax authorities. Management has reviewed the Portfolios’ tax positions taken on federal income tax returns for the current and all open tax years (tax years ended October 31, 2011 through October 31, 2014) and has concluded that no provision for unrecognized tax benefits or expenses is required in these financial statements. Each Portfolio identifies its major tax jurisdiction as U.S. Federal.
36
NEW CENTURY PORTFOLIOS
NOTES TO FINANCIAL STATEMENTS (Continued)
April 30, 2015 (Unaudited)
NOTES TO FINANCIAL STATEMENTS (Continued)
April 30, 2015 (Unaudited)
| (6) | INVESTMENT IN OTHER INVESTMENT COMPANIES |
The Portfolios are funds of funds which invest primarily in the shares of registered open-end and closed-end investment companies, including exchange-traded investment companies, which are commonly referred to as “ETFs.” Thus, each Portfolio is affected by the performance of those companies. Investing in investment companies does not eliminate investment risk.
Closed-end investment companies and ETFs trade on securities exchanges, and the market price for which such securities trade may not correspond exactly with the net asset value of the investment company. In addition, shares of a closed-end investment company may trade infrequently, with small volume and at a discount to the net asset value, which may affect a Portfolio’s ability to sell shares of the investment company at a reasonable price. Further, ETFs which hold securities included in a particular index will not be able to perfectly replicate the performance of the indices they track because the total return generated by the securities will be reduced by operating costs and by transaction costs incurred in adjusting the actual balance of the securities.
| (7) | CONTINGENCIES AND COMMITMENTS |
New Century indemnifies its officers and Trustees for certain liabilities that might arise from the performance of their duties to the Portfolios. Additionally, in the normal course of business, New Century, on behalf of its Portfolios, enters into contracts that contain a variety of representations and warranties and which provide general indemnifications. The Portfolios’ maximum exposure under these arrangements is unknown, as this would involve future claims that may be made against the Portfolios that have not yet occurred. However, based on experience, New Century expects the risk of loss to be remote.
| (8) | SUBSEQUENT EVENTS |
The Portfolios are required to recognize in the financial statements the effects of all subsequent events that provide additional evidence about conditions that existed as of the date of the Statements of Assets and Liabilities. For non-recognized subsequent events that must be disclosed to keep the financial statements from being misleading, the Portfolios are required to disclose the nature of the event as well as an estimate of its financial effect, or a statement that such an estimate cannot be made. Management has evaluated subsequent events through the issuance of these financial statements and has noted no such events.
37
NEW CENTURY PORTFOLIOS
ABOUT YOUR PORTFOLIOS’ EXPENSES (Unaudited)
ABOUT YOUR PORTFOLIOS’ EXPENSES (Unaudited)
We believe it is important for you to understand the impact of costs on your investment. As a shareholder of the Portfolios, you may incur two types of costs: (1) transaction costs, including redemption fees; and (2) ongoing costs, including management fees, distribution (12b-1) fees and other expenses. The following examples are intended to help you understand ongoing costs (in dollars) of investing in the Portfolios and to compare these costs with the ongoing costs of investing in other mutual funds.
A mutual fund’s ongoing costs are expressed as a percentage of its average net assets. This figure is known as the expense ratio. The examples in the tables below are based on an investment of $1,000 made at the beginning of the period shown (November 1, 2014) and held until the end of the period (April 30, 2015).
The table below illustrates each Portfolio’s ongoing costs in two ways:
Actual fund return – This section helps you to estimate the actual expenses that you paid over the period. The “Ending Account Value” shown is derived from each Portfolio’s actual return, and the third column shows the dollar amount of operating expenses that would have been paid by an investor who started with an initial investment of $1,000 in each of the Portfolios. You may use the information here, together with the amount you invested, to estimate the expenses that you paid over the period.
To do so, simply divide your account value by $1,000 (for example, an $8,600 account value divided by $1,000 = 8.6), then multiply the result by the number given for the Portfolios under the heading “Expenses Paid During Period.”
Hypothetical 5% return – This section is intended to help you compare the Portfolios’ ongoing costs with those of other mutual funds. It assumes that each Portfolio had an annual return of 5% before expenses during the period shown, but that the expense ratio is unchanged. In this case, because the return used is not the Portfolios’ actual returns, the results do not apply to your investment. The example is useful in making comparisons because the Securities and Exchange Commission (“SEC”) requires all mutual funds to calculate expenses based on a 5% return. You can assess each Portfolio’s ongoing costs by comparing this hypothetical example with the hypothetical examples that appear in shareholder reports of other mutual funds.
Note that expenses shown in the table are meant to highlight and help you compare ongoing costs only. The Portfolios do not charge sales loads. However, a redemption fee of 2% is applied on the sale of shares of the Portfolios held for less than 30 days.
The calculations assume no shares were bought or sold during the period. Your actual costs may have been higher or lower, depending on the amount of your investment and the timing of any purchases or redemptions. In addition, the calculations do not reflect the Portfolios’ proportionate shares of expenses of the underlying investment companies in which the Portfolios invest.
38
NEW CENTURY PORTFOLIOS
ABOUT YOUR PORTFOLIOS’ EXPENSES (Unaudited)
(Continued)
ABOUT YOUR PORTFOLIOS’ EXPENSES (Unaudited)
(Continued)
More information about the Portfolios’ expenses, including recent annual expense ratios, can be found in this report. For additional information on operating expenses and other shareholder costs, please refer to the Portfolios’ prospectus.
Beginning Account Value November 1, 2014 | Ending Account Value April 30, 2015 | Expense Ratio(a) | Expenses Paid During Period(b) | |
| New Century Capital Portfolio | ||||
Actual | $1,000.00 | $1,041.70 | 1.44% | $7.29 |
Hypothetical 5% Return (before expenses) | $1,000.00 | $1,017.65 | 1.44% | $7.20 |
| New Century Balanced Portfolio | ||||
Actual | $1,000.00 | $1,026.20 | 1.39% | $6.98 |
Hypothetical 5% Return (before expenses) | $1,000.00 | $1,017.90 | 1.39% | $6.95 |
| New Century International Portfolio | ||||
Actual | $1,000.00 | $1,081.10 | 1.50% | $7.74 |
Hypothetical 5% Return (before expenses) | $1,000.00 | $1,017.36 | 1.50% | $7.50 |
| New Century Alternative Strategies Portfolio | ||||
Actual | $1,000.00 | $1,011.30 | 1.18% | $5.88 |
Hypothetical 5% Return (before expenses) | $1,000.00 | $1,018.94 | 1.18% | $5.91 |
(a) | Annualized, based on the Fund's most recent one-half year expenses. |
(b) | Expenses are equal to the Funds' annualized expense ratio multiplied by the average account value over the period, muliplied by 181/365 (to reflect the one-half year period). |
39
NEW CENTURY PORTFOLIOS
RESULTS OF SPECIAL MEETING OF SHAREHOLDERS
February 10, 2015 (Unaudited)
RESULTS OF SPECIAL MEETING OF SHAREHOLDERS
February 10, 2015 (Unaudited)
On February 10, 2015, a Special Meeting of Shareholders of New Century Capital Portfolio, New Century Balanced Portfolio, New Century International Portfolio and New Century Alternative Strategies Portfolio (the “New Century Portfolios”) was held at the offices of New Century Portfolios, 100 William Street, Suite 200, Wellesley, Massachusetts 02481-3902. The purpose of the meeting was to: (1) elect four Trustees, each to serve until his successor is duly elected and qualified; (2) ratify the appointment of BBD, LLP as the Trust’s Independent Registered Public Accounting Firm for the fiscal year ending October 31, 2015; and (3) amend the fundamental investment objective of the New Century Alternative Strategies Portfolio.
The shareholders of New Century Portfolios approved all three proposals considered and voted upon at the Special Meeting. The results of the voting with respect to each proposal are as follows:
| 1. | Election of Four Trustees. |
| Proposal No 1: Election of Trustees* | Shares Voted For | Shares Withheld | Percentage of Shares Voted | Percentage of Shares Outstanding |
| Stanley H. Cooper | 15,887,772.638 | 88,090.606 | 99.449% | 69.871% |
| 0.551% | 0.387% | |||
| Michael A. Diorio | 15,967,748.580 | 8,114.665 | 99.950% | 70.223% |
| 0.050% | 0.035% | |||
| J. Kevin Connaughton | 15,967,748.580 | 8,114.665 | 99.950% | 70.223% |
| 0.050% | 0.035% | |||
| John W. Filoon, III | 15,967,748.580 | 8,114.665 | 99.950% | 70.223% |
| 0.050% | 0.035% |
| 2. | Ratification of the Appointment of BBD, LLP as the Trust’s Independent Registered Public Accounting Firm for the fiscal year ending October 31, 2015. |
Proposal No. 2 Ratification of the Appointment of Auditors* | Shares Voted | Percentage of Shares Voted | Percentage of Shares Outstanding |
| For | 15,960,969.305 | 99.907% | 70.193% |
| Against | 10,977.958 | 0.069% | 0.048% |
| Abstain | 3,915.981 | 0.024% | 0.017% |
| Total | 15,975,863.24 | 100.000% | 70.258% |
| * | Voted by shareholders of the New Century Portfolios. |
40
NEW CENTURY PORTFOLIOS
RESULTS OF SPECIAL MEETING OF SHAREHOLDERS
February 10, 2015 (Unaudited)(Continued)
RESULTS OF SPECIAL MEETING OF SHAREHOLDERS
February 10, 2015 (Unaudited)(Continued)
| 3. | Amendment of Fundamental Investment Objective of the New Century Alternative Strategies Portfolio. |
Proposal No. 3 - Amend Fundamental Investment Objective* | Shares Voted | Percentage of Shares Voted | Percentage of Shares Outstanding |
| For | 4,935,664.727 | 99.920% | 53.659% |
| Against | 2,164.916 | 0.044% | 0.023% |
| Abstain | 1,364.583 | 0.027% | 0.015% |
| Broker Non-Vote | 468.000 | 0.009% | 0.005% |
| Total | 4,939,662.23 | 100.000% | 53.702% |
| * | Voted by shareholders of the New Century Alternative Strategies Portfolio. |
41
This page intentionally left blank.
INVESTMENT ADVISER AND ADMINISTRATOR Weston Financial Group, Inc. Wellesley, MA DISTRIBUTOR Weston Securities Corporation Wellesley, MA COUNSEL Greenberg Traurig, LLP Philadelphia, PA INDEPENDENT REGISTERED PUBLIC ACCOUNTING FIRM BBD, LLP Philadelphia, PA TRANSFER AGENT Ultimus Fund Solutions, LLC Cincinnati, OH CUSTODIAN US Bank, N.A. Cincinnati, OH This report and the financial statements contained herein are submitted for the general information of the shareholders of the Portfolios. This report is authorized for distribution to prospective investors in the Portfolios only if preceded or accompanied by an effective Prospectus which contains details concerning the management fees, expenses and other pertinent information. A description of the policies and procedures that the Portfolios use to determine how to vote proxies relating to portfolio securities is available without charge upon request by calling toll-free 1-888-639-0102, or on the SEC’s website at http://www.sec.gov. Information regarding how the Portfolios voted proxies relating to portfolio securities during the most recent 12-month period ended June 30 is available without charge upon request by calling toll-free 1-888-639-0102, or on the SEC’s website at http://www.sec.gov. The Portfolios file a complete listing of portfolio holdings with the SEC as of the end of the first and third quarters of each fiscal year on Form N-Q. The Portfolios’ Forms N-Q are available without charge upon request by calling 1-888-639-0102, or on the SEC’s website at http://www.sec.gov. The Portfolios’ Forms N-Q may be reviewed and copied at the SEC’s Public Reference Room in Washington, DC, or by calling 1-800-SEC-0330. |
| Item 2. | Code of Ethics. |
Not required
| Item 3. | Audit Committee Financial Expert. |
Not required
| Item 4. | Principal Accountant Fees and Services. |
Not required
| Item 5. | Audit Committee of Listed Registrants. |
Not applicable
| Item 6. | Schedule of Investments. |
| (a) | Not applicable [schedule filed with Item 1] |
| (b) | Not applicable |
| Item 7. | Disclosure of Proxy Voting Policies and Procedures for Closed-End Management Investment Companies. |
Not applicable
| Item 8. | Portfolio Managers of Closed-End Management Investment Companies. |
Not applicable
| Item 9. | Purchases of Equity Securities by Closed-End Management Investment Company and Affiliated Purchasers. |
Not applicable
| Item 10. | Submission of Matters to a Vote of Security Holders. |
The registrant has a standing nominating committee responsible for the selection and nomination to serve as trustees of the registrant. Although the nominating committee expects to be able to find an adequate number of qualified candidates to serve as trustees, the nominating committee is willing to consider nominations received from shareholders. Shareholders wishing to submit a nomination should do so by notifying the Secretary of the registrant, in writing, at the following address: 100 William Street, Suite 200, Wellesley, Massachusetts 02481-3902.
| Item 11. | Controls and Procedures. |
(a) Based on their evaluation of the registrant’s disclosure controls and procedures (as defined in Rule 30a-3(c) under the Investment Company Act of 1940) as of a date within 90 days of the filing date of this report, the registrant’s principal executive officer and principal financial officer have concluded that such disclosure controls and procedures are reasonably designed and are operating effectively to ensure that material information relating to the registrant, including its consolidated subsidiaries, is made known to them by others within those entities, particularly during the period in which this report is being prepared, and that the information required in filings on Form N-CSR is recorded, processed, summarized, and reported on a timely basis.
(b) There were no changes in the registrant’s internal control over financial reporting (as defined in Rule 30a-3(d) under the Investment Company Act of 1940) that occurred during the second fiscal quarter of the period covered by this report that have materially affected, or are reasonably likely to materially affect, the registrant’s internal control over financial reporting.
| Item 12. | Exhibits. |
File the exhibits listed below as part of this Form. Letter or number the exhibits in the sequence indicated.
(a)(1) Any code of ethics, or amendment thereto, that is the subject of the disclosure required by Item 2, to the extent that the registrant intends to satisfy the Item 2 requirements through filing of an exhibit: Not required
(a)(2) A separate certification for each principal executive officer and principal financial officer of the registrant as required by Rule 30a-2(a) under the Act (17 CFR 270.30a-2(a)): Attached hereto
(a)(3) Any written solicitation to purchase securities under Rule 23c-1 under the Act (17 CFR 270.23c-1) sent or given during the period covered by the report by or on behalf of the registrant to 10 or more persons: Not applicable
(b) Certifications required by Rule 30a-2(b) under the Act (17 CFR 270.30a-2(b)): Attached hereto
| Exhibit 99.CERT | Certifications required by Rule 30a-2(a) under the Act |
| Exhibit 99.906CERT | Certifications required by Rule 30a-2(b) under the Act |
SIGNATURES
Pursuant to the requirements of the Securities Exchange Act of 1934 and the Investment Company Act of 1940, the registrant has duly caused this report to be signed on its behalf by the undersigned, thereunto duly authorized.
| (Registrant) | New Century Portfolios | ||
| By (Signature and Title)* | /s/ Nicole M. Tremblay | ||
| Nicole M. Tremblay, President | |||
| Date | July 7, 2015 | ||
| Pursuant to the requirements of the Securities Exchange Act of 1934 and the Investment Company Act of 1940, this report has been signed below by the following persons on behalf of the registrant and in the capacities and on the dates indicated. | |||
| By (Signature and Title)* | /s/ Nicole M. Tremblay | ||
| Nicole M. Tremblay, President | |||
| Date | July 7, 2015 | ||
| By (Signature and Title)* | /s/ Stephen G. DaCosta | ||
| Stephen G. DaCosta, Treasurer | |||
| Date | July 7, 2015 | ||
* Print the name and title of each signing officer under his or her signature.