The accompanying notes are an integral part of these Consolidated Financial Statements.
The unaudited US dollar amounts are prepared on the basis set out in note 1.
The accompanying notes are an integral part of these Consolidated Financial Statements.
The unaudited US dollar amounts are prepared on the basis set out in note 1.
Back to Contents
Back to Consolidated Financial Statements Contents
|
| Notes to the Consolidated Financial Statements |
|
|
1. Basis of Consolidated Financial Statements
Statutory financial information
The Consolidated Financial Statements are prepared in accordance with applicable accounting standards and in conformity with UK GAAP, which differ in certain material respects from US GAAP – see note 36.
The preparation of financial statements in conformity with generally accepted accounting principles requires management to make estimates and assumptions that affect the reported amounts of assets and liabilities and disclosure of contingent assets and liabilities at the date of the financial statements and the reported amounts of revenue and expenses during the reporting period. Actual results could differ from those estimates.
Amounts in the Consolidated Financial Statements are stated in pounds sterling (£), the currency of the country in which the Company is incorporated. The translation into US dollars of the Consolidated Financial Statements as of, and for the financial year ended, 31 March 2005, is for convenience only and has been made at the Noon Buying Rate for cable transfers as announced by the Federal Reserve Bank of New York for customs purposes on 31 March 2005. This rate was $1.8888: £1. This translation should not be construed as a representation that the sterling amounts actually represented have been, or could be, converted into dollars at this or any other rate.
The Group’s material accounting policies are described below. For a discussion on the Group’s critical accounting estimates see “Operating and Financial Review and Prospects – Critical Accounting Estimates” elsewhere in this Annual Report.
Accounting convention
The Consolidated Financial Statements are prepared under the historical cost convention and in accordance with applicable accounting standards of the United Kingdom Accounting Standards Board and pronouncements of its Urgent Issues Task Force.
Basis of consolidation
The Consolidated Financial Statements include the accounts of the Company, its subsidiary undertakings and its share of the results of associated undertakings for financial statements made up to 31 March 2005. A listing of the Company’s principal subsidiary undertakings and associated undertakings is given in note 34.
Foreign currencies
Transactions in foreign currencies are recorded at the exchange rates ruling on the dates of those transactions, adjusted for the effects of any hedging arrangements. Foreign currency monetary assets and liabilities are translated into sterling at year end rates.
The results of international subsidiary undertakings, joint ventures and associated undertakings are translated into sterling at average rates of exchange. The adjustment to year end rates is taken to reserves. Exchange differences, which arise on the retranslation of international subsidiary undertakings’, joint ventures’ and associated undertakings’ balance sheets at the beginning of the year, and equity additions and withdrawals during the financial year, are dealt with as a movement in reserves.
Other translation differences are dealt with in the profit and loss account.
Turnover
Group turnover comprises turnover of the Company and its subsidiary undertakings and excludes sales taxes, discounts and sales between Group companies. Total Group turnover comprises Group turnover plus the Group’s share of the turnover of its associated undertakings and joint ventures.
Turnover from mobile telecommunications comprises amounts charged to customers in respect of monthly access charges, airtime usage, messaging, the provision of other mobile telecommunications services, including data services and information provision, fees for connecting customers to a mobile network, revenue from the sale of equipment, including handsets and revenue arising from agreements entered into with Partner Networks.
Access charges and airtime used by contract customers are invoiced and recorded as part of a periodic billing cycle and recognised as turnover over the related access period, with unbilled turnover resulting from services already provided from the billing cycle date to the end of each period accrued and unearned turnover from services provided in periods after each accounting period deferred. Revenue from the sale of prepaid credit is deferred until such time as the customer uses the airtime, or the credit expires.
Other turnover from mobile telecommunications primarily comprises equipment sales, which are recognised upon delivery to customers, and customer connection revenue. Customer connection revenue is recognised together with the related equipment revenue to the extent that the aggregate equipment and connection revenue does not exceed the fair value of the equipment delivered to the customer. Any customer connection revenue not recognised together with related equipment revenue is deferred and recognised over the period in which services are expected to be provided to the customer.
Revenue from data services and information provision is recognised when the Group has performed the related service and, depending on the nature of the service, is recognised either at the gross amount billed to the customer or the amount receivable by the Group as commission for facilitating the service.
Turnover from other businesses primarily comprises amounts charged to customers of the Group’s fixed line businesses, mainly in respect of access charges and line usage, invoiced and recorded as part of a periodic billing cycle.
Back to Contents
Back to Consolidated Financial Statements Contents
Derivative financial instruments
Transactions in derivative financial instruments are undertaken for risk management purposes only.
The Group uses derivative financial instruments to hedge its exposure to interest rate and foreign currency risk. To the extent that such instruments are matched against an underlying asset or liability, they are accounted for using hedge accounting.
Gains or losses on interest rate instruments are matched against the corresponding interest charge or interest receivable in the profit and loss account over the life of the instrument. For foreign exchange instruments, gains or losses and premiums or discounts are matched to the underlying transactions being hedged.
Termination payments made or received in respect of derivative financial instruments held for hedging purposes are spread over the life of the underlying exposure where the underlying exposure continues to exist. Where the underlying exposure ceases to exist, termination payments are taken to the profit and loss account.
Pensions
Costs relating to defined benefit plans, which are subject to periodic valuations calculated by professionally qualified actuaries, are charged against profits, within staff costs so that the expected costs of providing pensions are recognised during the period in which benefit is derived from the employees’ services.
The costs of the various pension schemes may vary from the funding, dependent upon actuarial advice, with any difference between pension cost and funding being treated as a provision or prepayment.
Defined contribution pension costs charged to the profit and loss account represent contributions payable in respect of the period.
Research and development and advertising costs
Expenditure on research and development and advertising is written off in the year in which it is incurred.
Goodwill
Goodwill is calculated as the surplus of fair value of consideration over fair value attributed to the identifiable net assets and liabilities (excluding goodwill) of subsidiary, joint venture and associated undertakings acquired.
For acquisitions made after the financial year ended 31 March 1998, goodwill is capitalised and held as a foreign currency denominated asset, where applicable. Goodwill is amortised on a straight line basis over its estimated useful economic life. For acquired network businesses, whose operations are governed by fixed term licences, the amortisation period is determined primarily by reference to the unexpired licence period and the conditions for licence renewal. The amortisation periods range between 3 and 20 years, with the exception of the goodwill arising on the formation of Verizon Wireless and the acquisition of interests in Vodafone Japan. The goodwill arising on the formation of Verizon Wireless is amortised over 25 years as the Group has assessed the renewal of Verizon Wireless’ licences as perfunctory and as such believes a useful economic life for the acquired business of greater than 20 years is appropriate. During the 2005 financial year, as a result of the acquisition of the minority stakes in Vodafone Japan as described in “Business Overview – History and Development of the Company”, the Group reviewed the amortisation period for goodwill arising on the acquisition of interests in Vodafone Japan, including acquisitions prior to 31 March 2004. The Group concluded that although licences in Japan are issued for a five year term with a presumption of renewal where there is a continuing need for spectrum, the licence issued is technology dependent. Accordingly, the amortisation period for this goodwill was increased from 16 years to 21 years. The effect of this change on the amortisation charge for the 2005 financial year is not material. For other acquisitions, including customer bases, the amortisation period for goodwill is typically between 3 and 10 years.
For acquisitions made before 1 April 1998, when FRS 10, “Goodwill and Intangible Assets”, was adopted, goodwill was written off directly to reserves. Goodwill written off directly to reserves is included in the profit and loss account when the related business is sold.
Other intangible fixed assets
Purchased intangible fixed assets, including licence fees, are capitalised at cost.
Network licence costs are amortised over the periods of the licences. Amortisation is charged from commencement of service of the network. The annual charge is calculated in proportion to the capacity of the network during the start up period and on a straight line basis thereafter.
Other intangible fixed assets are amortised over their expected useful economic life on a straight line basis.
Tangible fixed assets
Tangible fixed assets are stated at cost less accumulated depreciation.
Depreciation is not provided on freehold land. The cost of other tangible fixed assets is written off from the time they are brought into use, by equal instalments over their expected useful lives as follows:
| Freehold buildings | 25-50 years | |
| | | |
| Leasehold premises | the term of the lease | |
| | | |
| Equipment, fixtures and fittings | 3-10 years | |
The cost of tangible fixed assets includes directly attributable incremental costs incurred in their acquisition and installation.
Back to Contents
Back to Consolidated Financial Statements Contents
|
| Notes to the Consolidated Financial Statements continued |
|
| | |
| | |
| 2. | Accounting policies continued |
Investments
The Consolidated Financial Statements include investments in associated undertakings using the equity method of accounting. An associated undertaking is an entity in which the Group has a participating interest and, in the opinion of the directors, can exercise significant influence over its operational and financial policies. The Consolidated Profit and Loss Account includes the Group’s share of the operating profit or loss, exceptional items, interest income or expense and attributable taxation of those entities. The Balance Sheet shows the Group’s share of the net assets or liabilities of those entities, together with loans advanced and attributed goodwill.
The Consolidated Financial Statements include investments in joint ventures using the gross equity method of accounting. A joint venture is an entity in which the Group has a long-term interest and exercises joint control. Under the gross equity method, a form of the equity method of accounting, the Group’s share of the aggregate gross assets and liabilities underlying the investment in the joint venture is included in the Balance Sheet and the Group’s share of the turnover of the joint venture is disclosed in the Consolidated Profit and Loss Account.
Other investments, held as fixed assets, comprise equity shareholdings and other interests. They are stated at cost less provision for impairment. Dividend income is recognised upon receipt and interest when receivable.
Stocks
Stocks are valued at the lower of cost and estimated net realisable value.
Trade debtors
Trade debtors are accounted for at cost. Allowances are maintained for bad and doubtful debts for estimated losses resulting from the inability of customers to make required payments. Estimates are based on the ageing of the debt balances and historical experience. Debtors are written off when management deems them not to be collectable.
Taxation
Current tax, including UK corporation tax and foreign tax, is provided at amounts expected to be paid (or recovered) using the tax rates and laws that have been enacted or substantially enacted by the balance sheet date.
Deferred tax is provided in full on timing differences that exist at the balance sheet date and that result in an obligation to pay more tax, or a right to pay less tax in the future. The deferred tax is measured at the rate expected to apply in the periods in which the timing differences are expected to reverse, based on the tax rates and laws that are enacted or substantially enacted at the balance sheet date. Timing differences arise from the inclusion of items of income and expenditure in taxation computations in periods different from those in which they are included in the financial statements. Deferred tax is not provided on timing differences arising from the revaluation of fixed assets where there is no binding commitment to sell the asset. Deferred tax assets are recognised to the extent that it is regarded as more likely than not that they will be recovered. Deferred tax assets and liabilities are not discounted.
Leases
Rental costs under operating leases are charged to the profit and loss account in equal annual amounts over the periods of the leases.
Assets acquired under finance leases, which transfer substantially all the rights and obligations of ownership, are accounted for as though purchased outright. The fair value of the asset at the inception of the lease is included in tangible fixed assets and the capital element of the leasing commitment included in creditors. Finance charges are calculated on an actuarial basis and are allocated over each lease to produce a constant rate of charge on the outstanding balance.
Lease obligations which are satisfied by cash and other assets deposited with third parties are set-off against those assets in the Group’s balance sheet.
Back to Contents
Back to Consolidated Financial Statements Contents
The Group’s business is principally the supply of mobile telecommunications services and products. Other operations primarily comprise fixed line telecommunications businesses.
Segmental information is provided on the basis of geographic regions, being the basis on which the Group manages its worldwide interests.
In October 2004, the Group announced changes in the regional structure of its operations. Germany, Italy and the UK now form their own regions. The Group’s remaining mobile operations, outside Asia Pacific and the Americas, now form the Other EMEA region. The results below are presented in accordance with the new regional structure.
Turnover is by origin, which is not materially different from turnover by destination.
| | Mobile telecommunications | | Other operations | | | |
| |
| |
| | | |
| | | | | | | | Other | | | | Asia | | | | | | Other | | Total | |
| | Germany | | Italy | | UK | | EMEA | | Americas | | Pacific | | Total | | Germany | | EMEA | | Group | |
| | £m | | £m | | £m | | £m | | £m | | £m | | £m | | £m | | £m | | £m | |
|
|
|
|
|
|
|
|
|
|
|
|
|
|
|
|
|
|
|
| |
| Year ended 31 March 2005: | | | | | | | | | | | | | | | | | | | | |
| Segment turnover | 5,684 | | 5,565 | | 5,065 | | 8,614 | | – | | 8,531 | | 33,459 | | 1,108 | | – | | 34,567 | |
| Inter-segment turnover | (51 | ) | (44 | ) | (47 | ) | (129 | ) | – | | (4 | ) | (275 | ) | – | | – | | (275 | ) |
|
|
|
|
|
|
|
|
|
|
|
|
|
|
|
|
|
|
|
| |
| Net turnover | 5,633 | | 5,521 | | 5,018 | | 8,485 | | – | | 8,527 | | 33,184 | | 1,108 | | – | | 34,292 | |
| Turnover between mobile and other operations | (110 | ) | – | | – | | (3 | ) | – | | (1 | ) | (114 | ) | (45 | ) | – | | (159 | ) |
|
|
|
|
|
|
|
|
|
|
|
|
|
|
|
|
|
|
|
| |
| Group turnover | 5,523 | | 5,521 | | 5,018 | | 8,482 | | – | | 8,526 | | 33,070 | | 1,063 | | – | | 34,133 | |
|
|
|
|
|
|
|
|
|
|
|
|
|
|
|
|
|
|
|
| |
| | | | | | | | | | | | | | | | | | | | | |
| Operating (loss)/profit | (5,161 | ) | (1,522 | ) | 745 | | 382 | | (31 | ) | 217 | | (5,370 | ) | 65 | | 1 | | (5,304 | ) |
| Share of operating profit/(loss) in associated undertakings | – | | – | | – | | 337 | | 890 | | 4 | | 1,231 | | – | | (38 | ) | 1,193 | |
|
|
|
|
|
|
|
|
|
|
|
|
|
|
|
|
|
|
|
| |
| Total Group operating (loss)/profit | (5,161 | ) | (1,522 | ) | 745 | | 719 | | 859 | | 221 | | (4,139 | ) | 65 | | (37 | ) | (4,111 | ) |
| Exceptional non-operating items | – | | – | | – | | (10 | ) | 3 | | 20 | | 13 | | – | | – | | 13 | |
|
|
|
|
|
|
|
|
|
|
|
|
|
|
|
|
|
|
|
| |
| (Loss)/profit on ordinary activities before interest | (5,161 | ) | (1,522 | ) | 745 | | 709 | | 862 | | 241 | | (4,126 | ) | 65 | | (37 | ) | (4,098 | ) |
|
|
|
|
|
|
|
|
|
|
|
|
|
|
|
|
|
|
|
| |
|
|
|
|
|
|
|
|
|
|
|
|
|
|
|
|
|
|
|
| |
| Total Group operating (loss)/profit | (5,161 | ) | (1,522 | ) | 745 | | 719 | | 859 | | 221 | | (4,139 | ) | 65 | | (37 | ) | (4,111 | ) |
| Add back: | | | | | | | | | | | | | | | | | | | | |
| – Goodwill amortisation | 6,824 | | 3,779 | | 230 | | 2,349 | | 788 | | 729 | | 14,699 | | 1 | | – | | 14,700 | |
| | | | | | | | | | | | | | | | | | | | | |
| Subsidiaries | 6,824 | | 3,779 | | 230 | | 1,369 | | – | | 726 | | 12,928 | | 1 | | – | | 12,929 | |
| Associates | – | | – | | – | | 980 | | 788 | | 3 | | 1,771 | | – | | – | | 1,771 | |
| | | | | | | | | | | | | | | | | | | | | |
| – Exceptional operating items | – | | – | | – | | 315 | | – | | – | | 315 | | – | | – | | 315 | |
|
|
|
|
|
|
|
|
|
|
|
|
|
|
|
|
|
|
|
| |
| Total Group operating profit/(loss) before goodwill amortisation | | | | | | | | | | | | | | | | | | | | |
| and exceptional items(1) | 1,663 | | 2,257 | | 975 | | 3,383 | | 1,647 | | 950 | | 10,875 | | 66 | | (37 | ) | 10,904 | |
|
|
|
|
|
|
|
|
|
|
|
|
|
|
|
|
|
|
|
| |
| | | | | | | | | | | | | | | | | | | | | |
| Depreciation and amortisation charges, | | | | | | | | | | | | | | | | | | | | |
| excluding goodwill amortisation | 948 | | 700 | | 733 | | 1,086 | | – | | 1,300 | | 4,767 | | 173 | | – | | 4,940 | |
| Intangible and tangible fixed asset additions | 842 | | 721 | | 801 | | 1,548 | | – | | 1,150 | | 5,062 | | 128 | | – | | 5,190 | |
| | | | | | | | | | | | | | | | | | | | | |
| At 31 March 2005: | | | | | | | | | | | | | | | | | | | | |
| Net assets/(liabilities) and attributed goodwill | | | | | | | | | | | | | | | | | | | | |
| (before net borrowings): | | | | | | | | | | | | | | | | | | | | |
| – subsidiary undertakings | 36,674 | | 19,066 | | 4,603 | | 17,058 | | (2,001 | ) | 15,098 | | 90,498 | | 578 | | – | | 91,076 | |
| – share of associated undertakings | – | | – | | – | | 5,029 | | 14,286 | | 17 | | 19,332 | | – | | 66 | | 19,398 | |
|
|
|
|
|
|
|
|
|
|
|
|
|
|
|
|
|
|
|
| |
| | 36,674 | | 19,066 | | 4,603 | | 22,087 | | 12,285 | | 15,115 | | 109,830 | | 578 | | 66 | | 110,474 | |
|
|
|
|
|
|
|
|
|
|
|
|
|
|
|
|
|
| | | |
| Net debt | | | | | | | | | | | | | | | | | | | (8,339 | ) |
|
|
|
|
|
|
|
|
|
|
|
|
|
|
|
|
|
|
|
| |
| | | | | | | | | | | | | | | | | | | | 102,135 | |
|
|
|
|
|
|
|
|
|
|
|
|
|
|
|
|
|
|
|
| |
| Note: |
| (1) | The Group considers its segment result to be Total Group operating profit before goodwill amortisation and exceptional items. |
| | |
Back to Contents
Back to Consolidated Financial Statements Contents
|
| Notes to the Consolidated Financial Statements continued |
|
| | |
| 3. | Segmental Analysis continued |
| | |
| | Mobile telecommunications | | Other operations | | | |
|
|
| | | | | | | | Other | | | | Asia | | | | | | Other | | Asia | | Total | |
| Germany | Italy | UK | EMEA | Americas | Pacific | Total | Germany | EMEA | Pacific | Group |
| £m | £m | £m | £m | £m | £m | £m | £m | £m | £m | £m |
|
|
|
|
|
|
|
|
|
|
|
|
|
|
|
|
|
|
|
|
|
| |
| Year ended 31 March 2004: | | | | | | | | | | | | | | | | | | | | | | |
| Segment turnover | 5,536 | | 5,312 | | 4,782 | | 7,627 | | – | | 8,896 | | 32,153 | | 1,002 | | – | | 1,126 | | 34,281 | |
| Inter-segment turnover | (42 | ) | (36 | ) | (38 | ) | (116 | ) | – | | (6 | ) | (238 | ) | – | | – | | – | | (238 | ) |
|
|
|
|
|
|
|
|
|
|
|
|
|
|
|
|
|
|
|
|
|
| |
| Net turnover | 5,494 | | 5,276 | | 4,744 | | 7,511 | | – | | 8,890 | | 31,915 | | 1,002 | | – | | 1,126 | | 34,043 | |
Turnover between mobile and other
operations | (90 | ) | – | | – | | (5 | ) | – | | (105 | ) | (200 | ) | (55 | ) | – | | (229 | ) | (484 | ) |
|
|
|
|
|
|
|
|
|
|
|
|
|
|
|
|
|
|
|
|
|
| |
| Group turnover | 5,404 | | 5,276 | | 4,744 | | 7,506 | | – | | 8,785 | | 31,715 | | 947 | | – | | 897 | | 33,559 | |
|
|
|
|
|
|
|
|
|
|
|
|
|
|
|
|
|
|
|
|
|
| |
| | | | | | | | | | | | | | | | | | | | | | | |
| Operating (loss)/profit | (5,254 | ) | (1,343 | ) | 825 | | 473 | | (21 | ) | 515 | | (4,805 | ) | (49 | ) | – | | 78 | | (4,776 | ) |
Share of operating profit/(loss) in joint
ventures andassociated undertakings | – | | – | | – | | 257 | | 297 | | 1 | | 555 | | (9 | ) | (1 | ) | 1 | | 546 | |
|
|
|
|
|
|
|
|
|
|
|
|
|
|
|
|
|
|
|
|
|
| |
| Total Group operating (loss)/profit | (5,254 | ) | (1,343 | ) | 825 | | 730 | | 276 | | 516 | | (4,250 | ) | (58 | ) | (1 | ) | 79 | | (4,230 | ) |
| Exceptional non-operating items | (59 | ) | – | | – | | (3 | ) | 13 | | 2 | | (47 | ) | 2 | | 1 | | (59 | ) | (103 | ) |
|
|
|
|
|
|
|
|
|
|
|
|
|
|
|
|
|
|
|
|
|
| |
(Loss)/profit on ordinary activities
before interest | (5,313 | ) | (1,343 | ) | 825 | | 727 | | 289 | | 518 | | (4,297 | ) | (56 | ) | – | | 20 | | (4,333 | ) |
|
|
|
|
|
|
|
|
|
|
|
|
|
|
|
|
|
|
|
|
|
| |
| Total Group operating (loss)/profit | (5,254 | ) | (1,343 | ) | 825 | | 730 | | 276 | | 516 | | (4,250 | ) | (58 | ) | (1 | ) | 79 | | (4,230 | ) |
| Add back: | | | | | | | | | | | | | | | | | | | | | | |
| – Goodwill amortisation | 6,995 | | 3,837 | | 143 | | 2,412 | | 1,119 | | 701 | | 15,207 | | – | | – | | – | | 15,207 | |
| | | | | | | | | | | | | | | | | | | | | | | |
| Subsidiaries | 6,995 | | 3,837 | | 143 | | 1,424 | | – | | 696 | | 13,095 | | – | | – | | – | | 13,095 | |
| Associates | – | | – | | – | | 988 | | 1,119 | | 5 | | 2,112 | | – | | – | | – | | 2,112 | |
| | | | | | | | | | | | | | | | | | | | | | | |
| – Exceptional operating items | – | | (351 | ) | 130 | | – | | (2 | ) | (5 | ) | (228 | ) | – | | – | | – | | (228 | ) |
|
|
|
|
|
|
|
|
|
|
|
|
|
|
|
|
|
|
|
|
|
| |
Total Group operating profit/(loss)
before goodwill amortisation and
exceptional items | 1,741 | | 2,143 | | 1,098 | | 3,142 | | 1,393 | | 1,212 | | 10,729 | | (58 | ) | (1 | ) | 79 | | 10,749 | |
|
|
|
|
|
|
|
|
|
|
|
|
|
|
|
|
|
|
|
|
|
| |
| | | | | | | | | | | | | | | | | | | | | | | |
Depreciation and amortisation charges,
excluding goodwill amortisation | 740 | | 651 | | 508 | | 879 | | 4 | | 1,311 | | 4,093 | | 170 | | – | | 197 | | 4,460 | |
Intangible and tangible fixed asset
additions | 858 | | 700 | | 540 | | 1,141 | | – | | 1,366 | | 4,605 | | 115 | | – | | 41 | | 4,761 | |
| | | | | | | | | | | | | | | | | | | | | | | |
| At 31 March 2004: | | | | | | | | | | | | | | | | | | | | | | |
Net assets/(liabilities) and attributed
goodwill (before net borrowings): | | | | | | | | | | | | | | | | | | | | | | |
| – subsidiary undertakings | 42,512 | | 22,041 | | 5,369 | | 18,735 | | (1,739 | ) | 14,956 | | 101,874 | | 319 | | – | | – | | 102,193 | |
| – share of associated undertakings | – | | – | | – | | 5,983 | | 15,047 | | 18 | | 21,048 | | – | | 178 | | – | | 21,226 | |
|
|
|
|
|
|
|
|
|
|
|
|
|
|
|
|
|
|
|
|
|
| |
| | 42,512 | | 22,041 | | 5,369 | | 24,718 | | 13,308 | | 14,974 | | 122,922 | | 319 | | 178 | | – | | 123,419 | |
|
|
|
|
|
|
|
|
|
|
|
|
|
|
|
|
|
|
|
| | | |
| Net debt | | | | | | | | | | | | | | | | | | | | | (8,488 | ) |
|
|
|
|
|
|
|
|
|
|
|
|
|
|
|
|
|
|
|
|
|
| |
| | | | | | | | | | | | | | | | | | | | | | 114,931 | |
|
|
|
|
|
|
|
|
|
|
|
|
|
|
|
|
|
|
|
|
|
| |
| | | | | | | | | | | | | | | | | | | | | | | |
Back to Contents
Back to Consolidated Financial Statements Contents
| | Mobile telecommunications | | Other operations | | | |
|
|
| | | | | | | | Other | | | | Asia | | | | | | Other | | Asia | | Total | |
| Germany | Italy | UK | EMEA | Americas | Pacific | Total | Germany | EMEA | Pacific | Group |
| £m | £m | £m | £m | £m | £m | £m | £m | £m | £m | £m |
|
|
|
|
|
|
|
|
|
|
|
|
|
|
|
|
|
|
|
|
|
| |
| Year ended 31 March 2003: | | | | | | | | | | | | | | | | | | | | | | |
| Segment turnover | 4,754 | | 4,397 | | 4,055 | | 6,219 | | 18 | | 8,596 | | 28,039 | | 924 | | – | | 2,616 | | 31,579 | |
| Inter-segment turnover | (32 | ) | (26 | ) | (29 | ) | (88 | ) | (13 | ) | (4 | ) | (192 | ) | – | | – | | – | | (192 | ) |
|
|
|
|
|
|
|
|
|
|
|
|
|
|
|
|
|
|
|
|
|
| |
| Net turnover | 4,722 | | 4,371 | | 4,026 | | 6,131 | | 5 | | 8,592 | | 27,847 | | 924 | | – | | 2,616 | | 31,387 | |
Turnover between mobile and other
operations | (76 | ) | – | | – | | (1 | ) | – | | (228 | ) | (305 | ) | (70 | ) | – | | (637 | ) | (1,012 | ) |
|
|
|
|
|
|
|
|
|
|
|
|
|
|
|
|
|
|
|
|
|
| |
| Group turnover | 4,646 | | 4,371 | | 4,026 | | 6,130 | | 5 | | 8,364 | | 27,542 | | 854 | | – | | 1,979 | | 30,375 | |
|
|
|
|
|
|
|
|
|
|
|
|
|
|
|
|
|
|
|
|
|
| |
| | | | | | | | | | | | | | | | | | | | | | | |
| Operating (loss)/profit | (5,030 | ) | (1,955 | ) | 1,090 | | 359 | | (117 | ) | 702 | | (4,951 | ) | (89 | ) | – | | (255 | ) | (5,295) | |
| Share of operating (loss)/profit in joint ventures and associated undertakings | – | | – | | – | | (13 | ) | (21 | ) | 2 | | (32 | ) | – | | (124 | ) | – | | (156 | ) |
|
|
|
|
|
|
|
|
|
|
|
|
|
|
|
|
|
|
|
|
|
| |
| Total Group operating (loss)/profit | (5,030 | ) | (1,955 | ) | 1,090 | | 346 | | (138 | ) | 704 | | (4,983 | ) | (89 | ) | (124) | | (255 | ) | (5,451 | ) |
| Exceptional non-operating items | – | | – | | – | | (6 | ) | (28 | ) | (295 | ) | (329 | ) | 290 | | 58 | | (24 | ) | (5) | |
|
|
|
|
|
|
|
|
|
|
|
|
|
|
|
|
|
|
|
|
|
| |
(Loss)/profit on ordinary activities
before interest | (5,030 | ) | (1,955 | ) | 1,090 | | 340 | | (166 | ) | 409 | | (5,312 | ) | 201 | | (66) | | (279 | ) | (5,456 | ) |
|
|
|
|
|
|
|
|
|
|
|
|
|
|
|
|
|
|
|
|
|
| |
| Total Group operating (loss)/profit | (5,030 | ) | (1,955 | ) | 1,090 | | 346 | | (138 | ) | 704 | | (4,983 | ) | (89 | ) | (124) | | (255 | ) | (5,451 | ) |
| Add back: | | | | | | | | | | | | | | | | | | | | | | |
| – Goodwill amortisation | 6,465 | | 3,543 | | 30 | | 1,991 | | 1,235 | | 717 | | 13,981 | | – | | 75 | | – | | 14,056 | |
| | | | | | | | | | | | | | | | | | | | | | | |
| Subsidiaries | 6,465 | | 3,543 | | 30 | | 1,127 | | – | | 710 | | 11,875 | | – | | – | | – | | 11,875 | |
| Associates | – | | – | | – | | 864 | | 1,235 | | 7 | | 2,106 | | – | | 75 | | – | | 2,181 | |
| | | | | | | | | | | | | | | | | | | | | | | |
| – Exceptional operating items | – | | – | | – | | 50 | | 122 | | – | | 172 | | – | | – | | 404 | | 576 | |
|
|
|
|
|
|
|
|
|
|
|
|
|
|
|
|
|
|
|
|
|
| |
Total Group operating profit/(loss)
before goodwill amortisation and
exceptional items | 1,435 | | 1,588 | | 1,120 | | 2,387 | | 1,219 | | 1,421 | | 9,170 | | (89 | ) | (49) | | 149 | | 9,181 | |
|
|
|
|
|
|
|
|
|
|
|
|
|
|
|
|
|
|
|
|
|
| |
| | | | | | | | | | | | | | | | | | | | | | | |
Depreciation and amortisation charges,
excluding goodwill amortisation | 565 | | 570 | | 417 | | 720 | | 15 | | 1,190 | | 3,477 | | 166 | | – | | 389 | | 4,032 | |
Intangible and tangible fixed asset
additions | 800 | | 732 | | 500 | | 1,188 | | 9 | | 1,393 | | 4,622 | | 135 | | – | | 186 | | 4,943 | |
|
|
|
|
|
|
|
|
|
|
|
|
|
|
|
|
|
|
|
|
|
| |
| | | | | | | | | | | | | | | | | | | | | | | |
Back to Contents
Back to Consolidated Financial Statements Contents
|
| Notes to the Consolidated Financial Statements continued |
|
| | |
| 4. | Exceptional operating items |
| | |
| | 2005 | | 2004 | | 2003 | |
| £m | £m | £m |
|
|
|
|
|
| |
| Impairment of intangible and tangible fixed assets | (315 | ) | – | | (485 | ) |
| Contribution tax | – | | 351 | | – | |
| Reorganisation costs | – | | (123 | ) | (91 | ) |
|
|
|
|
|
| |
| | (315 | ) | 228 | | (576 | ) |
|
|
|
|
|
| |
The exceptional operating cost of £315 million in the year ended 31 March 2005 is due to an impairment of the carrying value of goodwill relating to Vodafone Sweden.
The net exceptional operating income for 2004 of £228 million comprises £351 million of expected recoveries and provision releases in relation to a contribution tax levy on Vodafone Italy and reorganisation costs of £123 million primarily relating to the Group’s operations in the UK.
The impairment charges for 2003 of £485 million relate to the carrying value of goodwill for Grupo Iusacell (£80 million) and tangible fixed assets in Japan Telecom (£405 million). Reorganisation costs of £91 million relate to the integration of Vizzavi and related restructuring of the Group’s internet portal activities.
| | 2005 | | 2004 | | 2003 | |
| |
|
|
| | | (1) | Continuing | | Discontinued | | | | Continuing | | Discontinued | | | |
| Total | operations | operations | Total | operations | operations | Total |
| £m | | £m | £m | £m | £m | £m | £m |
|
|
|
|
|
|
|
|
|
|
|
|
|
| |
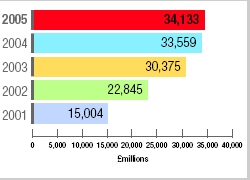
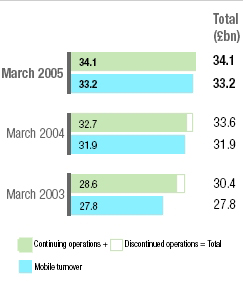
| Group turnover | 34,133 | | 32,741 | | 818 | | 33,559 | | 28,547 | | 1,828 | | 30,375 | |
| Cost of sales | (20,753 | ) | (18,986 | ) | (475 | ) | (19,461 | ) | (16,910 | ) | (986 | ) | (17,896 | ) |
| | | | | | | | | | | | | | | |
| Exceptional operating items | – | | 351 | | – | | 351 | | – | | – | | – | |
| Other cost of sales | (20,753 | ) | (19,337 | ) | (475 | ) | (19,812 | ) | (16,910 | ) | (986 | ) | (17,896 | ) |
| | | | | | | | | | | | | | | |
| Gross profit | 13,380 | | 13,755 | | 343 | | 14,098 | | 11,637 | | 842 | | 12,479 | |
|
|
|
|
|
|
|
|
|
|
|
|
|
| |
| Selling and distribution costs | (2,031 | ) | (2,065 | ) | (14 | ) | (2,079 | ) | (1,863 | ) | (20 | ) | (1,883 | ) |
| Administrative expenses | (16,653 | ) | (16,532 | ) | (263 | ) | (16,795 | ) | (14,826 | ) | (1,065 | ) | (15,891 | ) |
| | | | | | | | | | | | | | | |
| Goodwill amortisation | (12,929 | ) | (13,095 | ) | – | | (13,095 | ) | (11,875 | ) | – | | (11,875 | ) |
| Exceptional operating items | (315 | ) | (123 | ) | – | | (123 | ) | (91 | ) | (405 | ) | (496 | ) |
| Other administration expenses | (3,409 | ) | (3,314 | ) | (263 | ) | (3,577 | ) | (2,860 | ) | (660 | ) | (3,520 | ) |
|
|
|
|
|
|
|
|
|
|
|
|
|
| |
| Total operating expenses | (18,684 | ) | (18,597 | ) | (277 | ) | (18,874 | ) | (16,689 | ) | (1,085 | ) | (17,774 | ) |
|
|
|
|
|
|
|
|
|
|
|
|
|
| |
| Operating loss | (5,304 | ) | (4,842 | ) | 66 | | (4,776 | ) | (5,052 | ) | (243 | ) | (5,295 | ) |
|
|
|
|
|
|
|
|
|
|
|
|
|
| |
The results of Japan Telecom are analysed as discontinued operations in prior periods’ analyses.
| Note: |
| (1) | The results for the 2005 financial year entirely relate to continuing operations. |
| | |
Back to Contents
Back to Consolidated Financial Statements Contents
| | | | | | | |
| Operating loss has been arrived at after charging/(crediting): | |
| | | | | | | |
| | 2005 | | 2004 | | 2003 | |
| £m | £m | £m |
|
|
|
|
|
| |
| Staff costs (see note 31) | 2,293 | | 2,331 | | 2,278 | |
| Depreciation of tangible fixed assets: | | | | | | |
| Owned assets | 4,467 | | 4,181 | | 3,783 | |
| Leased assets | 61 | | 181 | | 196 | |
| Goodwill amortisation | 12,929 | | 13,095 | | 11,875 | |
| Impairment of intangible and tangible fixed assets | 315 | | – | | 485 | |
| Amortisation of other intangible fixed assets | 412 | | 98 | | 53 | |
| Research and development | 219 | | 171 | | 164 | |
| Advertising costs (including applicable staff costs) | 864 | | 990 | | 902 | |
| Bad debt expense | 224 | | 209 | | 193 | |
| Operating lease rentals: | | | | | | |
| Plant and machinery | 37 | | 98 | | 78 | |
| Other assets including fixed line rentals | 1,300 | | 1,254 | | 1,269 | |
| Own costs capitalised attributable to the construction or acquisition of tangible fixed assets | (301 | ) | (290 | ) | (207 | ) |
|
|
|
|
|
| |
| | | | | |
| The total amount charged by Deloitte & Touche LLP is analysed below: | |
| | | | | |
| | 2005 | | 2004 | |
| £m | £m |
|
|
|
| |
| Audit fees | 5 | | 4 | |
| Audit-related fees: | | | | |
| Audit regulatory reporting | – | | 2 | |
| Due diligence reviews | 1 | | 1 | |
| Tax fees: | | | | |
| Compliance | 1 | | 1 | |
| Other tax | 1 | | 1 | |
| All other fees: | | | | |
| IT consultancy | – | | 2 | |
| Other | 1 | | 1 | |
|
|
|
| |
| | 9 | | 12 | |
|
|
|
| |
| Analysed as: | | | | |
| | | | | |
| | 2005 | | 2004 | |
| £m | £m |
|
|
|
| |
| Charged to profit and loss account | 9 | | 10 | |
| Capitalised or charged to share premium account | – | | 2 | |
|
|
|
| |
| | 9 | | 12 | |
|
|
|
| |
| | | | | |
| | 2005 | | 2004 | |
| £m | £m |
|
|
|
| |
| UK companies | 3 | | 4 | |
| Overseas companies | 6 | | 8 | |
|
|
|
| |
| | 9 | | 12 | |
|
|
|
| |
| In addition to the above, the Group’s associated companies paid fees totalling £5 million to Deloitte & Touche LLP during the year ended 31 March 2005 (2004: £8 million). The Company audit fee for the year ended 31 March 2005 was £0.5 million (2004: £0.3 million). |
| |
Back to Contents
Back to Consolidated Financial Statements Contents
|
| Notes to the Consolidated Financial Statements continued |
|
|
| 5. | Operating loss continued |
| Joint ventures and associated undertakings |
| The Group’s share of the turnover and operating loss of joint ventures and associated undertakings is further analysed as follows: |
| | |
| | 2005 | | 2004 | | 2003 | |
| £m | £m | £m |
|
|
|
|
|
| |
| Share of turnover: | | | | | | |
| Joint ventures | – | | – | | 8 | |
| Associated undertakings | 11,648 | | 10,179 | | 8,769 | |
|
|
|
|
|
| |
| | 11,648 | | 10,179 | | 8,777 | |
|
|
|
|
|
| |
| | 2005 | | 2004 | | 2003 | |
| £m | £m | £m |
|
|
|
|
|
| |
| Share of operating profit/(loss): | | | | | | |
| Joint ventures | – | | – | | (39 | ) |
| Associated undertakings | 1,193 | | 546 | | (117 | ) |
|
|
|
|
|
| |
| | 1,193 | | 546 | | (156 | ) |
|
|
|
|
|
| |
| | | |
|
| |
| 6. | Exceptional non-operating items | |
| | 2005 | | 2004 | | 2003 | |
| £m | £m | £m |
|
|
|
|
|
| |
| Profit on disposal of fixed asset investments | 19 | | 12 | | 255 | |
| Share of associate profit/(loss) on disposal of investment | 5 | | (1 | ) | 55 | |
| Amounts written off fixed asset investments | (2 | ) | (6 | ) | (340 | ) |
| Loss on disposal of businesses | (9 | ) | (127 | ) | 22 | |
| Profit on disposal of tangible fixed assets | – | | 19 | | 3 | |
|
|
|
|
|
| |
| | 13 | | (103 | ) | (5 | ) |
|
|
|
|
|
| |
| The profit on disposal of fixed assets investments principally relates to the disposal of trade investments by Vodafone Japan. The loss on disposal of businesses for 2005 primarily relates to the loss on disposal incurred by the Group on the sale of a 16.9% stake in Vodafone Egypt reducing the Group’s controlling interest to 50.1%. |
| | | | | | | |
| The loss on disposal of businesses for the year ended 31 March 2004 primarily relates to the disposal of the Japan Telecom fixed line operations by the Group’s 66.7% owned subsidiary, Vodafone Holdings K.K. |
| | | | | | | |
| Amounts written off fixed asset investments for the year ended 31 March 2003 primarily relates to the Group’s interest in China Mobile. The profit on disposal of fixed asset investments for 2003 primarily relates to the disposal of the Group’s 23.6% interest in Bergemann GmbH, through which the Group’s stake in Ruhrgas AG was held. The share of associate profit on disposal of investment relates to the completion of the disposal for cash of AOL Europe shares by Cegetel Group S.A. |
Back to Contents
Back to Consolidated Financial Statements Contents
| 7. | Net interest payable and similar items |
| | 2005 | | 2004 | | 2003 | |
| £m | £m | £m |
|
|
|
|
|
| |
| Parent and subsidiary undertakings: | | | | | | |
| Interest receivable and similar income | (602 | ) | (592 | ) | (666 | ) |
|
|
|
|
|
| |
| Interest payable and similar charges: | | | | | | |
| Bank loans and overdrafts | 49 | | 46 | | 133 | |
| Other loans | 677 | | 820 | | 921 | |
| Tax liabilities | 261 | | 215 | | 55 | |
| Finance leases | 8 | | 10 | | 14 | |
|
|
|
|
|
| |
| | 995 | | 1,091 | | 1,123 | |
|
|
|
|
|
| |
| Group net interest payable | 393 | | 499 | | 457 | |
|
|
|
|
|
| |
| Share of joint ventures: | | | | | | |
| Interest payable and similar charges | – | | – | | 8 | |
|
|
|
|
|
| |
| Share of associated undertakings: | | | | | | |
| Interest receivable and similar income | (16 | ) | (7 | ) | (24 | ) |
| Interest payable and similar charges | 227 | | 222 | | 311 | |
|
|
|
|
|
| |
| | 211 | | 215 | | 287 | |
|
|
|
|
|
| |
| Share of joint ventures and associated undertakings net interest payable | 211 | | 215 | | 295 | |
|
|
|
|
|
| |
| | | | | | | |
|
|
|
|
|
| |
| Net interest payable and similar items | 604 | | 714 | | 752 | |
|
|
|
|
|
| |
| | | |
|
| |
| 8. | Tax on loss on ordinary activities | |
| | | | | | |
| | 2005 | | 2004 | | 2003 | |
| £m | £m | £m |
|
|
|
|
|
| |
| | | | | | | |
| United Kingdom corporation tax charge at 30% | 271 | | 209 | | 195 | |
|
|
|
|
|
| |
| Overseas corporation tax | | | | | | |
| Current tax: | | | | | | |
| Current year | 2,430 | | 2,264 | | 1,971 | |
| Prior year | (221 | ) | (159 | ) | 9 | |
|
|
|
|
|
| |
| | 2,209 | | 2,105 | | 1,980 | |
|
|
|
|
|
| |
| Total current tax | 2,480 | | 2,314 | | 2,175 | |
| Deferred tax – origination of and reversal of timing differences | (247 | ) | 736 | | 818 | |
| | | | | | | |
| United Kingdom deferred tax | 292 | | 426 | | 22 | |
| Overseas deferred tax | (539 | ) | 310 | | 796 | |
| | | | | | | |
| Tax on exceptional items | 3 | | 104 | | (37 | ) |
|
|
|
|
|
| |
| Total tax charge | 2,236 | | 3,154 | | 2,956 | |
|
|
|
|
|
| |
| Tax on loss on ordinary activities before exceptional items and exceptional tax credit | 2,832 | | 3,050 | | 2,993 | |
| Tax on exceptional items | 3 | | 104 | | (37 | ) |
| Exceptional tax credit | (599 | ) | – | | – | |
|
|
|
|
|
| |
| | 2,236 | | 3,154 | | 2,956 | |
|
|
|
|
|
| |
| | | | | | | |
| Parent and subsidiary undertakings | 1,698 | | 2,866 | | 2,624 | |
| Share of joint ventures | – | | – | | 17 | |
| Share of associated undertakings | 538 | | 288 | | 315 | |
|
|
|
|
|
| |
| | 2,236 | | 3,154 | | 2,956 | |
|
|
|
|
|
| |
Back to Contents
Back to Consolidated Financial Statements Contents
|
| Notes to the Consolidated Financial Statements continued |
|
| 8. | Tax on loss on ordinary activities continued |
| Factors affecting the tax charge for the year |
Refer to Operating and Financial Review and Prospects – Operating Results – Group Overview – 2005 financial year compared to 2004 financial year – Taxation.
Reconciliation of expected tax charge using the standard tax rate to the actual current tax charge
The differences between the Group’s expected tax charge, using the Group’s standard corporation tax rate of 36.0% in 2005 (36.4% in 2004 and 37.0% in 2003), comprising the average rates of tax payable across the Group and weighted in proportion to accounting profits, and the Group’s current tax charge for each of those years were as follows:
| | 2005 | | 2004 | | 2003 | |
| £m | £m | £m |
|
|
|
|
|
| |
| Expected tax credit at standard tax rate on loss on ordinary activities | (1,693 | ) | (1,837 | ) | (2,295 | ) |
| Goodwill amortisation | 5,292 | | 5,535 | | 5,196 | |
| Exceptional non-operating items | (5 | ) | 38 | | 2 | |
| Exceptional operating items | 113 | | (83 | ) | 213 | |
|
|
|
|
|
| |
| Expected tax charge at standard tax rate on profit on ordinary activities, | | | | | | |
| before goodwill amortisation and exceptional items | 3,707 | | 3,653 | | 3,116 | |
| Permanent differences | 93 | | 47 | | 140 | |
| Fixed asset timing differences | 12 | | (509 | ) | (404 | ) |
| Short term timing differences | (163 | ) | (18 | ) | (64 | ) |
| Deferred tax on overseas earnings | (322 | ) | (418 | ) | (424 | ) |
| Losses carried forward utilised/current year losses for which no credit taken | (171 | ) | 26 | | 278 | |
| Exceptional current tax credit | (166 | ) | – | | – | |
| Prior year adjustments | (289 | ) | (61 | ) | 4 | |
| Non taxable profits/non deductible losses | (148 | ) | (281 | ) | (239 | ) |
| International corporate tax rate differentials and other | (73 | ) | (125 | ) | (232 | ) |
|
|
|
|
|
| |
| Actual current tax charge (excluding tax on exceptional items) | 2,480 | | 2,314 | | 2,175 | |
|
|
|
|
|
| |
Reconciliation of expected tax charge using the UK statutory tax rate to the actual tax charge
The differences between the Group’s expected tax charge, using the UK corporation tax rate of 30% in 2005, 2004 and 2003 and the Group’s tax charge for each of those years were as follows:
| | 2005 | | 2004 | | 2003 | |
| £m | £m | £m |
|
|
|
|
|
| |
| Expected tax credit at UK corporation tax rate on loss on ordinary activities | (1,411 | ) | (1,514 | ) | (1,863 | ) |
| Goodwill amortisation | 4,410 | | 4,562 | | 4,217 | |
| Exceptional non-operating items | (4 | ) | 31 | | 2 | |
| Exceptional operating items | 95 | | (69 | ) | 173 | |
|
|
|
|
|
| |
| Expected tax charge at UK corporation tax rate, before goodwill amortisation and exceptional items | 3,090 | | 3,010 | | 2,529 | |
| Permanent differences | 118 | | 152 | | 165 | |
| Movement in valuation allowances against: | | | | | | |
| – Fixed asset timing differences | (22 | ) | (21 | ) | (40 | ) |
| – Short term timing differences | (197 | ) | (64 | ) | 60 | |
| – Losses carried forward utilised/current year losses for which no credit taken | (264 | ) | (26 | ) | 161 | |
| Prior year adjustments | (315 | ) | (61 | ) | (9 | ) |
| Net (over)/under charge relating to international associated undertakings | 23 | | (186 | ) | 8 | |
| Non taxable profits/non deductible losses | (148 | ) | (281 | ) | (239 | ) |
| International corporate tax rate differentials and other | 547 | | 527 | | 358 | |
|
|
|
|
|
| |
| Actual total tax charge (excluding tax on exceptional items and exceptional tax credit) | 2,832 | | 3,050 | | 2,993 | |
|
|
|
|
|
| |
Back to Contents
Back to Consolidated Financial Statements Contents
Factors affecting the tax charge in future years
Factors that may affect the Group’s future tax charge include the absence of one-off restructuring benefits, the resolution of open issues, future planning opportunities, corporate acquisitions and disposals, changes in tax legislation and rates, and the use of brought forward tax losses.
In particular, the Group’s subsidiary, Vodafone 2, is responding to an enquiry by the UK Inland Revenue with regard to the UK tax treatment of one of its Luxembourg holding companies under the controlled foreign companies rules. Further details in relation to this enquiry are included in “Risk Factors and Legal Proceedings”. At 31 March 2005, Vodafone has provided for £1,600 million tax and £157 million interest in respect of the potential UK tax liability that may arise in respect of this enquiry. At 31 March 2004, the respective provisions were £1,335 million and £62 million. Vodafone considers these amounts are sufficient to settle any assessments that may arise from the enquiry. However, the amount ultimately paid may differ materially from the amount accrued and, therefore, could affect the overall profitability of the Group in future periods. In the absence of any material unexpected developments, the provisions are likely to be reassessed when the views of the European Court of Justice become known, which is expected to be during 2006.
At 31 March 2005, the Group had the following trading and non-trading losses available for carry forward. These losses are available for offset against future trading and non-trading profits of certain Group and associated undertakings:
| | Expiring within | | Expiring within | | | | | |
| 5 years | 10 years | Unlimited | Total |
| £m | £m | £m | £m |
|
|
|
|
|
|
|
| |
| UK subsidiaries’ trading and non-trading losses | – | | – | | 2,035 | | 2,035 | |
| International subsidiaries’ trading and non-trading losses | 92 | | 1,035 | | 34,527 | | 35,654 | |
|
|
|
|
|
|
|
| |
The losses in respect of UK subsidiaries include an amount of £1,870 million that is only available for offset against future capital gains and since it is uncertain whether these losses will be utilised, no deferred tax asset has been recognised.
The losses in respect of international subsidiaries include amounts of £30,857 million (2004: £30,728 million) that have arisen in overseas holding companies as a result of revaluations of those companies’ investments for local GAAP purposes. Since it is uncertain whether these losses will be utilised, no deferred tax asset has been recognised. See note 21.
In addition to the losses described above, the Group has potential tax losses of £34,674 million (2004: £33,763 million) in respect of a write down in the value of investments in Germany. These losses have to date been denied by the German Tax Authorities. Vodafone is now in discussions with them regarding the availability of the losses, however the outcome of these discussions and the timing of the resolution are not yet known. The Group has not recognised the availability of the losses, nor the benefit arising from them, due to this uncertainty. If upon resolution a benefit is recognised, it may impact both the amount of current income taxes provided since the date of initial deduction and the amount of benefit from tax losses the Group will recognise. The recognition of these benefits could affect the overall profitability of the Group in future periods.
| | | | 2005 | | | | 2004 | | | | 2003 | |
| Pence per | Pence per | Pence per |
| 2005 | ordinary | 2004 | ordinary | 2003 | ordinary |
| £m | share | £m | share | £m | share |
|
|
|
|
|
|
|
|
|
|
|
| |
| Interim dividend paid | 1,263 | | 1.91 | | 650 | | 0.9535 | | 542 | | 0.7946 | |
| Proposed final dividend | 1,395 | | 2.16 | | 728 | | 1.0780 | | 612 | | 0.8983 | |
|
|
|
|
|
|
|
|
|
|
|
| |
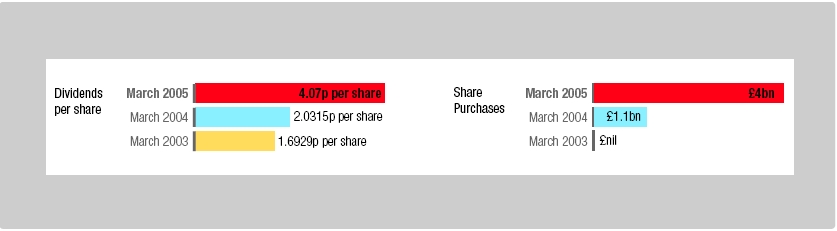
| | 2,658 | | 4.07 | | 1,378 | | 2.0315 | | 1,154 | | 1.6929 | |
|
|
|
|
|
|
|
|
|
|
|
| |
Shares held in treasury do not qualify for dividends. Dividends that would have been paid on these shares would have been £124 million for the year ended 31 March 2005 (2004: £9 million; 2003: £nil) had they qualified.
Back to Contents
Back to Consolidated Financial Statements Contents
|
| Notes to the Consolidated Financial Statements continued |
|
| | 2005 | | 2004 | | 2003 | |
|
|
|
|
|
| |
| Weighted average number of shares (millions) in issue during the year and used to | | | | | | |
| calculate basic and diluted loss per share: | 66,196 | | 68,096 | | 68,155 | |
| | | | | | | |
| | £m | | £m | | £m | |
|
|
|
|
|
| |
| | | | | | | |
| Loss for basic and diluted loss per share | (7,540 | ) | (9,015 | ) | (9,819 | ) |
| | | | | | | |
| | Pence | | Pence | | Pence | |
| per share | per share | per share |
|
|
|
|
|
| |
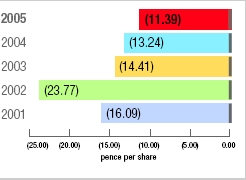
| Basic and diluted loss per share | (11.39 | ) | (13.24 | ) | (14.41 | ) |
| | | | | | | |
| | £m | | £m | | £m | |
|
|
|
|
|
| |
| Basic loss per share is stated inclusive of the following items: | | | | | | |
| Amortisation of goodwill | 14,700 | | 15,207 | | 14,056 | |
| Exceptional operating items | 315 | | (228 | ) | 576 | |
| Exceptional non-operating items | (13 | ) | 103 | | 5 | |
| Exceptional tax credit | (599 | ) | – | | – | |
| Tax on exceptional items | 3 | | 104 | | (37 | ) |
| Share of exceptional items attributable to minority interests | 26 | | 27 | | (139 | ) |
| | | | | | | |
| | Pence | | Pence | | Pence | |
| per share | per share | per share |
|
|
|
|
|
| |
| Amortisation of goodwill | 22.21 | | 22.33 | | 20.62 | |
| Exceptional operating items | 0.48 | | (0.33 | ) | 0.85 | |
| Exceptional non-operating items | (0.02 | ) | 0.15 | | 0.01 | |
| Exceptional tax credit | (0.91 | ) | – | | – | |
| Tax on exceptional items | – | | 0.15 | | (0.06 | ) |
| Share of exceptional items attributable to minority interests | 0.04 | | 0.04 | | (0.20 | ) |
Basic loss per share represents the net loss attributable to ordinary shareholders, being the loss on ordinary activities after taxation and minority interests. Diluted loss per share is the same as basic loss per share as it is considered that there are no dilutive potential ordinary shares.
Back to Contents
Back to Consolidated Financial Statements Contents
| 11.Intangible fixed assets |
| | | | | | | |
| Licence and |
| spectrum |
| Goodwill | fees | Total |
| £m | £m | £m |
|
|
|
|
|
| |
| Cost: | | | | | | |
| 1 April 2004 | 130,377 | | 15,063 | | 145,440 | |
| Exchange movements | 2,737 | | 244 | | 2,981 | |
| Acquisitions (note 25) | 1,757 | | – | | 1,757 | |
| Additions | – | | 124 | | 124 | |
| Disposals | (52 | ) | – | | (52 | ) |
|
|
|
|
|
| |
| 31 March 2005 | 134,819 | | 15,431 | | 150,250 | |
|
|
|
|
|
| |
| Accumulated amortisation and impairment: | | | | | | |
| 1 April 2004 | 51,597 | | 221 | | 51,818 | |
| Exchange movements | 1,323 | | 7 | | 1,330 | |
| Amortisation charge for the year | 12,929 | | 412 | | 13,341 | |
| Impairment | 315 | | – | | 315 | |
| Disposals | (18 | ) | – | | (18 | ) |
|
|
|
|
|
| |
| 31 March 2005 | 66,146 | | 640 | | 66,786 | |
|
|
|
|
|
| |
| Net book value: | | | | | | |
| 31 March 2005 | 68,673 | | 14,791 | | 83,464 | |
|
|
|
|
|
| |
| 31 March 2004 | 78,780 | | 14,842 | | 93,622 | |
|
|
|
|
|
| |
For acquisitions prior to 1 April 1998, the cumulative goodwill written off to reserves, net of the goodwill attributed to business disposals, was £723 million at 31 March 2005 (2004: £723 million).
In accordance with accounting standards, the Group regularly monitors the carrying value of its fixed assets. A review was undertaken at 31 March 2005 to assess whether the carrying value of assets was supported by the net present value of future cash flows derived from assets using cash flow projections for each asset in respect of the period to 31 March 2015.
The Group prepares and internally approves formal ten year plans for its businesses and uses these as the basis for its impairment reviews. The plans include cash flow projections for the mobile businesses which reflect continuing investment in network infrastructure to provide enhanced voice and data products and services, which are forecast to be significant drivers of future revenue growth. Capital expenditure is heaviest in the early years of the projections but is forecast to fall to 10% of revenue at Group level by the year ending 31 March 2008. Revenue growth is forecast from a combination of new customers and enhanced customer propositions. Data revenue is forecast to grow strongly throughout the ten year plan period. Voice revenue is forecast to benefit in the longer term from enhanced service offerings and traffic moving from fixed networks to mobile networks following a period of stabilisation reflecting the impact of price declines.
Accordingly, the directors believe that it is appropriate to use projections in excess of five years. For the years beyond 1 April 2015, forecast growth rates for mobile businesses do not exceed nominal GDP, using rates from independent sources, and are below nominal GDP for non-mobile businesses. The discount rates for the major markets reviewed were based on company specific pre-tax weighted average cost of capital percentages and ranged from 8.3% to 11.6%.
The results of the review undertaken at 31 March 2005 indicated that an impairment charge of £315 million was necessary in respect of goodwill held in relation to Vodafone Sweden (see note 4).
Back to Contents
Back to Consolidated Financial Statements Contents
|
Notes to the Consolidated Financial Statements continued |
|
| | Land and | | Equipment,
fixtures | | Network | | | |
| buildings | and fittings | infrastructure | Total |
| £m | £m | £m | £m |
|
|
|
|
|
|
|
| |
| Cost: | | | | | | | | |
| 1 April 2004 | 1,214 | | 5,979 | | 23,371 | | 30,564 | |
| Exchange movements | 9 | | 57 | | (37 | ) | 29 | |
| Additions | 126 | | 1,690 | | 3,250 | | 5,066 | |
| Disposals | (23 | ) | (274 | ) | (419 | ) | (716 | ) |
|
|
|
|
|
|
|
| |
| 31 March 2005 | 1,326 | | 7,452 | | 26,165 | | 34,943 | |
|
|
|
|
|
|
|
| |
| Accumulated depreciation and impairment: | | | | | | | | |
| 1 April 2004 | 293 | | 3,640 | | 8,548 | | 12,481 | |
| Exchange movements | 4 | | 27 | | – | | 31 | |
| Charge for the year | 86 | | 1,144 | | 3,298 | | 4,528 | |
| Disposals | (10 | ) | (184 | ) | (301 | ) | (495 | ) |
|
|
|
|
|
|
|
| |
| 31 March 2005 | 373 | | 4,627 | | 11,545 | | 16,545 | |
|
|
|
|
|
|
|
| |
| Net book value: | | | | | | | | |
| 31 March 2005 | 953 | | 2,825 | | 14,620 | | 18,398 | |
|
|
|
|
|
|
|
| |
| 31 March 2004 | 921 | | 2,339 | | 14,823 | | 18,083 | |
|
|
|
|
|
|
|
| |
| | | | | | | | | |
| The total net book value of land and buildings held by the Group comprises: | | | | | | | | |
| | | | | | 2005 | | 2004 | |
| £m | £m |
|
|
|
|
|
|
|
| |
| Freehold premises included in: | | | | | | | | |
| – Land and buildings | | | | | 597 | | 586 | |
| – Network infrastructure | | | | | 309 | | 284 | |
|
|
|
|
|
|
|
| |
| | | | | | 906 | | 870 | |
|
|
|
|
|
|
|
| |
| | | | | | | | | |
| Long-term leasehold premises included in: | | | | | | | | |
| – Land and buildings | | | | | 114 | | 115 | |
|
|
|
|
|
|
|
| |
| | | | | | | | | |
| Short term leasehold premises included in: | | | | | | | | |
| – Land and buildings | | | | | 242 | | 220 | |
| – Network infrastructure | | | | | 1,537 | | 1,348 | |
|
|
|
|
|
|
|
| |
| | | | | | 1,779 | | 1,568 | |
|
|
|
|
|
|
|
| |
| | | | | | | | | |
|
|
|
|
|
|
|
| |
| Total | | | | | 2,799 | | 2,553 | |
|
|
|
|
|
|
|
| |
| Network infrastructure and equipment include the following amounts in respect of finance leases: | | | | | | | |
| | | | | | 2005 | | 2004 | |
| £m | £m |
|
|
|
|
|
|
|
| |
| Cost | | | | | 309 | | 614 | |
| Accumulated depreciation | | | | | (184 | ) | (454 | ) |
|
|
|
|
|
|
|
| |
| Net book value | | | | | 125 | | 160 | |
|
|
|
|
|
|
|
| |
Liabilities under leases for network infrastructure assets, with an original cost of £104 million and net book value at 31 March 2005 of £20 million, have been unconditionally satisfied by call deposits and other assets, trust deed and set-off arrangements. Accordingly, lease liabilities and the corresponding financial assets in respect of these network infrastructure assets are not included in the Group’s balance sheet.
Back to Contents
Back to Consolidated Financial Statements Contents
| The cost of assets in the course of construction, which are not subject to depreciation, was: | | | |
| | | | |
| | 2005
£m | | |
|
| | |
| Land and buildings | 16 | | |
| Equipment, fixtures & fittings | 341 | | |
| Network infrastructure | 986 | | |
|
| | |
| Total | 1,343 | | |
|
| | |
| | | | |
|
| | |
|
| 13.Fixed asset investments |
| Associated undertakings |
| | | |
| | Group
£m | |
|
| |
| Share of net assets: | | |
| 1 April 2004 | 3,075 | |
| Exchange movements | (41 | ) |
| Share of retained results excluding goodwill amortisation | 152 | |
| Share of goodwill amortisation | (42 | ) |
|
| |
| 31 March 2005 | 3,144 | |
|
| |
| Capitalised goodwill: | | |
| 1 April 2004 | 18,151 | |
| Exchange movements | (173 | ) |
| Acquisitions (note 25) | 5 | |
| Goodwill amortisation | (1,729 | ) |
|
| |
| 31 March 2005 | 16,254 | |
|
| |
| | | |
| Net book value: | | |
| 31 March 2005 | 19,398 | |
|
| |
| 31 March 2004 | 21,226 | |
|
| |
|
For acquisitions of associated undertakings prior to 1 April 1998, the cumulative goodwill written off to reserves, net of the goodwill attributed to business disposals, was £467 million at 31 March 2005 (2004: £467 million).
The Group’s share of its associated undertakings comprises:
| | 2005
£m | | 2004
£m | |
|
|
|
| |
| Share of turnover of associated undertakings | 11,648 | | 10,179 | |
|
|
|
| |
| Share of assets: | | | | |
| Fixed assets | 8,895 | | 8,139 | |
| Current assets | 2,651 | | 2,263 | |
|
|
|
| |
| | 11,546 | | 10,402 | |
|
|
|
| |
| Share of liabilities: | | | | |
| Liabilities due within one year | 5,398 | | 4,695 | |
| Liabilities due after more than one year | 2,578 | | 2,197 | |
| Minority interests | 426 | | 435 | |
|
|
|
| |
| | 8,402 | | 7,327 | |
|
|
|
| |
| Share of net assets | 3,144 | | 3,075 | |
| Attributed goodwill net of accumulated amortisation and impairment | 16,254 | | 18,151 | |
|
|
|
| |
| | 19,398 | | 21,226 | |
|
|
|
| |
In addition, minority interests disclosed in the Consolidated Profit and Loss account for the year ended 31 March 2005 includes £45 million in respect of joint ventures and associated undertakings (2004: £61 million; 2003: £(20) million).
Back to Contents
Back to Consolidated Financial Statements Contents
|
| Notes to the Consolidated Financial Statements continued |
|
|
13.Fixed asset investments continued
| The Group’s principal associated undertakings and fixed asset investments are detailed in note 34. A summary of Verizon Wireless’ results is shown within note 36. |
| | | |
| Other fixed asset investments | | |
| | Group | |
| | £m | |
|
| |
| Cost: | | |
| 1 April 2004 | 2,079 | |
| Exchange movements | (112 | ) |
| Additions | 20 | |
| Disposals | (184 | ) |
|
| |
| 31 March 2005 | 1,803 | |
|
| |
| Amounts written off: | | |
| 1 April 2004 | 1,030 | |
| Exchange movements | (81 | ) |
| Amounts written off during the year | 2 | |
|
| |
| 31 March 2005 | 951 | |
|
| |
| Net book value: | | |
| 31 March 2005 | 852 | |
|
| |
| 31 March 2004 | 1,049 | |
|
| |
Other fixed asset investments include 3.3% of China Mobile (Hong Kong) Limited which is listed on the New York and Hong Kong Stock Exchanges. The market value of this investment at 31 March 2005 was £1,113 million (2004: £1,047 million).
The Company’s fixed asset investments comprise investments in subsidiary undertakings as follows:
| | £m | |
|
| |
| Cost: | | |
| 1 April 2004 | 110,939 | |
| Additions | 10 | |
| Disposals | (12,160 | ) |
|
| |
| 31 March 2005 | 98,789 | |
|
| |
| Amounts written off: | | |
| 1 April 2004 | 4,762 | |
|
| |
| 31 March 2005 | 4,762 | |
|
| |
| Net book value: | | |
| 31 March 2005 | 94,027 | |
|
| |
| 31 March 2004 | 106,177 | |
|
| |
Back to Contents
Back to Consolidated Financial Statements Contents
14.Stocks
| | | | 2005 | | 2004 | |
| | £m | | £m | |
|
|
|
|
|
| |
| Goods held for resale | | | 430 | | 458 | |
|
|
|
|
|
| |
| | | | | | | |
| Stocks are reported net of allowances for obsolescence, an analysis of which is as follows: | | | | | | |
| | 2005 | | 2004 | | 2003 | |
| | £m | | £m | | £m | |
|
|
|
|
|
| |
| Opening balance at 1 April | 193 | | 89 | | 126 | |
| Exchange adjustments | (4 | ) | (1 | ) | 2 | |
| Amounts (credited)/charged to the profit and loss account | (51 | ) | 107 | | (27 | ) |
| Assets written off | (15 | ) | (2 | ) | (12 | ) |
|
|
|
|
|
| |
| Closing balance at 31 March | 123 | | 193 | | 89 | |
| |
| | |
| |
| 15.Debtors | |
| | |
| | Group | | Company | |
| |
| |
| 2005 | | 2004 | | 2005 | | 2004 | |
| £m | | £m | | £m | | £m | |
|
|
|
|
|
|
|
| |
| Due within one year: | | | | | | | | |
| Trade debtors | 2,768 | | 2,593 | | – | | – | |
| Amounts owed by subsidiary undertakings | – | | – | | 76,303 | | 65,098 | |
| Amounts owed by associated undertakings | 23 | | 17 | | – | | – | |
| Taxation recoverable | 268 | | 372 | | 37 | | – | |
| Group relief receivable | – | | – | | 43 | | 132 | |
| Other debtors | 413 | | 491 | | 272 | | 310 | |
| Prepayments and accrued income | 2,130 | | 2,048 | | – | | – | |
|
|
|
|
|
|
|
| |
| | 5,602 | | 5,521 | | 76,655 | | 65,540 | |
|
|
|
|
|
|
|
| |
| Due after more than one year: | | | | | | | | |
| Trade debtors | 49 | | 37 | | – | | – | |
| Other debtors | 122 | | 76 | | – | | – | |
| Prepayments | 384 | | 302 | | – | | – | |
| Deferred taxation (note 21) | 1,541 | | 965 | | 83 | | 87 | |
|
|
|
|
|
|
|
| |
| | 2,096 | | 1,380 | | 83 | | 87 | |
|
|
|
|
|
|
|
| |
| | 7,698 | | 6,901 | | 76,738 | | 65,627 | |
| |
The Group’s deferred tax asset of £1,541 million at 31 March 2005 (2004: £965 million) relates to fixed asset timing differences of £206 million (2004: £nil) and short term timing differences and losses of £1,335 million (2004: £965 million). The directors are of the opinion, based on recent and forecast trading, that the level of future taxable profits and deferred tax liabilities will be sufficient to utilise the deferred tax asset being recognised.
The Company’s deferred tax asset of £83 million (2004: £87 million) is in respect of the closure of derivative financial instruments. The movement in the asset recognised has been charged to the Company’s profit and loss account for the year. There are no unrecognised deferred tax assets at 31 March 2005 (2004: £18 million).
Debtors are stated after allowances for bad and doubtful debts, an analysis of which is as follows:
| | 2005 | | 2004 | | 2003 | |
| £m | | £m | | £m | |
| |
| Opening balance at 1 April | 461 | | 520 | | 526 | |
| Exchange adjustments | 6 | | (20 | ) | 17 | |
| Amounts charged to the profit and loss account | 224 | | 209 | | 193 | |
| Acquisitions | – | | 11 | | 2 | |
| Disposals | – | | (21 | ) | – | |
| Debtors written off | (195 | ) | (238 | ) | (218 | ) |
|
|
|
|
|
| |
| Closing balance at 31 March | 496 | | 461 | | 520 | |
|
|
| |
Back to Contents
Back to Consolidated Financial Statements Contents
|
| Notes to the Consolidated Financial Statements continued |
|
|
16.Investments
| | Group | | Company | |
| |
| |
| 2005 | | 2004 | | 2005 | | 2004 | |
| £m | | £m | | £m | | £m | |
|
|
|
| |
|
|
| |
| Liquid investments | 816 | | 4,381 | | 28 | | – | |
|
|
|
|
|
|
|
| |
Group liquid investments principally comprise collateralised deposits and investments in commercial paper. The Company’s liquid investments comprise short term foreign exchange deals.
|
|
|
|
|
|
|
|
|
| 17.Creditors: amounts falling due within one year |
| |
| | Group | | Company | |
| |
| |
| 2005 | | 2004 | | 2005 | | 2004 | |
| £m | | £m | | £m | | £m | |
|
|
|
|
|
|
|
| |
| Bank overdrafts | 47 | | 42 | | – | | – | |
| Bank loans and other loans | 332 | | 2,000 | | 15 | | 956 | |
| Finance leases | 13 | | 12 | | – | | – | |
| Trade creditors | 2,887 | | 2,842 | | – | | – | |
| Amounts owed to subsidiary undertakings | – | | – | | 88,710 | | 93,553 | |
| Amounts owed to associated undertakings | 9 | | 8 | | – | | – | |
| Taxation | 4,759 | | 4,275 | | – | | – | |
| Other taxes and social security costs | 332 | | 367 | | – | | – | |
| Other creditors | 444 | | 741 | | 4 | | 71 | |
| Accruals and deferred income | 4,619 | | 4,011 | | 301 | | 371 | |
| Proposed dividend | 1,395 | | 728 | | 1,395 | | 728 | |
|
|
|
|
|
|
|
| |
| | 14,837 | | 15,026 | | 90,425 | | 95,679 | |
| |
| | | | | | | | | |
|
|
|
|
|
|
|
|
|
| 18.Creditors: amounts falling due after more than one year | |
| | |
| | Group | | Company | |
| |
| |
| |
| | 2005 | | 2004 | | 2005 | | 2004 | |
| | £m | | £m | | £m | | £m | |
|
|
|
|
|
|
|
| |
| Bank loans | 1,231 | | 1,504 | | 16 | | 23 | |
| Other loans | 10,269 | | 10,596 | | 8,800 | | 8,795 | |
| Finance leases | 113 | | 124 | | – | | – | |
| Other creditors | 12 | | 7 | | – | | – | |
| Accruals and deferred income | 757 | | 744 | | 358 | | 453 | |
|
|
|
|
|
|
|
| |
| | 12,382 | | 12,975 | | 9,174 | | 9,271 | |
| |
Bank loans are repayable as follows:
| | Group | | Company | |
| |
| |
| 2005 | | 2004 | | 2005 | | 2004 | |
| £m | | £m | | £m | | £m | |
|
|
|
|
|
|
|
| |
| Repayable in more than one year but not more than two years | 1,182 | | 105 | | 6 | | 6 | |
| Repayable in more than two years but not more than five years | 28 | | 1,398 | | 10 | | 16 | |
| Repayable in more than five years | 21 | | 1 | | – | | 1 | |
|
|
|
|
|
|
|
| |
| | 1,231 | | 1,504 | | 16 | | 23 | |
| |
Back to Contents
Back to Consolidated Financial Statements Contents
Other loans are repayable as follows:
| | Group | | Company | |
| |
|
|
| |
|
|
| |
| | 2005 | | 2004 | | 2005 | | 2004 | |
| | £m | | £m | | £m | | £m | |
|
|
|
|
|
|
|
| |
| Repayable in more than one year but not more than two years | 1,561 | | 303 | | 1,319 | | – | |
| Repayable in more than two years but not more than five years | 4,863 | | 3,108 | | 4,017 | | 2,549 | |
| Repayable in more than five years | 3,845 | | 7,185 | | 3,464 | | 6,246 | |
|
|
|
|
|
|
|
| |
| | 10,269 | | 10,596 | | 8,800 | | 8,795 | |
|
|
|
|
|
|
|
| |
Other loans falling due after more than one year comprise bond issues by the Company, or its subsidiaries, analysed as follows:
| | Group | | Company | |
| |
|
|
| |
|
|
| |
| | 2005 | | 2004 | | 2005 | | 2004 | |
| | £m | | £m | | £m | | £m | |
|
|
|
|
|
|
|
| |
| 1.27% Japanese yen bond due 2005(1) | – | | 134 | | – | | – | |
| 1.93% Japanese yen bond due 2005(1) | – | | 135 | | – | | – | |
| 6.35% US dollar bond due 2005(1) | – | | 34 | | – | | – | |
| 0.83% Japanese yen bond due 2006 | 15 | | 16 | | 15 | | 16 | |
| 1.78% Japanese yen bond due 2006 | 126 | | 135 | | – | | – | |
| 5.4% Euro bond due 2006 | 275 | | 267 | | 275 | | 267 | |
| 5.75% Euro bond due 2006 | 1,029 | | 1,001 | | 1,029 | | 1,001 | |
| 7.5% US dollar bond due 2006 | 116 | | 121 | | – | | – | |
| 4.161% US dollar bond due 2007 | 79 | | 81 | | 79 | | 81 | |
| 2.575% Japanese yen bond due 2008 | 127 | | 136 | | – | | – | |
| 3.95% US dollar bond due 2008 | 264 | | 271 | | 264 | | 271 | |
| 4.625% Euro bond due 2008 | 517 | | 504 | | 517 | | 504 | |
| 5.5% Euro bond due 2008 | 33 | | 32 | | – | | – | |
| 6.25% Sterling bond due 2008 | 249 | | 249 | | 249 | | 249 | |
| 6.25% Sterling bond due 2008 | 158 | | 160 | | 158 | | 160 | |
| 6.65% US dollar bond due 2008 | 132 | | 135 | | – | | – | |
| 4.25% Euro bond due 2009 | 1,301 | | 1,266 | | 1,301 | | 1,266 | |
| 4.75% Euro bond due 2009 | 568 | | 548 | | – | | – | |
| 2.0% Japanese yen bond due 2010 | 128 | | 135 | | – | | – | |
| 2.28% Japanese yen bond due 2010 | 126 | | 133 | | – | | – | |
| 2.5% Japanese yen bond due 2010 | 127 | | 137 | | – | | – | |
| 7.75% US dollar bond due 2010 | 1,435 | | 1,473 | | 1,449 | | 1,487 | |
| 5.0% US dollar bond due 2013 | 526 | | 540 | | 526 | | 540 | |
| 5.125% Euro bond due 2015 | 342 | | 333 | | 342 | | 333 | |
| 5.375% US dollar bond due 2015 | 481 | | 495 | | 481 | | 495 | |
| 5.0% Euro bond due 2018 | 513 | | 499 | | 513 | | 499 | |
| 4.625% US dollar bond due 2018 | 263 | | 270 | | 263 | | 270 | |
| 5.625% Sterling bond due 2025 | 246 | | 246 | | 246 | | 246 | |
| 7.875% US dollar bond due 2030 | 390 | | 400 | | 390 | | 400 | |
| 5.9% Sterling bond due 2032 | 443 | | 443 | | 443 | | 443 | |
| 6.25% US dollar bond due 2032 | 260 | | 267 | | 260 | | 267 | |
|
|
|
|
|
|
|
| |
| | 10,269 | | 10,596 | | 8,800 | | 8,795 | |
|
|
|
|
|
|
|
| |
Finance leases falling due after more than one year are repayable as follows:
| | Group | | Company | |
| |
|
|
| |
|
|
| |
| | 2005 | | 2004 | | 2005 | | 2004 | |
| | £m | | £m | | £m | | £m | |
|
|
|
|
|
|
|
| |
| Repayable in more than one year but not more than two years | 2 | | 11 | | – | | – | |
| Repayable in more than two years but not more than five years | 4 | | 30 | | – | | – | |
| Repayable in more than five years | 107 | | 83 | | – | | – | |
|
|
|
|
|
|
|
| |
| | 113 | | 124 | | – | | – | |
|
|
|
|
|
|
|
| |
| Note: |
| (1) | Balances reclassified to creditors falling due within one year. |
Back to Contents
Back to Consolidated Financial Statements Contents
|
| Notes to the Consolidated Financial Statements continued |
|
|
| 19.Financial liabilities and assets |
| Net debt | | | | |
| | 2005 | | 2004 | |
| | £m | | £m | |
|
|
|
| |
| Liquid investments | (816 | ) | (4,381 | ) |
| Cash at bank and in hand | (2,850 | ) | (1,409 | ) |
| Debt due in one year or less, or on demand | 392 | | 2,054 | |
| Debt due after one year | 11,613 | | 12,224 | |
|
|
|
| |
| | 8,339 | | 8,488 | |
|
|
|
| |
| Maturity of financial liabilities | | | | |
| The maturity profile of the Group’s borrowings at 31 March was as follows: | | | | |
| | 2005 | | 2004 | |
| | £m | | £m | |
|
|
|
| |
| Within one year | 392 | | 2,054 | |
| Between one and two years | 2,745 | | 419 | |
| Between two and three years | 870 | | 2,837 | |
| Between three and four years | 711 | | 922 | |
| Between four and five years | 3,314 | | 776 | |
| Between five and six years | 390 | | 3,298 | |
| Between six and seven years | 8 | | 416 | |
| Between seven and eight years | 5 | | 11 | |
| Between eight and nine years | 526 | | 12 | |
| Between nine and ten years | 510 | | 553 | |
| Between ten and eleven years | 381 | | 509 | |
| Between eleven and twelve years | 36 | | 345 | |
| Between twelve and thirteen years | 2 | | – | |
| Between thirteen and fourteen years | 776 | | – | |
| Between fourteen and fifteen years | – | | 770 | |
| Between twenty and twenty one years | 246 | | – | |
| Between twenty one and twenty two years | – | | 246 | |
| Between twenty four and twenty five years | 390 | | – | |
| Between twenty five and twenty six years | – | | 400 | |
| Between twenty seven and twenty eight years | 703 | | – | |
| Between twenty eight and twenty nine years | – | | 710 | |
|
|
|
| |
| | 12,005 | | 14,278 | |
|
|
|
| |
| The maturities of the Group’s other financial liabilities at 31 March was as follows: | | | | |
| | | | | |
| In more than one year but not more than two years | 4 | | 7 | |
| In more than five years | 8 | | – | |
|
|
|
| |
| | 12 | | 7 | |
|
|
|
| |
Borrowing facilities
At 31 March 2005, the Group’s most significant committed borrowing facilities comprised two bank facilities of $5,525 million (£2,926 million) and $4,853 million (£2,570 million) expiring between two and five years and between one and two years, respectively (2004: two bank facilities of $5,547 million (£3,018 million) and $4,853 million (£2,641 million)), and a ¥225 billion (£1,112 million, 2004: £1,177 million) term credit facility, which expires between one and two years. The bank facilities remained undrawn throughout the year and the term credit facility was drawn down in full on 15 October 2002.
Under the terms and conditions of the $5,525 million and $4,853 million bank facilities, lenders have the right, but not the obligation, to cancel their commitment 30 days from the date of notification of a change of control of the Company and have outstanding advances repaid on the last day of the current interest period. The facility agreement provides for certain structural changes that do not affect the obligations of the Company to be specifically excluded from the definition of a change of control. This is in addition to the rights of lenders to cancel their commitment if the Company has committed an event of default. Substantially the same terms and conditions apply in the case of Vodafone Finance K.K.’s ¥225 billion term credit facility, although the change of control provision is applicable to any guarantor of borrowings under the term credit facility. As of 31 March 2005, the Company was the sole guarantor of the ¥225 billion term credit facility.
In addition to the above, certain of the Group’s subsidiaries had committed facilities at 31 March 2005 of £168 million (2004: £467 million) in aggregate, of which £77 million (2004: £134 million) was undrawn. Of the total committed facilities, £28 million (2004: £69 million) expires in less than one year, £100 million (2004: £398 million) expires between two and five years, and £40 million (2004: £nil) which expires in more than five years.
Back to Contents
Back to Consolidated Financial Statements Contents
Financial liabilities and assets
The Group uses short term foreign exchange instruments for managing both liquidity and the currency mix of Group net debt. The net position of the Group’s short term foreign exchange deals at 31 March 2005 is an asset, however, for the purpose of this note they are included within the financial liabilities section below as they are primarily used to manage the currency profile of the Group’s gross debt. Foreign exchange instruments hedging items other than borrowings are disclosed in the table. Short term debtors and creditors are not included in the analyses in this note or those in note 20.
Interest rate and currency of financial liabilities
| | | | | | | | | | | | | | | | | | Non-interest | |
| | | | | | | | | | | | | | | | | | bearing | |
| | | | | | | | | | | | | | Fixed rate financial | | financial | |
| | | | | | | | | | | | | | liabilities | | liabilities | |
| | | | | | | | | | | | | |
| | | |
| | | | | | Financial | | | | | | | | | | | | | |
| | | | | | liabilities | | | | | | Non- | | | | Weighted | | | |
| | | | | | net of | | Floating | | | | interest | | Weighted | | average | | Weighted | |
| | Gross | | Foreign | | foreign | | rate | | Fixed rate | | bearing | | average | | time for | | average | |
| | financial | | exchange | | exchange | | financial | | financial | | financial | | interest | | which rate | | period until | |
| | liabilities | | instruments | | instruments | | liabilities | | liabilities | | liabilities | | rate | | is fixed | | maturity | |
| Currency | £m | | £m | | £m | | £m | | £m | | £m | | % | | Years | | Years | |
|
|
|
|
|
|
|
|
|
|
|
|
|
|
|
|
|
| |
| At 31 March 2005: | | | | | | | | | | | | | | | | | | |
| Sterling | 1,104 | | (570 | ) | 534 | | 534 | | – | | – | | – | | – | | – | |
| Euro | 4,811 | | 1,487 | | 6,298 | | 5,314 | | 978 | | 6 | | 5.0 | | 11.6 | | 2.7 | |
| US dollar | 3,984 | | (2,703 | ) | 1,281 | | 1,281 | | – | | – | | – | | – | | – | |
| Japanese yen | 2,066 | | 1,913 | | 3,979 | | 3,973 | | – | | 6 | | – | | – | | 5.0 | |
| Other | 52 | | (155 | ) | (103 | ) | (103 | ) | – | | – | | – | | – | | – | |
|
|
|
|
|
|
|
|
|
|
|
|
|
|
|
|
|
| |
| Gross financial liabilities | 12,017 | | (28 | ) | 11,989 | | 10,999 | | 978 | | 12 | | 5.0 | | 11.6 | | 3.9 | |
|
|
|
|
|
|
|
|
|
|
|
|
|
|
|
|
|
| |
| At 31 March 2004: | | | | | | | | | | | | | | | | | | |
| Sterling | 1,110 | | (2,456 | ) | (1,346 | ) | (1,346 | ) | – | | – | | – | | – | | – | |
| Euro | 5,670 | | 1,553 | | 7,223 | | 5,282 | | 1,941 | | – | | 5.0 | | 6.4 | | – | |
| US dollar | 4,953 | | (1,487 | ) | 3,466 | | 2,608 | | 858 | | – | | 7.6 | | 0.9 | | – | |
| Japanese yen | 2,218 | | 2,618 | | 4,836 | | 4,798 | | 31 | | 7 | | 1.6 | | 0.7 | | 1.5 | |
| Other | 254 | | (148 | ) | 106 | | 106 | | – | | – | | – | | – | | – | |
|
|
|
|
|
|
|
|
|
|
|
|
|
|
|
|
|
| |
| Gross financial liabilities | 14,205 | | 80 | | 14,285 | | 11,448 | | 2,830 | | 7 | | 5.7 | | 4.7 | | 1.5 | |
|
|
|
|
|
|
|
|
|
|
|
|
|
|
|
|
|
| |
Interest on floating rate borrowings is based on national London Inter Bank Offered Rate equivalents or government bond rates in the relevant currencies.
The figures shown in the tables above take into account interest rate swaps used to manage the interest rate profile of financial liabilities.
Further protection from euro and Japanese yen interest rate movements on debt is provided by forward starting interest rate swaps (“IRS”). The Group has entered into euro denominated forward starting IRS which cover the period December 2005 to June 2007 for an amount equal to £1,511 million (2004: £1,471 million). The effective rate which has been fixed is equal to 3.54% per annum. The Group has entered into Japanese yen denominated forward starting IRS and interest rate futures which cover the period June 2005 to September 2005, September 2005 to December 2005, December 2005 to March 2006 and March 2006 to March 2007 for amounts equal to £3,075 million (2004: £3,256 million), £988 million (2004: £3,635 million), £988 million (2004: £1,046 million) and £3,755 million (2004: £3,975 million), respectively. The effective rates, which have been fixed, range from 0.329% per annum to 0.362% per annum.
Back to Contents
Back to Consolidated Financial Statements Contents
|
| Notes to the Consolidated Financial Statements continued |
|
| 19.Financial liabilities and assets continued |
| Financial assets |
| | | | | Non-interest bearing assets | |
| | | | |
| |
| Currency | Total
£m | | Floating
rate
financial
assets(1)
£m | | Equity
investments(2)
£m | | Other
non-interest
bearing
financial
assets
£m | |
|
|
|
|
|
|
|
| |
| At 31 March 2005: | | | | | | | | |
| Sterling | 2,389 | | 2,385 | | 4 | | – | |
| Euro | 309 | | 242 | | 18 | | 49 | |
| US dollar | 998 | | 989 | | 1 | | 8 | |
| Japanese yen | 117 | | 2 | | 10 | | 105 | |
| Other | 848 | | 52 | | 787 | | 9 | |
|
|
|
|
|
|
|
| |
| Gross financial assets | 4,661 | | 3,670 | | 820 | | 171 | |
|
|
|
|
|
|
|
| |
| At 31 March 2004: | | | | | | | | |
| Sterling | 268 | | 264 | | 4 | | – | |
| Euro | 2,299 | | 2,245 | | 9 | | 45 | |
| US dollar | 3,231 | | 3,219 | | 3 | | 9 | |
| Japanese yen | 242 | | 4 | | 144 | | 94 | |
| Other | 912 | | 95 | | 809 | | 8 | |
|
|
|
|
|
|
|
| |
| Gross financial assets | 6,952 | | 5,827 | | 969 | | 156 | |
|
|
|
|
|
|
|
| |
| Financial assets comprise: | | | | | | | | |
| | | | | | 2005
£m | | 2004
£m | |
|
|
|
|
|
|
|
| |
| | | | | | | | | |
| Cash at bank and in hand | | | | | 2,850 | | 1,409 | |
| Liquid investments(2) | | | | | 816 | | 4,381 | |
| Trade and other debtors due after more than one year | | | | | 171 | | 113 | |
| Fixed asset investments (other than associated undertakings)(3) | | | | | 852 | | 1,049 | |
|
|
|
|
|
|
|
| |
| | | | | | 4,689 | | 6,952 | |
|
|
|
|
|
|
|
| |
| | | | | | | | | |
| Notes: |
| (1) | Floating rate financial assets comprise cash and short term deposits of £3,126 million (2004: £3,802 million) and US dollar denominated commercial paper totalling £512 million (2004: £2,025 million), invested with counterparties having a single-A credit rating or above from at least two of Moody’s, Fitch Ratings and Standard & Poor’s. These ratings are used in determining the aggregate credit risk with each counterparty. |
| (2) | Liquid investments include the net position of the Group’s short term foreign exchange deals of £28 million at 31 March 2005. In the notes above, they are included within the financial liabilities section as they are primarily used to manage the currency profile of the Group’s gross debt. |
| (3) | Equity investments include £788 million (2004: £810 million) represented by listed investments. Listed equity investments denominated in currencies other than sterling include £786 million (2004: £809 million) denominated in Hong Kong dollars and £2 million (2004: £1 million) denominated in Japanese yen. |
Back to Contents
Back to Consolidated Financial Statements Contents
| 20.Financial instruments |
| Fair values of financial assets and liabilities |
The carrying amounts and estimated fair value of the Group’s outstanding financial instruments are set out below:
| | 2005
Net carrying
amount
£m | | 2005
Estimated fair
value
£m | | 2004
Net carrying
amount
£m | | 2004
Estimated fair
value
£m | |
|
|
|
|
|
|
|
| |
| Fixed asset investments (excluding investments in associated undertakings) | 852 | | 1,182 | | 1,049 | | 1,290 | |
| Cash at bank and in hand | 2,850 | | 2,850 | | 1,409 | | 1,409 | |
| Liquid investments | 788 | | 788 | | 4,381 | | 4,381 | |
| Borrowings: | | | | | | | | |
| Short term | (392 | ) | (390 | ) | (1,974 | ) | (2,034 | ) |
| Long term | (11,613 | ) | (12,023 | ) | (12,224 | ) | (13,029 | ) |
| Derivative financial instruments: | | | | | | | | |
| Interest rate | – | | 120 | | – | | 343 | |
| Foreign exchange | 28 | | 28 | | (80 | ) | (80 | ) |
The Group’s exposure to market risk, which is the sensitivity of the value of financial instruments to changes in related currency and interest rates, is minimised because gains and losses on the underlying assets and liabilities offset gains and losses on derivative financial instruments.
The following methods and assumptions were used to estimate the fair values shown above.
Fixed asset investments (excluding investments in joint ventures and associated undertakings) – The net book value of fixed asset investments at 31 March 2005 comprises investments recorded at an original cost of £1,803 million (2004: £2,079 million). Listed investments are stated at fair value based on their quoted share price at 31 March 2005.
Cash at bank and in hand and liquid investments – The carrying values of cash and liquid investments approximate to their fair values because of the short term maturity of these instruments.
Borrowings (excluding foreign exchange contracts) – The fair value of quoted long term borrowings is based on year end mid-market quoted prices. The book values stated above exclude accrued interest on borrowings which is recorded separately on the balance sheet within accruals and deferred income. The fair value of other borrowings is estimated by discounting the future cash flows to net present values using appropriate market interest and foreign currency rates prevailing at the year end.
Foreign exchange contracts, interest rate swaps and futures – The Group enters into foreign exchange contracts, interest rate swaps and futures in order to manage its foreign currency and interest rate exposure. The book values stated above exclude accrued interest which is recorded separately in the balance sheet. The fair value of these financial instruments was estimated by discounting the future cash flows to net present values using appropriate market interest and foreign currency rates prevailing at the year end.
Hedges
The Group’s policy is to use derivative instruments to hedge against exposure to movements in interest rates and exchange rates. Changes in the fair value of instruments used for hedging are not recognised in the financial statements until the hedged exposure is itself recognised. Unrecognised gains and losses on instruments used for hedging are set out below:
| | Gains
£m | | Losses
£m | | Total net
gains/(losses)
£m | |
|
|
|
|
|
| |
| Unrecognised gains and losses on hedges at 1 April 2004 | 423 | | (80 | ) | 343 | |
| Less: gains and losses arising in previous years that were recognised in the year | (91 | ) | 23 | | (68 | ) |
|
|
|
|
|
| |
| Gains and losses arising before 1 April 2004 that were not recognised at 31 March 2005 | 332 | | (57 | ) | 275 | |
| Gains and losses arising in the year that were not recognised at 31 March 2005 | (96 | ) | (59 | ) | (155 | ) |
|
|
|
|
|
| |
| Unrecognised gains and losses on hedges at 31 March 2005 | 236 | | (116 | ) | 120 | |
|
|
|
|
|
| |
| Of which: | | | | | | |
| Gains and losses expected to be recognised in the year ending 31 March 2006 | 64 | | (28 | ) | 36 | |
|
|
|
|
|
| |
In addition to the amounts disclosed above, cumulative aggregate gains of £453 million in respect of terminated interest rate swaps were carried forward in the balance sheet at 31 March 2005 pending their recognition in the profit and loss account (2004: £607 million). Of these carried forward amounts, gains of £91 million are expected to be recognised in the profit and loss account in the 2006 financial year. Aggregate related gains of £154 million from previous years were recognised in the profit and loss account in the 2005 financial year (2004: £90 million).
Currency exposures
Taking into account the effect of forward contracts and other derivative instruments, the Group did not have any material financial exposure to foreign exchange gains or losses on monetary assets and monetary liabilities denominated in foreign currencies at 31 March 2005.
Back to Contents
Back to Consolidated Financial Statements Contents
|
| Notes to the Consolidated Financial Statements continued |
|
| 21.Provisions for liabilities and charges |
| | Deferred
taxation
£m | | Post
employment
benefits
£m | | Other
provisions
£m | | Total
£m | |
|
|
|
|
|
|
|
| |
| 1 April 2004 | 3,608 | | 68 | | 521 | | 4,197 | |
| Exchange movements | (2 | ) | – | | 6 | | 4 | |
| Profit and loss account | 332 | | 54 | | 68 | | 454 | |
| Utilised in the year – payments | – | | (45 | ) | (141 | ) | (186 | ) |
| Other | – | | 26 | | 57 | | 83 | |
|
|
|
|
|
|
|
| |
| 31 March 2005 | 3,938 | | 103 | | 511 | | 4,552 | |
|
|
|
|
|
|
|
| |
Deferred taxation
The Group’s deferred tax charge of £332 million (2004: £744 million) in respect of deferred tax liabilities excludes a charge to the profit and loss account of £25 million (2004: £47 million) relating to associated undertakings and a credit to the profit and loss account of £604 million (2004: £49 million) relating to deferred tax assets. Therefore the net deferred tax credit is £247 million (2004 charge: £742 million or £736 million before exceptional items).
At 31 March 2005:
| | Gross
deferred tax
asset
£m | | Gross
deferred tax
liability
£m | | Net deferred
tax (asset)/
liability
£m | | Less:
amounts
unprovided
£m | | Net deferred
tax (asset)/
liability
£m | |
|
|
|
|
|
|
|
|
|
| |
| Fixed asset timing differences | (227 | ) | 1,704 | | 1,477 | | (10 | ) | 1,467 | |
| Deferred tax on overseas earnings | – | | 1,747 | | 1,747 | | – | | 1,747 | |
| Other short term timing differences | (718 | ) | 745 | | 27 | | – | | 27 | |
| Unrelieved tax losses | (11,257 | ) | – | | (11,257 | ) | 10,413 | | (844 | ) |
|
|
|
|
|
|
|
|
|
| |
| | (12,202 | ) | 4,196 | | (8,006 | ) | 10,403 | | 2,397 | |
|
|
|
|
|
|
|
|
|
| |
| Analysed, after offset, as: | | | | | | | | | | |
| Deferred tax asset (note 15) | | | | | | | | | (1,541 | ) |
| Deferred tax provision | | | | | | | | | 3,938 | |
|
|
|
|
|
|
|
|
|
| |
| | | | | | | | | | 2,397 | |
|
|
|
|
|
|
|
|
|
| |
| At 31 March 2004: | | | | | | | | | | |
| | Gross
deferred tax
asset
£m | | Gross
deferred tax
liability
£m | | Net deferred
tax (asset)/
liability
£m | | Less:
amounts
unprovided
£m | | Net deferred
tax (asset)/
liability
£m | |
|
|
|
|
|
|
|
|
|
| |
| Fixed asset timing differences | (192 | ) | 1,848 | | 1,656 | | (4 | ) | 1,652 | |
| Deferred tax on overseas earnings | – | | 1,425 | | 1,425 | | – | | 1,425 | |
| Other short term timing differences | (812 | ) | 662 | | (150 | ) | 118 | | (32 | ) |
| Unrelieved tax losses | (11,420 | ) | – | | (11,420 | ) | 11,018 | | (402 | ) |
|
|
|
|
|
|
|
|
|
| |
| | (12,424 | ) | 3,935 | | (8,489 | ) | 11,132 | | 2,643 | |
|
|
|
|
|
|
|
|
|
| |
| Analysed, after offset, as: | | | | | | | | | | |
| Deferred tax asset (note 15) | | | | | | | | | (965 | ) |
| Deferred tax provision | | | | | | | | | 3,608 | |
|
|
|
|
|
|
|
|
|
| |
| | | | | | | | | | 2,643 | |
|
|
|
|
|
|
|
|
|
| |
A deferred tax asset has not been recognised in respect of unrelieved tax losses of £10,413 million (2004: £11,018 million) as it is regarded as more likely than not that there will not be suitable taxable profits against which the reversal of the underlying timing differences can be deducted.
The potential net tax benefit in respect of all tax losses carried forward at 31 March 2005, including amounts both recognised and unrecognised for deferred tax purposes, was £610 million in UK subsidiaries (2004: £50 million) and £10,647 million in international subsidiaries (2004: £11,370 million). These losses are only available for offset against future profits (or in some circumstances capital gains) arising within these companies subject to the laws of the relevant jurisdiction. The Group’s share of losses of international associated undertakings that are available for offset against future trading profits in these entities is £123 million (2004: £nil).
Details of the Company’s deferred tax asset are included in note 15.
Other provisions
Other provisions primarily comprise amounts provided for legal claims, decommissioning costs and restructuring costs. The associated cash outflows for restructuring costs are substantially short term in nature. For decommissioning costs, the associated cash outflows are generally expected to occur at the dates of exit of the assets to which they relate, which are long term in nature. The timing of cash outflows associated with legal claims cannot be reasonably determined.
Back to Contents
Back to Consolidated Financial Statements Contents
| 22.Called up share capital |
| | |
| | 2005 | | 2004 | |
| |
| |
| |
| | Number | | £m | | Number | | £m | |
|
|
|
|
|
|
|
| |
| Authorised: | | | | | | | | |
| Ordinary shares of $0.10 each | 78,000,000,000 | | 4,875 | | 78,000,000,000 | | 4,875 | |
| 7% cumulative fixed rate shares of £1 each | 50,000 | | – | | 50,000 | | – | |
|
|
|
|
|
|
|
| |
| | 78,000,050,000 | | 4,875 | | 78,000,050,000 | | 4,875 | |
|
|
|
|
|
|
|
| |
| Allotted, issued and fully paid: | | | | | | | | |
| Ordinary shares of $0.10 each(1): | | | | | | | | |
| 1 April | 68,263,933,048 | | 4,280 | | 68,179,382,971 | | 4,275 | |
| During the year | 116,933,491 | | 6 | | 84,550,077 | | 5 | |
|
|
|
|
|
|
|
| |
| 31 March | 68,380,866,539 | | 4,286 | | 68,263,933,048 | | 4,280 | |
|
|
|
|
|
|
|
| |
| 7% cumulative fixed rate shares of £1 each: | 50,000 | | – | | 50,000 | | – | |
|
|
|
|
|
|
|
| |
| 31 March | 68,380,916,539 | | 4,286 | | 68,263,983,048 | | 4,280 | |
|
|
|
|
|
|
|
| |
| Note: |
| (1) | At 31 March 2005 the Company held 3,785,000,000 (2004: 800,000,000; 2003: nil) treasury shares with a nominal value of £205 million (2004: £44 million; 2003: £nil). |
Allotted during the year
| | | | Nominal | | | |
| | Number | | value | | Proceeds | |
| | | | £m | | £m | |
|
|
|
|
|
| |
| UK share awards and option scheme awards | 64,931,201 | | 3 | | 82 | |
| US share awards and option scheme awards | 52,002,290 | | 3 | | 54 | |
|
|
|
|
|
| |
| Total for share option scheme awards | 116,933,491 | | 6 | | 136 | |
|
|
|
|
|
| |
Share plans
The Company currently uses a number of share plans to grant options and awards to its directors and employees.
Sharesave Scheme
The Vodafone Group 1998 Sharesave Scheme (the “Sharesave Scheme”) enables UK staff to acquire shares in the Company through monthly savings of up to £250 a year over a three or five year period, at the end of which they also receive a tax free bonus. The savings and bonus may then be used to purchase shares at the option price, which is set at the beginning of the savings contract and usually at a discount of 20% to the then prevailing market price of the Company’s shares. Invitations to participate in this scheme are usually made annually.
Discretionary share option plans
The Company has two discretionary share option plans, the Vodafone Group 1998 Company Share Option Scheme (which is UK Inland Revenue approved) and the Vodafone Group 1998 Executive Share Option Scheme (which is unapproved). Options under the discretionary schemes are subject to performance conditions. Options are normally exercisable between three and ten years from the date of grant.
Long Term Stock Incentive Plan
The Vodafone Group Plc 1999 Long Term Stock Incentive Plan is a discretionary plan under which both share option grants and share awards may be made. For some grants to US employees, the options have phased vesting over a four year period and are exercisable in respect of ADSs. For all other grants, options are normally exercisable between three and ten years from the date of grant, subject to the satisfaction of predetermined performance conditions, and are exercisable in respect of ordinary shares listed on the London Stock Exchange or ADSs for US employees.
In addition to the above, all permanent employees at 1 April 2004 received an award of 350 shares (known as “AllShares”) in Vodafone Group Plc on 5 July 2004, under the Vodafone Group Plc Global All Employee Share Plan. The awards vest after two years and are not subject to performance conditions.
Share option plans belonging to subsidiaries
Share option schemes are also operated by certain of the Group’s subsidiary and associated undertakings, under which options are only issued to key personnel.
Share Incentive Plan
The Share Incentive Plan enables UK staff to acquire shares in the Company through monthly purchases of up to £125 per month or 5% of salary, whichever is lower. For each share purchased by the employee, the Company provides a free matching share.
Back to Contents
Back to Consolidated Financial Statements Contents
|
| Notes to the Consolidated Financial Statements continued |
|
| 22.Called up share capital continued |
Restricted Share Plans
Under the Vodafone Group Short Term Incentive Plan, introduced in 1998, shares are conditionally awarded to directors(1) based on achievement of one year performance targets. Release of the shares is deferred for a further two years and is subject to continued employment. Additional shares are released at this time if a further performance condition has been satisfied over the two year period.
Under the Vodafone Long Term Incentive Plan and the Vodafone Group Plc 1999 Long Term Stock Incentive Plan referred to above, awards of performance shares are granted to directors(1) and certain employees. The release of these shares is conditional upon achievement of performance targets measured over a three year period.
Under these restricted share plans, the maximum aggregate number of ordinary shares which may be issued in respect of options or awards will not (without shareholder approval) exceed:
| • | 10% of the ordinary share capital of the Company in issue immediately prior to the date of grant, when aggregated with the total number of ordinary shares which have been allocated in the preceding ten year period under all plans; and |
| • | 5% of the ordinary share capital of the Company in issue immediately prior to the date of grant, when aggregated with the total number of ordinary shares which have been allocated in the preceding ten year period under all plans other than the Sharesave Scheme. |
| | |
| Note: |
| (1) | The term “directors” here refers to directors of the Company and directors of the Group’s subsidiaries. |
Share options
A summary of the options outstanding at 31 March 2005 to subscribe for shares in the Company is provided in the following table.
| | | | Weighted | | | | | | | | | |
| | | | average | | | | | | | | Exercisable | |
| | Total | | period | | Weighted | | | | | | shares | |
| | shares | | remaining | | average | | Weighted | | Exercisable | | weighted | |
| | under | | to full | | remaining | | average | | shares at | | average | |
| | option | | vesting | | contractual life | | exercise | | 31 March 2005 | | exercise | |
| Range of exercise prices | (millions) | | (months) | | (months) | | price | | (millions) | | price | |
|
|
|
|
|
|
|
|
|
|
|
| |
| Ordinary shares: | | | | | | | | | | | | |
| Vodafone Group Savings Related and Sharesave Schemes | | | | | | | | | | | | |
| £0.01 – £1.00 | 39.9 | | 20 | | 26 | | £0.79 | | 1.1 | | £0.76 | |
| £1.01 – £2.00 | 0.8 | | 16 | | 23 | | £1.27 | | 0.1 | | £1.27 | |
| £2.01 – £3.00 | 0.2 | | 5 | | 11 | | £2.25 | | – | | £2.19 | |
|
|
|
|
|
|
|
|
|
|
|
| |
| | 40.9 | | | | | | | | 1.2 | | | |
|
|
|
|
|
|
|
|
|
|
|
| |
| Vodafone Group Executive Schemes | | | | | | | | | | | | |
| £0.01 – £1.00 | 50.6 | | 3 | | 85 | | £0.89 | | 8.5 | | £0.85 | |
| £1.01 – £2.00 | 64.2 | | – | | 56 | | £1.56 | | 64.2 | | £1.56 | |
| £2.01 – £3.00 | 40.3 | | – | | 61 | | £2.75 | | 40.3 | | £2.75 | |
|
|
|
|
|
|
|
|
|
|
|
| |
| | 155.1 | | | | | | | | 113.0 | | | |
|
|
|
|
|
|
|
|
|
|
|
| |
| Vodafone Group 1999 Long Term Stock Incentive Plan | | | | | | | | | | | | |
| £0.01 – £1.00 | 462.3 | | 3 | | 87 | | £0.91 | | 27.4 | | £0.90 | |
| £1.01 – £2.00 | 423.2 | | 9 | | 89 | | £1.38 | | 189.9 | | £1.55 | |
| £2.01 – £3.00 | 15.8 | | – | | 3 | | £2.92 | | 5.8 | | £2.92 | |
|
|
|
|
|
|
|
|
|
|
|
| |
| | 901.3 | | | | | | | | 223.1 | | | |
|
|
|
|
|
|
|
|
|
|
|
| |
| Vodafone Netherlands options | | | | | | | | | | | | |
| £0.01 – £1.00 | 9.5 | | 3 | | 27 | | £0.73 | | – | | – | |
| £1.01 – £2.00 | 11.9 | | – | | 8 | | £1.43 | | 11.9 | | £1.43 | |
| £2.01 – £3.00 | – | | – | | – | | – | | – | | – | |
|
|
|
|
|
|
|
|
|
|
|
| |
| | 21.4 | | | | | | | | 11.9 | | | |
|
|
|
|
|
|
|
|
|
|
|
| |
| Vodafone Pacific options (Australia) | | | | | | | | | | | | |
| AUD 0.01 – AUD 10.00 | 2.4 | | – | | 71 | | AUD 4.85 | | 2.4 | | AUD 4.85 | |
|
|
|
|
|
|
|
|
|
|
|
| |
| Vodafone Pacific options (New Zealand) | | | | | | | | | | | | |
| NZD 0.01 – NZD 10.00 | 1.5 | | – | | 74 | | NZD 5.64 | | 1.5 | | NZD 5.64 | |
|
|
|
|
|
|
|
|
|
|
|
| |
Back to Contents
Back to Consolidated Financial Statements Contents
Following the merger with AirTouch, some rights to acquire AirTouch Communications, Inc. 1993 Long Term Stock Incentive Plan options were converted into rights to acquire shares in the Company. No further awards will be granted under this scheme.
| | | | Weighted | | | | | | | | | |
| | | | average | | | | | | | | Exercisable | |
| | Total | | period | | Weighted | | | | | | ADSs | |
| | ADSs | | remaining | | average | | Weighted | | Exercisable | | weighted | |
| | under | | to full | | remaining | | average | | ADSs at | | average | |
| | option | | vesting | | contractual life | | exercise | | 31 March 2004 | | exercise | |
| Range of exercise prices | (millions) | | (months) | | (months) | | price | | (millions) | | price | |
|
|
|
|
|
|
|
|
|
|
|
| |
| American Depositary Shares: | | | | | | | | | | | | |
| AirTouch Communications, Inc.1993 Long Term Stock Incentive Plan | | | | | | | | | | | | |
| $0.01 – $10.00 | 0.4 | | – | | 21 | | $6.10 | | 0.4 | | $6.10 | |
| $10.01 – $20.00 | 0.4 | | – | | 3 | | $16.61 | | 0.4 | | $16.61 | |
| $20.01 – $30.00 | 0.1 | | – | | 4 | | $20.02 | | 0.1 | | $20.02 | |
| $30.01 – $40.00 | 0.1 | | – | | 12 | | $34.05 | | 0.1 | | $34.05 | |
|
|
|
|
|
|
|
|
|
|
|
| |
| | 1.0 | | | | | | | | 1.0 | | | |
|
|
|
|
|
|
|
|
|
|
|
| |
| Vodafone Group 1999 Long Term Stock Incentive Plan | | | | | | | | | | | | |
| $10.01 – $20.00 | 3.5 | | 15 | | 88 | | $13.98 | | 1.8 | | $13.70 | |
| $20.01 – $30.00 | 3.6 | | 3 | | 87 | | $21.66 | | 1.8 | | $22.35 | |
| $30.01 – $40.00 | 0.1 | | – | | 68 | | $36.12 | | 0.1 | | $36.12 | |
| $40.01 – $50.00 | 2.9 | | – | | 54 | | $42.18 | | 2.8 | | $42.18 | |
| $50.01 – $60.00 | 0.1 | | – | | 84 | | $58.60 | | 0.1 | | $58.60 | |
|
|
|
|
|
|
|
|
|
|
|
| |
| | 10.2 | | | | | | | | 6.6 | | | |
|
|
|
|
|
|
|
|
|
|
|
| |
Share awards
A summary of unvested share awards at 31 March 2005 are provided in the following table.
| | | | Weighted | |
| | Total | | average period | |
| | unvested | | remaining to | |
| | awards | | full vesting | |
| | (millions)(1) | | (months) | |
|
|
|
| |
| All Shares | 18.5 | | 15 | |
| Performance Shares | 103.4 | | 21 | |
|
|
|
| |
| | 121.9 | | | |
|
|
|
| |
| Note: |
| (1) | Total unvested awards are stated on the basis of ordinary shares. Awards may be issued as ordinary shares or the equivalent number of ADSs. |
Back to Contents
Back to Consolidated Financial Statements Contents
|
| Notes to the Consolidated Financial Statements continued |
|
| | Group | | Company | |
| |
| |
| Share | | | | Own | | Profit | | Share | | | | Own | | Profit | |
| premium | Other | shares | and loss | premium | Other | shares | and loss |
| account | reserve | held | account | account | reserve | held | account |
| £m | £m | £m | £m | £m | £m | £m | £m |
|
|
|
|
|
|
|
|
|
|
|
|
|
|
|
| |
| 1 April 2004 | 52,154 | | 713 | | (1,136 | ) | (43,014 | ) | 52,154 | | 713 | | (1,088 | ) | 10,760 | |
| Allotments of shares | 130 | | – | | – | | – | | 130 | | – | | – | | – | |
| Purchase of treasury shares | – | | – | | (3,997 | ) | – | | – | | – | | (3,997 | ) | – | |
| Own shares released on vesting of share awards | – | | – | | 12 | | – | | – | | – | | – | | – | |
| Retained (loss)/profit for the financial year | – | | – | | – | | (10,198 | ) | – | | – | | – | | 8,148 | |
| Currency translation | – | | – | | – | | 1,467 | | – | | – | | – | | – | |
| Transfer to profit and loss account | – | | (84 | ) | – | | 84 | | – | | (84 | ) | – | | 84 | |
| Other movements | – | | – | | – | | (27 | ) | – | | – | | – | | – | |
|
|
|
|
|
|
|
|
|
|
|
|
|
|
|
| |
| 31 March 2005 | 52,284 | | 629 | | (5,121 | ) | (51,688 | ) | 52,284 | | 629 | | (5,085 | ) | 18,992 | |
|
|
|
|
|
|
|
|
|
|
|
|
|
|
|
| |
In accordance with the exemption allowed by section 230 of the Companies Act, no profit and loss account has been presented by the Company. The profit for the financial year dealt with in the accounts of the Company is £10,806 million (2004: £3,684 million). Under English law, the amount available for distribution to shareholders is based upon the profit and loss reserve of the Company and is reduced by the amount of own shares held.
The currency translation movement includes a gain of £143 million (2004: £144 million gain) in respect of foreign currency net borrowings.
For acquisitions prior to 1 April 1998, the cumulative goodwill written off to reserves, net of the goodwill attributed to business disposals, was £1,190 million at 31 March 2005 (2004: £1,190 million).
The following shares in the Company are held:
| | Group | | Company | |
|
|
| Employee | | Subsidiary | | | | | |
| Share Trust | companies | Treasury shares | Total | Treasury shares |
|
|
|
|
|
|
|
|
|
| |
| At 1 April 2004 | 29,439,475 | | 7,189,316 | | 800,000,000 | | 836,628,791 | | 800,000,000 | |
| Purchased during the year | – | | – | | 2,985,000,000 | | 2,985,000,000 | | 2,985,000,000 | |
| Dividend shares | 367,717 | | – | | – | | 367,717 | | – | |
| Distributed during the year | (7,727,075 | ) | (35,835 | ) | – | | (7,762,910 | ) | – | |
|
|
|
|
|
|
|
|
|
| |
| At 31 March 2005 | 22,080,117 | | 7,153,481 | | 3,785,000,000 | | 3,814,233,598 | | 3,785,000,000 | |
|
|
|
|
|
|
|
|
|
| |
| Total cost to Group of shares held (£m) | 23 | | 13 | | 5,085 | | 5,121 | | 5,085 | |
|
|
|
|
|
|
|
|
|
| |
| Market value of shares held (£m) | 31 | | 10 | | 5,318 | | 5,359 | | 5,318 | |
|
|
|
|
|
|
|
|
|
| |
Back to Contents
Back to Consolidated Financial Statements Contents
The shares held by the Vodafone Group Employee Trust are to satisfy the potential award of shares under the Group’s Long Term Incentive Plan and Short Term Incentive Plan. The shares held by subsidiary companies are in respect of an employee share option plan. Treasury shares are held in relation to the share purchase programme described in “Operating and Financial Review and Prospects – Liquidity and Capital Resources”. Details of all shares purchased in the year are shown below:
| | | | | | Total number of shares | | Maximum value of | |
| | Average price paid per | purchased under publicly | shares that may be |
| Total number of shares | share, inclusive of | announced share | purchased under the |
| Period | purchased | transaction costs (pence) | repurchase programme | (2) | programme (£m) | (1) |
|
|
|
|
|
|
|
| |
| 27 – 31 May 2004 | 46,000,000 | | 129.97 | | 46,000,000 | | 2,940 | |
| 1 – 30 June 2004 | 515,000,000 | | 125.49 | | 515,000,000 | | 2,294 | |
| 1 – 31 July 2004 | 246,000,000 | | 119.75 | | 246,000,000 | | 1,999 | |
| 1 – 31 August 2004 | 284,000,000 | | 124.07 | | 284,000,000 | | 1,647 | |
| 1 – 30 September 2004 | 305,100,000 | | 130.46 | | 305,100,000 | | 1,249 | |
| 16 – 30 November 2004 | 217,900,000 | | 145.35 | | 217,900,000 | | 1,932 | |
| 1 – 31 December 2004 | 393,200,000 | | 142.45 | | 393,200,000 | | 1,372 | |
| 1 – 31 January 2005 | 427,800,000 | | 140.66 | | 427,800,000 | | 770 | |
| 1 – 28 February 2005 | 282,500,000 | | 139.52 | | 282,500,000 | | 376 | |
| 1 – 31 March 2005 | 267,500,000 | | 140.58 | | 267,500,000 | | – | |
|
|
|
|
|
|
|
| |
| Total for year ended | | | | | | | | |
| 31 March 2005 | 2,985,000,000 | | 134.00 | | 2,985,000,000 | | – | |
|
|
|
|
|
|
|
| |
| 1 – 30 April 2005 | 321,000,000 | | 139.33 | | 321,000,000 | | 4,053 | |
| 1 – 12 May 2005 | 84,500,000 | | 139.00 | | 84,500,000 | | 3,935 | |
|
|
|
|
|
|
|
| |
| Note: | | | | | | | | |
| (1) | On 25 May 2004, the Company announced it was allocating £3.0 billion to the share purchase programme to cover the year to May 2005. This superseded the £2.5 billion announced on the set up of the programme in November 2003. On 16 November 2004, the Company announced that it was increasing the allocation to around £4 billion completing by March 2005. On 24 May 2005, the Company announced target purchases of £4.5 billion for the 2006 financial year, including those purchased between 1 April 2005 and 23 May 2005 under irrevocable purchase instructions. Shares have been repurchased in accordance with the approval given by shareholders at the AGM on 30 July 2003 (maximum of 6,800,000,000 shares), which expired on 27 July 2004, and 27 July 2004 (maximum of 6,600,000,000 shares), which expires on 26 July 2005. Shareholder approval will be sought at the AGM on 26 July 2005 for additional shares to be purchased in the 2006 financial year. |
| (2) | No shares were purchased outside the publicly announced share repurchase programme. |
| | |
|
| 24.Non-equity minority interests |
| | |
| | 2005 | | 2004 | |
| | £m | | £m | |
|
|
|
| |
| Preferred shares | 853 | | 875 | |
|
|
|
| |
|
Non-equity minority interests comprise class D and E preferred shares issued by Vodafone Americas, Inc. An annual dividend of $51.43 per class D and E preferred share is payable quarterly in arrears. The dividend for the year amounted to £46 million (2004: £50 million). The aggregate redemption value of the class D and E preferred shares is $1.65 billion. The holders of the preferred shares are entitled to vote on the election of directors and upon each other matter coming before any meeting of the shareholders on which the holders of ordinary shares are entitled to vote. Holders are entitled to vote on the basis of twelve votes for each share of class D or E preferred stock held. The maturity date of the 825,000 class D preferred shares is 6 April 2020. The 825,000 class E preferred shares have a maturity date of 1 April 2020. The class D and E preferred shares have a redemption price of $1,000 per share plus all accrued and unpaid dividends.
Back to Contents
Back to Consolidated Financial Statements Contents
|
| Notes to the Consolidated Financial Statements continued |
|
| 25.Acquisitions and disposals |
The Group has undertaken a number of transactions during the year, including the acquisition of additional minority stakes in certain existing subsidiary undertakings. The aggregate consideration and total cash outflow for all acquisitions was £2,461 million.
Under UK GAAP, the total goodwill capitalised in respect of transactions has been assessed as £1,762 million, including £5 million in relation to associated undertakings.
Acquisition of additional minority stakes in certain existing subsidiary undertakings
During the year ended 31 March 2005, the Company has directly or indirectly increased its interest in its subsidiary undertakings in Japan, Hungary and Greece. These transactions are in line with the Group’s strategy of increasing its shareholding in existing operations where opportunities arise for the creation of enhanced value for the Company’s shareholders.
| | | | Fair value net | | | |
| | assets | | Goodwill | |
| Consideration | | acquired | (1) | capitalised | |
| £m | | £m | | £m | |
|
|
|
|
|
| |
| Vodafone Japan(2) | 2,380 | | 690 | | 1,690 | |
| Vodafone Hungary(3)(4) | 55 | | 12 | | 43 | |
| Vodafone Greece(3) | 10 | | 3 | | 7 | |
|
|
|
|
|
| |
| | 2,445 | | 705 | | 1,740 | |
|
|
|
|
|
| |
| Notes: | | | | | | |
| (1) | No adjustments were made for fair values as compared with book values at acquisition. |
| (2) | In the first half of the year, the Group increased its effective shareholding in Vodafone K.K. from 69.7% to 98.2% and its stake in Vodafone Holdings K.K. from 66.7% to 96.1% for a total consideration of £2.4 billion. On 1 October 2004, the merger of Vodafone K.K. and Vodafone Holdings K.K. was completed, resulting in the Group holding a 97.7% stake in the merged company, Vodafone K.K. |
| (3) | As a result of these acquisitions, the Group’s interest in Vodafone Greece and Vodafone Hungary increased from 99.4% to 99.8% and from 87.9% to 100% respectively. |
| (4) | Additional equity of HUF 89,301 million (£248 million) was subscribed for in Vodafone Hungary prior to this transaction. |
As described in note 26 “Commitments”, the Group has entered into an agreement with Telesystem International Wireless Inc. of Canada to acquire approximately 79% of the share capital of MobiFon S.A. in Romania, and 100% of the issued share capital of Oskar Mobil a.s. in the Czech Republic.
Disposals
In January 2005, the Group disposed of a 16.9% stake in Vodafone Egypt for cash consideration of £65 million, reducing the Group’s controlling stake to 50.1%.
|
| 26.Commitments |
| Operating lease commitments |
Commitments to non-cancellable operating lease payments are analysed as follows:
| | 2005 | | 2004 | |
|
| |
Land and | | Other | | | Land and | | Other | | |
buildings | assets | Total | buildings | assets | Total |
£m | £m | £m | £m | £m | £m |
|
|
|
|
|
|
|
|
|
|
|
| |
| In respect of leases expiring: | | | | | | | | | | | | |
| Within one year | 99 | | 91 | | 190 | | 79 | | 97 | | 176 | |
| Between two and five years | 146 | | 91 | | 237 | | 147 | | 85 | | 232 | |
| After five years | 170 | | 33 | | 203 | | 136 | | 42 | | 178 | |
|
|
|
|
|
|
|
|
|
|
|
| |
| Payments due: | | | | | | | | | | | | |
| Within one year | 415 | | 215 | | 630 | | 362 | | 224 | | 586 | |
| In more than one year but less than two years | | | | | 406 | | | | | | 366 | |
| In more than two years but less than three years | | | | | 352 | | | | | | 295 | |
| In more than three years but less than four years | | | | | 299 | | | | | | 256 | |
| In more than four years but less than five years | | | | | 255 | | | | | | 218 | |
| Thereafter (more than five years) | | | | | 1,132 | | | | | | 1,016 | |
|
|
|
|
|
|
|
|
|
|
|
| |
| | | | | | 3,074 | | | | | | 2,737 | |
|
|
|
|
|
|
|
|
|
|
|
| |
Finance lease commitments
Details of commitments under finance leases are included in notes 17 and 18.
Back to Contents
Back to Consolidated Financial Statements Contents
| Capital and other commitments | | | | |
| | 2005
£m | | 2004
£m | |
|
|
|
| |
| Tangible and intangible fixed asset expenditure contracted for but not provided | 749 | | 866 | |
| Purchase commitments | 1,242 | | 957 | |
| Share purchase programme | 565 | | – | |
| Purchase of Mobifon and Oskar | 1,858 | | – | |
|
|
|
| |
| | 4,414 | | 1,823 | |
|
|
|
| |
On 15 March 2005, the Group announced it had entered into agreements with Telesystem International Wireless Inc. (“TIW”) of Canada to acquire approximately 79% of the share capital of MobiFon S.A. (“MobiFon”) in Romania, increasing the Group’s ownership of MobiFon to approximately 99%, and 100% of the issued share capital of Oskar Mobil a.s. in the Czech Republic for cash consideration of approximately $3.5 billion (£1.9 billion) to be satisfied from the Group’s cash resources. In addition, the Group will be assuming approximately $0.9 billion (£0.5 billion) of net debt. The acquisition is conditional on TIW shareholder approval, the receipt of all necessary unconditional regulatory and Canadian Court approvals and certain customary conditions and is expected to complete by the end of June 2005.
|
|
| 27.Contingent liabilities |
| | Group | | Company | |
| |
| |
| |
| | 2005
£m | | 2004
£m | | 2005
£m | | 2004
£m | |
|
|
|
|
|
|
|
| |
| Performance bonds | 382 | | 667 | | 176 | | 200 | |
| Credit guarantees – third party indebtedness | 67 | | 97 | | 1,424 | | 1,498 | |
| Other guarantees and contingent liabilities | 18 | | 29 | | 1 | | 17 | |
Performance bonds
Performance bonds require the Company, or certain of its subsidiary undertakings, to make payments to third parties in the event that the Company or subsidiary undertaking does not perform what is expected of it under the terms of any related contracts.
Group performance bonds include £189 million (2004: £434 million) in respect of undertakings to roll out 2G and 3G networks in Germany while the Company and Group performance bonds include £149 million (2004: £145 million) in respect of undertakings to roll out 3G networks in Spain. The majority of the German performance bonds expire by December 2005 and for Spain by November 2009.
Credit guarantees – third party indebtedness
Credit guarantees comprise guarantees and indemnities of bank or other facilities including those in respect of the Group’s associated undertakings and investments.
At 31 March 2005, the Company had guaranteed debt of Vodafone Finance K.K. amounting to £1,111 million (2004: £1,177 million) and issued guarantees in respect of notes issued by Vodafone Americas, Inc. amounting to £311 million (2004: £320 million). The Japanese facility expires by January 2007 and the majority of Vodafone Americas, Inc. bond guarantees by July 2008.
Other guarantees and contingent liabilities
Other guarantees principally comprise commitments to support disposed entities.
In addition to the amounts disclosed above, the Group has guaranteed financial indebtedness and issued performance bonds for £36 million (2004: £53 million) in respect of businesses which have been sold and for which counter indemnities have been received from the purchasers.
The Group also enters into lease arrangements in the normal course of business, which are principally in respect of land, buildings and equipment. Further details on the minimum lease payments due under non-cancellable operating lease arrangements can be found in note 26.
Save as disclosed within “Risk Factors and Legal Proceedings – Legal Proceedings”, the Company and its subsidiaries are not involved in any legal or arbitration proceedings (including any governmental proceedings which are pending or known to be contemplated) which are expected to have, or have had in the twelve months preceding the date of this document, a significant effect on the financial position or profitability of the Company and its subsidiaries.
Back to Contents
Back to Consolidated Financial Statements Contents
|
Notes to the Consolidated Financial Statements continued |
|
| 28.Analysis of cash flows |
| | 2005
£m | | 2004
£m | | 2003
£m | |
|
|
|
|
|
| |
| Net cash inflow from operating activities | | | | | | |
| Operating loss | (5,304 | ) | (4,776 | ) | (5,295 | ) |
| Exceptional items | 315 | | (228 | ) | 496 | |
| Depreciation | 4,528 | | 4,362 | | 3,979 | |
| Goodwill amortisation (subsidiary undertakings) | 12,929 | | 13,095 | | 11,875 | |
| Amortisation of other intangible fixed assets | 412 | | 98 | | 53 | |
| Loss on disposal of tangible fixed assets | 161 | | 89 | | 109 | |
|
|
|
|
|
| |
| | 13,041 | | 12,640 | | 11,217 | |
| Decrease/(increase) in stocks | 22 | | (102 | ) | (17 | ) |
| (Increase)/decrease in debtors | (453 | ) | (293 | ) | 198 | |
| Increase/(decrease) in creditors | 150 | | 157 | | (233 | ) |
| Payments in respect of exceptional items | (47 | ) | (85 | ) | (23 | ) |
|
|
|
|
|
| |
| | 12,713 | | 12,317 | | 11,142 | |
|
|
|
|
|
| |
| Net cash outflow for returns on investments and servicing of finance | | | | | | |
| Interest received | 746 | | 942 | | 543 | |
| Dividends from investments | 19 | | 25 | | 15 | |
| Interest paid | (1,074 | ) | (901 | ) | (1,004 | ) |
| Interest element of finance leases | (8 | ) | (10 | ) | (14 | ) |
| Dividends paid to minority shareholders in subsidiary undertakings | (74 | ) | (100 | ) | (91 | ) |
|
|
|
|
|
| |
| | (391 | ) | (44 | ) | (551 | ) |
|
|
|
|
|
| |
| Net cash outflow from financing | | | | | | |
| Issue of ordinary share capital | 115 | | 69 | | 28 | |
| Issue of shares to minorities | – | | – | | 1 | |
| Purchase of treasury shares | (4,053 | ) | (1,032 | ) | – | |
| Purchase of own shares in relation to employee share schemes | – | | (17 | ) | (14 | ) |
| Capital element of finance lease payments | (12 | ) | (115 | ) | (97 | ) |
| Debt due within one year: | | | | | | |
| Decrease in short term debt | (1,997 | ) | (1,791 | ) | (1,366 | ) |
| Debt due after one year: | | | | | | |
| Decrease in long-term debt | (161 | ) | (507 | ) | (1,700 | ) |
| Issue of new bonds | – | | 2,693 | | 2,998 | |
|
|
|
|
|
| |
| | (6,108 | ) | (700 | ) | (150 | ) |
|
|
|
|
|
| |
Back to Contents
Back to Consolidated Financial Statements Contents
| | | | | | Other non-
cash changes | | | |
| 1 April | Cash | and exchange | 31 March |
| 2004 | flow | movements | 2005 |
| £m | £m | £m | £m |
|
|
|
|
|
|
|
| |
| Liquid investments | 4,381 | | (3,563 | ) | (2 | ) | 816 | |
|
|
|
|
|
|
|
| |
| Cash at bank and in hand | 1,409 | | 1,408 | | 33 | | 2,850 | |
| Bank overdrafts | (42 | ) | (3 | ) | (2 | ) | (47 | ) |
|
|
|
|
|
|
|
| |
| | 1,367 | | 1,405 | | 31 | | 2,803 | |
|
|
|
|
|
|
|
| |
| Debt due within one year | (2,000 | ) | 1,997 | | (329 | ) | (332 | ) |
| Debt due after one year | (12,100 | ) | 161 | | 439 | | (11,500 | ) |
| Finance leases | (136 | ) | 12 | | (2 | ) | (126 | ) |
|
|
|
|
|
|
|
| |
| | (14,236 | ) | 2,170 | | 108 | | (11,958 | ) |
|
|
|
|
|
|
|
| |
| | | | | | | | | |
| | (8,488 | ) | 12 | | 137 | | (8,339 | ) |
|
|
|
|
|
|
|
| |
Cash flows in respect of the Commercial Paper programme are shown net within debt-related cash flows.
Debt includes secured debt of £90 million (2004: £132 million) in respect of Vodafone Egypt (£50 million, 2004: £132 million) and Vodafone Albania (£40 million, 2004: £nil). Further information on guarantees can be found in note 27.
|
| 30.Directors |
| Aggregate emoluments of the directors of the Company were as follows: |
| | 2005 | | 2004 | | 2003 | |
| £’000 | £’000 | £’000 |
|
|
|
|
|
| |
| Salaries and fees | 5,806 | | 6,752 | | 5,457 | |
| Incentive schemes | 4,218 | | 5,418 | | 5,738 | |
| Benefits | 582 | | 1,371 | | 709 | |
|
|
|
|
|
| |
| | 10,606 | | 13,541 | | 11,904 | |
|
|
|
|
|
| |
The aggregate gross pre-tax gain made on the exercise of share options in the year to 31 March 2005 by serving directors was £3,076,200 (2004: £1,904,000; 2003: £226,873) and by former directors was £2,507,477 (2004: £nil, 2003: £nil).
Further details of directors’ emoluments can be found in “Board’s Report to Shareholders on Directors’ Remuneration – Remuneration for the year to 31 March 2005”.
Back to Contents
Back to Consolidated Financial Statements Contents
|
| Notes to the Consolidated Financial Statements continued |
|
|
| | |
| 31.Employees |
An analysis of the average number of employees by category of activity is shown below. |
| | 2005 | | 2004 | | 2003 | |
| Number | Number | Number |
|
|
|
|
|
| |
| By activity: | | | | | | |
| Operations | 13,772 | | 14,096 | | 14,863 | |
| Selling and distribution | 16,140 | | 15,303 | | 16,252 | |
| Administration | 27,466 | | 30,710 | | 35,552 | |
|
|
|
|
|
| |
| | 57,378 | | 60,109 | | 66,667 | |
|
|
|
|
|
| |
| By segment: | | | | | | |
| Mobile telecommunications: | | | | | | |
| Germany | 9,266 | | 9,143 | | 8,532 | |
| Italy | 8,898 | | 9,047 | | 8,893 | |
| UK | 11,397 | | 11,304 | | 9,972 | |
| Other EMEA | 17,681 | | 17,215 | | 16,984 | |
| Americas | 174 | | 241 | | 391 | |
| Asia Pacific | 5,610 | | 6,048 | | 7,063 | |
|
|
|
|
|
| |
| | 53,026 | | 52,998 | | 51,835 | |
| Non mobile: | | | | | | |
| Germany | 4,352 | | 4,767 | | 6,354 | |
| Asia Pacific | – | | 2,344 | | 8,478 | |
|
|
|
|
|
| |
| | 57,378 | | 60,109 | | 66,667 | |
|
|
|
|
|
| |
| The cost incurred in respect of these employees (including directors) was: | | | | | | |
| | 2005 | | 2004 | | 2003 | |
| £m | £m | £m |
|
|
|
|
|
| |
| Wages and salaries | 1,955 | | 2,018 | | 1,984 | |
| Social security costs | 243 | | 234 | | 199 | |
| Other pension costs | 95 | | 79 | | 95 | |
|
|
|
|
|
| |
| | 2,293 | | 2,331 | | 2,278 | |
|
|
|
|
|
| |
| | | | | | | |
| | | | | | | |
Back to Contents
Back to Consolidated Financial Statements Contents
As at 31 March 2005, the Group operated a number of pension plans for the benefit of its employees throughout the world, which vary with conditions and practices in the countries concerned. The Group’s pension plans are provided through both defined benefit and defined contribution arrangements. Defined benefit schemes provide benefits based on the employees’ length of pensionable service and their final pensionable salary or other criteria. Defined contribution schemes offer employees individual funds that are converted into benefits at the time of retirement.
Further details on the three principal defined benefit pension schemes, in the United Kingdom, Germany and Japan are shown below. In addition to the principal schemes, the Group operates defined benefit schemes in Greece, Ireland, Italy, Sweden and the United States. Defined contribution pension schemes are provided in Australia, Belgium, Egypt, Germany, Greece, Hungary, Ireland, Italy, Luxembourg, Malta, the Netherlands, New Zealand, Portugal, Spain, the United Kingdom and the United States. There is a post retirement medical plan in the United States for a small closed group of participants.
The Group accounts for its pension schemes in accordance with SSAP 24, “Accounting for pension costs”. Scheme liabilities are assessed by independent actuaries using the projected unit funding method and applying the principal actuarial assumptions set out in “Pension disclosures required under SSAP 24” below. Assets are shown at market value.
From 2006, the Group will account for its pension schemes in accordance with IFRS principles (which are largely equivalent to the current FRS 17 requirements under UK GAAP). Additional disclosures required under the current transitional provisions of FRS 17 are also set out below. The bases of calculation under FRS 17 are significantly different to SSAP 24. Whilst both require use of formal actuarial valuations, FRS 17 requires the use of a different set of underlying assumptions and also specifies more frequent valuation updates. Accordingly, when IFRS is implemented in full, the Group’s reported pension costs and balance sheet position will change accordingly.
United Kingdom
The majority of the UK employees are members of the Vodafone Group Pension Scheme (the “main scheme”). This is a tax approved defined benefit scheme, the assets of which are held in an external trustee-administered fund. In addition, there is an internally funded unapproved defined benefit plan in place for a small number of senior executives. The pension cost for these defined benefit arrangements are included in the summary information shown below.
The main scheme is subject to quarterly funding updates by independent actuaries and to formal actuarial valuations at least every three years. The most recent formal triennial valuation of this scheme was carried out as at 31 March 2004 and valued scheme assets at £434 million and scheme liabilities at £393 million. This represents a funding ratio of 111% (2004: 116%).
As a result of the triennial actuarial valuation, the Group’s UK subsidiaries agreed to make a special lump sum contribution of £100 million during the financial year and to maintain the ongoing contributions of 13% of pensionable earnings. The updated funding level as at 31 March 2005 has been estimated as approximately 130% using assumptions consistent with the 2004 actuarial valuation. This special contribution brings the funding position on an FRS 17 basis to 101% at 31 March 2005.
The SSAP 24 liabilities are valued using the same assumptions adopted for the triennial valuation. These are outlined further below. As a result of the acceleration of payments, a net prepayment of £299 million (2004: £193 million) is included in debtors due after more than one year, representing the excess of the amounts funded over accumulated pension costs.
Germany
There are a number of separate pension and associated arrangements in Germany, with the majority of these being financed through a funded trust arrangement. The German schemes are subject to annual valuations, with the last formal valuations having been completed at 31 March 2005.
Under SSAP 24 requirements, an amount of £7 million (2004: £14 million) is included in provisions for liabilities and charges, representing the excess of the accumulated pension cost over the funded amounts on some schemes, with an equal amount in prepayments (2004: £nil), representing the excess of the amounts funded over accumulated pension costs for the remaining schemes.
Under the requirements of FRS 17, the total pension liability at 31 March 2005 for benefits funded through the trust arrangement was £191 million. The market value of the trust arrangement assets was £181 million. A contribution of £14 million was made into the trust during the financial year. The total FRS 17 pension liability for additional unfunded arrangements was £22 million.
Japan
There are a number of separate pension schemes operating in Japan. These plans are generally not funded externally. The latest formal actuarial valuation was prepared at 31 March 2005.
Under the requirements of SSAP 24, an amount of £21 million (2004: £26 million) is included in provisions for liabilities and charges, representing the excess of the accumulated pension costs over the amounts funded externally reflecting the internally funded nature of the principal arrangements.
On an FRS 17 basis, liabilities are valued at £30 million at 31 March 2005 while scheme assets are valued at £2 million.
Back to Contents
Back to Consolidated Financial Statements Contents
|
| Notes to the Consolidated Financial Statements continued |
|
|
| | |
| 32.Pensions continued |
| Pension disclosures required under SSAP 24 |
During the year ended 31 March 2005, the total amount charged to the profit and loss account in respect of all the Group’s pensions plans was £95 million (2004: £79 million, 2003: £95 million), as analysed below:
| | 2005 | | 2004 | | 2003 | |
| £m | £m | £m |
|
|
|
|
|
| |
| Defined benefit schemes: | | | | | | |
| United Kingdom | 31 | | 31 | | 24 | |
| Germany | 5 | | 7 | | 12 | |
| Japan | 28 | | 10 | | 32 | |
| Other | 8 | | 6 | | 5 | |
|
|
|
|
|
| |
| Net pension charge: Defined benefit schemes | 72 | | 54 | | 73 | |
| Net pension charge: Defined contribution schemes | 23 | | 25 | | 22 | |
|
|
|
|
|
| |
| Total amount charged to the profit and loss account | 95 | | 79 | | 95 | |
|
|
|
|
|
| |
Below is a summary of the principal assumptions used in calculating the pension cost for the year to 31 March 2005:
| | UK | | Germany | | Japan | |
| % | % | % |
|
|
|
|
|
| |
| Rate of inflation | 2.5 | | 2.0 | | – | |
| Rate of increase in salaries | 4.5 | | 3.0 | | –(1 | ) |
| Rate of increase in pensions in payment | 2.5 | | 2.0 | | N/A | |
| Rate of increase in deferred pensions | 2.5 | | – | | N/A | |
| Rate used to discount liabilities – pre-retirement | 6.8 | | 5.5 | | 2.5 | |
| Rate used to discount liabilities – post-retirement | 5.8 | | 5.5 | | 2.5 | |
Notes: |
| (1) | Rate of increase in salaries in Japan is calculated in line with company specific experience where benefits are salary related. |
The components of the total pension costs of the three principal defined benefit schemes were as follows:
| | | | UK | | | | | | Germany | | | | | | Japan(2) | | | |
| |
|
|
|
|
| |
|
|
|
|
| |
|
|
|
|
| |
| | 2005 | | 2004 | | 2003 | | 2005 | | 2004 | | 2003 | | 2005 | | 2004 | | 2003 | |
| | £m | | £m | | £m | | £m | | £m | | £m | | £m | | £m | | £m | |
|
|
|
|
|
|
|
|
|
|
|
|
|
|
|
|
|
| |
| Regular cost | 27 | | 23 | | 22 | | 3 | | 5 | | 5 | | 5 | | 8 | | 12 | |
| Interest (credit)/cost | (13 | ) | (9 | ) | (4 | ) | 1 | | 4 | | 9 | | – | | 1 | | 2 | |
| Variation in regular cost(1) | 17 | | 17 | | 6 | | 1 | | (2 | ) | (2 | ) | 23 | | 1 | | 18 | |
|
|
|
|
|
|
|
|
|
|
|
|
|
|
|
|
|
| |
| Total | 31 | | 31 | | 24 | | 5 | | 7 | | 12 | | 28 | | 10 | | 32 | |
|
|
|
|
|
|
|
|
|
|
|
|
|
|
|
|
|
| |
| Notes: |
| (1) | The variation in regular cost was calculated by amortising the shortfall at the date of the last formal valuation or review over the future working lives of members on a percentage of pensionable salary basis. For the purposes of determining the UK SSAP 24 variation in regular cost, a review was undertaken as at 31 March 2003 to reflect the impact of investment market movements. The charge for Japan in the year ended 31 March 2005 also included £23 million (2004: £nil, 2003: £17 million) in respect of lump sum redundancy benefits payable through a redundancy programme associated with the retirement plan. |
| (2) | The charge for Japan for the year ended 31 March 2004 includes the pension costs in relation to companies sold during the year for that part of the year prior to their disposal. |
Back to Contents
Back to Consolidated Financial Statements Contents
| Additional disclosures in respect of FRS 17 |
| |
| The most recent full formal actuarial valuations for defined benefit schemes have been updated by qualified independent actuaries for the financial year ended 31 March 2005 to derive the FRS 17 disclosures below. |
| |
| Major assumptions used |
| |
| | UK | | Germany | | Japan | | Other(2) | |
|
|
|
|
| 2005 | | 2004 | | 2003 | 2005 | | 2004 | | 2003 | 2005 | | 2004 | | 2003 | 2005 | | 2004 | | 2003 |
| % | % | % | % | % | % | % | | % | | % | % | % | % |
|
|
|
|
|
|
|
|
|
|
|
|
|
|
|
|
|
|
|
|
|
|
|
| |
| | | | | | | | | | | | | | | | | | | | | | | | | |
| Rate of inflation | 2.8 | | 2.5 | | 2.5 | | 1.9 | | 2.0 | | 1.5 | | – | | – | | – | | 2.0 | | 2.0 | | 1.8 | |
| Rate of increase in salaries | 4.8 | | 4.5 | | 4.5 | | 2.9 | | 3.0 | | 3.5 | | – | (1) | – | (1) | – | (1) | 2.6 | | 3.0 | | 3.5 | |
Rate of increase in
pensions in payment | 2.8 | | 2.5 | | 2.5 | | 1.9 | | 2.0 | | 1.5 | | N/a | | N/a | | N/a | | 2.0 | | 2.0 | | 1.9 | |
Rate of increase in
deferred pensions | 2.8 | | 2.5 | | 2.5 | | 1.9 | | – | | – | | N/a | | N/a | | N/a | | 2.0 | | 2.0 | | 1.9 | |
| Discount rate | 5.4 | | 5.5 | | 5.4 | | 4.5 | | 5.3 | | 5.3 | | 2.3 | | 2.3 | | 1.5 | | 4.7 | | 4.8 | | 5.3 | |
| | | | | | | | | | | | | | | | | | | | | | | | | |
| Notes: |
| (1) | Rate of increase in salaries in Japan is calculated in line with company specific experience. |
| (2) | Figures shown for other schemes represent weighted average assumptions of individual schemes. |
| | |
| The expected rates of return at 31 March were: |
| | |
| | UK | | Germany | | Japan | | Other | |
|
|
|
|
| 2005 | | 2004 | | 2003 | 2005 | | 2004 | | 2003 | 2005 | | 2004 | | 2003 | 2005 | | 2004 | | 2003 |
| % | % | % | % | % | % | % | % | % | % | % | % |
|
|
|
|
|
|
|
|
|
|
|
|
|
|
|
|
|
|
|
|
|
|
|
| |
| Bonds | 4.8 | | 4.8 | | 5.5 | | 4.0 | | 4.5 | | 4.8 | | 1.6 | | 1.0 | | N/a | | 4.3 | | 4.6 | | 4.9 | |
| Equities | 7.7 | | 7.5 | | 8.0 | | 6.6 | | 6.8 | | 7.3 | | 4.3 | | 4.0 | | N/a | | 6.8 | | 6.8 | | 7.8 | |
| Other assets | 4.9 | | – | | – | | 2.1 | | 2.0 | | 2.8 | | 2.8 | | – | | 3.0 | | 4.3 | | 2.0 | | 3.5 | |
| | | | | | | | | | | | | | | | | | | | | | | | | |
| Charges that would have been made to the profit and loss account and consolidated statement of total recognised gains and losses on compliance with FRS 17 and on the basis of the assumptions stated above |
| | UK | | Germany | | Japan | | Other | | Total | |
|
|
|
|
|
| 2005 | | 2004 | 2005 | | 2004 | 2005 | | 2004 | 2005 | | 2004 | 2005 | | 2004 |
| £m | £m | £m | £m | £m | £m | £m | £m | £m | £m |
|
|
|
|
|
|
|
|
|
|
|
|
|
|
|
|
|
|
|
| |
| Operating profit: | | | | | | | | | | | | | | | | | | | | |
| Current service cost | 37 | | 32 | | 6 | | 8 | | 5 | | 10 | | 30 | | 44 | | 78 | | 94 | |
| Past service cost | – | | – | | – | | – | | – | | – | | – | | 1 | | – | | 1 | |
|
|
|
|
|
|
|
|
|
|
|
|
|
|
|
|
|
|
|
| |
| Total charge to operating profit | 37 | | 32 | | 6 | | 8 | | 5 | | 10 | | 30 | | 45 | | 78 | | 95 | |
|
|
|
|
|
|
|
|
|
|
|
|
|
|
|
|
|
|
|
| |
| Finance costs/(income): | | | | | | | | | | | | | | | | | | | | |
| Interest cost | 26 | | 22 | | 9 | | 9 | | 1 | | 1 | | 6 | | 6 | | 42 | | 38 | |
| Expected return on pension scheme assets | (31 | ) | (22 | ) | (8 | ) | (5 | ) | – | | – | | (3 | ) | (2 | ) | (42 | ) | (29 | ) |
|
|
|
|
|
|
|
|
|
|
|
|
|
|
|
|
|
|
|
| |
| Total (credit)/charge to finance (income)/costs | (5 | ) | – | | 1 | | 4 | | 1 | | 1 | | 3 | | 4 | | – | | 9 | |
|
|
|
|
|
|
|
|
|
|
|
|
|
|
|
|
|
|
|
| |
| Total charge to loss before taxation | 32 | | 32 | | 7 | | 12 | | 6 | | 11 | | 33 | | 49 | | 78 | | 104 | |
|
|
|
|
|
|
|
|
|
|
|
|
|
|
|
|
|
|
|
| |
| Consolidated statement of total recognised gains and losses: | | | | | | | | | | | | | | | | | | | | |
| Actual return less expected return on pension scheme assets | (23 | ) | (56 | ) | 1 | | (3 | ) | – | | – | | (2 | ) | (7 | ) | (24 | ) | (66 | ) |
| Experience (gains) and losses arising on the scheme liabilities | 56 | | – | | 3 | | 3 | | – | | (1 | ) | 1 | | (3 | ) | 60 | | (1 | ) |
| Changes in assumptions underlying the present value of the plan liabilities | 39 | | 16 | | 16 | | 11 | | – | | (5 | ) | 11 | | (2 | ) | 66 | | 20 | |
|
|
|
|
|
|
|
|
|
|
|
|
|
|
|
|
|
|
|
| |
| Actuarial (gains)/losses on assets and liabilities | 72 | | (40 | ) | 20 | | 11 | | – | | (6 | ) | 10 | | (12 | ) | 102 | | (47 | ) |
| Exchange rate movements | – | | – | | 1 | | (1 | ) | (2 | ) | (3 | ) | 1 | | (5 | ) | – | | (9 | ) |
|
|
|
|
|
|
|
|
|
|
|
|
|
|
|
|
|
|
|
| |
| Total (gains)/losses recognised in statement of total recognised gains and losses | 72 | | (40 | ) | 21 | | 10 | | (2 | ) | (9 | ) | 11 | | (17 | ) | 102 | | (56 | ) |
|
|
|
|
|
|
|
|
|
|
|
|
|
|
|
|
|
|
|
| |
Back to Contents
Back to Consolidated Financial Statements Contents
|
| Notes to the Consolidated Financial Statements continued |
|
|
32.Pensions continued
History of amounts that would have been recognised in the statement of total recognised gains and losses under FRS 17
| | | 2005 | | 2004 | | 2003 | |
|
|
|
| £m | | % | £m | | % | £m | | % |
|
|
|
|
|
|
|
|
|
|
|
|
| |
| UK | Difference between the expected and actual return on assets(1) | 23 | | 4 | | 56 | | 13 | | (95 | ) | (36 | ) |
| | Experience gains and (losses) arising on scheme liabilities(2) | (56 | ) | (9 | ) | – | | – | | – | | – | |
| | Actuarial gain/(loss)(2) | (72 | ) | (12 | ) | 40 | | 9 | | (132 | ) | (34 | ) |
|
|
|
|
|
|
|
|
|
|
|
|
| |
| Germany | Difference between the expected and actual return on assets(1) | (1 | ) | (1 | ) | 3 | | 2 | | (1 | ) | (1 | ) |
| | Experience gains and (losses) arising on scheme liabilities(2) | (3 | ) | (1 | ) | (3 | ) | (2 | ) | 7 | | 4 | |
| | Actuarial gain/(loss)(2) | (20 | ) | (9 | ) | (11 | ) | (6 | ) | (5 | ) | (3 | ) |
|
|
|
|
|
|
|
|
|
|
|
|
| |
| Japan | Difference between the expected and actual return on assets(1) | – | | – | | – | | – | | – | | – | |
| | Experience gains and (losses) arising on scheme liabilities(2) | – | | – | | 1 | | 3 | | (1 | ) | (1 | ) |
| | Actuarial gain/(loss)(2) | – | | – | | 6 | | 17 | | (17 | ) | (13 | ) |
|
|
|
|
|
|
|
|
|
|
|
|
| |
| Other | Difference between the expected and actual return on assets(1) | 2 | | 3 | | 7 | | 18 | | (14 | ) | (37 | ) |
| | Experience gains and (losses) arising on scheme liabilities(2) | (1 | ) | (1 | ) | 3 | | 2 | | 1 | | 1 | |
| | Actuarial gain/(loss)(2) | (10 | ) | (7 | ) | 12 | | 10 | | (18 | ) | (14 | ) |
|
|
|
|
|
|
|
|
|
|
|
|
| |
| Group | Difference between the expected and actual return on assets(1) | 24 | | 3 | | 66 | | 10 | | (110 | ) | (27 | ) |
| | Experience gains and (losses) arising on scheme liabilities(2) | (60 | ) | (6 | ) | 1 | | – | | 7 | | 1 | |
| | Actuarial gain/(loss)(2) | (102 | ) | (10 | ) | 47 | | 6 | | (172 | ) | (21 | ) |
|
|
|
|
|
|
|
|
|
|
|
|
| |
| Notes: |
| (1) | Percentage stated is expressed as a percentage of scheme assets at 31 March. |
| (2) | Percentage stated is expressed as a percentage of scheme liabilities at 31 March. |
| |
| Fair value of the assets and liabilities of the schemes |
| |
| | UK | | Germany | | Japan | | Other | | Total | |
|
|
|
|
|
| 2005 | | 2004 | | 2003 | 2005 | | 2004 | | 2003 | 2005 | | 2004 | | 2003 | 2005 | | 2004 | | 2003 | 2005 | | 2004 | | 2003 |
| £m | £m | £m | £m | £m | £m | £m | £m | £m | £m | £m | £m | £m | £m | £m |
|
|
|
|
|
|
|
|
|
|
|
|
|
|
|
|
|
|
|
|
|
|
|
|
|
|
|
|
|
| |
| Bonds | 105 | | 89 | | 56 | | 115 | | 104 | | – | | – | | 1 | | – | | 6 | | 4 | | 7 | | 226 | | 198 | | 63 | |
| Equities | 418 | | 345 | | 208 | | 54 | | 51 | | – | | – | | 1 | | – | | 52 | | 33 | | 27 | | 524 | | 430 | | 235 | |
| Other assets | 105 | | – | | – | | 12 | | 10 | | 107 | | 2 | | – | | 1 | | 5 | | 3 | | 4 | | 124 | | 13 | | 112 | |
|
|
|
|
|
|
|
|
|
|
|
|
|
|
|
|
|
|
|
|
|
|
|
|
|
|
|
|
|
| |
| Total fair value | | | | | | | | | | | | | | | | | | | | | | | | | | | | | | |
| of scheme | | | | | | | | | | | | | | | | | | | | | | | | | | | | | | |
| assets | 628 | | 434 | | 264 | | 181 | | 165 | | 107 | | 2 | | 2 | | 1 | | 63 | | 40 | | 38 | | 874 | | 641 | | 410 | |
| Present value | | | | | | | | | | | | | | | | | | | | | | | | | | | | | | |
| of scheme | | | | | | | | | | | | | | | | | | | | | | | | | | | | | | |
| liabilities | (619 | ) | (457 | ) | (383 | ) | (213 | ) | (192 | ) | (180 | ) | (30 | ) | (35 | ) | (127 | ) | (148 | ) | (122 | ) | (126 | ) | (1,010 | ) | (806 | ) | (816 | ) |
|
|
|
|
|
|
|
|
|
|
|
|
|
|
|
|
|
|
|
|
|
|
|
|
|
|
|
|
|
| |
| FRS 17 | | | | | | | | | | | | | | | | | | | | | | | | | | | | | | |
| assets/(deficits) | 9 | | (23 | ) | (119 | ) | (32 | ) | (27 | ) | (73 | ) | (28 | ) | (33 | ) | (126 | ) | (85 | ) | (82 | ) | (88 | ) | (136 | ) | (165 | ) | (406 | ) |
| Related deferred | | | | | | | | | | | | | | | | | | | | | | | | | | | | | | |
| tax (liabilities) | | | | | | | | | | | | | | | | | | | | | | | | | | | | | | |
| /assets | (2 | ) | 7 | | 36 | | 13 | | 11 | | 30 | | 12 | | 14 | | 53 | | 32 | | 30 | | 30 | | 55 | | 62 | | 149 | |
|
|
|
|
|
|
|
|
|
|
|
|
|
|
|
|
|
|
|
|
|
|
|
|
|
|
|
|
|
| |
| Net FRS 17 | | | | | | | | | | | | | | | | | | | | | | | | | | | | | | |
| surplus/(deficit) | 7 | | (16 | ) | (83 | ) | (19 | ) | (16 | ) | (43 | ) | (16 | ) | (19 | ) | (73 | ) | (53 | ) | (52 | ) | (58 | ) | (81 | ) | (103 | ) | (257 | ) |
|
|
|
|
|
|
|
|
|
|
|
|
|
|
|
|
|
|
|
|
|
|
|
|
|
|
|
|
|
| |
| Analysed as: | | | | | | | | | | | | | | | | | | | | | | | | | | | | | | |
| Assets | 7 | | – | | – | | 2 | | – | | – | | – | | – | | – | | – | | – | | – | | 9 | | – | | – | |
| Liabilities | – | | (16 | ) | (83 | ) | (21 | ) | (16 | ) | (43 | ) | (16 | ) | (19 | ) | (73 | ) | (53 | ) | (52 | ) | (58 | ) | (90 | ) | (103 | ) | (257 | ) |
|
|
|
|
|
|
|
|
|
|
|
|
|
|
|
|
|
|
|
|
|
|
|
|
|
|
|
|
|
| |
The funded status of each of the above principal defined benefit schemes is reported at the beginning of this note. The deficits reported under FRS 17 reflect the different assumptions for valuing assets and liabilities compared with SSAP 24.
The funding policy for the German and UK schemes is reviewed on a systematic basis in consultation with the independent scheme actuary in order to ensure that the funding contributions from sponsoring employers are appropriate to meet the liabilities of the schemes over the long term.
The deficit in respect of other schemes at 31 March 2005 primarily relates to internally funded schemes in Italy, Sweden and the United States.
Back to Contents
Back to Consolidated Financial Statements Contents
| Movement in deficit during the year | |
| | UK | | Germany | | Japan | | Other | | Total | |
| |
| |
| |
| |
| |
| |
| | 2005 | | 2004 | | 2005 | | 2004 | | 2005 | | 2004 | | 2005 | | 2004 | | 2005 | | 2004 | |
| | £m | | £m | | £m | | £m | | £m | | £m | | £m | | £m | | £m | | £m | |
|
|
|
|
|
|
|
|
|
|
|
|
|
|
|
|
|
|
|
| |
| Deficit in schemes before deferred tax at 1 April | 23 | | 119 | | 27 | | 73 | | 33 | | 126 | | 82 | | 88 | | 165 | | 406 | |
| Current service cost | 37 | | 32 | | 6 | | 8 | | 5 | | 10 | | 30 | | 44 | | 78 | | 94 | |
| Cash contributions | (136 | ) | (88 | ) | (23 | ) | (68 | ) | (9 | ) | (22 | ) | (41 | ) | (33 | ) | (209 | ) | (211 | ) |
| Past service cost | – | | – | | – | | – | | – | | – | | – | | 1 | | – | | 1 | |
| Financial (income)/costs | (5 | ) | – | | 1 | | 4 | | 1 | | 1 | | 3 | | 4 | | – | | 9 | |
| Actuarial (gains)/losses | 72 | | (40 | ) | 20 | | 11 | | – | | (6 | ) | 10 | | (12 | ) | 102 | | (47 | ) |
| Exchange rate movements | – | | – | | 1 | | (1 | ) | (2 | ) | (3 | ) | 1 | | (5 | ) | – | | (9 | ) |
| Other movements | – | | – | | – | | – | | – | | (73 | ) | – | | (5 | ) | – | | (78 | ) |
|
|
|
|
|
|
|
|
|
|
|
|
|
|
|
|
|
|
|
| |
(Surplus)/deficit in schemes before deferred tax at
31 March | (9 | ) | 23 | | 32 | | 27 | | 28 | | 33 | | 85 | | 82 | | 136 | | 165 | |
|
|
|
|
|
|
|
|
|
|
|
|
|
|
|
|
|
|
|
| |
Other movements in 2004 principally relate to the disposal of the Japan Telecom fixed line business.
Group net assets and profit and loss account reserves
| | Under SSAP 24 | | Under FRS 17 | |
| (as adopted) | (for information only) |
|
|
| 2005 | | 2004 | 2005 | | 2004 |
| £m | £m | £m | £m |
|
|
|
|
|
|
|
| |
| Net assets excluding pension scheme assets/(liabilities) | 102,000 | | 114,836 | | 102,000 | | 114,836 | |
| Net pension scheme assets/(liabilities) (net of deferred tax) | 135 | | 95 | | (81 | ) | (103 | ) |
|
|
|
|
|
|
|
| |
| Net assets including pension scheme liabilities | 102,135 | | 114,931 | | 101,919 | | 114,733 | |
|
|
|
|
|
|
|
| |
| Profit and loss reserve excluding pension scheme assets/(liabilities) | (51,823 | ) | (43,109 | ) | (51,823 | ) | (43,109 | ) |
| Net pension scheme assets/(liabilities) (net of deferred tax) | 135 | | 95 | | (81 | ) | (103 | ) |
|
|
|
|
|
|
|
| |
| Profit and loss reserve including pension scheme assets/(liabilities) | (51,688 | ) | (43,014 | ) | (51,904 | ) | (43,212 | ) |
|
|
|
|
|
|
|
| |
On 13 April 2005, the Group’s associated undertaking, Verizon Wireless, completed its purchase of NextWave Telecom Inc. for $3 billion in cash.
On 19 April 2005, the Board of directors of Vodafone Italy approved a proposal to buy back issued and outstanding shares for approximately €7.9 billion (£5.4 billion). If the proposal is approved by the shareholders of Vodafone Italy, participation will be invited on a pro rata basis. In accordance with Dutch and Italian corporate law the buy back will take place in two tranches, the first in June 2005 and the second expected to be October 2005. After the transaction is completed the Company and Verizon Communications Inc. will continue to hold approximately 76.8% and 23.1%, respectively, of Vodafone Italy indirectly through their wholly owned subsidiaries. It is anticipated that the buy back will be funded from currently available and forecast available cash of Vodafone Italy. At 31 March 2005, Vodafone Italy had net cash on deposit with Group companies of €7.2 billion (£4.9 billion).
On 11 May 2005, it was announced that an agreement had been reached to merge Cegetel with neuf telecom.
Between 1 April 2005 and 12 May 2005, the Company repurchased 405,500,000 of its own shares, to be held in treasury, under irrevocable purchase orders placed prior to 31 March 2005 for total consideration of £565 million. Further details of these transactions are shown in note 23.
As described in note 26 “Commitments”, the Group has entered into an agreement with Telesystem International Wireless Inc. of Canada to acquire approximately 79% of the share capital of MobiFon S.A. in Romania, and 100% of the issued share capital of Oskar Mobil a.s. in the Czech Republic.
Back to Contents
Back to Consolidated Financial Statements Contents
|
| Notes to the Consolidated Financial Statements continued |
|
| 34.Principal subsidiary undertakings, associated undertakings and investments |
| Principal subsidiary undertakings |
At 31 March 2005, the Company had the following subsidiary undertakings carrying on businesses which principally affect the profits and assets of the Group. They have the same year end date as the Company, unless otherwise stated, and have been included in the Group consolidation.
Unless otherwise stated the Company’s principal subsidiary undertakings all have share capital consisting solely of ordinary shares and are indirectly held. The country of incorporation or registration of all subsidiary undertakings is also their principal place of operation.
| | | Country of | |
| | | incorporation | Percentage(1) |
| Name | Principal activity | or registration | shareholding |
|
|
|
|
| Arcor AG & Co. | Fixed line operator | Germany | 73.7 |
| Europolitan Vodafone AB | Mobile network operator | Sweden | 100.0 |
| Vodafone Albania Sh.A.(2) | Mobile network operator | Albania | 99.9 |
| Vodafone Americas Inc.(3) | Holding company | USA | 100.0 |
| Vodafone D2 GmbH | Mobile network operator | Germany | 100.0 |
| Vodafone Egypt Telecommunications S.A.E. | Mobile network operator | Egypt | 50.1 |
| Vodafone Espana S.A. | Mobile network operator | Spain | 100.0 |
| Vodafone Europe B.V. | Holding company | Netherlands | 100.0 |
| Vodafone Holding GmbH(2) | Holding company | Germany | 100.0 |
| Vodafone Holdings Europe S.L. | Holding company | Spain | 100.0 |
| Vodafone K.K. | Mobile network operator | Japan | 97.7 |
| Vodafone Hungary Mobile Telecommunications Limited | Mobile network operator | Hungary | 100.0 |
| Vodafone International Holdings B.V. | Holding company | Netherlands | 100.0 |
| Vodafone Investments Luxembourg S.a.r.l. | Holding company | Luxembourg | 100.0 |
| Vodafone Ireland Limited | Mobile network operator | Ireland | 100.0 |
| Vodafone Libertel N.V. | Mobile network operator | Netherlands | 99.9 |
| Vodafone Limited | Mobile network operator | England | 100.0 |
| Vodafone Malta Limited | Mobile network operator | Malta | 100.0 |
| Vodafone Marketing S.a.r.l | Provider of Partner Network services | Luxembourg | 100.0 |
| Vodafone Network Pty Limited | Mobile network operator | Australia | 100.0 |
| Vodafone New Zealand Limited | Mobile network operator | New Zealand | 100.0 |
| Vodafone Omnitel N.V.(4) | Mobile network operator | Netherlands | 76.8 |
| Vodafone-Panafon Hellenic Telecommunications Company S.A. | Mobile network operator | Greece | 99.8 |
| Vodafone Portugal-Comunicações Pessoais, S.A. | Mobile network operator | Portugal | 100.0 |
| Vodafone Group Services Limited | Global products and services provider | England | 100.0 |
|
|
|
|
| Notes: |
| (1) | Rounded to nearest tenth of one percent. |
| (2) | Vodafone Albania Sh.A. and Vodafone Holding GmbH have a 31 December year end. Accounts are drawn up to 31 March 2005 for consolidation into the Group’s financial statements. |
| (3) | Share capital consists of 597,379,729 ordinary shares and 1.65 million class D and E redeemable preference shares of which 100% of the ordinary shares are held by the Group. |
| (4) | The principal place of operation of Vodafone Omnitel N.V. is Italy. |
Back to Contents
Back to Consolidated Financial Statements Contents
Principal associated undertakings
The Company’s principal associated undertakings all have share capital consisting solely of ordinary shares, unless otherwise stated, and are all indirectly held. The country of incorporation or registration of all associated undertakings is also their principal place of operation.
| | | Percentage | (1) | | | | | |
| | | shareholding/ | | Par value | | Latest | | Country of |
| | | partnership | | of issued | | financial | | incorporation or |
| Name | Principal activity | interest | | equity | | accounts | | registration |
|
|
|
|
|
|
|
|
|
| Belgacom Mobile S.A. | Mobile network operator | 25.0 | | €70.0m | | 31.12.04(2) | | Belgium |
| Cellco Partnership(3) | Mobile network operator | 45.0 | | — | | 31.12.04(2) | | USA |
| Mobifon S.A. | Mobile network operator | 20.1 | | ROL 712,923m | | 31.12.04(2) | | Romania |
| Polkomtel S.A. | Mobile network operator | 19.6 | | PLN 2,050m | | 31.12.04(2) | | Poland |
| Safaricom Limited(4) | Mobile network operator | 35.0 | | 1,020 Kshs | | 31.03.05 | | Kenya |
| Société Française du Radiotéléphone S.A. | Mobile network operator and | | | | | | | |
| | telecommunications company | 43.9 | | €1,348m | | 31.12.04(2) | | France |
| Swisscom Mobile A.G. | Mobile network operator | 25.0 | | CHF100m | | 31.12.04(2) | | Switzerland |
| Vodafone Fiji Limited | Mobile network operator | 49.0 | | F$6m | | 31.03.05 | | Fiji |
| Vodacom Group (Pty) Limited | Holding company | 35.0 | | ZAR 100 | | 31.03.05 | | South Africa |
|
|
|
|
|
|
|
|
|
| Notes: |
| (1) | Rounded to nearest tenth of one percent. |
| (2) | Accounts are drawn up to 31 March 2005 for consolidation in the Group’s financial statements. |
| (3) | Cellco Partnership trades under the name Verizon Wireless. The registered or principal office of the partnership is 180 Washington Valley Road, Bedminster, New Jersey 07921, USA. |
| (4) | The Group also holds 2 non-voting shares. |
Principal investments
The shareholding in the investment consists solely of ordinary shares and is indirectly held. The principal country of operation is the same as the country of incorporation or registration.
| | | | Country of |
| | | Percentage(1) | incorporation or |
| Name | Principal activity | shareholding | registration |
|
|
|
|
| China Mobile (Hong Kong) Limited(2) | Mobile network operator | 3.3 | China |
|
|
|
|
| Notes: |
| (1) | Rounded to nearest tenth of one percent. |
| (2) | Listed on the Hong Kong and New York stock exchanges and incorporated under the laws of Hong Kong. |
| | |
|
| 35.Related party transactions |
| Transactions with joint ventures and associated undertakings |
Group turnover includes sales to joint ventures and associated undertakings of £220 million (2004: £174 million, 2003: £40 million), primarily comprising fees for the use of Vodafone products and services, network airtime and access charges. Total operating costs include charges from joint ventures and associated undertakings of £272 million (2004: £173 million, 2003: £91 million), primarily comprising roaming charges.
Dividends received from joint ventures and associated undertakings are disclosed in Consolidated Cash Flows on page 80. Loans and trade balances owed to or from joint ventures and associated undertakings are disclosed in notes 15 and 17. During the year the Group received £nil (2004: £3 million; 2003: £14 million) in respect of interest on these loans.
Transactions with directors
During the year ended 31 March 2005, and as of 23 May 2005, neither any director nor any other executive officer, nor any associate of any director or any other executive officer, was indebted to the Company.
Since 1 April 2004, the Company has not been, and is not now, a party to any other material transactions, or proposed transactions, in which any member of the key management personnel (including directors, any other executive officer, senior manager, any spouse or relative of any of the foregoing, or any relative of such spouse), had or was to have a direct or indirect material interest.
Back to Contents
Back to Consolidated Financial Statements Contents
|
| Notes to the Consolidated Financial Statements continued |
|
| 36.US GAAP information |
| Reconciliations to US GAAP |
The Consolidated Financial Statements are prepared in accordance with UK GAAP, which differ in certain material respects from US GAAP. The following is a summary of the effects of the differences between UK GAAP and US GAAP. The translation of pounds sterling amounts into US dollars is provided solely for convenience based on the Noon Buying Rate on 31 March 2005 of $1.8888: £1.
Net loss for the years ended 31 March
| | | 2005 | | 2005 | | 2004 | | 2003 | |
| | Ref. | $m | | £m | | £m | | £m | |
|
|
|
|
|
|
|
|
| |
| Revenue from continuing operations (UK GAAP) | | 64,470 | | 34,133 | | 32,741 | | 28,547 | |
| Items (decreasing)/increasing revenue: | | | | | | | | | |
| Investments accounted for under the equity method | (a) | (10,356 | ) | (5,483 | ) | (5,276 | ) | (4,371 | ) |
| Connection revenue | (b) | 2,310 | | 1,223 | | 188 | | (1,760 | ) |
|
|
|
|
|
|
|
|
| |
| Revenue from continuing operations (US GAAP) | | 56,424 | | 29,873 | | 27,653 | | 22,416 | |
|
|
|
|
|
|
|
|
| |
| Loss for the financial year (UK GAAP) | | (14,242 | ) | (7,540 | ) | (9,015 | ) | (9,819 | ) |
| Items (increasing)/decreasing net loss: | | | | | | | | | |
| Investments accounted for under the equity method | (a) | (34 | ) | (18 | ) | 1,306 | | 656 | |
| Connection revenue and costs | (b) | 30 | | 16 | | 29 | | 16 | |
| Goodwill and other intangible assets | (c) | (12,243 | ) | (6,482 | ) | (6,520 | ) | (5,487 | ) |
| Capitalised interest | (d) | (162 | ) | (86 | ) | 406 | | 408 | |
| Licence fee amortisation | (e) | (822 | ) | (435 | ) | (76 | ) | (6 | ) |
| Exceptional items | (f) | 465 | | 246 | | (351 | ) | 270 | |
| Income taxes | (g) | 13,235 | | 7,007 | | 6,231 | | 4,953 | |
| Cumulative effect of change in accounting principle: EITF Topic D-108 | (h) | (11,667 | ) | (6,177 | ) | – | | – | |
| Cumulative effect of change in accounting principle: Post employment benefits | (h) | (368 | ) | (195 | ) | – | | – | |
| Other | (j) | (223 | ) | (118 | ) | (137 | ) | (46 | ) |
|
|
|
|
|
|
|
|
| |
| Net loss (US GAAP) | | (26,031 | ) | (13,782 | ) | (8,127 | ) | (9,055 | ) |
|
|
|
|
|
|
|
|
| |
| Loss from continuing operations | | (13,996 | ) | (7,410 | ) | (7,734 | ) | (9,135 | ) |
| Loss/(income) from operations and disposal of discontinued operations | (f) | – | | – | | (393 | ) | 80 | |
| Cumulative effect of changes in accounting principles | (h) | (12,035 | ) | (6,372 | ) | – | | – | |
|
|
|
|
|
|
|
|
| |
| Net loss (US GAAP) | | (26,031 | ) | (13,782 | ) | (8,127 | ) | (9,055 | ) |
|
|
|
|
|
|
|
|
| |
| Basic and diluted loss per share (US GAAP): | (k) | | | | | | | | |
| – Loss from continuing operations | | (21.14 | )¢ | (11.19 | )p | (11.36 | )p | (13.40 | )p |
| – Loss/(income) from operations and disposal of discontinued operations | | – | | – | | (0.57 | )p | 0.11 | p |
| – Cumulative effect of changes in accounting principles | | (18.18 | )¢ | (9.63 | )p | – | | – | |
|
|
|
|
|
|
|
|
| |
| – Net loss | | (39.32 | )¢ | (20.82 | )p | (11.93 | )p | (13.29 | )p |
|
|
|
|
|
|
|
|
| |
Pro-forma amounts as if the new accounting policy related to post employment benefits was applied retroactively
The following table presents net loss including related per share amounts on a pro forma basis as if the voluntary change in accounting principle related to the accounting for post employment benefits was applied retroactively. The change in accounting principle resulting from the adoption of EITF Topic D-108 has not been adjusted in the following table as this was not a voluntary change in accounting principle. Further details on the changes in accounting principles can be found in section (h) of this note.
| | 2005 | | 2005 | | 2004 | | 2003 | |
| | $m | | £m | | £m | | £m | |
|
|
|
|
|
|
|
| |
| Pro forma net loss | (26,400 | ) | (13,977 | ) | (8,081 | ) | (9,163 | ) |
| Pro forma net loss basic and diluted loss per share | (39.88 | )¢ | (21.11 | )p | (11.87 | )p | (13.44 | )p |
|
|
|
|
|
|
|
| |
Back to Contents
Back to Consolidated Financial Statements Contents
Comprehensive (loss)/income for the years ended 31 March
| | | 2005 | | 2005 | | 2004 | | 2003 | |
| Ref. | $m | £m | £m | £m |
|
|
|
|
|
|
|
|
| |
| Total recognised losses relating to the year (UK GAAP) | | (11,471 | ) | (6,073 | ) | (14,307 | ) | (780 | ) |
| Items (increasing)/decreasing total recognised losses: | | | | | | | | | |
| Net difference between loss for the financial year (UK GAAP) and | | | | | | | | | |
| net loss (US GAAP) | | (11,789 | ) | (6,242 | ) | 888 | | 764 | |
| Additional minimum pension liability, net of tax | (j) | 87 | | 46 | | 144 | | (191 | ) |
| Available for sale securities, net of tax | (j) | 166 | | 88 | | 378 | | (137 | ) |
| Derivative financial instruments, net of tax | (j) | 2 | | 1 | | (1 | ) | 1 | |
| Currency translation, net of tax | | 171 | | 91 | | (353 | ) | 913 | |
|
|
|
|
|
|
|
|
| |
| Comprehensive (loss)/income (US GAAP) | (l) | (22,834 | ) | (12,089 | ) | (13,251 | ) | 570 | |
|
|
|
|
|
|
|
|
| |
Shareholders’ equity at 31 March
| | | 2005 | | 2005 | | 2004 | |
| Ref. | $m | £m | £m |
|
|
|
|
|
|
| |
| Equity shareholders’ funds (UK GAAP) | | 187,590 | | 99,317 | | 111,924 | |
| Items increasing/(decreasing) equity shareholders’ funds: | | | | | | | |
| Investments accounted for under the equity method | (a) | 9,525 | | 5,043 | | 15,669 | |
| Connection revenue and costs | (b) | (26 | ) | (14 | ) | (55 | ) |
| Goodwill and other intangible assets | (c) | 76,918 | | 40,723 | | 45,320 | |
| Capitalised interest | (d) | 2,888 | | 1,529 | | 1,615 | |
| Licence fee amortisation | (e) | (1,043 | ) | (552 | ) | (109 | ) |
| Exceptional items | (f) | 595 | | 315 | | – | |
| Income taxes | (g) | (76,563 | ) | (40,535 | ) | (50,177 | ) |
| Proposed dividends | (i) | 2,635 | | 1,395 | | 728 | |
| Other | (j) | 45 | | 24 | | 114 | |
|
|
|
|
|
|
| |
| Shareholders’ equity (US GAAP) | | 202,564 | | 107,245 | | 125,029 | |
|
|
|
|
|
|
| |
Cash flows for the years ended 31 March
The consolidated statements of cash flows prepared under UK GAAP differ in certain presentational respects from the format required under US GAAP. These differences are reconciled below. Under US GAAP, cash equivalents are defined as short term, highly liquid investments which are readily convertible into known amounts of cash and were within three months of maturity when acquired. At 31 March 2005, cash and cash equivalents under US GAAP included cash equivalents of £816 million (2004: £4,381 million; 2003: £291 million), which are classified as investments under UK GAAP.
Condensed consolidated cash flow information
The movement and composition of cash and cash equivalents is presented in US GAAP format in the following table.
| | 2005 | | 2005 | | 2004 | | 2003 | |
| $m | £m | £m | £m |
|
|
|
|
|
|
|
| |
| Cash and cash equivalents were provided by/(used in): | | | | | | | | |
| Operating activities | 20,221 | | 10,706 | | 11,091 | | 9,708 | |
| Investing activities | (9,000 | ) | (4,765 | ) | (3,778 | ) | (9,497 | ) |
| Financing activities | (15,291 | ) | (8,096 | ) | (1,915 | ) | (1,202 | ) |
|
|
|
|
|
|
|
| |
| | (4,070 | ) | (2,155 | ) | 5,398 | | (991 | ) |
| Exchange movement | 59 | | 31 | | (374 | ) | (112 | ) |
| Cash and cash equivalents at the beginning of year | 10,936 | | 5,790 | | 766 | | 1,869 | |
|
|
|
|
|
|
|
| |
| Cash and cash equivalents at the end of year | 6,925 | | 3,666 | | 5,790 | | 766 | |
|
|
|
|
|
|
|
| |
Back to Contents
Back to Consolidated Financial Statements Contents
|
| Notes to the Consolidated Financial Statements continued |
|
36.US GAAP information continued
A reconciliation of the consolidated statements of cash flows presented in accordance with UK GAAP format to a US GAAP format is set out below.
| | 2005 | | 2005 | | 2004 | | 2003 | |
| $m | £m | £m | £m |
|
|
|
|
|
|
|
| |
| Operating activities: | | | | | | | | |
| Net cash inflow from operating activities (UK GAAP) | 24,012 | | 12,713 | | 12,317 | | 11,142 | |
| Taxation | (3,052 | ) | (1,616 | ) | (1,182 | ) | (883 | ) |
| Net cash outflow for returns on investments and servicing of finance | (739 | ) | (391 | ) | (44 | ) | (551 | ) |
|
|
|
|
|
|
|
| |
| Net cash provided by operating activities (US GAAP) | 20,221 | | 10,706 | | 11,091 | | 9,708 | |
|
|
|
|
|
|
|
| |
| Investing activities: | | | | | | | | |
| Net cash outflow from capital expenditure, financial investments and acquisitions and | | | | | | | | |
| disposals (UK GAAP) | (12,815 | ) | (6,785 | ) | (5,579 | ) | (10,239 | ) |
| Dividends received from joint ventures and associated undertakings | 3,815 | | 2,020 | | 1,801 | | 742 | |
|
|
|
|
|
|
|
| |
| Net cash used in investing activities (US GAAP) | (9,000 | ) | (4,765 | ) | (3,778 | ) | (9,497 | ) |
|
|
|
|
|
|
|
| |
| Financing activities: | | | | | | | | |
| Net cash outflow from financing activities (UK GAAP) | (11,537 | ) | (6,108 | ) | (700 | ) | (150 | ) |
| Increase in bank overdrafts | 6 | | 3 | | 43 | | – | |
| Equity dividends paid | (3,760 | ) | (1,991 | ) | (1,258 | ) | (1,052 | ) |
|
|
|
|
|
|
|
| |
| Net cash used in financing activities (US GAAP) | (15,291 | ) | (8,096 | ) | (1,915 | ) | (1,202 | ) |
|
|
|
|
|
|
|
| |
Summary of differences between UK GAAP and US GAAP
The Consolidated Financial Statements are prepared in accordance with UK GAAP, which differ in certain material respects from US GAAP. The differences that are material to the Group relate to the following:
Change in presentation
In previous years, the deferred tax liabilities and deferred tax income allocable to partnership entities (as determined for US income tax purposes) resulting from adjustments to US GAAP were included in the line item “Investments accounted for under the equity method”. The Group now shows these deferred tax liabilities and deferred tax income within the line item “Income taxes”. Amounts within the reconciliations of net loss for the years ended 31 March 2004 and 2003 and shareholders’ equity as at 31 March 2004 have been reclassified to provide comparability with the presentation as at 31 March 2005 and for the year then ended. This reclassification does not have an effect on net loss or shareholders’ equity under US GAAP.
(a) Investments accounted for under the equity method
This line item includes the US GAAP adjustments affecting net loss and shareholders’ equity discussed in (b) through (g) and (j) below related to investments accounted for under the equity method. Additional classification and presentational items not affecting net loss or shareholders’ equity are discussed below.
Under UK GAAP, amounts for exceptional non-operating items, interest, taxation and minority interest for joint ventures and associated undertakings are aggregated within the respective total Group amounts shown on the face of the consolidated profit and loss account. Under US GAAP, all of these items are included in the Group’s share in the net income or loss of these entities and is shown as a single line in the profit and loss account.
Back to Contents
Back to Consolidated Financial Statements Contents
Condensed financial information for Vodafone Italy
The basis of consolidation under UK GAAP differs from that under US GAAP. Under UK GAAP, the results and net assets of Vodafone Italy are consolidated in the Group’s financial statements. Under US GAAP, as a result of significant participating rights held by minority shareholders, the Group’s interest in Vodafone Italy has been accounted for under the equity method of accounting.
The following tables present, on a condensed basis, the financial information of Vodafone Italy as it is included in the Consolidated Profit and Loss Account and Consolidated Balance Sheet prepared under UK GAAP.
| | 2005 | | 2004 | | 2003 | |
| £m | £m | £m |
|
|
|
|
|
| |
| Turnover | 5,521 | | 5,276 | | 4,371 | |
| Cost of sales | (2,578 | ) | (2,132 | ) | (2,201 | ) |
|
|
|
|
|
| |
| Gross margin | 2,943 | | 3,144 | | 2,170 | |
| Selling and distribution costs | (213 | ) | (211 | ) | (182 | ) |
| Administrative expenses | (4,252 | ) | (4,276 | ) | (3,943 | ) |
| | | | | | | |
| Goodwill amortisation | (3,779 | ) | (3,837 | ) | (3,543 | ) |
| Other administrative expenses | (473 | ) | (439 | ) | (400 | ) |
|
|
|
|
|
| |
| Operating loss | (1,522 | ) | (1,343 | ) | (1,955 | ) |
| Other income/ (expense) | 1 | | 4 | | (12 | ) |
|
|
|
|
|
| |
| Loss on ordinary activities before taxation | (1,521 | ) | (1,339 | ) | (1,967 | ) |
| Tax on loss on ordinary activities | (660 | ) | (583 | ) | (478 | ) |
| Equity minority interest | (384 | ) | (459 | ) | (264 | ) |
|
|
|
|
|
| |
| Loss for the financial year | (2,565 | ) | (2,381 | ) | (2,709 | ) |
|
|
|
|
|
| |
| | | | | |
| | 2005 | | 2004 | |
| £m | £m |
|
|
|
| |
| Goodwill | 16,162 | | 19,443 | |
| Other intangible assets | 1,690 | | 1,666 | |
| Tangible assets | 2,006 | | 1,934 | |
|
|
|
| |
| Fixed assets | 19,858 | | 23,043 | |
|
|
|
| |
| Debtors | 1,349 | | 1,220 | |
| Other current assets | 73 | | 82 | |
|
|
|
| |
| Current assets | 1,422 | | 1,302 | |
|
|
|
| |
| Total assets | 21,280 | | 24,345 | |
| Creditors: amounts falling due within one year | (1,630 | ) | (1,587 | ) |
| Non-current creditors and provisions | (560 | ) | (518 | ) |
|
|
|
| |
| | 19,090 | | 22,240 | |
|
|
|
| |
| Total equity shareholders’ funds | 17,280 | | 20,855 | |
|
|
|
| |
| Equity minority interests | 1,810 | | 1,385 | |
|
|
|
| |
| | 19,090 | | 22,240 | |
|
|
|
| |
Back to Contents
Back to Consolidated Financial Statements Contents
|
| Notes to the Consolidated Financial Statements continued |
|
| 36.US GAAP information continued |
The following tables reconcile Vodafone Italy’s turnover, loss for the financial year and equity shareholders’ funds from UK GAAP to their related amounts in US GAAP as used in determining the net loss and shareholder’s equity in the Consolidated Financial Statements.
| | 2005 | | 2004 | | 2003 | |
| £m | £m | £m |
|
|
|
|
|
| |
| Turnover (UK GAAP) | 5,521 | | 5,276 | | 4,371 | |
| Item increasing/(decreasing) revenue: | | | | | | |
| Connection revenue | 109 | | 4 | | (179 | ) |
|
|
|
|
|
| |
| Turnover (US GAAP) | 5,630 | | 5,280 | | 4,192 | |
|
|
|
|
|
| |
| Loss for the financial year (UK GAAP) | (2,565 | ) | (2,381 | ) | (2,709 | ) |
| Items (increasing)/decreasing net loss: | | | | | | |
| Goodwill and other intangible assets | (2,885 | ) | (2,942 | ) | (2,702 | ) |
| Income taxes | 2,440 | | 3,234 | | 2,245 | |
| Other | (2 | ) | (24 | ) | (8 | ) |
|
|
|
|
|
| |
| Net loss (US GAAP) | (3,012 | ) | (2,113 | ) | (3,174 | ) |
|
|
|
|
|
| |
| | | | | | | |
| | 2005 | | 2004 | |
| £m | £m |
|
|
|
| |
| Equity shareholders’ funds (UK GAAP) | 17,280 | | 20,855 | |
| Items increasing/(decreasing) equity shareholders’ funds: | | | | |
| Goodwill and other intangible assets | 14,049 | | 16,526 | |
| Income taxes | (10,736 | ) | (12,812 | ) |
| Other | (54 | ) | (31 | ) |
|
|
|
| |
| Shareholders’ equity (US GAAP) | 20,539 | | 24,538 | |
|
|
|
| |
Vodafone Italy had the following effects on consolidated cash flows from operating, investing and financing activities presented in a US GAAP format:
| | 2005 | | 2004 | | 2003 | |
| £m | £m | £m |
|
|
|
|
|
| |
| Cash and cash equivalents were provided by/(used in): | | | | | | |
| Operating activities | 2,272 | | 2,588 | | 1,846 | |
| Investing activities | (769 | ) | (585 | ) | (724 | ) |
| Financing activities | – | | – | | – | |
|
|
|
|
|
| |
| | 1,503 | | 2,003 | | 1,122 | |
|
|
|
|
|
| |
Equity in losses of investments accounted for under the equity method
| | 2005 | | 2004 | | 2003 | |
| £m | £m | £m |
|
|
|
|
|
| |
| Share of operating profit/(loss) in associated undertakings (UK GAAP) | 1,193 | | 546 | | (156 | ) |
| Reclassification of exceptional non-operating items, interest, taxation and minority interests | (789 | ) | (565 | ) | (614 | ) |
| Share of Vodafone Italy’s loss for the financial year under UK GAAP | (2,565 | ) | (2,381 | ) | (2,709 | ) |
| US GAAP differences resulting in an effect on net income/(loss)(1) | (18 | ) | 1,306 | | 656 | |
|
|
|
|
|
| |
| Equity in losses of investments accounted for under the equity method (US GAAP) | (2,179 | ) | (1,094 | ) | (2,823 | ) |
|
|
|
|
|
| |
| Note: |
| (1) | These differences represent the differences described in (b) through (g) and (j) below as they relate to investments accounted for under the equity method. |
Carrying value of investments accounted for under the equity method
| | 2005 | | 2004 | |
| £m | £m |
|
|
|
| |
| Investments in associated undertakings (UK GAAP) | 19,398 | | 21,226 | |
| Carrying value of Vodafone Italy under UK GAAP | 22,151 | | 24,028 | |
| US GAAP differences affecting the carrying value of the investments(1) | 5,043 | | 15,669 | |
|
|
|
| |
| Investments accounted for under the equity method (US GAAP) | 46,592 | | 60,923 | |
|
|
|
| |
| Note: | |
| (1) | These differences represent the differences described in (b) through (g) and (j) below as they relate to investments accounted for under the equity method. |
Back to Contents
Back to Consolidated Financial Statements Contents
Summary aggregated financial information of 50% or less owned entities accounted for under the equity method
Summary aggregated financial information of 50% or less owned entities accounted for under the equity method, extracted on a 100% basis from accounts prepared under UK GAAP as of 31 March and for the years then ended, is set out below.
| | 2005 | | 2004 | | 2003 | |
| £m | £m | £m |
|
|
|
|
|
| |
| Assets: | | | | | | |
| Current assets | 6,774 | | 6,048 | | 7,033 | |
| Non-current assets | 21,371 | | 19,619 | | 21,004 | |
|
|
|
|
|
| |
| | 28,145 | | 25,667 | | 28,037 | |
|
|
|
|
|
| |
| Liabilities and equity shareholders’ funds: | | | | | | |
| Current liabilities | 12,960 | | 11,818 | | 12,978 | |
| Long-term liabilities | 5,980 | | 5,076 | | 5,310 | |
| Minority interests | 952 | | 974 | | 963 | |
| Total equity shareholders’ funds | 8,253 | | 7,799 | | 8,786 | |
|
|
|
|
|
| |
| | 28,145 | | 25,667 | | 28,037 | |
|
|
|
|
|
| |
| Turnover | 29,243 | | 23,418 | | 23,148 | |
|
|
|
|
|
| |
| Operating profit | 7,965 | | 6,759 | | 5,710 | |
|
|
|
|
|
| |
Summary financial information for Verizon Wireless as of 31 March and for the years then ended is set out below. The financial information is extracted on a 100% basis from accounts prepared under UK GAAP.
| | Verizon Wireless | |
|
|
|
|
|
| 2005 | | 2004 | | 2003 |
| £m | £m | £m |
|
|
|
|
|
| |
| Assets: | | | | | | |
| Current assets | 2,714 | | 2,142 | | 2,257 | |
| Non-current assets | 14,500 | | 13,033 | | 13,645 | |
|
|
|
|
|
| |
| | 17,214 | | 15,175 | | 15,902 | |
|
|
|
|
|
| |
| Liabilities and equity shareholders’ funds: | | | | | | |
| Current liabilities | 7,030 | | 6,610 | | 7,809 | |
| Long-term liabilities | 4,814 | | 3,910 | | 3,605 | |
| Minority interests | 854 | | 855 | | 962 | |
| Total equity shareholders’ funds | 4,516 | | 3,800 | | 3,526 | |
|
|
|
|
|
| |
| | 17,214 | | 15,175 | | 15,902 | |
|
|
|
|
|
| |
| Turnover | 15,634 | | 13,886 | | 12,902 | |
|
|
|
|
|
| |
| Operating profit | 3,598 | | 3,035 | | 2,795 | |
|
|
|
|
|
| |
(b) Connection revenue and costs
The Group’s UK GAAP accounting policy on revenue recognition was amended during the year ended 31 March 2004 in relation to the deferral of certain equipment, connection, upgrade and tariff migration fees following the issuance of Application Note G to FRS 5 “Reporting the Substance of Transactions”. Following the prospective adoption of EITF 00-21, “Accounting for Revenue Arrangements with Multiple Deliverables” on 1 October 2003 under US GAAP the Group’s UK and US GAAP accounting policies have been substantially aligned.
For transactions prior to 1 October 2003, connection revenue under US GAAP are recognised over the period that a customer is expected to remain connected to a network. Connection costs directly attributable to the income deferred are recognised over the same period. Where connection costs exceed connection revenue, the excess costs were charged in the profit and loss account immediately upon connection. The balances of deferred revenue and deferred charges as of 30 September 2003 will continue to be recognised over the period that a customer is expected to remain connected to a network.
Back to Contents
Back to Consolidated Financial Statements Contents
|
| Notes to the Consolidated Financial Statements continued |
|
| 36.US GAAP information continued |
| (c) Goodwill and other intangible assets |
Under UK GAAP, FRS 10, “Goodwill and Intangible Assets”, requires goodwill to be capitalised and amortised over its estimated useful economic life. Prior to the prospective adoption of FRS 10 on 1 April 1999 the Group offset acquired goodwill against shareholders’ equity in the year of acquisition. Under UK GAAP, licences and customer bases are not recognised separately from goodwill because they do not meet the recognition criteria.
Under US GAAP goodwill and intangible assets with indefinite lives are capitalised and not amortised, but tested for impairment, at least annually, in accordance with Statement of Financial Accounting Standards (“SFAS”) No. 142, “Goodwill and Other Intangible Assets”. Intangible assets with finite lives are capitalised and amortised over their useful economic lives. The Group has assigned amounts to licences and customer bases as they meet the criteria for recognition apart from goodwill. In determining the value of licences purchased in business combinations prior to adoption of EITF Topic D-108, “Use of the Residual Method to Value Acquired Assets Other Than Goodwill”, on 29 September 2004, the Group allocated the surplus of the purchase price, over the fair value attributed to the share of net assets acquired, to licences. This was on the basis the nature of the licences and the related goodwill acquired in business combinations was fundamentally indistinguishable. As a result of the adoption of EITF Topic D-108 as detailed in (h) below, for business combinations subsequent to 28 September 2004, the Group assigns amounts to licences based on a direct valuation of the licence. Any residual purchase price is then assigned to goodwill. When testing the recoverability of licences with indefinite lives, the Group adopted a direct valuation methodology on 1 January 2005. Previously, the Group had used a residual method similar to that used in the initial allocation of amounts to licences in business combinations prior to 29 September 2004.
As discussed in (g) below, deferred tax liabilities are recognized on the difference between the US GAAP carrying value of the intangible assets recognised in business combinations and their respective tax basis. Although this does not affect net assets on the date of acquisition, this results in a significantly larger residual amount being allocated to intangible assets with an offsetting entry to deferred tax liabilities.
Under UK GAAP and US GAAP, the purchase price of a transaction accounted for as an acquisition is based on the fair value of the consideration. In the case of share consideration, under UK GAAP the fair value of such consideration is based on the share price at completion of the acquisition or the date when the transaction becomes unconditional. Under US GAAP, the fair value of the share consideration is based on the average share price over a reasonable period of time before and after the proposed acquisition is agreed to and announced. This has resulted in a difference in the fair value of the consideration for certain acquisitions and consequently in the amount of goodwill capitalised under UK GAAP and US GAAP.
Under UK GAAP, costs incurred in reorganising acquired businesses are charged to the profit and loss account as post-acquisition expenses. Under US GAAP, certain of such costs are considered in the allocation of purchase consideration.
Acquisitions
As described further in note 25, the Group has undertaken a number of transactions in the year ended 31 March 2005, including stake increases in Vodafone Japan and Vodafone Hungary. Under US GAAP, these transactions have resulted in the Group assigning £2,938 million to intangible assets, including £2,260 million to cellular licences, £655 million to customer bases and £23 million to goodwill. A corresponding deferred tax liability of £1,182 million was recognised. All intangible assets acquired other than goodwill are deemed to be of finite life, with a weighted average amortisation period of 17 years, comprising licences of 21 years and customer bases of 5 years.
Goodwill
| | Mobile: OEMEA | | Mobile: UK | | Non-mobile: Germany | |
|
|
|
|
|
|
|
|
|
| 2005 | | 2004 | 2005 | | 2004 | 2005 | | 2004 |
| £m | £m | £m | £m | £m | £m |
|
|
|
|
|
|
|
|
|
|
|
| |
| 1 April | – | | – | | 467 | | 117 | | 41 | | – | |
| Additions | 23 | | – | | – | | 352 | | – | | 43 | |
| Exchange movements | – | | – | | – | | (2 | ) | 2 | | (2 | ) |
|
|
|
|
|
|
|
|
|
|
|
| |
| 31 March | 23 | | – | | 467 | | 467 | | 43 | | 41 | |
|
|
|
|
|
|
|
|
|
|
|
| |
Finite-lived intangible assets
| | 2005 | | 2004 | |
|
|
|
|
|
|
| Licences | | Customer bases | Licences | | Customer bases |
| £m | £m | £m | £m |
|
|
|
|
|
|
|
| |
| Gross carrying value | 170,039 | | 7,449 | | 164,226 | | 7,417 | |
| Accumulated amortisation | (64,468 | ) | (6,067 | ) | (48,026 | ) | (4,939 | ) |
|
|
|
|
|
|
|
| |
| | 105,571 | | 1,382 | | 116,200 | | 2,478 | |
|
|
|
|
|
|
|
| |
Back to Contents
Back to Consolidated Financial Statements Contents
Further analysis as to how amounts presented within the US GAAP reconciliation for goodwill and other intangibles, net of amortisation, have been determined is provided below.
| | 2005 | | 2004 | |
| £m | £m |
|
|
|
| |
| Deferred tax | 38,108 | | 42,188 | |
| Use of a different measurement date for the purposes of determining purchase consideration | 2,241 | | 2,630 | |
| Other | 374 | | 502 | |
|
|
|
| |
| | 40,723 | | 45,320 | |
|
|
|
| |
The total amortisation charge for the year ended 31 March 2005, under US GAAP, was £16,530 million (2004: £15,893 million; 2003: £13,873 million). The estimated future amortisation charge on finite-lived intangible assets for each of the next five years is set out in the following table. The estimate is based on finite-lived intangible assets recognised at 31 March 2005 using foreign exchange rates on that date. It is likely that future amortisation charges will vary from the figures below, as the estimate does not include the impact of any future investments, disposals, capital expenditures or fluctuations in foreign exchange rates.
| Year ending 31 March | £m | |
|
| |
| 2006 | 15,991 | |
| 2007 | 15,703 | |
| 2008 | 15,543 | |
| 2009 | 15,422 | |
| 2010 | 12,402 | |
| | | |
| (d) Capitalised interest | | |
Under UK GAAP, the Group’s policy is not to capitalise interest costs on borrowings in respect of the acquisition of tangible and intangible fixed assets. Under US GAAP, the interest costs of financing the construction of network assets and other fixed assets is capitalised during the period of construction until the date that the asset is placed in service. Interest costs of financing the acquisition of licences are also capitalised until the date that the related network service is launched. Capitalised interest costs are amortised over the estimated useful lives of the related assets. During the year ended 31 March 2005, £31 million (2004: £429 million; 2003: £408 million) of interest has been capitalised.
(e) Licence fee amortisation
Under UK GAAP, the Group has adopted a policy of amortising licence fees in proportion to the capacity of the network during the start up period and then on a straight line basis. Under US GAAP, licence fees are amortised on a straight line basis from the date that operations commence over their estimated useful economic lives.
(f) Exceptional items
In the year ended 31 March 2005, the Group recorded an impairment charge under UK GAAP of £315 million in relation to the fixed assets of Vodafone Sweden. Under US GAAP, the Group evaluated the recoverability of these assets in accordance with the requirements of SFAS No. 144, “Accounting for the Impairment or Disposal of Long-Lived Assets”, and determined that the carrying amount of these assets was recoverable. As a result, the UK GAAP impairment charge of £315 million was not recognised under US GAAP. The reversal of this impairment was partially offset by the incremental loss on the disposal of 16.9% of Vodafone Egypt under US GAAP which arose primarily due to the reclassification of currency losses from other comprehensive income to net loss.
The results of operations of Japan Telecom, which was deconsolidated from 1 October 2003, are reported as discontinued operations under US GAAP and are included in the segment “Other operations – Asia Pacific”. The pre-tax loss, including the loss on sale, was £515 million for the year ended 31 March 2004 (2003: income of £133 million). An incremental loss on disposal of £476 million (£351 million net of minority interests) was recognised under US GAAP resulting in a total loss on sale of £555 million (£399 million net of minority interests).
In the year ended 31 March 2003, the Group recorded an impairment charge under UK GAAP of £405 million in relation to the fixed assets of Japan Telecom. Under US GAAP, the Group evaluated the recoverability of these fixed assets in accordance with the requirements of SFAS No. 144 and determined that the carrying amount of these assets was recoverable. As a result, the UK GAAP impairment charge of £405 million (£270 million net of minority interests) was not recognised under US GAAP during the year ended 31 March 2003.
In addition, the exceptional non-operating items recorded under UK GAAP, disclosed in note 6, are reclassified as operating items under US GAAP.
(g) Income taxes
Under UK GAAP, deferred tax is provided in full on timing differences that result in an obligation at the balance sheet date to pay more tax, or a right to pay less tax, at a future date, at rates expected to apply when they crystallise based on current tax rates and law. Under US GAAP, deferred tax assets and liabilities are provided in full on all temporary differences and a valuation adjustment is established in respect of those deferred tax assets where it is more likely than not that some portion will not be realised. The most significant component of the income tax adjustment is due to the temporary difference between the assigned values and tax values of intangible assets acquired in a business combination, which results in the recognition of deferred tax liabilities under US GAAP. Under UK GAAP, no such deferred tax liabilities are recognised.
Back to Contents
Back to Consolidated Financial Statements Contents
|
| Notes to the Consolidated Financial Statements continued |
|
| 36.US GAAP information continued |
Under UK GAAP, deferred tax assets are recognised for future deductions and utilisations of tax carry-forwards to the extent that it is more likely than not that suitable taxable profit is expected to be available. While the effects on the net deferred assets are the same, under US GAAP, the deferred tax assets are recognised at their full amounts and reduced by a valuation allowance to the extent it is more likely than not that suitable taxable profits will not be available. The valuation allowance established against deferred tax assets at 31 March 2005 was £10,413 million (2004: £11,150 million), the movement in the year being £737 million (2004: £296 million). The valuation allowance is mainly in respect of tax losses amounting to £10,413 million (2004: £11,018 million) not recognised.
In respect of Verizon Wireless, the line “Investments accounted for under the equity method” includes the Group’s share of pre-tax partnership income and the Group’s share of the post-tax income attributable to corporate entities (as determined for US corporate income tax purposes) held by the partnership. The tax attributable to the Group’s share of allocable partnership income is included as part of “Income taxes” in the reconciliations of net loss and shareholders’ equity. This treatment reflects the fact that tax on allocable partnership income is, for US corporate income tax purposes, a liability of the partners and not the partnership.
The Group has not provided certain deferred tax liabilities related to the outside basis differences of its foreign subsidiaries and foreign joint ventures under Accounting Principles Board Opinion (“APB”) No. 23, “Accounting for Income Taxes – Special Areas”, because it is the Group’s policy to permanently reinvest such earnings giving rise to such basis differences and such differences are permanent in duration. Quantifying the amount of undistributed earnings and deferred tax liabilities associated with those earnings is not practicable.
FASB Staff Position (“FSP”) No. 109-2, “Accounting and Disclosure Guidance for the Foreign Earnings Repatriation Provision within the American Jobs Creation Act of 2004”, provides guidance under FASB Statement No. 109, “Accounting for Income Taxes,” with respect to recording the potential impact of the repatriation provisions of the American Jobs Creation Act of 2004 (the “JOBS Act”) on a company’s income tax expense and deferred tax liability balances. The JOBS Act was enacted on 22 October 2004. FSP No. 109-2 states that an enterprise is allowed time beyond the financial reporting period of enactment to evaluate the effect of the JOBS Act on its plan for reinvestment or repatriation of foreign earnings for purposes of applying FAS Statement No. 109. Vodafone has determined that the benefits obtained from these provisions are immaterial to the financial statements at 31 March 2005.
(h) Cumulative effect of changes in accounting principles
EITF Topic D-108
On 29 September 2004, the SEC Staff announced new guidance on the interpretation of SFAS No. 142 in relation to the valuation of intangibles assets in business combinations and impairment testing. This guidance has been codified as EITF Topic D-108. Historically, the Group assigned to mobile licences the residual purchase price in business combinations in excess of the fair values of all assets and liabilities acquired other than mobile licences and goodwill. This approach was on the basis that mobile licences were indistinguishable from goodwill. The new SEC guidance requires the Group to distinguish between mobile licences and goodwill. However, the new guidance does not permit the amount historically reported as mobile licences to be subsequently reallocated between mobile licences and goodwill.
The new guidance will affect the allocation of the purchase price in future business combinations involving entities with mobile licences. The Group has applied the guidance relating to the allocation of purchase price to all business combinations consummated subsequent to 29 September 2004. This has resulted in values being assigned to licences using direct valuation method with any remaining residual purchase price allocated to goodwill.
In impairment testing of mobile licences held by Verizon Wireless under SFAS No. 142, the Group has used a similar residual approach to determine the fair value of the licences when testing the asset for recoverability. In their announcement, the SEC Staff stated that the residual method of accounting for intangible assets should no longer be used and that companies should perform an impairment test using a direct method on all assets which were previously tested using a residual method. The Group’s licences in other business are not tested for recoverability using a residual method and are, therefore, not affected by the new guidance.
The Group completed its transitional impairment test of Verizon Wireless’ mobile licences as of 1 January 2005. This resulted in a pre-tax charge of £11,416 million. This impairment is included, net of the related tax of £5,239 million, in the cumulative effect of change in accounting principle in the reconciliation of net loss. The tax effect comprises the release of £1,220 million representing the Group’s share of Verizon Wireless’ deferred tax liabilities and £4,019 million deferred tax liabilities representing taxes recognised by the Group on its investment in Verizon Wireless. Fair value was determined as the present value of estimated future net cash flows allocable to the mobile licences. Verizon Wireless is in the segment “Mobile telecommunications – Americas”.
Accounting for post employment benefits
During the second half of the year ended 31 March 2005, the Group amended its policy for accounting for actuarial gains and losses arising from its pension obligations effective 1 April 2004. Until 31 March 2004, the Group used a corridor approach under SFAS No. 87, “Employers’ Accounting for Pensions” in which actuarial gains and losses were deferred and amortised over the expected remaining service period of the employees. The Group now recognises these gains and losses through the profit and loss in the period in which they arise as the new policy more faithfully represents the Group’s financial position and will more fully align the Group’s US GAAP policy to its IFRS policy of immediate recognition of these items.
The pro forma amounts in the reconciliation of net loss have been adjusted for the effect of retroactive application of the immediate recognition of actuarial gains and losses less related tax effects. Other adjustments, such as to employee/director compensation or interest expense, are not included as these would not have been affected had the new policy been applied in previous years.
The cumulative effect on periods prior to adoption of £288 million has been shown, net of tax of £93 million, as a cumulative effect of a change in accounting principle in the reconciliation of net loss for the year ended 31 March 2005. The effect of the change in the year ended 31 March 2005 was to increase loss from continuing operations by £55 million (or 0.08 pence per share). The effect of the change on the six months ended 30 September 2004 was to increase loss from continuing operations by £31 million (or 0.05 pence per share).
Back to Contents
Back to Consolidated Financial Statements Contents
(i) Proposed dividends
Under UK GAAP, final dividends are included in the financial statements when recommended by the Board to the shareholders in respect of the results for a financial year. Under US GAAP, dividends are included in the financial statements when declared by the Board.
(j) Other
Marketable securities
Under US GAAP, the Group classifies its marketable equity securities with readily determinable fair values as available for sale and are stated at fair value with the unrealised loss or gain, net of deferred taxes, reported in comprehensive income. Under UK GAAP, such investments are generally carried at cost and reviewed for other than temporary impairment.
The Group’s fixed asset investments, comprising mainly of equity securities, are classified as available for sale. The table below sets out the information of the cost, fair value and unrealised gains and losses.
| | UK GAAP net book | | Unrealised gains | | Unrealised losses | | Fair value | |
| value(1) |
| £m | £m | £m | £m |
|
|
|
|
|
|
|
| |
| 31 March 2005 | 852 | | 330 | | – | | 1,182 | |
|
|
|
|
|
|
|
| |
| 31 March 2004 | 1,049 | | 241 | | – | | 1,290 | |
|
|
|
|
|
|
|
| |
| Note: | | | | | | | | |
| (1) Determined using the weighted average cost basis. | | | | | | | | |
Minority interests
Where losses in a subsidiary undertaking attributable to the minority interest result in its interest being one in net liabilities, UK GAAP requires a parent company make provision only to the extent it has a commercial or legal obligation to provide funding that may not be recoverable in respect of the accumulated losses attributable to the minority interest. US GAAP requires all losses allocable to minority interests in excess of their interest in the equity of the respective subsidiary to be charged to the majority shareholder.
Derivative instruments
All the Group’s transactions in derivative financial instruments are undertaken for risk management purposes only and are used to hedge its exposure to interest rate and foreign currency risk. In accordance with UK GAAP, to the extent that such instruments are matched against an underlying asset or liability, they are accounted for as hedging transactions and recorded at appropriate historical amounts, with fair value information disclosed in the notes to the Consolidated Financial Statements. Under US GAAP, in accordance with SFAS No. 133, “Accounting for Derivative Instruments and Hedging Activities”, the Group’s derivative financial instruments, together with any separately identified embedded derivatives, are reported as assets or liabilities on the Group’s balance sheet at fair value. In a hedge of fair values, changes in the fair value of the derivative are recorded in earnings with a corresponding change in the fair value of the hedged item also being recorded in earnings. For hedges of future cash flows, the changes in fair value of the derivative are recorded in other comprehensive income and reclassified to earnings when the hedged item affects earnings. Under US GAAP, all changes in fair value of derivatives not designated in hedging relationships are accounted for in the consolidated profit and loss account. The Group does not pursue hedge accounting treatment for:
| – | interest rate futures, which are typically used to switch floating interest rates to fixed interest rates; |
| | |
| – | derivatives entered into for funding and liquidity purposes, including forwards; or |
| | |
| – | individual contracts where the underlying value of the transactions amounts to less than £10 million. |
The net effect recognised in earnings representing hedge ineffectiveness for fair value hedges and cash flow hedges is not material.
Post employment benefits
Under both UK GAAP and US GAAP, pension costs provide for future pension liabilities. There are differences, however, in the prescribed methods of valuation, which give rise to GAAP adjustments to the pension cost and the pension prepayment/liability. As at 31 March 2005, the Group operated a number of pension plans for the benefit of its employees throughout the world, which vary with conditions and practices in the countries concerned. A description of the Group’s major pension plans is provided in note 32.
The investment policy and strategy of the UK main scheme in the UK is set by the Trustees and reflects the liabilities of the plan. The investment policy and strategy of the German plans are set by the Investment Sub-Committee of the Contractual Trust Agreement and similarly reflects the liabilities of the plans, which are more heavily weighted towards pensioners than the UK plan.
The basis used to determine the overall long term return on plan assets is to apply the expected rate of return on bonds based on market interest rates at the relevant date to that proportion of the assets invested in bonds. The bond rate of return is then increased by an allowance for the expected equity risk premium in each market, based on past experience and future expectations of return and this rate is applied to the relevant proportion invested in equities. The measurement date for the Group’s pension assets and obligations is 31 March. The measurement date for the Group’s net periodic pension cost is 1 April. From 1 April 2004, actuarial gains and losses are recognised in the period in which they arise.
Analyses of the net pension cost, plan assets, obligations and funded status for the major defined benefit plans in the UK, Germany and Japan, prepared under US GAAP, are provided in the following table.
Back to Contents
Back to Consolidated Financial Statements Contents
|
Notes to the Consolidated Financial Statements continued |
|
| 36.US GAAP information continued |
| | UK | | Germany | | Japan | |
|
|
|
| 2005 | | 2004 | | 2003 | 2005 | | 2004 | | 2003 | 2005 | | 2004 | | 2003 |
| £m | £m | £m | £m | £m | £m | £m | £m | £m |
|
|
|
|
|
|
|
|
|
|
|
|
|
|
|
|
|
| |
| Service cost | 37 | | 25 | | 23 | | 6 | | 3 | | 3 | | 5 | | 10 | | 12 | |
| Interest costs | 26 | | 19 | | 16 | | 9 | | 7 | | 7 | | 1 | | 1 | | 2 | |
| Expected return on assets | (31 | ) | (21 | ) | (23 | ) | (8 | ) | (4 | ) | (1 | ) | – | | – | | – | |
| Actuarial gains and losses | 72 | | 16 | | 9 | | 25 | | 2 | | 3 | | – | | 1 | | 1 | |
|
|
|
|
|
|
|
|
|
|
|
|
|
|
|
|
|
| |
| Net periodic pension cost | 104 | | 39 | | 25 | | 32 | | 8 | | 12 | | 6 | | 12 | | 15 | |
|
|
|
|
|
|
|
|
|
|
|
|
|
|
|
|
|
| |
| Termination benefits and | | | | | | | | | | | | | | | | | | |
| curtailment costs | – | | – | | – | | – | | – | | – | | (1 | ) | (16 | ) | 24 | |
|
|
|
|
|
|
|
|
|
|
|
|
|
|
|
|
|
| |
| Accumulated benefit obligation | 545 | | 390 | | 279 | | 208 | | 153 | | 141 | | 24 | | 25 | | 106 | |
|
|
|
|
|
|
|
|
|
|
|
|
|
|
|
|
|
| |
| Change in projected benefit obligation: | | | | | | | | | | | | | | | | | | |
| Benefit obligation at 1 April | 457 | | 327 | | 258 | | 158 | | 145 | | 119 | | 35 | | 127 | | 115 | |
| Service cost | 37 | | 25 | | 23 | | 6 | | 3 | | 3 | | 5 | | 10 | | 12 | |
| Interest cost | 26 | | 19 | | 16 | | 9 | | 7 | | 7 | | 1 | | 1 | | 2 | |
| Members’ contributions | 11 | | 10 | | 9 | | – | | – | | – | | – | | – | | – | |
| Amendments | – | | – | | – | | – | | – | | (3 | ) | – | | – | | 5 | |
| Actuarial loss/(gain) | 95 | | 82 | | 28 | | 44 | | 19 | | 13 | | – | | (3 | ) | 4 | |
| Curtailment | – | | – | | – | | – | | (2 | ) | – | | (1 | ) | – | | 2 | |
| Settlement | – | | – | | – | | – | | – | | – | | – | | (76 | ) | 13 | |
| Special termination benefit | – | | – | | – | | – | | – | | – | | – | | – | | 9 | |
| Benefits paid (estimated) | (7 | ) | (6 | ) | (7 | ) | (9 | ) | (9 | ) | (9 | ) | (9 | ) | (22 | ) | (36 | ) |
| Exchange movement | – | | – | | – | | 5 | | (5 | ) | 15 | | (1 | ) | (2 | ) | 1 | |
|
|
|
|
|
|
|
|
|
|
|
|
|
|
|
|
|
| |
| Benefit obligation at 31 March | 619 | | 457 | | 327 | | 213 | | 158 | | 145 | | 30 | | 35 | | 127 | |
|
|
|
|
|
|
|
|
|
|
|
|
|
|
|
|
|
| |
| Change in plans’ assets: | | | | | | | | | | | | | | | | | | |
| Fair value of assets at 1 April | 433 | | 264 | | 229 | | 136 | | 86 | | 1 | | 2 | | 1 | | 1 | |
| Actual return/(loss) on plans’ assets | 54 | | 77 | | (73 | ) | 27 | | 7 | | – | | – | | 1 | | – | |
| Employer’s contributions | 136 | | 88 | | 106 | | 14 | | 57 | | 88 | | 9 | | 22 | | 36 | |
| Members’ contributions | 12 | | 10 | | 9 | | – | | – | | – | | – | | – | | – | |
| Benefits paid (estimated) | (7 | ) | (6 | ) | (7 | ) | – | | (9 | ) | (9 | ) | (9 | ) | (22 | ) | (36 | ) |
| Exchange movement | – | | – | | – | | 4 | | (5 | ) | 6 | | – | | – | | – | |
|
|
|
|
|
|
|
|
|
|
|
|
|
|
|
|
|
| |
| Fair value of assets at 31 March | 628 | | 433 | | 264 | | 181 | | 136 | | 86 | | 2 | | 2 | | 1 | |
|
|
|
|
|
|
|
|
|
|
|
|
|
|
|
|
|
| |
| Funded status | 9 | | (24 | ) | (63 | ) | (32 | ) | (22 | ) | (59 | ) | (28 | ) | (33 | ) | (126 | ) |
| Unrecognised net loss(1) | – | | 203 | | 195 | | – | | 57 | | 46 | | – | | 3 | | 24 | |
| Prior period service cost | – | | 1 | | 1 | | – | | – | | – | | – | | 5 | | 5 | |
|
|
|
|
|
|
|
|
|
|
|
|
|
|
|
|
|
| |
| Net amount recognised | 9 | | 180 | | 133 | | (32 | ) | 35 | | (13 | ) | (28 | ) | (25 | ) | (97 | ) |
|
|
|
|
|
|
|
|
|
|
|
|
|
|
|
|
|
| |
| Amounts recognised in the statement of financial position: | | | | | | | | | | | | | | | |
| Prepaid/(accrued) benefit cost | 9 | | 180 | | (15 | ) | (32 | ) | (11 | ) | (55 | ) | (28 | ) | (25 | ) | (105 | ) |
| Intangible asset | – | | – | | 1 | | – | | – | | – | | – | | – | | 5 | |
| Other comprehensive income | – | | – | | 147 | | – | | 46 | | 42 | | – | | – | | 3 | |
|
|
|
|
|
|
|
|
|
|
|
|
|
|
|
|
|
| |
| Net amount recognised | 9 | | 180 | | 133 | | (32 | ) | 35 | | (13 | ) | (28 | ) | (25 | ) | (97 | ) |
|
|
|
|
|
|
|
|
|
|
|
|
|
|
|
|
|
| |
| Expected contributions in year ended | | | | | | | | | | | | | | | | | | |
| 31 March 2006 | 36 | | | | | | – | | | | | | – | | | | | |
| Expected payments in year ended | | | | | | | | | | | | | | | | | | |
| 31 March: | | | | | | | | | | | | | | | | | | |
| 2006 | 7 | | | | | | 11 | | | | | | – | | | | | |
| 2007 | 7 | | | | | | 11 | | | | | | – | | | | | |
| 2008 | 7 | | | | | | 12 | | | | | | – | | | | | |
| 2009 | 8 | | | | | | 12 | | | | | | – | | | | | |
| 2010 | 8 | | | | | | 13 | | | | | | – | | | | | |
| 2011-2016 | 43 | | | | | | 71 | | | | | | 3 | | | | | |
| Weighted-average actuarial assumptions used to determine benefit obligations: | | | | | | | | | | | | | |
| Discount rate | 5.4% | | 5.5% | | 5.9% | | 4.5% | | 5.3% | | 5.3% | | 2.3% | | 2.3% | | 1.5% | |
| Rate of compensation increase | 4.8% | | 4.5% | | 4.0% | | 2.9% | | 3.0% | | 2.0% | | – | | – | | – | |
| Weighted-average actuarial assumptions used to determine net periodic benefit cost: | | | | | | | | | | | | | |
| Discount rate | 5.5% | | 5.9% | | 6.5% | | 5.3% | | 5.3% | | 6.0% | | 2.3% | | 1.5% | | 2.5% | |
| Rate of compensation increase | 4.5% | | 4.0% | | 4.0% | | 3.0% | | 2.0% | | 2.5% | | – | | – | | – | |
| Expected long-term return on plan assets | 6.9% | | 7.5% | | 8.0% | | 5.3% | | 5.3% | | 6.0% | | 2.8% | | 3.0% | | 4.4% | |
|
|
|
|
|
|
|
|
|
|
|
|
|
|
|
|
|
| |
Back to Contents
Back to Consolidated Financial Statements Contents
Stock based compensation
The Company currently uses a number of share plans to grant options and share awards to its directors and employees described in note 22. Under UK GAAP, options granted over the Company’s ordinary shares are accounted for using the intrinsic value method, with the difference between the fair value of shares and the exercise price charged to the profit and loss over the period until the shares first vest. Grants under the Group’s Sharesave Scheme are exempt from this accounting methodology.
Under US GAAP, the Group accounts for option plans in accordance with the requirements of APB No. 25, “Accounting for Stock Issued to Employees” and applies the disclosure provisions of SFAS No. 148, “Accounting for Stock-Based Compensation – Transition and Disclosure”. Under APB No. 25, such plans are accounted for as variable plans and the cost is calculated by reference to the market price of the shares at the measurement date, which is usually the date the shares vest, and amortised over the period until the shares vest. Where the measurement date has not yet been reached, the cost is calculated by reference to the market price of the relevant shares at the end of each accounting period.
Movements in ordinary share options and ADS options outstanding during the years ended 31 March 2005, 2004 and 2003 are as follows:
| | Number of ADS options | | Number of ordinary share options | |
| |
|
| 2005 | | | 2004 | | | 2003 | | | 2005 | | | 2004 | | | 2003 |
| (millions) | (millions) | (millions) | (millions) | (millions) | (millions) |
|
|
|
|
|
|
|
|
|
|
|
|
|
|
|
|
| |
| At 1 April | | 17.7 | | | 21.0 | | | 43.8 | | | 1,184.0 | | | 1,110.9 | | | 488.3 | |
| Granted | | 0.2 | | | 2.2 | | | 6.5 | | | 60.1 | | | 192.0 | | | 700.9 | |
| Exercised | | (5.3 | ) | | (4.6 | ) | | (2.7 | ) | | (60.0 | ) | | (36.6 | ) | | (9.7 | ) |
| Forfeited | | (1.4 | ) | | (0.9 | ) | | (26.6 | ) | | (61.5 | ) | | (82.3 | ) | | (68.6 | ) |
|
|
|
|
|
|
|
|
|
|
|
|
|
|
|
|
|
| |
| At 31 March | | 11.2 | | | 17.7 | | | 21.0 | | | 1,122.6 | | | 1,184.0 | | | 1,110.9 | |
|
|
|
|
|
|
|
|
|
|
|
|
|
|
|
|
|
| |
| | | | | | | | | | | | | | | | | | | |
|
|
|
|
|
|
|
|
|
|
|
|
|
|
|
|
|
| |
| Exercisable at 31 March | | 7.6 | | | 9.2 | | | 11.7 | | | 353.1 | | | 107.0 | | | 90.7 | |
|
|
|
|
|
|
|
|
|
|
|
|
|
|
|
|
|
| |
| Weighted average exercise price: | | | | | | | | | | | | | | | | | | |
| Granted during year | | $20.19 | | | $20.34 | | | $13.71 | | | £1.17 | | | £1.19 | | | £0.99 | |
| Exercised during year | | $16.75 | | | $15.03 | | | $10.00 | | | £0.94 | | | £1.00 | | | £0.82 | |
| Forfeited during year | | $38.05 | | | $34.17 | | | $33.61 | | | £1.43 | | | £1.34 | | | £1.46 | |
| Outstanding at 31 March | | $38.76 | | | $22.97 | | | $22.32 | | | £1.22 | | | £1.16 | | | £1.23 | |
| Exercisable at 31 March | | $27.74 | | | $28.29 | | | $25.20 | | | £1.65 | | | £2.13 | | | £1.45 | |
|
|
|
|
|
|
|
|
|
|
|
|
|
|
|
|
|
| |
The weighted average fair value of ADS options and ordinary share options and the weighted average assumptions used to determine fair value are set out in the following table:
| | ADS options | | Ordinary share options | |
| |
| |
| |
| | | 2005 | | | 2004 | | | 2003 | | | 2005 | | | 2004 | | | 2003 | |
|
|
|
|
|
|
|
|
|
|
|
|
|
|
|
|
|
| |
| Weighted average fair value | | $6.34 | | | $5.92 | | | $4.49 | | | £0.33 | | | £0.37 | | | £0.28 | |
| Weighted average assumptions: | | | | | | | | | | | | | | | | | | |
| Volatility | | 26.10 | % | | 39.19 | % | | 34.83 | % | | 25.25 | % | | 37.93 | % | | 34.82 | % |
| Expected dividend yield | | 1.91 | % | | 0.82 | % | | 0.62 | % | | 1.92 | % | | 0.81 | % | | 0.63 | % |
| Risk-free interest rate | | 5.10 | % | | 3.82 | % | | 5.02 | % | | 5.16 | % | | 3.75 | % | | 4.97 | % |
| Expected option lives (years) | | 6.3 | | | 3.5 | | | 3.5 | | | 5.47 | | | 3.4 | | | 3.5 | |
During the year ended 31 March 2005, the Group granted 99.1 million restricted shares with a weighted average fair value at grant of £1.11.
Had compensation cost been determined based upon the fair value of the share options and ADS options at grant date, the Group’s net loss and loss per share would have been restated to the pro forma amounts indicated below (in millions, except per share amounts):
| | 2005 | | 2004 | | 2003 | |
| £m | £m | £m |
|
|
|
|
|
| |
| Net loss as reported under US GAAP | (13,782 | ) | (8,127 | ) | (9,055 | ) |
| Share-based employee compensation expense, net of related tax effects, included in the | | | | | | |
| determination of net income as reported | 198 | | 129 | | 48 | |
| Share-based employee compensation expense, under fair value based method for all awards, | | | | | | |
| net of related tax effects | (168 | ) | (107 | ) | (65 | ) |
|
|
|
|
|
| |
| Pro forma net loss | (13,752 | ) | (8,105 | ) | (9,072 | ) |
|
|
|
|
|
| |
| Loss per share | | | | | | |
| Basic and diluted – as reported under US GAAP | (20.82 | )p | (11.93 | )p | (13.29 | )p |
| Basic and diluted – pro forma | (20.77 | )p | (11.90 | )p | (13.31 | )p |
Back to Contents
Back to Consolidated Financial Statements Contents
|
Notes to the Consolidated Financial Statements continued |
|
| 36.US GAAP information continued |
| | |
| (k) | Loss per share |
| |
| The share options and share plans described in note 22 were excluded from the calculation of diluted loss per share as the effect of their inclusion in the calculation would be antidilutive due to the Group recognising a loss in all periods presented. |
| |
| (l) | Comprehensive (loss)/income |
Total recognised losses under UK GAAP include net loss and currency translation adjustment. Under US GAAP, comprehensive (loss)/income is the change in equity during a period resulting from transactions other than with shareholders. Comprehensive (loss)/income is comprised of net loss, the minimum pension liability adjustment, changes in the fair value of available for sale securities and derivatives used in cash flow hedging relationships, and currency translation adjustment.
During the year ended 31 March 2005, £63 million of foreign currency losses were reclassified from other comprehensive income and included in the determination of net loss as a result of the partial disposal of Vodafone Egypt.
| 37.Changes in accounting standards |
| International Financial Reporting Standards |
On 19 July 2002, the European Parliament adopted Regulation No. 1606/2002 requiring listed companies in the Member States of the European Union to prepare their consolidated financial statements in accordance with International Financial Reporting Standards (“IFRS”) from 2005. IFRS will apply for the first time in the Group’s Annual Report for the year ending 31 March 2006. Consequently, the Group’s interim results for the six month period ending 30 September 2005 will be presented under IFRS together with restated information for the six months ended 30 September 2004 and the year ended 31 March 2005.
US standards
SFAS No. 123 (Revised 2004), “Share-Based Payment”
In December 2004, the FASB issued a revised version of SFAS No. 123 (SFAS No. 123R), which among other changes, eliminates the option to account for share-based payment to employees using the intrinsic value method and requires share-based payment to be recorded using the fair value method. Under the fair value method, compensation cost for employees and directors is determined at the date awards are granted and recognised over the service period. The Group is currently analysing the effects of the new standard including the alternative methods of adoption.
Staff Accounting Bulletin 107
The SEC issued SAB 107 in March 2005. SAB 107 summarizes the views of the SEC staff regarding the interaction between SFAS No. 123R and certain Securities and Exchange Commission rules and regulations and provides the staff’s views regarding the valuation of share-based payment arrangements for public companies. The Group is currently analysing the effects of this SAB and will adopt SAB 107 concurrently with SFAS No. 123.
Back to Contents
|
| Report of Independent Auditors |
|
Independent Auditors’ Report to the Members of
Vodafone Group Plc
We have audited the consolidated financial statements of Vodafone Group Plc for the year ended 31 March 2005, which comprise the consolidated and Company balance sheets at 31 March 2005 and 2004, the consolidated profit and loss accounts, the consolidated cash flow statements, the consolidated statements of total recognised gains and losses and the movement in total equity shareholders’ funds for the three years ended 31 March 2005 and the related notes 1 to 37. These financial statements have been prepared under the accounting policies set out therein. We have also audited the information in the part of the Board’s Report to Shareholders on Directors’ Remuneration that is described as having been audited.
Respective Responsibilities of Directors and Auditors
As described in the Statement of Directors’ Responsibilities, the Company’s directors are responsible for the preparation of the financial statements in accordance with applicable United Kingdom law and accounting standards. They are also responsible for the preparation of the other information contained in the Annual Report including the Board’s Report to Shareholders on Directors’ Remuneration. Our responsibility is to audit the financial statements and the part of the Board’s Report to Shareholders on Directors’ Remuneration described as having been audited in accordance with relevant United Kingdom legal and regulatory requirements and auditing standards.
We report to you our opinion as to whether the financial statements give a true and fair view and whether the financial statements and the part of the Board’s Report to Shareholders on Directors’ Remuneration described as having been audited have been properly prepared in accordance with the Companies Act 1985. We also report to you if, in our opinion, the Directors’ Report is not consistent with the financial statements, if the Company has not kept proper accounting records, if we have not received all the information and explanations we require for our audit, or if information specified by law regarding directors’ remuneration and transactions with the Company and other members of the Group is not disclosed.
We review whether the corporate governance statement reflects the Company’s compliance with the nine provisions of the July 2003 FRC Combined Code specified for our review by the Listing Rules of the Financial Services Authority, and we report if it does not. We are not required to consider whether the Board’s statements on internal control cover all risks and controls, or form an opinion on the effectiveness of the Group’s corporate governance procedures or its risk and control procedures.
We read the Directors’ Report and the other information contained in the Annual Report for the year ended 31 March 2005 as described in the contents section, including the unaudited part of the Board’s Report to Shareholders on Directors’ Remuneration and consider the implications for our report if we become aware of any apparent misstatements or material inconsistencies with the financial statements.
Basis of Audit Opinion
We conducted our audit in accordance with United Kingdom auditing standards issued by the Auditing Practices Board and with the standards of the Public Company Accounting Oversight Board (United States). The Company is not required to have, nor were we engaged to perform, an audit of its internal control over financial reporting. Our audit included consideration of internal control over financial reporting as a basis for designing audit procedures that are appropriate in the circumstances but not for the purpose of expressing an opinion on the effectiveness of the Company’s internal control over financial reporting. Accordingly, we express no such opinion. An audit includes examination, on a test basis, of evidence relevant to the amounts and disclosures in the financial statements and the part of the Board’s Report to Shareholders on Directors’ Remuneration described as having been audited. It also includes an assessment of the significant estimates and judgements made by the directors in the preparation of the
financial statements, and of whether the accounting policies are appropriate to the circumstances of the Company and the Group, consistently applied and adequately disclosed.
We planned and performed our audit so as to obtain all the information and explanations which we considered necessary in order to provide us with sufficient evidence to give reasonable assurance that the financial statements and the part of the Board’s Report to Shareholders on Directors’ Remuneration described as having been audited are free from material misstatement, whether caused by fraud or other irregularity or error. In forming our opinion, we also evaluated the overall adequacy of the presentation of information in the financial statements and the part of the Board’s Report to Shareholders on Directors’ Remuneration described as having been audited.
Opinions
UK opinion
In our opinion:
| • | the financial statements give a true and fair view of the state of affairs of the Company and the Group at 31 March 2005 and of the loss of the Group for the year then ended; and |
| • | the financial statements and that part of the Board’s Report to Shareholders on Directors’ Remuneration described as having been audited have been properly prepared in accordance with the Companies Act 1985. |
US opinion
In our opinion:
| • | the financial statements present fairly, in all material respects, the consolidated financial position of the Group at 31 March 2005 and 2004 and the consolidated results of its operations and cash flows for each of the three years in the period ended 31 March 2005 in conformity with accounting principles generally accepted in the United Kingdom. |
Accounting principles generally accepted in the United Kingdom vary in significant respects from accounting principles generally accepted in the United States of America. Information relating to the nature and effect of such differences is presented in note 36 to the consolidated financial statements.

Deloitte & Touche LLP
Chartered Accountants and Registered Auditors
London, England
24 May 2005
Back to Contents
|
| Information on International Financial Reporting Standards |
|
Introduction
On 19 July 2002, the European Parliament adopted Regulation No. 1606/2002 requiring listed companies in the Member States of the European Union to prepare their consolidated financial statements in accordance with International Financial Reporting Standards (“IFRS”) from 2005. IFRS will apply for the first time in the Group’s Annual Report for the year ending 31 March 2006. Consequently, the Group’s interim results for the six month period ending 30 September 2005 will be presented under IFRS together with restated information for the six months ended 30 September 2004 and the year ended 31 March 2005.
The Group provided an update of its adoption of IFRS on 20 January 2005 which included restated financial information for the six months ended 30 September 2004, and additional IFRS segmental information was released on 18 March 2005. The Group currently intends to publish restated IFRS financial information for the year ended 31 March 2005 in July 2005. These updates are available on the Company’s website, www.vodafone.com.
Basis of preparation of IFRS financial information
The Group’s IFRS financial information for the year ending 31 March 2006 will be prepared in accordance with the IFRS, International Accounting Standards (“IAS”) and interpretations issued by the IASB and its committees, and as interpreted by any regulatory bodies applicable to the Group, for those standards that are mandatory for EU listed companies adopting IFRS for the first time. In addition, the Group has elected to adopt early the amendment to IAS 19, “Employee Benefits”, issued on 16 December 2004 which allows actuarial gains and losses to be charged or credited to equity.
On 19 November 2004, the European Commission endorsed an amended version of IAS 39, “Financial Instruments: Recognition and Measurement” rather than the full version as previously published by the IASB. In accordance with guidance issued by the UK Accounting Standards Board, the full version of IAS 39, as issued by the IASB, will be adopted.
Following the SEC’s issuance on 12 April 2005 of its final rule, “First-Time Application of International Financial Reporting Standards”, the Group’s Annual Report for the year ending 31 March 2006 will provide one year of comparative financial information under IFRS and the opening balance sheet date for adoption of IFRS will be 1 April 2004.
IFRS 1 exemptions
IFRS 1, “First-time Adoption of International Financial Reporting Standards” sets out the procedures that the Group must follow when it adopts IFRS for the first time as the basis for preparing its consolidated financial statements. The Group is required to establish its IFRS accounting policies as at 31 March 2006 and, in general, apply these retrospectively to determine the IFRS opening balance sheet at its date of transition, 1 April 2004. This standard provides a number of optional exceptions to this general principle. The most significant of these are set out below, together with a description in each case of the exception to be adopted by the Group.
Business combinations that occurred before the opening IFRS balance sheet date (IFRS 3, “Business Combinations”).
The Group has elected not to apply IFRS 3 retrospectively to business combinations that took place before the date of transition. As a result, in the opening balance sheet, goodwill arising from past business combinations remains as stated under UK GAAP at 31 March 2004.
Employee Benefits – actuarial gains and losses (IAS 19, “Employee Benefits”)
The Group has elected to recognise all cumulative actuarial gains and losses in relation to employee benefit schemes at the date of transition.
Share-based Payments (IFRS 2, “Share-based Payment”)
The Group has elected to apply IFRS 2 to all relevant share-based payment transactions granted but not fully vested at 1 April 2004.
Financial Instruments (IAS 39, “Financial Instruments: Recognition and Measurement” and IAS 32, “Financial Instruments: Disclosure and Presentation”)
The Group has applied IAS 32 and IAS 39 for all periods presented and has therefore not taken advantage of the exemption in IFRS 1 that would enable the Group to only apply these standards from 1 April 2005.
Reconciliation of IFRS equity shareholders’ funds at opening balance sheet date
The following is a summary of the effects of the differences between IFRS and UK GAAP on the Group’s total equity shareholders’ funds at the opening balance sheet date. Further significant differences may arise from accounting standards and pronouncements that the IASB could issue in the future and which the Group may elect to early adopt in its first IFRS accounts.
| | At 1 April 2004
£m | |
|
| |
| | | |
| Total equity shareholders’ funds (UK GAAP) | 111,924 | |
| Proposed dividends | 728 | |
| Financial instruments | 385 | |
| Defined benefit pension schemes | (257 | ) |
| Licence fee amortisation | (164 | ) |
| Deferred and current taxes | (1,011 | ) |
| Share based payments | 12 | |
| Other | (66 | ) |
|
| |
| Total equity shareholders’ funds (IFRS) | 111,551 | |
|
| |
| 138 | | Shareholder information |
Back to Contents
Principal differences between IFRS and UK GAAP
Measurement and Recognition
The Group has identified the principal differences between IFRS and the Group’s UK GAAP accounting policies, which are summarised below.
Proposed dividends
IAS 10, “Events after the Balance Sheet Date” requires that dividends declared after the balance sheet date should not be recognised as a liability at that balance sheet date as the liability does not represent a present obligation as defined by IAS 37, “Provisions, Contingent Liabilities and Contingent Assets”.
The final dividend declared in May 2004 in relation to the financial year ended 31 March 2004 of £728 million has been reversed in the opening balance sheet.
Financial Instruments
IAS 32, “Financial Instruments: Disclosure and Presentation” and IAS 39, “Financial Instruments: Recognition and Measurement” address the accounting for, and reporting of, financial instruments. IAS 39 sets out detailed accounting requirements in relation to financial assets and liabilities.
All derivative financial instruments are accounted for at fair market value whilst other financial instruments are accounted for either at amortised cost or at fair value depending on their classification. Subject to stringent criteria, financial assets and financial liabilities may be designated as forming hedge relationships as a result of which fair value changes are offset in the income statement or charged/credited to equity depending on the nature of the hedge relationship.
Reclassification of non-equity minority interests to liabilities
The primary impact of the implementation of IAS 32 is the reclassification of the $1.65 billion preferred shares issued by the Group’s subsidiary, Vodafone Americas Inc., from non-equity minority interests to liabilities. The reclassification at 1 April 2004 was £875 million. Dividend payments by this subsidiary, which were previously reported in the Group’s income statement as non-equity minority interests, have been reclassified to financing costs.
Fair value of available for sale financial assets
The Group has classified certain of its cost-based investments as ‘available for sale’ financial assets as defined in IAS 39. This classification does not reflect the intentions of management in relation to these investments. These assets are measured at fair value at each reporting date with movements in fair value taken to equity. At 1 April 2004, a cumulative increase of £233 million in the fair value over the carrying value of these investments has been recognised.
Other adjustments
Hedge accounting has been adopted for the majority of the Group’s interest rate swaps and underlying capital market debt, thereby reducing potential volatility in the income statement.
Certain derivative financial instruments used to manage interest rate and foreign exchange exposures are not held in hedge relationships. However, these tend to be relatively short term in nature, causing limited income statement volatility.
Defined benefit pension schemes
The Group currently applies the provisions of SSAP 24 under UK GAAP and provides detailed disclosure under FRS 17 in accounting for pensions and other post-employment benefits.
The Group has elected to adopt early the amendment to IAS 19, “Employee Benefits” issued by the IASB on 16 December 2004 which allows all actuarial gains and losses to be charged or credited to equity.
The Group’s opening IFRS balance sheet at 1 April 2004 reflects the assets and liabilities of the Group’s defined benefit schemes totalling a net liability of £154 million. This amount represents less than 0.2% of the Group’s market capitalisation at 31 March 2004. The transitional adjustment of £257 million to opening reserves comprises the reversal of entries in relation to UK GAAP accounting under SSAP 24 less the recognition of the net liabilities of the Group’s and associated undertakings’ defined benefit schemes.
Goodwill and acquired intangible asset amortisation
IAS 38, “Intangible Assets” requires that goodwill is not amortised. Instead it is subject to an annual impairment review. As the Group has elected not to apply IFRS 3 retrospectively to business combinations prior to the opening balance sheet date under IFRS, the UK GAAP goodwill balance at 31 March 2004 (£96,931 million) has been included in the opening IFRS consolidated balance sheet and is no longer amortised.
Licence fee amortisation
Under IAS 38, capitalised payments for mobile licences are amortised on a straight line basis over their useful economic life. Amortisation is charged from the commencement of service of the network. Under UK GAAP, the Group’s policy is to amortise such costs in proportion to the capacity of the network during the start up period and then on a straight-line basis thereafter.
| Shareholder information | | 139 |
Back to Contents
|
| Information on International Financial Reporting Standards continued |
|
Deferred and Current Taxes
The scope of IAS 12, “Income Taxes” is wider than the corresponding UK GAAP standards, and requires deferred tax to be provided on all temporary differences rather than just timing differences under UK GAAP.
As a result, the Group’s IFRS opening balance sheet at 1 April 2004 includes an additional deferred tax liability of £1,801 million in respect of the differences between the carrying value and tax written down value of the Group’s investments in associated undertakings and joint ventures. This comprises £1.3 billion in respect of differences that arose when US investments were acquired and £0.5 billion in respect of undistributed earnings of certain associated undertakings and joint ventures, principally Vodafone Italy. UK GAAP does not permit deferred tax to be provided on the undistributed earnings of the Group’s associated undertakings and joint ventures until there is a binding obligation to distribute those earnings.
IAS 12 also requires deferred tax to be provided in respect of the Group’s liabilities under its post employment benefit arrangements and on other employee benefits such as share and share option schemes.
Share-based Payments
IFRS 2, “Share-based Payment” requires that an expense for equity instruments granted be recognised in the financial statements based on their fair value at the date of grant. This expense, which is primarily in relation to employee option and performance share schemes, is recognised over the vesting period of the scheme.
While IFRS 2 allows the measurement of this expense to be calculated only on options granted after 7 November 2002, the Group has applied IFRS 2 to all instruments granted but not fully vested as at 1 April 2004. The Group has adopted the binomial model for the purposes of computing fair value under IFRS.
Principal presentational differences
Scope of consolidation
IAS 31, “Interests in Joint Ventures” defines a jointly controlled entity as an entity where unanimous consent over the strategic financial and operating decisions is required between the parties sharing control. Control is defined as the power to govern the financial and operating decisions of an entity so as to obtain economic benefit from it.
The Group has reviewed the classification of its investments and concluded that the Group’s 76.8% interest in Vodafone Italy, currently classified as a subsidiary undertaking under UK GAAP, should be accounted for as a joint venture under IFRS. In addition, the Group’s interests in South Africa, Poland, Romania, Kenya and Fiji, which are currently classified as associated undertakings under UK GAAP, have been classified as joint ventures under IFRS as a result of the contractual rights held by the Group. The Group has adopted proportionate consolidation as the method of accounting for these six entities.
Under UK GAAP, the revenue, operating profit, net financing costs and taxation of Vodafone Italy are consolidated in full in the income statement with a corresponding allocation to minority interest. Under proportionate consolidation, the Group recognises its share of all income statement lines with no allocation to minority interest. There is no effect on the result for a financial period from this adjustment.
Under UK GAAP, the Group’s interests in South Africa, Poland, Romania, Kenya and Fiji are accounted for under the equity method, with the Group’s share of operating profit, interest and tax being recognised separately in the consolidated income statement. Under proportionate consolidation, the Group recognises its share of all income statement lines. There is no effect on the result for a financial period from this adjustment.
Under UK GAAP, the Group fully consolidates the cash flows of Vodafone Italy, but does not consolidate the cash flows of its associated undertakings. The IFRS consolidated cash flow statements reflect the Group’s share of cash flows relating to its joint ventures on a line by line basis, with a corresponding recognition of the Group’s share of net debt for each of the proportionately consolidated entities.
Associated undertakings taxation
Under IFRS, in accordance with IAS 1, “Presentation of Financial Statements”, “Tax on (loss)/profit on ordinary activities” on the face of the consolidated income statement comprises the tax charge of the Company, its subsidiaries and its share of the tax charge of joint ventures. The Group’s share of its associated undertakings’ tax charges is shown as part of “Share of result in associated undertakings” rather than being disclosed as part of the tax charge under UK GAAP.
In respect of the Verizon Wireless partnership, the line “Share of result in associated undertakings” includes the Group’s share of pre-tax partnership income and the Group’s share of the post-tax income attributable to corporate entities (as determined for US corporate income tax purposes) held by the partnership. The tax attributable to the Group’s share of allocable partnership income is included as part of “Tax on (loss)/profit on ordinary activities” on the consolidated income statement. This treatment reflects the fact that tax on allocable partnership income is, for US corporate income tax purposes, a liability of the partners and not the partnership.
| 140 | | Shareholder information |
Back to Contents
Contents
Financial calendar for the 2006 financial year
| Annual General Meeting (see below) | 26 July 2005 |
| Interim Results announcement | 15 November 2005 |
| Preliminary announcement of full year results | 30 May 2006 |
Dividends
Full details on the dividend amount per share or ADS can be found on page 45. Set out below is information relevant to the final dividend for the year ended 31 March 2005.
| Ex-dividend date | 1 June 2005 | |
| Record date | 3 June 2005 | |
| DRIP election date | 15 July 2005 | |
| Dividend payment date | 5 August 2005 | (1) |
| (1) Payment date for both ordinary shares and ADSs. | | |
Dividend Payment Methods
Holders of ordinary shares can:
| • | have cash dividends paid direct to a bank or building society account; or |
| | |
| • | have cash dividends paid in the form of a cheque; or |
| | |
| • | elect to use the cash dividends to purchase more Vodafone shares under the Dividend Reinvestment Plan (see below). |
If a holder of ordinary shares does decide to receive cash dividends, it is recommended that these are paid directly to the shareholder’s bank or building society account via BACS or EFTS. This avoids the risk of cheques being lost in the post and means the dividend will be in the shareholder’s account on the dividend payment date. The shareholder will be sent a tax voucher confirming the amount of dividend and the account into which it has been paid.
Please contact the Company’s Registrars for further details.
Holders of ADSs can:
| • | have cash dividends paid direct to a bank account; or |
| | |
| • | have cash dividends paid by cheque; or |
| | |
| • | elect to have the dividends reinvested to purchase additional Vodafone ADSs (see below for contact details). |
Dividend reinvestment
The Company offers a Dividend Reinvestment Plan which allows holders of ordinary shares who choose to participate to use their cash dividends to acquire additional shares in the Company. These are purchased on their behalf by the Plan Administrator through a low cost dealing arrangement. Further details can be obtained from the Plan Administrator on +44 (0) 870 702 0198.
For ADS holders, The Bank of New York maintains a Global BuyDIRECT Plan for the Company, which is a direct purchase and sale plan for depositary receipts, with a dividend reinvestment facility. For additional information, please call toll-free from within the US on +1 800 233 5601, or write to:
| | The Bank of New York
Shareholder Relations Department
Global BuyDIRECT
P.O. Box 1958 Newark
New Jersey 07101-1958 USA |
For calls from outside the US, call +1 610 382 7836. Please note that this number is not toll-free.
Telephone share dealing
A telephone share dealing service with the Company’s Registrars is available for holders of ordinary shares. The service is available from 8.00 am to 4.30 pm, Monday to Friday, excluding bank holidays, on telephone number +44 (0) 870 703 0084.
Detailed terms and conditions are available on request by calling the above number.
Postal share dealing
A postal share dealing service is available for holders of ordinary shares with 1,000 shares or fewer who want to either increase their holding or sell their entire holding.
Further information about this service can be obtained from the Company’s Registrars on +44 (0) 870 702 0198.
Registrars and transfer office
The Company’s ordinary share register is maintained by:
| | Computershare Investor Services PLC
P.O. Box 82
The Pavilions, Bridgwater Road
Bristol BS99 7NH
England |
| | |
| | Telephone: +44 (0) 870 702 0198 Fax: + 44 (0) 870 703 6101
Email: web.queries@computershare.co.uk |
| | |
| Holders of ordinary shares resident in Ireland should contact: |
| | |
| | Computershare Investor Services (Ireland) Limited
P.O. Box 9742
Dublin 18
Ireland |
| | |
| | Telephone: +353 (0) 818 300 999 Fax: +353 (0) 1 216 3151
Email: web.queries@computershare.ie |
| Shareholder information | | 141 |
Back to Contents
Back to Investor Information Contents
|
| Investor Information continued |
|
Any queries about the administration of holdings of ordinary shares, such as change of address, change of ownership or dividend payments, should be directed to the Company’s Registrars at the relevant address or telephone number immediately above. Holders of ordinary shares may also check details of their shareholding, subject to passing an identity check, on the Registrars’ website at www.computershare.com
The Depositary Bank for the Company’s ADR programme is:
| | The Bank of New York
Investor Relations Dept, P.O. Box 11258
Church St. Station
New York, NY 10286-1258
USA |
| | |
| | Telephone: +1 (800) 233 5601 (Toll free) |
ADS holders should address any queries or instructions regarding their holdings to The Bank of New York at the above address or telephone number. ADS holders can also, subject to passing an identity check, view their account balances and transaction history, sell shares and request certificates from their Global BuyDIRECT Plan at www.stockbny.com
Online Shareholder Services
www.vodafone.com/investor
| • | Register to receive electronic shareholder communications. Benefits to shareholders and the Company include faster receipt of communications such as annual reports, and cost and time savings for Vodafone. Electronic shareholder communications are also more environmentally friendly. |
| | |
| • | View a live webcast of the AGM of the Company on 26 July 2005 and a recording will be available to review after that date. |
| | |
| • | View and/or download the Annual Report and the Annual Review & Summary Financial Statement 2005. |
| | |
| • | Check the current share price. |
| | |
| • | Calculate dividend payments. |
| | |
| • | Use interactive tools to calculate the value of shareholdings, look up the historic price on a particular date and chart Vodafone ordinary share price changes against indices. |
Shareholders and other interested parties can also receive Company press releases, including London Stock Exchange announcements, by registering for Vodafone News via the Company’s website at www.vodafone.com/news.
Registering for Vodafone News will enable users to:
| • | be alerted by free SMS as soon as news breaks; |
| | |
| • | access the latest news from their mobile; and |
| | |
| • | have news automatically e-mailed to them. |
Annual General Meeting
The twenty first AGM of the Company will be held at The Queen Elizabeth II Conference Centre, Broad Sanctuary, Westminster, London SW1 on 26 July 2005 at 11.00 a.m.
The Notice of Meeting, together with details of the business to be conducted at the Meeting, is being circulated to shareholders with this Annual Report or the Annual Review & Summary Financial Statement and can be viewed at the Company’s website – www.vodafone.com/agm.
The AGM will be transmitted via a live webcast and can be viewed at the Company’s website – www.vodafone.com/agm – on the day of the meeting and a recording will be available to review after that date.
To find out more about the AGM and how to view the webcast, visit www.vodafone.com/agm.
ShareGift
The Company supports ShareGift, the charity share donation scheme administered by The Orr Mackintosh Foundation (registered charity number 1052686). Through ShareGift, shareholders who have only a very small number of shares which might be considered uneconomic to sell are able to donate them to charity. Donated shares are aggregated and sold by ShareGift, the proceeds being passed on to a wide range of UK charities. Donating shares to charity gives rise neither to a gain nor a loss for UK Capital Gains purposes and UK taxpayers may also be able to claim income tax relief on the value of the donation.
ShareGift transfer forms specifically for the Company’s shareholders are available from the Company’s Registrars, Computershare Investor Services PLC and, even if the share certificate has been lost or destroyed, the gift can be completed. The service is generally free. However, there may be an indemnity charge for a lost or destroyed share certificate where the value of the shares exceeds £100. Further details about ShareGift can be obtained from its website at www.ShareGift.org or at The Orr Mackintosh Foundation, 46 Grosvenor Street, London W1K 3HN (telephone: +44 (0) 20 7337 0501).
The Unclaimed Assets Register
The Company participates in the Unclaimed Assets Register, which provides a search facility for financial assets which may have been forgotten and which donates a proportion of its public search fees to a group of three UK charities (Age Concern, NSPCC and Scope). For further information, contact The Unclaimed Assets Register, Garden Floor, Bain House, 16 Connaught Place, London W2 2ES (telephone: +44 (0) 870 241 1713), or visit its website at www.uar.co.uk.
Share Price History
Upon flotation of the Company on 11 October 1988, the ordinary shares were valued at 170 pence each. On 16 September 1991, when the Company was finally demerged, for UK taxpayers the base cost of Racal Electronics Plc shares was apportioned between the Company and Racal Electronics Plc for Capital Gains Tax purposes in the ratio of 80.036% and 19.964% respectively. Opening share prices on 16 September 1991 were 332 pence for each Vodafone share and 223 pence for each Racal share.
On 21 July 1994, the Company effected a bonus issue of two new shares for every one then held and, on 30 September 1999, it effected a bonus issue of four new shares for every one held at that date. The flotation and demerger share prices, therefore, may be restated as 11.333 pence and 22.133 pence, respectively.
The share price at 31 March 2005 was 140.50 pence (31 March 2004: 128.75 pence). The share price on 23 May 2005 was 146.50 pence.
The following tables set out, for the periods indicated, (i) the reported high and low middle market quotations of ordinary shares on the London Stock Exchange, (ii) the reported high and low sales prices of ordinary shares on the Frankfurt Stock Exchange, and (iii) the reported high and low sales prices of ADSs on the NYSE.
The Company’s ordinary shares were traded on the Frankfurt Stock Exchange from 3 April 2000 until 23 March 2004 and, therefore, information has not been provided for periods outside these dates.
| 142 | | Shareholder information |
Back to Contents
Back to Investor Information Contents
Five year data on an annual basis
| | | London Stock
Exchange
Pounds per
ordinary share | | Frankfurt Stock
Exchange
Euros per
ordinary share | | NYSE
Dollars
per ADS | |
| | Financial Year | High | | Low | | High | | Low | | High | | Low | |
| |
|
|
|
|
|
|
|
|
|
|
|
| |
| | 2000/2001 | 3.56 | | 1.82 | | 5.82 | | 2.87 | | 56.63 | | 26.01 | |
| | 2001/2002 | 2.29 | | 1.24 | | 3.70 | | 2.00 | | 33.26 | | 17.88 | |
| | 2002/2003 | 1.31 | | 0.81 | | 2.15 | | 1.26 | | 20.30 | | 12.76 | |
| | 2003/2004 | 1.50 | | 1.12 | | 2.22 | | 1.59 | | 27.88 | | 18.10 | |
| | 2004/2005 | 1.49 | | 1.14 | | – | | – | | 28.54 | | 20.83 | |
| |
|
|
|
|
|
|
|
|
|
|
|
| |
Two year data on a quarterly basis
| | | London Stock
Exchange
Pounds per
ordinary share | | Frankfurt Stock
Exchange
Euros per
ordinary share | | NYSE
Dollars
per ADS | |
| | Financial Year | High | | Low | | High | | Low | | High | | Low | |
| |
|
|
|
|
|
|
|
|
|
|
|
| |
| | 2003/2004 | | | | | | | | | | | | |
| | First Quarter | 1.35 | | 1.13 | | 1.93 | | 1.61 | | 22.16 | | 18.28 | |
| | Second Quarter | 1.28 | | 1.12 | | 1.86 | | 1.59 | | 21.14 | | 18.10 | |
| | Third Quarter | 1.40 | | 1.20 | | 2.03 | | 1.70 | | 25.15 | | 20.26 | |
| | Fourth Quarter | 1.50 | | 1.24 | | 2.22 | | 1.88 | | 27.88 | | 22.81 | |
| |
|
|
|
|
|
|
|
|
|
|
|
| |
| | 2004/2005 | | | | | | | | | | | | |
| | First Quarter | 1.44 | | 1.21 | | – | | – | | 25.90 | | 21.87 | |
| | Second Quarter | 1.34 | | 1.14 | | – | | – | | 24.21 | | 20.83 | |
| | Third Quarter | 1.49 | | 1.32 | | – | | – | | 28.54 | | 24.06 | |
| | Fourth Quarter | 1.46 | | 1.35 | | – | | – | | 27.53 | | 25.60 | |
| |
|
|
|
|
|
|
|
|
|
|
|
| |
| | 2005/2006 | | | | | | | | | | | | |
| | First Quarter(1) | 1.47 | | 1.35 | | – | | – | | 26.91 | | 25.43 | |
| |
|
|
|
|
|
|
|
|
|
|
|
| |
| | |
| Note: |
| (1) | covering period up to 23 May 2005. |
Six month data on a monthly basis
| | | London Stock
Exchange
Pounds per
ordinary share | | NYSE
Dollars
per ADS | |
| | Financial Year | High | | Low | | High | | Low | |
| |
|
|
|
|
|
|
|
| |
| | November 2004 | 1.49 | | 1.37 | | 27.55 | | 25.45 | |
| | December 2004 | 1.48 | | 1.37 | | 28.54 | | 26.62 | |
| | January 2005 | 1.46 | | 1.37 | | 27.53 | | 25.68 | |
| | February 2005 | 1.42 | | 1.35 | | 26.89 | | 25.60 | |
| | March 2005 | 1.44 | | 1.36 | | 27.50 | | 26.23 | |
| | April 2005 | 1.43 | | 1.35 | | 26.91 | | 25.70 | |
| | May 2005(1) | 1.47 | | 1.37 | | 26.90 | | 25.43 | |
| |
|
|
|
|
|
|
|
| |
| | |
| Notes: |
| (1) | High and low share prices for May 2004 only reported until 23 May 2005. |
The current authorised share capital comprises 78,000,000,000 ordinary shares of $0.10 each and 50,000 7% cumulative fixed rate shares of £1.00 each.
Markets
Ordinary shares of Vodafone Group Plc are traded on the London Stock Exchange and, in the form of ADSs, on the New York Stock Exchange.
ADSs, each representing ten ordinary shares, are traded on the New York Stock Exchange under the symbol ‘VOD’. The ADSs are evidenced by ADRs issued by The Bank of New York, as Depositary, under a Deposit Agreement, dated as of 12 October 1988, as amended and restated as of 26 December 1989, as further amended and restated as of 16 September 1991 and as further amended and restated as of 30 June 1999, between the Company, the Depositary and the holders from time to time of ADRs issued thereunder.
ADS holders are not members of the Company but may instruct The Bank of New York on the exercise of voting rights relative to the number of ordinary shares represented by their ADSs. See “Memorandum and Articles of Association and Applicable English Law – Rights attaching to the Company’s shares – Voting rights” below.
Shareholders at 31 March 2005
| | Number of
ordinary shares
held | Number of
accounts | | % of total
issued
shares | |
| |
|
| |
| |
| | 1 – 1,000 | 448,502 | | 0.21 | |
| | 1,001 – 5,000 | 109,635 | | 0.36 | |
| | 5,001– 50,000 | 30,851 | | 0.64 | |
| | 50,001 – 100,000 | 1,593 | | 0.17 | |
| | 100,001– 500,000 | 1,501 | | 0.53 | |
| | More than 500,000 | 2,168 | | 98.09 | |
| |
|
|
|
| |
| | | 594,250 | | 100.00 | |
| |
|
|
|
| |
Geographical analysis of shareholders
At 31 March 2005, approximately 51.53% of the Company’s shares were held in the UK, 32.17% in North America, 13.91% in Europe (excluding the UK) and 2.39% in the Rest of the World.
Memorandum and Articles of Association and
Applicable English law
The following description summarises certain provisions of the Company’s Memorandum and Articles of Association and applicable English law. This summary is qualified in its entirety by reference to the Companies Act 1985 of Great Britain (the “Companies Act”), as amended, and the Company’s Memorandum and Articles of Association. Information on where shareholders can obtain copies of the Memorandum and Articles of Association is provided under “Documents on Display”.
All of the Company’s ordinary shares are fully paid. Accordingly, no further contribution of capital may be required by the Company from the holders of such shares.
English law specifies that any alteration to the Articles of Association must be approved by a special resolution of the shareholders.
The Company’s Objects
The Company is a public limited company under the laws of England and Wales. The Company is registered in England and Wales under the name Vodafone Group Public Limited Company, with the registration number 1833679. The Company’s objects are set out in the fourth clause of its Memorandum of Association and cover a wide range of activities, including to carry on the business of a holding company, to carry on business as dealers in, operators, manufacturers, repairers, designers, developers, importers and exporters of electronic, electrical, mechanical and aeronautical equipment of all types as well as to carry on all other businesses necessary to attain the Company’s objectives. The Memorandum of Association grants the Company a broad range of powers to effect its objects.
Directors
The Company’s Articles of Association provide for a board of directors, consisting of not fewer than three directors, who shall manage the business and affairs of the Company.
Under the Company’s Articles of Association, a director cannot vote in respect of any proposal in which the director, or any person connected with the director, has a material interest other than by virtue of the director’s interest in the Company’s shares or other securities. However, this restriction on voting does not apply to resolutions (a) giving the director or a third party any guarantee, security or indemnity in respect of obligations or liabilities incurred at the request of or for the benefit of the Company, (b) giving any guarantee, security or indemnity to the director or a third party in respect
| Shareholder information | | 143 |
Back to Contents
Back to Investor Information Contents
|
| Investor Information continued |
|
of obligations of the Company for which the director has assumed responsibility under an indemnity or guarantee, (c) relating to an offer of securities of the Company in which the director participates as a holder of shares or other securities or in the underwriting of such shares or securities, (d) concerning any other company in which the director (together with any connected person) is a shareholder or an officer or is otherwise interested, provided that the director (together with any connected person) is not interested in 1% or more of any class of the company’s equity share capital or the voting rights available to its shareholders, (e) relating to the arrangement of any employee benefit in which the director will share equally with other employees and (f) relating to any insurance that the Company purchases or renews for its directors or any group of people, including directors.
The directors are empowered to exercise all the powers of the Company to borrow money, subject to the limitation that the aggregate amount of all liabilities and obligations of the Group outstanding at any time shall not exceed an amount equal to 1.5 times the aggregate of the Group’s share capital and reserves calculated in the manner prescribed in the Articles of Association, unless sanctioned by an ordinary resolution of the Company’s shareholders.
In accordance with the Company’s Articles of Association, a third of all the directors retire at each AGM. The specific retiring directors are those last elected or re-elected at or before the AGM held in the third calendar year before the current year. This year, the Company reviewed its policy regarding the retirement and re-election of directors and, although it is not intended to amend the Company’s Articles in this regard, the Board has decided, in the interests of good corporate governance, that all the directors should offer themselves for re-election annually. Accordingly, all the directors will submit themselves for re-election at the 2005 AGM, except for Ken Hydon and Sir David Scholey, who are retiring.
No person is disqualified from being a director or is required to vacate that office by reason of age. If, at a general meeting, a director who is 70 or more years of age is proposed for election or re-election, that director’s age must be set out in the notice of the meeting.
Directors are not required, under the Company’s Articles, to hold any shares of the Company as a qualification to act as a director, although executive directors participating in long term incentive plans must comply with the Company’s share ownership guidelines. In accordance with best practice in the UK for corporate governance, compensation awarded to executive directors is decided by a remuneration committee consisting exclusively of non-executive directors.
In addition, as required by The Directors’ Remuneration Report Regulations, the Board has, since 2003, prepared a report to shareholders on the directors’ remuneration which complies with the Regulations (see pages 65 to 74). The report is also subject to a shareholder vote.
Rights attaching to the Company’s shares
Dividend rights
Holders of the Company’s ordinary shares may by ordinary resolution declare dividends but may not declare dividends in excess of the amount recommended by the directors. The Board of directors may also pay interim dividends. No dividend may be paid other than out of profits available for distribution. Dividends on ordinary shares will be announced in pounds sterling. Holders of ordinary shares with a registered address in a euro-zone country (defined, for this purpose, as a country that has adopted the euro as its national currency) will receive their dividends in euro, exchanged from pounds sterling at a rate fixed by the Board of directors in accordance with the Articles of Association. Dividends for ADS holders represented by ordinary shares held by the Depositary will be paid to the Depositary in US dollars, exchanged from pounds sterling at a rate fixed by the directors in accordance with the Articles of Association, and the Depositary will distribute them to the ADS holders.
If a dividend has not been claimed for one year after the later of the resolution passed at a general meeting declaring that dividend or the resolution of the directors providing for payment of that dividend, the directors may invest the dividend or use it in some other way for the benefit of the Company until the dividend is claimed. If the dividend remains unclaimed for 12 years after the relevant resolution either declaring that dividend or providing for payment of that dividend, it will be forfeited and belong to the Company.
Voting rights
The Company’s Articles of Association provide that voting on Substantive Resolutions (i.e. any resolution which is not a Procedural Resolution) at a general meeting shall be decided on a poll. On a poll, each shareholder who is entitled to vote and is present in person or by proxy has one vote for every share held. Procedural Resolutions (such as a resolution to adjourn a General Meeting or a resolution on the choice of Chairman of a General Meeting) shall be decided on a show of hands, where each shareholder who is present at the meeting has one vote regardless of the number of shares held, unless a poll is demanded. In addition, the Articles of Association allow persons appointed as proxies of shareholders entitled to vote at general meetings to vote on a show of hands, as well as to vote on a poll and attend and speak at general meetings. Holders of the Company’s ordinary shares do not have cumulative voting rights.
Under English law, two shareholders present in person constitute a quorum for purposes of a general meeting, unless a company’s articles of association specify otherwise. The Company’s Articles of Association do not specify otherwise, except that the shareholders do not need to be present in person, and may instead be present by proxy, to constitute a quorum.
Under English law, shareholders of a public company such as the Company are not permitted to pass resolutions by written consent.
Record holders of the Company’s ADSs are entitled to attend, speak and vote on a poll or a show of hands at any general meeting of the Company’s shareholders by the Depositary’s appointment of them as corporate representatives with respect to the underlying ordinary shares represented by their ADSs. Alternatively, holders of ADSs are entitled to vote by supplying their voting instructions to the Depositary or its nominee, who will vote the ordinary shares underlying their ADSs in accordance with their instructions.
Employees are able to vote any shares held under the Vodafone Group Share Incentive Plan, the Vodafone Group Profit Sharing Scheme and “My ShareBank” (a vested share account) through the respective plan’s trustees, Mourant ECS Trustees Limited.
Liquidation rights
In the event of the liquidation of the Company, after payment of all liabilities and deductions in accordance with English law, the holders of the Company’s 7% cumulative fixed rate shares would be entitled to a sum equal to the capital paid up on such shares, together with certain dividend payments, in priority to holders of the Company’s ordinary shares. The holders of the fixed rate shares do not have any other right to share in the Company’s surplus assets.
Pre-emptive rights and new issues of shares
Under Section 80 of the Companies Act, directors are, with certain exceptions, unable to allot relevant securities without the authority of the shareholders in a general meeting. Relevant securities as defined in the Companies Act include the Company’s ordinary shares or securities convertible into the Company’s ordinary shares. In addition, Section 89 of the Companies Act imposes further restrictions on the issue of equity securities (as defined in the Companies Act, which include the Company’s ordinary shares and securities convertible into ordinary shares) which are, or are to be, paid up wholly in cash and not first offered to existing shareholders. The Company’s Articles of Association allow shareholders to authorise directors for a period up to five years to allot (a) relevant securities generally up to an amount fixed by the shareholders and (b) equity securities for cash other than in connection with a rights issue up to an
| 144 | | Shareholder information |
Back to Contents
Back to Investor Information Contents
amount specified by the shareholders and free of the restriction in Section 89. In accordance with institutional investor guidelines, the amount of relevant securities to be fixed by shareholders is normally restricted to one third of the existing issued ordinary share capital, and the amount of equity securities to be issued for cash other than in connection with a rights issue is restricted to 5% of the existing issued ordinary share capital.
Variation of rights
If, at any time, the Company’s share capital is divided into different classes of shares, the rights attached to any class may be varied, subject to the provisions of the Companies Act, either with the consent in writing of the holders of three fourths in nominal value of the shares of that class or upon the adoption of an extraordinary resolution passed at a separate meeting of the holders of the shares of that class.
At every such separate meeting, all of the provisions of the Articles of Association relating to proceedings at a general meeting apply, except that (a) the quorum is to be the number of persons (which must be at least two) who hold or represent by proxy not less than one-third in nominal value of the issued shares of the class or, if such quorum is not present on an adjourned meeting, one person who holds shares of the class regardless of the number of shares he holds, (b) any person present in person or by proxy may demand a poll, and (c) each shareholder will have one vote per share held in that particular class in the event a poll is taken.
Class rights are deemed not to have been varied by the creation or issue of new shares ranking equally with or subsequent to that class of shares in sharing in profits or assets of the Company or by a redemption or repurchase of the shares by the Company.
Limitations on voting and shareholding
There are no limitations imposed by English law or the Company’s Articles of Association on the right of non-residents or foreign persons to hold or vote the Company’s shares other than those limitations that would generally apply to all of the shareholders.
Disclosure of interests in the Company’s shares
There are no provisions in the Articles of Association whereby persons acquiring, holding or disposing of a certain percentage of the Company’s shares are required to make disclosure of their ownership percentage, although such requirements exist under the Companies Act.
The basic disclosure requirement under Sections 198 to 211 of the Companies Act imposes upon a person interested in the shares of the Company a statutory obligation to provide written notification to the Company, including certain details as set out in the Companies Act, where:
| (a) | he acquires (or becomes aware that he has acquired) or ceases to have (or becomes aware that he has ceased to have) an interest in shares comprising any class of the Company’s issued and voting share capital; and |
| | |
| (b) | as a result, EITHER he obtains, or ceases to have: |
| | | |
| | (i) | a “material interest” in 3%, or more; or |
| | | |
| | (ii) | an aggregate interest (whether “material” or not) in 10%, or more of the Company’s voting capital; or |
| | | |
| | (iii) | the percentage of his interest in the Company’s voting capital remains above the relevant level and changes by a whole percentage point. |
A “material interest” means, broadly, any beneficial interest (including those of a spouse or a child or a step-child (under the age of 18), those of a company which is accustomed to act in accordance with the relevant person’s instructions or in which one third or more of the votes are controlled by such person and certain other interests set out in the Companies Act) other than those of an investment manager or an
operator of a unit trust/recognised scheme/collective investment scheme/open-ended investment company.
Sections 204 to 206 of the Companies Act set out particular rules of disclosure where two or more parties (each a “concert party”) have entered into an agreement to acquire interests in shares of a public company, and the agreement imposes obligations/restrictions on any concert party with respect to the use, retention or disposal of the shares in the company and an acquisition of shares by a concert party pursuant to the agreement has taken place.
Under Section 212 of the Companies Act, the Company may by notice in writing require a person that the Company knows or has reasonable cause to believe is or was during the preceding three years interested in the Company’s shares to indicate whether or not that is correct and, if that person does or did hold an interest in the Company’s shares, to provide certain information as set out in the Companies Act.
Sections 324 to 329 of the Companies Act further deal with the disclosure by persons (and certain members of their families) of interests in shares or debentures of the companies of which they are directors and certain associated companies.
There are additional disclosure obligations under Rule 3 of the Substantial Acquisitions Rules where a person acquires 15% or more of the voting rights of a listed company or when an acquisition increases his holding of shares or rights over shares so as to increase his voting rights beyond that level by a whole percentage point. Notification in this case should be to the Company, the Panel on Takeovers and Mergers and the UK Listing Authority through one of its approved regulatory information services no later than 12 noon on the business day following the date of the acquisition.
The City Code on Takeovers and Mergers also contains strict disclosure requirements on all parties to a takeover with regard to dealings in the securities of an offeror or offeree company and also on their respective associates during the course of an offer period.
General meetings and notices
Annual general meetings are held at such times and place as determined by the directors of the Company. The directors may also, when they think fit, convene an extraordinary general meeting of the Company. Extraordinary general meetings may also be convened on requisition as provided by the Companies Act.
An annual general meeting and an extraordinary general meeting called for the passing of a special resolution need to be called by not less than twenty-one days’ notice in writing and all other extraordinary general meetings by not less than fourteen days’ notice in writing. The directors may determine that persons entitled to receive notices of meetings are those persons entered on the register at the close of business on a day determined by the directors but not later than twenty-one days before the date the relevant notice is sent. The notice may also specify the record date, which shall not be more than forty-eight hours before the time fixed for the meeting.
Shareholders must provide the Company with an address or (so far as the Companies Act allows) an electronic address or fax number in the United Kingdom in order to be entitled to receive notices of shareholders’ meetings and other notices and documents. In certain circumstances, the Company may give notices to shareholders by advertisement in newspapers in the United Kingdom. Holders of the Company’s ADSs are entitled to receive notices under the terms of the Deposit Agreement relating to the ADSs.
Under Section 366 of the Companies Act 1985 and the Company’s Articles of Association, the annual general meeting of shareholders must be held each calendar year with no more than fifteen months elapsing since the date of the preceding annual general meeting.
| Shareholder information | | 145 |
Back to Contents
Back to Investor Information Contents
|
| Investor Information continued |
|
|
Documents on Display
The Company is subject to the information requirements of the US Securities and Exchange Act of 1934 applicable to foreign private issuers. In accordance with these requirements, the Company files its Annual Report on Form 20-F and other related documents with the SEC. These documents may be inspected at the SEC’s public reference rooms located at 450 Fifth Street, NW Washington, DC 20549. Information on the operation of the public reference room can be obtained in the US by calling the SEC on +1-800-SEC-0330. In addition, some of the Company’s SEC filings, including all those filed on or after 4 November 2002, are available on the SEC’s website at www.sec.gov. Shareholders can also obtain copies of the Company’s Memorandum and Articles of Association from the Vodafone website at www.vodafone.com or from the Company’s registered office.
Material Contracts
At the date of this Annual Report, the Group is not party to any contracts that are considered material to the Group’s results or operations, except for its $10.4 billion credit facilities which are discussed under “Operating and Financial Review and Prospects – Liquidity and Cash Resources”.
Exchange Controls
There are no UK government laws, decrees or regulations that restrict or affect the export or import of capital, including but not limited to, foreign exchange controls on remittance of dividends on the ordinary shares or on the conduct of the Group’s operations, except as otherwise set out under “Taxation”.
Taxation
As this is a complex area, investors should consult their own tax adviser regarding the US federal, state and local, the UK and other tax consequences of owning and disposing of shares and ADSs in their particular circumstances, and in particular whether they are eligible for the benefits of the Old Treaty and/or the New Treaty.
This section describes for a US holder (as defined below), in general terms, the principal US federal income tax and UK tax consequences of owning shares or ADSs in the Company as capital assets (for US and UK tax purposes). This section does not, however, cover the tax consequences for members of certain classes of holders subject to special rules and holders that, directly or indirectly, hold 10 per cent or more of the Company’s voting stock.
A US holder is a beneficial owner of shares or ADSs that is for US federal income tax purposes:
| (i) | a citizen or resident of the United States; |
| | |
| (ii) | US domestic corporation; |
| | |
| (iii) | an estate the income of which is subject to US federal income tax regardless of its source; or |
| | |
| (iv) | a trust if a US court can exercise primary supervision over the trust’s administration and one or more US persons are authorised to control all substantial decisions of the trust. |
This section is based on the Internal Revenue Code of 1986, as amended, its legislative history, existing and proposed regulations thereunder, published rulings and court decisions, and on the tax laws of the United Kingdom, all as currently in effect, as well as on the Double Taxation Convention between the United States and the United Kingdom entered into force in 1980 (the “Old Treaty”) and the Double Taxation Convention between the United States and the United Kingdom that entered into force on 31 March 2003 (the “New Treaty”). These laws are subject to change, possibly on a retroactive basis.
The New Treaty has been effective in respect of taxes withheld at source for amounts paid or credited on or after 1 May 2003. Other provisions of the New Treaty, however, including capital gains tax, took effect for UK purposes for individuals on 6 April 2003 (1 April 2003 for UK companies) and took effect for US purposes on 1 January 2004. The rules of the Old Treaty remained applicable until these effective dates. Moreover, a taxpayer can elect to have the Old Treaty apply in its entirety for a period of twelve months after the applicable effective dates of the New Treaty (if such a taxpayer would be entitled to greater benefits under the Old Treaty).
This section is further based in part upon the representations of the Depositary and assumes that each obligation in the Deposit Agreement and any related agreement will be performed in accordance with its terms.
Based on this assumption, for purposes of the Old Treaty and the New Treaty and the US-UK double taxation convention relating to estate and gift taxes (the “Estate Tax Convention”), and for US federal income tax and UK tax purposes, a holder of ADRs evidencing ADSs will be treated as the owner of the shares in the Company represented by those ADSs. Generally, exchanges of shares for ADRs, and ADRs for shares, will not be subject to US federal income tax or to UK tax, other than stamp duty or stamp duty reserve tax (see the section on these taxes below).
Taxation of dividends
UK Taxation
Under current UK tax law, no withholding tax will be deducted from dividends paid by the Company.
A shareholder that is a company resident for UK tax purposes in the United Kingdom will not be taxable on a dividend it receives from the Company. A shareholder in the Company who is an individual resident for UK tax purposes in the United Kingdom is entitled, in calculating their liability to UK income tax, to a tax credit on cash dividends paid on shares in the Company or ADSs, and the tax credit is equal to one-ninth of the cash dividend.
If applicable, under the Old Treaty, a US holder was entitled to a tax credit from the UK Inland Revenue equal to the amount of the tax credit available to a shareholder resident in the United Kingdom (i.e. one-ninth of the dividend received) but the amount of the dividend plus the amount of the tax credit were then subject to withholding in an amount equal to the amount of the tax credit. A US holder, therefore, did not, in fact, receive any repayment from the UK Inland Revenue in respect of a dividend from the Company, although assuming the US holder was not resident in the United Kingdom for UK tax purposes, there was no further UK tax to pay in respect of that dividend.
Under the New Treaty, a US holder is not entitled to a tax credit from the UK Inland Revenue in the manner described above and dividends received by the US holder from the Company are not subject to any withholding by the United Kingdom under the New Treaty or otherwise.
US Federal Income Taxation
A US holder is subject to US federal income taxation on the gross amount of any dividend paid by the Company out of its current or accumulated earnings and profits (as determined for US federal income tax purposes). Dividends paid to a non-corporate US holder in tax years beginning before 1 January 2009 that constitute qualified dividend income will be taxable to the holder at a maximum tax rate of 15%, provided that the ordinary shares or ADSs are held for more than 60 days during the 121-day period beginning 60 days before the ex-dividend rate and the holder meets other holding period requirements. Dividends paid by the Company with respect to the shares or ADSs will generally be qualified dividend income.
A US holder that is eligible and elects the benefits of the Old Treaty, for dividends paid prior to 1 May 2004 may include in the gross amount of income the UK tax withheld from the dividend payment pursuant to the Old Treaty as described under
| 146 | | Shareholder information |
Back to Contents
Back to Investor Information Contents
“UK Taxation”. Subject to certain limitations, the UK tax withheld in accordance with the Old Treaty and effectively paid over to the UK Inland Revenue will be creditable against the US holder’s US federal income tax liability, provided the US holder is eligible for the benefits of the Old Treaty and has properly filed Internal Revenue Form 8833. Special rules apply in determining the foreign tax credit limitation with respect to dividends that are subject to the maximum 15% tax rate.
Under the New Treaty, a US holder is not entitled to a UK tax credit payment, but is also not subject to a UK withholding tax. The US holder includes in gross income for US federal income tax purposes only the amount of the dividend actually received from the Company, and the receipt of a dividend does not entitle the US holder to a foreign tax credit.
In either case, dividends must be included in income when the US holder, in the case of shares, or the Depositary, in the case of ADSs, actually or constructively receives the dividend and will not be eligible for the dividends-received deduction generally allowed to US corporations in respect of dividends received from other US corporations. Dividends will be income from sources outside the United States and will generally be “passive income” or “financial services income”, which is treated separately from other types of income for the purposes of computing any allowable foreign tax credit.
In the case of shares, the amount of the dividend distribution to be included in income will be the US dollar value of the pound sterling payments made, determined at the spot pound sterling/US dollar rate on the date of the dividend distribution, regardless of whether the payment is in fact converted into US dollars. Generally, any gain or loss resulting from currency exchange fluctuations during the period from the date the dividend payment is to be included in income to the date the payment is converted into US dollars will be treated as ordinary income or loss. Generally, the gain or loss will be income or loss from sources within the United States for foreign tax credit limitation purposes.
Taxation of capital gains
UK taxation
A US holder may be liable for both UK and US tax in respect of a gain on the disposal of the Company’s shares or ADSs if the US holder is:
| (i) | a citizen of the United States resident or ordinarily resident for UK tax purposes in the United Kingdom; |
| | |
| (ii) | a citizen of the United States who has been resident or ordinarily resident for UK tax purposes in the United Kingdom, ceased to be so resident or ordinarily resident for a period of less than 5 years of assessment and who disposed of the shares or ADSs during that period (a “Temporary Non-Resident”), unless the shares or ADSs were also acquired during that period, such liability arising on that individual’s return to the UK; |
| | |
| (iii) | a US domestic corporation resident in the United Kingdom by reason of being centrally managed and controlled in the United Kingdom; or |
| | |
| (iv) | a citizen of the United States or a corporation that carries on a trade, profession or vocation in the United Kingdom through a branch or agency or, in respect of companies through a permanent establishment and that has used the shares or ADSs for the purposes of such trade, profession or vocation or has used, held or acquired the shares or ADSs for the purposes of such branch or agency or permanent establishment. |
However, subject to applicable limitations and eligibility to the provisions of the Old Treaty, such persons may be entitled to a tax credit against their US federal income tax liability for the amount of UK capital gains tax or UK corporation tax on chargeable gains (as the case may be) which is paid in respect of such gain.
Under the New Treaty, capital gains on dispositions of the shares or ADSs are generally subject to tax only in the country of residence of the relevant holder as determined under both the laws of the United Kingdom and the United States and as required by the terms of the New Treaty. However, individuals who are residents of either the
United Kingdom or the United States and who have been residents of the other jurisdiction (the US or the UK, as the case may be) at any time during the six years immediately preceding the relevant disposal of shares or ADSs may be subject to tax with respect to capital gains arising from the dispositions of the shares or ADSs not only in the country of which the holder is resident at the time of the disposition, but also in that other country (although, in respect of UK taxation, generally only to the extent that such an individual comprises a Temporary Non-Resident).
US federal income taxation
A US holder that sells or otherwise disposes of the Company’s shares or ADSs will recognise a capital gain or loss for US federal income tax purposes equal to the difference between the US dollar value of the amount realised and the holder’s tax basis, determined in US dollars, in the shares or ADSs. Generally, capital gain of a non-corporate US holder that is recognised before 1 January 2009 is taxed at a maximum rate of 15%, provided the holder has a holding period of more than one year. The gain or loss will generally be income or loss from sources within the United States for foreign tax credit limitation purposes. The deductibility of losses is subject to limitations.
Additional tax considerations
UK inheritance tax
An individual who is domiciled in the United States (for the purposes of the Estate Tax Convention) and is not a UK national will not be subject to UK inheritance tax in respect of the Company’s shares or ADSs on the individual’s death or on a transfer of the shares or ADSs during the individual’s lifetime, provided that any applicable US federal gift or estate tax is paid, unless the shares or ADSs are part of the business property of a UK permanent establishment or pertain to a UK fixed base used for the performance of independent personal services. Where the shares or ADSs have been placed in trust by a settlor, they may be subject to UK inheritance tax unless, when the trust was created, the settlor was domiciled in the United States and was not a UK national. Where the shares or ADSs are subject to both UK inheritance tax and to US federal gift or estate tax, the Estate and Gift Tax Convention generally provides a credit against US federal tax liabilities for UK inheritance tax paid.
UK stamp duty and stamp duty reserve tax
Stamp duty will, subject to certain exceptions, be payable on any instrument transferring shares in the Company to the Custodian of the Depositary at the rate of 1.5% on the amount or value of the consideration if on sale or on the value of such shares if not on sale. Stamp duty reserve tax (SDRT), at the rate of 1.5% of the price or value of the shares, could also be payable in these circumstances, and on issue to such a person, but no SDRT will be payable if stamp duty equal to such SDRT liability is paid. In accordance with the terms of the Deposit Agreement, any tax or duty payable on deposits of shares by the Depositary or the Custodian of the Depositary will be charged to the party to whom ADSs are delivered against such deposits.
No stamp duty will be payable on any transfer of ADSs of the Company, provided that the ADSs and any separate instrument of transfer are executed and retained at all times outside the United Kingdom.
A transfer of shares in the Company in registered form will attract ad valorem stamp duty generally at the rate of 0.5% of the purchase price of the shares. There is no charge to ad valorem stamp duty on gifts. On a transfer from nominee to beneficial owner (the nominee having at all times held the shares on behalf of the transferee) under which no beneficial interest passes and which is neither a sale nor in contemplation of a sale, a fixed £5.00 stamp duty will be payable.
SDRT is generally payable on an unconditional agreement to transfer shares in the Company in registered form at 0.5% of the amount or value of the consideration for the transfer, but is repayable if, within six years of the date of the agreement, an instrument transferring the shares is executed or, if the SDRT has not been paid, the liability to pay the tax (but not necessarily interest and penalties) would be cancelled. However, an agreement to transfer the ADSs of the Company will not give rise to SDRT.
| Shareholder information | | 147 |
Back to Contents
Back to Investor Information Contents
|
| Investor Information continued |
|
| |
| |
|
| Contact Details | | |
| Registered Office | | |
| Vodafone House | | |
| The Connection | | |
| Newbury | | |
| Berkshire RG14 2FN | | |
| England | | |
| | | |
| Telephone: | +44 (0) 1635 33251 |
| Fax: | +44 (0) 1635 45713 |
| | | |
| Group Corporate Affairs |
| Simon Lewis | Group Corporate Affairs Director |
| Telephone: | +44 (0) 1635 673310 |
| Fax: | +44 (0) 1635 682890 |
| | | |
| Investor Relations | | |
| Charles Butterworth | | |
| Darren Jones | | |
| Sarah Moriarty | | |
| Telephone: | +44 (0) 1635 673310 |
| | | |
| Media Relations | | |
| Bobby Leach | | |
| Ben Padovan | | |
| Telephone: | +44 (0) 1635 673310 |
| | | |
| Corporate Responsibility |
| Charlotte Grezo | Director of Corporate Responsibility |
| Telephone: | +44 (0) 1635 33251 |
| Fax: | +44 (0) 1635 674478 |
| E-mail: | responsibility@vodafone.com |
| Website: | www.vodafone.com/responsibility |
| 148 | | Shareholder information |
Back to Contents
|
| Form 20-F Cross Reference Guide |
|
This table has been provided as a cross reference from the information included in this Annual Report to the requirements of Form 20-F.
| Shareholder information | | 149 |
Back to Contents
|
| Form 20-F Cross Reference Guide continued |
|
| 150 | | Shareholder information |
| | | | |
| | | | |
| | | | |
| | | | |
| | | | |
| | | | |
| | | | |
| | | | |
| | | | |
| | | | |
| | | | |
| | | | |
| | | | |
| | | | |
| | | | |
| | | | |
| | | | |
| | | | |
| | | | |
| | | | |
| | | | |
| | | | |
| | | | |
| | | | |
| | | | |
| | | | |
| | | | |
| | | | |
| | | | |
| | | | |
| | | | |
| | | | |
| | | | |
| | | | |
| | | | |
| | | Designed and produced by Barrett Howe Plc | |
| | | | |
| | | | |
| | | | |
| | | | |
| | | | |
| | | | |
| | | | |
| | | | |
| | | | |
| | | | |
| | | | |
| | | | |
| | | | |
| | | | |
| | | | |
| | | | |
| | | | |
| | | | |
| | | | |
| | | | |
| | | | |
| | | | |
| | | | |
| | | | |
| | | | |
| | | | |
| | | | |
| | | | |
| | | | |
| | Vodafone Group Plc
Vodafone House
The Connection
Newbury
Berkshire
RG14 2FN
England Registered in England No. 1833679 Tel: +44 (0) 1635 33251
Fax: +44 (0) 1635 45713
www.vodafone.com |  | |
| | | | |
| | | | |
| | | | |
Back to Contents
Signatures
The registrant hereby certifies that it meets all of the requirements for filing on Form 20-F and that it has duly caused and authorized the undersigned to sign this annual report on its behalf.
| | VODAFONE GROUP PUBLIC LIMITED COMPANY |
| | (Registrant) |
| | |
| | /s/ S R Scott |
| | Stephen R. Scott |
| | Company Secretary |
Date: June 8, 2005
Back to Filed with the SEC
Index to Exhibits to Form 20-F for year ended 31 March 2005
| 1. | Memorandum, as adopted on June 13, 1984 and including all amendments made on July 28, 2000, and Articles of Association, as adopted on June 30, 1999 and including all amendments made on July 25, 2001, of the Company (incorporated by reference to Exhibit 2.1 to the Company’s Amendment No. 3 to the Registration Statement on Form 8-A/A, dated December 5, 2003). (File No. 001-10086). |
| | |
| 2. | Indenture, dated as of February 10, 2000, between the Company and Citibank, N.A. as Trustee, including forms of debt securities (incorporated by reference to Exhibit 4(a) of Amendment No. 1 to the Company’s Registration Statement on Form F-3, dated November 24, 2000). (File No. 333-10762)). |
| | |
| 4.1. | Agreement for US$5,525,000,000 5 year Revolving Credit Facility, dated June 24, 2004, among, inter alia, the Company, ABN Amro Bank N.V.; Banco Bilbao Vizcaya Argentaria S.A. ; Bank of America, N.A.; Barclays Bank PLC; Bayerische Hypo-und Vereinsbank AG; BNP Paribas ; CALYON; Citibank, N.A.; Commerzbank Aktiengesellschaft, London Branch; Deutsche Bank AG; HSBC Bank plc; ING Bank, N.V.; JPMorgan Chase Bank; Lehman Brothers Bankhaus AG; Lloyds TSB Bank plc; Morgan Stanley Dean Witter Bank Limited and Morgan Stanley Bank; Mizuho Corporate Bank, Ltd.; National Australia Bank Limited ABN 12 004 044 937; Sumitomo Mitsui Banking Corporation Europe Limited; The Bank of Tokyo-Mitsubishi, Ltd.; The Royal Bank of Scotland Plc; UBS AG; WestLB AG; Banco Santander Central Hispano, S.A.; William Street Commitment Corporation; Banca Intesa SpA; KBC Bank NV; Standard Chartered Bank; TD Bank Europe Limited; and The Bank of New York with The Royal Bank of Scotland plc as Agent and US Swingline Agent. |
| | |
| 4.2. | Agreement for US$4,853,333,331 3 year Revolving Credit Facility, dated June 26, 2003 and amended on August 11, 2003 and June 24, 2004, among, inter alia, the Company, ABN Amro Bank N.V.; Banco Bilbao Vizcaya Argentaria S.A.; Bank of America, N.A.; Barclays Bank PLC; Bayerische Hypo-und Vereinsbank AG; Bayerische Landesbank; BNP Paribas; Citibank, N.A.; Commerzbank Aktiengesellschaft; Credit Agricole Indosuez; Deutsche Bank AG; HSBC Bank plc; ING Bank, N.V.; JPMorgan Chase Bank; Lehman Brothers Bankhaus AG; Lloyds TSB Bank plc; Mizuho Corporate Bank, Ltd.; National Australia Bank Limited ABN 12 004 044 937; Sumitomo Mitsui Banking Corporation Europe Limited; The Bank of Tokyo-Mitsubishi, Ltd.; The Royal Bank of Scotland Plc; UBS AG; WestLB AG; William Street Commitment Corporation; Banco Santander Central Hispano, S.A.; Banca Intesa SpA; KBC Bank NV; San Paolo IMI Bank Ireland Plc; Standard Chartered Bank; TD Bank Europe Limited; and The Bank of New York with The Royal Bank of Scotland plc as Agent and US Swingline Agent. |
| | |
| 4.3. | Vodafone Group Long Term Incentive Plan (incorporated by reference to Exhibit 4.5 to the Company’s Annual Report on Form 20-F for the financial year ended March 31, 2001). |
| | |
| 4.4. | Vodafone Group Short Term Incentive Plan (incorporated by reference to Exhibit 4.6 to the Company’s Annual Report on Form 20-F for the financial year ended March 31, 2001). |
| | |
| 4.5. | Vodafone Group 1999 Long Term Stock Incentive Plan (incorporated by reference to Exhibit 4.7 to the Company’s Annual Report on Form 20-F for the financial year ended March 31, 2001). |
| | |
| 4.6. | Vodafone Group 1998 Company Share Option Scheme (incorporated by reference to Exhibit 4.8 to the Company’s Annual Report on Form 20-F for the financial year ended March 31, 2001). |
| | |
| 4.7. | Vodafone Group 1998 Executive Share Option Scheme (incorporated by reference to Exhibit 4.9 to the Company’s Annual Report on Form 20-F for the financial year ended March 31, 2001). |
| | |
| 4.8. | Agreement for Services with Lord MacLaurin of Knebworth (included in and incorporated by reference to Exhibit 4.10 to the Company’s Annual Report on Form 20-F for the financial year ended March 31, 2001). |
| | |
| 4.9. | Letter of Appointment of Paul Hazen (incorporated by reference to Exhibit 4.15 to the Company’s Annual Report on Form 20-F for the financial year ended March 31, 2003). |
| | |
| 4.10. | Service Contract of Arun Sarin (incorporated by reference to Exhibit 4.20 to the Company’s Annual Report on Form 20-F for the financial year ended March 31, 2003). |
| | |
| 4.11. | Service Contract of Sir Julian Horn-Smith (included in and incorporated by reference to Exhibit 4.10 to the Company’s Annual Report on Form 20-F for the financial year ended March 31, 2001). |
| | |
| 4.12. | Service Contract of Peter Bamford (included in and incorporated by reference to Exhibit 4.10 to the Company’s Annual Report on Form 20-F for the financial year ended March 31, 2001). |
| | |
| 4.13. | Service Contract of Thomas Geitner. |
| | |
| 4.14. | Service Contract of Kenneth Hydon (included in and incorporated by reference to Exhibit 4.10 to the Company’s Annual Report on Form 20-F for the financial year ended March 31, 2001). |
| | |
| 4.15. | Letter of Appointment of Sir John Bond. |
| | |
| 4.16. | Letter of Appointment of Dr. Michael Boskin (incorporated by reference to Exhibit 4.9 to the Company’s Annual Report on Form 20-F for the financial year ended March 31, 2003). |
| | |
| 4.17. | Letter of Appointment of Lord Broers (incorporated by reference to Exhibit 4.10 to the Company’s Annual Report on Form 20-F for the financial year ended March 31, 2003; at a meeting of the Directors of the Company held on September 16, 2003, the term of office of Professor Sir Alec Broers was extended until December 31, 2006). |
| | |
| 4.18. | Letter of Appointment of Dr. John Buchanan (incorporated by reference to Exhibit 4.11 to the Company’s Annual Report on Form 20-F for the financial year ended March 31, 2003). |
| | |
| 4.19. | Letter of Appointment of Penelope Hughes (incorporated by reference to Exhibit 4.17 to the Company’s Annual Report on Form 20-F for the financial year ended March 31, 2003; at a meeting of the Directors of the Company held on September 16, 2003, the term of office of Penelope Hughes was extended until August 31, 2007). |
| | |
| 4.20. | Letter of Appointment of Sir David Scholey (incorporated by reference to Exhibit 4.21 to the Company’s Annual Report on Form 20-F for the financial year ended March 31, 2003; at a meeting of the Directors of the Company held on September 16, 2003, the term of office of Sir David Scholey was extended until the Annual General Meeting of the Company in 2005). |
| | |
| 4.21. | Letter of Appointment of Jurgen Schrempp (incorporated by reference to Exhibit 4.21 to the Company’s Annual Report on Form 20-F for the financial year ended March 31, 2004). |
| | |
| 4.22. | Letter of Appointment of Luc Vandevelde (incorporated by reference to Exhibit 4.22 to the Company’s Annual Report on Form 20-F for the financial year ended March 31, 2004). |
| | | |
| 7. | Computation of ratio of earnings to fixed charges. |
| | |
| 8. | The list of the Company’s subsidiaries is incorporated by reference to note 34 to the Consolidated Financial Statements included in the Annual Report. |
| | |
| 12. | Rule 13a – 14(a) Certifications. |
| | |
| 13. | Rule 13a – 14(b) Certifications. |
| | |
| 15. | Consent of Deloitte & Touche LLP. |
| | |