Senior Management
Members of the Executive Committee who are not also executive directors are regarded as senior managers of the Company.
Executive Committee
Chaired by Arun Sarin, this committee focuses on the Group’s strategy, financial structure and planning, succession planning, organisational development and Group-wide policies. The Executive Committee membership comprises the Executive Directors, details of whom are shown on pages 50 to 51, and the senior managers who are listed below:
Brian Clark, Group Human Resources Director, aged 57, was appointed to this position in April 2005. He joined Vodafone in 1997 and, before his current position, was Chief Executive, Asia Pacific Region. Prior to joining Vodafone, he was Managing Director and Chief Executive Officer of Telkom SA Limited, South Africa.
Paul Donovan, Chief Executive Officer, EMAPA (Central Europe, Middle East, Asia Pacific and Affiliates), aged 47, was appointed to this position on 1 May 2006. He joined Vodafone in 1999 as Managing Director – Commercial, was appointed Chief Executive of Vodafone Ireland in 2001 and became Chief Executive Officer, Other Vodafone Subsidiaries in January 2005, managing fourteen of Vodafone’s controlled entities. He has over fifteen years experience in the telecommunications and IT industries and has held senior roles at BT, One2One and Optus Communications and, prior to that, marketing roles at the Mars Group, Coca Cola and Schweppes Beverages.
Warren Finegold, Chief Executive, Global Business Development, aged 49, was appointed to this position and joined the Executive Committee on 24 April 2006. He was previously a Managing Director of UBS Investment Bank and head of its technology team in Europe. He is responsible for Business Development, M&A and Partner Networks.
Alan Harper, Group Strategy and Business Integration Director, aged 49, joined Vodafone in 1995 as Group Commercial Director and he subsequently became Managing Director of Vodafone UK. He was appointed to his current position in July 2000. Prior to joining the Group, he held the post of Business Strategy Director with Mercury One2One and senior roles with Unitel and STC Telecoms. He is also a member of the Vodafone D2 GmbH Supervisory Board and Chairman of the Vodafone UK Foundation
Simon Lewis, Group Corporate Affairs Director, aged 47, joined Vodafone in November 2004. He previously held senior roles at Centrica Plc including Managing Director, Europe and Group Director of Communications and Public Policy. Prior to that he was Director of Corporate Affairs at NatWest Group and the Head of Public Relations at SG Warburg plc. He was President of the Institute of Public Relations in 1997 and is a Visiting Professor at the Cardiff School of Journalism. In 1998, he was seconded to Buckingham Palace for two years as the first Communications Secretary to the Queen. He is a Fulbright Commissioner and a trustee of The Vodafone Group Foundation.
Tim Miles, Global Chief Technology Officer, aged 48, was appointed to this position on 1 April 2006. He joined Vodafone New Zealand in 2001 as Director of Business Markets and was appointed Managing Director of Vodafone New Zealand in 2002. In April 2005, he joined Vodafone UK as Chief Executive Officer before moving to his present role. He has over twenty years’ experience in the IT and telecommunications industry. Prior to joining Vodafone, he was Vice President for Global Industries, Unisys Corporation, USA and, before that, held executive positions with Data General and IBM.
Bill Morrow, Chief Executive Officer, Europe, aged 46, was appointed to this position on 1 May 2006 after ten years with the Vodafone Group. Over the last ten years, he has held various positions, including President of Vodafone Japan, Chief Executive of Vodafone UK and President of Japan Telecom. He has twenty-six years of experience in the telecommunications industry, holding senior leadership roles in the USA, Asia and Europe. Bill Morrow is widely recognised for operational performance lifts, technology management and company restructuring.
Frank Rovekamp, Global Chief Marketing Officer, aged 51, was appointed to this position and joined the Executive Committee on 1 May 2006. He joined Vodafone four years ago as Marketing Director and a Member of the Management Board of Vodafone Netherlands and later moved to Vodafone Germany as Chief Marketing Officer and a member of the Management Board. Before joining Vodafone, Frank held roles as President and Chief Executive Officer of Beyoo and Chief Marketing Officer with KLM Royal Dutch Airlines.
Stephen Scott, Group General Counsel and Company Secretary, aged 52, was appointed Group General Counsel and Company Secretary in 1991, prior to which he was employed in the Racal Group legal department, having moved into industry in 1980 from private law practice in London. He is a director of the Company’s UK pension trustee company and of ShareGift (the Orr Mackintosh Foundation Limited) and is a director and trustee of LawWorks (the Solicitors Pro Bono Group Limited).
Strategy Board
The Strategy Board meets two or three times per year to discuss strategy. This is attended by Executive Committee members and the Chief Executive Officers of the major operating companies and other selected individuals based on Strategy Board topics.
Other Board and Executive Committee members
The following members also served on the Board or the Executive Committee during the 2006 financial year:
Peter Bamford was an executive director until 7 March 2006.
Ken Hydon was an executive director until he retired on 26 July 2005.
Sir David Scholey CBE was a non-executive director until he retired on 26 July 2005.
Pietro Guindani, Chief Executive Italy, was a member of Executive Committee until 1 May 2006.
Fritz Joussen, Chief Executive Germany, was a member of Executive Committee until 1 May 2006.
Jurgen von Kuczkowski was a member of the Executive Committee until he retired on 30 September 2005.
Shiro Tsuda, Executive Chairman and Chairman of the Board, Vodafone K.K., was an Executive Committee member until the completion of the sale of the Japanese business on 27 April 2006.
Phil Williams was a member of the Executive Committee until he retired on 31 July 2005.
Back to Contents
Corporate Governance
Introduction
Statement of corporate governance policy
The Board of directors of the Company is committed to high standards of corporate governance, which it considers are critical to business integrity and to maintaining investors’ trust in the Company. The Group expects all its directors and employees to act with honesty, integrity and fairness. The Group will strive to act in accordance with the laws and customs of the countries in which it operates; adopt proper standards of business practice and procedure; operate with integrity; and observe and respect the culture of every country in which it does business.
The Combined Code
The Company’s ordinary shares are listed in the United Kingdom on the London Stock Exchange. As such, the Company is required to make a disclosure statement concerning its application of the principles of and compliance with the provisions of the revised Combined Code on corporate governance (the “Combined Code”). For the year ended 31 March 2006, the Board confirms that the Company has been in compliance with the provisions of section 1 of the Combined Code. The disclosures provided below are nevertheless intended to provide an explanation of the Company’s corporate governance policies and practices.
US listing requirements
The Company’s ADSs are listed on the NYSE and the Company is, therefore, subject to the rules of the NYSE as well as US securities laws and the rules of the SEC. The NYSE requires US companies listed on the exchange to comply with the NYSE’s corporate governance rules but foreign private issuers, such as the Company, are exempt from most of those rules. However, pursuant to NYSE Rule 303A.11, the Company is required to disclose a summary of any significant ways in which the corporate governance practices it follows differ from those required by the NYSE for US companies. A summary of such differences is set out below.
The Company has established a Disclosure Committee with responsibility for reviewing and approving controls and procedures over the public disclosure of financial and related information, and other procedures necessary to enable the Chief Executive and Chief Financial Officer to provide their Certifications of the Annual Report on Form 20-F that is filed with the SEC.
Section 404 of the Sarbanes-Oxley Act of 2002 (US) requires the Company to annually assess and make public statements about the quality and effectiveness of its internal controls over financial reporting. As a non-US company, Vodafone is first required to report on its compliance with section 404 for the year ended 31 March 2007. Management’s report must describe conclusions about the effectiveness of the Company’s internal control over financial reporting based on management’s evaluation as of the end of the Company’s most recent fiscal year.
The Company has established a Steering Committee to provide strategic direction to the Company’s section 404 compliance efforts and a Programme Management Office which monitors progress and provides detailed guidance to the compliance teams that have been set up in the Group’s subsidiaries and central functions. The Company’s Audit Committee also plays an active role in monitoring these efforts. The Audit Committee receives progress updates at each of its meetings as well as a bi-annual status presentation from the Programme Management Office. The Company’s external auditors have been consulted throughout the project and will continue to be involved as the Company finalises its review.
The Company has reviewed the structure and operation of its “entity level” control environment: the overarching structure of review and monitoring essential to the management of its business.
Each of the Company’s subsidiaries and central functions has ensured that the relevant processes and controls are documented to appropriate standards, taking into account the guidance provided by the US Public Company Accounting Oversight Board’s Auditing Standard No. 2 and subsequent SEC Staff Questions and Answers related to the standard. The approach taken has been to identify the key financial reporting processes so that, in aggregate, the Company has reasonable assurance regarding the reliability of its financial reporting and the preparation of financial statements.
The Company is making satisfactory progress on the work required to enable it to report on its compliance with section 404 at 31 March 2007.
The Company has also adopted a corporate Code of Ethics for senior executive, financial and accounting officers, separate from and additional to its Business Principles, described below. A copy of this code is available on the Group’s website at www.vodafone.com.
Differences from New York Stock Exchange corporate governance practices
Independence
The NYSE rules require that a majority of the Board must be comprised of independent directors and the rules include detailed tests that US companies must use for determining independence. The Combined Code requires a company’s board of directors to assess and make a determination as to the independence of its directors. While the Board does not explicitly take into consideration the NYSE’s detailed tests, it has carried out an assessment based on the requirements of the Combined Code and has determined in its judgement that all of the non-executive directors are independent within those requirements. As at the date of this Annual Report, the Board comprised the Chairman, four executive directors and eleven non-executive directors.
Committees
Under NYSE rules, US companies are required to have a nominating and corporate governance committee and a compensation committee, each composed entirely of independent directors with a written charter that addresses the Committees’ purpose and responsibilities. The Company’s Nominations and Governance Committee and Remuneration Committee have terms of reference and composition that comply with the Combined Code requirements. The Nominations and Governance Committee is chaired by the Chairman of the Board, and its other members are non-executive directors of the Company and the Chief Executive. The Remuneration Committee is composed entirely of non-executive directors whom the Board has determined to be independent. The Company’s Audit Committee is composed entirely of non-executive directors whom the Board has determined to be independent and who meet the requirements of Rule 10A-3 of the Securities Exchange Act. The Company considers that the terms of reference of these committees, which are available on its website at www.vodafone.com, are generally responsive to the relevant NYSE rules but may not address all aspects of these rules.
Corporate governance guidelines
Under NYSE rules, US companies must adopt and disclose corporate governance guidelines. Vodafone has posted its statement of compliance with the Combined Code on its website at www.vodafone.com. The Company also has adopted a Group Governance Manual which provides the first level of the framework within which its businesses operate. The manual is a reference for Chief Executives and their teams and applies to all directors and employees. The Company considers that its corporate governance guidelines are generally responsive to, but may not address all aspects of, the relevant NYSE rules.
| Vodafone Group Plc Annual Report 2006 | 53 |
Back to Contents
Corporate Governance
continued
Business principles
In addition to the formal requirements of the Listing Authorities and Stock Exchanges described above, the Group has developed and implemented its own Business Principles which define its relationships with all of its stakeholders, govern how Vodafone conducts its day-to-day business and represents the additional commitments the Group makes to its stakeholders. These can be found on the Group’s website at www.vodafone.com.
The Business Principles apply to all subsidiary companies in the Group. Chief Executives are responsible for ensuring application of the Business Principles within their business. Vodafone also promotes the Business Principles to its joint venture companies, associated undertakings, business partners and third parties.
Every employee is expected to act in accordance with the Business Principles. A confidential email facility has been established for employees to report any concerns.
The Group tracks the implementation of its Business Principles through its internal audits.
Directors and Organisation
Board composition
The Company’s Board consists of 16 directors, 12 of whom served throughout the 2006 financial year. At 31 March 2006, in addition to the Chairman, Lord MacLaurin, there were four executive directors and ten non-executive directors. The Deputy Chairman, Paul Hazen, is the nominated senior independent director and his role includes being available for approach or representation by directors or significant shareholders who may feel inhibited from raising issues with the Chairman. He is also responsible for conducting an annual review of the performance of the Chairman and, in the event it should be necessary, convening an annual meeting of the non-executive directors.
Philip Yea, Anne Lauvergeon and Anthony Watson joined the Board as non-executive directors on 1 September 2005, 1 November 2005 and 1 May 2006 respectively. Peter Bamford ceased to be a member of the Board on 7 March 2006. Lord MacLaurin, Sir Julian Horn-Smith, Paul Hazen and Penny Hughes will retire on conclusion of the Company’s AGM on 25 July 2006. Sir John Bond will become the Chairman of the Company following the retirement of Lord MacLaurin and John Buchanan will succeed Paul Hazen as the Deputy Chairman and senior independent director. The Company considers all of its present non-executive directors to be fully independent. The executive directors are Arun Sarin (Chief Executive), Sir Julian Horn-Smith, Thomas Geitner and Andy Halford.
The following table shows directors’ attendance at meetings during the 2006 financial year:
| | | | | | Nominations and | | | |
| | | | Audit | | Governance | | Remuneration | |
| | Board | | Committee | | Committee | | Committee | |
|
|
|
|
|
|
|
| |
| Number of meetings | | | | | | | | |
| during the year | | | | | | | | |
| to 31 March 2006 | 8 | | 5 | | 3 | | 5 | |
|
|
|
|
|
|
|
| |
| Lord MacLaurin | 8 | | | | 2 | (1) | | |
| Paul Hazen | 8 | | 1 | | 2 | | | |
| Arun Sarin | 8 | | | | 3 | | | |
| Sir Julian Horn-Smith | 8 | | | | | | | |
| Peter Bamford(2) | 7 | | | | | | | |
| Thomas Geitner | 8 | | | | | | | |
| Andy Halford(3) | 6 | | | | | | | |
| Ken Hydon(4) | 2 | | | | | | | |
| Sir John Bond | 7 | | | | 2 | | 4 | |
| Dr Michael Boskin | 8 | | 5 | (1)(5) | | | 5 | |
| Lord Broers | 7 | | 5 | | 1 | | | |
| John Buchanan | 7 | | 5 | | | | | |
| Penny Hughes | 8 | | 4 | | | | 2 | |
| Anne Lauvergeon(6) | 3 | | 1 | | | | | |
| Sir David Scholey(4) | 2 | | 1 | | | | | |
| Professor Jürgen Schrempp | 8 | | | | 2 | | 5 | |
| Luc Vandevelde | 7 | | | | | | 4 | (1)(7) |
| Philip Yea(8) | 6 | | | | | | 2 | |
|
|
|
|
|
|
|
| |
| Notes: |
| (1) | Committee Chairman. |
| (2) | Peter Bamford ceased to be a member of the Board on 7 March 2006. |
| (3) | Andy Halford joined the Board on 26 July 2005 and from then until 31 March 2006 there were six Board meetings. |
| (4) | Ken Hydon and Sir David Scholey retired from the Board on conclusion of the AGM on 26 July 2005. |
| (5) | Dr Michael Boskin succeeded Paul Hazen as Chairman of the Audit Committee during the year. |
| (6) | Anne Lauvergeon joined the Board on 1 November 2005 and from then until 31 March 2006 there were four Board meetings. |
| (7) | Luc Vandevelde succeeded Penny Hughes as Chairman of the Remuneration Committee during the year. |
| (8) | Philip Yea joined the Board on 1 September 2005 and from then until 31 March 2006 there were six Board meetings. |
In addition to regular Board meetings, there are a number of other meetings to deal with specific matters. Directors unable to attend a Board meeting because of another engagement, as was the case for a number of directors in the year, are nevertheless provided with all the papers and information relevant for such meeting and are able to discuss issues arising in the meeting with the Chairman or the Chief Executive.
Re-election of Directors
Although not required by the Articles, in the interests of good corporate governance, the directors have resolved that they will all submit themselves for annual re-election at the AGM. Accordingly, at the AGM to be held on 25 July 2006, other than Lord MacLaurin, Sir Julian Horn-Smith, Paul Hazen and Penny Hughes who are retiring at the conclusion of the AGM, all the directors will be retiring and, being eligible and on the recommendation of the Nominations and Governance Committee, will offer themselves for re-election.
Performance evaluation
Performance evaluation of the Board, its Committees and individual directors takes place on an annual basis and is conducted within the terms of reference of the Nominations and Governance Committee with the aim of improving individual contributions, the effectiveness of the Board and its Committees and the Group’s performance. The Chairman leads the assessment of the Chief Executive and the non-executive directors, the Chief Executive undertakes the performance reviews for the executive directors and the senior independent director conducts the review of the performance of the Chairman. Each Board Committee undertakes a review of its own work and, in relation to the performance of the Board, each director is required to complete a comprehensive questionnaire, the results of which are analysed and discussed by the Nominations and Governance Committee prior to the presentation of recommendations to the Board. The evaluation process is designed to cover Board processes, the structure and capability of the Board, strategic alignment, Board dynamics and the skills brought to the Board by each director. A series of questionnaires has also been developed to facilitate the evaluation processes for each Board Committee.
| 54 | Vodafone Group Plc Annual Report 2006 |
Back to Contents
The evaluations found the performance of each director to be effective and concluded that the Board provides the effective leadership and control required for a listed company. The Nominations and Governance Committee confirmed to the Board that the contributions made by the directors offering themselves for re-election at the AGM in July 2006 continued to be effective and the Company should support their re-election.
Information and professional development
Each member of the Board has immediate access to a dedicated online team room and can access monthly information including actual financial results, reports from the executive directors in respect of their areas of responsibility and the Chief Executive’s report which deals, amongst other things, with investor relations, giving Board members an opportunity to develop an understanding of the views of major investors. These matters are discussed at each Board meeting. From time to time, the Board receives detailed presentations from non-Board members on matters of significance or on new opportunities for the Group. Financial plans, including budgets and forecasts, are regularly discussed at Board meetings. The non-executive directors periodically visit different parts of the Group and are provided with briefings and information to assist them in performing their duties. The non-executive directors and the Chairman regularly meet without executives present.
The Board is confident that all its members have the knowledge, ability and experience to perform the functions required of a director of a listed company. On appointment, all directors are provided with appropriate training and guidance as to their duties, responsibilities and liabilities as a director of a public and listed company and also have the opportunity to discuss organisational, operational and administrative matters with the Chairman, the Chief Executive and the Company Secretary. When considered necessary, more formal training is provided.
Matters for the Board
The Board has a formal schedule of matters specifically referred to it for decision, including:
| • | the approval of Group commercial strategy; |
| | |
| • | Group strategic and long-term plans; |
| | |
| • | major capital projects; |
| | |
| • | approving annual budgets and operating plans; |
| | |
| • | devising and reviewing the Group’s corporate governance structure; |
| | |
| • | Group financial structure (including tax and treasury policy); |
| | |
| • | approving statutory accounts and shareholder communications; |
| | |
| • | Group risk management; and |
| | |
| • | material contracts not in the ordinary course of business. |
This schedule is reviewed periodically. It was last formally reviewed and updated by the Nominations and Governance Committee in January 2004 and its proposals were subsequently approved by the Board. Its currency and continued validity were assessed as part of the performance evaluations conducted in the 2006 financial year described earlier in this Report. The agendas for Board meetings are initially developed by the Chief Executive and the Company Secretary and are finalised by the Chairman. The directors have access to the advice and services of the Company Secretary and, both as a group and individually, are entitled to take independent professional advice at the cost of the Company on matters relating to the proper discharge of their responsibilities.
Executive Management
The executive directors, together with certain other Group functional heads and regional chief executives, meet 12 times a year as the Executive Committee under the chairmanship of the Chief Executive. The Executive Committee is responsible for the day-to-day management of the Group’s businesses, the overall financial performance of the Group in fulfilment of strategy, plans and budgets and Group capital structure and funding. It also reviews major acquisitions and disposals.
Committees of the Board
The standing Board Committees are the Audit Committee, the Nominations and Governance Committee and the Remuneration Committee. The composition and terms of reference of these committees are published on the Group’s website at www.vodafone.com. The Secretary to these standing Board Committees is the Company Secretary or his nominee.
The Audit Committee
The Audit Committee is comprised of financially literate members having the necessary ability and experience to understand financial statements. Solely for the purpose of fulfilling the requirements of the Sarbanes-Oxley Act and the Combined Code, the Board
has designated John Buchanan, who is an independent non-executive director, satisfying the independence requirements of Rule 10A-3 of the US Securities Exchange Act 1934, as its financial expert on the Audit Committee. Further details of John Buchanan can be found in “Board of Directors and Group Management”.
Under its terms of reference, the Audit Committee is required, amongst other things, to oversee the relationship with the external auditors, to review the Company’s preliminary results announcement, interim results and annual financial statements, to monitor compliance with statutory and listing requirements for any exchange on which the Company’s shares are quoted, to review the scope, extent and effectiveness of the activity of the Group Internal Audit Department, to engage independent advisers as it determines is necessary and to perform investigations.
The Audit Committee reports to the Board on the quality and acceptability of the Company’s accounting policies and practices, including without limitation, critical accounting policies and practices. The Audit Committee also plays an active role in monitoring the Company’s compliance efforts for section 404 of the Sarbanes-Oxley Act and receives progress updates at each of its meetings as well as a bi-annual status presentation from the Programme Management Office.
At least twice a year, the Audit Committee meets separately with the external auditors and the Group Audit Director without management being present. Further details on the oversight of the relationships with the external auditors can be found under “Auditors” and the “Report from the Audit Committee” which are set out on page 57.
The Nominations and Governance Committee
The Nominations and Governance Committee, which provides a formal and transparent procedure for the appointment of new directors to the Board, generally engages external consultants to advise on prospective Board appointees. This year, the Committee recommended the appointment of three further non-executive directors. Detailed role profiles were agreed by the Committee before external search consultants were engaged to prepare a shortlist of potentially suitable candidates. Only after a rigorous interview process were the appointments recommended to the Board.
The Committee also reviewed the Group’s succession plans, directed the performance evaluations described earlier in this Annual Report, discussed matters of corporate governance and assessed the independence of non-executive directors prior to reporting to the Board.
The Remuneration Committee
The Remuneration Committee is responsible to the Board for the assessment and recommendation of policy on executive remuneration and packages for individual executive directors. The Committee has regular private sessions without executive directors present. Further information on the Committee’s activities is contained in the “Board’s Report to Shareholders on Directors’ Remuneration”.
Statement on Internal Control
Introduction
The Board has established procedures that implement in full the Turnbull Guidance, “Internal Control: Guidance for Directors on the Combined Code”, for the year under review and to the date of approval of the Annual Report. These procedures, which are subject to regular review, provide an ongoing process for identifying, evaluating and managing the significant risks faced by the Group.
Responsibility
The Board has overall responsibility for the system of internal control. A sound system of internal control is designed to manage rather than eliminate the risk of failure to achieve business objectives, and can only provide reasonable and not absolute assurance against material misstatement or loss. The process of managing the risks associated with social, environmental and ethical impacts is also discussed under “Corporate Responsibility and Environmental Issues”, on pages 59 to 60.
Control structure
The Board sets the policy on internal control that is implemented by management. This is achieved through a clearly defined operating structure with lines of responsibility and delegated authority. The Executive Committee, chaired by the Chief Executive, manages this on a day-to-day basis.
The Group’s brand essence, which encapsulates the Group’s commitment to integrity and continuous improvement, in combination with the Group’s Business Principles, sets the tone of the Group and reflects the control consciousness of management.
Written policies and procedures have been issued which clearly define the limits of delegated authority and provide a framework for management to deal with areas of
| Vodafone Group Plc Annual Report 2006 | 55 |
Back to Contents
Corporate Governance
continued
significant business risk. These policies and procedures are reviewed and, where necessary, updated at Executive Committee meetings.
Control Environment
The Group’s operating procedures include a comprehensive system for reporting information to the directors. This system is properly documented and regularly reviewed.
Budgets are prepared by subsidiary management and subject to review by both regional management and the directors. Forecasts are revised on a quarterly basis and compared against budget. When setting budgets and forecasts, management identifies, evaluates and reports on the potential significant business risks.
The Executive Committee and the Board review management reports on the financial results and key operating statistics.
Emphasis is placed on the quality and abilities of the Group’s employees with continuing education, training and development actively encouraged through a wide variety of schemes and programmes. The Group has adopted a set of values to act as a framework for its people to exercise judgement and make decisions on a consistent basis.
Directors are appointed to associated undertakings and joint ventures and attend the board meetings and review the key financial information of those undertakings. Clear guidance is given to those directors on the preparation that should take place before these board meetings and their activity at the board meeting. It is the Group’s policy, where possible, that its auditors are appointed as auditors of associated companies and joint ventures.
The acquisition of any business requires a rigorous analysis of the financial implications of the acquisition and key performance figures. A sensitivity analysis takes place of the key assumptions made in the analysis. Post investment appraisals of the Group’s investments are conducted on a periodic and timely basis.
The Board reviews a half-yearly report detailing any significant legal actions faced by Group companies.
The Executive Committee monitors legal, environmental and regulatory matters and approves appropriate responses or amendments to existing policy.
Monitoring and review activities
There are clear processes for monitoring the system of internal control and reporting any significant control failings or weaknesses together with details of corrective action.
A formal annual confirmation is provided by the chief executive officer and chief financial officer of each Group company certifying the operation of their control systems and highlighting any weaknesses. Regional management, the Audit Committee and the Board review the results of this confirmation.
The Chief Executive and the Chief Financial Officer undertake a review of the quality and timeliness of disclosures that includes formal annual meetings with the operating company or regional chief executives and the Disclosure Committee.
The Group Internal Audit Department, reporting directly to the Audit Committee, undertakes periodic examination of business processes on a risk basis and reports on controls throughout the Group.
Reports from the external auditors, Deloitte & Touche LLP, on certain internal controls and relevant financial reporting matters, are presented to the Audit Committee and management.
Review of Effectiveness
The directors, the Chief Executive and the Chief Financial Officer consider that any controls and procedures, no matter how well designed and operated, can provide only reasonable and not absolute assurance of achieving the desired control objectives. The Group’s management is required to apply judgement in evaluating the risks facing the Group in achieving its objectives, in determining the risks that are considered acceptable to bear, in assessing the likelihood of the risks concerned materialising, in identifying the company’s ability to reduce the incidence and impact on the business of risks that do materialise and in ensuring the costs of operating particular controls are proportionate to the benefit.
The directors, the Chief Executive and the Chief Financial Officer confirm that they have reviewed the effectiveness of the system of internal control and the disclosure controls and procedures through the monitoring process set out above, which as noted separately on page 55 does not include any statement of compliance with section 404
of the Sarbanes-Oxley Act, and are not aware of any significant weakness or deficiency in the Group’s system of internal control. The directors, the Chief Executive and the Chief Financial Officer have evaluated the effectiveness of the disclosure controls and procedures and, based on that evaluation, have concluded that the disclosure controls and procedures are effective as at the end of the period covered by this Annual Report.
During the period covered by this Annual Report, there were no changes in the Company’s internal control over financial reporting that have materially affected or are reasonably likely to materially affect the effectiveness of the internal controls over financial reporting.
Relations with Shareholders
The Company is committed to communicating its strategy and activities clearly to its shareholders and, to that end, maintains an active dialogue with investors through a planned programme of investor relations activities. The investor relations programme includes formal presentations of full year and interim results and quarterly statements on key performance indicators. The Company holds briefing meetings with its major institutional shareholders in the UK, the US and in Continental Europe, after the interim results and preliminary announcement, to ensure that the investing community receives a balanced and complete view of the Group’s performance and the issues faced by the Group. Telecommunications analysts are invited to presentations of the financial results and senior executives across the business attend relevant meetings and conferences throughout the year. During the year, the Company hosts investors and analysts sessions at which senior management from its largest operating subsidiaries, its largest joint venture and certain associated undertakings deliver presentations which provide an overview of each of the individual businesses. The Company, through its Investor Relations team, responds to enquiries from shareholders. The Chief Executive and the Chief Financial Officer meet regularly with institutional investors and analysts, who also have access to the Chairman if they so require, to discuss business performance.
The principal communication with private investors is through the provision of the Annual Review and Summary Financial Statement, the interim results and the AGM, an occasion which is attended by all the Company’s directors and at which all shareholders present are given the opportunity to question the Chairman and the Board as well as the Chairmen of the Audit, Remuneration and Nominations and Governance Committees. A summary presentation of results and development plans is also given by the Chairman at the AGM before dealing with the formal business of the meeting. The AGM is broadcast live on the Group’s website, www.vodafone.com, and a recording of the webcast can subsequently be viewed on the website. All substantive resolutions at the Company’s AGMs are decided on a poll. The poll is conducted by the Company’s Registrars and scrutinised by Electoral Reform Services. The proxy votes cast in relation to all resolutions are disclosed to those in attendance at the meeting and the results of the poll are published on the Company’s website and announced via the regulatory news service. Financial and other information is made available on the Company’s website, www.vodafone.com, which is regularly updated.
Political Donations
At the AGM on 26 July 2005, the Board sought and obtained shareholders’ approval to enable the Group to make donations to EU Political Organisations or incur EU Political Expenditure, under the relevant provisions of the Political Parties, Elections and Referendums Act 2000 (“the Act”). The approval given restricted such expenditure to an aggregate limit of £100,000 in the period of 12 months following the date of the AGM.
The Group has made no political donations during the year.
At this year’s AGM, to be held on 25 July 2006, the directors propose to seek a renewal of shareholders’ approval for a period of three years (until the AGM in 2009). The amount of the approval for each year until the AGM in 2009 will again be restricted to an aggregate amount of £100,000 (£50,000 in respect of donations to EU Political Organisations and £50,000 in respect of EU Political Expenditure).
Although the directors are seeking shareholders’ approval for the next three years, as with previous annual approvals, the Group has no intention of changing its current policy and practice of not making political donations and will not do so without the specific endorsement of shareholders. The Board seeks the approval on a precautionary basis, to avoid any possibility of unintentionally breaching the Act.
Directors’ Indemnities
The Companies (Audit Investigations and Community Enterprise) Act 2004 came into force on 6 April 2005 and, amongst other things, changed the provisions of Section 310 of the Companies Act 1985 to give companies the power to extend indemnities to directors against liability to third parties (excluding criminal and regulatory penalties) and to pay directors’ legal costs as incurred provided that they are reimbursed to the Company if the individual is convicted or, in an action brought by the Company, judgment is given against the director. Accordingly, the Company sought and obtained
| 56 | Vodafone Group Plc Annual Report 2006 |
Back to Contents
shareholder approval at the AGM in July 2005 to amend its Memorandum and Articles of Association to give it authority to provide funding for directors’ defence costs. Following that approval, the Company indemnified its directors and will indemnify new directors to the extent permitted by legislation.
Auditors
Following a recommendation by the Audit Committee and, in accordance with section 384 of the Companies Act 1985, a resolution proposing the re-appointment of Deloitte & Touche LLP as auditors to the Company will be put to the AGM.
In their assessment of the independence of the auditors and in accordance with the US Independence Standards Board Standard No. 1, “Independence Discussions with Audit Committees”, the Audit Committee receives in writing details of relationships between Deloitte & Touche LLP and the Company that may have a bearing on their independence and receives confirmation that they are independent of the Company within the meaning of the securities laws administered by the SEC.
In addition, the Audit Committee pre-approves the audit fee after a review of both the level of the audit fee against other comparable companies, including those in the
telecommunications industry, and the level and nature of non-audit fees, as part of its review of the adequacy and objectivity of the audit process.
In a further measure to ensure auditor independence is not compromised, policies have been adopted to provide for the pre-approval by the Audit Committee of all permitted non-audit services by Deloitte & Touche LLP. Should there be an immediate requirement for permitted non-audit services to be provided by Deloitte & Touche LLP which have not been pre-approved by the Audit Committee, the policies provide that the Group Audit Director will consult with the Chairman of the Audit Committee for pre-approval.
In addition to their statutory duties, Deloitte & Touche LLP are also employed where, as a result of their position as auditors, they either must, or are best placed to, perform the work in question. This is primarily work in relation to matters such as shareholder circulars, Group borrowings, regulatory filings and business acquisitions and disposals. Other work is awarded on the basis of competitive tender.
During the year, Deloitte & Touche LLP and its affiliates charged the Group’s subsidiary undertakings £4 million (2005: £4 million) for audit services and a further £4 million (2005: £3 million) for non-audit assignments. An analysis of these fees can be found in note 4 to the Consolidated Financial Statements.
Report from the Audit Committee
The composition of the Audit Committee is shown in the table on page 54 and its terms of reference are discussed under “Committees of the Board – The Audit Committee”.
During the year ended 31 March 2006, the principal activities of the Committee were as follows:
Financial statements
The Committee considered reports from the Chief Financial Officer and the Group Financial Controller on the half-year and annual financial statements. It also considered reports from the external auditors, Deloitte & Touche LLP, on the scope and outcome of the annual audit.
The financial statements were reviewed in the light of these reports and the results of that review reported to the Board.
Risk management and internal control
The Committee reviewed the process by which the Group evaluated its control environment, its risk assessment process and the way in which significant business risks were managed. It also considered the Group Audit department’s reports on the effectiveness of internal controls, significant frauds and any fraud that involved management or employees with a significant role in internal controls.
The Committee also reviewed and approved arrangements by which staff could, in confidence, raise concerns about possible improprieties in matters of financial reporting or other matters. This was achieved through using existing reporting procedures and a web site with a dedicated anonymous email feature.
External auditors
The Committee reviewed the letter from Deloitte & Touche LLP confirming their independence and objectivity. It also reviewed and pre-approved the scope of non-audit services provided by Deloitte & Touche LLP to ensure that there was no impairment of independence.
The Committee pre-approved the scope and fees for audit services provided by Deloitte & Touche LLP and confirmed the wording of the recommendations put by the Board to the shareholders on the appointment and retention of the external auditors.
Private meetings were held with Deloitte & Touche LLP to ensure that there were no restrictions on the scope of their audit and to discuss any items the auditors did not wish to raise with management present.
Internal audit
The Committee engaged in discussion and review of the Group Audit Department’s audit plan for the year, together with its resource requirements. Private meetings were held with the Group Audit Director.
Audit Committee effectiveness
The Audit Committee conducts a formal review of its effectiveness annually and concluded this year that it was effective and able to fulfil its terms of reference.

Dr Michael Boskin
On behalf of the Audit Committee
| Vodafone Group Plc Annual Report 2006 | 57 |
Back to Contents
Employees
Vodafone employs approximately 60,000 people worldwide, with a goal to recruit, develop and retain the most talented, motivated people that are well aligned with the Vodafone brand essence. The Company aims to do this by providing a good, safe working environment, treating people with respect and offering attractive incentives and opportunities. Training and development programmes help employees to develop their skills and experience and to reach their full potential, benefiting themselves and the Company.
Employee Involvement
The Board’s aim is to ensure that Vodafone people understand the Group’s strategic goals and the mutual obligations of working in a high performing, values-based organisation.
Vodafone’s values continue to provide a common way of doing things and are implicit in all that the Group does for and with its shareholders, customers and employees. During the year, Vodafone launched a major employee engagement initiative to bring alive the essence of the Vodafone brand. ‘Red, Rock Solid, Restless’ is the cornerstone to changing the culture of the Group by inspiring the behaviour of employees in their interactions with customers and other stakeholders.
The Board places a high priority on effective employee communications to create a dialogue with the Group’s people. In addition to the more traditional channels, the Group increasingly uses its own products and services, such as SMS and audio based messaging, and is currently trialling 3G video based internal communications media in some local markets. This is the natural next step in the evolution of VTV, the Group’s successful intranet based business television service.
The Chief Executive and other members of the executive management team continue to host the “Talkabout” programme, which aims to visit each of the Group’s local operating companies every year. In the “Talkabout” sessions, the executive team use the opportunity to discuss the Group’s strategic goals with as wide an audience of Vodafone people as possible, listening to their views and talking about the issues that matter most to them, as well as exchanging ideas about how Vodafone can serve its customers as a single, global team.
All of these initiatives are supported and enhanced by a comprehensive range of award winning in-house publications for effectively sharing information with employees on key performance indicators for the business. The Vodafone intranet was recently included by Nielsen Norman Research in their authoritative list as one of the ten best intranets in the world.
Vodafone’s success is driven by the passion and effort of the Group’s employees. In return, Vodafone values employees’ opinions on improving the performance of the Group. Within European subsidiaries, employee representatives meet annually with members of the executive management team in the Vodafone European Employee Consultative Council to discuss the performance and prospects of the Group and significant trans-national issues.
In 2005, Vodafone carried out its second biennial Employee Survey to measure the levels of employee satisfaction and engagement. 89% of employees from 17 countries, including Japan, took part to inform the Company on its progression on the key issues highlighted by the first survey in 2003.
The results showed that Vodafone employees had responded more positively in 2005 than in 2003. Specific results indicated that the overwhelming majority of employees are proud to work for Vodafone, understand the importance of Vodafone’s values, know the results expected of them in their jobs and have a good understanding of Vodafone’s strategic goals and priorities. The number of employees agreeing with the statement “I am proud to work for Vodafone” was equal to the high performance norm for companies on the Fortune list of “Most Admired Companies”.
Vodafone is focused on continually improving and, as a result, the Company has identified three areas to be addressed through co-ordinated global and local action:
| • | To take a genuine interest in employees and their development, by taking a more proactive approach to developing employees, with a specific emphasis on coaching and feedback. This area will be supported by the global launch of a performance management process in the next financial year and the launch of selected functional ‘Academies’ which focus on the professional and skills development offered to employees; |
| | |
| • | To improve the Group’s understanding of the underlying customer focus issues in each market and identify improvements in the service offered. Meeting customers’ requirements remains at the heart of the business and will continue to differentiate Vodafone from our competition; and |
| | |
| • | To develop practical global frameworks and guidelines to help employees effectively manage change within the business. |
The next Employee Survey is scheduled to take place in the 2007 financial year.
Employment Policies
The Group’s employment policies are consistent with the principles of the United Nations Universal Declaration of Human Rights and the International Labour Organisation Core Conventions and are developed to reflect local legal, cultural and employment requirements. High standards are maintained wherever the Group operates, as Vodafone aims to ensure that the Group is recognised as an employer of choice. Employees at all levels and in all companies are encouraged to make the greatest possible contribution to the Group’s success. The Group considers its employee relations to be good.
Equal Opportunities
Vodafone does not condone unfair treatment of any kind and operates an equal opportunities policy for all aspects of employment and advancement, regardless of race, nationality, sex, age, marital status, disability or religious or political belief. In practice, this means that the Group is able to select the best people available for positions on the basis of merit and capability, making the most effective use of the talents and experience of people in the business, providing them with the opportunity to develop and realise their potential.
The Disabled
The directors are conscious of the special difficulties experienced by people with disabilities. Every effort is made to ensure ready access to the Group’s facilities and services and a range of products has been developed for people with special needs. In addition, disabled people are assured of full and fair consideration for all vacancies for which they offer themselves as suitable candidates and efforts are made to meet their special needs, particularly in relation to access and mobility. Where possible, modifications to workplaces have been made to provide access and, therefore, job opportunities for the disabled. Every effort is made to continue the employment of people who become disabled via the provision of additional facilities, job design and the provision of appropriate training.
Health, Safety and Wellbeing
The health, safety and wellbeing of the Group’s customers, employees and others who could be affected by its activities are of paramount importance to Vodafone and the Group applies rigorous standards to all of its operations.
The health and safety management in each operating company is audited annually and the results are submitted in a report for discussion by the Board. The Group’s annual global health and safety audit has shown a consistent rise in scores every year since inception in 2002. New standards, policies and a health and safety management system have been implemented, with an increase in consultation, participation and best practice sharing by health and safety professionals from the operating companies. These will be further developed in the next financial year.
| 58 | Vodafone Group Plc Annual Report 2006 |
Back to Contents
Corporate Responsibility and Environmental Issues
Corporate Responsibility
Vodafone sees corporate responsibility (“CR”) as the process of understanding the expectations of stakeholders in the Group and taking appropriate action to meet those expectations where they are realistic and legitimate. Stakeholders include customers, investors, employees, suppliers, the communities where the Group operates and where networks are based, governments and regulators and representatives of civil society.
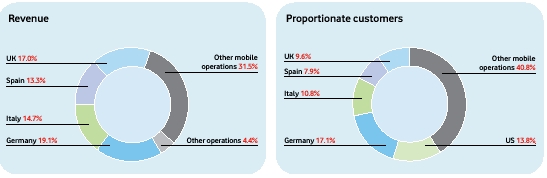
CR is relevant across all aspects of business strategy and is encapsulated in the Group’s strategic goal of being a responsible business. The Executive Committee, chaired by the Chief Executive, receives regular information on CR and the Director of Corporate Responsibility provides an annual report to the Board. All mobile operating companies have a representative on their management boards with responsibility for CR. For purposes of this section of the Annual Report, all mobile operating companies refers to the Group’s mobile operating subsidiaries and the Group’s joint venture in Italy, with the exception of the newly acquired operations in Czech Republic and Romania and the Swedish operations which were disposed of in the year. The CR impact of the Japanese operations has been included in the information presented in this section, reflecting the Group’s responsibility for its impact throughout the 2006 financial year. Systems for data collection on corporate responsibility and environmental issues are being put in place for the 2007 financial year for the Czech Republic and Romania.
CR is at the heart of Vodafone’s values and is clearly linked to one of the Group’s four passions, Passion for the world around us. Vodafone’s approach to business is underpinned by the Business Principles which cover, amongst other things, environment, employees, individual conduct and community and society. The Business Principles are available on www.vodafone.com/responsibility/businessprinciples and are communicated to employees in a number of ways, including induction processes, websites and briefings. In the 2006 financial year, CR matters were included within the Group’s development programme for directors and senior managers.
Vodafone aims to integrate CR into the business and this is being reflected in governance, policy, process and reporting. For example, CR is integrated into Vodafone’s risk management processes such as the formal annual confirmation provided by each mobile operating company detailing the operation of their controls system, as outlined on page 55.
CR performance is closely monitored and reports are provided to most mobile operating company boards on a regular basis. This has driven demonstrable performance improvement and is valuable in benchmarking.
These processes are supported by stakeholder engagement, which seeks to provide a clear understanding of expectations of performance. The Group engages with stakeholders in a variety of different ways. For example, during the financial year, meetings relating to CR issues were held with 15 investors; a quantitative perception survey was carried out with 146 opinion leaders (including academics, non governmental organisations and policy makers) in 11 European countries and face to face meetings were held with non governmental organisations and opinion formers. This process of stakeholder engagement helps to ensure Vodafone is aware of the issues relevant to the business and that it is focused on the priority areas. This is covered in more detail in the Company’s CR Report for the 2006 financial year, which can be found at www.vodafone.com/responsibility.
Vodafone has maintained last year’s level of independent assessment and assurance of the CR programme and performance data. The scope of work for the Group’s auditors includes a review of certain environmental, community and health and safety performance data across the business, the progress achieved against commitments set in the 2005 financial year, as well as to review the management and reporting of CR matters against the requirements of the assurance standard AA1000 AS, issued by AccountAbility. This identifies, in all material respects, whether reporting reflects the material CR issues of the Group as defined by the standard, whether processes are in place to ensure a complete understanding of the issues, and whether Vodafone is responding adequately to identified stakeholders’ expectations. The assurance statement is published in the Company’s CR Report.
Over the last year, progress has been made in responding to the Group’s stakeholders’ expectations. The most significant developments are summarised below and further details are provided in the Company’s CR Report and on www.vodafone.com/responsibility. In addition to the Company’s CR Report, ten mobile operating subsidiaries have produced their own CR reports.
Vodafone is included in the FTSE4Good and Dow Jones Sustainability Index.
Socially inclusive products
Vodafone is working to improve people’s access to mobile communications and is developing products and services that support health and personal security and use secure mobile messaging to facilitate micro-finance in developing countries. In February 2006, Vodafone announced a commitment of £5 million over a period of four years to the Group’s Social Investment Fund. The fund facilitates the development of commercially viable products and services with high social value, particularly those that increase accessibility. Examples of initiatives during the year include:
| • | The Vodafone Speaking Phone with screen reader software for the blind and visually impaired, has been fully launched in six markets and test launched in one other. An assessment of the availability of handsets with accessibility features and an investigation into the compatibility of hearing aids and mobile phones have been completed. |
| | |
| • | A mobile micro-finance platform called M-pesa has been trialled in Kenya, with support from the UK Department for International Development. The payment platform is being used to enable customers without local bank infrastructure to move money between accounts and to make remittances. |
Parental controls
Two mobile operating companies have implemented parental control tools to enable customers to protect their children by restricting access to adult oriented wap and internet sites. A further three mobile operating companies have launched access controls for Vodafone live!
Group guidelines on premium rate subscription services have been developed. The guidelines recommend that mobile operating companies require providers of premium rate subscription services to advertise clearly and send a confirmation text to customers when they sign up explaining applicable charges and clearly stating how to opt out.
Earning the trust of customers
Vodafone values its long-term reputation with customers. Several issues are key to maintaining customers’ trust, including the clarity of the pricing, marketing communications and the way Vodafone handles the confidentiality of customers’ communications and personal information.
During the year, two major initiatives that provide clearer and easier to understand costs for customers were launched:
| • | Vodafone Passport offers clearer pricing for international roaming, with a one off connection fee per call. Vodafone Passport won the 2006 GSM Association award for ‘Best Roaming Product or Service’. To date, over 6 million customers have subscribed to Vodafone Passport. |
| | |
| • | For the Vodafone Mobile Connect data card tariffs, which offer high speed internet connection to laptops, a monthly roaming bundle was developed to make roaming costs more predictable. |
In November 2005, Vodafone adopted a group wide privacy policy that covers the collection, storage and use of our customers’ personal information. The policy is overseen by a Privacy Steering Group, a cross functional body made up of senior management, and requires the appointment of a Privacy Officer by each Vodafone mobile operating company with day-to-day responsibility for compliance. An overview of Vodafone’s Privacy Policy is available at www.vodafone.com/responsibility.
The programme of responsible marketing and advertising continued, shifting the focus from control to awareness raising. Upheld complaints received by advertising regulatory bodies were monitored throughout the markets. Most of these related to price claims and clarity.
Supply chain
The Group continues to implement Vodafone’s Code of Ethical Purchasing (“CEP”), which sets out environmental and labour standards for suppliers.
| • | Corporate responsibility is one of six pillars in Vodafone’s overall Supplier Performance Management system. |
| | |
| • | Over 80% of purchasing managers and staff from across the Group have received training on the CEP. |
| | |
| • | A risk based approach has been introduced across the Group to prioritise which suppliers require further assessment for compliance against the CEP. In the 2006 financial year, over 600 suppliers have been reviewed for risk and over 80 suppliers have completed a self assessment process. 15 site evaluations have been completed. |
Vodafone continues to work with other information and communication technology companies to develop a common approach to managing CR in the supply chain.
| Vodafone Group Plc Annual Report 2006 | 59 |
Back to Contents
Corporate Responsibility and Environmental Issues
continued
Socio-economic potential of mobiles
Following on from research published in the 2005 financial year on the broader impact of mobile telecommunications in Africa, the Group commissioned and published research into the impact of mobile phones in healthcare. The study demonstrated how existing voice and text message applications could increase productivity, improve patient health and enable greater access to health services in the developed and developing world. Further information is available at www.vodafone.com/healthcare.
Social investment
The Vodafone Group Foundation and family of local foundations have continued to implement a programme of grant making activity. In the 2006 financial year, the process of establishing new local foundations in the Czech Republic and Albania was initiated.
During the year ended 31 March 2006, the Company made cash charitable donations of £24.0 million to The Vodafone Group Foundation. In addition, Group operating companies donated a further £10.0 million to local Vodafone Foundations and a further £6.9 million directly to a variety of causes. These donations total £40.9 million and include donations of £2.5 million made as required by the terms of certain network operating licences. More details regarding the activities of The Vodafone Group Foundation and local Vodafone Foundations can be found in the Company’s CR Report for the 2006 financial year.
Environmental Issues
The Group continues to monitor and manage the impact of its activities on the environment and is committed to minimising adverse impacts in an appropriate manner. Over the last 12 months, progress has been made across a series of projects that address environmental issues, including mobile phones, masts and health; responsible network deployment; energy use and efficiency; and the reuse and recycling of equipment.
Mobile phones, masts and health
Vodafone supports research, aligned to World Health Organisation (“WHO”) priorities, to resolve scientific uncertainty relating to mobile phones, masts and health, and is committed to reducing public concern by making objective information widely available to stakeholders and by engaging in open, transparent dialogue.
In the 2006 financial year, the Group engaged with a wide range of external and internal stakeholders through surveys, guidelines (consistent with WHO advice), Vodafone websites and other existing forms of communications, to promote a consistent and high level of understanding on the subject. Vodafone also led the industry on the introduction of bodyworn testing of all handsets sold in Europe. This involves testing exposure to RF (Radio Frequency) fields not only to the head but to other parts of the body.
Please also refer to note 31 to the Consolidated Financial Statements for further information.
Responsible network deployment
Vodafone’s mobile services rely on a network of base stations that transmit and receive calls. The Group recognises that network roll out can cause concern to communities, usually about the visual impact of base stations or health issues concerning RF fields. This year, Vodafone was found in breach of planning regulations relating to 46 mast sitings. Fines levied by regulatory bodies or Courts in relation to offences under environmental law or regulations were approximately £63,000. To address these challenges, Vodafone began implementing a Group policy and guidelines on responsible network deployment. These set out consistent standards for all mobile operating companies on legal compliance, environmental impact, RF emissions, site planning and selection, communication and consultation, and landlord relationships.
Energy use and efficiency
A consequence of the Group’s business growth is increasing energy demand to run the network. This is Vodafone’s most significant environmental impact and limiting the Group’s contribution to climate change is a priority. In partnership with equipment manufacturers, Vodafone is improving the energy efficiency of the network so that data and voice can be transmitted with greater efficiency. In the 2006 financial year:
| • | Energy use increased 23% to 3,198 GWh, equating to 1.31 million tonnes of carbon dioxide. |
| | |
| • | There has been a 22% increase from the previous year in the amount of renewable energy used by the Group and this has resulted in 12% of total grid energy being sourced from renewables. Vodafone has also trialled onsite renewable energy technologies including the use of hydrogen fuel cells, wind generators and solar power. |
Reuse and recycling
Mobile phones, accessories and the networks on which they operate require upgrading, replacement and decommissioning. Whilst Vodafone does not manufacture mobile phones or equipment, the Group is committed to working closely with suppliers to improve the sustainability of mobiles and network equipment. Waste management involves minimisation, reuse and recycling before waste disposal. The following were achieved during the year:
| • | 1.37 million phones have been collected for reuse and recycling and collection programmes are in place in 15 mobile operating companies. |
| | |
| • | Initiatives have been launched to raise awareness and encourage recycling. These include offering incentives for customers and promoting handset recycling with corporate customers and employees. |
| | |
| • | 97% of network equipment waste was sent for reuse or recycling. |
| | |
| Environmental Performance Indicators | | | | | |
| | | 2006 | (1) | 2005 | (1) |
|
|
|
|
| |
| Number of mobile operating subsidiaries undertaking independent RF field monitoring | | 15 | | 14 | |
| Total energy use (GWh) (direct and indirect) | | 3,198 | | 2,600 | |
| Total carbon dioxide emissions (millions of tonnes) | | 1.31 | | 1.2 | |
| % of energy sourced from renewables | | 12 | | 11 | |
| Number of phones collected for reuse and | | | | | |
| recycling (million) | | 1.37 | | 1.27 | |
| % network equipment waste sent for reuse or recycling | | 97 | | 96 | |
|
|
|
|
| |
| Note: |
| (1) | These performance indicators were calculated using actual or estimated data collected by the Group’s mobile operating companies. The data is sourced from invoices, purchasing requisitions, direct data measurement and estimations where required. The carbon dioxide emissions figure is calculated using the Kwh/CO2 conversion factor for the electricity provided by the national grid and for other energy sources in each operating company. The data collection and reporting process is within the assurance undertaken by Deloitte & Touche LLP on the Company’s CR Report. The data for the 2005 financial year excludes newly acquired operations in the Czech Republic and Romania and operations in Sweden that were sold during 2006. It includes the Group’s joint venture in Italy and the discontinued operation in Japan. |
| 60 | Vodafone Group Plc Annual Report 2006 |
Back to Contents
Board’s Report to Shareholders on Directors’ Remuneration
Dear Shareholder
Since the introduction of the current Executive Remuneration Policy in 2002 (the “Policy”), the Remuneration Committee has conducted annual reviews to ensure that the Policy continues to serve the Company and shareholders. Following my appointment as Chairman of the Committee, we have undertaken a review again this year.
As a result of this year’s review, the Remuneration Committee has concluded that the existing Policy remains appropriate but wishes to make three minor changes. These are as follows:
| • | the deferred bonus scheme will be extended to members of the Executive Committee based outside of the UK, and the mechanics amended in light of recent US tax legislation; |
| | |
| • | we have considered the weighting of performance shares and options within our long term incentives, and will place a greater weighting on performance shares for 2006 awards, thus increasing the emphasis on total shareholder return performance; and |
| | |
| • | dividends will be accrued on performance shares awarded from 2006 and transferred as shares on the vesting of awards, to increase the alignment of executive and shareholder interests. |
The key principles of the Policy, which are being maintained, are:
| • | the expected value of total remuneration will be benchmarked against the relevant market; |
| | |
| • | a high proportion of total remuneration will be delivered through performance related payments; |
| | |
| • | performance measures will be balanced between absolute financial measures and sector comparative measures to achieve maximum alignment between executive and shareholder objectives; |
| | |
| • | the majority of performance related remuneration will be provided in the form of equity; and |
| | |
| • | share ownership requirements will be applied to executive directors. |
The Committee continues to monitor how well incentive awards made in previous years align with the Company’s performance. The Policy continues to work well and forecast rewards are commensurate with actual performance. I am confident that the Policy continues to align executives’ interests with the interests of shareholders, whilst enabling the Company to engage a high calibre team to successfully lead the Company. I hope that we receive your support at the AGM on 25 July 2006.

Luc Vandevelde
Chairman of the Remuneration Committee
30 May 2006
Remuneration Committee
The Remuneration Committee is comprised to exercise independent judgement and consists only of independent non-executive directors. Luc Vandevelde (Chairman), Sir John Bond, Dr Michael Boskin and Professor Jürgen Schrempp continue as members. Philip Yea joined the Committee on 1 January 2006. The Chief Executive and Chairman are invited to attend meetings of the Remuneration Committee, other than when their own remuneration is being discussed.
The Remuneration Committee met on five occasions during the year. The Committee appointed and received advice from Towers Perrin (market data and advice on market practice and governance) and Kepler Associates (performance analysis and advice on performance measures and market practice) and received advice from the Group Human Resources Director and the Group Compensation and Benefits Director. The advisers also provided advice to the Company on general human resource and compensation related matters.
Remuneration Policy
The Policy was approved by shareholders in July 2002. The Policy is set out below:
| | | |
| | The overriding objective of the Policy on incentives is to ensure that Vodafone is able to attract, retain and motivate executives of the highest calibre essential to the successful leadership and effective management of a global company at the leading edge of the telecommunications industry. To achieve this objective, Vodafone, from the context of its UK domicile, takes into account both the UK regulatory framework, including best practice in corporate governance, shareholder views, political opinion and the appropriate geographic and nationality basis for determining competitive remuneration, recognising that this may be subject to change over time as the business evolves. The total remuneration will be benchmarked against the relevant market. Vodafone is one of the largest companies in Europe and is a global business; Vodafone’s policy will be to provide executive directors with remuneration generally at levels that are competitive with the largest companies in Europe. A high proportion of the total remuneration will be awarded through performance related remuneration, with phased delivery over the short, medium and long term. For executive directors, approximately 80% of the total expected remuneration will be performance related. Performance measures will be balanced between absolute financial measures and sector comparative measures to achieve maximum alignment between executive and shareholder objectives. All medium and long term incentives are delivered in the form of Vodafone shares and options. Executive directors are required to comply with share ownership guidelines. | |
| | | |
The structure of remuneration for executive directors under the Policy (excluding pensions) is illustrated below:

The Policy’s key objective is to ensure that there is a strong linkage between pay and performance. This is achieved by approximately 80% of the total package (excluding pensions) being delivered through performance-linked short, medium and long term incentive plans. Therefore, the only guaranteed payment to executive directors is their base salary.
The Remuneration Committee selects performance measures for incentive plans that provide the greatest degree of alignment with the Company’s strategic goals and that are clear and transparent to both directors and shareholders. The performance measures adopted incentivise both operational performance and share price growth.
| Vodafone Group Plc Annual Report 2006 | 61 |
Back to Contents
Board’s Report to Shareholders on Directors’ Remuneration
continued
Each element of the reward package focuses on supporting different Company objectives, which are illustrated below:
| | | Purpose | | Performance Measure(s) | |
| |
| Base salary | • | Reflects competitive market | • | Individual contribution | |
| | | level, role and individual | | | |
| | | achievement | | | |
|
|
|
|
| |
| Annual | • | Motivates achievement of | • | Adjusted operating profit | |
| deferred | | annual business KPIs | • | Free cash flow | |
| share bonus | • | Provides incentive to co-invest | • | Total service revenue | |
| | • | Motivates achievement of | • | Customer satisfaction | |
| | | medium term KPIs | • | Adjusted EPS growth on share | |
| | • | Aligns with shareholders | | deferral | |
|
|
|
|
| |
| Share options | • | Incentivise earnings growth | • | Adjusted EPS growth | |
| | | and share price growth | | | |
| | • | Aligns with shareholders | | | |
|
|
|
|
| |
| Performance | • | Incentivise share price and | • | Relative Total Shareholder | |
| shares | | dividend growth | | Return (“TSR”) | |
| | • | Aligns with shareholders | | | |
The principles of the Policy are cascaded, where appropriate, to executives below Board level as set out below:
| | | Cascade of policy to Executive Committee | |
|
|
| |
| Base salary | | Set against national market | |
|
|
| |
| Annual Deferred | | Target bonus level competitive in local market, | |
| Share Bonus | | payout conditional on business performance | |
| | | relevant to individual executive | |
| | | | |
| | | Opportunity to defer bonus to be extended to | |
| | | Executive Committee members based overseas | |
| | | in 2006 | |
|
|
| |
| Long Term Incentive | | Annual awards of performance shares and share | |
| | | options with performance conditions | |
Report on Executive Directors’ Remuneration for the 2006
Financial Year and Subsequent Periods
Total remuneration levels
In accordance with the Policy, the Company benchmarks total remuneration levels against other large European domiciled companies, using externally provided pay data. Total remuneration for these purposes means the sum of base salary and short, medium and long term incentives. The European focus was selected because Europe continues to be Vodafone’s major market and the Company is one of the top ten companies in Europe by market capitalisation. The competitive data is used as one input to determine the remuneration level of the Chief Executive and Board. The Committee also takes into account other factors, including personal and Company performance, in determining the target remuneration level.
Components of executive directors’ remuneration
Executive directors receive base salary, short and medium term incentive (annual deferred share bonus), long term incentives (performance shares and share options) and pension benefits. Vesting of all incentives is dependent on the achievement of performance targets that are set by the Remuneration Committee prior to the awards being granted.
Base salary
Salaries are reviewed annually and adjustments may be made to reflect competitive national pay levels, the prevailing level of salary reviews of employees within the Group, changes in responsibilities and Group and individual performance. External remuneration consultants provide data about market salary levels and advise the Committee accordingly. Pension entitlements are based only on base salary.
Incentive awards
Short and medium term incentive: annual deferred share bonus
The purpose of the annual deferred share bonus is to focus and motivate executive directors to achieve annual business KPIs that will further the Company’s medium term objectives. Awards made in July 2003 under the Vodafone Group Short Term Incentive Plan (“STIP”) vested in July 2005. Details of STIP awards are given in the table on page 66.
The Company has reviewed the current STIP in light of changes to US tax legislation and will make future awards under the Vodafone Global Incentive Plan Rules approved by shareholders in 2005. This will enable the plan to be operated for members of the Executive Committee based overseas. Whilst the mechanics of the plan will change, the quantum of awards will remain the same.
The STIP comprises two elements: a base award and an enhancement award. Release of both elements after three years is dependent upon the continued employment of the participant.
Base award
The base award is earned by achievement of one year KPI linked performance targets and is delivered in the form of shares. The target base award level for the 2006 financial year was 100% of salary with a maximum of 200% of salary available for exceptional performance. From 2006, the base award will be deferred into shares, net of tax.
The Remuneration Committee reviews and sets the base award performance targets on an annual basis, taking into account business strategy. The performance measures for the 2006 financial year relate to adjusted operating profit, total service revenue, free cash flow and customer delight. Each element is weighted according to the responsibilities of the relevant director. For the Chief Executive, in the 2006 financial year, the adjusted operating profit target was 30% of the total, total service revenue 35%, free cash flow 20% and customer satisfaction 15%, and the payout achieved was 118.7%. The targets are not disclosed, as they are commercially sensitive. For the 2007 financial year, no changes will be made to the performance measures or weightings. More information on Company performance against KPIs in the 2006 financial year can be found in “Key Performance Indicators” on page 29.
The Group may, at its discretion, pay a cash sum of up to the value of the base award in the event that an executive director declines the share award. In these circumstances, the executive director will not be eligible to receive the enhancement award or any cash alternative.
Enhancement award
An enhancement award of 50% of the number of shares comprised in the pre-tax base award is earned by achievement of a subsequent two year EPS performance target following the initial twelve month period. For awards made in the 2006 financial year, which will vest in July 2007, the performance measure related to growth in adjusted EPS. Three quarters of the enhancement award will vest for achievement of EPS growth of 11% rising to full vesting for achievement of EPS growth of 16% over the two year performance period.
Long term incentives
Awards of performance shares and share options were made to executive directors following the 2005 AGM on 26 July 2005. The awards for the 2006 financial year will be also be made following the AGM.
Awards in the 2006 financial year were made under the Vodafone Group Plc 1999 Long Term Stock Incentive Plan. Awards of performance shares and options in the 2007 financial year will be made under the Vodafone Global Incentive Plan.
Awards are delivered in the form of ordinary shares of the Company. All awards are made under plans that incorporate dilution limits as set out in the Guidelines for Share Incentive Schemes published by the Association of British Insurers. The current estimated dilution from subsisting awards, including executive and all-employee share awards, is approximately 2.6% of the Company’s share capital at 31 March 2006 (2.4% as at 31 March 2005).
Performance shares
Performance shares are awarded annually to executive directors. Vesting of the performance shares depends upon the Company’s relative TSR performance. TSR measures the change in value of a share and reinvested dividends over the period of measurement. The Company’s TSR performance is compared to that of other companies in the FTSE Global Telecommunications index as at the date of grant, over a three-year performance period.
In the 2006 financial year, the Chief Executive received an award of performance shares with a face value of two times base salary; the Deputy Chief Executive and other executive directors one and a half times their base salary.
Performance shares will vest only if the Company ranks in the top half of the ranking table; maximum vesting will only occur if the Company is in the top 20%. Vesting is also conditional on underlying improvement in the performance of the Company. Awards will vest to the extent that the performance condition has been satisfied at the end of the three-year performance period. To the extent that the performance target is not met, the awards will be forfeited. The following chart shows the basis on which the performance shares will vest:
| 62 | Vodafone Group Plc Annual Report 2006 |
Back to Contents
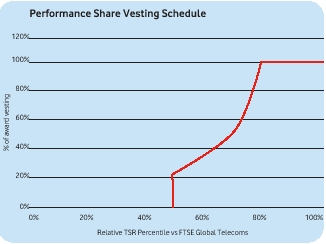
For awards made in the 2007 financial year, dividend equivalents will be awarded at vesting. Initial award levels will be adjusted to take into account the increased expected value of awards and the proportion of dividend equivalents transferred will reflect TSR performance achievement.
Previously disclosed performance share awards granted in the 2003 financial year vested in the 2006 financial year. Details are given in the table on page 67.
Share options
Share options are granted annually to executive directors. The exercise of share options is subject to the achievement of a performance condition set prior to grant. The Remuneration Committee determined that the most appropriate performance measure for awards relating to the 2006 financial year was absolute growth in adjusted EPS. One quarter of the option award will vest for achievement of EPS growth of 8% p.a. rising to full vesting for achievement of EPS growth of 16% p.a. over the performance period. In setting this target the Remuneration Committee has taken the internal long range plan and market expectations into account. The Remuneration Committee has decided that for the 2007 financial year grants, the performance range will be 5% – 10% p.a. The following chart illustrates the basis on which share options granted in the 2006 financial year will vest:

Options have a ten year term and will vest after three years, subject to performance achievement. To the extent that the performance target is not met, the options will lapse. Re-testing of performance is not permitted.
The price at which shares can be acquired on option exercise will be no lower than the market value of the shares on the day prior to the date of grant of the options. Therefore, scheme participants only benefit if the share price increases and vesting conditions are achieved.
In July 2005, the Chief Executive received an award of options with a face value of six and a half times base salary; the Deputy Chief Executive and the other executive directors five times their base salary.
Illustration
To help shareholders understand the value of the package provided to the Chief Executive, the following illustration demonstrates that in order to gain value from the incentive plans, considerable shareholder value must be created.
For example, if the Company’s share price increases by over 50% from 127.0 pence to approximately 190.0 pence, the Company’s value increases by £42 billion, and there was a 50% vesting of long term incentives, the Chief Executive would have a pre-tax gain of approximately £4 million, representing less than a hundredth of 1% of the total increase in shareholder value.
Measurement of performance under IFRS
From 1 April 2005, the Company has prepared its financial statements under IFRS. The Remuneration Committee has reviewed the impact of the introduction of IFRS for incentive scheme purposes, to ensure that EPS performance achievement is measured on a consistent basis and that the introduction of the new standard does not advantage or disadvantage participants. For the schemes affected, EPS under IFRS is adjusted to reflect UK GAAP measurement so that performance may be measured on a consistent basis. In each case, an independent auditor is requested to review and verify the achievement level.
Share ownership guidelines
Executive directors participating in long term incentive plans must comply with the Company’s share ownership guidelines. These guidelines, which were first introduced in 2000, require the Chief Executive to have a shareholding in the Company of four times base salary and other executive directors to have a shareholding of three times base salary.
It is intended that these ownership levels will be attained within five years from the director first becoming subject to the guidelines and be achieved through the retention of shares awarded under incentive plans.
Pensions
The Chief Executive, Arun Sarin, is provided with a defined contribution pension arrangement to which the Company contributes 30% of his base salary. The contribution is currently held in a notional fund outside the Company pension scheme.
During the 2006 financial year, Sir Julian Horn-Smith, Peter Bamford, and Andy Halford, being UK based directors, were contributing members of the Vodafone Group Pension Scheme, which is a UK defined benefit scheme approved by the Inland Revenue. The scheme provides a benefit of two-thirds of pensionable salary after a minimum of 20 years’ service. The normal retirement age is 60, but directors may retire from age 55 with a pension proportionately reduced to account for their shorter service but with no actuarial reduction. Where directors’ benefit levels are restricted by Inland Revenue limits, the Company made contributions to the defined contribution Vodafone Group Funded Unapproved Retirement Benefit Scheme (“FURBS”).
Sir Julian Horn-Smith has elected to receive his pension from 6 April 2006, prior to his actual retirement from the Company, in accordance with the new UK pension rules effective from April 2006. Sir Julian is planning to retire at the end of the 2006 AGM and the Committee authorised a pension allowance of 30% of base salary for four months until he steps down from the Board.
Thomas Geitner is entitled to a defined benefit pension of 40% of salary from a normal retirement age of 60. On early retirement, the pension may be reduced if he has accrued less than 10 years of Board service.
All the plans referred to above provide benefits in the event of death in service.
Further details of the pension benefits earned by the directors in the year ended 31 March 2006 can be found on page 66. Liabilities in respect of the pension schemes in which the executive directors participate are funded to the extent described in note 25 to the Consolidated Financial Statements, “Post employment benefits”.
A-Day proposals
As a result of the new UK legislation affecting the taxation of pensions, the Company has reviewed the pension arrangements it provides to UK based executives. From April 2006, executives participating in UK pension arrangements may choose to continue membership of the Vodafone Group Pension Scheme or opt out and instead receive a non-pensionable cash allowance. Participation in an Inland Revenue approved defined contribution plan or a non-pensionable cash allowance will be provided in place of the current FURBS arrangement.
All-employee share incentive schemes
Global All Employee Share Plan
As in the 2005 financial year, the Remuneration Committee has approved that an award of shares based on the achievement of performance conditions be made to all employees in the Vodafone Group. The 2006 award will be made on 3 July 2006. These awards have a dilutive effect of approximately 0.03%.
Sharesave
The Vodafone Group 1998 Sharesave Scheme is an Inland Revenue approved scheme open to all UK permanent employees.
| Vodafone Group Plc Annual Report 2006 | 63 |
Back to Contents
Board’s Report to Shareholders on Directors’ Remuneration
continued
The maximum that can be saved each month is £250 and savings plus interest may be used to acquire shares by exercising the related option. The options have been granted at up to a 20% discount to market value. UK based executive directors are eligible to participate in the scheme and details of their participation are given in the table on page 68.
Share Incentive Plan
The Vodafone Share Incentive Plan (“SIP”) is an Inland Revenue approved plan open to all UK permanent employees. Eligible employees may contribute up to £125 each month and the trustee of the plan uses the money to buy shares on their behalf. An equivalent number of shares is purchased with contributions from the employing company. UK based executive directors are eligible to participate in the SIP and details of their share interests under these plans are given in the table on page 69.
Non-executive directors’ remuneration
The remuneration of non-executive directors is periodically reviewed by the Board, excluding the non-executive directors. Basic fee levels were increased in April 2005 to reflect directors’ considerably increased workload and the increased complexity of managing an international group. The fees payable are as follows:
| | Fees payable from 1 April 2005 | |
| | £’000 | |
|
| |
| Chairman | 510 | |
| Deputy Chairman and Senior Independent Director | 130 | |
| Basic Non-Executive Director fee | 95 | |
| Chairmanship of Audit Committee | 20 | |
| Chairmanship of Remuneration Committee | 15 | |
| Chairmanship of Nominations and Governance Committee | 10 | |
|
| |
In addition, an allowance of £6,000 is payable each time a non-Europe based non-executive director is required to travel to attend Board and Committee meetings, to reflect the additional time commitment involved.
Details of each non-executive director’s remuneration are included in the table on page 65.
Non-executive directors do not participate in any incentive or benefit plans. The Company does not provide any contribution to their pension arrangements. The Chairman is entitled to the provision of a fully expensed car or car allowance.
Service contracts and appointments of directors
Executive directors
The Remuneration Committee has determined that, after an initial term that may be of up to two years’ duration, executive directors’ contracts should thereafter have rolling terms and be terminable on no more than one year’s notice. All current executive directors’ contracts have an indefinite term (to normal retirement date) and one year notice periods. No payments should normally be payable on termination other than the salary due for the notice period and such entitlements under incentive plans and benefits that are consistent with the terms of such plans.
All the UK based executive directors have, whilst in service, entitlement under a long term disability plan from which two-thirds of base salary, up to a maximum benefit determined by the insurer, would be provided until normal retirement date. In the event of disability, Thomas Geitner would receive his normal retirement pension based on his accrued service.
Sir Julian Horn-Smith
Sir Julian Horn-Smith, the Company’s Deputy Chief Executive, will retire from the Company following the AGM on 25 July 2006. Sir Julian will be entitled to subsisting awards, pro-rated for both time and performance, in accordance with the standard rules of each incentive plan in which he participates. Sir Julian will receive a pension in line with the standard rules of the plan in which he participates, described in more detail in “Pensions” on page 63. The Remuneration Committee agreed that he would be offered the opportunity to purchase his company car on leaving the Company. No severance payment will be payable to him.
Peter Bamford
Peter Bamford left the Company on 1 April 2006 and will receive salary and compensation for loss of office in accordance with his legal entitlement. The total payment is in the order of £1.25 million, including pension contribution. He will receive his annual bonus for the 2006 financial year and the Remuneration Committee has exercised discretion to allow him access to long term incentive awards, pro-rated for time and performance.
Fees retained for non-executive directorships in other companies
Some executive directors hold positions in other companies as non-executive directors. The fees received in respect of the 2006 financial year and retained by directors were as follows:
| | | | Fees retained by the | |
| | | | individual in the | |
| | Company in which non- | | 2006 financial year | |
| | executive directorship is held | | £’000(1) | |
|
|
|
| |
| Arun Sarin | Bank of England | | 5.0 | |
| Thomas Geitner | Singulus Technologies AG | | 61.9 | |
| Sir Julian Horn-Smith(2) | Smiths Group plc | | 50.0 | |
| | LloydsTSB Group plc | | 74.0 | |
| | Sage Group plc | | 3.4 | |
| Ken Hydon(3) | Reckitt Benckiser plc | | 20.0 | |
| | Tesco PLC | | 18.5 | |
|
|
|
| |
| Notes: |
| (1) | Fees were retained in accordance with Company policy. |
| (2) | An option over 400,000 shares was granted to Sir Julian in November 2005 by China Mobile (Hong Kong) Limited for his duties as non-executive director, which are held for the benefit of the Company and will lapse on his retirement. |
| (3) | Fees retained in the period to 26 July 2005. |
Chairman and non-executive directors
In December 2005, the Company announced that Lord MacLaurin, the Company’s Chairman, will retire from the Company following the AGM on 25 July 2006. Lord MacLaurin will receive fees in accordance with his service contract until the end of the 2006 calendar year. The Company has entered into an agreement with Lord MacLaurin that he will provide advisory services to the Company for a period of three years following his retirement. During this period he will receive an annual fee of £125,000, which he has advised the Company he intends to donate to charity.
In December 2005, Sir John Bond accepted the invitation of the Board to be appointed as Chairman of the Company following the 2006 AGM. As Chairman, he will receive a fee of £475,000 per annum. The appointment is indefinite and may be terminated by either party on one year’s notice.
Non-executive directors, including the Deputy Chairman, are engaged on letters of appointment that set out their duties and responsibilities. The appointment of non-executive directors may be terminated without compensation.
The terms and conditions of appointment of non-executive directors are available for inspection by any person at the Company’s registered office during normal business hours and at the AGM (for 15 minutes prior to the meeting and during the meeting).
Philip Yea, Anne Lauvergeon and Tony Watson were appointed to the Board as non-executive directors with effect from 1 September 2005, 1 November 2005 and 1 May 2006 respectively, and hold office on the same terms as other non-executive directors.
TSR performance
The following chart shows the performance of the Company relative to the FTSE100 index and the FTSE Global Telecommunications index, which are the most relevant indices for the Company.
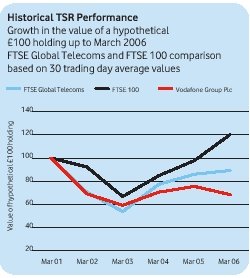
Graph provided by Towers Perrin and calculated according to a methodology that is compliant with the requirements of Schedule 7A of the Companies Act. Data Sources: FTSE and Datastream
Note: Performance of the Company shown by the graph is not indicative of vesting levels under the Company’s various incentive plans.
| 64 | Vodafone Group Plc Annual Report 2006 |
Back to Contents
Audited Information
Remuneration for the year ended 31 March 2006
The remuneration of the directors serving during the year ended 31 March 2006 was as follows:
| | Salary/fees | | Incentive schemes | | Benefits | | Total | |
| |
| |
| |
| |
| |
| | 2006 | | | 2005 | | 2006 | (1) | | 2005 | | 2006 | (2) | | 2005 | | 2006 | | | 2005 | |
| | £’000 | | | £’000 | | £’000 | | | £’000 | | £’000 | | | £’000 | | £’000 | | | £’000 | |
|
|
|
|
|
|
|
|
|
|
|
|
|
|
|
|
|
|
|
| |
| Chairman | | | | | | | | | | | | | | | | | | | | |
| Lord MacLaurin | 520 | | | 485 | | – | | | – | | 57 | | | 32 | | 577 | | | 517 | |
| Deputy Chairman | | | | | | | | | | | | | | | | | | | | |
| Paul Hazen(3) | 173 | | | 130 | | – | | | – | | – | | | – | | 173 | | | 130 | |
| Chief Executive | | | | | | | | | | | | | | | | | | | | |
| Arun Sarin | 1,254 | | | 1,175 | | 1,424 | | | 1,148 | | 54 | | | 183 | | 2,732 | | | 2,506 | |
| Executive directors | | | | | | | | | | | | | | | | | | | | |
| Peter Bamford | 804 | | | 771 | | 908 | | | 663 | | 48 | | | 37 | | 1,760 | | | 1,471 | |
| Thomas Geitner | 734 | | | 679 | | 851 | | | 665 | | 148 | | | 37 | | 1,733 | | | 1,381 | |
| Andy Halford | 342 | | | – | | 396 | | | – | | 16 | | | – | | 754 | | | – | |
| Sir Julian Horn-Smith | 1,022 | | | 970 | | 1,169 | | | 966 | | 48 | | | 34 | | 2,239 | | | 1,970 | |
| Ken Hydon | 253 | | | 779 | | 264 | | | 776 | | 91 | | | 30 | | 608 | | | 1,585 | |
| Non-executive directors | | | | | | | | | | | | | | | | | | | | |
| Sir John Bond | 95 | | | 21 | | – | | | – | | – | | | – | | 95 | | | 21 | |
| Dr Michael Boskin(3) | 144 | | | 85 | | – | | | – | | – | | | – | | 144 | | | 85 | |
| Lord Broers | 95 | | | 85 | | – | | | – | | – | | | – | | 95 | | | 85 | |
| John Buchanan | 95 | | | 85 | | – | | | – | | – | | | – | | 95 | | | 85 | |
| Penny Hughes | 100 | | | 95 | | – | | | – | | – | | | – | | 100 | | | 95 | |
| Anne Lauvergeon | 40 | | | – | | – | | | – | | – | | | – | | 40 | | | – | |
| Sir David Scholey | 32 | | | 85 | | – | | | – | | – | | | – | | 32 | | | 85 | |
| Professor Jürgen Schrempp | 95 | | | 85 | | – | | | – | | – | | | – | | 95 | | | 85 | |
| Luc Vandevelde | 105 | | | 85 | | – | | | – | | – | | | – | | 105 | | | 85 | |
| Philip Yea | 55 | | | – | | – | | | – | | – | | | – | | 55 | | | – | |
| Former directors(4) | – | | | 191 | | – | | | – | | 1,283 | | | 229 | | 1,283 | | | 420 | |
|
|
|
|
|
|
|
|
|
|
|
|
|
|
|
|
|
|
|
| |
| | 5,958 | | | 5,806 | | 5,012 | | | 4,218 | | 1,745 | | | 582 | | 12,715 | | | 10,606 | |
|
|
|
|
|
|
|
|
|
|
|
|
|
|
|
|
|
|
|
| |
| Notes: |
| (1) | These figures are the cash equivalent value of the base share awards under the Vodafone Group Short Term Incentive Plan applicable to the year ended 31 March 2006. These awards are in relation to the performance achievements against targets in adjusted operating profit, total service revenue, free cash flow and customer delight for the 2006 financial year. |
| (2) | Benefits principally comprise cars and private health and disability insurance. Thomas Geitner relocated from Germany to the UK during the 2006 financial year. The benefits figure disclosed includes relocation expenses and a monthly allowance to reflect the higher cost of living in the UK. |
| (3) | Fees include allowances paid in respect of a non-executive director based outside of Europe to reflect the additional time commitment involved when required to travel to attend Board and Committee meetings. |
| (4) | Under the terms of an agreement, Sam Ginn, a former director of the Company, provides consultancy services to the Group and was entitled to certain benefits. The estimated value of the benefits received by him in the year to 31 March 2006 was £29,852. During the year, the agreement was terminated by mutual agreement. Mr Ginn received a payment of $2.23m (£1.25m) as compensation for benefits for the outstanding term. |
The aggregate compensation paid by the Company to its collective senior management(1) for services for the year ended 31 March 2006, is set out below. The aggregate number of senior management as at 31 March 2006 was ten, the same number as at 31 March 2005.
| | 2006 | | | 2005 | |
| | £’000 | | | £’000 | |
|
|
|
|
| |
| Salaries and fees | 4,555 | | | 2,972 | |
| Incentive schemes(2) | 5,155 | | | 2,875 | |
| Benefits | 3,125 | | | 1,066 | |
|
|
|
|
| |
| | 12,835 | | | 6,913 | |
|
|
|
|
| |
| Notes: |
| (1) | Aggregate compensation for senior management is in respect of those individuals who were members of the Executive Committee during the year ended 31 March 2006, other than executive directors and reflects compensation paid from date of appointment to the Executive Committee, to 31 March 2006 or date of leaving, where applicable. |
| (2) | Comprises the incentive scheme information for senior management on an equivalent basis to that disclosed for directors in the table at the top of this page. Details of share incentives awarded to directors and senior management are included in footnotes to “Short term incentives” and “Long term incentives” on pages 66 and 67. |
| Vodafone Group Plc Annual Report 2006 | 65 |
Back to Contents
Board’s Report to Shareholders on Directors’ Remuneration
continued
Pensions
Pension benefits earned by the directors serving during the year ended 31 March 2006 were:
| | | | | | | | | | | | | | | | Employer | |
| | | | | | | | | | | | | | Transfer value | | allocation/ | |
| | | | | | | | | | Change in transfer | | | | of change in | | contribution to | |
| | Total accrued | | Change in | | | | | | value over year | | Change in accrued | | accrued benefit | | to defined | |
| | benefit at | | accrued benefit | | Transfer value at | | Transfer value at | | less member | | benefit in excess | | net of member | | contribution | |
| | 31 March 2006 | (1) | over the year | (1) | 31 March 2005 | (1) | 31 March 2006 | (2) | contributions | | of inflation | | contributions | | plans | |
| Name of Director | £’000 | | £’000 | | £’000 | | £’000 | | £’000 | | £’000 | | £’000 | | £’000 | |
|
|
|
|
|
|
|
|
|
|
|
|
|
|
|
| |
| Arun Sarin | – | | – | | – | | – | | – | | – | | – | | 360.0 | |
| Peter Bamford | 30.8 | | 3.5 | | 348.8 | | 529.9 | | 177.4 | | 2.8 | | 44.2 | | 202.4 | |
| Thomas Geitner | 115.8 | | 23.1 | | 1,163.2 | | 1,971.4 | | 808.2 | | 20.6 | | 350.7 | | – | |
| Andy Halford | 13.3 | | 2.3 | | 110.1 | | 182.8 | | 69.0 | | 2.0 | | 23.7 | | 73.6 | |
| Sir Julian Horn-Smith | 605.2 | | 57.1 | | 9,090.3 | | 13,231.0 | | 4,106.2 | | 42.3 | | 890.0 | | – | |
| Ken Hydon(3) | 516.6 | | 10.4 | | 10,241.1 | | 12,637.2 | | 2,396.1 | | – | | – | | 79.2 | |
|
|
|
|
|
|
|
|
|
|
|
|
|
|
|
| |
| Notes: |
| (1) | The accrued pension benefits earned by the directors are those which would be paid annually on retirement, based on service to the end of the year, at the normal retirement age. The increase in accrued pension excludes any increase for inflation. |
| (2) | The transfer values have been calculated on the basis of actuarial advice in accordance with the Faculty and Institute of Actuaries’ Guidance Note GN11. No director elected to pay additional voluntary contributions. The transfer values disclosed above do not represent a sum paid or payable to the individual director. Instead they represent a potential liability of the pension scheme. |
| (3) | Ken Hydon reached 60 years of age on 3 November 2004 and retired from the Company following the AGM on 26 July 2005. In accordance with the standard rules of the scheme, he received an immediate pension based on his accrued benefit without actuarial reduction or any enhancement. From 1 December 2004, Ken Hydon accrued a cash allowance equivalent to 30% of his base salary, which ceased on leaving the Company. |
In respect of senior management, the Group has made aggregate contributions of £829,582 into pension schemes. The Company’s proposals in light of the changes in pension legislation are detailed under “Pensions” on page 63.
Directors’ interests in the shares of the Company
Short term incentives
Conditional awards of ordinary shares made to executive directors under the STIP, and dividends on those shares paid under the terms of the Company’s scrip dividend scheme and dividend reinvestment plan, are shown below. STIP shares which vested and were sold or transferred during the year ended 31 March 2006 are also shown below.
| | | | Shares conditionally | | Shares conditionally | | | | | | | | | | | |
| | | | awarded during the | | awarded during the year | | | | | | | | | | | |
| | Total interest | | year as base award | | as enhancement shares | | Shares sold or transferred | | | | | | | |
| | in STIP at | | in respect of STIP awards | | in respect of STIP awards | | during the year in respect | | | | | | | |
| | 1 April 2005 | | for the 2005 financial year | | for the 2005 financial year | | of the 2003 financial year | (1) | Total interest in STIP as at 31 March 2006 | |
|
|
|
|
|
|
|
|
|
| |
| | | | | | Value at | | | | Value at | | | | In respect of | | Number | | Number of | | | |
| | Total number | | | | date of award | (2)(3) | | | date of award | ((3) | In respect of | | enhancement | | of base | | enhancement | | Total value | (4) |
| | of shares | | Number | | £’000 | | Number | | £’000 | | base awards | | shares | | award shares | | shares | | £’000 | |
|
|
|
|
|
|
|
|
|
|
|
|
|
|
|
|
|
|
|
| |
| Arun Sarin | 1,520,600 | | 840,498 | | 1,148 | | 420,249 | | 574 | | – | | – | | 1,854,231 | | 927,116 | | 3,352 | |
| Peter Bamford | 1,958,447 | | – | | – | | – | | – | | 704,311 | | 352,155 | | 601,320 | | 300,661 | | 1,087 | |
| Thomas Geitner | 329,205 | | 285,453 | | 390 | | 142,726 | | 195 | | 219,470 | | 109,735 | | 285,453 | | 142,726 | | 516 | |
| Andy Halford | 565,211 | | – | | – | | – | | – | | 181,941 | | 90,971 | | 194,866 | | 97,433 | | 352 | |
| Sir Julian Horn-Smith | 1,324,070 | | – | | – | | – | | – | | 882,713 | | 441,357 | | – | | – | | – | |
| Ken Hydon | 1,081,324 | | – | | – | | – | | – | | 720,883 | | 360,441 | | – | | – | | – | |
|
|
|
|
|
|
|
|
|
|
|
|
|
|
|
|
|
|
|
| |
| Notes: |
| (1) | Shares in respect of the STIP awards for the 2003 financial year were transferred on 1 July 2005. |
| (2) | Previously disclosed within directors’ emoluments for the year ended 31 March 2005. |
| (3) | Value at date of award is based on the price of the Company’s ordinary shares on 1 July 2005 of 136.25p. |
| (4) | The value at 31 March 2006 is calculated using the closing middle market price of the Company’s ordinary shares at 31 March 2006 of 120.5p. |
The aggregate number of shares conditionally awarded during the year as base award and enhancement shares to the Company‘s senior management, other than executive directors, is 514,603. For a description of the performance and vesting conditions, see “Short and medium term incentive: annual deferred share bonus” on page 62.
| 66 | Vodafone Group Plc Annual Report 2006 |
Back to Contents
Long term incentives
Performance shares
Conditional awards of ordinary shares made to executive directors under the Vodafone Group Long Term Incentive Plan and Vodafone Group Plc 1999 Long Term Stock Incentive Plan, and dividends on those shares paid under the terms of the Company’s scrip dividend scheme and dividend reinvestment plan, are shown below. Long Term Incentive shares that vested and were sold or transferred during the year ended 31 March 2006 are also shown below:
| | | | | | | | | | | | Shares sold or | | | | | |
| | | | | | | | Shares | | Shares forfeited in | | transferred in | | | | | |
| | Total interest in | | | | | | added during the | | respect of awards | | respect of awards | | | | | |
| | Long Term Incentives | | | | | | 2006 financial year | | for the 2003, | | for the 2003, | | | | | |
| | at 1 April 2005 or | | Shares conditionally awarded | | through dividend | | 2004 and 2005 | | 2004 and 2005 | | Total interest in long term | |
| | date of appointment | (1) | during the 2006 financial year | | reinvestment | | financial years | | financial years | | incentives at 31 March 2006 | |
|
|
|
|
|
|
|
|
|
|
|
|
|
|
|
| |
| | | | | | Value at | | | | | | | | | | | |
| | | | | | date of award | (2) | | | | | | | Number | | Total value | (4) |
| | Number | | Number | | £’000 | | Number | | Number | (3) | Number | (3) | of shares | | £’000 | |
|
|
|
|
|
|
|
|
|
|
|
|
|
|
|
| |
| Arun Sarin | 3,861,669 | | 1,717,120 | | 2,494 | | – | | – | | – | | 5,578,789 | | 6,722 | |
| Peter Bamford | 2,934,630 | | 876,532 | | 1,273 | | 15,609 | | 592,145 | | 492,367 | | 2,742,259 | | 3,304 | |
| Thomas Geitner | 2,429,377 | | 811,127 | | 1,178 | | 11,949 | | 453,321 | | 376,934 | | 2,422,198 | | 2,919 | |
| Andy Halford | 514,616 | | 539,975 | | 784 | | 3,110 | | 118,013 | | 98,126 | | 841,562 | | 1,014 | |
| Sir Julian Horn-Smith | 3,717,872 | | 1,117,080 | | 1,623 | | 20,387 | | 773,413 | | 643,092 | | 3,438,834 | | 4,144 | |
| Ken Hydon | 2,948, 684 | | – | | – | | 15,609 | | 592,145 | | 788,719 | | – | | – | |
|
|
|
|
|
|
|
|
|
|
|
|
|
|
|
| |
| Notes: |
| (1) | Restricted share awards under the Vodafone Group Long Term Incentive Plan and Vodafone Group Plc 1999 Long Term Stock Incentive Plan. |
| (2) | The value of awards under the Vodafone Group Plc 1999 Long Term Incentive Plan is based on the price of the Company’s ordinary shares on 26 July 2005 of 145.25p. |
| (3) | Shares in respect of awards for the 2003 financial year were sold or transferred on 1 July 2005 and 19 August 2005. The closing middle market price of the Company’s ordinary shares on 1 July 2005, the date of vesting, was 136.25p. |
| (4) | The value at 31 March 2006 is calculated using the closing middle market price of the Company’s ordinary shares at 31 March 2006 of 120.5p. |
| (5) | All employees, including Executive Directors with the exception of those retiring in the 2006 financial year, received an award of 320 shares on 1 July 2005, under the Global All Employee Share Plan. The awards vest after two years and are not subject to performance conditions. |
The aggregate number of shares conditionally awarded during the year to the Company‘s senior management is 3,192,815 shares. For a description of the performance and vesting conditions see “Long term incentives” on pages 62 to 63. In some cases local performance conditions attach to the awards.
Share options
The following information summarises the directors’ options under the Vodafone Group Plc Savings Related Share Option Scheme, the Vodafone Group 1998 Sharesave Scheme, the Vodafone Group Plc Executive Share Option Scheme and the Vodafone Group 1998 Company Share Option Scheme, all of which are HM Revenue and Customs approved schemes. The table also summarises the directors’ options under the Vodafone Group Plc Share Option Scheme, the Vodafone Group 1998 Executive Share Option Scheme, the AirTouch Communications, Inc. 1993 Long Term Stock Incentive Plan and the Vodafone Group Plc 1999 Long Term Stock Incentive Plan, which are not HM Revenue and Customs approved. No other directors have options under any of these schemes. Only under the Vodafone Group 1998 Sharesave Scheme may shares be offered at a discount in future grants of options. For a description of the performance and vesting conditions see “Long term incentives” on pages 62 to 63.
| | Options held at | | | | | | | | | | | | | | | |
| | 1 April 2005 | | Options granted | | Options exercised | | Options lapsed | | | | Weighted average | | | | | |
| | or date of | | during the 2006 | | during the 2006 | | during the 2006 | | Options held at | | exercise price at | | Earliest date | | | |
| | appointment | (1) | financial year | | financial year | | financial year | | 31 March 2006 | | 31 March 2006 | | from which | | Latest | |
| | Number | | Number | | Number | | Number | | Number | | Pence | | exercisable | | expiry date | |
|
|
|
|
|
|
|
|
|
|
|
|
|
|
|
| |
| Arun Sarin(2)(3) | 20,704,987 | | 5,711,292 | | – | | – | | 26,416,279 | | 152.5 | | Jun 2000 | | Jul 2015 | |
| Peter Bamford | 19,073,022 | | 2,915,424 | | 4,350,652 | | 2,053,776 | | 15,584,018 | | 148.5 | | Jul 2002 | | Mar 2007 | |
| Thomas Geitner | 17,334,854 | | 2,697,882 | | – | | 1,635,776 | | 18,396,960 | | 140.5 | | Jul 2003 | | Jul 2015 | |
| Andy Halford | 921,485 | | 1,796,003 | | 13,395 | | – | | 2,704,093 | | 147.6 | | Jul 2002 | | Jul 2015 | |
| Sir Julian Horn-Smith | 23,332,869 | | 3,715,505 | | – | | 1,847,776 | | 25,200,598 | | 134.9 | | Jul 2002 | | Jul 2015 | |
| Ken Hydon | 18,717,166 | | – | | 8,338,371 | | 7,280,782 | | 3,098,013 | | 213.9 | | Jul 2002 | | Jul 2006 | |
|
|
|
|
|
|
|
|
|
|
|
|
|
|
|
| |
| | 100,084,383 | | 16,836,106 | | 12,702,418 | | 12,818,110 | | 91,399,961 | | | | | | | |
|
|
|
|
|
|
|
|
|
|
|
|
|
|
|
| |
| Notes: |
| (1) | The weighted average exercise price of options over shares in the Company granted during the year and listed above is 145.25 pence. The earliest date from which they are exercisable is July 2008 and the latest expiry date is 25 July 2015. For a description of the performance and vesting conditions see “Long term incentives” on pages 62 to 63. |
| (2) | Some of the options held by Arun Sarin are held in the form of ADSs, each representing ten ordinary shares of the Company, which are traded on the New York Stock Exchange. The number of ADSs over which Arun Sarin holds options is 625,000. |
| (3) | The terms of the share options granted over 6,250,000 shares in 1999 to Arun Sarin allow exercise until the earlier of the date on which he ceases to be a director of the Company and the seventh anniversary of the respective dates of grant. |
| (4) | In accordance with the terms of the plan rules, options granted to Ken Hydon became exercisable on retirement, being pro-rated for both time and performance. |
The aggregate number of options granted during the year to the Company’s senior management, other than executive directors, is 10,454,900. The weighted average exercise price of the options granted to senior management during the year is 145.24 pence. The earliest date from which they are exercisable is July 2008 and the latest expiry date is 25 July 2015.
| Vodafone Group Plc Annual Report 2006 | 67 |
Back to Contents
Board’s Report to Shareholders on Directors’ Remuneration
continued
Further details of options outstanding at 31 March 2006 are as follows:
| | | | Exercisable: Market price | | | | Exercisable: Option price | | | | | | | |
| | | | greater than option price | (1) | | | greater than market price | (1) | | | | | Not yet exercisable | |
| |
|
|
| |
|
|
| |
|
|
|
|
| |
| | | | Weighted average | | Latest | | | | Weighted average | | Latest | | | | Weighted average | | Earliest date from | |
| | Options held | | exercise price | | expiry date | | Options held | | exercise price | | expiry date | | Options held | | exercise price | | which exercisable | |
| | Number | | Pence | | | | Number | | Pence | | | | Number | | Pence | | | |
|
|
|
|
|
|
|
|
|
|
|
|
|
|
|
|
|
| |
| Arun Sarin(2) | – | | – | | – | | 6,250,000 | | 236.3 | | Jul-06 | | 20,166,279 | | 126.5 | | Jul-06 | |
| Peter Bamford | – | | – | | – | | 3,307,713 | | 207.2 | | Mar-07 | | 12,276,305 | | 132.7 | | Jul-06 | |
| Thomas Geitner | 3,507,178 | | 97.0 | | Aug-12 | | 3,259,679 | | 209.3 | | Jul-11 | | 11,630,103 | | 134.4 | | Jul-06 | |
| Andy Halford | 94,444 | | 90.0 | | Jul-12 | | 344,800 | | 214.6 | | Jul-11 | | 2,264,849 | | 139.8 | | Jul-06 | |
| Sir Julian Horn-Smith | 5,753,505 | | 97.0 | | Aug-12 | | 3,701,990 | | 201.7 | | Jul-11 | | 15,745,103 | | 133.1 | | Jul-06 | |
| Ken Hydon | – | | – | | – | | 3,098,013 | | 213.9 | | Jul-06 | | – | | – | | – | |
|
|
|
|
|
|
|
|
|
|
|
|
|
|
|
|
|
| |
| | 9,355,127 | | | | | | 19,962,195 | | | | | | 62,082,639 | | | | | |
|
|
|
|
|
|
|
|
|
|
|
|
|
|
|
|
|
| |
| Notes: |
| (1) | Market price is the closing middle market price of the Company’s ordinary shares at 31 March 2006 of 120.5p. |
| (2) | Some of Arun Sarin’s options are in respect of American Depositary Shares, each representing ten ordinary shares in the Company, which are traded on the New York Stock Exchange. The number and option price have been converted into the equivalent amounts for the Company’s ordinary shares. |
The Company’s register of directors’ interests (which is open to inspection at the Company’s registered office) contains full details of directors’ shareholdings and options to subscribe. These options by exercise price were:
| | | | Options held at | | | | | | | | | |
| | | | 1 April 2005 | | Options granted | | Options exercised | | Options lapsed | | | |
| | | | or date of | | during the 2006 | | during the 2006 | | during the 2006 | | Options held at | |
| | Option price | | appointment | (1) | financial year | | financial year | | financial year | | 31 March 2006 | |
| | Pence | | Number | | Number | | Number | | Number | | Number | |
|
|
|
|
|
|
|
|
|
|
|
|
|
| Vodafone Group Plc Share Option Scheme (Unapproved – 1988) | 155.90 | | 855,000 | | – | | – | | 855,000 | | – | |
| Vodafone Group 1998 Company Share Option Scheme (Approved) | 255.00 | | 502,500 | | – | | – | | – | | 502,500 | |
| Vodafone Group 1998 Executive Share Option Scheme (Unapproved) | 282.30 | | 1,131,000 | | – | | – | | – | | 1,131,000 | |
| Vodafone Group Plc Savings Related Share Option Scheme (1988) | 70.92 | | 63,521 | | – | | 40,185 | | – | | 23,336 | |
| Vodafone Group 1998 Sharesave Scheme | 95.30 | | 16,710 | | – | | – | | – | | 16,710 | |
| | 108.84 | | 8,705 | | – | | – | | – | | 8,705 | |
| Vodafone Group Plc 1999 Long Term Stock Incentive Plan | 90.00 | | 94,444 | | – | | – | | – | | 94,444 | |
| | 97.00 | | 17,935,197 | | – | | 8,674,514 | | – | | 9,260,683 | |
| | 119.00 | | 20,794,632 | | – | | 1,079,081 | | 2,246,855 | | 17,468,696 | |
| | 119.25 | | 23,119,811 | | – | | 2,908,638 | | 831,039 | | 19,380,134 | |
| | 145.25 | | – | | 16,836,106 | | – | | – | | 16,836,106 | |
| | 151.56 | | 2,000,400 | | – | | – | | – | | 2,000,400 | |
| | 157.50 | | 16,943,043 | | – | | – | | 2,342,112 | | 14,600,931 | |
| | 236.34 | (2) | 6,250,000 | | – | | – | | – | | 6,250,000 | |
| | 291.50 | | 10,369,420 | | – | | – | | 6,543,104 | | 3,826,316 | |
|
|
|
|
|
|
|
|
|
|
|
|
|
| | | | 100,084,383 | | 16,836,106 | | 12,702,418 | | 12,818,110 | | 91,399,961 | |
|
|
|
|
|
|
|
|
|
|
|
|
|
| Notes: |
| (1) | Includes options held by Andy Halford as at 26 July 2005 on appointment to the Board |
| (2) | These share options are in respect of American Depositary Shares, each representing ten ordinary shares in the Company, which are traded on the New York Stock Exchange. The number and option price have been converted into the equivalent amounts for the Company’s ordinary shares. |
Details of the options exercised by directors of the Company in the year ended 31 March 2006 are as follows:
| | Options | | | | Market price | | | |
| | exercised | | | | at date of | | Gross | |
| | during the year | | Option price | | exercise | | pre-tax gain | |
| | Number | | Pence | | Pence | | £’000 | |
|
|
|
|
|
|
|
| |
| Peter Bamford | 13,395 | | 70.9 | | 152.0 | | 10.9 | |
| Andy Halford | 13,395 | | 70.9 | | 152.0 | | 10.9 | |
|
|
|
|
|
|
|
| |
| | 26,790 | | | | | | 21.8 | |
|
|
|
|
|
|
|
| |
| Note: | |
| The aggregate gross pre-tax gain made on the exercise of share options in the 2006 financial year by the Company’s above directors was £21,721 (2005: £3,076,276). The closing middle market price of the Company’s shares at 31 March 2006 was 120.5p, its highest closing price in the 2006 financial year having been 155.0 pence and its lowest closing price having been 109.0 pence. |
| 68 | Vodafone Group Plc Annual Report 2006 |
Back to Contents
Beneficial interests
The directors’ beneficial interests in the ordinary shares of the Company, which includes interests in the Vodafone Group Profit Sharing Scheme and the Vodafone Share Incentive Plan, but which excludes interests in the Vodafone Group Share Option Schemes, the Vodafone Group Short Term Incentive or in the Vodafone Group Long Term Incentives, are shown below:
| | | | | | 1 April 2005 or date | |
| | 26 May 2006 | | 31 March 2006 | | of appointment | |
|
|
|
|
|
|
|
| Lord MacLaurin | 92,495 | | 92,495 | | 92,495 | |
| Paul Hazen | 360,900 | | 360,900 | | 360,900 | |
| Arun Sarin(1) | 4,932,560 | | 4,932,560 | | 4,832,560 | |
| Thomas Geitner | 451,556 | | 451,556 | | 417,700 | |
| Andy Halford(2) | 108,293 | | 107,895 | | 91,336 | |
| Sir Julian Horn-Smith | 1,829,385 | | 1,828,987 | | 1,818,257 | |
| Sir John Bond | 134,423 | | 134,423 | | 34,423 | |
| Dr Michael Boskin | 212,500 | | 212,500 | | 212,500 | |
| Lord Broers | 20,483 | | 20,483 | | 19,819 | |
| John Buchanan | 208,124 | | 208,124 | | 104,318 | |
| Penny Hughes | 22,500 | | 22,500 | | 22,500 | |
| Anne Lauvergeon(3) | 31,000 | | 31,000 | | – | |
| Professor Jürgen Schrempp | 10,000 | | 10,000 | | 10,000 | |
| Luc Vandevelde | 20,000 | | 20,000 | | 20,000 | |
| Philip Yea(3) | 70,000 | | 70,000 | | – | |
|
|
|
|
|
|
|
| Notes: |
| (1) | Arun Sarin also has a non-beneficial interest as the trustee of two family trusts, each holding 5,720 shares. |
| (2) | Andy Halford was appointed to the Board on 26 July 2005. |
| (3) | Non-executive directors appointed to the Board as follows: Anne Lauvergeon: 1 November 2005, Philip Yea: 1 September 2005. |
Changes to the interests of the directors of the Company in the ordinary shares of the Company during the period from 1 April 2006 to 26 May 2006 relate to shares acquired either through Vodafone Group Personal Equity Plans or the Vodafone Share Incentive Plan. As at 31 March 2006, and during the period from 1 April 2006 to 26 May 2006, no director had any interest in the shares of any subsidiary company.
Other than those individuals included in the table above who were Board members at 31 March 2006, members of the Group’s Executive Committee, as at 31 March 2006, had an aggregate beneficial interest in 2,078,326 ordinary shares of the Company. At 26 May 2006, Executive Committee members at that date had an aggregate beneficial interest in 2,079,522 ordinary shares of the Company, none of whom had an individual beneficial interest amounting to greater than 1% of the Company’s ordinary shares.
Interests in share options of the Company at 26 May 2006
At 26 May 2006, there had been no change to the directors’ interests in share options from 31 March 2006.
Other than those individuals included in the table above, at 26 May 2006, members of the Group’s Executive Committee at that date held options for 34,714,916 ordinary shares at prices ranging from 48.3 pence to 293.7 pence per ordinary share, with a weighted average exercise price of 141.60 pence per ordinary share exercisable at dates ranging from July 1999 to July 2015, and options for 172,669 ADSs at prices ranging from $13.65 to $45.3359 per ADS, with a weighted average exercise price of $26.6056 per ADS, exercisable at dates ranging from July 2001 to July 2013.
Lord MacLaurin, Paul Hazen, Sir John Bond, Dr Michael Boskin, Lord Broers, John Buchanan, Penny Hughes, Anne Lauvergeon, Professor Jürgen Schrempp, Luc Vandevelde and Philip Yea held no options at 26 May 2006.
Directors’ interests in contracts
None of the current directors had a material interest in any contract of significance to which the Company or any of its subsidiary undertakings was a party during the financial year.

Luc Vandevelde
On behalf of the Board
| Vodafone Group Plc Annual Report 2006 | 69 |
Back to Contents
Directors’ Statement of Responsibility
United Kingdom company law requires the directors to prepare financial statements for each financial year which give a true and fair view of the state of affairs of the Company and the Group as at the end of the financial year and of the profit or loss of the Group for that period. In preparing those financial statements, the directors are required to:
| • | select suitable accounting policies and apply them consistently; |
| • | make judgements and estimates that are reasonable and prudent; |
| • | state whether the Consolidated Financial Statements have been prepared in accordance with IFRS as adopted for use in the EU; |
| • | for the Company Financial Statements, state whether applicable UK accounting standards have been followed; and |
| • | prepare the financial statements on a going concern basis unless it is inappropriate to presume that the Company and the Group will continue in business. |
The directors are responsible for keeping proper accounting records which disclose with reasonable accuracy at any time the financial position of the Company and the Group and to enable them to ensure that the financial statements comply with the Companies Act 1985 and Article 4 of the IAS Regulation. They are also responsible for the system of internal control, for safeguarding the assets of the Company and the Group and, hence, for taking reasonable steps for the prevention and detection of fraud and other irregularities.
Disclosure of Information to Auditors
Having made the requisite enquiries, so far as the directors are aware, there is no relevant audit information (as defined by Section 234ZA of the Companies Act 1985) of which the Company’s auditors are unaware, and the directors have taken all the steps they ought to have taken to make themselves aware of any relevant audit information and to establish that the Company’s auditors are aware of that information.
Going Concern
After reviewing the Group’s and Company’s budget for the next financial year, and other longer term plans, the directors are satisfied that, at the time of approving the financial statements, it is appropriate to adopt the going concern basis in preparing the financial statements.
By Order of the Board

Stephen Scott
Secretary
30 May 2006
| 70 | Vodafone Group Plc Annual Report 2006 |
Back to Contents
Financials
| Vodafone Group Plc Annual Report 2006 | 71 |
Back to Contents
Consolidated Income Statement for the years ended 31 March
| | | | 2006 | | 2006 | | 2005 | |
| | Note | | $m | | £m | | £m | |
|
|
|
|
|
|
|
| |
| Revenue | 3 | | 51,048 | | 29,350 | | 26,678 | |
| Cost of sales | | | (29,689 | ) | (17,070 | ) | (15,800 | ) |
|
|
|
|
|
|
|
| |
| Gross profit | | | 21,359 | | 12,280 | | 10,878 | |
| Selling and distribution expenses | | | (3,263 | ) | (1,876 | ) | (1,649 | ) |
| Administrative expenses | | | (5,941 | ) | (3,416 | ) | (2,856 | ) |
| Share of result in associated undertakings | 14 | | 4,223 | | 2,428 | | 1,980 | |
| Impairment losses | 10 | | (40,900 | ) | (23,515 | ) | (475 | ) |
| Other income and expense | | | 26 | | 15 | | – | |
|
|
|
|
|
|
|
| |
| Operating (loss)/profit | 3,4 | | (24,496 | ) | (14,084 | ) | 7,878 | |
| Non-operating income and expense | | | (3 | ) | (2 | ) | (7 | ) |
| Investment income | 5 | | 614 | | 353 | | 294 | |
| Financing costs | 5 | | (1,948 | ) | (1,120 | ) | (880 | ) |
|
|
|
|
|
|
|
| |
| (Loss)/profit before taxation | | | (25,833 | ) | (14,853 | ) | 7,285 | |
| Tax on (loss)/profit | 6 | | (4,140 | ) | (2,380 | ) | (1,869 | ) |
|
|
|
|
|
|
|
| |
| (Loss)/profit for the financial year from continuing operations | | | (29,973 | ) | (17,233 | ) | 5,416 | |
| (Loss)/profit for the financial year from discontinued operations | 29 | | (7,980 | ) | (4,588 | ) | 1,102 | |
|
|
|
|
|
|
|
| |
| (Loss)/profit for the financial year | | | (37,953 | ) | (21,821 | ) | 6,518 | |
|
|
|
|
|
|
|
| |
| Attributable to: | | | | | | | | |
| Equity shareholders | | | (38,118 | ) | (21,916 | ) | 6,410 | |
| Minority interests | | | 165 | | 95 | | 108 | |
|
|
|
|
|
|
|
| |
| | | | (37,953 | ) | (21,821 | ) | 6,518 | |
|
|
|
|
|
|
|
| |
| | | | | | | | | |
| (Loss)/earnings per share | | | | | | | | |
| From continuing operations: | | | | | | | | |
| Basic | 8 | | (48.11 | )¢ | (27.66 | )p | 8.12 | p |
| Diluted | 8 | | (48.11 | )¢ | (27.66 | )p | 8.09 | p |
| | | | | | | | | |
| From continuing and discontinued operations: | | | | | | | | |
| Basic | 8 | | (60.89 | )¢ | (35.01 | )p | 9.68 | p |
| Diluted | 8 | | (60.89 | )¢ | (35.01 | )p | 9.65 | p |
|
|
|
|
|
|
|
| |
Consolidated Statement of Recognised Income and Expense
for the years ended 31 March
| | | | 2006 | | 2006 | | 2005 | |
| | Note | | $m | | £m | | £m | |
|
|
|
|
|
|
|
| |
| Gains on revaluation of available-for-sale investments, net of tax | | | 1,226 | | 705 | | 106 | |
| Exchange differences on translation of foreign operations | | | 2,599 | | 1,494 | | 1,488 | |
| Actuarial losses on defined benefit pension schemes, net of tax | | | (52 | ) | (30 | ) | (79 | ) |
| Asset revaluation surplus | 28 | | 195 | | 112 | | – | |
| Transfer to the income statement on disposal of foreign operations | | | 63 | | 36 | | – | |
|
|
|
|
|
|
|
| |
| Net income recognised directly in equity | | | 4,031 | | 2,317 | | 1,515 | |
| (Loss)/profit for the financial year | | | (37,953 | ) | (21,821 | ) | 6,518 | |
|
|
|
|
|
|
|
| |
| Total recognised income and expense relating to the year | | | (33,922 | ) | (19,504 | ) | 8,033 | |
|
|
|
|
|
|
|
| |
| Attributable to: | | | | | | | | |
| Equity shareholders | | | (34,101 | ) | (19,607 | ) | 7,958 | |
| Minority interests | | | 179 | | 103 | | 75 | |
|
|
|
|
|
|
|
| |
| | | | (33,922 | ) | (19,504 | ) | 8,033 | |
|
|
|
|
|
|
|
| |
The accompanying notes are an integral part of these Consolidated Financial Statements.
The unaudited US dollar amounts are prepared on the basis set out in note 1.
| 72 | Vodafone Group Plc Annual Report 2006 |
Back to Contents
Consolidated Balance Sheet at 31 March
| | | | 2006 | | 2006 | | 2005 | |
| | Note | | $m | | £m | | £m | |
|
|
|
|
|
|
|
| |
| Non-current assets | | | | | | | | |
| Goodwill | 9 | | 91,497 | | 52,606 | | 80,999 | |
| Other intangible assets | 9 | | 28,719 | | 16,512 | | 16,149 | |
| Property, plant and equipment | 11 | | 23,759 | | 13,660 | | 17,442 | |
| Investments in associated undertakings | 14 | | 40,346 | | 23,197 | | 20,234 | |
| Other investments | 15 | | 3,686 | | 2,119 | | 1,181 | |
| Deferred tax assets | 6 | | 244 | | 140 | | 1,184 | |
| Post employment benefits | 25 | | 33 | | 19 | | 12 | |
| Trade and other receivables | 17 | | 628 | | 361 | | 585 | |
|
|
|
|
|
|
|
| |
| | | | 188,912 | | 108,614 | | 137,786 | |
|
|
|
|
|
|
|
| |
| Current assets | | | | | | | | |
| Inventory | 16 | | 517 | | 297 | | 440 | |
| Taxation recoverable | | | 14 | | 8 | | 38 | |
| Trade and other receivables | 17 | | 7,718 | | 4,438 | | 5,164 | |
| Cash and cash equivalents | 18 | | 4,851 | | 2,789 | | 3,769 | |
|
|
|
|
|
|
|
| |
| | | | 13,100 | | 7,532 | | 9,411 | |
|
|
|
|
|
|
|
| |
| Assets included in disposal group held for sale | 29 | | 18,423 | | 10,592 | | – | |
|
|
|
|
|
|
|
| |
| Total assets | | | 220,435 | | 126,738 | | 147,197 | |
|
|
|
|
|
|
|
| |
| Equity | | | | | | | | |
| Called up share capital | 19 | | 7,244 | | 4,165 | | 4,286 | |
| Share premium account | 21 | | 91,216 | | 52,444 | | 52,284 | |
| Own shares held | 21 | | (14,259) | | (8,198) | | (5,121 | ) |
| Additional paid-in capital | 21 | | 174,194 | | 100,152 | | 100,081 | |
| Capital redemption reserve | 21 | | 223 | | 128 | | – | |
| Accumulated other recognised income and expense | 22 | | 7,114 | | 4,090 | | 1,781 | |
| Retained losses | 23 | | (117,152) | | (67,356) | | (39,511 | ) |
|
|
|
|
|
|
|
| |
| Total equity shareholders’ funds | | | 148,580 | | 85,425 | | 113,800 | |
| | | | | | | | | |
| Minority interests | | | (197) | | (113) | | (152 | ) |
|
|
|
|
|
|
|
| |
| Total equity | | | 148,383 | | 85,312 | | 113,648 | |
|
|
|
|
|
|
|
| |
| Non-current liabilities | | | | | | | | |
| Long-term borrowings | 24 | | 29,133 | | 16,750 | | 13,190 | |
| Deferred tax liabilities | 6 | | 9,862 | | 5,670 | | 4,849 | |
| Post employment benefits | 25 | | 209 | | 120 | | 136 | |
| Provisions for liabilities and charges | 26 | | 461 | | 265 | | 319 | |
| Trade and other payables | 27 | | 984 | | 566 | | 438 | |
|
|
|
|
|
|
|
| |
| | | | 40,649 | | 23,371 | | 18,932 | |
|
|
|
|
|
|
|
| |
| Current liabilities | | | | | | | | |
| Short-term borrowings: | | | | | | | | |
| Third parties | 24 | | 5,340 | | 3,070 | | 861 | |
| Related parties | 24 | | 657 | | 378 | | 1,142 | |
| Current taxation liabilities | | | 7,736 | | 4,448 | | 4,353 | |
| Trade and other payables | 27 | | 13,005 | | 7,477 | | 8,033 | |
| Provisions for liabilities and charges | 26 | | 242 | | 139 | | 228 | |
|
|
|
|
|
|
|
| |
| | | | 26,980 | | 15,512 | | 14,617 | |
|
|
|
|
|
|
|
| |
| Liabilities included in disposal group held for sale | 29 | | 4,423 | | 2,543 | | – | |
|
|
|
|
|
|
|
| |
| Total equity and liabilities | | | 220,435 | | 126,738 | | 147,197 | |
|
|
|
|
|
|
|
| |
The Consolidated Financial Statements were approved by the Board of directors on 30 May 2006 and were signed on its behalf by:
 |  |
Arun Sarin
Chief Executive | Andy Halford
Chief Financial Officer |
The accompanying notes are an integral part of these Consolidated Financial Statements. The unaudited US dollar amounts are prepared on the basis set out in note 1.
| Vodafone Group Plc Annual Report 2006 | 73 |
Back to Contents
Consolidated Cash Flow Statement for the years ended 31 March
| | | | 2006 | | 2006 | | 2005 | |
| | Note | | $m | | £m | | £m | |
|
|
|
|
|
|
|
| |
| Net cash flows from operating activities | 29, 32 | | 20,595 | | 11,841 | | 10,979 | |
|
|
|
|
|
|
|
| |
| Cash flows from investing activities | | | | | | | | |
| Purchase of interests in subsidiary undertakings and joint ventures, net of cash acquired | | | (7,280 | ) | (4,186 | ) | (2,461 | ) |
| Disposal of interests in subsidiary undertakings, net of cash disposed | | | 1,042 | | 599 | | 444 | |
| Purchase of intangible assets | | | (1,200 | ) | (690 | ) | (699 | ) |
| Purchase of property, plant and equipment | | | (7,794 | ) | (4,481 | ) | (4,279 | ) |
| Disposal of property, plant and equipment | | | 45 | | 26 | | 68 | |
| Purchase of investments | | | (99 | ) | (57 | ) | (19 | ) |
| Disposal of investments | | | 2 | | 1 | | 22 | |
| Loans to businesses sold or acquired businesses held for sale | | | – | | – | | 110 | |
| Dividends received from associated undertakings | | | 1,452 | | 835 | | 1,896 | |
| Dividends received from investments | | | 71 | | 41 | | 19 | |
| Interest received | | | 555 | | 319 | | 339 | |
|
|
|
|
|
|
|
| |
| Net cash flows from investing activities | 29 | | (13,206 | ) | (7,593 | ) | (4,560 | ) |
|
|
|
|
|
|
|
| |
| Cash flows from financing activities | | | | | | | | |
| Issue of ordinary share capital and reissue of treasury shares | | | 619 | | 356 | | 115 | |
| Net movement in short-term borrowings | | | 1,231 | | 708 | | – | |
| Proceeds from the issue of long-term borrowings | | | 9,142 | | 5,256 | | – | |
| Repayment of borrowings | | | (2,385 | ) | (1,371 | ) | (1,824 | ) |
| Loans repaid to associated undertakings | | | (82 | ) | (47 | ) | (2 | ) |
| Purchase of treasury shares | | | (11,230 | ) | (6,457 | ) | (4,053 | ) |
| Equity dividends paid | | | (4,781 | ) | (2,749 | ) | (1,991 | ) |
| Dividends paid to minority shareholders in subsidiary undertakings | | | (89 | ) | (51 | ) | (32 | ) |
| Interest paid | | | (1,254 | ) | (721 | ) | (744 | ) |
|
|
|
|
|
|
|
| |
| Net cash flows from financing activities | 29 | | (8,829 | ) | (5,076 | ) | (8,531 | ) |
|
|
|
|
|
|
|
| |
| Net decrease in cash and cash equivalents | | | (1,440 | ) | (828 | ) | (2,112 | ) |
| Cash and cash equivalents at beginning of the financial year | 18 | | 6,481 | | 3,726 | | 5,809 | |
| Exchange gains on cash and cash equivalents | | | 59 | | 34 | | 29 | |
|
|
|
|
|
|
|
| |
| Cash and cash equivalents at end of the financial year | 18 | | 5,100 | | 2,932 | | 3,726 | |
|
|
|
|
|
|
|
| |
The accompanying notes are an integral part of these Consolidated Financial Statements.
The unaudited US dollar amounts are prepared on the basis set out in note 1.
| 74 | Vodafone Group Plc Annual Report 2006 |
Back to Contents
Notes to the Consolidated Financial Statements
1. Basis of preparation
The Consolidated Financial Statements are prepared in accordance with International Financial Reporting Standards (“IFRS”) (including International Accounting Standards (“IAS”) and interpretations issued by the International Accounting Standards Board (“IASB”) and its committees, and as interpreted by any regulatory bodies applicable to the Group as adopted for use in the European Union (“EU”), the Companies Act 1985 and Article 4 of the IAS Regulations. The Consolidated Financial Statements have been prepared in accordance with IFRS, which differs in certain material respects from US generally accepted accounting principles (“US GAAP”) – see note 38.
The preparation of financial statements in conformity with IFRS requires management to make estimates and assumptions that affect the reported amounts of assets and liabilities and disclosure of contingent assets and liabilities at the date of the financial statements and the reported amounts of revenue and expenses during the reporting period. For a discussion on the Group’s critical accounting estimates see “Performance – Critical Accounting Estimates” elsewhere in this Annual Report. Actual results could differ from those estimates. The estimates and underlying assumptions are reviewed on an ongoing basis. Revisions to accounting estimates are recognised in the period in which the estimate is revised if the revision affects only that period or in the period of the revision and future periods if the revision affects both current and future periods. Certain amounts in relation to the previous financial year have been reclassified to conform presentation with the requirements of IFRS.
Amounts in the Consolidated Financial Statements are stated in pounds sterling (£), the currency of the country in which the Company is incorporated. The translation into US dollars of the Consolidated Financial Statements as of, and for the financial year ended, 31 March 2006, is for convenience only and has been made at the Noon Buying Rate for cable transfers as announced by the Federal Reserve Bank of New York for customs purposes on 31 March 2006. This rate was $1.7393: £1. This translation should not be construed as a representation that the sterling amounts actually represented have been, or could be, converted into dollars at this or any other rate.
2. Significant accounting policies
The Group’s significant accounting policies are described below.
Accounting convention
The Consolidated Financial Statements are prepared on a historical cost basis except for certain financial and equity instruments that have been measured at fair value.
Basis of consolidation
The Consolidated Financial Statements incorporate the financial statements of the Company and entities controlled, both unilaterally and jointly, by the Company.
Accounting for subsidiaries
A subsidiary is an entity controlled by the Company. Control is achieved where the Company has the power to govern the financial and operating policies of an entity so as to obtain benefits from its activities.
The results of subsidiaries acquired or disposed of during the year are included in the income statement from the effective date of acquisition or up to the effective date of disposal, as appropriate. Where necessary, adjustments are made to the financial statements of subsidiaries to bring their accounting policies into line with those used by other members of the Group.
All intra-group transactions, balances, income and expenses are eliminated on consolidation.
Minority interests in the net assets of consolidated subsidiaries are identified separately from the Group’s equity therein. Minority interests consist of the amount of those interests at the date of the original business combination and the minority’s share of changes in equity since the date of the combination. Losses applicable to the minority in excess of the minority’s share of changes in equity are allocated against the interests of the Group except to the extent that the minority has a binding obligation and is able to make an additional investment to cover the losses.
Business combinations
The acquisition of subsidiaries is accounted for using the purchase method. The cost of the acquisition is measured at the aggregate of the fair values, at the date of exchange, of assets given, liabilities incurred or assumed, and equity instruments issued by the Group in exchange for control of the acquiree, plus any costs directly attributable to the business combination. The acquiree’s identifiable assets and liabilities are recognised at their fair values at the acquisition date.
Goodwill arising on acquisition is recognised as an asset and initially measured at cost, being the excess of the cost of the business combination over the Group’s interest in the net fair value of the identifiable assets, liabilities and contingent liabilities recognised.
The interest of minority shareholders in the acquiree is initially measured at the minority’s proportion of the net fair value of the assets, liabilities and contingent liabilities recognised.
Previously held identifiable assets, liabilities and contingent liabilities of the acquired entity are revalued to their fair value at the date of acquisition, being the date at which the Group achieves control of the acquiree. The movement in fair value is taken to the asset revaluation surplus.
Interests in joint ventures
A joint venture is a contractual arrangement whereby the Group and other parties undertake an economic activity that is subject to joint control, that is when the strategic financial and operating policy decisions relating to the activities require the unanimous consent of the parties sharing control.
The Group reports its interests in jointly controlled entities using proportionate consolidation. The Group’s share of the assets, liabilities, income, expenses and cash flows of jointly controlled entities are combined with the equivalent items in the results on a line-by-line basis.
Any goodwill arising on the acquisition of the Group’s interest in a jointly controlled entity is accounted for in accordance with the Group’s accounting policy for goodwill arising on the acquisition of a subsidiary.
Investments in associates
An associate is an entity over which the Group has significant influence and that is neither a subsidiary nor an interest in a joint venture. Significant influence is the power to participate in the financial and operating policy decisions of the investee, but is not control or joint control over those policies.
The results and assets and liabilities of associates are incorporated in the Consolidated Financial Statements using the equity method of accounting. Under the equity method, investments in associates are carried in the consolidated balance sheet at cost as adjusted for post-acquisition changes in the Group’s share of the net assets of the associate, less any impairment in the value of the investment. Losses of an associate in excess of the Group’s interest in that associate are not recognised. Additional losses are provided for, and a liability is recognised, only to the extent that the Group has incurred legal or constructive obligations or made payments on behalf of the associate.
Any excess of the cost of acquisition over the Group’s share of the net fair value of the identifiable assets, liabilities and contingent liabilities of the associate recognised at the date of acquisition is recognised as goodwill. The goodwill is included within the carrying amount of the investment.
The licences of the Group’s associated undertaking in the US, Verizon Wireless, are indefinite lived assets as they are subject to perfunctory renewal. Accordingly they are not subject to amortisation but are tested annually for impairment, or when indicators exist that the carrying value is not recoverable.
Intangible assets
Goodwill
Goodwill arising on the acquisition of an entity represents the excess of the cost of acquisition over the Group’s interest in the net fair value of the identifiable assets, liabilities and contingent liabilities of the entity recognised at the date of acquisition. Goodwill is initially recognised as an asset at cost and is subsequently measured at cost less any accumulated impairment losses. Goodwill is held in the currency of the acquired entity and revalued to the closing rate at each balance sheet date.
Goodwill is not subject to amortisation but is tested for impairment.
Negative goodwill arising on an acquisition is recognised directly in the income statement.
On disposal of a subsidiary or a jointly controlled entity, the attributable amount of goodwill is included in the determination of the profit or loss recognised in the income statement on disposal.
Goodwill arising before the date of transition to IFRS, on 1 April 2004, has been retained at the previous UK GAAP amounts subject to being tested for impairment at that date. Goodwill written off to reserves under UK GAAP prior to 1998 has not been reinstated and is not included in determining any subsequent profit or loss on disposal.
| Vodafone Group Plc Annual Report 2006 | 75 |
Back to Contents
Notes to the Consolidated Financial Statements
continued
2. Significant accounting policies continued
Licence and spectrum fees
Licence and spectrum fees are stated at cost less accumulated amortisation. The amortisation periods range from 3 to 25 years and are determined primarily by reference to the unexpired licence period, the conditions for licence renewal and whether licences are dependent on specific technologies. Amortisation is charged to the income statement on a straight-line basis over the estimated useful lives from the commencement of service of the network.
Computer software
Computer software licences are capitalised on the basis of the costs incurred to acquire and bring into use the specific software. These costs are amortised over their estimated useful lives, being 3 to 5 years.
Costs that are directly associated with the production of identifiable and unique software products controlled by the Group, and that are expected to generate economic benefits exceeding costs beyond one year, are recognised as intangible assets. Direct costs include software development employee costs and directly attributable overheads.
Software integral to a related item of hardware equipment is accounted for as property, plant and equipment.
Costs associated with maintaining computer software programmes are recognised as an expense as incurred.
Research and development expenditure
Expenditure on research activities is recognised as an expense in the period in which it is incurred.
An internally-generated intangible asset arising from the Group’s development activity is recognised only if all of the following conditions are met:
| • | an asset is created that can be separately identified; |
| • | it is probable that the asset created will generate future economic benefits; and |
| • | the development cost of the asset can be measured reliably. |
Internally-generated intangible assets are amortised on a straight-line basis over their estimated useful lives. Where no internally-generated intangible asset can be recognised, development expenditure is charged to the income statement in the period in which it is incurred.
Other intangible assets
Other intangible assets with finite lives are stated at cost less accumulated amortisation and impairment losses. Amortisation is charged to the income statement on a straight-line basis over the estimated useful lives of intangible assets from the date they are available for use. The estimated useful lives are as follows:
| Brands | 1 - 10 years |
| | |
| Customer bases | 3 - 8 years |
Property, plant and equipment
Land and buildings held for use are stated in the balance sheet at their cost, less any subsequent accumulated depreciation and subsequent accumulated impairment losses.
Assets in the course of construction are carried at cost, less any recognised impairment loss. Depreciation of these assets commences when the assets are ready for their intended use.
Equipment, fixtures and fittings are stated at cost less accumulated depreciation and any accumulated impairment losses.
The cost of property, plant and equipment includes directly attributable incremental costs incurred in their acquisition and installation.
Depreciation is charged so as to write off the cost or valuation of assets, other than land and properties under construction, using the straight-line method, over their estimated useful lives as follows:
| Freehold buildings | 25 - 50 years |
| | |
| Leasehold premises | the term of the lease |
| | |
| Equipment, fixtures and fittings | 3 - 10 years |
| | |
| Network infrastructure | 3 - 25 years |
Depreciation is not provided on freehold land.
Assets held under finance leases are depreciated over their expected useful lives on the same basis as owned assets or, where shorter, the term of the relevant lease.
The gain or loss arising on the disposal or retirement of an item of property, plant and equipment is determined as the difference between the sales proceeds and the carrying amount of the asset and is recognised in the income statement.
Impairment of assets
Indefinite lived assets
Goodwill and other assets that have an indefinite useful life are not subject to amortisation but are tested for impairment annually or whenever there is an indication that the asset may be impaired.
For the purpose of impairment testing, assets are grouped at the lowest levels for which there are separately identifiable cash flows, known as cash-generating units. If the recoverable amount of the cash-generating unit is less than the carrying amount of the unit, the impairment loss is allocated first to reduce the carrying amount of any goodwill allocated to the unit and then to the other assets of the unit pro-rata on the basis of the carrying amount of each asset in the unit. An impairment loss recognised for goodwill is not reversed in a subsequent period.
Recoverable amount is the higher of fair value less costs to sell and value in use. In assessing value in use, the estimated future cash flows are discounted to their present value using a pre-tax discount rate that reflects current market assessments of the time value of money and the risks specific to the asset for which the estimates of future cash flows have not been adjusted.
Property, plant and equipment and finite lived intangible assets
At each balance sheet date, the Group reviews the carrying amounts of its property, plant and equipment and finite lived intangible assets to determine whether there is any indication that those assets have suffered an impairment loss. If any such indication exists, the recoverable amount of the asset is estimated in order to determine the extent of the impairment loss (if any). Where it is not possible to estimate the recoverable amount of an individual asset, the Group estimates the recoverable amount of the cash-generating unit to which the asset belongs.
If the recoverable amount of an asset (or cash-generating unit) is estimated to be less than its carrying amount, the carrying amount of the asset (or cash-generating unit) is reduced to its recoverable amount. An impairment loss is recognised immediately in the income statement.
Where an impairment loss subsequently reverses, the carrying amount of the asset (or cash-generating unit) is increased to the revised estimate of its recoverable amount, not to exceed the carrying amount that would have been determined had no impairment loss been recognised for the asset (or cash-generating unit) in prior years. A reversal of an impairment loss is recognised immediately in the income statement.
Disposal groups held for sale
Disposal groups held for sale are stated at the lower of carrying value and fair value less costs to sell.
Revenue
Group revenue comprises revenue of the Company and its subsidiary undertakings plus the Group’s share of the revenue of its joint ventures and excludes sales taxes and discounts.
Revenue from mobile telecommunications comprises amounts charged to customers in respect of monthly access charges, airtime usage, messaging, the provision of other mobile telecommunications services, including data services and information provision, fees for connecting users of other fixed line and mobile networks to the Group’s network, revenue from the sale of equipment, including handsets and revenue arising from Partner Market Agreements.
Access charges and airtime used by contract customers are invoiced and recorded as part of a periodic billing cycle and recognised as revenue over the related access period, with unbilled revenue resulting from services already provided from the billing cycle date to the end of each period accrued and unearned revenue from services provided in periods after each accounting period deferred. Revenue from the sale of prepaid credit is deferred until such time as the customer uses the airtime, or the credit expires.
Other revenue from mobile telecommunications primarily comprises equipment sales, which are recognised upon delivery to customers, and customer connection revenue. Customer connection revenue is recognised together with the related equipment revenue to the extent that the aggregate equipment and connection revenue does not exceed the fair value of the equipment delivered to the customer. Any customer connection revenue not recognised together with related equipment revenue is deferred and recognised over the period in which services are expected to be provided to the customer.
| 76 | Vodafone Group Plc Annual Report 2006 |
Back to Contents
Revenue from data services and information provision is recognised when the Group has performed the related service and, depending on the nature of the service, is recognised either at the gross amount billed to the customer or the amount receivable by the Group as commission for facilitating the service.
Incentives are provided to customers in various forms and are usually offered on signing a new contract or as part of a promotional offering.
Where one-off incentives are provided on connection of a new customer or the upgrade of an existing customer, revenue representing the fair value of the incentive, relative to other deliverables provided to the customer as part of the same arrangement, is deferred and recognised in line with the Group’s performance of its obligations relating to the incentive.
For equipment sales made to intermediaries, revenue is recognised if the significant risks associated with the equipment are transferred to the intermediary and the intermediary has no general right of return. If the significant risks are not transferred, revenue recognition is deferred until sale of the handset to an end customer by the intermediary or the expiry of the right of return.
Intermediaries are incentivised by the Group to connect new customers and upgrade existing customers. Where such incentives are separable from the initial sale of equipment to an intermediary, the incentive is accounted for as an expense upon connection, or upgrade, of the customer.
Revenue from other businesses primarily comprises amounts charged to customers of the Group’s fixed line businesses, mainly in respect of access charges and line usage, invoiced and recorded as part of a periodic billing cycle.
Inventory
Inventory is stated at the lower of cost and net realisable value. Cost is determined on the basis of weighted average costs and comprises direct materials and, where applicable, direct labour costs and those overheads that have been incurred in bringing the inventories to their present location and condition.
Leasing
Leases are classified as finance leases whenever the terms of the lease transfer substantially all the risks and rewards of ownership of the asset to the lessee. All other leases are classified as operating leases.
Assets held under finance leases are recognised as assets of the Group at their fair value at the inception of the lease or, if lower, at the present value of the minimum lease payments as determined at the inception of the lease. The corresponding liability to the lessor is included in the balance sheet as a finance lease obligation. Lease payments are apportioned between finance charges and reduction of the lease obligation so as to achieve a constant rate of interest on the remaining balance of the liability. Finance charges are recognised in the income statement.
Rentals payable under operating leases are charged to the income statement on a straight line basis over the term of the relevant lease. Benefits received and receivable as an incentive to enter into an operating lease are also spread on a straight line basis over the lease term.
Foreign currencies
In preparing the financial statements of the individual entities, transactions in currencies other than the entity’s functional currency are recorded at the rates of exchange prevailing on the dates of the transactions. At each balance sheet date, monetary items denominated in foreign currencies are retranslated at the rates prevailing on the balance sheet date. Non-monetary items carried at fair value that are denominated in foreign currencies are retranslated at the rate prevailing on the date when fair value was determined. Non-monetary items that are measured in terms of historical cost in a foreign currency are not retranslated.
Exchange differences arising on the settlement of monetary items, and on the retranslation of monetary items, are included in the income statement for the period. Exchange differences arising on the retranslation of non-monetary items carried at fair value are included in the income statement for the period except for differences arising on the retranslation of non-monetary items in respect of which gains and losses are recognised directly in equity. For such non-monetary items, any exchange component of that gain or loss is also recognised directly in equity.
For the purpose of presenting Consolidated Financial Statements, the assets and liabilities of entities with a functional currency other than sterling are expressed in sterling using exchange rates prevailing on the balance sheet date. Income and expense items and cash flows are translated at the average exchange rates for the period and exchange differences arising are recognised directly in equity. Such translation
differences are recognised in the income statement in the period in which a foreign operation is disposed of.
Goodwill and fair value adjustments arising on the acquisition of a foreign operation are treated as assets and liabilities of the foreign operation and translated accordingly.
In respect of all foreign operations, any exchange differences that have arisen before 1 April 2004, the date of transition to IFRS, are deemed to be nil and will be excluded from the determination of any subsequent profit or loss on disposal.
Borrowing costs
All borrowing costs are recognised in the income statement in the period in which they are incurred.
Post employment benefits
For defined benefit retirement plans, the difference between the fair value of the plan assets and the present value of the plan liabilities is recognised as an asset or liability on the balance sheet. The Group has early adopted the amendment to IAS 19, “Employee Benefits”, issued by the IASB on 16 December 2004 and applied it from 1 April 2004. Accordingly, actuarial gains and losses are taken to the statement of recognised income and expense. For this purpose, actuarial gains and losses comprise both the effects of changes in actuarial assumptions and experience adjustments arising because of differences between the previous actuarial assumptions and what has actually occurred.
Other movements in the net surplus or deficit are recognised in the income statement, including the current service cost, any past service cost and the effect of any curtailment or settlements. The interest cost less the expected return on assets is also charged to the income statement. The amount charged to the income statement in respect of these plans is included within operating costs or in the Group's share of the results of equity accounted operations as appropriate.
The values attributed to plan liabilities are assessed in accordance with the advice of independent qualified actuaries.
The Group's contributions to defined contribution pension plans are charged to the income statement as they fall due.
Cumulative actuarial gains and losses as at 1 April 2004, the date of transition to IFRS, have been recognised in the balance sheet.
Taxation
Income tax expense represents the sum of the current tax payable and deferred tax.
Current tax payable or recoverable is based on taxable profit for the year. Taxable profit differs from profit as reported in the income statement because some items of income or expense are taxable or deductible in different years or may never be taxable or deductible. The Group’s liability for current tax is calculated using UK and foreign tax rates and laws that have been enacted or substantively enacted by the balance sheet date.
Deferred tax is the tax expected to be payable or recoverable in the future arising from temporary differences between the carrying amounts of assets and liabilities in the financial statements and the corresponding tax bases used in the computation of taxable profit. It is accounted for using the balance sheet liability method. Deferred tax liabilities are generally recognised for all taxable temporary differences and deferred tax assets are recognised to the extent that it is probable that taxable profits will be available against which deductible temporary differences can be utilised. Such assets and liabilities are not recognised if the temporary difference arises from goodwill or from the initial recognition (other than in a business combination) of assets and liabilities in a transaction that affects neither the taxable profit nor the accounting profit.
Deferred tax liabilities are recognised for taxable temporary differences arising on investments in subsidiaries and associates, and interests in joint ventures, except where the Group is able to control the reversal of the temporary difference and it is probable that the temporary difference will not reverse in the foreseeable future.
The carrying amount of deferred tax assets is reviewed at each balance sheet date and reduced to the extent that it is no longer probable that sufficient taxable profits will be available to allow all or part of the asset to be recovered.
Deferred tax is calculated at the tax rates that are expected to apply in the period when the liability is settled or the asset realised, based on tax rates that have been enacted or substantively enacted by the balance sheet date.
Tax assets and liabilities are offset when there is a legally enforceable right to set off current tax assets against current tax liabilities and when they either relate to income taxes
| Vodafone Group Plc Annual Report 2006 | 77 |
Back to Contents
Notes to the Consolidated Financial Statements
continued
2. Significant accounting policies continued
levied by the same taxation authority on either the same taxable entity or on different taxable entities which intend to settle the current tax assets and liabilities on a net basis.
Tax is charged or credited to the income statement, except when it relates to items charged or credited directly to equity, in which case the tax is also recognised directly in equity.
Financial instruments
Financial assets and financial liabilities, in respect of financial instruments, are recognised on the Group’s balance sheet when the Group becomes a party to the contractual provisions of the instrument.
The Group has applied the requirements of IFRS to financial instruments for all periods presented and has not taken advantage of any exemptions available to first time adopters of IFRS in this respect. The Group has early adopted IFRS 7, “Financial Instruments: Disclosures”, amendments to IAS 39, “Financial Instruments: Recognition and Measurement” and IFRS 4, “Insurance Contracts”, regarding “Financial Guarantee Contracts” and amendments to IAS 39 regarding “The Fair Value Option” and “Cash Flow Hedge Accounting of Forecast Intragroup Transactions” and applied them from 1 April 2004.
Trade receivables
Trade receivables do not carry any interest and are stated at their nominal value as reduced by appropriate allowances for estimated irrecoverable amounts. Estimated irrecoverable amounts are based on the ageing of the receivable balances and historical experience. Individual trade receivables are written off when management deems them not to be collectible.
Investments
Investments are recognised and derecognised on a trade date where a purchase or sale of an investment is under a contract whose terms require delivery of the investment within the timeframe established by the market concerned, and are initially measured at cost, including transaction costs.
Investments are classified as either held for trading or available-for-sale, and are measured at subsequent reporting dates at fair value. Where securities are held for trading purposes, gains and losses arising from changes in fair value are included in net profit or loss for the period. For available-for-sale investments, gains and losses arising from changes in fair value are recognised directly in equity, until the security is disposed of or is determined to be impaired, at which time the cumulative gain or loss previously recognised in equity, determined using the weighted average costs method, is included in the net profit or loss for the period.
Cash and cash equivalents
Cash and cash equivalents comprise cash on hand and call deposits, and other short term highly liquid investments that are readily convertible to a known amount of cash and are subject to an insignificant risk of changes in value.
Trade payables
Trade payables are not interest bearing and are stated at their nominal value.
Financial liabilities and equity instruments
Financial liabilities and equity instruments issued by the Group are classified according to the substance of the contractual arrangements entered into and the definitions of a financial liability and an equity instrument. An equity instrument is any contract that evidences a residual interest in the assets of the Group after deducting all of its liabilities and includes no obligation to deliver cash or other financial assets. The accounting policies adopted for specific financial liabilities and equity instruments are set out below.
Capital market and bank borrowings
Interest bearing loans and overdrafts are initially measured at fair value (which is equal to cost at inception), and are subsequently measured at amortised cost, using the effective interest rate method, except where they are identified as a hedged item in a fair value hedge. Any difference between the proceeds net of transaction costs and the settlement or redemption of borrowings is recognised over the term of the borrowing.
Equity instruments
Equity instruments issued by the Group are recorded at the proceeds received, net of direct issue costs.
Derivative financial instruments and hedge accounting
The Group’s activities expose it to the financial risks of changes in foreign exchange rates and interest rates.
The use of financial derivatives is governed by the Group’s policies approved by the board of directors, which provide written principles on the use of financial derivatives consistent with the Group’s risk management strategy. Changes in values of all derivatives of a financing nature are included within investment income and financing costs in the income statement. The Group does not use derivative financial instruments for speculative purposes.
Derivative financial instruments are initially measured at fair value on the contract date, and are subsequently re-measured to fair value at each reporting date. The Group designates certain derivatives as either:
| • | hedges of the change of fair value of recognised assets and liabilities (“fair value hedges”); or |
| | |
| • | hedges of net investments in foreign operations. |
Hedge accounting is discontinued when the hedging instrument expires or is sold, terminated, or exercised, or no longer qualifies for hedge accounting.
Fair value hedges
The Group’s policy is to use derivative instruments (primarily interest rate swaps) to convert a proportion of its fixed rate debt to floating rates in order to hedge the interest rate risk arising, principally, from capital market borrowings. The Group designates these as fair value hedges of interest rate risk with changes in fair value of the hedging instrument recognised in the income statement for the period together with the changes in the fair value of the hedged item due to the hedged risk, to the extent the hedge is effective. The ineffective portion is recognised immediately in the income statement.
Net investment hedges
Exchange differences arising from the translation of the net investment in foreign operations are recognised directly in equity. Gains and losses on those hedging instruments designated as hedges of the net investments in foreign operations are recognised in equity to the extent that the hedging relationship is effective. These amounts are included in exchange differences on translation of foreign operations as stated in the statement of recognised income and expense. Any ineffectiveness is recognised immediately in the income statement for the period. Gains and losses accumulated in the translation reserve are included in the income statement when the foreign operation is disposed of. The Group has adopted the Amendments to IAS 21, “The Effect of Changes in Foreign Exchange Rates”, with effect from 1 April 2004, being the date of transition to IFRS for the Group.
Provisions
Provisions are recognised when the Group has a present obligation as a result of a past event, and it is probable that the Group will be required to settle that obligation. Provisions are measured at the directors’ best estimate of the expenditure required to settle the obligation at the balance sheet date, and are discounted to present value where the effect is material.
Share-based payments
The Group issues equity-settled share-based payments to certain employees. Equity-settled share-based payments are measured at fair value (excluding the effect of non market-based vesting conditions) at the date of grant. The fair value determined at the grant date of the equity-settled share-based payments is expensed on a straight-line basis over the vesting period, based on the Group’s estimate of the shares that will eventually vest and adjusted for the effect of non market-based vesting conditions.
Fair value is measured using a binomial pricing model which is calibrated using a Black-Scholes framework. The expected life used in the model has been adjusted, based on management’s best estimate, for the effects of non-transferability, exercise restrictions and behavioural considerations.
Advertising costs
Expenditure on advertising is written off in the year in which it is incurred.
| 78 | Vodafone Group Plc Annual Report 2006 |
Back to Contents
3. Segmental analysis
The Group’s business is principally the supply of mobile telecommunications services and products. Primary segmental information is provided on the basis of geographic regions, being the basis on which the Group manages its worldwide interests. Other operations primarily comprise fixed line telecommunications businesses. The segmental analysis is provided for the Group’s continuing operations. Revenue is determined by location of assets, which is not materially different from revenue by location of customer. Inter-segment sales are charged at arms length prices.
| | | | | | | | | | | | Mobile telecommunications | | Other operations | | Group | |
|
|
|
|
|
|
|
|
|
|
|
|
|
|
|
| |
| |
| |
| | | | | | | | | | | | Other | | Common | | | | | | | | | |
| | Germany | | Italy | | Spain | | UK | | US | | mobile | | functions | | Total | | Germany | | Other | | | |
| | £m | | £m | | £m | | £m | | £m | | £m | | £m | | £m | | £m | | £m | | £m | |
|
|
|
|
|
|
|
|
|
|
|
|
|
|
|
|
|
|
|
|
|
| |
| 31 March 2006 | | | | | | | | | | | | | | | | | | | | | | |
| Service revenue | 5,394 | | 4,170 | | 3,615 | | 4,568 | | – | | 8,530 | | | | 26,277 | | 1,320 | | 19 | | 27,616 | |
| Equipment and other revenue | 360 | | 193 | | 380 | | 480 | | – | | 720 | | | | 2,133 | | – | | – | | 2,133 | |
|
|
|
|
|
|
|
|
|
|
|
|
|
|
|
|
|
|
|
|
|
| |
| Segment revenue | 5,754 | | 4,363 | | 3,995 | | 5,048 | | – | | 9,250 | | | | 28,410 | | 1,320 | | 19 | | 29,749 | |
| Subsidiaries | 5,754 | | – | | 3,995 | | 5,048 | | – | | 7,812 | | | | 22,609 | | 1,320 | | – | | 23,929 | |
| Joint ventures | – | | 4,363 | | – | | – | | – | | 1,470 | | | | 5,833 | | – | | 19 | | 5,852 | |
| Less: intra-segment revenue | – | | – | | – | | – | | – | | (32 | ) | | | (32 | ) | – | | – | | (32 | ) |
| Common functions | | | | | | | | | | | | | 145 | | 145 | | | | | | 145 | |
| Inter-segment revenue | (64 | ) | (44 | ) | (105 | ) | (65 | ) | – | | (121 | ) | (19 | ) | (418 | ) | – | | – | | (418 | ) |
|
|
|
|
|
|
|
|
|
|
|
|
|
|
|
|
|
|
|
|
|
| |
| Net revenue | 5,690 | | 4,319 | | 3,890 | | 4,983 | | – | | 9,129 | | 126 | | 28,137 | | 1,320 | | 19 | | 29,476 | |
| Less: revenue between mobile and other operations | (91 | ) | – | | – | | – | | – | | (1 | ) | | | (92 | ) | (34 | ) | – | | (126 | ) |
|
|
|
|
|
|
|
|
|
|
|
|
|
|
|
|
|
|
|
|
|
| |
| Group revenue | 5,599 | | 4,319 | | 3,890 | | 4,983 | | – | | 9,128 | | 126 | | 28,045 | | 1,286 | | 19 | | 29,350 | |
|
|
|
|
|
|
|
|
|
|
|
|
|
|
|
|
|
|
|
|
|
| |
| Segment result | (17,904 | ) | (1,928 | ) | 968 | | 698 | | – | | 1,296 | | | | (16,870 | ) | 139 | | 4 | | (16,727 | ) |
| Subsidiaries | (17,904 | ) | – | | 968 | | 698 | | – | | 933 | | | | (15,305 | ) | 139 | | – | | (15,166 | ) |
| Joint ventures | – | | (1,928 | ) | – | | – | | – | | 363 | | | | (1,565 | ) | – | | 4 | | (1,561 | ) |
| Common functions | | | | | | | | | | | | | 215 | | 215 | | | | | | 215 | |
| Share of result in associated undertakings | – | | – | | – | | – | | 1,732 | | 712 | | 8 | | 2,452 | | – | | (24 | ) | 2,428 | |
|
|
|
|
|
|
|
|
|
|
|
|
|
|
|
|
|
|
|
|
|
| |
| Operating (loss)/profit | (17,904 | ) | (1,928 | ) | 968 | | 698 | | 1,732 | | 2,008 | | 223 | | (14,203 | ) | 139 | | (20 | ) | (14,084 | ) |
| Non-operating income and expense | | | | | | | | | | | | | | | | | | | | | (2 | ) |
| Investment income | | | | | | | | | | | | | | | | | | | | | 353 | |
| Financing costs | | | | | | | | | | | | | | | | | | | | | (1,120 | ) |
|
|
|
|
|
|
|
|
|
|
|
|
|
|
|
|
|
|
|
|
|
| |
| Loss before taxation | | | | | | | | | | | | | | | | | | | | | (14,853 | ) |
| Tax on loss | | | | | | | | | | | | | | | | | | | | | (2,380 | ) |
|
|
|
|
|
|
|
|
|
|
|
|
|
|
|
|
|
|
|
|
|
| |
| Loss for the year from continuing operations | | | | | | | | | | | | | | | | | | | | | (17,233 | ) |
|
|
|
|
|
|
|
|
|
|
|
|
|
|
|
|
|
|
|
|
|
| |
| Operating loss | (17,904 | ) | (1,928 | ) | 968 | | 698 | | 1,732 | | 2,008 | | 223 | | (14,203 | ) | 139 | | (20 | ) | (14,084 | ) |
| Add back: | | | | | | | | | | | | | | | | | | | | | | |
| Impairment losses | 19,400 | | 3,600 | | – | | – | | – | | 515 | | – | | 23,515 | | – | | – | | 23,515 | |
| Non-recurring items related to acquisitions and disposals | – | | – | | – | | – | | – | | (20 | ) | (12 | ) | (32 | ) | – | | – | | (32 | ) |
|
|
|
|
|
|
|
|
|
|
|
|
|
|
|
|
|
|
|
|
|
| |
| Adjusted operating profit | 1,496 | | 1,672 | | 968 | | 698 | | 1,732 | | 2,503 | | 211 | | 9,280 | | 139 | | (20 | ) | 9,399 | |
|
|
|
|
|
|
|
|
|
|
|
|
|
|
|
|
|
|
|
|
|
| |
| Non-current assets(1) | 24,360 | | 19,422 | | 12,596 | | 8,743 | | – | | 17,200 | | 1,907 | | 84,228 | | 754 | | 64 | | 85,046 | |
| Investment in associated undertakings | – | | – | | – | | – | | 17,898 | | 5,182 | | 37 | | 23,117 | | – | | 80 | | 23,197 | |
| Current assets(1) | 669 | | 888 | | 443 | | 743 | | – | | 1,555 | | 79 | | 4,377 | | 266 | | 13 | | 4,656 | |
|
|
|
|
|
|
|
|
|
|
|
|
|
|
|
|
|
|
|
|
|
| |
| Total segment assets(1) | 25,029 | | 20,310 | | 13,039 | | 9,486 | | 17,898 | | 23,937 | | 2,023 | | 111,722 | | 1,020 | | 157 | | 112,899 | |
| Unallocated non-current assets: | | | | | | | | | | | | | | | | | | | | | | |
| Deferred tax assets | | | | | | | | | | | | | | | | | | | | | 140 | |
| Trade and other receivables | | | | | | | | | | | | | | | | | | | | | 231 | |
| Unallocated current assets: | | | | | | | | | | | | | | | | | | | | | | |
| Cash and cash equivalents | | | | | | | | | | | | | | | | | | | | | 2,789 | |
| Trade and other receivables | | | | | | | | | | | | | | | | | | | | | 79 | |
| Taxation recoverable | | | | | | | | | | | | | | | | | | | | | 8 | |
| Assets included in disposal group for resale(3) | | | | | | | | | | | | | | | | | | | | | 10,592 | |
|
|
|
|
|
|
|
|
|
|
|
|
|
|
|
|
|
|
|
|
|
| |
| Total assets | | | | | | | | | | | | | | | | | | | | | 126,738 | |
|
|
|
|
|
|
|
|
|
|
|
|
|
|
|
|
|
|
|
|
|
| |
| Vodafone Group Plc Annual Report 2006 | 79 |
Back to Contents
Notes to the Consolidated Financial Statements
continued
3. Segmental analysis continued
| | | | | | | | | | | | Mobile telecommunications | | Other operations | | Group | |
|
|
|
|
|
|
|
|
|
|
|
|
|
|
|
| |
|
|
| |
| |
| | Germany | | Italy | | Spain | | UK | | US | | Other | | Common | | Total | | Germany | | Other | | | |
| | | | | | | | | | | | mobile | | functions | | | | | | | | | |
| | £m | | £m | | £m | | £m | | £m | | £m | | £m | | £m | | £m | | £m | | £m | |
|
|
|
|
|
|
|
|
|
|
|
|
|
|
|
|
|
|
|
|
|
| |
| Segment liabilities(1) | (753 | ) | (1,370 | ) | (914 | ) | (827 | ) | – | | (2,638 | ) | (1,458 | ) | (7,960 | ) | (362 | ) | (26 | ) | (8,348 | ) |
| Unallocated liabilities: | | | | | | | | | | | | | | | | | | | | | | |
| Current taxation liabilities | | | | | | | | | | | | | | | | | | | | | (4,448 | ) |
| Deferred tax liabilities | | | | | | | | | | | | | | | | | | | | | (5,670 | ) |
| Trade and other payables | | | | | | | | | | | | | | | | | | | | | (219 | ) |
| Short-term borrowings | | | | | | | | | | | | | | | | | | | | | (3,448 | ) |
| Long-term borrowings | | | | | | | | | | | | | | | | | | | | | (16,750 | ) |
| Liabilities included in disposal group for resale(3) | | | | | | | | | | | | | | | | | | | | | (2,543 | ) |
|
|
|
|
|
|
|
|
|
|
|
|
|
|
|
|
|
|
|
|
|
| |
| Total liabilities | | | | | | | | | | | | | | | | | | | | | (41,426 | ) |
|
|
|
|
|
|
|
|
|
|
|
|
|
|
|
|
|
|
|
|
|
| |
| | | | | | | | | | | | | | | | | | | | | | | |
| Other segment items: | | | | | | | | | | | | | | | | | | | | | | |
| Capitalised fixed asset additions(2) | 592 | | 541 | | 502 | | 665 | | – | | 1,456 | | 112 | | 3,868 | | 129 | | 8 | | 4,005 | |
| Expenditure on other intangible assets | – | | 1 | | – | | 11 | | – | | 4 | | – | | 16 | | – | | – | | 16 | |
| Non-cash items: | | | | | | | | | | | | | | | | | | | | | | |
| Depreciation | 653 | | 398 | | 281 | | 486 | | – | | 1,113 | | 6 | | 2,937 | | 140 | | 2 | | 3,079 | |
| Amortisation of intangible assets | 514 | | 190 | | 114 | | 438 | | – | | 186 | | 183 | | 1,625 | | – | | – | | 1,625 | |
| Impairment of goodwill | 19,400 | | 3,600 | | – | | – | | – | | 515 | | – | | 23,515 | | – | | – | | 23,515 | |
| Bad debt expense | 39 | | 5 | | 41 | | 9 | | – | | 64 | | – | | 158 | | 10 | | – | | 168 | |
| Share-based payments | 6 | | 7 | | 5 | | 18 | | – | | 17 | | 54 | | 107 | | 2 | | – | | 109 | |
|
|
|
|
|
|
|
|
|
|
|
|
|
|
|
|
|
|
|
|
|
| |
| Notes: | | | | | | | | | | | | | | | | | | | | | | |
| (1) | Excluding unallocated items. |
| (2) | Includes additions to property, plant and equipment and computer software, included with intangible assets. |
| (3) | See note 29 for information on discontinued operations. |
| 80 | Vodafone Group Plc Annual Report 2006 |
Back to Contents
| | | | | | | | | | | | | | | | | | | | | | Continuing | | Discontinued | | | |
| | | | | | | | | | | | Mobile telecommunications | | Other operations | | operations | | operations | | Group | |
|
|
|
|
|
|
|
|
|
|
|
|
|
|
|
| |
|
|
| |
| |
| |
| |
| | Germany | | Italy | | Spain | | UK | | US | | Other | | Common | | Total | | Germany | | Other | | | | | | | |
| | | | | | | | | | | | mobile | | functions | | | | | | | | | | | | | |
| | £m | | £m | | £m | | £m | | £m | | £m | | £m | | £m | | £m | | £m | | £m | | £m | | £m | |
|
|
|
|
|
|
|
|
|
|
|
|
|
|
|
|
|
|
|
|
|
|
|
|
|
| |
| 31 March 2005 | | | | | | | | | | | | | | | | | | | | | | | | | | |
| Service revenue | 5,320 | | 4,091 | | 2,963 | | 4,498 | | – | | 6,973 | | | | 23,845 | | 1,095 | | – | | 24,940 | | 5,610 | | | |
| Equipment and other revenue | 364 | | 182 | | 298 | | 567 | | – | | 664 | | | | 2,075 | | – | | – | | 2,075 | | 1,786 | | | |
|
|
|
|
|
|
|
|
|
|
|
|
|
|
|
|
|
|
|
|
|
|
|
| | | |
| Segment revenue | 5,684 | | 4,273 | | 3,261 | | 5,065 | | – | | 7,637 | | | | 25,920 | | 1,095 | | – | | 27,015 | | 7,396 | | | |
| Subsidiaries | 5,684 | | – | | 3,261 | | 5,065 | | – | | 6,474 | | | | 20,484 | | 1,095 | | – | | 21,579 | | 7,396 | | | |
| Joint ventures | – | | 4,273 | | – | | – | | – | | 1,184 | | | | 5,457 | | – | | – | | 5,457 | | – | | | |
| Less: intra-segment revenue | – | | – | | – | | – | | – | | (21 | ) | | | (21 | ) | – | | – | | (21 | ) | – | | | |
| Common functions | | | | | | | | | | | | | 123 | | 123 | | | | | | 123 | | | | | |
| Inter-segment revenue | (51 | ) | (36 | ) | (80 | ) | (47 | ) | – | | (84 | ) | (5 | ) | (303 | ) | – | | – | | (303 | ) | (1 | ) | | |
|
|
|
|
|
|
|
|
|
|
|
|
|
|
|
|
|
|
|
|
|
|
|
| | | |
| Net revenue | 5,633 | | 4,237 | | 3,181 | | 5,018 | | – | | 7,553 | | 118 | | 25,740 | | 1,095 | | – | | 26,835 | | 7,395 | | | |
| Less: revenue between mobile and | | | | | | | | | | | | | | | | | | | | | | | | | | |
| other operations | (110 | ) | – | | – | | – | | – | | – | | (1 | ) | (111 | ) | (46 | ) | – | | (157 | ) | – | | | |
|
|
|
|
|
|
|
|
|
|
|
|
|
|
|
|
|
|
|
|
|
|
|
| | | |
| Group revenue | 5,523 | | 4,237 | | 3,181 | | 5,018 | | – | | 7,553 | | 117 | | 25,629 | | 1,049 | | – | | 26,678 | | 7,395 | | | |
|
|
|
|
|
|
|
|
|
|
|
|
|
|
|
|
|
|
|
|
|
|
|
| | | |
| | | | | | | | | | | | | | | | | | | | | | | | | | | |
| Segment result | 1,473 | | 1,694 | | 775 | | 779 | | – | | 1,198 | | | | 5,919 | | 64 | | – | | 5,983 | | 664 | | | |
| Subsidiaries | 1,473 | | – | | 775 | | 779 | | – | | 893 | | | | 3,920 | | 64 | | – | | 3,984 | | 664 | | | |
| Joint ventures | – | | 1,694 | | – | | – | | – | | 305 | | | | 1,999 | | – | | – | | 1,999 | | | | | |
| Common functions | | | | | | | | | | | | | (85 | ) | (85 | ) | | | | | (85 | ) | | | | |
| Share of result in associated undertakings | – | | – | | – | | – | | 1,354 | | 671 | | | | 2,025 | | – | | (45 | ) | 1,980 | | – | | | |
|
|
|
|
|
|
|
|
|
|
|
|
|
|
|
|
|
|
|
|
|
|
|
| | | |
| Operating profit/(loss) | 1,473 | | 1,694 | | 775 | | 779 | | 1,354 | | 1,869 | | (85 | ) | 7,859 | | 64 | | (45 | ) | 7,878 | | 664 | | | |
| Non-operating income and expense | | | | | | | | | | | | | | | | | | | | | (7 | ) | 13 | | | |
| Investment income | | | | | | | | | | | | | | | | | | | | | 294 | | 9 | | | |
| Financing costs | | | | | | | | | | | | | | | | | | | | | (880 | ) | (20 | ) | | |
|
|
|
|
|
|
|
|
|
|
|
|
|
|
|
|
|
|
|
|
|
|
|
| | | |
| Profit before taxation | | | | | | | | | | | | | | | | | | | | | 7,285 | | 666 | | | |
| Tax on profit | | | | | | | | | | | | | | | | | | | | | (1,869 | ) | 436 | | | |
|
|
|
|
|
|
|
|
|
|
|
|
|
|
|
|
|
|
|
|
|
|
|
|
|
| |
| Profit for the financial year | | | | | | | | | | | | | | | | | | | | | 5,416 | | 1,102 | | 6,518 | |
|
|
|
|
|
|
|
|
|
|
|
|
|
|
|
|
|
|
|
|
|
|
|
|
|
| |
| | | | | | | | | | | | | | | | | | | | | | | | | | | |
| Operating profit/(loss) | 1,473 | | 1,694 | | 775 | | 779 | | 1,354 | | 1,869 | | (85 | ) | 7,859 | | 64 | | (45 | ) | 7,878 | | 664 | | | |
| Add back: | | | | | | | | | | | | | | | | | | | | | | | | | | |
| Impairment losses | – | | – | | – | | – | | – | | 475 | | – | | 475 | | – | | – | | 475 | | – | | | |
|
|
|
|
|
|
|
|
|
|
|
|
|
|
|
|
|
|
|
|
|
|
|
| | | |
| Adjusted operating profit/(loss) | 1,473 | | 1,694 | | 775 | | 779 | | 1,354 | | 2,344 | | (85 | ) | 8,334 | | 64 | | (45 | ) | 8,353 | | 664 | | | |
|
|
|
|
|
|
|
|
|
|
|
|
|
|
|
|
|
|
|
|
|
|
|
| | | |
| | | | | | | | | | | | | | | | | | | | | | | | | | | |
| Non-current assets(1) | 44,101 | | 22,768 | | 12,288 | | 9,014 | | – | | 12,443 | | 884 | | 101,498 | | 752 | | – | | 102,250 | | 13,754 | | 116,004 | |
| Investment in associated undertakings | – | | – | | – | | – | | 15,039 | | 5,096 | | 33 | | 20,168 | | – | | 66 | | 20,234 | | – | | 20,234 | |
| Current assets(1) | 811 | | 844 | | 356 | | 741 | | – | | 1,301 | | 118 | | 4,171 | | 221 | | – | | 4,392 | | 1,168 | | 5,560 | |
|
|
|
|
|
|
|
|
|
|
|
|
|
|
|
|
|
|
|
|
|
|
|
|
|
| |
| Total segment assets(1) | 44,912 | | 23,612 | | 12,644 | | 9,755 | | 15,039 | | 18,840 | | 1,035 | | 125,837 | | 973 | | 66 | | 126,876 | | 14,922 | | 141,798 | |
| Unallocated non-current assets: | | | | | | | | | | | | | | | | | | | | | | | | | | |
| Deferred tax assets | | | | | | | | | | | | | | | | | | | | | | | | | 1,184 | |
| Trade and other receivables | | | | | | | | | | | | | | | | | | | | | | | | | 364 | |
| Unallocated current assets: | | | | | | | | | | | | | | | | | | | | | | | | | | |
| Cash and cash equivalents | | | | | | | | | | | | | | | | | | | | | | | | | 3,769 | |
| Trade and other receivables | | | | | | | | | | | | | | | | | | | | | | | | | 44 | |
| Taxation recoverable | | | | | | | | | | | | | | | | | | | | | | | | | 38 | |
|
|
|
|
|
|
|
|
|
|
|
|
|
|
|
|
|
|
|
|
|
|
|
|
|
| |
| Total assets | | | | | | | | | | | | | | | | | | | | | | | | | 147,197 | |
|
|
|
|
|
|
|
|
|
|
|
|
|
|
|
|
|
|
|
|
|
|
|
|
|
| |
| Vodafone Group Plc Annual Report 2006 | 81 |
Back to Contents
Notes to the Consolidated Financial Statements
continued
3. Segmental analysis continued
| | | | | | | | | | | | | | | | | | | | | | Continuing | | Discontinued | | | |
| | | | | | | | | | | | Mobile telecommunications | | Other operations | | operations | | operations | | Group | |
|
|
|
|
|
|
|
|
|
|
|
| |
| |
| |
| |
| |
| | Germany | | Italy | | Spain | | UK | | US | | Other | | Common | | Total | | Germany | | Other | | | | | | | |
| | | | | | | | | | | | mobile | | functions | | | | | | | | | | | | | |
| | £m | | £m | | £m | | £m | | £m | | £m | | £m | | £m | | £m | | £m | | £m | | £m | | £m | |
|
|
|
|
|
|
|
|
|
|
|
|
|
|
|
|
|
|
|
|
|
|
|
|
|
| |
| Segment liabilities(1) | (848 | ) | (1,237 | ) | (735 | ) | (939 | ) | – | | (2,295 | ) | (1,180 | ) | (7,234 | ) | (364 | ) | – | | (7,598 | ) | (1,477 | ) | (9,075 | ) |
| Unallocated liabilities: | | | | | | | | | | | | | | | | | | | | | | | | | | |
| Current taxation liabilities | | | | | | | | | | | | | | | | | | | | | | | | | (4,353 | ) |
| Deferred tax liabilities | | | | | | | | | | | | | | | | | | | | | | | | | (4,849 | ) |
| Short-term borrowings | | | | | | | | | | | | | | | | | | | | | | | | | (2,003 | ) |
| Long-term borrowings | | | | | | | | | | | | | | | | | | | | | | | | | (13,190 | ) |
| Trade and other payables | | | | | | | | | | | | | | | | | | | | | | | | | (79 | ) |
|
|
|
|
|
|
|
|
|
|
|
|
|
|
|
|
|
|
|
|
|
|
|
|
|
| |
| Total liabilities | | | | | | | | | | | | | | | | | | | | | | | | | (33,549 | ) |
|
|
|
|
|
|
|
|
|
|
|
|
|
|
|
|
|
|
|
|
|
|
|
|
|
| |
| | | | | | | | | | | | | | | | | | | | | | | | | | | |
| Other segment items: | | | | | | | | | | | | | | | | | | | | | | | | | | |
| Capitalised fixed asset additions(2) | 827 | | 538 | | 490 | | 789 | | – | | 1,333 | | 136 | | 4,113 | | 112 | | – | | 4,225 | | 885 | | | |
| Expenditure on other intangible assets | – | | 8 | | – | | – | | – | | 118 | | – | | 126 | | – | | – | | 126 | | – | | | |
| Non-cash items: | | | | | | | | | | | | | | | | | | | | | | | | | | |
| Depreciation | 640 | | 403 | | 253 | | 464 | | – | | 961 | | 11 | | 2,732 | | 153 | | – | | 2,885 | | 1,114 | | | |
| Amortisation of intangible assets | 514 | | 184 | | 101 | | 468 | | – | | 142 | | 7 | | 1,416 | | – | | – | | 1,416 | | 100 | | | |
| Impairment of goodwill | – | | – | | – | | – | | – | | 475 | | – | | 475 | | – | | – | | 475 | | – | | | |
| Bad debt expense | 50 | | 13 | | 35 | | 36 | | – | | 39 | | – | | 173 | | 10 | | – | | 183 | | 39 | | | |
| Share-based payments | 3 | | 4 | | 2 | | 15 | | – | | 11 | | 94 | | 129 | | 1 | | – | | 130 | | 7 | | | |
|
|
|
|
|
|
|
|
|
|
|
|
|
|
|
|
|
|
|
|
|
|
|
| | | |
| Notes: | | | | | | | | | | | | | | | | | | | | | | | | | | |
| (1) | Excluding unallocated items. |
| (2) | Includes additions to property, plant and equipment and computer software, included with intangible assets. |
| 82 | Vodafone Group Plc Annual Report 2006 |
Back to Contents
4. Operating (loss)/profit
Operating (loss)/profit has been arrived at after charging/(crediting):
| | 2006 | | 2005 | |
| | £m | | £m | |
|
|
|
| |
| Net foreign exchange gains | – | | (10 | ) |
| Depreciation of property, plant and equipment: | | | | |
| Owned assets | 3,069 | | 2,871 | |
| Leased assets | 10 | | 14 | |
| Amortisation of intangible assets | 1,625 | | 1,416 | |
| Impairment of goodwill | 23,515 | | 475 | |
| Research and development expenditure | 206 | | 198 | |
| Advertising costs | 670 | | 660 | |
| Staff costs (see note 34) | 2,310 | | 2,185 | |
| Operating lease rentals payable: | | | | |
| Plant and machinery | 35 | | 37 | |
| Other assets including fixed line rentals | 933 | | 873 | |
| Loss on disposal of property, plant and equipment | 69 | | 68 | |
| Own costs capitalised attributable to the construction or acquisition of property, plant and equipment | (256 | ) | (250 | ) |
|
|
|
| |
The total remuneration of the Group’s auditors, Deloitte & Touche LLP, and its affiliates for services provided to the Group’s subsidiary undertakings is analysed below:
| | 2006 | | 2005 | |
| | £m | | £m | |
|
|
|
| |
| Audit fees | 4 | | 4 | |
| Audit-related fees: | | | | |
| Audit regulatory reporting | 1 | | – | |
| Due diligence reviews | 1 | | 1 | |
| Tax fees | 1 | | 1 | |
| Other fees | 1 | | 1 | |
|
|
|
| |
| | 8 | | 7 | |
|
|
|
| |
The total remuneration includes £1 million (2005: £1 million) in respect of the Group’s discontinued operations in Japan.
In addition to the above, the Group’s joint ventures and associated undertakings paid fees totalling £2 million (2005: £2 million) and £4 million (2005: £5 million), respectively, to Deloitte & Touche LLP and its affiliates during the year.
A description of the work performed by the Audit Committee in order to safeguard auditor independence when non audit services are provided is set out in the Corporate Governance section on page 57. In the year ended 31 March 2006, the Audit Committee pre-approved all services.
| Vodafone Group Plc Annual Report 2006 | 83 |
Back to Content
Notes to the Consolidated Financial Statements
continued
5. Investment income and financing costs
| | 2006 | | 2005 | |
| | £m | | £m | |
|
|
|
| |
| Investment income | | | | |
| Available-for-sale investments: | | | | |
| Dividends received | 41 | | 19 | |
| Loans and receivables | 153 | | 201 | |
| Fair value adjustments recognised in the income statement: | | | | |
| Derivatives - foreign exchange contracts and interest rate futures | 159 | | 74 | |
|
|
|
| |
| | 353 | | 294 | |
|
|
|
| |
| Financing costs | | | | |
| Items in hedge relationships: | | | | |
| Other loans | 510 | | 472 | |
| Interest rate swaps | (118 | ) | (198 | ) |
| Dividends on redeemable preference shares | 48 | | – | |
| Fair value hedging instrument | 213 | | 231 | |
| Fair value of hedged item | (186 | ) | (213 | ) |
| Other financial liabilities held at amortised cost: | | | | |
| Bank loans and overdrafts | 126 | | 129 | |
| Other loans | 78 | | 68 | |
| Dividends on redeemable preference shares | – | | 46 | |
| Potential interest charge on settlement of tax issues | 329 | | 245 | |
| Fair value adjustments recognised in the income statement: | | | | |
| Derivatives - forward starting swaps | (48 | ) | 25 | |
| Equity put rights and similar arrangements(1) | 161 | | 67 | |
| Finance leases | 7 | | 8 | |
|
|
|
| |
| | 1,120 | | 880 | |
|
|
|
| |
| Net financing costs | 767 | | 586 | |
|
|
|
| |
| Note: |
| (1) | The fair value adjustments for equity put rights and similar arrangements relates to the Group’s arrangements with Telecom Egypt and it’s minority partners in the Group’s other operations in Germany. Further information is provided in “Options agreements and similar arrangements” on page 42. |
| 84 | Vodafone Group Plc Annual Report 2006 |
Back to Contents
6. Taxation
(Loss)/profit before tax is split as follows:
| | 2006 | | 2005 | |
| | £m | | £m | |
|
|
|
| |
| United Kingdom profit before tax | 491 | | 765 | |
| Overseas (loss)/profit before tax | (15,344 | ) | 6,520 | |
|
|
|
| |
| Total (loss)/profit before tax | (14,853 | ) | 7,285 | |
|
|
|
| |
| | | | | |
| | | | | |
Income tax expense
Tax on (loss)/profit from continuing operations, as shown in the income statement, is as follows: | | | | |
| | 2006 | | 2005 | |
| | £m | | £m | |
|
|
|
| |
| United Kingdom corporation tax expense/(income) at 30%: | | | | |
| Current year | 169 | | 339 | |
| Adjustments in respect of prior years | (15 | ) | (79 | ) |
|
|
|
| |
| | 154 | | 260 | |
|
|
|
| |
| Overseas current tax expense/(income): | | | | |
| Current year | 2,077 | | 1,774 | |
| Adjustments in respect of prior years | (418 | ) | (154 | ) |
|
|
|
| |
| | 1,659 | | 1,620 | |
|
|
|
| |
| Total current tax expense | 1,813 | | 1,880 | |
|
|
|
| |
| | | | | |
| Deferred tax on origination and reversal of temporary differences: | | | | |
| United Kingdom deferred tax | 444 | | 234 | |
| Overseas deferred tax | 123 | | (245 | ) |
|
|
|
| |
| Total deferred tax expense/(income) | 567 | | (11 | ) |
|
|
|
| |
|
|
|
| |
| Total tax on (loss)/profit from continuing operations | 2,380 | | 1,869 | |
|
|
|
| |
| | | | | |
| Tax recognised directly in equity | | | | |
| | 2006 | | 2005 | |
| | £m | | £m | |
|
|
|
| |
| Current tax credit | (6 | ) | (10 | ) |
| Deferred tax credit | (11 | ) | (35 | ) |
|
|
|
| |
| Total tax credited directly to equity | (17 | ) | (45 | ) |
|
|
|
| |
| | | | | |
|
Factors affecting tax expense for the year
The table below explains the differences between the expected tax expense on continuing operations, at the UK statutory tax rate of 30% for 2006 and 2005, and the Group’s total tax expense for each year. Further discussion of the current year tax expense can be found in the section titled “Performance – Operating Results – Group Overview – 2006 financial year compared to 2005 financial year – Taxation.”
| | 2006 | | 2005 | |
| | £m | | £m | |
|
|
|
| |
| (Loss)/profit before tax on continuing operations as shown in the income statement | (14,853 | ) | 7,285 | |
|
|
|
| |
| Expected tax (credit)/ charge on profit from continuing operations at UK statutory tax rate | (4,456 | ) | 2,186 | |
| Effect of taxation of associated undertakings, reported within operating profit | 133 | | 134 | |
| Non deductible impairment losses | 7,055 | | 143 | |
|
|
|
| |
| Expected tax charge at UK statutory rate on profit from continuing operations, before impairment losses and taxation of associates | 2,732 | | 2,463 | |
| Effect of different statutory tax rates of overseas jurisdictions | 411 | | 433 | |
| Other expenses not deductible for tax purposes | 299 | | 367 | |
| Deferred tax on overseas earnings | (78 | ) | (66 | ) |
| Effect of previously unrecognised temporary differences | (71 | ) | (463 | ) |
| Prior period adjustments | (470 | ) | (417 | ) |
| Exclude taxation of associated undertakings | (443 | ) | (448 | ) |
|
|
|
| |
| Total tax expense on (loss)/profit from continuing operations | 2,380 | | 1,869 | |
|
|
|
| |
| Vodafone Group Plc Annual Report 2006 | 85 |
Back to Contents
Notes to the Consolidated Financial Statements
continued
6. Taxation continued
Deferred tax
Analysis of movements in net deferred tax balance during the year:
| | 2006 | |
| | £m | |
|
| |
| 1 April 2005 | (3,665 | ) |
| Reclassification as held for sale | (717 | ) |
| Exchange movements | (217 | ) |
| Charged to the income statement | (567 | ) |
| Credited to the statement of recognised income and expense | 8 | |
| Acquisitions and disposals | (372 | ) |
|
| |
| 31 March 2006 | (5,530 | ) |
|
| |
Deferred tax assets and liabilities in respect of continuing operations, before offset of balances within countries, are as follows:
| | | | | | | | Net recognised | | Amount credited | |
| | | | | | Less: | | deferred tax | | /(charged) in | |
| | Gross deferred | | Gross deferred | | amounts | | asset/ | | income | |
| | tax asset | | tax liability | | unrecognised | | (liability) | | statement | |
| | £m | | £m | | £m | | £m | | £m | |
|
|
|
|
|
|
|
|
|
| |
| Accelerated tax depreciation | 155 | | (1,702 | ) | (48 | ) | (1,595 | ) | (91 | ) |
| Accelerated tax depreciation | 155 | | (1,702 | ) | (48 | ) | (1,595 | ) | (91 | ) |
| Tax losses | 9,565 | | – | | (9,191 | ) | 374 | | (85 | ) |
| Deferred tax on overseas earnings | – | | (4,025 | ) | – | | (4,025 | ) | (318 | ) |
| Other short term timing differences | 4,073 | | (1,418 | ) | (2,939 | ) | (284 | ) | (73 | ) |
|
|
|
|
|
|
|
|
|
| |
| 31 March 2006 | 13,793 | | (7,145 | ) | (12,178 | ) | (5,530 | ) | (567 | ) |
|
|
|
|
|
|
|
|
|
| |
|
| | | | |
| Analysed in the balance sheet, after offset of balances within countries, as: | £m | | |
|
| | |
| Deferred tax asset | 140 | | |
| Deferred tax liability | (5,670 | ) | |
|
| | |
| | (5,530 | ) | |
|
| | |
| | | | | | | | | | | |
| | | | | | | | Net recognised | | Amount credited | |
| | | | | | Less: | | deferred tax | | /(charged) in | |
| | Gross deferred | | Gross deferred | | amounts | | asset/ | | income | |
| | tax asset | | tax liability | | unrecognised | | (liability) | | statement | |
| | £m | | £m | | £m | | £m | | £m | |
|
|
|
|
|
|
|
|
|
| |
| Accelerated tax depreciation | 293 | | (1,604 | ) | (20 | ) | (1,331 | ) | (175 | ) |
| Tax losses | 8,248 | | – | | (7,370 | ) | 878 | | 69 | |
| Deferred tax on overseas earnings | – | | (3,427 | ) | – | | (3,427 | ) | (245 | ) |
| Other short term timing differences | 5,017 | | (1,065 | ) | (3,737 | ) | 215 | | 362 | |
|
|
|
|
|
|
|
|
|
| |
| 31 March 2005 | 13,558 | | (6,096 | ) | (11,127 | ) | (3,665 | ) | 11 | |
|
|
|
|
|
|
|
|
|
| |
|
| | | | |
| Analysed in the balance sheet, after offset of balances within countries, as: | £m | | |
|
| | |
| Deferred tax asset | 1,184 | | |
| Deferred tax liability | (4,849 | ) | |
|
| | |
| | (3,665 | ) | |
|
| | |
Deferred tax balances at 31 March 2005 above are inclusive of discontinued operations. The amounts reported for the 2005 income statement are for continuing operations. Further deferred tax credits of £35 million for accelerated tax depreciation, £433 million tax losses and £103 million other short term timing differences are included within amounts related to discontinued operations in the 2005 income statement.
Factors affecting the tax charge in future years
Factors that may affect the Group’s future tax charge include one-off restructuring benefits, the resolution of open issues, future planning opportunities, corporate acquisitions and disposals, changes in tax legislation and rates, and the use of brought forward tax losses.
In particular, the Group’s subsidiary Vodafone 2 is responding to an enquiry by HM Revenue & Customs (“HMRC”) with regard to the UK tax treatment of one of its Luxembourg holding companies under the controlled foreign companies (“CFC”) rules. Further details in relation to this enquiry are included in note 31 “Contingent Liabilities”. At 31 March 2006, the Group holds provisions of £1,822 million tax and £276 million interest in respect of the potential UK tax liability that may arise from this enquiry (2005: £1,600 million tax and £157 million interest). Management considers these amounts are sufficient to settle any assessments that may result from the enquiry. However, the amount ultimately paid may differ materially from the amount accrued and, therefore, could affect the overall profitability of the Group in future periods. In the absence of any material unexpected developments, the provisions are likely to be reassessed when the views of the European Court of Justice become known.
| 86 | Vodafone Group Plc Annual Report 2006 |
Back to Contents
At 31 March 2006, the gross amount and expiry dates of losses available for carry forward are as follows:
| | Expiring within | | | | | |
| | 5 years | | Unlimited | | Total | |
| | £m | | £m | | £m | |
|
|
|
|
|
| |
| Losses for which a deferred tax asset is recognised | 1 | | 1,451 | | 1,452 | |
| Losses for which no deferred tax is recognised | 172 | | 31,331 | | 31,503 | |
|
|
|
|
|
| |
| | 173 | | 32,782 | | 32,955 | |
|
|
|
|
|
| |
Included above are losses amounting to £1,939 million (2005: £1,870 million) in respect of UK subsidiaries which are only available for offset against future capital gains and since it is uncertain whether these losses will be utilised, no deferred tax asset has been recognised.
The losses above also include £27,545 million (2005 £20,898 million) that have arisen in overseas holding companies as a result of revaluations of those companies’ investments for local GAAP purposes. Since it is uncertain whether these losses will be utilised no deferred tax asset has been recognised.
In addition to the losses described above, the Group has potential tax losses of £35,250 million (2005: £34,674 million) in respect of a write down in the value of investments in Germany. These losses have to date been denied by the German tax authorities. Vodafone is in continuing discussions with them regarding the availability of the losses, however the outcome of these discussions and the timing of the resolution are not yet known. The Group has not recognised the availability of the losses, nor the income statement benefit arising from them, due to this uncertainty. If upon resolution a benefit is recognised, it may impact both the amount of current income taxes provided since the date of initial deduction and the amount of the benefit from tax losses the Group will recognise. The recognition of these benefits could affect the overall profitability of the Group in future periods.
The Group holds provisions in respect of deferred taxation that would arise if temporary differences on investments in subsidiaries, associates and interests in joint ventures were to be realised after the balance sheet date. No deferred tax liability has been recognised in respect of a further £23,038 million (2005: £15,060 million) of unremitted earnings of subsidiaries, associates and joint ventures because the Group is in a position to control the timing of the reversal of the temporary difference and it is probable that such differences will not reverse in the foreseeable future.
7. Equity dividends
| | 2006 | | 2005 | |
| | £m | | £m | |
|
|
|
| |
| Declared and paid during the financial year: | | | | |
| Final dividend for the year ended 31 March 2005: 2.16 pence per share | | | | |
| (2004: 1.078 pence per share) | 1,386 | | 728 | |
| Interim dividend for the year ended 31 March 2006: 2.20 pence per share | | | | |
| (2005: 1.91 pence per share) | 1,367 | | 1,263 | |
|
|
|
| |
| | 2,753 | | 1,991 | |
|
|
|
| |
| | | | | |
| Proposed or declared after the balance sheet date and not recognised as a liability: | | | | |
| Final dividend for the year ended 31 March 2006: 3.87 pence per share | | | | |
| (2005: 2.16 pence per share) | 2,327 | | 1,386 | |
|
|
|
| |
| Vodafone Group Plc Annual Report 2006 | 87 |
Back to Contents
Notes to the Consolidated Financial Statements
continued
8. (Loss)/earnings per share
| | 2006 | | 2005 | |
| | Millions | | Millions | |
|
|
|
| |
| Weighted average number of shares for basic (loss)/earnings per share | 62,607 | | 66,196 | |
| Effect of dilutive potential shares: restricted shares and share options | – | | 231 | |
|
|
|
| |
| Weighted average number of shares for diluted (loss)/earnings per share | 62,607 | | 66,427 | |
|
|
|
| |
| | | | | |
| | £m | | £m | |
|
|
|
| |
| (Loss)/earnings for basic and diluted earnings per share | | | | |
| Continuing operations | (17,318 | ) | 5,375 | |
| Discontinued operations | (4,598 | ) | 1,035 | |
|
|
|
| |
| Total | (21,916 | ) | 6,410 | |
|
|
|
| |
|
| | | | | |
| | Pence per share | | Pence per share | |
|
|
|
| |
| (Loss)/earnings per share from continuing operations: | | | | |
| Basic (loss)/earnings per share | (27.66 | ) | 8.12 | |
| Diluted (loss)/earnings per share(2) | (27.66 | ) | 8.09 | |
| | | | | |
| (Loss)/earnings per share from continuing and discontinued operations(1): | | | | |
| Basic (loss)/earnings per share | (35.01 | ) | 9.68 | |
| Diluted (loss)/earnings per share(2) | (35.01 | ) | 9.65 | |
|
|
|
| |
|
| | | | | |
| | £m | | £m | |
|
|
|
| |
| Basic and diluted (loss)/earnings per share for continuing operations is stated inclusive of the following items: | | | | |
| Impairment losses (note 10) | (23,515 | ) | (475 | ) |
| Other income and expense | 15 | | – | |
| Share of associated undertakings non-operating income (note 14) | 17 | | – | |
| Non-operating income and expense | (2 | ) | (7 | ) |
| Changes in fair value of equity put rights and similar arrangements (note 5)(3) | (161 | ) | (67 | ) |
| Tax on the above items | – | | (3 | ) |
|
|
|
| |
| | | | | |
| | Pence per share | | Pence per share | |
|
|
|
| |
| Impairment losses | (37.56 | ) | (0.72 | ) |
| Other income and expense | 0.02 | | – | |
| Share of associated undertakings non-operating income | 0.03 | | – | |
| Non-operating income and expense | – | | (0.01 | ) |
| Changes in fair value of equity put rights and similar arrangements(3) | (0.26 | ) | (0.10 | ) |
| Tax on the above items | – | | – | |
|
|
|
| |
|
| Notes: |
| (1) | See note 29 for further information on discontinued operations including the per share effect of discontinued operations. |
| (2) | In the year ended 31 March 2006, 183 million shares have been excluded from the calculation of diluted loss per share as they are anti dilutive. |
| (3) | Comprises the fair value movement in relation to the potential put rights held by Telecom Egypt over its 25.5% interest in Vodafone Egypt and the fair value of a financial liability in relation to the minority partners of Arcor, the Group’s non-mobile operation in Germany.
Following the sale of 16.9% of Vodafone Egypt to Telecom Egypt, the Group signed a shareholder agreement with Telecom Egypt setting out the basis under which the Group and Telecom Egypt would each contribute a 25.5% interest in Vodafone Egypt to a newly formed company to be 50% owned by each party. Within this shareholder agreement, Telecom Egypt was granted a put option over its entire interest in Vodafone Egypt giving Telecom Egypt the right to put its shares back to the Group at deemed fair value. In the 2006 financial year, the shareholder agreement between Telecom Egypt and Vodafone expired and the associated rights and obligations contained in the shareholder agreement terminated, including the aforementioned put option. However, the original shareholders agreement contained an obligation on both parties to use reasonable efforts to renegotiate a revised shareholder agreement for their direct shareholding in Vodafone Egypt on substantially the same terms as the original agreement, which may or may not lead to a new agreement containing a put option under the terms described above. As of 31 March 2006, the parties have not agreed to abandon such efforts and as such the financial liability relating to the initial shareholder agreement has been retained in the Group’s balance sheet as at 31 March 2006. Fair value movements are determined by the reference to the quoted share price of Vodafone Egypt. For the year ended 31 March 2006, a charge of £105 million was recognised.
The capital structure of Arcor provides all partners, including Vodafone, the right to withdraw capital from 31 December 2026 onwards and this right in relation to the minority partner has been recognised as a financial liability. Fair value movements are determined by reference to a calculation of enterprise value of the partnership. For the year ended 31 March 2006, a charge of £56 million was recognised.
The valuation of these financial liabilities is inherently unpredictable and changes in the fair value could have a material impact on the future results and financial position of Vodafone. |
| 88 | Vodafone Group Plc Annual Report 2006 |
Back to Contents
9. Intangible assets
| | | | | | | | | | | |
| | | | Licences and | | Computer | | | | | |
| | Goodwill | | spectrum fees | | software | | Other | | Total | |
| | £m | | £m | | £m | | £m | | £m | |
|
|
|
|
|
|
|
|
|
| |
| Cost: | | | | | | | | | | |
| 1 April 2004 | 78,753 | | 15,178 | | 2,432 | | – | | 96,363 | |
| Exchange movements | 1,519 | | 254 | | 39 | | (5 | ) | 1,807 | |
| Arising on acquisition | 1,239 | | 229 | | – | | 654 | | 2,122 | |
| Additions | – | | 126 | | 528 | | – | | 654 | |
| Disposals | (37 | ) | – | | (35 | ) | – | | (72 | ) |
|
|
|
|
|
|
|
|
|
| |
| 31 March 2005 | 81,474 | | 15,787 | | 2,964 | | 649 | | 100,874 | |
| Reclassification as held for sale | (8,295 | ) | (214 | ) | (36 | ) | (620 | ) | (9,165 | ) |
|
|
|
|
|
|
|
|
|
| |
| | 73,179 | | 15,573 | | 2,928 | | 29 | | 91,709 | |
| Exchange movements | 1,291 | | 216 | | 51 | | 22 | | 1,580 | |
| Arising on acquisition | 2,802 | | 1,196 | | 20 | | 699 | | 4,717 | |
| Additions | – | | 6 | | 616 | | 10 | | 632 | |
| Disposals | (1,142 | ) | – | | (43 | ) | (5 | ) | (1,190 | ) |
|
|
|
|
|
|
|
|
|
| |
| 31 March 2006 | 76,130 | | 16,991 | | 3,572 | | 755 | | 97,448 | |
|
|
|
|
|
|
|
|
|
| |
| | | | | | | | | | | |
| Accumulated impairment losses and amortisation: | | | | | | | | | | |
| 1 April 2004 | – | | 361 | | 1,378 | | – | | 1,739 | |
| Exchange movements | – | | 12 | | 21 | | (2 | ) | 31 | |
| Amortisation charge for the year(1) | – | | 926 | | 494 | | 96 | | 1,516 | |
| Impairment losses | 475 | | – | | – | | – | | 475 | |
| Disposals | – | | – | | (35 | ) | – | | (35 | ) |
|
|
|
|
|
|
|
|
|
| |
| 31 March 2005 | 475 | | 1,299 | | 1,858 | | 94 | | 3,726 | |
| Reclassification as held for sale | – | | (8 | ) | (7 | ) | (90 | ) | (105 | ) |
|
|
|
|
|
|
|
|
|
| |
| | 475 | | 1,291 | | 1,851 | | 4 | | 3,621 | |
| Exchange movements | 513 | | 38 | | 33 | | 4 | | 588 | |
| Amortisation charge for the year | – | | 1,030 | | 493 | | 102 | | 1,625 | |
| Impairment losses | 23,515 | | – | | – | | – | | 23,515 | |
| Disposals | (979 | ) | – | | (38 | ) | (2 | ) | (1,019 | ) |
|
|
|
|
|
|
|
|
|
| |
| 31 March 2006 | 23,524 | | 2,359 | | 2,339 | | 108 | | 28,330 | |
|
|
|
|
|
|
|
|
|
| |
| | | | | | | | | | | |
| Net book value: | | | | | | | | | | |
| 31 March 2006 | 52,606 | | 14,632 | | 1,233 | | 647 | | 69,118 | |
|
|
|
|
|
|
|
|
|
| |
| 31 March 2005 | 80,999 | | 14,488 | | 1,106 | | 555 | | 97,148 | |
|
|
|
|
|
|
|
|
|
| |
| Note: |
| (1) | The amortisation charge for the year includes £100 million in relation to discontinued operations |
The net book value at 31 March 2006 and expiry dates of the most significant purchased licences, are as follows:
| | | | 2006 | |
| | Expiry date | | £m | |
|
|
|
| |
| Germany | December 2020 | | 5,165 | |
| UK | December 2021 | | 5,245 | |
|
|
|
| |
| Vodafone Group Plc Annual Report 2006 | 89 |
Back to Contents
Notes to the Consolidated Financial Statements
continued
9. Intangible assets continued
Goodwill, analysed by reportable segment, is as follows:
| | | | | | | | | | | | Other | | Other | | | |
| | | | | | | | | | | | mobile | | operations | | | |
| | Germany | | Italy | | Japan | | Spain | | UK | | operations | | Germany | | Total | |
| | £m | | £m | | £m | | £m | | £m | | £m | | £m | | £m | |
|
|
|
|
|
|
|
|
|
|
|
|
|
|
|
| |
| Cost: | | | | | | | | | | | | | | | | |
| 1 April 2004 | 34,824 | | 19,291 | | 7,523 | | 10,125 | | 713 | | 6,237 | | 40 | | 78,753 | |
| Exchange movements | 941 | | 521 | | (428 | ) | 274 | | – | | 210 | | 1 | | 1,519 | |
| Arising on acquisition | – | | – | | 1,200 | | – | | – | | 39 | | – | | 1,239 | |
| Disposals | – | | – | | – | | – | | – | | (37 | ) | – | | (37 | ) |
|
|
|
|
|
|
|
|
|
|
|
|
|
|
|
| |
| 31 March 2005 | 35,765 | | 19,812 | | 8,295 | | 10,399 | | 713 | | 6,449 | | 41 | | 81,474 | |
| Reclassification as held for sale | – | | – | | (8,295 | ) | – | | – | | – | | – | | (8,295 | ) |
|
|
|
|
|
|
|
|
|
|
|
|
|
|
|
| |
| | 35,765 | | 19,812 | | – | | 10,399 | | 713 | | 6,449 | | 41 | | 73,179 | |
| Exchange movements | 595 | | 330 | | – | | 172 | | – | | 192 | | 2 | | 1,291 | |
| Arising on acquisition | – | | 15 | | – | | – | | 3 | | 2,784 | | – | | 2,802 | |
| Disposals | – | | – | | – | | – | | – | | (1,142 | ) | – | | (1,142 | ) |
|
|
|
|
|
|
|
|
|
|
|
|
|
|
|
| |
| 31 March 2006 | 36,360 | | 20,157 | | – | | 10,571 | | 716 | | 8,283 | | 43 | | 76,130 | |
|
|
|
|
|
|
|
|
|
|
|
|
|
|
|
| |
| | | | | | | | | | | | | | | | | |
| Accumulated impairment losses: | | | | | | | | | | | | | | | | |
| 1 April 2004 | – | | – | | – | | – | | – | | – | | – | | – | |
| Impairment losses | – | | – | | – | | – | | – | | 475 | | – | | 475 | |
|
|
|
|
|
|
|
|
|
|
|
|
|
|
|
| |
| 31 March 2005 | – | | – | | – | | – | | – | | 475 | | – | | 475 | |
| Exchange movements | 442 | | 82 | | – | | – | | – | | (11 | ) | – | | 513 | |
| Impairment losses | 19,400 | | 3,600 | | – | | – | | – | | 515 | | – | | 23,515 | |
| Disposals | – | | – | | – | | – | | – | | (979 | ) | – | | (979 | ) |
|
|
|
|
|
|
|
|
|
|
|
|
|
|
|
| |
| 31 March 2006 | 19,842 | | 3,682 | | – | | – | | – | | – | | – | | 23,524 | |
|
|
|
|
|
|
|
|
|
|
|
|
|
|
|
| |
| | | | | | | | | | | | | | | | | |
| Net book value: | | | | | | | | | | | | | | | | |
| 31 March 2006 | 16,518 | | 16,475 | | – | | 10,571 | | 716 | | 8,283 | | 43 | | 52,606 | |
|
|
|
|
|
|
|
|
|
|
|
|
|
|
|
| |
| 31 March 2005 | 35,765 | | 19,812 | | 8,295 | | 10,399 | | 713 | | 5,974 | | 41 | | 80,999 | |
|
|
|
|
|
|
|
|
|
|
|
|
|
|
|
| |
90 | Vodafone Group Plc Annual Report 2006 |
Back to Contents
10. Impairment
The following cash-generating units, being the lowest level of asset for which there are separately identifiable cash flows, have carrying amounts of goodwill that are considered significant in comparison with the Group’s total goodwill balance:
| | 2006 | | 2005 | |
| | £m | | £m | |
|
|
|
| |
| Germany | 16,518 | | 35,765 | |
| Italy | 16,475 | | 19,812 | |
| Spain | 10,571 | | 10,399 | |
| Japan(1) | – | | 8,295 | |
|
|
|
| |
| | 43,564 | | 74,271 | |
| Multiple units without significant goodwill | 9,042 | | 6,728 | |
|
|
|
| |
| | 52,606 | | 80,999 | |
|
|
|
| |
| Note: |
| (1) | Goodwill of £8,295 million relating to the Group’s mobile operations in Japan has been reclassified to assets included in the disposal group held for sale, following the Group’s announcement of its intention to dispose of its operations in Japan on17 March 2006. |
In accordance with accounting standards, the Group undertakes an annual test for impairment of its cash generating units. The most recent test was undertaken at 31 January 2006. The tests in the years ended 31 March 2006 and 2005 were based on value in use calculations.
Impairment losses
The impairment losses recognised in the income statement, as a separate line item within operating profit, in respect of goodwill are as follows:
| | 2006 | | 2005 | |
| | £m | | £m | |
|
|
|
| |
| Germany | 19,400 | | – | |
| Italy | 3,600 | | – | |
| Other Mobile Operations – Sweden | 515 | | 475 | |
|
|
|
| |
| | 23,515 | | 475 | |
|
|
|
| |
Germany and Italy
The carrying value of goodwill of the Group’s mobile operations in Germany and Italy, with each representing a reportable segment, has been impaired due to Vodafone having revised its view of longer term trends for these businesses given certain developments in the current market environment.
The German market has seen recent intensification in price competition, principally from new market entrants, together with high levels of penetration and continued regulated reductions in incoming call rates.
In Italy, competitive pressures are increasing with the mobile network operators competing aggressively on subsidies and, increasingly, on price.
The impairment losses were determined as part of the annual test for impairment and were based on value in use calculations using the pre-tax risk adjusted discount rates disclosed on page 92.
Sweden
The impairment of the carrying value of goodwill of the Group’s mobile operation in Sweden in the years ended 31 March 2006 and 2005 resulted from fierce competition in the Swedish market combined with onerous 3G licence obligations. Vodafone Sweden forms part of the Group’s Other Mobile Operations, which is a reportable segment.
Prior to its disposal in the year in the year ended 31 March 2006, the carrying value of goodwill was tested for impairment at an interim date as increased competition provided an indicator that the goodwill may have been further impaired. The recoverable amount of the goodwill was determined as the fair value less costs to sell, reflecting the announcement on 31 October 2005 that the Group’s 100% interest in Vodafone Sweden was to be sold for €953 million (£653 million). The sale completed on 5 January 2006.
In the year ended 31 March 2005, the impairment was determined as part of the annual test for impairment and was based on value in use calculations. A pre-tax risk adjusted discount rate of 9.7% was used in the value in use calculation.
Key assumptions used in the value in use calculations
The Group prepares and internally approves formal ten year plans for its businesses. For the year ended 31 March 2005, the Group used these plans for its value in use calculations. The plans included cash flow projections for the mobile businesses which were expected to have growth rates in excess of the long-term average growth rates, beyond an initial five year period, for the markets in which they operate.
In the year ended 31 March 2006, the most recent management plans have shown that the need to reflect a differing growth profile beyond an initial five year period has diminished in a number of the Group’s key operating companies as the Group has revised its view of longer term trends. Accordingly, the directors believe it is now appropriate to use projections of five years for its value in use calculations, except in markets which are forecast to grow ahead of the long term growth rate for the market. At 31 March 2006, the value in use calculation for the Group’s joint venture in India used a ten year plan reflecting the low penetration of mobile telecommunications in the country and the expectation of strong revenue growth throughout the ten year plan.
| Vodafone Group Plc Annual Report 2006 | 91 |
Back to Contents
Notes to the Consolidated Financial Statements
continued
10. Impairment continued
The key assumptions used in determining the value in use are:
| Assumption | How determined |
|
|
|
| Budgeted EBITDA | Budgeted EBITDA, calculated as adjusted operating profit before depreciation and amortisation, has been based on past experience adjusted for the following: |
| | | |
| | • | voice and messaging revenue is expected to benefit from increased usage from new customers, the introduction of new services and traffic moving from fixed networks to mobile networks, though these factors will be partially offset by increased competitor activity, which may result in price declines, and the trend of falling termination rates; |
| | | |
| | • | non-messaging data revenue is expected to continue to grow strongly as the penetration of 3G enabled devices rises and new products and services are introduced; and |
| | | |
| | • | margins are expected to be impacted by negative factors such as an increase in the cost of acquiring and retaining customers in increasingly competitive markets and the expectation of further termination rates cuts by regulators; and by positive factors such as the efficiencies expected from the implementation of One Vodafone initiatives. |
| | |
| Budgeted capital expenditure | The cash flow forecasts for capital expenditure is based on past experience and includes the ongoing capital expenditure required to provide enhanced voice and data products and services and to meet the population coverage requirements of certain of the Group’s licences. Capital expenditure includes cash outflows for the purchase of property, plant and equipment and computer software. |
| | |
| Long term growth rate | For mobile businesses, a long term growth rate into perpetuity has been determined as the lower of: |
| | | |
| | • | the nominal GDP rates for the country of operation; and |
| | | |
| | • | the long term compound annual growth rate in EBITDA implied by the business plan. |
| | |
| | For non-mobile businesses, no growth is expected beyond management’s plans for the initial five year period. |
| | |
| Pre-tax risk adjusted discount rate | The discount rate applied to the cash flows of each the Group’s operations is based on the risk free rate for ten year bonds issued by the government in the respective market, adjusted for a risk premium to reflect both the increased risk of investing in equities and the systematic risk of the specific Group operating company. In making this adjustment, inputs required are the equity market risk premium (that is the required increased return required over and above a risk free rate by an investor who is investing in the market as a whole) and the risk adjustment (“beta”) applied to reflect the risk of the specific Group operating company relative to the market as a whole. |
| | |
| | In determining the risk adjusted discount rate, management have applied an adjustment for the systematic risk to each of the Group’s operations determined using an average of the beta’s of comparable listed mobile telecommunications companies and, where available and appropriate, across a specific territory. Management have used a forward looking equity market risk premium that takes into consideration both studies by independent economists, the average equity market risk premium over the past ten years and the market risk premiums typically used by investment banks in evaluating acquisition proposals. |
|
| |
| The following assumptions have been applied in the value in use calculations as follows: |
| | Pre-tax risk adjusted discount rate | | Long term growth rate | |
| |
|
|
| |
|
|
| |
| | 2006 | | 2005 | | 2006 | | 2005 | |
| | % | | % | | % | | % | |
|
|
|
|
|
|
|
| |
| Germany | 10.1 | | 9.6 | | 1.1 | | 2.7 | |
| Italy | 10.1 | | 9.2 | | 1.5 | | 4.1 | |
| Spain | 9.0 | | 9.3 | | 3.3 | | 3.4 | |
|
|
|
|
|
|
|
| |
Impact of a reasonably possible change in a key assumption
For those cash generating units, or the aggregate of cash generating units which are not individually significant, where a reasonably possible change in a key assumption would lead to an impairment loss, the following provides additional information on the sensitivity of such a change on the recoverable amount.
| | Germany | | Italy | |
| | £m | | £m | |
|
|
|
| |
| Amount by which recoverable amount exceeded the carrying value at 31 January 2006 | – | | – | |
|
|
|
| |
|
| | | | | |
| | % | | % | |
|
|
|
| |
| Key assumptions: | | | | |
| Budgeted EBITDA(1) | 0.3 | | (1.8 | ) |
| Budgeted capital expenditure(2) | 9.3 to 9.0 | | 13.4 to 8.5 | |
|
|
|
| |
| Notes: |
| (1) | Compound annual growth rates in the initial five years of the Group’s approved financial plans. |
| (2) | Range of capital expenditure as a percentage of revenue in the initial five years of the Group’s approved plans. |
As noted above, there has been an impairment loss recognised in the year ended 31 March 2006 in respect of Germany and Italy, whose carrying values, therefore, equalled their respective recoverable amounts at 31 January 2006, the date of the Group’s annual impairment test. As a result, any adverse change in key assumption would cause a further impairment loss to be recognised.
| 92 | Vodafone Group Plc Annual Report 2006 |
Back to Contents
11. Property, plant and equipment
| | | | Equipment, | | | | | |
| | Land and | | fixtures and | | Network | | | |
| | buildings | | fittings | | infrastructure | | Total | |
| | £m | | £m | | £m | | £m | |
|
|
|
|
|
|
|
| |
| Cost: | | | | | | | | |
| 1 April 2004 | 1,193 | | 3,893 | | 22,759 | | 27,845 | |
| Exchange movements | 8 | | 38 | | (54 | ) | (8 | ) |
| Additions | 125 | | 1,393 | | 3,064 | | 4,582 | |
| Disposals | (23 | ) | (253 | ) | (368 | ) | (644 | ) |
|
|
|
|
|
|
|
| |
| 31 March 2005 | 1,303 | | 5,071 | | 25,401 | | 31,775 | |
| Reclassification as held for sale | (209 | ) | (201 | ) | (7,599 | ) | (8,009 | ) |
|
|
|
|
|
|
|
| |
| | 1,094 | | 4,870 | | 17,802 | | 23,766 | |
| Exchange movements | 11 | | 199 | | 252 | | 462 | |
| Arising on acquisition | 3 | | 404 | | 492 | | 899 | |
| Additions | 55 | | 984 | | 2,350 | | 3,389 | |
| Disposal of businesses | (6 | ) | (111) | | (820 | ) | (937 | |
| Disposals | (67 | ) | (257 | ) | (412 | ) | (736 | ) |
| Reclassifications | 22 | | 306 | | (328 | ) | – | |
|
|
|
|
|
|
|
| |
| 31 March 2006 | 1,112 | | 6,395 | | 19,336 | | 26,843 | |
|
|
|
|
|
|
|
| |
| | | | | | | | | |
| Accumulated depreciation and impairment: | | | | | | | | |
| 1 April 2004 | 280 | | 2,060 | | 8,393 | | 10,733 | |
| Exchange movements | 4 | | 16 | | (6 | ) | 14 | |
| Charge for the year(1) | 81 | | 791 | | 3,127 | | 3,999 | |
| Disposals | (9 | ) | (204 | ) | (200 | ) | (413 | ) |
|
|
|
|
|
|
|
| |
| 31 March 2005 | 356 | | 2,663 | | 11,314 | | 14,333 | |
| Reclassification as held for sale | (44 | ) | (101 | ) | (3,347 | ) | (3,492 | ) |
|
|
|
|
|
|
|
| |
| | 312 | | 2,562 | | 7,967 | | 10,841 | |
| Exchange movements | 3 | | 90 | | 132 | | 225 | |
| Charge for the year | 62 | | 905 | | 2,112 | | 3,079 | |
| Disposal of businesses | (1 | ) | (75 | ) | (281 | ) | (357 | ) |
| Disposals | (26 | ) | (243 | ) | (336 | ) | (605 | ) |
| Reclassifications | 3 | | 306 | | (309 | ) | – | |
|
|
|
|
|
|
|
| |
| 31 March 2006 | 353 | | 3,545 | | 9,285 | | 13,183 | |
|
|
|
|
|
|
|
| |
| | | | | | | | | |
| Net book value: | | | | | | | | |
| 31 March 2006 | 759 | | 2,850 | | 10,051 | | 13,660 | |
|
|
|
|
|
|
|
| |
| 31 March 2005 | 947 | | 2,408 | | 14,087 | | 17,442 | |
|
|
|
|
|
|
|
| |
| Note: |
| (1) | The depreciation charge for the year includes £1,114 million in relation to discontinued operations. |
The net book value of equipment, fixtures and fittings and network infrastructure includes £2 million and £50 million, respectively (2005: £3 million and £118 million) in relation to assets held under finance leases (see note 24).
Included in the net book value of land and buildings, equipment, fixtures and fittings and network infrastructure are assets in the course of construction, which are not depreciated, with a cost of £30 million, £290 million and £677 million, respectively (2005: £15 million, £360 million and £837 million).
Borrowings of £426 million (2005: £327 million) have been secured against property, plant and equipment.
| Vodafone Group Plc Annual Report 2006 | 93 |
Back to Contents
Notes to the Consolidated Financial Statements
continued
12. Principal subsidiary undertakings
At 31 March 2006, the Company had the following subsidiary undertakings carrying on businesses which principally affect the profits and assets of the Group. They have the same year end date as the Company, unless otherwise stated, and have been included in the Consolidated Financial Statements.
Unless otherwise stated, the Company’s principal subsidiary undertakings all have share capital consisting solely of ordinary shares and are indirectly held. The country of incorporation or registration of all subsidiary undertakings is also their principal place of operation.
| | | Country of | | |
| | | incorporation | Percentage | (1) |
| Name | Principal activity | or registration | shareholdings | |
|
|
|
| |
| Arcor AG & Co. KG(2) | Fixed line operator | Germany | 73.7 | |
| Vodafone Albania Sh.A.(3) | Mobile network operator | Albania | 99.9 | |
| Vodafone Americas Inc.(4) | Holding company | USA | 100.0 | |
| Vodafone Czech Republic a.s.(5) | Mobile network operator | Czech Republic | 100.0 | |
| Vodafone D2 GmbH | Mobile network operator | Germany | 100.0 | |
| Vodafone Egypt Telecommunications S.A.E. | Mobile network operator | Egypt | 50.1 | |
| Vodafone Espana S.A. | Mobile network operator | Spain | 100.0 | |
| Vodafone Europe B.V. | Holding company | Netherlands | 100.0 | |
| Vodafone Group Services Limited(6) | Global products and services provider | England | 100.0 | |
| Vodafone Holding GmbH(3) | Holding company | Germany | 100.0 | |
| Vodafone Holdings Europe S.L. | Holding company | Spain | 100.0 | |
| Vodafone Hungary Mobile Telecommunications Limited | Mobile network operator | Hungary | 100.0 | |
| Vodafone International Holdings B.V. | Holding company | Netherlands | 100.0 | |
| Vodafone Investments Luxembourg S.a.r.l. | Holding company | Luxembourg | 100.0 | |
| Vodafone Ireland Limited | Mobile network operator | Ireland | 100.0 | |
| Vodafone K.K.(7) | Mobile network operator | Japan | 97.7 | |
| Vodafone Libertel N.V. | Mobile network operator | Netherlands | 99.9 | |
| Vodafone Limited | Mobile network operator | England | 100.0 | |
| Vodafone Malta Limited | Mobile network operator | Malta | 100.0 | |
| Vodafone Marketing S.a.r.l. | Provider of Partner Network services | Luxembourg | 100.0 | |
| Vodafone Network Pty Limited | Mobile network operator | Australia | 100.0 | |
| Vodafone New Zealand Limited | Mobile network operator | New Zealand | 100.0 | |
| Vodafone-Panafon Hellenic Telecommunications Company S.A. | Mobile network operator | Greece | 99.8 | |
| Vodafone Portugal-Comunicações Pessoais, S.A. | Mobile network operator | Portugal | 100.0 | |
| Vodafone Romania S.A.(3)(8) | Mobile network operator | Romania | 100.0 | |
|
|
|
| |
| Notes: |
| (1) | Rounded to nearest tenth of one percent. |
| (2) | Arcor AG & Co. KG is a partnership and, accordingly, its share capital is comprised solely of partners’ capital rather than share capital. |
| (3) | Vodafone Romania S.A., Vodafone Albania Sh.A. and Vodafone Holding GmbH have a 31 December year end. Accounts are drawn up to 31 March 2006 for inclusion in the Consolidated Financial Statements. |
| (4) | Share capital consists of 597,379,729 ordinary shares and 1.65 million class D and E redeemable preference shares, of which 100% of the ordinary shares are held by the Group. |
| (5) | On 1 February 2006, Oskar Mobil a.s. changed its name to Vodafone Czech Republic a.s. |
| (6) | The entire issued share capital of Vodafone Group Services Limited is held directly by Vodafone Group Plc. |
| (7) | On 27 April 2006, the Group disposed of its 97.7% interest in Vodafone K.K. to a wholly-owned subsidiary of SoftBank Corporation. |
| (8) | On 18 April 2006, MobiFon S.A. changed its name to Vodafone Romania S.A. |
| 94 | Vodafone Group Plc Annual Report 2006 |
Back to Contents
13. Investments in joint ventures
Principal joint ventures
Unless otherwise stated, the Company’s principal joint ventures all have share capital consisting solely of ordinary shares, which are indirectly held, and the country of incorporation or registration is also their principal place of operation. The accounts of the joint ventures are drawn up to 31 March 2006 for inclusion in the Consolidated Financial Statements. Summarised financial information of joint ventures is disclosed in note 37.
| | | Country of | | |
| | | incorporation | Percentage | (1) |
| Name | Principal activity | or registration | shareholdings | |
|
|
|
| |
| Bharti Airtel Limited(2) | Mobile network and fixed line operator | India | 10.0 | (3) |
| Polkomtel S.A.(4) | Mobile network operator | Poland | 19.6 | |
| Safaricom Limited(5) | Mobile network operator | Kenya | 35.0 | (3) |
| Vodacom Group (Pty) Limited | Holding company | South Africa | 50.0 | |
| Vodafone Fiji Limited | Mobile network operator | Fiji | 49.0 | (3) |
| Vodafone Omnitel N.V.(6) | Mobile network operator | Netherlands | 76.9 | (7) |
|
|
|
| |
| Notes: |
| (1) | Rounded to nearest tenth of one percent. |
| (2) | On 28 April 2006, Bharti Tele-Ventures Limited changed its name to Bharti Airtel Limited. |
| (3) | The Group holds substantive participating rights which provide it with a veto over the significant financial and operating policies of these entities and which ensure it is able to exercise joint control over these entities with the respective majority shareholder. |
| (4) | Latest statutory financial statements were drawn up to 31 December 2005. |
| (5) | The Group also holds two non-voting shares. |
| (6) | The principal place of operation of Vodafone Omnitel N.V. is Italy. |
| (7) | The Group considered the existence of substantive participating rights held by the minority shareholder which provide that shareholder with a veto right over the significant financial and operating policies of Vodafone Omnitel N.V. and determined that, as a result of these rights, the Group does not have control over the financial and operating policies of Vodafone Omnitel N.V., despite the Group’s 76.9% ownership interest. |
Effect of proportionate consolidation of joint ventures
The following presents, on a condensed basis, the effect of including joint ventures in the Consolidated Financial Statements using proportionate consolidation:
| | 2006 | | 2005 | |
| | £m | | £m | |
|
|
|
| |
| Revenue | 5,756 | | 5,423 | |
| Cost of sales | (2,832 | ) | (2,805 | ) |
|
|
|
| |
| Gross profit | 2,924 | | 2,618 | |
| Selling and distribution expenses | (251 | ) | (230 | ) |
| Administrative expenses | (634 | ) | (389 | ) |
| Impairment losses | (3,600 | ) | – | |
|
|
|
| |
| Operating (loss)/profit | (1,561 | ) | 1,999 | |
| Net financing costs | 27 | | 64 | |
|
|
|
| |
| (Loss)/profit before tax | (1,534 | ) | 2,063 | |
| Tax on (loss)/profit | (711 | ) | (782 | ) |
|
|
|
| |
| (Loss)/profit for the financial year | (2,245 | ) | 1,281 | |
|
|
|
| |
| | | | | |
| Intangible assets | 20,985 | | 21,925 | |
| Property, plant and equipment | 2,506 | | 1,951 | |
| Other non-current assets | 27 | | 470 | |
|
|
|
| |
| Non-current assets | 23,518 | | 24,346 | |
|
|
|
| |
| | | | | |
| Cash and cash equivalents | 1,345 | | 3,931 | |
| Other current assets | 1,148 | | 1,013 | |
|
|
|
| |
| Current assets | 2,493 | | 4,944 | |
|
|
|
| |
| | | | | |
| Total assets | 26,011 | | 29,290 | |
|
|
|
| |
| | | | | |
| Current liabilities | 2,059 | | 1,583 | |
| Other non-current liabilities | 535 | | 363 | |
|
|
|
| |
| | 2,594 | | 1,946 | |
| Total equity shareholders’ funds | 23,402 | | 27,340 | |
| Minority interests | 15 | | 4 | |
|
|
|
| |
| Total equity and liabilities | 26,011 | | 29,290 | |
|
|
|
| |
| Vodafone Group Plc Annual Report 2006 | 95 |
Back to Contents
Notes to the Consolidated Financial Statements
continued
14. Investments in associated undertakings
The Company’s principal associated undertakings all have share capital consisting solely of ordinary shares, unless otherwise stated, and are all indirectly held. The country of incorporation or registration of all associated undertakings is also their principal place of operation. The accounts of the associated undertakings are drawn up to 31 March 2006 for inclusion in the Consolidated Financial Statements. The latest statutory financial statements of the associated undertakings were drawn up to 31 December 2005. Summarised financial information of associated undertakings is disclosed in note 37.
| | | | Percentage | (1) |
| | | Country of | shareholding/ | |
| | | incorporation or | partnership | |
| Name | Principal activity | registration | interest | |
|
|
|
| |
| Belgacom Mobile S.A. | Mobile network operator | Belgium | 25.0 | |
| Cellco Partnership(2) | Mobile network operator | USA | 45.0 | |
| Société Française du Radiotéléphone S.A. | Mobile network and fixed line operator | France | 44.0 | |
| Swisscom Mobile A.G. | Mobile network operator | Switzerland | 25.0 | |
|
|
|
| |
| Notes: |
| (1) | Rounded to nearest tenth of one percent. |
| (2) | Cellco Partnership trades under the name Verizon Wireless. The registered or principal office of the partnership is 180 Washington Valley Road, Bedminster, New Jersey 07921, USA. |
The Group’s share of the aggregated financial information of equity accounted associated undertakings is set out below:
| | 2006 | | 2005 | |
| | £m | | £m | |
|
|
|
| |
| Revenue | 12,480 | | 10,546 | |
|
|
|
| |
| Operating profit | 3,133 | | 2,668 | |
| Non-operating income and expense | 17 | | – | |
| Net interest | (227 | ) | (197 | ) |
| Tax on profit | (443 | ) | (448 | ) |
| Minority interest | (52 | ) | (43 | ) |
|
|
|
| |
| Share of result in associated undertakings | 2,428 | | 1,980 | |
|
|
|
| |
| | | | | |
| Non-current assets | 29,055 | | 25,739 | |
| Current assets | 2,183 | | 2,331 | |
|
|
|
| |
| Share of total assets | 31,238 | | 28,070 | |
|
|
|
| |
| | | | | |
| Non-current liabilities | 4,141 | | 2,476 | |
| Current liabilities | 3,468 | | 4,938 | |
| Minority interests | 432 | | 422 | |
|
|
|
| |
| Share of total liabilities | 8,041 | | 7,836 | |
|
|
|
| |
| Share of net assets in associated undertakings | 23,197 | | 20,234 | |
|
|
|
| |
15. Other investments
Other investments comprise the following, all of which are available-for-sale:
| | 2006 | | 2005 | |
| | £m | | £m | |
|
|
|
| |
| Listed securities: | | | | |
| Equity securities | 1,938 | | 1,117 | |
| Unlisted securities: | | | | |
| Equity securities | 7 | | 16 | |
| Public debt and bonds | 20 | | 16 | |
| Cash held in restricted deposits | 154 | | 32 | |
|
|
|
| |
| | 2,119 | | 1,181 | |
|
|
|
| |
The fair values of listed securities are based on quoted market prices, and include the Group’s 3.3% investment in China Mobile (Hong Kong) Limited, which is listed on the Hong Kong and New York stock exchanges and incorporated under the laws of Hong Kong. China Mobile (Hong Kong) Limited is a mobile network operator and its principal place of operation is China.
Unlisted equity securities are recorded at cost, as their fair values cannot be reliably measured as there is no active market upon which they are traded.
For all other unlisted securities, the carrying amount approximates the fair value.
The total unrealised gain in respect of listed securities was £1,080 million (2005: £330 million).
| 96 | Vodafone Group Plc Annual Report 2006 |
Back to Contents
16. Inventory
| | 2006 | | 2005 | |
| | £m | | £m | |
|
|
|
| |
| Goods held for resale | 297 | | 440 | |
|
|
|
| |
Inventory is reported net of allowances for obsolescence, an analysis of which is as follows:
| | 2006 | | 2005 | |
| | £m | | £m | |
|
|
|
| |
| At 1 April | 121 | | 189 | |
| Transfer in respect of discontinued operations | (40 | ) | – | |
| Exchange movements | 1 | | (4 | ) |
| Amounts charged/(credited) to the income statement | 15 | | (64) | |
|
|
|
| |
| At 31 March | 97 | | 121 | |
|
|
|
| |
Cost of sales includes amounts related to inventory amounting to £3,662 million (2005: £3,205 million).
17. Trade and other receivables
| | 2006 | | 2005 | |
| | £m | | £m | |
|
|
|
| |
| Included within non-current assets: | | | | |
| Trade receivables | 37 | | 42 | |
| Other receivables | 28 | | 113 | |
| Prepayments and accrued income | 65 | | 66 | |
| Derivative financial instruments | 231 | | 364 | |
|
|
|
| |
| | 361 | | 585 | |
|
|
|
| |
| | | | | |
| Included within current assets: | | | | |
| Trade receivables | 2,462 | | 2,802 | |
| Amounts owed by associated undertakings | 12 | | 22 | |
| Other receivables | 399 | | 396 | |
| Prepayments and accrued income | 1,486 | | 1,900 | |
| Derivative financial instruments | 79 | | 44 | |
|
|
|
| |
| | 4,438 | | 5,164 | |
|
|
|
| |
The Group’s trade receivables are stated after allowances for bad and doubtful debts, an analysis of which is as follows:
| | 2006 | | 2005 | |
| | £m | | £m | |
|
|
|
| |
| At 1 April | 474 | | 441 | |
| Transfer in respect of discontinued operations | (41 | ) | – | |
| Exchange movements | 4 | | 5 | |
| Amounts charged to administrative expenses | 168 | | 222 | |
| Trade receivables written off | (174 | ) | (194 | ) |
|
|
|
| |
| At 31 March | 431 | | 474 | |
|
|
|
| |
Concentrations of credit risk with respect to trade receivables are limited due to the Group’s customer base being large and unrelated. Due to this, the directors believe there is no further credit risk provision required in excess of the allowance for bad and doubtful debts.
The carrying amounts of trade and other receivables approximate their fair value. Trade and other receivables are predominantly non-interest bearing.
| Vodafone Group Plc Annual Report 2006 | 97 |
Back to Contents
Notes to the Consolidated Financial Statements
continued
17. Trade and other receivables continued
Included within “Derivative financial instruments” is the following: | | | | | |
| | 2006 | | | 2005 | |
| | £m | | | £m | |
|
|
|
|
| |
| Fair value through the income statement: | | | | | |
| Interest rate swaps | 19 | | | – | |
| Foreign exchange swaps | 30 | | | 42 | |
| Option contracts | 1 | | | – | |
| Other derivatives | – | | | 1 | |
|
|
|
|
| |
| | 50 | | | 43 | |
| Fair value hedges: | | | | | |
| Interest rate swaps | 260 | | | 365 | |
|
|
|
|
| |
| | 310 | | | 408 | |
|
|
|
|
| |
The fair values of these financial instruments are calculated by discounting the future cash flows to net present values using appropriate market interest and foreign currency rates prevailing at the year end.
| 18. Cash and cash equivalents | | | | | |
| | 2006 | | | 2005 | |
| | £m | | | £m | |
|
|
|
|
| |
| Cash at bank and in hand | 948 | | | 343 | |
| Money market funds | 1,841 | | | 2,708 | |
| Repurchase agreements | – | | | 206 | |
| Commercial paper | – | | | 512 | |
|
|
|
|
| |
| Cash and cash equivalents as presented in the balance sheet | 2,789 | | | 3,769 | |
| Bank overdrafts | (18 | ) | | (43) | |
| Cash and cash equivalents of discontinued operations (note 29) | 161 | | | – | |
|
|
|
|
| |
| Cash and cash equivalents as presented in the cash flow statement | 2,932 | | | 3,726 | |
|
|
|
|
| |
Bank balances and money market funds comprise cash held by the Group on a short-term basis with original maturity of three months or less. The carrying amount of these assets approximates their fair value.
All commercial paper and repurchase agreements have a maturity of less than three months and the carrying value approximates the fair value.
All repurchase agreements represent fully collateralised bank deposits.
| 19. Called up share capital | | | | | | | | | |
| | | | 2006 | | | | | 2005 | |
| | Number | | £m | | | Number | | £m | |
|
|
|
|
|
|
|
|
| |
| Authorised: | | | | | | | | | |
| Ordinary shares of US$0.10 each | 78,000,000,000 | | 4,875 | | | 78,000,000,000 | | 4,875 | |
|
|
|
|
|
|
|
|
| |
| | | | | | | | | | |
| Ordinary shares allotted, issued and fully paid: | | | | | | | | | |
| 1 April | 68,380,866,539 | | 4,286 | | | 68,263,933,048 | | 4,280 | |
| Allotted during the year | 120,466,245 | | 7 | | | 116,933,491 | | 6 | |
| Cancelled during the year | (2,250,000,000 | ) | (128 | ) | | – | | – | |
|
|
|
|
|
|
|
|
| |
| 31 March | 66,251,332,784 | | 4,165 | | | 68,380,866,539 | | 4,286 | |
|
|
|
|
|
|
|
|
| |
| Note: |
| (1) | At 31 March 2006, the Group held 6,132,757,329 (2005: 3,814,233,598) treasury shares with a nominal value if £353 million (2005: £205 million). The market value of shares held is £7,390 million (2005: £5,359 million). |
| | |
| Allotted during the year | | | | | | |
| | | | Nominal | | | |
| | | | value | | Net proceeds | |
| | Number | | £m | | £m | |
|
|
|
|
|
| |
| UK share awards and option scheme awards | 85,744,935 | | 5 | | 122 | |
| US share awards and option scheme awards | 34,721,310 | | 2 | | 37 | |
|
|
|
|
|
| |
| Total for share option schemes and restricted stock awards | 120,466,245 | | 7 | | 159 | |
|
|
|
|
|
| |
|
Cancelled during the year
During the year 2,250,000,000 (2005: nil) treasury shares were cancelled in order to comply with Companies Act 1985 requirements in relation to the amount of issued share capital that can be held in treasury.
| 98 | Vodafone Group Plc Annual Report 2006 |
Back to Contents
20. Share-based payments
The Company currently uses a number of equity settled share plans to grant options and shares to its directors and employees.
Share options
Vodafone Group savings related and Sharesave schemes
The Vodafone Group 1998 Sharesave Scheme (the “Sharesave Scheme”) enables UK staff to acquire shares in the Company through monthly savings of up to £250 a year over a three or five year period, at the end of which they also receive a tax free bonus. The savings and bonus may then be used to purchase shares at the option price, which is set at the beginning of the savings contract and usually at a discount of 20% to the then prevailing market price of the Company’s shares. Invitations to participate in this scheme are usually made annually.
Vodafone Group executive schemes
The Company has a number of discretionary share option plans, under which awards are no longer made. The current share options plans in place are the Vodafone Group 1998 Company Share Option Scheme and Vodafone Group 1988 Executive Share Option Scheme (which are UK HM Revenue and Customs approved) and the Vodafone Group 1998 Executive Share Option Scheme and the Vodafone 1988 Share Option Scheme (which are unapproved). Options under discretionary schemes are subject to performance conditions. Options are normally exercisable between three and ten years from the date of grant.
Vodafone Group 1999 Long Term Stock Incentive Plan and ADSs
The Vodafone Group Plc 1999 Long Term Stock Incentive Plan is a discretionary plan under which both share option grants and share awards may be made. For grants made to US employees, prior to 7 July 2003 the options have phased vesting over a four year period and are exercisable in respect of ADSs. For grants made after 6 July 2003, options are normally exercisable between three and ten years from the date of grant, subject to the satisfaction of predetermined performance conditions and are exercisable in respect of ordinary shares listed on the London Stock Exchange, or ADSs for US employees.
Other share option schemes
Share option schemes are operated by certain of the Group’s subsidiary and associated undertakings, under which options are only issued to key personnel.
Share plans
Share Incentive Plan
The Share Incentive Plan enables UK staff to acquire shares in the Company through monthly purchases of up to £125 per month or 5% of salary, whichever is lower. For each share purchased by the employee, the Company provides a free matching share.
In addition to the above, all permanent employees at 1 April 2005 received an award of 320 shares (2005: 350) (known as "All Shares") in Vodafone Group Plc on 1 July 2005 (5 July 2004), under the Vodafone Group Plc Global All Employee Share Plan. The awards vest after two years and are not subject to performance conditions other than continued employment.
Restricted share plans
Under the Vodafone Group Short Term Incentive Plan, introduced in 1998, shares are conditionally awarded to directors based on achievement of one year performance targets. Release of the shares is deferred for a further two years and is subject to continued employment. Additional shares are released at this time if a further performance condition has been satisfied over the two year period.
Under the Vodafone Group Long Term Incentive Plan and the Vodafone Group Plc 1999 Long Term Stock Incentive Plan referred to above, awards of performance shares are granted to directors and certain employees. The release of these shares is conditional upon achievement of performance targets measured over a three year period.
Under these restricted share plans, the maximum aggregate number of ordinary shares which may be issued in respect of options or awards will not (without shareholder approval) exceed:
| a. | 10% of the ordinary share capital of the Company in issue immediately prior to the date of grant, when aggregated with the total number of ordinary shares which have been allocated in the preceding ten year period under all plans; and |
| | |
| b. | 5% of the ordinary share capital of the Company in issue immediately prior to the date of grant, when aggregated with the total number of ordinary shares which have been allocated in the preceding ten year period under all plans other than the Sharesave Scheme and the Vodafone Group Plc All Employee Share Plan. |
| Vodafone Group Plc Annual Report 2006 | 99 |
Back to Contents
Notes to the Consolidated Financial Statements
continued
20. Share-based payments continued
Movements in ordinary share options and ADS options outstanding | | | | |
| | | ADS | | Ordinary | |
| | |
| |
| |
| | | 2006 | | | 2005 | | 2006 | | | 2005 | |
| | | Millions | | | Millions | | Millions | | | Millions | |
|
|
|
|
|
|
|
|
|
|
| |
| 1 April | | 11 | | | 18 | | 1,123 | | | 1,184 | |
| Granted during the year | | – | | | – | | 64 | | | 60 | |
| Forfeited during the year | | – | | | (2 | ) | (40 | ) | | (61 | ) |
| Exercised during the year | | (2 | ) | | (5 | ) | (325 | ) | | (60 | ) |
| Expired during the year | | (1 | ) | | – | | (35 | ) | | – | |
|
|
|
|
|
|
|
|
|
|
| |
| 31 March | | 8 | | | 11 | | 787 | | | 1,123 | |
|
|
|
|
|
|
|
|
|
|
| |
| Weighted average exercise price: | | | | | | | | | | | |
| 1 April | | $24.49 | | | $23.36 | | £1.25 | | | £1.16 | |
| Granted during the year | | – | | | – | | £1.35 | | | £1.17 | |
| Forfeited during the year | | – | | | $28.52 | | £1.46 | | | £1.43 | |
| Exercised during the year | | $15.08 | | | $16.75 | | £0.93 | | | £0.94 | |
| Expired during the year | | $36.83 | | | – | | £1.83 | | | – | |
|
|
|
|
|
|
|
|
|
|
| |
| 31 March | | $26.53 | | | $24.49 | | £1.32 | | | £1.25 | |
|
|
|
|
|
|
|
|
|
|
| |
| | | | | | | | | | | | |
| Summary of options outstanding and exercisable at 31 March 2006 | | | | | |
| | | Outstanding | | Exercisable | |
| | |
| |
| |
| | | | | | | Weighted | | | | | | Weighted | |
| | | | | Weighted | | average | | | | Weighted | | average | |
| | | Outstanding | | average | | remaining | | Exercisable | | average | | remaining | |
| | | shares | | exercise | | contractual life | | shares | | exercise | | contractual life | |
| | | Millions | | price | | Months | | Millions | | price | | Months | |
|
|
|
|
|
|
|
|
|
|
|
|
| |
| Vodafone Group Savings Related and Sharesave Scheme: | | | | | | | | | | | | | |
| £0.01 – £1.00 | | 21 | | £0.84 | | 24 | | – | | – | | – | |
| £1.01 – £2.00 | | 12 | | £1.10 | | 39 | | – | | – | | – | |
|
|
|
|
|
|
|
|
|
|
|
|
| |
| | | 33 | | £0.93 | | 30 | | – | | – | | – | |
|
|
|
|
|
|
|
|
|
|
|
|
| |
| Vodafone Group Executive Schemes: | | | | | | | | | | | | | |
| £1.01 – £2.00 | | 17 | | £1.58 | | 29 | | 17 | | £1.58 | | 29 | |
| £2.01 – £3.00 | | 33 | | £2.75 | | 49 | | 33 | | £2.75 | | 49 | |
|
|
|
|
|
|
|
|
|
|
|
|
| |
| | | 50 | | £2.34 | | 42 | | 50 | | £2.34 | | 42 | |
|
|
|
|
|
|
|
|
|
|
|
|
| |
| Vodafone Group 1999 Long Term Stock Incentive Plan: | | | | | | | | | | | | | |
| £0.01 – £1.00 | | 227 | | £0.91 | | 75 | | 227 | | £0.91 | | 75 | |
| £1.01 – £2.00 | | 446 | | £1.39 | | 78 | | 213 | | £1.56 | | 60 | |
| £2.01 – £3.00 | | 12 | | £2.92 | | 16 | | 12 | | £2.92 | | 16 | |
|
|
|
|
|
|
|
|
|
|
|
|
| |
| | | 685 | | £1.26 | | 76 | | 452 | | £1.27 | | 66 | |
|
|
|
|
|
|
|
|
|
|
|
|
| |
| Other Share Option Plans: | | | | | | | | | | | | | |
| £0.01 – £1.00 | | 2 | | £0.73 | | 16 | | 2 | | £0.73 | | 15 | |
| £1.01 – £2.00 | | 14 | | £1.37 | | 37 | | 11 | | £1.47 | | 36 | |
| £2.01 – £3.00 | | 3 | | £2.17 | | 25 | | 3 | | £2.17 | | 25 | |
|
|
|
|
|
|
|
|
|
|
|
|
| |
| | | 19 | | £1.45 | | 33 | | 16 | | £1.54 | | 32 | |
|
|
|
|
|
|
|
|
|
|
|
|
| |
| Vodafone Group 1999 Long Term Stock Incentive Plan: | | | | | | | | | | | | | |
| $10.01 – $20.00 | | 2 | | $13.96 | | 76 | | – | | – | | – | |
| $20.01 – $30.00 | | 3 | | $21.60 | | 53 | | 1 | | $22.55 | | 28 | |
| Greater than $30.01 | | 3 | | $42.59 | | 7 | | 3 | | $42.59 | | 7 | |
|
|
|
|
|
|
|
|
|
|
|
|
| |
| | | 8 | | $26.49 | | 44 | | 4 | | $35.20 | | 15 | |
|
|
|
|
|
|
|
|
|
|
|
|
| |
| 100 | Vodafone Group Plc Annual Report 2006 |
Back to Contents
Movements in non-vested shares during the year ended 31 March 2006 is as follows:
| | | | All Shares | | | | Other | | | | Total | |
| |
|
|
| |
|
|
| |
|
|
| |
| | | | Weighted | | | | Weighted | | | | Weighted | |
| | | | average fair | | | | average fair | | | | average fair | |
| | | | value at grant | | | | value at grant | | | | value at grant | |
| | Millions | | date | | Millions | | date | | Millions | | date | |
|
|
|
|
|
|
|
|
|
|
|
| |
| 1 April 2005 | 19 | | £1.11 | | 103 | | £1.07 | | 122 | | £1.08 | |
| Granted | 19 | | £1.27 | | 73 | | £1.22 | | 92 | | £1.23 | |
| Vested | (1 | ) | £1.12 | | (16 | ) | £1.04 | | (17 | ) | £1.04 | |
| Forfeited | (2 | ) | £1.19 | | (19 | ) | £1.02 | | (21 | ) | £1.04 | |
|
|
|
|
|
|
|
|
|
|
|
| |
| 31 March 2006 | 35 | | £1.19 | | 141 | | £1.16 | | 176 | | £1.17 | |
|
|
|
|
|
|
|
|
|
|
|
| |
|
| Fair value | | | | | | | | | | | | |
| | | | ADS Options | | | | | | Ordinary Share Options | |
| |
|
|
| |
|
|
|
|
| |
| | | | | | Board of directors and | | | | | |
| | | | Other | | and Executive Committee | | | | Other | |
| |
|
|
| |
| |
|
|
| |
| | 2006 | | 2005 | | 2006 | | 2005 | | 2006 | | 2005 | |
|
|
|
|
|
|
|
|
|
|
|
| |
| Expected life of option (years) | 8 – 9 | | 6 – 7 | | 6 – 7 | | 5 – 6 | | 8 – 9 | | 6 – 7 | |
| Expected share price volatility | 17.9 –18.9% | | 25.6 – 26.6% | | 17.6 –18.6% | | 24.3 – 25.3% | | 17.9 –18.9% | | 25.6 – 26.6% | |
| Dividend yield | 2.8 – 3.2% | | 1.7 – 2.1% | | 2.6 – 3% | | 1.7 – 2.1 % | | 2.8 – 3.2% | | 1.7 – 2.1% | |
| Risk free rates | 4.2% | | 5.1% | | 4.2% | | 5.2% | | 4.2% | | 5.1% | |
| Exercise price | £1.36 | | £1.40 | | £1.45 | | £1.40 | | £1.36 | | £1.40 | |
|
|
|
|
|
|
|
|
|
|
|
| |
|
The fair value of the options is estimated at the date of grant using a lattice-based option valuation model (i.e. binomial model) that uses the assumptions noted in the above table. Lattice-based option valuation models incorporate ranges of assumptions for inputs and those ranges are disclosed above. The executive options have a market based performance condition attached and hence the assumptions are disclosed separately.
The Group uses historical data to estimate option exercise and employee termination within the valuation model; seperate groups of employees that have similar historical exercise behaviour are considered separately for valuation purposes. The expected life of options granted is derived from the output of the option valuation model and represents the period of time that options granted are expected to be outstanding; the range given above results from certain groups of employees exhibiting different behaviour. Expected volatilities are based on implied volatilities as determined by a simple average of no less than three international banks excluding the highest and lowest numbers. The risk-free rates for periods within the contractual life of the option are based on the UK gilt yield curve in effect at the time of grant.
Shares used for the Group’s employee incentive plans can be newly issued shares, shares held in treasury or market purchased shares either through the Company's employee benefit trust or direct from the market or a combination of sources. The source of the shares is determined by the Company having regard to what is considered the most efficient source at the relevant time.
Some share awards have an attached market condition, based on Total Shareholder Return (“TSR”), which is taken into account when calculating fair value of the share awards. The valuation methodology for the TSR was based on Vodafone’s ranking within the same group of companies (where possible) over the past 10 years. The volatility of the ranking over a three year period was used to determine the probability weighted percentage number of shares that could be expected to vest and hence affect fair value.
Other information
The weighted average grant-date fair value of options granted during the year 2006 was £0.30 (2005: £0.34). The total intrinsic value of options exercised during the year ended 31 March 2006 was £164 million (2005: £28 million). The aggregate intrinsic value of fully vested share options outstanding at the year end was £68 million and the aggregate intrinsic value of fully vested share options exercisable at the year end was £58 million. Cash received from the exercise of options under share options schemes was £356 million and the tax benefit realised from options exercised during the annual period was £24 million.
The total fair value of shares vested during the year ended 31 March 2006 was £18 million (2005: £5 million).
The compensation cost that has been charged against income in respect of share options and share plans for continuing operations was £109 million (2005: £130 million), which is comprised entirely of equity-settled transactions. Including discontinued operations, the compensation cost charged against income in respect of share options and share plans in total was £114 million (2005: £137 million). The total income tax benefit recognised in the consolidated income statement was £50 million (2005: £17 million). Compensation costs capitalised during the years ended 31 March 2006 and 31 March 2005 were insignificant. As of 31 March 2006, there was £162 million of total compensation cost relating to non-vested awards not yet recognised, which is expected to be recognised over a weighted average period of two years.
No cash was used to settle equity instruments granted under share-based payment schemes.
The average share price for the financial year was 136 pence.
| Vodafone Group Plc Annual Report 2006 | 101 |
Back to Contents
Notes to the Consolidated Financial Statements
continued
21. Transactions with equity shareholders
| | | | Capital | | | | | |
| | Share premium | | redemption | | Own shares | | Additional paid | |
| | account | | reserve | | held | | in capital | |
| | £m | | £m | | £m | | £m | |
|
|
|
|
|
|
|
| |
| 1 April 2004 | 52,154 | | – | | (1,136 | ) | 99,950 | |
| Issue of new shares | 130 | | – | | – | | (28 | ) |
| Purchase of own shares | – | | – | | (3,997 | ) | – | |
| Own shares released on vesting of share awards | – | | – | | 12 | | – | |
| Share-based payment charge, inclusive of tax credit of £22 million | – | | – | | – | | 159 | |
|
|
|
|
|
|
|
| |
| 31 March 2005 | 52,284 | | – | | (5,121 | ) | 100,081 | |
| Issue of new shares | 152 | | – | | – | | (44 | ) |
| Purchase of own shares | – | | – | | (6,500 | ) | – | |
| Own shares released on vesting of share awards | 8 | | – | | 370 | | (8 | ) |
| Cancellation of own shares held | – | | 128 | | 3,053 | | – | |
| Share-based payment charge, inclusive of tax credit of £9 million | – | | – | | – | | 123 | |
|
|
|
|
|
|
|
| |
| 31 March 2006 | 52,444 | | 128 | | (8,198 | ) | 100,152 | |
|
|
|
|
|
|
|
| |
|
| 22. Movements in accumulated other recognised income and expense |
| | | | | | Available-for-sale | | | | | |
| | Translation | | Pensions | | investments | | Asset revaluation | | | |
| | reserve | | reserve | | reserve | | surplus | | Total | |
| | £m | | £m | | £m | | £m | | £m | |
|
|
|
|
|
|
|
|
|
| |
| 1 April 2004 | – | | – | | 233 | | – | | 233 | |
| Gains/(losses) arising in the year | 1,521 | | (102 | ) | 106 | | – | | 1,525 | |
| Tax effect | – | | 23 | | – | | – | | 23 | |
|
|
|
|
|
|
|
|
|
| |
| 31 March 2005 | 1,521 | | (79 | ) | 339 | | – | | 1,781 | |
| Gains/(losses) arising in the year | 1,486 | | (43 | ) | 710 | | 112 | | 2,265 | |
| Foreign exchange recycled on business disposal | 36 | | – | | – | | – | | 36 | |
| Tax effect | – | | 13 | | (5 | ) | – | | 8 | |
|
|
|
|
|
|
|
|
|
| |
| 31 March 2006 | 3,043 | | (109 | ) | 1,044 | | 112 | | 4,090 | |
|
|
|
|
|
|
|
|
|
| |
| 23. Movements in retained losses | | | | |
| | 2006 | | 2005 | |
| | £m | | £m | |
|
|
|
| |
| 1 April | (39,511 | ) | (43,930 | ) |
| (Loss)/profit for the financial year | (21,916 | ) | 6,410 | |
| Dividends (note 7) | (2,753 | ) | (1,991 | ) |
| Loss on issue of treasury shares | (123 | ) | – | |
| Cancellation of shares | (3,053 | ) | – | |
|
|
|
| |
| 31 March | (67,356 | ) | (39,511 | ) |
|
|
|
| |
|
| 24. Borrowings | | | | | | | | | | | | |
| | | | | | 2006 | | | | | | 2005 | |
| |
|
|
|
|
| |
|
|
|
|
| |
| | Short-term | | Long-term | | | | Short-term | | Long-term | | | |
| | borrowings | | borrowings | | Total | | borrowings | | borrowings | | Total | |
| | £m | | £m | | £m | | £m | | £m | | £m | |
|
|
|
|
|
|
|
|
|
|
|
| |
| Financial liabilities measured at amortised cost: | | | | | | | | | | | | |
| Bank loans | 58 | | 1,414 | | 1,472 | | 27 | | 1,214 | | 1,241 | |
| Bank overdrafts | 18 | | – | | 18 | | 43 | | – | | 43 | |
| Redeemable preference shares | – | | 902 | | 902 | | – | | 845 | | 845 | |
| Finance lease obligations | 7 | | 68 | | 75 | | 11 | | 130 | | 141 | |
| Bonds | – | | 3,928 | | 3,928 | | – | | 906 | | 906 | |
| Other liabilities | 1,840 | | 295 | | 2,135 | | 1,640 | | 202 | | 1,842 | |
| Loans in fair value hedge relationships | 1,525 | | 10,143 | | 11,668 | | 282 | | 9,893 | | 10,175 | |
|
|
|
|
|
|
|
|
|
|
|
| |
| | 3,448 | | 16,750 | | 20,198 | | 2,003 | | 13,190 | | 15,193 | |
|
|
|
|
|
|
|
|
|
|
|
| |
| 102 | Vodafone Group Plc Annual Report 2006 |
Back to Contents
Maturity of borrowings
The maturity profile of the Group’s non-derivative financial liabilities, using undiscounted cash flows and which, therefore, differs to both the carrying value and fair value, is as follows:
| | | | Redeemable | | Finance | | | | | | Loans in fair | | | |
| | Bank | | preference | | lease | | | | Other | | value hedge | | | |
| | loans | | shares | | obligations | | Bonds | | liabilities | | relationships | | Total | |
| | £m | | £m | | £m | | £m | | £m | | £m | | £m | |
|
|
|
|
|
|
|
|
|
|
|
|
|
| |
| Within one year | 58 | | 49 | | 12 | | 167 | | 1,858 | | 2,164 | | 4,308 | |
| In one to two years | 36 | | 49 | | 11 | | 2,044 | | 295 | | 1,521 | | 3,956 | |
| In two to three years | 36 | | 49 | | 11 | | 936 | | – | | 1,187 | | 2,219 | |
| In three to four years | 39 | | 49 | | 11 | | 55 | | – | | 5,548 | | 5,702 | |
| In four to five years | 1,290 | | 49 | | 10 | | 55 | | – | | 267 | | 1,671 | |
| In more than five years | 13 | | 1,387 | | 42 | | 1,375 | | – | | 7,428 | | 10,245 | |
|
|
|
|
|
|
|
|
|
|
|
|
|
| |
| | 1,472 | | 1,632 | | 97 | | 4,632 | | 2,153 | | 18,115 | | 28,101 | |
| Effect of discount/financing rates | – | | (730 | ) | (22 | ) | (704 | ) | – | | (6,447 | ) | (7,903 | ) |
|
|
|
|
|
|
|
|
|
|
|
|
|
| |
| 31 March 2006 | 1,472 | | 902 | | 75 | | 3,928 | | 2,153 | | 11,668 | | 20,198 | |
|
|
|
|
|
|
|
|
|
|
|
|
|
| |
| | | | | | | | | | | | | | | |
| Within one year | 27 | | 45 | | 21 | | 43 | | 1,683 | | 590 | | 2,409 | |
| In one to two years | 1,176 | | 45 | | 21 | | 43 | | 192 | | 2,143 | | 3,620 | |
| In two to three years | 4 | | 45 | | 20 | | 43 | | – | | 1,488 | | 1,600 | |
| In three to four years | 5 | | 45 | | 18 | | 43 | | – | | 1,056 | | 1,167 | |
| In four to five years | 8 | | 45 | | 17 | | 43 | | 10 | | 5,619 | | 5,742 | |
| In more than five years | 21 | | 1,323 | | 76 | | 1,196 | | – | | 4,806 | | 7,422 | |
|
|
|
|
|
|
|
|
|
|
|
|
|
| |
| | 1,241 | | 1,548 | | 173 | | 1,411 | | 1,885 | | 15,702 | | 21,960 | |
| Effect of discount/financing rates | – | | (703 | ) | (32 | ) | (505 | ) | – | | (5,527 | ) | (6,767 | ) |
|
|
|
|
|
|
|
|
|
|
|
|
|
| |
| 31 March 2005 | 1,241 | | 845 | | 141 | | 906 | | 1,885 | | 10,175 | | 15,193 | |
|
|
|
|
|
|
|
|
|
|
|
|
|
| |
|
| The maturity profile of the Group’s financial derivatives, using undiscounted cash flows, is as follows: |
| | | | 2006 | | | | 2005 | |
| |
|
|
| |
|
|
| |
| | Payable | | Receivable | | Payable | | Receivable | |
| | £m | | £m | | £m | | £m | |
|
|
|
|
|
|
|
| |
| Within one year | 14,012 | | 14,009 | | 5,701 | | 5,855 | |
| In one to two years | 609 | | 600 | | 412 | | 515 | |
| In two to three years | 545 | | 556 | | 391 | | 435 | |
| In three to four years | 456 | | 523 | | 345 | | 393 | |
| In four to five years | 332 | | 315 | | 273 | | 357 | |
| In more than five years | 2,839 | | 2,851 | | 2,045 | | 2,176 | |
|
|
|
|
|
|
|
| |
| | 18,793 | | 18,854 | | 9,167 | | 9,731 | |
|
|
|
|
|
|
|
| |
The currency split of the Group’s foreign exchange derivatives, all of which mature in less than one year, is as follows:
| | | | 2006 | | | | 2005 | |
| |
|
|
| |
|
|
| |
| | Payable | | Receivable | | Payable | | Receivable | |
| | £m | | £m | | £m | | £m | |
|
|
|
|
|
|
|
| |
| Sterling | – | | 2,971 | | 350 | | 920 | |
| Euro | 6,387 | | 157 | | 1,553 | | 66 | |
| US dollar | 3,646 | | 9,655 | | 1,258 | | 3,961 | |
| Japanese yen | 2,017 | | 190 | | 2,054 | | 141 | |
| Other | 1,323 | | 361 | | 91 | | 247 | |
|
|
|
|
|
|
|
| |
| | 13,373 | | 13,334 | | 5,306 | | 5,335 | |
|
|
|
|
|
|
|
| |
The £39 million net payable (2005: £29 million net receivable) foreign exchange financial instruments, in the table above, are split £69 million (2005: £13 million) within trade and other payables and £30 million (2005: £42 million) within trade and other receivables.
The present value of minimum lease payments under finance lease arrangements under which the Group has leased certain of its equipment is analysed as follows:
| | 2006 | | 2005 | |
| | £m | | £m | |
|
|
|
| |
| Within one year | 7 | | 11 | |
| In two to five years | 31 | | 64 | |
| In more than five years | 37 | | 66 | |
|
|
|
| |
| Vodafone Group Plc Annual Report 2006 | 103 |
Back to Contents
Notes to the Consolidated Financial Statements
continued
24. Borrowings continued
The fair value and carrying value of the Group’s financial liabilities, for short-term borrowings and long-term borrowings, is as follows:
| | Fair | | Fair | | Carrying | | Carrying | |
| | value | | value | | value | | value | |
| | 2006 | | 2005 | | 2006 | | 2005 | |
| | £m | | £m | | £m | | £m | |
|
|
|
|
|
|
|
| |
| Financial liabilities measured at amortised cost: | | | | | | | | |
| Bank loans | 58 | | 27 | | 58 | | 27 | |
| Bank overdrafts | 18 | | 43 | | 18 | | 43 | |
| Finance lease obligations | 7 | | 11 | | 7 | | 11 | |
| Other liabilities | 1,840 | | 1,640 | | 1,840 | | 1,640 | |
| Loans in fair value hedge relationships: | | | | | | | | |
| 1.27% Japanese yen 25bn bond due 2005 | – | | 124 | | – | | 124 | |
| 1.93% Japanese yen 25bn bond due 2005 | – | | 124 | | – | | 124 | |
| 6.35% US dollar 200m bond due 2005 | – | | 34 | | – | | 34 | |
| 0.83% Japanese yen bond due 2006 | 15 | | – | | 15 | | – | |
| 5.4% euro400m bond due 2006 | 281 | | – | | 293 | | – | |
| 5.75% euro1.5bn bond due 2006 | 1,063 | | – | | 1,091 | | – | |
| 7.5% US dollar 400m bond due 2006 | 126 | | – | | 126 | | – | |
|
|
|
|
|
|
|
| |
| Short-term borrowings | 3,408 | | 2,003 | | 3,448 | | 2,003 | |
|
|
|
|
|
|
|
| |
| Financial liabilities measured at amortised cost: | | | | | | | | |
| Bank loans | 1,414 | | 1,214 | | 1,414 | | 1,214 | |
| Redeemable preference shares | 902 | | 845 | | 902 | | 845 | |
| Finance lease obligations | 68 | | 130 | | 68 | | 130 | |
| Bonds: | | | | | | | | |
| US dollar FRN due June 2007 | 1,064 | | – | | 1,064 | | – | |
| US dollar FRN due December 2007 | 859 | | – | | 867 | | – | |
| Euro FRN due July 2008 | 873 | | – | | 875 | | – | |
| US dollar FRN due June 2011 | 201 | | – | | 202 | | – | |
| 5.125% euro 500m bond due 2015 | 366 | | 375 | | 376 | | 371 | |
| 5% euro 750m bond due 2018 | 540 | | 554 | | 544 | | 535 | |
| Other liabilities | 295 | | 202 | | 295 | | 202 | |
| Loans in fair value hedge relationships: | | | | | | | | |
| 0.83% Japanese yen 3bn bond due 2006 | – | | 15 | | – | | 15 | |
| 1.78% Japanese yen 25bn bond due 2006 | – | | 126 | | – | | 123 | |
| 5.4% euro 400m bond due 2006 | – | | 284 | | – | | 296 | |
| 5.75% euro 1.5bn bond due 2006 | – | | 1,080 | | – | | 1,102 | |
| 7.5% US dollar 400m bond due 2006 | – | | 120 | | – | | 115 | |
| 4.161% US dollar 150m bond due 2007 | 86 | | 79 | | 85 | | 79 | |
| 2.575% Japanese yen 25bn bond due 2008 | – | | 132 | | – | | 140 | |
| 3.95% US dollar 500m bond due 2008 | 281 | | 261 | | 281 | | 260 | |
| 4.625% euro 250m bond due 2008 | 178 | | 180 | | 172 | | 175 | |
| 5.5% euro 400m bond due 2008 | 34 | | 35 | | 34 | | 34 | |
| 6.25% sterling 250m bond due 2008 | 257 | | 258 | | 255 | | 255 | |
| 6.25% sterling 150m bond due 2008 | 154 | | 155 | | 145 | | 148 | |
| 6.65% US dollar 500m bond due 2008 | 147 | | 141 | | 140 | | 129 | |
| 4.625% euro 500m bond due 2008 | 316 | | 359 | | 355 | | 357 | |
| 4.25% euro 1.4bn bond due 2009 | 990 | | 1,000 | | 1,008 | | 1,017 | |
| 4.25% euro 500m bond due 2009 | 354 | | 357 | | 360 | | 364 | |
| 4.75% euro 3bn bond due 2009 | 624 | | 633 | | 593 | | 587 | |
| 2.0% Japanese yen 25bn bond due 2010 | – | | 131 | | – | | 121 | |
| 2.28% Japanese yen 25bn bond due 2010 | – | | 133 | | – | | 125 | |
| 2.50% Japanese yen 25bn bond due 2010 | – | | 135 | | – | | 121 | |
| 7.75% US dollar 2.75bn bond due 2010 | 1,702 | | 1,543 | | 1,693 | | 1,600 | |
| 5.5% US dollar 750m bond due 2011 | 428 | | – | | 430 | | – | |
| 3.625% euro 750m bond due 2012 | 505 | | – | | 514 | | – | |
| 5.0% US dollar 1bn bond due 2013 | 549 | | 513 | | 559 | | 528 | |
| 4.625% sterling 350m bond due 2014 | 333 | | – | | 349 | | – | |
| 5.375% US dollar 500m bond due 2015 | 307 | | 260 | | 274 | | 260 | |
| 5.375% US dollar 400m bond due 2015 | 220 | | 208 | | 220 | | 208 | |
| 5.0% US dollar 750m bond due 2015 | 419 | | – | | 415 | | – | |
| 5.75% US dollar 750m bond due 2016 | 423 | | – | | 427 | | – | |
| 4.625% US dollar 500m bond due 2018 | 258 | | 245 | | 260 | | 245 | |
| 5.625% sterling 250m bond due 2025 | 254 | | 253 | | 271 | | 258 | |
| 7.875% US dollar 750m bond due 2030 | 499 | | 496 | | 542 | | 512 | |
| 5.9% sterling 450m bond due 2032 | 477 | | 468 | | 480 | | 454 | |
| 6.25% US dollar 495m bond due 2032 | 293 | | 268 | | 281 | | 265 | |
|
|
|
|
|
|
|
| |
| Long-term borrowings | 16,670 | | 13,188 | | 16,750 | | 13,190 | |
|
|
|
|
|
|
|
| |
Fair values are calculated using discounted cash flows with a discount rate based upon forward interest rates available to the Group at the balance sheet date.
| 104 | Vodafone Group Plc Annual Report 2006 |
Back to Contents
Borrowing facilities
At 31 March 2006, the Group’s most significant committed borrowing facilities comprised two bank facilities of $5,925 million (£3,407 million) and $5,025 million (£2,890 million) expiring between two and five years and in more than five years, respectively (2005: two bank facilities of $5,525 million (£2,926 million) and $4,853 million (£2,570 million)), and a ¥259 billion (£1,265 million, 2005: ¥225 billion (£1,112 million)) term credit facility, which expires between two and five years. The bank facilities remained undrawn throughout the year and the ¥259 billion term credit facility was fully drawn down on 21 December 2005.
Under the terms and conditions of the $5,925 million and $5,025 million bank facilities, lenders have the right, but not the obligation, to cancel their commitment 30 days from the date of notification of a change of control of the Company and have outstanding advances repaid on the last day of the current interest period. The facility agreement provides for certain structural changes that do not affect the obligations of the Company to be specifically excluded from the definition of a change of control. This is in addition to the rights of lenders to cancel their commitment if the Company has committed an event of default. Substantially the same terms and conditions apply in the case of Vodafone Finance K.K.’s ¥259 billion term credit facility, although the change of control provision is applicable to any guarantor of borrowings under the term credit facility. As of 31 March 2006, the Company was the sole guarantor of the ¥259 billion term credit facility.
In addition to the above, certain of the Group’s subsidiaries had committed facilities at 31 March 2006 of £271 million (2005: £168 million) in aggregate, of which £65 million (2005: £77 million) was undrawn. Of the total committed facilities, £121 million (2005: £28 million) expires in less than one year, £109 million (2005: £100 million) expires between two and five years, and £41 million (2005: £40) expires in more than five years.
Redeemable preference shares
Redeemable preference shares comprise class D and E preferred shares issued by Vodafone Americas, Inc. An annual dividend of $51.43 per class D and E preferred share is payable quarterly in arrears. The dividend for the year amounted to £48 million (2005: £46 million). The aggregate redemption value of the class D and E preferred shares is $1.65 billion. The holders of the preferred shares are entitled to vote on the election of directors and upon each other matter coming before any meeting of the shareholders on which the holders of ordinary shares are entitled to vote. Holders are entitled to vote on the basis of twelve votes for each share of class D or E preferred stock held. The maturity date of the 825,000 class D preferred shares is 6 April 2020. The 825,000 class E preferred shares have a maturity date of 1 April 2020. The class D and E preferred shares have a redemption price of $1,000 per share plus all accrued and unpaid dividends.
Interest rate and currency of borrowings
| | | | | | Fixed rate borrowings | |
| | | | | |
| |
| | | | | | | | | | Weighted | |
| | | | | | | | | | average | |
| | | | Floating | | Fixed | | Weighted | | time for | |
| | Total | | rate | | rate | | average | | which rate is | |
| | borrowings | | borrowings | | borrowings | | interest rate | | fixed | |
| Currency | £m | | £m | | £m | | % | | Years | |
|
|
|
|
|
|
|
|
|
| |
| Sterling | 1,511 | | 1,511 | | – | | – | | – | |
| Euro | 6,941 | | 5,996 | | 945 | | 5.1 | | 10.8 | |
| US dollar | 8,905 | | 8,905 | | – | | – | | – | |
| Japanese yen | 1,296 | | 1,296 | | – | | – | | – | |
| Other | 1,545 | | 1,545 | | – | | – | | – | |
|
|
|
|
|
|
|
|
|
| |
| 31 March 2006 | 20,198 | | 19,253 | | 945 | | 5.1 | | 10.8 | |
|
|
|
|
|
|
|
|
|
| |
| Sterling | 1,123 | | 1,123 | | – | | – | | – | |
| Euro | 6,216 | | 5,238 | | 978 | | 5.0 | | 11.6 | |
| US dollar | 5,107 | | 5,107 | | – | | – | | – | |
| Japanese yen | 2,061 | | 2,061 | | – | | – | | – | |
| Other | 686 | | 686 | | – | | – | | – | |
|
|
|
|
|
|
|
|
|
| |
| 31 March 2005 | 15,193 | | 14,215 | | 978 | | 5.0 | | 11.6 | |
|
|
|
|
|
|
|
|
|
| |
Interest on floating rate borrowings is based on national LIBOR equivalents or government bond rates in the relevant currencies.
The figures shown in the tables above take into account interest rate swaps used to manage the interest rate profile of financial liabilities.
At 31 March 2006, the Group had entered into foreign exchange contracts to decrease its sterling and US dollar borrowings above by amounts equal to £2,971 million (2005: £570 million) and £6,009 million (2005: £2,703 million) respectively and to increase its euro, Japanese yen and other currency borrowings above by amounts equal to £6,230 million (2005: £1,487 million), £1,827 million (2005: £1,913 million) and £962 million (2005: £156 million decrease to other borrowings) respectively.
Further protection from euro and Japanese yen interest rate movements on debt is provided by interest rate swaps. At 31 March 2006 the Group had euro and Japanese yen denominated interest rate swaps for amounts equal to £1,536 million and £3,720 million respectively. The effective rates, which have been fixed, are 3.54% and 0.36% respectively. In addition the Group has entered into euro denominated forward starting interest rate swaps for amounts equal to £698 million, £2,793 million and £698 million, which cover the periods June 2007 to June 2008, June 2008 to June 2009 and September 2008 to September 2009 respectively. The effective rates, which have been fixed, range from 2.62% per annum to 3.02% per annum.
| Vodafone Group Plc Annual Report 2006 | 105 |
Back to Contents
Notes to the Consolidated Financial Statements
continued
24. Borrowings continued
Financial risk management
The Group’s treasury function provides a centralised service to the Group for funding, foreign exchange, interest rate management and counterparty risk management. Treasury operations are conducted within a framework of policies and guidelines authorised and reviewed annually by the Company’s Board of directors, most recently on 31 January 2006. A Treasury Risk Committee, comprising of the Group’s Chief Financial Officer, Group General Counsel and Company Secretary, Group Treasurer and Director of Financial Reporting, meets quarterly to review treasury activities and management information relating to treasury activities. In accordance with the Group treasury policy, a quorum for meetings is four members and either the Chief Financial Officer or Group General Counsel and Company Secretary must be present at each meeting. The Group accounting function, which does not report to the Group Treasurer, provides regular update reports of treasury activity to the Board of directors. The Group uses a number of derivative instruments that are transacted, for risk management purposes only, by specialist treasury personnel. The Group’s internal auditors review the internal control environment regularly. There has been no significant change during the financial year, or since the end of the year, to the types of financial risks faced by the Group or the Group’s approach to the management of those risks.
The Group’s policy is to borrow centrally, using a mixture of long term and short term capital market issues and borrowing facilities, to meet anticipated funding requirements. These borrowings, together with cash generated from operations, are on-lent or contributed as equity to certain subsidiaries. The Board of directors has approved three debt protection ratios, being: net interest to operating cash flow (plus dividends from associated undertakings); retained cash flow (operating cash flow plus dividends from associated undertakings less interest, tax, dividends to minorities and equity dividends) to net debt; and operating cash flow (plus dividends from associated undertakings) to net debt.
These internal ratios establish levels of debt that the Group should not exceed other than for relatively short periods of time and are shared with the Group’s debt rating agencies, being Moody’s, Fitch Ratings and Standard & Poor’s.
Liquidity risk
As at 31 March 2006, the Group had $10.9 billion committed undrawn bank facilities and $15 billion and £5 billion commercial paper programmes, that are supported by the $10.9 billion committed bank facilities, available to manage its liquidity.
Market risk
Interest rate management
Under the Group’s interest rate management policy, interest rates on monetary assets and liabilities are maintained on a floating rate basis, unless the forecast interest charge for the next eighteen months is material in relation to forecast results, in which case rates are fixed. In addition, fixing is undertaken for longer periods when interest rates are statistically low.
At 31 March 2006, 29% (2005: 31%) of the Group’s gross borrowings were fixed for a period of at least one year. A one hundred basis point fall or rise in market interest rates for all currencies in which the Group had borrowings at 31 March 2006 would increase or reduce profit before tax by approximately £91 million, including mark-to-market revaluations of interest rate and other derivatives and the potential interest on outstanding tax issues.
Foreign exchange management
As Vodafone’s primary listing is on the London Stock Exchange, its share price is quoted in sterling. Since the sterling share price represents the value of its future multi-currency cash flows, principally in euro, yen (until disposal of its Japan operation on 27 April 2006), sterling and US dollars, the Group has a policy to hedge external foreign exchange risks on transactions denominated in other currencies above certain de minimis levels.
The Group also maintains the currency of debt and interest charges in proportion with its expected future principal multi-currency cash flows. As such, at 31 March 2006,113% of net debt was denominated in currencies other than sterling (73% euro, 21% yen, 14% US dollar and 5% other), whilst 13% of net debt had been purchased forward in sterling in anticipation of sterling denominated shareholder returns via share purchases, dividends and B share distribution. This allows debt to be serviced in proportion to expected future cash flows and, therefore, provides a partial hedge against income statement translation exposure, as interest costs will be denominated in foreign currencies. A relative weakening in the value of sterling against certain currencies in which the Group maintains debt has resulted in an increase in net debt of £182 million from currency translation differences.
When the Group’s international net earnings for the year ended 31 March 2006 are retranslated assuming a 10% strengthening of sterling against all exchange rates, the operating profit for the year would have increased by £1,344 million (2005: reduced by
£645 million), and would have been reduced by £1,642 million (2005: increased by £789 million) if sterling weakened by 10%.
The change in equity due to a 10% fall or rise in sterling rates against all exchange rates for the translation of net investment hedging instruments would be a decrease of £1,669 million or an increase of £1,365 million. However, there would be no net impact on equity as there would be an offset in the currency translation of the foreign operation.
Credit risk
The Group considers its maximum exposure to credit risk to be as follows:
| | 2006 | | | 2005 | |
| | £m | | | £m | |
|
|
|
|
| |
| Bank deposits | 948 | | | 343 | |
| Money market fund investments | 1,841 | | | 2,708 | |
| Commercial paper investments | – | | | 512 | |
| Repurchase agreements | – | | | 206 | |
| Derivative financial instruments | 310 | | | 408 | |
|
|
|
|
| |
| | 3,099 | | | 4,177 | |
|
|
|
|
| |
Concentrations of credit risk with respect to trade receivables are limited due to the Group's customer base being large and unrelated. Due to this, management believes there is no further credit risk provision required in excess of the normal provision for bad and doubtful receivables (note 17).
The deposits shown in the table equate to the principal of the amount deposited. The foreign exchange transactions and interest rate swaps shown in the table have been marked-to-market.
For repurchase agreements, collateral equivalent to the investment value is satisfied by triple-A rated government and/or supranational instruments and collateral is replenished on a daily basis. In respect of financial instruments used by the Group’s treasury function, the aggregate credit risk the Group may have with one counterparty is limited by reference to the long term credit ratings assigned for that counterparty by Moody’s, Fitch Ratings and Standard & Poor’s. While these counterparties may expose the Group to credit losses in the event of non-performance, it considers the possibility of material loss to be acceptable because of this policy.
Consistent with development of its strategy, the Group is now targeting low single A long term credit ratings from Moody’s, Fitch Ratings and Standard & Poor’s having previously managed the capital structure at single A credit ratings. Credit ratings are not a recommendation to purchase, hold or sell securities, in as much as ratings do not comment on market price or suitability for a particular investor, and are subject to revision or withdrawal at any time by the assigning rating organisation. Each rating should be evaluated independently.
25. Post employment benefits
Background
As at 31 March 2006, the Group operated a number of pension plans for the benefit of its employees throughout the world, which vary depending on the conditions and practices in the countries concerned. The Group's pension plans are provided through both defined benefit and defined contribution arrangements. Defined benefit schemes provide benefits based on the employees' length of pensionable service and their final pensionable salary or other criteria. Defined contribution schemes offer employees individual funds that are converted into benefits at the time of retirement.
The principal defined benefit pension schemes are in the United Kingdom and Germany. The Group also operated defined benefit schemes in Japan, its discontinued operation, and in Sweden until it was disposed of on 5 January 2006. In addition, the Group operates defined benefit schemes in Greece, Ireland, Italy and the United States. Defined contribution pension schemes are provided in Australia, Belgium, Egypt, Germany, Greece, Hungary, Ireland, Italy, Malta, the Netherlands, New Zealand, Portugal, Spain, the United Kingdom and the United States. A defined contribution scheme is also operated in the Group’s discontinued operation in Japan. There is a post retirement medical plan in the United States for a small closed group of participants.
The Group accounts for its pension schemes in accordance with IAS 19, Employee Benefits (“IAS19”). The Group has also early adopted the amendment to IAS 19 that was published in December 2004 regarding actuarial gains and losses, group plans and disclosures.
Scheme liabilities are assessed by independent actuaries using the projected unit funding method and applying the principal actuarial assumptions set out below. Assets are shown at market value.
| 106 | Vodafone Group Plc Annual Report 2006 |
Back to Contents
The measurement date for the Group’s pension assets and obligations is 31 March. The measurement date for the Group’s net periodic cost is 31 March of the previous year. Actuarial gains and losses are recognised in the period in which they arise. Payments to defined contribution schemes are charged as an expense as they fall due.
In the UK, the majority of the UK employees are members of the Vodafone Group Pension Scheme (the “main scheme”), which was closed to new entrants from 1 January 2006. This is a tax approved defined benefit scheme, the assets of which are held in an external trustee-administered fund. The investment policy and strategy of the scheme is the responsibility of the plan trustees, who are required to consult with the Company as well as taking independent advice on key investment issues. In setting the asset allocation, the Trustees take into consideration a number of criteria, including the key characteristics of the asset classes, expected risk and return, the structure and term of the member liabilities, diversification of assets, minimum funding and solvency requirements, as well as the Company’s input on contribution requirements. The plan has a relatively low level of pensioner liabilities already in payment, meaning that the overall duration of plan liabilities is long term. A significant percentage of assets has currently been allocated to equities although this approach is reviewed regularly.
The main scheme is subject to quarterly funding updates by independent actuaries and to formal actuarial valuations at least every three years. The most recent formal triennial valuation of this scheme was carried out as at 31 March 2004.
As a result of the triennial actuarial valuation, the Group’s UK subsidiaries agreed to make a special lump sum contribution of £30 million (2005: £100 million) during the financial year. The special contributions brought the funding position to 99% at 31 March 2006.
There are a number of separate pension and associated arrangements in Germany. There is no requirement to fund liabilities, however the Group funds pension obligations via a Contractual Trust Arrangement, in a separate legal agreement. The investment policy and strategy is controlled by Group appointed trustees. The investment approach followed is similar to that adopted by the Trustees of the UK plan although a higher proportion of assets are allocated to bond securities than to equities, reflecting the more mature nature and shorter duration of the liability commitments. The German schemes are subject to annual valuations, with the last formal valuations having been completed at 31 March 2006.
| Income statement expense | | | | |
| 2006 | | 2005 | |
| £m | | £m | |
|
|
|
| |
| Defined contributions schemes | 28 | | 18 | |
| Defined benefit schemes | 52 | | 52 | |
|
|
|
| |
| Total amount charged to the income statement (note 34) | 80 | | 70 | |
|
|
|
| |
|
Defined benefit schemes
The most recent full formal actuarial valuations for defined benefit schemes have been updated by qualified independent actuaries for the financial year ended 31 March 2006 to provide the IAS 19 disclosures below.
| Major assumptions used | | | | | | | | | | | | |
| | Germany | | UK | | Other | (1) |
| |
|
|
| |
|
|
| |
|
|
| |
| | 2006 | | 2005 | | 2006 | | 2005 | | 2006 | | 2005 | |
| | % | | % | | % | | % | | % | | % | |
|
|
|
|
|
|
|
|
|
|
|
| |
| Weighted average actuarial assumptions used to determine | | | | | | | | | | | | |
| benefit obligations: | | | | | | | | | | | | |
| Rate of inflation | 1.9 | | 1.9 | | 2.8 | | 2.8 | | 2.0 | | 2.0 | |
| Rate of increase in salaries | 2.9 | | 2.9 | | 4.8 | | 4.8 | | 3.0 | | 2.9 | |
| Rate of increase in pensions in payment and deferred pensions | 1.9 | | 1.9 | | 2.8 | | 2.8 | | 2.0 | | 2.0 | |
| Discount rate | 4.4 | | 4.5 | | 4.9 | | 5.4 | | 4.6 | | 4.3 | |
|
|
|
|
|
|
|
|
|
|
|
| |
| Weighted average actuarial assumptions used to determine net | | | | | | | | | | | | |
| periodic benefit cost: | | | | | | | | | | | | |
| Rate of inflation | 1.9 | | 2.0 | | 2.8 | | 2.5 | | 2.0 | | 2.1 | |
| Rate of increase in salaries | 2.9 | | 3.0 | | 4.8 | | 4.5 | | 2.9 | | 3.0 | |
| Discount rate | 4.5 | | 5.3 | | 5.4 | | 5.5 | | 4.7 | | 4.4 | |
| Expected long term rate of return on plan assets during the year | 4.9 | | 5.3 | | 6.8 | | 6.9 | | 6.4 | | 6.4 | |
|
|
|
|
|
|
|
|
|
|
|
| |
| Expected rates of return: | | | | | | | | | | | | |
| Equities | 6.7 | | 6.6 | | 7.4 | | 7.7 | | 6.7 | | 6.6 | |
| Bonds | 4.0 | | 4.0 | | 4.4 | | 4.8 | | 4.0 | | 4.0 | |
| Other assets | 2.8 | | 2.1 | | – | | 4.9 | | 5.3 | | 2.8 | |
|
|
|
|
|
|
|
|
|
|
|
| |
| Note: | |
| (1) | Figures shown for other schemes represent weighted average assumptions of individual schemes. |
For the US post retirement medical plan, the immediate trend rate for valuing the dental benefits was 6.5 per cent, which is assumed to reduce gradually to 5.25 per cent in 2008. The immediate trend rate for medical benefits was 12.0 per cent, which is assumed to reduce gradually to 5.25 per cent in 2013.
The expected return on assets assumption is derived by considering the expected long term rates of return on plan investments. The overall rate of return is a weighted average of the expected returns of the individual investments made in the group plans. The long term rate of return on equities and property are derived from considering current “risk free” rates of return with the addition of an appropriate future “risk premium” from an analysis of historic returns in various countries. The long term rates of return on bonds and cash investments are set in line with market yields currently available at the balance sheet date.
Mortality and life expectancy assumptions used are consistent with those recommended by the individual scheme actuaries, and in accordance with statutory and local funding requirements. The mortality tables in Germany have been updated at 31 March 2006 in line with newly published tables.
| Vodafone Group Plc Annual Report 2006 | 107 |
Back to Contents
Notes to the Consolidated Financial Statements
continued
25. Post employment benefits continued
Charges made to the consolidated income statement and consolidated statement of recognised income and expense on the basis of the assumptions stated above:
| | Germany | | UK | | Other | | Total | |
| |
|
|
| |
|
|
| |
|
|
| |
|
|
| |
| 2006 | | 2005 | | 2006 | | 2005 | | 2006 | | 2005 | | 2006 | | 2005 | |
| | £m | | £m | | £m | | £m | | £m | | £m | | £m | | £m | |
|
|
|
|
|
|
|
|
|
|
|
|
|
|
|
| |
| Current service cost | 7 | | 6 | | 38 | | 37 | | 12 | | 10 | | 57 | | 53 | |
| Interest cost | 10 | | 9 | | 36 | | 26 | | 6 | | 6 | | 52 | | 41 | |
| Expected return on scheme assets | (9 | ) | (8 | ) | (44 | ) | (31 | ) | (4 | ) | (3 | ) | (57 | ) | (42 | ) |
|
|
|
|
|
|
|
|
|
|
|
|
|
|
|
| |
| Total included within staff costs (note 34) | 8 | | 7 | | 30 | | 32 | | 14 | | 13 | | 52 | | 52 | |
|
|
|
|
|
|
|
|
|
|
|
|
|
|
|
| |
Consolidated statement of recognised income and expense: | | | | | | | | | | | | | | | | |
| | | | | | | | | | | | | | | | | |
Total actuarial (gains)/losses recognised in consolidated statement of recognised income and expense | (5 | ) | 20 | | 56 | | 72 | | (8 | ) | 10 | | 43 | | 102 | |
|
|
|
|
|
|
|
|
|
|
|
|
|
|
|
| |
All actuarial gains and losses are recognised immediately.
Figures relating to the income statement are for continuing operations only.
The cumulative recognised actuarial losses for Germany, the UK and the other schemes was £15 million, £128 million and £2 million respectively.
Fair value of the assets and liabilities of the schemes
The amount included in the balance sheet arising from the Group’s obligations in respect of its defined benefit retirement schemes is as follows:
| | Germany | | UK | | Other | | Total | |
| |
|
|
| |
|
|
| |
|
|
| |
|
|
| |
| | 2006 | | 2005 | | 2006 | | 2005 | | 2006 | | 2005 | | 2006 | | 2005 | |
| | £m | | £m | | £m | | £m | | £m | | £m | | £m | | £m | |
|
|
|
|
|
|
|
|
|
|
|
|
|
|
|
| |
| Movement in assets: | | | | | | | | | | | | | | | | |
| 1 April | 181 | | 165 | | 628 | | 433 | | 65 | | 42 | | 874 | | 640 | |
| Reclassification as held for sale | – | | – | | – | | – | | (3 | ) | – | | (3 | ) | – | |
| Expected return on scheme assets | 9 | | 8 | | 44 | | 31 | | 4 | | 3 | | 57 | | 42 | |
| Actuarial gains/(losses) | 10 | | (1 | ) | 99 | | 23 | | 12 | | 2 | | 121 | | 24 | |
| Employer cash contributions | 11 | | 14 | | 65 | | 137 | | 9 | | 16 | | 85 | | 167 | |
| Member cash contributions | – | | – | | 10 | | 11 | | 1 | | 1 | | 11 | | 12 | |
| Benefits paid | (10 | ) | – | | (11 | ) | (7 | ) | (6 | ) | – | | (27 | ) | (7 | ) |
| Other movements | – | | (9 | ) | – | | – | | – | | – | | – | | (9 | ) |
| Exchange rate movements | 4 | | 4 | | – | | – | | 1 | | 1 | | 5 | | 5 | |
|
|
|
|
|
|
|
|
|
|
|
|
|
|
|
| |
| 31 March | 205 | | 181 | | 835 | | 628 | | 83 | | 65 | | 1,123 | | 874 | |
|
|
|
|
|
|
|
|
|
|
|
|
|
|
|
| |
| Movement in scheme liabilities: | | | | | | | | | | | | | | | | |
| 1 April | 213 | | 192 | | 619 | | 457 | | 166 | | 145 | | 998 | | 794 | |
| Reclassification as held for sale | – | | – | | – | | – | | (31 | ) | – | | (31 | ) | – | |
| Service cost | 7 | | 6 | | 38 | | 37 | | 12 | | 15 | | 57 | | 58 | |
| Interest cost | 10 | | 9 | | 36 | | 26 | | 6 | | 7 | | 52 | | 42 | |
| Member cash contributions | – | | – | | 10 | | 11 | | 1 | | 1 | | 11 | | 12 | |
| Actuarial (gains)/losses | 5 | | 19 | | 155 | | 95 | | 4 | | 12 | | 164 | | 126 | |
| Benefits paid | (10 | ) | (9 | ) | (11 | ) | (7 | ) | (6 | ) | (14 | ) | (27 | ) | (30 | ) |
| Other movements | – | | (9 | ) | – | | – | | (8 | ) | – | | (8 | ) | (9 | ) |
| Exchange rate movements | 4 | | 5 | | – | | – | | 4 | | – | | 8 | | 5 | |
|
|
|
|
|
|
|
|
|
|
|
|
|
|
|
| |
| 31 March | 229 | | 213 | | 847 | | 619 | | 148 | | 166 | | 1,224 | | 998 | |
|
|
|
|
|
|
|
|
|
|
|
|
|
|
|
| |
| Accumulated benefit obligation | 222 | | 208 | | 746 | | 545 | | 113 | | 151 | | 1,081 | | 904 | |
|
|
|
|
|
|
|
|
|
|
|
|
|
|
|
| |
| Analysis of net assets/(deficits): | | | | | | | | | | | | | | | | |
| Total fair value of scheme assets | 205 | | 181 | | 835 | | 628 | | 83 | | 65 | | 1,123 | | 874 | |
| Present value of funded scheme liabilities | (207 | ) | (191 | ) | (847 | ) | (619 | ) | (74 | ) | (108 | ) | (1,128 | ) | (918 | ) |
|
|
|
|
|
|
|
|
|
|
|
|
|
|
|
| |
| Net assets/(deficits) for funded schemes | (2 | ) | (10 | ) | (12 | ) | 9 | | 9 | | (43 | ) | (5 | ) | (44 | ) |
| Present value of unfunded scheme | | | | | | | | | | | | | | | | |
| liabilities | (22 | ) | (22 | ) | – | | – | | (74 | ) | (58 | ) | (96 | ) | (80 | ) |
|
|
|
|
|
|
|
|
|
|
|
|
|
|
|
| |
| Net assets/(deficits) | (24 | ) | (32 | ) | (12 | ) | 9 | | (65 | ) | (101 | ) | (101 | ) | (124 | ) |
|
|
|
|
|
|
|
|
|
|
|
|
|
|
|
| |
| Net assets/(deficits) are analysed as: | | | | | | | | | | | | | | | | |
| Assets | 10 | | 3 | | – | | 9 | | 9 | | – | | 19 | | 12 | |
| Liabilities | (34 | ) | (35 | ) | (12 | ) | – | | (74 | ) | (101 | ) | (120 | ) | (136 | ) |
|
|
|
|
|
|
|
|
|
|
|
|
|
|
|
| |
| |
| The funding policy for the German and UK schemes is reviewed on a systematic basis in consultation with the independent scheme actuary in order to ensure that the funding contributions from sponsoring employers are appropriate to meet the liabilities of the schemes over the long term. |
| |
| The deficit in respect of other schemes at 31 March 2006 primarily relates to internally funded schemes in Italy and the United States. |
| 108 | Vodafone Group Plc Annual Report 2006 |
Back to Contents
Actual return on scheme assets
| | Germany | | UK | | Other | | Total | |
| |
|
|
| |
|
|
| |
|
|
| |
|
|
| |
| | 2006 | | 2005 | | 2006 | | 2005 | | 2006 | | 2005 | | 2006 | | 2005 | |
| | £m | | £m | | £m | | £m | | £m | | £m | | £m | | £m | |
|
|
|
|
|
|
|
|
|
|
|
|
|
|
|
| |
| Actual return on scheme assets | 19 | | 7 | | 143 | | 54 | | 16 | | 5 | | 178 | | 66 | |
|
|
|
|
|
|
|
|
|
|
|
|
|
|
|
| |
| Analysis of scheme assets at | | | | | | | | | | | | | | | | |
| 31 March is as follows: | % | | % | | % | | % | | % | | % | | | | | |
|
|
|
|
|
|
|
|
|
|
|
|
| | | | |
| Equities | 34.1 | | 29.8 | | 79.9 | | 66.6 | | 85.0 | | 81.0 | | | | | |
| Bonds | 59.1 | | 63.6 | | 20.1 | | 16.7 | | 10.0 | | 9.7 | | | | | |
| Property | – | | – | | – | | – | | 5.0 | | 4.7 | | | | | |
| Other | 6.8 | | 6.6 | | – | | 16.7 | | – | | 4.6 | | | | | |
|
|
|
|
|
|
|
|
|
|
|
|
| | | | |
| | 100.0 | | 100.0 | | 100.0 | | 100.0 | | 100.0 | | 100.0 | | | | | |
|
|
|
|
|
|
|
|
|
|
|
|
| | | | |
| | | | | | | | | | | | | | | | | |
| The scheme has no investments in the Group’s equity securities or in property currently used by the Group. |
| |
| History of experience adjustments | | | | | | | | | | | | | | | | |
| | Germany | | UK | | Other | | Total | |
| |
|
|
| |
|
|
| |
|
|
| |
|
|
| |
| | 2006 | | 2005 | | 2006 | | 2005 | | 2006 | | 2005 | | 2006 | | 2005 | |
| | £m | | £m | | £m | | £m | | £m | | £m | | £m | | £m | |
|
|
|
|
|
|
|
|
|
|
|
|
|
|
|
| |
| Experience adjustments on | | | | | | | | | | | | | | | | |
| scheme liabilities: | | | | | | | | | | | | | | | | |
| Amount (£m) | (3 | ) | (3 | ) | (1 | ) | (56 | ) | – | | (1 | ) | (4 | ) | (60 | ) |
| Percentage of scheme liabilities (%) | 1% | | 1% | | – | | 9% | | – | | 1% | | – | | 6% | |
|
|
|
|
|
|
|
|
|
|
|
|
|
|
|
| |
| Experience adjustments on scheme assets: | | | | | | | | | | | | | | | | |
| Amount (£m) | 10 | | (1 | ) | 99 | | 23 | | 12 | | 2 | | 121 | | 24 | |
|
|
|
|
|
|
|
|
|
|
|
|
|
|
|
| |
| Percentage of scheme assets (%) | 5% | | 1% | | 12% | | 4% | | 14% | | 3% | | 11% | | 3% | |
|
|
|
|
|
|
|
|
|
|
|
|
|
|
|
| |
| | | | | | | | | | | | | | | | | |
| Expected contributions and benefit payments | | | | | | | | | |
| | | Germany | | UK | | Other | | Total | |
| |
|
|
|
|
|
|
| |
| | £m | | £m | | £m | | £m | |
|
|
|
|
|
|
|
|
| |
| Expected employer’s contributions in the year ending 31 March 2007 | | 16 | | 36 | | 9 | | 61 | |
|
|
|
|
|
|
|
|
| |
| Expected benefit payments in the year ending 31 March: | | | | | | | | | |
| 2007 | | 16 | | 11 | | 7 | | 34 | |
| 2008 | | 15 | | 11 | | 7 | | 33 | |
| 2009 | | 15 | | 11 | | 7 | | 33 | |
| 2010 | | 15 | | 12 | | 7 | | 34 | |
| 2011 | | 15 | | 12 | | 7 | | 34 | |
| 2012-2017 | | 76 | | 66 | | 38 | | 180 | |
|
|
|
|
|
|
|
|
| |
| | | | | | | | | | |
|
| 26. Provisions for liabilities and charges | | | | | | | | |
| | Asset | | | | | | | |
| | retirement | | | | Other | | | |
| | obligations | | Legal | | provisions | | Total | |
| | £m | | £m | | £m | | £m | |
|
|
|
|
|
|
|
| |
| 31 March 2005 | 160 | | 188 | | 199 | | 547 | |
| Reclassification as held for sale | (25 | ) | – | | – | | (25 | ) |
|
|
|
|
|
|
|
| |
| | 135 | | 188 | | 199 | | 522 | |
| Exchange movements | 4 | | 3 | | 3 | | 10 | |
| Amounts capitalised in the year | 14 | | – | | – | | 14 | |
| Amounts charged to the income statement | – | | 1 | | 38 | | 39 | |
| Utilised in the year - payments | (3 | ) | (74 | ) | (77 | ) | (154 | ) |
| Amounts released to the income statement | (2 | ) | (19 | ) | (6 | ) | (27 | ) |
|
|
|
|
|
|
|
| |
| 31 March 2006 | 148 | | 99 | | 157 | | 404 | |
|
|
|
|
|
|
|
| |
| | | | | | | | | |
|
| Provisions have been analysed between current and non-current as follows: | | | | |
| | 2006 | | 2005 | |
| | £m | | £m | |
|
|
|
| |
| Current liabilities | 139 | | 228 | |
| Non-current liabilities | 265 | | 319 | |
|
|
|
| |
| | 404 | | 547 | |
|
|
|
| |
| Vodafone Group Plc Annual Report 2006 | 109 |
Back to Contents
Notes to the Consolidated Financial Statements
continued
26. Provisions for liabilities and charges continued
Asset retirement obligations
In the course of the Group’s activities, a number of sites and other assets are utilised which are expected to have costs associated with exiting and ceasing their use. The associated cash outflows are generally expected to occur at the dates of exit of the assets to which they relate, which are long term in nature.
Legal
The Group is involved in a number of legal and other disputes, including notification of possible claims. The directors of the Company, after taking legal advice, have established provisions after taking into account the facts of each case. The timing of cash outflows associated with legal claims cannot be reasonably determined. For a discussion of certain legal issues potentially affecting the Group, refer to note 31 “Contingent liabilities”.
Other provisions
Other provisions primarily comprise amounts provided for property and restructuring costs. The associated cash outflows for restructuring costs are substantially short term in nature. The timing of the cash flows associated with property is dependent upon the remaining term of the associated lease.
27. Trade and other payables
| | 2006 | | 2005 | |
| | £m | | £m | |
|
|
|
| |
| Included within non-current liabilities: | | | | |
| Other payables | 61 | | 14 | |
| Derivative financial instruments | 148 | | 48 | |
| Accruals and deferred income | 357 | | 376 | |
|
|
|
| |
| | 566 | | 438 | |
|
|
|
| |
| Included within current liabilities: | | | | |
| Trade payables | 2,248 | | 3,013 | |
| Amounts owed to associated undertakings | 29 | | 8 | |
| Other taxes and social security payable | 412 | | 314 | |
| Derivative financial instruments | 71 | | 31 | |
| Other payables | 440 | | 470 | |
| Accruals and deferred income | 4,277 | | 4,197 | |
|
|
|
| |
| | 7,477 | | 8,033 | |
|
|
|
| |
Trade payables and accruals principally comprise amounts outstanding for trade purchases and ongoing operating expenses.
The fair values of the derivative financial instruments are calculated by discounting the future cash flows to net present values using appropriate market interest and foreign currency rates prevailing at the year end.
Included within “Derivative financial instruments” is the following:
| | 2006 | | 2005 | |
| | £m | | £m | |
|
|
|
| |
| Fair value hedges: | | | | |
| Interest rate swaps | 148 | | 48 | |
| Fair value through the income statement: | | | | |
| Interest rate swaps | 2 | | 18 | |
| Foreign exchange swaps | 69 | | 12 | |
| Foreign exchange forwards | – | | 1 | |
|
|
|
| |
| | 71 | | 31 | |
|
|
|
| |
| | 219 | | 79 | |
|
|
|
| |
| 110 | Vodafone Group Plc Annual Report 2006 |
Back to Contents
28. Acquisitions
The principal acquisitions made by the Group during the financial year are as follows:
Czech Republic and Romania – ClearWave N.V.
On 31 May 2005, the Group acquired 99.99% of the issued share capital of ClearWave N.V. for cash consideration of £1,905 million. ClearWave N.V. is the parent company of a group of companies involved in the provision of mobile telecommunications in the Czech Republic and Romania. This transaction has been accounted for by the purchase method of accounting.
| | Book | | Fair value | | Fair | |
| | value | | adjustments | | value | |
| | £m | | £m | | £m | |
|
|
|
|
|
| |
| Net assets acquired: | | | | | | |
| Intangible assets | 87 | | 770 | | 857 | (1) |
| Property, plant and equipment | 562 | | (23 | ) | 539 | |
| Inventory | 7 | | – | | 7 | |
| Trade and other receivables | 106 | | (12 | ) | 94 | |
| Cash and cash equivalents | 65 | | – | | 65 | |
| Deferred tax liabilities | – | | (129 | ) | (129 | ) |
| Short and long-term borrowings | (550 | ) | (64 | ) | (614 | ) |
| Current tax liabilities | (11 | ) | – | | (11 | ) |
| Trade and other payables | (153 | ) | (3 | ) | (156 | ) |
|
|
|
|
|
| |
| | 113 | | 539 | | 652 | |
|
|
|
|
| | |
| Minority interests | | | | | (2 | ) |
| Asset revaluation surplus(2) | | | | | (112 | ) |
| Goodwill | | | | | 1,367 | |
|
|
|
|
|
| |
| Total cash consideration (including £9 million of directly attributable costs) | | | | | 1,905 | |
|
|
|
|
|
| |
| Net cash outflow arising on acquisition: | | | | | | |
| Cash consideration | | | | | 1,905 | |
| Cash and cash equivalents acquired | | | | | (65 | ) |
|
|
|
|
|
| |
| | | | | | 1,840 | |
|
|
|
|
|
| |
| Notes: | | | | | | |
| (1) | Intangible assets consist of licences and spectrum fees of £461 million and other intangibles of £396 million. |
| (2) | The asset revaluation surplus relates to the recognition of the fair value of intangible assets on the Group’s existing 20.1% stake in MobiFon S.A. |
The goodwill is attributable to the profitability of the acquired business and the synergies expected to arise within those businesses after the Group's acquisition of ClearWave N.V.
The acquired entities and percentage of voting rights acquired was as follows:
| | % | |
|
| |
| MobiFon S.A. (renamed Vodafone Romania S.A.) | 78.99 | |
| Oskar Mobil a.s. | 99.87 | |
| ClearWave N.V. | 99.99 | |
| MobiFon Holdings B.V. | 99.99 | |
| Oskar Holdings N.V. (renamed Vodafone Oskar Holdings N.V.) | 99.99 | |
| Oskar Finance B.V. (renamed Vodafone Oskar Finance B.V.) | 99.99 | |
| ClearWave Services (Mauritius) Ltd. | 99.99 | |
|
| |
Results of the acquired entities have been consolidated in the income statement from the date of acquisition, 31 May 2005.
Subsequent to the completion of the acquisition on 31 May 2005, a further 0.9% of Vodafone Romania S.A. was acquired for consideration of £16 million.
From the dates of acquisition, these entities contributed a profit of £26 million to the net loss of the Group.
| Vodafone Group Plc Annual Report 2006 | 111 |
Back to Contents
Notes to the Consolidated Financial Statements
continued
28. Acquisitions continued
India – Bharti Airtel Limited
On 18 November 2005, the Group acquired a 5.61% direct interest in Bharti Airtel Limited (previously Bharti Tele-Ventures Limited) from Warburg Pincus LLC, and on 22 December 2005 the Group acquired a further 4.39% indirect interest in Bharti Airtel Limited, bringing the Group’s effective shareholding to 10.0%.
Total cash consideration was Rs.67 billion (£858 million).
| | Book | | Fair value | | Fair | |
| | value | | adjustments | | value | |
| | £m | | £m | | £m | |
|
|
|
|
|
| |
| Net assets acquired: | | | | | | |
| Intangible assets | 49 | | 345 | | 394 | (1) |
| Property, plant and equipment | 142 | | (1 | ) | 141 | |
| Inventory | 1 | | – | | 1 | |
| Trade and other receivables | 30 | | – | | 30 | |
| Cash and cash equivalents | 9 | | – | | 9 | |
| Deferred tax liabilities | (2 | ) | (126 | ) | (128 | ) |
| Short and long-term borrowings | (56 | ) | – | | (56 | ) |
| Current tax liabilities | – | | (2 | ) | (2 | ) |
| Trade and other payables | (73 | ) | (1 | ) | (74 | ) |
|
|
|
|
|
| |
| | 100 | | 215 | | 315 | |
|
|
|
|
| | |
| Goodwill | | | | | 543 | |
|
|
|
|
|
| |
| Total cash consideration (including £1 million of directly attributable costs) | | | | | 858 | |
|
|
|
|
|
| |
| | | | | | | |
| Net cash outflow arising on acquisition: | | | | | | |
| Cash consideration | | | | | 858 | |
| Cash and cash equivalents acquired | | | | | (9 | ) |
|
|
|
|
|
| |
| | | | | | 849 | |
|
|
|
|
|
| |
| Note: |
| (1) | Intangible assets consist of licences and spectrum fees of £343 million and other intangibles of £51 million. |
The goodwill is attributable to the profitability of the acquired business and the synergies expected to arise within those businesses after the Group's acquisition of the shares in Bharti Airtel Limited.
Results of the acquired entity have been proportionately consolidated in the income statement from the dates of acquisition.
From the date of acquisition, the entity contributed a loss of £8 million to the net loss of the Group.
| 112 | Vodafone Group Plc Annual Report 2006 |
Back to Contents
South Africa – VenFin Limited
On 26 January 2006, the Group announced that its offer to acquire a 100% interest in VenFin Limited (“VenFin”) had become wholly unconditional. VenFin’s principal asset was a 15% stake in Vodacom Group (Pty) Limited (“Vodacom”). At 31 March 2006, the Group held an effective economic interest in VenFin of 98.7% and an effective voting interest of 99.3%.
The combined cash consideration for the Group’s 98.7% economic interest in VenFin was ZAR15.8 billion (£1,458 million).
| | Book | | Fair value | | Fair | |
| | value | | adjustments | | value | |
| | £m | | £m | | £m | |
|
|
|
|
|
| |
| Net assets acquired: | | | | | | |
| Intangible assets | 24 | | 600 | | 624 | (1) |
| Property, plant and equipment | 216 | | – | | 216 | |
| Inventory | 8 | | – | | 8 | |
| Trade and other receivables | 74 | | – | | 74 | |
| Cash and cash equivalents | 14 | | – | | 14 | |
| Deferred tax liabilities | (1 | ) | (180 | ) | (181 | ) |
| Short and long-term borrowings | (36 | ) | – | | (36 | ) |
| Current tax liabilities | (20 | ) | – | | (20 | ) |
| Trade and other payables | (110 | ) | – | | (110 | ) |
|
|
|
|
|
| |
| | 169 | | 420 | | 589 | |
|
|
|
|
| | |
| Minority interests | | | | | (9 | ) |
| Goodwill | | | | | 878 | |
|
|
|
|
|
| |
| Total cash consideration (including £7 million of directly attributable costs) | | | | | 1,458 | |
|
|
|
|
|
| |
| | | | | | | |
| Net cash outflow arising on acquisition: | | | | | | |
| Cash consideration | | | | | 1,458 | |
| Cash and cash equivalents acquired | | | | | (14 | ) |
|
|
|
|
|
| |
| | | | | | 1,444 | |
|
|
|
|
|
| |
| Note: |
| (1) | Intangible assets consist of licences and spectrum fees of £391 million and other intangibles of £233 million. |
The goodwill is attributable to the profitability of the acquired business and the synergies expected to arise within that business after the Group's acquisition of VenFin.
Results of the acquired entities have been proportionately consolidated in the income statement from the date of acquisition.
From the date of acquisition, the acquired part of the entity contributed a loss of £30 million to the net loss of the Group.
On 20 April 2006, the Group completed the compulsory acquisition of the remaining minority shareholdings in VenFin, from which date the Group holds 100% of the issued share capital of VenFin. As a result, the Group holds 50% of the share capital of Vodacom.
Across the acquisitions mentioned above, the weighted average life of licences and spectrum fees is 10 years, the weighted average life of other intangible assets is five years and the weighted average of total intangibles is eight years.
Turkey – Telsim Mobil Telekomunikasyon
On 24 May 2006, the Group completed the acquisition of substantially all the assets and business of Telsim Mobil Telekomunikasyon (“Telsim”) from the Turkish Savings Deposit and Investment Fund. The cash paid on this date was US$4.67 billion (£2.6 billion). It is impracticable to provide further information due to the proximity of the acquisition date to the date of approval of the Consolidated Financial Statements.
Pro forma full year information
The following unaudited pro forma summary presents the Group as if all of the businesses acquired in the year to 31 March 2006 had been acquired on 1 April 2005 or 1 April 2004, respectively. The pro forma amounts include the results of the acquired companies, amortisation of the acquired intangibles assets recognised on acquisition and the interest expense on debt incurred as a result of the acquisition. The pro forma amounts do not include any possible synergies from the acquisition. The pro forma information is provided for comparative purposes only and does not necessarily reflect the actual results that would have occurred, nor is it necessarily indicative of future results of operations of the combined companies.
| | 2006 | | 2005 | |
| | £m | | £m | |
|
|
|
| |
| Revenue | 29,924 | | 27,709 | |
| (Loss) /profit for the financial year | (21,870 | ) | 6,239 | |
| (Loss) /profit attributable to equity shareholders | (21,966 | ) | 6,131 | |
| | | | | |
| | Pence per share | | Pence per share | |
|
|
|
| |
| Basic (loss)/earnings per share from continuing and discontinued operations | (35.09 | ) | 9.26 | |
| Diluted (loss)/earnings per share from continuing and discontinued operations(1) | (35.09 | ) | 9.23 | |
|
|
|
| |
|
| Note: |
| (1) | In the year ended 31 March 2006, there are no dilutive ordinary shares as the Group recorded a loss for the financial year. |
| Vodafone Group Plc Annual Report 2006 | 113 |
Back to Contents
Notes to the Consolidated Financial Statements
continued
29. Discontinued operations and disposals
Japan – Vodafone K.K.
On 17 March 2006, the Group announced an agreement to sell its 97.7% holding in Vodafone K.K. to SoftBank. The transaction completed on 27 April 2006 with the Group receiving cash of approximately ¥1.42 trillion (£6.9 billion) including the repayment of intercompany debt of ¥0.16 trillion (£0.8 billion). In addition, the Group received non-cash consideration with a fair value of approximately ¥0.23 trillion (£1.1 billion), comprised of preferred equity and a subordinated loan. SoftBank also assumed debt of approximately ¥0.13 trillion (£0.6 billion). Vodafone K.K. represented a separate geographical area of operation. On this basis, Vodafone K.K. has been treated as a discontinued operation.
| Income statement and segment analysis of discontinued operation | | | | |
| | 2006 | | 2005 | |
| | £m | | £m | |
|
|
|
| |
| Service revenue | 5,264 | | 5,610 | |
| Equipment and other revenue | 2,004 | | 1,786 | |
|
|
|
| |
| Segment revenue | 7,268 | | 7,396 | |
| Inter-segment revenue | (2 | ) | (1 | ) |
|
|
|
| |
| Net revenue | 7,266 | | 7,395 | |
| Operating expenses | (5,667 | ) | (5,417 | ) |
| Depreciation and amortisation(1) | (1,144 | ) | (1,314 | ) |
| Impairment loss | (4,900 | ) | – | |
|
|
|
| |
| Operating (loss)/profit | (4,445 | ) | 664 | |
| Non operating income and expense | – | | 13 | |
| Net financing costs | (3 | ) | (11 | ) |
|
|
|
| |
| (Loss)/profit before taxation | (4,448 | ) | 666 | |
| Taxation relating to performance of discontinued operations | 7 | | 436 | |
| Taxation relating to the classification of the discontinued operations | (147 | ) | – | |
|
|
|
| |
| (Loss)/profit for the financial year from discontinued operations | (4,588 | ) | 1,102 | |
|
|
|
| |
| | | | | |
| (Loss)/earnings per share from discontinued operations | | | | |
| | 2006 | | 2005 | |
| | Pence per share | | Pence per share | |
|
|
|
| |
| Basic (loss)/earnings per share | (7.35 | ) | 1.56 | |
| Diluted (loss)/earnings per share | (7.35 | ) | 1.56 | |
|
|
|
| |
| Note: |
| (1) | including gains and losses on disposal of fixed assets |
Assets and liabilities of disposal group at 31 March 2006
| | 2006 | | |
| | £m | | |
|
|
| |
| Intangible assets | 3,957 | | |
| Property, plant and equipment | 4,546 | | |
| Other investments | 29 | | |
| Cash and cash equivalents | 161 | | |
| Inventory | 131 | | |
| Trade and other receivables | 1,113 | | |
| Deferred tax asset | 655 | | |
|
|
| |
| Total assets | 10,592 | | |
|
|
| |
| | | | |
| Current taxation liability | (1 | ) | |
| Short and long-term borrowings | (677 | ) | |
| Trade and other payables | (1,579 | ) | |
| Deferred tax liabilities | (246 | ) | |
| Other liabilities | (40 | ) | |
|
|
| |
| Total liabilities | (2,543 | ) | |
|
|
| |
|
| 114 | Vodafone Group Plc Annual Report 2006 |
Back to Contents
| Cash flows from discontinued operations | | | | |
| | 2006 | | 2005 | |
| | £m | | £m | |
|
|
|
| |
| Net cash flows from operating activities | 1,651 | | 1,739 | |
| Net cash flows from investing activities | (939 | ) | (448 | ) |
| Net cash flows from financing activities | (536 | ) | (1,289 | ) |
|
|
|
| |
| Net increase in cash and cash equivalents | 176 | | 2 | |
| Cash and cash equivalents at the beginning of the financial year | 4 | | 3 | |
| Exchange loss on cash and cash equivalents | (19 | ) | (1 | ) |
|
|
|
| |
| Cash and cash equivalents at the end of the financial year | 161 | | 4 | |
|
|
|
| |
|
Sweden – Europolitan Vodafone AB
On 5 January 2006, the Group completed the disposal of its 100% interest in Europolitan Vodafone AB to Telenor Mobile Holding AS. The assets and liabilities of Europolitan Vodafone AB at the date of disposal, and the cash effects of the transaction, were as follows:
| | £m | |
|
| |
| Intangible assets | 171 | |
| Property, plant and equipment | 581 | |
| Inventory | 10 | |
| Trade and other receivables | 155 | |
| Cash and cash equivalents | (5 | ) |
| Deferred tax liabilities | (77 | ) |
| Short and long term borrowings | (20 | ) |
| Trade and other payables | (157 | ) |
|
| |
| Net assets disposed of | 658 | |
| | | |
| Total cash consideration | 653 | |
| Other effects(1) | 8 | |
|
| |
| Net gain on disposal | 3 | |
|
| |
| | | |
| Net cash inflow arising on disposal: | | |
| Cash consideration | 653 | |
| Cash and cash equivalents disposed of | 5 | |
|
| |
| | 658 | |
|
| |
| Note: |
| (1) | Other effects include the recycling of currency translation on disposal and professional fees related to the disposal. |
| Vodafone Group Plc Annual Report 2006 | 115 |
Back to Contents
Notes to the Consolidated Financial Statements
continued
30. Commitments
Operating lease commitments
The Group has entered into commercial leases on certain properties, network infrastructure, motor vehicles and items of machinery. The leases have various terms, escalation clauses, purchase options and renewal rights.
Future minimum lease payments under non-cancellable operating leases comprise:
| | 2006 | | 2005 | |
| | £m | | £m | |
|
|
|
| |
| Within one year | 654 | | 662 | |
| In more than one year but less than two years | 509 | | 456 | |
| In more than two years but less than three years | 447 | | 403 | |
| In more than three years but less than four years | 397 | | 351 | |
| In more than four years but less than five years | 345 | | 305 | |
| In more than five years | 1,292 | | 1,170 | |
|
|
|
| |
| | 3,644 | | 3,347 | |
|
|
|
| |
In addition to the amounts disclosed above as at 31 March 2006, there were additional operating lease commitments of £120 million relating to the Group’s discontinued operations in Japan, which were sold on 27 April 2006.
The total of future minimum sublease payments expected to be received under non-cancellable subleases is £60 million (2005: £51 million).
Capital and other financial commitments
| | | | Group | | Share of joint ventures | |
| |
|
|
| |
| |
| | 2006 | | 2005 | | 2006 | | 2005 | |
| | £m | | £m | | £m | | £m | |
|
|
|
|
|
|
|
| |
| Contracts placed for future capital expenditure not provided in the financial statements:(1)(2) | 651 | | 656 | | 162 | | 121 | |
| Purchase commitments(2) | 996 | | 1,201 | | 163 | | 80 | |
| Share purchase programme | – | | 565 | | – | | – | |
| Purchase of MobiFon and Oskar | – | | 1,858 | | – | | – | |
| Purchase of Telsim(3) | 2,600 | | – | | – | | – | |
|
|
|
|
|
|
|
| |
| | 4,247 | | 4,280 | | 325 | | 201 | |
|
|
|
|
|
|
|
| |
| Notes: |
| (1) | Commitment includes contracts placed for property, plant and equipment and intangible assets. |
| (2) | In addition to the amounts disclosed above as at 31 March 2006, there were additional commitments of £90 million for future capital expenditure and £368 million other purchase commitments relating to the Group’s discontinued operations in Japan, which were sold on 27 April 2006. |
| (3) | In addition to the consideration price of $4.67 billion (approximately £2.6 billion), the Group will be required to pay approximately $0.4 billion of VAT which will be recoverable against Telsim's future VAT liabilities. The Group expects to recover this payment over the short to medium term. |
| 116 | Vodafone Group Plc Annual Report 2006 |
Back to Contents
31. Contingent liabilities
| | 2006 | | 2005 | |
| | £m | | £m | |
|
|
|
| |
| Performance bonds | 189 | | 382 | |
| Credit guarantees – third party indebtedness | 64 | | 67 | |
| Other guarantees and contingent liabilities | 19 | | 18 | |
|
|
|
| |
Performance bonds
Performance bonds require the Group to make payments to third parties in the event that the Group does not perform what is expected of it under the terms of any related contracts.
Group performance bonds include £152 million (2005: £149 million) in respect of undertakings to roll out 3G networks in Spain and £nil (2005: £189 million) in respect of undertakings to roll out 2G and 3G networks in Germany.
Credit guarantees – third party indebtedness
Credit guarantees comprise guarantees and indemnities of bank or other facilities including those in respect of the Group’s associated undertakings and investments.
Other guarantees and contingent liabilities
Other guarantees principally comprise commitments to support disposed entities.
In addition to the amounts disclosed above, the Group has guaranteed financial indebtedness and issued performance bonds for £33 million (2005: £36 million) in respect of businesses which have been sold and for which counter indemnities have been received from the purchasers.
The Group also enters into lease arrangements in the normal course of business, which are principally in respect of land, buildings and equipment. Further details on the minimum lease payments due under non-cancellable operating lease arrangements can be found in note 30.
Legal proceedings
The Company and its subsidiaries are currently, and may be from time to time, involved in a number of legal proceedings, including inquiries from or discussions with governmental authorities, that are incidental to their operations. However, save as disclosed below, the Company and its subsidiaries are not involved currently in any legal or arbitration proceedings (including any governmental proceedings which are pending or known to be contemplated) which may have, or have had in the twelve months preceding the date of this report, a significant effect on the financial position or profitability of the Company and its subsidiaries.
The Company is a defendant in four actions in the United States alleging personal injury, including brain cancer, from mobile phone use. In each case, various other carriers and mobile phone manufacturers are also named as defendants. These actions are at an early stage and no accurate quantification of any losses which may arise out of the claims can therefore be made as at the date of this report. The Company is not aware that the health risks alleged in such personal injury claims have been substantiated and will be vigorously defending such claims.
In 2002, a class action lawsuit was brought in the United States District Court for the Southern District of New York against the Company and certain of its officers and directors under Sections 10(b) and 20(a) of the Securities Exchange Act of 1934 and Rule 10b-5 thereunder alleging principally that Vodafone had improperly delayed taking and disclosing goodwill impairment losses relating to certain fixed line and non-controlled mobile assets that Vodafone reported in the financial year ended 31 March 2002. Vodafone firmly denied any wrongdoing and believes the allegations are wholly without merit. On 4 March 2005, the parties entered into a definitive settlement agreement for a cash payment by Vodafone and its insurance carriers of $24.5 million, before fees and expenses, which was approved by the Court on 15 July 2005. The settlement, which covers all current and former defendants, does not involve any admission or evidence of wrongdoing by any of them. The plaintiffs’ application for reimbursement of costs and an award of attorneys’ fees to be paid form the settlement fund remains pending.
A subsidiary of the Company, Vodafone 2, is responding to an enquiry (“the Vodafone 2 enquiry”) by the UK Inland Revenue (now called “Her Majesty’s Revenue and Customs” and hereinafter referred to as “HMRC”) with regard to the UK tax treatment of its Luxembourg holding company, Vodafone Investments Luxembourg SARL (“VIL”), under the Controlled Foreign Companies section of the UK’s Income and Corporation Taxes Act 1988 (“the CFC Regime”) relating to the tax treatment of profits earned by the holding company for the accounting period ended 31 March 2001. Vodafone 2’s position is that it is not liable to corporation tax in the UK under the CFC Regime in respect of VIL. Vodafone 2 asserts, inter alia, that the CFC Regime is contrary to EU law and has made an application to the Special Commissioners of HMRC for closure of the Vodafone 2 enquiry. On 3 May 2005, the Special Commissioners referred certain questions relating to the compatability of the CFC Regime with EU law to the European Court of Justice (the “ECJ”) for determination. Vodafone 2’s application for closure has been stayed pending delivery of the ECJ’s judgment. In its judgement, the ECJ will only determine questions referred to it and does not have jurisdiction to determine the outcome of Vodafone 2’s application. Instead, the Special Commissioners will apply the ECJ’s judgement to the particular facts of Vodafone 2’s application. Although it is not possible to address all possible outcomes, it should be noted that even if the CFC Regime is held by the ECJ to be entirely lawful, Vodafone 2 would continue to resist the imposition of corporation tax liability on other grounds. On 15 June 2005, HMRC appealed to the High Court challenging the Special Commissioners’ decision to refer questions to the ECJ. This appeal was dismissed and HMRC has since appealed this dismissal to the Court of Appeal. A decision in the latter appeal is expected to be rendered in the second half of 2006. In addition to the Vodafone 2 enquiry, on 31 October 2005, HMRC commenced an enquiry into the residence of VIL which is ongoing (the “VIL enquiry”). VIL’s position is that it is resident for tax purposes solely in Luxembourg and therefore it is not liable for corporation tax in the UK. The Company has taken provisions, which at 31 March 2006 amounted to £2,098 million, for the potential UK corporation tax liability and related interest expense that may arise in connection with the Vodafone 2 and VIL enquiries, if the Company is not successful in its challenge of the CFC Regime. The provisions relate to the accounting period which is the subject of the proceedings described above as well as to accounting periods after 31 March 2001 to date.
The judgement of the ECJ is expected to be delivered at the beginning of 2007 at the earliest. In the absence of any material unexpected developments, the provisions are likely to be reassessed when the views of the ECJ become known.
| Vodafone Group Plc Annual Report 2006 | 117 |
Back to Contents
Notes to the Consolidated Financial Statements
continued
32. Reconciliation of net cash flows to operating activities
| | 2006 | | 2005 | |
| | £m | | £m | |
|
|
|
| |
| (Loss)/profit for the financial year from continuing operations | (17,233 | ) | 5,416 | |
| (Loss)/profit for the financial year from discontinued operations | (4,588 | ) | 1,102 | |
| Adjustments for(1): | | | | |
| Tax on profit | 2,520 | | 1,433 | |
| Depreciation and amortisation | 5,834 | | 5,517 | |
| Loss on disposal of property, plant and equipment | 88 | | 162 | |
| Non operating income and expense | 2 | | (6 | ) |
| Other income and expense | (15) | | – | |
| Investment income | (353 | ) | (303 | ) |
| Financing costs | 1,123 | | 900 | |
| Impairment losses | 28,415 | | 475 | |
| Share of result in associated undertakings | (2,428 | ) | (1,980 | ) |
|
|
|
| |
| Operating cash flows before movements in working capital | 13,365 | | 12,716 | |
| Decrease in inventory | 23 | | 17 | |
| Decrease/(increase) in trade and other receivables | 54 | | (321 | ) |
| Increase in payables | 81 | | 145 | |
|
|
|
| |
| Cash generated by operations | 13,523 | | 12,557 | |
| Tax paid | (1,682 | ) | (1,578 | ) |
|
|
|
| |
| Net cash flows from operating activities | 11,841 | | 10,979 | |
|
|
|
| |
| Note: | |
| (1) | Adjustments include amounts relating to continuing and discontinued operations. |
33. Directors and key management compensation
Directors
Aggregate emoluments of the directors of the Company were as follows:
| | 2006 | | 2005 | |
| | £m | | £m | |
|
|
|
| |
| Salaries and fees | 6 | | 6 | |
| Incentive schemes | 5 | | 4 | |
| Benefits | 2 | | 1 | |
|
|
|
| |
| | 13 | | 11 | |
|
|
|
| |
The aggregate gross pre-tax gain made on the exercise of share options in the year ended 31 March 2006 by directors who served during the year was less than £1 million (2005: £3 million).
Further details of directors’ emoluments can be found in “Board’s Report to Shareholders on Directors’ Remuneration – Remuneration for the year to 31 March 2006” on pages 61 to 69.
Key management compensation
Aggregate compensation for key management, being the directors and members of the Group Executive Committee, were as follows:
| | 2006 | | 2005 | |
| | £m | | £m | |
|
|
|
| |
| Short term employee benefits | 26 | | 18 | |
| Post-employment benefits: | | | | |
| Defined benefit schemes | 2 | | 2 | |
| Defined contribution schemes | 2 | | 1 | |
| Share-based payments | 16 | | 22 | |
|
|
|
| |
| | 46 | | 43 | |
|
|
|
| |
| 118 | Vodafone Group Plc Annual Report 2006 |
Back to Contents
34. Employees
An analysis of the average employee headcount by category of activity is shown below.
| | 2006 | | 2005 | |
| | Number | | Number | |
|
|
|
| |
| By activity: | | | | |
| Operations | 12,541 | | 11,923 | |
| Selling and distribution | 17,315 | | 16,410 | |
| Administration | 31,816 | | 29,426 | |
|
|
|
| |
| | 61,672 | | 57,759 | |
|
|
|
| |
| By segment: | | | | |
| Mobile telecommunications: | | | | |
| Germany | 10,124 | | 10,183 | |
| Italy | 7,123 | | 7,213 | |
| Spain | 4,052 | | 3,949 | |
| UK | 10,620 | | 11,260 | |
| Other Mobile Operations | 22,895 | | 18,858 | |
| Common functions | 2,628 | | 2,201 | |
|
|
|
| |
| | 57,442 | | 53,664 | |
|
|
|
| |
| Other operations: | | | | |
| Germany | 4,086 | | 4,095 | |
| Other | 144 | | – | |
|
|
|
| |
| | 4,230 | | 4,095 | |
|
|
|
| |
| Total continuing operations | 61,672 | | 57,759 | |
|
|
|
| |
| Discontinued operations: | | | | |
| Japan | 2,733 | | 3,033 | |
|
|
|
| |
| | | | | |
| The cost incurred in respect of these employees (including directors) was:(1) | | | | | | |
| | 2006 | | 2005 | |
| | £m | | £m | |
|
|
|
| |
| Continuing operations: | | | | |
| Wages and salaries | 1,879 | | 1,752 | |
| Social security costs | 242 | | 233 | |
| Share based payments | 109 | | 130 | |
| Other pension costs (see note 25) | 80 | | 70 | |
|
|
|
| |
| | 2,310 | | 2,185 | |
|
|
|
| |
| Note: |
| (1) | From continuing operations. The cost incurred in respect of employees (including directors) from discontinued operations was £155 million (2005: £191 million). |
35. Subsequent events
On 17 March 2006, the Group announced an agreement to sell its 97.7% holding in Vodafone Japan to SoftBank. The transaction completed on 27 April 2006, with the Group receiving cash of approximately ¥1.42 trillion (£6.9 billion) including the repayment of intercompany debt of ¥0.16 trillion (£0.8 billion). In addition, the Group received non-cash consideration with a fair value of approximately ¥0.23 trillion (£1.1 billion), comprised of preferred equity and a subordinated loan. SoftBank also assumed debt of approximately ¥0.13 trillion (£0.6 billion).
On 13 December 2005, the Group announced it had agreed to acquire substantially all the assets and business of Telsim Mobil Telekomunikasyon (“Telsim”) from the Turkish Savings Deposit and Investment Fund. The acquisition completed on 24 May 2006. The cash paid on this date was US$4.67 billion (£2.6 billion).
| Vodafone Group Plc Annual Report 2006 | 119 |
Back to Contents
Notes to the Consolidated Financial Statements
continued
36. Related party transactions
Transactions with joint ventures and associated undertakings
Transactions between the Company and its subsidiaries, joint ventures and associates represent related party transactions. Transactions with subsidiaries have been eliminated on consolidation. Transactions between the Company and its joint ventures are not material to the extent that they have not been eliminated through proportionate consolidation. Except as disclosed below, no material related party transactions have been entered into, during the year, which might reasonably affect any decisions made by the users of these Consolidated Financial Statements.
| | 2006 | | 2005 | |
| | £m | | £m | |
|
|
|
| |
| Transactions with associated undertakings: | | | | |
| Sales of goods and services | 288 | | 194 | |
| Purchase of goods and services | 268 | | 243 | |
|
|
|
| |
| Amounts owed to joint ventures included within short term borrowings(1) | 378 | | 1,142 | |
|
|
|
| |
| Note: |
| (1) | Loan arises through Vodafone Italy being part of a Group cash pooling arrangement. Interest is paid in line with short term market rates. |
Amounts owed by and owed to associated undertakings are disclosed within notes 17 and 27.
Dividends received from associated undertakings are disclosed in the consolidated cash flow statement.
Group contributions to pension schemes are disclosed in note 25.
Compensation paid to the Company’s Board of directors and members of the Executive Committee is disclosed in note 33.
Transactions with directors
During the year ended 31 March 2006, and as of 26 May 2006, neither any director nor any other executive officer, nor any associate of any director or any other executive officer, was indebted to the Company.
Since 1 April 2005, the Company has not been, and is not now, a party to any other material transaction, or proposed transactions, in which any member of the key management personnel (including directors, any other executive officer, senior manager, any spouse or relative of any of the foregoing, or any relative of such spouse), had or was to have a direct or indirect material interest.
37. Financial information of joint ventures and associated undertakings
Summary aggregated financial information of 50% or less owned entities accounted for using proportionate consolidation or under the equity method, extracted on a 100% basis from accounts prepared under IFRS at 31 March and for the years then ended, is set out below.
| | 2006 | | 2005 | |
| Entities classified as associated undertakings | £m | | £m | |
|
|
|
| |
| Revenue | 30,204 | | 25,141 | |
| Gross profit | 12,506 | | 12,358 | |
| Profit for the financial year | 5,768 | | 4,883 | |
|
|
|
| |
| Non-current assets | 42,776 | | 36,385 | |
| Current assets | 5,868 | | 5,763 | |
|
|
|
| |
| Total assets | 48,644 | | 42,148 | |
|
|
|
| |
| Current liabilities | 8,365 | | 11,475 | |
| Non-current liabilities | 9,367 | | 5,579 | |
|
|
|
| |
| Total liabilities | 17,732 | | 17,054 | |
|
|
|
| |
| Total equity shareholders’ funds | 29,951 | | 24,155 | |
| Minority interests | 961 | | 939 | |
|
|
|
| |
| Total equity and liabilities | 48,644 | | 42,148 | |
|
|
|
| |
| 120 | Vodafone Group Plc Annual Report 2006 |
Back to Contents
| | 2006 | | 2005 | |
| Entities classified as joint ventures | £m | | £m | |
|
|
|
| |
| Revenue | 4,919 | | 3,946 | |
| Gross profit | 2,071 | | 1,611 | |
| Profit for the financial year | 786 | | 658 | |
|
|
|
| |
| Non-current assets | 7,631 | | 2,983 | |
| Current assets | 1,389 | | 1,056 | |
|
|
|
| |
| Total assets | 9,020 | | 4,039 | |
|
|
|
| |
| Current liabilities | 2,384 | | 1,458 | |
| Non-current liabilities | 1,164 | | 362 | |
|
|
|
| |
| Total liabilities | 3,548 | | 1,820 | |
|
|
|
| |
| Total equity shareholders’ funds | 5,432 | | 2,207 | |
| Minority interests | 40 | | 12 | |
|
|
|
| |
| Total equity and liabilities | 9,020 | | 4,039 | |
|
|
|
| |
Summary aggregated financial information of Vodafone Omnitel N.V., extracted on a 100% basis from financial statements prepared under IFRS at 31 March and for the years then ended, is set out below.
| | 2006 | | 2005 | |
| | £m | | £m | |
|
|
|
| |
| Revenue | 5,619 | | 5,518 | |
| Gross profit | 2,995 | | 2,779 | |
| (Loss)/profit for the financial year | (2,134 | ) | 1,507 | |
|
|
|
| |
|---|
| Non-current assets | 20,280 | | 24,186 | |
| Current assets | 2,837 | | 6,117 | |
|
|
|
| |
| Total assets | 23,117 | | 30,303 | |
|
|
|
| |
| Current liabilities | 1,915 | | 1,719 | |
| Non-current liabilities | 78 | | 312 | |
|
|
|
| |
| Total liabilities | 1,993 | | 2,031 | |
|
|
|
| |
| Total equity shareholders’ funds | 21,124 | | 28,272 | |
|
|
|
| |
| Total equity and liabilities | 23,117 | | 30,303 | |
|
|
|
| |
| Vodafone Group Plc Annual Report 2006 | 121 |
Back to Contents
Notes to the Consolidated Financial Statements
continued
| 38. | US GAAP information |
| The following is a summary of the effects of the differences between US GAAP and IFRS. The unaudited translation of pounds sterling amounts into US dollars is provided solely for convenience based on the Noon Buying Rate on 31 March 2006 of $1.7393: £1. Amounts at 31 March 2005 and for the year then ended have been restated to give effect to the modified retrospective adoption of SFAS No. 123 (Revised 2004), discussed in (j) below. |
Net loss for the years ended 31 March
| | | | 2006 | | 2006 | | 2005 | |
| | | | | | | | Restated | |
| | Reference | | $m | | £m | | £m | |
|
|
|
|
|
|
|
| |
| Revenue (IFRS) | | | 51,048 | | 29,350 | | 26,678 | |
| Items (decreasing)/increasing revenues: | | | | | | | | |
| Discontinued operations | | | (1,642 | ) | (944 | ) | (1,108 | ) |
| Basis of consolidation | a | | (10,011 | ) | (5,756 | ) | (5,423 | ) |
| Connection revenue | b | | 1,924 | | 1,106 | | 1,223 | |
|
|
|
|
|
|
|
| |
| Revenue (US GAAP) | | | 41,319 | | 23,756 | | 21,370 | |
|
|
|
|
|
|
|
| |
| (Loss)/profit for the financial year (IFRS) | | | (37,953 | ) | (21,821 | ) | 6,518 | |
| | | | | | | | | |
| Items (increasing)/decreasing net loss: | | | | | | | | |
| Investments accounted for under the equity method | c | | (2,139 | ) | (1,230 | ) | (5,440 | ) |
| Connection revenue and costs | b | | 17 | | 10 | | 16 | |
| Goodwill and other intangible assets | d | | (24,870 | ) | (14,299 | ) | (15,534 | ) |
| Impairment losses | e | | 26,745 | | 15,377 | | 475 | |
| Amortisation of capitalised interest | f | | (188 | ) | (108 | ) | (105 | ) |
| Interest capitalised during the year | f | | 63 | | 36 | | 19 | |
| Other | g | | (74 | ) | (42 | ) | 99 | |
| Income taxes | h | | 15,483 | | 8,902 | | 6,680 | |
| Minority interests | i | | (165 | ) | (95 | ) | (108 | ) |
| Cumulative effect of change in accounting principle: post employment benefits | j | | – | | – | | (195 | ) |
| Cumulative effect of change in accounting principle: intangible assets | j | | – | | – | | (6,177 | ) |
|
|
|
|
|
|
|
| |
| Net loss (US GAAP) | | | (23,081 | ) | (13,270 | ) | (13,752 | ) |
|
|
|
|
|
|
|
| |
Shareholders’ equity at 31 March
| | | | | | | | | |
| | | | 2006 | | 2006 | | 2005 | |
| | | | | | | | Restated | |
| | Reference | | $m | | £m | | £m | |
|
|
|
|
|
|
|
| |
| Total equity (IFRS) | | | 148,383 | | 85,312 | | 113,648 | |
| Items (decreasing)/increasing shareholders’ funds: | | | | | | | | |
| Investments accounted for under the equity method | c | | (3,978 | ) | (2,287 | ) | (982 | ) |
| Connection revenue and costs | b | | (9 | ) | (5 | ) | (14 | ) |
| Goodwill and other intangible assets | d | | 56,618 | | 32,552 | | 31,714 | |
| Capitalised interest | f | | 2,510 | | 1,443 | | 1,529 | |
| Other | g | | 365 | | 210 | | 104 | |
| Income taxes | h | | (52,795 | ) | (30,354 | ) | (38,856 | ) |
| Minority interests | i | | 197 | | 113 | | 152 | |
|
|
|
|
|
|
|
| |
| Shareholders’ equity (US GAAP) | | | 151,291 | | 86,984 | | 107,295 | |
|
|
|
|
|
|
|
| |
| 122 | Vodafone Group Plc Annual Report 2006 |
Back to Contents
US GAAP condensed consolidated statement of operations
| | | | 2006 | | 2006 | | 2005 | |
| | | | | | | | Restated | |
| | Reference | | $m | | £m | | £m | |
|
|
|
|
|
|
|
| |
| Revenue | | | 41,319 | | 23,756 | | 21,370 | |
| Cost of sales | | | (48,920 | ) | (28,126 | ) | (27,803 | ) |
| Selling, general and administrative expense | | | (7,552 | ) | (4,342 | ) | (3,779 | ) |
|
|
|
|
|
|
|
| |
| Operating loss | | | (15,153 | ) | (8,712 | ) | (10,212 | ) |
| Share of results in investments accounted for under the equity method | | | (1,816 | ) | (1,044 | ) | (2,179 | ) |
| Non-operating income and expense | | | (1,151 | ) | (662 | ) | (465 | ) |
|
|
|
|
|
|
|
| |
| Loss before income taxes | | | (18,120 | ) | (10,418 | ) | (12,856 | ) |
| Income tax benefit | | | 5,614 | | 3,228 | | 4,994 | |
| Minority interests | | | (170 | ) | (98 | ) | (108 | ) |
|
|
|
|
|
|
|
| |
| Loss from continuing operations | | | (12,676 | ) | (7,288 | ) | (7,970 | ) |
| Discontinued operations, net of taxes | | | (10,405 | ) | (5,982 | ) | 590 | |
| Cumulative effect of changes in accounting principles, net of taxes | | | – | | – | | (6,372 | ) |
|
|
|
|
|
|
|
| |
| Net loss | | | (23,081 | ) | (13,270 | ) | (13,752 | ) |
|
|
|
|
|
|
|
| |
| | | | | | | | | |
| Basic and diluted loss per share: | | | Cents | | Pence | | Pence | |
| Loss from continuing operations | | | (20.25 | ) | (11.64 | ) | (12.03 | ) |
| Discontinued operations | | | (16.62 | ) | (9.56 | ) | 0.89 | |
| Cumulative effect of changes in accounting principles | | | – | | – | | (9.63 | ) |
|
|
|
|
|
|
|
| |
| Net loss | k | | (36.87 | ) | (21.20 | ) | (20.77 | ) |
|
|
|
|
|
|
|
| |
Discontinued operations
As discussed in note 29, the Group disposed of its interests in Vodafone Sweden during the year ended 31 March 2006. Vodafone Sweden has been classified as discontinued under US GAAP.
Summary of differences between IFRS and US GAAP
The Consolidated Financial Statements are prepared in accordance with IFRS, which differ in certain material respects from US GAAP. The differences that are material to the Group relate to the following:
a. Basis of consolidation
The basis of consolidation under IFRS differs from that under US GAAP. The Group has interests in several jointly controlled entities, the most significant being Vodafone Italy. Under IFRS, the Group reports its interests in jointly controlled entities using proportionate consolidation. The Group’s share of the assets, liabilities, income, expenses and cash flows of jointly controlled entities are combined with the equivalent items in the Consolidated Financial Statements on a line-by-line basis. Under US GAAP, the results and assets and liabilities of jointly controlled entities are incorporated in the Consolidated Financial Statements using the equity method of accounting. Under the equity method, investments in jointly controlled entities are carried in the consolidated balance sheet at cost as adjusted for post-acquisition changes in the Group’s share of the net assets of the jointly controlled entity, less any impairment in the value of the investment. The Group’s share of the assets, liabilities, income and expenses of jointly controlled entities which are included in the Consolidated Financial Statements are reported in note 13.
b. Connection revenues and costs
Under IFRS and, for transactions subsequent to 30 September 2003, under US GAAP, customer connection revenue is recognised together with the related equipment revenue to the extent that the aggregate equipment and connection revenue does not exceed the fair value of the equipment delivered to the customer. Any customer connection revenue not recognised together with related equipment revenue is deferred and recognised over the period in which services are expected to be provided to the customer.
For transactions prior to 1 October 2003, connection revenue under US GAAP is recognised over the period that a customer is expected to remain connected to a network. Connection costs directly attributable to the income deferred are recognised over the same period. Where connection costs exceed connection revenue, the excess costs were charged in the statement of operations immediately upon connection. The balances of deferred revenue and deferred charges as of 30 September 2003 continue to be recognised over the period that a customer is expected to remain connected to a network.
c. Investments accounted for under the equity method
This line item includes the net effect of IFRS to US GAAP adjustments affecting net loss and shareholders’ equity related to investments accounted for under the equity method, other than the cumulative effect of change in accounting principle related to intangible assets, which has been disclosed separately. The differences are:
Adjustment to the share of results in investments accounted for under the equity method
| | 2006 | | 2005 | |
| | £m | | £m | |
|
|
|
| |
| Goodwill and other intangible assets associated with investments accounted for under the equity method | (7,772 | ) | (8,864 | ) |
| Impairment loss | 3,600 | | – | |
| Income taxes | 2,863 | | 3,362 | |
| Other | 79 | | 62 | |
|
|
|
| |
| Total | (1,230 | ) | (5,440 | ) |
|
|
|
| |
|
Adjustments to the carrying value of investments accounted for under the equity method
| | 2006 | | 2005 | |
| | £m | | £m | |
|
|
|
| |
| Goodwill and other intangible assets associated with investments accounted for under the equity method | 9,539 | | 13,549 | |
| Income taxes | (11,997 | ) | (14,615 | ) |
| Other | 171 | | 84 | |
|
|
|
| |
| Total | (2,287 | ) | (982 | ) |
|
|
|
| |
|
| Vodafone Group Plc Annual Report 2006 | 123 |
Back to Contents
Notes to the Consolidated Financial Statements
continued
| 38. | US GAAP information continued |
| d. | Goodwill and other intangible assets |
| The differences related to goodwill and other intangible assets included in the reconciliations of net loss and shareholders’ equity relate to acquisitions prior to the Group’s adoption of SEC guidance issued on 29 September 2004. In determining the value of licences purchased in business combinations prior to 29 September 2004, the Group allocated the portion of the purchase price, in excess of the fair value attributed to the share of net assets acquired, to licences. The Group had previously concluded that the nature of the licences and the related goodwill acquired in business combinations was fundamentally indistinguishable. |
Following the adoption of the SEC guidance issued on 29 September 2004, the Group’s US GAAP accounting policy for initial and subsequent measurement of goodwill and other intangible assets, other than determination of impairment of goodwill and finite lived intangible assets, is substantially aligned to that of IFRS described in note 2. However, there are substantial adjustments arising prior to 29 September 2004 from different methods of transition to current IFRS and US GAAP as discussed below.
Goodwill arising before the date of transition to IFRS has been retained under IFRS at the previous UK GAAP amounts for acquisitions prior to 1 April 2004. The Group has assigned amounts to licences and customer bases under US GAAP as they meet the criteria for recognition separately from goodwill, while these had not been recognised separately from goodwill under UK GAAP because they did not meet the recognition criteria. Under US GAAP, goodwill and other intangible assets with indefinite lives are capitalised and not amortised, but tested for impairment at least annually. Intangible assets with finite lives are capitalised and amortised over their useful economic lives.
Under IFRS and US GAAP, the purchase price of a transaction accounted for as an acquisition is based on the fair value of the consideration. In the case of share consideration, under IFRS the fair value of such consideration is based on the share price on the date of exchange. Under US GAAP, the fair value of the share consideration is based on the average share price over a reasonable period of time before and after the proposed acquisition is agreed to and announced. This has resulted in a difference in the fair value of the consideration for certain acquisitions and consequently in the amount of goodwill capitalised under IFRS and US GAAP.
The Group’s accounting policy for testing goodwill and finite lived intangible assets for impairment under IFRS is discussed in note 2. For the purpose of goodwill impairment testing under US GAAP, the fair value of a reporting unit including goodwill is compared to its carrying value. If the fair value of a reporting unit is lower than its carrying value, the fair value of the goodwill within that reporting unit is compared to its respective carrying value, with any excess carrying value written off as an impairment loss. The fair value of the goodwill is the difference between the fair value of the reporting unit and the fair value of the identifiable net assets of the reporting unit. Intangible assets with finite lives are subject to periodic impairment tests when circumstances indicate that an impairment loss may exist. Where an asset’s (or asset group’s) carrying amount exceeds its sum of undiscounted future cash flows, an impairment loss is recognised in an amount equal to the amount by which the asset’s (or asset group’s) carrying amount exceeds its fair value, which is generally based on discounted cash flows.
As a result of the above, there are significant amounts reported as goodwill and not amortised under IFRS which are reported as licences, customers and deferred tax liabilities under US GAAP.
During the year ended 31 March 2005, the Group undertook a number of transactions, including a stake increase in Vodafone Hungary. Under US GAAP, these transactions have resulted in the Group assigning £65 million to intangible assets, of which £21 million was assigned to cellular licences and £20 million to customer bases. A corresponding deferred tax liability of £8 million was recognised. All intangible assets acquired, other than goodwill, are deemed to be of finite life, with a weighted average amortisation period of 8 years, comprising licences of 10 years and customer bases of 5 years.
| Finite-lived intangible assets | | | | |
| | 2006 | | 2005 | |
| Licences | £m | | £m | |
|
|
|
| |
| Gross carrying value | 154,135 | | 152,831 | |
| Accumulated amortisation | (75,170 | ) | (61,188 | ) |
|
|
|
| |
| | 78,965 | | 91,643 | |
|
|
|
| |
| | | | | |
| Customer bases | | | | |
|
|
|
| |
| Gross carrying value | 1,663 | | 5,952 | |
| Accumulated amortisation | (1,071 | ) | (5,333 | ) |
|
|
|
| |
| | 592 | | 619 | |
|
|
|
| |
The total amortisation charge for the year ended 31 March 2006, under US GAAP, was £15,011 million (2005: £15,400 million). The estimated future amortisation charge on finite-lived intangible assets for each of the next five years is set out in the following table. The estimate is based on finite-lived intangible assets recognised at 31 March 2006 using foreign exchange rates on that date. It is likely that future amortisation charges will vary from the figures below, as the estimate does not include the impact of any future investments, disposals, capital expenditures or fluctuations in foreign exchange rates.
| Year ending 31 March | £m | |
|
| |
| 2007 | 15,448 | |
| 2008 | 15,362 | |
| 2009 | 15,264 | |
| 2010 | 12,367 | |
| 2011 | 3,754 | |
|
| |
e. Impairment losses
As discussed in note 10, during the year ended 31 March 2006, the Group recorded impairment losses of £23,000 million in relation to the goodwill of Vodafone Germany and Vodafone Italy under IFRS. Under US GAAP, the Group evaluated the recoverability of the long-lived assets, comprised primarily of licences, in Vodafone Germany and Vodafone Italy using undiscounted cash flows and determined that the carrying amount of these assets was recoverable. As a result, the IFRS impairment losses of £23,000 million related to Vodafone Germany and Vodafone Italy were not recognised under US GAAP.
During the year ended 31 March 2006, the Group also recorded an impairment loss under IFRS of £515 million and £4,900 million in relation to the goodwill of Vodafone Sweden and Vodafone Japan, respectively. Under US GAAP, the Group recognised impairment losses of licences of £883 million and £8,556 million in Vodafone Sweden and in Vodafone Japan. As a result of these impairment losses, the Group released related deferred tax liabilities of £247 million and £3,508 million, which have been included in the adjustment for income taxes. The impairment losses on Vodafone Sweden’s and Vodafone Japan’s licences have been included in discontinued operations under US GAAP.
Cumulative cumulative foreign currency gains and losses arising on the translation of the assets and liabilities into sterling have been included in the carrying value of a discontinued operation when assessing that carrying value for impairment.
f. Capitalised interest
Under IFRS, the Group has adopted the benchmark accounting treatment for borrowing costs and, as a result, the Group does not capitalise interest costs on borrowings in respect of the acquisition or construction of tangible and intangible fixed assets. Under US GAAP, the interest costs of financing the acquisition or construction of network assets and other fixed assets is capitalised during the period of construction until the date that the asset is placed in service. Interest costs of financing the acquisition of licences are also capitalised until the date that the related network service is launched. Capitalised interest costs are amortised over the estimated useful lives of the related assets.
g. Other
Financial instruments
Under IFRS, the equity put rights and similar arrangements are classified as financial liabilities. The liabilities are measured as the present value of the estimated exercise prices of the equity put rights and similar arrangements, which is the fair value of the underlying shares on the date of exercise, with any changes in this estimate recognised in the consolidated income statement each period. Under US GAAP, these equity put rights and similar arrangements are generally classified as derivative instruments. Consequently, this financial liability is eliminated for US GAAP purposes and the equity put rights and similar arrangements are accounted for at fair value.
Pensions
Under both IFRS and US GAAP, the Group recognises actuarial gains and losses as they are incurred. Under IFRS, these gains and losses are recognised directly in equity. These gains and losses are included in the determination of net loss under US GAAP.
Other recognised income and expense
Under both IFRS and US GAAP, the cumulative foreign currency gains and losses arising on the translation of the assets and liabilities of entities with a functional currency other than sterling are reclassified from accumulated other recognised income and expense and included in the determination of profit for the period or net loss on sale or liquidation of a foreign entity. Differences in the amount reclassified arise due to differences in the carrying values of the underlying net assets and because the Group deemed the cumulative translation differences at the date of transition to IFRS to be zero.
| 124 | Vodafone Group Plc Annual Report 2006 |
Back to Contents
During the year ended 31 March 2006, £9 million of foreign currency losses were reclassified from other recognised income and expense and included in the determination of US GAAP net loss as a result of the disposal of Vodafone Sweden. During the year ended 31 March 2005, £63 million of foreign currency losses were reclassified from other recognised income and expense and included in the determination of US GAAP net loss as a result of the partial disposal of Vodafone Egypt. Under IFRS, these gains amounted to £36 million for the year ended 31 March 2006.
h. Income taxes
The most significant component of the income tax adjustment is due to temporary differences between the book basis and tax basis of intangible assets other than goodwill acquired in business combinations prior to 29 September 2004, resulting in the recognition of deferred tax liabilities under US GAAP. This line item also includes the tax effects of the other pre-tax IFRS to US GAAP adjustments described above.
Under IFRS, the Group does not recognise a deferred tax liability on the outside basis differences in its investment in associates to the extent that the Group controls the timing of the reversal of the difference and it is probable the difference will not reverse in the foreseeable future. Under US GAAP, the Group recognises deferred tax liabilities on these differences.
i. Minority interests
Minority interests are reported as a component of total equity under IFRS and, accordingly, profit for the period does not include an adjustment for profit for the period attributable to minority interests. Under US GAAP, minority interests are reported outside of shareholders’ equity and the minority interest in the income of consolidated subsidiaries is an adjustment to US GAAP net income.
j. Changes in accounting principles
Post employment benefits
During the second half of the year ended 31 March 2005, the Group amended its policy for accounting for actuarial gains and losses arising from its pension obligations effective 1 April 2004. Until 31 March 2004, the Group used a corridor approach under SFAS No. 87, “Employers’ Accounting for Pensions” in which actuarial gains and losses were deferred and amortised over the expected remaining service period of the employees. The Group now recognises these gains and losses through the income statement in the period in which they arise as the new policy more faithfully represents the Group’s financial position and more closely aligns the Group’s US GAAP policy to its IFRS policy of immediate recognition of these items.
The cumulative effect on periods prior to adoption of £288 million has been shown, net of tax of £93 million, as a cumulative effect of a change in accounting principle in the reconciliation of net loss. The effect of the change in the year ended 31 March 2005 was to increase loss from continuing operations by £55 million (or 0.08 pence per share).
Intangible assets
On 29 September 2004, the SEC Staff issued new guidance on the interpretation of SFAS No. 142 in relation to the valuation of intangible assets in business combinations and impairment testing. This guidance has been codified as EITF Topic D-108. Historically, the Group assigned to mobile licences the residual purchase price in business combinations in excess of the fair values of all assets and liabilities acquired other than mobile licences and goodwill. This approach was on the basis that mobile licences were indistinguishable from goodwill. The new SEC guidance requires the Group to distinguish between mobile licences and goodwill. However, the new guidance does not permit the amount historically reported as mobile licences to be subsequently reallocated between mobile licences and goodwill.
The new guidance will affect the allocation of the purchase price in future business combinations involving entities with mobile licences. The Group has applied the guidance relating to the allocation of purchase price to all business combinations consummated subsequent to 29 September 2004. This has resulted in values being assigned to licences using a direct valuation method, with any remaining residual purchase price allocated to goodwill.
In impairment testing of mobile licences associated with the Verizon Wireless equity method investment accounted for under SFAS No. 142, the Group has used a similar residual approach to determine the fair value of the licences when testing the asset for recoverability. In their announcement, the SEC Staff stated that the residual method of accounting for intangible assets should no longer be used and that companies should perform an impairment test using a direct method on all assets which were previously tested using a residual method. The Group’s licences in other businesses are not tested for recoverability using a residual method and are, therefore, not affected by the new guidance.
The Group completed its transitional impairment test of Verizon Wireless’ mobile licences as of 1 January 2005. This resulted in a pre-tax charge of £11,416 million. This impairment loss is included, net of the related tax of £5,239 million, in the cumulative effect of change in accounting principle in the reconciliation of net loss. The tax effect comprises the release of £1,220 million representing the Group’s share of Verizon Wireless’ deferred tax liabilities and £4,019 million deferred tax liabilities representing taxes recognised by the Group on its investment in Verizon Wireless. Fair value was determined as the present value of estimated future net cash flows allocable to the mobile licences. Verizon Wireless is included in the segment “Mobile telecommunications – US”.
Share-based payments
The Group adopted SFAS No. 123 (Revised 2004), “Share-based Payment”, and related FASB staff positions on 1 October 2005. SFAS No. 123 (Revised 2004) eliminates the option to account for share-based payments to employees using the intrinsic value method and requires share-based payments to be recorded using the fair value method. Under the fair value method, the compensation cost for employees and directors is determined at the date awards are granted and recognised over the service period.
Concurrent with the adoption of SFAS No. 123 (Revised 2004), the Group adopted Staff Accounting Bulletin (SAB) 107. SAB 107 summarises the views of the SEC Staff regarding the interaction between SFAS No. 123 (Revised 2004) and certain SEC rules and regulations and provides the staff’s views regarding the valuation of share-based payment arrangements for public companies.
The Group has adopted SFAS No. 123 (Revised 2004) using the modified retrospective method. Under this method, the Group has adjusted the financial statements for the periods between 1 April 1995 and 30 September 2005 to give effect to the fair value method of accounting for awards granted, modified or settled during those periods on a basis consistent with the pro forma amounts disclosed under the requirements of the original SFAS No. 123, “Accounting for Stock-Based Compensation”. The provisions of SFAS No. 123 (Revised 2004) will be applied to all awards granted, modified, or settled after 1 October 2005. The effect of applying the original provisions of SFAS No. 123 under the modified retrospective method of adoption on the year ended 31 March 2005 was to decrease loss before income taxes, loss from continuing operations and net loss by £66 million, £30 million and £30 million respectively (six months ended 30 September 2005: increases of £4 million, £8 million and £8 million respectively). The adjustment also had the effect of decreasing both basic and diluted loss per share from continuing operations and net loss by 0.05 pence (six months ended 30 September 2005: increase 0.01 pence). The adoption of SFAS No. 123 (Revised 2004) increased shareholders’ equity at 1 April 2004 by £112 million.
k. Loss per share
The share options and shares described in note 20 were excluded from the calculation of diluted loss per share as the effect of their inclusion in the calculation would be antidilutive due to the Group recognising a loss in all periods presented.
39. New accounting standards
The Group has not adopted the following standards, which have been issued by the IASB or the International Financial Reporting Interpretations Committee (“IFRIC”). The Group does not currently believe the adoption of these standards will have a material impact on the consolidated results or financial position of the Group.
| • | IAS Amendment, “Amendment to IAS 1, “Presentation of Financial Statements” – Capital Disclosures” (effective for annual periods beginning after 1 January 2007, with earlier application encouraged). |
| | |
| • | IFRIC 4, “Determining whether an Arrangements contains a Lease” (effective from 1 April 2006). |
| | |
| • | IFRIC 5, “Rights to Interests arising from Decommissioning, Restoration and Environmental Rehabilitation Funds” (effective from 1 April 2006). |
| | |
| • | IFRIC 6, “Liabilities arising from Participating in a Specific Market – Waste Electrical and Electronic Equipment” (effective from 1 April 2006). |
| | |
| • | IFRIC 7, “Applying the Restatement Approach under IAS 29, “Financial Reporting in Hyperinflationary Economies” (effective from 1 April 2006). |
| | |
| • | IFRIC 8, “Scope of IFRS 2” (effective for annual periods beginning on or after 1 May 2006, with early application encouraged). This interpretation has not yet been adopted for use in the EU. |
| | |
| • | IFRIC 9, “Reassessment of Embedded Derivatives” (effective for annual periods beginning on or after 1 June 2006, with early application encouraged). This interpretation has not yet been adopted for use in the EU. |
| Vodafone Group Plc Annual Report 2006 | 125 |
Back to Contents
Notes to the Consolidated Financial Statements
continued
40. Transition to IFRS on first-time adoption
Basis of preparation of IFRS financial information
The Group’s Annual Report for the year ended 31 March 2006 is the first annual Consolidated Financial Statements that comply with IFRS. The Consolidated Financial Statements have been prepared in accordance with the significant accounting policies described in note 2. The Group has applied IFRS 1, “First-time Adoption of International Financial Reporting Standards” in preparing these statements.
IFRS 1 exemptions
IFRS 1 sets out the procedures that the Group must follow when it adopts IFRS for the first time as the basis for preparing its Consolidated Financial Statements. The Group is required to establish its IFRS accounting policies as at 31 March 2006 and, in general, apply these retrospectively to determine the IFRS opening balance sheet at its date of transition, 1 April 2004. This standard provides a number of optional exemptions to this general principle. These are set out below, together with a description in each case of the exemption adopted by the Group.
Business combinations that occurred before the opening IFRS balance sheet
date (IFRS 3, “Business Combinations”)
The Group has elected not to apply IFRS 3 retrospectively to business combinations that took place before the date of transition. As a result, in the opening balance sheet, goodwill arising from past business combinations remains as stated under UK GAAP at 31 March 2004.
If the Group had elected to apply IFRS 3 retrospectively, the purchase consideration would have been allocated to the following major categories of acquired intangible assets and liabilities based on their fair values: licence and spectrum fees, brands, customer bases, and deferred tax liabilities. Goodwill would have been recognised as the excess of the purchase consideration over the fair values of acquired assets and liabilities – retrospective application may have resulted in an increase or decrease to goodwill. The fair values of the acquired intangible assets would have been amortised over their respective useful lives.
Employee benefits – actuarial gains and losses (IAS 19, “Employee Benefits”)
The Group has elected to recognise all cumulative actuarial gains and losses in relation to employee benefit schemes at the date of transition.
Share-based payments (IFRS 2, “Share-based Payment”)
The Group has elected to apply IFRS 2 to all relevant share-based payment transactions granted but not fully vested at 1 April 2004.
Financial instruments (IAS 39, “Financial Instruments: Recognition and
Measurement” and IFRS 7, “Financial Instruments: Disclosures”)
The Group has applied IAS 32 and IAS 39 for all periods presented and has therefore not taken advantage of the exemption in IFRS 1 that would enable the Group to only apply these standards from 1 April 2005.
Cumulative translation differences (IAS 21, “The Effects of Changes in
Foreign Exchange Rates”)
The Group has deemed the cumulative translation differences at the date of transition to IFRS to be zero. As a result, the gain or loss of a subsequent disposal of any foreign operation will exclude the translation differences that arose before the date of transition to IFRS.
If the Group had not applied the exemption, the gain or loss on any disposals after the transition date would include additional cumulative transaction differences relating to the businesses disposed of.
Fair value or revaluation as deemed cost (IAS 16, “Property, Plant and
Equipment” and IAS 38, “Intangible Assets”)
The Group has not elected to measure any item of property, plant and equipment or intangible asset at the date of transition to IFRS at its fair value.
Impact of transition to IFRS
The following is a summary of the effects of the differences between IFRS and UK GAAP on the Group’s total equity shareholders’ funds and profit for the financial year for the years previously reported under UK GAAP following the date of transition to IFRS.
Total equity shareholders’ funds
| | | 1 April 2004 | | 31 March 2005 | |
| | Note | £m | | £m | |
|
|
|
|
| |
| Total equity shareholders’ funds (UK GAAP) | | 111,924 | | 99,317 | |
| Measurement and recognition differences: | | | | | |
| Intangible assets | a | (164 | ) | 13,986 | |
| Proposed dividends | b | 728 | | 1,395 | |
| Financial instruments | c | 385 | | 350 | |
| Share-based payments | d | 12 | | 63 | |
| Defined benefit pension schemes | e | (257 | ) | (361 | ) |
| Deferred and current taxes | f | (1,011 | ) | (774 | ) |
| Other | | (66 | ) | (176 | ) |
|
|
|
|
| |
| Total equity shareholders’ funds (IFRS) | | 111,551 | | 113,800 | |
|
|
|
|
| |
|
| Profit for the year ended 31 March 2005 | | | | | |
| | Note | | | £m | |
|
|
|
|
| |
| Loss on ordinary activities after taxation (UK GAAP) | | | | (6,938) | |
| Measurement and recognition differences: | | | | | |
| Intangible assets | a | | | 14,263 | |
| Financial instruments | c | | | (174 | ) |
| Share-based payments | d | | | (91 | ) |
| Defined benefit pension schemes | e | | | 7 | |
| Deferred and current taxes | f | | | 10 | |
| Other | | | | (130 | ) |
| Presentation differences: | | | | | |
| Presentation of equity accounted investments | g | | | (45 | ) |
| Presentation of joint ventures | h | | | (384 | ) |
|
|
|
|
| |
| Profit for the financial year (IFRS) | | | | 6,518 | |
|
|
|
|
| |
|
There were no significant differences between IFRS and UK GAAP on the Group’s cash flow statement for the year ended 31 March 2005.
| 126 | Vodafone Group Plc Annual Report 2006 |
Back to Contents
Principal differences between IFRS and UK GAAP
Measurement and recognition differences
a. Intangible assets
IAS 38, “Intangible Assets” requires that goodwill is not amortised. Instead it is subject to an annual impairment review. As the Group has elected not to apply IFRS 3 retrospectively to business combinations prior to the opening balance sheet date under IFRS, the UK GAAP goodwill balance, after adjusting for items including the impact of proportionate consolidation of joint ventures, at 31 March 2004 (£78,753 million) has been included in the opening IFRS consolidated balance sheet and is no longer amortised.
Under IAS 38, capitalised payments for licences and spectrum fees are amortised on a straight line basis over their useful economic life. Amortisation is charged from the commencement of service of the network. Under UK GAAP, the Group’s policy was to amortise such costs in proportion to the capacity of the network during the start up period and then on a straight-line basis thereafter.
b. Proposed dividends
IAS 10, “Events after the Balance Sheet Date” requires that dividends declared after the balance sheet date should not be recognised as a liability at that balance sheet date as the liability does not represent a present obligation as defined by IAS 37, “Provisions, Contingent Liabilities and Contingent Assets”.
c. Financial instruments
IAS 32, “Financial Instruments: Disclosure and Presentation” and IAS 39, “Financial Instruments: Recognition and Measurement” address the accounting for, and reporting of, financial instruments. IAS 39 sets out detailed accounting requirements in relation to financial assets and liabilities.
All derivative financial instruments are accounted for at fair market value whilst other financial instruments are accounted for either at amortised cost or at fair value depending on their classification. Subject to certain criteria, financial assets and financial liabilities may be designated as forming hedge relationships as a result of which fair value changes are offset in the income statement or charged/credited to equity depending on the nature of the hedge relationship.
d. Share-based payments
IFRS 2, “Share-based Payment” requires that an expense for equity instruments granted be recognised in the financial statements based on their fair value at the date of grant. This expense, which is primarily in relation to employee option and performance share schemes, is recognised over the vesting period of the scheme.
While IFRS 2 allows the measurement of this expense to be calculated only on options granted after 7 November 2002, the Group has applied IFRS 2 to all instruments granted but not fully vested as at 1 April 2004. The Group has adopted the binomial model for the purposes of calculating fair value under IFRS, calibrated using a Black-Scholes framework.
e. Defined benefit pension schemes
The Group elected to adopt early the amendment to IAS 19, “Employee Benefits” issued by the IASB on 16 December 2004 which allows all actuarial gains and losses to be charged or credited to equity.
The Group’s opening IFRS balance sheet at 1 April 2004 reflects the assets and liabilities of the Group’s defined benefit schemes totalling a net liability of £154 million. The transitional adjustment of £257 million to opening reserves comprises the reversal of entries in relation to UK GAAP accounting under SSAP 24 less the recognition of the net liabilities of the Group’s and associated undertakings’ defined benefit schemes.
f. Deferred and current taxes
The scope of IAS 12, “Income Taxes” is wider than the corresponding UK GAAP standards, and requires deferred tax to be provided on all temporary differences rather than just timing differences under UK GAAP.
As a result, taxes in the Group's IFRS opening balance sheet at 1 April 2004 were adjusted by £1.0 billion. This includes an additional deferred tax liability of £1.8 billion in respect of the differences between the carrying value and tax written down value of the Group's investments in associated undertakings and joint ventures. This comprises £1.3 billion in respect of differences that arose when US investments were acquired and £0.5 billion in respect of undistributed earnings of certain associated undertakings and joint ventures, principally Vodafone Italy. UK GAAP does not permit deferred tax to be provided on the undistributed earnings of the Group’s associated undertakings and joint ventures until there is a binding obligation to distribute those earnings.
IAS 12 also requires deferred tax to be provided in respect of the Group’s liabilities under its post employment benefit arrangements and on other employee benefits such as share and share option schemes.
Presentation differences
g. Presentation of equity accounted investments
Under IFRS, in accordance with IAS 1, “Presentation of Financial Statements”, “Tax on profit” on the face of the consolidated income statement comprises the tax charge of the Company, its subsidiaries and its share of the tax charge of joint ventures. The Group’s share of its associated undertakings’ tax charges is shown as part of “Share of result in associated undertakings” rather than being disclosed as part of the tax charge under UK GAAP.
In respect of the Verizon Wireless partnership, the line “Share of result in associated undertakings” includes the Group’s share of pre-tax partnership income and the Group’s share of the post-tax income attributable to corporate entities (as determined for US corporate income tax purposes) held by the partnership. The tax attributable to the Group’s share of allocable partnership income is included as part of “Tax on profit” in the consolidated income statement. This treatment reflects the fact that tax on allocable partnership income is, for US corporate income tax purposes, a liability of the partners and not the partnership. Under UK GAAP, the Group’s share of minority interests in associated undertakings was reported in minority interests, under IFRS this is reported within investments in associated undertakings.
h. Presentation of joint ventures
IAS 31, “Interests in Joint Ventures” defines a jointly controlled entity as an entity where unanimous consent over the strategic financial and operating decisions is required between the parties sharing control. Control is defined as the power to govern the financial and operating decisions of an entity so as to obtain economic benefit from it.
The Group has reviewed the classification of its investments and concluded that the Group’s 76.9% (31 March 2005: 76.8%) interest in Vodafone Italy, classified as a subsidiary undertaking under UK GAAP, should be accounted for as a joint venture under IFRS. In addition, the Group’s interests in South Africa, Poland, Kenya and Fiji, which were classified as associated undertakings under UK GAAP, have been classified as joint ventures under IFRS as a result of the contractual rights held by the Group. The Group’s interest in Romania was classified as a joint venture until the acquisition of the controlling stake from Telesystem International Wireless Inc. of Canada completed on 31 May 2005. The Group has adopted proportionate consolidation as the method of accounting for these six entities.
Under UK GAAP, the revenue, operating profit, net financing costs and taxation of Vodafone Italy were consolidated in full in the income statement with a corresponding allocation to minority interest. Under proportionate consolidation, the Group recognises its share of all income statement lines with no allocation to minority interest. There is no effect on the result for a financial period from this adjustment.
Under UK GAAP, the Group’s interests in South Africa, Poland, Romania, Kenya and Fiji were accounted for under the equity method, with the Group’s share of operating profit, interest and tax being recognised separately in the consolidated income statement. Under proportionate consolidation, the Group recognises its share of all income statement lines. There is no effect on the result for a financial period from this adjustment.
Under UK GAAP, the Group fully consolidated the cash flows of Vodafone Italy, but did not consolidate the cash flows of its associated undertakings. The IFRS consolidated cash flow statement reflects the Group’s share of cash flows relating to its joint ventures on a line by line basis, with a corresponding recognition of the Group’s share of net debt for each of the proportionately consolidated entities.
Other differences
i. Reclassification of non-equity minority interests to liabilities
The primary impact of the implementation of IAS 32 is the reclassification of the $1.65 billion preferred shares issued by the Group’s subsidiary, Vodafone Americas Inc., from non-equity minority interests to liabilities. The reclassification at 1 April 2004 was £875 million. Dividend payments by this subsidiary, which were previously reported in the Group’s income statement as non-equity minority interests, have been reclassified to financing costs.
j. Fair value of available-for-sale financial assets
The Group has classified certain of its cost-based investments as available-for-sale financial assets as defined in IAS 39. This classification does not reflect the intentions of management in relation to these investments. These assets are measured at fair value at each reporting date with movements in fair value taken to equity. At 1 April 2004, a cumulative increase of £233 million in the fair value over the carrying value of these investments was recognised.
| Vodafone Group Plc Annual Report 2006 | 127 |
Back to Content
Notes to the Consolidated Financial Statements
continued
40. Transition to IFRS on first-time adoption continued
Reconciliation of the UK GAAP consolidated profit and loss account to the IFRS consolidated income statement
Year ended 31 March 2005
| | | | | | Measurement | | | | | | |
| | | | Presentation | | and recognition | | Discontinued | | | | |
| | UK GAAP | | differences | | differences | | operations | | IFRS | | |
| UK GAAP format | £m | | £m | | £m | | £m | | £m | | IFRS format |
|
| Turnover | 34,133 | | – | | (60 | ) | (7,395 | ) | 26,678 | | Revenue |
| Cost of sales | (20,753 | ) | – | | (711 | ) | 5,664 | | (15,800 | ) | Cost of sales |
|
| Gross profit | 13,380 | | – | | (771 | ) | (1,731 | ) | 10,878 | | Gross profit |
| Selling and distribution costs | (2,031 | ) | – | | (15 | ) | 397 | | (1,649 | ) | Selling and distribution expenses |
| Administrative expenses | (16,653 | ) | 315 | | 12,812 | | 670 | | (2,856 | ) | Administrative expenses |
| | | | 404 | | 1,576 | | – | | 1,980 | | Share of result in associated |
| | | | | | | | | | | | undertakings |
| | | | (315 | ) | (160 | ) | – | | (475 | ) | Other income and expense |
|
| Operating loss | (5,304 | ) | 404 | | 13,442 | | (664 | ) | 7,878 | | Operating profit |
| Share of result in associated undertakings | 1,193 | | (1,193 | ) | | | | | | | |
| Exceptional non-operating items | 13 | | (13 | ) | | | | | | | |
| | | | 8 | | (2 | ) | (13 | ) | (7 | ) | Non-operating income and expense |
| | | | 324 | | (21 | ) | (9 | ) | 294 | | Investment income |
| Net interest payable and similar items | (604 | ) | (113 | ) | (183 | ) | 20 | | (880 | ) | Financing costs |
|
| Loss on ordinary activities before taxation | (4,702 | ) | (583 | ) | 13,236 | | (666 | ) | 7,285 | | Profit before taxation |
| Tax on loss on ordinary activities | (2,236 | ) | 538 | | 265 | | (436 | ) | (1,869 | ) | Tax on profit |
|
| Loss on ordinary activities after taxation | (6,938 | ) | (45 | ) | 13,501 | | (1,102 | ) | 5,416 | | Profit on ordinary activities after |
| | | | | | | | | | | | taxation from continuing operations |
| | – | | – | | – | | 1,102 | | 1,102 | | Profit on ordinary activites after |
| | | | | | | | | | | | taxation from discontinued |
| | | | | | | | | | | | operations |
|
| | (6,938 | ) | (45 | ) | 13,501 | | – | | 6,518 | | Profit for the financial year |
| Minority interest | (602 | ) | 45 | | 449 | | – | | (108 | ) | Profit for the financial year |
| | | | | | | | | | | | attributable to minority interests |
|
| Loss for the financial year | (7,540 | ) | – | | 13,950 | | – | | 6,410 | | Profit for the financial year |
| | | | | | | | | | | | attributable to equity shareholders |
|
| 128 | Vodafone Group Plc Annual Report 2006 |
Back to Contents
Reconciliation of the UK GAAP consolidated balance sheet to the IFRS consolidated balance sheet
1 April 2004
| | | | | | Measurement | | | | |
| | | | Presentation | | and recognition | | | | |
| | UK GAAP | | differences | | differences | | IFRS | | |
| UK GAAP format | £m | | £m | | £m | | £m | | IFRS format |
|
| Fixed assets: | | | | | | | | | Non-current assets: |
| Intangible assets | 93,622 | | – | | 1,002 | | 94,624 | | Intangible assets |
| Tangible assets | 18,083 | | – | | (971 | ) | 17,112 | | Property, plant and equipment |
| Investments in associated undertakings | 21,226 | | – | | (800 | ) | 20,426 | | Investments in associated undertakings |
| Other investments | 1,049 | | – | | 233 | | 1,282 | | Other investments |
| | | | 671 | | 136 | | 807 | | Deferred tax assets |
| | | | 221 | | (9 | ) | 212 | | Trade and other receivables |
|
| | 133,980 | | 892 | | (409 | ) | 134,463 | | |
|
| Current assets: | | | | | | | | | Current assets: |
| Stocks | 458 | | – | | 10 | | 468 | | Inventory |
| Debtors | 6,901 | | (6,901 | ) | | | | | |
| | | | 372 | | (103 | ) | 269 | | Taxation recoverable |
| | | | 5,148 | | 305 | | 5,453 | | Trade and other receivables |
| Investments | 4,381 | | (4,381 | ) | | | | | |
| Cash at bank and in hand | 1,409 | | 4,381 | | 61 | | 5,851 | | Cash and cash equivalents |
|
| | 13,149 | | (1,381 | ) | 273 | | 12,041 | | |
|
| Total assets | 147,129 | | (489 | ) | (136 | ) | 146,504 | | Total assets |
|
| | | | | | | | | | |
| Capital and reserves: | | | | | | | | | Equity: |
| Called up share capital | 4,280 | | – | | – | | 4,280 | | Called up share capital |
| Share premium account | 52,154 | | – | | – | | 52,154 | | Share premium account |
| Own shares held | (1,136 | ) | – | | – | | (1,136 | ) | Own shares held |
| Other reserve | 99,640 | | – | | 310 | | 99,950 | | Additional paid-in capital |
| | | | – | | 233 | | 233 | | Other reserves |
| Profit and loss account | (43,014 | ) | – | | (916 | ) | (43,930 | ) | Retained losses |
|
| Total equity shareholders’ funds | 111,924 | | – | | (373 | ) | 111,551 | | Total equity shareholders’ funds |
| Minority interests | 3,007 | | – | | (2,198 | ) | 809 | | Minority interests |
|
| | 114,931 | | – | | (2,571 | ) | 112,360 | | |
|
| Creditors – amounts falling due after more than one year | 12,975 | | (12,975 | ) | | | | | Non-current liabilities: |
| | | | 12,224 | | 1,859 | | 14,083 | | Long-term borrowings |
| | | | 3,314 | | 1,421 | | 4,735 | | Deferred tax liabilities |
| | | | (73 | ) | 227 | | 154 | | Post employment benefits |
| Provisions for liabilities and charges | 4,197 | | (3,858 | ) | 5 | | 344 | | Provisions for liabilities and charges |
| | | | 751 | | (449 | ) | 302 | | Trade and other payables |
|
| | 17,172 | | (617 | ) | 3,063 | | 19,618 | | |
|
| Creditors – amounts falling due within one year | 15,026 | | (15,026 | ) | | | | | Current liabilities: |
| | | | 2,054 | | 788 | | 2,842 | | Short-term borrowings |
| | | | 4,275 | | (356 | ) | 3,919 | | Current taxation liabilities |
| | | | 8,643 | | (1,068 | ) | 7,575 | | Trade and other payables |
| | | | 182 | | 8 | | 190 | | Provisions for liabilities and charges |
|
| | 15,026 | | 128 | | (628 | ) | 14,526 | | |
|
| | 147,129 | | (489 | ) | (136 | ) | 146,504 | | Total equity and liabilities |
|
| Vodafone Group Plc Annual Report 2006 | 129 |
Back to Content
Notes to the Consolidated Financial Statements
continued
40. Transition to IFRS on first-time adoption continued
31 March 2005
| | | | | | Measurement | | | | |
| | | | Presentation | | and recognition | | | | |
| | UK GAAP | | differences | | differences | | IFRS | | |
| UK GAAP format | £m | | £m | | £m | | £m | | IFRS format |
|
| Fixed assets: | | | | | | | | | Non-current assets: |
| | | | 68,673 | | 12,326 | | 80,999 | | Goodwill |
| Intangible assets | 83,464 | | (68,673 | ) | 1,358 | | 16,149 | | Other intangible assets |
| Tangible assets | 18,398 | | – | | (956 | ) | 17,442 | | Property, plant and equipment |
| Investments in associated undertakings | 19,398 | | – | | 836 | | 20,234 | | Investments in associated undertakings |
| Other investments | 852 | | – | | 329 | | 1,181 | | Other investments |
| | | | 1,084 | | 100 | | 1,184 | | Deferred tax assets |
| | | | 12 | | – | | 12 | | Post employment benefits |
| | | | 613 | | (28 | ) | 585 | | Trade and other receivables |
|
| | 122,112 | | 1,709 | | 13,965 | | 137,786 | | |
|
| Current assets: | | | | | | | | | Current assets: |
| Stocks | 430 | | – | | 10 | | 440 | | Inventory |
| Debtors | 7,698 | | (7,698 | ) | | | | | |
| | | | 268 | | (230 | ) | 38 | | Taxation recoverable |
| | | | 5,049 | | 115 | | 5,164 | | Trade and other receivables |
| Investments | 816 | | (816 | ) | | | | | |
| Cash at bank and in hand | 2,850 | | 816 | | 103 | | 3,769 | | Cash and cash equivalents |
|
| | 11,794 | | (2,381 | ) | (2 | ) | 9,411 | | |
|
| Total assets | 133,906 | | (672 | ) | 13,963 | | 147,197 | | Total assets |
|
| | | | | | | | | | |
| Capital and reserves: | | | | | | | | | Equity: |
| Called up share capital | 4,286 | | – | | – | | 4,286 | | Called up share capital |
| Share premium account | 52,284 | | – | | – | | 52,284 | | Share premium account |
| Own shares held | (5,121 | ) | – | | – | | (5,121 | ) | Own shares held |
| Other reserve | 99,556 | | – | | 525 | | 100,081 | | Additional paid-in capital |
| | | | – | | 1,781 | | 1,781 | | Accumulated other recognised |
| | | | | | | | | | income and expense |
| Profit and loss account | (51,688 | ) | – | | 12,177 | | (39,511 | ) | Retained losses |
|
| Total equity shareholders’ funds | 99,317 | | – | | 14,483 | | 113,800 | | Total equity shareholders’ funds |
| Minority interests | 2,818 | | – | | (2,970 | ) | (152 | ) | Minority Interests |
|
| | 102,135 | | – | | 11,513 | | 113,648 | | |
|
| Creditors – amounts falling due after more than one year | 12,382 | | (12,382 | ) | | | | | Non-current liabilities: |
| | | | 11,613 | | 1,577 | | 13,190 | | Long-term borrowings |
| | | | 3,481 | | 1,368 | | 4,849 | | Deferred tax liabilities |
| | | | (171 | ) | 307 | | 136 | | Post employment benefits |
| Provisions for liabilities and charges | 4,552 | | (4,235 | ) | 2 | | 319 | | Provisions for other liabilities and |
| | | | | | | | | | charges |
| | | | 797 | | (359 | ) | 438 | | Trade and other payables |
|
| | 16,934 | | (897 | ) | 2,895 | | 18,932 | | |
|
| Creditors – amounts falling due within one year | 14,837 | | (14,837 | ) | | | | | Current liabilities: |
| | | | 392 | | 1,611 | | 2,003 | | Short-term borrowings |
| | | | 4,759 | | (406 | ) | 4,353 | | Current taxation liabilities |
| | | | 9,717 | | (1,684 | ) | 8,033 | | Trade and other payables |
| | | | 194 | | 34 | | 228 | | Provisions for other liabilities and |
| | | | | | | | | | charges |
|
| | 14,837 | | 225 | | (445 | ) | 14,617 | | |
|
| | 133,906 | | (672 | ) | 13,963 | | 147,197 | | Total equity and liabilities |
|
| 130 | Vodafone Group Plc Annual Report 2006 |
Back to Contents
Report of Independent Registered Public Accounting Firm to the Members of Vodafone Group Plc
We have audited the Consolidated Financial Statements of Vodafone Group Plc, which comprise the consolidated consolidated balance sheets at 31 March 2006 and 2005, the consolidated income statements, consolidated cash flow statements, the consolidated statements of recognised income and expenses for each of the two years in the period ended 31 March 2006 and the related notes numbered 1 to 40. These Consolidated Financial Statements have been prepared under the accounting policies set out therein. We have also audited the information in the directors’ remuneration report that is described as having been audited.
We have reported separately on the individual Company Financial Statements of Vodafone Group Plc for the year ended 31 March 2006.
Respective responsibilities of directors and auditors
The directors’ responsibilities for preparing the annual report, the directors’ remuneration report and the Consolidated Financial Statements in accordance with applicable law and International Financial Reporting Standards (IFRS) as adopted for use in the European Union are set out in the statement of directors’ responsibilities.
Our responsibility is to audit the Consolidated Financial Statements and the part of the directors’ remuneration report described as having been audited in accordance with relevant United Kingdom legal and regulatory requirements and International Standards on Auditing (UK and Ireland).
We report to you our opinion as to whether the Consolidated Financial Statements give a true and fair view in accordance with the relevant financial reporting framework and whether the Consolidated Financial Statements and the part of the directors’ remuneration report described as having been audited have been properly prepared in accordance with the Companies Act 1985 and Article 4 of the IAS Regulation.
We report to you if in our opinion the information given in the directors’ report is not consistent with the Consolidated Financial Statements. We also report to you if we have not received all the information and explanations we require for our audit, or if information specified by law regarding directors’ transactions with the Company and other members of the Group is not disclosed.
We also report to you if, in our opinion, the Company has not complied with any of the four directors’ remuneration disclosure requirements specified for our review by the Listing Rules of the Financial Services Authority. These comprise the amount of each element in the remuneration package and information on share options, details of long term incentive schemes, and money purchase and defined benefit schemes. We give a statement, to the extent possible, of details of any non-compliance.
We review whether the corporate governance statement reflects the Company’s compliance with the nine provisions of the 2003 FRC Combined Code specified for our review by the Listing Rules of the Financial Services Authority, and we report if it does not. We are not required to consider whether the board’s statement on internal control covers all risks and controls, or form an opinion on the effectiveness of the Group’s corporate governance procedures or its risk and control procedures.
We read the directors’ report and the other information contained in the annual report for the above year as described in the contents section including the unaudited part of the directors’ remuneration report and we consider the implications for our report if we become aware of any apparent misstatements or material inconsistencies with the Consolidated Financial Statements.
Basis of audit opinion
We conducted our audit in accordance with International Standards on Auditing (UK and Ireland) issued by the Auditing Practices Board and with the standards of the Public Company Accounting Oversight Board (United States). The Company is not required to have, nor were we engaged to perform, an audit of its internal control over financial reporting. Our audit included consideration of internal control over financial reporting as a basis for designing audit procedures that are appropriate in the circumstances but not for the purpose of expressing an opinion on the effectiveness of the Company’s internal control over financial reporting. Accordingly, we express no such opinion. An audit includes examination, on a test basis, of evidence relevant to the amounts and disclosures in the Consolidated Financial Statements and the part of the directors’ remuneration report described as having been audited. It also includes an assessment of the significant estimates and judgements made by the directors in the preparation of the Consolidated Financial Statements, and of whether the accounting policies are appropriate to the Group’s circumstances, consistently applied and adequately disclosed.
We planned and performed our audit so as to obtain all the information and explanations which we considered necessary in order to provide us with sufficient evidence to give reasonable assurance that the Consolidated Financial Statements and the part of the directors’ remuneration report described as having been audited are free
from material misstatement, whether caused by fraud or other irregularity or error. In forming our opinion we also evaluated the overall adequacy of the presentation of information in the Consolidated Financial Statements and the part of the directors’ remuneration report described as having been audited.
Opinions
IFRS opinion
In our opinion:
| • | the Consolidated Financial Statements give a true and fair view, in accordance with IFRS as adopted for use in the European Union, of the state of the Group’s affairs as at31 March 2006 and of its loss for the year then ended; |
| | |
| • | the Consolidated Financial Statements and the part of the directors’ remuneration report described as having been audited have been properly prepared in accordance with the Companies Act 1985 and Article 4 of the IAS Regulation; and |
| | |
| • | the information given in the directors’ report is consistent with the Consolidated Financial Statements. |
As explained in note 1 of the Consolidated Financial Statements, the Group, in addition to complying with its legal obligation to comply with IFRS as adopted for use in the European Union, has also complied with the IFRS as issued by the International Accounting Standards Board. Accordingly, in our opinion the financial statements give a true and fair view, in accordance with IFRS, of the state of the Group’s affairs as at 31 March 2006 and of its loss for the year then ended.
US opinion
In our opinion the Consolidated Financial Statements present fairly, in all material respects, the consolidated financial position of the Group at 31 March 2006 and 2005 and the consolidated results of its operations and cash flows for each of the two years in the period ended 31 March 2006 in conformity with IFRS as adopted for use in the European Union and as issued by the International Accounting Standards Board.
IFRS vary in significant respects from the accounting principles generally accepted in the United States of America. Information relating to the nature and effect of such differences is presented in note 38 to the Consolidated Financial Statements.

Deloitte & Touche LLP
Chartered Accountants and Registered Auditors
London
United Kingdom
30 May 2006
| Vodafone Group Plc Annual Report 2006 | 131 |
Back to Contents
Company Financial Statements of Vodafone Group Plc at 31 March
| | | | 2006 | | 2005 | |
| | | | | | (restated) | |
| | Note | | £m | | £m | |
|
|
|
|
|
| |
| Fixed assets | | | | | | |
| Other investments | 3 | | 133 | | – | |
| Shares in group undertakings | 3 | | 67,395 | | 94,446 | |
|
|
|
|
|
| |
| | | | 67,528 | | 94,446 | |
|
|
|
|
|
| |
| Current assets | | | | | | |
| Debtors: amounts falling due after more than one year | 4 | | 236 | | 370 | |
| Debtors: amounts falling due within one year | 4 | | 99,417 | | 77,466 | |
| Investments | 5 | | – | | 28 | |
|
|
|
|
|
| |
| | | | 99,653 | | 77,864 | |
| Creditors: amounts falling due within one year | 6 | | (76,591 | ) | (89,740 | ) |
|
|
|
|
|
| |
| Net current assets/( liabilities) | | | 23,062 | | (11,876 | ) |
|
|
|
|
|
| |
| Total assets less current liabilities | | | 90,590 | | 82,570 | |
| Creditors: amounts falling due after more than one year | 6 | | (13,487 | ) | (9,380 | ) |
|
|
|
|
|
| |
| | | | 77,103 | | 73,190 | |
|
|
|
|
|
| |
| Capital and reserves | | | | | | |
| Called up share capital | 7 | | 4,165 | | 4,286 | |
| Share premium account | 8 | | 52,444 | | 52,284 | |
| Capital redemption reserve | 8 | | 128 | | – | |
| Capital reserve | 8 | | 88 | | 88 | |
| Other reserves | 8 | | 1,012 | | 1,048 | |
| Own shares held | 8 | | (8,186 | ) | (5,085 | ) |
| Profit and loss account | 8 | | 27,452 | | 20,569 | |
|
|
|
|
|
| |
| Equity shareholders’ funds | | | 77,103 | | 73,190 | |
|
|
|
|
|
| |
The Financial Statements were approved by the Board of directors on 30 May 2006 and were signed on its behalf by:
 |  |
| Arun Sarin | Andy Halford |
| Chief Executive | Chief Financial Officer |
The accompanying notes are an integral part of these Financial Statements.
| 132 | Vodafone Group Plc Annual Report 2006 |
Back to Contents
Notes to the Company Financial Statements
1. Basis of preparation
The separate financial statements of the Company are drawn up in accordance with the Companies Act 1985 and UK generally accepted accounting principles (“UK GAAP”).
The preparation of financial statements in conformity with generally accepted accounting principles requires management to make estimates and assumptions that affect the reported amounts of assets and liabilities and disclosure of contingent assets and liabilities at the date of the financial statements and the reported amounts of revenue and expenses during the reporting period. Actual results could differ from those estimates. The estimates and underlying assumptions are reviewed on an ongoing basis. Revisions to accounting estimates are recognised in the period in which the estimate is revised if the revision affects only that period or in the period of the revision and future periods if the revision affects both current and future periods.
As permitted by Section 230 of the Companies Act 1985, the profit and loss account of the Company is not presented in this Annual Report.
The Company has taken advantage of the exemption contained in FRS 1 “Cash flow statements” and has not produced a cash flow statement.
The Company has taken advantage of the exemption contained in FRS 8 “Related party disclosures” and has not reported transactions with fellow Group undertakings.
2. Significant accounting policies
The Company’s significant accounting policies are described below.
Accounting convention
The Company Financial Statements are prepared under the historical cost convention and in accordance with applicable accounting standards of the UK Accounting Standards Board and pronouncements of the Urgent Issues Task Force.
New accounting standards
The Company has adjusted its accounting policies to adopt the following new standards: FRS 17 “Retirement Benefits”, FRS 20 “Share-based Payments”, FRS 21 “Events after the Balance Sheet Date”, FRS 22 “Earnings per share”, FRS 23 “The Effects of Changes in Foreign Exchange Rates”, FRS 26 “Financial Instruments: Measurement” and FRS 28 “Corresponding Amounts”. The Company has also early adopted FRS 29 “Financial Instruments: Disclosures”, which replaces the disclosure requirements of FRS 25 “Financial Instruments: Disclosure and Presentation”. Comparative figures have been restated accordingly for changes in accounting policy. Details of the effect of the prior year adjustment are set out below and the full impact on the Company’s net asset position as at 1 April 2005 is analysed in note 8.
FRS 17 impacts the Company in its role as sponsoring employer of the Vodafone Group Pension Scheme, a defined benefit pension scheme. The adoption of FRS 17 had no effect on the Company’s profit or net assets as the Company was unable to identify its share of the underlying assets and liabilities of the Vodafone Group Pension Scheme on a consistent and reasonable basis. Therefore the Company has applied the guidance within FRS 17 to account for defined benefit schemes as if they were defined contribution schemes and recognise only the contribution payable each year. The Company had no contributions payable for the years ended 31 March 2006 and 31 March 2005 as it has no employees.
FRS 20 requires that the fair value of options and shares awarded to employees is charged to the profit and loss account over the vesting period. The Company does not incur a charge under this standard. However, where the Company has granted rights over the Company’s shares or share options to the employees of its subsidiary undertakings, an additional capital contribution has been deemed to have been made by the Company to its subsidiary undertakings. This results in an additional investment in subsidiaries and a corresponding increase in shareholders equity. The additional capital contribution is based on the fair value of the grant issued allocated over the underlying grant’s vesting period. As a result of adopting FRS 20, the Company’s net assets at 31 March 2005 increased by £419 million.
FRS 21 requires that dividends declared after the balance sheet date should not be recognised as a liability at the balance sheet date as the liability does not represent a present obligation. Under FRS 21, interim dividends are recognised when they are paid, and final dividends are recognised when they are approved by shareholders. As a result of adopting FRS 21, the Company’s net assets at 31 March 2005 increased by £1,395 million.
FRS 23 sets out additional guidance on the translation method for transactions in foreign currencies and on determining the functional and presentational currencies. The adoption of FRS 23 had no impact on the Company’s profit or net assets.
The Company has adopted the presentation requirements of FRS 25. This deals with the classification of capital instruments issued between debt and equity and the implications of that classification for dividends and interest expense.
FRS 26 sets out the requirements for measurement, recognition and de-recognition of financial instruments. The main impact of this change in accounting policy is to recognise the fair value of foreign exchange contracts and interest rate swaps on the balance sheet with effect from the transitional date of 1 April 2004. The adoption of FRS 26 increased the Company’s net assets at 31 March 2005 by £182 million.
FRS 28 gives the requirements for the disclosure of corresponding amounts for items shown in an entity’s primary financial statements and the notes to the financial statements. The adoption of FRS 28 had no effect upon the Company’s profit or net assets.
FRS 29 sets out the requirements for the disclosures relating to financial instruments. The Company has early adopted FRS 29 and applied its requirements from 1 April 2005. The Company is exempt from the requirements of the standard as full FRS 29 disclosures are available in the Vodafone Group Plc Annual Report 2006.
Investments
Shares in Group undertakings are stated at cost less any provision for permanent diminution in value.
The Company assesses investments for impairment whenever events or changes in circumstances indicate that the carrying value of an investment may not be recoverable. If any such indication of impairment exists, the Company makes an estimate of the recoverable amount. If the recoverable amount of the cash-generating unit is less than the value of the investment, the investment is considered to be impaired and is written down to its recoverable amount. An impairment loss is recognised immediately in the profit and loss account.
For available-for-sale investments, gains and losses arising from changes in fair value are recognised directly in equity, until the security is disposed of or is determined to be impaired, at which time the cumulative gain or loss previously recognised in equity, determined using the weighted average costs method, is included in the net profit or loss for the period.
Foreign currencies
In preparing the financial statements of the Company, transactions in currencies other than the Company’s functional currency are recorded at the rates of exchange prevailing on the dates of the transactions. At each balance sheet date, monetary items denominated in foreign currencies are retranslated at the rates prevailing on the balance sheet date. Non-monetary items carried at fair value that are denominated in foreign currencies are retranslated at the rate prevailing on the date when fair value was determined. Non-monetary items that are measured in terms of historical cost in a foreign currency are not retranslated.
Exchange differences arising on the settlement of monetary items, and on the retranslation of monetary items, are included in the profit and loss account for the period. Exchange differences arising on the retranslation of non-monetary items carried at fair value are included in the profit and loss account for the period except for differences arising on the retranslation of non-monetary items in respect of which gains and losses are recognised directly in equity. For such non-monetary items, any exchange component of that gain or loss is also recognised directly in equity.
| Vodafone Group Plc Annual Report 2006 | 133 |
Back to Contents
Notes to the Company Financial Statements
continued
2. Significant accounting policies continued
Borrowing costs
All borrowing costs are recognised in the profit and loss account in the period in which they are incurred.
Taxation
Current tax, including UK corporation tax and foreign tax, is provided at amounts expected to be paid (or recovered) using the tax rates and laws that have been enacted or substantively enacted by the balance sheet date.
Deferred tax is provided in full on timing differences that exist at the balance sheet date and that result in an obligation to pay more tax, or a right to pay less tax in the future. The deferred tax is measured at the rate expected to apply in the periods in which the timing differences are expected to reverse, based on the tax rates and laws that are enacted or substantively enacted at the balance sheet date. Timing differences arise from the inclusion of items of income and expenditure in taxation computations in periods different from those in which they are included in the financial statements. Deferred tax is not provided on timing differences arising from the revaluation of fixed assets where there is no binding commitment to sell the asset. Deferred tax assets are recognised to the extent that it is regarded as more likely than not that they will be recovered. Deferred tax assets and liabilities are not discounted.
Financial instruments
Financial assets and financial liabilities, in respect of financial instruments, are recognised on the balance sheet when the Company becomes a party to the contractual provisions of the instrument.
Financial liabilities and equity instruments
Financial liabilities and equity instruments issued by the Company are classified according to the substance of the contractual arrangements entered into and the definitions of a financial liability and an equity instrument. An equity instrument is any contract that evidences a residual interest in the assets of the Company after deducting all of its liabilities. The accounting policies adopted for specific financial liabilities and equity instruments are set out below.
Capital market and bank borrowings
Interest-bearing loans and overdrafts are initially measured at fair value, and are subsequently measured at amortised cost, using the effective interest rate method, except where they are identified as a hedged item in a fair value hedge. Any difference between the proceeds net of transaction costs and the settlement or redemption of borrowings is recognised over the term of the borrowing.
Equity instruments
Equity instruments issued by the Company are recorded at the proceeds received, net of direct issue costs.
Derivative financial instruments and hedge accounting
The Company’s activities expose it to the financial risks of changes in foreign exchange rates and interest rates.
The use of financial derivatives is governed by the Group’s policies approved by the board of directors, which provide written principles on the use of financial derivatives consistent with the Group’s risk management strategy. The Company does not use derivative financial instruments for speculative purposes.
Derivative financial instruments are initially measured at fair value on the contract date, and are subsequently re-measured to fair value at each reporting date. The Company designates certain derivatives as hedges of the change of fair value of recognised assets and liabilities (“fair value hedges”). Hedge accounting is discontinued when the hedging instrument expires or is sold, terminated, or exercised, or no longer qualifies for hedge accounting.
Fair value hedges
The Company’s policy is to use derivative instruments (primarily interest rate swaps) to convert a proportion of its fixed rate debt to floating rates in order to hedge the interest rate risk arising, principally, from capital market borrowings. The Company designates these as fair value hedges of interest rate risk with changes in fair value of the hedging instrument recognised in the profit and loss account for the period together with the changes in the fair value of the hedged item due to the hedged risk, to the extent the hedge is effective. The ineffective portion is recognised immediately in the profit and loss account.
Share based payments
The Group operates a number of equity settled share based compensation plans for the employees of subsidiary undertakings, using the Company’s equity instruments. The fair value of the compensation given in respect of these share based compensation plans is recognised as a capital contribution to the Company’s subsidiary undertakings, over the vesting period. The capital contribution is reduced by any payments received from subsidiary undertakings in respect of these share based payments.
Dividends paid and received
Dividends paid and received are included in the financial statements in the period in which the related dividends are actually paid or received or, in respect of the Company’s final dividend for the year, approved by shareholders.
| 134 | Vodafone Group Plc Annual Report 2006 |
Back to Contents
3. Fixed assets
Other investments
The Company’s fixed asset investments comprises £133 million (2005: £nil) representing 30,252,460 ordinary shares in VenFin Limited (2005: £nil). The investment is held at fair value.
Shares in group undertakings
| | £m | |
|
| |
| Cost: | | |
| 1 April 2005 | 98,789 | |
| Adjustment for adoption of FRS 20 | 419 | |
|
| |
| 1 April 2005, as restated | 99,208 | |
| Additions | 3,642 | |
| Capital contributions arising from share based payments | 114 | |
| Contributions received in relation to share based payments | (150 | ) |
| Disposals | (30,654 | ) |
|
| |
| 31 March 2006 | 72,160 | |
|
| |
| Amounts provided for: | | |
| 1 April 2005 | 4,762 | |
| Amounts provided for during the year | 3 | |
|
| |
| 31 March 2006 | 4,765 | |
|
| |
| Net book value: | | |
| 31 March 2006 | 67,395 | |
|
| |
| 31 March 2005, as restated | 94,446 | |
|
| |
At 31 March 2006, the Company had the following principal subsidiary undertakings:
| | | | Country of | | | |
| | | | incorporation | | Percentage | |
| Name | Principal activity | | or registration | | shareholding | |
|
|
|
|
|
| |
| Vodafone International Operations Limited | Holding company | | England | | 100 | |
|
|
|
|
|
| |
4. Debtors
| | 2006 | | 2005 | |
| | | | (restated) | |
| | £m | | £m | |
|
|
|
| |
| Amounts falling due within one year: | | | | |
| Amounts owed by subsidiary undertakings | 99,174 | | 77,246 | |
| Taxation recoverable | 72 | | 37 | |
| Group relief receivable | – | | 43 | |
| Other debtors | 171 | | 140 | |
|
|
|
| |
| | 99,417 | | 77,466 | |
|
|
|
| |
| Amounts falling due after more than one year: | | | | |
| Deferred taxation | 5 | | 5 | |
| Other debtors | 231 | | 365 | |
|
|
|
| |
| | 236 | | 370 | |
|
|
|
| |
5. Investments
| | 2006 | | 2005 | |
| | £m | | £m | |
|
|
|
| |
| Liquid Investments | – | | 28 | |
|
|
|
| |
The Company’s liquid investments at 31 March 2005 comprised of short term foreign exchange forward contracts.
| Vodafone Group Plc Annual Report 2006 | 135 |
Back to Contents
Notes to the Company Financial Statements
continued
6. Creditors
| | 2006 | | 2005 | |
| | | | (restated) | |
| | £m | | £m | |
|
|
|
| |
| Amounts falling due within one year: | | | | |
| Bank loans and other loans | 2,143 | | 42 | |
| Amounts owed to subsidiary undertakings | 74,229 | | 89,652 | |
| Group relief payable | 89 | | – | |
| Other creditors | 120 | | 34 | |
| Accruals and deferred income | 10 | | 12 | |
|
|
|
| |
| | 76,591 | | 89,740 | |
|
|
|
| |
| Amounts falling due after more than one year: | | | | |
| Bank loans | – | | 16 | |
| Other loans | 13,321 | | 9,316 | |
| Other creditors | 166 | | 48 | |
|
|
|
| |
| | 13,487 | | 9,380 | |
|
|
|
| |
Included in amounts falling due after more than one year are other loans of £5,942 million, which are due in more than five years from 1 April 2006 and are payable otherwise than by instalments. Interest payable on this debt ranges from 3.625% and 7.875%.
7. Share capital
| | 2006 | | 2005 | |
| |
| |
| |
| | Number | | £m | | Number | | £m | |
|
|
|
|
|
|
|
| |
| Authorised: | | | | | | | | |
| Ordinary shares of US$0.10 each | 78,000,000,000 | | 4,875 | | 78,000,000,000 | | 4,875 | |
|
|
|
|
|
|
|
| |
| Ordinary shares allotted, issued and fully paid: | | | | | | | | |
| 1 April | 68,380,866,539 | | 4,286 | | 68,263,933,048 | | 4,280 | |
| Allotted during the year | 120,466,245 | | 7 | | 116,933,491 | | 6 | |
| Cancelled during the year | (2,250,000,000 | ) | (128 | ) | – | | – | |
|
|
|
|
|
|
|
| |
| 31 March | 66,251,332,784 | | 4,165 | | 68,380,866,539 | | 4,286 | |
|
|
|
|
|
|
|
| |
| Notes: |
| (1) | At 31 March 2006 the Company held 6,120,129,348 (2005: 3,785,000,000) treasury shares with a nominal value of £352 million (2005: £205 million). |
| (2) | At 31 March 2006, 50,000 (2005: 50,000) 7% cumulative fixed rate shares of £1 each were authorised, allotted, issued and fully paid by the Company. |
Allotted during the year
| | | | Nominal | | | |
| | | | value | | Proceeds | |
| | Number | | £m | | £m | |
|
|
|
|
|
| |
| UK share awards and option scheme awards | 85,744,935 | | 5 | | 122 | |
| US share awards and option scheme awards | 34,721,310 | | 2 | | 37 | |
|
|
|
|
|
| |
| Total for share option schemes and restricted stock awards | 120,466,245 | | 7 | | 159 | |
|
|
|
|
|
| |
Cancelled during the year
During the year 2,250,000,000 (2005: nil) treasury shares were cancelled in order to comply with Companies Act requirements in relation to the amount of issued share capital that can be held in treasury.
Share-based payments
The Company currently uses a number of equity settled share plans to grant options and shares to the directors and employees of its subsidiary undertakings, as listed below.
Share option schemes
Vodafone Group savings related and sharesave schemes
Vodafone Group executive schemes
Vodafone Group 1999 Long Term Stock Incentive Plan and ADSs
Other share option plans
Share plans
Share Incentive plan
Restricted share plans
As at 31 March 2006, the Company had 786.9 million ordinary share options outstanding (2005: 1,122.6 million) and 7.7 million ADS options outstanding (2005: 11.2 million).
The Company has made a capital contribution to its subsidiary undertakings in relation to share based payments. At 1 April 2005, the capital contribution net of payments received from subsidiary undertakings was £419 million. During the year ended 31 March 2006, the capital contribution arising from share based payments was £114 million, with payments of £150 million received from subsidiary undertakings. The Company does not incur a profit and loss account charge in relation to share based payments.
Full details of share based payments, share option schemes and share plans are disclosed in note 20 to the Consolidated Financial Statements.
| 136 | Vodafone Group Plc Annual Report 2006 |
Back to Contents
8. Reserves and reconciliation of movements in equity shareholders’ funds
| | | | Share | | Capital | | | | | | | | Profit | | Total equity | |
| | | | premium | | redemption | | Capital | | Other | | Own shares | | and loss | | shareholders’ | |
| | Share capital | | account | | reserve | | reserve | | reserves | | held | | account | | funds | |
| | £m | | £m | | £m | | £m | | £m | | £m | | £m | | £m | |
|
|
|
|
|
|
|
|
|
|
|
|
|
|
|
| |
| 1 April 2005 as previously reported | 4,286 | | 52,284 | | – | | 88 | | 629 | | (5,085 | ) | 18,992 | | 71,194 | |
| Prior year adjustment – implementation of FRS 20 | – | | – | | – | | – | | 419 | | – | | – | | 419 | |
| Prior year adjustment – implementation of FRS 21 | – | | – | | – | | – | | – | | – | | 1,395 | | 1,395 | |
| Prior year adjustment – implementation of FRS 26 | – | | – | | – | | – | | – | | – | | 182 | | 182 | |
|
|
|
|
|
|
|
|
|
|
|
|
|
|
|
| |
| 1 April 2005 | 4,286 | | 52,284 | | – | | 88 | | 1,048 | | (5,085 | ) | 20,569 | | 73,190 | |
| Issue of new shares | 7 | | 152 | | – | | – | | – | | – | | – | | 159 | |
| Purchase of own shares | – | | – | | – | | – | | – | | (6,500 | ) | – | | (6,500 | ) |
| Own shares released on vesting of share awards | – | | 8 | | – | | – | | – | | 346 | | – | | 354 | |
| Cancellation of own shares held | (128 | ) | – | | 128 | | – | | – | | 3,053 | | (3,053 | ) | – | |
| Profit for the financial year | – | | – | | – | | – | | – | | – | | 12,671 | | 12,671 | |
| Dividends | – | | – | | – | | – | | – | | – | | (2,753 | ) | (2,753 | ) |
| Capital contribution given relating to share based payments | – | | – | | – | | – | | 114 | | – | | – | | 114 | |
| Contribution received relating to share based payments | – | | – | | – | | – | | (150 | ) | – | | – | | (150 | ) |
| Other movements | – | | – | | – | | – | | – | | – | | 18 | | 18 | |
|
|
|
|
|
|
|
|
|
|
|
|
|
|
|
| |
| 31 March 2006 | 4,165 | | 52,444 | | 128 | | 88 | | 1,012 | | (8,186 | ) | 27,452 | | 77,103 | |
|
|
|
|
|
|
|
|
|
|
|
|
|
|
|
| |
In accordance with the exemption allowed by section 230 in the Companies Act 1985, no profit and loss account has been presented by the Company. The profit for the financial year dealt with in the accounts of the Company is £12,671 million (2005 restated: £10,583 million). Under English law, the amount available for distribution to shareholders is based upon the profit and loss reserve of the Company and is reduced by the amount of own shares held and is limited by statutory or other restrictions.
The auditor remuneration for audit services to the Company was £0.6 million (2005: £0.5 million). The Company paid no audit fees in relation to non audit services to the Company for the years ended 31 March 2006 and 31 March 2005.
The directors are remunerated by Vodafone Group Plc for their services to the Group as a whole. No remuneration was paid to them specifically in respect of their services to Vodafone Group Plc for either year. Full details of the directors’ remuneration are disclosed in the Directors’ Remuneration Report in the Vodafone Group Plc Annual Report 2006.
There were no employees other than directors of the Company throughout the current or the preceding year.
9. Equity dividends
| | 2006 | | 2005 | |
| | £m | | £m | |
|
|
|
| |
| Declared and paid during the financial year: | | | | |
| Final dividend for the year ended 31 March 2005: 2.16 pence per share | | | | |
| (2004: 1.078 pence per share) | 1,386 | | 728 | |
| Interim dividend for the year ended 31 March 2006: 2.20 pence per share | | | | |
| (2005: 1.91 pence per share) | 1,367 | | 1,263 | |
|
|
|
| |
| | 2,753 | | 1,991 | |
|
|
|
| |
| Proposed or declared after the balance sheet date and not recognised as a liability: | | | | |
| Final dividend for the year ended 31 March 2006: 3.87 pence per share | | | | |
| (2005: 2.16 pence per share) | 2,327 | | 1,386 | |
|
|
|
| |
| Vodafone Group Plc Annual Report 2006 | 137 |
Back to Contents
Notes to the Company Financial Statements
continued
10. Contingent liabilities
| | 2006 | | 2005 | |
| | £m | | £m | |
|
|
|
| |
| Performance bonds | 172 | | 176 | |
| Credit guarantees – third party indebtedness | 1,570 | | 1,424 | |
| Other guarantees and contingent liabilities | 1 | | 1 | |
|
|
|
| |
|
Performance bonds
Performance bonds require the Company to make payments to third parties in the event that the Company or its subsidiary undertakings do not perform what is expected of it under the terms of any related contracts.
Company performance bonds include £152 million (2005: £149 million) in respect of undertakings to roll out third generation networks in Spain.
Credit guarantees – third party indebtedness
Credit guarantees comprise guarantees and indemnities of bank or other facilities.
At 31 March 2006, the Company had guaranteed debt of Vodafone Finance K.K. amounting to £1,268 million (2005: £1,111 million) and issued guarantees in respect of notes issued by Vodafone Americas, Inc. amounting to £302 million (2005: £311 million). The Japanese facility expires by March 2011 and the majority of Vodafone Americas, Inc. bond guarantees by July 2008.
Other guarantees and contingent liabilities
Other guarantees principally comprise commitments to support disposed entities.
Legal proceedings
Details regarding certain legal actions which involve the Company are set out in note 31 to the Consolidated Financial Statements.
| 138 | Vodafone Group Plc Annual Report 2006 |
Back to Contents
Independent Auditor’s Report to the Members of Vodafone Group Plc
We have audited the individual Company Financial Statements of Vodafone Group Plc for the year ended 31 March 2006 which comprise the balance sheet and the related notes 1 to 10. These individual Company Financial Statements have been prepared under the accounting policies set out therein.
The corporate governance statement and the directors’ remuneration report are included in the Group annual report of Vodafone Group Plc for the year ended 31 March 2006. We have reported separately on the Consolidated Financial Statements of Vodafone Group Plc for the year ended 31 March 2006 and on the information in the directors’ remuneration report that is described as having been audited.
Respective responsibilities of directors and auditors
The directors’ responsibilities for preparing the annual report and the individual Company Financial Statements in accordance with applicable law and United Kingdom Accounting Standards (United Kingdom Generally Accepted Accounting Practice) are set out in the statement of directors’ responsibilities.
Our responsibility is to audit the individual Company Financial Statements in accordance with relevant United Kingdom legal and regulatory requirements and International Standards on Auditing (UK and Ireland).
We report to you our opinion as to whether the individual Company Financial Statements give a true and fair view in accordance with the relevant financial reporting framework and whether the individual Company Financial Statements have been properly prepared in accordance with the Companies Act 1985. We report to you if in our opinion the information given in the directors’ report is not consistent with the individual Company Financial Statements. We also report to you if, in our opinion, the Company has not kept proper accounting records, if we have not received all the information and explanations we require for our audit, or if information specified by law regarding directors’ remuneration and other transactions is not disclosed.
We read the directors’ report and the other information contained in the annual report for the above year as described in the contents section and consider the implications for our report if we become aware of any apparent misstatements or material inconsistencies with the individual Company Financial Statements.
Basis of audit opinion
We conducted our audit in accordance with International Standards on Auditing (UK and Ireland) issued by the Auditing Practices Board. An audit includes examination, on a test basis, of evidence relevant to the amounts and disclosures in the individual Company Financial Statements. It also includes an assessment of the significant estimates and judgements made by the directors in the preparation of the individual Company Financial Statements, and of whether the accounting policies are appropriate to the Company’s circumstances, consistently applied and adequately disclosed.
We planned and performed our audit so as to obtain all the information and explanations which we considered necessary in order to provide us with sufficient evidence to give reasonable assurance that the individual Company Financial Statements are free from material misstatement, whether caused by fraud or other irregularity or error. In forming our opinion we also evaluated the overall adequacy of the presentation of information in the individual Company Financial Statements.
Opinion
In our opinion:
| • | the individual Company Financial Statements give a true and fair view, in accordance with United Kingdom Generally Accepted Accounting Practice, of the state of the Company's affairs as at 31 March 2006; |
| | |
| • | the individual Company Financial Statements have been properly prepared in accordance with the Companies Act 1985; and |
| | |
| • | the information given in the directors’ report is consistent with the Company Financial Statements. |

Deloitte & Touche LLP
Chartered Accountants and Registered Auditors
London
United Kingdom
30 May 2006
| Vodafone Group Plc Annual Report 2006 | 139 |
Back to Contents
Investor information
Financial calendar for the 2007 financial year | |
|
| |
| Annual General Meeting (see below) | 25 July 2006 | |
| Interim Results announcement | 14 November 2006 | |
| Preliminary announcement of full year results | 23 May 2007 | |
|
| |
Dividends
Full details on the dividend amount per share or ADS can be found on page 38. Set out below is information relevant to the final dividend for the year ended 31 March 2006. | |
|
| |
| Ex-dividend date | 7 June 2006 | |
| Record date | 9 June 2006 | |
| Dividend reinvestment plan election date | 14 July 2006 | |
| Dividend payment date | 4 August 2006 | (1) |
|
| |
| Note: |
| (1) | Payment date for both ordinary shares and ADSs. |
Dividend payment methods
Holders of ordinary shares can:
| • | have cash dividends paid direct to a bank or building society account; or |
| | |
| • | have cash dividends paid in the form of a cheque; or |
| | |
| • | elect to use the cash dividends to purchase more Vodafone shares under the Dividend Reinvestment Plan (see below). |
If a holder of ordinary shares does decide to receive cash dividends, it is recommended that these are paid directly to the shareholder’s bank or building society account via BACS or EFTS. This avoids the risk of cheques being lost in the post and means the dividend will be in the shareholder’s account on the dividend payment date. The shareholder will be sent a tax voucher confirming the amount of dividend and the account into which it has been paid.
Please contact the Company’s Registrars for further details.
Holders of ADSs can:
| • | have cash dividends paid direct to a bank account; or |
| | |
| • | have cash dividends paid by cheque; or |
| | |
| • | elect to have the dividends reinvested to purchase additional Vodafone ADSs (see below for contact details). |
Dividend reinvestment
The Company offers a Dividend Reinvestment Plan which allows holders of ordinary shares who choose to participate to use their cash dividends to acquire additional shares in the Company. These are purchased on their behalf by the Plan Administrator through a low cost dealing arrangement. Further details can be obtained from the Plan Administrator on +44 (0) 870 702 0198.
For ADS holders, The Bank of New York maintains a Global BuyDIRECT Plan for the Company, which is a direct purchase and sale plan for depositary receipts, with a dividend reinvestment facility. For additional information, please call toll-free from within the US on +1 800 233 5601, or write to:
| | The Bank of New York
Shareholder Relations Department
Global BuyDIRECT
P.O. Box 1958
Newark
New Jersey 07101-1958
USA |
For calls from outside the US, call +1 212 815 3700.
Please note that this number is not toll-free.
Telephone share dealing
A telephone share dealing service with the Company’s Registrars is available for holders of ordinary shares. The service is available from 8.00 am to 4.30 pm, Monday to Friday, excluding bank holidays, on telephone number +44 (0) 870 703 0084.
Detailed terms and conditions are available on request by calling the above number.
Postal share dealing
A postal share dealing service is available for holders of ordinary shares with 1,000 shares or fewer who want to either increase their holding or sell their entire holding.
Further information about this service can be obtained from the Company’s Registrars on +44 (0) 870 702 0198.
Registrars and transfer office
The Company’s ordinary share register is maintained by:
| | Computershare Investor Services PLC
P.O. Box 82
The Pavilions, Bridgwater Road
Bristol BS99 7NH
England |
| | |
| | Telephone: +44 (0) 870 702 0198 Fax: + 44 (0) 870 703 6101
Email: web.queries@computershare.co.uk |
Holders of ordinary shares resident in Ireland should contact:
| | Computershare Investor Services (Ireland) Limited
P.O. Box 9742
Dublin 18
Ireland |
| | |
| | Telephone: +353 (0) 818 300 999 or Fax: +353 (0) 1 216 3151
Email: web.queries@computershare.ie |
Any queries about the administration of holdings of ordinary shares, such as change of address, change of ownership or dividend payments, should be directed to the Company’s Registrars at the relevant address or telephone number immediately above. Holders of ordinary shares may also check details of their shareholding, subject to passing an identity check, on the Registrars’ website at www.computershare.com
The Depositary Bank for the Company’s ADR programme is:
| | The Bank of New York
Investor Relations Dept, P.O. Box 11258
Church St. Station
New York, NY 10286-1258
USA |
| | |
| | Telephone: +1 (800) 233 5601 (Toll free) |
ADS holders should address any queries or instructions regarding their holdings to The Bank of New York at the above address or telephone number. ADS holders can also, subject to passing an identity check, view their account balances and transaction history, sell shares and request certificates from their Global BuyDIRECT Plan at www.stockbny.com.
| 140 | Vodafone Group Plc Annual Report 2006 |
Back to Contents
Online shareholder services
The Company provides a number of shareholder services online at www.vodafone.com/shareholder, where shareholders may:
| • | Register to receive electronic shareholder communications. Benefits to shareholders include faster receipt of communications such as annual reports, with cost and time savings for the Company. Electronic shareholder communications are also more environmentally friendly; |
| | |
| • | View a live webcast of the AGM of the Company on 25 July 2006. A recording will be available to review after that date; |
| | |
| • | View and/or download the Annual Report and the Annual Review & Summary Financial Statement 2006; |
| | |
| • | Check the current share price; |
| | |
| • | Calculate dividend payments; and |
| | |
| • | Use interactive tools to calculate the value of shareholdings, look up the historic price on a particular date and chart Vodafone ordinary share price changes against indices. |
Shareholders and other interested parties can also receive Company press releases, including London Stock Exchange announcements, by registering for Vodafone News via the Company’s website at www.vodafone.com/news.
Registering for Vodafone News will enable users to:
| • | be alerted by free SMS as soon as news breaks; |
| | |
| • | access the latest news from their mobile; and |
| | |
| • | have news automatically e-mailed to them. |
Annual General Meeting
The twenty-second AGM of the Company will be held at The Queen Elizabeth II Conference Centre, Broad Sanctuary, Westminster, London SW1 on 25 July 2006 at 11.00 a.m. or, if later, on conclusion of the Extraordinary General Meeting to be held immediately before it at 10.45 a.m.
The Notice of Meeting, together with details of the business to be conducted at the Meeting, is being circulated to shareholders with this Annual Report or the Annual Review & Summary Financial Statement and can be viewed at the Company’s website – www.vodafone.com/agm.
The AGM will be transmitted via a live webcast and can be viewed at the Company’s website – www.vodafone.com/agm – on the day of the meeting and a recording will be available to review after that date.
To find out more about the AGM and how to view the webcast, visit www.vodafone.com/agm.
Corporate sponsored nominee service for shareholders
Subject to changes to the Company’s Articles of Association being approved at the Annual General Meeting on 25 July 2006, the Company intends to establish a Corporate Nominee Service for Shareholders, which would be operated by the Company’s Registrar. The service provides a facility for shareholders to remove their shares from the Vodafone Group Plc share register and hold them, together with other shareholders through a nominee. There would be no need for a share certificate and, in addition, shareholders’ details will not be held on the main register and so will remain confidential.
Details will be available frollowing the AGM on the Company’s website at www.vodafone.com/shareholder.
ShareGift
The Company supports ShareGift, the charity share donation scheme (registered charity number 1052686). Through ShareGift, shareholders who have only a very small number of shares which might be considered uneconomic to sell are able to donate them to charity. Donated shares are aggregated and sold by ShareGift, the proceeds being passed on to a wide range of UK charities. Donating shares to charity gives rise neither to a gain nor a loss for UK Capital Gains purposes and UK taxpayers may also be able to claim income tax relief on the value of the donation.
ShareGift transfer forms specifically for the Company’s shareholders are available from the Company’s Registrars, Computershare Investor Services PLC and, even if the share certificate has been lost or destroyed, the gift can be completed. The service is generally free. However, there may be an indemnity charge for a lost or destroyed share certificate where the value of the shares exceeds £100. Further details about ShareGift can be obtained from its website at www.ShareGift.org or at 5 Lower Grosvenor Place, London SW1W 0EJ (telephone: +44 (0) 20 7828 1151).
The Unclaimed Assets Register
The Company participates in the Unclaimed Assets Register, which provides a search facility for financial assets which may have been forgotten and which donates a proportion of its public search fees to a group of three UK charities (Age Concern, NSPCC and Scope). For further information, contact The Unclaimed Assets Register, Garden Floor, Bain House, 16 Connaught Place, London W2 2ES (telephone: +44 (0) 870 241 1713), or visit its website at www.uar.co.uk.
Share price history
Upon flotation of the Company on 11 October 1988, the ordinary shares were valued at 170 pence each. On 16 September 1991, when the Company was finally demerged, for UK taxpayers the base cost of Racal Electronics Plc shares was apportioned between the Company and Racal Electronics Plc for Capital Gains Tax purposes in the ratio of 80.036% and 19.964% respectively. Opening share prices on 16 September 1991 were 332 pence for each Vodafone share and 223 pence for each Racal share.
On 21 July 1994, the Company effected a bonus issue of two new shares for every one then held and, on 30 September 1999, it effected a bonus issue of four new shares for every one held at that date. The flotation and demerger share prices, therefore, may be restated as 11.333 pence and 22.133 pence, respectively.
The share price at 31 March 2006 was 120.50 pence (31 March 2005: 140.50 pence). The share price on 26 May 2006 was 119.75 pence.
The following tables set out, for the periods indicated, (i) the reported high and low middle market quotations of ordinary shares on the London Stock Exchange, (ii) the reported high and low sales prices of ordinary shares on the Frankfurt Stock Exchange, and (iii) the reported high and low sales prices of ADSs on the NYSE.
The Company’s ordinary shares were traded on the Frankfurt Stock Exchange from 3 April 2000 until 23 March 2004 and, therefore, information has not been provided for periods outside these dates.
Five year data on an annual basis
| | | London Stock | | Frankfurt | | | |
| | | Exchange | | Stock Exchange | | NYSE | |
| | | Pounds per | | Euros per | | Dollars | |
| | | ordinary share | | ordinary share | | per ADS | |
| | |
| |
| |
| |
| Financial Year | | High | | Low | | High | | Low | | High | | Low | |
|
|
|
|
|
|
|
|
|
|
|
|
| |
| 2001/2002 | | 2.29 | | 1.24 | | 3.70 | | 2.00 | | 33.26 | | 17.88 | |
| 2002/2003 | | 1.31 | | 0.81 | | 2.15 | | 1.26 | | 20.30 | | 12.76 | |
| 2003/2004 | | 1.50 | | 1.12 | | 2.22 | | 1.59 | | 27.88 | | 18.10 | |
| 2004/2005 | | 1.49 | | 1.14 | | – | | – | | 28.54 | | 20.83 | |
| 2005/2006 | | 1.55 | | 1.09 | | – | | – | | 28.04 | | 19.32 | |
|
|
|
|
|
|
|
|
|
|
|
|
| |
Two year data on a quarterly basis
| | London Stock | | | |
| | Exchange | | NYSE | |
| | Pounds per | | Dollars | |
| | ordinary share | | per ADS | |
| |
| |
| |
| Financial Year | High | | Low | | High | | Low | |
|
|
|
|
|
|
|
| |
| 2004/2005 | | | | | | | | |
| First Quarter | 1.44 | | 1.21 | | 25.90 | | 21.87 | |
| Second Quarter | 1.34 | | 1.14 | | 24.21 | | 20.83 | |
| Third Quarter | 1.49 | | 1.32 | | 28.54 | | 24.06 | |
| Fourth Quarter | 1.46 | | 1.35 | | 27.53 | | 25.60 | |
|
|
|
|
|
|
|
| |
| 2005/2006 | | | | | | | | |
| First Quarter | 1.47 | | 1.34 | | 26.87 | | 24.32 | |
| Second Quarter | 1.55 | | 1.36 | | 28.04 | | 23.90 | |
| Third Quarter | 1.52 | | 1.23 | | 26.65 | | 21.29 | |
| Fourth Quarter | 1.33 | | 1.09 | | 23.39 | | 19.32 | |
|
|
|
|
|
|
|
| |
| 2006/2007 | | | | | | | | |
| First Quarter(1) | 1.30 | | 1.14 | | 24.23 | | 21.07 | |
|
|
|
|
|
|
|
| |
| Note: |
| (1) | Covering period up to 26 May 2006. |
| Vodafone Group Plc Annual Report 2006 | 141 |
Back to Contents
Investor information
continued
Six month data on a monthly basis
| | London Stock | | | |
| | Exchange | | NYSE | |
| | Pounds per | | Dollars | |
| | ordinary share | | per ADS | |
| |
| |
| |
| Financial Year | High | | Low | | High | | Low | |
|
|
|
|
|
|
|
| |
| November 2005 | 1.52 | | 1.25 | | 26.65 | | 21.55 | |
| December 2005 | 1.29 | | 1.23 | | 22.66 | | 21.29 | |
| January 2006 | 1.33 | | 1.18 | | 23.39 | | 20.86 | |
| February 2006 | 1.25 | | 1.09 | | 21.81 | | 19.32 | |
| March 2006 | 1.30 | | 1.12 | | 22.74 | | 19.55 | |
| April 2006 | 1.30 | | 1.21 | | 23.70 | | 21.07 | |
| May 2006(1) | 1.30 | | 1.14 | | 24.23 | | 21.53 | |
|
|
|
|
|
|
|
| |
| Note: |
| (1) | High and low share prices for May 2006 only reported until 26 May 2006. |
| |
| The current authorised share capital comprises 78,000,000,000 ordinary shares of $0.10 each and 50,000 7% cumulative fixed rate shares of £1.00 each. |
Markets
Ordinary shares of Vodafone Group Plc are traded on the London Stock Exchange and, in the form of ADSs, on the New York Stock Exchange.
ADSs, each representing ten ordinary shares, are traded on the New York Stock Exchange under the symbol ‘VOD’. The ADSs are evidenced by ADRs issued by The Bank of New York, as Depositary, under a Deposit Agreement, dated as of 12 October 1988, as amended and restated as of 26 December 1989, as further amended and restated as of 16 September 1991 and as further amended and restated as of 30 June 1999, between the Company, the Depositary and the holders from time to time of ADRs issued thereunder.
ADS holders are not members of the Company but may instruct The Bank of New York on the exercise of voting rights relative to the number of ordinary shares represented by their ADSs. See “Memorandum and Articles of Association and Applicable English Law –Rights attaching to the Company’s shares – Voting rights” below.
Shareholders at 31 March 2006
| Number of | | | % of total | |
| ordinary shares | Number of | | issued | |
| held | accounts | | shares | |
|
|
|
| |
| 1 – 1,000 | 439,814 | | 0.19 | |
| 1,001 – 5,000 | 102,534 | | 0.33 | |
| 5,001– 50,000 | 28,540 | | 0.57 | |
| 50,001 – 100,000 | 1,451 | | 0.15 | |
| 100,001– 500,000 | 1,292 | | 0.45 | |
| More than 500,000 | 1,937 | | 98.31 | |
|
|
|
| |
| | 575,568 | | 100.00 | |
|
|
|
| |
Geographical analysis of shareholders
At 31 March 2006, approximately 52.68% of the Company’s shares were held in the UK, 32.04% in North America, 12.86% in Europe (excluding the UK) and 2.42% in the Rest of the World.
Major shareholders
The Bank of New York, as custodian of the Company’s ADR programme, held approximately 12.8% of the Company’s ordinary shares of $0.10 each at 26 May 2006 as nominee. The total number of ADRs outstanding at 26 May 2006 was 773,146,523. At this date, 1,147 holders of record of ordinary shares had registered addresses in the United States and in total held approximately 0.006% of the ordinary shares of the Company. As at 26 May 2006, the following percentage interests in the ordinary share capital of the Company, disclosable under Part VI of the Companies Act 1985, have been notified to the directors:
| Shareholder | Shareholding | |
|
| |
| The Capital Group Companies, Inc. | 5.56% | |
| Barclays PLC | 3.92% | |
| Legal & General Investment Management | 3.67% | |
|
| |
The rights attaching to the ordinary shares of the Company held by these shareholders are identical in all respects to the rights attaching to all the ordinary shares of the Company. The directors are not aware, as at 26 May 2006, of any other interest of 3% or more in the ordinary share capital of the Company. The Company is not directly or indirectly owned or controlled by any foreign government or any other legal entity. There are no arrangements known to the Company that could result in a change of control of the Company.
Memorandum and Articles of Association and Applicable
English law
The following description summarises certain provisions of the Company’s Memorandum and Articles of Association and applicable English law. This summary is qualified in its entirety by reference to the Companies Act 1985 of Great Britain (the “Companies Act”), as amended, and the Company’s Memorandum and Articles of Association. Information on where shareholders can obtain copies of the Memorandum and Articles of Association is provided under “Documents on Display”.
All of the Company’s ordinary shares are fully paid. Accordingly, no further contribution of capital may be required by the Company from the holders of such shares.
English law specifies that any alteration to the Articles of Association must be approved by a special resolution of the shareholders.
The Company’s Objects
The Company is a public limited company under the laws of England and Wales. The Company is registered in England and Wales under the name Vodafone Group Public Limited Company, with the registration number 1833679. The Company’s objects are set out in the fourth clause of its Memorandum of Association and cover a wide range of activities, including to carry on the business of a holding company, to carry on business as dealers in, operators, manufacturers, repairers, designers, developers, importers and exporters of electronic, electrical, mechanical and aeronautical equipment of all types as well as to carry on all other businesses necessary to attain the Company’s objectives. The Memorandum of Association grants the Company a broad range of powers to effect its objects.
Directors
The Company’s Articles of Association provide for a Board of directors, consisting of not fewer than three directors, who shall manage the business and affairs of the Company.
Under the Company’s Articles of Association, a director cannot vote in respect of any proposal in which the director, or any person connected with the director, has a material interest other than by virtue of the director’s interest in the Company’s shares or other securities. However, this restriction on voting does not apply to resolutions (a) giving the director or a third party any guarantee, security or indemnity in respect of obligations or liabilities incurred at the request of or for the benefit of the Company, (b) giving any guarantee, security or indemnity to the director or a third party in respect of obligations of the Company for which the director has assumed responsibility under an indemnity or guarantee, (c) relating to an offer of securities of the Company in which the director participates as a holder of shares or other securities or in the underwriting of such shares or securities, (d) concerning any other company in which the director (together with any connected person) is a shareholder or an officer or is otherwise interested, provided that the director (together with any connected person) is not interested in 1% or more of any class of the company’s equity share capital or the voting rights available to its shareholders, (e) relating to the arrangement of any employee benefit in which the director will share equally with other employees and (f) relating to any insurance that the Company purchases or renews for its directors or any group of people, including directors.
The directors are empowered to exercise all the powers of the Company to borrow money, subject to the limitation that the aggregate amount of all liabilities and obligations of the Group outstanding at any time shall not exceed an amount equal to 1.5 times the aggregate of the Group’s share capital and reserves calculated in the manner prescribed in the Articles of Association, unless sanctioned by an ordinary resolution of the Company’s shareholders.
In accordance with the Company’s Articles of Association, directors retiring at each AGM are those last elected or re-elected at or before the AGM held in the third calendar year before the current year. In 2005, the Company reviewed its policy regarding the retirement and re-election of directors and, although it is not intended to amend the Company’s Articles in this regard, the Board has decided, in the interests of good corporate governance, that all the directors should offer themselves for re-election annually. Accordingly, all the directors will submit themselves for re-election at the 2006 AGM, except for Lord MacLaurin of Knebworth, Sir Julian Horn-Smith, Paul Hazen and Penny Hughes, who are retiring.
| 142 | Vodafone Group Plc Annual Report 2006 |
Back to Contents
No person is disqualified from being a director or is required to vacate that office by reason of age. If, at a general meeting, a director who is 70 or more years of age is proposed for election or re-election, that director’s age must be set out in the notice of the meeting.
Directors are not required, under the Company’s Articles, to hold any shares of the Company as a qualification to act as a director, although executive directors participating in long term incentive plans must comply with the Company’s share ownership guidelines. In accordance with best practice in the UK for corporate governance, compensation awarded to executive directors is decided by a remuneration committee consisting exclusively of non-executive directors.
In addition, as required by The Directors’ Remuneration Report Regulations, the Board has, since 2003, prepared a report to shareholders on the directors’ remuneration which complies with the Regulations (see pages 61 to 69). The report is also subject to a shareholder vote.
Rights attaching to the Company’s shares
Dividend rights
Holders of the Company’s ordinary shares may by ordinary resolution declare dividends but may not declare dividends in excess of the amount recommended by the directors. The Board of directors may also pay interim dividends. No dividend may be paid other than out of profits available for distribution. Dividends on ordinary shares will be announced in pounds sterling. Holders of ordinary shares with a registered address in a euro-zone country (defined, for this purpose, as a country that has adopted the euro as its national currency) will receive their dividends in euro, exchanged from pounds sterling at a rate fixed by the Board of directors in accordance with the Articles of Association. Dividends for ADS holders represented by ordinary shares held by the Depositary will be paid to the Depositary in US dollars, exchanged from pounds sterling at a rate fixed by the directors in accordance with the Articles of Association, and the Depositary will distribute them to the ADS holders.
If a dividend has not been claimed for one year after the later of the resolution passed at a general meeting declaring that dividend or the resolution of the directors providing for payment of that dividend, the directors may invest the dividend or use it in some other way for the benefit of the Company until the dividend is claimed. If the dividend remains unclaimed for 12 years after the relevant resolution either declaring that dividend or providing for payment of that dividend, it will be forfeited and belong to the Company.
Voting rights
The Company’s Articles of Association provide that voting on Substantive Resolutions (i.e. any resolution which is not a Procedural Resolution) at a general meeting shall be decided on a poll. On a poll, each shareholder who is entitled to vote and is present in person or by proxy has one vote for every share held. Procedural Resolutions (such as a resolution to adjourn a General Meeting or a resolution on the choice of Chairman of a General Meeting) shall be decided on a show of hands, where each shareholder who is present at the meeting has one vote regardless of the number of shares held, unless a poll is demanded. In addition, the Articles of Association allow persons appointed as proxies of shareholders entitled to vote at general meetings to vote on a show of hands, as well as to vote on a poll and attend and speak at general meetings. Holders of the Company’s ordinary shares do not have cumulative voting rights.
Under English law, two shareholders present in person constitute a quorum for purposes of a general meeting, unless a company’s articles of association specify otherwise. The Company’s Articles of Association do not specify otherwise, except that the shareholders do not need to be present in person, and may instead be present by proxy, to constitute a quorum.
Under English law, shareholders of a public company such as the Company are not permitted to pass resolutions by written consent.
Record holders of the Company’s ADSs are entitled to attend, speak and vote on a poll or a show of hands at any general meeting of the Company’s shareholders by the Depositary’s appointment of them as corporate representatives with respect to the underlying ordinary shares represented by their ADSs. Alternatively, holders of ADSs are entitled to vote by supplying their voting instructions to the Depositary or its nominee, who will vote the ordinary shares underlying their ADSs in accordance with their instructions.
Employees are able to vote any shares held under the Vodafone Group Share Incentive Plan and “My ShareBank” (a vested share account) through the respective plan’s trustees, Mourant ECS Trustees Limited.
Liquidation rights
In the event of the liquidation of the Company, after payment of all liabilities and deductions in accordance with English law, the holders of the Company’s 7% cumulative fixed rate shares would be entitled to a sum equal to the capital paid up on such shares,
together with certain dividend payments, in priority to holders of the Company’s ordinary shares. The holders of the fixed rate shares do not have any other right to share in the Company’s surplus assets.
Pre-emptive rights and new issues of shares
Under Section 80 of the Companies Act, directors are, with certain exceptions, unable to allot relevant securities without the authority of the shareholders in a general meeting. Relevant securities as defined in the Companies Act include the Company’s ordinary shares or securities convertible into the Company’s ordinary shares. In addition, Section 89 of the Companies Act imposes further restrictions on the issue of equity securities (as defined in the Companies Act, which include the Company’s ordinary shares and securities convertible into ordinary shares) which are, or are to be, paid up wholly in cash and not first offered to existing shareholders. The Company’s Articles of Association allow shareholders to authorise directors for a period up to five years to allot (a) relevant securities generally up to an amount fixed by the shareholders and (b) equity securities for cash other than in connection with a rights issue up to an amount specified by the shareholders and free of the restriction in Section 89. In accordance with institutional investor guidelines, the amount of relevant securities to be fixed by shareholders is normally restricted to one third of the existing issued ordinary share capital, and the amount of equity securities to be issued for cash other than in connection with a rights issue is restricted to 5% of the existing issued ordinary share capital.
Disclosure of interests in the Company’s shares
There are no provisions in the Articles of Association whereby persons acquiring, holding or disposing of a certain percentage of the Company’s shares are required to make disclosure of their ownership percentage, although such requirements exist under the Companies Act.
The basic disclosure requirement under Sections 198 to 211 of the Companies Act imposes upon a person interested in the shares of the Company a statutory obligation to provide written notification to the Company, including certain details as set out in the Companies Act, where:
| (a) | he acquires (or becomes aware that he has acquired) or ceases to have (or becomes aware that he has ceased to have) an interest in shares comprising any class of the Company’s issued and voting share capital; and |
| | |
| (b) | as a result, EITHER he obtains, or ceases to have: |
| | | |
| | (i) | a “material interest” in 3%, or more; or |
| | | |
| | (ii) | an aggregate interest (whether “material” or not) in 10%, or more of the Company’s voting capital; or |
| | | |
| | (iii) | the percentage of his interest in the Company’s voting capital remains above the relevant level and changes by a whole percentage point. |
A “material interest” means, broadly, any beneficial interest (including those of a spouse or a child or a step-child (under the age of 18), those of a company which is accustomed to act in accordance with the relevant person’s instructions or in which one third or more of the votes are controlled by such person and certain other interests set out in the Companies Act) other than those of an investment manager or an operator of a unit trust/recognised scheme/collective investment scheme/open-ended investment company.
Sections 204 to 206 of the Companies Act set out particular rules of disclosure where two or more parties (each a “concert party”) have entered into an agreement to acquire interests in shares of a public company, and the agreement imposes obligations/restrictions on any concert party with respect to the use, retention or disposal of the shares in the company and an acquisition of shares by a concert party pursuant to the agreement has taken place.
Under Section 212 of the Companies Act, the Company may by notice in writing require a person that the Company knows or has reasonable cause to believe is or was during the preceding three years interested in the Company’s shares to indicate whether or not that is correct and, if that person does or did hold an interest in the Company’s shares, to provide certain information as set out in the Companies Act.
Sections 324 to 329 of the Companies Act further deal with the disclosure by persons (and certain members of their families) of interests in shares or debentures of the companies of which they are directors and certain associated companies.
There are additional disclosure obligations under Rule 3 of the Substantial Acquisitions Rules where a person acquires 15% or more of the voting rights of a listed company or when an acquisition increases his holding of shares or rights over shares so as to increase his voting rights beyond that level by a whole percentage point. Notification in this case should be to the Company, the Panel on Takeovers and Mergers and the UK Listing Authority through one of its approved regulatory information services no later than 12 noon on the business day following the date of the acquisition.
| Vodafone Group Plc Annual Report 2006 | 143 |
Back to Contents
Investor information
continued
The City Code on Takeovers and Mergers also contains strict disclosure requirements on all parties to a takeover with regard to dealings in the securities of an offeror or offeree company and also on their respective associates during the course of an offer period.
General meetings and notices
Annual general meetings are held at such times and place as determined by the directors of the Company. The directors may also, when they think fit, convene an extraordinary general meeting of the Company. Extraordinary general meetings may also be convened on requisition as provided by the Companies Act.
An annual general meeting and an extraordinary general meeting called for the passing of a special resolution need to be called by not less than twenty-one days’ notice in writing and all other extraordinary general meetings by not less than fourteen days’ notice in writing. The directors may determine that persons entitled to receive notices of meetings are those persons entered on the register at the close of business on a day determined by the directors but not later than twenty-one days before the date the relevant notice is sent. The notice may also specify the record date, which shall not be more than forty-eight hours before the time fixed for the meeting.
Shareholders must provide the Company with an address or (so far as the Companies Act allows) an electronic address or fax number in the United Kingdom in order to be entitled to receive notices of shareholders’ meetings and other notices and documents. In certain circumstances, the Company may give notices to shareholders by advertisement in newspapers in the United Kingdom. Holders of the Company’s ADSs are entitled to receive notices under the terms of the Deposit Agreement relating to the ADSs.
Under Section 366 of the Companies Act 1985 and the Company’s Articles of Association, the annual general meeting of shareholders must be held each calendar year with no more than fifteen months elapsing since the date of the preceding annual general meeting.
Variation of rights
If, at any time, the Company’s share capital is divided into different classes of shares, the rights attached to any class may be varied, subject to the provisions of the Companies Act, either with the consent in writing of the holders of three fourths in nominal value of the shares of that class or upon the adoption of an extraordinary resolution passed at a separate meeting of the holders of the shares of that class.
At every such separate meeting, all of the provisions of the Articles of Association relating to proceedings at a general meeting apply, except that (a) the quorum is to be the number of persons (which must be at least two) who hold or represent by proxy not less than one-third in nominal value of the issued shares of the class or, if such quorum is not present on an adjourned meeting, one person who holds shares of the class regardless of the number of shares he holds, (b) any person present in person or by proxy may demand a poll, and (c) each shareholder will have one vote per share held in that particular class in the event a poll is taken.
Class rights are deemed not to have been varied by the creation or issue of new shares ranking equally with or subsequent to that class of shares in sharing in profits or assets of the Company or by a redemption or repurchase of the shares by the Company.
Limitations on voting and shareholding
There are no limitations imposed by English law or the Company’s Articles of Association on the right of non-residents or foreign persons to hold or vote the Company’s shares other than those limitations that would generally apply to all of the shareholders.
Documents on display
The Company is subject to the information requirements of the US Securities and Exchange Act of 1934 applicable to foreign private issuers. In accordance with these requirements, the Company files its Annual Report on Form 20-F and other related documents with the SEC. These documents may be inspected at the SEC’s public reference rooms located at 450 Fifth Street, NW Washington, DC 20549. Information on the operation of the public reference room can be obtained in the US by calling the SEC on +1-800-SEC-0330. In addition, some of the Company’s SEC filings, including all those filed on or after 4 November 2002, are available on the SEC’s website at www.sec.gov. Shareholders can also obtain copies of the Company’s Memorandum and Articles of Association from the Vodafone website at www.vodafone.com or from the Company’s registered office.
Material contracts
At the date of this Annual Report, the Group is not party to any contracts that are considered material to the Group’s results or operations, except for its $10.9 billion credit facilities which are discussed under “Financial Position and Resources – Liquidity and Cash Resources”.
Exchange controls
There are no UK government laws, decrees or regulations that restrict or affect the export or import of capital, including but not limited to, foreign exchange controls on remittance of dividends on the ordinary shares or on the conduct of the Group’s operations, except as otherwise set out under “Taxation” below.
Taxation
As this is a complex area, investors should consult their own tax adviser regarding the US federal, state and local, the UK and other tax consequences of owning and disposing of shares and ADSs in their particular circumstances.
This section describes for a US holder (as defined below), in general terms, the principal US federal income tax and UK tax consequences of owning shares or ADSs in the Company as capital assets (for US and UK tax purposes). This section does not, however, cover the tax consequences for members of certain classes of holders subject to special rules and holders that, directly or indirectly, hold 10 per cent or more of the Company’s voting stock.
A US holder is a beneficial owner of shares or ADSs that is for US federal income tax purposes:
| (i) | a citizen or resident of the United States; |
| | |
| (ii) | a US domestic corporation; |
| | |
| (iii) | an estate the income of which is subject to US federal income tax regardless of its source; or |
| | |
| (iv) | a trust if a US court can exercise primary supervision over the trust’s administration and one or more US persons are authorised to control all substantial decisions of the trust. |
This section is based on the Internal Revenue Code of 1986, as amended, its legislative history, existing and proposed regulations thereunder, published rulings and court decisions, and on the tax laws of the United Kingdom and the Double Taxation Convention between the United States and the United Kingdom (the “Treaty”), all as currently in effect. These laws are subject to change, possibly on a retroactive basis.
This section is further based in part upon the representations of the Depositary and assumes that each obligation in the Deposit Agreement and any related agreement will be performed in accordance with its terms.
Based on this assumption, for purposes of the Treaty and the US-UK double taxation convention relating to estate and gift taxes (the “Estate Tax Convention”), and for US federal income tax and UK tax purposes, a holder of ADRs evidencing ADSs will be treated as the owner of the shares in the Company represented by those ADSs. Generally, exchanges of shares for ADRs, and ADRs for shares, will not be subject to US federal income tax or to UK tax, other than stamp duty or stamp duty reserve tax (see the section on these taxes below).
Taxation of dividends
UK taxation
Under current UK tax law, no withholding tax will be deducted from dividends paid by the Company.
A shareholder that is a company resident for UK tax purposes in the United Kingdom will not be taxable on a dividend it receives from the Company. A shareholder in the Company who is an individual resident for UK tax purposes in the United Kingdom is entitled, in calculating their liability to UK income tax, to a tax credit on cash dividends paid on shares in the Company or ADSs, and the tax credit is equal to one-ninth of the cash dividend.
US federal income taxation
A US holder is subject to US federal income taxation on the gross amount of any dividend paid by the Company out of its current or accumulated earnings and profits (as determined for US federal income tax purposes). Dividends paid to a non-corporate US holder in tax years beginning before 1 January 2009 that constitute qualified dividend income will be taxable to the holder at a maximum tax rate of 15%, provided that the ordinary shares or ADSs are held for more than 60 days during the 121 day period beginning 60 days before the ex-dividend date and the holder meets other holding period requirements. Dividends paid by the Company with respect to the shares or ADSs will generally be qualified dividend income.
A US holder is not subject to a UK withholding tax. The US holder includes in gross income for US federal income tax purposes only the amount of the dividend actually received from the Company, and the receipt of a dividend does not entitle the US holder to a foreign tax credit.
| 144 | Vodafone Group Plc Annual Report 2006 |
Back to Contents
Dividends must be included in income when the US holder, in the case of shares, or the Depositary, in the case of ADSs, actually or constructively receives the dividend and will not be eligible for the dividends-received deduction generally allowed to US corporations in respect of dividends received from other US corporations. Dividends will be income from sources outside the United States. Dividends paid in taxable years beginning before 1 January 2007 generally will be “passive” or “financial services” income, and dividends paid in taxable years beginning after 31 December 2006 generally will be “passive” or “general” income, which in either case is treated separately from other types of income for the purposes of computing any allowable foreign tax credit.
In the case of shares, the amount of the dividend distribution to be included in income will be the US dollar value of the pound sterling payments made, determined at the spot pound sterling/US dollar rate on the date of the dividend distribution, regardless of whether the payment is in fact converted into US dollars. Generally, any gain or loss resulting from currency exchange fluctuations during the period from the date the dividend payment is to be included in income to the date the payment is converted into US dollars will be treated as ordinary income or loss. Generally, the gain or loss will be income or loss from sources within the United States for foreign tax credit limitation purposes.
Taxation of capital gains
UK taxation
A US holder may be liable for both UK and US tax in respect of a gain on the disposal of the Company’s shares or ADSs if the US holder is:
| (i) | a citizen of the United States resident or ordinarily resident for UK tax purposes in the United Kingdom; |
| | |
| (ii) | a citizen of the United States who has been resident or ordinarily resident for UK tax purposes in the United Kingdom, ceased to be so resident or ordinarily resident for a period of less than 5 years of assessment and who disposed of the shares or ADSs during that period (a “Temporary Non-Resident”), unless the shares or ADSs were also acquired during that period, such liability arising on that individual’s return to the UK; |
| | |
| (iii) | a US domestic corporation resident in the United Kingdom by reason of being centrally managed and controlled in the United Kingdom; or |
| | |
| (iv) | a citizen of the United States or a corporation that carries on a trade, profession or vocation in the United Kingdom through a branch or agency or, in respect of companies, through a permanent establishment and that has used the shares or ADSs for the purposes of such trade, profession or vocation or has used, held or acquired the shares or ADSs for the purposes of such branch or agency or permanent establishment. |
Under the Treaty, capital gains on dispositions of the shares or ADSs are generally subject to tax only in the country of residence of the relevant holder as determined under both the laws of the United Kingdom and the United States and as required by the terms of the Treaty. However, individuals who are residents of either the United Kingdom or the United States and who have been residents of the other jurisdiction (the US or the UK, as the case may be) at any time during the six years immediately preceding the relevant disposal of shares or ADSs may be subject to tax with respect to capital gains arising from the dispositions of the shares or ADSs not only in the country of which the holder is a resident at the time of the disposition but also in that other country (although, in respect of UK taxation, generally only to the extent that such an individual comprises a Temporary Non-Resident).
US federal income taxation
A US holder that sells or otherwise disposes of the Company’s shares or ADSs will recognise a capital gain or loss for US federal income tax purposes equal to the difference between the US dollar value of the amount realised and the holder’s tax basis, determined in US dollars, in the shares or ADSs. Generally, a capital gain of a non-corporate US holder that is recognised before 1 January 2009 is taxed at a maximum rate of 15%, provided the holder has a holding period of more than one year. The gain or loss will generally be income or loss from sources within the United States for foreign tax credit limitation purposes. The deductibility of losses is subject to limitations.
Additional tax considerations
UK inheritance tax
An individual who is domiciled in the United States (for the purposes of the Estate Tax Convention) and is not a UK national will not be subject to UK inheritance tax in respect of the Company’s shares or ADSs on the individual’s death or on a transfer of the shares or ADSs during the individual’s lifetime, provided that any applicable US federal gift or estate tax is paid, unless the shares or ADSs are part of the business property of a UK permanent establishment or pertain to a UK fixed base used for the performance of independent personal services. Where the shares or ADSs have been placed in trust by a settlor, they may be subject to UK inheritance tax unless, when the trust was created, the settlor was domiciled in the United States and was not a UK national. Where the shares or ADSs are subject to both UK inheritance tax and to US federal gift or estate tax, the Estate Tax Convention generally provides a credit against US federal tax liabilities for UK inheritance tax paid.
UK stamp duty and stamp duty reserve tax
Stamp duty will, subject to certain exceptions, be payable on any instrument transferring shares in the Company to the Custodian of the Depositary at the rate of 1.5% on the amount or value of the consideration if on sale or on the value of such shares if not on sale. Stamp duty reserve tax (SDRT), at the rate of 1.5% of the price or value of the shares, could also be payable in these circumstances, and on issue to such a person, but no SDRT will be payable if stamp duty equal to such SDRT liability is paid. In accordance with the terms of the Deposit Agreement, any tax or duty payable on deposits of shares by the Depositary or the Custodian of the Depositary will be charged to the party to whom ADSs are delivered against such deposits.
No stamp duty will be payable on any transfer of ADSs of the Company, provided that the ADSs and any separate instrument of transfer are executed and retained at all times outside the United Kingdom.
A transfer of shares in the Company in registered form will attract ad valorem stamp duty generally at the rate of 0.5% of the purchase price of the shares. There is no charge to ad valorem stamp duty on gifts. On a transfer from nominee to beneficial owner (the nominee having at all times held the shares on behalf of the transferee) under which no beneficial interest passes and which is neither a sale nor in contemplation of a sale, a fixed £5.00 stamp duty will be payable.
SDRT is generally payable on an unconditional agreement to transfer shares in the Company in registered form at 0.5% of the amount or value of the consideration for the transfer, but is repayable if, within six years of the date of the agreement, an instrument transferring the shares is executed or, if the SDRT has not been paid, the liability to pay the tax (but not necessarily interest and penalties) would be cancelled. However, an agreement to transfer the ADSs of the Company will not give rise to SDRT.
| Vodafone Group Plc Annual Report 2006 | 145 |
Back to Contents
Form 20-F Cross Reference Guide
Certain of the information in this document that is referenced in the following table is included in the Company’s Annual Report on Form 20–F for 2006 filed with the SEC (the “2006 Form 20–F”). No other information in this document is included in the 2006 Form 20–F or incorporated by reference into any filings by the Company under the US Securities Act of 1933, as amended. Please see “Documents on display” for information on how to access the 2006 Form 20–F as filed with the SEC. The 2006 Form 20–F has not been approved or disapproved by the SEC nor has the SEC passed judgement upon the adequacy or accuracy of the 2006 Form 20–F.
| Item | Form 20–F caption | Location in this document | Page |
|
|
|
|
| 1 | Identity of Directors, Senior Management | | |
| | and Advisers | Not applicable | – |
|
|
|
|
| 2 | Offer Statistics and Expected Timetable | Not applicable | – |
|
|
|
|
| 3 | Key Information | | |
| | 3A Selected Financial Data | Financial Highlights | 2 |
| | | Introduction – Foreign Currency Translation | 25 |
| | 3B Capitalisation and indebtedness | Not applicable | – |
| | 3C Reasons for the offer and use of proceeds | Not applicable | – |
| | 3D Risk Factors | Risk factors, Trends and Outlook – Risk Factors | 43 |
|
|
|
|
| 4 | Information on the Company | | |
| | 4A History and Development of the Company | Business Overview – History and Development of the Company | 19 |
| | | Investor Information – Contact Details | back cover |
| | 4B Business Overview | Business Overview | 12 |
| | | Operating Results – Review of Operations | 32 |
| | | Risk Factors, Trends and Outlook – Trend Information | 44 |
| | | Investor Information – Material Contracts | 144 |
| | 4C Organisational Structure | Note 12 “Principal subsidiary undertakings” | 94 |
| | | Note 13 “Investments in joint ventures” | 95 |
| | | Note 14 ”Investments in associated undertakings” | 96 |
| | | Note 15 “Other investments” | 96 |
| | 4D Property, Plant and Equipment | Business Overview – Licences and network infrastructure – Mobile network infrastructure | 14 |
| | | Financial Position and Resources | 38 |
| | | Corporate Responsibility and Environmental Issues – Environmental Issues | 60 |
|
|
|
|
| 4A | Unresolved Staff Comments | None | – |
|
|
|
|
| 5 | Operating and Financial Review and Prospects | | |
| | 5A Operating Results | Operating Results | 30 |
| | | Note 24 “Borrowings” | 102 |
| | | Introduction – Inflation | 25 |
| | 5B Liquidity and Capital Resources | Financial Position and Resources – Liquidity and Capital Resources | 39 |
| | 5C Research and Development, Patents and | | |
| | Licences, etc. | Business Overview – Global Services – Research and Development | 19 |
| | 5D Trend Information | Risk Factors, Trends and Outlook – Trend Information | 44 |
| | 5E Off-balance sheet arrangements | Financial Position and Resources – Liquidity and Capital Resources – Off-balance sheet arrangements | 42 |
| | | Note 30 “Commitments” | 116 |
| | | Note 31 “Contingent liabilities” | 117 |
| | 5F Tabular disclosure of contractual obligations | Financial Position and Resources – Contractual Obligations | 39 |
| | 5G Safe harbor | Cautionary Statement Regarding Forward–Looking Statements | 46 |
|
|
|
|
| 6 | Directors, Senior Management and Employees | | |
| | 6A Directors and Senior Management | Board of Directors and Group Management | 50 |
| | 6B Compensation | Board’s Report to Shareholders on Directors’ Remuneration | 61 |
| | 6C Board Practices | Corporate Governance | 53 |
| | | Board’s Report to Shareholders on Directors’ Remuneration | 61 |
| | | Board of Directors and Group Management | 50 |
| | 6D Employees | Employees | 58 |
| | | Note 34 “Employees” | 119 |
| | 6E Share Ownership | Board’s Report to Shareholders on Directors’ Remuneration – Directors’ interests in the shares of the Company | 66 |
| | | Note 19 “Called up share capital” | 98 |
|
|
|
|
| 7 | Major Shareholders and Related Party Transactions | |
| | 7A Major Shareholders | Investor Information – Major shareholders | 142 |
| | 7B Related Party Transactions | Board’s Report to Shareholders on Directors’ Remuneration | 61 |
| | | Note 36 “Related party transactions” | 120 |
| | | Note 31 “Contingent liabilities” | 117 |
| | 7C Interests of experts and counsel | Not applicable | – |
|
|
|
|
| 8 | Financial Information | | |
| | 8A Consolidated Statements and Other Financial | Consolidated Financial Statements | 71 |
| | Information | Report of Independent Auditors | 131 |
| | | Note 31 “Contingent liabilities” | 117 |
| | | Financial Position and Resources – Equity Dividends | 38 |
| | 8B Significant Changes | Note 35 “Subsequent events” | 119 |
|
|
|
|
| 146 | Vodafone Group Plc Annual Report 2006 |
Back to Contents
| Item | Form 20–F caption | Location in this document | Page |
|
|
|
|
| 9 | The Offer and Listing | | |
| | 9A Offer and listing details | Investor Information – Share Price History | 141 |
| | 9B Plan of distribution | Not applicable | – |
| | 9C Markets | Investor Information – Markets | 142 |
| | 9D Selling shareholders | Not applicable | – |
| | 9E Dilution | Not applicable | – |
| | 9F Expenses of the issue | Not applicable | – |
|
|
|
|
| 10 | Additional Information | | |
| | 10A Share capital | Not applicable | – |
| | 10B Memorandum and articles of association | Investor Information – Memorandum and Articles of Association and Applicable English law | 144 |
| | 10C Material contracts | Investor Information – Material Contracts | 144 |
| | 10D Exchange controls | Investor Information – Exchange Controls | 144 |
| | 10E Taxation | Investor Information – Taxation | 144 |
| | 10F Dividends and paying agents | Not applicable | – |
| | 10G Statement by experts | Not applicable | – |
| | 10H Documents on Display | Investor Information – Documents on Display | 144 |
| | 10I Subsidiary information | Not applicable | – |
|
|
|
|
| 11 | Quantitative and Qualitative Disclosures
About Market Risk | Note 24 “Borrowings” | 102 |
|
|
|
|
| 12 | Description of Securities Other than Equity
Securities | Not applicable | – |
|
|
|
|
| 13 | Defaults, Dividend Arrearages and
Delinquencies | Not applicable | – |
|
|
|
|
| 14 | Material Modifications to the Rights of
Security Holders and Use of Proceeds | Not applicable | – |
|
|
|
|
| 15 | Controls and Procedures | Corporate Governance | 53 |
|
|
|
|
| 16 | 16A Audit committee financial expert | Corporate Governance – Committees of the Board – The Audit Committee | 55 |
| | 16B Code of Ethics | Corporate Governance – Introduction – US Listing Requirements | 53 |
| | 16C Principal Accountant Fees and Services | Note 4 “Operating (loss)/profit” | 83 |
| | | Corporate Governance – Auditors | 57 |
| | 16D Exemptions from the Listing Standards for
Audit Committees | Corporate Governance – Committees of the Board – The Audit Committee | 55 |
| | | | |
| | 16E Purchase of Equity Securities by the Issuer
and Affiliated Purchasers | Financial Position and Resources – Liquidity and Capital Resources – Treasury shares | 41 |
| | | Note 21 “Transactions with equity shareholders” | 102 |
|
|
|
|
| 17 | Financial Statements | Not applicable | – |
|
|
|
|
| 18 | Financial Statements | Consolidated Financial Statements | 71 |
|
|
|
|
| 19 | Exhibits | Filed with the SEC | – |
|
|
|
|
| Vodafone Group Plc Annual Report 2006 | 147 |
Back to Contents
Back to Contents
Back to Contents
SIGNATURE
The registrant hereby certifies that it meets all of the requirements for filing on Form 20-F and that it has duly caused and authorized the undersigned to sign this transition report on its behalf.
| | |
| | VODAFONE GROUP PUBLIC LIMITED COMPANY |
| | (Registrant) |
| | |
| | /s/ Arun Sarin |
| | Arun Sarin |
| | Chief Executive |
| | |
Dated: 14 June 2006 | |
Back to Contents
Index to Exhibits to Form 20-F for year ended 31 March 2006
| 1. | Memorandum, as adopted on June 13, 1984 and including all amendments made on July 28, 2000 and July 26, 2005, and Articles of Association, as adopted on June 30, 1999 and including all amendments made on July 25, 2001 and July 26, 2005, of the Company. |
| | |
| 2. | Indenture, dated as of February 10, 2000, between the Company and Citibank, N.A. as Trustee, including forms of debt securities (incorporated by reference to Exhibit 4(a) of Amendment No. 1 to the Company’s Registration Statement on Form F-3, dated November 24, 2000). (File No. 333-10762)). |
| | |
| 4.1. | Agreement for US $5,525,000,000 5 year Revolving Credit Facility (subsequently increased by accession of further lenders to US$5,925,000,000), dated 24 June 2004, among, inter alia, the Company, ABN Amro Bank N.V.; Banco Bilbao Vizcaya Argentaria S.A. ; Bank of America, N.A.; Barclays Bank PLC; Bayerische Hypo-und Vereinsbank AG; BNP Paribas ; CALYON; Citibank, N.A.; Commerzbank Aktiengesellschaft, London Branch; Deutsche Bank AG; HSBC Bank plc; ING Bank, N.V.; JPMorgan Chase Bank; Lehman Brothers Bankhaus AG; Lloyds TSB Bank plc; Morgan Stanley Dean Witter Bank Limited and Morgan Stanley Bank; Mizuho Corporate Bank, Ltd.; National Australia Bank Limited ABN 12 004 044 937; Sumitomo Mitsui Banking Corporation Europe Limited; The Bank of Tokyo-Mitsubishi, Ltd.; The Royal Bank of Scotland Plc; UBS AG; WestLB AG; Banco Santander Central Hispano, S.A.; William Street Commitment Corporation; Banca Intesa SpA; KBC Bank NV; Standard Chartered Bank; TD Bank Europe Limited; and The Bank of New York with The Royal Bank of Scotland plc as Agent and US Swingline Agent, as amended and restated on 24 June 2005 by Supplemental Agreement among, inter alia,the Company, ABN AMRO Bank N.V.; Banc of America Securities Limited; Banco Bilbao Vizcaya Argentaria S.A.; Banco Santander Central Hispano, S.A. London Branch; Barclays Capital; Bayerische Hypo-und Vereinsbank AG; BNP Paribas; Calyon; Citigroup Global Markets Limited; Commerzbank Aktiengesellschaft, London Branch; Deutsche Bank AG London; HSBC Bank Plc; ING Bank N.V., London Branch; JPMorgan Chase Bank, N.A.; J.P. Morgan Plc; Lehman Commercial Paper Inc.; Llloyds TSB Bank Plc; Mizuho Corporate Bank, Ltd; Morgan Stanley Bank International Limited; National Australia Bank Limited ABN 12 004 044 937; Sumitomo Mitsui Banking Corporation Europe Limited; The Bank of Tokyo-Mitsubishi, Ltd.; The Royal Bank of Scotland Plc; UBS Limited; WestLB AG, London Branch; William Street Commitment Corporation; Banca Intesa SpA; KBC Bank NV; Standard Chartered Bank; TD Bank Europe Limited; The Bank of New York; ABN AMRO Bank N.V.; Banca Intesa SpA; Banco Bilbao Vizvcaya Argentaria S.A.; Banco Bilbao Vizvcaya Argentaria S.A. (New York Branch); Banco Santander Central Hispano, S.A. London Branch; Bank of America, N.A.; Barclays Bank Plc; Bayerische Hypo-und Vereinsbank AG; BNP Paribas (London Branch); BNP Paribas (acting through its New York Branch); Calyon; Citibank, N.A.; Commerzbank Aktiengesellschaft, London Branch; Commerzbank Aktiengesellschaft, New York Branch; Deutsche Bank AG London; Deutsche Bank AG New York; HSBC Bank Plc; ING Bank N.V., London Branch; JPMorgan Chase Bank, N.A.; KBC Bank NV; Lehman Commercial Paper Inc.; Lloyds TSB Bank Plc; Mizuho Corporate Bank, Ltd.; Morgan Stanley Bank; Morgan Stanley Bank International Limited; National Australia Bank Limited ABN 12 004 044 937; Standard Chartered Bank; Sumitomo Mitsui Banking Corporation Europe Limited; TD Bank Europe Limited; The Bank of New York; The Bank of Tokyo-Mitsubishi, Ltd.; The Royal Bank of Scotland Plc; The Royal Bank of Scotland Plc (New York Branch); UBS AG, London Branch; UBS AG, Stamford Branch; UBS Loan Finance LLC; WestLB AG, London Branch; WestLB AG, New York Branch; William Street Commitment Corporation; and The Royal Bank of Scotland Plc with The Royal Bank of Scotland Plc (New York Branch) as Agent and U.S. Swingline Agent. |
Back to Contents
| 4.2. | Agreement for US$4,675,000,000 7 year Revolving Credit Facility (subsequently increased by accession of further lenders to US$5,025,000,000), dated June 24, 2005, among, inter alia, the Company, Banc of America Securities Limited; Banca Intesa SpA; Banco Bilboa Vizcaya Argentaria S.A.; Banco Santander Central Hispano, S.A. London Branch; Barclays Capital; Bayerische Hypo-und Vereinsbank AG; BNP Paribas; Calyon; Citigroup Global Markets Limited; Deutsche Bank AG London; HSBC Bank Plc; ING Bank N.V., London Branch; J.P. Morgan Plc; Lehman Commercial Paper Inc., UK Branch; Lloyds TSB Bank Plc; Mizuho Corporate Bank, Ltd; Morgan Stanley Bank International Limited; National Australia Bank Limited ABN 12 004 044 937; The Bank of Tokyo-Mitsubishi, Ltd; The Royal Bank of Scotland Plc; UBS Limited; Unicredit Banca d’Impresa SpA; WestLB AG, London Branch; William Street Commitment Corporation; Commerzbank Aktiengesellschaft, Filiale Düsseldorf; KBC Bank NV; Standard Chartered Bank; TD Bank Europe Limited; The Bank of New York; Banca Intesa SpA; Banco Bilbao Vizcaya Argentaria S.A.; Banco Bilbao Vizcaya Argentaria S.A. (New York Branch); Banco Santander Central Hispano, S.A. London Branch; Bank of America, N.A., Barclays Bank Plc; Bayerische Hypo-und Vereinsbank AG; BNP Paribas (London Branch); BNP Paribas, New York Branch; Calyon; Citibank, N.A.; Commerzbank Aktiengesellschaft, Filiale Düsseldorf; Deustche Bank AG London; Deutsche Bank AG New York; HSBC Bank Plc; ING Bank N.V., London Branch; JPMorgan Chase Bank, N.A.; KBC Bank NV; Lehman Commercial Paper Inc., UK Branch; Lloyds TSB Bank Plc; Mizuho Corporate Bank, Ltd.; Morgan Stanley Senior Funding, Inc.; Morgan Stanley Bank International Limited; National Australia Bank Limited ABN 12 004 044 937; Standard Chartered Bank; TD Bank Europe Limited; The Bank of New York; The Bank of Tokyo-Mitsubishi, Ltd.; The Royal Bank of Scotland Plc; The Royal Bank of Scotland Plc (New York Branch); UBS AG, London Branch; UBS Loan Finance LLC; Unicredit Banca d’Impresa SpA; WestLB AG, London Branch; WestLB AG, New York Branch; William Street Commitment Corporation; and The Royal Bank of Scotland plc with The Royal Bank of Scotland Plc (New York Branch) as Agent and US Swingline Agent. |
| | |
| 4.3. | Vodafone Group Long Term Incentive Plan (incorporated by reference to Exhibit 4.5 to the Company’s Annual Report on Form 20-F for the financial year ended March 31, 2001). |
| | |
| 4.4. | Vodafone Group Short Term Incentive Plan (incorporated by reference to Exhibit 4.6 to the Company’s Annual Report on Form 20-F for the financial year ended March 31, 2001). |
| | |
| 4.5. | Vodafone Group 1999 Long Term Stock Incentive Plan (incorporated by reference to Exhibit 4.7 to the Company’s Annual Report on Form 20-F for the financial year ended March 31, 2001). |
| | |
| 4.6. | Vodafone Group 1998 Company Share Option Scheme (incorporated by reference to Exhibit 4.8 to the Company’s Annual Report on Form 20-F for the financial year ended March 31, 2001). |
| | |
| 4.7. | Vodafone Group 1998 Executive Share Option Scheme (incorporated by reference to Exhibit 4.9 to the Company’s Annual Report on Form 20-F for the financial year ended March 31, 2001). |
Back to Contents
| 4.9. | Agreement for Services with Lord MacLaurin of Knebworth (incorporated by reference to Exhibit 4.10 to the Company’s Annual Report on Form 20-F for the financial year ended March 31, 2001). |
| | |
| 4.10. | Letter of Appointment of Paul Hazen (incorporated by reference to Exhibit 4.15 to the Company’s Annual Report on Form 20-F for the financial year ended March 31, 2003). |
| | |
| 4.11. | Service Contract of Arun Sarin (incorporated by reference to Exhibit 4.20 to the Company’s Annual Report on Form 20-F for the financial year ended March 31, 2003). |
| | |
| 4.12. | Service Contract of Julian Horn-Smith (incorporated by reference to Exhibit 4.10 to the Company’s Annual Report on Form 20-F for the financial year ended March 31, 2001). |
| | |
| 4.13. | Service Contract of Peter Bamford (incorporated by reference to Exhibit 4.10 to the Company’s Annual Report on Form 20-F for the financial year ended March 31, 2001). |
| | |
| 4.14. | Service Contract of Thomas Geitner (incorporated by reference to Exhibit 4.13 to the Company’s Annual Report on Form 20-F for the financial year ended March 31, 2005). |
| | |
| 4.15. | Service Contract of Kenneth Hydon (included in and incorporated by reference to Exhibit 4.10 to the Company’s Annual Report on Form 20-F for the financial year ended March 31, 2001). |
| | |
| 4.17. | Letter of Appointment of Sir John Bond (incorporated by reference to Exhibit 4.15 to the Company’s Annual Report on Form 20-F for the financial year ended March 31, 2005). |
| | |
| 4.18. | Letter of Appointment of Dr. Michael Boskin(incorporated by reference to Exhibit 4.9 to the Company’s Annual Report on Form 20-F for the financial year ended March 31, 2003). |
| | |
| 4.19. | Letter of Appointment of Professor Sir Alec Broers, now Lord Broers, (incorporated by reference to Exhibit 4.10 to the Company’s Annual Report on Form 20-F for the financial year ended March 31, 2003; at a meeting of the Directors of the Company held on September 16, 2003, the term of office of Professor Sir Alec Broers was extended until December 31, 2006). |
| | |
| 4.20. | Letter of Appointment of Dr. John Buchanan(incorporated by reference to Exhibit 4.11 to the Company’s Annual Report on Form 20-F for the financial year ended March 31, 2003). |
| | |
| 4.21. | Letter of Appointment of Penelope Hughes(incorporated by reference to Exhibit 4.17 to the Company’s Annual Report on Form 20-F for the financial year ended March 31, 2003; at a meeting of the Directors of the Company held on September 16, 2003, the term of office of Penelope Hughes was extended until August 31, 2007). |
| | |
| 4.23. | Letter of Appointment of Sir David Scholey (incorporated by reference to Exhibit 4.21 to the Company’s Annual Report on Form 20-F for the financial year ended March 31, 2003; at a meeting of the Directors of the Company held on September 16, 2003, the term of office of Sir David Scholey was extended until the Annual General Meeting of the Company in 2005). |
Back to Contents
| 4.24. | Letter of Appointment of Jurgen Schrempp (incorporated by reference to Exhibit 4.21 to the Company’s Annual Report on Form 20-F for the financial year ended March 31, 2004). |
| | |
| 4.25. | Letter of Appointment of Luc Vandevelde (incorporated by reference to Exhibit 4.22 to the Company’s Annual Report on Form 20-F for the financial year ended March 31, 2004). |