WASHINGTON, D.C. 20549
CAPITOL BANCORP LTD.
(Former name, former address and former fiscal year, if changed since last report)
Indicate by check mark whether the registrant (1) has filed all reports required to be filed by Section 13 or 15(d) of the Securities Exchange Act of 1934 during the preceding 12 months (or for such shorter period that the registrant was required to file such reports), and (2) has been subject to such filing requirements for the past 90 days.
Indicate by check mark whether the registrant is a shell company (as defined in Rule 12b-2 of the Exchange Act).
Indicate the number of shares outstanding of each of the issuer's classes of common stock, as of the latest practicable date.
Indicate by check mark whether the registrant is a large accelerated filer, an accelerated filer, a non-accelerated filer, or a smaller reporting company. See the definitions of "large accelerated filer," "accelerated filer" and "smaller reporting company" in Rule 12b-2 of the Exchange Act.
NOTES TO CONDENSED CONSOLIDATED FINANCIAL STATEMENTS
Note A – Basis of Presentation
The accompanying unaudited condensed consolidated financial statements of Capitol Bancorp Limited (Capitol or the Corporation) have been prepared in accordance with generally accepted accounting principles for interim financial information and with the instructions for Form 10-Q. Accordingly, they do not include all information and footnotes necessary for a fair presentation of consolidated financial position, results of operations and cash flows in conformity with accounting principles generally accepted in the United States of America.
The condensed consolidated financial statements do, however, include all adjustments of a normal recurring nature (in accordance with Rule 10-01(b)(8) of Regulation S-X) which Capitol considers necessary for a fair presentation of the interim periods.
The results of operations for the periods ended September 30, 2009 are not necessarily indicative of the results to be expected for the year ending December 31, 2009.
The consolidated balance sheet as of December 31, 2008 was derived from audited consolidated financial statements as of that date. Certain 2008 amounts have been reclassified to conform to the 2009 presentation.
Note B – Implementation of New Accounting Standards
In September 2006, an accounting standard regarding fair value was issued which provides a definition of fair value for accounting purposes, establishes a framework for measuring fair value and expanded related financial statement disclosures. The standard was originally effective beginning January 1, 2008 but was subsequently deferred until January 1, 2009 for nonfinancial assets and nonfinancial liabilities except those items recognized or disclosed at fair value on an annual or more frequently recurring basis. Fair value disclosures are set forth in Note D to the condensed consolidated financial statements.
In December 2007, a new accounting standard was issued to further enhance the accounting and financial reporting related to business combinations. This standard established principles and requirements for how the acquirer in a business combination (1) recognizes and measures in its financial statements the identifiable assets acquired, the liabilities assumed and any noncontrolling interest in the acquiree, (2) recognizes and measures goodwill acquired in the business combination or a gain from a bargain purchase, (3) requires that acquisition-related and restructuring costs be recognized separately from the acquisition, generally charged to expense when incurred and (4) determines information to disclose to enable users of the financial statements to evaluate the nature and financial effects of the business combination. This standard applies prospectively to business combinations for which the acquisition date is on or after January 1, 2009. The effects of the Corporation's adoption of this standard had no impact upon implementation and its subsequent impact will depend upon the extent and magnitude of acquisitions in the future.
Also in December 2007, a new accounting standard was issued to create accounting and reporting standards for the noncontrolling interest in a subsidiary and for the deconsolidation of a subsidiary. This standard establishes accounting and reporting standards that require (1) the ownership interest in subsidiaries held by parties other than the parent to be clearly identified and presented in the consolidated balance sheet within equity, but separate from the parent's equity, (2) the amount of consolidated net income (loss) attributable to the parent and the noncontrolling interest to be clearly identified and presented on the face of the consolidated statement of income, (3) changes in a parent's ownership interest while the parent retains its controlling financial interest in its subsidiary to be accounted for consistently, (4) when a subsidiary is deconsolidated, any retained noncontrolling equity investment in the former subsidiary to be initially measured at fair value and (5) entities provide sufficient disclosures that clearly identify and distinguish between the interests of the parent and the interests of the noncontrolling owners. This standard became effective for Capitol on January 1, 2009 and the accompanying condensed consolidated financial statements reflect the implementation of this new accounting standard.
NOTES TO CONDENSED CONSOLIDATED FINANCIAL STATEMENTS
CAPITOL BANCORP LIMITED – Continued
Note B – Implementation of New Accounting Standards – Continued
On April 9, 2009, several new accounting standards were issued which became effective for interim 2009 reporting.
One of the new standards requires interim disclosures about fair value of financial instruments in addition to annual reporting. The required interim disclosures are included in Note D to the condensed consolidated financial statements.
Another new standard amended the other-than-temporary-impairment guidance for debt securities to make it more operational and to improve the presentation and disclosure of other-than-temporary-impairments on debt and equity securities in financial statements. Implementation of this new guidance did not have a material effect on Capitol's consolidated financial statements. The expanded interim disclosures about investment securities are set forth in Note C to the condensed consolidated financial statements.
The final new standard issued in April 2009 amended prior fair value guidance to aid in determining fair value when the volume and level of activity for an asset or liability have significantly decreased and identifying transactions that are not orderly. This new guidance intended to clarify that significant adjustments to quoted prices may be necessary to estimate fair value when there has been a significant decrease in the volume and activity for the asset/liability in relation to normal market activity. Fair value is the price that would be received to sell an asset (or paid to transfer a liability) in an orderly transaction (that is, not a forced liquidation or distressed sale) between willing market participants under current market conditions. Capitol's implementation of this standard and its related disclosures are set forth in Note D to the condensed consolidated financial statements.
In March 2008, a new accounting standard was issued which revises the presentation and disclosure of derivatives and hedging activities. It became effective for Capitol on January 1, 2009 and did not have a material impact on Capitol's condensed consolidated financial statements upon implementation.
In February 2008, a new accounting standard was issued which clarifies transfers and certain transactions' accounting subject to the provisions of standards for accounting for transfers of financial assets and repurchase financing transactions. It became effective January 1, 2009 and did not have a material impact on Capitol's financial position or results of operations upon implementation. In June 2009, that accounting standard was amended to revise the presentation and disclosure of transfers of financial assets and the effects of a transfer on an entity's financial position, financial performance and cash flows. This standard applies to fiscal years, and interim periods within those fiscal years, beginning on or after November 15, 2009. Management has not completed its review of this new guidance.
In May 2009, a new accounting standard was issued which requires the disclosure of the date through which an entity has evaluated subsequent events and became effective June 30, 2009. This new guidance did not have a material impact on the Corporation's consolidated financial statements and the related disclosures are set forth in Note N to the condensed consolidated financial statements.
In June 2009, a new accounting standard was issued related to the hierarchy of generally accepted accounting principles. On the effective date of this standard, the Financial Accounting Standards Board Accounting Standards Codification™ (Codification) supersedes all then-existing non-Securities and Exchange Commission (SEC) accounting and reporting standards. All other non-grandfathered non-SEC accounting literature not included in the Codification becomes non-authoritative. This standard is effective for financial statements issued for interim and annual periods ending after September 15, 2009 and did not have a material impact to the Corporation's condensed consolidated financial statements upon implementation.
NOTES TO CONDENSED CONSOLIDATED FINANCIAL STATEMENTS
CAPITOL BANCORP LIMITED – Continued
Note C – Investment Securities
Investment securities consisted of the following (in $1,000s):
| | | September 30, 2009 | | | December 31, 2008 |
| | | Amortized Cost | | | Estimated Fair Value | | | Amortized Cost | | | Estimated Fair Value |
| Available for sale: | | | | | | | | | | | |
United States government agency securities | | $ | 7,150 | | | $ | 7,161 | | | $ | 9,785 | | | $ | 9,913 |
| Mortgage-backed securities | | | 9,912 | | | | 10,061 | | | | 4,813 | | | | 4,890 |
| Municipals | | | 767 | | | | 783 | | | | 768 | | | | 781 |
| | | | 17,829 | | | | 18,005 | | | | 15,366 | | | | 15,584 |
| Held for long-term investment: | | | | | | | | | | | | | | | |
| Federal Reserve Bank stock | | | 210 | | | | 210 | | | | 146 | | | | 146 |
| Federal Home Loan Bank stock | | | 24,534 | | | | 24,534 | | | | 26,053 | | | | 26,053 |
Capitol Development Bancorp Limited III | | | 637 | | | | 637 | | | | | | | | |
| Corporate | | | 5,229 | | | | 5,229 | | | | 6,591 | | | | 6,591 |
| Other | | | 100 | | | | 100 | | | | 66 | | | | 66 |
| | | | 30,710 | | | | 30,710 | | | | 32,856 | | | | 32,856 |
| | | | | | | | | | | | | | | | |
| | | $ | 48,539 | | | $ | 48,715 | | | $ | 48,222 | | | $ | 48,440 |
Investments in Federal Reserve Bank and Federal Home Loan Bank stock are restricted and may only be resold to, or redeemed by, the issuer. Corporate investments consist primarily of equity-method investments in limited partnerships and a limited liability company. Those entities, which are involved in making equity investments in banks and small businesses, use the fair value method of accounting in valuing their investment portfolios.
Securities held for long term investment are not subject to the classification and accounting rules relating to most typical investments. Rather, investments in Federal Home Loan Bank stock and Federal Reserve Bank stock are required to be recorded at cost and generally classified within other assets. In addition, Capitol's corporate investments consist mostly of equity-method investments in small limited partnerships which, accordingly, are outside of the scope of accounting rules for most typical investments which often require use of estimated fair value. Notwithstanding that these investments are outside the scope of such accounting rules, they are included in Capitol's investment securities for financial reporting purposes to summarize all such investment securities together for reporting purposes.
Gross unrealized gains and losses on investment securities available for sale were as follows (in $1,000s):
| | | September 30, 2009 | | | December 31, 2008 |
| | | Gains | | | Losses | | | Gains | | | Losses |
United States government agency securities | | $ | 13 | | | $ | 2 | | | $ | 128 | | | $ | -- |
| Mortgage-backed securities | | | 149 | | | | -- | | | | 85 | | | | 8 |
| Municipals | | | 16 | | | | -- | | | | 13 | | | | -- |
| | | | | | | | | | | | | | | | |
| | | $ | 178 | | | $ | 2 | | | $ | 226 | | | $ | 8 |
NOTES TO CONDENSED CONSOLIDATED FINANCIAL STATEMENTS
CAPITOL BANCORP LIMITED – Continued
Note C – Investment Securities—Continued
The age of gross unrealized losses and carrying value (at estimated fair value) of securities available for sale are summarized below (in $1,000s):
| | | September 30, 2009 | | | December 31, 2008 |
| | | Unrealized Loss | | | Carrying Value | | | Unrealized Loss | | | Carrying Value |
| | | | | | | | | | | | |
| One year or less: | | | | | | | | | | | |
| Mortgage-backed securities | | $ | -- | | | $ | -- | | | $ | 4 | | | $ | 281 |
United States government agency securities | | | 2 | | | | 700 | | | | -- | | | | -- |
| | | $ | 2 | | | $ | 700 | | | $ | 4 | | | $ | 281 |
| In excess of one year: | | | | | | | | | | | | | | | |
| Mortgage-backed securities | | $ | -- | | | $ | -- | | | $ | 4 | | | $ | 501 |
Management does not believe any individual unrealized loss as of September 30, 2009 represents an other-than-temporary loss (primarily due to such amounts being attributable to changes in interest rates). Further, it does not intend to sell such securities and believes it is unlikely a sale would become required before the amortized cost can be recovered.
Gross realized gains and losses from sales and maturities of investment securities were insignificant for the periods presented.
Scheduled maturities of investment securities held as of September 30, 2009 were as follows (in $1,000s):
| | | Amortized Cost | | | Estimated Fair Value |
| | | | | | |
| Due in one year or less | | $ | 5,517 | | | $ | 5,523 |
| After one year, through five years | | | 2,311 | | | | 2,326 |
| After five years, through ten years | | | 580 | | | | 591 |
| After ten years | | | 9,421 | | | | 9,565 |
| Securities held for long-term | | | | | | | |
| investment without stated | | | | | | | |
| maturities | | | 30,710 | | | | 30,710 |
| | | | | | | | |
| | | $ | 48,539 | | | $ | 48,715 |
Note D – Fair Value
Accounting standards establish a hierarchy that prioritizes the use of fair value inputs used in valuation methodologies into the following three levels:
| | Level 1: Quoted prices (unadjusted) for identical assets or liabilities in active markets that the entity has the ability to access as of the measurement date. |
| | Level 2: Significant observable inputs other than Level 1 prices such as quoted prices for similar assets or liabilities in active markets; quoted prices for identical or similar assets or liabilities in markets that are not active; or other inputs that are observable or can be derived from or corroborated by observable market data by correlation or other means. |
| | Level 3: Significant unobservable inputs that reflect the reporting entity's own assumptions about the assumptions that market participants would use in pricing an asset or liability. |
NOTES TO CONDENSED CONSOLIDATED FINANCIAL STATEMENTS
CAPITOL BANCORP LIMITED – Continued
Note D – Fair Value – Continued
The following is a description of Capitol's valuation methodologies used to measure and disclose the fair values of its assets and liabilities on a recurring or nonrecurring basis:
| | Investment securities available for sale: Securities available for sale are recorded at fair value on a recurring basis. Fair value measurement is based on quoted prices, when available (Level 1). If quoted prices are not available, fair values are measured using independent pricing models (Level 2). |
| | Mortgage loans held for sale: Mortgage loans held for sale are carried at the lower of cost or fair value and are measured on a nonrecurring basis. There were no mortgage loans held for sale written down to fair value at September 30, 2009. Fair value is based on independent quoted market prices, where applicable, or the prices for other mortgage whole loans with similar characteristics. |
| | Loans: The Corporation does not record loans at fair value on a recurring basis. However, from time to time, nonrecurring fair value adjustments to collateral-dependent loans are recorded to reflect partial write-downs based on the observable market price, current appraised value of the collateral or other estimates of fair value. |
| | Other real estate owned: At the time of foreclosure, foreclosed properties are adjusted to estimated fair value less estimated costs to sell upon transfer from portfolio loans to other real estate owned, establishing a new accounting basis. The Corporation subsequently adjusts estimated fair value on other real estate owned on a nonrecurring basis to reflect partial write-downs based on the observable market price, current appraised value of the asset or other estimates of fair value. |
The balances of assets and liabilities measured at fair value on a recurring basis as of September 30, 2009 were as follows (in $1,000s):
| | | Total | | | Significant Other Observable Inputs (Level 2) |
| | | | | | |
| Investment securities available for sale: | | | | | |
United States government agency securities | | $ | 7,161 | | | $ | 7,161 |
| Mortgage-backed securities | | | 10,061 | | | | 10,061 |
| Municipals | | | 783 | | | | 783 |
| | | $ | 18,005 | | | $ | 18,005 |
The balances of assets and liabilities measured at fair value on a recurring basis as of December 31, 2008 were as follows (in $1,000s):
| | | Total | | | Significant Other Observable Inputs (Level 2) |
| | | | | | |
| Investment securities available for sale: | | | | | |
United States government agency securities | | $ | 9,913 | | | $ | 9,913 |
| Mortgage-backed securities | | | 4,890 | | | | 4,890 |
| Municipals | | | 781 | | | | 781 |
| | | $ | 15,584 | | | $ | 15,584 |
NOTES TO CONDENSED CONSOLIDATED FINANCIAL STATEMENTS
CAPITOL BANCORP LIMITED – Continued
Note D – Fair Value – Continued
The balances of assets and liabilities measured at fair value on a nonrecurring basis as of September 30, 2009 were as follows (in $1,000s):
| | | Total | | | Significant Unobservable Inputs (Level 3) |
| | | | | | |
Impaired loans (1) | | $ | 123,914 | | | $ | 123,914 |
| | | | | | | | |
Other real estate owned (1) | | $ | 119,801 | | | $ | 119,801 |
| (1) | Represents carrying value based on the appraised value of the applicable collateral or foreclosed property or other estimates of fair value. |
The balances of assets and liabilities measured at fair value on a nonrecurring basis as of December 31, 2008 were as follows (in $1,000s):
| | | Total | | | Significant Other Observable Inputs (Level 2) |
| | | | | | |
Impaired loans (1) | | $ | 103,580 | | | $ | 103,580 |
| (1) | Represents carrying value based on the appraised value of the applicable collateral or other estimates of fair value. |
Many of Capitol's collateral-dependent impaired loans and other real estate owned are located in severely depressed real estate markets. In those markets, appraisal data may be of limited usefulness in estimating fair value because comparable sale transactions are infrequent, not orderly and are often distressed or forced.
Appraisals are generally obtained when it has been determined that a collateral-dependent loan has become impaired or when it is likely a real-estate loan will be foreclosed. Adjustments to the loan's carrying value or the allowance for loan losses are made, when appropriate, after review of the appraisal or subsequently if it is determined that the market significantly declines further. The timing of the recognition of a collateral-dependent loan as nonperforming is dependent on several factors, including the performance of the loan, the payment history of the loan or the receipt of updated borrower financial information. When borrower performance has deteriorated (for example, sales or leasing has not occurred as expected), the borrower has become late on the required payments or financial information received indicates adverse financial trends, the loan will be regraded and, if appropriate, an updated appraisal will be ordered. In the interim period between loans being recognized as impaired and the appraisal being received, the loan will be included within loss contingency pools. When the appraisal is received and reviewed and any further fair value analysis is completed, the loan will be evaluated for any appropriate charge-down. Generally, negative differences between appraised value, less the estimated cost to sell, and the carrying value of the loan are charged to the allowance for loan losses when the appraisal has been received and reviewed. Occasionally, additional amounts may be specifically reserved if there is a pending event which may impact the fair value estimate. Internally-developed evaluations may be used when the amount of the loan is less than $250,000. Internal evaluations may also be used when the most recent appraisal date is within a year and economic conditions have had corrections or deterioration. Updated appraisals are obtained at least annually for collateral-dependent loans and other real estate owned.
Effective January 1, 2009, in accordance with recent accounting standards, Capitol began applying the fair value measurement and disclosure provisions regarding fair value to nonfinancial assets and liabilities measured on a nonrecurring basis, which did not have a material effect on Capitol's consolidated financial position upon implementation. The Corporation measures the fair value of the following nonfinancial assets on a nonrecurring basis: (1) long-lived assets, (2) foreclosed assets (other real estate owned), (3) the reporting unit under step one of its goodwill impairment test and (4) indefinite lived intangible assets.
NOTES TO CONDENSED CONSOLIDATED FINANCIAL STATEMENTS
CAPITOL BANCORP LIMITED – Continued
Note D – Fair Value – Continued
Comparative carrying values and estimated fair values of financial instruments based upon the accounting guidance set forth in ASC 825-10 were as follows (in $1,000s):
| | | September 30, 2009 | | | December 31, 2008 | |
| | | Carrying Value | | | Estimated Fair Value | | | Carrying Value | | | Estimated Fair Value | |
| Financial assets: | | | | | | | | | | | | |
| Cash and cash equivalents | | $ | 889,694 | | | $ | 889,694 | | | $ | 624,366 | | | $ | 624,366 | |
| Loans held for sale | | | 14,432 | | | | 14,432 | | | | 10,474 | | | | 10,474 | |
| Investment securities: | | | | | | | | | | | | | | | | |
| Available for sale | | | 18,005 | | | | 18,005 | | | | 15,584 | | | | 15,584 | |
| Held for long-term investment | | | 30,710 | | | | 30,710 | | | | 32,856 | | | | 32,856 | |
| | | | 48,715 | | | | 48,715 | | | | 48,440 | | | | 48,440 | |
| Portfolio loans: | | | | | | | | | | | | | | | | |
| Loans secured by real estate: | | | | | | | | | | | | | | | | |
| Commercial | | | 2,013,473 | | | | 2,026,975 | | | | 2,115,515 | | | | 2,105,204 | |
| Residential (including multi-family) | | | 806,027 | | | | 802,209 | | | | 879,754 | | | | 865,406 | |
Construction, land development and other land | | | 579,752 | | | | 515,233 | | | | 797,486 | | | | 753,028 | |
| Total loans secured by real estate | | | 3,399,252 | | | | 3,344,417 | | | | 3,792,755 | | | | 3,723,638 | |
| Commercial and other business-purpose loans | | | 707,302 | | | | 706,085 | | | | 845,593 | | | | 830,283 | |
| Consumer | | | 45,866 | | | | 46,394 | | | | 61,340 | | | | 62,313 | |
| Other | | | 37,114 | | | | 36,243 | | | | 35,541 | | | | 32,504 | |
| Total portfolio loans | | | 4,189,534 | | | | 4,133,139 | | | | 4,735,229 | | | | 4,648,738 | |
| Less allowance for loan losses | | | (126,188 | ) | | | (126,188 | ) | | | (93,040 | ) | | | (93,040 | ) |
| Net portfolio loans | | | 4,063,346 | | | | 4,006,951 | | | | 4,642,189 | | | | 4,555,698 | |
| | | | | | | | | | | | | | | | | |
| Financial liabilities: | | | | | | | | | | | | | | | | |
| Deposits: | | | | | | | | | | | | | | | | |
| Noninterest-bearing | | | 651,887 | | | | 651,887 | | | | 700,786 | | | | 700,786 | |
| Interest-bearing: | | | | | | | | | | | | | | | | |
| Demand accounts | | | 1,341,614 | | | | 1,341,619 | | | | 1,231,170 | | | | 1,231,172 | |
| Time certificates of less than $100,000 | | | 909,826 | | | | 917,813 | | | | 1,160,221 | | | | 1,161,411 | |
| Time certificates of $100,000 or more | | | 1,605,016 | | | | 1,610,752 | | | | 1,405,435 | | | | 1,408,431 | |
| Total interest-bearing | | | 3,856,456 | | | | 3,870,184 | | | | 3,796,826 | | | | 3,801,014 | |
| Total deposits | | | 4,508,343 | | | | 4,522,071 | | | | 4,497,612 | | | | 4,501,800 | |
| Notes payable and short-term borrowings | | | 300,326 | | | | 302,051 | | | | 446,925 | | | | 447,490 | |
| Subordinated debentures | | | 167,402 | | | | 170,841 | | | | 167,293 | | | | 170,841 | |
Estimated fair values of financial assets and liabilities in the preceding table are based upon a comparison of current interest rates on financial instruments and the timing of related scheduled cash flows to the estimated present value of such cash flows using current estimated market rates of interest (unless quoted market values or other fair value information is more readily available). For example, the estimated fair value of portfolio loans is based on discounted cash flow computations. Similarly, the estimated fair value of time deposits, debt obligations and subordinated debentures were determined through discounted cash flow computations. Such estimates of fair value are not intended to represent market value or portfolio liquidation value, and only represent an estimate of fair value based on current financial reporting requirements.
NOTES TO CONDENSED CONSOLIDATED FINANCIAL STATEMENTS
CAPITOL BANCORP LIMITED – Continued
Note D – Fair Value – Continued
Given current market conditions, a portion of the loan portfolio is not readily marketable and market prices do not exist. Capitol has not attempted to market the loan portfolio to potential buyers, if any exist, to determine the fair value of those instruments. Since negotiated prices in illiquid markets depend upon the then present motivations of the buyer and seller, it is reasonable to assume that actual sales prices could vary widely from any estimate of fair value made without the benefit of negotiations. Additionally, changes in market interest rates can dramatically impact the value of financial instruments in a short period of time. Accordingly, the fair value measurements for loans included in the table on the preceding page are unlikely to represent the instruments' liquidation values.
Note E – Stock Options
Stock option activity for the interim 2009 period is summarized as follows:
| | | Number of Stock Options Outstanding | | | Exercise Price Range | | | Weighted Average Exercise Price |
| | | | | | | | | |
| Outstanding at January 1 | | | 2,374,159 | | | $ | 13.50 to $ 46.20 | | | $ | 28.28 |
| Granted | | | 69,520 | | | | 6.04 | | | | 6.04 |
| Exercised | | | -- | | | | | | | | |
| Cancelled or expired | | | (68,699 | ) | | | 13.50 to 21.82 | | | | 20.88 |
| | | | | | | | | | | | |
| Outstanding at September 30 | | | 2,374,980 | | | $ | 6.04 to $ 46.20 | | | $ | 27.84 |
Stock options were granted in the first nine months of 2009 and 2008, with an aggregate fair value approximating $240,000 and $255,000, respectively. Stock options granted during the interim 2009 period have a vesting date of December 31, 2009 and stock options granted during the interim 2008 period (52,360) became vested at December 31, 2008. Each stock option expires seven years from date of grant. Share-based compensation expense relating to stock options for the nine months ended September 30, 2009 and 2008 approximated $342,000 and $565,000, respectively.
As of September 30, 2009, stock options outstanding had a weighted average remaining contractual life of 2.23 years and, due to the exercise price being greater than the current fair value of Capitol's common stock, had no intrinsic value at that date. The following table summarizes stock options outstanding segregated by exercise price range as of September 30, 2009:
| | | | | | | Weighted Average |
Exercise Price Range | | | Number Outstanding | | | Exercise Price | | Remaining Contractual Life |
| | | | | | | | | |
| $ | 5.00 to 14.99 | | | | 69,520 | | | $ | 6.04 | | 6.61 years |
| $ | 15.00 to 19.99 | | | | 135,288 | | | | 16.67 | | 1.23 years |
| $ | 20.00 to 24.99 | | | | 522,130 | | | | 21.70 | | 2.30 years |
| $ | 25.00 to 29.99 | | | | 585,415 | | | | 27.09 | | 1.15 years |
| $ | 30.00 to 34.99 | | | | 695,119 | | | | 32.10 | | 2.19 years |
| $ | 35.00 or more | | | | 367,508 | | | | 37.92 | | 3.42 years |
| | | | | | | | | | | | |
| Total outstanding | | | | 2,374,980 | | | | | | |
NOTES TO CONDENSED CONSOLIDATED FINANCIAL STATEMENTS
CAPITOL BANCORP LIMITED – Continued
Note F – Net Loss Per Share Attributable to Capitol Bancorp Limited
The computations of basic and diluted loss per share were based on the following (in 1,000s) for the periods ended September 30:
| | | Three Month Period | | | Nine Month Period | |
| | | 2009 | | | 2008 | | | 2009 | | | 2008 | |
| | | | | | | | | | | | | |
Numerator—net loss attributable to Capitol Bancorp Limited for the period | | $ | (83,748 | ) | | $ | (32,495 | ) | | $ | (118,118 | ) | | $ | (29,681 | ) |
| | | | | | | | | | | | | | | | | |
| Denominator: | | | | | | | | | | | | | | | | |
Weighted average number of shares outstanding, excluding unvested restricted shares (denominator for basic loss per share) | | | 17,398 | | | | 17,145 | | | | 17,269 | | | | 17,144 | |
| | | | | | | | | | | | | | | | | |
| Effect of dilutive securities: | | | | | | | | | | | | | | | | |
| Unvested restricted shares | | | -- | | | | -- | | | | -- | | | | -- | |
| Warrants | | | -- | | | | | | | | -- | | | | | |
| Stock options | | | -- | | | | -- | | | | -- | | | | -- | |
| Total effect of dilutive securities | | | -- | | | | -- | | | | -- | | | | -- | |
| | | | | | | | | | | | | | | | | |
| Denominator for diluted net loss per share— | | | | | | | | | | | | | | | | |
Weighted average number of shares and potential dilution | | | 17,398 | | | | 17,145 | | | | 17,269 | | | | 17,144 | |
| | | | | | | | | | | | | | | | | |
Number of antidilutive stock options excluded from diluted net loss per share computation (see Note E) | | | 2,375 | | | | 2,389 | | | | 2,375 | | | | 2,389 | |
| | | | | | | | | | | | | | | | | |
Number of antidilutive unvested restricted shares excluded from diluted net loss per share computation | | | 109 | | | | 61 | | | | 109 | | | | 61 | |
| | | | | | | | | | | | | | | | | |
Number of antidilutive warrants excluded from diluted net loss per share computation | | | 76 | | | | | | | | 76 | | | | | |
Note G – Trust-Preferred Securities
In April 2009, the Corporation determined that it would commence the deferral of interest payments on its various trust-preferred securities, as is permitted under the terms of the securities, to conserve cash and capital resources. The payment of interest may be deferred for periods up to five years. During such deferral periods, Capitol is prohibited from paying dividends on its common stock (subject to certain exceptions) and will continue to accrue interest payable on such securities. Holders of the trust-preferred securities will recognize current taxable income relating to the deferred interest payments.
Note H – Share-Exchange Transaction
Effective May 31, 2009, Capitol completed a share-exchange transaction with the noncontrolling shareholders of Bank of Auburn Hills, previously a 51%-owned subsidiary. In conjunction with the share exchange, Capitol issued 227,000 previously unissued shares of Capitol's common stock and warrants for the purchase of 76,000 shares of Capitol's common stock. The exercise price of the warrants is $20.37 per share of Capitol's common stock, which expire May 31, 2012. As a result of the share exchange transaction, Bank of Auburn Hills became wholly-owned. Capitol's results of operations would not have been materially different if the share exchange transaction had occurred at the beginning of the periods presented.
NOTES TO CONDENSED CONSOLIDATED FINANCIAL STATEMENTS
CAPITOL BANCORP LIMITED – Continued
Note I – Deconsolidation of Subsidiaries
Bank of Santa Barbara, Community Bank of Rowan and Summit Bank of Kansas City are majority-owned subsidiaries of Capitol Development Bancorp Limited III (CDBL III) of which Capitol ceased to have majority voting control effective September 30, 2009 when the previously nonvoting Class B shares of CDBL III became voting. Thus, effective September 30, 2009, these banks and the CDBL III holding company ceased to be consolidated subsidiaries of Capitol and assets totaling $257.7 million and related equity amounts were removed from the consolidated balance sheet on that date.
Note J – Sale of Subsidiary Banks
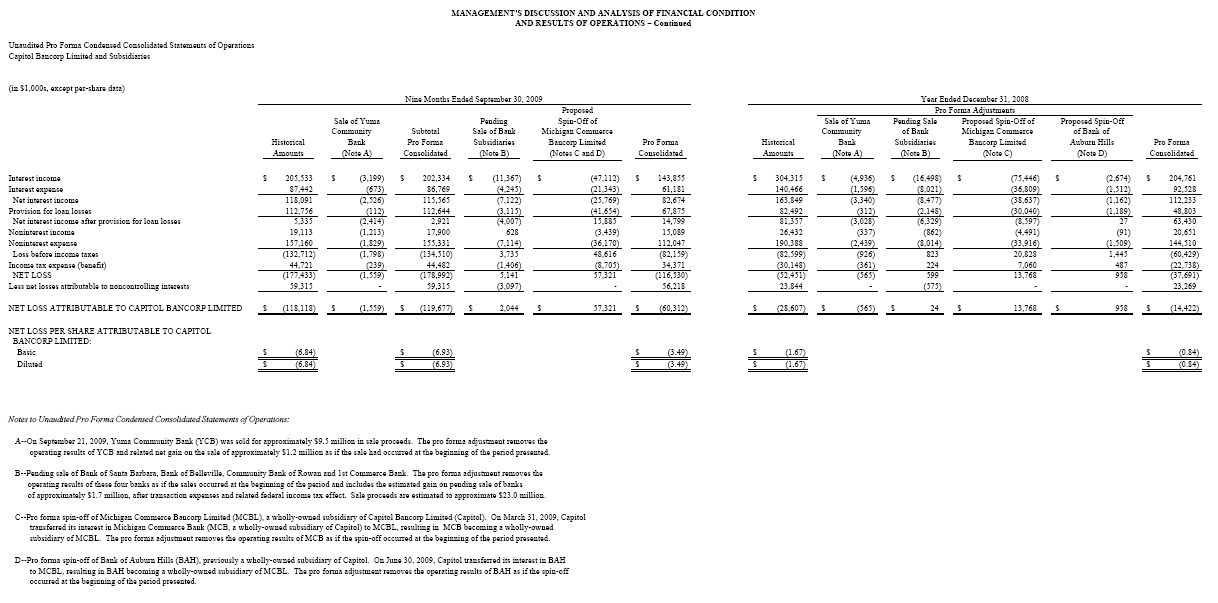
Effective September 21, 2009, Capitol completed the sale of Yuma Community Bank, previously a wholly-owned subsidiary. Capitol received $9.5 million in sale proceeds and recorded a pre-tax gain of approximately $1.2 million. Capitol's consolidated results of operations would not have been materially different if the sale had occurred at the beginning of the periods presented.
In July 2009, Capitol entered into definitive agreements to sell the following four affiliate institutions: 1st Commerce Bank, Bank of Belleville, Bank of Santa Barbara and Community Bank of Rowan. Bank of Santa Barbara and Community Bank of Rowan are subsidiaries of CDBL III which as disclosed in Note I were deconsolidated effective September 30, 2009. The projected financial impact of the divestiture of these institutions is set forth in the accompanying pro forma condensed consolidated financial statements on pages 42 and 44 (along with the proposed spin-off discussed in Note K).
On November 6, 2009, the sale of Bank of Santa Barbara was completed. The remaining three pending bank sales are in various stages of regulatory approval for which approval is not assured.
Note K – Proposed Spin-Off
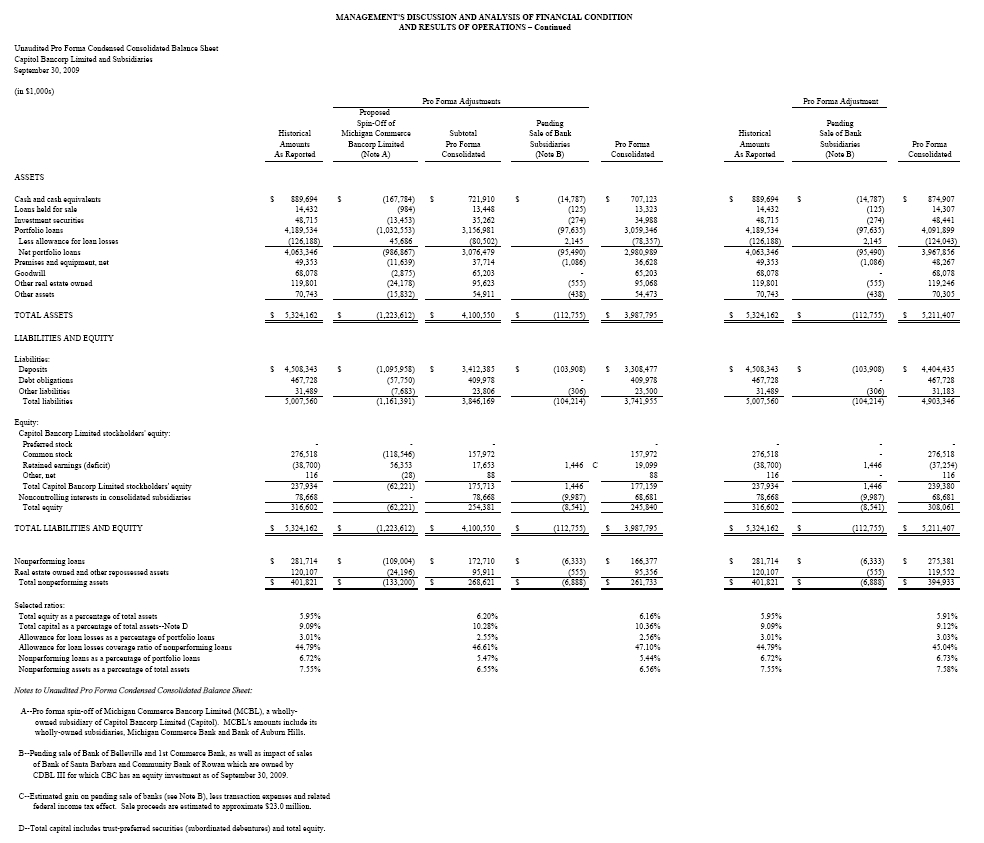
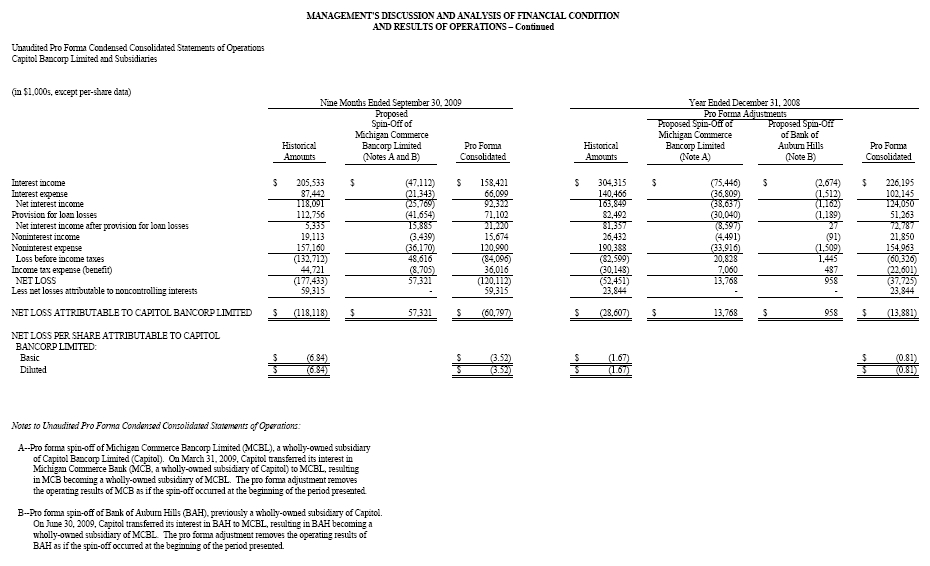
On July 21, 2009, Capitol announced its intention to formally and legally separate the operations of Michigan Commerce Bancorp Limited (MCBL) as an independent publicly-traded company through a spin-off transaction. If completed, Capitol would continue to be a bank holding company with national banking operations and MCBL would become a separate publicly-traded bank holding company consisting of the substantial majority of Capitol's prior Michigan-based banks (see accompanying pro forma condensed consolidated financial statements on pages 42-44).
In the proposed spin-off, Capitol's shareholders would receive shares of MCBL common stock according to a distribution ratio. The distribution ratio and related record date for the proposed distribution would be determined at a later date. The proposed spin-off is subject to a number of significant contingencies. The proposed spin-off would enable the two separate publicly-traded companies to focus on maximizing opportunities for the distinct business markets of each, and will allow both Capitol and MCBL to each develop and implement a strategic plan that fits their specific market and operations. As of the date of this report, Capitol has not received regulatory approval of the proposed spin-off.
MCBL's consolidated total assets approximated $1.2 billion or about 23% of Capitol's total assets as of September 30, 2009. If the proposed spin-off had been completed on September 30, 2009, consolidated total assets of Capitol would have approximated $4.1 billion, while reflecting a 33.1% decline in nonperforming assets and a modest increase in the consolidated total capital ratio. If the proposed spin-off would have occurred at January 1, 2009, the consolidated net loss attributable to Capitol would have been reduced 48.5% to $60.8 million ($3.52 per share) for the nine months ended September 30, 2009.
NOTES TO CONDENSED CONSOLIDATED FINANCIAL STATEMENTS
CAPITOL BANCORP LIMITED – Continued
Note L – Proposed Share Exchange Transaction
In July 2009, Capitol proposed a share exchange offer regarding the shares of Capitol Development Bancorp Limited (CDBL) III-VI not already owned by Capitol, whereby Class B common stock of the CDBLs could be exchanged for a combination of convertible preferred stock of Capitol and trust-preferred securities. The proposed exchange offer was terminated in October 2009.
Note M – Regulatory Agreements
On September 21, 2009, Capitol and its second-tier bank holding companies entered into a written agreement with the Federal Reserve Bank of Chicago (the Reserve Bank) under which Capitol has agreed to refrain from the following actions without the prior written consent of the Reserve Bank (i) declare or pay dividends; (ii) receive dividends or any other form of payment representing a reduction in capital from Michigan Commerce Bank or from any of its subsidiary institutions that is subject to any restriction by the institution's federal or state regulator that limits the payment of dividends or other intercorporate payments; (iii) make any distributions of interest, principal, or other sums of subordinated debentures or trust preferred securities; (v) incur, increase or guarantee any debt; or (vi) purchase or redeem any shares of its own stock or any shares of the stock of Capitol, the second-tier bank holding companies, the nonbank subsidiaries or any of the subsidiary banks that are held by shareholders.
Capitol has also agreed to (i) submit to the Reserve Bank, within 60 days of the agreement, a written plan to maintain sufficient capital at Capitol on a consolidated basis and at Michigan Commerce Bank as a separate legal entity on a stand-alone basis; (ii) notify the Reserve Bank no more than 30 days after the end of any quarter in which Capitol's consolidated or Michigan Commerce Bank's capital ratios fall below the approved capital plan's minimum ratios as well as if any subsidiary institution's ratios fall below the minimum ratios required by the institution's federal or state regulator; (iii) review and revise within 60 days of this agreement its ALLL methodology for loans held by Capitol and submit to the Reserve Bank a written program for maintenance of an adequate ALLL for loans held by Capitol; (iv) take all necessary actions to ensure each of its subsidiary institutions comply with Federal Reserve regulations; (v) refrain from increasing any fees or charging new fees to any subsidiary institution without the prior written consent of the Reserve Bank; (vi) submit to the Reserve Bank, within 60 days of the agreement, a written plan to enhance the consolidated organization's risk management practices, a strategic plan to improve the consolidated organization's earnings and overall condition for the remainder of 2009 and a cash flow projection; (vii) comply with laws and regulations regarding senior executive officer positions and severance payments; and (viii) provide quarterly reports to the Reserve Bank regarding these undertakings.
Certain of Capitol's bank subsidiaries have entered into formal agreements with their applicable regulatory agencies. Those agreements provide for certain restrictions and other guidelines and/or limitations to be followed by the banks. The banks generally subject to such regulatory agreements are noted as such in the regulatory capital detail appearing on page 37.
Note N – Subsequent Events
Management has evaluated subsequent events through the time of filing this quarterly report on Form 10-Q on November 9, 2009.
On November 6, 2009, the sale of Bank of Santa Barbara was completed, resulting in aggregate proceeds approximating $3.9 million. As discussed in Note I, the Bank of Santa Barbara was not included in Capitol's consolidated assets at the time of sale. The pre-tax gain on sale of the bank will approximate $1.1 million.
On November 6, 2009, new tax legislation was signed into law which would increase the amount of tax benefits realizable through carryback of operating losses. Management has not completed its analysis of that new tax legislation, however, it is believed that it will be beneficial to the Corporation during the fourth quarter of 2009 through the recognition of additional income tax benefits in the form of potential refund of taxes previously paid which were charged to expense in prior years.
PART I, ITEM 2
MANAGEMENT'S DISCUSSION AND ANALYSIS OF FINANCIAL CONDITION
AND RESULTS OF OPERATIONS
The following discussion and analysis is intended as a review of significant factors affecting the financial condition and results of operations of Capitol for the periods indicated. The discussion should be read in conjunction with the unaudited condensed consolidated financial statements and the notes thereto presented herein. In addition to historical information, the following Management's Discussion and Analysis of Financial Condition and Results of Operations contains forward-looking statements that involve risks and uncertainties. Capitol's actual results could differ significantly from those anticipated in these forward-looking statements as a result of certain factors discussed in this report. Please refer to commentary regarding forward-looking statements appearing on page 2 of this document.
Financial Condition
Total assets approximated $5.3 billion at September 30, 2009 and $5.7 billion at December 31, 2008. The balance sheet includes Capitol and its consolidated subsidiaries (in thousands):
| | | Total Assets |
| | | September 30, 2009 | | | December 31, 2008 |
| Arizona Region: | | | | | |
| Arrowhead Community Bank | | $ | 77,223 | | | $ | 80,606 |
| Asian Bank of Arizona | | | 40,202 | | | | 38,127 |
| Bank of Tucson | | | 206,996 | | | | 189,869 |
| Camelback Community Bank | | | 89,859 | | | | 93,754 |
| Central Arizona Bank | | | 88,347 | | | | 79,775 |
| Colonia Bank | | | 12,786 | | | | 12,522 |
| Mesa Bank | | | 206,423 | | | | 248,262 |
| Southern Arizona Community Bank | | | 89,568 | | | | 88,146 |
| Sunrise Bank of Albuquerque | | | 79,724 | | | | 81,977 |
| Sunrise Bank of Arizona | | | 112,318 | | | | 119,395 |
Yuma Community Bank(3) | | | | | | | 73,028 |
| Arizona Region Total | | | 1,003,446 | | | | 1,105,461 |
| | | | | | | | |
| California Region: | | | | | | | |
| Bank of Escondido | | | 106,147 | | | | 96,803 |
| Bank of Feather River | | | 34,014 | | | | 29,218 |
| Bank of San Francisco | | | 81,270 | | | | 74,670 |
Bank of Santa Barbara(2) | | | | | | | 72,076 |
| Napa Community Bank | | | 163,014 | | | | 149,093 |
| Point Loma Community Bank | | | 75,167 | | | | 61,514 |
| Sunrise Bank of San Diego | | | 84,048 | | | | 86,322 |
| Sunrise Community Bank | | | 42,323 | | | | 36,139 |
| California Region Total | | | 585,983 | | | | 605,835 |
| | | | | | | | |
| Colorado Region: | | | | | | | |
| Fort Collins Commerce Bank | | | 88,504 | | | | 80,247 |
| Larimer Bank of Commerce | | | 90,146 | | | | 88,725 |
| Loveland Bank of Commerce | | | 38,944 | | | | 32,034 |
| Mountain View Bank of Commerce | | | 46,226 | | | | 37,740 |
| Colorado Region Total | | | 263,820 | | | | 238,746 |
| | | | | | | | |
| Great Lakes Region: | | | | | | | |
| Bank of Auburn Hills | | | 36,124 | | | | 43,856 |
| Bank of Maumee | | | 50,048 | | | | 56,812 |
| Bank of Michigan | | | 107,384 | | | | 78,716 |
| Capitol National Bank | | | 227,743 | | | | 245,354 |
| Elkhart Community Bank | | | 96,550 | | | | 99,917 |
| Evansville Commerce Bank | | | 56,601 | | | | 63,228 |
| Goshen Community Bank | | | 80,393 | | | | 87,419 |
Michigan Commerce Bank(1) | | | 1,187,487 | | | | 1,275,125 |
| Ohio Commerce Bank | | | 63,716 | | | | 60,678 |
| Paragon Bank & Trust | | | 102,479 | | | | 107,491 |
| Great Lakes Region Total | | | 2,008,525 | | | | 2,118,596 |
MANAGEMENT'S DISCUSSION AND ANALYSIS OF FINANCIAL CONDITION
AND RESULTS OF OPERATIONS – Continued
Financial Condition – Continued
Summary of total assets – continued:
| | | Total Assets |
| | | September 30, 2009 | | | December 31, 2008 |
| Midwest Region: | | | | | |
| Adams Dairy Bank | | $ | 42,248 | | | $ | 33,867 |
| Bank of Belleville | | | 73,017 | | | | 73,901 |
| Community Bank of Lincoln | | | 56,535 | | | | 53,222 |
Summit Bank of Kansas City(2) | | | | | | | 53,429 |
| Midwest Region Total | | | 171,800 | | | | 214,419 |
| | | | | | | | |
| Nevada Region: | | | | | | | |
1st Commerce Bank | | | 41,184 | | | | 52,622 |
| Bank of Las Vegas | | | 74,365 | | | | 73,692 |
| Black Mountain Community Bank | | | 173,101 | | | | 157,545 |
| Desert Community Bank | | | 107,244 | | | | 100,312 |
| Red Rock Community Bank | | | 138,547 | | | | 126,993 |
| Nevada Region Total | | | 534,441 | | | | 511,164 |
| | | | | | | | |
| Northeast Region: | | | | | | | |
| USNY Bank | | | 61,163 | | | | 49,620 |
| | | | | | | | |
| Northwest Region: | | | | | | | |
| Bank of Bellevue | | | 57,091 | | | | 55,841 |
| Bank of Everett | | | 44,232 | | | | 44,756 |
| Bank of Tacoma | | | 43,932 | | | | 44,241 |
| High Desert Bank | | | 44,803 | | | | 41,904 |
| Issaquah Community Bank | | | 35,034 | | | | 36,942 |
| Northwest Region Total | | | 225,092 | | | | 223,684 |
| | | | | | | | |
| Southeast Region: | | | | | | | |
| Bank of Valdosta | | | 52,662 | | | | 58,995 |
Community Bank of Rowan(2) | | | | | | | 138,341 |
| First Carolina State Bank | | | 114,011 | | | | 119,774 |
| Peoples State Bank | | | 26,837 | | | | 29,233 |
| Pisgah Community Bank | | | 58,705 | | | | 36,897 |
| Sunrise Bank of Atlanta | | | 57,521 | | | | 62,198 |
| Southeast Region Total | | | 309,736 | | | | 445,438 |
| | | | | | | | |
| Texas Region: | | | | | | | |
| Bank of Fort Bend | | | 34,831 | | | | 26,424 |
| Bank of Las Colinas | | | 43,810 | | | | 31,354 |
| Texas Region Total | | | 78,641 | | | | 57,778 |
| | | | | | | | |
| Parent company and other, net | | | 81,515 | | | | 84,095 |
| | | | | | | | |
| Consolidated Totals | | $ | 5,324,162 | | | $ | 5,654,836 |
| (1) | Michigan Commerce Bank resulted from the merger of Ann Arbor Commerce Bank, Brighton Commerce Bank, Detroit Commerce Bank, Grand Haven Bank, Kent Commerce Bank, Macomb Community Bank, Muskegon Commerce Bank, Oakland Commerce Bank and Portage Commerce Bank effective March 31, 2009. For comparative purposes, the merger of those banks is presented as if such merger occurred December 31, 2008. |
| (2) | Bank of Santa Barbara, Community Bank of Rowan and Summit Bank of Kansas City are majority-owned subsidiaries of Capitol Development Bancorp Limited (CDBL) III of which Capitol ceased to have majority voting control effective September 30, 2009. Thus, effective September 30, 2009, those banks and CDBL III ceased to be consolidated subsidiaries of Capitol. |
| (3) | Capitol sold its ownership in Yuma Community Bank effective September 21, 2009. |
MANAGEMENT'S DISCUSSION AND ANALYSIS OF FINANCIAL CONDITION
AND RESULTS OF OPERATIONS – Continued
Financial Condition – Continued
Portfolio loans, the single largest asset category, decreased during the nine months ended September 30, 2009 by approximately $546 million, compared to loan growth of about $347.6 million during the corresponding period of 2008. Of the interim 2009 decrease, $203 million related to the deconsolidation of Bank of Santa Barbara, Community Bank of Rowan and Summit Bank of Kansas City. Portfolio growth has slowed in response to the need to preserve liquidity and capital in the current economic climate and the general economic slowdown occurring nationally.
Geographic diversification of Capitol's balance sheet is important. Prior to 1996, all of Capitol's banking operations were located in Michigan. As of September 30, 2009, 39% of the consolidated loan portfolio relates to banks located within the Great Lakes Region (39% at December 31, 2008) and 61% of the consolidated loan portfolio relates to banks located in other regions of the country (61% at December 31, 2008). The reason why this is important is that Capitol's diversification efforts will add stability to results of operations by further reducing a disproportionate geographic concentration within a specific region. On July 21, 2009, Capitol announced the proposed spin-off of the substantial majority of its Michigan banking operation which, if completed, would minimize Capitol's future exposure to the Michigan economy. The proposed spin-off transaction is subject to a number of contingencies and is discussed elsewhere in this narrative.
The consolidated allowance for loan losses at September 30, 2009 approximated $126 million or 3.01% of total portfolio loans, a very significant increase from the 1.96% ratio at the beginning of the year, resulting from continued deterioration in economic conditions and asset quality.
[The remainder of this page intentionally left blank]
MANAGEMENT'S DISCUSSION AND ANALYSIS OF FINANCIAL CONDITION
AND RESULTS OF OPERATIONS – Continued
Financial Condition – Continued
The allowance for loan losses is maintained at a level believed adequate by management to absorb potential losses inherent in the loan portfolio at the balance-sheet date. Management's determination of the adequacy of the allowance is based on evaluation of the portfolio (including potential impairment of individual loans and concentrations of credit), past loss experience, current economic conditions, volume, amount and composition of the loan portfolio and other factors. The allowance is increased by provisions charged to operations and reduced by net charge-offs. The table below summarizes portfolio loan balances and activity in the allowance for loan losses (in thousands):
| | | Periods Ended September 30 | |
| | | Three Month Period | | | Nine Month Period | |
| | | 2009 | | | 2008 | | | 2009 | | | 2008 | |
| | | | | | | | | | | | | |
| Allowance for loan losses at beginning of period | | $ | 114,215 | | | $ | 63,904 | | | $ | 93,040 | | | $ | 58,124 | |
| | | | | | | | | | | | | | | | | |
| Loans charged-off: | | | | | | | | | | | | | | | | |
| Loans secured by real estate: | | | | | | | | | | | | | | | | |
| Commercial | | | (5,593 | ) | | | (2,186 | ) | | | (11,218 | ) | | | (5,630 | ) |
| Residential (including multi-family) | | | (6,845 | ) | | | (2,428 | ) | | | (18,213 | ) | | | (5,590 | ) |
| Construction, land development and other land | | | (11,862 | ) | | | (12,128 | ) | | | (25,729 | ) | | | (15,248 | ) |
Total loans secured by real estate | | �� | (24,300 | ) | | | (16,742 | ) | | | (55,160 | ) | | | (26,468 | ) |
| Commercial and other business-purpose loans | | | (8,582 | ) | | | (3,753 | ) | | | (21,340 | ) | | | (8,051 | ) |
| Consumer | | | (485 | ) | | | (73 | ) | | | (1,029 | ) | | | (262 | ) |
| Other | | | (34 | ) | | | -- | | | | (35 | ) | | | (34 | ) |
| Total charge-offs | | | (33,401 | ) | | | (20,568 | ) | | | (77,564 | ) | | | (34,815 | ) |
| Recoveries: | | | | | | | | | | | | | | | | |
| Loans secured by real estate: | | | | | | | | | | | | | | | | |
| Commercial | | | 29 | | | | 181 | | | | 151 | | | | 899 | |
| Residential (including multi-family) | | | 51 | | | | 130 | | | | 252 | | | | 590 | |
| Construction, land development and other land | | | 385 | | | | 17 | | | | 506 | | | | 240 | |
Total loans secured by real estate | | | 465 | | | | 328 | | | | 909 | | | | 1,729 | |
| Commercial and other business-purpose loans | | | 163 | | | | 102 | | | | 1,042 | | | | 686 | |
| Consumer | | | 88 | | | | 9 | | | | 117 | | | | 74 | |
| Other | | | 1 | | | | -- | | | | 2 | | | | -- | |
| Total recoveries | | | 717 | | | | 439 | | | | 2,070 | | | | 2,489 | |
| Net charge-offs | | | (32,684 | ) | | | (20,129 | ) | | | (75,494 | ) | | | (32,326 | ) |
| Additions to allowance charged to expense | | | 48,771 | | | | 53,810 | | | | 112,756 | | | | 71,787 | |
Less allowance for loan losses of subsidiaries no longer consolidated | | | (4,114 | ) | | | | | | | (4,114 | ) | | | | |
| | | | | | | | | | | | | | | | | |
| Allowance for loan losses at September 30 | | $ | 126,188 | | | $ | 97,585 | | | $ | 126,188 | | | $ | 97,585 | |
| | | | | | | | | | | | | | | | | |
| Average total portfolio loans for the period | | $ | 4,505,447 | | | $ | 4,617,153 | | | $ | 4,623,317 | | | $ | 4,521,165 | |
| | | | | | | | | | | | | | | | | |
Ratio of net charge-offs (annualized) to average portfolio loans outstanding | | | 2.90 | % | | | 1.74 | % | | | 2.18 | % | | | 0.95 | % |
MANAGEMENT'S DISCUSSION AND ANALYSIS OF FINANCIAL CONDITION
AND RESULTS OF OPERATIONS – Continued
Financial Condition – Continued
Interim loan charge-offs for the nine-month 2009 period, which increased significantly compared to 2008, are not necessarily indicative of future charge-off levels because of the variability in asset quality and resolution of nonperforming loans. The significant increase in the provision for loan losses in 2009 was associated primarily with Michigan, Arizona and Nevada banks, due to growth in nonperforming loans and a sustained difficult and uncertain economic climate. The interim 2009 provision for loan losses is discussed in further detail in the ‘Results of Operations’ section of this narrative.
The amounts of the allowance for loan losses allocated in the following table (dollars in thousands) are based on management's estimate of losses inherent in the portfolio at the balance sheet date and should not be interpreted as an indication of future charge-offs:
| | | September 30, 2009 | | | December 31, 2008 | |
| | | Amount | | | Percentage of Total Portfolio Loans | | | Amount | | | Percentage of Total Portfolio Loans | |
| |
| |
| |
| | | | | | | | | | | | | |
| Loans secured by real estate: | | | | | | | | | | | | |
| Commercial | | $ | 39,794 | | | | 0.95 | % | | $ | 30,007 | | | | 0.63 | % |
| Residential (including multi-family) | | | 28,445 | | | | 0.68 | % | | | 21,645 | | | | 0.46 | % |
Construction, land development and other land | | | 23,764 | | | | 0.57 | % | | | 17,496 | | | | 0.37 | % |
| Total loans secured by real estate | | | 92,003 | | | | 2.20 | % | | | 69,148 | | | | 1.46 | % |
| Commercial and other business-purpose loans | | | 32,717 | | | | 0.78 | % | | | 22,547 | | | | 0.47 | % |
| Consumer | | | 1,255 | | | | 0.03 | % | | | 1,032 | | | | 0.02 | % |
| Other | | | 213 | | | | | | | | 313 | | | | 0.01 | % |
| | | | | | | | | | | | | | | | | |
| Total allowance for loan losses | | $ | 126,188 | | | | 3.01 | % | | $ | 93,040 | | | | 1.96 | % |
[The remainder of this page intentionally left blank]
MANAGEMENT'S DISCUSSION AND ANALYSIS OF FINANCIAL CONDITION
AND RESULTS OF OPERATIONS – Continued
Financial Condition – Continued
Nonperforming loans (i.e., loans which are 90 days or more past due and still accruing interest and loans on nonaccrual status) and other nonperforming assets are summarized below (in $1,000s):
| | | September 30, 2009 | | | June 30, 2009 | | | March 31, 2009 | | | December 31, 2008 | |
| Nonaccrual loans: | | | | | | | | | | | | |
| Loans secured by real estate: | | | | | | | | | | | | |
| Commercial | | $ | 101,704 | | | $ | 84,879 | | | $ | 68,537 | | | $ | 39,892 | |
| Residential (including multi-family) | | | 54,226 | | | | 57,764 | | | | 62,961 | | | | 35,675 | |
| Construction, land development and other land | | | 86,720 | | | | 87,055 | | | | 77,861 | | | | 72,996 | |
| Total loans secured by real estate | | | 242,650 | | | | 229,698 | | | | 209,359 | | | | 148,563 | |
| Commercial and other business-purpose loans | | | 25,002 | | | | 24,767 | | | | 17,233 | | | | 16,283 | |
| Consumer | | | 513 | | | | 586 | | | | 356 | | | | 190 | |
| Total nonaccrual loans | | | 268,165 | | | | 255,051 | | | | 226,948 | | | | 165,036 | |
| | | | | | | | | | | | | | | | | |
Past due (>90 days) loans and accruing interest: | | | | | | | | | | | | | | | | |
| Loans secured by real estate: | | | | | | | | | | | | | | | | |
| Commercial | | | 4,520 | | | | 2,706 | | | | 2,345 | | | | 1,623 | |
| Residential (including multi-family) | | | 1,787 | | | | 1,318 | | | | 2,371 | | | | 365 | |
| Construction, land development and other land | | | 2,990 | | | | 4,284 | | | | 109 | | | | 2,293 | |
| Total loans secured by real estate | | | 9,297 | | | | 8,308 | | | | 4,825 | | | | 4,281 | |
| Commercial and other business-purpose loans | | | 4,223 | | | | 1,152 | | | | 636 | | | | 747 | |
| Consumer | | | 29 | | | | 42 | | | | 50 | | | | 146 | |
| Total past due loans | | | 13,549 | | | | 9,502 | | | | 5,511 | | | | 5,174 | |
| | | | | | | | | | | | | | | | | |
| Total nonperforming loans | | $ | 281,714 | | | $ | 264,553 | | | $ | 232,459 | | | $ | 170,210 | |
| | | | | | | | | | | | | | | | | |
Real estate owned and other repossessed assets | | | 120,107 | | | | 103,953 | | | | 87,074 | | | | 67,449 | |
| | | | | | | | | | | | | | | | | |
| Total nonperforming assets | | $ | 401,821 | | | $ | 368,506 | | | $ | 319,533 | | | $ | 237,659 | |
Loans are considered impaired when it is probable that all amounts due according to the contractual terms of a loan agreement will not be collected, including contractually scheduled interest and principal payments. Impaired loans, which are included in nonperforming loans, are summarized below (in $1,000s):
| | | September 30, 2009 | | | December 31, 2008 | |
| Impaired loans: | | | | | | |
| Loans which have an allowance requirement | | $ | 126,053 | | | $ | 82,387 | |
| Loans which do not have an allowance requirement | | | 142,112 | | | | 82,649 | |
| Total impaired loans | | $ | 268,165 | | | $ | 165,036 | |
| | | | | | | | | |
| Allowance for loan losses related to impaired loans | | $ | 30,781 | | | $ | 16,769 | |
Impaired loans which do not have an allowance requirement include collateral-dependent loans for which direct write-downs have been made and, accordingly, no allowance requirement or allocation is necessary.
MANAGEMENT'S DISCUSSION AND ANALYSIS OF FINANCIAL CONDITION
AND RESULTS OF OPERATIONS – Continued
Financial Condition – Continued
Nonperforming loans at September 30, 2009 approximated 6.72% of total portfolio loans, a sharp increase from the December 31, 2008 ratio of 3.59%. Nonperforming loans increased $112 million during the nine-month 2009 period. Notably, the pace of growth in nonperforming loans decreased for the second consecutive quarter. Of the nonperforming loans at September 30, 2009, about 89% were real estate secured. Those loans, when originated, had appropriate loan-to-value ratios based upon real estate market conditions at that time and, accordingly, have loss exposure which would be expected to be minimal; however, underlying real estate values depend upon current economic conditions and liquidation strategies. Most other nonperforming loans were generally secured by other business assets. Nonperforming loans at September 30, 2009 were in various stages of resolution for which management believes such loans are adequately collateralized or otherwise appropriately considered in its determination of the adequacy of the allowance for loan losses.
Due to local and regional economic conditions, there is uncertainty in future real estate values, appraisal results and the resulting potential impact on valuation of collateral-dependent loans and other real estate owned. The fair value measurement of collateral-dependent loans and other real estate owned is dependent primarily upon appraisal of the underlying property value. Management cautiously monitors real estate values and related appraisal data when evaluating such valuations.
Appraisals are generally obtained when it has been determined that a collateral-dependent loan has become impaired or when it is likely a real-estate loan will be foreclosed. Adjustments to the loan's carrying value or the allowance for loan losses are made, when appropriate, after review of the appraisal or subsequently if it is determined that the market significantly declines further. The timing of the recognition of a collateral-dependent loan as nonperforming is dependent on several factors, including the performance of the loan, the payment history of the loan or the receipt of updated borrower financial information. When borrower performance has deteriorated (for example, sales or leasing has not occurred as expected), the borrower has become late on the required payments or financial information received indicates adverse financial trends, the loan will be regraded and, if appropriate, an updated appraisal will be ordered. In the interim period between loans being recognized as impaired and the appraisal being received, the loan will be included within loss contingency pools. When the appraisal is received and reviewed and any further fair value analysis is completed, the loan will be evaluated for any appropriate charge-down. Generally, negative differences between appraised value, less the estimated cost to sell, and the carrying value of the loan are charged to the allowance for loan losses when the appraisal has been received and reviewed. Occasionally, additional amounts may be specifically reserved if there is a pending event which may impact the fair value estimate. Internally-developed evaluations may be used when the amount of the loan is less than $250,000. Internal evaluations may also be used when the most recent appraisal date is within a year and economic conditions have had corrections or deterioration. Updated appraisals are obtained at least annually for collateral-dependent loans and other real estate owned.
Many of Capitol's collateral-dependent impaired loans are located in severely depressed real estate markets. In those markets, appraisal data may be of limited usefulness in estimating fair value because comparable sale transactions are infrequent, not orderly and are often distressed or forced. In accordance with recent accounting standards on fair value, management made significant adjustments to appraisal data earlier in 2009, reducing estimated losses which would otherwise be recognized based on appraisals which appear to be biased by forced or distressed sales. Although recent accounting guidance provides for the use of alternative valuation techniques to estimate fair value, other than the exclusive use of appraisals, certain bank regulatory agencies appear to be singularly-focused on appraisal data even when such appraisal data may be tainted by forced or distressed sales. Because of this circumstance, bank regulatory agencies may increase their loss estimates.
Total nonperforming loans approximated $281.7 million at September 30, 2009. Of that total, $153.4 million or 54.5% (including some loans carried at the parent level) were originated by banks within the Great Lakes Region, primarily located in Michigan. Within the Great Lakes Region, nonperforming loans approximated 3.66% of total consolidated portfolio loans at September 30, 2009. Responsive to the elevated level of nonperforming loans within the Great Lakes Region, higher levels of allowances for loan losses have been established, approximating 4.01% of portfolio loans for the region on a combined basis as of September 30, 2009 and ranging as high as 5.21%
MANAGEMENT'S DISCUSSION AND ANALYSIS OF FINANCIAL CONDITION
AND RESULTS OF OPERATIONS – Continued
Financial Condition – Continued
at certain banks. Those ratios can be contrasted with other banks and geographic regions within the Corporation with lower levels of nonperforming loans. Nonperforming loans have increased during the nine months ended September 30, 2009 in other regions, such as the Arizona Region ($7.6 million increase) and the Nevada Region ($27.4 million increase) to 1.19% and 1.04% of consolidated portfolio loans, respectively, as the effects of the recession have had an evolving significant effect on those regions recently.
In addition to the identification of nonperforming loans involving borrowers with payment performance difficulties (i.e., nonaccrual loans and loans past due 90 days or more), management utilizes an internal loan review process to identify other potential problem loans which may warrant additional monitoring or other attention. This loan review process is a continuous activity which periodically updates internal loan ratings. At inception, all loans are individually assigned a rating which grades the credits on a risk basis, based on the financial strength of the borrower and guarantors and other factors such as nature of the borrower's business climate, local economic conditions and other subjective factors. The loan rating process is fluid and subjective.
Potential problem loans include loans which are generally performing as agreed; however, because of loan reviews and/or lending staff's risk assessment, increased monitoring is deemed appropriate. In addition, some loans are assigned a more adverse classification, with specific performance issues or other risk factors requiring close management and development of specific remedial action plans.
At September 30, 2009, potential problem loans (including the previously-mentioned nonperforming loans) approximated $826 million or about 20% of total consolidated portfolio loans, a significant increase compared to approximately $551 million or about 12% at December 31, 2008. These potential problem loans do not necessarily have significant loss exposure (nor are they necessarily deemed 'impaired'), but rather are identified by management in this manner to aid in loan administration and risk management. Management has considered these loans in its evaluation of the adequacy of the allowance for loan losses. Management believes, however, that current general economic conditions in some markets may result in higher levels of future loan losses in comparison to previous years, as experienced in the first nine months of 2009.
Real estate owned and other repossessed assets increased $53 million to $120 million during the nine months ended September 30, 2009. Most of this increase ($48 million) was related to banks located in Michigan and the Arizona Region.
Foreclosure laws in Michigan generally favor borrowers rather than lenders and, accordingly, foreclosure and redemption periods (i.e., the number of months it takes for a financial institution to obtain clear title to freely market the real estate) take much longer than many other states. Further, once the property is available to the bank for sale or liquidation, market conditions, as they are currently (particularly in Michigan and some western communities), may not be conducive to rapid marketing or near-term sale of the properties.
Asset quality is summarized on the following two pages.
[The remainder of this page intentionally left blank]
MANAGEMENT'S DISCUSSION AND ANALYSIS OF FINANCIAL CONDITION
AND RESULTS OF OPERATIONS – Continued
Financial Condition – Continued
The following comparative analysis summarizes each bank's total portfolio loans, allowance for loan losses, nonperforming loans and ratio of the allowance as a percentage of portfolio loans (dollars in thousands):
| | | | | | Allowance for | | | | | | Allowance as a Percentage | |
| | | Total Portfolio Loans | | | Loan Losses | | | Nonperforming Loans | | | of Total Portfolio Loans | |
| | | Sept 30, 2009 | | | Dec 31, 2008 | | | Sept 30, 2009 | | | Dec 31, 2008 | | | Sept 30, 2009 | | | Dec 31, 2008 | | | Sept 30, 2009 | | | Dec 31, 2008 | |
| Arizona Region: | | | | | | | | | | | | | | | | | | | | | | | | |
| Arrowhead Community Bank | | $ | 53,759 | | | $ | 69,487 | | | $ | 4,561 | | | $ | 2,375 | | | $ | 5,964 | | | $ | 7,430 | | | | 8.48 | % | | | 3.42 | % |
| Asian Bank of Arizona | | | 31,257 | | | | 33,023 | | | | 1,000 | | | | 694 | | | | 461 | | | | 1,898 | | | | 3.20 | % | | | 2.10 | % |
| Bank of Tucson | | | 153,793 | | | | 168,390 | | | | 1,936 | | | | 1,550 | | | | 4,375 | | | | 2,462 | | | | 1.26 | % | | | 0.92 | % |
| Camelback Community Bank | | | 79,206 | | | | 84,957 | | | | 1,320 | | | | 789 | | | | 3,835 | | | | 2,030 | | | | 1.67 | % | | | 0.93 | % |
| Central Arizona Bank | | | 68,203 | | | | 69,372 | | | | 2,917 | | | | 1,339 | | | | 2,388 | | | | 1,895 | | | | 4.28 | % | | | 1.93 | % |
| Colonia Bank | | | 10,429 | | | | 7,483 | | | | 216 | | | | 120 | | | | | | | | | | | | 2.07 | % | | | 1.60 | % |
| Mesa Bank | | | 107,965 | | | | 147,853 | | | | 2,459 | | | | 3,250 | | | | 14,492 | | | | 21,423 | | | | 2.28 | % | | | 2.20 | % |
| Southern Arizona Community Bank | | | 79,338 | | | | 79,434 | | | | 1,110 | | | | 875 | | | | 164 | | | | | | | | 1.40 | % | | | 1.10 | % |
| Sunrise Bank of Albuquerque | | | 65,561 | | | | 74,115 | | | | 1,269 | | | | 933 | | | | 6,296 | | | | 43 | | | | 1.94 | % | | | 1.26 | % |
| Sunrise Bank of Arizona | | | 88,607 | | | | 110,131 | | | | 1,676 | | | | 1,159 | | | | 11,976 | | | | 3,707 | | | | 1.89 | % | | | 1.05 | % |
Yuma Community Bank(3) | | | | | | | 63,804 | | | | | | | | 730 | | | | | | | | 1,506 | | | | | | | | 1.14 | % |
| Arizona Region Total | | | 738,118 | | | | 908,049 | | | | 18,464 | | | | 13,814 | | | | 49,951 | | | | 42,394 | | | | 2.50 | % | | | 1.52 | % |
| | | | | | | | | | | | | | | | | | | | | | | | | | | | | | | | | |
| California Region: | | | | | | | | | | | | | | | | | | | | | | | | | | | | | | | | |
| Bank of Escondido | | | 69,420 | | | | 62,608 | | | | 1,784 | | | | 810 | | | | 2,838 | | | | 817 | | | | 2.57 | % | | | 1.29 | % |
| Bank of Feather River | | | 27,178 | | | | 22,962 | | | | 347 | | | | 320 | | | | | | | | | | | | 1.28 | % | | | 1.39 | % |
| Bank of San Francisco | | | 72,473 | | | | 60,772 | | | | 1,352 | | | | 823 | | | | 597 | | | | 299 | | | | 1.87 | % | | | 1.35 | % |
Bank of Santa Barbara(2) | | | | | | | 60,535 | | | | | | | | 1,138 | | | | | | | | 1,841 | | | | | | | | 1.88 | % |
| Napa Community Bank | | | 141,984 | | | | 130,150 | | | | 2,550 | | | | 1,890 | | | | 2,849 | | | | 1,848 | | | | 1.80 | % | | | 1.45 | % |
| Point Loma Community Bank | | | 51,498 | | | | 52,497 | | | | 1,100 | | | | 797 | | | | 2,172 | | | | 795 | | | | 2.14 | % | | | 1.52 | % |
| Sunrise Bank of San Diego | | | 66,748 | | | | 76,282 | | | | 2,620 | | | | 1,048 | | | | 3,609 | | | | 1,444 | | | | 3.93 | % | | | 1.37 | % |
| Sunrise Community Bank | | | 33,210 | | | | 28,355 | | | | 995 | | | | 440 | | | | 1,107 | | | | | | | | 3.00 | % | | | 1.55 | % |
| California Region Total | | | 462,511 | | | | 494,161 | | | | 10,748 | | | | 7,266 | | | | 13,172 | | | | 7,044 | | | | 2.32 | % | | | 1.47 | % |
| | | | | | | | | | | | | | | | | | | | | | | | | | | | | | | | | |
| Colorado Region: | | | | | | | | | | | | | | | | | | | | | | | | | | | | | | | | |
| Fort Collins Commerce Bank | | | 80,945 | | | | 74,280 | | | | 1,630 | | | | 1,101 | | | | 1,829 | | | | 48 | | | | 2.01 | % | | | 1.48 | % |
| Larimer Bank of Commerce | | | 79,377 | | | | 78,638 | | | | 1,620 | | | | 1,160 | | | | | | | | | | | | 2.04 | % | | | 1.48 | % |
| Loveland Bank of Commerce | | | 33,174 | | | | 27,251 | | | | 590 | | | | 652 | | | | 1,386 | | | | 1,090 | | | | 1.78 | % | | | 2.39 | % |
| Mountain View Bank of Commerce | | | 39,037 | | | | 32,180 | | | | 601 | | | | 474 | | | | | | | | | | | | 1.54 | % | | | 1.47 | % |
| Colorado Region Total | | | 232,533 | | | | 212,349 | | | | 4,441 | | | | 3,387 | | | | 3,215 | | | | 1,138 | | | | 1.91 | % | | | 1.60 | % |
| | | | | | | | | | | | | | | | | | | | | | | | | | | | | | | | | |
| Great Lakes Region: | | | | | | | | | | | | | | | | | | | | | | | | | | | | | | | | |
| Bank of Auburn Hills | | | 31,346 | | | | 39,914 | | | | 1,625 | | | | 988 | | | | 1,536 | | | | 2,895 | | | | 5.18 | % | | | 2.48 | % |
| Bank of Maumee | | | 40,521 | | | | 50,094 | | | | 1,100 | | | | 752 | | | | 542 | | | | 37 | | | | 2.71 | % | | | 1.50 | % |
| Bank of Michigan | | | 66,123 | | | | 67,700 | | | | 1,191 | | | | 996 | | | | 1,498 | | | | 306 | | | | 1.80 | % | | | 1.47 | % |
| Capitol National Bank | | | 182,751 | | | | 213,392 | | | | 7,456 | | | | 8,341 | | | | 19,021 | | | | 12,828 | | | | 4.08 | % | | | 3.91 | % |
| Elkhart Community Bank | | | 77,470 | | | | 87,971 | | | | 2,748 | | | | 1,702 | | | | 7,188 | | | | 3,941 | | | | 3.55 | % | | | 1.93 | % |
| Evansville Commerce Bank | | | 46,971 | | | | 55,779 | | | | 1,160 | | | | 943 | | | | 1,055 | | | | 158 | | | | 2.47 | % | | | 1.69 | % |
| Goshen Community Bank | | | 63,799 | | | | 74,144 | | | | 1,706 | | | | 1,501 | | | | 1,839 | | | | 876 | | | | 2.67 | % | | | 2.02 | % |
Michigan Commerce Bank(1) | | | 1,001,207 | | | | 1,127,348 | | | | 44,061 | | | | 30,258 | | | | 107,467 | | | | 63,092 | | | | 4.40 | % | | | 2.68 | % |
| Ohio Commerce Bank | | | 52,956 | | | | 48,207 | | | | 814 | | | | 723 | | | | | | | | | | | | 1.54 | % | | | 1.50 | % |
| Paragon Bank & Trust | | | 70,214 | | | | 87,651 | | | | 3,655 | | | | 2,990 | | | | 6,820 | | | | 6,447 | | | | 5.21 | % | | | 3.41 | % |
| Great Lakes Region Total | | | 1,633,358 | | | | 1,852,200 | | | | 65,516 | | | | 49,194 | | | | 146,966 | | | | 90,580 | | | | 4.01 | % | | | 2.66 | % |
| | | | | | | | | | | | | | | | | | | | | | | | | | | | | | | | | |
| Midwest Region: | | | | | | | | | | | | | | | | | | | | | | | | | | | | | | | | |
| Adams Dairy Bank | | | 35,330 | | | | 28,834 | | | | 645 | | | | 450 | | | | 207 | | | | | | | | 1.83 | % | | | 1.56 | % |
| Bank of Belleville | | | 63,371 | | | | 65,150 | | | | 938 | | | | 923 | | | | | | | | | | | | 1.48 | % | | | 1.42 | % |
| Community Bank of Lincoln | | | 45,232 | | | | 43,657 | | | | 960 | | | | 674 | | | | 263 | | | | | | | | 2.12 | % | | | 1.54 | % |
Summit Bank of Kansas City(2) | | | | | | | 44,068 | | | | | | | | 709 | | | | | | | | 779 | | | | | | | | 1.61 | % |
| Midwest Region Total | | | 143,933 | | | | 181,709 | | | | 2,543 | | | | 2,756 | | | | 470 | | | | 779 | | | | 1.77 | % | | | 1.52 | % |
MANAGEMENT'S DISCUSSION AND ANALYSIS OF FINANCIAL CONDITION
AND RESULTS OF OPERATIONS – Continued
Financial Condition – Continued
Summary of loan information – continued:
| | | | | | Allowance for | | | | | | Allowance as a Percentage | |
| | | Total Portfolio Loans | | | Loan Losses | | | Nonperforming Loans | | | of Total Portfolio Loans | |
| | | Sept 30, 2009 | | | Dec 31, 2008 | | | Sept 30, 2009 | | | Dec 31, 2008 | | | Sept 30, 2009 | | | Dec 31, 2008 | | | Sept 30, 2009 | | | Dec 31, 2008 | |
| Nevada Region: | | | | | | | | | | | | | | | | | | | | | | | | |
1st Commerce Bank | | $ | 34,264 | | | $ | 30,663 | | | $ | 1,207 | | | $ | 740 | | | $ | 6,332 | | | $ | 1,000 | | | | 3.52 | % | | | 2.41 | % |
| Bank of Las Vegas | | | 63,021 | | | | 64,648 | | | | 2,092 | | | | 901 | | | | 7,982 | | | | 4,399 | | | | 3.32 | % | | | 1.39 | % |
| Black Mountain Community Bank | | | 143,494 | | | | 143,654 | | | | 2,452 | | | | 1,765 | | | | 9,760 | | | | 1,722 | | | | 1.71 | % | | | 1.23 | % |
| Desert Community Bank | | | 84,814 | | | | 87,388 | | | | 2,625 | | | | 943 | | | | 5,539 | | | | 3,671 | | | | 3.10 | % | | | 1.08 | % |
| Red Rock Community Bank | | | 95,377 | | | | 110,143 | | | | 2,985 | | | | 1,200 | | | | 14,101 | | | | 5,488 | | | | 3.13 | % | | | 1.09 | % |
| Nevada Region Total | | | 420,970 | | | | 436,496 | | | | 11,361 | | | | 5,549 | | | | 43,714 | | | | 16,280 | | | | 2.70 | % | | | 1.27 | % |
| | | | | | | | | | | | | | | | | | | | | | | | | | | | | | | | | |
| Northeast Region: | | | | | | | | | | | | | | | | | | | | | | | | | | | | | | | | |
| USNY Bank | | | 54,889 | | | | 43,471 | | | | 833 | | | | 680 | | | | | | | | | | | | 1.52 | % | | | 1.56 | % |
| | | | | | | | | | | | | | | | | | | | | | | | | | | | | | | | | |
| Northwest Region: | | | | | | | | | | | | | | | | | | | | | | | | | | | | | | | | |
| Bank of Bellevue | | | 40,846 | | | | 48,838 | | | | 1,030 | | | | 850 | | | | 2,674 | | | | 170 | | | | 2.52 | % | | | 1.74 | % |
| Bank of Everett | | | 36,665 | | | | 32,735 | | | | 1,190 | | | | 686 | | | | 3,344 | | | | 92 | | | | 3.25 | % | | | 2.10 | % |
| Bank of Tacoma | | | 34,784 | | | | 40,175 | | | | 1,115 | | | | 770 | | | | 1,627 | | | | 1,183 | | | | 3.21 | % | | | 1.92 | % |
| High Desert Bank | | | 36,419 | | | | 35,407 | | | | 900 | | | | 624 | | | | 841 | | | | | | | | 2.47 | % | | | 1.76 | % |
| Issaquah Community Bank | | | 28,641 | | | | 24,238 | | | | 700 | | | | 385 | | | | 734 | | | | | | | | 2.44 | % | | | 1.59 | % |
| Northwest Region Total | | | 177,355 | | | | 181,393 | | | | 4,935 | | | | 3,315 | | | | 9,220 | | | | 1,445 | | | | 2.78 | % | | | 1.83 | % |
| | | | | | | | | | | | | | | | | | | | | | | | | | | | | | | | | |
| Southeast Region: | | | | | | | | | | | | | | | | | | | | | | | | | | | | | | | | |
| Bank of Valdosta | | | 44,331 | | | | 51,629 | | | | 843 | | | | 835 | | | | 972 | | | | | | | | 1.90 | % | | | 1.62 | % |
Community Bank of Rowan(2) | | | | | | | 109,290 | | | | | | | | 1,634 | | | | | | | | 1,688 | | | | | | | | 1.50 | % |
| First Carolina State Bank | | | 93,979 | | | | 97,670 | | | | 1,710 | | | | 1,312 | | | | 2,877 | | | | 2,421 | | | | 1.82 | % | | | 1.34 | % |
| Peoples State Bank | | | 19,438 | | | | 21,314 | | | | 399 | | | | 366 | | | | 1,158 | | | | 937 | | | | 2.05 | % | | | 1.72 | % |
| Pisgah Community Bank | | | 45,729 | | | | 27,746 | | | | 918 | | | | 475 | | | | 419 | | | | 100 | | | | 2.01 | % | | | 1.71 | % |
| Sunrise Bank of Atlanta | | | 45,657 | | | | 52,763 | | | | 1,465 | | | | 1,063 | | | | 3,150 | | | | 269 | | | | 3.21 | % | | | 2.01 | % |
| Southeast Region Total | | | 249,134 | | | | 360,412 | | | | 5,335 | | | | 5,685 | | | | 8,576 | | | | 5,415 | | | | 2.14 | % | | | 1.58 | % |
| | | | | | | | | | | | | | | | | | | | | | | | | | | | | | | | | |
| Texas Region: | | | | | | | | | | | | | | | | | | | | | | | | | | | | | | | | |
| Bank of Fort Bend | | | 29,403 | | | | 19,859 | | | | 465 | | | | 305 | | | | | | | | | | | | 1.58 | % | | | 1.54 | % |
| Bank of Las Colinas | | | 34,772 | | | | 29,657 | | | | 705 | | | | 435 | | | | | | | | | | | | 2.03 | % | | | 1.47 | % |
| Texas Region Total | | | 64,175 | | | | 49,516 | | | | 1,170 | | | | 740 | | | | | | | | | | | | 1.82 | % | | | 1.49 | % |
| | | | | | | | | | | | | | | | | | | | | | | | | | | | | | | | | |
| Parent company and other, net | | | 12,558 | | | | 15,473 | | | | 842 | | | | 654 | | | | 6,430 | | | | 5,135 | | | | 6.71 | % | | | 4.23 | % |
| | | | | | | | | | | | | | | | | | | | | | | | | | | | | | | | | |
| Consolidated totals | | $ | 4,189,534 | | | $ | 4,735,229 | | | $ | 126,188 | | | $ | 93,040 | | | $ | 281,714 | | | $ | 170,210 | | | | 3.01 | % | | | 1.96 | % |
| (1) | Michigan Commerce Bank resulted from the merger of Ann Arbor Commerce Bank, Brighton Commerce Bank, Detroit Commerce Bank, Grand Haven Bank, Kent Commerce Bank, Macomb Community Bank, Muskegon Commerce Bank, Oakland Commerce Bank and Portage Commerce Bank effective March 31, 2009. For comparative purposes, the merger of those banks is presented as if such merger occurred December 31, 2008. |
| (2) | Bank of Santa Barbara, Community Bank of Rowan and Summit Bank of Kansas City are majority-owned subsidiaries of Capitol Development Bancorp Limited (CDBL) III of which Capitol ceased to have majority voting control effective September 30, 2009. Thus, effective September 30, 2009, those banks and CDBL III ceased to be consolidated subsidiaries of Capitol. |
| (3) | Capitol sold its ownership in Yuma Community Bank effective September 21, 2009. |
As previously discussed, the adequacy of the allowance for loan losses is determined by management at the balance-sheet date. Levels of nonperforming loans may fluctuate at balance-sheet dates at amounts which are not commensurate with the ratio of the allowance for loan losses or the so-called allowance coverage ratio of nonperforming loans (i.e., nonperforming loans as a percentage of the allowance for loan losses). Several factors may contribute to this occurrence. For example, estimated losses relating to impaired collateral-dependent loans are generally reflected as direct write-downs to those loans (and, accordingly, there is no related allowance for loan losses allocation necessary). Further, some collateral-dependent loans may have no or minimal loss potential which would negate a computational comparison between the allowance for loan losses and such nonperforming loans.
MANAGEMENT'S DISCUSSION AND ANALYSIS OF FINANCIAL CONDITION
AND RESULTS OF OPERATIONS – Continued
Financial Condition – Continued
At September 30, 2009, Capitol had $68 million of goodwill and other intangibles ($72.3 million at December 31, 2008). Goodwill arises in acquisition accounting. In Capitol's history, most of this goodwill is the result of share-exchange transactions when Capitol issued shares of its common stock at a premium over the book value of the noncontrolling interest of a subsidiary banks' shares. Resulting goodwill is recorded at the entity to which the goodwill related. Current accounting rules require an annual review of goodwill for potential impairment, which Capitol most recently conducted as of November 30, 2008. An interim review for potential goodwill impairment is deemed necessary when events or circumstances indicate potential for impairment since the annual testing date. Impairment testing is determined through a two-step process; step one involves using published information regarding comparable bank-sale transactions and related multiples of book values and multiples of earnings, as well as the primary valuation methodology to determine fair value, which is the discounted cash flow method. The second testing step is required in the event that any reporting unit fails step one. Step two involves the determination of the fair value of each component of the reporting unit's balance sheet. The results of this approach to estimating fair value of the reporting unit is compared to the implied fair value determined in step one. The difference between the estimated fair value determined in step two of the impairment test and the implied fair value represents implied goodwill which, in turn, is compared to recorded goodwill. If implied goodwill is less than recorded goodwill, impairment exists and the amount of shortfall between implied goodwill and recorded goodwill is the impairment amount which is to be written off in the period the determination is made.
During the third quarter of 2009, Capitol initiated an evaluation using August 31, 2009 information to determine if events or circumstances warranted an interim impairment test of goodwill. Such events or circumstances considered included recent increases in the level of nonperforming assets, changes in net interest margin, level of operating expenses, profitability and recent changes to elements of the discount rate. These are considered key inputs and drivers in the step one valuation methodology which is discounted cash flows. Capitol determined that during the third quarter of 2009, a number of the key inputs, either individually or collectively, had changed significantly for a number of the reporting units from prior quarter-ends as well as since the last testing date of November 30, 2008 such that an updated interim impairment test was warranted. The overall methodology for evaluating potential impairment of goodwill did not change in 2009 from the methodology used for annual testing performed in 2008, but assumptions used in step one and step two analyses were updated to reflect the current environment.
In performing step one of the interim analyses, future cash flows were projected using updated assumptions for asset growth, interest margin, noninterest income and noninterest expense. Those cash flows were then discounted using an updated discount rate that was adjusted for changes in the 20-year U.S. Treasury rate and company-specific risk premiums. The discount rate used for all entities was 16.14% which was 144 basis points higher than the discount rate used for the majority of the entities during the annual impairment testing conducted as of November 30, 2008. Additionally, cash flows were discounted using a lower rate of 15.14% and higher rate of 17.14% in order to stress-test the results of the analysis.
[The remainder of this page intentionally left blank]
MANAGEMENT'S DISCUSSION AND ANALYSIS OF FINANCIAL CONDITION
AND RESULTS OF OPERATIONS – Continued
Financial Condition – Continued
The following table provides information as to the amount of goodwill by the reporting unit as of August 31, 2009, the estimated fair value determined in step one under the discounted cash flow methodology as a percentage of carrying value of equity and whether the reporting unit passed step one of the impairment testing:
| Entity | | Recorded Goodwill as of August 31, 2009 | | | Estimated Entity Fair Value as Percentage of Book Value | | Did Entity Pass Step One of Impairment Test? |
| | | (in $1,000s) | | | | | |
| | | | | | | | |
| Paragon Bank & Trust | | $ | 1,321 | | | | 105.13 | % | Yes |
| Michigan Commerce Bank | | | 2,875 | | | | 93.35 | % | No |
| Elkhart Community Bank | | | 1,228 | | | | 135.72 | % | Yes |
| Goshen Community Bank | | | 1,407 | | | | 115.92 | % | Yes |
| Central Arizona Bank | | | 947 | | | | 86.95 | % | No |
| Camelback Community Bank | | | 894 | | | | 130.91 | % | Yes |
| Southern Arizona Community Bank | | | 916 | | | | 154.09 | % | Yes |
| Mesa Bank | | | 1,552 | | | | 120.34 | % | Yes |
| Arrowhead Community Bank | | | 644 | | | | 83.94 | % | No |
| Sunrise Bank of Albuquerque | | | 671 | | | | 97.26 | % | No |
| Sunrise Bank of San Diego | | | 1,965 | | | | 96.11 | % | No |
| Desert Community Bank | | | 1,213 | | | | 156.93 | % | Yes |
| Red Rock Community Bank | | | 2,582 | | | | 148.15 | % | Yes |
| Black Mountain Community Bank | | | 1,263 | | | | 212.44 | % | Yes |
| First Carolina State Bank | | | 3,926 | | | | 62.26 | % | No |
| Peoples State Bank | | | 2,125 | | | | 28.83 | % | No |
| Bank of Las Vegas | | | 1,800 | | | | 85.85 | % | No |
| Bank of Escondido | | | 2,806 | | | | 86.21 | % | No |
| | | | | | | | | | |
| Capitol Bancorp Limited | | $ | 70,596 | | | | 133.83 | % | Yes |
As noted in the table above, nine reporting units did not pass step one of the impairment test and, accordingly, were subject to further evaluation under step two testing. The resulting step two analysis determined one institution, Peoples State Bank, in which the implied goodwill was less than the recorded goodwill by approximately $1.5 million. Therefore, that amount was written-off to noninterest expense effective September 2009. There can be no assurance that future testing will not result in additional material impairment charges at a future date.
Accounting for income taxes (before valuation allowance; see following discussion) requires significant estimates and management judgments. At September 30, 2009, Capitol had a deferred tax asset approximating $109 million ($61.3 million at December 31, 2008). If it is determined that realization of the deferred tax asset is in doubt, a valuation reserve is required to reduce the deferred tax asset to the amount which is more-likely-than-not realizable.
Capitol Bancorp's management has considered and reviewed the status of the corporation's consolidated deferred tax asset as of September 30, 2009. As of that date, the consolidated deferred tax asset consisted primarily of components relating to provisions for loan losses and net operating losses of consolidated subsidiaries. Current accounting rules require recording of a valuation allowance for deferred taxes assets when realization of the asset is less than more-likely-than-not.
Due to continuing operating losses during 2009, management reassessed the potential realization of the deferred tax asset as of September 30, 2009 and elected to record a valuation allowance of $91 million, to reduce the deferred tax asset to approximately $17.6 million, which represents the amount of the asset estimated to be currently recoverable via carryback of current net operating losses.
MANAGEMENT'S DISCUSSION AND ANALYSIS OF FINANCIAL CONDITION
AND RESULTS OF OPERATIONS – Continued
Results of Operations
Summary
The third quarter 2009 net loss attributable to Capitol was approximately $83.7 million compared to $32.5 million reported for the third quarter of 2008. The net loss per share attributable to Capitol for the three months ended September 30, 2009 was $4.81 compared to loss per share of $1.90 in the corresponding period of 2008. The net loss attributable to Capitol for the nine months ended September 30, 2009 approximated $118.1 million, compared to $29.7 million in the corresponding period of 2008. The net loss per share attributable to Capitol was $6.84 for the nine months ended September 30, 2009, compared to $1.73 in the corresponding 2008 period.
The primary reason for the interim 2009 loss was a very large provision for loan losses recorded during the nine months ended September 30, 2009 as the Corporation continued to carefully assess the implications and impact of declining property values and weak bank performance as well as a valuation allowance of approximately $91 million recorded to reduce deferred tax assets. The provision for loan losses increased $41 million to $112.8 million for the nine months ended September 30, 2009, compared to a provision of $71.8 million for the corresponding period of 2008.
Analytical Review
The provision for loan losses for the three months ended September 30, 2009 was $48.8 million compared to $53.8 million during the corresponding 2008 period. The provision for loan losses for the nine-month 2009 period was $112.8 million compared to $71.8 million for the same period in 2008. The provision for loan losses increased significantly in the 2009 period due to higher levels of loan charge-offs and in response to growth in nonperforming loans. Of the provision for loan losses for the nine months ended September 30, 2009, about half was attributable to increasing the allowance for loan losses as a percentage of portfolio loans from 1.96% to 3.01%. Provisions for loan losses are based upon management's analysis of the adequacy of the allowance for loan losses, as previously discussed. The significant increase in the provision for loan losses compared to the preceding year had a material adverse effect on operating results for the interim 2009 periods.
Net interest income for the nine-month 2009 period totaled $118.1 million, a 5.65% decrease compared to $125.2 million in 2008. Net interest income for the three months ended September 30, 2009 totaled $40.1 million, a 2.41% decrease compared to $41 million in 2008. The net interest margin approximated 3.0% for the three months ended September 30, 2009, a 2 basis-point increase compared to 2.98% for the three months ended December 31, 2008 and a 30 basis-point decrease compared to 3.3% for the three months ended September 30, 2008. Several causal factors impacted the 2009 margin, including elevated levels of nonperforming loans, higher levels of liquidity, higher cost of funds due to avoiding wholesale funding sources, migration of noninterest-bearing deposits to interest-bearing accounts, changes in interest rates and higher interest costs related to debt obligations. It is difficult to speculate on future changes in net interest margin.
Noninterest income for the three months ended September 30, 2009 was $7.2 million, a 3% increase compared to the $7.0 million for the same period in 2008, primarily due to a gain on the sale of a bank subsidiary. Noninterest income for the nine months ended September 30, 2009 was $19.1 million, a decrease of $880,000 or 4.4%, over the same period in 2008. Fees from origination of non-portfolio residential mortgage loans totaled $3.2 million for the first nine months of 2009, up slightly from $2.9 million for the comparable period in 2008, due to lower interest rates and increasing loan origination volume.
The largest element of noninterest expense is salaries and employee benefits, which approximated $77 million for the nine months ended September 30, 2009, a decrease from $82.6 million in the corresponding period of 2008. For the three months ended September 30, 2009, salaries and employee benefits expense decreased $5.8 million or about 20% from amounts recorded in the comparable period of 2008, as a result of significant reductions in staffing and other cost-cutting measures implemented in late 2008 and early 2009.
MANAGEMENT'S DISCUSSION AND ANALYSIS OF FINANCIAL CONDITION
AND RESULTS OF OPERATIONS – Continued
Results of Operations – Continued
Noninterest expense totaled $157.2 million for the nine-month 2009 period and $55.5 million for the three months ended September 30, 2009, compared to $146.4 million and $53.8 million, respectively, for the comparable periods of 2008. The net increase in noninterest expense is associated with regulatory fees, growth in the size of previously-existing banks, costs of problem loan administration and other real estate write-downs. Costs associated with foreclosed properties and other real estate increased to $18 million in the nine-month 2009 period ($4.1 million in the 2008 period) while the cost of FDIC insurance and other regulatory fees also increased significantly to $11.3 million ($2.9 million in the 2008 period) largely attributable to a one-time special FDIC industry-wide assessment effective June 30, 2009 which approximated $2.6 million. The FDIC has announced it is likely that an additional special assessment will be imposed later in 2009, however, the amount has not been determined.
The more significant elements of other noninterest expense consisted of the following (in thousands) for the periods ended September 30:
| | | Three Month Period | | | Nine Month Period | |
| | | 2009 | | | 2008 | | | 2009 | | | 2008 | |
| | | | | | | | | | | | | |
Bank services (ATMs, telephone banking and Internet banking) | | $ | 649 | | | $ | 687 | | | $ | 2,102 | | | $ | 1,868 | |
| Loan and collection expense | | | 834 | | | | 410 | | | | 2,097 | | | | 1,443 | |
| Legal fees | | | 1,012 | | | | 373 | | | | 2,052 | | | | 946 | |
| Directors' fees | | | 507 | | | | 616 | | | | 1,768 | | | | 2,174 | |
| Advertising | | | 513 | | | | 838 | | | | 1,533 | | | | 2,471 | |
| Paper, printing and supplies | | | 517 | | | | 648 | | | | 1,526 | | | | 2,200 | |
| Professional fees | | | 767 | | | | 485 | | | | 1,442 | | | | 1,184 | |
| Travel, lodging and meals | | | 463 | | | | 707 | | | | 1,349 | | | | 2,193 | |
| Communications | | | 394 | | | | 585 | | | | 1,308 | | | | 1,634 | |
| Postage | | | 318 | | | | 335 | | | | 949 | | | | 993 | |
| Taxes other than income taxes | | | 197 | | | | 147 | | | | 690 | | | | 658 | |
| Dues and memberships | | | 207 | | | | 245 | | | | 634 | | | | 704 | |
| Insurance expense | | | 204 | | | | 158 | | | | 549 | | | | 451 | |
| Courier service | | | 185 | | | | 220 | | | | 542 | | | | 692 | |
| Contracted labor | | | 114 | | | | 101 | | | | 189 | | | | 345 | |
| Preopening and start-up costs | | | | | | | | | | | | | | | 2,038 | |
| Goodwill impairment | | | 1,500 | | | | | | | | 1,500 | | | | | |
Restructuring charge (1) | | | | | | | 2,500 | | | | | | | | 2,500 | |
| Other | | | 2,074 | | | | 3,560 | | | | 6,446 | | | | 8,696 | |
| Total | | $ | 10,455 | | | $ | 12,615 | | | $ | 26,676 | | | $ | 33,190 | |
| (1) | A restructuring charge was accrued during the 2008 period related to plans to reduce staffing in conjunction with consolidation of certain back office functions and mergers of bank charters. |
[The remainder of this page intentionally left blank]
MANAGEMENT'S DISCUSSION AND ANALYSIS OF FINANCIAL CONDITION
AND RESULTS OF OPERATIONS – Continued
Results of Operations – Continued
Operating results (dollars in thousands) were as follows:
| | | Nine Months Ended September 30 | |
| | | Total Revenues | | | Net Income (Loss)(1) | | | Return on Average Equity(2) | | | Return on Average Assets(2) | |
| | | 2009 | | | 2008 | | | 2009 | | | 2008 | | | 2009 | | | 2008 | | | 2009 | | | 2008 | |
| Arizona Region: | | | | | | | | | | | | | | | | | | | | | | | | |
| Arrowhead Community Bank | | $ | 3,443 | | | $ | 4,784 | | | $ | (8,415 | ) | | $ | (720 | ) | | | | | | | | | | | | |
| Asian Bank of Arizona | | | 1,662 | | | | 1,467 | | | | (3,618 | ) | | | (685 | ) | | | | | | | | | | | | |
| Bank of Tucson | | | 9,513 | | | | 10,006 | | | | 1,467 | | | | 2,897 | | | | 11.04 | % | | | 21.43 | % | | | 0.97 | % | | | 2.13 | % |
| Camelback Community Bank | | | 4,003 | | | | 4,536 | | | | (768 | ) | | | 764 | | | | | | | | 11.00 | % | | | | | | | 1.12 | % |
| Central Arizona Bank | | | 3,050 | | | | 3,628 | | | | (4,977 | ) | | | (587 | ) | | | | | | | | | | | | | | | | |
| Colonia Bank | | | 435 | | | | 80 | | | | (1,618 | ) | | | (551 | ) | | | | | | | | | | | | | | | | |
| Mesa Bank | | | 6,261 | | | | 11,058 | | | | (9,131 | ) | | | (8,211 | ) | | | | | | | | | | | | | | | | |
| Southern Arizona Community Bank | | | 3,903 | | | | 4,482 | | | | 237 | | | | 411 | | | | 3.51 | % | | | 6.05 | % | | | 0.35 | % | | | 0.62 | % |
| Sunrise Bank of Albuquerque | | | 3,155 | | | | 3,955 | | | | (1,173 | ) | | | 199 | | | | | | | | 3.62 | % | | | | | | | 0.35 | % |
| Sunrise Bank of Arizona | | | 5,088 | | | | 6,201 | | | | (5,479 | ) | | | (322 | ) | | | | | | | | | | | | | | | | |
Yuma Community Bank(5) | | | 3,225 | | | | 4,043 | | | | 372 | | | | 468 | | | | 7.69 | % | | | 7.96 | % | | | 0.78 | % | | | 0.82 | % |
| Arizona Region Total | | | 43,738 | | | | 54,240 | | | | (33,103 | ) | | | (6,337 | ) | | | | | | | | | | | | | | | | |
| | | | | | | | | | | | | | | | | | | | | | | | | | | | | | | | | |
| California Region: | | | | | | | | | | | | | | | | | | | | | | | | | | | | | | | | |
| Bank of Escondido | | | 3,559 | | | | 3,789 | | | | (1,443 | ) | | | 241 | | | | | | | | 2.22 | % | | | | | | | 0.34 | % |
| Bank of Feather River | | | 1,560 | | | | 955 | | | | (716 | ) | | | (463 | ) | | | | | | | | | | | | | | | | |
| Bank of San Francisco | | | 3,415 | | | | 2,807 | | | | (973 | ) | | | 39 | | | | | | | | 0.61 | % | | | | | | | 0.08 | % |
Bank of Santa Barbara(4) | | | 2,571 | | | | 3,083 | | | | (1,300 | ) | | | (198 | ) | | | | | | | | | | | | | | | | |
| Napa Community Bank | | | 6,801 | | | | 6,551 | | | | 1,224 | | | | 914 | | | | 10.26 | % | | | 8.47 | % | | | 1.11 | % | | | 0.94 | % |
| Point Loma Community Bank | | | 2,521 | | | | 2,828 | | | | (1,396 | ) | | | 244 | | | | | | | | 4.46 | % | | | | | | | 0.57 | % |
| Sunrise Bank of San Diego | | | 3,565 | | | | 4,174 | | | | (1,586 | ) | | | 166 | | | | | | | | 2.07 | % | | | | | | | 0.25 | % |
| Sunrise Community Bank | | | 1,542 | | | | 1,182 | | | | (2,530 | ) | | | (522 | ) | | | | | | | | | | | | | | | | |
| California Region Total | | | 25,534 | | | | 25,369 | | | | (8,720 | ) | | | 421 | | | | | | | | | | | | | | | | | |
| | | | | | | | | | | | | | | | | | | | | | | | | | | | | | | | | |
| Colorado Region: | | | | | | | | | | | | | | | | | | | | | | | | | | | | | | | | |
| Fort Collins Commerce Bank | | | 3,860 | | | | 3,424 | | | | 262 | | | | 536 | | | | 3.63 | % | | | 7.81 | % | | | 0.42 | % | | | 1.06 | % |
| Larimer Bank of Commerce | | | 4,030 | | | | 3,279 | | | | 326 | | | | 299 | | | | 5.40 | % | | | 5.27 | % | | | 0.49 | % | | | 0.60 | % |
| Loveland Bank of Commerce | | | 1,531 | | | | 1,035 | | | | (900 | ) | | | (371 | ) | | | | | | | | | | | | | | | | |
| Mountain View Bank of Commerce | | | 1,711 | | | | 746 | | | | (608 | ) | | | (711 | ) | | | | | | | | | | | | | | | | |
| Colorado Region Total | | | 11,132 | | | | 8,484 | | | | (920 | ) | | | (247 | ) | | | | | | | | | | | | | | | | |
| | | | | | | | | | | | | | | | | | | | | | | | | | | | | | | | | |
| Great Lakes Region: | | | | | | | | | | | | | | | | | | | | | | | | | | | | | | | | |
| Bank of Auburn Hills | | | 1,683 | | | | 2,123 | | | | (3,344 | ) | | | (599 | ) | | | | | | | | | | | | | | | | |
| Bank of Maumee | | | 1,973 | | | | 2,119 | | | | (2,336 | ) | | | (604 | ) | | | | | | | | | | | | | | | | |
| Bank of Michigan | | | 3,556 | | | | 3,707 | | | | (505 | ) | | | 426 | | | | | | | | 8.41 | % | | | | | | | 0.81 | % |
| Capitol National Bank | | | 9,281 | | | | 11,214 | | | | (4,005 | ) | | | 233 | | | | | | | | 1.61 | % | | | | | | | 0.14 | % |
| Elkhart Community Bank | | | 3,550 | | | | 4,354 | | | | (2,998 | ) | | | 210 | | | | | | | | 3.18 | % | | | | | | | 0.30 | % |
| Evansville Commerce Bank | | | 2,640 | | | | 3,020 | | | | (1,509 | ) | | | (201 | ) | | | | | | | | | | | | | | | | |
| Goshen Community Bank | | | 3,304 | | | | 3,946 | | | | (676 | ) | | | 252 | | | | | | | | 4.23 | % | | | | | | | 0.42 | % |
Michigan Commerce Bank(3) | | | 49,397 | | | | 62,027 | | | | (50,985 | ) | | | (6,428 | ) | | | | | | | | | | | | | | | | |
| Ohio Commerce Bank | | | 2,292 | | | | 1,991 | | | | (560 | ) | | | (117 | ) | | | | | | | | | | | | | | | | |
| Paragon Bank & Trust | | | 4,181 | | | | 5,370 | | | | (5,520 | ) | | | (725 | ) | | | | | | | | | | | | | | | | |
| Great Lakes Region Total | | | 81,857 | | | | 99,871 | | | | (72,438 | ) | | | (7,553 | ) | | | | | | | | | | | | | | | | |
| | | | | | | | | | | | | | | | | | | | | | | | | | | | | | | | | |
| Midwest Region | | | | | | | | | | | | | | | | | | | | | | | | | | | | | | | | |
| Adams Dairy Bank | | | 1,704 | | | | 1,121 | | | | (587 | ) | | | (569 | ) | | | | | | | | | | | | | | | | |
| Bank of Belleville | | | 2,839 | | | | 2,706 | | | | (808 | ) | | | 23 | | | | | | | | 0.45 | % | | | | | | | 0.05 | % |
| Community Bank of Lincoln | | | 2,694 | | | | 1,402 | | | | (1,243 | ) | | | (511 | ) | | | | | | | | | | | | | | | | |
Summit Bank of Kansas City(4) | | | 2,780 | | | | 2,333 | | | | (978 | ) | | | (10 | ) | | | | | | | | | | | | | | | | |
| Midwest Region Total | | | 10,017 | | | | 7,562 | | | | (3,616 | ) | | | (1,067 | ) | | | | | | | | | | | | | | | | |
| | | | | | | | | | | | | | | | | | | | | | | | | | | | | | | | | |
| Nevada Region: | | | | | | | | | | | | | | | | | | | | | | | | | | | | | | | | |
1st Commerce Bank | | | 1,814 | | | | 1,776 | | | | (2,046 | ) | | | (660 | ) | | | | | | | | | | | | | | | | |
| Bank of Las Vegas | | | 3,557 | | | | 3,710 | | | | (1,328 | ) | | | 112 | | | | | | | | 1.71 | % | | | | | | | 0.21 | % |
| Black Mountain Community Bank | | | 7,404 | | | | 8,093 | | | | (859 | ) | | | 1,390 | | | | | | | | 12.49 | % | | | | | | | 1.22 | % |
| Desert Community Bank | | | 4,449 | | | | 5,622 | | | | (1,510 | ) | | | 485 | | | | | | | | 6.37 | % | | | | | | | 0.63 | % |
| Red Rock Community Bank | | | 4,600 | | | | 5,891 | | | | (3,224 | ) | | | 672 | | | | | | | | 6.56 | % | | | | | | | 0.75 | % |
| Nevada Region Total | | | 21,824 | | | | 25,092 | | | | (8,967 | ) | | | 1,999 | | | | | | | | | | | | | | | | | |
MANAGEMENT'S DISCUSSION AND ANALYSIS OF FINANCIAL CONDITION
AND RESULTS OF OPERATIONS – Continued
Results of Operations – Continued
Operating results – continued:
| | | Nine Months Ended September 30 | |
| | | Total Revenues | | | Net Income (Loss)(1) | | | Return on Average Equity(2) | | | Return on Average Assets(2) | |
| | | 2009 | | | 2008 | | | 2009 | | | 2008 | | | 2009 | | | 2008 | | | 2009 | | | 2008 | |
| Northeast Region: | | | | | | | | | | | | | | | | | | | | | | | | |
| USNY Bank | | $ | 2,316 | | | $ | 1,249 | | | $ | (1,340 | ) | | $ | (583 | ) | | | | | | | | | | | | |
| | | | | | | | | | | | | | | | | | | | | | | | | | | | | |
| Northwest Region: | | | | | | | | | | | | | | | | | | | | | | | | | | | | |
| Bank of Bellevue | | | 1,981 | | | | 2,181 | | | | (1,537 | ) | | | (179 | ) | | | | | | | | | | | | |
| Bank of Everett | | | 1,789 | | | | 1,541 | | | | (2,048 | ) | | | (779 | ) | | | | | | | | | | | | |
| Bank of Tacoma | | | 1,805 | | | | 1,485 | | | | (2,530 | ) | | | (629 | ) | | | | | | | | | | | | |
| High Desert Bank | | | 1,820 | | | | 955 | | | | (2,726 | ) | | | (581 | ) | | | | | | | | | | | | |
| Issaquah Community Bank | | | 1,554 | | | | 857 | | | | (1,284 | ) | | | (494 | ) | | | | | | | | | | | | |
| Northwest Region Total | | | 8,949 | | | | 7,019 | | | | (10,125 | ) | | | (2,662 | ) | | | | | | | | | | | | |
| | | | | | | | | | | | | | | | | | | | | | | | | | | | | |
| Southeast Region: | | | | | | | | | | | | | | | | | | | | | | | | | | | | |
| Bank of Valdosta | | | 2,165 | | | | 2,413 | | | | (1,261 | ) | | | (55 | ) | | | | | | | | | | | | |
Community Bank of Rowan(4) | | | 4,962 | | | | 5,553 | | | | 459 | | | | 698 | | | | 5.73 | % | | | 9.38 | % | | | 0.47 | % | | | 0.76 | % |
| First Carolina State Bank | | | 4,183 | | | | 4,785 | | | | (976 | ) | | | 31 | | | | | | | | 0.37 | % | | | | | | | 0.04 | % |
| Peoples State Bank | | | 1,017 | | | | 1,326 | | | | (1,739 | ) | | | 5 | | | | | | | | 0.13 | % | | | | | | | 0.03 | % |
| Pisgah Community Bank | | | 1,739 | | | | 357 | | | | (1,187 | ) | | | (700 | ) | | | | | | | | | | | | | | | | |
| Sunrise Bank of Atlanta | | | 2,867 | | | | 3,462 | | | | (2,126 | ) | | | (310 | ) | | | | | | | | | | | | | | | | |
| Southeast Region Total | | | 16,933 | | | | 17,896 | | | | (6,830 | ) | | | (331 | ) | | | | | | | | | | | | | | | | |
| | | | | | | | | | | | | | | | | | | | | | | | | | | | | | | | | |
| Texas Region: | | | | | | | | | | | | | | | | | | | | | | | | | | | | | | | | |
| Bank of Fort Bend | | | 1,122 | | | | 629 | | | | (1,278 | ) | | | (669 | ) | | | | | | | | | | | | | | | | |
| Bank of Las Colinas | | | 1,435 | | | | 887 | | | | (1,162 | ) | | | (470 | ) | | | | | | | | | | | | | | | | |
| Texas Region Total | | | 2,557 | | | | 1,516 | | | | (2,440 | ) | | | (1,139 | ) | | | | | | | | | | | | | | | | |
| | | | | | | | | | | | | | | | | | | | | | | | | | | | | | | | | |
| Parent company and other, net | | | (211 | ) | | | 2,831 | | | | 30,381 | | | | (12,182 | ) | | | | | | | | | | | | | | | | |
| | | | | | | | | | | | | | | | | | | | | | | | | | | | | | | | | |
| Consolidated totals | | $ | 224,646 | | | $ | 251,129 | | | $ | (118,118 | ) | | $ | (29,681 | ) | | | -- | | | | -- | | | | -- | | | | -- | |
| (1) | Excludes net losses attributable to noncontrolling interests. |
| (2) | Annualized for periods presented. |
| (3) | Michigan Commerce Bank resulted from the merger of Ann Arbor Commerce Bank, Brighton Commerce Bank, Detroit Commerce Bank, Grand Haven Bank, Kent Commerce Bank, Macomb Community Bank, Muskegon Commerce Bank, Oakland Commerce Bank and Portage Commerce Bank effective March 31, 2009. For comparative purposes, the merger of those banks is presented as if such merger occurred December 31, 2008. |
| (4) | Bank of Santa Barbara, Community Bank of Rowan and Summit Bank of Kansas City are majority-owned subsidiaries of Capitol Development Bancorp Limited (CDBL) III of which Capitol ceased to have majority voting control effective September 30, 2009. Thus, effective September 30, 2009, those banks and CDBL III ceased to be consolidated subsidiaries of Capitol. |
| (5) | Capitol sold its ownership in Yuma Community Bank effective September 21, 2009. The Bank's operations are included in Capitol's consolidated totals through that date. |
Liquidity and Capital Resources
The principal funding source for asset growth and loan origination activities is deposits. Total deposits increased $10.7 million for the nine months ended September 30, 2009, compared to a $438.8 million increase in the corresponding period of 2008. Growth occurred in most interest-bearing deposit categories, with the majority coming from time deposit accounts. Brokered deposits approximated $1.0 billion as of September 30, 2009, or about 21.6% of total deposits, a decrease of $95.6 million during the nine-month 2009 period, as the banks have sought to add these funds selectively based on maturity and interest-rate opportunities to aid in matching the repricing of funding sources and assets. Brokered deposits at September 30, 2009 include about $288.6 million of relationship-based structured time accounts. Banks that are classified as less than well-capitalized are required to obtain approval from the FDIC to renew or issue new brokered deposits.
Noninterest-bearing deposits approximated 14.5% of total deposits at September 30, 2009, a decrease from 15.6% at December 31, 2008, and a decrease of $48.9 million in the 2009 interim period compared to a decrease of $23.7 million during the 2008 period. Levels of noninterest-bearing deposits can, however, fluctuate based on customers' transaction activity.
MANAGEMENT'S DISCUSSION AND ANALYSIS OF FINANCIAL CONDITION
AND RESULTS OF OPERATIONS – Continued
Liquidity and Capital Resources – Continued
During the 2009 period, interest-bearing accounts increased about $59.6 million which served as the primary funding source for growth in liquid assets. Because of the growth in interest-bearing deposits, coupled with higher relative rates on those balances (particularly with time deposit accounts) and deployment of funds into liquid assets, net interest margins have generally decreased compared to 2008.
Interim 2009 deposit growth was deployed primarily into cash and cash equivalents to enhance liquidity. Cash and cash equivalents amounted to $889.7 million or 16.7% of total assets at September 30, 2009, compared to $624.4 million or 11% of total assets at December 31, 2008. As liquidity levels vary continuously based on customer activities, amounts of cash and cash equivalents can vary widely at any given point in time. Management believes the banks' liquidity position at September 30, 2009 is adequate to fund loan demand and meet depositor needs. In the current low interest rate environment, deployment of deposit growth into cash and cash equivalents adversely impacts net interest margin.
In addition to cash and cash equivalents, an additional source of long-term liquidity is the banks' marketable investment securities. Liquidity needs have not historically necessitated the sale of investments in order to meet funding requirements and the banks have not engaged in active trading of their investments. At September 30, 2009, Capitol's banks had approximately $18 million of investment securities classified as available for sale which may be utilized to meet various liquidity needs as they arise.
Several of Capitol's banks have secured lines of credit with regional Federal Home Loan Banks. Borrowings thereunder approximated $285 million and additional borrowing capacity approximated $234 million at September 30, 2009. These facilities are used from time to time as a lower-cost funding source versus various rates and maturities of time deposits available within banks' individual communities. Total notes payable and short-term borrowings were $300.3 million at September 30, 2009, a reduction of $146.6 million from the beginning of the year as deposit growth enabled repayment of select borrowings in addition to enhanced liquidity discussed previously.
Capitol Bancorp Limited stockholders' equity, as a percentage of total assets, approximated 4.47% at September 30, 2009 and 6.26% at December 31, 2008. As of September 30, 2009, Capitol's total capital funds (i.e., the sum of Capitol Bancorp Limited stockholders' equity, noncontrolling interests in consolidated subsidiaries and subordinated debentures) approximated $484 million or 9.09% of total assets.
In April 2009, the Corporation determined that it would commence the deferral of interest payments on its various trust-preferred securities, as is permitted under the terms of the securities, to conserve cash and capital resources. The payment of interest may be deferred for periods up to five years. During such deferral periods, Capitol is prohibited from paying dividends on its common stock (subject to certain exceptions) and will continue to accrue interest payable on such securities. Holders of the trust-preferred securities will continue to recognize current taxable income relating to the deferred interest payments.
Capitol and its banks are subject to complex regulatory capital requirements, which require maintaining certain minimum capital ratios. These ratio measurements, in addition to certain other requirements, are used by regulatory agencies to determine the level of regulatory intervention and enforcement applied to financial institutions.
[The remainder of this page intentionally left blank]
MANAGEMENT'S DISCUSSION AND ANALYSIS OF FINANCIAL CONDITION
AND RESULTS OF OPERATIONS – Continued
Liquidity and Capital Resources – Continued
The following comparative analysis summarizes each bank's regulatory capital position as of the dates indicated:
| | | | | | Tier 1 Risk-Based | | | Total Risk-Based | | |
| | | Tier 1 Leverage Ratio(1)(5) | | | Capital Ratio(1)(5) | | | Capital Ratio(2)(5) | | Regulatory Classification(3) |
| | | Sept 30, 2009 | | | Dec 31, 2008 | | | Sept 30, 2009 | | | Dec 31, 2008 | | | Sept 30, 2009 | | | Dec 31, 2008 | | Sept 30, 2009 | Dec 31, 2008 |
| Arizona Region: | | | | | | | | | | | | | | | | | | | | |
| Arrowhead Community Bank | | | 4.55 | % | | | 7.77 | % | | | 6.69 | % | | | 8.74 | % | | | 8.03 | % | | | 10.02 | % | adequately-capitalized | well-capitalized |
Asian Bank of Arizona(4) | | | 6.38 | % | | | 13.27 | % | | | 8.03 | % | | | 15.06 | % | | | 9.30 | % | | | 16.32 | % | adequately-capitalized | well-capitalized |
| Bank of Tucson | | | 8.90 | % | | | 9.53 | % | | | 11.41 | % | | | 9.41 | % | | | 12.59 | % | | | 10.26 | % | well-capitalized | well-capitalized |
| Camelback Community Bank | | | 8.62 | % | | | 9.02 | % | | | 9.76 | % | | | 9.64 | % | | | 11.02 | % | | | 10.53 | % | well-capitalized | well-capitalized |
| Central Arizona Bank | | | 5.49 | % | | | 13.38 | % | | | 6.86 | % | | | 13.02 | % | | | 8.15 | % | | | 14.27 | % | adequately-capitalized | well-capitalized |
Colonia Bank(4) | | | 40.91 | % | | | 65.50 | % | | | 59.24 | % | | | 79.66 | % | | | 60.51 | % | | | 80.91 | % | well-capitalized | well-capitalized |
| Mesa Bank | | | 4.93 | % | | | 6.74 | % | | | 6.99 | % | | | 8.85 | % | | | 8.24 | % | | | 10.10 | % | adequately-capitalized(8) | well-capitalized |
Southern Arizona Community Bank | | | 9.53 | % | | | 9.14 | % | | | 10.66 | % | | | 10.15 | % | | | 11.91 | % | | | 11.22 | % | well-capitalized | well-capitalized |
| Sunrise Bank of Albuquerque | | | 7.11 | % | | | 8.50 | % | | | 8.87 | % | | | 9.08 | % | | | 10.14 | % | | | 10.33 | % | adequately-capitalized(8) | well-capitalized |
| Sunrise Bank of Arizona | | | 5.73 | % | | | 8.73 | % | | | 7.61 | % | | | 9.38 | % | | | 8.87 | % | | | 10.41 | % | adequately-capitalized | well-capitalized |
Yuma Community Bank(6) | | | | | | | 8.94 | % | | | | | | | 10.26 | % | | | | | | | 11.40 | % | | well-capitalized |
| | | | | | | | | | | | | | | | | | | | | | | | | | | |
| California Region: | | | | | | | | | | | | | | | | | | | | | | | | | | |
| Bank of Escondido | | | 9.24 | % | | | 11.29 | % | | | 13.42 | % | | | 15.50 | % | | | 14.70 | % | | | 16.66 | % | well-capitalized | well-capitalized |
Bank of Feather River(4) | | | 18.35 | % | | | 25.72 | % | | | 27.07 | % | | | 27.12 | % | | | 28.32 | % | | | 28.37 | % | well-capitalized | well-capitalized |
| Bank of San Francisco | | | 8.37 | % | | | 11.04 | % | | | 9.76 | % | | | 11.53 | % | | | 11.02 | % | | | 12.78 | % | well-capitalized | well-capitalized |
Bank of Santa Barbara(9) | | | 6.93 | % | | | 8.00 | % | | | 7.80 | % | | | 8.77 | % | | | 9.07 | % | | | 10.03 | % | adequately-capitalized | well-capitalized |
| Napa Community Bank | | | 10.77 | % | | | 11.06 | % | | | 11.03 | % | | | 10.79 | % | | | 12.28 | % | | | 12.04 | % | well-capitalized | well-capitalized |
| Point Loma Community Bank | | | 8.43 | % | | | 11.11 | % | | | 11.20 | % | | | 12.78 | % | | | 12.46 | % | | | 14.04 | % | well-capitalized | well-capitalized |
| Sunrise Bank of San Diego | | | 8.36 | % | | | 10.27 | % | | | 10.95 | % | | | 11.12 | % | | | 12.24 | % | | | 12.38 | % | well-capitalized | well-capitalized |
Sunrise Community Bank(4) | | | 8.96 | % | | | 14.39 | % | | | 12.08 | % | | | 18.07 | % | | | 13.35 | % | | | 19.32 | % | well-capitalized | well-capitalized |
| | | | | | | | | | | | | | | | | | | | | | | | | | | |
| Colorado Region: | | | | | | | | | | | | | | | | | | | | | | | | | | |
| Fort Collins Commerce Bank | | | 11.23 | % | | | 12.48 | % | | | 12.70 | % | | | 12.98 | % | | | 13.96 | % | | | 14.23 | % | well-capitalized | well-capitalized |
Larimer Bank of Commerce(4) | | | 9.11 | % | | | 8.95 | % | | | 11.46 | % | | | 9.83 | % | | | 12.73 | % | | | 11.08 | % | well-capitalized | well-capitalized |
Loveland Bank of Commerce(4) | | | 15.93 | % | | | 21.48 | % | | | 18.81 | % | | | 24.66 | % | | | 20.07 | % | | | 25.92 | % | well-capitalized | well-capitalized |
Mountain View Bank of Commerce(4) | | | 14.69 | % | | | 20.81 | % | | | 17.30 | % | | | 20.53 | % | | | 18.55 | % | | | 21.78 | % | well-capitalized | well-capitalized |
| | | | | | | | | | | | | | | | | | | | | | | | | | | |
| Great Lakes Region: | | | | | | | | | | | | | | | | | | | | | | | | | | |
| Bank of Auburn Hills | | | 6.37 | % | | | 11.05 | % | | | 8.31 | % | | | 12.64 | % | | | 9.61 | % | | | 13.90 | % | adequately-capitalized | well-capitalized |
Bank of Maumee(4) | | | 8.99 | % | | | 10.47 | % | | | 11.94 | % | | | 11.54 | % | | | 13.21 | % | | | 12.79 | % | well-capitalized | well-capitalized |
| Bank of Michigan | | | 6.66 | % | | | 9.15 | % | | | 9.96 | % | | | 9.76 | % | | | 11.22 | % | | | 11.01 | % | well-capitalized | well-capitalized |
| Capitol National Bank | | | 7.29 | % | | | 7.95 | % | | | 9.48 | % | | | 8.96 | % | | | 10.76 | % | | | 10.24 | % | adequately-capitalized(8) | well-capitalized |
| Elkhart Community Bank | | | 5.02 | % | | | 7.71 | % | | | 6.89 | % | | | 8.82 | % | | | 8.17 | % | | | 10.08 | % | adequately-capitalized(8) | well-capitalized |
Evansville Commerce Bank(4) | | | 8.01 | % | | | 8.13 | % | | | 10.68 | % | | | 9.81 | % | | | 11.94 | % | | | 11.07 | % | well-capitalized | well-capitalized |
| Goshen Community Bank | | | 7.28 | % | | | 7.96 | % | | | 9.64 | % | | | 8.96 | % | | | 10.92 | % | | | 10.21 | % | adequately-capitalized(8) | well-capitalized |
| Michigan Commerce Bank | | | 4.64 | % | | | 10.75 | % | | | 5.86 | % | | | 10.70 | % | | | 7.15 | % | | | 12.19 | % | under-capitalized(7)(8) | well-capitalized |
Ohio Commerce Bank(4) | | | 14.23 | % | | | 15.29 | % | | | 16.82 | % | | | 17.14 | % | | | 18.07 | % | | | 18.39 | % | well-capitalized | well-capitalized |
| Paragon Bank & Trust | | | 4.76 | % | | | 8.09 | % | | | 6.92 | % | | | 8.99 | % | | | 8.22 | % | | | 10.27 | % | adequately-capitalized | well-capitalized |
| | | | | | | | | | | | | | | | | | | | | | | | | | | |
| Midwest Region: | | | | | | | | | | | | | | | | | | | | | | | | | | |
Adams Dairy Bank(4) | | | 16.37 | % | | | 22.19 | % | | | 20.76 | % | | | 25.01 | % | | | 21.71 | % | | | 26.27 | % | well-capitalized | well-capitalized |
| Bank of Belleville | | | 8.30 | % | | | 8.68 | % | | | 10.28 | % | | | 9.51 | % | | | 11.53 | % | | | 10.76 | % | well-capitalized | well-capitalized |
Community Bank of Lincoln(4) | | | 10.12 | % | | | 13.68 | % | | | 12.60 | % | | | 15.14 | % | | | 13.86 | % | | | 16.39 | % | well-capitalized | well-capitalized |
Summit Bank of Kansas City(9) | | | 9.25 | % | | | 11.64 | % | | | 12.51 | % | | | 13.57 | % | | | 13.76 | % | | | 14.82 | % | well-capitalized | well-capitalized |
| | | | | | | | | | | | | | | | | | | | | | | | | | | |
| Nevada Region: | | | | | | | | | | | | | | | | | | | | | | | | | | |
1st Commerce Bank(4) | | | 8.41 | % | | | 10.03 | % | | | 11.40 | % | | | 16.02 | % | | | 12.67 | % | | | 17.28 | % | well-capitalized | well-capitalized |
| Bank of Las Vegas | | | 6.90 | % | | | 8.78 | % | | | 7.75 | % | | | 9.47 | % | | | 9.03 | % | | | 10.72 | % | adequately-capitalized | well-capitalized |
Black Mountain Community Bank | | | 7.55 | % | | | 8.45 | % | | | 8.78 | % | | | 9.10 | % | | | 10.04 | % | | | 10.31 | % | well-capitalized | well-capitalized |
| Desert Community Bank | | | 6.93 | % | | | 8.21 | % | | | 8.12 | % | | | 9.58 | % | | | 9.39 | % | | | 10.65 | % | adequately-capitalized | well-capitalized |
| Red Rock Community Bank | | | 5.76 | % | | | 8.52 | % | | | 7.92 | % | | | 9.39 | % | | | 9.18 | % | | | 10.45 | % | adequately-capitalized | well-capitalized |
| | | | | | | | | | | | | | | | | | | | | | | | | | | |
| Northeast Region: | | | | | | | | | | | | | | | | | | | | | | | | | | |
USNY Bank(4) | | | 8.12 | % | | | 11.72 | % | | | 9.76 | % | | | 12.45 | % | | | 11.01 | % | | | 13.70 | % | well-capitalized | well-capitalized |
MANAGEMENT'S DISCUSSION AND ANALYSIS OF FINANCIAL CONDITION
AND RESULTS OF OPERATIONS – Continued
Liquidity and Capital Resources – Continued
Regulatory capital position – continued:
| | | | | | Tier 1 Risk-Based | | | Total Risk-Based | | | |
| | | Tier 1 Leverage Ratio(1)(5) | | | Capital Ratio(1)(5) | | | Capital Ratio(2)(5) | | Regulatory Classification(3) |
| | | Sept 30, 2009 | | | Dec 31, 2008 | | | Sept 30, 2009 | | | Dec 31, 2008 | | | Sept 30, 2009 | | | Dec 31, 2008 | | Sept 30, 2009 | Dec 31, 2008 |
| Northwest Region: | | | | | | | | | | | | | | | | | | | | |
| Bank of Bellevue | | | 8.79 | % | | | 10.93 | % | | | 13.15 | % | | | 11.99 | % | | | 14.42 | % | | | 13.25 | % | well-capitalized | well-capitalized |
Bank of Everett(4) | | | 9.14 | % | | | 11.98 | % | | | 11.34 | % | | | 14.30 | % | | | 12.61 | % | | | 15.56 | % | well-capitalized | well-capitalized |
Bank of Tacoma(4) | | | 8.06 | % | | | 13.54 | % | | | 11.10 | % | | | 12.86 | % | | | 12.37 | % | | | 14.12 | % | adequately-capitalized(8) | well-capitalized |
High Desert Bank(4) | | | 8.34 | % | | | 15.86 | % | | | 10.94 | % | | | 17.29 | % | | | 12.21 | % | | | 18.54 | % | well-capitalized | well-capitalized |
Issaquah Community Bank(4) | | | 15.77 | % | | | 23.27 | % | | | 21.69 | % | | | 26.08 | % | | | 22.96 | % | | | 27.33 | % | well-capitalized | well-capitalized |
| | | | | | | | | | | | | | | | | | | | | | | | | | | |
| Southeast Region: | | | | | | | | | | | | | | | | | | | | | | | | | | |
Bank of Valdosta(4) | | | 7.94 | % | | | 8.01 | % | | | 11.70 | % | | | 10.32 | % | | | 12.96 | % | | | 11.58 | % | well-capitalized | well-capitalized |
Community Bank of Rowan(4)(9) | | | 8.42 | % | | | 8.04 | % | | | 10.41 | % | | | 9.59 | % | | | 11.67 | % | | | 10.84 | % | well-capitalized | well-capitalized |
| First Carolina State Bank | | | 7.91 | % | | | 8.61 | % | | | 9.87 | % | | | 9.69 | % | | | 11.13 | % | | | 10.94 | % | well-capitalized | well-capitalized |
| Peoples State Bank | | | 9.11 | % | | | 8.15 | % | | | 13.53 | % | | | 10.40 | % | | | 14.79 | % | | | 11.65 | % | well-capitalized | well-capitalized |
Pisgah Community Bank(4) | | | 11.73 | % | | | 22.86 | % | | | 14.56 | % | | | 25.11 | % | | | 15.82 | % | | | 26.37 | % | well-capitalized | well-capitalized |
Sunrise Bank of Atlanta(4) | | | 7.21 | % | | | 8.19 | % | | | 9.05 | % | | | 9.78 | % | | | 10.32 | % | | | 11.04 | % | well-capitalized | well-capitalized |
| | | | | | | | | | | | | | | | | | | | | | | | | | | |
| Texas Region: | | | | | | | | | | | | | | | | | | | | | | | | | | |
Bank of Fort Bend(4) | | | 15.61 | % | | | 23.19 | % | | | 20.25 | % | | | 28.46 | % | | | 21.50 | % | | | 29.71 | % | well-capitalized | well-capitalized |
Bank of Las Colinas(4) | | | 12.08 | % | | | 19.54 | % | | | 16.26 | % | | | 22.08 | % | | | 17.53 | % | | | 23.33 | % | well-capitalized | well-capitalized |
| | | | | | | | | | | | | | | | | | | | | | | | | | | |
| Consolidated totals | | | 6.26 | % | | | 10.72 | % | | | 8.43 | % | | | 12.07 | % | | | 11.17 | % | | | 13.75 | % | well-capitalized | well-capitalized |
| (1) | The minimum required Tier 1 leverage ratio and Tier 1 risk-based capital ratio is 4% (8% for de novo institutions). |
| (2) | The minimum required total risk-based capital ratio is 8%. |
| (3) | In order to be classified as a 'well-capitalized' institution, the total risk-based capital ratio must be 10% or more. To be classified as an 'adequately-capitalized' institution, the total risk-based capital ratio must be between 8% and 10%. |
| (4) | De novo institution which is subject to higher minimum ratio requirements as noted in (1) above for the first three years of operations. |
| (5) | Ratios are per the regulatory call reports and Y9-C filed at original due date which is generally within 30 days after quarter-end. |
| (6) | Capitol sold its ownership in Yuma Community Bank effective September 21, 2009. |
| (7) | Effective November 9, 2009, Capitol transferred $8.3 million as additional capital to Michigan Commerce Bank, increasing its regulatory classification to adequately-capitalized. |
| (8) | Institution is subject to a regulatory agreement and, accordingly, cannot be classified better than adequately-capitalized. |
| (9) | Bank of Santa Barbara, Community Bank of Rowan and Summit Bank of Kansas City are majority-owned subsidiaries of Capitol Development Bancorp Limited (CDBL) III of which Capitol ceased to have majority voting control effective September 30, 2009. Thus, effective September 30, 2009, those banks and CDBL III ceased to be consolidated subsidiaries of Capitol. |
Effective May 31, 2009, Capitol completed a share-exchange transaction with the noncontrolling shareholders of Bank of Auburn Hills, previously a 51%-owned subsidiary. In conjunction with the share exchange, Capitol issued 227,000 previously unissued shares of Capitol's common stock and warrants for the purchase of 76,000 shares of Capitol's common stock. The exercise price of the warrants is $20.37 per share of Capitol's common stock, which expire May 31, 2012. As a result of the share exchange transaction, Bank of Auburn Hills became wholly-owned by Capitol. Capitol's results of operations would not have been materially different if it had occurred at the beginning of the periods presented.
In October 2008, Capitol applied to its primary federal regulator and the FDIC for up to $142 million of preferred stock to be purchased by the U.S. Treasury pursuant to the Capital Purchase Program (CPP) under the Troubled Asset Relief Program (TARP). Capitol withdrew its application to participate in this program.
In February 2009, the U.S. Treasury announced its new Capital Assistance Program (CAP) under which U.S. banking organizations may apply for a U.S. Treasury investment in mandatorily convertible preferred stock in an amount of up to 1% or 2% of risk-weighted assets. The purpose of the CAP is to provide eligible banking organizations with capital in the form of a preferred security which is convertible into common equity. Participating banking organizations would also issue warrants to the U.S. Treasury. Eligibility will be consistent with the criteria and deliberative process established under the TARP/CPP. Capitol has recently submitted a CAP application on behalf of Michigan Commerce Bancorp Limited (MCBL, described more fully on page 40) in the amount of $21.7 million. There can be no assurance the CAP application will be approved or, if approved, whether Capitol or MCBL would choose to participate.
MANAGEMENT'S DISCUSSION AND ANALYSIS OF FINANCIAL CONDITION
AND RESULTS OF OPERATIONS – Continued
Trends Affecting Operations
One of the most significant trends which can impact the financial condition and results of operations of financial institutions is changes in market rates of interest.
Changes in interest rates, either up or down, have an impact on net interest income (plus or minus), depending on the direction and timing of such changes. At any point in time, there is a difference between interest rate-sensitive assets and interest rate-sensitive liabilities. This means that when interest rates change, the timing and magnitude of the effect of such interest rate changes can alter the relationship between asset yields and the cost of funds.
The Board of Governors of the Federal Reserve, which influences interest rates, has maintained interbank borrowing rates at unusually low levels since 2008. The Board of Governors of the Federal Reserve has also expressed concerns about a variety of macro economic issues. Home mortgage rates have recently fluctuated and residential real estate markets have deteriorated in various regions, which adversely impacts fee income from the origination of residential mortgages. There has been widespread media coverage of subprime and other residential mortgage “meltdown” issues; Capitol believes its exposure to the residential real estate crisis to be generally minimal due to its practice of selling residential mortgage loan production to the secondary market. Many of Capitol's banks' commercial loans are variable-rate and, accordingly, rate decreases may result in lower interest income to Capitol in the near term; however, depositors will continue to expect reasonable rates of interest on their accounts, potentially compressing net interest margins further. The future outlook on interest rates and their impact on Capitol's interest income, interest expense and net interest income is uncertain.
General economic conditions also have a significant impact on both the results of operations and the financial condition of financial institutions. As mentioned previously, general economic conditions within the state of Michigan and the national economic recession are uncertain and are likely to continue to have an adverse effect on Capitol's banks and their customers. It is likely that, absent significant catalysts, Michigan's economic recovery in particular may take an extended period of time.
Media reports raising questions about the health of the domestic economy and the sustained national recession have continued in 2009. During the interim 2009 period, nonperforming assets have increased significantly; it is likely levels of nonperforming assets and related loan losses will increase further as economic conditions, locally and nationally, evolve.
Effective March 31, 2009, nine Michigan bank charters were merged into Michigan Commerce Bank. The resulting bank, with nine locations, was combined to gain efficiencies in loan portfolio and problem asset management and general operating efficiencies in daily processing. Similar multi-bank mergers have been proposed in Arizona, Nevada, Southern California and the Pacific Northwest, subject to regulatory approval. Additional mergers and combinations of bank charters in other markets are under consideration as management evaluates potential synergies and cost savings. In April 2009, Capitol announced the engagement of a financial advisor to assist management in pursuing divestiture opportunities.
[The remainder of this page intentionally left blank]
MANAGEMENT'S DISCUSSION AND ANALYSIS OF FINANCIAL CONDITION
AND RESULTS OF OPERATIONS – Continued
Proposed Spin-off of Michigan Commerce Bancorp Limited
On July 21, 2009, Capitol announced its intention to formally and legally separate the operations of Michigan Commerce Bancorp Limited (MCBL) as an independent publicly-traded company through a spin-off transaction. If completed, Capitol would continue to be a bank holding company with national banking operations and MCBL would become a separate publicly-traded bank holding company consisting of the substantial majority of Capitol's prior Michigan-based banks (see accompanying pro forma condensed consolidated financial statements).
In the proposed spin-off, Capitol's shareholders would receive shares of MCBL common stock according to a distribution ratio. The distribution ratio and related record date for the proposed distribution would be determined at a later date. The proposed spin-off is subject to a number of significant contingencies. As of the date of this report, Capitol has not received regulatory approval of the proposed spin-off. The proposed spin-off would enable the two separate publicly-traded companies to focus on maximizing opportunities for the distinct business markets of each, and will allow both Capitol and MCBL to each develop and implement a strategic plan that fits their specific market and operations. As of the date of this report, Capitol has not received regulatory approval of the proposed spin-off. The proposed spin-off is illustrated in the accompanying pro forma condensed consolidated financial statements on pages 42-44.
MCBL's consolidated total assets approximated $1.2 billion or about 23% of Capitol's total assets as of September 30, 2009. If the proposed spin-off had been completed on September 30, 2009, consolidated total assets of Capitol would have approximated $4.1 billion, while reflecting a 33.1% decline in nonperforming assets and a modest increase in the consolidated total capital ratio. If the proposed spin-off would have occurred at January 1, 2009, the consolidated net loss attributable to Capitol would have been reduced 48.5% to $60.8 million ($3.52 per share) for the nine months ended September 30, 2009.
Pending Sale of Four Banks
In July 2009, Capitol entered into definitive agreements to sell the following four affiliate institutions: 1st Commerce Bank, Bank of Belleville, Bank of Santa Barbara and Community Bank of Rowan. The projected financial impact of the divestiture of these institutions is set forth in the accompanying pro forma condensed consolidated financial statements on pages 42 and 44 (along with the proposed spin-off discussed in Note K). Total proceeds from the pending sales are expected to approximate $23 million, resulting in a pre-tax gain of $2.2 million ($1.4 million, or $0.08 per share, after federal income tax) and are expected to be consummated in the fourth quarter of 2009, subject to regulatory approval and other contingencies. The sale of Bank of Santa Barbara was completed November 6, 2009 with aggregate proceeds of $3.9 million and a pre-tax gain on sale approximating $1.1 million.
Proposed Share Exchange Offer
In July 2009, Capitol proposed a share exchange offer regarding the shares of Capitol Development Bancorp Limited (CDBL) III-VI not already owned by Capitol, whereby Class B common stock of the CDBLs could be exchanged for a combination of convertible preferred stock of Capitol and trust-preferred securities. The proposed exchange offer was terminated in October 2009.
Regulatory Agreements
On September 21, 2009, Capitol and its second-tier bank holding companies entered into a written agreement with the Federal Reserve Bank of Chicago (the Reserve Bank) under which Capitol has agreed to refrain from the following actions without the prior written consent of the Reserve Bank (i) declare or pay dividends; (ii) receive dividends or any other form of payment representing a reduction in capital from Michigan Commerce Bank or from any of its subsidiary institutions that is subject to any restriction by the institution's federal or state regulator that limits the payment of dividends or other intercorporate payments; (iii) make any distributions of interest, principal, or other sums of subordinated debentures or trust preferred securities; (v) incur, increase or guarantee any debt; or (vi) purchase or redeem any shares of its own stock or any shares of the stock of Capitol, the second-tier bank holding companies, the nonbank subsidiaries or any of the subsidiary banks that are held by shareholders.
MANAGEMENT'S DISCUSSION AND ANALYSIS OF FINANCIAL CONDITION
AND RESULTS OF OPERATIONS – Continued
Regulatory Agreements – Continued
Capitol has also agreed to (i) submit to the Reserve Bank, within 60 days of the agreement, a written plan to maintain sufficient capital at Capitol on a consolidated basis and at Michigan Commerce Bank as a separate legal entity on a stand-alone basis; (ii) notify the Reserve Bank no more than 30 days after the end of any quarter in which Capitol's consolidated or Michigan Commerce Bank's capital ratios fall below the approved capital plan's minimum ratios as well as if any subsidiary institution's ratios fall below the minimum ratios required by the institution's federal or state regulator; (iii) review and revise within 60 days of this agreement its ALLL methodology for loans held by Capitol and submit to the Reserve Bank a written program for maintenance of an adequate ALLL for loans held by Capitol; (iv) take all necessary actions to ensure each of its subsidiary institutions comply with Federal Reserve regulations; (v) refrain from increasing any fees or charging new fees to any subsidiary institution without the prior written consent of the Reserve Bank; (vi) submit to the Reserve Bank, within 60 days of the agreement, a written plan to enhance the consolidated organization's risk management practices, a strategic plan to improve the consolidated organization's earnings and overall condition for the remainder of 2009 and a cash flow projection; (vii) comply with laws and regulations regarding senior executive officer positions and severance payments; and (viii) provide quarterly reports to the Reserve Bank regarding these undertakings.
Certain of Capitol's bank subsidiaries have entered into formal agreements with their applicable regulatory agencies. Those agreements provide for certain restrictions and other guidelines and/or limitations to be followed by the banks. The banks generally subject to such regulatory agreements are noted as such in the regulatory capital detail appearing on page 37.
[The remainder of this page intentionally left blank]