UNITED STATES
SECURITIES AND EXCHANGE COMMISSION
WASHINGTON, D.C. 20549
FORM 10-Q
| T | QUARTERLY REPORT PURSUANT TO SECTION 13 OR 15(d) OF THE |
| | SECURITIES EXCHANGE ACT OF 1934 |
| | For the quarterly period ended March 31, 2012 |
| | OR |
| £ | TRANSITION REPORT PURSUANT TO SECTION 13 OR 15(d) OF THE |
| | SECURITIES EXCHANGE ACT OF 1934 |
| | |
| | For the transition period from ________________ to ________________ |
Commission file number: 001-31708
CAPITOL BANCORP LTD.
(Exact name of registrant as specified in its charter)
| Michigan | | 38-2761672 |
| (State or other jurisdiction of | | (IRS Employer Identification No.) |
| incorporation or organization) | | |
| Capitol Bancorp Center | | |
| Fourth Floor | | |
| 200 N. Washington Square | | |
| Lansing, Michigan | | 48933 |
| (Address of principal executive offices) | | (Zip Code) |
517-487-6555
(Registrant's telephone number, including area code)
Not applicable
(Former name, former address and former fiscal year, if changed since last report)
Indicate by check mark whether the registrant (1) has filed all reports required to be filed by Section 13 or 15(d) of the Securities Exchange Act of 1934 during the preceding 12 months (or for such shorter period that the registrant was required to file such reports), and (2) has been subject to such filing requirements for the past 90 days.
Indicate by check mark whether the registrant has submitted electronically and posted on its corporate web site, if any, every Interactive Data File required to be submitted and posted pursuant to Rule 405 of Regulation S-T (§232.405 of this chapter) during the preceding 12 months (or for such shorter period that the registrant was required to submit and post such files).
Indicate by check mark whether the registrant is a large accelerated filer, an accelerated filer, a non-accelerated filer, or a smaller reporting company. See the definitions of "large accelerated filer," "accelerated filer" and "smaller reporting company" in Rule 12b-2 of the Exchange Act.
Large accelerated filer o | | | Accelerated filer o |
Non-accelerated filer o (Do not check if a smaller reporting company) | | Smaller reporting company x |
Indicate by check mark whether the registrant is a shell company (as defined in Rule 12b-2 of the Exchange Act).
Indicate the number of shares outstanding of each of the issuer's classes of common stock, as of the latest practicable date.
| Class | | Outstanding at April 30, 2012 |
| Common Stock, No par value | | 41,038,908 shares |
INDEX
PART I. FINANCIAL INFORMATION
Forward-Looking Statements
Some statements contained in this document, including consolidated financial statements of Capitol Bancorp Limited ("Capitol" or the "Corporation"), Management's Discussion and Analysis of Financial Condition and Results of Operations and in documents incorporated into this document by reference that are not historical facts, including, without limitation, statements of future expectations, projections of results of operations and financial condition, statements of future economic performance and other forward-looking statements within the meaning of the Private Securities Litigation Reform Act of 1995, are subject to known and unknown risks, uncertainties and other factors which may cause actual future results, performance or achievements of Capitol and/or its subsidiaries and other operating units to differ materially from those contemplated in such forward-looking statements. The words "intend," "expect," "project," "estimate," "predict," "anticipate," "should," "could," "believe," "may," "might," and similar expressions also are intended to identify forward-looking statements. Important factors which may cause actual results to differ from those contemplated in such forward-looking statements include, but are not limited to:
· The risks associated with implementing Capitol's business strategy, including its ability to preserve and access sufficient capital to execute its strategy;
· Capitol's ability to continue as a going concern;
· The availability and cost of capital and liquidity on favorable terms, if at all, which may depend in part on Capitol's asset quality, prospects and outlook;
· The risk that Capitol may not be able to complete its various proposed divestitures, mergers and consolidations of certain of its subsidiary banks or, if completed, realize the anticipated benefits of the proposed mergers and/or consolidations;
· The risk of additional future losses if the proceeds Capitol receives upon the liquidation of assets are less than the carrying value of such assets;
· Restrictions or limitations on access to funds from subsidiaries and potential obligations to contribute additional capital to Capitol's subsidiaries, which may restrict its ability to make payments on its obligations;
· Administrative or enforcement actions of banking regulators in connection with any material failure of Capitol or its subsidiary banks to comply with banking laws, rules or regulations or formal agreements with regulatory agencies;
· The costs and effects of litigation, investigations, inquiries or similar matters, or adverse facts and developments related thereto;
· The possibility of the Federal Deposit Insurance Corporation ("FDIC") assessing Capitol's banking subsidiaries for any cross-guaranty liability;
· Capitol's compliance with the terms of its written agreement with the Federal Reserve Bank, amendments thereto or subsequent regulatory agreements;
· The current prohibition of Capitol's subsidiary banks to pay dividends to Capitol without prior written authorization from regulatory agencies;
· The risk that the realization of deferred tax assets may not occur;
· The risk that Capitol could have an "ownership change" under Section 382 of the Internal Revenue Code, which could impair its ability to timely and fully utilize its net operating losses for tax purposes and so-called built-in losses that may exist if such an "ownership change" occurs;
· The risks associated with the high concentration of commercial real estate loans within Capitol's consolidated loan portfolio along with other credit risks associated with individual large loans;
INDEX – Continued
PART I. FINANCIAL INFORMATION – Continued
Forward-Looking Statements – Continued
· The concentration of Capitol's nonperforming assets by loan type in certain geographic regions and with affiliated borrowing groups;
· The overall adequacy of the allowance for loan losses to absorb the amount of actual losses inherent within the loan portfolio;
· The failure of assumptions underlying estimates for the allowance for loan losses and estimation of values of collateral or cash flow projections related to collateral-dependent loans;
· Capitol's ability to manage fluctuations in the value of its assets and liabilities and maintain sufficient capital and liquidity to support its operations;
· Fluctuations in the value of Capitol's investment securities;
· Volatility of interest rate sensitive deposits and the uncertainties of future depositor activity regarding potentially uninsured deposits;
· The ability to successfully acquire deposits for funding and the pricing thereof;
· The continued availability of credit facilities provided by Federal Home Loan Banks to Capitol's banking subsidiaries;
· Management's ability to effectively manage interest rate risk and the impact of interest rates, in general, on the volatility of Capitol's net interest income;
· The ability to successfully execute strategies to increase noninterest income;
· The impact of possible future material impairment charges;
· Capitol's ability to adapt successfully to technological changes to compete effectively in the marketplace;
· Operational risks, including data processing system failures or fraud;
· The ability to attract and retain senior management experienced in banking and financial services;
· A continuation of unprecedented volatility in the capital markets;
· The decline in commercial and residential real estate values and sales volume and the likely potential for continuing illiquidity in the real estate market;
· The uncertainties in estimating the fair value of developed real estate and undeveloped land relating to collateral-dependent loans and other real estate owned in light of declining demand for such assets, falling prices and continuing illiquidity in the real estate market;
· Negative developments and disruptions in the credit and lending markets, including the impact of the ongoing credit crisis on Capitol's business and on the businesses of its customers as well as other banks and lending institutions with which Capitol has commercial relationships;
· Continued unemployment, the overall continued national economic weakness, rising commodity prices and the impact on Capitol's customers' savings rates and their ability to service debt obligations;
· Changes in the general economic environment, industry conditions, competition or other factors, either nationally or regionally, that may influence loan demand and repayment, deposit inflows and outflows, and the quality of the loan portfolio and loan and deposit pricing;
INDEX – Continued
PART I. FINANCIAL INFORMATION – Continued
Forward-Looking Statements – Continued
· The effects of competition from other commercial banks, savings associations, mortgage banking firms, consumer finance companies, credit unions, securities brokerage firms, insurance companies, money market and other mutual funds, and other financial institutions operating in Capitol's markets or elsewhere or providing similar services;
· Changes in legislation or regulatory and accounting principles, policies, or guidelines affecting the business conducted by Capitol and/or its operating strategy;
· The impact on Capitol's financial results, reputation and business if it is unable to comply with all applicable federal and state regulations and applicable formal agreements, consent orders, other regulatory actions and any related capital requirements;
· The effect of the Dodd-Frank Wall Street Reform and Consumer Protection Act of 2010, Emergency Economic Stabilization Act of 2008, the implementation by the Department of the U.S. Treasury and federal banking regulators of a number of programs to address capital and liquidity issues within the banking system and additional programs that may apply to Capitol in the future, all of which may have significant effects on Capitol and the financial services industry;
· Governmental monetary and fiscal policies, as well as legislative and regulatory changes, that may result in the imposition of costs and constraints on Capitol through higher FDIC insurance premiums, significant fluctuations in market interest rates, increases in capital requirements and operational limitations;
· The ability of the U.S. government to develop a fiscal operating budget that controls spending and serves to reduce the national deficit in a meaningful way, and the potential impact on future inflation and the current weak national economy;
· Acts of war or terrorism; and
· Other factors and other information contained in this document and in other reports and filings that Capitol makes with the SEC under the Securities Exchange Act of 1934, as amended, including, without limitation, under the caption "Risk Factors."
For a discussion of these and other risks that may cause actual results to differ from expectations, you should refer to the risk factors and other information in this Form 10-Q and Capitol's other periodic filings, including its 2011 Annual Report on Form 10-K, quarterly reports on Form 10-Q and current reports on Form 8-K, that Capitol files from time to time with the SEC. All written or oral forward-looking statements that are made by or are attributable to Capitol are expressly qualified by this cautionary notice.
Should one or more of these risks or uncertainties materialize, or should underlying assumptions prove incorrect, actual outcomes may vary materially from those indicated. All subsequent written or oral forward-looking statements attributable to Capitol or persons acting on its behalf are expressly qualified in their entirety by the foregoing factors. Investors and other interested parties are cautioned not to place undue reliance on such statements, which speak as of the date of such statements. Capitol undertakes no obligation to release publicly any revisions to these forward-looking statements to reflect events or circumstances after the date of such statements or to reflect the occurrence of unanticipated events.
INDEX – Continued
PART I. FINANCIAL INFORMATION – Continued
Item 1. | Financial Statements (unaudited): | Page |
| | | 6 |
| | March 31, 2012 and 2011. | 7 |
| | ended March 31, 2012 and 2011. | 8 |
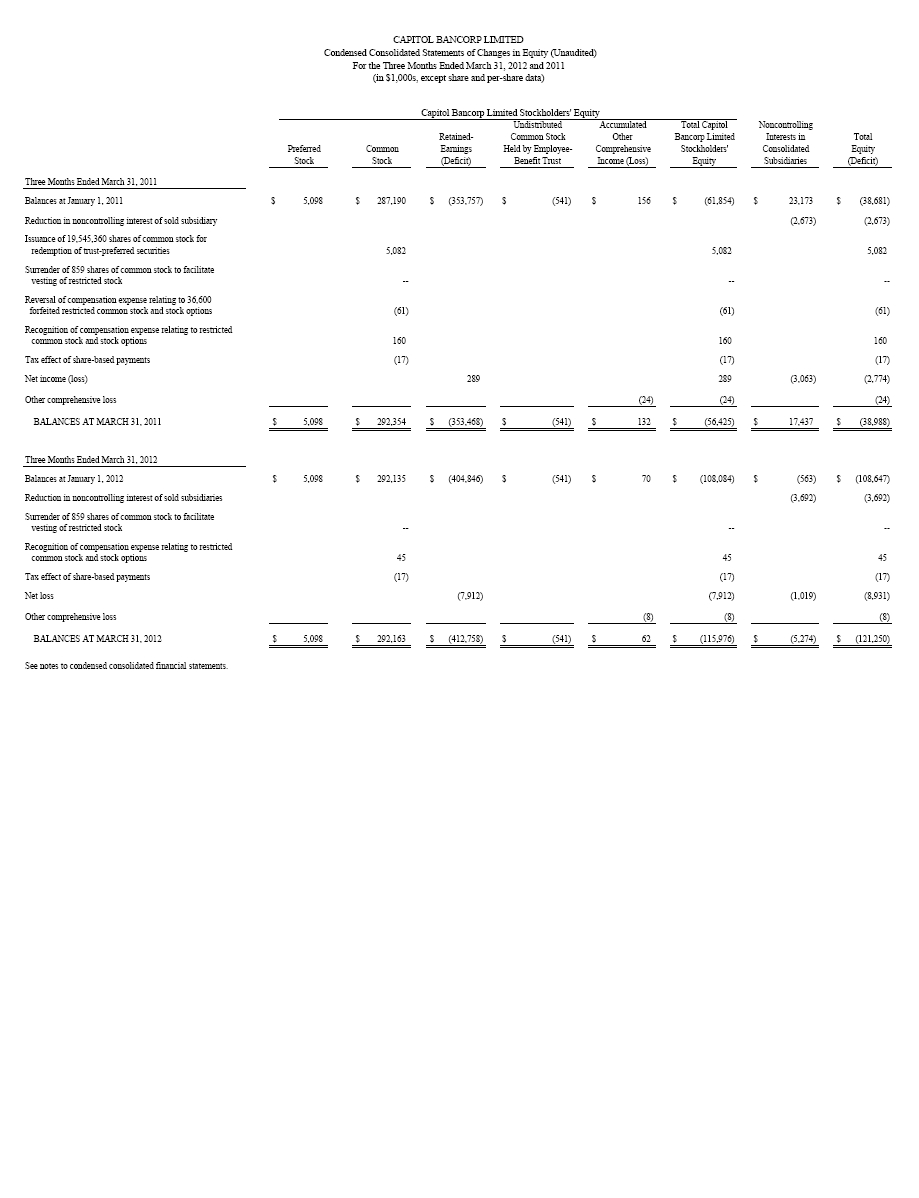
| | Condensed consolidated statements of changes in equity – Three months ended March 31, 2012 and 2011. | 9 |
| | 2012 and 2011. | 10 |
| | | 11 |
| Item 2. | | 33 |
| Item 3. | | 52 |
| Item 4. | | 52 |
PART II. | OTHER INFORMATION | |
Item 1. | | 53 |
| Item 1A. | | 53 |
| Item 2. | | 53 |
| Item 3. | | 53 |
| Item 4. | | 53 |
| Item 5. | | 53 |
| Item 6. | | 54 |
| | 55 |
| | 56 |
[The remainder of this page intentionally left blank]
| PART I, ITEM 1 |
| | | | | | | | |
| CAPITOL BANCORP LIMITED |
|
| As of March 31, 2012 and December 31, 2011 |
| (in $1,000s, except share and per-share data) |
| | | | | | | | |
| | | | (Unaudited) | | | | |
| | | | March 31, | | | December 31, | |
| | | | 2012 | | | 2011 | |
| ASSETS | | | | | | | |
| Cash and due from banks | | | $ | 58,714 | | | $ | 43,613 | |
| Money market and interest-bearing deposits | | | | 321,332 | | | | 343,611 | |
| Cash and cash equivalents | | | 380,046 | | | | 387,224 | |
| Loans held for sale | | | | 814 | | | | 2,936 | |
| Investment securities -- Note C: | | | | | | | | | |
| Available for sale, carried at fair value | | | | 23,089 | | | | 25,082 | |
| Held for long-term investment, carried at | | | | | | | | | |
| amortized cost which approximates fair value | | | | 2,722 | | | | 2,737 | |
| Total investment securities | | | 25,811 | | | | 27,819 | |
| Federal Home Loan Bank and Federal Reserve | | | | | | | | | |
| Bank stock (carried on the basis of cost) -- Note C | | | 13,401 | | | | 13,514 | |
| Portfolio loans, less allowance for loan losses of $86,799 | | | | | | | | |
| in 2012 and $92,529 in 2011 -- Note D | | | | 1,485,320 | | | | 1,571,680 | |
| Premises and equipment | | | | 27,364 | | | | 27,420 | |
| Accrued interest income | | | | 5,232 | | | | 5,507 | |
| Other real estate owned | | | | 105,966 | | | | 100,463 | |
| Other assets | | | | 14,785 | | | | 17,037 | |
| Assets of discontinued operations -- Note E | | | | - | | | | 51,665 | |
| | | | | | | | | | |
| TOTAL ASSETS | | | $ | 2,058,739 | | | $ | 2,205,265 | |
| | | | | | | | | | |
| LIABILITIES AND EQUITY | | | | | | | | | |
| LIABILITIES: | | | | | | | | | |
| Deposits: | | | | | | | | | |
| Noninterest-bearing | | | $ | 369,320 | | | $ | 348,817 | |
| Interest-bearing | | | | 1,562,042 | | | | 1,661,030 | |
| Total deposits | | | 1,931,362 | | | | 2,009,847 | |
| Debt obligations: | | | | | | | | | |
| Notes payable and other borrowings | | | | 50,067 | | | | 60,178 | |
| Subordinated debentures -- Note I | | | | 149,181 | | | | 149,156 | |
| Total debt obligations | | | 199,248 | | | | 209,334 | |
| Accrued interest on deposits and other liabilities | | | 49,379 | | | | 50,593 | |
| Liabilities of discontinued operations -- Note E | | | | - | | | | 44,138 | |
| Total liabilities | | | 2,179,989 | | | | 2,313,912 | |
| | | | | | | | | | |
| EQUITY: | | | | | | | | | |
| Capitol Bancorp Limited stockholders' equity -- Notes G and L: | | | | | | | | |
| Preferred stock (Series A), 700,000 shares authorized | | | | | | | | |
| ($100 per-share liquidation preference); 50,980 shares | | | | | | | | |
| issued and outstanding | | | | 5,098 | | | | 5,098 | |
| Preferred stock (for potential future issuance), | | | | | | | | |
| 19,300,000 shares authorized (none issued and outstanding) | | | -- | | | | -- | |
| Common stock, no par value, 1,500,000,000 shares authorized; | | | | | | | | |
| issued and outstanding: 2012 - 41,038,908 shares | | | | | | | | |
| 2011 - 41,039,767 shares | | | 292,163 | | | | 292,135 | |
| Retained-earnings deficit | | | | (412,758 | ) | | | (404,846 | ) |
| Undistributed common stock held by employee-benefit trust | | | (541 | ) | | | (541 | ) |
| Accumulated other comprehensive income | | | | 62 | | | | 70 | |
| Total Capitol Bancorp Limited stockholders' equity deficit | | | (115,976 | ) | | | (108,084 | ) |
| Noncontrolling interests in consolidated subsidiaries | | | (5,274 | ) | | | (563 | ) |
| Total equity deficit | | | (121,250 | ) | | | (108,647 | ) |
| | | | | | | | | | |
| TOTAL LIABILITIES AND EQUITY | | $ | 2,058,739 | | | $ | 2,205,265 | |
| | | | | | | | | | |
| See notes to condensed consolidated financial statements. | | | | | | | | |
| CAPITOL BANCORP LIMITED |
|
| For the Three Months Ended March 31, 2012 and 2011 |
| (in $1,000s, except per-share data) |
| | | | | | | |
| | | 2012 | | | 2011 | |
| Interest income: | | | | | | |
| Portfolio loans (including fees) | | $ | 22,596 | | | $ | 27,908 | |
| Loans held for sale | | | 15 | | | | 23 | |
| Taxable investment securities | | | 71 | | | | 50 | |
| Other | | | 312 | | | | 378 | |
| Total interest income | | | 22,994 | | | | 28,359 | |
| Interest expense: | | | | | | | | |
| Deposits | | | 4,298 | | | | 7,084 | |
| Debt obligations and other | | | 3,125 | | | | 3,057 | |
| Total interest expense | | | 7,423 | | | | 10,141 | |
| Net interest income | | | 15,571 | | | | 18,218 | |
| Provision for loan losses -- Note D | | | 1,326 | | | | 13,429 | |
| Net interest income after provision | | | | | | | | |
| for loan losses | | | 14,245 | | | | 4,789 | |
| Noninterest income: | | | | | | | | |
| Service charges on deposit accounts | | | 816 | | | | 792 | |
| Trust and wealth-management revenue | | | 723 | | | | 944 | |
| Fees from origination of non-portfolio residential | | | | | | | | |
| mortgage loans | | | 243 | | | | 232 | |
| Gain on sale of government-guaranteed loans | | | 219 | | | | 451 | |
| Gain on debt extinguishment -- Note I | | | | | | | 16,861 | |
| Other | | | 1,654 | | | | 1,780 | |
| Total noninterest income | | | 3,655 | | | | 21,060 | |
| Noninterest expense: | | | | | | | | |
| Salaries and employee benefits | | | 11,333 | | | | 13,042 | |
| Occupancy | | | 2,681 | | | | 2,937 | |
| Equipment rent, depreciation and maintenance | | | 1,497 | | | | 1,967 | |
| Costs associated with foreclosed properties and other | | | | | | | | |
| real estate owned | | | 5,148 | | | | 7,458 | |
| FDIC insurance premiums and other regulatory fees | | | 1,790 | | | | 2,897 | |
| Other | | | 4,648 | | | | 7,296 | |
| Total noninterest expense | | | 27,097 | | | | 35,597 | |
| Loss before income tax benefit | | | (9,197 | ) | | | (9,748 | ) |
| Income tax benefit | | | (117 | ) | | | (2,226 | ) |
| Loss from continuing operations | | | (9,080 | ) | | | (7,522 | ) |
| Discontinued operations -- Note E: | | | | | | | | |
| Income from operations of bank subsidiaries sold | | | 77 | | | | 1,959 | |
| Gain on sale of bank subsidiaries | | | 126 | | | | 4,368 | |
| Less income tax expense | | | 54 | | | | 1,579 | |
| Income from discontinued operations | | | 149 | | | | 4,748 | |
| NET LOSS | | | (8,931 | ) | | | (2,774 | ) |
| Net losses attributable to noncontrolling interests in | | | | | | | | |
| consolidated subsidiaries | | | 1,019 | | | | 3,063 | |
| | | | | | | | | |
| NET INCOME (LOSS) ATTRIBUTABLE TO CAPITOL | | | | | | | | |
| BANCORP LIMITED | | $ | (7,912 | ) | | $ | 289 | |
| | | | | | | | | |
| NET INCOME (LOSS) PER COMMON SHARE | | | | | | | | |
| ATTRIBUTABLE TO CAPITOL BANCORP | | | | | | | | |
| LIMITED -- Note H | | $ | (0.19 | ) | | $ | 0.01 | |
| | | | | | | | | |
| See notes to condensed consolidated financial statements. | | | | | | | | |
| CAPITOL BANCORP LIMITED |
|
| For the Three Months Ended March 31, 2012 and 2011 |
| (in $1,000s) |
| | | | | | | |
| | | 2012 | | | 2011 | |
| | | | | | | |
| NET LOSS | | $ | (8,931 | ) | | $ | (2,774 | ) |
| | | | | | | | | |
| Other comprehensive loss, net of tax: | | | | | | | | |
| Unrealized losses arising during the period | | | (8 | ) | | | (24 | ) |
| Less reclassification adjustment for losses | | | | | | | | |
| included in net loss | | | -- | | | | -- | |
| | | | | | | | | |
| COMPREHENSIVE LOSS | | | (8 | ) | | | (24 | ) |
| | | | | | | | | |
| Comprehensive loss attributable to noncontrolling interests in | | | | | | | | |
| consolidated subsidiaries | | | -- | | | | -- | |
| | | | | | | | | |
| COMPREHENSIVE LOSS ATTRIBUTABLE | | | | | | | | |
| TO CAPITOL BANCORP LIMITED | | $ | (8,939 | ) | | $ | (2,798 | ) |
| | | | | | | | | |
| See notes to condensed consolidated financial statements. | | | | | | | | |
| CAPITOL BANCORP LIMITED |
|
| For the Three Months Ended March 31, 2012 and 2011 |
| (in $1,000s) |
| | | | | | | |
| | | 2012 | | | 2011 | |
| | | | | | | |
| OPERATING ACTIVITIES | | | | | | |
| Net loss | | $ | (8,931 | ) | | $ | (2,774 | ) |
| Adjustments to reconcile net loss to net cash provided | | | | | | | | |
| by operating activities (including discontinued operations): | | | | | | | | |
| Provision for loan losses | | | 1,326 | | | | 13,961 | |
| Depreciation of premises and equipment | | | 1,050 | | | | 1,597 | |
| Net amortization of investment security premiums | | | 45 | | | | 3 | |
| Loss on sale of premises and equipment | | | 21 | | | | 4 | |
| Gain on sale of government-guaranteed loans | | | (219 | ) | | | (786 | ) |
| Gain on sale of bank subsidiaries | | | (126 | ) | | | (4,368 | ) |
| Gain on extinguishment of debt | | | -- | | | | (16,861 | ) |
| Loss (gain) on sale of other real estate owned | | | (333 | ) | | | 134 | |
| Write-down of other real estate owned | | | 4,789 | | | | 4,223 | |
| Amortization of issuance costs of subordinated debentures | | | 25 | | | | 25 | |
| Share-based compensation expense | | | 45 | | | | 99 | |
| Deferred income tax credit | | | (243 | ) | | | (230 | ) |
| Originations and purchases of loans held for sale | | | (8,461 | ) | | | (9,516 | ) |
| Proceeds from sales of loans held for sale | | | 10,583 | | | | 14,847 | |
| Decrease in accrued interest income and other assets | | | 2,697 | | | | 17,262 | |
| Increase (decrease) in accrued interest expense on deposits | | | | | | | | |
| and other liabilities | | | (1,196 | ) | | | 1,187 | |
| | | | | | | | | |
| NET CASH PROVIDED BY OPERATING ACTIVITIES | | | 1,072 | | | | 18,807 | |
| | | | | | | | | |
| INVESTING ACTIVITIES | | | | | | | | |
| Proceeds from sales of investment securities available for sale | | | -- | | | | 488 | |
| Proceeds from calls, prepayments and maturities of investment | | | | | | | | |
| securities | | | 4,437 | | | | 6,766 | |
| Purchases of investment securities | | | (2,500 | ) | | | (10,265 | ) |
| Redemption of Federal Home Loan Bank stock by issuer | | | 144 | | | | 42 | |
| Purchase of Federal Home Loan Bank stock | | | (31 | ) | | | (849 | ) |
| Net decrease in portfolio loans | | | 64,597 | | | | 40,531 | |
| Proceeds from sales of government-guaranteed loans | | | 2,377 | | | | 11,628 | |
| Proceeds from sales of premises and equipment | | | 28 | | | | 50 | |
| Purchases of premises and equipment | | | (1,038 | ) | | | (592 | ) |
| Proceeds from sale of bank subsidiaries | | | 4,060 | | | | 8,869 | |
| Payments received on other real estate owned | | | 15 | | | | 14 | |
| Proceeds from sales of other real estate owned | | | 8,627 | | | | 7,988 | |
| | | | | | | | | |
| NET CASH PROVIDED BY INVESTING ACTIVITIES | | | 80,716 | | | | 64,670 | |
| | | | | | | | | |
| FINANCING ACTIVITIES | | | | | | | | |
| Net increase in demand deposits, NOW accounts and savings accounts | | | 51,933 | | | | 42,353 | |
| Net decrease in certificates of deposit | | | (130,154 | ) | | | (112,350 | ) |
| Net borrowing from (payments on) debt obligations | | | (111 | ) | | | 425 | |
| Proceeds from Federal Home Loan Bank borrowings | | | 4,500 | | | | 91,350 | |
| Payments on Federal Home Loan Bank borrowings | | | (14,500 | ) | | | (103,250 | ) |
| Tax effect of share-based payments | | | (17 | ) | | | (17 | ) |
| | | | | | | | | |
| NET CASH USED IN FINANCING ACTIVITIES | | | (88,349 | ) | | | (81,489 | ) |
| | | | | | | | | |
| INCREASE (DECREASE) IN CASH AND CASH EQUIVALENTS | | | (6,561 | ) | | | 1,988 | |
| | | | | | | | | |
| Change in cash and cash equivalents of discontinued operations | | | (617 | ) | | | (6,138 | ) |
| | | | | | | | | |
| Cash and cash equivalents at beginning of period | | | 387,224 | | | | 421,344 | |
| | | | | | | | | |
| CASH AND CASH EQUIVALENTS AT END OF PERIOD | | $ | 380,046 | | | $ | 417,194 | |
| | | | | | | | | |
| Supplemental disclosures: | | | | | | | | |
| Cash paid during the period for interest on deposits and debt obligations | | $ | 7,721 | | | $ | 11,914 | |
| Transfers of loans to other real estate owned | | | 18,601 | | | | 17,671 | |
| Exchange of common stock for redemption of debt | | | -- | | | | 5,082 | |
| | | | | | | | | |
| See notes to condensed consolidated financial statements. | | | | | | | | |
Note A – Basis of Presentation
The accompanying unaudited condensed consolidated financial statements of Capitol Bancorp Limited ("Capitol" or the "Corporation") have been prepared in accordance with generally accepted accounting principles for interim financial information and with the instructions for Form 10-Q. Accordingly, they do not include all information and footnotes necessary for a fair presentation of consolidated financial position, results of operations and cash flows in conformity with accounting principles generally accepted in the United States of America.
The condensed consolidated financial statements do, however, include all adjustments of a normal recurring nature (in accordance with Rule 10-01(b)(8) of Regulation S-X) which Capitol considers necessary for a fair presentation of the interim periods.
The results of operations for the period ended March 31, 2012 are not necessarily indicative of the results to be expected for the year ending December 31, 2012.
The consolidated balance sheet as of December 31, 2011 was derived from audited consolidated financial statements as of that date. Certain 2011 amounts have been reclassified to conform to the 2012 presentation.
Capitol's ability to continue to operate as a going concern is contingent upon a number of factors which are discussed on page 45 of this document, as well as a variety of risk factors discussed elsewhere in this document and in Capitol's other filings with the SEC. Capitol's auditors included a going concern qualification in the most recent report on the Corporation's audited consolidated financial statements as of and for the year ended December 31, 2011.
Note B – Accounting Standards Updates
In April 2011, an accounting standards update was issued to improve financial reporting of repurchase agreements and other agreements that both entitle and obligate a transferor to repurchase or redeem financial assets on substantially the agreed upon terms. This standard eliminates consideration of the transferor's ability to fulfill its contractual rights and obligations from the criteria, as well as related implementation guidance (i.e., that it possesses adequate collateral to fund substantially all the cost of purchasing replacement financial assets), in determining effective control, even in the event of default by the transferee. Other criteria applicable to the assessment of effective control are not changed by this new guidance. This new guidance became effective January 1, 2012 and it did not have any effect on the Corporation's consolidated financial statements upon implementation.
In May 2011, an accounting standards update was issued to amend the fair value measurement and disclosure requirements to explain how to measure fair value in certain instances, but it does not require additional fair value measurements. Some of the amendments include clarification regarding the application of the highest and best use and valuation premise concepts, measuring the fair value of an instrument classified in a reporting entity's stockholders' equity, measuring the fair value of financial instruments that are managed within a portfolio, application of premiums and discounts in a fair value measurement, expanded disclosure requirements to include quantitative information about the unobservable inputs used in a fair value measurement that is categorized within Level 3 of the fair value hierarchy and expanded disclosure of the categorization by level of the fair value hierarchy for the items that are not measured at fair value in the balance sheet, but for where the estimated fair value is required to be disclosed (e.g. portfolio loans and deposits). This new guidance was effective prospectively beginning January 1, 2012 and it did not have a material effect on the Corporation's consolidated financial statements upon implementation. The new disclosures of the fair value levels of the Corporation's assets and liabilities are set forth in Note F.
In June 2011, an accounting standards update was issued to amend the options available for the presentation of other comprehensive income. An entity will have the option to present the total of comprehensive income, the components of net income and the components of other comprehensive income either in a single continuous statement of comprehensive income or in two separate but consecutive statements. An entity will no longer be able to present the components of comprehensive income as part of the statement of stockholders' equity. Regardless of which presentation method an entity chooses, the entity is required to present on the face of the financial statements reclassification
NOTES TO CONDENSED CONSOLIDATED FINANCIAL STATEMENTS
CAPITOL BANCORP LIMITED – Continued
Note B – Accounting Standards Updates – Continued
adjustments for items that are reclassified from other comprehensive income to net income in the statement(s), where the components of net income and the components of other comprehensive income are presented. This new guidance was effective retrospectively for all annual and interim periods presented beginning January 1, 2012 and the Corporation now presents a separate condensed consolidated statement of comprehensive income. In October 2011, the FASB decided to defer the presentation of reclassification adjustments pending further consideration.
Note C – Investment Securities
Investments in Federal Home Loan Bank and Federal Reserve Bank stock are combined and classified separately from investment securities in the condensed consolidated balance sheet, are restricted and may only be resold to, or redeemed by, the issuer.
Investment securities consisted of the following (in $1,000s):
| | | March 31, 2012 | | | December 31, 2011 | |
| | | Amortized Cost | | | Estimated Fair Value | | | Amortized Cost | | | Estimated Fair Value | |
| Available for sale: | | | | | | | | | | | | |
| United States treasury | | $ | 3,499 | | | $ | 3,503 | | | $ | 4,004 | | | $ | 4,013 | |
| United States government agency | | | 9,028 | | | | 9,035 | | | | 9,805 | | | | 9,819 | |
| Mortgage-backed | | | 10,365 | | | | 10,443 | | | | 10,894 | | | | 10,972 | |
| Municipalities | | | 103 | | | | 108 | | | | 275 | | | | 278 | |
| | | | 22,995 | | | | 23,089 | | | | 24,978 | | | | 25,082 | |
| Held for long-term investment: | | | | | | | | | | | | | | | | |
Capitol Development Bancorp Limited III | | | 958 | | | | 958 | | | | 973 | | | | 973 | |
| Other equity investments | | | 1,764 | | | | 1,764 | | | | 1,764 | | | | 1,764 | |
| | | | 2,722 | | | | 2,722 | | | | 2,737 | | | | 2,737 | |
| | | | | | | | | | | | | | | | | |
| | | $ | 25,717 | | | $ | 25,811 | | | $ | 27,715 | | | $ | 27,819 | |
Securities held for long-term investment are not subject to the classification and accounting rules relating to most typical investments. In addition, Capitol's other equity investments consist mostly of equity-method investments in non-public enterprises which, accordingly, are outside of the scope of accounting rules for most typical investments which often require use of estimated fair value. Those entities, which are primarily involved in making equity investments in or financing small businesses, use the fair value method of accounting in valuing their investment portfolios. Notwithstanding that those investments are outside the scope of such accounting rules, they are included in Capitol's investment securities for financial reporting purposes to summarize all such investment securities together for reporting purposes.
Gross unrealized gains and losses on investment securities available for sale were as follows (in $1,000s):
| | | March 31, 2012 | | | December 31, 2011 | |
| | | Gains | | | Losses | | | Gains | | | Losses | |
| | | | | | | | | | | | | |
| United States treasury | | $ | 6 | | | $ | 1 | | | $ | 9 | | | | |
| United States government agency | | | 11 | | | | 4 | | | | 16 | | | $ | 2 | |
| Mortgage-backed | | | 95 | | | | 17 | | | | 93 | | | | 16 | |
| Municipalities | | | 4 | | | | | | | | 4 | | | | | |
| | | | | | | | | | | | | | | | | |
| | | $ | 116 | | | $ | 22 | | | $ | 122 | | | $ | 18 | |
NOTES TO CONDENSED CONSOLIDATED FINANCIAL STATEMENTS
CAPITOL BANCORP LIMITED – Continued
Note C – Investment Securities – Continued
The age of gross unrealized losses and carrying value (at estimated fair value) of securities available for sale are summarized below (in $1,000s):
| | | March 31, 2012 | | | December 31, 2011 | |
| | | Unrealized Loss | | | Carrying Value | | | Unrealized Loss | | | Carrying Value | |
| One year or less: | | | | | | | | | | | | |
| United States treasury | | $ | 1 | | | $ | 1,498 | | | | | | | |
| United States government agency | | | 4 | | | | 996 | | | $ | 2 | | | $ | 3,247 | |
| Mortgage-backed | | | 17 | | | | 6,226 | | | | 16 | | | | 6,680 | |
| | | | | | | | | | | | | | | | | |
| | | $ | 22 | | | $ | 8,720 | | | $ | 18 | | | $ | 9,927 | |
Gross realized gains and losses from sales and maturities of investment securities were insignificant for each of the periods presented.
Scheduled maturities of investment securities held as of March 31, 2012 were as follows (in $1,000s):
| | | Amortized Cost | | | Estimated Fair Value | |
| | | | | | | |
| Due in one year or less | | $ | 8,278 | | | $ | 8,290 | |
| After one year, through five years | | | 4,370 | | | | 4,374 | |
| After five years, through ten years | | | 310 | | | | 329 | |
| After ten years | | | 10,037 | | | | 10,096 | |
| Securities held for long-term investment | | | | | | | | |
| without stated maturities | | | 2,722 | | | | 2,722 | |
| | | | | | | | | |
| | | $ | 25,717 | | | $ | 25,811 | |
[The remainder of this page intentionally left blank]
NOTES TO CONDENSED CONSOLIDATED FINANCIAL STATEMENTS
CAPITOL BANCORP LIMITED – Continued
Note D – Loans
The following tables present the allowance for loan losses and the carrying amount of loans based on management's overall assessment of probable incurred losses (in $1,000s), and should not be interpreted as an indication of future charge-offs:
| | | March 31, 2012 | |
| | | Secured by Real Estate | | | | | | | | | | | | | | | | |
| | | Commercial | | | Residential (including multi- family) | | | Construction, Land Development and Other Land | | | Commercial and Other Business- Purpose Loans | | | Consumer | | | Other | | | Unallocated | | | Total | |
| | | | | | | | | | | | | | | | | | | | | | | | | |
Allowance for loan losses: | | | | | | | | | | | | | | | | | | | | | | | | |
| Individually | | | | | | | | | | | | | | | | | | | | | | | | |
| evaluated for | | | | | | | | | | | | | | | | | | | | | | | | |
| impairment | | $ | 10,986 | | | $ | 4,201 | | | $ | 3,784 | | | $ | 3,361 | | | $ | 20 | | | | | | | | | $ | 22,352 | |
| Collectively | | | | | | | | | | | | | | | | | | | | | | | | | | | | | | |
| evaluated for | | | | | | | | | | | | | | | | | | | | | | | | | | | | | | |
| probable incurred | | | | | | | | | | | | | | | | | | | | | | | | | | | | | | |
| losses | | | 22,497 | | | | 13,997 | | | | 6,472 | | | | 9,341 | | | | 536 | | | $ | 18 | | | $ | 11,586 | | | | 64,447 | |
| | | | | | | | | | | | | | | | | | | | | | | | | | | | | | | | | |
| Total allowance | | | | | | | | | | | | | | | | | | | | | | | | | | | | | | | | |
| for loan losses | | $ | 33,483 | | | $ | 18,198 | | | $ | 10,256 | | | $ | 12,702 | | | $ | 556 | | | $ | 18 | | | $ | 11,586 | | | $ | 86,799 | |
| | | | | | | | | | | | | | | | | | | | | | | | | | | | | | | | | |
| Portfolio loans: | | | | | | | | | | | | | | | | | | | | | | | | | | | | | | | | |
| Individually | | | | | | | | | | | | | | | | | | | | | | | | | | | | | | | | |
| evaluated for | | | | | | | | | | | | | | | | | | | | | | | | | | | | | | | | |
| impairment | | $ | 159,343 | | | $ | 55,685 | | | $ | 33,840 | | | $ | 22,529 | | | $ | 109 | | | | | | | | | | | $ | 271,506 | |
| Collectively | | | | | | | | | | | | | | | | | | | | | | | | | | | | | | | | |
| evaluated for | | | | | | | | | | | | | | | | | | | | | | | | | | | | | | | | |
| probable incurred | | | | | | | | | | | | | | | | | | | | | | | | | | | | | | | | |
| losses | | | 776,589 | | | | 284,971 | | | | 68,984 | | | | 154,296 | | | | 12,870 | | | $ | 2,903 | | | | | | | | 1,300,613 | |
| | | | | | | | | | | | | | | | | | | | | | | | | | | | | | | | | |
Total portfolio loans | | $ | 935,932 | | | $ | 340,656 | | | $ | 102,824 | | | $ | 176,825 | | | $ | 12,979 | | | $ | 2,903 | | | | | | | $ | 1,572,119 | |
| | | December 31, 2011 | |
| | | Secured by Real Estate | | | | | | | | | | | | | | | | |
| | | Commercial | | | Residential (including multi- family) | | | Construction, Land Development and Other Land | | | Commercial and Other Business- Purpose Loans | | | Consumer | | | Other | | | Unallocated | | | Total | |
| | | | | | | | | | | | | | | | | | | | | | | | | |
Allowance for loan losses: | | | | | | | | | | | | | | | | | | | | | | | | |
| Individually | | | | | | | | | | | | | | | | | | | | | | | | |
| evaluated for | | | | | | | | | | | | | | | | | | | | | | | | |
| impairment | | $ | 11,141 | | | $ | 4,305 | | | $ | 3,434 | | | $ | 3,740 | | | $ | 29 | | | | | | | | | $ | 22,649 | |
| Collectively | | | | | | | | | | | | | | | | | | | | | | | | | | | | | | |
| evaluated for | | | | | | | | | | | | | | | | | | | | | | | | | | | | | | |
| probable incurred | | | | | | | | | | | | | | | | | | | | | | | | | | | | | | |
| losses | | | 28,204 | | | | 16,836 | | | | 8,453 | | | | 11,199 | | | | 721 | | | $ | 20 | | | $ | 4,447 | | | | 69,880 | |
| | | | | | | | | | | | | | | | | | | | | | | | | | | | | | | | | |
| Total allowance | | | | | | | | | | | | | | | | | | | | | | | | | | | | | | | | |
| for loan losses | | $ | 39,345 | | | $ | 21,141 | | | $ | 11,887 | | | $ | 14,939 | | | $ | 750 | | | $ | 20 | | | $ | 4,447 | | | $ | 92,529 | |
| | | | | | | | | | | | | | | | | | | | | | | | | | | | | | | | | |
| Portfolio loans: | | | | | | | | | | | | | | | | | | | | | | | | | | | | | | | | |
| Individually | | | | | | | | | | | | | | | | | | | | | | | | | | | | | | | | |
| evaluated for | | | | | | | | | | | | | | | | | | | | | | | | | | | | | | | | |
| impairment | | $ | 173,165 | | | $ | 59,371 | | | $ | 40,013 | | | $ | 23,796 | | | $ | 63 | | | | | | | | | | | $ | 296,408 | |
| Collectively | | | | | | | | | | | | | | | | | | | | | | | | | | | | | | | | |
| evaluated for | | | | | | | | | | | | | | | | | | | | | | | | | | | | | | | | |
| probable incurred | | | | | | | | | | | | | | | | | | | | | | | | | | | | | | | | |
| losses | | | 799,880 | | | | 304,431 | | | | 77,723 | | | | 169,055 | | | | 13,750 | | | $ | 2,962 | | | | | | | | 1,367,801 | |
| | | | | | | | | | | | | | | | | | | | | | | | | | | | | | | | | |
Total portfolio loans | | $ | 973,045 | | | $ | 363,802 | | | $ | 117,736 | | | $ | 192,851 | | | $ | 13,813 | | | $ | 2,962 | | | | | | | $ | 1,664,209 | |
NOTES TO CONDENSED CONSOLIDATED FINANCIAL STATEMENTS
CAPITOL BANCORP LIMITED – Continued
Note D – Loans – Continued
The allowance for loan losses is maintained at a level believed adequate by management to absorb potential losses inherent in the loan portfolio at the balance-sheet date. Management's determination of the adequacy of the allowance is an estimate based on evaluation of the portfolio (including potential impairment of individual loans and concentrations of credit), past loss experience, current economic conditions, volume, amount and composition of the loan portfolio and other factors. The allowance is increased by provisions for loan losses charged to operations and reduced by net charge-offs.
The tables below summarize activity in the allowance for loan losses for the three months ended March 31, 2012 and 2011 (in $1,000s) by loan type:
| | | Three Months Ended March 31, 2012 | |
| | | Secured by Real Estate | | | | | | | | | | | | | | | | |
| | | Commercial | | | Residential (including multi- family) | | | Construction, Land Development and Other Land | | | Commercial and Other Business- Purpose Loans | | | Consumer | | | Other | | | Unallocated | | | Total | |
| | | | | | | | | | | | | | | | | | | | | | | | | |
| Beginning balance | | $ | 39,345 | | | $ | 21,141 | | | $ | 11,887 | | | $ | 14,939 | | | $ | 750 | | | $ | 20 | | | $ | 4,447 | | | $ | 92,529 | |
| | | | | | | | | | | | | | | | | | | | | | | | | | | | | | | | | |
| Charge-offs | | | (5,992 | ) | | | (4,708 | ) | | | (2,227 | ) | | | (1,801 | ) | | | (295 | ) | | | | | | | | | | | (15,023 | ) |
| Recoveries | | | 2,515 | | | | 3,207 | | | | 773 | | | | 1,402 | | | | 63 | | | | 7 | | | | | | | | 7,967 | |
| Net charge-offs | | | (3,477 | ) | | | (1,501 | ) | | | (1,454 | ) | | | (399 | ) | | | (232 | ) | | | 7 | | | | | | | | (7,056 | ) |
| | | | | | | | | | | | | | | | | | | | | | | | | | | | | | | | | |
| Provision for loan | | | | | | | | | | | | | | | | | | | | | | | | | | | | | | | | |
| losses | | | 1,869 | | | | 105 | | | | 289 | | | | (1,038 | ) | | | 97 | | | | 4 | | | | | | | | 1,326 | |
| | | | | | | | | | | | | | | | | | | | | | | | | | | | | | | | | |
| Additional | | | | | | | | | | | | | | | | | | | | | | | | | | | | | | | | |
| unallocated | | | | | | | | | | | | | | | | | | | | | | | | | | | | | | | | |
| allowance | | | (4,254 | ) | | | (1,547 | ) | | | (466 | ) | | | (800 | ) | | | (59 | ) | | | (13 | ) | | | 7,139 | | | | | |
| | | | | | | | | | | | | | | | | | | | | | | | | | | | | | | | | |
| Ending balance | | $ | 33,483 | | | $ | 18,198 | | | $ | 10,256 | | | $ | 12,702 | | | $ | 556 | | | $ | 18 | | | $ | 11,586 | | | $ | 86,799 | |
| | | Three Months Ended March 31, 2011 | |
| | | Secured by Real Estate | | | | | | | | | | | | | |
| | | Commercial | | | Residential (including multi- family) | | | Construction, Land Development and Other Land | | | Commercial and Other Business- Purpose Loans | | | Consumer | | | Other | | | Total | |
| | | | | | | | | | | | | | | | | | | | | | |
| Beginning balance | | $ | 50,017 | | | $ | 35,722 | | | $ | 18,867 | | | $ | 24,660 | | | $ | 709 | | | $ | 87 | | | $ | 130,062 | |
| | | | | | | | | | | | | | | | | | | | | | | | | | | | | |
| Acquired loan loss | | | | | | | | | | | | | | | | | | | | | | | | | | | | |
| reserve | | | 1,043 | | | | 117 | | | | 651 | | | | 500 | | | | 68 | | | | 1 | | | | 2,380 | |
| | | | | | | | | | | | | | | | | | | | | | | | | | | | | |
| Charge-offs | | | (8,599 | ) | | | (7,265 | ) | | | (8,225 | ) | | | (5,303 | ) | | | (223 | ) | | | | | | | (29,615 | ) |
| Recoveries | | | 995 | | | | 981 | | | | 3,008 | | | | 776 | | | | 38 | | | | 1 | | | | 5,799 | |
| Net charge-offs | | | (7,604 | ) | | | (6,284 | ) | | | (5,217 | ) | | | (4,527 | ) | | | (185 | ) | | | 1 | | | | (23,816 | ) |
| | | | | | | | | | | | | | | | | | | | | | | | | | | | | |
| Provision for loan | | | | | | | | | | | | | | | | | | | | | | | | | | | | |
| losses | | | 7,488 | | | | (2,487 | ) | | | 3,843 | | | | 4,337 | | | | 291 | | | | (43 | ) | | | 13,429 | |
| | | | | | | | | | | | | | | | | | | | | | | | | | | | | |
| Ending balance | | $ | 50,944 | | | $ | 27,068 | | | $ | 18,144 | | | $ | 24,970 | | | $ | 883 | | | $ | 46 | | | $ | 122,055 | |
The average total portfolio loans for the three months ended March 31, 2012 and 2011 were $1.6 billion and $2.1 billion, respectively. The ratio of net charge-offs (annualized) to average portfolio loans outstanding was 1.74% and 4.62% as of March 31, 2012 and 2011, respectively.
NOTES TO CONDENSED CONSOLIDATED FINANCIAL STATEMENTS
CAPITOL BANCORP LIMITED – Continued
Note D – Loans – Continued
Nonperforming loans (i.e., loans which are 90 days or more past due and still accruing interest and loans on nonaccrual status) and other nonperforming assets are summarized below (in $1,000s):
| | | March 31, 2012 | | | December 31, 2011 | |
| Nonaccrual loans: | | | | | | |
| Loans secured by real estate: | | | | | | |
| Commercial | | $ | 115,735 | | | $ | 122,481 | |
| Residential (including multi-family) | | | 41,081 | | | | 47,728 | |
| Construction, land development and other land | | | 24,026 | | | | 31,297 | |
| Total loans secured by real estate | | | 180,842 | | | | 201,506 | |
| Commercial and other business-purpose loans | | | 15,064 | | | | 18,002 | |
| Consumer | | | 182 | | | | 124 | |
| Total nonaccrual loans | | | 196,088 | | | | 219,632 | |
| | | | | | | | | |
Past due (>90 days) loans and accruing interest: | | | | | | | | |
| Loans secured by real estate: | | | | | | | | |
| Commercial | | | 696 | | | | 3,778 | |
| Residential (including multi-family) | | | 1,089 | | | | 259 | |
| Construction, land development and other land | | | 312 | | | | -- | |
| Total loans secured by real estate | | | 2,097 | | | | 4,037 | |
| Commercial and other business-purpose loans | | | 233 | | | | 148 | |
| Consumer | | | 17 | | | | 38 | |
| Total past due loans | | | 2,347 | | | | 4,223 | |
| | | | | | | | | |
| Total nonperforming loans | | $ | 198,435 | | | $ | 223,855 | |
| | | | | | | | | |
Real estate owned and other repossessed assets | | | 106,031 | | | | 100,727 | |
| | | | | | | | | |
| Total nonperforming assets | | $ | 304,466 | | | $ | 324,582 | |
Impaired loans which do not have an allowance requirement include collateral-dependent loans for which direct write-downs have been made to the carrying amount of such loans and, accordingly, no additional allowance requirement or allocation is currently necessary.
[The remainder of this page intentionally left blank]
NOTES TO CONDENSED CONSOLIDATED FINANCIAL STATEMENTS
CAPITOL BANCORP LIMITED – Continued
Note D – Loans – Continued
Impaired loans are summarized in the following table (in $1,000s), based on loans which either have an allowance for loan losses recorded or no such allowance as of March 31, 2012:
| | | Carrying Value | | | Unpaid Principal Balance | | | Related Allowance for Loan Losses | |
| | | | | | | | | | |
| With an allowance recorded: | | | | | | | | | |
| Loans secured by real estate: | | | | | | | | | |
| Commercial | | $ | 87,527 | | | $ | 92,939 | | | $ | 11,434 | |
| Residential (including multi-family) | | | 38,257 | | | | 41,625 | | | | 5,281 | |
| Construction, land development and other land | | | 17,737 | | | | 20,878 | | | | 4,012 | |
| Total loans secured by real estate | | | 143,521 | | | | 155,442 | | | | 20,727 | |
| Commercial and other business-purpose loans | | | 15,767 | | | | 17,389 | | | | 3,583 | |
| Consumer | | | 286 | | | | 1,370 | | | | 111 | |
| | | | 159,574 | | | | 174,201 | | | | 24,421 | |
| With no related allowance recorded: | | | | | | | | | | | | |
| Loans secured by real estate: | | | | | | | | | | | | |
| Commercial | | | 89,720 | | | | 134,503 | | | | | |
| Residential (including multi-family) | | | 25,509 | | | | 46,918 | | | | | |
| Construction, land development and other land | | | 19,603 | | | | 36,765 | | | | | |
| Total loans secured by real estate | | | 134,832 | | | | 218,186 | | | | | |
| Commercial and other business-purpose loans | | | 9,683 | | | | 21,978 | | | | | |
| Consumer | | | 14 | | | | 672 | | | | | |
| | | | 144,529 | | | | 240,836 | | | | | |
| | | | | | | | | | | | | |
| Total | | $ | 304,103 | | | $ | 415,037 | | | $ | 24,421 | |
Included in total impaired loans as of March 31, 2012 is $220.1 million of loans modified as troubled debt restructurings (see further discussion under the Troubled Debt Restructurings section of this Note).
Interest income is recorded on impaired loans if not on nonaccrual status, or may be recorded on a cash basis in some circumstances, if such payments are not credited to principal. For the three months ended March 31, 2012 and 2011, the average recorded investment in impaired loans and interest income recorded on impaired loans were as follows (in $1,000s):
| | | Three Months Ended | |
| | | March 31, 2012 | | | March 31, 2011 | |
| | | Average | | | Interest | | | Average | | | Interest | |
| | | Recorded | | | Income | | | Recorded | | | Income | |
| | | Investment | | | Recorded | | | Investment | | | Recorded | |
| | | | | | | | | | | | | |
| Commercial | | $ | 178,560 | | | $ | 1,732 | | | $ | 184,722 | | | $ | 544 | |
| Residential (including multi-family) | | | 66,555 | | | | 679 | | | | 65,364 | | | | 150 | |
| Construction, land development and other land | | | 40,192 | | | | 392 | | | | 53,539 | | | | 36 | |
| Total loans secured by real estate | | | 285,307 | | | | 2,803 | | | | 303,625 | | | | 730 | |
| Commercial and other business-purpose loans | | | 26,699 | | | | 318 | | | | 34,486 | | | | 100 | |
| Consumer | | | 239 | | | | 4 | | | | 395 | | | | | |
| | | | | | | | | | | | | | | | | |
| Total | | $ | 312,245 | | | $ | 3,125 | | | $ | 338,506 | | | $ | 830 | |
NOTES TO CONDENSED CONSOLIDATED FINANCIAL STATEMENTS
CAPITOL BANCORP LIMITED – Continued
Note D – Loans – Continued
Impaired loans are summarized in the following table (in $1,000s), based on loans which either have an allowance for loan losses recorded or no such allowance as of December 31, 2011:
| | | Carrying Value | | | Unpaid Principal Balance | | | Related Allowance for Loan Losses | |
| | | | | | | | | | |
| With an allowance recorded: | | | | | | | | | |
| Loans secured by real estate: | | | | | | | | | |
| Commercial | | $ | 72,164 | | | $ | 83,433 | | | $ | 11,533 | |
| Residential (including multi-family) | | | 33,649 | | | | 38,238 | | | | 5,744 | |
| Construction, land development and other land | | | 16,980 | | | | 22,940 | | | | 3,764 | |
| Total loans secured by real estate | | | 122,793 | | | | 144,611 | | | | 21,041 | |
| Commercial and other business-purpose loans | | | 16,120 | | | | 17,506 | | | | 4,728 | |
| Consumer | | | 166 | | | | 173 | | | | 95 | |
| | | | 139,079 | | | | 162,290 | | | | 25,864 | |
| With no related allowance recorded: | | | | | | | | | | | | |
| Loans secured by real estate: | | | | | | | | | | | | |
| Commercial | | | 107,709 | | | | 148,926 | | | | | |
| Residential (including multi-family) | | | 35,695 | | | | 48,220 | | | | | |
| Construction, land development and other land | | | 26,064 | | | | 42,309 | | | | | |
| Total loans secured by real estate | | | 169,468 | | | | 239,455 | | | | | |
| Commercial and other business-purpose loans | | | 11,828 | | | | 17,146 | | | | | |
| Consumer | | | 12 | | | | 48 | | | | | |
| | | | 181,308 | | | | 256,649 | | | | | |
| | | | | | | | | | | | | |
| Total | | $ | 320,387 | | | $ | 418,939 | | | $ | 25,864 | |
Included in impaired loans as of December 31, 2011 is $217.5 million of loans modified as troubled debt restructurings (see further discussion under the Troubled Debt Restructurings section of this Note).
The following tables summarize the aging and amounts of past due loans (in $1,000s):
| | | March 31, 2012 | |
| | | Past Due Loans | | | Total | | | | | | | |
| | | (based on payment due dates) | | | Amount of | | | | | | | |
| | | | | | | | | Loans on | | | Loans More | | | Loans Either | | | | |
| | | More Than | | | | | | Nonaccrual | | | Than 29 Days | | | Current or | | | | |
| | | 29 Days, | | | More Than | | | Status | | | Past Due or on | | | Less Than | | | Total | |
| | | and Less Than | | | 89 Days | | | (Generally, 90 | | | Nonaccrual | | | 30 Days | | | Portfolio | |
| | | 90 Days | | | (Accruing) | | | Days or More) | | | Status | | | Past Due | | | Loans | |
| | | | | | | | | | | | | | | | | | | |
| Loans secured by real estate: | | | | | | | | | | | | | | | | | | |
| Commercial | | $ | 21,698 | | | $ | 696 | | | $ | 115,735 | | | $ | 138,129 | | | $ | 797,803 | | | $ | 935,932 | |
| Residential (including multi- | | | | | | | | | | | | | | | | | | | | | | | | |
| family) | | | 5,917 | | | | 1,089 | | | | 41,081 | | | | 48,087 | | | | 292,569 | | | | 340,656 | |
| Construction, land development | | | | | | | | | | | | | | | | | | | | | | | | |
| and other land | | | 2,593 | | | | 312 | | | | 24,026 | | | | 26,931 | | | | 75,893 | | | | 102,824 | |
Total loans secured by real estate | | | 30,208 | | | | 2,097 | | | | 180,842 | | | | 213,147 | | | | 1,166,265 | | | | 1,379,412 | |
| Commercial and other business- | | | | | | | | | | | | | | | | | | | | | | | | |
| purpose loans | | | 3,414 | | | | 233 | | | | 15,064 | | | | 18,711 | | | | 158,114 | | | | 176,825 | |
| Consumer | | | 97 | | | | 17 | | | | 182 | | | | 296 | | | | 12,683 | | | | 12,979 | |
| Other | | | 3 | | | | | | | | | | | | 3 | | | | 2,900 | | | | 2,903 | |
| | | | | | | | | | | | | | | | | | | | | | | | | |
| Total | | $ | 33,722 | | | $ | 2,347 | | | $ | 196,088 | | | $ | 232,157 | | | $ | 1,339,962 | | | $ | 1,572,119 | |
NOTES TO CONDENSED CONSOLIDATED FINANCIAL STATEMENTS
CAPITOL BANCORP LIMITED – Continued
Note D – Loans – Continued
| | | December 31, 2011 | |
| | | Past Due Loans | | | Total | | | | | | | |
| | | (based on payment due dates) | | | Amount of | | | | | | | |
| | | | | | | | | Loans on | | | Loans More | | | Loans Either | | | | |
| | | More Than | | | | | | Nonaccrual | | | Than 29 Days | | | Current or | | | | |
| | | 29 Days, | | | More Than | | | Status | | | Past Due or on | | | Less Than | | | Total | |
| | | and Less Than | | | 89 Days | | | (Generally, 90 | | | Nonaccrual | | | 30 Days | | | Portfolio | |
| | | 90 Days | | | (Accruing) | | | Days or More) | | | Status | | | Past Due | | | Loans | |
| | | | | | | | | | | | | | | | | | | |
| Loans secured by real estate: | | | | | | | | | | | | | | | | | | |
| Commercial | | $ | 18,127 | | | $ | 3,778 | | | $ | 122,481 | | | $ | 144,386 | | | $ | 828,659 | | | $ | 973,045 | |
| Residential (including multi- | | | | | | | | | | | | | | | | | | | | | | | | |
| family) | | | 5,376 | | | | 259 | | | | 47,728 | | | | 53,363 | | | | 310,439 | | | | 363,802 | |
| Construction, land development | | | | | | | | | | | | | | | | | | | | | | | | |
| and other land | | | 4,634 | | | | | | | | 31,297 | | | | 35,931 | | | | 81,805 | | | | 117,736 | |
Total loans secured by real estate | | | 28,137 | | | | 4,037 | | | | 201,506 | | | | 233,680 | | | | 1,220,903 | | | | 1,454,583 | |
| Commercial and other business- | | | | | | | | | | | | | | | | | | | | | | | | |
| purpose loans | | | 3,958 | | | | 148 | | | | 18,002 | | | | 22,108 | | | | 170,743 | | | | 192,851 | |
| Consumer | | | 479 | | | | 38 | | | | 124 | | | | 641 | | | | 13,172 | | | | 13,813 | |
| Other | | | | | | | | | | | | | | | | | | | 2,962 | | | | 2,962 | |
| | | | | | | | | | | | | | | | | | | | | | | | | |
| Total | | $ | 32,574 | | | $ | 4,223 | | | $ | 219,632 | | | $ | 256,429 | | | $ | 1,407,780 | | | $ | 1,664,209 | |
Capitol categorizes loans into risk categories based on relevant information about the ability of borrowers to service their debt obligations based on: current financial information, aging analysis, historical payment experience, credit documentation and public information, among other factors. Capitol analyzes loans individually by classifying the loans as to credit risk. This analysis generally includes all loans and is generally performed at least quarterly. The following loan risk rating definitions are used:
Pass. Loans classified with a pass rating have been deemed to have acceptable credit quality by bank management.
Watch. Loans classified as watch have a potential weakness that deserves management's close attention. If not improved, those potential weaknesses may result in deterioration of the repayment prospects for the loan in the future.
Substandard. Loans classified as substandard are inadequately protected by the borrower's current net worth, paying capacity of the borrower or the fair value of collateral. Loans so classified have a well-defined weakness or weaknesses that jeopardize the liquidation of the debt obligation by the borrower. These are characterized by the reasonable possibility that some loss will be sustained if the deficiencies are not favorably resolved.
[The remainder of this page intentionally left blank]
NOTES TO CONDENSED CONSOLIDATED FINANCIAL STATEMENTS
CAPITOL BANCORP LIMITED – Continued
Note D – Loans – Continued
Based on management's most recent analysis, the risk categories of loans are summarized as follows (in $1,000s):
| | | March 31, 2012 | |
| | | Pass | | | | | | Total Portfolio Loans | |
| | | Watch | | | Substandard | |
| | | | | | | | | | | | | |
| Loans secured by real estate: | | | | | | | | | | | | |
| Commercial | | $ | 639,516 | | | $ | 92,853 | | | $ | 203,563 | | | $ | 935,932 | |
| Residential (including multi-family) | | | 237,746 | | | | 28,513 | | | | 74,397 | | | | 340,656 | |
| Construction, land development and | | | | | | | | | | | | | | | | |
| other land | | | 52,475 | | | | 14,036 | | | | 36,313 | | | | 102,824 | |
| Total loans secured by real estate | | | 929,737 | | | | 135,402 | | | | 314,273 | | | | 1,379,412 | |
| Commercial and other business-purpose | | | | | | | | | | | | | | | | |
| loans | | | 133,331 | | | | 13,795 | | | | 29,699 | | | | 176,825 | |
| Consumer | | | 11,868 | | | | 666 | | | | 445 | | | | 12,979 | |
| Other | | | 2,618 | | | | 285 | | | | | | | | 2,903 | |
| | | | | | | | | | | | | | | | | |
| Total | | $ | 1,077,554 | | | $ | 150,148 | | | $ | 344,417 | | | $ | 1,572,119 | |
| | | December 31, 2011 | |
| | | Pass | | | | | | Total Portfolio Loans | |
| | | Watch | | | Substandard | |
| | | | | | | | | | | | | |
| Loans secured by real estate: | | | | | | | | | | | | |
| Commercial | | $ | 662,963 | | | $ | 94,151 | | | $ | 215,931 | | | $ | 973,045 | |
| Residential (including multi-family) | | | 250,750 | | | | 32,631 | | | | 80,421 | | | | 363,802 | |
| Construction, land development and | | | | | | | | | | | | | | | | |
| other land | | | 59,249 | | | | 12,592 | | | | 45,895 | | | | 117,736 | |
| Total loans secured by real estate | | | 972,962 | | | | 139,374 | | | | 342,247 | | | | 1,454,583 | |
| Commercial and other business-purpose | | | | | | | | | | | | | | | | |
| loans | | | 145,498 | | | | 14,641 | | | | 32,712 | | | | 192,851 | |
| Consumer | | | 12,715 | | | | 578 | | | | 520 | | | | 13,813 | |
| Other | | | 2,668 | | | | 294 | | | | | | | | 2,962 | |
| | | | | | | | | | | | | | | | | |
| Total | | $ | 1,133,843 | | | $ | 154,887 | | | $ | 375,479 | | | $ | 1,664,209 | |
[The remainder of this page intentionally left blank]
NOTES TO CONDENSED CONSOLIDATED FINANCIAL STATEMENTS
CAPITOL BANCORP LIMITED – Continued
Note D – Loans – Continued
Troubled Debt Restructurings
Loan modifications or restructurings are accounted for as troubled debt restructurings if, for economic or legal reasons, it has been determined a borrower is experiencing financial difficulties and the bank grants a "concession" to the borrower that it would not otherwise consider. For all classes of loans, a troubled debt restructuring may involve a modification of terms such as a reduction of the stated interest rate or loan balance, a reduction of the accrued interest, an extension of the maturity date at an interest rate lower than a current market rate for a new loan with similar risk, or some combination thereof involving a concession to the borrower to facilitate repayment.
The Corporation has designated a troubled debt restructuring as a loan that has been modified because the borrower is experiencing financial difficulty and the loan meets one or more of the following criteria:
| 1. | An extension or renewal of a substandard rated loan with no change in rate or terms, and the terms provided are not representative of current market rates for credits with similar risk characteristics; |
| 2. | A loan modification where the repayment terms are modified for a specific period of time in order to allow the borrower to liquidate or dispose of the related collateral to provide the ability to pay the loan off in full; |
| 3. | Modification of the interest rate for a defined period of time in order to allow the borrower to repay the debt, based on current cash flow sources; |
| 4. | A loan modified to an "interest only" structure for a period of time that will result in the loan being paid off, returned to the contracted terms or refinanced; or |
| 5. | A modification of a loan into an A/B note structure, where the A note is at market rate terms and conditions, and the B note has been charged off. |
Loans modified and classified as troubled debt restructurings are impaired loans. Each loan that is designated as a troubled debt restructuring is individually evaluated for impairment to determine the specific reserve to be established. The specific reserve is determined using the discounted cash flow method, the collateral dependency method or, when available, the observable market price method, and is calculated as the difference between the carrying value of the loan and the result of the impairment measurement method.
The loan portfolios contain primarily three categories of troubled debt restructurings, (1) loans for which the rate or terms have been modified (2) loans for which the rate or terms have not been modified but the loan was extended or renewed, and (3) loans that have been modified with interest only terms. The following are the factors that enter into the determination of the specific reserve for each of these categories:
Loans for which the rate or terms have been modified: The specific reserve for loans in this category, for which the repayment ability is based on the cash flows of the borrower, is determined using a discounted cash flow analysis. The discount period used is based on when the bank believes, based on cash flows from the borrower or project, that the credit will be paid in full. The period used is generally based on a defined cash flow event that is projected to occur in the future. For an event which will result in a paydown allowing for a refinance, the discount period would be the number of months until the refinance. If an event for paydown or refinance cannot be documented, a discount period that will result in the cash flows from the borrower reducing the loan balance down to the collateral value is used. The specific reserve for loans in this category that have been deemed collateral dependent is determined using the collateral dependency method.
Loans for which there has been no rate or term modification: If there has been no change in the rate and term, a discounted cash flow analysis using the same terms would not, in most cases, yield a specific reserve allocation commensurate with loans in the general allowance account that have similar risk characteristics with respect to payment default but that have not been modified and are a troubled debt restructuring. In the determination of the specific reserve for this category of loans, the appropriate general pool loss reserve factor is used as a baseline with adjustments made based on known circumstances that may affect the collectability of the loan. Any increase
NOTES TO CONDENSED CONSOLIDATED FINANCIAL STATEMENTS
CAPITOL BANCORP LIMITED – Continued
Note D – Loans – Continued
or decrease to the baseline general allowance reserve factor is determined based on the loss experience for loans with similar risk characteristics and probabilities of default.
Loans that have interest only terms: Unless there is a specific event that can be documented which will result in the loan being paid, returned to the original contract terms or refinanced, these loans are treated as collateral-dependent and the specific reserve is based on the net value of the collateral held.
The following table summarizes loans modified as troubled debt restructurings during the three months ended March 31, 2012 (in $1,000s):
| | | Number of Contracts | | | Pre-restructuring Outstanding Recorded Investment | | | Post-restructuring Outstanding Recorded Investment | | | Loan Loss Reserve | |
| Troubled debt restructurings: | | | | | | | | | | | | |
| Loans secured by real estate: | | | | | | | | | | | | |
| Commercial | | | 52 | | | $ | 16,174 | | | $ | 16,215 | | | $ | 1,158 | |
| Residential | | | 41 | | | | 4,160 | | | | 4,384 | | | | 306 | |
| Construction, land development | | | | | | | | | | | | | | | | |
| and other | | | 22 | | | | 3,604 | | | | 2,784 | | | | 272 | |
| Total loans secured by | | | | | | | | | | | | | | | | |
| real estate | | | 115 | | | | 23,938 | | | | 23,383 | | | | 1,736 | |
| Commercial and other business- | | | | | | | | | | | | | | | | |
| purpose loans | | | 18 | | | | 895 | | | | 1,262 | | | | 123 | |
| Consumer | | | 2 | | | | 2 | | | | 39 | | | | 3 | |
| | | | | | | | | | | | | | | | | |
| Total | | | 135 | | | $ | 24,835 | | | $ | 24,684 | | | $ | 1,862 | |
Of the amounts in the table above, approximately $8.8 million, or 36%, and 53 contracts, or 39%, are substandard rated loans that were extended or renewed with no change in rate or terms, and the terms provided were not representative of current market rates for loans with similar risk characteristics. The remainder of the troubled debt restructuring pool constitutes loans where repayment terms and/or interest rates were modified, or the loan was modified to an "interest only" structure.
The following table summarizes loans modified as troubled debt restructurings in the last twelve months for which there was a payment default (i.e., when a loan becomes 90 days or more past due) during the three months ended March 31, 2012 (in $1,000s):
| | | Number of Contracts | | | Recorded Investment | |
| Troubled debt restructurings that | | | | | | |
| subsequently defaulted: | | | | | | |
| Loans secured by real estate: | | | | | | |
| Commercial | | | 11 | | | $ | 1,799 | |
| Residential | | | 6 | | | | 348 | |
| Construction, land development | | | | | | | | |
| and other | | | 1 | | | | 62 | |
| Total loans secured by | | | | | | | | |
| real estate | | | 18 | | | | 2,209 | |
| Commercial and other business- | | | | | | | | |
| purpose loans | | | 2 | | | | 105 | |
| | | | | | | | | |
| Total | | | 20 | | | $ | 2,314 | |
NOTES TO CONDENSED CONSOLIDATED FINANCIAL STATEMENTS
CAPITOL BANCORP LIMITED – Continued
Note D – Loans – Continued
The total amount of troubled debt restructurings as of March 31, 2012 and December 31, 2011 is detailed in the following tables by loan type and accrual status (in $1,000s):
| | | Troubled Debt Restructurings at March 31, 2012 | |
| | | On Non-Accrual Status | | | On Accrual Status | | | Total | |
| | | | | | | | | | |
| Loans secured by real estate: | | | | | | | | | |
| Commercial | | $ | 66,867 | | | $ | 61,512 | | | $ | 128,379 | |
| Residential (including multi-family) | | | 25,483 | | | | 22,685 | | | | 48,168 | |
| Construction, land development and | | | | | | | | | | | | |
| other land | | | 12,452 | | | | 13,315 | | | | 25,767 | |
| Total loans secured by real estate | | | 104,802 | | | | 97,512 | | | | 202,314 | |
| Commercial and other business-purpose | | | | | | | | | | | | |
| loans | | | 7,263 | | | | 10,386 | | | | 17,649 | |
| Consumer | | | 1 | | | | 118 | | | | 119 | |
| | | | | | | | | | | | | |
| Total | | $ | 112,066 | | | $ | 108,016 | | | $ | 220,082 | |
| | | Troubled Debt Restructurings at December 31, 2011 | |
| | | On Non-Accrual Status | | | On Accrual Status | | | Total | |
| | | | | | | | | | |
| Loans secured by real estate: | | | | | | | | | |
| Commercial | | $ | 65,814 | | | $ | 57,392 | | | $ | 123,206 | |
| Residential (including multi-family) | | | 27,105 | | | | 21,616 | | | | 48,721 | |
| Construction, land development and | | | | | | | | | | | | |
| other land | | | 15,475 | | | | 11,748 | | | | 27,223 | |
| Total loans secured by real estate | | | 108,394 | | | | 90,756 | | | | 199,150 | |
| Commercial and other business-purpose | | | | | | | | | | | | |
| loans | | | 8,336 | | | | 9,945 | | | | 18,281 | |
| Consumer | | | | | | | 54 | | | | 54 | |
| | | | | | | | | | | | | |
| Total | | $ | 116,730 | | | $ | 100,755 | | | $ | 217,485 | |
Note E – Discontinued Operations
During the period ended March 31, 2012, Capitol completed the following sale of a bank subsidiary (in $1,000s):
| | | | Sale | | | | |
| | Date Sold | | Proceeds | | | Gain | |
| | | | | | | | |
Mountain View Bank of Commerce(1) | January 30, 2012 | | $ | 4,060 | | | $ | 126 | |
| | (1) | Previously a majority-owned subsidiary of a bank-development subsidiary controlled by Capitol. |
NOTES TO CONDENSED CONSOLIDATED FINANCIAL STATEMENTS
CAPITOL BANCORP LIMITED – Continued
Note E – Discontinued Operations – Continued
The results of operations for Mountain View Bank of Commerce, together with the results of operations of banks sold in 2011, including Bank of Feather River, Bank of Fort Bend, Bank of Las Colinas, Bank of the Northwest, Bank of Tucson – main office, Community Bank of Rowan, Evansville Commerce Bank and Sunrise Bank, are classified as discontinued operations for the periods presented and include the following components (in $1,000s):
| | | Three Months Ended March 31 | |
| | | 2012 | | | 2011 | |
| | | | | | | |
| Interest income | | $ | 215 | | | $ | 8,802 | |
| Interest expense | | | 44 | | | | 1,426 | |
| Net interest income | | | 171 | | | | 7,376 | |
| Provision for loan losses | | | | | | | 532 | |
| Net interest income after provision for | | | | | | | | |
| loan losses | | | 171 | | | | 6,844 | |
| Noninterest income | | | 6 | | | | 773 | |
| Gain on sale of bank subsidiaries | | | 126 | | | | 4,368 | |
| Noninterest expense | | | 100 | | | | 5,658 | |
| Income before income taxes | | | 203 | | | | 6,327 | |
| Less income tax expense | | | 54 | | | | 1,579 | |
| Net income from discontinued operations | | | 149 | | | | 4,748 | |
| Net income attributable to noncontrolling | | | | | | | | |
| interests in consolidated subsidiaries | | | (12 | ) | | | (236 | ) |
| Net income from discontinued operations | | | | | | | | |
| attributable to Capitol Bancorp Limited | | $ | 137 | | | $ | 4,512 | |
| Net income from discontinued operations | | | | | | | | |
| per common share attributable to Capitol | | | | | | | | |
| Bancorp Limited | | $ | -- | | | $ | 0.14 | |
Assets and liabilities of discontinued operations as of December 31, 2011 are summarized below (in $1,000s) (none as of March 31, 2012):
| Assets: | | | | Liabilities: | | | |
| Cash and cash equivalents | | $ | 9,898 | | Noninterest-bearing | | | |
| Federal Home Loan Bank | | | | | deposits | | $ | 7,371 | |
| stock | | | 293 | | Interest-bearing deposits | | | 34,336 | |
| Portfolio loans | | | 40,060 | | Total deposits | | | 41,707 | |
| Less allowance for loan | | | | | Other liabilities | | | 2,431 | |
| losses | | | (751 | ) | | | | | |
| Net portfolio loans | | | 39,309 | | | | $ | 44,138 | |
| Premises and equipment | | | 381 | | | | | | |
| Other real estate owned | | | 1,009 | | | | | | |
| Other assets | | | 775 | | | | | | |
| | | | | | | | | | |
| | | $ | 51,665 | | | | | | |
NOTES TO CONDENSED CONSOLIDATED FINANCIAL STATEMENTS
CAPITOL BANCORP LIMITED – Continued
Note F – Fair Value
Accounting standards establish a hierarchy that prioritizes the use of fair value inputs used in valuation methodologies into the following three levels:
Level 1: Quoted prices (unadjusted) for identical assets or liabilities in active markets that the entity has the ability to access as of the measurement date.
Level 2: Significant observable inputs other than Level 1 prices such as quoted prices for similar assets or liabilities in active markets; quoted prices for identical or similar assets or liabilities in markets that are not active; or other inputs that are observable or can be derived from or corroborated by observable market data by correlation or other means.
Level 3: Significant unobservable inputs that reflect the reporting entity's own assumptions about the assumptions that market participants would use in pricing an asset or liability.
The following is a description of Capitol's valuation methodologies used to measure and disclose the fair values of its assets and liabilities on a recurring or nonrecurring basis:
| | Investment securities available for sale: Securities available for sale are recorded at fair value on a recurring basis. Fair value measurement is based on quoted prices, when available (Level 1 inputs). If quoted prices are not available, fair values are measured using independent pricing models, as Level 2 inputs. |
| | Mortgage loans held for sale: Mortgage loans held for sale are carried at the lower of aggregate cost or fair value and are measured on a nonrecurring basis. There were no mortgage loans held for sale written down to fair value at March 31, 2012. Fair value is based on independent quoted market prices, where applicable (Level 1 inputs), or the prices for other whole mortgage loans with similar characteristics, as Level 2 inputs. |
| | Loans: The Corporation does not record loans at fair value on a recurring basis. However, from time to time, nonrecurring fair value adjustments for collateral-dependent loans are recorded to reflect partial write-downs or specific reserves based on the observable market price, current appraised value of the collateral or other estimates of fair value, as Level 3 inputs. |
| | Other real estate owned: At the time of foreclosure, foreclosed properties are adjusted to estimated fair value less estimated costs to sell upon transfer from portfolio loans to other real estate owned, establishing a new carrying value. The Corporation subsequently adjusts estimated fair value of other real estate owned on a nonrecurring basis to reflect partial write-downs based on the observable market price or current appraisal data, as Level 3 inputs. |
Long-lived and indefinite-lived assets: The Corporation does not record long-lived or indefinite-lived assets at fair value on a recurring basis. However, from time to time, nonrecurring fair value adjustments to a long-lived or indefinite-lived asset are recorded to reflect partial write-downs based on the observable market price or other estimate of fair value in the event of impairment.
There were no liabilities measured at fair value on a recurring or nonrecurring basis as of March 31, 2012 and December 31, 2011.
NOTES TO CONDENSED CONSOLIDATED FINANCIAL STATEMENTS
CAPITOL BANCORP LIMITED – Continued
Note F – Fair Value – Continued
Assets measured at fair value on a recurring basis were as follows (in $1,000s):
| | | March 31, 2012 | | | December 31, 2011 | |
| | | Total | | | Significant Other Observable Inputs (Level 2) | | | Total | | | Significant Other Observable Inputs (Level 2) | |
| | | | | | | | | | | | | |
Investment securities available for sale:(1) | | | | | | | | | | | | |
| United States treasury | | $ | 3,503 | | | $ | 3,503 | | | $ | 4,013 | | | $ | 4,013 | |
| United States government agency | | | 9,035 | | | | 9,035 | | | | 9,819 | | | | 9,819 | |
| Mortgage-backed | | | 10,443 | | | | 10,443 | | | | 10,972 | | | | 10,972 | |
| Municipalities | | | 108 | | | | 108 | | | | 278 | | | | 278 | |
| | | | | | | | | | | | | | | | | |
| | | $ | 23,089 | | | $ | 23,089 | | | $ | 25,082 | | | $ | 25,082 | |
| (1) | Level 2 inputs for investment securities available for sale include pricing models from independent pricing sources with reasonable levels of price transparency. |
Assets measured at fair value on a nonrecurring basis were as follows (in $1,000s):
| | | March 31, 2012 | | | December 31, 2011 | |
| | | Total | | | Significant Unobservable Inputs (Level 3) | | | Total | | | Significant Unobservable Inputs (Level 3) | |
| | | | | | | | | | | | | |
Impaired loans(1) | | $ | 144,529 | | | $ | 144,529 | | | $ | 181,308 | | | $ | 181,308 | |
| | | | | | | | | | | | | | | | | |
Other real estate owned(2) | | $ | 105,966 | | | $ | 105,966 | | | $ | 100,463 | | | $ | 100,463 | |
| (1) | Level 3 inputs for impaired loans include appraised value of the applicable collateral or other unobservable estimates of fair value. |
| (2) | Level 3 inputs for other real estate owned include appraised value of the foreclosed property or other unobservable estimates of fair value. Fair value is reduced by estimated costs to sell the properties. |
Updated appraisals are generally obtained when it has been determined that a collateral-dependent loan has become impaired or when it is likely a loan secured by real estate will be foreclosed. Adjustments to the loan's carrying value (or requirements for an allocation of the allowance for loan losses) are made, when appropriate, after review of appraisal data or, in the absence of a recent appraisal, if market conditions significantly decline further. The timing of when a collateral-dependent loan should be classified as a nonperforming credit is contingent upon several factors, including the performance of the loan, payment history and/or results of the bank's review of updated borrower financial information.
When a borrower's performance has deteriorated (for example, the borrower has become delinquent on required payments, the borrower's updated financial information received indicates adverse financial trends or sales/leasing activity is less than expected in the case of multi-unit properties), the loan will be downgraded and, if appropriate, an updated appraisal will be ordered. In the period between a loan being recognized as impaired and receipt of an updated appraisal, the loan will be included within loss contingency pools, in conjunction with estimating the bank's requirements for its allowance for loan losses. Upon receipt and review of updated appraisal data and after any further fair value analysis is completed, the loan will be further evaluated for appropriate write-down. Negative differences between appraised value, less the estimated cost to sell, and the related carrying value of the loans are charged to the allowance for loan losses, as a partial write-down/charge-off, on a timely basis after the appraisal has been received and reviewed. Occasionally, additional potential loss amounts may be included if circumstances exist
NOTES TO CONDENSED CONSOLIDATED FINANCIAL STATEMENTS
CAPITOL BANCORP LIMITED – Continued
Note F – Fair Value – Continued
which may further adversely impact fair value estimates. Internally-developed evaluations may be used when the amount of a loan is less than $250,000. Internally-prepared evaluations may also be used when the most recent appraisal date is within a year to estimate the current effect of economic conditions or deterioration. Updated fair value information is generally obtained at least annually for collateral-dependent loans and other real estate owned.
Comparative carrying values and estimated fair values of financial instruments based upon the accounting guidance set forth in Accounting Standards Codification 825-10 were as follows (in $1,000s):
| | | | | | March 31, 2012 | | | December 31, 2011 | |
| | | Level Used to Measure Estimated Fair Value | | | Carrying Value | | | Estimated Fair Value | | | Carrying Value | | | Estimated Fair Value | |
| Financial assets: | | | | | | | | | | | | | | | |
| Cash | | | 1 | | | $ | 58,714 | | | $ | 58,714 | | | $ | 43,613 | | | $ | 43,613 | |
| Cash equivalents | | | 2 | | | | 321,332 | | | | 321,332 | | | | 343,611 | | | | 343,611 | |
| Loans held for sale | | | 2 | | | | 814 | | | | 814 | | | | 2,936 | | | | 2,936 | |
| Investment securities: | | | | | | | | | | | | | | | | | | | | |
| Available for sale | | | 2 | | | | 23,089 | | | | 23,089 | | | | 25,082 | | | | 25,082 | |
| Held for long-term investment | | | 3 | | | | 2,722 | | | | 2,722 | | | | 2,737 | | | | 2,737 | |
| | | | | | | | 25,811 | | | | 25,811 | | | | 27,819 | | | | 27,819 | |
Federal Home Loan Bank and Federal Reserve Bank stock | | | 2 | | | | 13,401 | | | | 13,401 | | | | 13,514 | | | | 13,514 | |
| Portfolio loans: | | | | | | | | | | | | | | | | | | | | |
| Loans secured by real estate: | | | | | | | | | | | | | | | | | | | | |
| Commercial | | | 3 | | | | 935,932 | | | | 933,402 | | | | 973,045 | | | | 969,531 | |
| Residential (including multi-family) | | | 3 | | | | 340,656 | | | | 340,196 | | | | 363,802 | | | | 363,233 | |
Construction, land development and other land | | | 3 | | | | 102,824 | | | | 102,794 | | | | 117,736 | | | | 117,714 | |
| Total loans secured by real estate | | | | | | | 1,379,412 | | | | 1,376,392 | | | | 1,454,583 | | | | 1,450,478 | |
Commercial and other business-purpose loans | | | 3 | | | | 176,825 | | | | 176,797 | | | | 192,851 | | | | 192,880 | |
| Consumer | | | 3 | | | | 12,979 | | | | 13,670 | | | | 13,813 | | | | 14,010 | |
| Other | | | 3 | | | | 2,903 | | | | 2,870 | | | | 2,962 | | | | 2,727 | |
| Total portfolio loans | | | | | | | 1,572,119 | | | | 1,569,729 | | | | 1,664,209 | | | | 1,660,095 | |
| Less allowance for loan losses | | | 3 | | | | (86,799 | ) | | | (86,799 | ) | | | (92,529 | ) | | | (92,529 | ) |
| Net portfolio loans | | | | | | | 1,485,320 | | | | 1,482,930 | | | | 1,571,680 | | | | 1,567,566 | |
| | | | | | | | | | | | | | | | | | | | | |
| Financial liabilities: | | | | | | | | | | | | | | | | | | | | |
| Deposits: | | | | | | | | | | | | | | | | | | | | |
| Noninterest-bearing | | | 1 | | | | 369,320 | | | | 369,320 | | | | 348,817 | | | | 348,817 | |
| Interest-bearing: | | | | | | | | | | | | | | | | | | | | |
| Demand accounts | | | 2 | | | | 550,693 | | | | 550,693 | | | | 533,432 | | | | 533,432 | |
| Time certificates of less than $100,000 | | | 3 | | | | 437,840 | | | | 443,550 | | | | 492,530 | | | | 497,931 | |
| Time certificates of $100,000 or more | | | 3 | | | | 573,509 | | | | 578,837 | | | | 635,068 | | | | 639,504 | |
| Total interest-bearing | | | | | | | 1,562,042 | | | | 1,573,080 | | | | 1,661,030 | | | | 1,670,867 | |
| Total deposits | | | | | | | 1,931,362 | | | | 1,942,400 | | | | 2,009,847 | | | | 2,019,684 | |
| Notes payable and other borrowings | | | 3 | | | | 50,067 | | | | 50,790 | | | | 60,178 | | | | 61,351 | |
| Subordinated debentures | | | 3 | | | | 149,181 | | | | 124,691 | | | | 149,156 | | | | 123,452 | |
NOTES TO CONDENSED CONSOLIDATED FINANCIAL STATEMENTS
CAPITOL BANCORP LIMITED – Continued
Note F – Fair Value – Continued
Estimated fair values of financial assets and liabilities in the preceding table are based upon a comparison of current interest rates on financial instruments and the timing of related scheduled cash flows to the estimated present value of such cash flows using current estimated market rates of interest (unless quoted market values or other fair value information is more readily available, except certain subordinated debentures, as indicated above, for which the fair value is based on the liquidation or principal amount outstanding). For example, the estimated fair value of portfolio loans is determined based on discounted cash flow computations. Similarly, the estimated fair values of time deposits, notes payable and other borrowings were determined through discounted cash flow computations. Such estimates of fair value are not intended to represent portfolio liquidation value and, accordingly, only represent an estimate of fair value based on current financial reporting requirements.
Given current economic conditions, the majority of the loan portfolio is not readily marketable and, accordingly, market prices may not exist. Capitol has not attempted to market the loan portfolio to potential buyers, if any exist, to determine the fair value of those instruments. Since negotiated prices, if any, in illiquid markets depend upon the then-present motivations of the buyer and seller, it is reasonable to assume that potential sales prices could vary widely from any estimate of fair value made without the benefit of negotiations. Additionally, changes in market interest rates commensurate with risk may dramatically impact the value of financial instruments at any time. Accordingly, fair value measurements for loans included in the preceding table are unlikely to represent the instruments' liquidation values.
Note G – Stock Options
Stock option activity is summarized as follows:
| | | Number Outstanding | | | Exercise Price Range | | | Weighted Average Exercise Price | |
| | | | | | | | | | |
| Outstanding at January 1, 2012 | | | 2,163,434 | | | $ | 0.06 | | to | | $ | 46.20 | | | $ | 13.61 | |
| Cancelled or expired | | | (106,662 | ) | | | 0.06 | | to | | | 34.84 | | | | 14.57 | |
| | | | | | | | | | | | |
| Outstanding at March 31, 2012 | | | 2,056,772 | | | $ | 0.06 | | to | | $ | 46.20 | | | $ | 13.56 | |
There were no stock options granted during the three months ended March 31, 2012 and 2011. Share-based compensation expense relating to stock options for the three months ended March 31, 2012 and 2011 approximated $23,000 and $2,000, respectively.
As of March 31, 2012, stock options outstanding had a weighted average remaining contractual life of 2.40 years and, due to the exercise price being greater than the fair value of Capitol's common stock, had no intrinsic value at that date. The following table summarizes stock options outstanding segregated by exercise price range as of March 31, 2012:
| | | | | | | Weighted Average |
Exercise Price Range | | | Number Outstanding | | | Exercise Price | | Remaining Contractual Life |
| | | | | | | | | |
| $ | 0.01 to 5.99 | | | | 1,156,050 | | | $ | 0.75 | | 3.34 years |
| $ | 6.00 to 9.99 | | | | 69,521 | | | | 6.04 | | 3.85 years |
| $ | 20.00 to 24.99 | | | | 196,200 | | | | 21.91 | | 2.44 years |
| $ | 30.00 to 34.99 | | | | 300,005 | | | | 32.01 | | 0.23 years |
| $ | 35.00 or more | | | | 334,996 | | | | 37.91 | | 0.80 years |
| | | | | | | | | | | | |
| Total outstanding | | | | 2,056,772 | | | $ | 13.56 | | |
NOTES TO CONDENSED CONSOLIDATED FINANCIAL STATEMENTS
CAPITOL BANCORP LIMITED – Continued
Note H – Net Loss Per Common Share Attributable to Capitol Bancorp Limited
Computations of net loss per common share were based on the following (in 1,000s) for the periods ended March 31:
| | | Three Months Ended March 31 | |
| | | 2012 | | | 2011 | |
| | | | | | | |
Numerator—net income (loss) attributable to Capitol Bancorp Limited for the period | | $ | (7,912 | ) | | $ | 289 | |
| | | | | | | | | |
| Denominator: | | | | | | | | |
Weighted average number of common shares outstanding, excluding unvested restricted shares of common stock (denominator for basic earnings per share) | | | 41,020 | | | | 32,164 | |
| | | | | | | | | |
| Effect of dilutive securities: | | | | | | | | |
| Unvested restricted shares of common stock | | | -- | | | | 711 | |
| | | | | | | | | |
| Denominator for diluted earnings per share— | | | | | | | | |
Weighted average number of common shares and potential dilution | | | 41,020 | | | | 32,875 | |
| | | | | | | | | |
Number of antidilutive stock options excluded from diluted net loss per share computation | | | 2,057 | | | | 1,716 | |
| | | | | | | | | |
Number of antidilutive unvested restricted shares excluded from basic and diluted net loss per share computation | | | 18 | | | | 30 | |
| | | | | | | | | |
Number of antidilutive warrants excluded from diluted net loss per share computation | | | 1,325 | | | | 1,325 | |
| | | | | | | | | |
Net income (loss) per common share attributable to Capitol Bancorp Limited: | | | | | | | | |
| From continuing operations | | $ | (0.19 | ) | | $ | (0.13 | ) |
| From discontinued operations | | | -- | | | | 0.14 | |
| | | | | | | | | |
Total net income (loss) per common share attributable to Capitol Bancorp Limited | | $ | (0.19 | ) | | $ | 0.01 | |
Note I – Trust-Preferred Securities and Debt Extinguishment
In 2009, the Corporation commenced the deferral of interest payments on its various trust-preferred securities, as is permitted under the terms of the securities, in order to conserve cash and capital resources. The payment of interest on those securities may be deferred for periods up to five years. During such deferral periods, Capitol is prohibited from paying dividends on its common stock (subject to certain exceptions) and is further restricted by Capitol's written agreement with the Federal Reserve Bank of Chicago, which prohibits both payment of interest on the trust-preferred securities and cash dividends without prior written approval by that agency. Accrued interest payable on such securities approximated $30.3 million and $27.6 million at March 31, 2012 and December 31, 2011, respectively. Holders of the trust-preferred securities recognize current taxable income relating to the deferred interest payments.
NOTES TO CONDENSED CONSOLIDATED FINANCIAL STATEMENTS
CAPITOL BANCORP LIMITED – Continued
Note I – Trust-Preferred Securities and Debt Extinguishment – Continued
On January 31, 2011, Capitol accepted for exchange 1,180,602 of the 2,530,000 outstanding shares of trust-preferred securities of Capitol Trust I and 773,934 of the 1,454,100 outstanding shares of trust-preferred securities of Capitol Trust XII and, pursuant to the related exchange offer, issued approximately 19.5 million previously-unissued shares of Capitol's common stock. This exchange resulted in the retirement of approximately $19.5 million aggregate liquidation amount of the trust-preferred securities on a combined basis and eliminated approximately $3.4 million of accrued interest payable associated with the retired securities, which collectively increased Capitol's equity and regulatory capital by $21.9 million, including a gain on the transaction of approximately $16.9 million.
Note J – Pending Sale of Subsidiary Banks
In addition to completed sales of certain bank subsidiaries (see Note E), Capitol has entered into definitive agreements to sell its interests (or controlling interests held by bank-development subsidiaries) in the following institutions which are pending: Bank of Maumee, Bank of Michigan and First Carolina State Bank. The financial statement impact of the potential divestiture of these institutions is set forth in the accompanying pro forma condensed consolidated financial statements on pages 50 and 51 of this document.
The remaining pending bank sales are subject to regulatory approval and other significant contingencies.
Note K – Regulatory and Operating Matters
In September 2009, Capitol and its second-tier bank holding companies entered into an agreement with the Federal Reserve Bank of Chicago (the "Reserve Bank") under which Capitol agreed to refrain from the following actions without the prior written consent of the Reserve Bank: (i) declare or pay dividends; (ii) receive dividends or any other form of payment representing a reduction in capital from Michigan Commerce Bank, or from any of its subsidiary institutions that are subject to any restriction by the institution's federal or state regulator that limits the payment of dividends or other intercorporate payments; (iii) make any distributions of interest, principal, or other sums on subordinated debentures or trust-preferred securities; (iv) incur, increase or guarantee any debt; or (v) purchase or redeem any shares of the stock of Capitol, the second-tier bank holding companies, nonbank subsidiaries or any of the subsidiary banks that are held by shareholders other than Capitol.
In addition, Capitol agreed to: (i) submit to the Reserve Bank a written plan to maintain sufficient capital at Capitol on a consolidated basis and at Michigan Commerce Bank (as Capitol's largest bank subsidiary and a separate legal entity on a stand-alone basis); (ii) notify the Reserve Bank no more than 30 days after the end of any quarter in which Capitol's consolidated or Michigan Commerce Bank's capital ratios fall below the approved capital plan's minimum ratios, as well as if any subsidiary institution's ratios fall below the minimum ratios required by the institution's federal or state regulator; (iii) review and revise its allowance for loan losses ("ALLL") methodology for loans held by Capitol and submit to the Reserve Bank a written program for maintenance of an adequate ALLL for loans held by Capitol; (iv) take all necessary actions to ensure each of its subsidiary institutions comply with Federal Reserve regulations; (v) refrain from increasing any fees or charging new fees to any subsidiary institution without the prior written consent of the Reserve Bank; (vi) submit to the Reserve Bank a written plan to enhance the consolidated organization's risk management practices, a strategic plan to improve the consolidated organization's operating results and overall condition and a cash flow projection; (vii) comply with laws and regulations regarding senior executive officer positions and severance payments; and (viii) provide quarterly reports to the Reserve Bank regarding these undertakings.
Many of Capitol's bank subsidiaries have entered into formal agreements (as well as informal agreements) with their applicable regulatory agencies. Those agreements provide for certain restrictions and other guidelines and/or limitations to be followed by the banks.
NOTES TO CONDENSED CONSOLIDATED FINANCIAL STATEMENTS
CAPITOL BANCORP LIMITED – Continued
Note K – Regulatory and Operating Matters – Continued
The FDIC may issue Prompt Corrective Action Notifications ("PCAN") to banking subsidiaries falling below the "adequately-capitalized" regulatory-capital classification, and subsequently may issue Prompt Correction Action Directives ("PCAD"). PCADs may be issued when a bank, which has previously received a PCAN, has submitted two consecutive capital restoration plans which have been rejected by the FDIC.
Capitol's banking subsidiaries which have received a PCAD are as follows as of March 2012 (listed in descending order based on total assets):
| Michigan Commerce Bank | | |
| Bank of Las Vegas | | |
| Sunrise Bank of Arizona | | |
| Sunrise Bank | | |
| First Carolina State Bank | | |
| Central Arizona Bank | | |
| Sunrise Bank of Albuquerque | | |
1st Commerce Bank | | |
| Pisgah Community Bank | | |
These banks are striving to develop and implement capital restoration plans which may be acceptable to the FDIC. Typically, a capital plan is not deemed acceptable by the FDIC until receipt of the planned capital funds is imminent.
Regulatory capital matters are set forth in Note L.
On July 21, 2010, the Dodd-Frank Wall Street Reform and Consumer Protection Act (the "Dodd-Frank Act") was signed into law and is significantly impacting the regulation of financial institutions and the financial services industry. The Dodd-Frank Act includes provisions affecting large and small financial institutions alike, including several provisions that will profoundly affect how community banks, thrifts and smaller bank holding companies will be regulated in the future. Among other things, these provisions abolished the Office of Thrift Supervision and transferred its functions to other federal banking agencies, relaxed rules regarding interstate branching, allowed financial institutions to pay interest on business checking accounts, changed the scope of FDIC insurance coverage and imposes new capital requirements on bank holding companies, including removing trust-preferred securities as a permitted component of a holding company's Tier 1 capital after a three-year phase-in period beginning January 1, 2013. The Dodd-Frank Act also established the Bureau of Consumer Financial Protection as an independent entity within the Federal Reserve, which was given the authority to promulgate consumer protection regulations applicable to all entities offering consumer financial services or products, including banks. Additionally, the Dodd-Frank Act includes a series of provisions covering mortgage loan origination standards affecting, among other things, originator compensation, minimum repayment standards and prepayments. Management is continuing to evaluate the provisions of the Dodd-Frank Act and assess its probable impact on the Corporation's business, financial condition and results of operations. However, the ultimate effect of the Dodd-Frank Act on the financial services industry in general, and on the Corporation in particular, currently remains uncertain.
One particularly important aspect of the Dodd-Frank Act (as amended) is that certain trust-preferred securities issued by bank holding companies with total assets less than $10 billion, such as Capitol, will be permitted to be included as an element of qualifying capital for regulatory capital-adequacy purposes. Accordingly, Capitol's trust-preferred securities may be included in regulatory capital measurements in the future, subject to certain limitations, although none of those securities are currently included.
In July 2011, Capitol adopted a Tax Benefits Preservation Plan (the "Plan") designed to preserve substantial tax assets. Capitol's tax attributes include net operating losses that could be utilized in certain circumstances to offset taxable income and reduce federal income tax liability. Capitol's ability to use these tax attributes would be
NOTES TO CONDENSED CONSOLIDATED FINANCIAL STATEMENTS
CAPITOL BANCORP LIMITED – Continued
Note K – Regulatory and Operating Matters – Continued
substantially limited if there were an "ownership change" as defined under Section 382 of the Internal Revenue Code and related Internal Revenue Service pronouncements. As part of the Plan, Capitol's board of directors declared a dividend of one preferred share purchase right for each outstanding share of its common stock distributable to shareholders of record as of August 1, 2011, as well as to holders of common stock issued after that date, which would only be activated if triggered under the Plan.
Note L – Regulatory Capital Matters
The following table summarizes the amounts (in $1,000s) and related ratios of Capitol's consolidated regulatory capital position:
| | | March 31, | | | | December 31, | |
| | | 2012 | | | | 2011 | |
| Tier 1 capital to average adjusted total assets: | | | | | | | | | |
| Minimum required amount | | ≥ | $ | 84,709 | | | | ≥ | $ | 92,356 | |
| Actual amount | | | $ | (121,513 | ) | | | | $ | (109,146 | ) |
| Ratio | | | | (5.74 | )% | | | | | (4.73 | )% |
| | | | | | | | | | | | |
| Tier 1 capital to risk-weighted assets: | | | | | | | | | | | |
Minimum required amount(1) | | ≥ | $ | 63,789 | | | | ≥ | $ | 68,615 | |
| Actual amount | | | $ | (121,513 | ) | | | | $ | (109,146 | ) |
| Ratio | | | | (7.62 | )% | | | | | (6.36 | )% |
| | | | | | | | | | | | |
Combined Tier 1 and Tier 2 capital to risk- weighted assets: | | | | | | | | | | | |
Minimum required amount(2) | | ≥ | $ | 127,578 | | | | ≥ | $ | 137,231 | |
| Actual amount | | | $ | (121,513 | ) | | | | $ | (109,146 | ) |
| Ratio | | | | (7.62 | )% | | | | | (6.36 | )% |
| (1) | The minimum required ratio of Tier 1 capital to risk-weighted assets to be considered "adequately-capitalized" is 4%. |
| (2) | The minimum required ratio of Tier 1 and Tier 2 capital to risk-weighted assets to be considered "adequately-capitalized" is 8%. |
Capitol's total risk-based capital ratio at March 31, 2012 and December 31, 2011 was materially and adversely impacted by the exclusion of approximately $169.9 million and $171.5 million, respectively, of previously-qualifying Tier 2 capital, inasmuch as Tier 2 capital is limited to 100% of Tier 1 capital, primarily trust-preferred securities and a portion of the allowance for loan losses. The Tier 1 capital deficit resulted primarily from operating losses. Capitol's Tier 1 capital will need to increase to a positive level in order to allow for the inclusion of trust-preferred securities in Tier 2 capital for regulatory capital computation purposes.
The preceding summary indicates that Capitol, on a consolidated basis, was classified as less than "adequately-capitalized" at March 31, 2012 for regulatory purposes. In addition, several of its bank subsidiaries had capital levels resulting in classification as "undercapitalized" or "significantly-undercapitalized" at that date. Banks and bank holding companies which are less than "adequately-capitalized" are subject to increased regulatory oversight, requirements and limitations. Regarding banks classified as "undercapitalized" or "significantly-undercapitalized," or otherwise noncompliant with formal regulatory agreements, management is taking appropriate action to improve such capital classifications and related compliance in the future.
Regulatory capital ratios of the banks are set forth on page 44 on this document.
PART I, ITEM 2
AND RESULTS OF OPERATIONS
The following discussion and analysis is intended as a review of significant factors affecting the financial condition and results of operations of Capitol for the periods indicated, excluding the effect of discontinued operations for the periods presented. The discussion should be read in conjunction with the condensed consolidated financial statements and the notes thereto presented elsewhere herein. In addition to historical information, the following Management's Discussion and Analysis of Financial Condition and Results of Operations contains forward-looking statements that involve risks and uncertainties, some of which are material to Capitol and its subsidiaries. Capitol's actual results could differ significantly from those anticipated in these forward-looking statements as a result of certain factors discussed in this report. Please refer to the commentary regarding forward-looking statements appearing on page 2 of this document.
Financial Condition
Total assets approximated $2.1 billion at March 31, 2012 and $2.2 billion at December 31, 2011. The balance sheets include total assets of Capitol and its consolidated subsidiaries (in $1,000s) as follows:
| | | March 31, 2012 | | | December 31, 2011 | |
| Arizona Region: | | | | | | |
| Central Arizona Bank | | $ | 43,417 | | | $ | 41,976 | |
| Sunrise Bank of Albuquerque | | | 57,252 | | | | 60,063 | |
| Sunrise Bank of Arizona | | | 283,193 | | | | 303,513 | |
| Arizona Region Total | | | 383,862 | | | | 405,552 | |
| | | | | | | | | |
| Colorado Region: | | | | | | | | |
Mountain View Bank of Commerce(1) | | | | | | | 51,665 | |
| | | | | | | | | |
| Great Lakes Region: | | | | | | | | |
| Bank of Maumee | | | 35,338 | | | | 33,495 | |
| Bank of Michigan | | | 87,420 | | | | 85,664 | |
| Capitol National Bank | | | 158,178 | | | | 153,938 | |
| Indiana Community Bank | | | 110,897 | | | | 119,372 | |
| Michigan Commerce Bank | | | 719,408 | | | | 776,289 | |
| Great Lakes Region Total | | | 1,111,241 | | | | 1,168,758 | |
| | | | | | | | | |
| Nevada Region: | | | | | | | | |
1st Commerce Bank | | | 26,044 | | | | 26,375 | |
| Bank of Las Vegas | | | 309,121 | | | | 318,174 | |
| Nevada Region Total | | | 335,165 | | | | 344,549 | |
| | | | | | | | | |
| Northwest Region: | | | | | | | | |
| High Desert Bank | | | 31,348 | | | | 31,020 | |
| | | | | | | | | |
| Southeast Region: | | | | | | | | |
| First Carolina State Bank | | | 80,047 | | | | 85,169 | |
| Pisgah Community Bank | | | 27,292 | | | | 28,120 | |
| Sunrise Bank | | | 79,523 | | | | 81,119 | |
| Southeast Region Total | | | 186,862 | | | | 194,408 | |
| | | | | | | | | |
| Parent company and other, net | | | 10,261 | | | | 9,313 | |
| | | | | | | | | |
| Consolidated totals | | | 2,058,739 | | | | 2,205,265 | |
| Less discontinued operations | | | | | | | (51,665 | ) |
| | | | | | | | | |
| Consolidated totals—continuing operations | | $ | 2,058,739 | | | $ | 2,153,600 | |
| (1) | Capitol sold its ownership in Mountain View Bank of Commerce effective January 30, 2012. This bank's operations are included in Capitol's consolidated totals up to the date of sale as part of discontinued operations. |
Total assets decreased $146.5 million during the three months ended March 31, 2012, of which $51.7 million related to the bank subsidiary sold during the period.
MANAGEMENT'S DISCUSSION AND ANALYSIS OF FINANCIAL CONDITION
AND RESULTS OF OPERATIONS – Continued
Financial Condition – Continued
Portfolio loans, the single largest asset category (76% of total assets at March 31, 2012), decreased during the three months ended March 31, 2012 by approximately $92.1 million, compared to a decrease of about $87.4 million during the corresponding period of 2011. Capitol's banks operate in regions where the economies are beginning to show some signs of recovery, but are still challenged with continued relative weakness in real estate values in their banking regions and markets. The portfolio decrease is attributed largely to shrinkage due in part to disciplined pricing and portfolio management, as the banks continue to deploy available options to preserve liquidity and bolster regulatory capital levels, while the regional and national economies begin to recover and real estate values begin to stabilize. Because portfolio loans comprise the largest portion of assets, most of this section of the narrative is devoted to loans and asset quality.
Geographic diversification of Capitol's balance sheet continues to play an important role in risk management and the road to improved profitability. Prior to 1996, all of Capitol's banking operations were located in Michigan. At March 31, 2012, Capitol's primary geographic banking regions include Phoenix, Arizona, Las Vegas, Nevada and the Great Lakes Region, dominated by the largest banking affiliate, located in Lansing, Michigan. As of March 31, 2012, 56% of the consolidated loan portfolio is within the Great Lakes Region (55% at December 31, 2011) and 44% is at banks located in other regions of the country (45% at December 31, 2011). While concentration levels remain somewhat static compared to the end of 2011, the geographic mix of portfolio loans has changed slightly over the past few years as Capitol has divested of banks. Management believes that these banking regions offer the Corporation the best opportunity for improved performance and resource allocation.
The consolidated allowance for loan losses at March 31, 2012 approximated $86.8 million or 5.52% of total portfolio loans, a decrease from the 5.56% ratio at the beginning of the year (excluding discontinued operations), resulting from some improvement in economic conditions and positive changes in asset quality. The consolidated allowance for loan losses at March 31, 2012 decreased $5.7 million from the beginning of the year, excluding discontinued operations, as the Corporation continued to reduce its loan portfolio in conjunction with its balance sheet deleveraging strategy and as a result of general loan curtailments. The decrease in the allowance for loan losses is also somewhat reflective of the effects of stabilizing asset quality, as levels of nonperforming loans have declined.
Last year, the Corporation received regulatory guidance regarding the methodology used to determine the allowance for loan losses at its three largest banks. The guidance recommended that the banks' methodology be modified such that higher loss rates, in part derived from loan charge-off history on the substandard risk-rated loan pools, be applied to the "watch" rated loans as well as the "pass" (or acceptable credit quality) rated loan pool, the largest category of loans in the banks' portfolios. Corporate management, in ongoing dialogue concerning this guidance for determining the allowance for loan losses, evaluated other methodologies permissible in accordance with regulatory pronouncements. As of December 31, 2011 and March 31, 2012, Capitol applied a new technique to calculate the historical net charge-off rates using migration analysis to determine the allowance for loan losses at two of its three largest banks. In calculating the annualized net charge-off rates, the banks generally applied a twenty-four month look back period of the loan portfolio, and accumulated losses over the most recent eighteen-month period. The time periods for the loan portfolio look back period were selected in a manner as to reach a confidence interval such that 85-90% of the incurred historical losses captured under the migration approach had been accounted for in the analysis. This migration analysis approach to calculating annualized net charge-off rates was validated by an independent professional accounting and consulting firm, and was also reviewed on a preliminary basis by the banks' regulators without notable issue. Based on management's analysis and judgment, and supported by an external firm's validation results, the Corporation believes that the methodology used to determine the allowance for loan losses meets both regulatory guidance and requirements under generally accepted accounting principles, and represents management's best estimate of probable incurred losses in the consolidated loan portfolio as of March 31, 2012.
MANAGEMENT'S DISCUSSION AND ANALYSIS OF FINANCIAL CONDITION
AND RESULTS OF OPERATIONS – Continued
Financial Condition – Continued
At March 31, 2012, the Corporation's largest banking affiliate modeled its allowance for loan losses using three techniques to calculate historical loan loss experience, two using migration analysis and loss accumulation periods of eighteen and thirty-three months, and the other using the previously discussed method as per the regulatory guidance received last year. The three calculations produced an allowance for loan losses level that resulted in excess reserves ranging from $11.6 million to $23 million at March 31, 2012, with the $11.6 million in excess reserves resulting from the amount calculated based on regulatory guidance received last year. As it is currently operating under a Consent Order, written approval is required for the bank to release any portion of its $11.6 million in excess reserves and record a negative provision for loan losses. As of April 2012, written approval had not been received. The bank has identified the $11.6 million portion of its allowance for loan losses at March 31, 2012 as unallocated.
The methodology used in the determination of the allowance for loan losses at March 31, 2012 for the remaining banking affiliates has remained consistent with no changes to the techniques used to calculate historical loan loss experience, and has been incorporated in the consolidated provision for loan losses recorded for the quarter ended March 31, 2012.
Loan charge-offs for the interim 2012 period, which decreased significantly compared to the same period in 2011, are not necessarily indicative of future charge-off levels because of the variability in asset quality and resolution of nonperforming loans. The significant level of the provision for loan losses in the comparable 2011 interim period related primarily to Michigan, Arizona and Nevada banks, and were the result of higher levels of nonperforming loans and a challenging and uncertain economic climate.
Total nonperforming loans approximated $198.4 million at March 31, 2012 (excluding discontinued operations). Of that total, $88.6 million or 44.7% (including some loans carried at the parent level) were originated by banks located within the Great Lakes Region, primarily in Michigan. Nonperforming loans decreased significantly during the three-month period, including decreases of $19.7 million within the Great Lakes Region and $6.7 million within the Nevada Region.
In response to the elevated level of nonperforming loans, higher levels of allowances for loan losses have been established for the Great Lakes Region, the Southeast Region and the Nevada Region, approximating 5.76%, 7.44% and 5.63% of portfolio loans, respectively, for each of the regions on a combined basis as of March 31, 2012. The allowance for loan losses levels reach as high as 10.92% at Pisgah Community Bank, 8.55% at 1st Commerce Bank, 7.27% at First Carolina State Bank and 7.18% at Michigan Commerce Bank. Those ratios can be contrasted with some other banks and geographic regions within the Corporation with lower levels of nonperforming loans.
Nonperforming loans decreased $25.4 million or 11.4% during the three months ended March 31, 2012, compared to a decrease of $20.4 million or 6.9% in the corresponding period of 2011. Nonperforming loans have decreased for seven consecutive quarters. Nonperforming assets decreased $20.1 million for the three months ended March 31, 2012, compared to a decrease of $16.9 million in the corresponding period of 2011. Management believes the overall decreases primarily demonstrate signs of stability in several of Capitol's key markets; however, there can be no assurance that future operating results will continue to reflect these recent trends.
The allowance for loan losses as a percentage of nonperforming loans approximated 43.7% at March 31, 2012, compared to 41.3% at the beginning of the year (excluding operations discontinued in 2011). As previously discussed, the allowance for loan losses is an estimate based on management's judgment at the balance-sheet date. Levels of nonperforming loans may fluctuate at balance-sheet dates by amounts which are not commensurate with the ratio of the allowance for loan losses or the allowance coverage ratio of nonperforming loans (i.e., the allowance for loan losses as a percentage of nonperforming loans). Several factors may contribute to this occurrence. For example, estimated losses relating to impaired collateral-dependent loans are generally reflected as direct write-downs to those loans as charge-offs and, accordingly, there is no related allowance for loan losses allocation necessary. Further, some collateral-dependent loans may have minimal, or no, loss potential which would negate a computational comparison between the allowance for loan losses and such nonperforming loans.
MANAGEMENT'S DISCUSSION AND ANALYSIS OF FINANCIAL CONDITION
AND RESULTS OF OPERATIONS – Continued
Financial Condition – Continued
While recent reductions in nonperforming loans and other nonperforming assets are encouraging, future changes in asset quality remain uncertain. Because bank subsidiaries which were sold during 2011 and the interim 2012 period had relatively more favorable asset quality than the remaining banks, nonperforming assets increased slightly as a percentage of consolidated portfolio loans and total assets, despite the most recent decreases in the amount of nonperforming assets.
Nonperforming loans at March 31, 2012 approximated 12.6% of total portfolio loans, a decrease from the December 31, 2011 ratio of 13.5% (excluding discontinued operations). Of the nonperforming loans at March 31, 2012, about 91% were secured by real estate. Those loans, when originated, had appropriate loan-to-value ratios based upon real estate market conditions at that time and, accordingly, had loss exposure which would have been expected to be minimal; however, underlying real estate values depend upon current economic conditions and liquidation strategies as markets deteriorate. Most other nonperforming loans were generally secured by other business assets. Nonperforming loans at March 31, 2012 were in various stages of resolution which management believes are adequately collateralized or otherwise appropriately considered in its determination of the adequacy of the allowance for loan losses.
Due to local, regional and national economic conditions, there is uncertainty in future real estate values, appraisal data and the resulting potential impact on valuation of collateral-dependent loans and other real estate owned. The fair value measurement of collateral-dependent loans and other real estate owned is dependent upon appraisals of the underlying property value. Management cautiously and diligently monitors real estate values when evaluating appraisals or its internal evaluations of property values.
Updated appraisals are generally obtained when it has been determined that a collateral-dependent loan has become impaired or when it is likely a loan secured by real estate will be foreclosed. Adjustments to the loan's carrying value (or requirements for an allocation of the allowance for loan losses) are made, when appropriate, after review of appraisal data or, in the absence of a recent appraisal, if market conditions significantly decline further. The timing of when a collateral-dependent loan should be classified as a nonperforming credit is contingent upon several factors, including the performance of the loan, payment history and/or results of the bank's review of updated borrower financial information.
When a borrower's performance has deteriorated (for example, the borrower has become delinquent on required payments, the borrower's updated financial information received indicates adverse financial trends or sales/leasing activity is less than expected in the case of multi-unit properties), the loan will be downgraded and, if appropriate, an updated appraisal will be ordered. In the period between a loan being recognized as impaired and receipt of an updated appraisal, the loan will be included within loss contingency pools, in conjunction with estimating the bank's requirements for its allowance for loan losses. Upon receipt and review of updated appraisal data and after any further fair value analysis is completed, the loan will be further evaluated for appropriate write-down. Negative differences between appraised value, less the estimated cost to sell, and the related carrying value of the loans are charged to the allowance for loan losses, as a partial write-down/charge-off, on a timely basis after the appraisal has been received and reviewed. Occasionally, additional potential loss amounts may be included if circumstances exist which may further adversely impact fair value estimates. Internally developed evaluations may be used when the amount of a loan is less than $250,000. Internally prepared evaluations may also be used when the most recent appraisal date is within a year to estimate the current effect of economic conditions or deterioration. Updated fair value information is generally obtained at least annually for collateral-dependent loans and other real estate owned.
MANAGEMENT'S DISCUSSION AND ANALYSIS OF FINANCIAL CONDITION
AND RESULTS OF OPERATIONS – Continued
Financial Condition – Continued
In addition to the identification of nonperforming loans involving borrowers with payment performance difficulties (i.e., nonaccrual loans and loans past due 90 days or more), management utilizes an internal loan review process to identify other potential problem loans which may warrant additional monitoring or other intervention. This loan review process is a continuous activity and internal loan ratings are periodically updated. At inception, all loans are individually assigned a rating which grades the credits on a risk basis, based on the financial strength of the borrower and guarantors and other factors such as the nature of the borrower's business climate, local economic conditions and other subjective factors. The loan rating process is fluid and subjective.
Potential problem loans include loans which are generally performing as agreed; however, because of loan reviews and/or lending staff's risk assessment, increased monitoring is deemed appropriate. In addition, some loans are assigned a more adverse classification, with specific performance issues or other risk factors requiring close management and development of specific remedial action plans.
At March 31, 2012, problem and potential problem loans (including the previously-discussed nonperforming loans) approximated $494.6 million or about 31% of total consolidated portfolio loans, compared to approximately $530.4 million or about 32% at December 31, 2011. These potential problem loans (exclusive of nonperforming loans) do not necessarily have significant loss exposure (nor are they necessarily deemed "impaired"), but rather are identified by management as potential problem loans to aid in loan administration and risk management. Management has considered these loans in its evaluation of the adequacy of the allowance for loan losses. Nonperforming loans, as previously discussed, are primarily secured by real estate which is subject to fair value estimates and related loss recognition. Management believes, however, that current general economic conditions in some markets may result in continued future loan losses, as experienced in the first three months of 2012.
Regarding other real estate owned and collateral-dependent loans in Michigan, foreclosure laws in that state generally favor borrowers rather than lenders and, accordingly, foreclosure and redemption periods (i.e., the number of months it takes for a financial institution to obtain clear title to freely market the real estate) take much longer than in many other states. Further, once a property is available to the bank for sale or liquidation, current market conditions (particularly in Michigan, Arizona and Nevada) may not be conducive to rapid marketing or near-term sale of the properties.
The Corporation's other real estate owned increased $5.5 million during the quarter ended March 31, 2012, which was mostly related to a net $10.3 million addition related to properties acquired in foreclosure.
The following table presents the activity within other real estate owned for the three months ended March 31, 2012 (in $1,000s):
| | | | |
| Other real estate owned at January 1 | | $ | 100,463 | |
Properties acquired in restructure of loans or in lieu of foreclosure | | | 18,601 | |
| Properties sold | | | (8,294 | ) |
Payments received from tenants, credited to carrying amount | | | (15 | ) |
| Write-down of other real estate owned | | | (4,789 | ) |
| | | | | |
| Other real estate owned at March 31 | | $ | 105,966 | |
MANAGEMENT'S DISCUSSION AND ANALYSIS OF FINANCIAL CONDITION
AND RESULTS OF OPERATIONS – Continued
Financial Condition – Continued
The following comparative analysis summarizes each bank's total portfolio loans, allowance for loan losses, nonperforming loans and ratio of the allowance as a percentage of portfolio loans (in $1,000s):
| | | | | | Allowance for | | | | | | Allowance as a Percentage | |
| | | Total Portfolio Loans | | | Loan Losses | | | Nonperforming Loans | | | of Total Portfolio Loans | |
| | | March 31, 2012 | | | Dec 31, 2011 | | | March 31, 2012 | | | Dec 31, 2011 | | | March 31, 2012 | | | Dec 31, 2011 | | | March 31, 2012 | | | Dec 31, 2011 | |
| Arizona Region: | | | | | | | | | | | | | | | | | | | | | | | | |
| Central Arizona Bank | | $ | 31,630 | | | $ | 33,108 | | | $ | 1,755 | | | $ | 1,801 | | | $ | 3,465 | | | $ | 4,069 | | | | 5.55 | % | | | 5.44 | % |
| Sunrise Bank of Albuquerque | | | 44,494 | | | | 45,924 | | | | 2,160 | | | | 2,013 | | | | 5,127 | | | | 4,077 | | | | 4.85 | % | | | 4.38 | % |
| Sunrise Bank of Arizona | | | 218,694 | | | | 237,914 | | | | 7,959 | | | | 11,126 | | | | 23,269 | | | | 24,038 | | | | 3.64 | % | | | 4.68 | % |
| Arizona Region Total | | | 294,818 | | | | 316,946 | | | | 11,874 | | | | 14,940 | | | | 31,861 | | | | 32,184 | | | | 4.03 | % | | | 4.71 | % |
| | | | | | | | | | | | | | | | | | | | | | | | | | | | | | | | | |
| Colorado Region: | | | | | | | | | | | | | | | | | | | | | | | | | | | | | | | | |
| Mountain View Bank of Commerce | | | | | | | 40,060 | | | | | | | | 751 | | | | | | | | 22 | | | | | | | | 1.87 | % |
| | | | | | | | | | | | | | | | | | | | | | | | | | | | | | | | | |
| Great Lakes Region: | | | | | | | | | | | | | | | | | | | | | | | | | | | | | | | | |
| Bank of Maumee | | | 24,206 | | | | 26,334 | | | | 1,049 | | | | 1,084 | | | | 198 | | | | 988 | | | | 4.33 | % | | | 4.12 | % |
| Bank of Michigan | | | 68,074 | | | | 64,970 | | | | 1,900 | | | | 1,505 | | | | 1,386 | | | | 715 | | | | 2.79 | % | | | 2.32 | % |
| Capitol National Bank | | | 117,679 | | | | 119,929 | | | | 2,874 | | | | 3,681 | | | | 9,870 | | | | 12,423 | | | | 2.44 | % | | | 3.07 | % |
| Indiana Community Bank | | | 88,055 | | | | 92,257 | | | | 3,109 | | | | 3,346 | | | | 6,205 | | | | 7,803 | | | | 3.53 | % | | | 3.63 | % |
| Michigan Commerce Bank | | | 579,976 | | | | 618,852 | | | | 41,660 | | | | 41,653 | | | | 70,709 | | | | 86,179 | | | | 7.18 | % | | | 6.73 | % |
| Great Lakes Region Total | | | 877,990 | | | | 922,342 | | | | 50,592 | | | | 51,269 | | | | 88,368 | | | | 108,108 | | | | 5.76 | % | | | 5.56 | % |
| | | | | | | | | | | | | | | | | | | | | | | | | | | | | | | | | |
| Nevada Region: | | | | | | | | | | | | | | | | | | | | | | | | | | | | | | | | |
1st Commerce Bank | | | 18,122 | | | | 18,542 | | | | 1,549 | | | | 1,634 | | | | 3,527 | | | | 3,998 | | | | 8.55 | % | | | 8.81 | % |
| Bank of Las Vegas | | | 226,198 | | | | 240,110 | | | | 12,197 | | | | 13,440 | | | | 55,643 | | | | 61,908 | | | | 5.39 | % | | | 5.60 | % |
| Nevada Region Total | | | 244,320 | | | | 258,652 | | | | 13,746 | | | | 15,074 | | | | 59,170 | | | | 65,906 | | | | 5.63 | % | | | 5.83 | % |
| | | | | | | | | | | | | | | | | | | | | | | | | | | | | | | | | |
| Northwest Region: | | | | | | | | | | | | | | | | | | | | | | | | | | | | | | | | |
| High Desert Bank | | | 25,268 | | | | 259,13 | | | | 957 | | | | 957 | | | | | | | | | | | | 3.79 | % | | | 3.69 | % |
| | | | | | | | | | | | | | | | | | | | | | | | | | | | | | | | | |
| Southeast Region: | | | | | | | | | | | | | | | | | | | | | | | | | | | | | | | | |
| First Carolina State Bank | | | 54,272 | | | | 58,126 | | | | 3,945 | | | | 4,279 | | | | 5,070 | | | | 5,280 | | | | 7.27 | % | | | 7.36 | % |
| Pisgah Community Bank | | | 17,704 | | | | 19,753 | | | | 1,933 | | | | 1,925 | | | | 4,550 | | | | 3,717 | | | | 10.92 | % | | | 9.75 | % |
| Sunrise Bank | | | 57,482 | | | | 62,207 | | | | 3,751 | | | | 4,084 | | | | 9,157 | | | | 8,395 | | | | 6.53 | % | | | 6.57 | % |
| Southeast Region Total | | | 129,458 | | | | 140,086 | | | | 9,629 | | | | 10,288 | | | | 18,777 | | | | 17,392 | | | | 7.44 | % | | | 7.34 | % |
| | | | | | | | | | | | | | | | | | | | | | | | | | | | | | | | | |
| Parent company and other, net | | | 265 | | | | 270 | | | | 1 | | | | 1 | | | | 259 | | | | 265 | | | | 0.38 | % | | | 0.37 | % |
| | | | | | | | | | | | | | | | | | | | | | | | | | | | | | | | | |
| Consolidated totals | | | 1,572,119 | | | | 1,704,269 | | | | 86,799 | | | | 93,280 | | | | 198,435 | | | | 223,877 | | | | 5.52 | % | | | 5.47 | % |
| Less discontinued operations | | | | | | | (40,060 | ) | | | | | | | (751 | ) | | | | | | | (22 | ) | | | | | | | 1.87 | % |
| | | | | | | | | | | | | | | | | | | | | | | | | | | | | | | | | |
Consolidated totals relating to continuing operations | | $ | 1,572,119 | | | $ | 1,664,209 | | | $ | 86,799 | | | $ | 92,529 | | | $ | 198,435 | | | $ | 223,855 | | | | 5.52 | % | | | 5.56 | % |
[The remainder of this page intentionally left blank]
MANAGEMENT'S DISCUSSION AND ANALYSIS OF FINANCIAL CONDITION
AND RESULTS OF OPERATIONS – Continued
Results of Operations
Summary
Net loss attributable to Capitol for the three months ended March 31, 2012 was approximately $7.9 million compared to net income of $289,000 in the corresponding period of 2011. The net loss per share attributable to Capitol was $0.19 for the three months ended March 31, 2012 compared to net income per share of $0.01 in the corresponding period of 2011. Net income relating to discontinued operations was not material to the periods presented except for the gain on sale of bank subsidiaries which approximated $4.4 million for the three months ended March 31, 2011.
The primary reason for the net income in the 2011 interim period was a $16.9 million gain related to an exchange of trust-preferred securities. The interim 2012 net loss showed significant improvement compared to the corresponding 2011 interim period exclusive of such gain. There was a significant reduction in the provision for loan losses of $12.1 million to $1.3 million for the three months ended March 31, 2012 compared to a provision of $13.4 million for the corresponding period of 2011 (excluding discontinued operations), as well as a reduction in operating expenses of $8.5 million, or 23.9%, in the 2012 period as compared to the corresponding 2011 period.
Analytical Review
Operating results in all of the Corporation's banking regions improved dramatically for the quarter ended March 31, 2012 compared to the same period in 2011. While total revenues from continuing operations declined by $22.8 million (46.1%) for the quarter ended March 31, 2012 compared to the same period in 2011 due mainly to the aforementioned gain on exchange of trust-preferred securities in the 2011 period, net operating losses from continuing operations declined to $9.1 million from $24.4 million exclusive of that one-time gain, or by almost 63%, for the same comparable period. In the Great Lakes Region, one of the Michigan-based banks, Capitol National Bank, posted a $57,000 profit, while the largest banking affiliate, Michigan Commerce Bank, recorded only an $18,000 net loss compared to a $7.1 million loss for the same period in 2011. Most of the improvement in operating results is directly related to significantly lower provisions for loan losses and lower costs associated with foreclosed properties and other real estate owned.
The consolidated provision for loan losses decreased significantly for the three months ended March 31, 2012 due to lower levels of loan charge-offs, declining levels of nonperforming loans and stable valuations of collateral-dependent loans, primarily secured by real estate. Provisions for loan losses are estimates based upon management's analysis of the adequacy of the allowance for loan losses, as previously discussed.
Net interest income for the three months ended March 31, 2012 totaled $15.6 million, a 14.5% decrease compared to $18.2 million in 2011. Due to an increase of 0.83% in the percentage of performing loans to total loans, as well as an increase of 1.62% of noninterest-bearing demand deposits to total funding, the net interest margin improved to 3.12% for the three months ended March 31, 2012, a 22 basis-point increase compared to 2.90% for the three months ended December 31, 2011. Net interest margin decreased 3 basis-points compared to 3.15% for the three months ended March 31, 2011. It is not feasible to speculate on future potential changes in net interest margin.
Noninterest income for the three months ended March 31, 2012 approximated $3.7 million, a significant decrease compared to $21.1 million for the same period in 2011. However, the interim 2011 period included a $16.9 million gain on exchange of trust-preferred securities (see Note I to the accompanying condensed consolidated financial statements). When excluding this gain, noninterest income reflected a slight decrease in 2012 as compared to 2011.
MANAGEMENT'S DISCUSSION AND ANALYSIS OF FINANCIAL CONDITION
AND RESULTS OF OPERATIONS – Continued
Results of Operations – Continued
Noninterest expense totaled $27.1 million for the three-month 2012 period compared to $35.6 million for the comparable period of 2011. The decrease resulted from significantly lower costs associated with foreclosed properties and other real estate owned, which decreased $2.3 million (31%) to $5.1 million in the three-month 2012 period ($7.5 million in the corresponding 2011 period), due to stabilizing valuations and holding costs of other real estate owned. The cost of FDIC insurance and other regulatory fees also decreased to $1.8 million in the three-month 2012 period, compared to $2.9 million in the same period of 2011.
The largest element of noninterest expense is salaries and employee benefits, which approximated $11.3 million for the three months ended March 31, 2012, a decrease of $1.7 million (13%) from $13.0 million in the corresponding period of 2011, as a result of Capitol's ongoing efforts to 'right size' the Corporation and streamline staffing at its banks and corporate offices following bank divestitures.
The more significant elements of other noninterest expense consisted of the following for the period ended March 31 (in $1,000s):
| | | Three Months Ended March 31 | |
| | | 2012 | | | 2011(1) | |
| | | | | | | |
| Legal fees | | $ | 787 | | | $ | 808 | |
| Professional fees | | | 693 | | | | 429 | |
| Insurance | | | 581 | | | | 674 | |
| Loan and collection expense | | | 328 | | | | 456 | |
Bank services (ATMs, telephone banking and Internet banking) | | | 292 | | | | 321 | |
| Travel, lodging and meals | | | 242 | | | | 206 | |
| Communications | | | 211 | | | | 243 | |
| Other | | | 1,514 | | | | 4,159 | |
| | | | | | | | | |
| Total | | $ | 4,648 | | | $ | 7,296 | |
| (1) | For comparative purposes, original balances as previously reported have been adjusted to exclude amounts related to discontinued operations. |
[The remainder of this page intentionally left blank]
MANAGEMENT'S DISCUSSION AND ANALYSIS OF FINANCIAL CONDITION
AND RESULTS OF OPERATIONS – Continued
Results of Operations – Continued
Operating results for the three months ended March 31 were as follows (in $1,000s):
| | | Total Revenues | | | Net Income (Loss)(1) | | | Return on Average Equity(2) | | | Return on Average Assets(2) | |
| | | 2012 | | | 2011 | | | 2012 | | | 2011 | | | 2012 | | | 2011 | | | 2012 | | | 2011 | |
| Arizona Region: | | | | | | | | | | | | | | | | | | | | | | | | |
| Central Arizona Bank | | $ | 439 | | | $ | 729 | | | $ | (251 | ) | | $ | (663 | ) | | | | | | | | | | | | |
| Sunrise Bank of Albuquerque | | | 657 | | | | 805 | | | | (288 | ) | | | (734 | ) | | | | | | | | | | | | |
| Sunrise Bank of Arizona | | | 3,487 | | | | 5,397 | | | | (988 | ) | | | (2,506 | ) | | | | | | | | | | | | |
| Arizona Region Total | | | 4,583 | | | | 6,931 | | | | (1,527 | ) | | | (3,903 | ) | | | | | | | | | | | | |
| | | | | | | | | | | | | | | | | | | | | | | | | | | | | |
| California Region: | | | | | | | | | | | | | | | | | | | | | | | | | | | | |
Bank of Feather River(3) | | | | | | | 636 | | | | | | | | 14 | | | | | | | 0.90 | % | | | | | | 0.14 | % |
Sunrise Bank(3) | | | | | | | 2,889 | | | | | | | | 542 | | | | | | | 10.99 | % | | | | | | 0.96 | % |
| California Region Total | | | | | | | 3,535 | | | | | | | | 556 | | | | | | | | | | | | | | | |
| | | | | | | | | | | | | | | | | | | | | | | | | | | | | | | |
| Colorado Region: | | | | | | | | | | | | | | | | | | | | | | | | | | | | | | |
Mountain View Bank of Commerce(3) | | | 221 | | | | 690 | | | | 16 | | | | 33 | | | | | | | 1.82 | % | | | | | | 0.22 | % |
| | | | | | | | | | | | | | | | | | | | | | | | | | | | | | | |
| Great Lakes Region: | | | | | | | | | | | | | | | | | | | | | | | | | | | | | | |
| Bank of Maumee | | | 411 | | | | 535 | | | | (95 | ) | | | (26 | ) | | | | | | | | | | | | | | |
| Bank of Michigan | | | 1,233 | | | | 1,223 | | | | (145 | ) | | | 37 | | | | | | | 2.15 | % | | | | | | 0.19 | % |
| Capitol National Bank | | | 1,922 | | | | 2,192 | | | | 57 | | | | 27 | | | | 2.09 | % | | | 1.02 | % | | | 0.14 | % | | | 0.07 | % |
Evansville Commerce Bank(3) | | | | | | | 613 | | | | | | | | (45 | ) | | | | | | | | | | | | | | | | |
| Indiana Community Bank | | | 1,391 | | | | 1,690 | | | | (150 | ) | | | (268 | ) | | | | | | | | | | | | | | | | |
| Michigan Commerce Bank | | | 11,705 | | | | 14,311 | | | | (18 | ) | | | (7,123 | ) | | | | | | | | | | | | | | | | |
| Great Lakes Region Total | | | 16,662 | | | | 20,564 | | | | (351 | ) | | | (7,398 | ) | | | | | | | | | | | | | | | | |
| | | | | | | | | | | | | | | | | | | | | | | | | | | | | | | | | |
| Nevada Region: | | | | | | | | | | | | | | | | | | | | | | | | | | | | | | | | |
1st Commerce Bank | | | 264 | | | | 335 | | | | (215 | ) | | | (1,778 | ) | | | | | | | | | | | | | | | | |
| Bank of Las Vegas | | | 3,103 | | | | 3,743 | | | | (1,307 | ) | | | (695 | ) | | | | | | | | | | | | | | | | |
| Nevada Region Total | | | 3,367 | | | | 4,078 | | | | (1,522 | ) | | | (2,473 | ) | | | | | | | | | | | | | | | | |
| | | | | | | | | | | | | | | | | | | | | | | | | | | | | | | | | |
| Northwest Region: | | | | | | | | | | | | | | | | | | | | | | | | | | | | | | | | |
Bank of the Northwest(3) | | | | | | | 1,853 | | | | | | | | 81 | | | | | | | | 2.17 | % | | | | | | | 0.23 | % |
| High Desert Bank | | | 415 | | | | 492 | | | | (309 | ) | | | (320 | ) | | | | | | | | | | | | | | | | |
| Northwest Region Total | | | 415 | | | | 2,345 | | | | (309 | ) | | | (239 | ) | | | | | | | | | | | | | | | | |
| | | | | | | | | | | | | | | | | | | | | | | | | | | | | | | | | |
| Southeast Region: | | | | | | | | | | | | | | | | | | | | | | | | | | | | | | | | |
Community Bank of Rowan(3) | | | | | | | 1,550 | | | | | | | | (71 | ) | | | | | | | | | | | | | | | | |
| First Carolina State Bank | | | 849 | | | | 1,018 | | | | (320 | ) | | | (2,120 | ) | | | | | | | | | | | | | | | | |
| Pisgah Community Bank | | | 316 | | | | 353 | | | | (427 | ) | | | (2,385 | ) | | | | | | | | | | | | | | | | |
| Sunrise Bank | | | 992 | | | | 1,261 | | | | (1,409 | ) | | | (1,002 | ) | | | | | | | | | | | | | | | | |
| Southeast Region Total | | | 2,157 | | | | 4,182 | | | | (2,156 | ) | | | (5,578 | ) | | | | | | | | | | | | | | | | |
| | | | | | | | | | | | | | | | | | | | | | | | | | | | | | | | | |
| Texas Region: | | | | | | | | | | | | | | | | | | | | | | | | | | | | | | | | |
Bank of Fort Bend(3) | | | | | | | 720 | | | | | | | | 128 | | | | | | | | 14.82 | % | | | | | | | 2.27 | % |
Bank of Las Colinas(3) | | | | | | | 613 | | | | | | | | 38 | | | | | | | | 2.78 | % | | | | | | | 0.34 | % |
| Texas Region Total | | | | | | | 1,333 | | | | | | | | 166 | | | | | | | | | | | | | | | | | |
| | | | | | | | | | | | | | | | | | | | | | | | | | | | | | | | | |
| Parent company and other, net | | | (409 | ) | | | 15,335 | | | | (3,082 | ) | | | 16,062 | | | | | | | | | | | | | | | | | |
| Consolidated totals | | | 26,996 | | | | 58,993 | | | | (8,931 | ) | | | (2,774 | ) | | | | | | | | | | | | | | | | |
| Less discontinued operations | | | (347 | ) | | | (9,574 | ) | | | 149 | | | | 4,748 | | | | | | | | | | | �� | | | | | | |
| | | | | | | | | | | | | | | | | | | | | | | | | | | | | | | | | |
Consolidated totals for continuing operations | | $ | 26,649 | | | $ | 49,419 | | | $ | (9,080 | ) | | $ | (7,522 | ) | | | -- | | | | -- | | | | -- | | | | -- | |
| (1) | Excludes net losses attributable to noncontrolling interests. |
| (2) | Annualized for periods presented. |
| (3) | Capitol sold its ownership in Mountain View Bank of Commerce effective January 30, 2012; Bank of Las Colinas effective October 27, 2011; Evansville Commerce Bank effective October 10, 2011; Bank of Feather River effective October 4, 2011; Bank of the Northwest and Sunrise Bank effective July 28, 2011; Community Bank of Rowan effective April 19, 2011 and Bank of Fort Bend effective March 30, 2011. |
MANAGEMENT'S DISCUSSION AND ANALYSIS OF FINANCIAL CONDITION
AND RESULTS OF OPERATIONS – Continued
Liquidity and Capital Resources
The principal funding source for banks is deposits. Total deposits (excluding discontinued operations) decreased $78.5 million during the three months ended March 31, 2012 compared to a $69.6 million decrease in the corresponding period of 2011. Brokered deposits approximated $20.3 million as of March 31, 2012, or about 1% of total deposits, a decrease of $16.6 million during the three-month 2012 period, as the banks have sought to reduce use of that funding source based on maturity and interest rate opportunities, regulatory constraints and to aid in matching the repricing of funding sources and assets. Brokered deposits at March 31, 2012 include about $10.6 million of relationship-based structured time accounts. Banks that are classified as less than "well-capitalized" are required to obtain approval from the FDIC to renew or obtain new brokered deposits and, for banks classified as less than "adequately-capitalized," renewal of brokered deposits is generally prohibited.
Noninterest-bearing deposits approximated 19.1% of total deposits at March 31, 2012, an increase from 17.4% at December 31, 2011. Levels of noninterest-bearing deposits can fluctuate based on customers' transaction activity. During the 2012 period, however, interest-bearing deposits decreased about $99.0 million, mostly related to the previously-mentioned reduction in brokered deposits.
Cash and cash equivalents amounted to $380.0 million, or 18.5%, of total assets at March 31, 2012, compared to $387.2 million, or 17.6%, of total assets at December 31, 2011, as reductions in portfolio loans (principally from repayments) and proceeds from sales and maturities of investment securities, government-guaranteed loans and other real estate owned were used to reduce debt obligations or deployed into liquid assets. As liquidity levels vary continuously based on customer activities, amounts of cash and cash equivalents can vary widely at any given point in time. Liquidity levels have been increased by management in response to regulatory guidance, coupled with limited opportunities to deploy funds into investment securities during a low interest rate environment and a cautious approach to, and capital restrictions associated with, making new loans in an uncertain economy. Management believes Capitol's liquidity position at March 31, 2012 is adequate to fund loan demand and meet depositor needs.
In addition to cash and cash equivalents, an additional source of long-term liquidity is the banks' marketable investment securities. Liquidity needs have not historically necessitated the sale of investments in order to meet funding requirements and the banks have not engaged in active trading of their investments. At March 31, 2012, Capitol's banks had approximately $23.1 million of investment securities classified as available for sale which may be utilized to meet various liquidity needs as they arise.
Several of Capitol's banks have secured lines of credit with regional Federal Home Loan Banks. Borrowings thereunder approximated $37.0 million at March 31, 2012 and additional borrowing capacity approximated $120.9 million. These facilities are used from time to time as a lower-cost funding source versus various rates and maturities of time deposits available within banks' individual communities. Future availability of such borrowing capacity may be contingent upon the creditworthiness of Capitol's banks and related matters. Total notes payable and other borrowings were $13.1 million at March 31, 2012.
In 2009, the Corporation commenced the deferral of interest payments on its various trust-preferred securities, as is permitted under the terms of the securities, in order to conserve cash and capital resources. The payment of interest on those securities may be deferred for periods up to five years. During such deferral periods, Capitol is prohibited from paying dividends on its common stock (subject to certain exceptions) and is further restricted by Capitol's written agreement with the Federal Reserve Bank of Chicago, which prohibits both payment of interest on the trust-preferred securities and cash dividends without prior written approval by that agency. Accrued interest payable on such securities approximated $30.3 million and $27.6 million at March 31, 2012 and December 31, 2011, respectively. Holders of the trust-preferred securities recognize current taxable income relating to the deferred interest payments.
MANAGEMENT'S DISCUSSION AND ANALYSIS OF FINANCIAL CONDITION
AND RESULTS OF OPERATIONS – Continued
Liquidity and Capital Resources – Continued
On January 31, 2011, Capitol accepted for exchange 1,180,602 of the 2,530,000 outstanding shares of trust-preferred securities of Capitol Trust I and 773,934 of the 1,454,100 outstanding shares of trust-preferred securities of Capitol Trust XII and, pursuant to the related exchange offer, issued approximately 19.5 million previously-unissued shares of Capitol's common stock. This exchange resulted in the retirement of approximately $19.5 million aggregate liquidation amount of the trust-preferred securities on a combined basis and eliminated approximately $3.4 million of accrued interest payable associated with the retired securities, which collectively increased Capitol's equity and regulatory capital by $21.9 million, including a gain on the transaction of approximately $16.9 million.
Capitol Bancorp Limited stockholders' equity, as a percentage of total assets, approximated (5.63)% at March 31, 2012 and (4.90)% at December 31, 2011. As of March 31, 2012, total capital funds (i.e., the sum of Capitol Bancorp Limited stockholders' equity, noncontrolling interests in consolidated subsidiaries and subordinated debentures) approximated $27.9 million or 1.36% of total assets. Capitol's equity deficit increased in the interim 2012 period due to losses incurred from operations, although the losses were less significant than in 2011 due primarily to lower provisions for loan losses recorded at its banks.
Capitol and its banks are subject to complex regulatory capital requirements, which require maintaining certain minimum capital ratios. These ratio measurements, in addition to certain other requirements, are used by regulatory agencies to determine the level of regulatory intervention and enforcement applied to financial institutions.
[The remainder of this page intentionally left blank]
MANAGEMENT'S DISCUSSION AND ANALYSIS OF FINANCIAL CONDITION
AND RESULTS OF OPERATIONS – Continued
Liquidity and Capital Resources – Continued
The following comparative analysis summarizes each bank's regulatory capital position as of the dates indicated based on the banks included in Capitol's consolidation as of March 31, 2012:
| | | Tier 1 Leverage | | | Tier 1 Risk-Based | | | Total Risk-Based | | | |
| | | Ratio(2) | | | Capital Ratio(2) | | | Capital Ratio(2) | | | Regulatory Classification(1) |
| | | Mar 31, 2012 | | | Dec 31, 2011 | | | Mar 31, 2012 | | | Dec 31, 2011 | | | Mar 31, 2012 | | | Dec 31, 2011 | | | Mar 31, 2012 | | Dec 31, 2011 |
| Arizona Region: | | | | | | | | | | | | | | | | | | | | | | |
| Central Arizona Bank | | | 2.07 | % | | | 2.01 | % | | | 2.63 | % | | | 2.65 | % | | | 3.93 | % | | | 3.95 | % | | significantly-undercapitalized | | significantly-undercapitalized |
| Sunrise Bank of Albuquerque | | | 2.11 | % | | | 2.43 | % | | | 2.79 | % | | | 3.22 | % | | | 4.09 | % | | | 4.50 | % | | significantly-undercapitalized | | significantly-undercapitalized |
| Sunrise Bank of Arizona | | | 2.00 | % | | | 2.03 | % | | | 2.56 | % | | | 2.56 | % | | | 3.84 | % | | | 3.85 | % | | significantly-undercapitalized | | significantly-undercapitalized |
| | | | | | | | | | | | | | | | | | | | | | | | | | | | | |
| Great Lakes Region: | | | | | | | | | | | | | | | | | | | | | | | | | | | | |
| Bank of Maumee | | | 5.02 | % | | | 5.41 | % | | | 7.71 | % | | | 7.56 | % | | | 9.00 | % | | | 8.85 | % | | adequately-capitalized | | adequately-capitalized |
| Bank of Michigan | | | 8.25 | % | | | 8.80 | % | | | 10.59 | % | | | 11.31 | % | | | 11.86 | % | | | 12.58 | % | | well-capitalized | | well-capitalized |
| Capitol National Bank | | | 6.90 | % | | | 6.90 | % | | | 9.48 | % | | | 9.15 | % | | | 10.75 | % | | | 10.42 | % | | adequately-capitalized(3) | | adequately-capitalized(3) |
| Indiana Community Bank | | | 6.91 | % | | | 6.66 | % | | | 9.55 | % | | | 9.35 | % | | | 10.83 | % | | | 10.63 | % | | adequately-capitalized(3) | | adequately-capitalized(3) |
| Michigan Commerce Bank | | | 2.34 | % | | | 2.17 | % | | | 3.00 | % | | | 2.84 | % | | | 4.32 | % | | | 4.16 | % | | significantly-undercapitalized | | significantly-undercapitalized |
| | | | | | | | | | | | | | | | | | | | | | | | | | | | | |
| Nevada Region: | | | | | | | | | | | | | | | | | | | | | | | | | | | | |
1st Commerce Bank | | | 2.61 | % | | | 2.30 | % | | | 3.73 | % | | | 3.88 | % | | | 5.07 | % | | | 5.22 | % | | significantly-undercapitalized | | significantly-undercapitalized |
| Bank of Las Vegas | | | 2.03 | % | | | 2.16 | % | | | 2.65 | % | | | 2.90 | % | | | 3.95 | % | | | 4.20 | % | | significantly-undercapitalized | | significantly-undercapitalized |
| | | | | | | | | | | | | | | | | | | | | | | | | | | | | |
| Northwest Region: | | | | | | | | | | | | | | | | | | | | | | | | | | | | |
| High Desert Bank | | | 5.63 | % | | | 6.47 | % | | | 7.72 | % | | | 8.72 | % | | | 9.01 | % | | | 10.00 | % | | adequately-capitalized | | adequately-capitalized(3) |
| | | | | | | | | | | | | | | | | | | | | | | | | | | | | |
| Southeast Region: | | | | | | | | | | | | | | | | | | | | | | | | | | | | |
| First Carolina State Bank | | | 2.06 | % | | | 2.08 | % | | | 3.14 | % | | | 3.09 | % | | | 4.47 | % | | | 4.41 | % | | significantly-undercapitalized | | significantly-undercapitalized |
| Pisgah Community Bank | | | 2.20 | % | | | 2.09 | % | | | 3.20 | % | | | 2.93 | % | | | 4.56 | % | | | 4.28 | % | | significantly-undercapitalized | | significantly-undercapitalized |
| Sunrise Bank | | | 2.10 | % | | | 2.16 | % | | | 2.92 | % | | | 2.97 | % | | | 4.24 | % | | | 4.29 | % | | significantly-undercapitalized | | significantly-undercapitalized |
| | | | | | | | | | | | | | | | | | | | | | | | | | | | | |
| Consolidated totals | | | (5.74 | )% | | | (4.73 | )% | | | (7.62 | )% | | | (6.36 | )% | | | (7.62 | )% | | | (6.36 | )% | | less than adequately-capitalized | | less than adequately-capitalized |
| (1) | Regulatory capital classifications are defined as follows: Well-Capitalized – Total risk-based capital ratio must be 10% or more, and Tier 1 risk-based capital ratio must be 6% or more, and Tier 1 leverage ratio must be 5% or more, and the bank must not be subject to formal regulatory enforcement action requiring non-standard capital ratios. Adequately-Capitalized – Does not meet the criteria for "well-capitalized," but has total risk-based capital ratio of 8% or more, and Tier 1 risk-based capital ratio of 4% or more, and Tier 1 leverage ratio of 4% or more. Undercapitalized – Does not meet the criteria for "adequately-capitalized," but has total risk-based capital ratio of 6% or more, and Tier 1 risk-based capital ratio of 3% or more, and Tier 1 leverage ratio of 3% or more. Significantly-Undercapitalized – Does not meet the criteria for "undercapitalized," but has Tier 1 leverage ratio of 2% or more. Institutions with a Tier 1 leverage ratio below 2% are classified as "critically-undercapitalized." |
| (2) | Ratios are based on the banks' regulatory reports filed on or before April 30, 2012. |
| (3) | Institution is subject to a regulatory agreement and, accordingly, cannot be classified better than "adequately-capitalized" even though the risk-based capital ratios would otherwise suggest "well-capitalized" classification. |
MANAGEMENT'S DISCUSSION AND ANALYSIS OF FINANCIAL CONDITION
AND RESULTS OF OPERATIONS – Continued
Liquidity and Capital Resources – Continued
Banks less than "adequately-capitalized" may become subject to increased regulatory enforcement pursuant to the prompt-corrective-action or other provisions of the FDIC and other bank regulatory agencies. The preceding summary indicates that Capitol, on a consolidated basis, was classified as less than "adequately-capitalized" at March 31, 2012.
Capitol's total risk-based capital ratio at March 31, 2012 was adversely impacted by the exclusion of approximately $169.9 million of previously-qualifying Tier 2 capital, inasmuch as Tier 2 capital is limited to 100% of Tier 1 capital. The Tier 1 capital deficit at March 31, 2012 resulted primarily from operating losses.
In addition to Capitol's consolidated regulatory capital classification at March 31, 2012, several of its bank subsidiaries had capital levels resulting in classification as "undercapitalized" or "significantly-undercapitalized" at that date. Regarding banks classified as "undercapitalized" or "significantly-undercapitalized," and otherwise noncompliant with formal regulatory agreements, management is taking appropriate action to improve such capital classifications and related compliance in the future.
Proceeds from the sale of banks through March 31, 2012 have been deployed as additional capital in the remaining affiliated banks, irrespective of minority ownership, pursuant to requirements imposed by the FDIC. Capitol anticipates augmenting the capital levels of its less than "adequately-capitalized" bank subsidiaries further, through the allocation of proceeds from the pending divestiture of certain bank subsidiaries. Pending divestitures are discussed later in this narrative. Management is pursuing various strategies to increase Capitol's Tier 1 capital, including raising capital through potential equity transactions, gains on divestiture of some bank subsidiaries and other initiatives.
Going-Concern Considerations
As of March 31, 2012, there are several significant adverse aspects of Capitol's consolidated financial position and results of operations which include, but are not limited to, the following:
| · | An equity deficit approximating $121.3 million; |
| · | Regulatory capital classification on a consolidated basis as less than "adequately-capitalized" and related negative amounts and ratios; |
| · | Numerous banking subsidiaries with regulatory capital classification as "undercapitalized" or "significantly-undercapitalized"; |
| · | Certain banking subsidiaries which are generally subject to formal regulatory agreements have received "prompt corrective action" notifications and/or directives from the FDIC, which require timely action by bank management and the respective boards of directors to resolve regulatory capital ratios which result in classification as less than "adequately-capitalized" (the basis of a PCAN) or to submit an acceptable capital restoration plan to the FDIC (the basis of a PCAD), and it is likely additional PCANs and/or PCADs may be issued in the future and/or the banking subsidiaries may be unable to satisfactorily resolve such notices and/or directives; |
| · | Capitol has sold several of its banking subsidiaries during the past few years and has other divestiture transactions pending (see Note J to the accompanying condensed consolidated financial statements). The proceeds from those divestitures have been redeployed at certain remaining banking subsidiaries which have experienced a significant erosion of capital due to operating losses. While such proceeds have been a significant source of funds for redeployment, the Corporation will need to raise significant other sources of new capital in the future; |
MANAGEMENT'S DISCUSSION AND ANALYSIS OF FINANCIAL CONDITION
AND RESULTS OF OPERATIONS – Continued
Liquidity and Capital Resources – Continued
| · | The Corporation and substantially all of its banking subsidiaries are operating under various regulatory agreements (formal and informal) which place a number of restrictions on them and impose other requirements limiting activities and requiring preservation of capital, improvement in regulatory capital measures, reduction of nonperforming assets and other matters for which the entities have not achieved full compliance; |
| · | Elevated levels of nonperforming loans and other nonperforming assets as a percentage of consolidated loans and total assets, respectively; and |
| · | Significant losses from continuing operations, resulting primarily from elevated provisions for loan losses and costs associated with foreclosed properties and other real estate owned. |
The foregoing considerations raise some level of doubt (potentially substantial doubt) as to the Corporation's ability to continue as a going concern.
Capitol has commenced several initiatives and other actions to mitigate these going-concern considerations and to improve its financial condition, equity, regulatory capital and regulatory compliance.
In early 2011, a partial exchange of trust-preferred securities was completed and the Corporation's stockholders approved an amendment to its articles of incorporation to increase its authorized common stock and authorize its board of directors to proceed with a rights offering and reverse stock split, in addition to a potential share exchange regarding second-tier bank-development subsidiaries.
Improvement in Capitol's and its banking subsidiaries' capitalization, financial position, asset quality and results of operations requires multi-faceted efforts, which are currently being considered in the following areas, among others:
| · | Raising significant amounts of new equity capital; |
| · | Completion of divestitures which are currently pending; |
| · | Further reductions in nonperforming assets; |
| · | Stabilization of provisions for loan losses and impairment losses; |
| · | Upon the Tier 1 capital level becoming positive either through future earnings or additional new equity capital, or both, Capitol's trust-preferred securities may be included as a qualifying element of regulatory capital and/or equity; and |
| · | Further reductions in operating expenses as a result of potential mergers of bank subsidiaries. |
Capitol's ability to continue as a going concern is contingent on the successful achievement of the items listed above. Capitol's board of directors and management are fully engaged and committed to successful completion of those items, with a clear sense of urgency, subject to the availability of capital and continued cooperation by regulatory agencies.
Trends Affecting Operations
As noted elsewhere in this narrative, Capitol has experienced adverse trends in its results of operations, asset quality, valuation of collateral-dependent loans and other real estate owned and capital adequacy. Capitol continues to focus its efforts on mitigating those adverse trends through a multifaceted approach, including raising and redeploying capital funds, merging bank subsidiaries on a regional basis to achieve operational efficiencies, reducing operating expenses and staffing levels, implementing hiring and compensation freezes and selling banks, among other things. Capitol also continues to explore other solutions to improve operating results and capital adequacy.
MANAGEMENT'S DISCUSSION AND ANALYSIS OF FINANCIAL CONDITION
AND RESULTS OF OPERATIONS – Continued
Trends Affecting Operations – Continued
Capitol has made significant progress in its efforts to reduce staffing and operating costs, as well as in redeploying proceeds from the sale of banks completed thus far. While Capitol's management believes its plans to improve operating results and capital adequacy will help mitigate recent adverse trends, Capitol's loan portfolio is dominated by loans secured by real estate. Future valuation of collateral-dependent loans and other real estate owned and future loan repayments by borrowers are largely dependent upon economic conditions on a local, regional and national basis. Uncertainty in those economic conditions, particularly relating to real estate values and the ability of borrowers to repay loans, is outside of the control of Capitol and its banks. Accordingly, the extent to which those matters may further adversely affect Capitol in the future remains highly unpredictable.
In addition to volatility which arises from changes in asset quality, changes in market rates of interest can have a material impact on the financial condition and results of operations of financial institutions.
Changes in interest rates, either up or down, have an impact on net interest income (plus or minus), depending on the direction and timing of such changes. At any point in time, there is a difference between interest rate-sensitive assets and interest rate-sensitive liabilities. Therefore, when interest rates change, the timing and magnitude of the effect of such interest rate changes can alter the relationship between asset yields and the cost of funds.
In late 2008, the Federal Reserve took unprecedented action to reduce market interest rates to near zero. Further, in December 2011, the Federal Reserve indicated plans to hold short-term market interest rates at near zero for the next two years. Because of Capitol's consolidated asset-sensitive gap position, such rates generally have an adverse impact on net interest margin (and results of operations) as interest rates on loans reprice quickly, while rates paid on deposits reprice over an extended period of time. It is also more difficult to attract deposits and deploy liquidity in a very low rate environment. It is impossible to speculate on the timing, size and direction of future interest rate changes.
General economic conditions also have a significant impact on both the results of operations and the financial condition of financial institutions. As mentioned previously, general economic conditions and economic conditions within Capitol's primary banking regions in particular, including Michigan, Arizona, Nevada and the Southeast, are uncertain and could continue to have an adverse effect on Capitol's banks and their customers. It is likely that, absent significant catalysts, these states' economic recoveries in particular may take an extended period of time.
Concerns about the future health of the domestic economy and a sustained recession continue to be reported in many of Capitol's markets. During 2010 and 2009, nonperforming assets increased significantly before showing a decline in 2011 and early 2012; it is likely that levels of nonperforming assets and related loan losses and adverse valuation adjustments may continue as economic conditions, locally and nationally, evolve.
Capitol and its banking subsidiaries, along with the entire banking industry, are subject to significant regulatory requirements which impact current and future operations. In addition to the extent of regulatory interaction with financial institutions, extensive rules and regulations governing lending activities, deposit gathering and capital adequacy, among others, translate into a significant cost burden of financial institution regulation. Such costs include the amount of management time and expense incurred in developing systems and maintaining compliance with those rules and regulations, as well as the cost of examinations, audits and other compliance activities. The future of financial institution regulation, and its costs, is uncertain and difficult to predict.
MANAGEMENT'S DISCUSSION AND ANALYSIS OF FINANCIAL CONDITION
AND RESULTS OF OPERATIONS – Continued
Divestiture of Banks
During the period ended March 31, 2012, Capitol completed the following sale of a bank subsidiary (in $1,000s):
| | | | Sale | | | | |
| | Date Sold | | Proceeds | | | Gain | |
| | | | | | | | |
Mountain View Bank of Commerce(1) | January 30, 2012 | | $ | 4,060 | | | $ | 126 | |
| | (1) | Previously a majority-owned subsidiary of a bank-development subsidiary controlled by Capitol. |
In addition to completed sales transactions, Capitol has entered into definitive agreements to sell its interests (or controlling interests held by bank-development subsidiaries) in the following institutions which are pending: Bank of Maumee, Bank of Michigan and First Carolina State Bank. The projected financial impact of the potential divestiture of these institutions is set forth in the accompanying pro forma condensed consolidated financial statements on pages 50 and 51 of this document. Total proceeds from those pending sales are expected to approximate $5.3 million, resulting in a projected loss of $870,000 ($0.02 per common share) and are expected to be consummated throughout the remainder of 2012, subject to regulatory approval and other significant contingencies.
Regulatory Matters
In September 2009, Capitol and its second-tier bank holding companies entered into an agreement with the Federal Reserve Bank of Chicago (the "Reserve Bank") under which Capitol agreed to refrain from the following actions without the prior written consent of the Reserve Bank: (i) declare or pay dividends; (ii) receive dividends or any other form of payment representing a reduction in capital from Michigan Commerce Bank, or from any of its subsidiary institutions that are subject to any restriction by the institution's federal or state regulator that limits the payment of dividends or other intercorporate payments; (iii) make any distributions of interest, principal, or other sums on subordinated debentures or trust-preferred securities; (iv) incur, increase or guarantee any debt; or (v) purchase or redeem any shares of the stock of Capitol, the second-tier bank holding companies, nonbank subsidiaries or any of the subsidiary banks that are held by shareholders other than Capitol.
In addition, Capitol agreed to: (i) submit to the Reserve Bank a written plan to maintain sufficient capital at Capitol on a consolidated basis and at Michigan Commerce Bank (as Capitol's largest bank subsidiary and a separate legal entity on a stand-alone basis); (ii) notify the Reserve Bank no more than 30 days after the end of any quarter in which Capitol's consolidated or Michigan Commerce Bank's capital ratios fall below the approved capital plan's minimum ratios as well as if any subsidiary institution's ratios fall below the minimum ratios required by the institution's federal or state regulator; (iii) review and revise its ALLL methodology for loans held by Capitol and submit to the Reserve Bank a written program for maintenance of an adequate ALLL for loans held by Capitol; (iv) take all necessary actions to ensure each of its subsidiary institutions comply with Federal Reserve regulations; (v) refrain from increasing any fees or charging new fees to any subsidiary institution without the prior written consent of the Reserve Bank; (vi) submit to the Reserve Bank a written plan to enhance the consolidated organization's risk management practices, a strategic plan to improve the consolidated organization's operating results and overall condition and a cash flow projection; (vii) comply with laws and regulations regarding senior executive officer positions and severance payments; and (viii) provide quarterly reports to the Reserve Bank regarding these undertakings.
Many of Capitol's bank subsidiaries have entered into formal agreements (as well as informal agreements) with their applicable regulatory agencies. Those agreements provide for certain restrictions and other guidelines and/or limitations to be followed by the banks. The banks generally subject to such agreements are noted as such in the regulatory capital detail appearing on page 44 of this document.
MANAGEMENT'S DISCUSSION AND ANALYSIS OF FINANCIAL CONDITION
AND RESULTS OF OPERATIONS – Continued
Regulatory Matters – Continued
Regulatory capital matters are set forth in Note L of the accompanying condensed consolidated financial statements.
On July 21, 2010, the Dodd-Frank Act was signed into law and is significantly impacting the regulation of financial institutions and the financial services industry. The Dodd-Frank Act includes provisions affecting large and small financial institutions alike, including several provisions that will profoundly affect how community banks, thrifts, and smaller bank holding companies will be regulated in the future. Among other things, these provisions abolished the Office of Thrift Supervision and transferred its functions to the other federal banking agencies, relaxed rules regarding interstate branching, allowed financial institutions to pay interest on business checking accounts, changed the scope of FDIC insurance coverage and imposed new capital requirements on bank holding companies including removing trust-preferred securities as a permitted component of a holding company's Tier 1 capital after a three-year phase-in period beginning January 1, 2013. The Dodd-Frank Act also establishes the Bureau of Consumer Financial Protection as an independent entity within the Federal Reserve, which was given the authority to promulgate consumer protection regulations applicable to all entities offering consumer financial services or products, including banks. Additionally, the Dodd-Frank Act includes a series of provisions covering mortgage loan origination standards affecting, among other things, originator compensation, minimum repayment standards and prepayments. Management is continuing to evaluate the provisions of the Dodd-Frank Act and assess its probable impact on the Corporation's business, financial condition and results of operations. However, the ultimate effect of the Dodd-Frank Act on the financial services industry in general, and on the Corporation in particular, currently remains uncertain.
Tax Matters
Accounting for income taxes requires significant estimates and management judgments. At March 31, 2012, Capitol had a gross deferred tax asset approximating $205.6 million, subject to a related valuation allowance of $204.9 million.
An Internal Revenue Service examination which commenced in 2011 is expected to conclude in 2012. The findings of this examination are not expected to have material impact on Capitol's consolidated financial statements as of March 31, 2012.
In July 2011, Capitol adopted a Tax Benefits Preservation Plan (the "Plan") designed to preserve substantial tax assets. Capitol's tax attributes include net operating losses that could be utilized in certain circumstances to offset taxable income and reduce federal income tax liability. Capitol's ability to use these tax attributes would be substantially limited if there were an "ownership change" as defined under Section 382 of the Internal Revenue Code and related Internal Revenue Service pronouncements. As part of the Plan, Capitol's board of directors declared a dividend of one preferred share purchase right for each outstanding share of its common stock distributable to shareholders of record as of August 1, 2011, as well as to holders of common stock issued after that date, which would only be activated if triggered under the Plan.
The Plan is designed to reduce the likelihood that Capitol will experience an ownership change by discouraging any person from becoming a 5-percent shareholder. There is no guarantee, however, that the Plan will prevent Capitol from experiencing an ownership change.
The issuance of the preferred share purchase rights will not affect Capitol's reported per-share results and is not taxable to Capitol or its shareholders.
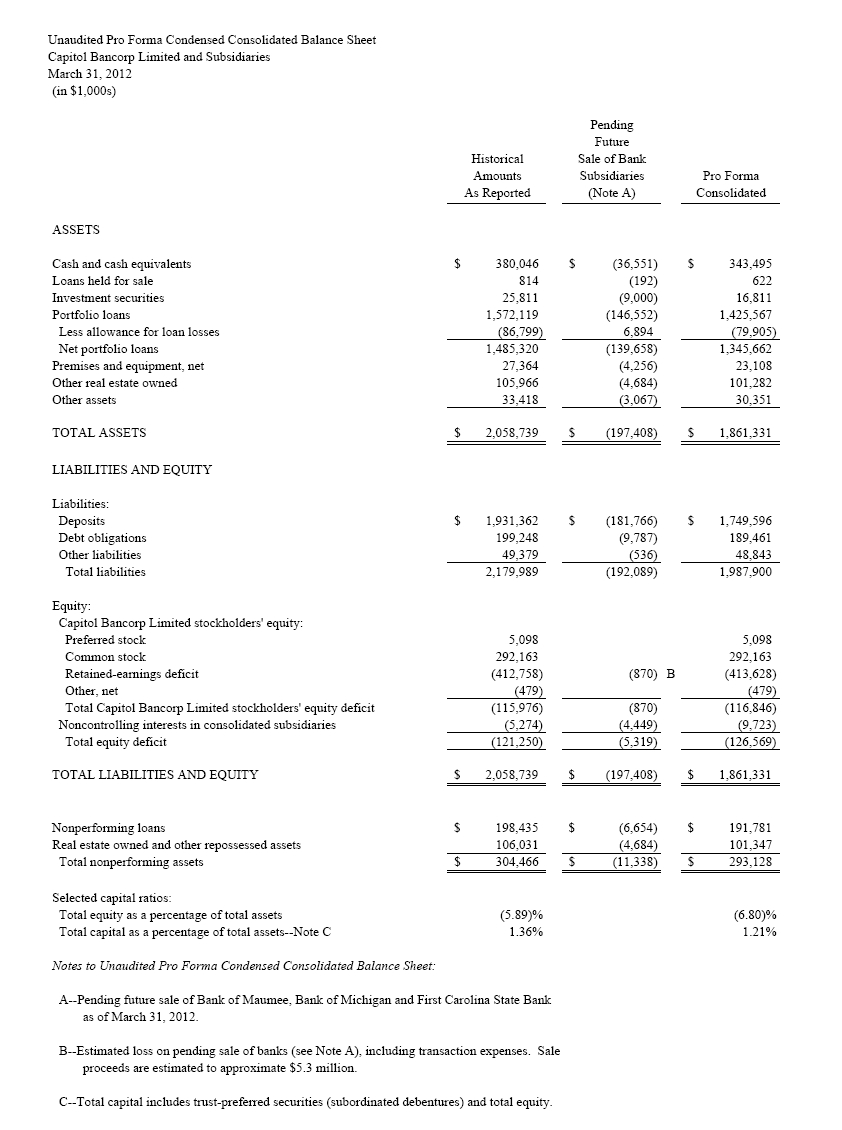
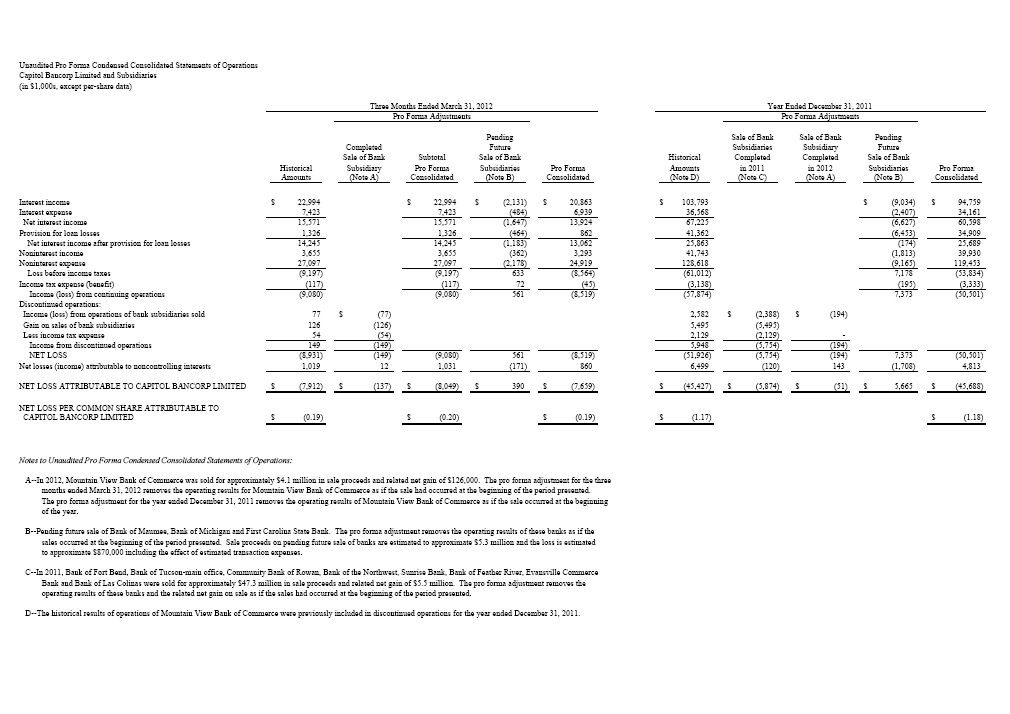
MANAGEMENT'S DISCUSSION AND ANALYSIS OF FINANCIAL CONDITION
AND RESULTS OF OPERATIONS – Continued
Impact of Accounting Standards Updates
There are certain accounting standards updates issued or becoming effective in 2012. They are discussed in Note B of the accompanying condensed consolidated financial statements.
Critical Accounting Policies
Capitol's critical accounting policies are described on pages F-47 – F-50 of the financial section of its 2011 Annual Report. In the circumstances of Capitol, management believes its "critical accounting policies" are those which encompass the use of estimates in determining the allowance for loan losses (because of inherent subjectivity), accounting for income taxes and its consolidation policy.
QUANTITATIVE AND QUALITATIVE DISCLOSURES ABOUT
MARKET RISK
Information about Capitol's quantitative and qualitative disclosures about market risk were included in Capitol's Annual Report on Form 10-K for the year ended December 31, 2011. Capitol does not believe that there has been a material change in the nature or categories of market risk exposure, except as noted in the "Management's Discussion and Analysis of Financial Condition and Results of Operations" section herein (Part I, Item 2), under the caption, "Trends Affecting Operations."
CONTROLS AND PROCEDURES
Evaluation of Disclosure Controls and Procedures
As of the end of the period covered by this Quarterly Report on Form 10-Q, Capitol evaluated the effectiveness of the design and operation of its "disclosure controls and procedures" as defined in Rule 13a-15(e) under the Securities Exchange Act of 1934, as amended (the "Disclosure Controls"). The Disclosure Controls are designed to allow Capitol to reach a reasonable level of assurance that information required to be disclosed by Capitol in the reports it files or submits under the Securities Exchange Act of 1934 is recorded, processed, summarized and reported within the time period specified in the SEC's rules and forms and that such information is accumulated and communicated to management, including its principal executive/financial officer to allow timely decisions regarding required disclosure. The evaluation of the Disclosure Controls ("Controls Evaluation") was conducted under the supervision and with the participation of Capitol's management, including the Chief Executive Officer ("CEO") and the Principal Financial Officer ("PFO"). Based upon the Controls Evaluation and subsequent discussions and actions by Capitol as described in its Annual Report on Form 10-K for the fiscal year ended December 31, 2011 ("Form 10-K") and above, the CEO and PFO have concluded that as of March 31, 2012, Capitol's Disclosure Controls were effective at a reasonable assurance level.
Changes in Internal Controls Over Financial Reporting
During the fiscal quarter ended March 31, 2012, no changes in Capitol's "internal control over financial reporting," as defined in Rule 13a-15(f) under the Securities Exchange Act of 1934, as amended ("Internal Control") have occurred that have materially affected or are reasonably likely to materially affect Capitol's Internal Control.
PART I, ITEM 4
CONTROLS AND PROCEDURES – Continued
Limitations on the Effectiveness of Controls
Capitol's management, including the CEO and PFO, does not expect that its Disclosure Controls and/or its Internal Control will prevent all errors and all fraud. A control system, no matter how well conceived and operated, can provide only reasonable, not absolute, assurance that the objectives of the control system are met. Further, the design of a control system must reflect the fact that there are resource constraints, and the benefits of controls must be considered relative to their costs.
Because of the inherent limitations in all control systems, no evaluation of controls can provide absolute assurance that all control issues and instances of fraud, if any, within Capitol have been detected. These inherent limitations include the realities that judgments in decision-making can be faulty, and that breakdowns can occur because of simple error or mistake. Additionally, controls can be circumvented by the individual acts of some persons, by collusion of two or more people, or by management override of the control. The design of any system of controls also is based in part upon certain assumptions about the likelihood of future events, and there can be no assurance that any design will succeed in achieving its stated goals under all potential future conditions; over time, controls may become inadequate because of changes in conditions, or the degree of compliance with the policies or procedures may deteriorate. Because of the inherent limitations in a cost-effective control system, misstatements due to error or fraud may occur and not be detected.
PART II. OTHER INFORMATION
| Item 1. | Capitol and its subsidiaries are parties to certain ordinary, routine litigation incidental to their business. In the opinion of management, liabilities arising from such litigation would not have a material effect on Capitol's consolidated financial position or results of operations. |
| Item 1A. | During the three months ended March 31, 2012, there were no material changes from the risk factors set forth in Part I, Item 1A, "Risk Factors," of Capitol's Form 10-K for the year ended December 31, 2011. Refer to that section of Capitol's Form 10-K for disclosures regarding the risks and uncertainties related to Capitol's business. |
| Item 2. | |
| | (b) Not applicable. (c) None. |
| Item 3. | None. |
| Item 4. | Not applicable. |
| Item 5. | None. |
PART II. OTHER INFORMATION – Continued
| (a) | (b) |
| Exhibit No. | Description of Exhibit |
| | |
| 31.1 | Certification of Chief Executive Officer, Joseph D. Reid, pursuant to Section 302 of the Sarbanes-Oxley Act of 2002. |
| 31.2 | Certification of Principal Financial Officer, Nicholas G. Hahn, pursuant to Section 302 of the Sarbanes-Oxley Act of 2002. |
| 32.1 | Certification of Chief Executive Officer, Joseph D. Reid, pursuant to Section 906 of the Sarbanes-Oxley Act of 2002. |
| 32.2 | Certification of Principal Financial Officer, Nicholas G. Hahn, pursuant to Section 906 of the Sarbanes-Oxley Act of 2002. |
| 101 | Interactive data files formatted in XBRL (eXtensible Business Reporting Language) pursuant to Rule 405 of Regulation S-T, including: (i) Condensed Consolidated Balance Sheets, (ii) Condensed Consolidated Statements of Operations, (iii) Condensed Consolidated Statements of Changes in Equity, (iv) Condensed Consolidated Statements of Cash Flows and (v) Notes to Condensed Consolidated Financial Statements tagged as blocks of text.* |
| | _______________ |
| | * As provided in Rule 406T of Regulation S-T, the Interactive Data Files on Exhibit 101 are deemed furnished and not filed for purposes of Sections 11 and 12 of the Securities Act of 1933, are deemed not filed for purposes of Section 18 of the Securities Exchange Act of 1934 and otherwise are not subject to liability under those sections. |
Pursuant to the requirements of the Securities Exchange Act of 1934, the registrant has duly caused this report to be signed on its behalf by the undersigned thereunto duly authorized.
| | CAPITOL BANCORP LTD. (Registrant) |
| /s/ Joseph D. Reid Joseph D. Reid Chairman and CEO (principal executive officer) |
| /s/ Nicholas G. Hahn Nicholas G. Hahn Interim Chief Financial Officer (principal financial officer) |
| Exhibit No. | Description of Exhibit |
| 31.1 | Certification of Chief Executive Officer, Joseph D. Reid, pursuant to Section 302 of the Sarbanes-Oxley Act of 2002. |
| 31.2 | Certification of Principal Financial Officer, Nicholas G. Hahn, pursuant to Section 302 of the Sarbanes-Oxley Act of 2002. |
| 32.1 | Certification of Chief Executive Officer, Joseph D. Reid, pursuant to Section 906 of the Sarbanes-Oxley Act of 2002. |
| 32.2 | Certification of Principal Financial Officer, Nicholas G. Hahn, pursuant to Section 906 of the Sarbanes-Oxley Act of 2002. |
| 101 | Interactive data files formatted in XBRL (eXtensible Business Reporting Language) pursuant to Rule 405 of Regulation S-T, including: (i) Condensed Consolidated Balance Sheets, (ii) Condensed Consolidated Statements of Operations, (iii) Condensed Consolidated Statements of Changes in Equity, (iv) Condensed Consolidated Statements of Cash Flows and (v) Notes to Condensed Consolidated Financial Statements tagged as blocks of text.* |
| | _______________ |
| | * As provided in Rule 406T of Regulation S-T, the Interactive Data Files on Exhibit 101 are deemed furnished and not filed for purposes of Sections 11 and 12 of the Securities Act of 1933, are deemed not filed for purposes of Section 18 of the Securities Exchange Act of 1934 and otherwise are not subject to liability under those sections. |