UNITED STATES
SECURITIES AND EXCHANGE COMMISSION
WASHINGTON, D.C. 20549
FORM 10-Q
| T | QUARTERLY REPORT PURSUANT TO SECTION 13 OR 15(d) OF THE |
| | SECURITIES EXCHANGE ACT OF 1934 |
| | For the quarterly period ended March 31, 2011 |
| | OR |
| £ | TRANSITION REPORT PURSUANT TO SECTION 13 OR 15(d) OF THE |
| | SECURITIES EXCHANGE ACT OF 1934 |
| | |
| | For the transition period from ________________ to ________________ |
Commission file number: 001-31708
CAPITOL BANCORP LTD.
(Exact name of registrant as specified in its charter)
| Michigan | | 38-2761672 |
| (State or other jurisdiction of | | (IRS Employer Identification No.) |
| incorporation or organization) | | |
| Capitol Bancorp Center | | |
| Fourth Floor | | |
| 200 N. Washington Square | | |
| Lansing, Michigan | | 48933 |
| (Address of principal executive offices) | | (Zip Code) |
517-487-6555
(Registrant's telephone number, including area code)
Not applicable
(Former name, former address and former fiscal year, if changed since last report)
Indicate by check mark whether the registrant (1) has filed all reports required to be filed by Section 13 or 15(d) of the Securities Exchange Act of 1934 during the preceding 12 months (or for such shorter period that the registrant was required to file such reports), and (2) has been subject to such filing requirements for the past 90 days.
Indicate by check mark whether the registrant has submitted electronically and posted on its corporate web site, if any, every Interactive Data File required to be submitted and posted pursuant to Rule 405 of Regulation S-T (§232.405 of this chapter) during the preceding 12 months (or for such shorter period that the registrant was required to submit and post such files).
Indicate by check mark whether the registrant is a large accelerated filer, an accelerated filer, a non-accelerated filer, or a smaller reporting company. See the definitions of "large accelerated filer," "accelerated filer" and "smaller reporting company" in Rule 12b-2 of the Exchange Act.
Large accelerated filer £ | | | Accelerated filer £ |
Non-accelerated filer £ (Do not check if a smaller reporting company) | | Smaller reporting company T |
Indicate by check mark whether the registrant is a shell company (as defined in Rule 12b-2 of the Exchange Act).
Indicate the number of shares outstanding of each of the issuer's classes of common stock, as of the latest practicable date.
| Class | | Outstanding at April 30, 2011 |
| Common Stock, No par value | | 41,122,057 shares |
INDEX
PART I. FINANCIAL INFORMATION
Forward-Looking Statements
Some statements contained in this document, including consolidated financial statements of Capitol Bancorp Limited (Capitol or the Corporation), Management's Discussion and Analysis of Financial Condition and Results of Operations and in documents incorporated into this document by reference that are not historical facts, including, without limitation, statements of future expectations, projections of results of operations and financial condition, statements of future economic performance and other forward-looking statements within the meaning of the Private Securities Litigation Reform Act of 1995, are subject to known and unknown risks, uncertainties and other factors which may cause actual future results, performance or achievements of Capitol and/or its subsidiaries and other operating units to differ materially from those contemplated in such forward-looking statements. The words "intend," "expect," "project," "estimate," "predict," "anticipate," "should," "could," "believe," "may," "might," and similar expressions also are intended to identify forward-looking statements. Important factors which may cause actual results to differ from those contemplated in such forward-looking statements include, but are not limited to: (i) the results of Capitol's efforts to implement its business strategy, (ii) changes in interest rates, (iii) legislation or regulatory requirements adversely impacting Capitol's banking business and/or operating strategy, (iv) adverse changes in business conditions or inflation, (v) general economic conditions, either nationally or regionally, which are less favorable than expected and that result in, among other things, a deterioration in credit quality and/or loan performance and collectability, (vi) competitive pressures among financial institutions, (vii) changes in securities markets, (viii) actions of competitors of Capitol's banks and Capitol's ability to respond to such actions, (ix) the cost of and access to capital, which may depend in part on Capitol's asset quality, prospects and outlook, (x) changes in governmental regulation, tax rates and similar matters, (xi) changes in management, (xii) consummation of pending sales of certain bank subsidiaries, (xiii) completion of Capitol's selective bank divestiture activities, (xiv) other risks detailed in Capitol's other filings with the Securities and Exchange Commission (SEC), and (xv) the following, among others:
· Capitol's ability to continue as a going concern;
· The impact on Capitol's financial results, reputation and business if it is unable to comply with all applicable federal and state regulations and applicable formal agreements, consent orders, other regulatory actions and any related capital requirements;
· Management's ability to effectively manage interest rate risk and the impact of interest rates, in general, on the volatility of Capitol's net interest income;
· The effect of the Dodd-Frank Wall Street Reform and Consumer Protection Act of 2010, Emergency Economic Stabilization Act of 2008, the American Recovery and Reinvestment Act of 2009, the implementation by the Department of the U.S. Treasury and federal banking regulators of a number of programs to address capital and liquidity issues within the banking system and additional programs that may apply to Capitol in the future, all of which may have significant effects on Capitol and the financial services industry;
· The decline in commercial and residential real estate values and sales volume and the likely potential for continuing illiquidity in the real estate market;
· The risks associated with the high concentration of commercial real estate loans within Capitol's portfolio;
· The uncertainties in estimating the fair value of developed real estate and undeveloped land relating to collateral-dependent loans and other real estate owned in light of declining demand for such assets, falling prices and continuing illiquidity in the real estate market;
· Negative developments and disruptions in the credit and lending markets, including the impact of the ongoing credit crisis on Capitol's business and on the businesses of its customers as well as other banks and lending institutions with which Capitol has commercial relationships;
· A continuation of unprecedented volatility in the capital markets;
· The risks associated with implementing Capitol's business strategy, including its ability to preserve and access sufficient capital to execute its strategy;
INDEX – Continued
PART I. FINANCIAL INFORMATION – Continued
Forward-Looking Statements – Continued
· Continued unemployment and its impact on Capitol's customers' savings rates and their ability to service debt obligations;
· Fluctuations in the value of Capitol's investment securities;
· The ability to attract and retain senior management experienced in banking and financial services;
· The sufficiency of the allowance for loan losses to absorb the amount of actual losses inherent within the loan portfolio;
· Capitol's ability to adapt successfully to technological changes to compete effectively in the marketplace;
· Credit risks and risks from concentrations (by geographic area and by industry) within each of Capitol's subsidiary banks' loan portfolio and individual large loans;
· The effects of competition from other commercial banks, thrifts, mortgage banking firms, consumer finance companies, credit unions, securities brokerage firms, insurance companies, money market and other mutual funds, and other financial institutions operating in Capitol's market or elsewhere or providing similar services;
· The failure of assumptions underlying estimates for the allowance for loan losses and estimation of values of collateral or cash flow projections related to collateral-dependent loans;
· Volatility of rate-sensitive deposits;
· Operational risks, including data processing system failures or fraud;
· Liquidity risks;
· The ability to successfully acquire deposits for funding and the pricing thereof;
· The ability to successfully execute strategies to increase noninterest income;
· Changes in the economic environment, competition or other factors that may influence loan demand and repayment, deposit inflows and outflows, and the quality of the loan portfolio and loan and deposit pricing;
· The impact from liabilities arising from legal or administrative proceedings on the financial condition of Capitol;
· The current prohibition of Capitol's subsidiary banks to pay dividends to Capitol without prior written authorization from regulatory agencies;
· The current prohibition of Capitol's payment of cash dividends on its common stock and periodic payments on its trust-preferred securities without prior written regulatory authorization;
· Administrative or enforcement actions of banking regulators in connection with any material failure of Capitol or its subsidiary banks to comply with banking laws, rules or regulations or formal agreements with regulatory agencies;
· Capitol's compliance with the terms of its written agreement with the Federal Reserve Bank, amendments thereto or subsequent regulatory agreements;
· The continued availability of credit facilities provided by Federal Home Loan Banks to Capitol's banking subsidiaries;
INDEX – Continued
PART I. FINANCIAL INFORMATION – Continued
Forward-Looking Statements – Continued
· The uncertainties of future depositor activity regarding potentially uninsured deposits;
· The possibility of the Federal Deposit Insurance Corporation (FDIC) assessing Capitol's banking subsidiaries for any cross-guaranty liability;
· Governmental monetary and fiscal policies, as well as legislative and regulatory changes, that may result in the imposition of costs and constraints on Capitol through higher FDIC insurance premiums, significant fluctuations in market interest rates, increases in capital requirements and operational limitations;
· Changes in general economic or industry conditions, nationally or in the communities in which Capitol conducts business;
· Changes in legislation or regulatory and accounting principles, policies, or guidelines affecting the business conducted by Capitol;
· The impact of possible future material impairment charges;
· Acts of war or terrorism;
· Capitol's ability to manage fluctuations in the value of its assets and liabilities and maintain sufficient capital and liquidity to support its operations;
· The concentration of Capitol's nonperforming assets by loan type in certain geographic regions and with affiliated borrowing groups;
· The risk of additional future losses if the proceeds Capitol receives upon the liquidation of assets are less than the carrying value of such assets;
· Restrictions or limitations on access to funds from subsidiaries and potential obligations to contribute additional capital to Capitol's subsidiaries, which may restrict its ability to make payments on its obligations;
· The availability and cost of capital and liquidity on favorable terms, if at all;
· The risk that the realization of deferred tax assets may not occur;
· The risk that Capitol may not be able to complete its various proposed divestitures, mergers and consolidations of certain of its subsidiary banks or, if completed, realize the anticipated benefits of the proposed mergers and/or consolidations;
· The costs, effects and impact of litigation, investigations, inquiries or similar matters, or adverse facts and developments related thereto;
· The risk that Capitol could have an "ownership change" under Section 382 of the Internal Revenue Code, which could impair its ability to timely and fully utilize its net operating losses for tax purposes and so-called built-in losses that may exist if such an "ownership change" occurs;
· Other factors and other information contained in this document and in other reports and filings that Capitol makes with the SEC under the Exchange Act, including, without limitation, under the caption "Risk Factors"; and
· Other economic, competitive, governmental, regulatory, and technical factors affecting Capitol's operations, products, services and prices.
INDEX – Continued
PART I. FINANCIAL INFORMATION – Continued
Forward-Looking Statements – Continued
For a discussion of these and other risks that may cause actual results to differ from expectations, you should refer to the risk factors and other information in this Form 10-Q and Capitol's other periodic filings, including its 2010 Annual Report on Form 10-K, quarterly reports on Form 10-Q and current reports on Form 8-K, that Capitol files from time to time with the SEC. All written or oral forward-looking statements that are made by or are attributable to Capitol are expressly qualified by this cautionary notice.
Should one or more of these risks or uncertainties materialize, or should underlying assumptions prove incorrect, actual outcomes may vary materially from those indicated. All subsequent written or oral forward-looking statements attributable to Capitol or persons acting on its behalf are expressly qualified in their entirety by the foregoing factors. Investors and other interested parties are cautioned not to place undue reliance on such statements, which speak as of the date of such statements. Capitol undertakes no obligation to release publicly any revisions to these forward-looking statements to reflect events or circumstances after the date of such statements or to reflect the occurrence of unanticipated events.
Item 1. | Financial Statements (unaudited): | Page |
| | Condensed consolidated balance sheets – March 31, 2011 and December 31, 2010. | 6 |
| | Condensed consolidated statements of operations – Three months ended March 31, 2011 and 2010. | 7 |
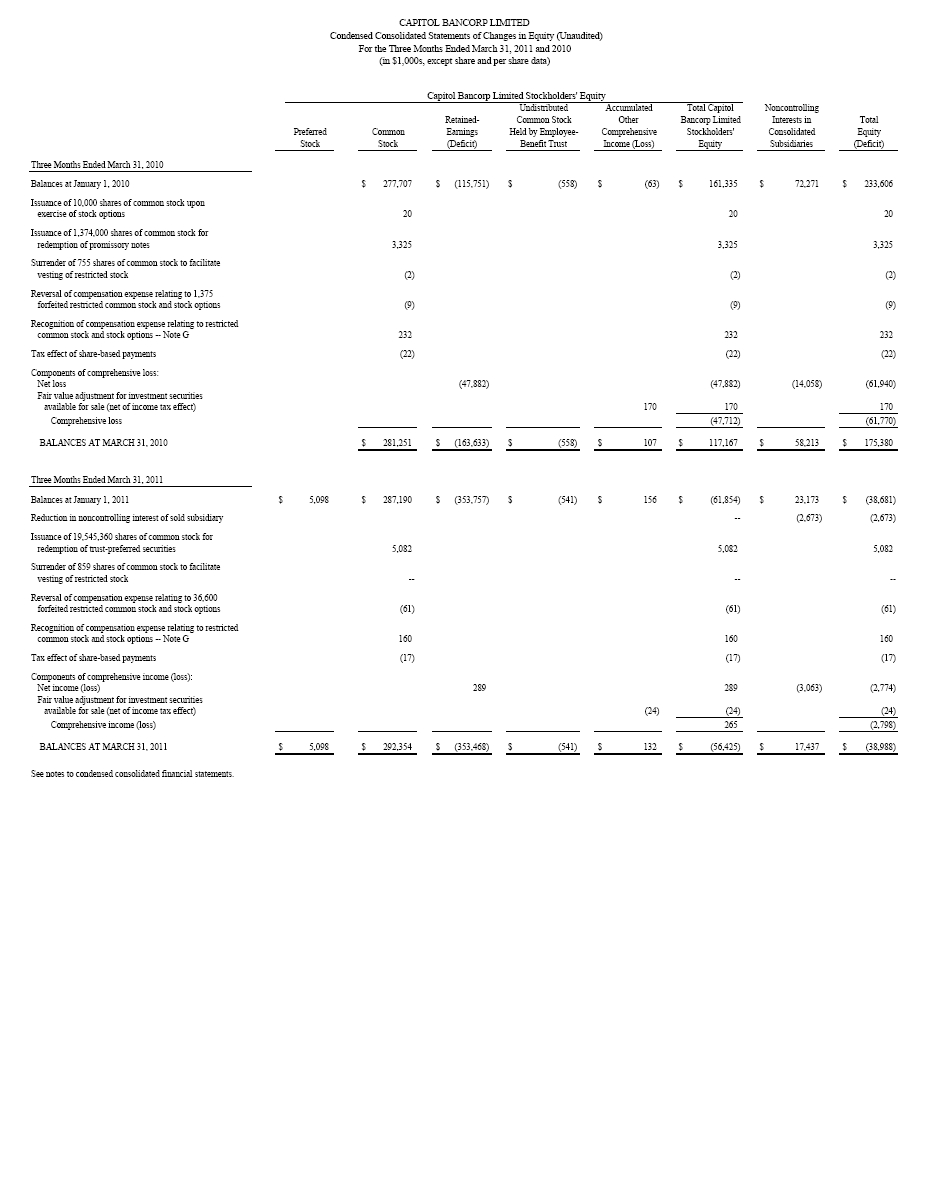
| | Condensed consolidated statements of changes in equity – Three months ended March 31, 2011 and 2010. | 8 |
| | Condensed consolidated statements of cash flows – Three months ended March 31, 2011 and 2010. | 9 |
| | Notes to condensed consolidated financial statements. | 10 |
| Item 2. | Management's Discussion and Analysis of Financial Condition and Results of Operations. | 30 |
| Item 3. | Quantitative and Qualitative Disclosures About Market Risk. | 49 |
| Item 4. | Controls and Procedures. | 49 |
PART II. | OTHER INFORMATION | |
Item 1. | Legal Proceedings. | 50 |
| Item 1A. | Risk Factors. | 50 |
| Item 2. | Unregistered Sales of Equity Securities and Use of Proceeds. | 50 |
| Item 3. | Defaults Upon Senior Securities. | 50 |
| Item 4. | [Removed and Reserved.] | 50 |
| Item 5. | Other Information. | 50 |
| Item 6. | Exhibits. | 55 |
SIGNATURES | | 56 |
EXHIBIT INDEX | | 57 |
[The remainder of this page intentionally left blank]
| PART I, ITEM 1 | |
| | |
| CAPITOL BANCORP LIMITED | |
| Condensed Consolidated Balance Sheets | |
| As of March 31, 2011 and December 31, 2010 | |
| (in $1,000s, except share and per-share data) | |
| | | | | | | | |
| | | | (Unaudited) | | | | |
| | | | March 31, | | | December 31, | |
| | | | 2011 | | | 2010 | |
| ASSETS | | | | | | | |
| Cash and due from banks | | | $ | 77,008 | | | $ | 56,709 | |
| Money market and interest-bearing deposits | | | | 459,002 | | | | 477,639 | |
| Federal funds sold | | | | 484 | | | | 413 | |
| | Cash and cash equivalents | | | 536,494 | | | | 534,761 | |
| Loans held for sale | | | | 1,710 | | | | 6,900 | |
| Investment securities -- Note C: | | | | | | | | | |
| Available for sale, carried at fair value | | | | 20,954 | | | | 17,482 | |
| Held for long-term investment, carried at | | | | | | | | | |
| amortized cost which approximates fair value | | | 2,330 | | | | 2,893 | |
| | Total investment securities | | | 23,284 | | | | 20,375 | |
| Federal Home Loan Bank and Federal Reserve | | | | | | | | |
| Bank stock (carried on the basis of cost) -- Note C | | | 17,811 | | | | 17,001 | |
| Portfolio loans -- Note D: | | | | | | | | | |
| Loans secured by real estate: | | | | | | | | | |
| Commercial | | | | 1,346,584 | | | | 1,374,791 | |
| Residential (including multi-family) | | | | 497,315 | | | | 518,943 | |
| Construction, land development and other land | | | 216,993 | | | | 230,788 | |
| | Total loans secured by real estate | | | 2,060,892 | | | | 2,124,522 | |
| Commercial and other business-purpose loans | | | 350,873 | | | | 375,968 | |
| Consumer | | | | 22,066 | | | | 23,375 | |
| Other | | | | 16,890 | | | | 15,133 | |
| | Total portfolio loans | | | 2,450,721 | | | | 2,538,998 | |
| Less allowance for loan losses | | | | (136,681 | ) | | | (144,985 | ) |
| | Net portfolio loans | | | 2,314,040 | | | | 2,394,013 | |
| Premises and equipment | | | | 34,212 | | | | 35,203 | |
| Accrued interest income | | | | 8,526 | | | | 8,628 | |
| Other real estate owned | | | | 110,829 | | | | 106,835 | |
| Other assets | | | | 15,555 | | | | 17,965 | |
| Assets of discontinued operations -- Note E | | | | 134,501 | | | | 398,533 | |
| | | | | | | | | | |
| TOTAL ASSETS | | | $ | 3,196,962 | | | $ | 3,540,214 | |
| | | | | | | | | | |
| LIABILITIES AND EQUITY | | | | | | | | | |
| LIABILITIES: | | | | | | | | | |
| Deposits: | | | | | | | | | |
| Noninterest-bearing | | | $ | 531,455 | | | $ | 500,809 | |
| Interest-bearing | | | | 2,276,515 | | | | 2,373,492 | |
| | Total deposits | | | 2,807,970 | | | | 2,874,301 | |
| Debt obligations: | | | | | | | | | |
| Notes payable and other borrowings | | | | 106,052 | | | | 117,377 | |
| Subordinated debentures -- Note I | | | | 149,080 | | | | 167,586 | |
| | Total debt obligations | | | 255,132 | | | | 284,963 | |
| Accrued interest on deposits and other liabilities | | | 48,049 | | | | 50,271 | |
| Liabilities of discontinued operations -- Note E | | | 124,799 | | | | 369,360 | |
| | Total liabilities | | | 3,235,950 | | | | 3,578,895 | |
| | | | | | | | | | |
| EQUITY: | | | | | | | | | |
| Capitol Bancorp Limited stockholders' equity -- Notes G and L: | | | | | | | | |
| Preferred stock (Series A), 700,000 shares authorized | | | | | | | | |
| ($100 per-share liquidation preference); 50,980 shares | | | | | | | | |
| issued and outstanding | | | | 5,098 | | | | | |
| Preferred stock (for potential future issuance), | | | | | | | | |
| 19,300,000 shares authorized (none issued and outstanding) | | | -- | | | | -- | |
| Common stock, no par value, 1,500,000,000 shares authorized; | | | | | | | | |
| issued and outstanding: 2011 - 41,122,757 shares | | | | | | | | |
| 2010 - 21,614,856 shares | | | 292,354 | | | | 287,190 | |
| Retained-earnings deficit | | | | (353,468 | ) | | | (353,757 | ) |
| Undistributed common stock held by employee-benefit trust | | | (541 | ) | | | (541 | ) |
| Fair value adjustment (net of tax effect) for investment securities | | | | | | | | |
| available for sale (accumulated other comprehensive income) | | | 132 | | | | 156 | |
| Total Capitol Bancorp Limited stockholders' equity deficit | | | (56,425 | ) | | | (61,854 | ) |
| Noncontrolling interests in consolidated subsidiaries | | | 17,437 | | | | 23,173 | |
| | Total equity deficit | | | (38,988 | ) | | | (38,681 | ) |
| | | | | | | | | | |
| TOTAL LIABILITIES AND EQUITY | | $ | 3,196,962 | | | $ | 3,540,214 | |
| | | | | | | | | | |
| See notes to condensed consolidated financial statements. | | | | | | | | |
| CAPITOL BANCORP LIMITED |
| Condensed Consolidated Statements of Operations (Unaudited) |
| For the Three Months Ended March 31, 2011 and 2010 |
| (in $1,000s, except per share data) |
| | | | |
| | 2011 | | | 2010 | |
| Interest income: | | | | | | |
| Portfolio loans (including fees) | | $ | 34,792 | | | $ | 41,796 | |
| Loans held for sale | | | 29 | | | | 60 | |
| Taxable investment securities | | | 54 | | | | 222 | |
| Federal funds sold | | | 2 | | | | 5 | |
| Other | | | 454 | | | | 485 | |
| Total interest income | | | 35,331 | | | | 42,568 | |
| Interest expense: | | | | | | | | |
| Deposits | | | 8,027 | | | | 13,300 | |
| Debt obligations and other | | | 3,113 | | | | 4,428 | |
| Total interest expense | | | 11,140 | | | | 17,728 | |
| Net interest income | | | 24,191 | | | | 24,840 | |
| Provision for loan losses -- Note D | | | 13,467 | | | | 47,364 | |
| Net interest income (deficiency) after | | | | | |
| provision for loan losses | | | 10,724 | | | | (22,524 | ) |
| Noninterest income: | | | | | | | | |
| Service charges on deposit accounts | | | 905 | | | | 978 | |
| Trust and wealth-management revenue | | | 944 | | | | 1,152 | |
| Fees from origination of non-portfolio residential | | | | | | | | |
| mortgage loans | | | 268 | | | | 382 | |
| Gain on sale of government-guaranteed loans | | | 527 | | | | 113 | |
| Gain on exchange of trust-preferred securities for | | | | | | | | |
| common stock -- Note I | | | 16,861 | | | | -- | |
| Gain on exchange of promissory notes for common | | | | | | | | |
| stock | | | -- | | | | 1,255 | |
| Realized gain on sale of investment securities available | | | | | |
| for sale | | | -- | | | | 14 | |
| Other | | | 1,887 | | | | 2,330 | |
| Total noninterest income | | | 21,392 | | | | 6,224 | |
| Noninterest expense: | | | | | | | | |
| Salaries and employee benefits | | | 15,529 | | | | 18,223 | |
| Occupancy | | | 3,612 | | | | 3,751 | |
| Equipment rent, depreciation and maintenance | | | 2,187 | | | | 2,669 | |
| Costs associated with foreclosed properties and other | | | | | | | | |
| real estate owned | | | 7,497 | | | | 11,593 | |
| FDIC insurance premiums and other regulatory fees | | | 3,296 | | | | 4,134 | |
| Other | | | 7,800 | | | | 6,691 | |
| Total noninterest expense | | | 39,921 | | | | 47,061 | |
| Loss before income tax benefit | | | (7,805 | ) | | | (63,361 | ) |
| Income tax benefit | | | (2,135 | ) | | | (482 | ) |
| Loss from continuing operations | | | (5,670 | ) | | | (62,879 | ) |
| Discontinued operations -- Note E: | | | | | | | | |
| Income from operations of bank subsidiaries sold | | | 16 | | | | 1,533 | |
| Gain on sale of bank subsidiaries | | | 4,368 | | | | -- | |
| Less income tax expense | | | 1,488 | | | | 594 | |
| Income from discontinued operations | | | 2,896 | | | | 939 | |
| NET LOSS | | | (2,774 | ) | | | (61,940 | ) |
| Net losses attributable to noncontrolling interests in | | | | | | | | |
| consolidated subsidiaries | | | 3,063 | | | | 14,058 | |
| | | | | | | | | |
| NET INCOME (LOSS) ATTRIBUTABLE TO CAPITOL | | | | | | | | |
| BANCORP LIMITED | | $ | 289 | | | $ | (47,882 | ) |
| | | | | | | | | |
| NET INCOME (LOSS) PER COMMON SHARE ATTRIBUTABLE | | | | | |
| TO CAPITOL BANCORP LIMITED -- Note H | | $ | 0.01 | | | $ | (2.75 | ) |
| | | | | | | | | |
| See notes to condensed consolidated financial statements. | | | | | | | | |
| | | | | | | | | |
| CAPITOL BANCORP LTD. |
| Condensed Consolidated Statements of Cash Flows (Unaudited) |
| For the Three Months Ended March 31, 2011 and 2010 |
| (in $1,000s) |
| | | | | | | |
| | | 2011 | | | 2010 | |
| | | | | | | |
| OPERATING ACTIVITIES | | | | | | |
| Net loss | | $ | (2,774 | ) | | $ | (61,940 | ) |
| Adjustments to reconcile net loss to net cash provided | | | | | | | | |
| by operating activities (including discontinued operations): | | | | | | | | |
| Provision for loan losses | | | 13,961 | | | | 50,100 | |
| Depreciation of premises and equipment | | | 1,597 | | | | 2,199 | |
| Amortization of intangibles | | | -- | | | | 61 | |
| Net amortization of investment security premiums | | | 3 | | | | 266 | |
| Loss on sale of premises and equipment | | | 4 | | | | 1 | |
| Gain on sale of government-guaranteed loans | | | (786 | ) | | | (462 | ) |
| Gain on sale of bank subsidiaries | | | (4,368 | ) | | | -- | |
| Gain on debt extinguishment | | | (16,861 | ) | | | (1,255 | ) |
| Realized gain on sale of investment securities available for sale | | | -- | | | | (14 | ) |
| Loss on sale of other real estate owned | | | 134 | | | | 1,774 | |
| Write-down of other real estate owned | | | 4,223 | | | | 8,620 | |
| Amortization of issuance costs of subordinated debentures | | | 25 | | | | 37 | |
| Share-based compensation expense | | | 99 | | | | 223 | |
| Deferred income tax credit | | | (230 | ) | | | (267 | ) |
| Valuation allowance for deferred income tax assets | | | -- | | | | 283 | |
| Originations and purchases of loans held for sale | | | (9,516 | ) | | | (29,344 | ) |
| Proceeds from sales of loans held for sale | | | 14,847 | | | | 38,598 | |
| Decrease in accrued interest income and other assets | | | 17,262 | | | | 8,720 | |
| Increase (decrease) in accrued interest expense on deposits and | | | | | | | | |
| other liabilities | | | 1,187 | | | | (2,264 | ) |
| | | | | | | | | |
| NET CASH PROVIDED BY OPERATING ACTIVITIES | | | 18,807 | | | | 15,336 | |
| | | | | | | | | |
| INVESTING ACTIVITIES | | | | | | | | |
| Proceeds from sales of investment securities available for sale | | | 488 | | | | 23,664 | |
| Proceeds from calls, prepayments and maturities of investment | | | | | | | | |
| securities | | | 6,766 | | | | 7,164 | |
| Purchases of investment securities | | | (10,265 | ) | | | (2,307 | ) |
| Redemption of Federal Home Loan Bank stock by issuer | | | 42 | | | | 225 | |
| Purchase of Federal Home Loan Bank stock | | | (849 | ) | | | (87 | ) |
| Net decrease in portfolio loans | | | 40,531 | | | | 66,679 | |
| Proceeds from sales of government-guaranteed loans | | | 11,628 | | | | 10,570 | |
| Proceeds from sales of premises and equipment | | | 50 | | | | 112 | |
| Purchases of premises and equipment | | | (592 | ) | | | (254 | ) |
| Proceeds from sale of bank subsidiaries | | | 8,869 | | | | -- | |
| Payments received on other real estate owned | | | 14 | | | | -- | |
| Proceeds from sales of other real estate owned | | | 7,988 | | | | 11,605 | |
| | | | | | | | | |
| NET CASH PROVIDED BY INVESTING ACTIVITIES | | | 64,670 | | | | 117,371 | |
| | | | | | | | | |
| FINANCING ACTIVITIES | | | | | | | | |
| Net increase in demand deposits, NOW accounts and savings accounts | | | 42,353 | | | | 37,607 | |
| Net increase (decrease) in certificates of deposit | | | (112,350 | ) | | | 6,121 | |
| Net borrowings from debt obligations | | | 425 | | | | 56 | |
| Proceeds from Federal Home Loan Bank borrowings | | | 91,350 | | | | 271,380 | |
| Payments on Federal Home Loan Bank borrowings | | | (103,250 | ) | | | (317,135 | ) |
| Net proceeds from issuance of common stock | | | -- | | | | 20 | |
| Tax effect of share-based payments | | | (17 | ) | | | (22 | ) |
| | | | | | | | | |
| NET CASH USED BY FINANCING ACTIVITIES | | | (81,489 | ) | | | (1,973 | ) |
| | | | | | | | | |
| INCREASE IN CASH AND CASH EQUIVALENTS | | | 1,988 | | | | 130,734 | |
| | | | | | | | | |
| Change in cash and cash equivalents of discontinued operations | | | (255 | ) | | | (28,947 | ) |
| | | | | | | | | |
| Cash and cash equivalents at beginning of period | | | 534,761 | | | | 667,881 | |
| | | | | | | | | |
| CASH AND CASH EQUIVALENTS AT END OF PERIOD | | $ | 536,494 | | | $ | 769,668 | |
| | | | | | | | | |
| Supplemental disclosures: | | | | | | | | |
| Cash paid during the period for interest on deposits and debt obligations | | $ | 11,914 | | | $ | 21,387 | |
| Transfers of loans to other real estate owned | | | 17,671 | | | | 20,194 | |
| Surrender of common stock to facilitate vesting of restricted stock | | | -- | | | | 2 | |
| Exchange of common stock for redemption of debt | | | 5,082 | | | | 3,325 | |
| | | | | | | | | |
| See notes to condensed consolidated financial statements. | | | | | | | | |
NOTES TO CONDENSED CONSOLIDATED FINANCIAL STATEMENTS
Note A – Basis of Presentation
The accompanying unaudited condensed consolidated financial statements of Capitol Bancorp Limited (Capitol or the Corporation) have been prepared in accordance with generally accepted accounting principles for interim financial information and with the instructions for Form 10-Q. Accordingly, they do not include all information and footnotes necessary for a fair presentation of consolidated financial position, results of operations and cash flows in conformity with accounting principles generally accepted in the United States of America.
The condensed consolidated financial statements do, however, include all adjustments of a normal recurring nature (in accordance with Rule 10-01(b)(8) of Regulation S-X) which Capitol considers necessary for a fair presentation of the interim periods.
The results of operations for the period ended March 31, 2011 are not necessarily indicative of the results to be expected for the year ending December 31, 2011.
The consolidated balance sheet as of December 31, 2010 was derived from audited consolidated financial statements as of that date. Certain 2010 amounts have been reclassified to conform to the 2011 presentation.
Capitol's ability to continue to operate as a going concern is contingent upon a number of factors which are discussed on page 41 of this document, as well as a variety of risk factors discussed elsewhere in this document and Capitol's other filings with the SEC. Capitol's auditors included a going concern qualification in the most recent report on the Corporation's audited consolidated financial statements as of December 31, 2010.
Note B – Accounting Standards Updates
In January 2010, an accounting standards update regarding fair value measurements and disclosures was issued to require more robust disclosures about (1) different classes of assets and liabilities measured at fair value, (2) valuation techniques and inputs used, (3) the activity in Level 3 fair-value measurements and (4) the transfers between Levels 1, 2, and 3 of fair-value estimates. The new disclosures became effective for the Corporation beginning January 1, 2010, except for the disclosures about purchases, sales, issuances and settlements in the rollforward of activity in Level 3 fair-value measurements which became effective beginning January 1, 2011. These new disclosures did not have a material effect on the Corporation's consolidated financial statements upon implementation.
In July 2010, an accounting standards update was issued which requires significant new disclosures on a disaggregated basis about the allowance for loan losses and the credit quality of loans. Under this standards update, a rollforward of the allowance for loan losses with the ending balance further disaggregated on the basis of the impairment methods used to establish loss estimates, along with the related ending loan balances and significant purchases and sales of loans during the period are to be disclosed by portfolio segment or classification used for reporting purposes. Additional disclosures are required by class of loan, including credit quality, aging of past-due loans, nonaccrual status and impairment information. Disclosure of the nature and extent of troubled debt restructurings that occur during the period and their effect on the allowance for loan losses, as well as the effect on the allowance regarding troubled debt restructurings that occur within the prior 12 months that defaulted during the current reporting period, will also be required. The disclosures are to be presented at the level of disaggregation that management uses when assessing and monitoring the loan portfolio's risk and performance.
The majority of the disclosures under this new guidance, which are required as of the end of a reporting period, were first implemented in 2010 and are set forth in Note D. The disclosures about activity that occurs during a reporting period, except for the disclosures related to troubled debt restructurings which were further delayed as noted below, became effective January 1, 2011 and did not have an effect on the Corporation's consolidated financial statements upon implementation except for expanded disclosures therein as set forth in Note D.
NOTES TO CONDENSED CONSOLIDATED FINANCIAL STATEMENTS
CAPITOL BANCORP LIMITED – Continued
Note B – Accounting Standards Updates – Continued
In April 2011, an accounting standards update was issued clarifying what constitutes a troubled debt restructuring. When performing the evaluation of whether a loan modification or restructuring constitutes a troubled debt restructuring, a creditor must separately conclude that both of the following exist: (1) the modification constitutes a concession and (2) the debtor is experiencing financial difficulties as defined by the guidance. This guidance also clarifies that a creditor is precluded from using the borrower's effective interest rate test when performing this evaluation. For identification and disclosure purposes, this new guidance is effective beginning in the third quarter of 2011 and is to be applied retrospectively to modifications occurring on or after January 1, 2011 that remain outstanding at September 30, 2011. The guidance requires disclosure of the total recorded investment and allowance for loan losses for newly-identified troubled debt restructurings, based on the new guidance, as of September 30, 2011. The previously-deferred troubled debt restructuring activity related disclosures will be concurrently required. Management has not completed its analysis of this new guidance, however, does not expect the new guidance will have a material effect on the Corporation's consolidated financial statements upon implementation beginning in the third quarter of 2011.
In April 2011, an accounting standards update was issued to improve financial reporting of repurchase agreements and other agreements that both entitle and obligate a transferor to repurchase or redeem financial assets on substantially the agreed upon terms. This standard eliminates consideration of the transferor's ability to fulfill its contractual rights and obligations from the criteria, as well as related implementation guidance (i.e., that it possesses adequate collateral to fund substantially all the cost of purchasing replacement financial assets), in determining effective control, even in the event of default by the transferee. Other criteria applicable to the assessment of effective control are not changed by this new guidance. This new guidance will become effective January 1, 2012 and management does not expect it to have a material effect on the Corporation's results of operations or financial position upon implementation.
Note C – Investment Securities
Investments in Federal Home Loan Bank and Federal Reserve Bank stock are combined and classified separately from investment securities in the condensed consolidated balance sheet, are restricted and may only be resold to, or redeemed by, the issuer.
Investment securities consisted of the following (in $1,000s):
| | | March 31, 2011 | | | December 31, 2010(1) | |
| | | Amortized Cost | | | Estimated Fair Value | | | Amortized Cost | | | Estimated Fair Value | |
| Available for sale: | | | | | | | | | | | | |
| United States treasury | | $ | 4,041 | | | $ | 4,045 | | | $ | 503 | | | $ | 506 | |
| United States government agency | | | 12,847 | | | | 12,856 | | | | 12,664 | | | | 12,680 | |
| Mortgage-backed | | | 3,518 | | | | 3,676 | | | | 3,758 | | | | 3,918 | |
| Municipalities | | | 370 | | | | 377 | | | | 371 | | | | 378 | |
| | | | 20,776 | | | | 20,954 | | | | 17,296 | | | | 17,482 | |
| Held for long-term investment: | | | | | | | | | | | | | | | | |
Capitol Development Bancorp Limited III | | | 457 | | | | 457 | | | | 463 | | | | 463 | |
| Corporate | | | 1,873 | | | | 1,873 | | | | 2,430 | | | | 2,430 | |
| | | | 2,330 | | | | 2,330 | | | | 2,893 | | | | 2,893 | |
| | | | | | | | | | | | | | | | | |
| | | $ | 23,106 | | | $ | 23,284 | | | $ | 20,189 | | | $ | 20,375 | |
(1) Excludes amounts related to discontinued operations.
NOTES TO CONDENSED CONSOLIDATED FINANCIAL STATEMENTS
CAPITOL BANCORP LIMITED – Continued
Note C – Investment Securities – Continued
Securities held for long-term investment are not subject to the classification and accounting rules relating to most typical investments. In addition, Capitol's corporate investments consist mostly of equity-method investments in non-public enterprises which, accordingly, are outside of the scope of accounting rules for most typical investments which often require use of estimated fair value. Those entities, which are primarily involved in making equity investments in or financing small businesses, use the fair value method of accounting in valuing their investment portfolios. Notwithstanding that those investments are outside the scope of such accounting rules, they are included in Capitol's investment securities for financial reporting purposes to summarize all such investment securities together for reporting purposes.
Gross unrealized gains and losses on investment securities available for sale were as follows (in $1,000s):
| | | March 31, 2011 | | | December 31, 2010 | |
| | | Gains | | | Losses | | | Gains | | | Losses | |
| | | | | | | | | | | | | |
| United States treasury | | $ | 4 | | | | | | $ | 3 | | | | |
| United States government agency | | | 15 | | | $ | 6 | | | | 17 | | | $ | 1 | |
| Mortgage-backed | | | 158 | | | | | | | | 160 | | | | | |
| Municipalities | | | 7 | | | | | | | | 7 | | | | | |
| | | | | | | | | | | | | | | | | |
| | | $ | 184 | | | $ | 6 | | | $ | 187 | | | $ | 1 | |
The age of gross unrealized losses and carrying value (at estimated fair value) of securities available for sale are summarized below (in $1,000s):
| | | March 31, 2011 | | | December 31, 2010 | |
| | | Unrealized Loss | | | Carrying Value | | | Unrealized Loss | | | Carrying Value | |
| | | | | | | | | | | | | |
| One year or less: | | | | | | | | | | | | |
| United States government agency | | $ | 6 | | | $ | 5,002 | | | $ | 1 | | | $ | 4,794 | |
Gross realized gains and losses from sales and maturities of investment securities were insignificant for the periods presented.
Scheduled maturities of investment securities held as of March 31, 2011 were as follows (in $1,000s):
| | | Amortized Cost | | | Estimated Fair Value | |
| | | | | | | |
| Due in one year or less | | $ | 4,561 | | | $ | 4,567 | |
| After one year, through five years | | | 8,286 | | | | 8,307 | |
| After five years, through ten years | | | 690 | | | | 717 | |
| After ten years | | | 7,239 | | | | 7,363 | |
| Securities held for long-term investment | | | | | | | | |
| without stated maturities | | | 2,330 | | | | 2,330 | |
| | | | | | | | | |
| | | $ | 23,106 | | | $ | 23,284 | |
NOTES TO CONDENSED CONSOLIDATED FINANCIAL STATEMENTS
CAPITOL BANCORP LIMITED – Continued
Note D – Loans
The following tables present the allowance for loan losses and the carrying amount of loans based on management's overall impairment evaluation methodology (in $1,000s), and should not be interpreted as an indication of future charge-offs:
| | | March 31, 2011 | |
| | | Secured by Real Estate | | | | | | | | | | | | | |
| | | Commercial | | | Residential (including multi- family) | | | Construction, Land Development and Other Land | | | Commercial and Other Business- Purpose Loans | | | Consumer | | | Other | | | Total | |
| | | | | | | | | | | | | | | | | | | | | | |
| Allowance for loan losses: | | | | | | | | | | | | | | | | | | | | | |
| Individually evaluated | | | | | | | | | | | | | | | | | | | | | |
| for impairment | | $ | 10,946 | | | $ | 5,767 | | | $ | 5,792 | | | $ | 6,831 | | | | | | | | | $ | 29,336 | |
| Collectively evaluated | | | | | | | | | | | | | | | | | | | | | | | | | | |
| for impairment | | | 44,751 | | | | 23,441 | | | | 14,890 | | | | 23,056 | | | $ | 1,031 | | | $ | 176 | | | | 107,345 | |
| | | | | | | | | | | | | | | | | | | | | | | | | | | | | |
| Total allowance for | | | | | | | | | | | | | | | | | | | | | | | | | | | | |
| loan losses | | $ | 55,697 | | | $ | 29,208 | | | $ | 20,682 | | | $ | 29,887 | | | $ | 1,031 | | | $ | 176 | | | $ | 136,681 | |
| | | | | | | | | | | | | | | | | | | | | | | | | | | | | |
| Portfolio loans: | | | | | | | | | | | | | | | | | | | | | | | | | | | | |
| Individually evaluated | | | | | | | | | | | | | | | | | | | | | | | | | | | | |
| for impairment | | $ | 171,224 | | | $ | 59,005 | | | $ | 56,493 | | | $ | 24,780 | | | $ | 22 | | | | | | | $ | 311,524 | |
| Collectively evaluated | | | | | | | | | | | | | | | | | | | | | | | | | | | | |
| for impairment | | | 1,175,360 | | | | 438,310 | | | | 160,500 | | | | 326,093 | | | | 22,044 | | | $ | 16,890 | | | | 2,139,197 | |
| | | | | | | | | | | | | | | | | | | | | | | | | | | | | |
| Total portfolio loans | | $ | 1,346,584 | | | $ | 497,315 | | | $ | 216,993 | | | $ | 350,873 | | | $ | 22,066 | | | $ | 16,890 | | | $ | 2,450,721 | |
| | | December 31, 2010 | |
| | | Secured by Real Estate | | | | | | | | | | | | | |
| | | Commercial | | | Residential (including multi- family) | | | Construction, Land Development and Other Land | | | Commercial and Other Business- Purpose Loans | | | Consumer | | | Other | | | Total | |
| | | | | | | | | | | | | | | | | | | | | | |
| Allowance for loan losses: | | | | | | | | | | | | | | | | | | | | | |
| Individually evaluated | | | | | | | | | | | | | | | | | | | | | |
| for impairment | | $ | 10,101 | | | $ | 5,828 | | | $ | 6,914 | | | $ | 6,108 | | | | | | | | | $ | 28,951 | |
| Collectively evaluated | | | | | | | | | | | | | | | | | | | | | | | | | | |
| for impairment | | | 44,322 | | | | 33,200 | | | | 14,201 | | | | 23,278 | | | $ | 858 | | | $ | 175 | | | | 116,034 | |
| | | | | | | | | | | | | | | | | | | | | | | | | | | | | |
| Total allowance for | | | | | | | | | | | | | | | | | | | | | | | | | | | | |
| loan losses | | $ | 54,423 | | | $ | 39,028 | | | $ | 21,115 | | | $ | 29,386 | | | $ | 858 | | | $ | 175 | | | $ | 144,985 | |
| | | | | | | | | | | | | | | | | | | | | | | | | | | | | |
| Portfolio loans: | | | | | | | | | | | | | | | | | | | | | | | | | | | | |
| Individually evaluated | | | | | | | | | | | | | | | | | | | | | | | | | | | | |
| for impairment | | $ | 178,576 | | | $ | 57,923 | | | $ | 64,345 | | | $ | 26,914 | | | $ | 22 | | | | | | | $ | 327,780 | |
| Collectively evaluated | | | | | | | | | | | | | | | | | | | | | | | | | | | | |
| for impairment | | | 1,196,215 | | | | 461,020 | | | | 166,443 | | | | 349,054 | | | | 23,353 | | | $ | 15,133 | | | | 2,211,218 | |
| | | | | | | | | | | | | | | | | | | | | | | | | | | | | |
| Total portfolio loans | | $ | 1,374,791 | | | $ | 518,943 | | | $ | 230,788 | | | $ | 375,968 | | | $ | 23,375 | | | $ | 15,133 | | | $ | 2,538,998 | |
NOTES TO CONDENSED CONSOLIDATED FINANCIAL STATEMENTS
CAPITOL BANCORP LIMITED – Continued
Note D – Loans – Continued
The allowance for loan losses is maintained at a level believed adequate by management to absorb potential losses inherent in the loan portfolio at the balance-sheet date. Management's determination of the adequacy of the allowance is an estimate based on evaluation of the portfolio (including potential impairment of individual loans and concentrations of credit), past loss experience, current economic conditions, volume, amount and composition of the loan portfolio and other factors. The allowance is increased by provisions for loan losses charged to operations and reduced by net charge-offs. The table below summarizes activity in the allowance for loan losses for the three months ended March 31, 2011 (in $1,000s) by loan type:
| | | Secured by Real Estate | | | | | | | | | | | | | |
| | | Commercial | | | Residential (including multi- family) | | | Construction, Land Development and Other Land | | | Commercial and Other Business- Purpose Loans | | | Consumer | | | Other | | | Total | |
| | | | | | | | | | | | | | | | | | | | | | |
| Beginning balance | | $ | 54,423 | | | $ | 39,028 | | | $ | 21,115 | | | $ | 29,386 | | | $ | 858 | | | $ | 175 | | | $ | 144,985 | |
| | | | | | | | | | | | | | | | | | | | | | | | | | | | | |
| Acquired loan loss reserve | | | 1,043 | | | | 117 | | | | 651 | | | | 500 | | | | 68 | | | | 1 | | | | 2,380 | |
| | | | | | | | | | | | | | | | | | | | | | | | | | | | | |
| Charge-offs | | | (8,753 | ) | | | (7,341 | ) | | | (8,434 | ) | | | (5,325 | ) | | | (223 | ) | | | | | | | (30,076 | ) |
| Recoveries | | | 995 | | | | 982 | | | | 3,023 | | | | 886 | | | | 38 | | | | 1 | | | | 5,925 | |
| Net charge-offs | | | (7,758 | ) | | | (6,359 | ) | | | (5,411 | ) | | | (4,439 | ) | | | (185 | ) | | | 1 | | | | (24,151 | ) |
| | | | | | | | | | | | | | | | | | | | | | | | | | | | | |
| Provision for loan losses | | | 7,989 | | | | (3,578 | ) | | | 4,327 | | | | 4,440 | | | | 290 | | | | (1 | ) | | | 13,467 | |
| | | | | | | | | | | | | | | | | | | | | | | | | | | | | |
| Ending balance | | $ | 55,697 | | | $ | 29,208 | | | $ | 20,682 | | | $ | 29,887 | | | $ | 1,031 | | | $ | 176 | | | $ | 136,681 | |
[The remainder of this page intentionally left blank]
NOTES TO CONDENSED CONSOLIDATED FINANCIAL STATEMENTS
CAPITOL BANCORP LIMITED – Continued
Note D – Loans – Continued
The table below summarizes activity in the allowance for loan losses (in $1,000s) and the ratio of net charge-offs to average portfolio loans outstanding:
| | | Three Months Ended March 31 | |
| | | 2011 | | | 2010(1) | |
| | | | | | | |
| Allowance for loan losses at beginning of period | | $ | 144,985 | | | $ | 129,310 | |
| | | | | | | | | |
Allowance for loan losses of previously-discontinued bank subsidiary | | | 2,380 | | | | -- | |
| | | | | | | | | |
| Loans charged-off: | | | | | | | | |
| Loans secured by real estate: | | | | | | | | |
| Commercial | | | (8,753 | ) | | | (10,588 | ) |
| Residential (including multi-family) | | | (7,341 | ) | | | (12,126 | ) |
| Construction, land development and other land | | | (8,434 | ) | | | (13,777 | ) |
| Total loans secured by real estate | | | (24,528 | ) | | | (36,491 | ) |
| Commercial and other business-purpose loans | | | (5,325 | ) | | | (7,457 | ) |
| Consumer | | | (223 | ) | | | (157 | ) |
| Total charge-offs | | | (30,076 | ) | | | (44,105 | ) |
| Recoveries: | | | | | | | | |
| Loans secured by real estate: | | | | | | | | |
| Commercial | | | 995 | | | | 358 | |
| Residential (including multi-family) | | | 982 | | | | 108 | |
| Construction, land development and other land | | | 3,023 | | | | 1,301 | |
| Total loans secured by real estate | | | 5,000 | | | | 1,767 | |
| Commercial and other business-purpose loans | | | 886 | | | | 688 | |
| Consumer | | | 38 | | | | 19 | |
| Other | | | 1 | | | | -- | |
| Total recoveries | | | 5,925 | | | | 2,474 | |
| Net charge-offs | | | (24,151 | ) | | | (41,631 | ) |
| Additions to allowance charged to expense (provision | | | | | | | | |
| for loan losses) | | | 13,467 | | | | 47,364 | |
| | | | | | | | | |
| Allowance for loan losses at end of period | | $ | 136,681 | | | $ | 135,043 | |
| | | | | | | | | |
| Average total portfolio loans for the period | | $ | 2,558,053 | | | $ | 3,215,054 | |
| | | | | | | | | |
Ratio of net charge-offs (annualized) to average portfolio loans outstanding | | | 3.78 | % | | | 5.18 | % |
(1) Excludes amounts related to operations discontinued in 2010 and 2011.
NOTES TO CONDENSED CONSOLIDATED FINANCIAL STATEMENTS
CAPITOL BANCORP LIMITED – Continued
Note D – Loans – Continued
Nonperforming loans (i.e., loans which are 90 days or more past due and still accruing interest and loans on nonaccrual status) and other nonperforming assets are summarized below (in $1,000s):
| | | March 31, 2011 | | | December 31, 2010(1) | |
| Nonaccrual loans: | | | | | | |
| Loans secured by real estate: | | | | | | |
| Commercial | | $ | 146,095 | | | $ | 153,956 | |
| Residential (including multi-family) | | | 53,502 | | | | 60,422 | |
| Construction, land development and other land | | | 51,877 | | | | 59,718 | |
| Total loans secured by real estate | | | 251,474 | | | | 274,096 | |
| Commercial and other business-purpose loans | | | 30,141 | | | | 30,660 | |
| Consumer | | | 538 | | | | 162 | |
| Total nonaccrual loans | | | 282,153 | | | | 304,918 | |
| | | | | | | | | |
Past due (>90 days) loans and accruing interest: | | | | | | | | |
| Loans secured by real estate: | | | | | | | | |
| Commercial | | | 5,049 | | | | 2,875 | |
| Residential (including multi-family) | | | 688 | | | | 1,484 | |
| Construction, land development and other land | | | 2,374 | | | | 2,380 | |
| Total loans secured by real estate | | | 8,111 | | | | 6,739 | |
| Commercial and other business-purpose loans | | | 410 | | | | 2,073 | |
| Consumer | | | 19 | | | | 279 | |
| Total past due loans | | | 8,540 | | | | 9,091 | |
| | | | | | | | | |
| Total nonperforming loans | | $ | 290,693 | | | $ | 314,009 | |
| | | | | | | | | |
Real estate owned and other repossessed assets | | | 111,428 | | | | 107,095 | |
| | | | | | | | | |
| Total nonperforming assets | | $ | 402,121 | | | $ | 421,104 | |
(1) Excludes amounts related to operations discontinued in 2010 and 2011.
[The remainder of this page intentionally left blank]
NOTES TO CONDENSED CONSOLIDATED FINANCIAL STATEMENTS
CAPITOL BANCORP LIMITED – Continued
Note D – Loans – Continued
Impaired loans which do not have an allowance requirement include collateral-dependent loans for which direct write-downs have been made to the carrying amount of such loans and, accordingly, no additional allowance requirement or allocation is currently necessary.
Impaired loans are summarized in the following table (in $1,000s), based on loans which either have an allowance for loan losses recorded or no such allowance as of March 31, 2011:
| | | Carrying Value | | | Unpaid Principal Balance | | | Related Allowance for Loan Losses | |
| | | | | | | | | | |
| With an allowance recorded: | | | | | | | | | |
| Loans secured by real estate: | | | | | | | | | |
| Commercial | | $ | 74,883 | | | $ | 84,957 | | | $ | 13,091 | |
| Residential (including multi-family) | | | 28,796 | | | | 30,529 | | | | 7,870 | |
| Construction, land development and other land | | | 25,170 | | | | 25,766 | | | | 6,530 | |
| Total loans secured by real estate | | | 128,849 | | | | 141,252 | | | | 27,491 | |
| Commercial and other business-purpose loans | | | 19,720 | | | | 21,607 | | | | 10,364 | |
| Consumer | | | 520 | | | | 550 | | | | 121 | |
| | | | 149,089 | | | | 163,409 | | | | 37,976 | |
| With no related allowance recorded: | | | | | | | | | | | | |
| Loans secured by real estate: | | | | | | | | | | | | |
| Commercial | | | 114,794 | | | | 150,893 | | | | | |
| Residential (including multi-family) | | | 35,056 | | | | 53,372 | | | | | |
| Construction, land development and other land | | | 35,234 | | | | 58,358 | | | | | |
| Total loans secured by real estate | | | 185,084 | | | | 262,623 | | | | | |
| Commercial and other business-purpose loans | | | 13,944 | | | | 21,701 | | | | | |
| Consumer | | | 18 | | | | 43 | | | | | |
| | | | 199,046 | | | | 284,367 | | | | | |
| | | | | | | | | | | | | |
| Total | | $ | 348,135 | | | $ | 447,776 | | | $ | 37,976 | |
Interest income is recorded on impaired loans if not on nonaccrual status, or may be recorded on a cash basis in some circumstances, if such payments are not credited to principal. For the three months ended March 31, 2011, the average recorded investment in impaired loans and interest income recorded on impaired loans were as follows (in $1,000s):
| | | Average | | | Interest | |
| | | Recorded | | | Income | |
| | | Investment | | | Recorded | |
| | | | | | | |
| Commercial | | $ | 189,504 | | | $ | 558 | |
| Residential (including multi-family) | | | 67,160 | | | | 150 | |
| Construction, land development and other land | | | 63,893 | | | | 52 | |
| Total loans secured by real estate | | | 320,557 | | | | 760 | |
| Commercial and other business-purpose loans | | | 34,883 | | | | 100 | |
| Consumer | | | 371 | | | | | |
| | | | | | | | | |
| Total | | $ | 355,811 | | | $ | 860 | |
NOTES TO CONDENSED CONSOLIDATED FINANCIAL STATEMENTS
CAPITOL BANCORP LIMITED – Continued
Note D – Loans – Continued
Impaired loans are summarized in the following table (in $1,000s), based on loans which either have an allowance for loan losses recorded or no such allowance as of December 31, 2010:
| | | Carrying Value | | | Unpaid Principal Balance | | | Related Allowance for Loan Losses | |
| | | | | | | | | | |
| With an allowance recorded: | | | | | | | | | |
| Loans secured by real estate: | | | | | | | | | |
| Commercial | | $ | 81,800 | | | $ | 131,352 | | | $ | 12,977 | |
| Residential (including multi-family) | | | 39,743 | | | | 47,718 | | | | 10,999 | |
| Construction, land development and other land | | | 27,150 | | | | 51,117 | | | | 8,554 | |
| Total loans secured by real estate | | | 148,693 | | | | 230,187 | | | | 32,530 | |
| Commercial and other business-purpose loans | | | 21,926 | | | | 35,307 | | | | 9,189 | |
| Consumer | | | 185 | | | | 211 | | | | 104 | |
| | | | 170,804 | | | | 265,705 | | | | 41,823 | |
| With no related allowance recorded: | | | | | | | | | | | | |
| Loans secured by real estate: | | | | | | | | | | | | |
| Commercial | | | 107,531 | | | | 173,018 | | | | | |
| Residential (including multi-family) | | | 30,724 | | | | 51,005 | | | | | |
| Construction, land development and other land | | | 40,232 | | | | 64,807 | | | | | |
| Total loans secured by real estate | | | 178,487 | | | | 288,830 | | | | | |
| Commercial and other business-purpose loans | | | 14,176 | | | | 23,209 | | | | | |
| Consumer | | | 18 | | | | 42 | | | | | |
| | | | 192,681 | | | | 312,081 | | | | | |
| | | | | | | | | | | | | |
| Total | | $ | 363,485 | | | $ | 577,786 | | | $ | 41,823 | |
The following tables summarize the aging and amounts of past due loans (in $1,000s):
| | | March 31, 2011 | |
| | | Past Due Loans | | | Total | | | | | | | |
| | | (based on payment due dates) | | | Amount of | | | | | | | |
| | | | | | | | | Loans on | | | Loans More | | | Loans Either | | | | |
| | | More Than | | | | | | Nonaccrual | | | Than 29 Days | | | Current or | | | | |
| | | 29 Days, | | | More Than | | | Status | | | Past Due or on | | | Less Than | | | Total | |
| | | and Less Than | | | 89 Days | | | (Generally, 90 | | | Nonaccrual | | | 30 Days | | | Portfolio | |
| | | 90 Days | | | (Accruing) | | | Days or More) | | | Status | | | Past Due | | | Loans | |
| | | | | | | | | | | | | | | | | | | |
| Loans secured by real estate: | | | | | | | | | | | | | | | | | | |
| Commercial | | $ | 23,853 | | | $ | 5,049 | | | $ | 146,095 | | | $ | 174,997 | | | $ | 1,171,587 | | | $ | 1,346,584 | |
| Residential (including multi- | | | | | | | | | | | | | | | | | | | | | | | | |
| family) | | | 8,551 | | | | 688 | | | | 53,502 | | | | 62,741 | | | | 434,574 | | | | 497,315 | |
| Construction, land development | | | | | | | | | | | | | | | | | | | | | | | | |
| and other land | | | 8,758 | | | | 2,374 | | | | 51,877 | | | | 63,009 | | | | 153,984 | | | | 216,993 | |
Total loans secured by real estate | | | 41,162 | | | | 8,111 | | | | 251,474 | | | | 300,747 | | | | 1,760,145 | | | | 2,060,892 | |
| Commercial and other business- | | | | | | | | | | | | | | | | | | | | | | | | |
| purpose loans | | | 5,936 | | | | 410 | | | | 30,141 | | | | 36,487 | | | | 314,386 | | | | 350,873 | |
| Consumer | | | 555 | | | | 19 | | | | 538 | | | | 1,112 | | | | 20,954 | | | | 22,066 | |
| Other | | | | | | | | | | | | | | | | | | | 16,890 | | | | 16,890 | |
| | | | | | | | | | | | | | | | | | | | | | | | | |
| Total | | $ | 47,653 | | | $ | 8,540 | | | $ | 282,153 | | | $ | 338,346 | | | $ | 2,112,375 | | | $ | 2,450,721 | |
NOTES TO CONDENSED CONSOLIDATED FINANCIAL STATEMENTS
CAPITOL BANCORP LIMITED – Continued
Note D – Loans – Continued
| | | December 31, 2010 | |
| | | Past Due Loans | | | Total | | | | | | | |
| | | (based on payment due dates) | | | Amount of | | | | | | | |
| | | | | | | | | Loans on | | | Loans More | | | Loans Either | | | | |
| | | More Than | | | | | | Nonaccrual | | | Than 29 Days | | | Current or | | | | |
| | | 29 Days, | | | More Than | | | Status | | | Past Due or on | | | Less Than | | | Total | |
| | | and Less Than | | | 89 Days | | | (Generally, 90 | | | Nonaccrual | | | 30 Days | | | Portfolio | |
| | | 90 Days | | | (Accruing) | | | Days or More) | | | Status | | | Past Due | | | Loans | |
| | | | | | | | | | | | | | | | | | | |
| Loans secured by real estate: | | | | | | | | | | | | | | | | | | |
| Commercial | | $ | 29,819 | | | $ | 2,875 | | | $ | 153,956 | | | $ | 186,650 | | | $ | 1,188,141 | | | $ | 1,374,791 | |
| Residential (including multi- | | | | | | | | | | | | | | | | | | | | | | | | |
| family) | | | 12,470 | | | | 1,484 | | | | 60,422 | | | | 74,376 | | | | 444,567 | | | | 518,943 | |
| Construction, land development | | | | | | | | | | | | | | | | | | | | | | | | |
| and other land | | | 6,467 | | | | 2,380 | | | | 59,718 | | | | 68,565 | | | | 162,223 | | | | 230,788 | |
Total loans secured by real estate | | | 48,756 | | | | 6,739 | | | | 274,096 | | | | 329,591 | | | | 1,794,931 | | | | 2,124,522 | |
| Commercial and other business- | | | | | | | | | | | | | | | | | | | | | | | | |
| purpose loans | | | 9,689 | | | | 2,073 | | | | 30,660 | | | | 42,422 | | | | 333,546 | | | | 375,968 | |
| Consumer | | | 560 | | | | 279 | | | | 162 | | | | 1,001 | | | | 22,374 | | | | 23,375 | |
| Other | | | | | | | | | | | | | | | | | | | 15,133 | | | | 15,133 | |
| | | | | | | | | | | | | | | | | | | | | | | | | |
| Total | | $ | 59,005 | | | $ | 9,091 | | | $ | 304,918 | | | $ | 373,014 | | | $ | 2,165,984 | | | $ | 2,538,998 | |
Capitol categorizes loans into risk categories based on relevant information about the ability of borrowers to service their debt obligations based on: current financial information, aging analysis, historical payment experience, credit documentation and public information, among other factors. Capitol analyzes loans individually by classifying the loans as to credit risk. This analysis generally includes all loans and is generally performed at least quarterly. Capitol uses the following definitions for its adversely-classified risk ratings:
Watch. Loans classified as watch have a potential weakness that deserves management's close attention. If not improved, those potential weaknesses may result in deterioration of the repayment prospects for the loan in the future.
Substandard. Loans classified as substandard are inadequately protected by the borrower's current net worth, paying capacity of the borrower or the fair value of collateral. Loans so classified have a well-defined weakness or weaknesses that jeopardize the liquidation of the debt obligation by the borrower. These are characterized by the reasonable possibility that some loss will be sustained if the deficiencies are not favorably resolved.
[The remainder of this page intentionally left blank]
NOTES TO CONDENSED CONSOLIDATED FINANCIAL STATEMENTS
CAPITOL BANCORP LIMITED – Continued
Note D – Loans – Continued
Loans not meeting the preceding criteria that are analyzed individually as part of management's classification categories described on the preceding page are considered to be loans which are not adversely classified. Based on management's most recent analysis, the risk categories of loans are summarized as follows (in $1,000s):
| | | March 31, 2011 | |
| | | Loans Not Adversely Classified | | | Adversely Classified Loans | | | Total Portfolio Loans | |
| | | Watch | | | Substandard | |
| | | | | | | | | | | | | |
| Loans secured by real estate: | | | | | | | | | | | | |
| Commercial | | $ | 969,754 | | | $ | 114,442 | | | $ | 262,388 | | | $ | 1,346,584 | |
| Residential (including multi-family) | | | 356,893 | | | | 41,155 | | | | 99,267 | | | | 497,315 | |
| Construction, land development and | | | | | | | | | | | | | | | | |
| other land | | | 112,691 | | | | 25,146 | | | | 79,156 | | | | 216,993 | |
| Total loans secured by real estate | | | 1,439,338 | | | | 180,743 | | | | 440,811 | | | | 2,060,892 | |
| Commercial and other business-purpose | | | | | | | | | | | | | | | | |
| loans | | | 267,633 | | | | 27,348 | | | | 55,892 | | | | 350,873 | |
| Consumer | | | 20,320 | | | | 378 | | | | 1,368 | | | | 22,066 | |
| Other | | | 15,764 | | | | 1,126 | | | | | | | | 16,890 | |
| | | | | | | | | | | | | | | | | |
| Total | | $ | 1,743,055 | | | $ | 209,595 | | | $ | 498,071 | | | $ | 2,450,721 | |
| | | December 31, 2010 | |
| | | Loans Not Adversely Classified | | | Adversely Classified Loans | | | Total Portfolio Loans | |
| | | Watch | | | Substandard | |
| | | | | | | | | | | | | |
| Loans secured by real estate: | | | | | | | | | | | | |
| Commercial | | $ | 990,225 | | | $ | 118,619 | | | $ | 265,947 | | | $ | 1,374,791 | |
| Residential (including multi-family) | | | 377,046 | | | | 42,157 | | | | 99,740 | | | | 518,943 | |
| Construction, land development and | | | | | | | | | | | | | | | | |
| other land | | | 115,042 | | | | 30,707 | | | | 85,039 | | | | 230,788 | |
| Total loans secured by real estate | | | 1,482,313 | | | | 191,483 | | | | 450,726 | | | | 2,124,522 | |
| Commercial and other business-purpose | | | | | | | | | | | | | | | | |
| loans | | | 278,739 | | | | 32,220 | | | | 65,009 | | | | 375,968 | |
| Consumer | | | 21,602 | | | | 1,028 | | | | 745 | | | | 23,375 | |
| Other | | | 13,565 | | | | 1,568 | | | | | | | | 15,133 | |
| | | | | | | | | | | | | | | | | |
| Total | | $ | 1,796,219 | | | $ | 226,299 | | | $ | 516,480 | | | $ | 2,538,998 | |
NOTES TO CONDENSED CONSOLIDATED FINANCIAL STATEMENTS
CAPITOL BANCORP LIMITED – Continued
Note E – Discontinued Operations
Through March 31, 2011, Capitol completed the following sales of bank subsidiaries (in $1,000s):
| | | | Sale | | | | |
| | Date Sold | | Proceeds | | | Gain | |
| | | | | | | | |
Bank of Tucson – main office(1) | January 24, 2011 | | $ | 4,567 | | | $ | 4,186 | |
Bank of Fort Bend(2) | March 30, 2011 | | | 4,302 | | | | 1,432 | |
| | | | | | | | | | |
| | | | $ | 8,869 | | | $ | 5,618 | |
| | (1) | Previously a wholly-owned subsidiary of Capitol. Sale proceeds represent the net premium received from the assumption of liabilities and acquisition of assets transaction. |
| | (2) | Previously a majority-owned subsidiary of a bank-development subsidiary controlled by Capitol. |
On April 19, 2011, the sale of Community Bank of Rowan was completed with aggregate proceeds of $4.8 million and an estimated loss of approximately $1.25 million, which has been reflected in Capitol's first quarter 2011 financial statements against the gain on sale of the above-mentioned bank subsidiaries.
Capitol's consolidated results of operations would not have been materially different if the sales of these banks had occurred at the beginning of the periods presented; however, such sales are reflected on that basis in the pro forma condensed consolidated financial statements on page 46 of this document.
The results of operations of Bank of Fort Bend, Bank of Tucson – main office and Community Bank of Rowan, together with the results of operations of Adams Dairy Bank, Bank of Belleville, Bank of San Francisco, Community Bank of Lincoln, Fort Collins Commerce Bank, Larimer Bank of Commerce, Loveland Bank of Commerce, Napa Community Bank, Ohio Commerce Bank, Southern Arizona Community Bank and USNY Bank which were sold in 2010, are classified as discontinued operations for the periods presented and include the following components (in $1,000s):
| | | Three Months Ended March 31 | |
| | | 2011 | | | 2010 | |
| | | | | | | |
| Interest income | | $ | 1,830 | | | $ | 14,927 | |
| Interest expense | | | 427 | | | | 3,305 | |
| Net interest income | | | 1,403 | | | | 11,622 | |
| Provision for loan losses | | | 494 | | | | 2,736 | |
| Net interest income after provision for | | | | | | | | |
| loan losses | | | 909 | | | | 8,886 | |
| Noninterest income | | | 441 | | | | 1,163 | |
| Gain on sale of bank subsidiaries | | | 4,368 | | | | | |
| Noninterest expense | | | 1,334 | | | | 8,516 | |
| Income before income taxes | | | 4,384 | | | | 1,533 | |
| Less income tax expense | | | 1,488 | | | | 594 | |
| Net income from discontinued operations | | | 2,896 | | | | 939 | |
| Net income attributable to noncontrolling | | | | | | | | |
| interests in consolidated subsidiaries | | | (60 | ) | | | (126 | ) |
| Net income from discontinued operations | | | | | | | | |
| attributable to Capitol Bancorp Limited | | $ | 2,836 | | | $ | 813 | |
| Net income from discontinued operations | | | | | | | | |
| per common share attributable to | | | | | | | | |
| Capitol Bancorp Limited | | $ | 0.09 | | | $ | 0.05 | |
NOTES TO CONDENSED CONSOLIDATED FINANCIAL STATEMENTS
CAPITOL BANCORP LIMITED – Continued
Note E – Discontinued Operations – Continued
Assets and liabilities of discontinued operations are summarized below (in $1,000s):
| | | March 31, 2011 | | | Dec 31, 2010 | | | | March 31, 2011 | | | Dec 31, 2010 | |
| Assets: | | | | | | | Liabilities: | | | | | | |
| Cash and cash equivalents | | $ | 19,719 | | | $ | 86,747 | | Noninterest-bearing | | | | | | |
| Investment securities | | | 6,682 | | | | 10,664 | | deposits | | $ | 9,212 | | | $ | 84,840 | |
| Federal Home Loan Bank | | | | | | | | | Interest-bearing deposits | | | 111,468 | | | | 277,677 | |
| stock | | | 1,065 | | | | 1,912 | | Total deposits | | | 120,680 | | | | 362,517 | |
| Portfolio loans | | | 101,219 | | | | 292,047 | | Other liabilities | | | 4,119 | | | | 6,843 | |
| Less allowance for loan | | | | | | | | | | | | | | | | | |
| losses | | | (1,628 | ) | | | (4,816 | ) | | | $ | 124,799 | | | $ | 369,360 | |
| Net portfolio loans | | | 99,591 | | | | 287,231 | | | | | | | | | | |
| Premises and equipment | | | 2,667 | | | | 4,169 | | | | | | | | | | |
| Other real estate owned | | | 2,099 | | | | 2,226 | | | | | | | | | | |
| Other assets | | | 2,678 | | | | 5,584 | | | | | | | | | | |
| | | | | | | | | | | | | | | | | | |
| | | $ | 134,501 | | | $ | 398,533 | | | | | | | | | | |
Note F – Fair Value
The following is a description of Capitol's valuation methodologies used to measure and disclose the fair values of its assets and liabilities on a recurring or nonrecurring basis:
| | Investment securities available for sale: Securities available for sale are recorded at fair value on a recurring basis. Fair value measurement is based on quoted prices, when available. If quoted prices are not available, fair values are measured using independent pricing models. |
| | Mortgage loans held for sale: Mortgage loans held for sale are carried at the lower of aggregate cost or fair value and are measured on a nonrecurring basis. There were no mortgage loans held for sale written down to fair value at March 31, 2011. Fair value is based on independent quoted market prices, where applicable, or the prices for other whole mortgage loans with similar characteristics. |
| | Loans: The Corporation does not record loans at fair value on a recurring basis. However, from time to time, nonrecurring fair value adjustments for collateral-dependent loans are recorded to reflect partial write-downs or specific reserves based on the observable market price, current appraised value of the collateral or other estimates of fair value. |
| | Other real estate owned: At the time of foreclosure, foreclosed properties are adjusted to estimated fair value less estimated costs to sell upon transfer from portfolio loans to other real estate owned, establishing a new carrying value. The Corporation subsequently adjusts estimated fair value of other real estate owned on a nonrecurring basis to reflect partial write-downs based on the observable market price or current appraisal data. |
| | Long-lived and indefinite-lived assets: The Corporation does not record long-lived or indefinite-lived assets at fair value on a recurring basis. However, from time to time, nonrecurring fair value adjustments to a long-lived or indefinite-lived asset are recorded to reflect partial write-downs based on the observable market price or other estimate of fair value in the event of impairment. |
There were no liabilities measured at fair value on a recurring or nonrecurring basis as of March 31, 2011 and December 31, 2010.
NOTES TO CONDENSED CONSOLIDATED FINANCIAL STATEMENTS
CAPITOL BANCORP LIMITED – Continued
Note F – Fair Value – Continued
Assets measured at fair value on a recurring basis were as follows (in $1,000s):
| | | March 31, 2011 | | | December 31, 2010 | |
| | | Total | | | Significant Other Observable Inputs (Level 2) | | | Total(2) | | | Significant Other Observable Inputs (Level 2)(2) | |
| | | | | | | | | | | | | |
| Investment securities available for sale: | | | | | | | | | | | | |
| United States treasury | | $ | 4,045 | | | $ | 4,045 | | | $ | 506 | | | $ | 506 | |
| United States government agency | | | 12,856 | | | | 12,856 | | | | 12,680 | | | | 12,680 | |
| Mortgage-backed | | | 3,676 | | | | 3,676 | | | | 3,918 | | | | 3,918 | |
| Municipalities | | | 377 | | | | 377 | | | | 378 | | | | 378 | |
| | | | | | | | | | | | | | | | | |
| | | $ | 20,954 | | | $ | 20,954 | | | $ | 17,482 | | | $ | 17,482 | |
Assets measured at fair value on a nonrecurring basis were as follows (in $1,000s):
| | | March 31, 2011 | | | December 31, 2010 | |
| | | Total | | | Significant Unobservable Inputs (Level 3) | | | Total(2) | | | Significant Unobservable Inputs (Level 3)(2) | |
| | | | | | | | | | | | | |
Impaired loans(1) | | $ | 313,665 | | | $ | 313,665 | | | $ | 321,196 | | | $ | 321,196 | |
| | | | | | | | | | | | | | | | | |
Other real estate owned(1) | | $ | 110,829 | | | $ | 110,829 | | | $ | 106,835 | | | $ | 106,835 | |
| (1) | Represents carrying value based on the appraised value of the applicable collateral or foreclosed property or other estimates of fair value. For other real estate owned, such fair value is reduced by estimated costs to sell the properties. |
| (2) | Excludes amounts related to discontinued operations. |
Updated appraisals are generally obtained when it has been determined that a collateral-dependent loan has become impaired or when it is likely a loan secured by real estate will be foreclosed. Adjustments to the loan's carrying value (or requirements for an allocation of the allowance for loan losses) are made, when appropriate, after review of appraisal data or, in the absence of a recent appraisal, if market conditions significantly decline further. The timing of when a collateral-dependent loan should be classified as a nonperforming credit is contingent upon several factors, including the performance of the loan, payment history and/or results of the bank's review of updated borrower financial information.
When a borrower's performance has deteriorated (for example, the borrower has become delinquent on required payments, the borrower's updated financial information received indicates adverse financial trends or sales/leasing activity is less than expected in the case of multi-unit properties), the loan will be downgraded and, if appropriate, an updated appraisal will be ordered. In the period between a loan being recognized as impaired and receipt of an updated appraisal, the loan will be included within loss contingency pools, in conjunction with estimating the bank's requirements for its allowance for loan losses. Upon receipt and review of updated appraisal data and after any further fair value analysis is completed, the loan will be further evaluated for appropriate write-down. Generally, negative differences between appraised value, less the estimated cost to sell, and the related carrying value of the loans are charged to the allowance for loan losses, as a partial write-down/charge-off, on a timely basis after the appraisal has been received and reviewed. Occasionally, additional potential loss amounts may be included if circumstances exist which may further adversely impact fair value estimates. Internally-developed evaluations may be used when the amount of a loan is less than $250,000. Internally-prepared evaluations may also be used when the most recent appraisal date is within a year to estimate the current effect of economic conditions or deterioration. Updated fair value information is generally obtained at least annually for collateral-dependent loans and other real estate owned.
NOTES TO CONDENSED CONSOLIDATED FINANCIAL STATEMENTS
CAPITOL BANCORP LIMITED – Continued
Note F – Fair Value – Continued
Comparative carrying values and estimated fair values of financial instruments based upon the accounting guidance set forth in Accounting Standards Codification 825-10 were as follows (in $1,000s):
| | | March 31, 2011 | | | December 31, 2010(2) | |
| | | Carrying Value | | | Estimated Fair Value | | | Carrying Value | | | Estimated Fair Value | |
| Financial assets: | | | | | | | | | | | | |
| Cash and cash equivalents | | $ | 536,494 | | | $ | 536,494 | | | $ | 534,761 | | | $ | 534,761 | |
| Loans held for sale | | | 1,710 | | | | 1,710 | | | | 6,900 | | | | 6,900 | |
| Investment securities: | | | | | | | | | | | | | | | | |
| Available for sale | | | 20,954 | | | | 20,954 | | | | 17,482 | | | | 17,482 | |
| Held for long-term investment | | | 2,330 | | | | 2,330 | | | | 2,893 | | | | 2,893 | |
| | | | 23,284 | | | | 23,284 | | | | 20,375 | | | | 20,375 | |
Federal Home Loan Bank and Federal Reserve Bank stock | | | 17,811 | | | | 17,811 | | | | 17,001 | | | | 17,001 | |
| Portfolio loans: | | | | | | | | | | | | | | | | |
| Loans secured by real estate: | | | | | | | | | | | | | | | | |
| Commercial | | | 1,346,584 | | | | 1,347,647 | | | | 1,374,791 | | | | 1,379,583 | |
| Residential (including multi-family) | | | 497,315 | | | | 497,524 | | | | 518,943 | | | | 518,493 | |
| Construction, land development and other land | | | 216,993 | | | | 217,305 | | | | 230,788 | | | | 230,886 | |
| Total loans secured by real estate | | | 2,060,892 | | | | 2,062,476 | | | | 2,124,522 | | | | 2,128,962 | |
| Commercial and other business-purpose loans | | | 350,873 | | | | 351,369 | | | | 375,968 | | | | 376,338 | |
| Consumer | | | 22,066 | | | | 22,358 | | | | 23,375 | | | | 23,613 | |
| Other | | | 16,890 | | | | 17,002 | | | | 15,133 | | | | 15,055 | |
| Total portfolio loans | | | 2,450,721 | | | | 2,453,205 | | | | 2,538,998 | | | | 2,543,968 | |
| Less allowance for loan losses | | | (136,681 | ) | | | (136,681 | ) | | | (144,985 | ) | | | (144,985 | ) |
| Net portfolio loans | | | 2,314,040 | | | | 2,316,524 | | | | 2,394,013 | | | | 2,398,983 | |
| | | | | | | | | | | | | | | | | |
| Financial liabilities: | | | | | | | | | | | | | | | | |
| Deposits: | | | | | | | | | | | | | | | | |
| Noninterest-bearing | | | 531,455 | | | | 531,455 | | | | 500,809 | | | | 500,809 | |
| Interest-bearing: | | | | | | | | | | | | | | | | |
| Demand accounts | | | 757,271 | | | | 757,271 | | | | 787,042 | | | | 787,042 | |
| Time certificates of less than $100,000 | | | 689,866 | | | | 693,625 | | | | 711,609 | | | | 715,720 | |
| Time certificates of $100,000 or more | | | 829,378 | | | | 832,952 | | | | 874,841 | | | | 878,653 | |
| Total interest-bearing | | | 2,276,515 | | | | 2,283,848 | | | | 2,373,492 | | | | 2,381,415 | |
| Total deposits | | | 2,807,970 | | | | 2,815,303 | | | | 2,874,301 | | | | 2,882,224 | |
| Notes payable and other borrowings | | | 106,052 | | | | 99,126 | | | | 117,377 | | | | 110,204 | |
| Subordinated debentures | | | 149,080 | | | | 151,296 | (1) | | | 167,586 | | | | 170,841 | (1) |
| (1) | Represents liquidation or principal amount outstanding. The quoted market value of certain trust-preferred securities |
| (Capitol Trust I and XII) included within subordinated debentures was substantially less than that amount. |
| (2) | Excludes amounts related to discontinued operations. |
Estimated fair values of financial assets and liabilities in the table above are based upon a comparison of current interest rates on financial instruments and the timing of related scheduled cash flows to the estimated present value of such cash flows using current estimated market rates of interest (unless quoted market values or other fair value information is more readily available, except certain subordinated debentures, as indicated above, for which the fair value is based on the liquidation or principal amount outstanding). For example, the estimated fair value of portfolio loans is based on discounted cash flow computations. Similarly, the estimated fair values of time deposits, notes payable and other borrowings were determined through discounted cash flow computations. Such estimates of fair value are not intended to represent portfolio liquidation value and, accordingly, only represent an estimate of fair value based on current financial reporting requirements.
NOTES TO CONDENSED CONSOLIDATED FINANCIAL STATEMENTS
CAPITOL BANCORP LIMITED – Continued
Note F – Fair Value – Continued
Given current economic conditions, the majority of the loan portfolio is not readily marketable and, accordingly, market prices may not exist. Capitol has not attempted to market the loan portfolio to potential buyers, if any exist, to determine the fair value of those instruments. Since negotiated prices, if any, in illiquid markets depend upon the then-present motivations of the buyer and seller, it is reasonable to assume that potential sales prices could vary widely from any estimate of fair value made without the benefit of negotiations. Additionally, changes in market interest rates commensurate with risk may dramatically impact the value of financial instruments at any time. Accordingly, fair value measurements for loans included in the preceding table are unlikely to represent the instruments' liquidation values.
Note G – Stock Options
Stock option activity is summarized as follows:
| | | Number Outstanding | | | Exercise Price Range | | | Weighted Average Exercise Price | |
| | | | | | | | | | |
| Outstanding at January 1, 2011 | | | 1,745,602 | | | $ | 1.78 to $ 46.20 | | | $ | 21.53 | |
| Cancelled or expired | | �� | (29,307 | ) | | | 28.75 to 30.21 | | | | 29.29 | |
| | | | | | | | | | | | | |
| Outstanding at March 31, 2011 | | | 1,716,295 | | | $ | 1.78 to $ 46.20 | | | $ | 21.40 | |
Stock options were granted during the three months ended March 31, 2010 with an aggregate fair value approximating $237,000 (none were granted in 2011). Share-based compensation expense relating to stock options for the three months ended March 31, 2011 and 2010 approximated $2,000 and $83,000, respectively.
As of March 31, 2011, stock options outstanding had a weighted average remaining contractual life of 2.48 years and, due to the exercise price being greater than the fair value of Capitol's common stock, had no intrinsic value at that date. The following table summarizes stock options outstanding segregated by exercise price range as of March 31, 2011:
| | | | | | | Weighted Average |
Exercise Price Range | | | Number Outstanding | | | Exercise Price | | Remaining Contractual Life |
| | | | | | | | | |
| $ | 1.00 to 14.99 | | | | 566,105 | | | $ | 2.49 | | 4.50 years |
| $ | 15.00 to 19.99 | | | | 66,883 | | | | 16.40 | | 0.53 years |
| $ | 20.00 to 24.99 | | | | 205,953 | | | | 22.02 | | 3.29 years |
| $ | 25.00 to 29.99 | | | | 90,001 | | | | 25.47 | | 0.22 years |
| $ | 30.00 to 34.99 | | | | 457,357 | | | | 31.78 | | 0.91 years |
| $ | 35.00 or more | | | | 339,996 | | | | 37.91 | | 1.79 years |
| | | | | | | | | | | | |
| Total outstanding | | | | 1,716,295 | | | $ | 21.40 | | |
NOTES TO CONDENSED CONSOLIDATED FINANCIAL STATEMENTS
CAPITOL BANCORP LIMITED – Continued
Note H – Net Income (Loss) Per Common Share Attributable to Capitol Bancorp Limited
Computations of income (loss) per common share were based on the following (in 1,000s) for the three months ended March 31:
| | | Three Months Ended March 31 | |
| | | 2011 | | | 2010 | |
| | | | | | | |
Numerator—net income (loss) attributable to Capitol Bancorp Limited for the period | | $ | 289 | | | $ | (47,882 | ) |
| | | | | | | | | |
| Denominator: | | | | | | | | |
Weighted average number of common shares outstanding, excluding unvested restricted shares of common stock (denominator for basic earnings per share) | | | 32,164 | | | | 17,402 | |
| | | | | | | | | |
| Effect of dilutive securities: | | | | | | | | |
| Unvested restricted shares of common stock | | | 711 | | | | -- | |
| | | | | | | | | |
Denominator for diluted earnings per share— Weighted average number of shares and potential dilution | | | 32,875 | | | | 17,402 | |
| | | | | | | | | |
Number of antidilutive stock options excluded from diluted earnings per share computation | | | 1,716 | | | | 2,355 | |
| | | | | | | | | |
Number of antidilutive unvested restricted shares excluded from basic and diluted earnings per share computation | | | 30 | | | | 140 | |
| | | | | | | | | |
Number of antidilutive warrants excluded from diluted earnings per share computation | | | 1,325 | | | | 76 | |
Note I – Trust-Preferred Securities
In 2009, the Corporation commenced the deferral of interest payments on its various trust-preferred securities, as is permitted under the terms of the securities, to conserve cash and capital resources. The payment of interest on those securities may be deferred for periods up to five years. During such deferral periods, Capitol is prohibited from paying dividends on its common stock (subject to certain exceptions) and is further restricted by Capitol's written agreement with the Federal Reserve Bank of Chicago which prohibits both payment of interest on the trust-preferred securities and cash dividends without prior written approval by that agency. Accrued interest payable on such securities approximated $19.8 million and $20.8 million at March 31, 2011 and December 31, 2010, respectively. Holders of the trust-preferred securities will recognize current taxable income relating to the deferred interest payments.
On January 31, 2011, Capitol accepted for exchange 1,180,602 of the 2,530,000 outstanding shares of trust-preferred securities of Capitol Trust I and 773,934 of the 1,454,100 outstanding shares of trust-preferred securities of Capitol Trust XII and, pursuant to the related exchange offer, issued approximately 19.5 million of previously-unissued shares of Capitol's common stock. Such exchange resulted in the retirement of approximately $19.5 million aggregate liquidation amount of the trust-preferred securities on a combined basis and eliminated approximately $2.4 million of accrued interest payable associated with the retired securities, which collectively increased Capitol's equity and regulatory capital by $21.9 million, including a gain on the transaction of approximately $16.9 million.
NOTES TO CONDENSED CONSOLIDATED FINANCIAL STATEMENTS
CAPITOL BANCORP LIMITED – Continued
Note J – Pending Sale of Subsidiary Banks
In addition to completed sales of certain bank subsidiaries (see Note E), Capitol has entered into definitive agreements to sell its interests (or controlling interests held by bank-development subsidiaries) in the following institutions which were pending at March 31, 2011: 1st Commerce Bank, Bank of Feather River, Bank of Las Colinas, Bank of Michigan, Evansville Commerce Bank and High Desert Bank. The financial statement impact of the potential divestiture of these institutions is set forth in the accompanying pro forma condensed consolidated financial statements on pages 46 and 47 of this document.
On April 19, 2011, the sale of Community Bank of Rowan was completed with aggregate proceeds of $4.8 million and an estimated loss of approximately $1.25 million, which has been reflected in Capitol's first quarter 2011 financial statements against the gain on sale of bank subsidiaries.
The remaining pending bank sales are subject to regulatory approval and other significant contingencies.
Note K – Regulatory and Operating Matters
In September 2009, Capitol and its second-tier bank holding companies entered into an agreement with the Federal Reserve Bank of Chicago (the Reserve Bank) under which Capitol agreed to refrain from the following actions without the prior written consent of the Reserve Bank: (i) declare or pay dividends; (ii) receive dividends or any other form of payment representing a reduction in capital from Michigan Commerce Bank, or from any of its subsidiary institutions that are subject to any restriction by the institution's federal or state regulator that limits the payment of dividends or other intercorporate payments; (iii) make any distributions of interest, principal, or other sums on subordinated debentures or trust-preferred securities; (iv) incur, increase or guarantee any debt; or (v) purchase or redeem any shares of the stock of Capitol, the second-tier bank holding companies, nonbank subsidiaries or any of the subsidiary banks that are held by shareholders other than Capitol.
In addition, Capitol agreed to: (i) submit to the Reserve Bank a written plan to maintain sufficient capital at Capitol on a consolidated basis and at Michigan Commerce Bank (as Capitol's largest bank subsidiary and a separate legal entity on a stand-alone basis); (ii) notify the Reserve Bank no more than 30 days after the end of any quarter in which Capitol's consolidated or Michigan Commerce Bank's capital ratios fall below the approved capital plan's minimum ratios, as well as if any subsidiary institution's ratios fall below the minimum ratios required by the institution's federal or state regulator; (iii) review and revise its allowance for loan losses (ALLL) methodology for loans held by Capitol and submit to the Reserve Bank a written program for maintenance of an adequate ALLL for loans held by Capitol; (iv) take all necessary actions to ensure each of its subsidiary institutions comply with Federal Reserve regulations; (v) refrain from increasing any fees or charging new fees to any subsidiary institution without the prior written consent of the Reserve Bank; (vi) submit to the Reserve Bank a written plan to enhance the consolidated organization's risk management practices, a strategic plan to improve the consolidated organization's operating results and overall condition and a cash flow projection; (vii) comply with laws and regulations regarding senior executive officer positions and severance payments; and (viii) provide quarterly reports to the Reserve Bank regarding these undertakings.
Many of Capitol's bank subsidiaries have entered into formal agreements (as well as informal agreements) with their applicable regulatory agencies. Those agreements provide for certain restrictions and other guidelines and/or limitations to be followed by the banks.
The FDIC may issue Prompt Corrective Action Notifications (PCAN) to banking subsidiaries falling below the "adequately-capitalized" regulatory-capital classification, and subsequently may issue Prompt Correction Action Directives (PCAD). PCADs may be issued when a bank, which has previously received a PCAN, has submitted two consecutive capital restoration plans which have been rejected by the FDIC.
NOTES TO CONDENSED CONSOLIDATED FINANCIAL STATEMENTS
CAPITOL BANCORP LIMITED – Continued
Note K – Regulatory and Operating Matters – Continued
Banking subsidiaries which have recently received a PCAN and/or a PCAD are as follows, as of March 2011 (listed in descending order based on total assets):
| PCAN | | PCAD |
| | | |
| Michigan Commerce Bank | | Michigan Commerce Bank |
| Bank of Las Vegas | | Bank of Las Vegas |
| Sunrise Bank of Arizona | | Sunrise Bank of Arizona |
| Sunrise Bank (GA) | | |
| First Carolina State Bank | | |
| Central Arizona Bank | | Central Arizona Bank |
| Sunrise Bank of Albuquerque | | |
1st Commerce Bank | | |
| Pisgah Community Bank | | |
For each banking subsidiary which has received a PCAN, capital restoration plans have been requested by the FDIC, prepared and resubmitted for regulatory review and approval. For banks in receipt of a PCAD, those institutions are striving to develop and implement capital restoration plans which may be subsequently acceptable to the FDIC.
Regulatory capital matters are set forth in Note L.
On July 21, 2010, the Dodd-Frank Wall Street Reform and Consumer Protection Act (the Dodd-Frank Act) was signed into law and significantly changes future regulation of financial institutions and the financial services industry. The Dodd-Frank Act includes provisions affecting large and small financial institutions alike, including several provisions that will profoundly affect how community banks, thrifts and smaller bank holding companies will be regulated in the future. Among other things, these provisions abolish the Office of Thrift Supervision and transfer its functions to other federal banking agencies, relax rules regarding interstate branching, allow financial institutions to pay interest on business checking accounts, change the scope of FDIC insurance coverage and impose new capital requirements on bank holding companies, including removing trust-preferred securities as a permitted component of a holding company's Tier 1 capital after a three-year phase-in period beginning January 1, 2013. The Dodd-Frank Act also establishes the Bureau of Consumer Financial Protection as an independent entity within the Federal Reserve, which will be given the authority to promulgate consumer protection regulations applicable to all entities offering consumer financial services or products, including banks. Additionally, the Dodd-Frank Act includes a series of provisions covering mortgage loan origination standards affecting, among other things, originator compensation, minimum repayment standards and prepayments. Management is reviewing the provisions of the Dodd-Frank Act and assessing its probable impact on the Corporation's business, financial condition and results of operations. However, the ultimate effect of the Dodd-Frank Act on the financial services industry in general, and on the Corporation in particular, is currently uncertain.
One particularly important aspect of the Dodd-Frank Act (as amended) is that certain trust-preferred securities issued by bank holding companies with total assets less than $10 billion, such as Capitol, will be permitted to be included as an element of qualifying capital for regulatory capital-adequacy purposes. Accordingly, Capitol's trust-preferred securities may be included in regulatory capital measurements in the future, subject to certain limitations, although none of those securities are currently included.
NOTES TO CONDENSED CONSOLIDATED FINANCIAL STATEMENTS
CAPITOL BANCORP LIMITED – Continued
Note L –Regulatory Capital Matters
The following table summarizes the amounts (in $1,000s) and related ratios of Capitol's consolidated regulatory capital position:
| | | | March 31, | | | | December 31, | |
| | | | 2011 | | | | 2010 | |
| Tier 1 capital to average adjusted total assets: | | | | | | | | |
Minimum required amount(1) | | ≥ | $ | 133,648 | | | ≥ | $ | 155,224 | |
| Actual amount | | | $ | (39,618 | ) | | | $ | (39,980 | ) |
| Ratio | | | | (1.19 | )% | | | | (1.03 | )% |
| | | | | | | | | | | |
| Tier 1 capital to risk-weighted assets: | | | | | | | | | | |
Minimum required amount(2) | | ≥ | $ | 100,366 | | | ≥ | $ | 110,909 | |
| Actual amount | | | $ | (39,618 | ) | | | $ | (39,980 | ) |
| Ratio | | | | (1.58 | )% | | | | (1.44 | )% |
| | | | | | | | | | | |
Combined Tier 1 and Tier 2 capital to risk- weighted assets: | | | | | | | | | | |
Minimum required amount(3) | | ≥ | $ | 200,732 | | | ≥ | $ | 221,818 | |
| Actual amount | | | $ | (39,618 | ) | | | $ | (39,980 | ) |
| Ratio | | | | (1.58 | )% | | | | (1.44 | )% |
| (1) | The minimum required ratio of Tier 1 capital to average adjusted total assets is 4%. |
| (2) | The minimum required ratio of Tier 1 capital to risk-weighted assets to be considered "adequately-capitalized" is 4%. |
| (3) | The minimum required ratio of Tier 1 and Tier 2 capital to risk-weighted assets to be considered "adequately-capitalized" is 8%. |
Capitol's total risk-based capital ratio at March 31, 2011 and December 31, 2010 was materially and adversely impacted by the exclusion of approximately $181.8 million and $203.7 million, respectively, of previously-qualifying Tier 2 capital, inasmuch as Tier 2 capital is limited to 100% of Tier 1 capital, primarily trust-preferred securities and a portion of the allowance for loan losses. The Tier 1 capital deficit resulted from operating losses; however, a Tier 2 limitation, primarily due to the exclusion of trust-preferred securities, did not apply to Capitol's regulatory capital computations at earlier measurement dates prior to 2010.
The preceding summary indicates that Capitol, on a consolidated basis, was classified as less than "adequately-capitalized" at March 31, 2011 for regulatory purposes. In addition, several of its bank subsidiaries had capital levels resulting in classification as "undercapitalized" or "significantly-undercapitalized" at that date. Banks and bank holding companies which are less than "adequately-capitalized" are subject to increased regulatory oversight, requirements and limitations. Regarding banks classified as "undercapitalized" or "significantly-undercapitalized," or otherwise noncompliant with formal regulatory agreements, management is taking appropriate action to improve such capital classifications and related compliance in the future.
Regulatory capital ratios of the banks are set forth on page 40 on this document.
PART I, ITEM 2
MANAGEMENT'S DISCUSSION AND ANALYSIS OF FINANCIAL CONDITION
AND RESULTS OF OPERATIONS
The following discussion and analysis is intended as a review of significant factors affecting the financial condition and results of operations of Capitol for the periods indicated. The discussion should be read in conjunction with the condensed consolidated financial statements and the notes thereto presented elsewhere herein. In addition to historical information, the following Management's Discussion and Analysis of Financial Condition and Results of Operations contains forward-looking statements that involve risks and uncertainties, some of which are material to Capitol and its subsidiaries. Capitol's actual results could differ significantly from those anticipated in these forward-looking statements as a result of certain factors discussed in this report. Please refer to the commentary regarding forward-looking statements appearing on page 2 of this document.
Financial Condition
Total assets approximated $3.2 billion at March 31, 2011 and $3.5 billion at December 31, 2010. The balance sheet includes total assets of Capitol and its consolidated subsidiaries (in $1,000s) as follows:
| | | March 31, 2011 | | | December 31, 2010 | |
| Arizona Region: | | | | | | |
Bank of Tucson(1) | | | | | $ | 222,882 | |
| Central Arizona Bank | | $ | 70,769 | | | | 75,590 | |
| Sunrise Bank of Albuquerque | | | 64,623 | | | | 73,539 | |
| Sunrise Bank of Arizona | | | 391,375 | | | | 353,154 | |
| Arizona Region Total | | | 526,767 | | | | 725,165 | |
| | | | | | | | | |
| California Region: | | | | | | | | |
| Bank of Feather River | | | 41,245 | | | | 38,930 | |
| Sunrise Bank | | | 232,003 | | | | 231,836 | |
| California Region Total | | | 273,248 | | | | 270,766 | |
| | | | | | | | | |
| Colorado Region: | | | | | | | | |
| Mountain View Bank of Commerce | | | 60,424 | | | | 60,303 | |
| | | | | | | | | |
| Great Lakes Region: | | | | | | | | |
| Bank of Maumee | | | 38,820 | | | | 40,300 | |
| Bank of Michigan | | | 79,916 | | | | 81,873 | |
| Capitol National Bank | | | 158,116 | | | | 157,606 | |
| Evansville Commerce Bank | | | 48,436 | | | | 52,506 | |
| Indiana Community Bank | | | 129,078 | | | | 128,728 | |
| Michigan Commerce Bank | | | 884,477 | | | | 933,698 | |
| Great Lakes Region Total | | | 1,338,843 | | | | 1,394,711 | |
| | | | | | | | | |
| Nevada Region: | | | | | | | | |
1st Commerce Bank | | | 34,513 | | | | 39,555 | |
| Bank of Las Vegas | | | 351,889 | | | | 375,084 | |
| Nevada Region Total | | | 386,402 | | | | 414,639 | |
| | | | | | | | | |
| Northwest Region: | | | | | | | | |
| Bank of the Northwest | | | 146,388 | | | | 145,540 | |
| High Desert Bank | | | 35,608 | | | | 37,967 | |
| Northwest Region Total | | | 181,996 | | | | 183,507 | |
| | | | | | | | | |
| Southeast Region: | | | | | | | | |
Community Bank of Rowan(1) | | | 134,501 | | | | 140,276 | |
| First Carolina State Bank | | | 99,176 | | | | 103,254 | |
| Pisgah Community Bank | | | 37,254 | | | | 43,125 | |
| Sunrise Bank | | | 106,007 | | | | 112,718 | |
| Southeast Region Total | | | 376,938 | | | | 399,373 | |
MANAGEMENT'S DISCUSSION AND ANALYSIS OF FINANCIAL CONDITION
AND RESULTS OF OPERATIONS – Continued
Financial Condition – Continued
Summary of total assets – continued:
| | | March 31, 2011 | | | December 31, 2010 | |
| Texas Region: | | | | | | |
Bank of Fort Bend(1) | | | | | $ | 35,375 | |
| Bank of Las Colinas | | $ | 49,949 | | | | 44,767 | |
| Texas Region Total | | | 49,949 | | | | 80,142 | |
| | | | | | | | | |
| Parent company and other, net | | | 2,395 | | | | 11,608 | |
| | | | | | | | | |
| Consolidated totals | | | 3,196,962 | | | | 3,540,214 | |
| Less discontinued operations | | | (134,501 | ) | | | (398,533 | ) |
| | | | | | | | | |
| Consolidated totals—continuing operations | | $ | 3,062,461 | | | $ | 3,141,681 | |
| (1) | Capitol sold its ownership in Community Bank of Rowan effective April 19, 2011; Bank of Fort Bend effective March 30, 2011 and Bank of Tucson effective January 24, 2011. The banks' operations have been included in Capitol's consolidated totals up to the date of sale; however, the banks' results are reflected in discontinued operations. |
Total assets decreased $343 million during the three months ended March 31, 2011, of which $258 million related to bank subsidiaries sold during the period.
Portfolio loans, the single largest asset category (77% of total assets at March 31, 2011), decreased during the three months ended March 31, 2011 by approximately $88 million, compared to a decrease of about $139 million during the corresponding period of 2010. The portfolio decrease is in response to the need to preserve liquidity and capital in the current economic climate and the general economic slowdown occurring nationally. Because portfolio loans compose the largest portion of assets, most of this section of the narrative is devoted to loans and asset quality.
Geographic diversification of Capitol's balance sheet is important. Prior to 1996, all of Capitol's banking operations were located in Michigan. As of March 31, 2011, 46% of the consolidated loan portfolio relates to banks located within the Great Lakes Region (43% at December 31, 2010) and 54% of the consolidated loan portfolio relates to banks located in other regions of the country (57% at December 31, 2010). This is important because Capitol's diversification efforts lessen disproportionate geographic concentration within a specific region.
The consolidated allowance for loan losses at March 31, 2011 approximated $136.7 million or 5.58% of total portfolio loans, a decrease from the 5.71% ratio at the beginning of the year (excluding discontinued operations), resulting from some improvement in economic conditions and changes in asset quality.
Loan charge-offs for the interim 2011 period, which decreased significantly compared to 2010, are not necessarily indicative of future charge-off levels because of the variability in asset quality and resolution of nonperforming loans. The significant increase in the provision for loan losses in the 2010 period related primarily to Michigan, Arizona and Nevada banks, due to growth in nonperforming loans and a sustained difficult and uncertain economic climate. The interim 2011 provision for loan losses is discussed in further detail in the 'Results of Operations' section of this narrative.
Nonperforming loans decreased $23.3 million or 7.4% during the three months ended March 31, 2011, compared to a large increase of $36.5 million or 11.9% in the corresponding period of 2010. Nonperforming loans have decreased for three consecutive quarters. Management believes the overall decrease may demonstrate some stabilization in several of Capitol's key markets; however, no assurance can be given that future operating results will continue to reflect these recent trends.
Nonperforming assets decreased $19.0 million for the three months ended March 31, 2011, compared to an $8.4 million decrease in the immediately preceding quarterly period.
MANAGEMENT'S DISCUSSION AND ANALYSIS OF FINANCIAL CONDITION
AND RESULTS OF OPERATIONS – Continued
Financial Condition – Continued
The allowance for loan losses as a percentage of nonperforming loans approximated 47.02% at March 31, 2011, compared to 46.17% at the beginning of the year (excluding operations discontinued in 2010). As previously-discussed, the allowance for loan losses is an estimate determined by management at the balance-sheet date. Levels of nonperforming loans may fluctuate at balance-sheet dates by amounts which are not commensurate with the ratio of the allowance for loan losses or the so-called allowance coverage ratio of nonperforming loans (i.e., the allowance for loan losses as a percentage of nonperforming loans). Several factors may contribute to this occurrence. For example, estimated losses relating to impaired collateral-dependent loans are generally reflected as direct write-downs to those loans and, accordingly, there is no related allowance for loan losses allocation necessary. Further, some collateral-dependent loans may have minimal or no loss potential which would negate a computational comparison between the allowance for loan losses and such nonperforming loans.
While recent reductions in nonperforming loans and other nonperforming assets are encouraging, future changes in asset quality remain uncertain. Because bank subsidiaries which have been sold during 2010 and the interim 2011 period had relatively better asset quality than the remaining banks, nonperforming assets increased as a percentage of consolidated portfolio loans and total assets, despite the most recent decreases in the amount of nonperforming assets.
Nonperforming loans at March 31, 2011 approximated 11.86% of total portfolio loans, a decrease from the December 31, 2010 ratio of 12.4% (excluding discontinued operations). Of the nonperforming loans at March 31, 2011, about 89% were real estate secured. Those loans, when originated, had appropriate loan-to-value ratios based upon real estate market conditions at that time and, accordingly, had loss exposure which would have been expected to be minimal; however, underlying real estate values depend upon current economic conditions and liquidation strategies. Most other nonperforming loans were generally secured by other business assets. Nonperforming loans at March 31, 2011 were in various stages of resolution which management believes are adequately collateralized or otherwise appropriately considered in its determination of the adequacy of the allowance for loan losses.
Due to local, regional and national economic conditions, there is uncertainty in future real estate values, appraisal data and the resulting potential impact on valuation of collateral-dependent loans and other real estate owned. The fair value measurement of collateral-dependent loans and other real estate owned is dependent upon appraisals of the underlying property value and cautious review of current appraisal data. Management cautiously and diligently monitors real estate values and related appraisal data when evaluating appraisals or its internal evaluations of property values.
Updated appraisals are generally obtained when it has been determined that a collateral-dependent loan has become impaired or when it is likely a loan secured by real estate will be foreclosed. Adjustments to the loan's carrying value (or requirements for an allocation of the allowance for loan losses) are made, when appropriate, after review of appraisal data or, in the absence of a recent appraisal, if market conditions significantly decline further. The timing of when a collateral-dependent loan should be classified as a nonperforming credit is contingent upon several factors, including the performance of the loan, payment history and/or results of the bank's review of updated borrower financial information.
When a borrower's performance has deteriorated (for example, the borrower has become delinquent on required payments, the borrower's updated financial information received indicates adverse financial trends or sales/leasing activity is less than expected in the case of multi-unit properties), the loan will be downgraded and, if appropriate, an updated appraisal will be ordered. In the period between a loan being recognized as impaired and receipt of an updated appraisal, the loan will be included within loss contingency pools, in conjunction with estimating the bank's requirements for its allowance for loan losses. Upon receipt and review of updated appraisal data and after any further fair value analysis is completed, the loan will be further evaluated for appropriate write-down. Generally, negative differences between appraised value, less the estimated cost to sell, and the related carrying value of the loans are charged to the allowance for loan losses, as a partial write-down/charge-off, on a timely basis after the appraisal has been received and reviewed. Occasionally, additional potential loss amounts may be included if circumstances exist which may further adversely impact fair value estimates. Internally-developed
MANAGEMENT'S DISCUSSION AND ANALYSIS OF FINANCIAL CONDITION
AND RESULTS OF OPERATIONS – Continued
Financial Condition – Continued
evaluations may be used when the amount of a loan is less than $250,000. Internally-prepared evaluations may also be used when the most recent appraisal date is within a year to estimate the current effect of economic conditions or deterioration. Updated fair value information is generally obtained at least annually for collateral-dependent loans and other real estate owned.
Total nonperforming loans approximated $291 million at March 31, 2011. Of that total, $132.8 million or 45.7% (including some loans carried at the parent level) were originated by banks located within the Great Lakes Region, primarily in Michigan. Nonperforming loans have decreased significantly during the three months ended March 31, 2011 by $11.9 million within the Great Lakes Region and $4.9 million within the Nevada Region.
In response to the elevated level of nonperforming loans, higher levels of allowances for loan losses have been established for the Great Lakes Region (including some loans carried at the parent level), Arizona Region and the Nevada Region, approximating 5.86%, 5.55% and 7.51% of portfolio loans for the respective region on a combined basis as of March 31, 2011. The allowance for loan losses levels range as high as 12.69% at Pisgah Community Bank, 7.56% at Bank of Las Vegas and 6.76% at Michigan Commerce Bank. Those ratios can be contrasted with some other banks and geographic regions within the Corporation with lower levels of nonperforming loans.
In addition to the identification of nonperforming loans involving borrowers with payment performance difficulties (i.e., nonaccrual loans and loans past due 90 days or more), management utilizes an internal loan review process to identify other potential problem loans which may warrant additional monitoring or other intervention. This loan review process is a continuous activity which periodically updates internal loan ratings. At inception, all loans are individually assigned a rating which grades the credits on a risk basis, based on the financial strength of the borrower and guarantors and other factors such as the nature of the borrower's business climate, local economic conditions and other subjective factors. The loan rating process is fluid and subjective.
Potential problem loans include loans which are generally performing as agreed; however, because of loan reviews and/or lending staff's risk assessment, increased monitoring is deemed appropriate. In addition, some loans are assigned a more adverse classification, with specific performance issues or other risk factors requiring close management and development of specific remedial action plans.
At March 31, 2011, problem and potential-problem loans (including the previously-discussed nonperforming loans) approximated $707.7 million or about 29% of total consolidated portfolio loans, compared to approximately $742.8 million or about 29% at December 31, 2010. These potential problem loans (exclusive of nonperforming loans) do not necessarily have significant loss exposure (nor are they necessarily deemed "impaired"), but rather are identified by management as potential problem loans to aid in loan administration and risk management. Management has considered these loans in its evaluation of the adequacy of the allowance for loan losses. Nonperforming loans, as previously-discussed, are primarily secured by real estate which is subject to fair value estimates and related loss recognition. Management believes, however, that current general economic conditions in some markets may result in higher levels of future loan losses in comparison to previous years, as experienced in the first three months of 2011.
Regarding other real estate owned and collateral-dependent loans in Michigan (about 32% of consolidated totals), foreclosure laws in that state generally favor borrowers rather than lenders and, accordingly, foreclosure and redemption periods (i.e., the number of months it takes for a financial institution to obtain clear title to freely market the real estate) take much longer than in many other states. Further, once a property is available to the bank for sale or liquidation, current market conditions (particularly in Michigan, Arizona and Nevada) may not be conducive to rapid marketing or near-term sale of the properties.
MANAGEMENT'S DISCUSSION AND ANALYSIS OF FINANCIAL CONDITION
AND RESULTS OF OPERATIONS – Continued
Financial Condition – Continued
The following comparative analysis summarizes each bank's total portfolio loans, allowance for loan losses, nonperforming loans and ratio of the allowance as a percentage of portfolio loans (in $1,000s):
| | | | | | Allowance for | | | | | | Allowance as a Percentage | |
| | | Total Portfolio Loans | | | Loan Losses | | | Nonperforming Loans | | | of Total Portfolio Loans | |
| | | March 31, 2011 | | | Dec 31, 2010 | | | March 31, 2011 | | | Dec 31, 2010 | | | March 31, 2011 | | | Dec 31, 2010 | | | March 31, 2011 | | | Dec 31, 2010 | |
| Arizona Region: | | | | | | | | | | | | | | | | | | | | | | | | |
Bank of Tucson(1) | | | | | $ | 159,334 | | | | | | $ | 2,380 | | | | | | $ | 7,711 | | | | | | | 1.49 | % |
| Central Arizona Bank | | $ | 48,442 | | | | 52,844 | | | $ | 2,031 | | | | 2,552 | | | $ | 3,986 | | | | 5,092 | | | | 4.19 | % | | | 4.83 | % |
| Sunrise Bank of Albuquerque | | | 50,051 | | | | 52,502 | | | | 2,692 | | | | 2,499 | | | | 3,986 | | | | 4,731 | | | | 5.38 | % | | | 4.76 | % |
| Sunrise Bank of Arizona | | | 288,155 | | | | 264,181 | | | | 16,740 | | | | 16,700 | | | | 29,507 | | | | 29,936 | | | | 5.81 | % | | | 6.32 | % |
| Arizona Region Total | | | 386,648 | | | | 528,861 | | | | 21,463 | | | | 24,131 | | | | 37,479 | | | | 47,470 | | | | 5.55 | % | | | 4.56 | % |
| | | | | | | | | | | | | | | | | | | | | | | | | | | | | | | | | |
| California Region: | | | | | | | | | | | | | | | | | | | | | | | | | | | | | | | | |
| Bank of Feather River | | | 33,167 | | | | 31,297 | | | | 501 | | | | 479 | | | | | | | | | | | | 1.51 | % | | | 1.53 | % |
| Sunrise Bank | | | 182,870 | | | | 183,641 | | | | 7,554 | | | | 7,815 | | | | 6,920 | | | | 8,529 | | | | 4.13 | % | | | 4.26 | % |
| California Region Total | | | 216,037 | | | | 214,938 | | | | 8,055 | | | | 8,294 | | | | 6,920 | | | | 8,529 | | | | 3.73 | % | | | 3.86 | % |
| | | | | | | | | | | | | | | | | | | | | | | | | | | | | | | | | |
| Colorado Region: | | | | | | | | | | | | | | | | | | | | | | | | | | | | | | | | |
| Mountain View Bank of Commerce | | | 42,882 | | | | 41,087 | | | | 803 | | | | 789 | | | | 879 | | | | 883 | | | | 1.87 | % | | | 1.92 | % |
| | | | | | | | | | | | | | | | | | | | | | | | | | | | | | | | | |
| Great Lakes Region: | | | | | | | | | | | | | | | | | | | | | | | | | | | | | | | | |
| Bank of Maumee | | | 32,299 | | | | 33,558 | | | | 1,422 | | | | 1,427 | | | | 715 | | | | 442 | | | | 4.40 | % | | | 4.25 | % |
| Bank of Michigan | | | 63,133 | | | | 64,278 | | | | 1,501 | | | | 1,368 | | | | 2,094 | | | | 2,312 | | | | 2.38 | % | | | 2.13 | % |
| Capitol National Bank | | | 133,598 | | | | 138,251 | | | | 5,063 | | | | 5,976 | | | | 12,782 | | | | 13,616 | | | | 3.79 | % | | | 4.32 | % |
| Evansville Commerce Bank | | | 36,074 | | | | 38,609 | | | | 1,029 | | | | 1,103 | | | | 1,551 | | | | 1,801 | | | | 2.85 | % | | | 2.86 | % |
| Indiana Community Bank | | | 108,062 | | | | 112,986 | | | | 3,758 | | | | 3,703 | | | | 7,758 | | | | 8,358 | | | | 3.48 | % | | | 3.28 | % |
| Michigan Commerce Bank | | | 754,839 | | | | 812,088 | | | | 51,012 | | | | 57,381 | | | | 105,020 | | | | 114,937 | | | | 6.76 | % | | | 7.07 | % |
| Great Lakes Region Total | | | 1,128,005 | | | | 1,199,770 | | | | 63,785 | | | | 70,958 | | | | 129,920 | | | | 141,466 | | | | 5.65 | % | | | 5.91 | % |
| | | | | | | | | | | | | | | | | | | | | | | | | | | | | | | | | |
| Nevada Region: | | | | | | | | | | | | | | | | | | | | | | | | | | | | | | | | |
1st Commerce Bank | | | 24,229 | | | | 25,521 | | | | 1,658 | | | | 624 | | | | 4,886 | | | | 5,611 | | | | 6.84 | % | | | 2.45 | % |
| Bank of Las Vegas | | | 286,145 | | | | 306,802 | | | | 21,641 | | | | 25,235 | | | | 77,836 | | | | 82,042 | | | | 7.56 | % | | | 8.23 | % |
| Nevada Region Total | | | 310,374 | | | | 332,323 | | | | 23,299 | | | | 25,859 | | | | 82,722 | | | | 87,653 | | | | 7.51 | % | | | 7.78 | % |
| | | | | | | | | | | | | | | | | | | | | | | | | | | | | | | | | |
| Northwest Region: | | | | | | | | | | | | | | | | | | | | | | | | | | | | | | | | |
| Bank of the Northwest | | | 118,188 | | | | 118,755 | | | | 4,002 | | | | 4,000 | | | | 5,610 | | | | 6,609 | | | | 3.39 | % | | | 3.37 | % |
| High Desert Bank | | | 28,935 | | | | 29,872 | | | | 1,450 | | | | 1,350 | | | | 933 | | | | 1,053 | | | | 5.01 | % | | | 4.52 | % |
| Northwest Region Total | | | 147,123 | | | | 148,627 | | | | 5,452 | | | | 5,350 | | | | 6,543 | | | | 7,662 | | | | 3.71 | % | | | 3.60 | % |
| | | | | | | | | | | | | | | | | | | | | | | | | | | | | | | | | |
| Southeast Region: | | | | | | | | | | | | | | | | | | | | | | | | | | | | | | | | |
Community Bank of Rowan(1) | | | 101,219 | | | | 102,926 | | | | 1,628 | | | | 1,736 | | | | 4,411 | | | | 3,441 | | | | 1.61 | % | | | 1.69 | % |
| First Carolina State Bank | | | 73,248 | | | | 77,797 | | | | 3,308 | | | | 2,389 | | | | 5,775 | | | | 6,560 | | | | 4.52 | % | | | 3.07 | % |
| Pisgah Community Bank | | | 26,493 | | | | 28,071 | | | | 3,362 | | | | 1,511 | | | | 7,289 | | | | 6,968 | | | | 12.69 | % | | | 5.38 | % |
| Sunrise Bank | | | 74,147 | | | | 79,558 | | | | 3,785 | | | | 4,374 | | | | 9,441 | | | | 10,452 | | | | 5.40 | % | | | 5.50 | % |
| Southeast Region Total | | | 275,107 | | | | 288,352 | | | | 12,083 | | | | 10,010 | | | | 26,916 | | | | 27,421 | | | | 4.39 | % | | | 3.47 | % |
| | | | | | | | | | | | | | | | | | | | | | | | | | | | | | | | | |
| Texas Region: | | | | | | | | | | | | | | | | | | | | | | | | | | | | | | | | |
Bank of Fort Bend(1) | | | | | | | 29,788 | | | | | | | | 700 | | | | | | | | 419 | | | | | | | | 2.35 | % |
| Bank of Las Colinas | | | 40,772 | | | | 41,434 | | | | 737 | | | | 737 | | | | 891 | | | | 907 | | | | 1.81 | % | | | 1.78 | % |
| Texas Region Total | | | 40,772 | | | | 71,222 | | | | 737 | | | | 1,437 | | | | 891 | | | | 1,326 | | | | 1.81 | % | | | 2.02 | % |
| | | | | | | | | | | | | | | | | | | | | | | | | | | | | | | | | |
| Parent company and other, net | | | 4,992 | | | | 5,866 | | | | 2,632 | | | | 2,973 | | | | 2,834 | | | | 3,170 | | | | 52.72 | % | | n.m. | |
| | | | | | | | | | | | | | | | | | | | | | | | | | | | | | | | | |
| Consolidated totals | | | 2,551,940 | | | | 2,831,046 | | | | 138,309 | | | | 149,801 | | | | 295,104 | | | | 325,580 | | | | 5.42 | % | | | 5.29 | % |
| Less discontinued operations | | | (101,219 | ) | | | (292,048 | ) | | | (1,628 | ) | | | (4,816 | ) | | | (4,411 | ) | | | (11,571 | ) | | | | | | | (1.49 | )% |
| | | | | | | | | | | | | | | | | | | | | | | | | | | | | | | | | |
Consolidated totals relating to continuing operations | | $ | 2,450,721 | | | $ | 2,538,998 | | | $ | 136,681 | | | $ | 144,985 | | | $ | 290,693 | | | $ | 314,009 | | | | 5.58 | % | | | 5.71 | % |
| (1) | Capitol sold its ownership in Community Bank of Rowan effective April 19, 2011; Bank of Fort Bend effective March 30, 2011 and Bank of Tucson effective January 24, 2011. The banks' operations have been included in Capitol's consolidated totals up to the date of sale; however, the banks' results are reflected in discontinued operations. |
| n.m. | Not meaningful. |
MANAGEMENT'S DISCUSSION AND ANALYSIS OF FINANCIAL CONDITION
AND RESULTS OF OPERATIONS – Continued
Financial Condition – Continued
Accounting for income taxes requires significant estimates and management judgments. At March 31, 2011, Capitol had a deferred tax asset approximating $198.6 million ($192.1 million at December 31, 2010), subject to a related valuation allowance. When realization of the deferred tax asset is in doubt, a valuation reserve is required to reduce the deferred tax asset to the amount which is more-likely-than-not realizable. Although there was a small gain recognized in the interim 2011 period, management reviewed the potential realization of net deferred tax assets as of March 31, 2011 and increased the related valuation allowance to $197.5 million, reducing the net deferred tax asset to approximately $1.1 million. The net deferred tax asset ($1.1 million and $1.8 million at March 31, 2011 and December 31, 2010, respectively) represents the amount which is more-likely-than-not realizable at the balance-sheet date for a small group of less than 80%-owned consolidated bank subsidiaries.
Results of Operations
Summary
Net income attributable to Capitol for the three months ended March 31, 2011 approximated $289,000 compared to a net loss of $47.9 million in the corresponding period of 2010. Net income per common share attributable to Capitol was $0.01 for the three months ended March 31, 2011 compared to a net loss per share of $2.75 in the corresponding 2010 period. Net income relating to discontinued operations was not material to the periods presented except for the gain on sale of bank subsidiaries which approximated $4.4 million for the three months ended March 31, 2011.
The primary reasons for the interim 2011 net income were a significant reduction in the provision for loan losses of $33.9 million to $13.5 million for the three months ended March 31, 2011 compared to a provision of $47.4 million for the corresponding period of 2010 (excluding discontinued operations), as well as a gain on exchange of trust-preferred securities for common stock of approximately $16.9 million.
Analytical Review
The provision for loan losses decreased significantly for the three months ended March 31, 2011 due to lower levels of loan charge-offs, declining levels of nonperforming loans and stable valuations of collateral-dependent loans, primarily secured by real estate. Provisions for loan losses are estimates based upon management's analysis of the adequacy of the allowance for loan losses, as previously-discussed. The significant increase in the provision for loan losses in the preceding year had a material adverse effect on interim 2010 operating results.
The net interest margin approximated 3.15% for the three months ended March 31, 2011, a 21 basis-point increase compared to 2.94% for the three months ended December 31, 2010, and a 12 basis-point increase compared to 3.03% for the three months ended March 31, 2010. It is difficult to speculate on future changes in net interest margin. Net interest income for the three-month 2011 period totaled $24.2 million, a small decrease compared to $24.8 million in 2010.
While net interest income was relatively stable during the interim 2011 period in spite of a significantly reduced asset base compared to 2010, provisions for loan losses did not exceed net interest income for the interim period of 2011 as it did in the interim 2010 period.
Noninterest income for the three months ended March 31, 2011 approximated $21.4 million, a significant increase compared to $6.2 million for the same period in 2010. The interim 2011 period included a gain on exchange of trust-preferred securities of $16.9 million (see Note I to the accompanying condensed consolidated financial statements) and the interim 2010 period included a gain on exchange of promissory notes for common stock of $1.3 million. When excluding each of these gains, noninterest income showed a 9% decline in 2011 compared to 2010.
MANAGEMENT'S DISCUSSION AND ANALYSIS OF FINANCIAL CONDITION
AND RESULTS OF OPERATIONS – Continued
Results of Operations – Continued
Noninterest expense totaled $39.9 million for the three-month 2011 period compared to $47.1 million for the comparable period of 2010. The decrease resulted from significantly lower costs associated with foreclosed properties and other real estate owned, which decreased $4.1 million (35%) to $7.5 million in the three-month 2011 period ($11.6 million in the corresponding 2010 period), due to stable valuations and holding costs of other real estate owned. The cost of FDIC insurance and other regulatory fees also decreased for the first quarter in over a year to $3.3 million compared to $4.1 million in the 2010 period due to the decline in deposits which is used for the assessment base.
The largest element of noninterest expense is salaries and employee benefits, which approximated $15.5 million for the three months ended March 31, 2011, a decrease of 14.8% from $18.2 million in the corresponding period of 2010, as a result of Capitol's efforts to reduce and streamline staffing at its banks and corporate offices.
The more significant elements of other noninterest expense consisted of the following for the period ended March 31 (in $1,000s):
| | | Three Months Ended March 31 | |
| | | 2011 | | | 2010(1) | |
| | | | | | | |
| Impairment loss | | $ | 1,600 | | | | |
| Legal fees | | | 896 | | | $ | 941 | |
| Insurance | | | 790 | | | | 275 | |
| Loan and collection expense | | | 508 | | | | 898 | |
| Professional fees | | | 465 | | | | 2,042 | |
Bank services (ATMs, telephone banking and Internet banking) | | | 366 | | | | 306 | |
| Directors' fees | | | 300 | | | | 392 | |
| Paper, printing and supplies | | | 293 | | | | 349 | |
| Communications | | | 282 | | | | 299 | |
| Advertising | | | 278 | | | | 366 | |
| Travel, lodging and meals | | | 247 | | | | 246 | |
| Other | | | 1,775 | | | | 577 | |
| | | | | | | | | |
| Total | | $ | 7,800 | | | $ | 6,691 | |
(1) Excludes amounts related to operations discontinued in 2010.
[The remainder of this page intentionally left blank]
| | MANAGEMENT'S DISCUSSION AND ANALYSIS OF FINANCIAL CONDITION |
AND RESULTS OF OPERATIONS – Continued
Results of Operations – Continued
Operating results for the three months ended March 31 were as follows (in $1,000s):
| | | Total Revenues | | | Net Income (Loss)(1) | | | Return on Average Equity(2) | | | Return on Average Assets(2) | |
| | | 2011 | | | 2010 | | | 2011 | | | 2010 | | | 2011 | | | 2010 | | | 2011 | | | 2010 | |
| Arizona Region: | | | | | | | | | | | | | | | | | | | | | | | | |
Bank of Tucson(3) | | | | | $ | 3,189 | | | | | | $ | 633 | | | | | | | 13.12 | % | | | | | | 1.21 | % |
| Central Arizona Bank | | $ | 729 | | | | 631 | | | $ | (663 | ) | | | (1,011 | ) | | | | | | | | | | | | | | |
Southern Arizona Community Bank(3) | | | | | | | 1,230 | | | | | | | | 203 | | | | | | | 8.45 | % | | | | | | 0.86 | % |
| Sunrise Bank of Albuquerque | | | 805 | | | | 957 | | | | (734 | ) | | | (677 | ) | | | | | | | | | | | | | | |
| Sunrise Bank of Arizona | | | 5,397 | | | | 3,787 | | | | (2,506 | ) | | | (16,180 | ) | | | | | | | | | | | | | | |
| Arizona Region Total | | | 6,931 | | | | 9,794 | | | | (3,903 | ) | | | (17,032 | ) | | | | | | | | | | | | | | |
| | | | | | | | | | | | | | | | | | | | | | | | | | | | | | | |
| California Region: | | | | | | | | | | | | | | | | | | | | | | | | | | | | | | |
| Bank of Feather River | | | 636 | | | | 566 | | | | 14 | | | | 30 | | | | 0.90 | % | | | 1.98 | % | | | 0.14 | % | | | 0.36 | % |
Bank of San Francisco(3) | | | | | | | 1,356 | | | | | | | | 160 | | | | | | | | 7.54 | % | | | | | | | 0.71 | % |
Napa Community Bank(3) | | | | | | | 2,224 | | | | | | | | (219 | ) | | | | | | | | | | | | | | | | |
| Sunrise Bank | | | 2,899 | | | | 3,431 | | | | 542 | | | | (1,480 | ) | | | 10.99 | % | | | | | | | 0.96 | % | | | | |
| California Region Total | | | 3,535 | | | | 7,577 | | | | 556 | | | | (1,509 | ) | | | | | | | | | | | | | | | | |
| | | | | | | | | | | | | | | | | | | | | | | | | | | | | | | | | |
| Colorado Region: | | | | | | | | | | | | | | | | | | | | | | | | | | | | | | | | |
Fort Collins Commerce Bank(3) | | | | | | | 1,434 | | | | | | | | 86 | | | | | | | | 3.63 | % | | | | | | | 0.37 | % |
Larimer Bank of Commerce(3) | | | | | | | 1,330 | | | | | | | | 55 | | | | | | | | 2.77 | % | | | | | | | 0.25 | % |
Loveland Bank of Commerce(3) | | | | | | | 573 | | | | | | | | 34 | | | | | | | | 2.17 | % | | | | | | | 0.34 | % |
| Mountain View Bank of Commerce | | | 690 | | | | 677 | | | | 33 | | | | 41 | | | | 1.82 | % | | | 2.31 | % | | | 0.22 | % | | | 0.33 | % |
| Colorado Region Total | | | 690 | | | | 4,014 | | | | 33 | | | | 216 | | | | | | | | | | | | | | | | | |
| | | | | | | | | | | | | | | | | | | | | | | | | | | | | | | | | |
| Great Lakes Region: | | | | | | | | | | | | | | | | | | | | | | | | | | | | | | | | |
| Bank of Maumee | | | 535 | | | | 633 | | | | (26 | ) | | | (138 | ) | | | | | | | | | | | | | | | | |
| Bank of Michigan | | | 1,223 | | | | 1,155 | | | | 37 | | | | (175 | ) | | | 2.15 | % | | | | | | | 0.19 | % | | | | |
| Capitol National Bank | | | 2,192 | | | | 2,604 | | | | 27 | | | | (642 | ) | | | 1.02 | % | | | | | | | 0.07 | % | | | | |
| Evansville Commerce Bank | | | 613 | | | | 706 | | | | (45 | ) | | | (150 | ) | | | | | | | | | | | | | | | | |
| Indiana Community Bank | | | 1,690 | | | | 1,999 | | | | (268 | ) | | | (424 | ) | | | | | | | | | | | | | | | | |
| Michigan Commerce Bank | | | 14,311 | | | | 15,673 | | | | (7,123 | ) | | | (27,308 | ) | | | | | | | | | | | | | | | | |
Ohio Commerce Bank(3) | | | | | | | 1,011 | | | | | | | | 128 | | | | | | | | 5.42 | % | | | | | | | 0.75 | % |
| Great Lakes Region Total | | | 20,564 | | | | 23,781 | | | | (7,398 | ) | | | (28,709 | ) | | | | | | | | | | | | | | | | |
| | | | | | | | | | | | | | | | | | | | | | | | | | | | | | | | | |
| Midwest Region | | | | | | | | | | | | | | | | | | | | | | | | | | | | | | | | |
Adams Dairy Bank(3) | | | | | | | 626 | | | | | | | | (110 | ) | | | | | | | | | | | | | | | | |
Bank of Belleville(3) | | | | | | | 785 | | | | | | | | 12 | | | | | | | | 0.68 | % | | | | | | | 0.07 | % |
Community Bank of Lincoln(3) | | | | | | | 658 | | | | | | | | (202 | ) | | | | | | | | | | | | | | | | |
| Midwest Region Total | | | | | | | 2,069 | | | | | | | | (300 | ) | | | | | | | | | | | | | | | | |
| | | | | | | | | | | | | | | | | | | | | | | | | | | | | | | | | |
| Nevada Region: | | | | | | | | | | | | | | | | | | | | | | | | | | | | | | | | |
1st Commerce Bank | | | 335 | | | | 483 | | | | (1,778 | ) | | | (725 | ) | | | | | | | | | | | | | | | | |
| Bank of Las Vegas | | | 3,743 | | | | 4,973 | | | | (695 | ) | | | (9,381 | ) | | | | | | | | | | | | | | | | |
| Nevada Region Total | | | 4,078 | | | | 5,456 | | | | (2,473 | ) | | | (10,106 | ) | | | | | | | | | | | | | | | | |
| | | | | | | | | | | | | | | | | | | | | | | | | | | | | | | | | |
| Northeast Region: | | | | | | | | | | | | | | | | | | | | | | | | | | | | | | | | |
USNY Bank(3) | | | | | | | 1,004 | | | | | | | | 203 | | | | | | | | 15.63 | % | | | | | | | 1.27 | % |
| | | | | | | | | | | | | | | | | | | | | | | | | | | | | | | | | |
| Northwest Region: | | | | | | | | | | | | | | | | | | | | | | | | | | | | | | | | |
| Bank of the Northwest | | | 1,853 | | | | 2,079 | | | | 81 | | | | (731 | ) | | | 2.17 | % | | | | | | | 0.23 | % | | | | |
| High Desert Bank | | | 492 | | | | 563 | | | | (320 | ) | | | (291 | ) | | | | | | | | | | | | | | | | |
| Northwest Region Total | | | 2,345 | | | | 2,642 | | | | (239 | ) | | | (1,022 | ) | | | | | | | | | | | | | | | | |
| | | | | | | | | | | | | | | | | | | | | | | | | | | | | | | | | |
| Southeast Region: | | | | | | | | | | | | | | | | | | | | | | | | | | | | | | | | |
Community Bank of Rowan(3)(4) | | | 1,550 | | | | | | | | (71 | ) | | | | | | | | | | | | | | | | | | | 0.47 | % |
| First Carolina State Bank | | | 1,018 | | | | 1,133 | | | | (2,120 | ) | | | (782 | ) | | | | | | | | | | | | | | | | |
| Pisgah Community Bank | | | 353 | | | | 541 | | | | (2,385 | ) | | | (6,542 | ) | | | | | | | | | | | | | | | | |
| Sunrise Bank | | | 1,261 | | | | 1,703 | | | | (1,002 | ) | | | (1,528 | ) | | | | | | | | | | | | | | | | |
| Southeast Region Total | | | 4,182 | | | | 3,377 | | | | (5,578 | ) | | | (8,852 | ) | | | | | | | | | | | | | | | | |
MANAGEMENT'S DISCUSSION AND ANALYSIS OF FINANCIAL CONDITION
AND RESULTS OF OPERATIONS – Continued
Results of Operations – Continued
Operating results – continued:
| | | Total Revenues | | | Net Income (Loss)(1) | | | Return on Average Equity(2) | | | Return on Average Assets(2) | |
| | | 2011 | | | 2010 | | | 2011 | | | 2010 | | | 2011 | | | 2010 | | | 2011 | | | 2010 | |
| Texas Region: | | | | | | | | | | | | | | | | | | | | | | | | | | |
Bank of Fort Bend(3) | | $ | 720 | | | $ | 494 | | | $ | 128 | | | $ | (50 | ) | | | 14.82 | % | | | | | | | 2.27 | % | | | | |
| Bank of Las Colinas | | | 613 | | | | 513 | | | | 38 | | | | (43 | ) | | | 2.78 | % | | | | | | | 0.34 | % | | | | |
| Texas Region Total | | | 1,333 | | | | 1,007 | | | | 166 | | | | (93 | ) | | | | | | | | | | | | | | | | |
| | | | | | | | | | | | | | | | | | | | | | | | | | | | | | | | | |
| Parent company and other, net | | | 19,704 | | | | 4,161 | | | | 16,062 | | | | 5,264 | | | | | | | | | | | | | | | | | |
| Consolidated totals | | | 63,359 | | | | 64,882 | | | | (2,774 | ) | | | (61,940 | ) | | | | | | | | | | | | | | | | |
| Less discontinued operations | | | (6,639 | ) | | | (15,914 | ) | | | 2,896 | | | | 939 | | | | | | | | | | | | | | | | | |
| | | | | | | | | | | | | | | | | | | | | | | | | | | | | | | | | |
Consolidated totals for continuing operations | | $ | 56,723 | | | $ | 48,968 | | | $ | (5,670 | ) | | $ | (62,879 | ) | | | -- | | | | -- | | | | -- | | | | -- | |
| (1) | Excludes net losses attributable to noncontrolling interests. |
| (2) | Annualized for periods presented. |
| (3) | Capitol sold its ownership in Community Bank of Rowan effective April 19, 2011; Bank of Fort Bend effective March 30, 2011; Bank of Tucson effective January 24, 2011; Southern Arizona community Bank effective December 10, 2010; Fort Collins Commerce Bank, Larimer Bank of Commerce and Loveland Bank of Commerce effective October 29, 2010; Bank of San Francisco effective September 28, 2010; Adams Dairy Bank effective August 31, 2010; USNY Bank effective August 23, 2010; Community Bank of Lincoln effective July 30, 2010; Ohio Commerce Bank effective June 30, 2010; Napa Community Bank effective April 30, 2010 and Bank of Belleville effective April 27, 2010. The banks' operations have been included in Capitol's consolidated totals up to the date of sale; however, the banks' results are reflected in discontinued operations. |
| (4) | As of December 31, 2009, Community Bank of Rowan (CBR) was a majority-owned subsidiary of Capitol Development Bancorp Limited III (CDBL III) which, due to a change in control effective September 30, 2009, became an unconsolidated affiliate of Capitol. Effective June 30, 2010, CDBL III transferred its controlling interest in CBR to Capitol in exchange for preferred stock of Capitol and, accordingly, CBR became a consolidated subsidiary of Capitol on that date. |
Liquidity and Capital Resources
The principal funding source for banks is deposits. Total deposits (excluding discontinued operations) decreased $66 million during the three months ended March 31, 2011 compared to a $44 million increase in the corresponding period of 2010. Brokered deposits approximated $190 million as of March 31, 2011, or about 6.5% of total deposits, a decrease of $89 million during the three-month 2011 period, as the banks have sought to reduce use of that funding source based on maturity and interest-rate opportunities, regulatory constraints and to aid in matching the repricing of funding sources and assets. Brokered deposits at March 31, 2011 include about $147 million of relationship-based structured time accounts. Banks that are classified as less than "well-capitalized" are required to obtain approval from the FDIC to renew or obtain new brokered deposits and, for banks classified as less than "adequately-capitalized," renewal of brokered deposits is generally prohibited.
Noninterest-bearing deposits approximated 18.9% of total deposits at March 31, 2011, an increase from 17.4% at December 31, 2010, and an increase of $30.6 million in the 2011 interim period compared to an increase of $5.4 million during the 2010 period (excluding discontinued operations). Levels of noninterest-bearing deposits can fluctuate based on customers' transaction activity. During the 2011 period, however, interest-bearing deposits decreased about $97.0 million, mostly related to the previously-mentioned reduction in brokered deposits.
Cash and cash equivalents amounted to $536.5 million or 16.8% of total assets at March 31, 2011, compared to $534.8 million or 15.1% of total assets at December 31, 2010 as reductions in portfolio loans (principally from repayments) and proceeds from sales and maturities of investment securities, government-guaranteed loans and other real estate owned were used to reduce debt obligations or deployed into liquid assets. As liquidity levels vary continuously based on customer activities, amounts of cash and cash equivalents can vary widely at any given point in time. Liquidity levels have been increased by management in response to regulatory guidance, coupled with limited opportunities to deploy funds into investment securities during a low interest-rate environment and a cautious approach to making new loans in an uncertain economy. Management believes the banks' liquidity position at March 31, 2011 is adequate to fund loan demand and meet depositor needs.
MANAGEMENT'S DISCUSSION AND ANALYSIS OF FINANCIAL CONDITION
AND RESULTS OF OPERATIONS – Continued
Liquidity and Capital Resources – Continued
In addition to cash and cash equivalents, an additional source of long-term liquidity is the banks' marketable investment securities. Liquidity needs have not historically necessitated the sale of investments in order to meet funding requirements and the banks have not engaged in active trading of their investments. At March 31, 2011, Capitol's banks had approximately $21.0 million of investment securities classified as available for sale which may be utilized to meet various liquidity needs as they arise.
Several of Capitol's banks have secured lines of credit with regional Federal Home Loan Banks. Borrowings thereunder approximated $100.1 million at March 31, 2011 and additional borrowing capacity approximated $125.8 million. These facilities are used from time to time as a lower-cost funding source versus various rates and maturities of time deposits available within banks' individual communities. Future availability of such borrowing capacity may be contingent upon the creditworthiness of Capitol's banks and related matters. Total notes payable and other borrowings were $6 million at March 31, 2011.
In 2009, the Corporation commenced the deferral of interest payments on its various trust-preferred securities, as is permitted under the terms of the securities, to conserve cash and capital resources. The payment of interest on those securities may be deferred for periods up to five years. During such deferral periods, Capitol is prohibited from paying dividends on its common stock (subject to certain exceptions) and is further restricted by Capitol's written agreement with the Federal Reserve Bank of Chicago which prohibits both payment of interest on the trust-preferred securities and cash dividends without prior written approval by that agency. Accrued interest payable on such securities approximated $19.8 million and $20.8 million at March 31, 2011 and December 31, 2010, respectively. Holders of the trust-preferred securities will recognize current taxable income relating to the deferred interest payments.
On January 31, 2011, Capitol accepted for exchange 1,180,602 of the 2,530,000 outstanding shares of trust-preferred securities of Capitol Trust I and 773,934 of the 1,454,100 outstanding shares of trust-preferred securities of Capitol Trust XII and, pursuant to the related exchange offer, issued approximately 19.5 million of previously-unissued shares of Capitol's common stock. Such exchange resulted in the retirement of approximately $19.5 million aggregate liquidation amount of the trust-preferred securities on a combined basis and eliminated approximately $2.4 million of accrued interest payable associated with the retired securities, which collectively increased Capitol's equity and regulatory capital by $21.9 million, including a gain on the transaction of approximately $16.9 million.
Capitol Bancorp Limited stockholders' equity, as a percentage of total assets, approximated (1.77)% at March 31, 2011 and (1.75)% at December 31, 2010. As of March 31, 2011, total capital funds (i.e., the sum of Capitol Bancorp Limited stockholders' equity, noncontrolling interests in consolidated subsidiaries and subordinated debentures) approximated $110.1 million or 3.44% of total assets. Capitol's equity deficit improved slightly in the interim 2011 period due to a small income incurred from operations as compared to significant losses from operations in 2010.
Capitol and its banks are subject to complex regulatory capital requirements, which require maintaining certain minimum capital ratios. These ratio measurements, in addition to certain other requirements, are used by regulatory agencies to determine the level of regulatory intervention and enforcement applied to financial institutions.
[The remainder of this page intentionally left blank]
MANAGEMENT'S DISCUSSION AND ANALYSIS OF FINANCIAL CONDITION
AND RESULTS OF OPERATIONS – Continued
Liquidity and Capital Resources – Continued
The following comparative analysis summarizes each bank's regulatory capital position as of the dates indicated based on the Corporation and its consolidated banks as of March 31, 2011 (excludes banks sold thus far in 2010):
| | | Tier 1 Leverage | | | Tier 1 Risk-Based | | | Total Risk-Based | | | |
| | | Ratio(1)(5) | | | Capital Ratio(1)(5) | | | Capital Ratio(2)(5) | | | Regulatory Classification(3) |
| | | Mar 31, 2011 | | | Dec 31, 2010 | | | Mar 31, 2011 | | | Dec 31, 2010 | | | Mar 31, 2011 | | | Dec 31, 2010 | | | Mar 31, 2011 | | Dec 31, 2010 |
| Arizona Region: | | | | | | | | | | | | | | | | | | | | | | |
| Central Arizona Bank | | | 2.10 | % | | | 2.24 | % | | | 3.10 | % | | | 3.20 | % | | | 4.38 | % | | | 4.49 | % | | significantly-undercapitalized | | significantly-undercapitalized |
| Sunrise Bank of Albuquerque | | | 2.73 | % | | | 2.43 | % | | | 3.63 | % | | | 3.39 | % | | | 4.93 | % | | | 4.68 | % | | significantly-undercapitalized | | significantly-undercapitalized |
| Sunrise Bank of Arizona | | | 2.11 | % | | | 0.69 | % | | | 2.65 | % | | | 0.92 | % | | | 3.95 | % | | | 1.84 | % | | significantly-undercapitalized | | critically-undercapitalized(7) |
| | | | | | | | | | | | | | | | | | | | | | | | | | | | | |
| California Region: | | | | | | | | | | | | | | | | | | | | | | | | | | | | |
| Bank of Feather River | | | 15.81 | % | | | 16.08 | % | | | 21.34 | % | | | 21.16 | % | | | 22.60 | % | | | 22.42 | % | | well-capitalized | | well-capitalized |
| Sunrise Bank | | | 8.19 | % | | | 7.04 | % | | | 10.42 | % | | | 9.93 | % | | | 11.71 | % | | | 11.22 | % | | adequately-capitalized(6) | | adequately-capitalized(6) |
| | | | | | | | | | | | | | | | | | | | | | | | | | | | | |
| Colorado Region: | | | | | | | | | | | | | | | | | | | | | | | | | | | | |
Mountain View Bank of Commerce | | | 11.92 | % | | | 12.02 | % | | | 17.36 | % | | | 17.99 | % | | | 18.61 | % | | | 19.25 | % | | well-capitalized | | well-capitalized |
| | | | | | | | | | | | | | | | | | | | | | | | | | | | | |
| Great Lakes Region: | | | | | | | | | | | | | | | | | | | | | | | | | | | | |
| Bank of Maumee | | | 7.47 | % | | | 7.00 | % | | | 9.68 | % | | | 9.43 | % | | | 10.98 | % | | | 10.72 | % | | well-capitalized | | well-capitalized |
| Bank of Michigan | | | 8.44 | % | | | 7.67 | % | | | 10.73 | % | | | 10.33 | % | | | 12.00 | % | | | 11.59 | % | | well-capitalized | | well-capitalized |
| Capitol National Bank | | | 6.45 | % | | | 6.10 | % | | | 7.96 | % | | | 7.74 | % | | | 9.24 | % | | | 9.03 | % | | adequately-capitalized | | adequately-capitalized |
| Evansville Commerce Bank | | | 8.59 | % | | | 8.47 | % | | | 12.91 | % | | | 12.25 | % | | | 14.19 | % | | | 13.52 | % | | well-capitalized | | well-capitalized |
| Indiana Community Bank | | | 6.50 | % | | | 6.34 | % | | | 8.32 | % | | | 8.19 | % | | | 9.60 | % | | | 9.47 | % | | adequately-capitalized | | adequately-capitalized |
| Michigan Commerce Bank | | | 2.05 | % | | | 1.15 | % | | | 2.56 | % | | | 1.46 | % | | | 3.88 | % | | | 2.78 | % | | significantly-undercapitalized | | critically-undercapitalized(7) |
| | | | | | | | | | | | | | | | | | | | | | | | | | | | | |
| Nevada Region: | | | | | | | | | | | | | | | | | | | | | | | | | | | | |
1st Commerce Bank | | | 2.34 | % | | | 2.48 | % | | | 3.56 | % | | | 3.94 | % | | | 4.88 | % | | | 5.20 | % | | significantly-undercapitalized | | significantly-undercapitalized |
| Bank of Las Vegas | | | 2.20 | % | | | 2.06 | % | | | 2.85 | % | | | 2.93 | % | | | 4.18 | % | | | 4.27 | % | | significantly-undercapitalized | | significantly-undercapitalized |
| | | | | | | | | | | | | | | | | | | | | | | | | | | | | |
| Northwest Region: | | | | | | | | | | | | | | | | | | | | | | | | | | | | |
| Bank of the Northwest | | | 10.49 | % | | | 10.05 | % | | | 13.41 | % | | | 13.25 | % | | | 14.69 | % | | | 14.52 | % | | adequately-capitalized(6) | | adequately-capitalized(6) |
| High Desert Bank | | | 6.78 | % | | | 7.83 | % | | | 9.46 | % | | | 10.07 | % | | | 10.76 | % | | | 11.36 | % | | adequately-capitalized(6) | | adequately-capitalized(6) |
| | | | | | | | | | | | | | | | | | | | | | | | | | | | | |
| Southeast Region: | | | | | | | | | | | | | | | | | | | | | | | | | | | | |
| Community Bank of Rowan | | | 6.84 | % | | | 6.83 | % | | | 9.55 | % | | | 10.05 | % | | | 10.81 | % | | | 11.30 | % | | well-capitalized | | well-capitalized |
| First Carolina State Bank | | | 2.19 | % | | | 3.11 | % | | | 3.24 | % | | | 4.75 | % | | | 4.53 | % | | | 6.02 | % | | significantly-undercapitalized | | undercapitalized |
Pisgah Community Bank(4) | | | 2.48 | % | | | 2.03 | % | | | 3.62 | % | | | 3.52 | % | | | 5.00 | % | | | 4.82 | % | | significantly-undercapitalized | | significantly-undercapitalized |
| Sunrise Bank | | | 2.02 | % | | | 2.14 | % | | | 3.03 | % | | | 3.29 | % | | | 4.33 | % | | | 4.59 | % | | significantly-undercapitalized | | significantly-undercapitalized |
| | | | | | | | | | | | | | | | | | | | | | | | | | | | | |
| Texas Region: | | | | | | | | | | | | | | | | | | | | | | | | | | | | |
| Bank of Las Colinas | | | 12.17 | % | | | 11.58 | % | | | 14.71 | % | | | 14.46 | % | | | 15.97 | % | | | 15.72 | % | | well-capitalized | | well-capitalized |
| | | | | | | | | | | | | | | | | | | | | | | | | | | | | |
| Consolidated totals | | | (1.19 | )% | | | (1.03 | )% | | | (1.58 | )% | | | (1.44 | )% | | | (1.58 | )% | | | (1.44 | )% | | less than adequately-capitalized | | less than adequately-capitalized |
MANAGEMENT'S DISCUSSION AND ANALYSIS OF FINANCIAL CONDITION
AND RESULTS OF OPERATIONS – Continued
Liquidity and Capital Resources – Continued
Notes to the preceding table:
| (1) | The minimum required Tier 1 leverage ratio and Tier 1 risk-based capital ratio is 4% (8% for de novo institutions). |
| (2) | The minimum required total risk-based capital ratio is 8%. |
| (3) | In order to be classified as a "well-capitalized" institution, the total risk-based capital ratio must be 10% or more. To be classified as an "adequately-capitalized" institution, the total risk-based capital ratio must be between 8% and 10%. Institutions are classified as "undercapitalized" when the total risk-based ratio is between 6% and 8% and "significantly-undercapitalized" when such ratio falls below 6%. Institutions with a Tier 1 leverage ratio below 2% are classified as "critically-undercapitalized." |
| (4) | De novo institution which is subject to higher minimum ratio requirements as noted in (1) above for up to the first three years of operations. |
| (5) | Ratios are based on the banks' regulatory reports filed on or before April 30, 2011. |
| (6) | Institution is subject to a regulatory agreement and, accordingly, cannot be classified better than "adequately-capitalized" even though the risk-based capital ratios would otherwise suggest "well-capitalized" classification. |
| (7) | Subsequent capital contributions in January 2011 eliminated the banks' classification as "critically-undercapitalized" in 2011. |
Banks less than "adequately-capitalized" may become subject to increased regulatory enforcement pursuant to the prompt-corrective-action or other provisions of the FDIC and other bank regulatory agencies. The preceding summary indicates that Capitol, on a consolidated basis, was classified as less than "adequately-capitalized" at March 31, 2011.
Capitol's total risk-based capital ratio at March 31, 2011 was adversely impacted by the exclusion of approximately $181.8 million of previously-qualifying Tier 2 capital, inasmuch as Tier 2 capital is limited to 100% of Tier 1 capital. The Tier 1 capital deficit at March 31, 2011 resulted from operating losses in the prior year; however, the Tier 2 limitation did not apply to Capitol's regulatory capital computations at earlier measurement dates prior to 2010.
In addition to Capitol's consolidated regulatory capital classification at March 31, 2011, several of its bank subsidiaries had capital levels resulting in classification as "undercapitalized" or "significantly-undercapitalized" at that date. Regarding banks classified as "undercapitalized" or "significantly-undercapitalized," and otherwise noncompliant with formal regulatory agreements, management is taking appropriate action to improve such capital classifications and related compliance in the future.
Proceeds from the sale of banks through March 31, 2011 have been deployed as additional capital in the remaining affiliated banks, irrespective of minority ownership, pursuant to requirements imposed by the FDIC. Capitol anticipates augmenting the capital levels of its less than "adequately-capitalized" bank subsidiaries further through the allocation of proceeds from the pending divestiture of certain bank subsidiaries. Pending divestitures are discussed later in this narrative. Management is pursuing various strategies to increase Capitol's Tier 1 capital, including raising capital through potential equity transactions, gains on divestiture of some bank subsidiaries and other initiatives.
Going-Concern Considerations
As of March 31, 2011, there are several significant adverse aspects of Capitol's consolidated financial position and results of operations which include, but are not limited to, the following:
| · | An equity deficit approximating $39 million; |
| · | Regulatory capital classification on a consolidated basis as less than "adequately-capitalized" and related negative amounts and ratios; |
| · | Numerous banking subsidiaries with regulatory capital classification as "undercapitalized" or "significantly-undercapitalized"; |
| · | Certain banking subsidiaries which are generally subject to formal regulatory agreements have received "prompt corrective action" notifications and/or directives from the FDIC, which require timely action by bank management and the respective boards of directors to resolve regulatory capital ratios which result in classification as less than "adequately-capitalized" (the basis of a PCAN) or to submit an acceptable capital restoration plan to the FDIC (the basis of a PCAD), and it is likely additional PCANs and/or PCADs may be issued in the future and/or the banking subsidiaries may be unable to satisfactorily resolve such notices and/or directives; |
MANAGEMENT'S DISCUSSION AND ANALYSIS OF FINANCIAL CONDITION
AND RESULTS OF OPERATIONS – Continued
Liquidity and Capital Resources – Continued
| · | In 2010 and early 2011, Capitol sold several of its banking subsidiaries and has other divestiture transactions pending (see Note J to the accompanying condensed consolidated financial statements). The proceeds from those divestitures have been redeployed at certain remaining banking subsidiaries which have experienced a significant erosion of capital due to operating losses. While such proceeds have been a significant source of funds for redeployment, the Corporation will need to raise significant other sources of new capital in the future; |
| · | The Corporation and substantially all of its banking subsidiaries are operating under various regulatory agreements (formal and informal) which place a number of restrictions on them and impose other requirements limiting activities, requiring preservation of capital, improvement in regulatory capital measures, reduction of nonperforming assets and other things for which the entities have not achieved full compliance; |
| · | Elevated levels of nonperforming loans and other nonperforming assets as a percentage of consolidated loans and total assets, respectively; and |
| · | Significant losses from continuing operations in 2011, 2010, 2009 and 2008, resulting primarily from provisions for loan losses, costs associated with foreclosed properties and other real estate owned and, in 2010, an impairment charge to operations for the write-off of previously-recorded goodwill ($64.5 million). |
The foregoing considerations raise some level of doubt (potentially "substantial doubt") as to the Corporation's ability to continue as a going concern.
Capitol has commenced several initiatives and other actions to mitigate these going-concern considerations and to improve the Corporation's financial condition, equity, regulatory capital and regulatory compliance.
In December 2010, Capitol announced a comprehensive capital strategy which includes the following:
| · | An offer to exchange all outstanding trust-preferred securities; |
| · | Amendment to Capitol's articles of incorporation to authorize additional shares of common stock; |
| · | A potential shareholder rights offering; and |
| · | A potential reverse stock split. |
In early 2011, a partial exchange of trust-preferred securities was completed and the Corporation's stockholders approved the amendment to the articles of incorporation to increase its authorized common stock and authorize its board of directors to proceed with a rights offering and reverse stock split, in addition to a potential share exchange regarding second-tier bank-development subsidiaries.
Improvement in Capitol's and its banking subsidiaries' capitalization, financial position, asset quality and results of operations requires multi-faceted efforts, which are currently being pursued aggressively in the following areas, among others:
| · | Raising significant amounts of new capital; |
| · | Completion of divestitures which are currently pending; |
| · | A shareholder rights offering; |
| · | Further reductions in nonperforming assets; |
| · | Stabilization of provisions for loan losses and impairment losses; |
| · | Resuscitation of Capitol's trust-preferred securities as a qualifying element of regulatory capital and/or equity; and |
| · | Further reductions in operating expenses through mergers of bank subsidiaries completed in recent years. |
Capitol's ability to continue as a going concern is contingent on the successful achievement of the items listed above. Capitol's board of directors and management are fully engaged and committed to successful completion of those items, with a clear sense of urgency, subject to the availability of capital and continued cooperation by regulatory agencies.
MANAGEMENT'S DISCUSSION AND ANALYSIS OF FINANCIAL CONDITION
AND RESULTS OF OPERATIONS – Continued
Trends Affecting Operations
As noted elsewhere in this narrative, Capitol has experienced adverse trends in its results of operations, asset quality, valuation of collateral-dependent loans and other real estate owned and capital adequacy. Capitol continues to focus on its efforts to mitigate those adverse trends through a multifaceted approach to raise and redeploy capital funds, merge bank subsidiaries on a regional basis to achieve operational efficiencies, reduce operating expenses, reduce staffing levels, implement hiring and compensation freezes, sell banks and suspension of employer contributions to retirement plans, among other things. Capitol continues to explore other ideas to improve operating results and capital adequacy.
Capitol has made significant progress in its efforts to reduce staffing and operating costs as well as redeployment of proceeds from the sale of banks completed thus far. In addition, in the most recent quarterly period, a notable reduction in the amount of nonperforming assets was achieved following a slowing trend in the prior growth rate of such assets, beginning in the fourth quarter of 2009.
While Capitol's management believes its plans to improve operating results and capital adequacy will help mitigate recent adverse trends, Capitol's loan portfolio is dominated by loans secured by real estate. Future valuation of collateral-dependent loans and other real estate owned and future loan repayments by borrowers are largely dependent upon economic conditions on a local, regional and national basis. Uncertainty in those economic conditions, particularly relating to real estate values and the ability of borrowers to repay loans, is outside of the control of Capitol and its banks. Accordingly, the extent to which those matters may further adversely affect Capitol in the future remains highly unpredictable.
In addition to volatility which arises from changes in asset quality, changes in market rates of interest can have a material impact on the financial condition and results of operations of financial institutions.
Changes in interest rates, either up or down, have an impact on net interest income (plus or minus), depending on the direction and timing of such changes. At any point in time, there is a difference between interest rate-sensitive assets and interest rate-sensitive liabilities. This means that when interest rates change, the timing and magnitude of the effect of such interest rate changes can alter the relationship between asset yields and the cost of funds.
The Board of Governors of the Federal Reserve, which influences interest rates, has maintained interbank borrowing rates at record low levels and has also expressed concerns about a variety of macro economic issues. Home mortgage rates have fluctuated and residential real estate markets have deteriorated in various regions, which adversely impacts fee income from the origination of residential mortgages. There has been widespread media coverage of earlier subprime and other residential mortgage "meltdown" issues; Capitol believes its exposure to the residential real estate crisis to be generally minimal due to its practice of selling residential mortgage loan production to the secondary market. Many of Capitol's banks' commercial loans are variable-rate and, accordingly, result in lower interest income to Capitol in the near term in the current interest-rate environment; however, depositors will continue to expect reasonable rates of interest on their accounts, potentially compressing net interest margins further. The future outlook on interest rates and their impact on Capitol's interest income, interest expense and net interest income is uncertain.
General economic conditions also have a significant impact on both the results of operations and the financial condition of financial institutions. As mentioned previously, general economic conditions within the states of Michigan, Arizona and Nevada and the national economic recession are uncertain and are likely to continue to have an adverse impact on Capitol, its banks and bank customers. It is likely that economic recovery may take an extended period of time.
Media reports raising questions about the health of the domestic economy and the sustained national recession have continued in 2010 and 2011. Although nonperforming assets have decreased during the interim 2011 period, it is likely levels of nonperforming assets and related loan losses may increase further as economic conditions, locally and nationally, evolve.
MANAGEMENT'S DISCUSSION AND ANALYSIS OF FINANCIAL CONDITION
AND RESULTS OF OPERATIONS – Continued
Trends Affecting Operations – Continued
Through March 31, 2011, mergers of some of Capitol's banking subsidiaries have been completed in Arizona, southern California, Georgia, Indiana, Michigan, Nevada and the Pacific Northwest. The resulting merged institutions have been combined on a regional basis to gain efficiencies in loan portfolio and problem asset management and general operating efficiencies in daily processing. Additional mergers and combinations of bank charters in other markets are under consideration as management evaluates potential synergies and cost savings.
Divestiture of Banks
Through March 31, 2011, Capitol completed the following sales of bank subsidiaries (in $1,000s):
| | | | Sale | | | | |
| | Date Sold | | Proceeds | | | Gain | |
| | | | | | | | |
Bank of Tucson – main office(1) | January 24, 2011 | | $ | 4,567 | | | $ | 4,186 | |
Bank of Fort Bend(2) | March 30, 2011 | | | 4,302 | | | | 1,432 | |
| | | | | | | | | | |
| | | | $ | 8,869 | | | $ | 5,618 | |
| | (1) | Previously a wholly-owned subsidiary of Capitol. Sale proceeds represent the net premium received from the assumption of liabilities and acquisition of assets transaction. |
| | (2) | Previously a majority-owned subsidiary of a bank-development subsidiary controlled by Capitol. |
On April 19, 2011, the sale of Community Bank of Rowan was completed with aggregate proceeds of $4.8 million and an estimated loss of approximately $1.25 million, which has been reflected in Capitol's first quarter 2011 financial statements against the gain on sale of the above-mentioned bank subsidiaries.
In addition to completed sales transactions, Capitol has entered into definitive agreements to sell its interests (or controlling interests held by bank-development subsidiaries) in the following institutions which were pending as of March 31, 2011: 1st Commerce Bank, Bank of Feather River, Bank of Las Colinas, Bank of Michigan, Community Bank of Rowan, Evansville Commerce Bank and High Desert Bank. The projected financial impact of the potential divestiture of these institutions is set forth in the accompanying pro forma condensed consolidated financial statements on pages 46 and 47 of this document. Total proceeds from those pending sales (excluding Community Bank of Rowan as noted above) are expected to approximate $13.5 million, resulting in a gain of $1.2 million ($0.04 per common share) and are expected to be consummated throughout the remainder of 2011, subject to regulatory approval and other significant contingencies.
Regulatory Matters
In September 2009, Capitol and its second-tier bank holding companies entered into an agreement with the Reserve Bank under which Capitol agreed to refrain from the following actions without the prior written consent of the Reserve Bank: (i) declare or pay dividends; (ii) receive dividends or any other form of payment representing a reduction in capital from Michigan Commerce Bank, or from any of its subsidiary institutions that are subject to any restriction by the institution's federal or state regulator that limits the payment of dividends or other intercorporate payments; (iii) make any distributions of interest, principal, or other sums on subordinated debentures or trust-preferred securities; (iv) incur, increase or guarantee any debt; or (v) purchase or redeem any shares of the stock of Capitol, the second-tier bank holding companies, nonbank subsidiaries or any of the subsidiary banks that are held by shareholders other than Capitol.
In addition, Capitol agreed to: (i) submit to the Reserve Bank a written plan to maintain sufficient capital at Capitol on a consolidated basis and at Michigan Commerce Bank (as Capitol's largest bank subsidiary and a separate legal entity on a stand-alone basis); (ii) notify the Reserve Bank no more than 30 days after the end of any quarter in which Capitol's consolidated or Michigan Commerce Bank's capital ratios fall below the approved capital plan's minimum ratios as well as if any subsidiary institution's ratios fall below the minimum ratios required by the
MANAGEMENT'S DISCUSSION AND ANALYSIS OF FINANCIAL CONDITION
AND RESULTS OF OPERATIONS – Continued
Regulatory Matters—Continued
institution's federal or state regulator; (iii) review and revise its ALLL methodology for loans held by Capitol and submit to the Reserve Bank a written program for maintenance of an adequate ALLL for loans held by Capitol; (iv) take all necessary actions to ensure each of its subsidiary institutions comply with Federal Reserve regulations; (v) refrain from increasing any fees or charging new fees to any subsidiary institution without the prior written consent of the Reserve Bank; (vi) submit to the Reserve Bank a written plan to enhance the consolidated organization's risk management practices, a strategic plan to improve the consolidated organization's operating results and overall condition and a cash flow projection; (vii) comply with laws and regulations regarding senior executive officer positions and severance payments; and (viii) provide quarterly reports to the Reserve Bank regarding these undertakings.
Many of Capitol's bank subsidiaries have entered into formal agreements with their applicable regulatory agencies. Those agreements provide for certain restrictions and other guidelines and/or limitations to be followed by the banks. The banks generally subject to such agreements are noted as such in the regulatory capital detail appearing on page 40 of this document.
Regulatory capital matters are set forth in Note L of the accompanying condensed consolidated financial statements.
On July 21, 2010, the Dodd-Frank Act was signed into law and significantly changes future regulation of financial institutions and the financial services industry. The Dodd-Frank Act includes provisions affecting large and small financial institutions alike, including several provisions that will profoundly affect how community banks, thrifts, and smaller bank holding companies will be regulated in the future. Among other things, these provisions abolish the Office of Thrift Supervision and transfer its functions to the other federal banking agencies, relax rules regarding interstate branching, allow financial institutions to pay interest on business checking accounts, change the scope of FDIC insurance coverage and impose new capital requirements on bank holding companies including removing trust-preferred securities as a permitted component of a holding company's Tier 1 capital after a three-year phase-in period beginning January 1, 2013. The Dodd-Frank Act also establishes the Bureau of Consumer Financial Protection as an independent entity within the Federal Reserve, which will be given the authority to promulgate consumer protection regulations applicable to all entities offering consumer financial services or products, including banks. Additionally, the Dodd-Frank Act includes a series of provisions covering mortgage loan origination standards affecting, among other things, originator compensation, minimum repayment standards and prepayments. Management is reviewing the provisions of the Dodd-Frank Act and assessing its probable impact on the Corporation's business, financial condition and results of operations. However, the ultimate effect of the Dodd-Frank Act on the financial services industry in general, and on the Corporation in particular, is currently uncertain.
[The remainder of this page intentionally left blank]
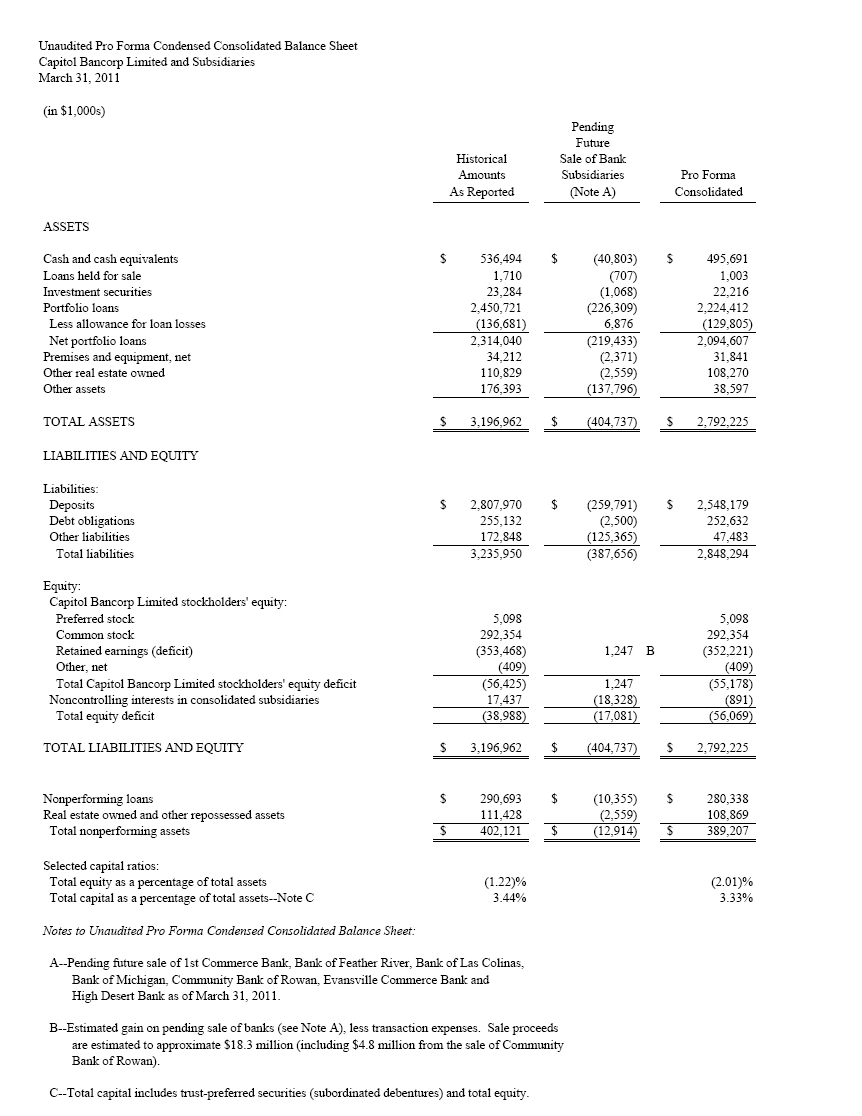
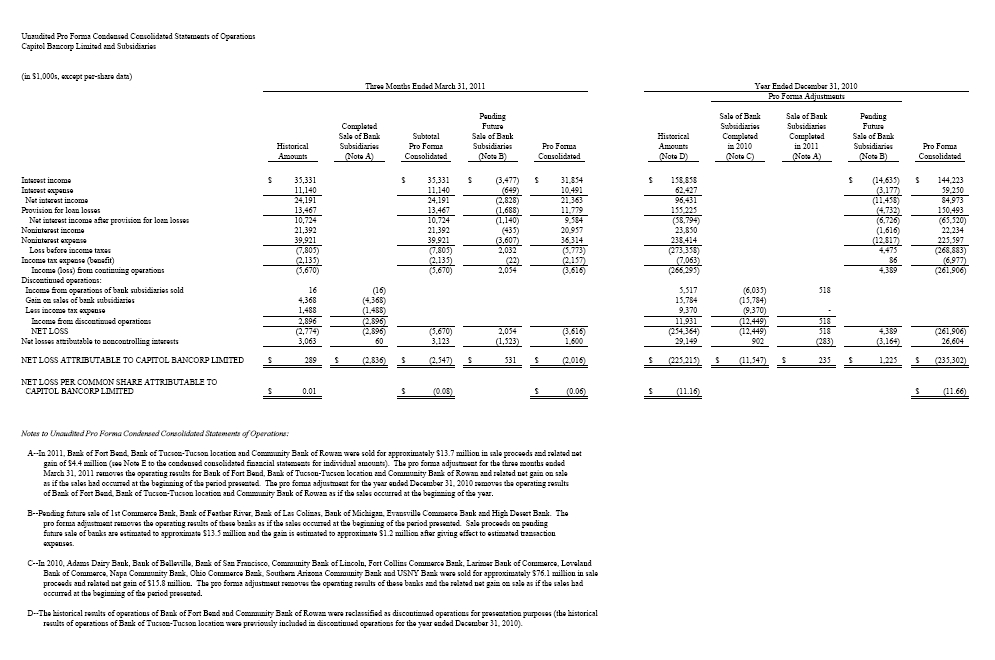
MANAGEMENT'S DISCUSSION AND ANALYSIS OF FINANCIAL CONDITION
AND RESULTS OF OPERATIONS – Continued
Impact of Accounting Standards Updates
There are certain accounting standards updates issued or becoming effective in 2011. They are discussed in Note B of the accompanying condensed consolidated financial statements.
Critical Accounting Policies
Capitol's critical accounting policies are described on pages F-46 – F-48 of the financial section of its 2010 Annual Report. In the circumstances of Capitol, management believes its "critical accounting policies" are those which encompass the use of estimates in determining the allowance for loan losses (because of inherent subjectivity), accounting for goodwill (Capitol's annual review of goodwill for potential impairment is performed in the fourth quarter of the year), accounting for income taxes and its consolidation policy.
[The remainder of this page intentionally left blank]
PART I, ITEM 3
QUANTITATIVE AND QUALITATIVE DISCLOSURES ABOUT
MARKET RISK
Information about Capitol's quantitative and qualitative disclosures about market risk were included in Capitol's Annual Report on Form 10-K for the year ended December 31, 2010. Capitol does not believe that there has been a material change in the nature or categories of market risk exposure, except as noted in the "Management's Discussion and Analysis of Financial Condition and Results of Operations" section herein (Part I, Item 2), under the caption, "Trends Affecting Operations."
PART I, ITEM 4
CONTROLS AND PROCEDURES
Evaluation of Disclosure Controls and Procedures
As of the end of the period covered by this report, an evaluation was performed under the supervision and with the participation of Capitol's Chief Executive Officer and Principal Accounting Officer of the effectiveness of Capitol's disclosure controls and procedures (as defined in Exchange Act Rule 240.13a-15(e)). Based on that evaluation, the Chief Executive Officer and the Principal Accounting Officer have concluded that Capitol's disclosure controls and procedures were effective as of March 31, 2011 to ensure that information required to be disclosed by Capitol in the reports that it files or submits under the Securities Exchange Act of 1934 is accumulated and communicated to Capitol's management, including its Chief Executive Officer and Principal Accounting Officer, to allow timely decisions regarding required disclosures and is recorded, processed, summarized and reported, within the time periods specified in the SEC's rules and forms.
Changes in Internal Controls Over Financial Reporting
As of December 31, 2010, Capitol identified a material weakness in internal control over financial reporting as a result of a restatement of its September 30, 2010 Form 10-Q. All aspects of that restatement are in the process of being remediated in 2011. Such remediation will consist of fully incorporating all regulatory-agency imposed requirements in the computations and internal control process for estimation of allowance for loan losses requirements both at the bank level and on a consolidated basis.
There were no changes in Capitol's internal control over financial reporting that occurred during the period covered by this report that have materially affected, or are reasonably likely to materially affect, Capitol's internal control over financial reporting.
[The remainder of this page intentionally left blank]
PART II. OTHER INFORMATION
| Item 1. | Legal Proceedings. Capitol and its subsidiaries are parties to certain ordinary, routine litigation incidental to their business. In the opinion of management, liabilities arising from such litigation would not have a material effect on Capitol's consolidated financial position or results of operations. |
| Item 1A. | Risk Factors. There were no material changes from the risk factors set forth in Part I, Item 1A, "Risk Factors," of Capitol's Form 10-K for the year ended December 31, 2010 during the three months ended March 31, 2011. Refer to that section of Capitol's Form 10-K for disclosures regarding the risks and uncertainties related to Capitol's business. In addition to the foregoing, additional risk factors in the current operating environment exist: If Capitol continues to experience significant net losses, it may be difficult to continue to operate as a going concern. During 2010 and the interim period of 2011, Capitol has incurred significant net losses from continuing operations, primarily resulting from additional loan losses associated with a continuing uncertain economy and operating environment. Those operating losses have resulted in a significant erosion of capital and regulatory matters which are discussed elsewhere in this document. Capitol's ability to continue to operate as a going concern is contingent upon a number of factors which include, but are not limited to, the following: · Significant proceeds from pending future bank sales to enable timely deployment to improve capital adequacy at remaining bank subsidiaries, in addition to raising additional capital from other sources at the parent-company level; · Future abatement of loan losses and losses associated with other nonperforming assets; · Future reduction in operating expenses; · Future improvement in net interest margin and sources of noninterest income; and · Future conversion of nonperforming assets into earning assets. |
| Item 2. | Unregistered Sales of Equity Securities and Use of Proceeds. |
| | (b) Not applicable. (c) None. |
| Item 3. | Defaults Upon Senior Securities. None. |
| Item 4. | [Removed and Reserved.] |
| Item 5. | Other Information. Adoption of the 2011 Equity Incentive Plan On May 9, 2011, the board of directors of Capitol adopted and approved the Capitol Bancorp Ltd. 2011 Equity Incentive Plan (the 2011 Plan), a copy of which is attached as Exhibit 10.1 to this Form 10-Q. |
PART II. OTHER INFORMATION – Continued
| Item 5. | Other Information. – Continued Description of the 2011 Equity Incentive Plan The material features of the 2011 Plan are outlined below. This summary is qualified in its entirety by reference to the complete text of the 2011 Plan. You are urged to read the actual text of the 2011 Plan in its entirety. Background and Purpose The terms of the 2011 Plan provide for the grant of stock options, stock appreciation rights, restricted stock, restricted stock units, other stock-related awards, and performance awards that may be settled in cash, stock, or other property. The 2011 Plan was adopted to provide a means by which employees, directors, and consultants may be given an opportunity to purchase Capitol's common stock to assist Capitol in retaining the services of such persons, to secure and retain the services of persons capable of filling such positions, and to provide incentives for such persons to exert maximum efforts for Capitol's success. Shares Available for Awards The total number of shares of Capitol's common stock reserved for issuance under the 2011 Plan will consist of: · five million (5,000,000) shares, plus · the number of shares of Capitol's common stock available for issuance under the 2011 Plan shall automatically increase on January 1st of each year for a period of nine years commencing on January 1, 2012 and ending on (and including) January 1, 2020, in an amount equal to five percent (5%) of the total number of shares of Capitol's common stock outstanding on December 31st of the preceding year. Notwithstanding the foregoing, the Board may act prior to January 1st of any fiscal year, to provide that there shall be no increase in the share reserve for such fiscal year or that the increase in the share reserve for such fiscal year shall be a lesser number of shares of Capitol's common stock than would otherwise occur pursuant to the preceding sentence. Eligibility The persons eligible to receive awards under the 2011 Plan consist of Capitol's employees, directors and consultants. However, incentive stock options (ISOs) may be granted under the 2011 Plan only to Capitol's employees, including Capitol's officers who are employees and only if Capitol elects to submit the 2011 Plan to its shareholders for approval. Shareholder Approval Capitol does not currently intend to submit the 2011 Plan to its shareholders. Notwithstanding the foregoing, Capitol does intend to submit the 2011 Plan for shareholder approval if Capitol desires to issue awards that are intended to satisfy the requirements of (A) Section 162(m) of the Internal Revenue Code of 1986, as amended regarding the exclusion of performance-based compensation from the limit on corporate deductibility of compensation paid to covered employees, (B) Section 422 of the Code regarding "incentive stock options", (C) Rule 16b-3 of the Securities Exchange Act of 1934, as amended or (D) the listing standards of any applicable stock exchange rules on which Capitol seeks to list its securities. |
PART II. OTHER INFORMATION – Continued
| Item 5. | Other Information. – Continued Administration The 2011 Plan is administered by the board of directors, which may in turn delegate authority to administer the plan to a committee. The board of directors has delegated administration of the 2011 Plan to the Compensation Committee. Subject to the terms of the 2011 Plan, the Compensation Committee determines recipients, the numbers and types of stock awards to be granted and the terms and conditions of the stock awards, including the period of their exercisability and vesting. Subject to the limitations set forth below, the Compensation Committee also determines the exercise price of options granted under the 2011 Plan. Subject to the terms of the 2011 Plan, the Compensation Committee may delegate to one or more of Capitol's officers the authority to grant stock awards to Capitol's other officers and employees. Such officer would be able to grant only the total number of stock awards specified by the Compensation Committee and such officer would not be allowed to grant a stock award to himself or herself. Stock Options Stock options are granted pursuant to stock option agreements and the exercise price for an option cannot be less than 100% of the fair market value of the common stock subject to the option on the date of grant. Options granted under the 2011 Plan vest at the rate specified in the option agreement. In general, the term of stock options granted under the 2011 Plan may not exceed ten years. Unless the terms of an optionholder's stock option agreement provide for earlier or later termination, if an optionholder's service relationship with Capitol, or any affiliate of Capitol, ceases due to disability or death, the optionholder, or his or her beneficiary, may exercise any vested options for up to 12 months after the date the service relationship ends. If an optionholder's service relationship with Capitol, or any affiliate of Capitol, ceases for any reason other than disability or death, the optionholder may exercise any vested options for up to three months after the date the service relationship ends, unless the terms of the stock option agreement provide for a longer or shorter period to exercise the option. In no event may an option be exercised after its expiration date. Acceptable forms of consideration for the purchase of Capitol's common stock issued under the 2011 Plan are determined by the Compensation Committee and may include cash, common stock previously owned by the optionholder, payment through a broker assisted exercise or a net exercise feature, or other legal consideration approved by the Compensation Committee. Generally, an optionholder may not transfer a stock option other than by will or the laws of descent and distribution or a domestic relations order. However, an optionholder may designate a beneficiary who may exercise the option following the optionholder's death. Limitations The aggregate fair market value, determined at the time of grant, of shares of Capitol's common stock with respect to ISOs that are exercisable for the first time by an optionholder during any calendar year under all of Capitol's stock plans may not exceed $100,000. The options or portions of options that exceed this limit are treated as nonqualified stock options (NSOs). No ISO may be granted to any person who, at the time of the grant, owns or is deemed to own stock possessing more than 10% of Capitol's total combined voting power or that of any affiliate unless the following conditions are satisfied: · the option exercise price must be at least 110% of the fair market value of the stock subject to the option on the date of grant; and · the term of any ISO award must not exceed five years from the date of grant. |
PART II. OTHER INFORMATION – Continued
| Item 5. | Other Information. – Continued Restricted Stock Awards Restricted stock awards are granted pursuant to restricted stock award agreements. A restricted stock award may be granted in consideration for the recipient's past or future services performed for Capitol or an affiliate of Capitol. Shares of Capitol's common stock acquired under a restricted stock award may be subject to forfeiture to Capitol in accordance with a vesting schedule to be determined by the Compensation Committee. Rights to acquire shares of Capitol's common stock under a restricted stock award may be transferred only upon such terms and conditions as are set forth in the restricted stock award agreement. Restricted Stock Unit Awards Restricted stock unit awards are granted pursuant to restricted stock unit award agreements. Payment of any purchase price may be made in any form permitted under applicable law; however, Capitol settles payments due to a recipient of a restricted stock unit award by delivery of shares of Capitol's common stock, by cash, by a combination of cash and stock as deemed appropriate by the Compensation Committee, or in any other form of consideration determined by the Compensation Committee and set forth in the restricted stock unit award agreement. Dividend equivalents may be credited in respect of shares of Capitol's common stock covered by a restricted stock unit award. Restricted stock unit awards may be subject to vesting in accordance with a vesting schedule to be determined by the Compensation Committee. Except as otherwise provided in the applicable restricted stock unit award agreement, restricted stock units that have not vested will be forfeited upon the participant's termination of continuous service for any reason. Stock Appreciation Rights Stock appreciation rights are granted through a stock appreciation rights agreement. Each stock appreciation right is denominated in common stock share equivalents. The strike price of each stock appreciation right is determined by the Compensation Committee or its authorized committee, but shall in no event be less than 100% of the fair market value of the stock subject to the stock appreciation right at the time of grant. The Compensation Committee may also impose any restrictions or conditions upon the vesting of stock appreciation rights that it deems appropriate. Stock appreciation rights may be paid in Capitol's common stock or in cash or any combination of the two, or any other form of legal consideration approved by the Compensation Committee. In general, the term of stock appreciation rights granted under the 2011 Plan may not exceed ten years. Unless the terms of a recipient's stock appreciation right agreement provide for earlier or later termination, if a stock appreciation right recipient's relationship with Capitol, or any of Capitol's affiliates, ceases for any reason, the recipient may exercise any vested stock appreciation right up to three months from cessation of service. Performance Awards The 2011 Plan provides for the grant of two types of performance awards: performance stock awards and performance cash awards. Performance awards may be granted, vest or be exercised based upon the attainment during a certain period of time of certain performance goals. All of Capitol's employees, directors and consultants are eligible to receive performance awards under the 2011 Plan. The length of any performance period, the performance goals to be achieved during the performance period, and the measure of whether and to what degree such performance goals have been attained shall be determined by the Compensation Committee. In granting a performance award, the Compensation Committee sets a period of time, or a performance period, over which the attainment of one or more performance goals is measured for the purpose of determining whether the award recipient has a vested right in or to such performance award. Within the time period prescribed by Section 162(m) of the Code (typically before the 90th day of a performance period), the |
PART II. OTHER INFORMATION – Continued
| Item 5. | Other Information. – Continued Compensation Committee establishes the performance goals, based upon one or more pre-established performance criteria enumerated in the 2011 Plan and described below. As soon as administratively practicable following the end of the performance period, the Compensation Committee certifies (in writing) whether the performance goals have been satisfied. Performance awards may be granted under the 2011 Plan only to Capitol's employees, including Capitol's officers who are employees, and only if Capitol elects to submit the 2011 Plan to its shareholders for approval. Other Stock Awards Other forms of stock awards valued in whole or in part with reference to Capitol's common stock may be granted either alone or in addition to other stock awards under the 2011 Plan. The Compensation Committee and, pursuant to limited authority granted to it, the Non-Officer Stock Award Committee, has the authority to determine the persons to whom and the time or times at which such other stock awards are granted, the number of shares of Capitol's common stock to be granted and all other conditions of such other stock awards. Other forms of stock awards may be subject to vesting in accordance with a vesting schedule to be determined by the Compensation Committee. Changes to Capital Structure In the event that there is a specified type of change in Capitol's capital structure not involving the receipt of consideration by Capitol, such as a stock split or stock dividend, the number of shares reserved under the 2011 Plan and the number of shares and exercise price or strike price, if applicable, of all outstanding stock awards will be appropriately adjusted. Corporate Transactions In the event of certain corporate transactions, all outstanding stock awards under the 2011 Plan may be assumed, continued or substituted for by any surviving entity. If the surviving entity elects not to assume, continue or substitute for such awards, the vesting of such stock awards held by persons whose service with Capitol has not terminated generally will be accelerated in full and such stock awards will terminate if and to the extent not exercised at or prior to the effective time of the corporate transaction and Capitol's repurchase rights will generally lapse. Plan Amendments The Compensation Committee has the authority to amend or terminate the 2011 Plan. However, no amendment or termination of the plan will adversely affect any rights under awards already granted to a participant unless agreed to by the affected participant. |
PART II. OTHER INFORMATION – Continued
| (a) | (b) |
| Exhibit No. | Description of Exhibit |
| | |
| 10.1 | Capitol Bancorp Ltd. 2011 Equity Incentive Plan |
| 10.2 | Stock Option Grant Notice Pursuant to the Capitol Bancorp Ltd. 2011 Equity Incentive Plan |
| 10.3 | Stock Option Grant Notice for Senior Management Pursuant to the Capitol Bancorp Ltd. 2011 Equity Incentive Plan |
| 10.4 | Restricted Stock Agreement Pursuant to the Capitol Bancorp Ltd. 2011 Equity Incentive Plan |
| 10.5 | Restricted Stock Unit Agreement Pursuant to the Capitol Bancorp Ltd. 2011 Equity Incentive Plan |
| 10.6 | Stock Appreciation Rights Agreement Pursuant to the Capitol Bancorp Ltd. 2011 Equity Incentive Plan |
| 31.1 | Certification of Chief Executive Officer, Joseph D. Reid, pursuant to Section 302 of the Sarbanes-Oxley Act of 2002. |
| 31.2 | Certification of Principal Accounting Officer, Marie D. Walker, pursuant to Section 302 of the Sarbanes-Oxley Act of 2002. |
| 32.1 | Certification of Chief Executive Officer, Joseph D. Reid, pursuant to Section 906 of the Sarbanes-Oxley Act of 2002. |
| 32.2 | Certification of Principal Accounting Officer, Marie D. Walker, pursuant to Section 906 of the Sarbanes-Oxley Act of 2002. |
SIGNATURES
Pursuant to the requirements of the Securities Exchange Act of 1934, the registrant has duly caused this report to be signed on its behalf by the undersigned thereunto duly authorized.
| | CAPITOL BANCORP LTD. (Registrant) |
| /s/ Joseph D. Reid Joseph D. Reid Chairman and CEO (principal executive officer) |
| /s/ Marie D. Walker Marie D. Walker (principal accounting officer) |
INDEX TO EXHIBITS
| Exhibit No. | Description of Exhibit |
| 10.1 | Capitol Bancorp Ltd. 2011 Equity Incentive Plan |
| 10.2 | Stock Option Grant Notice Pursuant to the Capitol Bancorp Ltd. 2011 Equity Incentive Plan |
| 10.3 | Stock Option Grant Notice for Senior Management Pursuant to the Capitol Bancorp Ltd. 2011 Equity Incentive Plan |
| 10.4 | Restricted Stock Agreement Pursuant to the Capitol Bancorp Ltd. 2011 Equity Incentive Plan |
| 10.5 | Restricted Stock Unit Agreement Pursuant to the Capitol Bancorp Ltd. 2011 Equity Incentive Plan |
| 10.6 | Stock Appreciation Rights Agreement Pursuant to the Capitol Bancorp Ltd. 2011 Equity Incentive Plan |
| 31.1 | Certification of Chief Executive Officer, Joseph D. Reid, pursuant to Section 302 of the Sarbanes-Oxley Act of 2002. |
| 31.2 | Certification of Principal Accounting Officer, Marie D. Walker, pursuant to Section 302 of the Sarbanes-Oxley Act of 2002. |
| 32.1 | Certification of Chief Executive Officer, Joseph D. Reid, pursuant to Section 906 of the Sarbanes-Oxley Act of 2002. |
| 32.2 | Certification of Principal Accounting Officer, Marie D. Walker, pursuant to Section 906 of the Sarbanes-Oxley Act of 2002. |