SECURITIES AND EXCHANGE COMMISSION
Washington, D.C. 20549
FORM 20-F
| ¨ | REGISTRATION STATEMENT PURSUANT TO SECTION 12(b) OR (g) OF THE SECURITIES EXCHANGE ACT OF 1934 |
OR
| x | ANNUAL REPORT PURSUANT TO SECTION 13 OR 15(d) OF THE SECURITIES EXCHANGE ACT OF 1934 |
For the fiscal year ended December 31, 2003
OR
| ¨ | TRANSITION REPORT PURSUANT TO SECTION 13 OR 15(d) OF THE SECURITIES EXCHANGE ACT OF 1934 |
Commission file number: 1-10110
BANCO BILBAO VIZCAYA ARGENTARIA, S.A.
(Exact name of Registrant as specified in its charter)
BANK BILBAO VIZCAYA ARGENTARIA, S.A.
(Translation of Registrant’s name into English)
Kingdom of Spain
(Jurisdiction of incorporation)
Plaza de San Nicolás 4
48005 Bilbao
Spain
(Address of principal executive offices)
Securities registered or to be registered pursuant to Section 12(b) of the Act.
| | |
Title of Each Class
| | Name of Each Exchange on which Registered
|
American Depositary Shares, each representing the right to receive one ordinary share, par value €0.49 per share | | New York Stock Exchange |
| Ordinary shares, par value €0.49 per share | | New York Stock Exchange* |
Non-Cumulative Guaranteed Preference Shares, nominal value $25 each, of BBVA Preferred Capital Ltd. | | New York Stock Exchange |
Guarantee of Non-Cumulative Guaranteed Preference Shares, nominal value $25 each, of BBVA Preferred Capital Ltd. | | New York Stock Exchange** |
Non-Cumulative Guaranteed Preference Shares, Series D, nominal value $0.01 each, of BBVA Privanza International (Gibraltar) Ltd. | | New York Stock Exchange |
Guarantee of Non-Cumulative Guaranteed Preference Shares, Series D, nominal value $0.01 each, of BBVA Privanza International (Gibraltar) Ltd. | | New York Stock Exchange*** |
| * | The ordinary shares are not listed for trading, but are listed only in connection with the registration of the American Depositary Shares, pursuant to requirements of the New York Stock Exchange. |
| ** | The guarantee is not listed for trading, but is listed only in connection with the registration of the corresponding Non-Cumulative Guaranteed Preference Shares of BBVA Preferred Capital Ltd. (a wholly-owned subsidiary of Banco Bilbao Vizcaya Argentaria, S.A.) |
| *** | The guarantee is not listed for trading, but is listed only in connection with the registration of the corresponding Non-Cumulative Guaranteed Preference Shares of BBVA Privanza International (Gibraltar) Ltd. (an indirect wholly-owned subsidiary of Banco Bilbao Vizcaya Argentaria, S.A.) |
Securities registered or to be registered pursuant to Section 12(g) of the Act.
None
Securities for which there is a reporting obligation pursuant to Section 15(d) of the Act.
None
The number of outstanding shares of each class of stock of the Registrant at December 31, 2003 was:
Ordinary shares, par value €0.49 per share—3,195,852,043
Non-Cumulative Guaranteed Preference Shares, nominal value $25 each, of BBVA Preferred Capital Ltd.—9,600,000
Non-Cumulative Guaranteed Preference Shares, Series D, nominal value $0.01 each, of BBVA Privanza International (Gibraltar) Ltd.—70
Indicate by check mark whether the registrant (1) has filed all reports required to be filed by Section 13 or 15(d) of the Securities Exchange Act of 1934 during the preceding 12 months (or for such shorter period that the registrant was required to file such reports), and (2) has been subject to such filing requirements for the past 90 days. Yes x No ¨
Indicate by check mark which financial statement item the registrant has elected to follow. Item 17 ¨ Item 18 x
BANCO BILBAO VIZCAYA ARGENTARIA, S.A.
TABLE OF CONTENTS
i
ii
GLOSSARY
The terms below are used as follows throughout this Annual Report:
| | • | “Argentaria” means Argentaria, Caja Postal y Banco Hipotecario, S.A. and its consolidated subsidiaries, unless otherwise indicated or the context otherwise requires. |
| | • | “BBV” means Banco Bilbao Vizcaya, S.A. and its consolidated subsidiaries, unless otherwise indicated or the context otherwise requires. |
| | • | “BBVA”, “Bank” or “Group” means Banco Bilbao Vizcaya Argentaria, S.A. and its consolidated subsidiaries unless otherwise indicated or the context otherwise requires. BBVA was formed by the merger of BBV and Argentaria, which was approved by the shareholders of each institution on December 18, 1999. |
| | • | “Consolidated Financial Statements” means BBVA’s audited consolidated balance sheets as of December 31, 2003, 2002 and 2001 and BBVA’s audited consolidated statements of income for the years ended December 31, 2003, 2002 and 2001 included in this Annual Report. |
FORWARD-LOOKING STATEMENTS
This Annual Report contains statements that constitute “forward-looking statements” within the meaning of the U.S. Private Securities Litigation Reform Act of 1995. Forward-looking statements may include words such as “believe”, “expect”, “estimate”, “project”, “anticipate”, “should”, “intend”, “probability”, “risk”, “VaR”, “target”, “goal”, “objective” and similar expressions or variations on such expressions. Forward-looking statements are not guarantees of future performance and involve risks and uncertainties, and actual results may differ materially from those in the forward-looking statements as a result of various factors. The accompanying information in this Annual Report, including, without limitation, the information under
| | • | “Item 3. Key Information—Risk Factors”; |
| | • | “Item 4. Information on the Company”; |
| | • | “Item 5. Operating and Financial Review and Prospects”; and |
| | • | “Item 11. Quantitative and Qualitative Disclosures About Market Risk” |
identifies important factors that could cause such differences. Readers are cautioned not to place undue reliance on those forward-looking statements, which speak only as of the date hereof. BBVA undertakes no obligation to release publicly the result of any revisions to these forward-looking statements which may be made to reflect events or circumstances after the date hereof, including, without limitation, changes in its business or acquisition strategy or planned capital expenditures, or to reflect the occurrence of unanticipated events.
CERTAIN TERMS AND CONVENTIONS
First person personal pronouns used in this report, such as “we”, “us”, or “our”, mean BBVA.
In this report, “$”, “U.S. dollars”, and “dollars” refer to United States Dollars, “€” and “euro” refer to Euro and “ARP” refers to Argentinean Pesos.
PRESENTATION OF FINANCIAL INFORMATION
Accounting Principles
The merger of BBV and Argentaria approved by the shareholders of each institution on December 18, 1999, was effected through a merger by absorption of Argentaria with and into BBV and was accounted for under the purchase method of accounting under generally accepted accounting principles in the United States (“U.S. GAAP”) and under the method of “pooling of interests” under generally accepted accounting principles for banks in Spain, which include the accounting requirements established by the Bank of Spain (“Spanish GAAP”).
1
Unless otherwise indicated, the financial information contained in this Annual Report has been derived from financial statements that have been prepared in accordance with Spanish GAAP. See Note 32.2 to the Consolidated Financial Statements for a discussion of some respects in which Spanish GAAP differs from U.S. GAAP.
The Consolidated Financial Statements have been presented in the same format as that used in the consolidated financial statements included in BBVA’s annual and interim reports to shareholders. This format differs from that required by the United States Securities and Exchange Commission (the “SEC” or “Commission”) for the consolidated financial statements of bank holding companies. Consolidated balance sheets and summary statements of income that reflect the reclassifications required by the Commission are included in Note 32.2 to the Consolidated Financial Statements.
We manage our business along four segmental lines which are discussed in “Item 4. Information on the Company” and whose operating results are described in “Item 5. Operating and Financial Review and Prospects”. In addition, due to the special conditions that have continued to affect our operations in Argentina in 2003, we have elected to provide additional disclosure, as we did in our Annual Report on Form 20-F for 2002, on our Argentinean operations and discuss these operations as if they comprised a separate segment, “Argentina”, and not part of the “Banking in America” business segment, where they were included in our Annual Report on Form 20-F for 2001 and prior years.
Certain numerical information in this Annual Report may not sum due to rounding.
Accelerated Amortization of Goodwill
The Consolidated Financial Statements are based on the Spanish statutorily approved financial statements included in BBVA’s reports to shareholders. The auditors’ reports for the years ended December 31, 1999 and 2000 were qualified with respect to the early amortization of goodwill arising mainly from the acquisition of our Latin American subsidiaries. In accordance with Spanish GAAP, this goodwill should have been capitalized and amortized over 10 years. U.S. securities regulations do not currently allow the use in filings with the Commission of financial statements on which the auditors’ report is qualified with respect to a material departure from generally accepted accounting principles. The financial statements included herein reflect adjustments of the Spanish statutorily approved financial statements solely for purposes of complying with U.S. securities regulations. The adjustments consist of the reversal of the early amortization of goodwill and the amortization of such goodwill over a period of five years, the estimated period of the associated assets’ useful life. The following table reflects these adjustments for the periods presented. This adjustment does not affect the year ended December 31, 2002 and 2003.
| | |
| | | Year ended December 31,
2001
|
| | | (in millions of euro) |
Net attributable profit as reported in BBVA’s Annual Report to shareholders | | 2,363 |
Net attributable profit reflecting reversal of early amortization of goodwill | | 1,843 |
Statistical and Financial Information
The following principles should be noted in reviewing the statistical and financial information contained herein:
| | • | Average balances, when used, are based on the beginning and the month-end balances during each year. We do not believe that such monthly averages present trends that are materially different from those that would be presented by daily averages. |
| | • | The book value of BBVA’s ordinary shares held by its consolidated subsidiaries has been deducted from stockholders’ equity. |
| | • | Unless otherwise stated, any reference to loans refers to both loans and leases. |
2
| | • | Interest income figures include interest income on non-accruing loans to the extent that cash payments have been received in the period in which they are due. |
| | • | Financial information with respect to subsidiaries may not reflect consolidation adjustments. |
Disclosures in this Annual Report with respect to the amount of “substandard loans” at any date reflect Bank of Spain classifications at such date. See “Item 4. Information on the Company—Selected Statistical Information—Assets—Loan Loss Reserve”, “—Substandard Loans” and “—Foreign Country Outstandings”. These classifications differ from the classifications applied by U.S. banks in reporting loans as non-accrual, past due, restructured and as potential problem loans. One of the most important differences is that under Bank of Spain classifications, in the case of loans which are classified as substandard because any payment of principal or interest is 90 days or more past due, initially only past due payments of principal or interest (to the extent accruing at the time that the relevant loan is classified as substandard) are treated as substandard. If any payment on a loan is past due for more than one year, or if, regardless of the time past due, the aggregate amount of past due principal and interest exceeds 25% of the principal amount of the loan, then the entire principal amount of the loan is required to be classified as substandard.
Translation into Euro Currency
The Consolidated Financial Statements are stated in euro. Financial data as of and for periods prior to December 31, 2001 included elsewhere in this Annual Report have been restated from pesetas into euro using the exchange rate in effect as of January 1, 1999 of Ptas.166.386 = €1.00. Data in pesetas converted to euro at such exchange rates show the same trends as would have been presented if the data had been presented in pesetas.
PART I
ITEM 1. IDENTITY OF DIRECTORS, SENIOR MANAGEMENT AND ADVISERS
Not Applicable.
Not Applicable.
Not Applicable.
ITEM 2. OFFER STATISTICS AND EXPECTED TIMETABLE
Not applicable.
3
ITEM 3. KEY INFORMATION
A. Selected Financial Data
Spanish GAAP Data
The historical financial information set forth below has been selected from, and should be read together with, the Consolidated Financial Statements included herein. For information concerning the preparation and presentation of financial information contained herein, see “Presentation of Financial Information”. Also see Note 32.2 of the Consolidated Financial Statements for a presentation of our balance sheet and income statement reconciled to U.S. GAAP.
| | | | | | | | | | | | | | | |
| | | Year ended December 31,
| |
Consolidated statement of income data
| | 2003
| | | 2002
| | | 2001
| | | 2000
| | | 1999(1)
| |
| | | (in millions of euro, except per share/ADS data (in euro) and percentages) | |
Net interest income | | 6,741 | | | 7,808 | | | 8,824 | | | 6,995 | | | 4,370 | |
Net fee income | | 3,263 | | | 3,668 | | | 4,038 | | | 3,369 | | | 2,077 | |
| | |
|
| |
|
| |
|
| |
|
| |
|
|
Basic margin | | 10,004 | | | 11,476 | | | 12,862 | | | 10,364 | | | 6,447 | |
Market operations | | 652 | | | 765 | | | 490 | | | 779 | | | 497 | |
| | |
|
| |
|
| |
|
| |
|
| |
|
|
Ordinary revenue | | 10,656 | | | 12,241 | | | 13,352 | | | 11,143 | | | 6,944 | |
General administrative expenses | | (5,031 | ) | | (5,772 | ) | | (6,725 | ) | | (5,937 | ) | | (3,834 | ) |
Depreciation and amortization | | (511 | ) | | (631 | ) | | (742 | ) | | (653 | ) | | (388 | ) |
Other operating revenues and expenses, net | | (219 | ) | | (261 | ) | | (286 | ) | | (177 | ) | | (143 | ) |
| | |
|
| |
|
| |
|
| |
|
| |
|
|
Net operating income | | 4,895 | | | 5,577 | | | 5,599 | | | 4,376 | | | 2,579 | |
Net income from companies accounted for by the equity method | | 383 | | | 33 | | | 393 | | | 589 | | | 200 | |
Amortization of consolidation goodwill(2) | | (639 | ) | | (679 | ) | | (1,143 | ) | | (923 | ) | | (482 | ) |
Net income on Group transactions | | 553 | | | 361 | | | 954 | | | 1,307 | | | 1,038 | |
Net loan loss provisions | | (1,277 | ) | | (1,743 | ) | | (1,919 | ) | | (973 | ) | | (694 | ) |
Net securities write-downs | | — | | | 3 | | | (43 | ) | | (7 | ) | | (18 | ) |
Extraordinary items, net | | (103 | ) | | (433 | ) | | (727 | ) | | (751 | ) | | (357 | ) |
| | |
|
| |
|
| |
|
| |
|
| |
|
|
Pre-tax profit(2) | | 3,812 | | | 3,119 | | | 3,114 | | | 3,618 | | | 2,266 | |
Corporate income tax and other taxes | | (915 | ) | | (653 | ) | | (625 | ) | | (962 | ) | | (488 | ) |
| | |
|
| |
|
| |
|
| |
|
| |
|
|
Income before minority interests(2) | | 2,897 | | | 2,466 | | | 2,489 | | | 2,656 | | | 1,778 | |
Minority interests | | (670 | ) | | (747 | ) | | (646 | ) | | (682 | ) | | (342 | ) |
| | |
|
| |
|
| |
|
| |
|
| |
|
|
Net attributable profit(2) | | 2,227 | | | 1,719 | | | 1,843 | | | 1,974 | | | 1,436 | |
| | |
|
| |
|
| |
|
| |
|
| |
|
|
Per Share/ADS(3) data | | | | | | | | | | | | | | | |
Operating income(4) | | 1.53 | | | 1.75 | | | 1.75 | | | 1.44 | | | 1.24 | |
Number of shares | | 3,195,852,043 | | | 3,195,852,043 | | | 3,195,852,043 | | | 3,195,852,043 | | | 2,133,235,006 | |
Net attributable profit(4) | | 0.70 | | | 0.54 | | | 0.58 | | | 0.65 | | | 0.69 | |
Dividends(4)(5) | | 0.38 | | | 0.35 | | | 0.38 | | | 0.36 | | | 0.28 | |
4
| | | | | | | | | | | | | | | |
| | | At December 31,
| |
Consolidated balance sheet data
| | 2003
| | | 2002
| | | 2001
| | | 2000
| | | 1999(1)
| |
| | | (in millions of euro, except per share/ADS data (in euro)
and percentages) | |
Total assets(2) | | 287,150 | | | 279,542 | | | 309,062 | | | 296,345 | | | 157,545 | |
Loans and leases, net | | 148,827 | | | 141,315 | | | 150,220 | | | 137,467 | | | 68,494 | |
Deposits | | 141,049 | | | 146,560 | | | 166,499 | | | 154,146 | | | 79,155 | |
Marketable debt securities and subordinated debt | | 41,782 | | | 34,010 | | | 32,986 | | | 31,571 | | | 16,071 | |
Minority interests | | 5,426 | | | 5,674 | | | 6,394 | | | 6,304 | | | 4,379 | |
Capital and reserves(2) | | 11,473 | | | 11,842 | | | 12,770 | | | 13,047 | | | 5,516 | |
| | | | | |
Consolidated ratios | | | | | | | | | | | | | | | |
Profitability ratios: | | | | | | | | | | | | | | | |
Net interest margin(6) | | 2.4 | % | | 2.70 | % | | 2.92 | % | | 2.58 | % | | 3.33 | % |
Return on average total assets(7) | | 1.04 | % | | 0.85 | % | | 0.82 | % | | 0.98 | % | | 1.24 | % |
Return on average capital and reserves(8) | | 12.45 | % | | 13.07 | % | | 13.96 | % | | 18.68 | % | | 26.12 | % |
| | | | | |
Credit quality data | | | | | | | | | | | | | | | |
Loan loss reserve | | 4,736 | | | 5,346 | | | 6,320 | | | 8,155 | | | 2,277 | |
Loan loss reserve as a percentage of total loans and leases | | 3.09 | % | | 3.65 | % | | 4.05 | % | | 5.71 | % | | 3.23 | % |
Substandard loans(9) | | 3,126 | | | 3,531 | | | 2,743 | | | 2,862 | | | 1,365 | |
Non-Performing loans as a percentage of total loans and leases | | 1.74 | % | | 2.37 | % | | 1.75 | % | | 2.00 | % | | 1.93 | % |
Loan loss reserve as a percentage of substandard loans | | 151.5 | % | | 151.42 | % | | 230.40 | % | | 284.94 | % | | 166.81 | % |
| (2) | In our Spanish statutory financial statements for the years ended December 31, 2000 and 1999, we amortized goodwill on an accelerated basis. See “Presentation of Financial Information”. |
| (3) | Each American Depositary Share (“ADS”) represents the right to receive one ordinary share. |
| (4) | Calculated on the basis of the weighted average number of BBVA’s ordinary shares outstanding during the relevant period. |
| (5) | Calculated based on total dividends paid in respect of each period indicated. |
| (6) | Represents net interest income as a percentage of average total assets. |
| (7) | Represents income before minority interests as a percentage of average total assets. |
| (8) | Represents net attributable profit as a percentage of average capital and reserves. |
| (9) | Only past due payments, and not outstanding principal, are included in the balance of substandard loans unless and until the entire principal amount is classified as substandard under applicable Bank of Spain rules. |
5
U.S. GAAP Information
| | | | | | | | | | | | | | | |
| | | Year ended December 31,
|
| | | 2003
| | 2002
| | 2001
| | Restated
2000(1)
| | | 2000
| | Restated (*)
1999(1)
| | 1999(1)
|
| | | (in millions of euro, except per share/ADS data (in euro) or as otherwise indicated) |
Consolidated statement of income data | | | | | | | | | | | | | | | |
| | | | | | | |
Net income(2) | | 1,906 | | 1,846 | | 680 | | 1,413 | | | 1,544 | | 1,056 | | 1,038 |
Basic earnings per share/ADS(3)(4) | | 0.60 | | 0.58 | | 0.21 | | 0.47 | | | 0.51 | | 0.51 | | 0.50 |
Diluted earnings per share/ADS(3)(4) | | 0.60 | | 0.58 | | 0.21 | | 0.46 | | | 0.50 | | 0.50 | | 0.49 |
Dividends per share/ADS (in dollars)(4)(5) | | 0.34 | | 0.33 | | 0.34 | | 0.39 | | | 0.39 | | 0.27 | | 0.27 |
| | | | | | | |
Consolidated balance sheet data as at December 31 | | | | | | | | | | | | | | | |
| | | | | | | |
Total assets(6) | | 287,912 | | 290,430 | | 322,612 | | 308,644 | (7) | | 313,120 | | 165,431 | | 165,300 |
Stockholders’ equity(6) | | 19,583 | | 18,908 | | 21,226 | | 22,579 | | | 22,579 | | 10,070 | | 9,939 |
Basic stockholders’ equity per share/ADS(4) | | 6.13 | | 5.92 | | 6.64 | | 7.43 | | | 7.43 | | 4.82 | | 4.76 |
Diluted stockholders’ equity per share/ADS(4) | | 6.13 | | 5.91 | | 6.63 | | 7.33 | | | 7.33 | | 4.77 | | 4.71 |
| (1) | The restated amounts are calculated according to the guidance of paragraphs 36-37 of APB 20 “correction of an error”, which is described in Note 32.2.B.15 to our consolidated financial statements included in our Annual Report on Form 20-F for 2002, in order to reflect the actual timing and substance of all transactions associated with the “unreported funds” described under “Item 8—Financial Information—Legal Proceedings”. |
| (2) | We generally refer to our income after taxes and minority interests as “net attributable profit”. In the case of the U.S. GAAP information provided above, the term “net income” is used for consistency with Note 32.2 to our Consolidated Financial Statements, which includes additional U.S. GAAP information and generally refers to “net income” in cases in which we would otherwise use the term “net attributable profit”. |
| (3) | Calculated on the basis of the weighted average number of BBVA’s ordinary shares outstanding during the relevant period. |
| (4) | Each ADS represents the right to receive one ordinary share. |
| (5) | Dividends per share/ADS are translated into dollars for 2003 through 1999, at an average exchange rate for each year, calculated based on the average of the noon buying rates for euro from the Federal Reserve Bank of New York on the last date of each month during the relevant period, expressed in dollars per €1.00. |
| (6) | At the end of the reported period. |
| (7) | Total assets were restated for 2000 from €313,120 million to €308,612 million due to a reclassification of certain assets of Bancomer, as reported in our Annual Report on Form 20-F for 2001. |
Exchange Rates
On January 1, 1999, the euro was introduced as a new currency in the following 11 European Union (“EU”) member states, forming the European Monetary and Economic Union at such date: Austria, Belgium, Finland, France, Germany, Ireland, Italy, Luxembourg, the Netherlands, Portugal and Spain. As of January 2001, the euro was also introduced as the new currency in Greece. The currencies of the participating member states were nondecimal subdivisions of the euro until January 1, 2002 and for up to six months thereafter. The exchange rate at which the peseta has been irrevocably fixed against the euro is Ptas.166.386 = €1.00. Beginning January 1, 2002, the participating member states issued new euro-denominated bills and coins for use in cash transactions. By July 1, 2002, the participating member states withdrew from circulation the bills and coins denominated in their respective currencies, and they are no longer legal tender for any transactions.
The following table sets forth, for the years indicated, the average exchange rate for each year, which reflects the average of the noon buying rates for euro from the Federal Reserve Bank of New York on the last date of each month during the relevant period, for the years ended December 31, 1999 through 2003, and for the year ended December 31, 2004 (through June 30), expressed in dollars per €1.00.
| | |
Year ended December 31,
| | Average
|
1999 | | 1.0588 |
2000 | | 0.9207 |
2001 | | 0.8909 |
2002 | | 0.9495 |
2003 | | 1.1411 |
2004 (through June 25) | | 1.2275 |
6
The following table describes, for the periods and dates indicated, information concerning the noon buying rate for euro from the Federal Reserve Bank of New York, expressed in dollars per €1.00.
| | | | |
Month ended
| | High
| | Low
|
December 31, 2003 | | 1.2597 | | 1.1956 |
January 31, 2004 | | 1.2853 | | 1.2389 |
February 28, 2004 | | 1.2848 | | 1.2426 |
March 31, 2004 | | 1.2431 | | 1.2088 |
April 30, 2004 | | 1.2358 | | 1.1802 |
May 31, 2004 | | 1.2274 | | 1.1801 |
June 30, 2004 (through June 25) | | 1.2320 | | 1.2006 |
The noon buying rate for euro from the Federal Reserve Bank of New York, expressed in dollars per €1.00, on June 25, 2004, was $1.2145. Unless otherwise indicated, amounts that have been converted to euro in this Annual Report have been done so at the corresponding exchange rate published by the European Central Bank on December 31 of the relevant year.
At December 31, 2003, approximately 30.8% of our assets and approximately 33.2% of our liabilities were denominated in currencies other than euro (principally dollars).
For a discussion of our foreign currency exposure, please see “Item 11. Quantitative and Qualitative Disclosures About Market Risk—Market Risk Management—Market risk in 2003—Structural Exchange Rate Risk”.
| B. | Capitalization and Indebtedness |
Not applicable.
| C. | Reasons for the Offer and Use of Proceeds |
Not applicable.
Risks Relating to us
Since our loan portfolio is highly concentrated in Spain, adverse changes affecting the Spanish economy could have a material adverse effect on our financial condition.
We historically have developed our lending business in Spain, which continues to be our main place of business. As of December 31, 2003, business activity in Spain accounted for 76.25% of our loan portfolio. See “Item 4. Information on the Company—Selected Statistical Information—Loans by Geographic Area”. Any adverse changes affecting the Spanish economy are likely to have a significant adverse impact on our loan portfolio and, as a result, on our financial condition and results of operations.
7
A substantial percentage of our customer base is particularly sensitive to adverse developments in the economy, which renders our lending activities relatively riskier than if we lent primarily to higher-income customer segments.
Medium- and small-size companies and middle and lower middle income individuals typically have less financial strength than large companies and high-income individuals and accordingly can be expected to be more negatively affected by adverse developments in the economy. As a result, it is generally accepted that lending to these segments of our existing and targeted customer base represents a relatively higher degree of risk than lending to other groups.
A substantial portion of our loan portfolio consists of residential mortgages and consumer loans to middle and lower middle income customers and commercial loans to medium and small companies. Consequently, during periods of slowdown in economic activity we may experience higher levels of past due amounts which could result in higher levels of allowance for loan losses. We cannot assure you that we will not suffer substantial adverse effects on our base portfolio to these customer segments in the event of adverse developments in the economy.
Increased exposure to real estate in Spain makes us more vulnerable to developments in this market.
The decrease in interest rates in Spain has caused an increase in the demand of mortgage loans in the last few years. This has had repercussions in housing prices, which have also risen significantly. As residential mortgages are one of our main assets, comprising 30%, 40% and 42% of our loan portfolio at December 31, 2001, 2002 and 2003, respectively, we are currently highly exposed to developments in real estate markets. A strong increase in interest rates in Spain might have a significant negative impact in mortgage payment delinquency rates. An increase in such delinquency rates could have an adverse effect on our business, financial condition and results of operations.
Highly-indebted households and corporations could endanger our asset quality and future revenues.
Spanish households and firms have reached, in recent years, a high indebtedness level, which represents increased risk for the Spanish banking system. The increase of loans referenced to variable rates make debt service on such loans more vulnerable to changes in interest rates than in the past. The increase in households’ and firms’ indebtedness also limits their ability to incur additional debt, decreasing the number of new products we may otherwise be able to sell them.
A sudden shortage of funds could cause an increase in our costs of funding and an adverse effect on our operating revenues.
Historically, one of our principal sources of funds has been savings and demand deposits. Time deposits represented 36.2%, 35.0% and 31.1% of our total funding at December 31, 2001, 2002 and 2003 respectively. Large-denomination time deposits may, under some circumstances, such as during periods of significant changes in market interest rates for these types of deposit products and resulting increased competition for such funds, be a less stable source of deposits than savings and demand deposits. In addition, since we rely heavily on short-term deposits for our funding, we cannot assure you that, in the event of a sudden or unexpected shortage of funds in the banking systems or money markets in which we operate, we will be able to maintain our current levels of funding without incurring higher funding costs or having to liquidate certain of our assets.
We face increasing competition in our business lines.
The markets in which we operate are highly competitive. Financial sector reforms in the markets in which we operate have increased competition among both local and foreign financial institutions, and we believe that this trend will continue. For example, the adoption of the euro as the common currency throughout the EU is making it easier for European banks to compete against us in Spain. In addition, the trend towards consolidation in the banking industry has created larger and stronger banks with which we must now compete.
We also face competition from non-bank competitors, such as:
| | • | department stores (for some credit products); |
8
We cannot assure you that this competition will not adversely affect our business, financial condition and results of operations.
Our business is particularly vulnerable to volatility in interest rates.
Our results of operations are substantially dependent upon the level of our net interest income, which is the difference between interest income from interest-earning assets and interest expense on interest-bearing liabilities. Interest rates are highly sensitive to many factors beyond our control, including deregulation of the financial sectors in the markets in which we operate, monetary policies pursued by national governments, domestic and international economic and political conditions and other factors.
Changes in market interest rates could affect the spread between interest rates charged on interest-earning assets and interest rates paid on interest-bearing liabilities and thereby negatively affect our results of operations. For example, an increase in interest rates could cause our interest expense on deposits to increase more significantly and quickly than our interest income from loans, resulting in a reduction in our net interest income.
In addition, income from treasury operations is particularly vulnerable to interest rate volatility. Since 64.30% of our portfolio consists of variable interest rate loans maturing in more than one year, rising interest rates may also bring about an increase in the non-performing loan portfolio.
Our financial statements and periodic disclosure under securities laws may not give you the same information as financial statements prepared under U.S. accounting rules and periodic disclosures provided by domestic U.S. issuers.
Publicly available information about public companies in Spain is generally less detailed and not as frequently updated as the information that is regularly published by or about listed companies in the United States. In addition, although we are subject to the periodic reporting requirements of the United States Securities Exchange Act of 1934 (the “Exchange Act”), the periodic disclosure required of foreign issuers under the Exchange Act is more limited than the periodic disclosure required of U.S. issuers. Finally, we maintain our financial accounts and records and prepare our financial statements in conformity with Spanish GAAP, which differs in certain respects from U.S. GAAP, the financial reporting standard to which many investors in the United States may be better accustomed.
Risks Relating to Latin America
The devaluation of the Argentinean peso, the adverse macroeconomic conditions prevailing in Argentina and emergency measures adopted by the Argentinean government have had, and may continue to have, a material adverse effect on our business, financial condition and results of operations.
Argentina’s economic situation deteriorated sharply in late 2001. The beginning of 2002 was marked by the continued movement of capital out of Argentina, the end of convertibility of the peso, devaluation, and the return of inflation. The crisis had a strong impact on the financial system and jeopardized the solvency and liquidity of banks. In 2003, macroeconomic conditions in Latin America and Argentina improved, but significant uncertainty regarding the scope and pace of the recovery remained.
As a result of the measures described in “Item 4. Information on the Company––Business Overview—Business Areas—Argentina”, we have written off our entire investment in Argentina to date. However, despite our provisions and write-downs, the situation in Argentina may continue to have a material adverse effect on our business, financial condition and results of operations.
We cannot assure you that the laws and regulations currently governing the Argentinean economy will not change in the future, or that any changes which may occur will not adversely affect our business, financial condition or results of our operations in the country, or the business which we transact with counterparties located in the country.
Risks relating to our investments in Argentina in light of the current social and political crises include the potential for: (i) civil unrest, rioting, looting, nationwide protests, widespread social unrest and strikes, (ii) expropriation, nationalization and forced renegotiation or modification of existing contracts, (iii) additional restrictions on repatriation of investments and transfer of funds abroad, (iv) adverse changes to taxation policies, including retroactive tax claims and (v) further changes in laws and policies of Argentina affecting foreign trade and investment.
9
Our Latin American subsidiaries’ growth, asset quality and profitability may be affected by volatile macroeconomic conditions, including government default on public debt, in the Latin American countries where they operate.
The Latin American countries where we operate have experienced significant economic volatility in recent decades, characterized by slow growth, declining investment and significant inflation. This volatility has resulted in fluctuations in the levels of deposits and in the relative economic strength of various segments of the economies to which we lend. Negative and fluctuating economic conditions, such as a changing interest rate environment, also affect our profitability by causing lending margins to decrease and leading to decreased demand for higher-margin products and services.
Negative and fluctuating economic conditions in some Latin American countries could result in government defaults on public debt. This could affect us in two ways: directly, through portfolio losses, and indirectly, through instabilities that a default in public debt could cause to the banking system as a whole, particularly since commercial banks’ exposure to government debt is generally high in several Latin American countries in which we operate.
While we seek to mitigate these risks through the conservative risk policies described in “Item 11. Quantitative and Qualitative Disclosures About Market Risk”, no assurance can be given that our Latin American subsidiaries’ growth, asset quality and profitability will not be affected by volatile macroeconomic conditions in the Latin American countries in which we operate.
Latin American economies can be directly and negatively affected by adverse developments in other countries.
Financial and securities markets in Latin American countries in which we operate, are to varying degrees, influenced by economic and market conditions in other countries in Latin America and beyond. Negative developments in the economy or securities markets in one country, particularly in an emerging market, may have a negative impact on other emerging market economies. These developments may adversely affect the business, financial condition and operating results of our subsidiaries in Latin America.
We are exposed to foreign exchange and, in some instances, political risks as well as other risks in the Latin American countries in which we operate, which could cause an adverse impact on our business, financial condition and results of operations.
We operate commercial banks in 10 Latin American countries and our overall success as a global business depends, in part, upon our ability to succeed in differing economic, social and political conditions. We are confronted with different legal and regulatory requirements in many of the jurisdictions in which we operate. These include, but are not limited to, different tax regimes and laws relating to the repatriation of funds or nationalization of assets. Our international operations may also expose us to risks and challenges which our local competitors may not be required to face, such as exchange rate risk, difficulty in managing a local entity from abroad, and political risk which may be particular to foreign investors. Our expansion in these markets requires us to respond to rapid changes in market conditions in these countries. We cannot assure you that we will continue to succeed in developing and implementing policies and strategies that are effective in each country in which we operate or that any of the foregoing factors will not have a material adverse effect on our business, financial condition and results of operations.
Regulatory changes in Latin America that are beyond our control may have a material effect on our business, financial condition and results of operations.
A number of banking regulations designed to maintain the safety and soundness of banks and limit their exposure to risk are applicable in certain Latin American countries in which we operate. Local regulations differ in a number of material respects from equivalent regulations in Spain and the United States.
Changes in regulations that are beyond our control may have a material effect on our business and operations. In addition, since some of the banking laws and regulations have been recently adopted, the manner in which those laws and related regulations are applied to the operations of financial institutions is still evolving. No assurance can be given that laws or regulations will be enforced or interpreted in a manner that will not have a material adverse effect on our business, financial condition and results of operations.
ITEM 4. INFORMATION ON THE COMPANY
A. History and Development of the Company
BBVA’s predecessor bank, BBV, was incorporated as a limited liability company (asociedad anónima or “S.A.”) under the Spanish Corporations Law on October 1, 1988. BBVA was formed as the result of a merger by absorption of Argentaria into BBV that was approved by the shareholders of each institution on December 18, 1999 and registered on January 28, 2000. It conducts its
10
business under the commercial name “BBVA”. BBVA is registered with the Commercial Registry of Vizcaya (Spain). It has its registered office at Plaza de San Nicolás 4, Bilbao, Spain, 48005, telephone number 34-94-420-3001. BBVA’s agent in the U.S. for U.S. federal securities law purposes is Raúl Santoro de Mattos Almeida (BBVA New York, 1345 Avenue of the Americas, 45th floor, NY, New York, 10105). BBVA is incorporated for an unlimited term.
Capital Expenditures
Our principal capital expenditures from 2001 to the date of this Annual Report were the following:
2004
Grupo Financiero BBVA Bancomer, S.A. de C.V (“Bancomer”). On January 30, 2004, our Board of Directors adopted a resolution to launch a tender offer for the approximated 40.6% of the shares of Bancomer, our Mexican affiliate, which were not already owned by BBVA. The tender offer was launched on February 19, 2004 and expired on March 19, 2004. As a result of the successful completion of the tender offer and subsequent purchases amounting to 0.56% of Bancomer’s capital stock, at March 31, 2004, we owned 99.44% of Bancomer’s outstanding shares. On February 5, 2004, to strengthen our capital ratios and finance a portion of the cost of the Bancomer tender offer, we sold 195,000,000 of our newly-issued ordinary shares to institutional investors in Spain and outside of Spain at the offer price of €10.25 per share.
BBVA Banco Francés, S.A. (“Banco Francés”). On March 18, 2004, the Board of Directors of Banco Francés, our Argentine affiliate, resolved to implement a plan intended to improve Banco Frances’s adjusted stockholders’ equity and enable Banco Frances to comply with new minimum capital requirements established by the Argentine Central Bank. The plan provides for:
| a) | a capital increase of up to ARP 385 million (approximately US$132.2 million (€108 million as of March 31, 2004)), which will be submitted for approval at an ordinary and extraordinary stockholders meeting and to the appropriate local authorities and |
| b) | the sale of Banco Francés’s entire interest in Banco Francés (Cayman) Limited, which has been approved by regulatory authorities of the Cayman Islands. |
BBVA, as Banco Francés’s largest shareholder, intends to participate in this plan by:
| (1) | capitalizing a loan granted by BBVA to Banco Francés in an amount up to US$77.7 million (€63.6 million as of March 31, 2004) and |
| (2) | subscribing to a capital increase in an amount up to US$40 million (€32.7 million as of March 31, 2004). |
Furthermore, BBVA will acquire from Banco Francés its entire interest in Banco Francés (Cayman) Limited for a purchase price of US$238.5 million (€195 million as of March 31, 2004), which is based on the independent valuation of Banco Francés (Cayman) Limited by two independent valuation experts.
The two transactions involving Banco Frances described above will not affect BBVA’s consolidated operating results because (i) in the case of the loan capitalization, BBVA had previously fully provisioned the loan, and (ii) in the case of the purchase of Banco Frances (Cayman) Limited, this entity was already fully consolidated by BBVA.
2003
During 2003, BBVA acquired 0.176% of the capital stock of Gas Natural S.D.G, S.A. (“Gas Natural”) for €12.7 million, raising its interest in Gas Natural to 3.241%.
During 2003, BBVA purchased 4.76% of the capital stock of Bancomer for a total of €304 million, raising its interest to 59.43% as of December 31, 2003.
2002
On May 14, 2002, Banco Francés sold its interest in BBVA Uruguay (60.88%) to BBVA for $55 million, after obtaining authorization from the Central Bank of Uruguay. As a result of this transaction, BBVA’s ownership interest in BBVA Uruguay increased from 80.66% to 100%.
On May 15, 2002, Terra Networks, S.A. (“Terra Networks”) and BBVA entered into a preliminary agreement for the integration of Uno-e Bank, S.A. and the individual consumer financing business of Finanzia Banco de Crédito, S.A. (“Finanzia”), BBVA’s wholly-owned subsidiary, whereby Terra Networks’ holding in Uno-e Bank would decrease to 33%. This integration transaction and the percentage of ownership held by Terra Networks were subject to the formalization of final contracts, which were
11
executed on January 10, 2003, and approved at extraordinary shareholders’ meetings of Finanzia and Uno-e Bank held on April 23, 2003. In connection with the integration transaction, Terra Networks was granted a put option over its shares in the resulting combined entity giving it the right to require BBVA to purchase such shares. For more information relating to this transaction, see “Item 5. Operating and Financial Review and Prospects—Liquidity and Capital Resources—Agreement with Terra Networks” and “Item 7. Major Shareholders and Related Party Transactions—Related Party Transactions—Uno-e Bank Agreement”.
On June 8, 2004, the European Commission approved plans by BBVA and Banca Nazionale del Lavore (“BNL”) to form a consumer-finance 50-50 joint venture in Italy. The new company will provide consumer credit products, such as credit cards, personal loans and salary advances.
In two transactions in June and November 2002, BBVA purchased from the Mexican government its 3% and 2.5% interests in Bancomer for approximately €240 million and €175 million, respectively. As a result of these transactions, BBVA’s ownership interest in Bancomer increased to 54.67% as of December 31, 2002.
2001
In January 2001, BBVA acquired 200 million shares of Bancomer from the Bank of Montreal, representing approximately 2.2% of Bancomer’s capital stock, for approximately $125 million. On April 4, 2001, BBVA reached an agreement with Bank of Montreal to purchase in two tranches 812 million shares of Bancomer for a total of $558 million. The first tranche, consisting of 500 million shares, was acquired in April 2001, and the second tranche, consisting of 312 million shares, in May 2001, raising BBVA’s holding in Bancomer to 48%. Additional purchases of shares of Bancomer amounting to $140 million were made in October and November 2001, increasing BBVA’s stake in Bancomer to 49% as of December 31, 2001.
BBVA acquired in the first and last quarters of 2001 a 4.87% interest in BNL for approximately €398 million, increasing its holding in BNL to 14.8% as of December 31, 2001. BBVA increased its holding to 14.9% as of January 31, 2002.
Capital Divestitures
Our principal capital divestitures from 2001 to the date of this Annual Report were the following:
2004
On June 18, 2004 BBVA sold its 5.01% interest in Acerinox, S.A. for €146.6 million, giving rise to a capital gain of €35 million.
In January 2004, BBVA sold 2.2% of the capital stock of Gas Natural. At the time the transaction closed, BBVA had not completed preparation of its 2003 Consolidated Financial Statements and therefore, in accordance with Spanish GAAP, reflected the amortization of €70 million of consolidation goodwill which resulted from the transaction in such financial statements rather than in its 2004 Consolidated Financial Statements.
2003
On January 13, 2003, BBVA announced its intention to sell its Brazilian affiliate, Banco Bilbao Vizcaya Argentaria Brasil, S.A. (“BBV Brasil”) to Banco Bradesco, S.A. (“Bradesco”). On June 9, 2003, upon completion of due diligence, receipt of authorizations from regulatory authorities and approval by the corresponding corporate bodies, BBVA transferred 100% of BBV Brasil to Bradesco, in consideration for which Bradesco paid 35,481,460,311 of its newly-issued ordinary shares and 34,948,501,563 of its newly-issued preferred shares, totaling 4.44% of Bradesco’s share capital, as well as 1,864 million Brazilian Reais in cash, for a total consideration of approximately 2,626 million Brazilian Reais (approximately $900 million). We were required, under Spanish GAAP, to take an extraordinary charge in 2002 relating to exchange rate differences relating to our investment in BBV Brasil accumulated up to December 31, 2002. Under the transaction agreements with Bradesco, in addition to the cash consideration and equity participation described above, we have been granted the right to nominate one member of Bradesco’s board of directors so long as we maintain, subject to exceptions relating to capital increases where shareholders are not offered preemptive rights, at least a 4.0% interest in Bradesco’s share capital. We have agreed for a period of two years from the closing date or so long as we have a right to nominate one member of Bradesco’s board of directors, whichever is longer, that we will not control and/or manage a financial institution in Brazil. See Note 32.2.D.13 to the Consolidated Financial Statements.
In March 2003, BBVA sold its 25% interest in Metrovacesa Residencial, S.A., resulting in a capital gain of €2.1 million.
On June 5, 2003, BBVA agreed to sell its holding in Crédit Lyonnais, S.A., to Crédit Agricole, S.A. in exchange for €482 million in cash, representing 67% of consideration, and 16.3 million shares of Crédit Agricole, S.A., representing the remaining 33% of consideration. BBVA immediately sold the Crédit Agricole shares to institutional investors at a price of €16.64 per share, for a total consideration of €271 million. As a result of this transaction, BBVA liquidated its participation in Crédit Lyonnais and recorded a capital gain of €342 million.
In July 2003, BBVA sold 3% of the capital stock of Gamesa, giving rise to a capital gain of €29.9 million.
12
In the last quarter of 2003, BBVA sold 2.465% of the capital stock of Repsol-YPF, giving rise to a loss of €73.3 million.
In 2003, a series of purchases and sales of shares of Telefónica de España, S.A., resulting in a 0.57% net reduction of our holding, gave rise to a capital gain of €220 million.
In 2003, a series of purchases and sales of shares of Iberdrola, S.A., resulting in a 1.02% net reduction of our holding, gave rise to a capital gain of €45.3 million.
In December 2003, BBVA sold its entire 9.9% interest in the Moroccan bank Wafabank, S.A. to Omnium Nord Africain, S.A. The total sale price was 529,505,625 dirhams (approximately €48 million) and gave rise to a capital gain of €3.5 million.
In December 2003, Banco Sabadell, S.A. launched a tender offer for the shares of Banco Atlántico, S.A. at a price of €71.79 per share. The transaction was completed in March, 2004 and BBVA sold its entire 24.37% interest in Banco Atlántico, which gave rise to a capital gain of approximately €218 million.
2002
In the first quarter of 2002, BBVA sold 3.82% of its holding in Metrovacesa, S.A., giving rise to a capital gain of €14 million. In June 2002, BAMI, S.A. Inmobiliaria de Construcciones y Terrenos agreed to purchase BBVA’s 23.9% interest in the capital stock of Metrovacesa, S.A. for €545.4 million (€36.55 per share). This transaction closed on July 17, 2002. As a result of this sale, as of December 31, 2002, BBVA had a 0.58% interest in Metrovacesa, S.A. The transaction gave rise to a capital gain of approximately €361 million.
2001
In March 2001, BBVA sold its interest in Profuturo GNP, S.A. de C.V. Administradora de Fondos de Pensiones for $190 million.
B. Business Overview
BBVA is a highly diversified international financial group, with strengths in the traditional banking businesses of retail banking, asset management, private banking and wholesale banking. We also have a portfolio of industrial holdings in some of Spain’s leading companies.
Business Areas
Reorganization in 2003
In 2003, we reorganized our business areas with a view to optimizing the earnings and value-creation of each line of business and to more closely align our organizational structure with the manner in which management has been setting business strategy and monitoring our operating results. The principal features of the reorganization were the following: (i) our Retail Banking in Spain and Portugal area now includes retail banking, and asset management and private banking, (which had been included in a separate Asset Management and Private Banking business area in 2002) in Spain and Portugal, (ii) our Banking in America area now includes all of our Latin American operations, including our Mexican operations (which had been a separate business area in 2002) and asset management and private banking in Latin America (but excluding our operations in Argentina, which is a separate business area, and in Brazil, as discussed below) and (iii) as a result of our agreement to sell our entire interest in BBV Brasil in January 2003, and the closing of such sale in June 2003, our Corporate Activities and Other business area included our interest in BBV Brasil for the period January to June 2003, accounted for under the equity method, and for 2002 and 2001, accounted under full consolidation. Due to the special conditions that have affected our operations in Argentina in 2003, we have continued to provide additional disclosure on our Argentinean operations and discuss these operations as if they comprised a separate business area, “Argentina”, and not part of the business area “Banking in America”, where they were included in our Annual Report on Form 20-F for 2001 and prior years. See “Presentation of Financial Information—Accounting Principles”.
13
The following is a description of our business areas:
| | • | Retail Banking in Spain and Portugal: formed by BBVA’s retail banking, asset management and private banking businesses in Spain and Portugal, covering the residential customer and small and medium entities (“SME”) segments in these markets. This area also includes the Finanzia / Uno-e group (which specializes in the e-banking business, consumer financing and card product distribution), BBVA Portugal, our private banking businesses (other than international private banking), and our mutual and pension fund management and insurance businesses. |
| | • | Wholesale and Investment Banking: includes BBVA’s business activities with large companies and institutions through national and international corporate banking and institutional banking. In addition, this business area includes our trading businesses located in Spain, Europe and New York, our equity distribution and origination business and security deposit and custody service business, as well as part of our real estate business. |
| | • | Banking in America: includes the operations of each of our subsidiary banks in Latin America and their investee companies, including pension management companies and insurance companies, as well as our international private banking business. As described above, this business area includes our operations in Mexico and excludes our operations in Argentina. |
| | • | Corporate Activities and Other: includes our holdings in large industrial corporations and in financial entities, as well as the activities and results of our support units, such as the Assets and Liabilities Management Committee (ALCO). In addition, this business area includes our other operations or activities that, by their nature, cannot be assigned to another business area, such as country risk provisions and amortization of goodwill (except for goodwill relating to the holdings owned by the Business and Real Estate Projects unit, which is included in the Wholesale and Investment Banking business area). As described above, this area included the operations of BBV Brasil, until the closing of its sale in June 2003. |
| | • | Argentina: includes our subsidiaries Banco Francés and Grupo Consolidar. |
The foregoing description of our business areas is consistent with our current internal organization. The financial information for our business areas for the years 2003, 2002 and 2001 presented below has been prepared on a uniform basis to reflect the reorganization of our business areas in 2003 described above. Unless otherwise indicated, the financial information provided below for each business area does not reflect the elimination of transactions between companies within one business area or between different business areas, since we consider these transactions to be an integral part of each business area’s activities. For the presentation and discussion of our consolidated operating results in “Item 5—Operating and Financial Review and Prospects” and elsewhere in this Annual Report, however, such intra- and inter-business area transactions are eliminated and the eliminations are generally reflected in the operating results of the Corporate Activities and Other business area.
The following table provides net attributable profit information for our business areas for the years ended December 31, 2003, 2002 and 2001.
| | | | | | | | | | | | | | | | | | | | | | | | | | | |
| | | Net Attributable Profit/
(Loss)
| | | % of Subtotal
| | | % of Net Attributable
Profit/(Loss)
| |
| | | Year ended December 31,
| |
Business Area
| | 2003
| | | 2002
| | | 2001
| | | 2003
| | | 2002
| | | 2001
| | | 2003
| | | 2002
| | | 2001
| |
| | | (in millions of euro) | | | | | | | | | | | | | | | | | | | |
Retail Banking in Spain and Portugal | | 1,239 | | | 1,266 | | | 1,173 | | | 51 | % | | 53 | % | | 47 | % | | 56 | % | | 73 | % | | 63 | % |
Wholesale and Investment Banking | | 468 | | | 382 | | | 531 | | | 19 | % | | 16 | % | | 21 | % | | 21 | % | | 22 | % | | 29 | % |
Banking in America | | 715 | | | 736 | | | 807 | | | 30 | % | | 31 | % | | 32 | % | | 32 | % | | 43 | % | | 44 | % |
| | |
|
| |
|
| |
|
| |
|
| |
|
| |
|
| |
|
| |
|
| |
|
|
Subtotal | | 2,422 | | | 2,384 | | | 2,511 | | | 100 | % | | 100 | % | | 100 | % | | 109 | % | | 138 | % | | 136 | % |
| | |
|
| |
|
| |
|
| |
|
| |
|
| |
|
| |
|
| |
|
| |
|
|
Corporate Activities and Other | | (205 | ) | | (656 | ) | | (451 | ) | | | | | | | | | | | (9 | )% | | (38 | )% | | (24 | )% |
Argentina | | 10 | | | (9 | ) | | (217 | ) | | | | | | | | | | | — | | | — | | | (12 | )% |
| | |
|
| |
|
| |
|
| | | | | | | | | | |
|
| |
|
| |
|
|
Net attributable profit | | 2,227 | | | 1,719 | | | 1,843 | | | | | | | | | | | | 100 | % | | 100 | % | | 100 | % |
| | |
|
| |
|
| |
|
| | | | | | | | | | |
|
| |
|
| |
|
|
14
Retail Banking in Spain and Portugal
Lending in this business area as of December 31, 2003, was approximately €91,295 million, an increase of 13.9% from €80,152 million as of December 31, 2002, principally due to growth in mortgage lending.
The non-performing loan (“NPL”) ratio fell to 0.88% as of December 31, 2003, from 1.00% as of December 31, 2002. The loan coverage ratio rose to 271.1% as of December 31, 2003, from 220.8% as of December 31, 2002.
Customer deposits and marketable debt securities, which were €51,894 million as of December 31, 2003, decreased by 1.3%, principally due to the cancellation of an agreement to manage certain government accounts in January 2003. Mutual and pension funds under management were €49,334 million as of December 31, 2003, an increase of 12.2%, due to the launch of new funds during 2003.
The business area’s main lines of activity focused on implementing the Financial Services Plan, including the Personal, Commercial and Special Plans described below, which are the focus of the new business model launched by BBVA at the end of 2002. Significant progress was made in 2003 in the development of the three customer approach methods devised by this business area: (i) Personal Financial Services, aimed at residential customers, (ii) Commercial Financial Services, for SMEs and businesses and (iii) Special Financial Services, which are offered through Finanzia and Uno-e Bank.
| • | Personal Financial Services: focuses on retail customers and is aimed at customers getting more value out of their relationship with us by being offered a wider range of products and services at attractive prices made available through different channels, along with solutions tailored to their specific needs. |
| | — | As part of this strategy, 450 of our most significant branches and over 6,000 employees were reoriented toward a customer sales strategy consistent with our Personal Financial Services approach. Also in 2003, 150 of our most significant branches in Spain were physically refurbished to enhance their role as sales and customer services centers and increase the efficiency of their operations and differentiation of services based on customers requirements. |
| | — | Also as part of our Personal Financial Services approach, in 2003, BBVA reorganized its private banking business by integrating it into the newly restructured Asset Management and Private Banking unit of the Retail Banking Spain and Portugal business area. |
| • | Commercial Financial Services: focuses on professionals, businesses and SMEs and implementing business models and organizational changes channeled focused on improving BBVA’s market position and taking it closer to its customers. Specifically, progress is being made in the risk, human resources, organization, technology and systems, products and channels areas to ensure that the actions required to enable BBVA to implement its new, focused approach to the segment are performed in 2004. |
| • | Special Financial Services: focuses on financings related to capital goods, vehicles and consumer goods, on-line banking and remittances. A redefinition of this approach was completed after the merger of Finanzia and Uno-e in 2003. |
The business units included in the Retail Banking in Spain and Portugal business area are:
| | • | Commercial Banking in Spain |
| | • | Small and Medium Entities (SME) Banking |
| | • | Assets Management and Private Banking |
| | • | Special Financial Services |
| | • | Insurance Business in Europe |
15
Commercial Banking in Spain
The Commercial Banking in Spain unit makes the biggest contribution to the Retail Banking Spain and Portugal business area and accounts for 73% (80% in 2002) of the business area’s ordinary revenue, 78% (85% in 2002) of customer funds and 71% (72% in 2002) of lending. The Commercial Banking in Spain unit serves the residential, commercial and small business customer segments, providing specialist mortgage banking, personal banking and private banking, among other services.
In 2003, lending by the Commercial Banking in Spain unit increased significantly to €85.2 billion, an increase of 14.2% from €74.6 billion in 2002, principally due to strong growth in mortgage products. Mortgages, increased 20.2% in 2003 to €15,734 million, due to the wide range of mortgage products we offer, which include the first 30-year fixed-rate mortgage in the Spanish market, the Hipoteca Mix Dos Tramos. This product guarantees a fixed rate for the first five years and may include an interest rate cap to protect customers against severe interest rate increases.
Our SME financing business focused in 2003 on increasing leasing activity and, in addition, a significant effort was made to increase point-of-sales (“POS”) to generate increased fee revenue—13,250 new POS terminals (for credit card payments) were installed during the year.
To increase customer funds in 2003, we endeavored to increase the breadth and attractiveness of our products. One example was the Libreta Flexible, a deposit product that combines the simplicity of a traditional passbook account with guaranteed returns. As of December 31, 2003, the Libreta Flexible’s deposit balance was €2,353 million.
We also launched several new mutual fund products designed to provide investors with favorable returns in a rising stock market, but also afford them a level of investment protection during market declines. Two versions of our Extra 5 fund, which were launched in September, attracted more than €3.4 billion as of December 31, 2003. In 2003, we also launched a set of pension plan products under the brand name BBVA Protección. These plans are tailored to each customer’s needs and risk profile and attracted more than €800 million as of December 31, 2003.
By launching several innovative products, such as theTarjeta Diez (Ten card) and theTarjeta Infinite (Infinite card), BBVA was able to issue more than 7 million new credit cards in 2003. BBVA was also active in developing new means of payment, such as BBVA VIA T, for toll road payment, or the Mobipay service, which employs mobile telephony.
BBVA continued to focus on moving customers to alternative channels to accomplish their banking transactions and in 2003 the number of transactions performed at our branches decreased by approximately 20 million with 72% of such transactions being completed through alternative channels. In addition, telephone banking users increased by approximately 15% in 2003 and internet transactions increased by 29.2% to 77.5 million. BBVA was named, for the second consecutive year, the Best Consumer Internet Bank in Europe by Global Finance magazine.
Small and Medium Entities (SME) Banking
SME Banking, the second most significant unit in the Retail Banking in Spain and Portugal business area, in terms of both business volume and contribution to net attributable profit, specializes in the management of the SME segment in Spain. As of December 31, 2003, the SME Banking unit managed a loan portfolio of €20.5 billion and approximately €7 billion of customer deposits, with year-on-year growth of 14.5% and 12.2%, respectively. In addition, in 2003, our leasing, renting and confirming businesses saw year-on-year increases of 22.3%, 30.2% and 34.3%, respectively.
In 2003, we were the leading Spanish bank in issuing SME loans funded by the Instituto de Crédito Oficial (ICO), a Spanish government agency, with a market share of 19.7%, according to ICO statistics.
Regarding customer funds managed, we launched five new mutual funds targeted at SMEs and were successful in increasing funds captured by 40.6% to €765 million as of December 31, 2003.
Consistent with our strategy to increase use of alternative channels and, in particular, the Internet, we launched a new product, SIETE net, which along with our prior Internet products, BBVA net c@sh and BBVA net office, had as users over 42,000 companies, which transacted collections and payments worth €58 billion through this electronic channel, in 2003.
Asset Management and Private Banking
The Asset Management and Private Banking business unit consists of eight subunits that can be grouped together, by business activity, in three blocks:
| | • | Pensions, Asset Management, Global Administration and Savings Investment Services, which focus mainly on product generation; |
16
| | • | Personal Banking and BBVA Patrimonios, which have responsibility for the highest-income customer segment and |
| | • | Control and Business Development, which are support subunits. |
Total funds managed by the Asset Management and Private Banking unit as of December 31, 2003, were approximately €18 billion, an increase of 11.4% over 2002.
The Pension subunit’s assets under management as of December 31, 2003 were €12.2 billion, an increase of 10.7% over 2002, for more than 1,280,000 participants. More than €6.4 billion of such funds relate to individual pension plans and approximately €5.8 billion to corporate pension and similar plans.
With respect to private banking in Spain, the BBVA Patrimonios and Personal Banking subunits manage total funds of €12,105 million. BBVA Patrimonios focuses on high-net worth individuals (with financial assets of over €2 million) and manages funds of €6,315 million belonging to more than 1,000 customers. Personal Banking provides customized advisory services to our medium-to-high income customers. This subunit has more than 70,000 customers and total funds under management of €5,790 million as of December 31, 2003.
BBVA Portugal
In 2003, the BBVA Portugal unit’s customer loans increased by 7.6%, boosted by a 32.8% increase in mortgage lending, while the non-performing loan ratio fell to 0.65% as of December 31, 2003, from 0.91% as of December 31, 2002.
The BBVA Portugal unit’s funds under management increased by 3.9% in 2003 principally due to strong growth in mutual funds assets, which increased by 19.8% over 2002. In 2003, we launched three new mutual funds, including the first guaranteed fund to be marketed in Portugal, Extra 5 BBVA. Seven new types of structured deposit products were also launched in 2003.
Special Financial Services
The Special Financial Services unit is comprised of Finanzia, our on-line bank Uno-e Bank and Dinero Express. In June 2003, Uno-e Bank was acquired by the consumer finance division of our subsidiary Finanzia. As a result of this transaction, we increased our ownership in Uno-e Bank to 67%.
- Finanzia manages collaboration agreements with distributors, manufacturers and importers in order to finance their sales. Total net lending amounted to €2,169 million at December 31, 2003.
- Uno-e Bank had funds under management of €1,101 million as of December 31, 2003, principally due to growth in mutual funds assets, from €15 million to €52 million.
- Dinero Express provides fast remittance services for immigrants to send money from Spain to their home countries of Ecuador, Colombia, Peru, the Dominican Republic and Argentina, where it has more than 1,000 payment points.
Insurance Business in Europe
This unit engages in direct insurance and reinsurance and insurance broking in Spain and Portugal and markets its products mainly through BBVA’s branches. In January 2004, BBVA entered into an agreement to sell to AXA Aurora Iberica, S.A. de Seguros y Reaseguros its 50% holding in Hilo Direct, S.A. de Seguros y Reaseguros, although BBVA’s products will still be distributed through the BBVA network until mid 2007.
Wholesale and Investment Banking
The Wholesale and Investment Banking business area focuses on large corporate, governmental, non-governmental organizations and institutional investor clients.
The business units included in this business area are:
| | • | Global Corporate Banking; |
17
| | • | Global Markets and Distribution |
| | • | Business and Real Estate Projects and |
| | • | Global Transaction Services. |
Global Corporate Banking
The Global Corporate Banking unit was created in 2003 to strengthen BBVA’s relationship with its large Spanish and multi-national customers and take advantage of this customer segment’s high growth potential. The Global Corporate Banking unit is further subdivided into the following four subunits to manage its corporate banking activities: Corporate Banking Iberia, Corporate Banking Europe and Asia, Corporate Banking America and Global and Investment Banking. The Global Corporate Banking unit has branches in New York, London, Paris, Milan and Hong Kong.
Global Corporate Banking also includes the Capital Markets subunit which handles the unit’s syndicated loan and structured finance transaction activities. In 2003, the Capital Markets subunit was particularly active in designing and structuring leveraged finance transactions and project financings. Also in 2003, the Capital Markets subunit, in conjunction with the Global Markets and Distribution unit, acted as joint book runner in more than ten public offerings of fixed-income securities, including a €5 billion offering by the Kingdom of Spain and a €1 billion offering by Repsol, S.A. The Capital Markets subunit also participated in public offerings by John Deere, Altadis, Caminhos de Ferro and Enersis and private placement offerings for Ford Motor Credit, HSH Nordbank and Dexia, as well as over 20 euro medium term note program offerings, including for Volvo, Cadbury Schweppes, Portugal Telecom, Valeo and L’Oréal, for which BBVA acted as one of the dealers.
Global Corporate Banking’s Corporate Finance subunit is responsible for advising on mergers and acquisitions and providing general corporate advisory services.
Institutional Banking
The Institutional Banking unit focuses on governmental and institutional clients, including the Spanish government and the governments of Spain’s autonomous communities and private organizations, associations, foundations and insurance companies. This unit has a network of 42 branches in Spain, Portugal and Belgium.
In 2003, the Institutional Banking unit submitted bids for over 38 public contracts offered by the Spanish government. Among the new contracts awarded to the Institutional Banking unit were management of the Spanish Ministry of Defense’s treasury and payments departments, management of the payrolls of the Spanish Ministries of Justice, Finance and Public Authorities, the National Statistics Institute (INE) and of the National Employment Institute (INEM).
The Institutional Banking unit operates in these markets under the BBVA brand name and through Banco de Crédito Local (BCL), a BBVA subsidiary that specializes in long-term financing. To finance its lending activities, BCL has a euro commercial paper program for up to €1.5 billion and a euro medium-term note program and a fixed-income security program for €4 billion each. In 2003, BCL carried out the first-ever issue of public covered bonds in the euro market with the sale of €1.5 billion aggregate principal amount of fixed-income securities guaranteed by loans and credits granted by the issuer to the public sector.
Global Markets and Distribution
The Global Markets and Distribution unit focuses on a wide range of securities market-oriented activities. This business unit engages in both treasury operations on behalf of BBVA and transactions for third-parties, which, as of December 31, 2003, accounted for approximately 60% of the Global Markets and Distribution unit’s net attributable profit. In 2003, BBVA’s securities brokerage affiliate, BBVA Bolsa, S.A., was merged into the Global Markets and Distribution unit, broadening the range of products available to offer BBVA’s clients through this business unit.
In 2003, weak securities markets encouraged investors to purchase fixed-income and government debt securities. The Global Markets and Distribution unit also experienced strong activity in the securities lending business, foreign exchange transactions and interest rate-related products. In addition, the Global Markets and Distribution unit participates actively in the cross-selling of products and services with other BBVA business areas and units. For example, the Global Markets and Distribution unit has made fixed-income and equity security products, as well as mutual funds, available for marketing and sale through BBVA’s retail banking branch network.
18
The Global Markets and Distribution is particularly active in a number of securities and trading markets, including the AIAF fixed-income market, the Spanish stock market, the Spanish foreign exchange market for euro/U.S. dollar transactions and the Spanish government debt securities market.
Business and Real Estate Projects
The Business and Real Estate Projects unit manages a portfolio of 127 investments with a book value as of December 31, 2003 of €992 million and unrealized gains amounting to €749 million, which is an increase of €200 million compared to total unrealized gains as of December 31, 2002. Its investment portfolio is diversified among the real estate, capital goods and services sectors.
Divestitures from this investment portfolio in 2003 amounted to approximately €230 million, giving rise to capital gains of €100 million. The most significant disposition related to the sale by Corporación IBV, which is 50%-owned by BBVA, of its 6% interest in the capital stock of Gamesa Corporación Tecnológica, giving rise to a capital gain of €30 million. Following this transaction, Corporación IBV’s interest in Gamesa decreased to 31.8%.
In 2003, the Business and Real Estate Projects unit made investments totaling €140 million in 10 real estate development projects with approximately 700,000 m2 of buildable land and sold mature real estate projects with a total of 550,000 m2 of buildable land, giving rise to capital gains of approximately €70 million. As of December 31, 2003, the Business and Real Estate Projects unit’s real estate development portfolio consisted of 2.5 million m2 of buildable land and 4,000 dwellings under management, distributed among 44 projects.
Global Transaction Services
The Global Transaction Services unit was created in 2003 to manage BBVA’s corporate and institutional transaction business, which is global in scope and offers a wide range of products and services, including domestic and international collections and payments, loans, trade bill discounting, factoring, confirming, credit cards, foreign trade, electronic banking, correspondent banking and cash pooling systems services.
Banking in America
Because political and economic conditions in Argentina in the last several years had a significant negative effect on the entire Argentinean banking sector and have consequently severely affected the operating results of our Argentinean subsidiaries during this period, during 2002 and 2003, management evaluated and managed our Argentinean operations as if they comprised a separate business area and not part of the Banking in America business area where such operations would otherwise be included. Accordingly, our Argentinean subsidiaries’ operations are discussed under the separate business area, “Argentina”, and not as part of the Banking in America business area.
In addition, as a result of the reorganization of our business areas in 2003, the Banking in America business area now includes our Mexican operations, which had been included in a separate business area in 2002, and excludes our Brazilian operations, which were sold in June 2003. In this Annual Report, the operating results of our Brazilian operations have been included in the Corporate Activities and Other business area. See “Item 5. Operating and Financial Review and Prospects—Operating Results—Results of operations by business area”. Unless otherwise specified, information included below relating to macroeconomic data in the Latin American countries in which we operate, such as GDP or inflation, has been drawn from our internal statistical studies based on information published by local governmental or regulatory authorities.
Economic conditions in the Latin America countries in which we operate generally improved in 2003, with average growth in gross domestic product (GDP), excluding Argentina, of 1.0%, compared to 0.2% in 2002, according to our internal statistical studies. In addition, the average rate of inflation in the region declined to 6.3% in 2003, compared to 8.0% in 2002, according to our internal statistical studies. These positive macroeconomic developments, however, were offset by the sharp and widespread decrease in interest rates throughout Latin America and particularly in Mexico. In this context, BBVA sought to take advantage of rebounding economies by adapting its business strategies to the new interest rate levels, addressing each customer segment with individually tailored products and services, improving efficiency and reducing costs and intensifying overall risk management.
The Banking in America business area includes the banks, pension fund managers and insurance companies managed by BBVA in fourteen Latin American countries as well as our international private banking business, some of whose customers also come from this geographical area.
As of December 31, 2003, this business area had total assets of €73,778 million, which represented 25.7% of BBVA’s total assets, and, for the year 2003, net attributable profit of €715 million, which represented 32% of BBVA’s total net attributable profit.
19
Our Banking in America business activities are carried out through our subsidiaries in Mexico, Colombia, Chile, Panama, Paraguay, Peru, Puerto Rico, Uruguay and Venezuela, which in the aggregate had 2,950 branches in the region and 47,877 employees as of December 31, 2003.
Our Mexican operations form the core of our activities in Latin America and they contributed approximately two thirds of the Banking in America business area’s total assets, operating profit and pre-tax profit as of December 31, 2003. The three investment-grade countries in Latin America in which we operate, Mexico, Chile and Puerto Rico, represented approximately 80% and 70% of the Banking in America business area’s assets and net attributable profit, respectively, as of December 31, 2003.
The following is a description of our operations and the economic and political factors that most significantly affect such operations, on a country-by-country basis, in the Banking in America business area. The operating results described below refer to each individual unit’s contribution to the Banking in America business area’s operating results, unless otherwise stated.
Mexico
The slow recovery of the United States economy in 2003 had a negative impact on Mexico’s GDP, which grew by 1.1% in 2003, compared to 0.7% in 2002. Due to the low rate of inflation of 4.0%, market interest rates also remained very low by historical standards and decreased to 5.85% in 2003, compared to 7.11% in 2002. Low prevailing market interest rates resulted in an overall increase in lending in Mexico, though such lower rates reduced margins and therefore decreased Mexican banks’ net interest income for the year.
Our Mexican operations are conducted by Bancomer, which includes a commercial bank, investment bank, capital markets, insurance, pensions and other related operations. On January 30, 2004, our Board of Directors adopted a resolution to launch a tender offer for the approximated 40.6% of the shares of Bancomer which were not already owned by BBVA. The tender offer was launched on February 19, 2004 and expired on March 19, 2004. As a result of the successful completion of the tender offer and subsequent purchases amounting to 0.56% of Bancomer’s capital stock, at March 31, 2004, we owned 99.42% of Bancomer’s outstanding shares.
In 2003, Bancomer focused on improving productivity, reducing cost and expanding the range of products and services offered. In addition, an effort was made to decentralize many of the decisions previously made only in Bancomer’s central offices, such as relating to the approval of certain loans. Bancomer’s total lending in 2003 increased by 4.8% over 2002, which was sufficient for Bancomer to maintain its position as the Mexican market leader in lending, with a market share of 31.7% as of December 31, 2003, compared to 32.2% for 2002 (source:Sistema de Intercambio de Bancos, December 2003). The fastest growing loan category in 2003 was the consumer loan and credit card segment, which grew by 24.9% over 2002. In addition, the Creditón Nómina consumer loan was also a strong performer in 2003, increasing by approximately 40% over 2002 in terms of total credits granted.
Bancomer also focused on increasing the number of its credit card clients and in 2003 launched several new cards, including the Mini Bancomer card and the Cash Back card. As of December 31, 2003, Bancomer’s clients had opened up approximately 3.5 million credit card accounts, an increase of approximately 900,000 accounts over 2002. Bancomer also launched the Business Card in 2003, which is marketed to small and medium sized corporate clients and allows them to access their credit lines through the Internet, cash dispensers, point of sale terminals in commercial establishments or Bancomer branches.
Bancomer’s growth in lending was accompanied by its development of enhanced risk management mechanisms, such as a new system of credit scoring and fraud control, resulting in an improvement in overall loan quality. Bancomer’s NPL ratio decreased to 3.95% from 4.22% as of December 31, 2003 and December 31, 2002, respectively. As of December 31, 2003 the coverage ratio was 221.8%.
Bancomer is the leader in Mexico in terms of customer deposits, with a market share of 32.7%, compared to 31.8% as of December 31, 2002 (source:Sistema de Intercambio de Bancos,December 2003). To increase customer deposits, Bancomer focused on increasing the volume of lower-cost deposits, such as current accounts and savings accounts, which rose 19.5% despite the relatively low level of economic growth in Mexico. Two specific products were the focus of Bancomer’s drive to increase deposits; the Libretón, a highly successful savings product, and time deposits, which took advantage of the interest rate spread between bank promissory notes and treasury securities. Overall, customer deposits grew 13.7% in 2003, compared to 2002.
Bancomer had nearly 900,000 on-line banking customers who performed an average of more than 22 million transactions per month, and more than 750,000 telephone banking customers who generated more than 3.5 million calls per month in 2003. Bancomer Transfer Services (BTS) performed approximately 15 million money transfer transactions in 2003, an increase of 18.8% over 2002, in the amount of approximately US$6 billion, which was an increase of 16.8% over 2002.
20
As of December 31, 2003, Bancomer’s pension fund affiliate, Afore BBVA Bancomer, had 4.3 million plan participants and €6,007 million in assets under management.
Chile
In 2003, the macroeconomic situation in Chile was generally favorable and the country experienced GDP growth of 3.2%, compared to 3.0% in 2002. Favorable economic growth was due in part to low inflation and interest rates, which were cut by 50 basis points during the year to 2.25% as of December 31, 2003, and an increase in the price of copper, Chile’s main export. In addition, the Chilean government signed free trade agreements with the EU, the United States and South Korea, which reflects Chile’s strong relative economic position compared to that of its Latin American neighbors.
For BBVA Chile, 2003 was the second year of development and implementation of the New Stage strategic plan for the 2002-2005 period. The objective of this plan is to enhance BBVA Chile’s innovation and, consequently, growth in all market segments. Part of this plan calls for BBVA Chile to develop products and services that are tailored to individual customer’s needs, such as with products like BBVA Plus, a new type of time deposit paying monthly interest, the Hipotecón, the first peso-denominated mortgage loan not linked to inflation and the Hipotecón Cien, the first mortgage loan to finance the full value of the purchased property. BBVA Chile was also the first bank in Chile to offer euro-denominated current accounts and time deposits for the corporate customer segment.
In 2003, BBVA Chile experienced lending growth of 15.3%, which increased BBVA Chile’s market share in lending to 7.2%, compared to 6% in 2002 (source: theSupertintendencia Bancariaas of December 31, 2003).
BBVA’s Chilean pension fund manager affiliate, AFP Provida, had funds under management of €12,347 million as of December 31, 2003, an increase of 16.5%, compared to 2002. Provida’s market share in pension fund management was 31.7% as of December 31, 2003, according to theSuperintendencia de Administradoras de Fondos de Pensiones of Chile, with approximately 3 million pension fund participants. Consistent with the trend in the overall market, the number of demands for payment against Provida increased in 2003, resulting in a significant increase in Provida’s costs. This increase in costs, however, was offset by an increase in fees collected and higher returns from funds invested.
Colombia
The Colombian economy experienced stronger than expected growth in 2003, with an increase in GDP of 3.2%, lower inflation and record low interest rates. After several years of economic crisis, in this improved economic environment Colombia’s financial system made major progress both in terms of banking income, overall business activity and credit risk quality.
Our Colombian affiliate, BBVA Banco Ganadero (“Banco Ganadero”) had a strong 2003, due, in part, to the success of Plan Líder, under which Banco Ganadero focused on more profitable customer segments, improved the structure of its loans and deposits, cut back on its marginal low-profit businesses and increased the rate of recovery of past-due loans during the year. In 2003, Banco Ganadero’s deposits grew 21.6%, increasing its market share by 0.48% to 7.7%, while lending also increased 10.1%, which resulted in a 0.30% increase in market share to 7.0%, in each case compared to 2002 (source:Superintendencia Bancaria of Colombia, November 2003).
As of December 31, 2003, BBVA’s Colombian pension fund manager affiliate, BBVA Horizonte Pensiones y Cesantías, had the third-highest market share in “compulsory pensions,” which are pensions employers are required to establish for their employees, in terms of assets under management, with an 18.9% market share, and ranked second in number of plan participants (source:Superintendencia Bancaria of Colombia, December 2003). In January 2003, a pension reform law came into effect in Colombia. Under the law, the fees that Colombian pension fund managers are permitted to charge for managing compulsory pensions dropped from 1.5% to 1% of net asset value. This decrease in fees had a corresponding negative effect on BBVA Horizonte’s net attributable profit, which fell 25.9% compared to 2002.
BBVA has two affiliates in Colombia operating in the insurance sector: BBVA Ganadero Vida, which, in 2003, was awarded the contract to provide disability and survival insurance policies to BBVA Horizonte’s pension plan participants, and BBVA Ganadero Seguros Generales.
Panama
Panama’s economy recovered in the second half of 2003 after slow start in the first half of the year. For the year, Panamanian GDP grew by approximately 2.7% over 2002. In this economic context, BBVA maintained lending at 2002 levels, but focused on improving its position in the retail banking sector, where it achieved lending growth of 42%, compared to 2002.
21
BBVA operates in the Panamanian pension fund sector through its 90% interest in BBVA Horizonte and its 25% interest in Progreso, which manages SIACAP’s funds (the Government Employee Pension Capitalization and Savings System).
Paraguay
The most significant development in Paraguay’s economy in 2003 was the reduction in interest rates from 31% to 13%. As a result of this significant interest rate reduction, BBVA Paraguay focused on managing its net interest income, balancing management of its deposits with its lending policies.
BBVA Paraguay continued to focus on lending in the agriculture sector, which is the most significant component of Paraguay’s economy.
Peru
The Peruvian economy continued its steady growth in 2003 with GDP and inflation increasing 4.0% and 2.5%, respectively. In this economic context, our Peruvian affiliate, BBVA Banco Continental (“Banco Continental”) consolidated its position as the second-largest bank in Peru in terms of deposits and loans in 2003, with increases of 3.4% and 1.72% in market share to 23.8% and 17.6% in deposits and loans, respectively (source:Supertintendencia de Banca y Seguros of Peru, November 2003).
In 2003, Banco Continental was honored as the Best Bank in Peru for the second straight year by The Banker magazine, as Bank of the year in Peru by Latin Finance magazine and was ranked as the 16th best bank in Latin America by América Economía magazine.
BBVA operates in the Peruvian pension fund sector through AFP Horizonte, which had assets under management of €1,267 million, representing a 25.4% market share, as of December 31, 2003 (source:Supertintendencia de Banca y Seguros of Peru, December 2003).
Puerto Rico
The Puerto Rican economy, which is strongly tied to the United States economy, experienced sluggish growth in 2003, with GDP increasing only 1.6%. In addition, like in the United States, interest rates remained very low by historical standards.
Our Puerto Rican affiliate, BBVA Puerto Rico had a commercial network of 47 branches and 1,062 employees as of December 31, 2003. Notable developments in BBVA Puerto Rico’s operations in 2003 included a 7.1% increase in automobile financing, 19.2% increase in mortgage lending, due in part to the establishment of the BBVA Mortgage brand in 2002, and the success of the El Libretazo deposit product.
Uruguay
Uruguay experienced a financial crisis in 2002 and during the first quarter of 2003 economic instability persisted as the government negotiated with lenders regarding the terms of its foreign debt. A successful conclusion to this process in mid-2003 marked a decrease in interest rates and improvement in Uruguay’s country-risk rating. In addition, in 2003, Uruguayan international reserves and bank deposits increased compared to 2002, during which a significant reduction in capital and deposits had occurred.
In light of this difficult and uncertain economic climate, BBVA Uruguay refocused its strategy on higher margin sectors, such as wholesale and VIP banking. BBVA Uruguay also reduced its branch network from 17 to 8 and the number of employees by a third to 151. BBVA Uruguay also focused on overall liquidity in 2003, particularly in light of new minimum liquidity ratios required by the Uruguayan Central Bank, increasing deposits by 63.8%, compared to 2002. In an effort to increase fee revenue, BBVA Uruguay expanded the range of its products, such as the launch of Internet banking. BBVA Uruguay’s market share in lending and deposits grew in 2003 by 0.86% and 1.14% to 6.6% and 5.6%, respectively (source:Banco Central of Uruguay, September 2003).
22
Venezuela
The economic recession in Venezuela that began in 2002 continued in 2003 and GDP decreased during 2003 by 9.6%. One of the significant developments in Venezuela that contributed to economic instability and the lack of growth was the control of the foreign exchange market taken by the government, which resulted in the de facto closure of Venezuelan currency markets. The government’s restrictions on the acquisition of foreign currency resulted in a very significant increase in banking deposits and a 13% reduction in interest rates. With very limited demand for credit as a result of the overall decrease in economic activity, the increased deposits were invested by Venezuelan banks in public debt securities and certificates of deposit offered by the Central Bank.
In this political and economic context, BBVA’s Venezuelan affiliate, Banco Provincial, focused on five principal priorities: strict monitoring and control of risk, maintaining adequate liquidity levels, investing in certificates of deposit of the Central Bank, rather than public debt securities, reducing costs and increasing customer segmentation in order to tailor products and services to individual customer needs.
In 2003, Banco Provincial increased customer funds by 49.4%, increasing its market share by 1.20% to 15.4%, which was second among Venezuelan banks, as of December 31, 2003 (source:Supertintendencia Bancariaof Venezuela, December 2003). Due to the absence of demand for credit, Banco Provincial’s lending decreased in 2003, but the quality of its loan portfolio increased, with the NPL ratio decreasing to 5.02% as of December 31, 2003, compared to 7.44% as of December 31, 2002, and the coverage ratio increasing to 191.7% as of December 31, 2003, compared to 132% as of December 31, 2002.
Other countries
In El Salvador, BBVA operates in the pension fund sector through two affiliates: the pension fund manager BBVA Crecer, which had €584 million of assets under management, a 47.5% market share as of November 30, 2003, according to theSupertintendencia de Administradoras de Fondos de Pensiones of El Salvador, and the life insurance company BBVA Seguros de Personas, which provides life insurance services to clients of BBVA Crecer.
In Bolivia, as of December 31, 2003, the pension fund manager BBVA Previsión de Bolivia had €1,227 million of assets under management.
In 2003, a private pension system was created in the Dominican Republic and contributions were collected for the first time beginning in June. As of December 31, 2003, BBVA Crecer, BBVA’s Dominican Republic affiliate, was ranked third in terms of number of participants. In addition, in the last quarter of 2003, AFP Provida, our Chilean pension fund administrator affiliate, acquired Porvenir, a Dominican pension fund manager, which further strengthened BBVA’s position in the Dominican Republic.
International Private Banking
The International Private Banking unit focuses on providing investment advice and asset management services to high net worth individuals through several offices in Europe and America.
Total funds managed by this unit amounted to approximately €13.5 billion as of December 31, 2003, which was an increase of only 1.3% compared to 2002, principally due to slow growth in customer deposits and the depreciation of the dollar against the euro. In 2003, the International Private Banking unit continued to focus on customer segmentation in order to provide more customized products and services. In addition, during the year a website was launched enabling customers to access their account information on a real-time basis.
Corporate Activities and Other
The Corporate Activities and Other business area includes BBVA’s portfolio of strategic and financial investments, the Assets and Liabilities Management Committee (ALCO) and other BBVA units that cannot be assigned to any other business area. As described above, the operating results of our Corporate Activities and Other business area included the financial results of our interest in BBV Brasil from January 1 to January 9, 2004 and reflect the elimination of intra- and inter-business area transactions.
Assets and Liabilities Management Committee
The ALCO manages interest and exchange rate risks, wholesale financing and overall supervision of BBVA’s capital adequacy requirements. ALCO’s management of exchange rate risk in 2003 was particularly important in light of BBVA’s significant investments in Latin American and the sharp movements of Latin American currencies against the euro. ALCO’s hedging policy permitted BBVA to decrease the negative effect of exchange rate depreciation on reserves by €243 million at a cost of €21 million net of taxes. In addition, ALCO’s hedging policy contributed €42 million, net of taxes, to BBVA’s income from market operations in 2003.
23
ALCO also actively manages interest rate risk. As of December 31, 2003, BBVA’s portfolio of fixed-income assets, which is held to reduce the negative effect on BBVA’s net interest income of a fall in interest rates, amounted to €25,116 million. The portfolio generated €327 million of net interest income and €37 million of net trading income in 2003.
Large Industrial Corporations
The Large Industrial Corporations unit manages BBVA’s strategic investments in certain large industrial companies in the Spanish telecommunications and energy sectors. In 2003, this unit undertook €257 million of investments and divestments of €1,433 million, generating aggregate capital gains of €221 million. Most of the divestments in 2003 and early 2004 were intended to generate cash to finance part of the acquisition of the minority interest in Bancomer. The divestments also permitted the release of €615 million of regulatory capital. As of December 31, 2003, the market value of our large industrial corporations portfolio amounted to €4,146 million, with unrealized capital gains of €964 million.
Financial Holdings
The Financial Holdings unit manages BBVA’s financial investments. In the first half of 2003, BBVA sold its interest in Crédit Lyonnais in a tender offer by Crédit Agricole for all of Crédit Lyonnais’s outstanding shares. This transaction gave rise to a capital gain of €342 million. As a result of BBVA’s sale of its entire interest in its Brazilian affiliate, BBV Brasil, BBVA received a 4.44% interest in Bradesco, another Brazilian bank. This interest was subsequently increased to 5.0%. In March, 2004, BBVA sold its 24.4% interest in Banco Atlántico in a tender offer by Banco Sabadell for all of Banco Atlántico’s outstanding shares. The transaction gave rise to a €218 million capital gain.
Argentina
Because the political and economic conditions in Argentina in the last several years had a significant negative effect on the entire Argentinean banking sector and have consequently severely affected the operating results of our Argentinean banking, and, to a lesser extent, pension fund management operations during the period, management in 2003 and 2002 elected to separate the operating results of our Argentinean banking and pension fund management operations from the Banking in America and Asset Management and Private Banking areas, to which they were attributed in past years and manage them as part of a separate business area, Argentina.
Argentinean Financial Crisis
The government measures implemented in Argentina at the end of 2001 and during 2002 in response to the serious economic crisis afflicting the country included freezing public debt payments, ending convertibility between the Argentinean peso and US dollar, imposing cash withdrawal limits on sight and savings accounts (thecorralito) and re-scheduling of term deposit maturities (thecorralón). In addition, the Argentinean government decreed that dollar assets and liabilities would be converted to pesos at different exchange rates (“asymmetrical pessification”). This measure could have a severe impact on the solvency of the Argentinean banking system due to application of a lower exchange rate to certain loans converted to pesos compared with the exchange rate applied to deposits.
The Argentinean government issued public bonds to be used to compensate financial institutions for damage to their balance sheets caused by asymmetric pesification. Nevertheless, asymmetric pesification caused losses that were not fully offset by the government’s bond issuance programs. These losses resulted from, among other causes: (i) the difference between the free exchange rate at which foreign currency deposits were paid in performance of judicial decisions allowing depositors to withdraw their funds in excess of the amounts prescribed by law and the exchange rate at which they were converted into pesos (ARP1.40 = $1.00) and (ii) the application of a lower exchange rate to certain loans converted to pesos than to deposits.
Instead of alleviating banks’ liquidity situation, thecorralito triggered a rush by banking customers to withdraw the maximum amount of money authorized, which caused a continual drain on deposits. The drain began to alleviate in July 2002, enabling partial release in October of term deposits to ARP7,000 (rising to ARP10,000 in some banks such as Banco Francés) and all funds in sight accounts in December 2002. Customers were also given the opportunity to exchange re-scheduled deposits for bonds, an offer taken by 22% of customers (30% for Banco Francés).
In 2003, macroeconomic conditions in Latin America and Argentina improved, but significant uncertainty regarding the scope and pace of the recovery remained.
24
Measures Taken Regarding Our Investments in Argentina
In 2001, we took substantial provisions and write-downs totaling €1,354 million relating to our investments in, and exposure to, Argentina. This amount included provisions of €617 million relating to our entire investment in Argentina, bad debt provisions of €416 million, additional country risk provisions of €34 million, provisions of €92 million relating to the value of Argentine government bonds held by BBVA, a downward revision of €72 million related to the expected reduction in net income and reduced capital gains arising from companies we carry by the equity method and from our portfolio of financial investments and a write-down of €123 million of goodwill corresponding to our Argentine investments. In addition, in 2001 we took a charge to the reserves at consolidated companies (in retained earnings) line item in our Consolidated Balance Sheets of €683 million to account for the devaluation of the Argentine Peso from ARP1.0 per U.S.$1.00 to ARP1.7 to U.S.$1.00 (the opening rate following the closure of the Argentine foreign exchange market), as of December 31, 2001.
In 2002, we took an additional provision of €131 million in respect of securities issued by Banco Francés and held by us. This amount was charged to our 2002 Consolidated Statement of Income.
In April 2002, as a result of Banco Francés’s liquidity problems, BBVA loaned Banco Francés $79 million and made available to it credit lines of $56 million and $24 million, both of which were fully drawn down. The foregoing loan and credit lines were undertaken in order for BBVA to comply with commitments it had made in 1999 to ensure that Banco Francés continued to meet the Argentinean Central Bank’s liquidity requirements. These three transactions are secured by loans held by Banco Francés and guaranteed by the Argentinean government and by collection rights on syndicated loans and floating rate notes owned by Banco Francés.
In June 2002, Banco Francés agreed with the Argentinean government to increase its capital stock by $209.3 million. BBVA subscribed to Banco Francés’s capital increase in exchange for $130 million in subordinated debt of Banco Francés held by BBVA and the $79 million loan, described above, made to Banco Francés in April 2002. As a result of our additional investment, we received new shares of Banco Francés and recorded €34.7 million in goodwill in consolidation, resulting in an increase in our ownership interest in Banco Francés from 68.25% to 79.61%.
In May 2002, BBVA bought Banco Francés’s 60.88% interest in BBVA Uruguay for $55 million.
In July 2002, BBVA bought Argentinean government debt securities from Banco Francés under a repurchase agreement for €98.8 million.
In 2003, BBVA did not make any additional investments in, or provide any financial assistance to, its subsidiaries in Argentina.
As of December 31, 2003, our entire investment in and exposure to Argentina, including the investments and loans described above, were fully covered by the provisions we took in 2001 and 2002. See Note 3(o) to the Consolidated Financial Statements.
As of the date of filing of this Annual Report, BBVA has no further obligation to make capital available to Banco Francés to ensure that it meets its liquidity requirements or for any other reason.
We continue to carefully monitor the situation in Argentina and, in the event of positive improvements from the current situation, may in the future consider providing further liquidity to our Argentinean subsidiaries.
Evolution of Business
Following four years of recession, the Argentinean economy significantly improved in 2003 with an increase in GDP of approximately 8%, a reduction in inflation from 41.0% to 3.7% and an improvement in liquidity in the banking sector that led to a reduction in interest rates on 30-day deposits from 22% in April to less than 4% as of December 31, 2003. In the banking sector, overall deposits grew 19.6% compared to 2002, but loans to the private sector decreased by 11.4% as a result of continuing institutional and legal uncertainties regarding the direction of political and economic events in the country.
BBVA operates in Argentina through its banking affiliate, Banco Francés, and its pension fund and insurance affiliate, Grupo Consolidar. As a result of the crisis that has afflicted the Argentine banking sector in the past several years, and the resulting affect of such crisis on banks’ deposit and lending businesses, in 2003, Banco Francés’s management focused on increasing fee income. In this regard, Banco Francés sought to increase fee-generating products and services, such as regarding means of payment (particularly electronic means), insurance and credit and debit card transactions. Improving conditions in the second half of 2003 also permitted Banco Francés to modestly increase lending, focusing on very short-term financings, such as account advances, credit/debit card financings, check transfers and foreign trade transactions.
25
The most significant factor affecting Banco Francés’s operating results in 2003 continued to be a structural mismatch in terms of interest rates—the interest rates on its assets were linked to inflation or peso/dollar conversion rates far below market rates, while interest rates payable on deposits were linked to high market interest rates and market-based peso/dollar conversion rates. Accordingly, for much of 2003 while inflation remained low and deposit interest rates high, Banco Francés experienced a substantial decrease in net interest income. This trend was partially reversed in the second half of 2003 as a result of a decrease in deposit interest rates and an increase in fee income. Banco Francés also continued cutting costs in 2003 and reduced headcount by approximately 10%, or 400 employees. Despite the reduction in costs and an increase in fee income, however, the overall reduction in net interest income resulted in an operating loss, measured in local currency, in 2003. As a result of the provisions we took in 2002 and 2001 with respect to our investments in our subsidiaries in Argentina, however, Banco Francés’s operating loss in 2003 did not affect our consolidated net attributable profit in such year.
BBVA’s affiliate, Consolidar Group, operates in the Argentine pension fund sector and had more than 1.5 million participants and assets under management of €2,551 million, with a market share of 20.5%, as of November 30, 2003 (source:Superintendecia Administradora de Fondos de Jubilaciones y Pensiones, November 2003). For 2003, Consolidar Group’s net attributable profit was €13 million, €4 million of which related to the pension fund business and €9 million to the insurance business.
Supervision and Regulation
The Spanish government traditionally has been closely involved with the Spanish banking system, both as a direct participant through its ownership of the ICO and as a regulator retaining an important role in the regulation and supervision of financial institutions.
The Bank of Spain
The Bank of Spain was established in 1962 as a public law entity (entidad de derecho público) that operates as Spain’s autonomous central bank. In addition, it has the ability to function as a private bank. Except in its public functions, the Bank of Spain’s relations with third parties are governed by private law and its actions are subject to the civil and business law codes and regulations.
Until January 1, 1999, the Bank of Spain was also the sole entity responsible for implementing Spanish monetary policy. For a description of monetary policy since the introduction of the euro, see “—Monetary Policy—General” and “—New monetary policy in the EMU”.
Since January 1, 1999, the Bank of Spain has performed the following basic functions attributed to the European System of Central Banks (“ESCB”):
| | • | defining and implementing the ESCB’s monetary policy, with the principal aim of maintaining price stability across the euro area; |
| | • | conducting currency exchange operations consistent with the provisions of Article 109 of the Treaty on European Union (“EU Treaty”), and holding and managing the States’ official currency reserves; |
| | • | promoting the sound working of payment systems in the euro area and |
| | • | issuing legal tender banknotes. |
26
Recognizing the foregoing functions as a fully-fledged member of the Euroystem, theLey de Autonomía del Banco de España (the Bank of Spain Law of Autonomy) stipulates the performance of the following functions by the Bank of Spain:
| | • | holding and managing currency and precious metal reserves not transferred to the European Central Bank (“ECB”); |
| | • | supervising the solvency and behavior of credit institutions, other entities and financial markets, for which it has been assigned supervisory responsibility, in accordance with the provisions in force; |
| | • | promoting the sound working and stability of the financial system and, without prejudice to the functions of the ECB, of national payment systems; |
| | • | placing coins in circulation and the performance, on behalf of the State, of all such other functions entrusted to it in this connection; |
| | • | preparing and publishing statistics relating to its functions, and assisting the ECB in the compilation of the necessary statistical information; |
| | • | providing treasury services and acting as financial agent for government debt; |
| | • | advising the government, preparing the appropriate reports and studies; and |
| | • | exercising all other powers attributed to it by legislation. |
Subject to the rules and regulations issued by the Ministry of Economy, the Bank of Spain has the following supervisory powers over Spanish banks:
| | • | conducting periodic inspections of Spanish banks to evaluate a bank’s compliance with current regulations including the preparation of financial statements, account structure and credit policies; |
| | • | advising a bank’s board of directors and management on its dividend policy; |
| | • | undertaking extraordinary inspections of banks; and |
| | • | collaborating with other regulatory entities to impose penalties for infringement or violation of applicable regulations. |
Fondo de Garantía de Depósitos
TheFondo de Garantía de Depósitos en Establecimientos Bancarios (“FGD”), which operates under the guidance of the Bank of Spain, guarantees bank deposits up to €20,000 per customer, which is the minimum insured amount for all EU member banks. Pursuant to Bank of Spain regulations, the FGD may purchase doubtful loans or may acquire, recapitalize and sell banks that are experiencing difficulties.
The FGD is funded by annual contributions from member banks. The rate of such contributions in 2003 was 0.06% of the year-end amount of deposits to which the guarantee extended. Nevertheless, once the capital of the FGD exceeds its requirements, the Minister of Economy may reduce the member banks’ contributions and, when the FGD’s funds exceed the capital requirements by one percent or more of the member banks’ deposits, such contributions may be suspended.
In order to safeguard the stability of its members, the FGD may also receive contributions from the Bank of Spain. At December 31, 2003, all of the Spanish banks belonging to BBVA were members of the FGD and thus obligated to make annual contributions to it.
Fondo Garantía Inversores
Royal Decree 948 of August 3, 2001 regulates investor guarantee schemes related to both investment firms and to credit institutions. These schemes are set up through an investment guarantee fund for securities broker and broker-dealer firms and the deposit guarantee funds already in place for credit institutions. A series of specific regulations have also been enacted, defining the system for contributing to the funds.
27
The General Investment Guarantee Fund Management Company was created in a relatively short period of time and is a business corporation with capital in which all the fund members hold an interest. Member firms must make a joint annual contribution to the fund equal to 0.2% of their capital plus 0.01% of the securities that they hold on their client’s behalf. However, it is foreseen that these contributions may be reduced if the fund reaches a level considered to be sufficient.
Liquidity Ratio
In an effort to implement European monetary policy, effective January 1, 1999, the ECB and the national central banks of the member states of the European Monetary Union (“EMU”) adopted a regulation that requires banks to deposit an amount equal to two percent of their qualifying liabilities, as defined by the regulation, with the central bank of their home country. These deposits will earn an interest rate equal to the average interest rate of the ESCB. Qualifying liabilities for this purpose include:
| | • | debt securities issued; and |
| | • | monetary market instruments. |
Furthermore, the liquidity ratio is set at zero percent instead of two percent for those qualifying liabilities that have a maturity over two years and are sold under repurchase agreements.
Investment Ratio
In the past, the government used the investment ratio to allocate funds among specific sectors or investments. As part of the liberalization of the Spanish economy, it was gradually reduced to a rate of zero percent as of December 31, 1992. However, the law that established the ratio has not been abolished and the government could re-impose the ratio, subject to applicable EU requirements.
Capital Adequacy Requirements
As part of a program to modernize Spain’s banking regulations, capital adequacy requirements were revised in 1985 and, pursuant to EU directives, amended as of January 1, 1993. The capital adequacy requirements are applicable to BBVA on both a consolidated and individual basis.
The principal characteristics of the capital adequacy requirements pursuant to EU directives are a distinction between “core” and “complementary” capital and the adoption of a ratio of stockholders’ equity to risk-weighted assets. Core capital generally includes:
| | • | certain nonvoting equity, including certain nonvoting guaranteed preference shares of subsidiaries; |
| | • | most reserves and generic allowances; |
| | • | less participation in other financial institutions; and |
| | • | treasury stock and financing for the acquisition, by persons other than the issuer’s employees, of the issuer’s shares. |
Complementary capital generally includes certain nonvoting equity, revaluation and similar reserves, and subordinated and perpetual debt. The computation of both core and complementary capital is subject to provisions limiting the type of stockholding and the level of control which these stockholdings may give a banking group. The level of non-perpetual subordinated debt taken into account for the calculation of complementary capital may not exceed 50% of core capital. The total amount of complementary capital admissible for computing total capital may not exceed the total amount of core capital.
The consolidated total of core and complementary capital of a banking group calculated in the manner described above may not be less than eight percent of the group’s risk-weighted assets net of specified provisions and amortizations. The calculation of total risk-weighted assets applies minimum multipliers of 0%, 20%, 50% and 100% to the group’s assets. Countries with special loan
28
arrangements with the International Monetary Fund, which have not renegotiated their foreign debt in the five preceding years, receive a zero percent risk weight. Pursuant to Bank of Spain regulations, the following loans also receive a 0% risk weighting:
| | • | credits to Spanish governmental autonomous bodies, credits to Social Security, and credits to certain Spanish governmental public entities; |
| | • | certain debt securities related to the securitization of the Spanish Nuclear Moratorium; and |
| | (a) | the EU and the OECD countries’ governments or central banks, |
| | (b) | governments or central banks of countries with special loan agreements with the International Monetary Fund (provided such countries have not renegotiated their external debt in the five preceding years), or |
| | (c) | Spanish governmental public entities. Loans to autonomous communities, the EU and the OECD regional and local governments, banks, savings banks, brokerage firms and multilateral development banks receive at least a 20% weighting. Residential mortgage loans receive at least a 50% weighting. |
All other loans are weighted at 100%; however, such weighting may be lower if the loan is guaranteed or secured. Off-balance sheet assets are also included in the calculation of risk-weighted assets.
The computation of core capital is subject to reductions of capital in amounts equivalent to unrealized losses on investment securities that are not charged to income and are accounted for as assets under the caption “Asset Accrual Accounts”. See Note 16 to the Consolidated Financial Statements.
The Basel Committee on Banking Supervision (the “Basel Committee”), which includes the supervisory authorities of twelve major industrial countries, has adopted an international framework (the “Basel Accord”) for capital measurement and capital standards of banking institutions. The framework provides:
| | • | definitions for “Tier 1” (core) capital and “Tier 2” (supplemental) capital; |
| | • | a system for weighting assets and off balance sheet items according to credit risk; and |
| | • | a requirement that banks engaged in international operations maintain Tier 1 capital of at least 4% of risk-weighted assets and “total” capital, Tier 1 capital plus up to an equal amount of Tier 2 capital, of at least 8% of risk-weighted assets. |
Members of the Bank for International Settlements are preparing a new Basel capital accord (also known as Basel II) which, when finalized, will replace the Basel Accord.
As described above, the capital adequacy of Spanish banks is regulated by EU directives applicable to the Spanish banking system as well as to the banking systems of other EU member states. Certain EU member states are parties to the Basel Accord. Spain joined the Basel Accord on February 1, 2001. Each national authority that is a party to the Basel Accord has implemented it in a significantly different fashion. The capital requirements imposed by the Basel Accord are in many respects similar to those imposed by EU directives, Spanish law and the Bank of Spain.
Banks in EU countries are permitted to net the credit exposure arising from certain interest rate and foreign exchange-related derivative contracts (rather than include the entire notional amount of such contracts) in calculating their total risk-adjusted assets for purposes of calculating their capital adequacy ratios, provided that such derivative contracts are subject to regulatory limitations on total credit exposure and the relevant regulatory authorities approve the inclusion in risk-adjusted assets of such credit risks on a net basis.
Spanish banks are permitted to include the net credit exposure arising from interest rate and foreign exchange transactions related to derivative products provided the following conditions are met:
| | • | all derivative related transactions between the parties form a single agreement; |
29
| | • | the incumbent bank has submitted to the Bank of Spain two legal opinions with regard to the validity of the netting provisions; and |
| | • | the incumbent bank has implemented the appropriate procedures to revise the treatment of netting if there is an amendment of the regulations in force. |
In addition, the Bank of Spain may not accept the accounting treatment of netting if the conditions set forth above are not met or if the Bank of Spain does not concur with the legality or validity of the netting provisions.
Concentration of Risk
The Bank of Spain regulates the concentration of risk. Since January 1, 1999, any exposure to a person or group exceeding 10% of a group’s or bank’s regulatory capital has been deemed a concentration. The total amount of exposure represented by all of such concentrations may not exceed 800% of regulatory capital. Exposure to a single person or group may not exceed 25% (20% in the case of an affiliate) of a bank’s or group’s regulatory capital.
Legal and Other Restricted Reserves
We are subject to the legal and other restricted reserves requirements applicable to Spanish companies. Please see “—Capital Adequacy Requirements”. See Note 24 to the Consolidated Financial Statements.
Allowance for Possible Loan Losses
For a discussion of the Bank of Spain regulations relating to allowances for possible loan losses and country risk, see “—Selected Statistical Information—Assets—Loan Loss Reserve”.
Regulation of the Disclosure of Fees and Interest Rates
Interest rates on most kinds of loans and deposits are not subject to a maximum limit. Banks must publish their preferential rates, rates applied on overdrafts, and fees and commissions charged in connection with banking transactions. Banking clients must be provided with written disclosure adequate to permit customers to ascertain transaction costs. The foregoing regulations are enforced by the Bank of Spain in response to bank client complaints.
Law 44/2002 concerning measures to reform the Spanish financial system contained a new rule concerning the calculation of variable interest applicable to loans and credit secured by mortgages, bails, pledges or any other equivalent guarantee.
Employee Pension Plans
Under the relevant collective labor agreements, BBVA and some of its subsidiaries provide supplemental pension payments to certain active and retired employees and their beneficiaries. These payments supplement social security benefits from the Spanish state. See Note 3.j. to the Consolidated Financial Statements.
Dividends
If a bank meets the Bank of Spain’s minimum capital requirements described above under “—Capital Adequacy Requirements”, it may dedicate all of its net profits to the payment of dividends, although, in practice, banks consult with the Bank of Spain before declaring a dividend. We calculate that as of December 31, 2003, we had approximately €4.4 billion of unrestricted reserves in excess of applicable capital and reserve requirements available for the payment of dividends. Compliance with such requirements notwithstanding, the Bank of Spain may advise a bank against the payment of dividends on grounds of prudence. In no event may dividends be paid from non-distributable reserves. Banks which fail to comply with the capital adequacy ratio by more than 20% are required to devote all of their net profits to increasing their capital ratios. Banks which fail to meet the required ratio by 20% or less must obtain prior approval of the Bank of Spain to distribute any dividends and must devote at least 50% of net profits to increasing their capital ratios. In addition, banks, and their directors and executive officers, that do not comply with the liquidity and investment ratios and capital adequacy requirements may be subject to fines or other sanctions. Compliance with the Bank of Spain’s capital requirements is determined on both a consolidated and individual basis. BBVA’s Spanish subsidiaries are in compliance with these capital adequacy requirements on both a consolidated and individual basis. If a bank has no net profits, the board of directors may propose at the general meeting of the stockholders that a dividend be declared out of retained earnings.
30
The Bank of Spain recommends that interim dividends not exceed an amount equal to one-half of net attributable profit from the beginning of the corresponding fiscal year. No interim dividend may be declared when a bank does not meet the minimum capital requirements and, according to the recommendations of the Bank of Spain, interim dividends may not be declared until the Bank of Spain has sufficient knowledge with respect to the year’s profits. Although banks are not legally required to seek prior approval from the Bank of Spain before declaring interim dividends, the Bank of Spain has asked that banks consult with it on a voluntary basis before declaring interim dividends.
Limitations on Types of Business
Spanish banks are subject to certain limitations on the types of businesses in which they may engage directly, but they are subject to few limitations on the types of businesses in which they may engage indirectly.
Mortgage Legislation
Spanish law limits the prepayment penalties on floating rate mortgage loans and limits the notarial costs and registration fees charged to borrowers in connection with renegotiation of mortgage terms on fixed and floating rate mortgages.
Mutual Fund Regulation
Mutual funds in Spain are regulated by theDirección General del Tesoro y Política Financiera del Ministerio de Economía(the Ministry of the Economy) and by theComisión Nacional del Mercado de Valores (“CNMV”). All mutual funds and mutual fund management companies are required to be registered with the CNMV. Spanish mutual funds are subject to investment limits with respect to single sectors or companies and overall portfolio diversification minimums. In addition, periodic reports including a review of the fund’s performance and any material events affecting the fund are required to be distributed to the fund’s investors and filed with the CNMV.
U.S. Regulation
Banking Regulation
By virtue of our branch in New York, our agency in Miami and our ownership of a commercial bank in Puerto Rico, we are subject to the International Banking Act of 1978, as amended. Our commercial bank in Puerto Rico is insured by the Federal Deposit Insurance Corporation, which is its primary regulator. The International Banking Act imposes certain restrictions on the activities in which BBVA and its subsidiaries may engage in the United States and subjects us to supervision and regulation by the Board of Governors of the Federal Reserve System (the “Federal Reserve Board”). In addition, certain of our banking activities in the United States are subject to supervision by state banking authorities. We have two securities subsidiaries operating in New York and Puerto Rico, which are regulated by the SEC and the National Association of Securities Dealers.
On June 12, 2000, BBVA and its Miami and New York offices entered into an agreement (the “Written Agreement”) with the Federal Reserve Board. The Written Agreement required BBVA, on behalf of its U.S. offices, to establish programs designed to identify and report known or suspected criminal activity with respect to money laundering activities and to comply with rules and regulations related to anti-money laundering compliance. BBVA responded to the Written Agreement by enhancing its U.S. internal controls through its Office of the Country Manager, implementing improved compliance policies and procedures, transferring its U.S. private banking activities from its New York branch to its Miami agency, and adopting an enhanced customer due diligence program. These remedial actions were subject to examination by the Federal Reserve Bank of New York and the New York State Banking Department. On February 21, 2003, the Written Agreement was terminated.
U.S. Foreign Corrupt Practices Act
BBVA, as well as all other foreign private issuers with a class of securities registered pursuant to Section 12 of the U.S. Securities Exchange Act of 1934, is subject to the U.S. Foreign Corrupt Practices Act. This Act generally prohibits such issuers and their directors, officers, employees and agents from using any means or instrumentality of U.S. interstate commerce in furtherance of any offer or payment of money to any foreign official or political party for the purpose of influencing a decision of such person in order to obtain or retain business. It also requires that the issuer maintain books and records and a system of internal accounting controls sufficient to provide reasonable assurance that accountability of assets is maintained and accurate financial statements can be prepared. Penalties, fines and imprisonment can be imposed for violations of such Act.
31
Monetary Policy
General
On May 2, 1998, the EU established the bilateral conversion rates among the member countries that make up the EMU, and on December 31, 1998 the EU established the irrevocable conversion rates between the euro and each of the member countries of the EMU. The exchange rate in Spain was fixed at 166.386 pesetas per euro.
Monetary policy within the 12 members of the euro zone is set by the ECB. The ECB has itself set the objective of containing inflation and will adjust interest rates in line with this policy. It has further declared that it will not set an exchange rate target for new currency.
As of January 1, 1999, the euro became the national currency of the Spanish monetary system, replacing the peseta. However, the peseta was used as a unit of account in any judicial/legal instrument as a fraction of the euro and according to the exchange rate during the transitory period (from January 1, 1999 through December 31, 2001).
On January 1, 1999, the monetary system adopted the euro exclusively as a unit of account. From this date through February 28, 2002, the Bank of Spain, commercial banks, savings banks and credit co-operatives exchanged pesetas into euro free of charge but did not exchange euro into pesetas. Beginning July 1, 2002, only the Bank of Spain was able to perform this exchange, as determined by the Ministry of the Economy.
As of January 1, 2002, all legal instruments that were not denominated in euro during the transitory period were understood to be expressed in the euro unit of account, subject to the established conversion and rounding procedure.
New monetary policy in the EMU
The integration of Spain into the EMU on January 1, 1999 implied the yielding of monetary policy sovereignty to the ESCB. The ESCB is composed of the ECB and the national central banks of the 12 member countries that form the EMU.
The ESCB determines and executes the single monetary policy of the 12 member countries of the EMU. The ESCB collaborates with the central banks of member countries to take advantage of the experience of the central banks in each of its national markets. The basic tasks to be carried out by the ESCB include:
| | • | defining and implementing the single monetary policy of the EU; |
| | • | conducting foreign exchange operations in accordance with the set exchange policy; |
| | • | holding and managing the official foreign reserves of the member states; and |
| | • | promoting the smooth operation of the payment systems. |
In addition, the EU Treaty establishes a series of rules designed to safeguard the independence of the system, in its institutional as well as in its administrative functions.
Law Reforming the Spanish Financial System
On November 22, 2002, the Spanish government approved theLey de Medidas de Reforma del Sistema Financiero (“Law 44/2002”), which amended, among others, the Spanish Securities Markets Act of 1988 (the “Securities Markets Act”), the Credit Entities Discipline and Intervention Law and Private Insurance law. Law 44/2002 affects the following matters: market transparency (concept of privileged information); accounting practices of companies (in particular, independence and reliability of external audits and creation of audit committees for every listed company); systems and risk coverage (promotion of the integration of various existing entry settlement systems into one); securitization (assignment of credit rights against public administration within a period before the bankruptcy of the companies, mortgage transfer certificates, territorial bonds, etc.); electronic money (definition and issuance); pre-emptive rights; collective investment schemes (merger of collective investments schemes and guarantees and security interest); venture capital (investments in its group companies, etc.); ring-fencing transactions (extending protection against bankruptcy to some special financial master transactions and OTC transactions); savings banks (legal regime ofcuotas participativas, or participating shares) and other rules concerning the disciplinary regime for listed companies.
32
New Law Reforming the Spanish Financial System
On June 18, 2003, the Spanish Government approved theLey de Transparencia(“Law 26/2003”), modifying both the Spanish Securities Markets Act and Law 22/2003, to reinforce the transparency of information regarding listed Spanish companies. This law adds a new chapter, Title X, to the Securities Markets Act, which (i) requires disclosure of shareholder agreements relating to listed companies, (ii) regulates the operation of the general shareholders’ meetings and of the boards of directors of listed companies, (iii) requires the publication of an annual report of corporate governance and (iv) establishes measures designed to increase the availability of information to shareholders.
In addition, this law amends theLey de Sociedades Anonimas (the “Corporate Law”), and requires: (i) offering to shareholders the possibility of exercising voting rights directly or remotely by delegation, so long as the identity of the person who exercises the vote can be properly guaranteed, (ii) an increase in the information that shareholders have the right to obtain from the company and (iii) that existing regulation of the duties and responsibilities of directors be expanded.
C. Organizational Structure
Below is a simplified organizational chart of BBVA’s significant subsidiaries as of April 30, 2004. An additional 400 companies are domiciled in the following countries: Germany, Brazil, Belgium, Costa Rica, Cuba, Chile, Ecuador, Bolivia, El Salvador, Spain, France, Netherlands, Ireland, Italy, Luxembourg, Morocco, Mexico, United Kingdom, Switzerland, United States, Canada, Panama, Paraguay, the Dominican Republic and Uruguay.
| | | | | | | | | | | |
Subsidiary
| | Country of
Incorporation
| | Activity
| | BBVA Voting
Power
| | BBVA
Ownership
| | Total
Assets
| |
| | | | | | | (percent) | | (in millions
of euro) | |
Administradora de Fondos Para el Retiro-Bancomer, S.A. de C.V. | | Mexico | | Financial services | | 100.00 | | 97.068 | | 514 | |
Administradora de Fondos de Pensiones Provida | | Chile | | Financial services | | 64.32 | | 64.32 | | 243 | |
Banc Internacional D’Andorra, S.A. | | Andorra | | Bank | | 51.00 | | 51.00 | | 2,359 | |
Banco Bilbao Vizcaya Argentaria (Portugal), S.A. | | Portugal | | Bank | | 100.00 | | 100.00 | | 3,503 | |
Banco Bilbao Vizcaya Argentaria Puerto Rico, S.A. | | Puerto Rico | | Bank | | 100.00 | | 100.00 | | 4,404 | |
Banco Continental, S.A. | | Peru | | Bank | | 92.04 | | 46.02 | | 3,123 | |
Banco de Crédito Local, S.A. | | Spain | | Bank | | 100.00 | | 100.00 | | 11,711 | |
Banco Provincial S.A.—Banco Universal | | Venezuela | | Bank | | 55.60 | | 55.60 | | 3,004 | |
BBVA Chile, S.A. | | Chile | | Bank | | 66.27 | | 66.27 | | 4,739 | |
BBVA Banco Francés, S.A. | | Argentina | | Bank | | 79.67 | | 79.65 | | 3,916 | |
BBVA Banco Ganadero, S.A. | | Colombia | | Bank | | 95.37 | | 95.37 | | 2,171 | |
Grupo Financiero BBVA Bancomer, S.A. de C.V. | | Mexico | | Bank | | 99.66 | | 99.66 | | 4,066 | |
BBVA Privanza Bank (Switzerland) Ltd. | | Switzerland | | Bank | | 100.00 | | 100.00 | | 636 | |
BBVA Privanza Bank (Jersey) Ltd. | | Channel Islands | | Bank | | 100.00 | | 100.00 | | 285 | |
BBVA Seguros, S.A. | | Spain | | Insurance | | 99.93 | | 99.93 | | 9,961 | (*) |
Consolidar A.F.J.P., S.A. | | Argentina | | Financial services | | 100.00 | | 89.03 | | 158 | |
Finanzia, Banco de Credito, S.A. | | Spain | | Bank | | 100.00 | | 100.00 | | 1,854 | |
Uno-e Bank, S.A. | | Spain | | Bank | | 67.00 | | 67.00 | | 745 | |
33
D. Property, Plants and Equipment
We own and rent a substantial network of properties in Spain and abroad, including 3,371 branch offices in Spain and, principally through our various affiliates, 3,553 branch offices abroad at December 31, 2003. Approximately 46% of these properties are rented in Spain from third parties pursuant to short-term leases that may be renewed by mutual agreement. The remaining properties, including most of our major branches and our headquarters, are owned by us.
E. Selected Statistical Information
The following is a presentation of selected statistical information for the periods indicated. Where required under Industry Guide 3, we have provided such selected statistical information separately for our domestic and foreign activities, pursuant to our calculation that our foreign operations are significant according to Rule 9-05 of Regulation S-X.
Average Balances and Rates
The tables below set forth selected statistical information on our average balance sheets, which are based on the beginning and month-end balances in each year. We do not believe that monthly averages present trends materially different from those that would be presented by daily averages. Interest income figures, when used, include interest income on non-accruing loans to the extent that cash payments have been received. Loan fees are included in the computation of interest revenue.
| | | | | | | | | | | | | | | | | | | | | | | | | | | |
| | | Average Balance Sheet—Assets and Interest from Earning Assets
| |
| | | 2003
| | | 2002
| | | 2001
| |
| | | Average
Balance
| | | Interest
| | | Average
Yield (1)
| | | Average
Balance
| | | Interest
| | | Average
Yield (1)
| | | Average
Balance
| | | Interest
| | | Average
Yield (1)
| |
| | | (in millions of euro, except percentages) | |
Assets | | �� | | | | | | | | | | | | | | | | | | | | | | | | | |
Credit entities | | 28,777 | | | 1,156 | | | 4.0 | % | | 27,220 | | | 1,429 | | | 5.3 | % | | 38,869 | | | 2,266 | | | 5.83 | % |
In euro | | 10,479 | | | 222 | | | 2.1 | % | | 9,511 | | | 256 | | | 2.7 | % | | 18,947 | | | 634 | | | 3.34 | % |
In other currencies | | 18,298 | | | 934 | | | 5.1 | % | | 17,709 | | | 1,173 | | | 6.6 | % | | 19,922 | | | 1,632 | | | 8.19 | % |
Lending | | 147,915 | | | 8,015 | | | 5.4 | % | | 148,074 | | | 10,956 | | | 7.4 | % | | 145,288 | | | 11,945 | | | 8.22 | % |
In euro (5) | | 114,121 | | | 5,185 | | | 4.5 | % | | 102,907 | | | 5,489 | | | 5.3 | % | | 93,973 | | | 5,752 | | | 6.12 | % |
Government and other agencies | | 12,470 | | | 396 | | | 3.2 | % | | 12,574 | | | 495 | | | 3.9 | % | | 11,442 | | | 537 | | | 4.7 | % |
Commercial loans (2) | | 7,363 | | | 336 | | | 4.6 | % | | 6,851 | | | 379 | | | 5.5 | % | | 6,441 | | | 426 | | | 6.6 | % |
Secured loans (3) | | 48,654 | | | 2,111 | | | 4.3 | % | | 41,862 | | | 2,146 | | | 5.1 | % | | 36,751 | | | 2,134 | | | 5.8 | % |
Others (4) | | 45,634 | | | 2,341 | | | 5.1 | % | | 41,620 | | | 2,469 | | | 5.9 | % | | 39,366 | | | 2,655 | | | 6.7 | % |
In other currencies (6) | | 33,794 | | | 2,831 | | | 8.4 | % | | 45,167 | | | 5,467 | | | 12.1 | % | | 51,315 | | | 6,193 | | | 12.07 | % |
Secured loans | | 9,547 | | | 599 | | | 6.3 | % | | 12,974 | | | 878 | | | 6.8 | % | | 15,200 | | | 1,166 | | | 7.7 | % |
Others | | 24,247 | | | 2,231 | | | 9.2 | % | | 32,193 | | | 4,589 | | | 14.3 | % | | 36,116 | | | 5,027 | | | 13.9 | % |
Securities portfolio | | 77,852 | | | 3,788 | | | 4.9 | % | | 85,951 | | | 5,179 | | | 6.0 | % | | 93,467 | | | 7,778 | | | 8.32 | % |
Fixed income securities | | 68,172 | | | 3,324 | | | 4.9 | % | | 75,561 | | | 4,821 | | | 6.4 | % | | 81,820 | | | 7,283 | | | 8.91 | % |
In euro | | 40,220 | | | 1,321 | | | 3.3 | % | | 40,447 | | | 1,706 | | | 4.2 | % | | 38,240 | | | 1,984 | | | 5.2 | % |
In other currencies | | 27,952 | | | 2,002 | | | 7.2 | % | | 35,114 | | | 3,115 | | | 8.9 | % | | 43,580 | | | 5,299 | | | 12.16 | % |
Equity securities | | 9,680 | | | 464 | | | 4.8 | % | | 10,3989 | | | 358 | | | 3.4 | % | | 11,647 | | | 495 | | | 4.25 | % |
Holdings of companies carried by the equity method | | 6,814 | | | 319 | | | 4.7 | % | | 7,100 | | | 244 | | | 3.4 | % | | 8,549 | | | 379 | | | 4.44 | % |
Other holdings | | 2,866 | | | 145 | | | 5.1 | % | | 3,290 | | | 114 | | | 3.5 | % | | 3,098 | | | 116 | | | 3.75 | % |
Other financial income | | — | | | 43 | | | — | | | — | | | 27 | | | — | | | — | | | 114 | | | — | |
Non-earning assets | | 24,701 | | | — | | | — | | | 27,468 | | | — | | | — | | | 25,038 | | | — | | | — | |
| | |
|
| | | | | | | |
|
| |
|
| | | | |
|
| |
|
| | | |
Total average assets | | 279,245 | | | 13,002 | | | 4.7 | % | | 288,712 | | | 17,591 | | | 6.1 | % | | 302,662 | | | 22,103 | | | 7.31 | % |
| | |
|
| |
|
| | | | |
|
| |
|
| | | | |
|
| |
|
| | | |
Total euro assets/ total assets | | 71.34 | % | | 55.65 | % | | — | | | 66.06 | % | | 44.39 | % | | — | | | 62.06 | % | | 40.11 | % | | — | |
34
| (1) | Rates have been presented on a non-taxable equivalent basis. |
| (2) | Principally short-term lending to companies and businesses. |
| (3) | Principally mortgages loans. |
| (4) | Principally other loans to individuals and companies and consumer loans. |
| (5) | Amounts reflected in euro correspond to predominantly domestic activities. |
| (6) | Amounts reflected in other currencies correspond to predominantly foreign activities. |
| | | | | | | | | | | | | | | | | | | | | |
| | | Average Balance Sheet—Liabilities and Interest paid on Interest Bearing Liabilities
| |
| | | 2003
| | | 2002
| | | 2001
| |
| | | Average
Balance
| | Interest
| | Average
Rate (1)
| | | Average
Balance
| | Interest
| | Average
Rate (1)
| | | Average
Balance
| | Interest
| | Average
Rate (1)
| |
| | | (in millions of euro, except percentages) | |
Liabilities | | | | | | | | | | | | | | | | | | | | | |
Credit entities | | 55,061 | | 1,809 | | 3.3 | % | | 59,940 | | 2,720 | | 4.5 | % | | 68,320 | | 3,775 | | 5.53 | % |
In euro | | 33,407 | | 818 | | 2.4 | % | | 32,824 | | 1,146 | | 3.5 | % | | 35,448 | | 1,659 | | 4.68 | % |
In other currencies | | 21,654 | | 992 | | 4.6 | % | | 27,116 | | 1,574 | | 5.8 | % | | 32,872 | | 2,116 | | 6.44 | % |
Customer funds | | 181,977 | | 4,282 | | 2.4 | % | | 185,470 | | 6,860 | | 3.7 | % | | 190,505 | | 9,201 | | 4.83 | % |
Customer deposits | | 142,279 | | 3,068 | | 2.2 | % | | 151,850 | | 5,457 | | 3.6 | % | | 158,083 | | 7,581 | | 4.80 | % |
In euro (2) | | 84,868 | | 1,316 | | 1.6 | % | | 82,115 | | 1,802 | | 2.2 | % | | 76,729 | | 2,001 | | 2.61 | % |
Government and other agencies | | 3,459 | | 57 | | 1.6 | % | | 5,911 | | 168 | | 2.8 | % | | 6,171 | | 200 | | 3.6 | % |
Current accounts | | 23,079 | | 219 | | 0.9 | % | | 22,248 | | 294 | | 1.3 | % | | 20,064 | | 294 | | 1.5 | % |
Savings accounts | | 16,117 | | 90 | | 0.6 | % | | 14,694 | | 69 | | 0.58 | % | | 13,330 | | 79 | | 0.6 | % |
Time accounts | | 26,757 | | 681 | | 2.5 | % | | 24,670 | | 807 | | 3.3 | % | | 24,496 | | 945 | | 3.9 | % |
Others | | 15,456 | | 270 | | 1.7 | % | | 14,592 | | 463 | | 3.2 | % | | 12,632 | | 462 | | 3.7 | % |
In other currencies (3) | | 57,411 | | 1,752 | | 3.1 | % | | 69,735 | | 3,655 | | 5.2 | % | | 81,354 | | 5,580 | | 6.86 | % |
Current accounts | | 13,147 | | 120 | | 0.9 | % | | 15,769 | | 255 | | 1.6 | % | | 17,448 | | 368 | | 2.1 | % |
Savings accounts | | 6,263 | | 96 | | 1.5 | % | | 7,511 | | 122 | | 1.6 | % | | 7,827 | | 192 | | 2.4 | % |
Time accounts | | 32,061 | | 1,272 | | 4.0 | % | | 37,841 | | 2,314 | | 6.1 | % | | 50,169 | | 3,986 | | 7.9 | % |
Others | | 5,939 | | 263 | | 4.4 | % | | 8,615 | | 964 | | 11.2 | % | | 5,909 | | 1,035 | | 17.5 | % |
Debt securities and other marketable securities | | 39,698 | | 1,214 | | 3.1 | % | | 33,620 | | 1,404 | | 4.2 | % | | 32,422 | | 1,620 | | 5.00 | % |
In euro | | 33,864 | | 974 | | 2.9 | % | | 24,341 | | 936 | | 3.8 | % | | 21,410 | | 838 | | 3.91 | % |
In other currencies | | 5,834 | | 241 | | 4.1 | % | | 9,279 | | 468 | | 5.0 | % | | 11,012 | | 782 | | 7.10 | % |
35
| | | | | | | | | | | | | | | | | | | | | | | | | | | |
| | | Average Balance Sheet— Liabilities and Interest paid on Interest Bearing Liabilities
| |
| | | 2003
| | | 2002
| | | 2001
| |
| | | Average
Balance
| | | Interest
| | | Average
Rate (1)
| | | Average
Balance
| | | Interest
| | | Average
Rate (1)
| | | Average
Balance
| | | Interest
| | | Average
Rate (1)
| |
| | | | | | | | | | | | (in millions of euro, except percentages) | | | | | | | | | | |
Other financial costs | | — | | | 168 | | | — | | | — | | | 203 | | | — | | | — | | | 303 | | | — | |
Non-interest-bearing liabilities | | 42,207 | | | — | | | — | | | 43,303 | | | — | | | — | | | 43,837 | | | — | | | — | |
Shareholders’ funds | | 12,069 | | | — | | | — | | | 12,531 | | | — | | | — | | | 13,201 | | | — | | | — | |
Other funds without cost | | 30,138 | | | — | | | — | | | 30,772 | | | — | | | — | | | 30,636 | | | — | | | — | |
| | |
|
| |
|
| | | | |
|
| |
|
| | | | |
|
| |
|
| | | |
Total average liabilities | | 279,245 | | | 6,260 | | | 2.2 | % | | 288,712 | | | 9,784 | | | 3.4 | % | | 302,662 | | | 13,279 | | | 4.39 | % |
| | |
|
| |
|
| | | | |
|
| |
|
| | | | |
|
| |
|
| | | |
Total euro liabilities/total liabilities | | 69.60 | % | | 52.33 | % | | — | | | 63.24 | % | | 41.77 | % | | — | | | 58.62 | % | | 36.15 | % | | — | |
| (1) | Rates have been presented on a non-taxable equivalent basis. |
| (2) | Amounts reflected in euro correspond to predominantly domestic activities. |
| (3) | Amounts reflected in other currencies correspond to predominantly foreign activities. |
Changes in Net Interest Income-Volume and Rate Analysis
The following table allocates changes in our net interest income between changes in volume and changes in rate for 2003 compared to 2002, and 2002 compared to 2001. Volume and rate variance have been calculated based on movements in average balances over the period and changes in interest rates on average interest-earning assets and average interest-bearing liabilities. The only out-of-period items and adjustments excluded from the following table are interest payments on loans which are made in a period other than the period during which they are due. Loan fees were included in the computation of interest income.
| | | | | | | | | | | | | | | | | | |
| | | 2003/2002
| | | 2002/2001
| |
| | | Increase (Decrease) Due to
changes in
| | | Increase (Decrease) Due to
changes in
| |
| | | Volume (2)
| | | Rate (1)(2)
| | | Net
Change
| | | Volume (2)
| | | Rate (1)(2)
| | | Net
Change
| |
| | | (in millions of euro) | |
Interest income | | | | | | | | | | | | | | | | | | |
Credit entities | | 65 | | | (338 | ) | | (273 | ) | | (497 | ) | | (339 | ) | | (836 | ) |
In euro | | 26 | | | (60 | ) | | (34 | ) | | (316 | ) | | (62 | ) | | (378 | ) |
In other currencies | | 39 | | | (278 | ) | | (239 | ) | | (181 | ) | | (277 | ) | | (459 | ) |
Lending | | (754 | ) | | (2,187 | ) | | (2,941 | ) | | (186 | ) | | (804 | ) | | (989 | ) |
In euro | | 610 | | | (914 | ) | | (304 | ) | | 531 | | | (795 | ) | | (264 | ) |
Government and other Agencies | | (4 | ) | | (95 | ) | | (99 | ) | | 53 | | | (96 | ) | | (43 | ) |
Commercial Loans | | 28 | | | (71 | ) | | (42 | ) | | 29 | | | (77 | ) | | (48 | ) |
Secured loans | | 348 | | | (383 | ) | | (35 | ) | | 297 | | | (285 | ) | | 12 | |
Others | | 238 | | | (366 | ) | | (128 | ) | | 152 | | | (338 | ) | | (185 | ) |
In other currencies | | (1,365 | ) | | (1,272 | ) | | (2,637 | ) | | (717 | ) | | (9 | ) | | (725 | ) |
Secured Loans | | (232 | ) | | (47 | ) | | (279 | ) | | (171 | ) | | (117 | ) | | (287 | ) |
Other | | (1,133 | ) | | (1,225 | ) | | (2,358 | ) | | (546 | ) | | 108 | | | (438 | ) |
Securities portfolio | | (669 | ) | | (722 | ) | | (1,391 | ) | | (972 | ) | | (1,628 | ) | | (2,600 | ) |
Fixed income securities | | (645 | ) | | (852 | ) | | (1,497 | ) | | (915 | ) | | (1,548 | ) | | (2,463 | ) |
In euro | | (10 | ) | | (375 | ) | | (385 | ) | | 115 | | | (393 | ) | | (278 | ) |
In other currencies | | (635 | ) | | (477 | ) | | (1,112 | ) | | (1,030 | ) | | (1,155 | ) | | (2,184 | ) |
Equity securities | | (24 | ) | | 131 | | | 106 | | | (57 | ) | | (80 | ) | | (137 | ) |
Holdings in companies carried by the equity method | | (10 | ) | | 85 | | | 75 | | | (64 | ) | | (71 | ) | | (135 | ) |
Other holdings | | (15 | ) | | 46 | | | 31 | | | 7 | | | (10 | ) | | (2 | ) |
Other assets | | (3 | ) | | 18 | | | 16 | | | 11 | | | (98 | ) | | (87 | ) |
| | |
|
| |
|
| |
|
| |
|
| |
|
| |
|
|
Total assets | | (1,361 | ) | | (3,228 | ) | | (4,589 | ) | | (1,644 | ) | | (2,869 | ) | | (4,513 | ) |
| | |
|
| |
|
| |
|
| |
|
| |
|
| |
|
|
Interest expense | | | | | | | | | | | | | | | | | | |
| | | | | | |
Credit entities | | (297 | ) | | (614 | ) | | (911 | ) | | (493 | ) | | (562 | ) | | (1,055 | ) |
In euro | | 20 | | | (349 | ) | | (328 | ) | | (123 | ) | | (390 | ) | | (513 | ) |
In other currencies | | (317 | ) | | (266 | ) | | (583 | ) | | (371 | ) | | (171 | ) | | (542 | ) |
Customer funds | | (479 | ) | | (2,098 | ) | | (2,578 | ) | | (448 | ) | | (1,892 | ) | | (2,341 | ) |
Customer deposits | | (672 | ) | | (1,717 | ) | | (2,389 | ) | | (440 | ) | | (1,685 | ) | | (2,125 | ) |
In euro | | 44 | | | (529 | ) | | (486 | ) | | 109 | | | (308 | ) | | (199 | ) |
Government and other agencies | | (70 | ) | | (42 | ) | | (111 | ) | | (9 | ) | | (43 | ) | | (52 | ) |
Current accounts | | 11 | | | (86 | ) | | (75 | ) | | 32 | | | (32 | ) | | 0 | |
Savings accounts | | 7 | | | 14 | | | 21 | | | 8 | | | (19 | ) | | (10 | ) |
Time accounts | | 68 | | | (195 | ) | | (126 | ) | | 7 | | | (144 | ) | | (137 | ) |
Others | | 27 | | | (221 | ) | | (194 | ) | | 72 | | | (71 | ) | | 1 | |
In other currencies | | (715 | ) | | (1,188 | ) | | (1,903 | ) | | (549 | ) | | (1,376 | ) | | (1,925 | ) |
Current accounts | | (42 | ) | | (93 | ) | | (135 | ) | | (35 | ) | | (78 | ) | | (113 | ) |
Savings accounts | | (20 | ) | | (6 | ) | | (26 | ) | | (8 | ) | | (62 | ) | | (69 | ) |
Time accounts | | (353 | ) | | (688 | ) | | (1,042 | ) | | (979 | ) | | (692 | ) | | (1,672 | ) |
Others | | (299 | ) | | (401 | ) | | (700 | ) | | 474 | | | (545 | ) | | (71 | ) |
Debt securities and other marketable securities | | 192 | | | (381 | ) | | (189 | ) | | (8 | ) | | (208 | ) | | (216 | ) |
In euro | | 366 | | | (328 | ) | | 38 | | | 115 | | | (16 | ) | | 98 | |
In other currencies | | (174 | ) | | (54 | ) | | (227 | ) | | (123 | ) | | (191 | ) | | (314 | ) |
Other liabilities | | (5 | ) | | (30 | ) | | (35 | ) | | (4 | ) | | (96 | ) | | (100 | ) |
| | |
|
| |
|
| |
|
| |
|
| |
|
| |
|
|
Total liabilities | | (781 | ) | | (2,743 | ) | | (3,524 | ) | | (945 | ) | | (2,550 | ) | | (3,496 | ) |
| | |
|
| |
|
| |
|
| |
|
| |
|
| |
|
|
Net interest income | | (580 | ) | | (485 | ) | | (1,065 | ) | | (698 | ) | | (319 | ) | | (1,017 | ) |
| | |
|
| |
|
| |
|
| |
|
| |
|
| |
|
|
| (1) | Rates have been presented on a non-taxable equivalent basis. |
| (2) | Variances caused by changes in both volume and rate have been allocated proportionally to volume and rate. |
36
Interest Earning Assets—Margin and Spread
The following table analyzes the levels of our average earning assets and illustrates the comparative gross and net yields and spread obtained for each of the years indicated.
| | | | | | | | | |
| | | Year ended December 31,
| |
| | | 2003
| | | 2002
| | | 2001
| |
| | | (in millions of euro, except percentages) | |
Average earning assets | | 254,544 | | | 261,244 | | | 277,625 | |
Gross yield(1) | | 5.10 | % | | 6.73 | % | | 7.96 | % |
Net yield(2) | | 2.41 | % | | 2.70 | % | | 2.92 | % |
Net interest margin(3) | | 2.65 | % | | 2.99 | % | | 3.18 | % |
Spread(4) | | 2.90 | % | | 3.33 | % | | 3.57 | % |
| (1) | Gross yield represents total interest income divided by average interest earning assets. |
| (2) | Net yield represents total interest income divided by average total assets. |
| (3) | Net interest margin represents net interest income as percentage of average interest earning assets. |
| (4) | Spread is the difference between gross yield and the average cost of interest-bearing liabilities. |
ASSETS
Interest-Bearing Deposits in Other Banks
As of December 31, 2003, 7.06% of our assets were represented by interbank deposits. Of such interbank deposits, 63.06% were held outside of Spain and 36.94% in Spain. We believe that our deposits are generally placed with highly rated banks and have a lower risk than many loans we could make in Spain. Such deposits, however, are subject to the risk that the deposit banks may fail or the banking system of certain of the countries in which a portion of our deposits are made may face liquidity or other problems.
Securities Portfolio
As of December 31, 2003, our securities (not including investments in affiliates but including equity investments in our industrial portfolio) were carried on our Consolidated Balance Sheet at a book value of €75 billion, representing 26.1% of our assets. €18.9 billion or 28.3% of our securities consisted of Spanish Treasury bonds and Treasury bills. The average yield during 2003 on Treasury bonds and bills that BBVA held was 2.11%, compared to an average yield of approximately 5.4% earned on loans and leases during 2003. Except for Spanish government securities, we do not hold the securities of any single issuer the book value of which exceeds 10% of our stockholders’ equity. The market or appraised value of our total securities portfolio as of December 31, 2003 was €75.5 billion. See Notes 6, 9 and 10 to the Consolidated Financial Statements. For a discussion of our investments in affiliates, see Notes 11 and 12 to the Consolidated Financial Statements. For a discussion of the manner in which we value our securities, see Notes 3.d. and 3.e. to the Consolidated Financial Statements.
37
The following table analyzes the book value and market value of our ownership of government debt securities, fixed income securities and equity securities. Investments in affiliated companies consolidated under the equity method are not included in the table below.
| | | | | | | | | | | | |
| | | At December 31,
|
| | | 2003
| | 2002
| | 2001
|
| | | Book
Value
| | Market or
Appraised*
| | Book
Value
| | Market or
Appraised*
| | Book
Value
| | Market or
Appraised*
|
| | | (in millions of euro) |
Government debt securities | | | | | | | | | | | | |
Trading securities: | | | | | | | | | | | | |
Spanish government securities | | 5,616 | | 5,616 | | 7,473 | | 7,473 | | 2,402 | | 2,402 |
Securities of, or guaranteed by, the Spanish government | | — | | — | | — | | — | | — | | — |
Investment securities: | | | | | | | | | | | | |
Bank of Spain certificates of deposit | | — | | — | | — | | — | | — | | — |
Spanish Treasury bills | | 601 | | 601 | | 1,145 | | 1,146 | | 6,502 | | 6,526 |
Other fixed interest securities: | | | | | | | | | | | | |
Securities of, or guaranteed by, the Spanish government | | 12,114 | | 12,297 | | 9,269 | | 9,566 | | 8,989 | | 9,168 |
Held to maturity securities | | 614 | | 652 | | 1,881 | | 1,983 | | 2,272 | | 2,382 |
| | |
| |
| |
| |
| |
| |
|
Total government securities | | 18,945 | | 19,166 | | 19,768 | | 20,168 | | 20,165 | | 20,478 |
| | |
| |
| |
| |
| |
| |
|
Fixed income portfolio | | | | | | | | | | | | |
Trading securities: | | | | | | | | | | | | |
Other fixed income securities | | 20,015 | | 20,015 | | 19,697 | | 19,697 | | 19,249 | | 19,249 |
Investment securities: | | | | | | | | | | | | |
Other fixed income securities listed in Spain | | 3,092 | | 3,117 | | 3,176 | | 3,200 | | 3,450 | | 3,479 |
U.S. Treasury securities | | 12 | | 12 | | 26 | | 26 | | 1,507 | | 1,515 |
Securities of other U.S. government agencies and corporations | | 1,515 | | 1,510 | | — | | — | | 6 | | 6 |
Securities of other foreign governments | | 23,645 | | 23,792 | | 19,971 | | 19,985 | | 30,431 | | 30,385 |
Other fixed interest securities listed outside of Spain | | 3,586 | | 3,596 | | 5,163 | | 5,210 | | 4,949 | | 4,929 |
Other fixed interest securities not listed | | 560 | | 563 | | 578 | | 551 | | 1,462 | | 1,460 |
Held to maturity securities | | 511 | | 543 | | 522 | | 562 | | 597 | | 648 |
| | |
| |
| |
| |
| |
| |
|
Total fixed income | | 52,936 | | 53,148 | | 49,133 | | 49,231 | | 61,651 | | 61,671 |
| | |
| |
| |
| |
| |
| |
|
Equity securities | | | | | | | | | | | | |
Trading securities: | | | | | | | | | | | | |
Equity securities | | 2,029 | | 2,029 | | 932 | | 932 | | 1,032 | | 1,032 |
Investment securities: | | | | | | | | | | | | |
Equity listed | | 501 | | 523 | | 1,364 | | 1,558 | | 1,328 | | 1,406 |
Equity unlisted | | 562 | | 645 | | 711 | | 643 | | 1,314 | | 1,375 |
| | |
| |
| |
| |
| |
| |
|
Total equity securities | | 3,092 | | 3,196 | | 3,007 | | 3,133 | | 3,674 | | 3,813 |
| | |
| |
| |
| |
| |
| |
|
Total securities portfolio | | 74,973 | | 75,510 | | 71,908 | | 72,532 | | 85,490 | | 85,962 |
| | |
| |
| |
| |
| |
| |
|
| * | Market values for listed securities are determined on the basis of their quoted values at the end of the year. Appraised values are used for unlisted securities based on our estimate or on unaudited financial statements, when available. |
38
The following table analyzes the maturities of our investment and fixed income securities by type and geographical area as of December 31, 2003.
| | | | | | | | | | | | | | | | | | | | | | |
| | | Maturing at one
Year or Less
| | | Maturing After
One Year to Five Years
| | | Maturing After
Five Years to Ten Years
| | | Maturing After
Ten Years
| | | Total
|
| | | Amount
| | Yield (2)
| | | Amount
| | Yield (2)
| | | Amount
| | Yield (2)
| | | Amount
| | Yield (2)
| | |
| | | (in millions of euro) |
Government debt securities | | | | | | | | | | | | | | | | | | | | | | |
Domestic: | | | | | | | | | | | | | | | | | | | | | | |
Investment securities: | | | | | | | | | | | | | | | | | | | | | | |
Spanish Treasury bills | | 601 | | 2.11 | % | | — | | — | | | — | | — | | | — | | — | | | 601 |
Other Spanish government securities | | 1,067 | | 4.77 | % | | 9,368 | | 4.26 | % | | 1,396 | | 6.15 | % | | 283 | | 4.64 | % | | 12,114 |
Held-to-maturity portfolio | | — | | — | | | — | | — | | | — | | — | | | 614 | | 6.00 | % | | 614 |
| | |
| |
|
| |
| |
|
| |
| |
|
| |
| |
|
| |
|
Total government debt | | 1,668 | | 3.81 | % | | 9,368 | | 4.26 | % | | 1,396 | | 6.15 | % | | 897 | | 5.57 | % | | 13,329 |
| | |
| |
|
| |
| |
|
| |
| |
|
| |
| |
|
| |
|
Fixed income portfolio | | | | | | | | | | | | | | | | | | | | | | |
Foreign | | | | | | | | | | | | | | | | | | | | | | |
United States: | | | | | | | | | | | | | | | | | | | | | | |
U.S. Treasury securities and other US Government agencies | | 254 | | 0.99 | % | | 277 | | 1.83 | % | | 374 | | 2.01 | % | | 621 | | 2.23 | % | | 1526 |
States and political subdivisions | | — | | — | | | — | | — | | | — | | — | | | 1 | | 5.94 | % | | 1 |
Other securities | | 193 | | 5.74 | % | | 137 | | 4.87 | % | | 22 | | 4.67 | % | | 84 | | 4.67 | % | | 436 |
| | |
| |
|
| |
| |
|
| |
| |
|
| |
| |
|
| |
|
Total United States | | 447 | | 3.04 | % | | 414 | | 2.84 | % | | 396 | | 2.16 | % | | 706 | | 2.53 | % | | 1,963 |
| | |
| |
|
| |
| |
|
| |
| |
|
| |
| |
|
| |
|
Other: | | | | | | | | | | | | | | | | | | | | | | |
Governments | | 1,996 | | 6.91 | % | | 12,761 | | 5.22 | % | | 4,682 | | 5.12 | % | | 4,236 | | 5.82 | % | | 23,645 |
Other securities | | 803 | | 2.17 | % | | 1,797 | | 4.34 | % | | 710 | | 4.60 | % | | 401 | | 4.52 | % | | 3,711 |
| | |
| |
|
| |
| |
|
| |
| |
|
| |
| |
|
| |
|
Total other | | 2,769 | | 5.54 | % | | 14,558 | | 5.11 | % | | 5,392 | | 5.05 | % | | 4,637 | | 5.71 | % | | 27,356 |
| | |
| |
|
| |
| |
|
| |
| |
|
| |
| |
|
| |
|
Domestic: | | | | | | | | | | | | | | | | | | | | | | |
Other securities | | 101 | | 3.40 | % | | 299 | | 4.41 | % | | 840 | | 3.11 | % | | 1,852 | | 3.25 | % | | 3,092 |
| | |
| |
|
| |
| |
|
| |
| |
|
| |
| |
|
| |
|
Total(1) | | 3,317 | | 4.69 | % | | 15,271 | | 4.74 | % | | 6,627 | | 4.90 | % | | 7,195 | | 4.76 | % | | 32,410 |
| | |
| |
|
| |
| |
|
| |
| |
|
| |
| |
|
| |
|
| (1) | Excluding held-to-maturity and trading securities. |
| (2) | Rates have been presented on a non-taxable equivalent basis. |
39
Loan Portfolio
As of December 31, 2003, our total loans and leases amounted to €153.3 billion, or 53.4% of total assets. During 2003, our loans in Spain increased by 13.3% compared to 2002. Our foreign loans decreased by 12.3%, compared to 2002, as a result of the depreciation of several Latin American currencies in the countries in which we operate against the euro. In local currency terms, by contrast, there was growth in loans of 19.2% in Chile, 5.0% in Peru, 10.1% in Colombia and 7.8% in Mexico, the latter showing an acceleration in lending throughout the year with notable growth in consumer and credit card lending. Net of our loan loss reserve, loans and leases amounted to €148.8 billion. For a discussion of certain mandatory ratios relating to our loan portfolio, see “—Supervision and Regulation—Liquidity Ratio” and “—Investment Ratio”.
Loans by Geographic Area
The following table analyzes, by domicile of the customer, our net loans and leases for each of the years indicated.
| | | | | | | | | | |
| | | At December 31,
|
| | | 2003
| | 2002
| | 2001
| | 2000
| | 1999(1)
|
| | | (in millions of euro) |
Domestic | | 113,485 | | 101,013 | | 97,910 | | 91,403 | | 44,334 |
Foreign: | | | | | | | | | | |
Western Europe | | 8,082 | | 7,261 | | 8,241 | | 7,172 | | 3,700 |
Central and South America | | 23,016 | | 28,321 | | 36,202 | | 32,595 | | 16,779 |
United States | | 3,118 | | 757 | | 4,157 | | 3,504 | | 2,659 |
Other | | 1,126 | | 3,963 | | 3,710 | | 2,793 | | 1,027 |
| | |
| |
| |
| |
| |
|
Total foreign | | 35,342 | | 40,302 | | 52,310 | | 46,064 | | 24,160 |
| | |
| |
| |
| |
| |
|
Total net lending | | 148,827 | | 141,315 | | 150,220 | | 137,467 | | 68,494 |
| | |
| |
| |
| |
| |
|
Loans by Type of Customer
The following table analyzes by domicile and type of customer our net loans and leases for each of the years indicated. The analyses by type of customer are based principally on the requirements of the regulatory authorities in each country.
| | | | | | | | | | |
| | | At December 31,
|
| | | 2003
| | 2002
| | 2001
| | 2000
| | 1999(1)
|
| | | (in millions of euro) |
Domestic: | | | | | | | | | | |
Government | | 13,403 | | 12,562 | | 12,196 | | 11,154 | | 3,156 |
Agriculture | | 1,057 | | 698 | | 533 | | 796 | | 609 |
Industrial | | 11,991 | | 11,970 | | 11,378 | | 11,661 | | 7,858 |
Real estate and construction | | 14,823 | | 13,652 | | 12,767 | | 13,304 | | 6,948 |
Commercial and financial | | 12,742 | | 9,336 | | 8,677 | | 13,784 | | 8,345 |
Loans to individuals | | 44,160 | | 38,515 | | 36,105 | | 33,383 | | 13,469 |
40
| | | | | | | | | | | | | | | |
| | | At December 31,
| |
| | | 2003
| | | 2002
| | | 2001
| | | 2000
| | | 1999(1)
| |
| | | (in millions of euro) | |
Lease financing | | 4,160 | | | 3,217 | | | 2,685 | | | 2,156 | | | 1,583 | |
Other | | 13,333 | | | 12,923 | | | 10,900 | | | 3,153 | | | 1,587 | |
| | |
|
| |
|
| |
|
| |
|
| |
|
|
Total domestic | | 115,669 | | | 102,873 | | | 95,241 | | | 89,391 | | | 43,555 | |
Foreign | | 37,602 | | | 43,540 | | | 60,907 | | | 53,380 | | | 27,049 | |
| | |
|
| |
|
| |
|
| |
|
| |
|
|
Total loans and leases | | 153,271 | | | 146,413 | | | 156,148 | | | 142,771 | | | 70,604 | |
Loan loss reserve | | (4,444 | ) | | (5,098 | ) | | (5,928 | ) | | (5,304 | ) | | (2,110 | ) |
| | |
|
| |
|
| |
|
| |
|
| |
|
|
Total net lending | | 148,827 | | | 141,315 | | | 150,220 | | | 137,467 | | | 68,494 | |
| | |
|
| |
|
| |
|
| |
|
| |
|
|
The following table sets forth a breakdown, by currency, of our net loan portfolio for each of the past five years.
| | | | | | | | | | |
| | | At December 31,
|
| | | 2003
| | 2002
| | 2001
| | 2000
| | 1999(1)
|
| | | (in millions of euro) |
In euro | | 120,152 | | 106,590 | | 98,982 | | 91,469 | | 44,461 |
In other currencies | | 28,675 | | 34,725 | | 51,238 | | 45,998 | | 24,033 |
| | |
| |
| |
| |
| |
|
Total | | 148,827 | | 141,315 | | 150,220 | | 137,467 | | 68,494 |
| | |
| |
| |
| |
| |
|
As of December 31, 2003, loans by BBVA and its subsidiaries to companies we are required to account for by the equity method (for listed companies, if we own over 3% of their voting equity securities, and for non-listed companies, over 20%) amounted to €3.6 billion. Loans outstanding to the Spanish government and its agencies amounted to €13.4 billion, or 8.7% of our total loans and leases as of December 31, 2003, compared to €12.6 billion, or 8.6% of our total loans and leases as of December 31, 2002. None of our loans to companies controlled by the Spanish government are guaranteed by the government and, accordingly, we apply normal credit criteria in extending credit to such entities. Moreover, we carefully monitor such loans because governmental policies necessarily affect such borrowers.
Diversification in our loan portfolio is our principal means of reducing the risk of loan losses. We also carefully monitor our loans to borrowers in sectors or countries experiencing liquidity problems. Our exposure to our four largest borrowers as of December 31, 2003, excluding government-related loans, amounted to €13.1 billion, or approximately 8.6% of our total outstanding loans and leases.
Maturity and Interest Sensitivity
The following table sets forth an analysis by maturity of our total loans and leases by domicile of the office that issued the loan and type of customer as of December 31, 2003. The determination of maturities is based on contract terms.
| | | | | | | | |
| | | Maturity
| | Total
|
| | | Due in One Year
or Less
| | Due After One Year Through
Five Years
| | Due After
Five Years
| |
| | | (in millions of euro) |
Domestic: | | | | | | | | |
Government | | 4,866 | | 3,825 | | 4,712 | | 13,403 |
Agriculture | | 442 | | 383 | | 232 | | 1,057 |
Industrial | | 9,590 | | 1,643 | | 758 | | 11,991 |
Real estate and construction | | 6,105 | | 3,400 | | 5,318 | | 14,823 |
Commercial and financial | | 9,085 | | 1,810 | | 1,847 | | 12,742 |
Loans to individuals | | 6,378 | | 11,574 | | 26,208 | | 44,160 |
Lease financing | | 193 | | 2,639 | | 1,328 | | 4,160 |
Other | | 8,677 | | 2,374 | | 2,282 | | 13,333 |
| | |
| |
| |
| |
|
Total domestic | | 45,336 | | 27,648 | | 42,685 | | 115,669 |
Foreign | | 17,747 | | 10,227 | | 9,628 | | 37,602 |
| | |
| |
| |
| |
|
Total loans and leases | | 63,083 | | 37,875 | | 52,313 | | 153,271 |
| | |
| |
| |
| |
|
41
The following table sets forth a breakdown of our fixed and variable rate loans which had a maturity of one year or more as of December 31, 2003.
| | | | | | |
| | | Interest Sensitivity of
Outstanding Loans and Leases
Maturing in More Than One
Year
|
| | | Domestic
| | Foreign
| | Total
|
| | | (in millions of euro) |
Fixed rate | | 21,465 | | 10,731 | | 32,196 |
Variable rate | | 45,262 | | 12,730 | | 57,992 |
| | |
| |
| |
|
Total | | 66,727 | | 23,461 | | 90,188 |
| | |
| |
| |
|
Loan Loss Reserve
Our loan loss reserve is intended to cover losses in connection with substandard loans (including risks and other losses relating to certain performing loans and operations). The loan loss reserve is based on our estimates which we make in accordance with Bank of Spain requirements. Our actual losses relating to loans we have issued may vary from our estimates, which are reviewed on a periodic basis. As changes become necessary, we adjust the level of the loan loss reserve, and appropriate provisions are taken in the period in which the necessity to make such adjustment becomes known. We do not expect to use all specific reserves to cover losses on loans with respect to which such reserves have been established. For both Spanish and foreign borrowers, we estimate the loan loss reserve based on an individual analysis of the quality of the exposure to principal borrowers and debtors and on a statistical basis for remaining lending risks. Country risk, as described under “—Foreign Country Outstandings”, is based on an individual country’s degree of difficulty in servicing its debts, which we estimate based on Bank of Spain guidelines. In accordance with current Bank of Spain regulations, the reserve for doubtful guarantees, acceptances and letters of credit is recorded under “—Other Liabilities—Other accounts”. See Notes 3.c. and 8 to the Consolidated Financial Statements.
Bank of Spain regulations applicable to Spanish banks require that loans on which any payment of principal or interest is 90 days past due must be classified as substandard to the extent described herein (“non-performing substandard loans”) and, so long as they are reflected on the balance sheet, must, except as described in the next paragraph regarding non-performing substandard loans which are fully-secured mortgage loans, be reserved as set forth in the following table. Until the amount of principal and interest past due on a non-performing substandard loan is more than 25% of the outstanding balance of the loan or a payment of principal or interest on such loan is at least six months overdue for consumer loans or 12 months for other loans, the reserve set forth in both of the tables set forth below is a percentage of past due payments of principal and interest to the extent accrued at the time that the loan becomes substandard and with respect to such loans, only such payments and not the entire loan (as in the case of a U.S. bank holding company) are treated as substandard in accordance with Bank of Spain regulations. When the amount of principal and interest past due on a non-performing substandard loan is greater than 25% of the outstanding balance of the loan, or when any payment on such loan is
42
6 or 12 months overdue (depending on the type of loan), the reserve indicated in both of the tables set forth below is a percentage of the entire amount of the outstanding balance of the loan, and, in accordance with Bank of Spain regulations, the entire principal amount of the loan becomes substandard and is so treated for the purposes of disclosure in this Annual Report.
| | | |
Period overdue
| | Reserve
| |
3-6 months | | 10 | % |
6-12 months | | 25 | % |
12-18 months | | 50 | % |
18-21 months | | 75 | % |
More than 21 months | | 100 | % |
Non-performing substandard loans (including leasing agreements) that are considered fully-secured mortgage loans, however, are reserved according to the table set forth below. To be classified as a “fully-secured mortgage loan”, a loan must meet three criteria. First, it must be secured by a mortgage on residential, commercial or mixed-use property or properties or certain rural property or properties. Second, the mortgage must have been placed on the property at the time the loan was originated. Third, total risk exposure must not be greater than 80% of the appraised value of the property (using the original appraised value, if the borrower cannot provide a more current value).
Compliance with these conditions is determined as of the time the loan first becomes a non-performing substandard loan.
| | | |
Period overdue
| | Reserve
| |
3-4 years | | 25 | % |
4-5 years | | 50 | % |
5-6 years | | 75 | % |
More than 6 years | | 100 | % |
The foregoing requirements apply to reserves with respect to a single loan to a borrower. In some cases, reserves may be required for all loans to a borrower. If the amount of principal and interest past due on non-performing substandard loans to a borrower, whether regarding fully-secured mortgage loans or otherwise, exceeds 25% of the outstanding balance of all of a Spanish bank’s loans to such borrower, then all of the bank’s loans to such borrower, even if otherwise performing, must be declared substandard, and, except in the case of any loan on which no payment of principal or interest is overdue, reserved for as set forth in the preceding two tables. Once a non-performing loan has been declared substandard, application of Bank of Spain requirements generally results in a higher reserve with respect to such loan than would be required by our estimates, which are made independently of such requirements.
If a bank, for reasons relating to the financial condition of the borrower, has a reasonable doubt that a loan will be collected (or if a loan is as described in the third sentence of this paragraph), such loan (an “other substandard loan”) must be classified as substandard, even if payments are past due for less than 90 days or the loan is otherwise performing. We are required to take a provision regarding other substandard loans equal to the percentage of the loan as to which, in our estimate, there is a reasonable doubt as to collectibility, which amount must be at least 10% of the outstanding balance of the loan. If the loan is to a borrower who is experiencing negative net worth, continuing losses, suspension of payments or a general delay in payments, the minimum reserve is 25% of the outstanding balance of the loan.
None of the foregoing Bank of Spain requirements as to reserves applies to any loan, even if classified as substandard, to the extent that such loan is:
| | • | guaranteed by companies directly or indirectly majority-owned by the Spanish government whose principal activity is to provide guarantees; |
| | • | to or guaranteed by a European Union country (other than the Spanish government); |
43
| | • | to or guaranteed by the Spanish government (including any subdivision thereof, such as autonomous communities, provinces and municipalities) or any instrumentality thereof; |
| | • | guaranteed by a pledge on a money market investment mutual fund, provided that the total risk exposure is equal to or lower than 90% of the redemption value of the money market investment mutual fund or |
| | • | guaranteed by a pledge on fixed-income securities issued by the Spanish government or any subdivision thereof, or issued by specified credit entities, provided that the total risk exposure is equal to or lower than 90% of the market value of the securities received as guarantee. |
In accordance with Bank of Spain regulations, an additional general purpose reserve, representing 1% of the sum of loans, discounts, fixed-income securities (except trading securities), contingent liabilities and certain doubtful assets (other than substandard loans exempted from provisioning as described in the foregoing paragraph), is set aside to cover risks which are not specifically identified but which may arise in the future. This general purpose reserve is limited to 0.5% for fully-secured mortgage loans.
A regulatory change by the Bank of Spain that entered into effect on July 1, 2000 requires the establishment of a supplementary general allowance for credit losses based either on a bank’s internal models of risk coefficients or, as in the case of BBVA, on risk coefficients set by the Bank of Spain which range from 0% to 1.5%. Provisions to this supplemental allowance are made quarterly and the allowance may not exceed three times risk weighted assets. The amount we contributed to such provision in 2003 was €328 million (€232 million in 2002, €251 million in 2001).
Spanish banks, consistent with Bank of Spain guidelines, generally charge off immediately only those loans which they believe will not be repaid at any time or which are outstanding to countries that are considered “bankrupt” under Bank of Spain guidelines. Under those guidelines, a provision for the full amount of such a substandard loan must be made within 18 months after such classification, or six years in the case of fully-secured mortgage loans. Substandard loans may be held on the bank’s balance sheets up to a maximum of three years, or six years in the case of fully-secured mortgage loans, after such classification.
Allowance for Credit Losses
Pursuant to Bank of Spain regulations, once any portion of a loan is classified as non-performing, a specific loan loss allowance is required to be established, with scheduled increases to the allowance based on a calendar of the time elapsed since the first event of nonpayment or for which collection is considered to be doubtful. Based on management’s assessment, banks may elect to record allowances in excess of this minimum requirement. The allowance for credit losses represents management’s estimate of probable losses based upon the following factors:
| | • | Economic conditions, including duration of the current cycle; |
| | • | Past experience, including recent loss experience; |
| | • | Credit rating assigned to each credit and credit quality trends; |
| | • | Specific credits and industry conditions; |
| | • | Geopolitical issues and their impact on the economy. |
The following table provides information, by domicile of customer, regarding our loan loss reserve and movements of loan charge-offs and recoveries for the periods indicated.
| | | | | | | | |
| | | At December 31,
|
| | | 2002
| | 2001
| | 2000
| | 1999(1)
|
| | | (in millions of euro, except percentages) |
Loan loss reserve at beginning of period: | | | | | | | | |
Domestic | | 1,375 | | 1,222 | | 698 | | 731 |
Foreign | | 4,945 | | 6,933 | | 1,578 | | 1,438 |
Merger with Argentaria: | | | | | | | | |
Domestic | | 0 | | 0 | | 356 | | 0 |
Foreign | | 0 | | 0 | | 419 | | 0 |
44
| | | | | | | | | | | | |
| | | At December 31,
| |
| | | 2002
| | | 2001
| | | 2000
| | | 1999(1)
| |
| | | (in millions of euro, except percentages) | |
Acquisition and disposition of subsidiaries | | (2 | ) | | 12 | | | 5,396 | | | 8 | |
of which due to Bancomer (*) | | | | | | | | 5,251 | | | | |
Total | | 6,318 | | | 8,167 | | | 8,447 | | | 2,177 | |
Loans written off: | | | | | | | | | | | | |
Domestic | | (337 | ) | | (409 | ) | | (337 | ) | | (192 | ) |
Foreign | | (1,205 | ) | | (4,929 | ) | | (1,359 | ) | | (740 | ) |
of which due to FOBAPROA (**) | | | | | (3,259 | ) | | | | | | |
Total | | (1,542 | ) | | (5,338 | ) | | (1,696 | ) | | (932 | ) |
Recoveries of loans previously written off: | | | | | | | | | | | | |
Domestic | | 112 | | | 124 | | | 130 | | | 72 | |
Foreign | | 96 | | | 164 | | | 143 | | | 105 | |
Total | | 208 | | | 288 | | | 273 | | | 177 | |
Net loans written off | | (1,334 | ) | | (5,050 | ) | | (1,423 | ) | | (755 | ) |
Provision for possible loan losses: | | | | | | | | | | | | |
Domestic | | 504 | | | 464 | | | 350 | | | 100 | |
Foreign | | 1,238 | | | 1,455 | | | 623 | | | 595 | |
Total | | 1,742 | | | 1,919 | | | 973 | | | 695 | |
Effect of foreign currency translation | | (1,441 | ) | | 715 | | | 102 | | | 165 | |
Other | | 61 | | | 569 | | | 56 | | | (5 | ) |
Total | | 362 | | | 3.203 | | | 1.131 | | | 855 | |
Loan loss reserve at end of period: | | | | | | | | | | | | |
Domestic | | 1,599 | | | 1,375 | | | 1,222 | | | 699 | |
Foreign | | 3,747 | | | 4,945 | | | 6,933 | | | 1,578 | |
Total | | 5,346 | | | 6,320 | | | 8,155 | | | 2,277 | |
| (1) | Information from BBV’s Annual Report on Form 20-F for 1999. |
| (*) | Due to the purchase of our interest in Bancomer in July 2000. See explanation below. |
| (**) | Due to accounting adjustments relating to FOBAPROA promissory notes. See Note 9 to the Consolidated Financial Statements. See also the explanation below. |
Purchase of Bancomer; FOBAPROA Adjustments
Bancomer Purchase
As a result of BBVA’s acquisition of a significant interest in Bancomer in July, 2000, Bancomer was consolidated in BBVA’s 2000 Consolidated Financial Statements. Of the €5,396 million in loan loss reserve reflected in the foregoing table as arising from the Bancomer acquisition, €5,251 million was the amount that had been included by Bancomer on its consolidated balance sheets under the Allowance for Loan Losses caption as of June 30, 2000. Following the Bancomer acquisition, the allowance for loan losses recorded by Bancomer was not adjusted under Spanish GAAP and when included in BBVA’s Consolidated Financial Statements, this balance was combined with BBVA’s existing allowance for loan losses in the same manner as all of Bancomer’s other balance sheet line items were combined with those of BBVA.
FOBAPROA adjustments
The foregoing table indicates that a €3,259 million charge off of loans in 2002 related to FOBAPROA promissory notes. Of this balance, €2,690 million related to a reduction to the provision for possible loan losses and the remaining €569 million related to other items which increased the provision for possible loan losses. As explained in Note 9 to the Consolidated Financial Statements, BBVA’s ownership of the FOBAPROA promissory notes, which were held by Bancomer, arose in connection with measures taken by the Mexican Government during the Mexican economic crisis in 1994 and 1995. Under these measures, Mexican banks, including Bancomer, were allowed to transfer to the Mexican government the right to collect on a portion of their loan portfolio that was experiencing payment difficulties. In exchange, the Mexican government issued to such banks FOBAPROA promissory notes, guaranteed in part by the Mexican government, in an amount equal to the book value (net of provisions) of the loans transferred. The banks, however, remained responsible for 25% of the losses arising from the difference between the amount of the FOBAPROA promissory notes at the time exchanged, plus the accumulated accrued interest on such promissory notes, and the amount the Mexican government was able to recover on the loans transferred to it.
Since the Mexican government only guaranteed up to 75% of the FOBAPROA promissory notes, in 2001 BBVA concluded that the amount not guaranteed by the Mexican government was not collectible. Under Spanish GAAP, this 25% was considered a loss and was written off, with a reduction of assets and of the Allowance for Loan Losses on BBVA’s Consolidated Balance Sheets.
45
The following table provides information, by domicile of customer, regarding our loan loss reserve and movements of loan charge-offs and recoveries for the year ended December 31, 2003.
| | | |
| | | At December 31,
2003
| |
| | | (in millions
of euro, except
percentages) | |
Loan loss reserve at beginning of period: | | | |
Domestic | | 1,599 | |
Foreign | | 3,747 | |
Total | | 5,346 | |
| | |
|
|
Loans charged off: | | | |
Domestic | | | |
Government and other Agencies | | — | |
Real estate and loans to individuals | | (186 | ) |
Commercial and financial | | (106 | ) |
Other | | — | |
Total domestic | | (292 | ) |
Foreign | | (931 | ) |
| | |
|
|
Total | | (1,223 | ) |
| | |
|
|
Recoveries of loans previously charged off: | | | |
Domestic | | | |
Government and other Agencies | | — | |
Real estate and loans to individuals | | 84 | |
Commercial and financial | | 19 | |
Other | | 2 | |
Total domestic | | 105 | |
Foreign | | 122 | |
| | |
|
|
Total | | 227 | |
| | |
|
|
Net loans charged off | | (996 | ) |
Provision for possible loan losses: | | | |
Domestic | | 468 | |
Foreign | | 809 | |
Total | | 1,277 | |
Acquisition and disposition of subsidiaries | | (75 | ) |
Effect of foreign currency translation | | (711 | ) |
Other | | (104 | ) |
| | |
|
|
Total | | 387 | |
| | |
|
|
Loan loss reserve at end of period: | | | |
Domestic | | 1,832 | |
Foreign | | 2,905 | |
| | |
|
|
Total | | 4,737 | |
| | |
|
|
Reserve as a percentage of total loans and leases at end of period | | 3.09 | % |
| |
Net loan charge-offs as a percentage of total loans and leases at end of period | | 0.65 | % |
46
Our loan loss reserves as a percentage of total loans and leases declined from 3.65% as of December 31, 2002, to 3.09% as of December 31, 2003, principally due to the significant negative effect of foreign currency translation which resulted in a decrease of €711 million in the value in euro of our loan loss reserves as of December 31, 2003. This decrease was primarily caused by the devaluation of currencies in Mexico, Venezuela, Colombia and Peru, which caused in the loan loss reserves of our banks in these countries to decline significantly when converted to euro in our Consolidated Financial Statements.
We do not maintain records allocating the amount of charge-offs and the amount of recoveries by loan category. See “—Substandard Loans” for information as to the breakdown as of December 31, 2003 by loan category of substandard loans. Also, at the time that a loan is charged off in accordance with Bank of Spain guidelines, it will normally be substantially or fully reserved and, accordingly, such charge-off would have a very limited effect on our net attributable profit or shareholders’ equity. Accordingly, we believe that information relating to domestic reserves and charge-offs by loan category is of less relevance than would be the case for a U.S. bank.
Substandard Loans
We classify loans as substandard according to the regulations of the Bank of Spain (see “—Assets—Loan Loss Reserve”), and not in the manner required by the SEC. In addition, consistent with Bank of Spain regulations, all loans that are 90 days past due, even if well-collateralized and in the process of being collected, are automatically considered non-accrual if they are classified as substandard. As of December 31, 2003, all country risk loans, which are loans that are required to be classified as substandard, even if paying, due to Bank of Spain regulations corresponding to the country of origin of the loans, included in the following table were non-accruing.
Interest on all of our substandard non-accrual loans is not credited to income until actually collected. The amount of gross interest income that would have been recorded regarding our substandard loans as of December 31, 2001, 2002 and 2003 was €1,625.8 million, €869.0 million and €766.8 million, respectively. The approximate amount of interest income on our substandard loans which was included in net attributable profit as of December 31, 2001, 2002 and 2003 was €325.7 million, €127.0 million and €357.4 million, respectively.
47
| | | | | | | | | | | | |
| | | At December 31
| |
| | | 2002
| | | 2001
| | | 2000
| | | 1999(1)
| |
| | | (in millions of euro, except percentages) | |
| Substandard loans: | | | | | | | | | | | | |
Non-performing loans | | 3,474 | | | 2,737 | | | 2,854 | | | 1,359 | |
Public sector | | 508 | | | 41 | | | 61 | | | 6 | |
Other resident sectors | | 771 | | | 786 | | | 805 | | | 427 | |
Non-resident sector | | | | | | | | | | | | |
Country risk | | 196 | | | 27 | | | 6 | | | 1 | |
Other | | 1,999 | | | 1,883 | | | 1,982 | | | 925 | |
Other non-performing loans | | 57 | | | 6 | | | 8 | | | 6 | |
Resident sector | | — | | | — | | | — | | | 4 | |
Non-resident sector | | 57 | | | 6 | | | 8 | | | 2 | |
| | |
|
| |
|
| |
|
| |
|
|
| Total substandard loans | | 3,531 | | | 2,743 | | | 2,862 | | | 1,365 | |
| | |
|
| |
|
| |
|
| |
|
|
Credit loan loss reserve | | 5,098 | | | 5,928 | | | 5,304 | | | 2,110 | |
Other loan loss reserve—Fixed income portfolio | | 125 | | | 253 | | | 2,705 | * | | 37 | |
Credit entities | | 123 | | | 139 | | | 146 | | | 130 | |
| | |
|
| |
|
| |
|
| |
|
|
| Total loan loss reserve | | 5,346 | | | 6,320 | | | 8,155 | | | 2,277 | |
| | |
|
| |
|
| |
|
| |
|
|
Substandard loans net of reserves | | (1,815 | ) | | (3,577 | ) | | (5,293 | ) | | (912 | ) |
Non-performing loans as a percentage of total loans and leases | | 2.37 | % | | 1.75 | % | | 2.00 | % | | 1.93 | % |
Non performing loans (net of reserves) as a percentage of total loans | | (1.11 | )% | | (2.04 | )% | | (1.71 | )% | | (1.06 | )% |
Loan loss reserve as a percentage of substandard loans | | 151.42 | % | | 230.40 | % | | 284.94 | % | | 166.81 | % |
| (*) | Due to the consolidation of Bancomer. |
48
| | | |
| | | At December 31, 2003
| |
| | | (in millions of euro, except percentages) | |
| Substandard loans: | | | |
Non-performing loans | | 2,673 | |
Domestic | | 859 | |
Public sector | | 99 | |
Other resident sectors | | 733 | |
Non-resident sector | | 27 | |
Country risk | | 6 | |
Other | | 21 | |
Foreign | | 1,813 | |
Public sector | | 436 | |
Other resident sectors | | — | |
Non-resident sector | | 1,377 | |
Country risk | | 6 | |
Other | | 1,371 | |
Other non-performing loans | | 454 | |
Domestic | | 17 | |
Resident sector | | — | |
Non-resident sector | | 17 | |
| | |
|
|
Foreign | | 437 | |
| | |
|
|
Resident sector | | — | |
| | |
|
|
Non-resident sector | | 437 | |
| | |
|
|
| Total substandard loans | | 3,126 | |
| | |
|
|
Credit loan loss reserve | | 4,444 | |
Other loan loss reserve—Fixed income portfolio | | 121 | |
Credit entities | | 171 | |
| | |
|
|
| Total loan loss reserve | | 4,736 | |
| | |
|
|
Substandard loans net of reserves | | (1,609 | ) |
Non-performing loans as a percentage of total loans and leases | | 1.74 | % |
Non-performing loans (net of reserves) as a percentage of total loans | | (1.16 | )% |
Loan loss reserve as a percentage of substandard loans | | 151.5 | % |
Our total substandard loans amounted to €3,126 million as of December 31, 2003, compared to €3,531 million as of December 31, 2002, principally due to the higher level of substandard loans recorded in 2002 primarily as a result of a decline in the Bank of Spain’s country risk classification of Argentina, which under Spanish GAAP required us to record a higher percentage of Argentine loans as non-performing regardless of the actual payment history of such loans. As a result of the decrease in loan loss reserves described above under “—Loan Loss Reserve” and the larger decrease in total substandard loans described above, our substandard loans as a percentage of total loans decreased from 2.41% to 2.04% and our loan loss reserves as a percentage of substandard loans increased from 151.42% to 152.26%, in each case as of December 31, 2002 and December 31, 2003, respectively.
We experience higher substandard loans in our Latin American operations, as a percentage of total loans, than in our domestic Spanish operations and actively monitor the higher risk profile of the loan portfolios of our Latin American banks.
49
As of December 31, 2003, we do not believe that there is a material amount of loans not included in the foregoing table where known information about possible credit problems of the borrowers gives rise to serious doubts as to the ability of the borrowers to comply with the currently applicable loan repayment terms.
The following table provides information, by domicile and type of customer, regarding our substandard loans and the loan loss reserves taken for each substandard loan category, as of December 31, 2003.
| | | | | | |
| | | Substandard
Loans
| | Loan
Loss
Reserve
| | Substandard
Loans as a
percentage
of Loans in
Category
|
| | | (in millions of euro) | | |
Domestic: | | | | | | |
Government | | 69.1 | | — | | 0.51 |
Agricultural | | 10.3 | | 6.4 | | 0.95 |
Industrial | | 94.4 | | 62.0 | | 0.78 |
Real estate and construction | | 128.0 | | 64.6 | | 0.86 |
Commercial and financial | | 109.2 | | 60.9 | | 0.85 |
Loans to individuals | | 355.8 | | 184.7 | | 0.81 |
Other | | 109.3 | | 39.8 | | 0.21 |
| | |
| |
| |
|
Total domestic | | 876.1 | | 418.4 | | 0.69 |
Foreign: | | | | | | |
Country risk | | 639.6 | | 609.2 | | — |
Other | | 1,610.6 | | 1,577.9 | | — |
| | |
| |
| |
|
Total foreign | | 2,250.2 | | 2,187.1 | | 6.18 |
General reserve | | — | | 2,130.3 | | — |
| | |
| |
| |
|
Total substandard loans | | 3,126.3 | | 4,735.8 | | 2.1 |
| | |
| |
| |
|
Foreign Country Outstandings
The following table sets forth, as of the end of the years indicated, the aggregate amounts of our cross-border outstandings (which consist of loans, interest-bearing deposits with other banks, acceptances and other monetary assets denominated in a currency other than the home-country currency of the office where the item is booked) where outstandings in the borrower’s country exceeded 0.75% of our total assets. Cross-border outstandings do not include loans in local currency made by our subsidiary banks to customers in other countries to the extent that such loans are funded in the local currency or hedged. As a result, they do not include the vast majority of the loans made by our Latin American subsidiaries.
| | | | | | | | | | | | | | | |
| | | At December 31,
| |
| | | 2003
| | | 2002
| | | 2001
| |
| | | Amount
| | % of Total Assets
| | | Amount
| | % of Total Assets
| | | Amount
| | % of Total Assets
| |
| | | (in millions of euro, except percentages) | |
O.E.C.D. | | | | | | | | | | | | | | | |
United Kingdom | | 3,532 | | 1.23 | % | | 1,185 | | 0.41 | % | | 1,756 | | 0.57 | % |
Mexico | | 6,682 | | 2.33 | % | | 5,389 | | 1.93 | % | | 7,370 | | 2.38 | % |
Other O.E.C.D. | | 4,335 | | 1.51 | % | | 5,115 | | 1.83 | % | | 4,590 | | 1.49 | % |
| | |
| |
|
| |
| |
|
| |
| |
|
|
Total O.E.C.D. | | 14,549 | | 5.07 | % | | 11,689 | | 4.18 | % | | 13,716 | | 4.44 | % |
| | |
| |
|
| |
| |
|
| |
| |
|
|
Central and South America | | 3,595 | | 1.25 | % | | 4,473 | | 1.60 | % | | 6,671 | | 2.16 | % |
Other | | 1,265 | | 0.44 | % | | 1,312 | | 0.47 | % | | 1,401 | | 0.45 | % |
| | |
| |
|
| |
| |
|
| |
| |
|
|
Total | | 19,409 | | 6.76 | % | | 17,474 | | 6.25 | % | | 21,788 | | 7.05 | % |
| | |
| |
|
| |
| |
|
| |
| |
|
|
50
The following table sets forth the amounts of our cross-border outstandings as of December 31 of each year indicated by type of borrower where outstandings in the borrower’s country exceeded 0.75% of our total assets.
| | | | | | | | |
| | | Governments
| | Banks and Other Financial Institutions
| | Commercial, Industrial and Other
| | Total
|
| | | (in millions of euro) |
2003 | | | | | | | | |
Mexico | | 3,662 | | 702 | | 2,318 | | 6,682 |
United Kingdom | | — | | 2,426 | | 1,106 | | 3,532 |
Total | | 3,662 | | 3,128 | | 3,424 | | 10,214 |
2002 | | | | | | | | |
Mexico | | 1,441 | | 811 | | 3,137 | | 5,389 |
United Kingdom | | — | | 628 | | 557 | | 1,185 |
Total | | 1,441 | | 1,439 | | 3,694 | | 6,574 |
2001 | | | | | | | | |
Mexico | | 1,656 | | 1,239 | | 4,475 | | 7,370 |
United Kingdom | | — | | 867 | | 889 | | 1,756 |
Total | | 1,656 | | 2,106 | | 5,364 | | 9,126 |
The Bank of Spain requires that minimum reserves be maintained for cross-border risk arising with respect to loans and other outstandings to countries, or residents of countries, falling into certain categories established by the Bank of Spain on the basis of the level of perceived transfer risk. The category that a country falls into is determined by us, subject to review by the Bank of Spain.
The following table shows the minimum required reserves with respect to each category of country. For BBVA’s level of coverage as of December 31, 2003, see Note 8 to the Consolidated Financial Statements.
| | |
Categories(1)
| | Minimum Percentage of
Coverage (Outstandings
Within Category)
|
Countries belonging to the OECD whose currencies are quoted in the Spanish foreign exchange market | | 0.0 |
Countries with transitory difficulties(2) | | 15.0 |
Doubtful countries(2) | | 20.0–35.0 |
Very doubtful countries(2)(3) | | 50.0–90.0 |
Bankrupt countries(4) | | 100.0 |
| (1) | Any outstanding which is guaranteed may be treated, for the purposes of the foregoing, as if it were an obligation of the guarantor. |
| (2) | Coverage for the aggregate of these three categories must equal at least 35% of outstanding loans within the three categories. The Bank of Spain has recommended up to 50% aggregate coverage. |
| (3) | Outstandings to very doubtful countries are treated as substandard under Bank of Spain regulations. |
| (4) | Outstandings to bankrupt countries must be charged off immediately. As a result, no such outstandings are reflected on our Consolidated Balance Sheet. Notwithstanding the foregoing minimum required reserves, certain interbank outstandings with an original maturity of three months or less have minimum required reserves of 50%. We met or exceeded the minimum percentage of required coverage with respect to each of the foregoing categories. |
51
Our exposure to borrowers in countries with difficulties (the last 4 categories in the foregoing table), excluding our exposure to subsidiaries or companies we manage and trade-related debt, amounted to €1,405 million as of December 31, 2001, €1,047 million as of December 31, 2002 and €927 million as of December 31, 2003. These figures do not reflect loan loss reserves of 35.2%, 46.1% and 66.2%, respectively, against the relevant amounts outstanding at such dates. Deposits with or loans to borrowers in all such countries as of December 31, 2003 did not in the aggregate exceed 0.45% of our total assets.
The country-risk exposures described in the preceding paragraph as of December 31, 2003 and 2002, do not include exposures for which insurance policies have been taken out with third parties that include coverage of the risk of confiscation, expropriation, nationalization, nontransfer, nonconvertibility and, if appropriate, war and political violence. The sums insured as of December 31, 2003 and 2002, amounted to $466 million and $584.5 million, respectively (approximately €369 million and €557.3 million, respectively based on a euro/dollar exchange rate on December 31, 2003 of $1.00 = €0.79 and on December 31, 2002 of $1.00 = €0.95).
LIABILITIES
Deposits
The principal components of our customer deposits are domestic demand and savings deposits and foreign time deposits. The following tables provide information regarding our deposits by principal geographic area for the dates indicated.
| | | | | | | | |
| | | At December 31, 2003
|
| | | Customer
Deposits
| | Bank of Spain and
Other Central
Banks
| | Other
Credit
Institutions
| | Total
|
| | | (in millions of euro) |
Domestic | | 74,032 | | 18,374 | | 14,863 | | 107,269 |
Foreign: | | | | | | | | |
Western Europe | | 10,914 | | — | | 11,078 | | 21,992 |
Latin America | | 44,674 | | 2,550 | | 9,175 | | 56,399 |
United States | | 3,381 | | — | | 1,687 | | 5,068 |
Other | | 8,048 | | — | | 3,842 | | 11,890 |
| | |
| |
| |
| |
|
Total foreign | | 67,017 | | 2,550 | | 25,782 | | 95,349 |
| | |
| |
| |
| |
|
Total | | 141,049 | | 20,924 | | 40,645 | | 202,618 |
| | |
| |
| |
| |
|
| |
| | | At December 31, 2002
|
| | | Customer
Deposits
| | Bank of Spain and
Other
Central Banks
| | Other
Credit
Institutions
| | Total
|
| | | (in millions of euro) |
Domestic | | | | | | | | |
Foreign: | | 73,485 | | 7,753 | | 14,940 | | 96,178 |
Western Europe | | 10,375 | | — | | 13,104 | | 23,479 |
Latin America | | 51,662 | | 2,095 | | 9,089 | | 62,846 |
United States | | 5,220 | | — | | 3,265 | | 8,485 |
Other | | 5,818 | | — | | 5,873 | | 11,691 |
| | |
| |
| |
| |
|
Total foreign | | 73,075 | | 2,095 | | 31,331 | | 106,501 |
| | |
| |
| |
| |
|
Total | | 146,560 | | 9,848 | | 46,271 | | 202,679 |
| | |
| |
| |
| |
|
52
| | | | | | | | |
| | | At December 31, 2001
|
| | | Customer
Deposits
| | Bank of
Spain and
Other Central
Banks
| | Other
Credit
Institutions
| | Total
|
| | | (in millions of euro) |
Domestic | | 72,140 | | 4,680 | | 15,997 | | 92,817 |
Foreign: | | | | | | | | |
Western Europe | | 11,277 | | — | | 20,319 | | 31,596 |
Latin America | | 73,275 | | 28 | | 13,162 | | 86,465 |
United States | | 3,994 | | — | | 3,221 | | 7,215 |
Other | | 5,813 | | — | | 7,181 | | 12,994 |
| | |
| |
| |
| |
|
Total foreign | | 94,359 | | 28 | | 43,883 | | 138,270 |
| | |
| |
| |
| |
|
Total | | 166,499 | | 4,708 | | 59,880 | | 231,087 |
| | |
| |
| |
| |
|
For an analysis of our deposits, including non-interest bearing demand deposits, interest-bearing demand deposits, saving deposits and time deposits, see Notes 17 and 18 to the Consolidated Financial Statements.
As of December 31, 2003, the maturity of our time deposits (excluding interbank deposits) in denominations of $100,000 (approximately €79,177 as of December 31, 2003) or greater was as follows:
| | | | | | |
| | | At December 31, 2003
|
| | | Domestic
| | Foreign
| | Total
|
| | | (in millions of euro) |
3 months or Under | | 7,351 | | 25,425 | | 32,776 |
Over 3 to 6 months | | 1,098 | | 2,073 | | 3,171 |
Over 6 to 12 months | | 1,098 | | 1,882 | | 2,980 |
Over 12 months | | 2,732 | | 3,890 | | 6,622 |
| | |
| |
| |
|
Total | | 12,279 | | 33,270 | | 45,549 |
| | |
| |
| |
|
Time deposits from Spanish and foreign financial institutions amounted to €6.5 billion and €19.8 billion, respectively, as of December 31, 2003, substantially all of which were in excess of $100,000 (approximately €79,177 as of December 31, 2003).
Large denomination deposits may be a less stable source of funds than demand and savings deposits because they are more sensitive to variations in interest rates. For a breakdown by currency of deposits as of December 31, 2003 and 2002, see Note 18 to the Consolidated Financial Statements.
Short-term Borrowings
Securities sold under agreements to repurchase and promissory notes issued by us constituted the only categories of short-term borrowings that equaled or exceeded 30% of stockholders’ equity at December 31, 2001, 2002 and 2003.
| | | | | | | | | | |
| | | At December 31,
| |
| | | 2002
| | | 2001
| |
| | | Amount
| | Weighted
Average Rate
| | | Amount
| | Weighted Average Rate
| |
| | | (in millions of euro, except percentages) | |
Securities sold under agreements to repurchase (principally Spanish Treasury bills): | | | | | | | | | | |
At December 31 | | 39,675 | | 4.65 | % | | 48,080 | | 6.16 | % |
Average during year | | 39,814 | | 4.72 | % | | 45,454 | | 6.51 | % |
Maximum quarter-end balance | | 44,732 | | — | | | 48,080 | | — | |
Other short-term borrowings (principally bank promissory notes): | | | | | | | | | | |
At December 31 | | 5,101 | | 2.85 | % | | 4,642 | | 4.87 | % |
Average during year | | 3,967 | | 3.12 | % | | 5,844 | | 4.11 | % |
Maximum quarter-end balance | | 5,101 | | — | | | 5,880 | | — | |
Total short-term borrowings at December 31 | | 44,776 | | 4.44 | % | | 52,722 | | 6.05 | % |
53
| | | | | |
| | | At December 31, 2003
| |
| | | Amount
| | Average Rate
| |
| | | (in millions of euro,
except percentages) | |
Securities sold under agreements to repurchase (principally Spanish Treasury bills): | | | | | |
At December 31 | | 38,483 | | 2.81 | % |
Average during year | | 36,759 | | 3.52 | % |
Maximum quarter-end balance | | 38,483 | | — | |
Bonds, debentures outstanding and subordinated debt | | | | | |
At December 31 | | 8,173 | | 3.00 | % |
Average during year | | 7,829 | | 3.09 | % |
Maximum quarter-end balance | | 10,764 | | — | |
Bank promissory notes: | | | | | |
At December 31 | | 6,087 | | 2.11 | % |
Average during year | | 4,666 | | 2.13 | % |
Maximum quarter-end balance | | 6,219 | | — | |
Total short-term borrowings at December 31 | | 52,743 | | 2.76 | % |
Additionally, as of December 31, 2003, the “short-term borrowings” caption included mortgage bonds amounting to €7,907 million.
Return on Equity
The following table sets out our return on equity ratios:
| | | | | | |
| | | 2003
| | 2002
| | 2001
|
ROE (net attributable profit/average equity) | | 18.4 | | 13.7 | | 18.0 |
ROA (income before minority interests/average total assets) | | 1.04 | | 0.85 | | 0.99 |
RORWA (income before minority interests/risk weighted assets) | | 1.74 | | 1.48 | | 1.78 |
Dividend pay-out ratio | | 55.0 | | 64.5 | | 51.8 |
Equity to assets ratio | | 4.32 | | 4.33 | | 4.32 |
54
F. Competition
We face strong competition in all of our principal areas of operation. The deregulation of interest rates on deposits in the past decade has led to increased competition for large demand deposits in Spain and the widespread promotion of interest-bearing demand deposit accounts and mutual funds. The capturing of customer funds in Spain had been characterized for several years by a large shift of deposits into mutual funds. In 2002 and 2001, the performance of capital markets reversed this trend and our mutual fund assets under management decreased during such period. In 2003, however, mutual fund deposits once again began to increase and grew by 16% over 2002, compared to the 4% decrease we experience in 2002 versus 2001. During the same period, the trend in deposits has been favorable and our deposits increased 8.5% in 2002 and 10.7% in 2003.
The commercial banking sector in Spain has undergone significant consolidation. In addition to the merger of Banco de Santander, S.A. and Banco Central Hispano S.A. that formed Santander Central Hispano, S.A., BBV and Argentaria merged in October 1999. In the majority of the markets where we provide financial services, Santander Central Hispano is our strongest competitor.
Foreign banks also have a strong presence in Spain. As of December 31, 2003, approximately 12 foreign banks and 58 subsidiaries operated in Spain and several foreign banks have acquired small and medium-sized Spanish banks. Foreign banks and subsidiaries represented 5.3% of banking assets and 2.5% of financial system assets as of December 31, 2003.
Spanish savings banks and money market mutual funds provide strong competition for savings deposits, which form an important part of our deposit base, and, in the case of savings banks, for other retail banking services. Credit cooperatives, which are active principally in rural areas, where they provide savings bank and loan services and related services such as the financing of agricultural machinery and supplies, are also a source of competition.
Insurance companies and other financial services firms also compete for customer funds. Like the commercial banks, savings banks, insurance companies and other financial services firms are expanding the services offered to consumers in Spain.
The EU Directive on Investment Services took effect on December 31, 1995. The EU Directive permits all brokerage houses authorized to operate in other member states of the EU to carry out investment services in Spain. Although the EU Directive is not specifically addressed to banks, it affects the activities of banks operating in Spain.
The entry of on-line banks in the Spanish banking system has increased competition, mainly in savings and time deposits. They have captured two percentage points of market share in just three years through a very aggressive offer of high yield deposits. Moreover, changes in the tax treatment of savings products are encouraging competition from the investment fund and the pension fund industries.
ITEM 5. OPERATING AND FINANCIAL REVIEW AND PROSPECTS
Overview
In the first half of 2003 uncertainty regarding demand and increasing tension in the Middle East resulted in a delay in the hoped for worldwide economic recovery. As a result of these factors and declining employer, consumer and investor confidence in many parts of the world, long-term interest rates remained at historical lows.
The war in Iraq in the Spring of 2003 did not put an end to sluggish worldwide economic growth. Although geopolitical risks decreased, continued slow economic growth sparked increased fears of recession, leading the U.S. Federal Reserve and the European Central Bank to cut long-term interest rates further to historical lows of 1.0% and 2.0%, respectively.
55
In the third quarter of 2003, more positive economic news began to emerge which led to an increase in optimism, particularly in the business sector, for a number of reasons. First, not only did a recovery in the U.S. appear likely, but also improved expectations concerning the Japanese economy and the continued dynamic growth of the Chinese economy provided additional support for increased worldwide economic growth. Second, indications began to emerge that businesses were looking to increase capital expenditures and low interest rates, a recovery of stock markets and a reduction in corporate debt spreads provided companies with favorable borrowing conditions. Third, optimism began to grow that improved productivity in the U.S., though based in part on a reluctance of companies to hire employees, had some permanence which would continue to sustain business activity in the future. In this more favorable economic context, long-term interest rates began to rise in the third and fourth quarters of 2003.
The U.S. dollar, however, continued to depreciate against the euro and several other major world currencies in 2003. The depreciating U.S. dollar undermined GDP growth in the euro zone, which increased a weak 0.5% and was lower in several major European economies, such as France and Germany. In 2003, as in previous years, Spain’s GDP grew faster than the EU average, achieving growth of approximately 2.4%. Spanish inflation in 2003, however, was also higher than the EU average.
In Latin America, GDP growth was a modest 1.2% in 2003, with Mexico’s GDP growing at a rate of 1.1%, due to its strong link to the U.S. economy, and Brazil experiencing zero GDP growth. Argentina had the highest GDP growth, 8%, as it recovered after four years of recession. Latin America’s small increase in GDP was principally due to export growth since domestic demand generally remained depressed. The depreciation of several Latin American currencies and increasing prices for basic goods, for which demand was strong, particularly from China, set favorable conditions for the export market.
The high trade surplus in 2003 contributed to current account surpluses in Latin America, which, together with improved capital flows, resulted in growth in reserves. Net private capital flows increased compared to 2002, but remained low by historical standards as a result of low foreign direct investment, which represents a significant part of foreign financing in many Latin American economies.
Critical Accounting Policies
Note 2 to the Consolidated Financial Statements explains that the Consolidated Financial Statements are presented in the format required by Bank of Spain rules and were prepared by applying the generally accepted accounting principles for banks in Spain, which include the accounting requirements established by the Bank of Spain (“Spanish GAAP”). The presentation format used and Spanish GAAP accounting principles applied vary in certain respects from generally accepted accounting principles in the United States (“U.S. GAAP”) and other rules that are applicable to U.S. banks. A description of the most significant valuation and income recognition principles under Spanish and U.S. GAAP applicable to the Consolidated Financial Statements of BBVA is set forth in Note 32.2.A.
56
Note 3 to the Consolidated Financial Statements contains a summary of our significant accounting policies. We consider certain of these policies to be particularly important due to their effect on the financial reporting of our financial condition, because they require management to make difficult, complex or subjective judgments, some of which may relate to matters that are inherently uncertain. Our reported financial condition and results of operations are sensitive to accounting methods, assumptions and estimates that underlie preparation of the Consolidated Financial Statements. The nature of critical accounting policies, the judgments and other uncertainties affecting application of those policies and the sensitivity of reported results to changes in conditions and assumptions are factors to be considered in conjunction with reviewing our Consolidated Financial Statements and the discussion below. We have identified the following accounting policies as critical to the understanding of our results of operations, since the application of these policies requires significant management assumptions and estimates that could result in materially different amounts to be reported if conditions or underlying circumstances were to change.
Derivatives and other futures transactions
These instruments include unmatured foreign currency purchase and sale transactions, unmatured securities purchase and sale transactions, futures transactions relating to securities, exchange rates or interest rates, forward interest rate agreements, options relating to exchange rates, securities or interest rates and various types of financial swaps.
Macro hedges
These transactions are carried out for hedging and overall management of the financial risks to which we are exposed and aimed at eliminating or significantly reducing currency, interest rate or price risks on asset and liability positions. Similarly, we also treat as hedging transactions certain transactions which, although not specifically assigned to a specific hedged item, form part of global hedges or macro hedges used to reduce the risk to which we are exposed as a consequence of overall management of our assets, liabilities and other transactions. For this reason, the gains or losses arising from these hedging transactions are recorded symmetrically with the revenues and costs of the hedged items, and the collections or payments made in settlement of such hedging transactions are recorded with a balancing item under the “Other Liabilities” and “Other Assets” captions in the Consolidated Balance Sheets.
As of December 31, 2003 and 2002, we had arranged share price risk and interest rate risk macro hedges consisting of transactions in securities listed on the main international markets and long-term deposit transactions, respectively. The security price macro hedges were valued at a quoted market price or based on other valuation techniques. The settlements relating to the interest rate macro hedge were recorded under the accrual method. Our hedging transactions are subject to an integrated system of risk and earnings measurement, enabling us to continually monitor and assess the financial performance of such transactions. As part of this risk monitoring system, for each macro hedge, we record provisions for credit, market and operating risk in accordance with banking practice for similar transactions. In connection with our macro hedging policy, we make assumptions as to interest rates and exchange rates.
Non-hedging transactions valuation
Non-hedging transactions, which are also known as trading transactions, are valued in accordance with Bank of Spain regulations based on the market on which they are traded:
| | • | Transactions arranged in organized markets are valued at quoted market prices and the gains or losses arising as a result of market price fluctuations are recorded in full in our Consolidated Statement of Income. |
| | • | For over the counter (OTC) derivative financial instruments (mainly, forwards, swaps and some options) theoretical closing prices are assessed at least every month and provisions are recorded with a charge to income for the potential net losses, if any, in each risk category (interest rate risk, currency risk and equity risk) and currency arising from such valuations. The potential gains are only recognized in income when effectively realized. This procedure is also applied to currency options traded outside organized markets. |
Although Bank of Spain’s rules provide guidance regarding valuation of OTC derivative financial instruments, we are required to make estimates and assumptions regarding valuations, such as with respect to the futures quotations, maturities and the effects of markets risks.
Theoretical closings are the most reliable measure of fair value for derivative financial instruments. The determination of fair value requires us to make estimates and certain assumptions. If listed market prices are not available, we have to calculate the fair value from commonly used pricing models that consider contractual prices for the underlying financial instruments, yield curves and other relevant factors. Our use of different estimates or assumptions in these pricing models could lead to different amounts being recorded in our Consolidated Financial Statements.
57
Provision for the statistical coverage of credit losses
In December 1999, the Bank of Spain introduced a new solvency provision, the so-called statistical or dynamic provision, focusing on the statistical risk embedded in a bank’s unimpaired loan portfolio. This provision went into effect in July 2000. The main idea behind this provision is to try to capture expected losses, which, during the pendency of loans, are known in a statistical sense but are not yet quantifiable or attributable to specific borrowers. Since the loss risk appears at the beginning of the loan, so does the statistical provision requirement.
The amount of the statistical provision is the difference between the measure of latent risk (expected losses) and any specific provisions already taken (covering impaired assets). In a favorable economic climate, specific provisions are low and statistical provisions are positive. However, during an economic slowdown, as impaired assets increase, specific provisions also increase and the statistical provisions become negative. This means that the statistical fund (accumulated in previous years) starts being used and its proceeds (the difference between the latent risk and the specific provisions) are credited to the Net Loan Loss Provisions line item of the Consolidated Statement of Income.
The new Bank of Spain solvency provision offers banks two options for establishing loan loss provisions. First, to use their own internal measurements of the statistical credit risk and second, to use a standard method wherein the Bank of Spain sets the parameters. We use the standard method, dividing our loan portfolio into six groups, according to the relative riskiness of our different assets, or of our off-balance sheet items with credit risk. A vector of coefficients (ranging from 0 to 1.5%) determined by the Bank of Spain is applied to the loans in each of the six groups. The resulting figure is the estimated expected loss for our entire loan portfolio.
We are currently working on developing our own internal method for calculating statistical credit risk, which is intended to be consistent with the principles of the Basel II accords.
Goodwill in consolidation
This line item in our Consolidated Statement of Income includes the positive differences between the acquisition cost of shares of consolidated companies or companies carried by the equity method and their underlying book value, if such differences cannot be classified as additions to the book value of specific assets of the acquired companies.
We generally amortize goodwill on a straight-line basis over a maximum period of 10 years (20 years for certain non-financial holdings) based on our assumption that this is the period over which the underlying investments will produce income for us.
If we determine that goodwill will not generate income as expected, we may be required to adjust the amortization period accordingly. For example, in 2001 we wrote off in full the unamortized goodwill resulting from our investments in Argentina. The write-off occurred when we realized that no profits resulting from such investments could be expected in the short-term.
Unrealized losses in investment securities
At the end of every fiscal year, we assess our investment securities to determine whether a decline in their fair value has resulted in unrealized gains or losses. If unrealized losses are characterized as “other than temporary”, such losses would be required to be taken as a charge in our Consolidated Statement of Income. In order to assess whether unrealized gains or losses exist, we must first identify whether there has been a change in the securities’ fair value by applying specific valuation methodologies under Spanish GAAP depending on whether the security is debt or equity and part of our trading portfolio, held-to-maturity portfolio or available-for-sale portfolio.
Determinations of fair value for listed securities are generally based on market prices and for unlisted securities on discounted cash flows (for debt) and book value (for equity). A change in fair value that results in a fair value that is lower than amortized cost will generally give rise to an unrealized loss.
Once an unrealized loss has been identified, it must then be classified as “temporary” or “other than temporary”. Under Spanish GAAP there are no general rules regarding the methodologies and factors that must be used or the period of time needed to consider an unrealized loss as “temporary” or “other than temporary”. BBVA’s management considers that an unrealized loss is “temporary” under Spanish GAAP if it believes that it will collect or recover all of the unrealized loss or when due to market conditions (volatility, interest rate evolution or macroeconomic variables) or future expectations, management considers that all or part of an unrealized loss will be recovered. BBVA’s management considers that an unrealized loss is “other than temporary” if it believes that it will not collect or recover all the unrealized loss (credit risk), or when due to market conditions (volatility, interest rate evolution, macroeconomic variables) or future expectations, management considers that all or part of an unrealized loss will not be recovered (market risk). Based on the foregoing factors, BBVA’s management will conclude that an unrealized loss is “other than temporary” when a demonstrable recovery in the fair value of the security is not expected in the near future (one year). BBVA’s management performs this analysis at the end of each reporting period.
As described above, if an unrealized loss is classified as “other-than-temporary” we are required by Bank of Spain regulations to take a charge to our Consolidated Statement of Income under the “net securities write downs” and “market operations” line items.
Our total unrealized losses were €60.3 million, €551.9 million and €116.3 million as of December 31, 2003, 2002 and 2001, respectively.
Charges to our Consolidated Statement of Income as of December 31, 2002 were €282,003 thousand. There were no charges to Consolidated Statement of Income as of December 31, 2003 and 2001.
If management’s assumptions and estimates concerning the probability that we will recover all or part of unrealized losses prove to be inaccurate, or if such assumptions and estimates are modified in light of the evolution of the factors described above, we may be required to change the classification of certain unrealized losses from “temporary” to “other than temporary” and, accordingly, take a corresponding charge to our Consolidated Statement of Income.
International Financial Reporting Standards
We currently prepare our Consolidated Financial Statements in accordance with Spanish GAAP. In June 2002, the Council of Ministers of the European Union adopted new regulations that would require any listed EU company to apply International Financial Reporting Standards (“IFRS”) (previously known as International Accounting Standards or “IAS”) in preparing its consolidated financial statements beginning January 1, 2005. The International Accounting Standards Board issued draft IFRSs on June 19, 2003.
On September 29, 2003, the European Parliament and the Council of Ministers of the European Union adopted all the IFRS/IAS in existence on September 14, 2002 except IAS 32 and IAS 39, which addresses recognition and measurement of financial instruments and will therefore be likely to significantly influence the preparation of our Consolidated Financial Statements under IFRS. Continuing developments in IFRS are expected between now and 2005 and, accordingly, there is uncertainty concerning what IFRSs will be required in 2005, and in particular, about the final version of IAS 39. Consequently, to date, we are unable to estimate the net effect that applying IFRS will have on our results of operations or financial condition, or any component thereof. The effect of such differences, however, may be material, individually or in the aggregate, to financial items reported in our Consolidated Financial Statements relating, among other things, to the accounting treatment for derivative instruments, financial instruments, intangible assets, deferred costs, business combinations and goodwill. The adoption of IFRS may, as a result, affect the valuation methods used to measure and evaluate our performance and make it more difficult to compare our results of operations and financial condition for periods in respect of which IFRS is applied to our results of operations and financial conditions to periods in respect of which Spanish GAAP is applied.
58
A. Operating Results
Events affecting comparability of historical and future results of operations and financial condition
Argentina
Political and economic conditions in Argentina in the last several years have had a significant negative effect on the entire Argentinean banking sector and have consequently severely affected the operating results of our Argentinean banking, and, to a lesser extent, pension fund management operations during the period. Though macroeconomic and political conditions improved in Argentina in 2003, significant instability remained and the extent and scope of any economic and banking recovery are uncertain.
In 2001, we took substantial provisions and write-downs totaling €1,354 million relating to our investments in, and exposure to, Argentina. This amount included provisions of €617 million relating to our entire investment in Argentina, bad debt provisions of €416 million, additional country risk provisions of €34 million, provisions of €92 million relating to the value of Argentine government bonds held by BBVA, a downward revision of €72 million related to the expected reduction in net income and reduced capital gains arising from companies we carry by the equity method and from our portfolio of financial investments and a write-down of €123 million of goodwill corresponding to our Argentine investments. In addition, in 2001 we took a charge to the reserves at consolidated companies (in retained earnings) line item in our Consolidated Balance Sheets of €683 million to account for the devaluation of the Argentine Peso from ARP1.0 per U.S.$1.00 to ARP1.7 to U.S.$1.00 (the opening rate following the closure of the Argentine foreign exchange market), as of December 31, 2001.
In 2002, we entered into a series of transactions with Banco Francés and made an additional provision of €131 million in respect of securities issued by Banco Francés and held by us. This amount was charged to our 2002 consolidated statement of income.
In 2003, BBVA did not make any additional investments in, or provide any financial assistance to, its subsidiaries in Argentina.
As a result of the measures described above, we provisioned for or wrote off our entire investment in Argentina to date. However, despite these provisions and write-downs, the situation in Argentina may continue to have a material adverse effect on our financial condition and results of operations.
Sale of BBV Brasil, S.A.
On January 13, 2003, BBVA announced its intention to sell its Brazilian affiliate, Banco Bilbao Vizcaya Argentaria Brasil, S.A. (“BBV Brasil”) to Banco Bradesco, S.A. (“Bradesco”). On June 9, 2003, upon completion of due diligence, receipt of authorizations from regulatory authorities and approval by the corresponding corporate bodies, BBVA transferred 100% of BBV Brasil to Bradesco, in consideration for which Bradesco paid 35,481,460,311 of its newly-issued ordinary shares and 34,948,501,563 of its newly-issued preferred shares, totaling 4.44% of Bradesco’s share capital, as well as 1,864 million Brazilian Reais in cash, for a total consideration of approximately 2,626 million Brazilian Reais (approximately $900 million). During the second half of 2003, BBVA increased its interest in Bradesco to 5.0%.
As a result of our agreement to sell our entire interest in BBV Brasil, S.A. in January 2003, under Spanish GAAP we accounted for BBV Brasil’s results of operations from January 1, 2003 until June 9, 2003 under the equity method, rather than under full consolidation, which we had applied in 2002 and 2001. In addition, also consistent with Spanish GAAP, for the remainder of 2003 we accounted for our interest in Bradesco under the equity method. Accordingly, whereas in 2002 and 2001 each of the line items in our Consolidated Statement of Income reflected the contribution of BBV Brasil, in 2003 our Brazilian results of operations and investments are reflected only in the “Net income from companies accounted for by the equity method” line item in our Consolidated Statement of Income.
In addition, in connection with our decision to sell BBV Brasil in January 2003, we recorded €189 million of net extraordinary charges, which included an estimated €245 million in exchange rate differences accumulated up to December 31, 2002 relating to BBV Brasil. These provisions were reflected in the “Net income on Group transactions” line item of our Consolidated Statement of Income.
Other Provisions and Charges
In 2002, we elected to take provisions and extraordinary charges of €129 million of extraordinary goodwill amortization in respect of our investments in subsidiaries located in non-investment grade countries, such as Colombia, Venezuela and Peru. These provisions were based on our assessment of the prospects for economic recovery in these countries, the prolongation of the negative effect on earnings of the depreciation in several Latin American currencies and the overall likelihood of our recovering the full value of our investments. In 2002, we also took €81 million of special provisions for early retirement expenses.
59
Effect of the Depreciation of Latin American Currencies
BBVA’s results of operations and financial condition in 2003, 2002 and 2001 were significantly affected by the sharp decline in exchange rates of many of the Latin American currencies in countries in which BBVA operates against the euro. As Latin American currencies depreciate against the euro, when the results of operations and financial condition of our Latin American subsidiaries are included in our Consolidated Financial Statements, the euro value of such results declines, even if, in local currency terms, the Latin American subsidiaries’ results of operations and financial condition have improved or remained flat relative to the prior year. The following table sets forth the exchange rates of several Latin American currencies against the euro, expressed in local currency=€1.00 at December 31, 2003 and 2002, according to the European Central Bank.
| | | | | | | | | | |
| | | December 31, 2003
| | D% from previous year
| | | December 31, 2002
| | D% from previous year
| |
Mexican peso | | 14.1882 | | (22.7 | ) | | 10.9700 | | (26.4 | ) |
Venezuelan bolivar | | 2.020.20 | | (28.1 | ) | | 1,453.49 | | (53.5 | ) |
Colombian peso | | 3,508.77 | | (14.4 | ) | | 3,003.00 | | (32.9 | ) |
Chilean peso | | 748.50 | | 0.9 | | | 755.29 | | (22.9 | ) |
Peruvian new sol | | 4.3810 | | (15.9 | ) | | 3.6867 | | (17.7 | ) |
Argentine peso | | 3.7195 | | (4.8 | ) | | 3.5394 | | (75.1 | ) |
U.S. dollar | | 1.2630 | | (17.0 | ) | | 1.0487 | | (16.0 | ) |
For BBVA, the most significant country that has been adversely affected by declining exchange rates has been Mexico where, as indicated in the foregoing table, the Mexican peso/euro exchange rate has fallen sharply over 2002 and 2003, declining approximately 49% over the two year period. The effect of declining exchange rates in Mexico and in several of the other Latin American countries in which we operate is an important factor that, if this trend were to change and exchange rates improve, may affect the comparability of our historical and future results of operations and financial condition. In addition, declining exchange rates may limit the ability of our results of operations, stated in euro, to fully describe the performance in local currency terms of our Latin American subsidiaries.
Consolidated Statement of Income
Our Consolidated Statement of Income covering the years ended December 31, 2003, 2002 and 2001 is set out below.
Consolidated Statement of Income
| | | | | | | | | | | | | | | |
| | | Year ended December 31,
| | | Change
| |
| | | 2003
| | | 2002
| | | 2001
| | | 2003/2002
| | | 2002/2001
| |
| | | (in millions of euro) | | | (in percentages) | |
Net interest income | | 6,741 | | | 7,808 | | | 8,824 | | | (13.7 | ) | | (11.5 | ) |
Net fee income | | 3,263 | | | 3,668 | | | 4,038 | | | (11.0 | ) | | (9.1 | ) |
| | |
|
| |
|
| |
|
| | | | | | |
Basic margin | | 10,004 | | | 11,476 | | | 12,862 | | | (12.8 | ) | | (10.8 | ) |
Market operations | | 652 | | | 765 | | | 490 | | | (14.8 | ) | | 56.1 | |
| | |
|
| |
|
| |
|
| | | | | | |
Ordinary revenue | | 10,656 | | | 12,241 | | | 13,352 | | | (12.9 | ) | | (8.3 | ) |
General administrative expenses | | (5,031 | ) | | (5,772 | ) | | (6,725 | ) | | (12.8 | ) | | (14.2 | ) |
Personnel costs | | (3,263 | ) | | (3,698 | ) | | (4,243 | ) | | (11.8 | ) | | (12.9 | ) |
Other administrative expenses | | (1,768 | ) | | (2,074 | ) | | (2,482 | ) | | (14.7 | ) | | (16.4 | ) |
Depreciation and amortization | | (511 | ) | | (631 | ) | | (742 | ) | | (19.0 | ) | | (14.9 | ) |
Other operating revenues and expenses, net | | (219 | ) | | (261 | ) | | (286 | ) | | (16.1 | ) | | (8.7 | ) |
| | |
|
| |
|
| |
|
| | | | | | |
Net operating income | | 4,895 | | | 5,577 | | | 5,599 | | | (12.2 | ) | | (0.4 | ) |
Net income from companies accounted for by the equity method | | 383 | | | 33 | | | 393 | | | n.m. | (1) | | (91.5 | ) |
Amortization of consolidation goodwill | | (639 | ) | | (679 | ) | | (1,143 | ) | | (5.9 | ) | | (40.6 | ) |
Net income on Group transactions | | 553 | | | 361 | | | 954 | | | 53.2 | | | (62.2 | ) |
Net loan loss provisions | | (1,277 | ) | | (1,743 | ) | | (1,919 | ) | | (26.7 | ) | | (9.2 | ) |
Net securities write-downs | | — | | | 3 | | | (43 | ) | | — | | | — | |
Extraordinary items, net | | (103 | ) | | (433 | ) | | (727 | ) | | (76.2 | ) | | (40.4 | ) |
| | |
|
| |
|
| |
|
| | | | | | |
Pre-tax profit | | 3,812 | | | 3,119 | | | 3,114 | | | (22.2 | ) | | 0.2 | |
Corporate income tax and other taxes | | (915 | ) | | (653 | ) | | (625 | ) | | 40.1 | | | 4.4 | |
| | |
|
| |
|
| |
|
| | | | | | |
Income before minority interests | | 2,897 | | | 2,466 | | | 2,489 | | | 17.5 | | | (0.9 | ) |
Minority interests | | (670 | ) | | (747 | ) | | (646 | ) | | (10.3 | ) | | 15.8 | |
| | |
|
| |
|
| |
|
| | | | | | |
Net attributable profit | | 2,227 | | | 1,719 | | | 1,843 | | | 29.5 | | | (6.7 | ) |
| | |
|
| |
|
| |
|
| | | | | | |
60
Results of operations for 2003 compared with 2002
Net interest income
Net interest income for 2003 amounted to €6,741 million, a decrease of 13.7% from €7,808 million in 2002, principally due to the negative effect of converting to euro the net interest income of several of our Latin American subsidiaries from their local currency, which depreciated against the euro in 2003, in our Consolidated Statement of Income. The effect of the depreciation of Latin American currencies on our reported net interest income more than offset modest growth in our core domestic commercial banking business, which experienced significant pressure on yield spreads as a result of extremely low market interest rates in Spain in 2003. The low interest rates reduced the spread between the interest we paid on interest-bearing liabilities, principally deposits, and the interest we earned on our interest-earning assets, principally loans, in our core Spanish market to historically low levels. Our efforts to offset this low yield spread by increasing volumes was only partially successful and overall growth in net interest income in Spain was insufficient to offset the strong depreciations of Latin American currencies described above. In addition, net interest income in 2003 was negatively affected by the sale of BBV Brasil, which contributed €304 million in net interest income in 2002.
The following table summarizes the principal components of net interest income for 2003 compared to 2002.
| | | | | | | | | |
| | | Year ended December 31,
| | | Change
| |
| | | 2003
| | | 2002
| | | 2003/2002
| |
| | | (in millions of euro) | | | (in percentages) | |
Financial revenues | | 12,537 | | | 17,234 | | | (27.3 | ) |
Financial expenses | | (6,260 | ) | | (9,784 | ) | | (36.0 | ) |
Income from equities portfolios | | 464 | | | 358 | | | 29.6 | |
Net interest income | | 6,741 | | | 7,808 | | | (13.7 | ) |
Net fee income
Net fee income in 2003 amounted to €3,263 million, a decrease of 11.0% from €3,668 million in 2002, principally due to the depreciation of Latin American currencies and market volatility, which depressed our fee income derived from domestic asset management, securities brokerage and trading activities. In addition, net fee income in 2003 was negatively affected by the sale of BBV Brasil, which contributed €58 million in net fee income in 2002.
61
Basic margin
Adding net interest income and net fee income results in a basic margin of €10,004 million in 2003, a decrease of 12.8% from €11,476 million in 2002.
Market operations
Income from market operations totaled €652 million in 2003, a decrease of 14.8% from €765 million in 2002, principally due to adverse market conditions, particularly in the second half of 2003. In addition, income from market operations in 2003 was negatively affected by the sale of BBV Brasil, which contributed €21 million to income from market operations in 2002.
Ordinary revenue
Adding basic margin and income from market operations results in ordinary revenue of €10,656 million in 2003, a decrease of 12.9% from €12,241 million in 2002.
General administrative expenses
General administrative expenses amounted to €5,031 million in 2003, a decrease of 12.8% from €5,772 million in 2002, principally due to the depreciation of Latin American currencies and to cost containment measures applied throughout BBVA’s operations. During 2003, we reduced our headcount by nearly 6,896 people (7.4%), particularly in Latin America (a reduction of 6,193, or 10.4%, of which 4,610 related to the sale of BBV Brasil in January 2003, and significant personnel cuts were also made in Venezuela and Argentina). Since 2000, when we acquired a significant interest in Bancomer, our total headcount has fallen from 108,082 employees as of December 31, 2000, to 86,197 as of December 31, 2003, a 20.2% reduction, including a net reduction of approximately 2,600 in Spain and 19,000 in Latin America, principally in Mexico, Venezuela, Argentina, Colombia and Brazil.
Depreciation and amortization
Depreciation and amortization of property and equipment and intangible assets amounted to €511 million in 2003, a decrease of 19.0% from €631 million in 2002, principally due to depreciation of Latin American currencies against the euro which decreased the euro value of the property and equipment and intangible assets of our Latin American subsidiaries.
Net operating income
Subtracting, among other items, general administrative expenses and depreciation and amortization from ordinary revenue results in net operating income of €4,895 million in 2003, a decrease of 12.2% from €5,577 million in 2002.
Net income from companies accounted for by the equity method
As described in the following table, in 2003 net income from companies accounted for by the equity method amounted to €383 million, compared to €33 million in 2002.
| | | | | | | | | |
| | | Year ended December 31,
| | | Change
| |
| | | 2003
| | | 2002
| | | 2003/2002
| |
| | | (in millions of euro) | | | (in percentages) | |
Income from companies accounted for by the equity method | | 702 | | | 275 | | | 155.2 | |
Dividend adjustment | | (319 | ) | | (242 | ) | | (31.8 | ) |
| | |
|
| |
|
| | | |
Net income from companies accounted for by the equity method | | 383 | | | 33 | | | n.m. | (1) |
| | |
|
| |
|
| | | |
(1) Not meaningful. | | | | | | | | | |
The significant increase in net income from companies accounted for by the equity method in 2003 was principally due to a strong improvement in the earnings of our investee companies in 2003 after they experienced sharp declines in operating results in 2002. In addition, as described above, in 2003 we accounted for our interest in BBV Brasil from January 1, 2003 until June 9, 2003 and our interest in Bradesco, following the closing of the BBV Brasil transaction on June 9, 2003, under this line item, whereas in 2002, we had accounted for our interest in BBV Brasil under full consolidation. Our interests in BBV Brasil and Bradesco contributed €34 million and €19 million, respectively, to net income from companies accounted for by the equity method in 2003, compared to zero contribution to this line item in 2002.
62
Amortization of consolidation goodwill
Amortization of consolidation goodwill charges amounted to €639 million in 2003, a decrease of 5.9% from €679 million in 2002, principally due to our decreased interest in Credit Lyonnais and the €129 million of extraordinary goodwill charges we recorded in 2002 relating to investments in our subsidiaries located in non-investment grade countries.
Net income on Group transactions
Net income on Group transactions amounted to €553 million in 2003, an increase of 53.2% from €361 million in 2002. This increase was principally due to the sale of our stake in Crédit Lyonnais which resulted in a gain of €342 million.
Net loan loss provisions
Net loan loss provisions amounted to €1,277 million in 2003, a decrease of 26.7% from €1,743 million in 2002. The following table sets forth the changes in the principal items comprising our net loan loss provisions in 2003 and 2002.
| | | | | | | | | |
| | | Year ended December 31,
| | | Change
| |
| | | 2003
| | | 2002
| | | 2003/2002
| |
| | | (in millions of euro) | | | (in percentages) | |
Gross provisions | | (1,821 | ) | | (2,385 | ) | | (23.6 | ) |
Reversals | | 317 | | | 434 | | | (26.9 | ) |
Recoveries | | 227 | | | 208 | | | 9.1 | |
| | |
|
| |
|
| | | |
Net loan loss provisions | | (1,277 | ) | | (1,743 | ) | | (26.7 | ) |
| | |
|
| |
|
| | | |
The decline in net loan loss provisions in 2003 was principally due to the effect of the depreciation of Latin American currencies which required us to take lower loan loss provisions as the euro value of loans made by our Latin American subsidiaries declined. The decrease in net loan loss provisions caused by depreciating currencies more than offset an increase in the percentage of loans in Latin America for which we took provisions in 2003 as a result of adopting more stringent criteria for classification of doubtful loans than are required under applicable Bank of Spain guidelines. These criteria were adopted as a result of regulatory developments in certain countries in which we operate and our effort to apply loan classification criteria on a uniform basis throughout our operations. Our non-performing loan (“NPL”) ratio in 2003 was 1.74%, which was a return to historical levels (1.71% in 2001) after a sharp increase in 2002 to 2.37% as a result of the crisis in Argentina.
Extraordinary items, net
Net extraordinary items in 2003 amounted to a loss of €103 million.
Extraordinary income amounted to €631 million in 2003, a decrease of 60.7% from 2002, and included the following items: €215 million representing gains relating to the effect of inflation accounting in certain countries in which we operate, €96 million representing gains on disposal of property and equipment and long-term financial investments, €80 million representing the recovery of interest earned in prior years and €240 million in other extraordinary gains principally due to the provision of non-banking services. See Note 28.g. to the Consolidated Financial Statements.
Extraordinary losses amounted to €734 million in 2003, a decrease of 64.0% from 2002, and included the following items: €272 million representing losses relating to the effect of inflation accounting in certain countries in which we operate, €118 million representing other losses arising from pension commitments, €52 million relating to losses on disposal of property and equipment and long-term financial investments, €87 million relating to provisions for property received in foreclosures and €205 million in other extraordinary losses.
63
Corporate income tax and other taxes
The effective tax rate for 2003 was 24% compared to 20.9% for 2002, principally due to the change in the composition of our pre-tax profit. The corporate tax reserve amounted to €915 million in 2003, an increase of 40.1% from €653 million in 2002.
Minority interests
Minority interests amounted to €670 million in 2003, a decrease of 10.3% from €747 million in 2002, principally due to our redemption of three series of our outstanding preferred shares.
Net attributable profit
As a result of the items described above, our net attributable profit amounted to €2,227 million in 2003, an increase of 29.5% from €1,719 million in 2002.
Financial condition
Our total assets amounted to €287 billion as of December 31, 2003, an increase of 2.7% from €280 billion as of December 31, 2002, principally due to an increase in due from credit institutions.
As of December 31, 2003, our customer funds (which include deposits, marketable debt securities, subordinated debt, mutual funds and pension funds) amounted to €296 billion, an increase of 2.3% from €289 billion as of December 31, 2002, principally due to an increase in deposits to our mutual funds and pensions plans.
Stockholders’ equity
As of December 31, 2003, stockholders’ equity amounted to €12.4 billion, a decrease of 0.8% from €12.3 billion as of December 31, 2002.
Results of operations for 2002 compared with 2001
Net interest income
Net interest income for 2002 amounted to €7,808 million, a decrease of 11.5% from €8,824 million in 2001, principally due to the exchange rate effect and a 27.7% decrease in dividends.
The following table summarizes the principal components of net interest income for 2002, as compared to 2001.
| | | | | | | | | |
| | | Year ended December 31,
| | | Change
| |
| | | 2002
| | | 2001
| | | 2002/2001
| |
| | | (in millions of euro) | | | (in percentages) | |
Financial revenues | | 17,234 | | | 21,608 | | | (20.2 | ) |
Financial expenses | | (9,784 | ) | | (13,279 | ) | | (26.3 | ) |
Income from equities portfolios | | 358 | | | 495 | | | (27.7 | ) |
| | |
|
| |
|
| | | |
Net interest income | | 7,808 | | | 8,824 | | | (11.5 | ) |
| | |
|
| |
|
| | | |
Net fee income
Net fee income in 2002 amounted to €3,668 million, a decrease of 9.1% from €4,038 million in 2001, principally due to exchange rate variations negatively affecting the Banking in America area and market volatility, which depressed fee income derived from our domestic asset management activities.
64
Basic margin
Adding net interest income and net fee income results in a basic margin of €11,476 million in 2002, a decrease of 10.8% from €12,862 million in 2001.
Market operations
Income from market operations amounted to €765 million in 2002, an increase of 56.1% from €490 million in 2001. Prior to the second quarter of 2002, we charged or credited to our income from market operations exchange rate differences arising from our financings in currencies other than the euro and the investment currency. In the second quarter of 2002, we began to record the financing of our investments in euro such that exchange rate differences no longer affect our income from market operations. See Note 3.b. to the Consolidated Financial Statements.
Ordinary revenue
Adding basic margin and income from market operations results in ordinary revenue of €12,241 million in 2002, a decrease of 8.3% from €13,352 million in 2001.
General administrative expenses
General administrative expenses amounted to €5,772 million in 2002, a decrease of 14.2% from €6,725 million in 2001 principally due to cost containment measures applied throughout BBVA’s operations. During 2002, we reduced our headcount by nearly 5,500 people (5.6%), mostly in Latin America, while in Spain we applied a combined policy of early retirements and recruitment of a large number of young graduates. Over the last two years, our net departures totaled 15,000 employees (13.9%), with approximately 2,000 having taken place in Spain and 13,000 in Latin America, primarily in Mexico, Venezuela, Argentina and Colombia. In addition, in 2002, we cut our number of branch offices by 6.1%, closing 484 (more than 200 in Spain and almost 300 in Latin America). Over the last two years, BBVA has closed a total of 1,442 branch offices (450 in Spain and 979 in Latin America) mainly in Mexico and Argentina.
Depreciation and amortization
Depreciation and amortization of property and equipment and intangible assets amounted to €631 million in 2002, a decrease of 15.0% from €742 million in 2001, principally due to the depreciation of Latin American currencies against the euro during this period.
Net operating income
Subtracting, among other items, general administrative expenses and depreciation and amortization from ordinary revenue results in net operating income of €5,577 million in 2002, a decrease of 0.4% from €5,599 million in 2001.
Net income from companies accounted for by the equity method
As described in the following table, in 2002, net income from companies accounted for by the equity method amounted to €33 million, a decrease of 91.5% from €393 million in 2001.
| | | | | | | | | |
| | | 2002
| | | 2001
| | | Change 2002/2001
| |
| | | (in millions of euro) | | | (in percentages) | |
Income from companies accounted for by the equity method | | 275 | | | 772 | | | (64.4 | ) |
Dividend adjustment | | (242 | ) | | (379 | ) | | (36.1 | ) |
| | |
|
| |
|
| | | |
Net income from companies accounted for by the equity method | | 33 | | | 393 | | | (91.5 | ) |
| | |
|
| |
|
| | | |
The main factors behind this decline were (i) the €104 million charge allocated during the first half of 2002 to restate the income contributed during 2001 by Repsol YPF, BNL and Telefónica, after these companies published their 2001 financial statements, which generally reflected a decline in net income due to the effect of the deteriorating economic situation in Argentina on our investee companies’ operating results and (ii) the downgrading of our 2002 earnings forecasts in respect of such companies due to continued concern over Argentina and other factors, such as in the case of Telefónica its decision to significantly write-down its investments certain UMTS licenses, which reduced our net income from companies accounted for by the equity method by €209 million.
65
Amortization of consolidation goodwill
Consolidation goodwill amortization charges amounted to €679 million in 2002, a decrease of 40.6% from €1,143 million in 2001, principally due to our increased interests in Bancomer and BNL, and the €129 million of extraordinary goodwill charges we recorded relating to investments in our subsidiaries located in non-investment grade countries.
Net income on Group transactions
In 2002, the sluggish financial markets restricted our ability to generate capital gains through investment rotation, limiting net income on Group transactions to €361 million, a decrease of 62.2% from €954 million in 2001. The decrease was offset in part by the sale of our 27.7% interest in Metrovacesa, which generated a capital gain of €375 million, and the sale of our 7.6% interest in Acerinox, which generated a capital gain of €66 million.
Net loan loss provisions
Net loan loss provisions amounted to €1,743 million in 2002, a decrease of 9.2% from €1,919 million in 2001, principally due to changes in the constituent items set forth below.
| | | | | | | | | |
| | | 2002
| | | 2001
| | | Change 2002/2001
| |
| | | (in millions of euro) | | | (in percentages) | |
Gross provisions | | (2,385 | ) | | (2,501 | ) | | (4.6 | ) |
Reversals | | 434 | | | 294 | | | 47.6 | |
Recoveries | | 208 | | | 288 | | | (27.8 | ) |
| | |
|
| |
|
| | | |
Net loan loss provisions | | (1,743 | ) | | (1,919 | ) | | (9.2 | ) |
| | |
|
| |
|
| | | |
Extraordinary items, net
Net extraordinary items in 2002 amounted to a loss of €433 million.
Extraordinary income amounted to €1,607 million in 2002, an increase of 24.1% from 2001, and included the following items: €1,038 million representing gains relating to the effect of inflation accounting in certain countries in which we operate, €261 million representing specific provisions described in Notes 14 and 20 to the Consolidated Financial Statements, €199 million representing gains on disposal of property and equipment and long-term financial investments, €74 million recovery of interest earned in prior years, €4 million representing extraordinary income from pension commitments and €31 million in other extraordinary gains. See Note 28.g. to the Consolidated Financial Statements.
Extraordinary losses amounted to €2,039 million in 2002, an increase of 1% from 2001, and included the following items: €1,034 million representing losses relating to the effect of inflation accounting in certain countries in which we operate, €908 million representing special provisions, €263 million reversal to the specific provision for Argentina, €193 million representing other losses arising from pension commitments, €99 million on losses on disposal of property and equipment and long-term financial investments, €35 million net charge to the theoretical goodwill relating to the sale of BBV Brasil, and €33 million in other extraordinary losses.
Corporate income tax and other taxes
The effective tax rate for 2002 was 20.9% compared to 20.1% for 2001. The corporate tax reserve amounted to €653 million in 2002, an increase of 4.4% from €625 million in 2001.
Minority interests
Minority interests amounted to €747 million in 2002, an increase of 15.8% from €646 million in 2001.
Net attributable profit
As a result of the items described above, our net attributable profit amounted to €1,719 million in 2002, a decrease of 6.7% from €1,843 million in 2001. The decrease was principally due to the declines in net interest income, net fee income and net income on Group transactions.
66
Financial condition
Our total assets amounted to €280 billion as of December 31, 2002, a decrease of 9.6% from €309 billion as of December 31, 2001, principally due to a reduction in the value of our assets in Latin America.
As of December 31, 2002, our customer funds (which include deposits, marketable debt securities, subordinated debt, mutual funds and pension funds) amounted to €289 billion, a decrease of 10.7% from €324 billion as of December 31, 2001, principally due to adverse market conditions.
Stockholders’ equity
As of December 31, 2002, stockholders’ equity amounted to €12.3 billion, a decrease of 7.2% from €13.3 billion as of December 31, 2001.
Results of operations by business area
As described under “Item 4. Information on the Company—Business Overview,” in 2003 we reorganized our business areas such that (i) our Retail Banking in Spain and Portugal area now includes retail banking, and asset management and private banking (which had been included in a separate Asset Management and Private Banking business area in 2002) in Spain and Portugal, (ii) our Banking in America area now includes all of our Latin American operations, including our Mexican operations (which had been a separate business area in 2002) and asset management and private banking in Latin America (but excluding our operations in Argentina, which is a separate business area, and in Brazil, as discussed below) and (iii) as a result of our agreement to sell our entire interest in BBV Brasil in January 2003, and the closing of such sale in June 2003, our Corporate Activities and Other business area included our interest in BBV Brasil for the period January to June 2003, accounted for under the equity method, and for 2002 and 2001, accounted under full consolidation. Due to the special conditions that have affected our operations in Argentina in 2003, we have continued to provide additional disclosure on our Argentinean operations and discuss these operations as if they comprised a separate business area, “Argentina”, and not part of the business area “Banking in America”, where they were included in our Annual Report on Form 20-F for 2001 and prior years.
Retail Banking in Spain and Portugal
| | | | | | | | | | | | | | | |
| | | Year ended December 31,
| | | Change
| |
| | | 2003
| | | 2002
| | | 2001
| | | 2003/2002
| | | 2002/2001
| |
Net interest income | | 3,221 | | | 3,189 | | | 3,025 | | | 1.0 | | | 5.4 | |
Net fee income | | 1,476 | | | 1,510 | | | 1,555 | | | (2.3 | ) | | (2.9 | ) |
| | |
|
| |
|
| |
|
| | | | | | |
Basic margin | | 4,697 | | | 4,699 | | | 4,580 | | | 0.0 | | | 2.6 | |
Market operations | | 44 | | | 46 | | | 63 | | | (3,2 | ) | | (27.0 | ) |
| | |
|
| |
|
| |
|
| | | | | | |
Ordinary revenue | | 4,741 | | | 4,745 | | | 4,643 | | | (0.1 | ) | | 2.2 | |
General administrative expenses | | (2,119 | ) | | (2,124 | ) | | (2,248 | ) | | (0.2 | ) | | (5.5 | ) |
Personnel costs | | (1,391 | ) | | (1,386 | ) | | (1,465 | ) | | 0.4 | | | (5.4 | ) |
Other administrative expenses | | (728 | ) | | (738 | ) | | (783 | ) | | (1.4 | ) | | (5.7 | ) |
Depreciation and amortization | | (114 | ) | | (123 | ) | | (125 | ) | | (7.0 | ) | | (1.6 | ) |
Other operating revenues and expenses, net | | (43 | ) | | (51 | ) | | (59 | ) | | (14.8 | ) | | (13.6 | ) |
| | |
|
| |
|
| |
|
| | | | | | |
Net operating income | | 2,465 | | | 2,447 | | | 2,211 | | | 0.7 | | | 10.7 | |
Net income from companies accounted for by the equity method | | 8 | | | (6 | ) | | 28 | | | n.m | (1) | | n.m. | |
Amortization of consolidation goodwill | | — | | | 1 | | | — | | | — | | | — | |
Net income on Group transactions | | (1 | ) | | — | | | — | | | — | | | — | |
Net loan loss provisions | | (492 | ) | | (433 | ) | | (402 | ) | | 13.6 | | | 7.7 | |
Extraordinary items, net | | (10 | ) | | 5 | | | 6 | | | n.m. | | | (16.7 | ) |
| | |
|
| |
|
| |
|
| | | | | | |
Pre-tax profit | | 1,970 | | | 2,014 | | | 1,843 | | | (2.2 | ) | | 9.3 | |
Corporate income tax and other taxes | | (650 | ) | | (666 | ) | | (587 | ) | | (2.4 | ) | | 13.5 | |
| | |
|
| |
|
| |
|
| | | | | | |
Income before minority interests | | 1,320 | | | 1,348 | | | 1,256 | | | (2.1 | ) | | 7.3 | |
Minority interests | | (81 | ) | | (82 | ) | | (83 | ) | | (1.2 | ) | | (1.2 | ) |
| | |
|
| |
|
| |
|
| | | | | | |
Net attributable profit | | 1,239 | | | 1,266 | | | 1,173 | | | (2.1 | ) | | 7.9 | |
| | |
|
| |
|
| |
|
| | | | | | |
67
Net interest income. Net interest income for 2003 amounted to €3,221 million, a 1.0% increase from €3,189 million in 2002, principally due to growth in our loan portfolio and more efficient asset and liability management, which slightly offset narrowing spreads. Our loan portfolio increased by €11,143 million, or 13.9%, with particularly strong growth in mortgage loans. In 2002, net interest income amounted to €3,189 million, a 5.4% increase from €3,025 million in 2001, and our loan portfolio increased by €8,057 million, or 11.2%, with particularly strong growth in mortgage loans.
Net fee income. Net fee income for 2003 amounted to €1,476 million, a decrease of 2.3% from €1,510 million in 2001, principally due to a decrease in underwriting fees. In 2002, net fee income amounted to €1,510 million, a decrease of 2.9% from €1,555 million in 2001, principally due to a decrease of 6.0% in mutual fund fee income as a result of market instability, which also affected the volume of total funds under management and hindered new fund-capturing efforts.
Basic margin. Adding net interest income and net fee income results in a basic margin of €4,697 million in 2003, compared to basic margin of €4,699 million in 2002, which increased 2.6% from €4,580 million in 2001.
Market operations. Income from market operations amounted to €44 million in 2003, compared to income from market operations of €46 million in 2002, which decreased 27.0% from €63 million in 2001, principally due to lower exchange rate gains.
General administrative expenses, depreciation and amortization and net other operating revenues and expenses. Operating expenses in 2003 amounted to €2,276 million, a decrease of 1.0% from €2,298 million in 2002. Most of the savings were achieved through efficiency plans implemented in 2003, which brought down expense items (personnel costs only increased 0.4%, other administrative expenses fell 1.4%, and depreciation and amortization charges decreased 7.3%). In 2002, operating expenses totaled €2,298 million, a decrease of 5.5%.
Net operating income. Subtracting, among other items, general administrative expenses and depreciation and amortization from ordinary revenue results in net operating income of €2,465 million in 2003, an increase of 0.7% from 2002. In 2002, net operating income amounted to €2,447 million, an increase of 10.7% from 2001.
Other items. Net loan loss provisions amounted to €492 million in 2003, an increase of 13.6% from €433 million in 2002, principally due to an increase in the size of our loan portfolio. In 2002, net loan loss provisions amounted to €433 million, an increase of 7.7% from €402 million in 2001.
Net attributable profit. As a result of the items described above, net attributable profit amounted to €1,239 million in 2003, a decrease of 2.1%. In 2002, net attributable profit amounted to €1,266 million, an increase of 7.9% from €1,173 million in 2001.
68
Wholesale and Investment Banking
| | | | | | | | | | | | | | | |
| | | Year ended December 31,
| | | Change
| |
| | | 2003
| | | 2002
| | | 2001
| | | 2003/2002
| | | 2002/2001
| |
Net interest income | | 678 | | | 718 | | | 744 | | | (5.6 | ) | | (3.5 | ) |
Net fee income | | 178 | | | 209 | | | 225 | | | (14.8 | ) | | (7.1 | ) |
| | |
|
| |
|
| |
|
| | | | | | |
Basic margin | | 856 | | | 927 | | | 969 | | | (7.7 | ) | | (4.3 | ) |
Market operations | | 123 | | | (5 | ) | | 125 | | | n.m. | (1) | | n.m. | |
| | |
|
| |
|
| |
|
| | | | | | |
Ordinary revenue | | 979 | | | 922 | | | 1,094 | | | 6.2 | | | (15.7 | ) |
General administrative expenses | | (310 | ) | | (329 | ) | | (353 | ) | | (5.7 | ) | | (6.79 | ) |
Personnel costs | | (205 | ) | | (212 | ) | | (228 | ) | | (3.3 | ) | | (7.0 | ) |
Other administrative expenses | | (105 | ) | | (117 | ) | | (125 | ) | | (10.3 | ) | | (6.4 | ) |
Depreciation and amortization | | (9 | ) | | (12 | ) | | (12 | ) | | (25.0 | ) | | 0.0 | |
Other operating revenues and expenses, net | | (6 | ) | | (1 | ) | | (2 | ) | | n.m. | | | (50.0 | ) |
| | |
|
| |
|
| |
|
| | | | | | |
Net operating income | | 654 | | | 580 | | | 727 | | | 12.8 | | | (20.2 | ) |
Net income from companies accounted for by the equity method | | 65 | | | 21 | | | 26 | | | n.m. | | | (19.2 | ) |
Amortization of consolidation goodwill | | (2 | ) | | (5 | ) | | (7 | ) | | (60.0 | ) | | (28.6 | ) |
Net income on Group transactions | | 32 | | | 88 | | | 109 | | | (63.6 | ) | | (19.3 | ) |
Net loan loss provisions | | (143 | ) | | (141 | ) | | (130 | ) | | 1.4 | | | 8.5 | |
Extraordinary items, net | | 38 | | | 9 | | | (31 | ) | | n.m. | | | n.m. | |
| | |
|
| |
|
| |
|
| | | | | | |
Pre-tax profit | | 644 | | | 552 | | | 694 | | | 16.7 | | | (20.5 | ) |
Corporate income tax and other taxes | | (135 | ) | | (124 | ) | | (114 | ) | | 8.9 | | | 8.8 | |
| | |
|
| |
|
| |
|
| | | | | | |
Income before minority interests | | 509 | | | 428 | | | 580 | | | 18.9 | | | (26.2 | ) |
Minority interests | | (41 | ) | | (46 | ) | | (49 | ) | | (10.9 | ) | | (6.1 | ) |
| | |
|
| |
|
| |
|
| | | | | | |
Net attributable profit | | 468 | | | 382 | | | 531 | | | 22.5 | | | (28.1 | ) |
| | |
|
| |
|
| |
|
| | | | | | |
Net interest income. Net interest income amounted to €678 million in 2003, a decrease of 5.6% from €718 million in 2002, principally due the fall in interests rates and the weakness of the U.S. dollar against the euro, which negatively affected the interest income generated from our dollar-denominated assets when converted to euro and included in our Consolidated Statement of Income. In 2002, net interest income amounted to €718 million, a decrease of 3.5% from 744 million in 2001, principally due to an 8.3% decrease in lending in this business area as a result of sluggish and uncertain general economic conditions caused by political and financial crises affecting several Latin American countries and the impact of accounting irregularities at several large international companies that affected several large companies and certain business sectors.
Net fee income. Net fee income amounted to €178 million in 2003, a decrease of 14.8% from €209 million in 2002, principally due to a lower level of activity in the equities markets. In 2002, net fee income totaled €209 million, a decrease of 7.1% from €225 million in 2001, as a result of the lower volume of brokering activities by the Investment Banking unit.
Basic margin. Adding net interest income and net fee income results in a basic margin of €856 million in 2003, a decrease of 7.7% from €927 million in 2002. Adding net interest income and net fee income for 2002 results in a basic margin of €927 million, a decrease of 4.3% from €969 million in 2001.
69
Market operations. Income from market operations amounted to €123 million in 2003, compared to a loss of €5 million in 2002, principally due to severe market volatility in 2002.
General administrative expenses, depreciation and amortization and net other operating revenues and expenses. Operating expenses amounted to €325 million in 2003, a decrease of 5% from €342 million in 2002. Most of the cost savings were achieved in the capital markets unit. Personnel costs fell €7 million, or 3.3%, other administrative expenses dropped €12 million, or 10.3%, and depreciation and amortization charges fell €3 million, or 25%. In 2002, operating expenses amounted to €342 million, a decrease of 6.8% from €367 million in 2001. Most of the cost savings were achieved in the Global Markets and Distribution unit.
Net operating income. Subtracting, among other items, general administrative expenses and depreciation and amortization from ordinary revenue results in, net operating income of €654 million in 2003, an increase of 12.8% from €580 million in 2002. In 2002, net operating income was €580 million, a decrease of 20.2% from €727 million in 2001.
Other items. In 2003, net income from companies accounted for by the equity method amounted to €65 million, an increase of 209% from €21 million in 2002, principally due to an increase in the net income of several of our investee companies, particularly in the real estate sector. Net loan loss provisions amounted to €143 million in 2003, an increase of 1.4% from €141 million in 2002, principally due to a moderate 3.6% increase in lending. Net loan loss provisions amounted to €141 million in 2002, an increase of 8.5% from €130 million in 2001, with the Global Corporate Banking unit accounting for the majority of this increase. The Wholesale and Investment Banking business area’s non-performing loan ratio was 0.66% in 2003, compared to 1.24% in 2002 and 0.42% in 2001, principally due to the improved financial condition of many of our corporate clients.
Net attributable profit. As a result of the items described above, net attributable profit amounted to €468 million in 2003, an increase of 22.5% from €382 million in 2002. In 2002, net attributable profit amounted to €382 million, a decrease of 28.1% from €531 million in 2001.
Banking in America
As described above, in 2003 we reorganized our business areas such that our Banking in America area now includes all of our Latin American operations, including our Mexican operations (which had been a separate business area in 2002) and asset management and private banking in Latin America (which also had been included in a separate business area in 2002), but excludes our operations in Brazil, which we have included in our Corporate Activities and Other business area as a result of our sale of BBV Brasil in 2003. In addition, because the political and economic conditions in Argentina in the last several years had a significant negative affect on the entire banking sector and have consequently severely affected the operating results of our Argentinean subsidiaries during the period, during 2003 and 2002, management evaluated and managed our Argentinean operations as if they comprised a separate business area and not part of the Banking in America business area where such operations would otherwise be included. Accordingly, our Argentinean subsidiaries’ operations are discussed under the separate business area, “Argentina”, and not as part of the Banking in America business area.
As discussed above under “—Events Affecting Comparability of Historical and Future Results of Operations and Financial Condition—Effect of the Depreciation of Latin American Currencies”, the depreciation of the currencies against the euro in the Latin American countries in which we operate was the most significant factor affecting the results of operations of our Latin American subsidiaries. In local currency terms, our Latin American subsidiaries sought to increase business volumes and fee income in order to offset the effect of historically low interest rates on yield spreads.
70
| | | | | | | | | | | | | | | |
| | | Year ended December 31,
| | | Change
| |
| | | 2003
| | | 2002
| | | 2001
| | | 2003/2002
| | | 2002/2001
| |
Net interest income | | 2,790 | | | 3,391 | | | 3,988 | | | (17.7 | ) | | (15.0 | ) |
Net fee income | | 1,630 | | | 1,889 | | | 1,872 | | | (13.7 | ) | | 0.9 | |
| | |
|
| |
|
| |
|
| | | | | | |
Basic margin | | 4,420 | | | 5,280 | | | 5,860 | | | (16.3 | ) | | (9.9 | ) |
Market operations | | 196 | | | 277 | | | 285 | | | (29.2 | ) | | (2.8 | ) |
| | |
|
| |
|
| |
|
| | | | | | |
Ordinary revenue | | 4,616 | | | 5,557 | | | 6,145 | | | (16.9 | ) | | (9.6 | ) |
General administrative expenses | | (2,034 | ) | | (2,559 | ) | | (3,007 | ) | | (20.5 | ) | | (14.9 | ) |
Personnel costs | | (1,128 | ) | | (1,444 | ) | | (1,637 | ) | | (21.8 | ) | | (11.8 | ) |
Other administrative expenses | | (906 | ) | | (1,115 | ) | | (1,370 | ) | | (18.8 | ) | | (18.6 | ) |
Depreciation and amortization | | (213 | ) | | (282 | ) | | (339 | ) | | (24.5 | ) | | (16.8 | ) |
Other operating revenues and expenses, net | | (139 | ) | | (179 | ) | | (198 | ) | | (22.3 | ) | | (9.6 | ) |
| | |
|
| |
|
| |
|
| | | | | | |
Net operating income | | 2,230 | | | 2,537 | | | 2,601 | | | (12.1 | ) | | (2.5 | ) |
Net income from companies accounted for by the equity method | | 72 | | | 20 | | | 8 | | | n.m. | (1) | | 150.0 | |
Amortization of consolidation goodwill | | — | | | — | | | — | | | — | | | — | |
Net income on Group transactions | | 14 | | | (3 | ) | | 50 | | | n.m. | | | n.m. | |
Net loan loss provisions | | (495 | ) | | (691 | ) | | (795 | ) | | (28.4 | ) | | (13.1 | ) |
Extraordinary items, net | | (292 | ) | | (193 | ) | | (21 | ) | | 51.3 | | | n.m. | |
| | |
|
| |
|
| |
|
| | | | | | |
Pre-tax profit | | 1,529 | | | 1,670 | | | 1,843 | | | (8.4 | ) | | (9.4 | ) |
Corporate income tax and other taxes | | (369 | ) | | (410 | ) | | (448 | ) | | (10.0 | ) | | (8.5 | ) |
| | |
|
| |
|
| |
|
| | | | | | |
Income before minority interests | | 1,160 | | | 1,260 | | | 1,395 | | | (7.9 | ) | | (9.7 | ) |
Minority interests | | (445 | ) | | (524 | ) | | (588 | ) | | (15.1 | ) | | (10.9 | ) |
| | |
|
| |
|
| |
|
| | | | | | |
Net attributable profit | | 715 | | | 736 | | | 807 | | | (2.9 | ) | | (8.8 | ) |
| | |
|
| |
|
| |
|
| | | | | | |
Net interest income. Net interest income amounted to €2,790 million in 2003, a decrease of 17.7% from €3,391 million in 2002, principally due to depreciations in Latin American currencies. In 2002, net interest income amounted to €3,391 million, a decrease of 15% from €3,988 million from 2001.
Net fee income. Net fee income totaled €1,630 million in 2003, a decrease of 13.7% from €1,889 million in 2002, principally due to depreciations in Latin American currencies, which more than offset efforts to increase fee and commission income by offering additional services to clients. In 2002, fee income amounted to €1,889 million, an increase of 0.9% from 1,872 million in 2001.
Basic margin.Adding net interest income and net fee income results in a basic margin of €4,420 million in 2003, a decrease of 16.3% from €5,280 million in 2002. In 2002, basic margin was €5,280, a decrease of 0.9% from €5,860 million in 2001.
Market operations. Income from market operations in 2003 amounted to €196 million, a decrease of 29.2% from €277 million in 2002, principally due to the depreciation of the currencies in Venezuela and Uruguay against the euro. In 2002, income from market operations amounted to €277 million, a decrease of 2.8% from €285 million in 2001.
71
General administrative expenses, depreciation and amortization and net other operating revenues and expenses. Operating expenses amounted to €2,386 million in 2003, a decrease of 21% from €3,020 million in 2002, principally due to the positive effect on costs of the depreciations in Latin American currencies and efficiency measures implemented in 2003, such as the reduction of 1,097 in headcount and the 1.7% decline in the number of branches, to limit costs increases in local currency terms. In 2002, total operating expenses amounted to €3,020 million, a decrease of 14.8% from €3,544 million.
Net operating income. Subtracting, among other items, general administrative expenses and depreciation and amortization from ordinary revenue results in net operating income of €2,230 million for 2003, a decrease of 12.1% from €2,537 million in 2002. In 2002, net operating income amounted to €2,537 million, a decrease of 2.5% from €2,601 million in 2001.
Other items. In 2003, net income from companies accounted for by the equity method amounted to €72 million, compared to €20 million in 2002, principally due to an increase in the net income of several of our investee companies, particularly insurance companies in which our Latin American subsidiaries own significant interests but we are not permitted to consolidate under Spanish GAAP. Net loan loss provisions amounted to €495 million in 2003, a decrease of 28.4% from €691 million in 2002, principally due to the effect of depreciations in Latin American currencies on the euro value of our Latin American subsidiaries’ loans and an improvement in the quality of such subsidiaries’ loan portfolios. Net loan loss provisions amounted to €691 million in 2002, a decrease of 13.1% from €795 million in 2001. The Banking in America’s NPL ratio was 4.01% in 2003, compared to 3.82% in 2002 and 3.51% in 2001, principally due to the adoption of stricter criteria for classifying loans issued by several of our Latin American subsidiaries as doubtful or non-performing. These criteria were adopted as a result of regulatory developments in certain countries in which we operate and our effort to apply loan classification criteria on a uniform basis throughout our operations. The loan coverage ratio was 169.4% in 2003, compared to 241.6% in 2002 and 242.6% in 2001. Net extraordinary expense amounted to €292 million in 2003, an increase of 51.3% from net extraordinary expense of €193 million in 2002, principally due to the effects of inflation accounting. Net extraordinary expense amounted to €193 million in 2002, compared to €21 million in 2001, principally due to the allocation of special provisions relating to the crisis in Venezuela in 2002.
Net attributable profit. As a result of the items described above, net attributable profit amounted to €715 million in 2003, a decrease of 2.9% from €736 million in 2002. In 2002, net attributable profit amounted to €736 million, a decrease of 8.8% from €807 million in 2001.
72
Corporate Activities and Other
As described above, in January 2003 we agreed to sell our entire interest in BBV Brasil, which we previously included in the Banking in America business area. As a result of such agreement, from January 1, 2003 through June 9, 2003, the date the sale closed, we accounted for BBV Brasil’s business area’s operating results by the equity method. In order to provide a more meaningful presentation of our Banking in America business area’s operating results, we have elected to present the operating results of BBV Brasil—in 2003 carried by the equity method and in 2002 and 2001 under full consolidation—in the Corporate Activities and Other business area rather than in the Banking in America business area.
| | | | | | | | | | | | | | | |
| | | Year ended December 31,
| | | Change
| |
| | | 2003
| | | 2002
| | | 2001
| | | 2003/2002
| | | 2002/2001
| |
Net interest income | | 4 | | | 187 | | | 403 | | | (97.9 | ) | | (53.6 | ) |
Net fee income | | (112 | ) | | (42 | ) | | (49 | ) | | 166.7 | | | (14.3 | ) |
| | |
|
| |
|
| |
|
| | | | | | |
Basic margin | | (108 | ) | | 145 | | | 354 | | | n.m. | (1) | | (59.0 | ) |
Market operations | | 237 | | | 346 | | | (22 | ) | | (31.5 | ) | | n.m. | |
| | |
|
| |
|
| |
|
| | | | | | |
Ordinary revenue | | 129 | | | 491 | | | 332 | | | (73.7 | ) | | 47.9 | |
General administrative expenses | | (416 | ) | | (588 | ) | | (557 | ) | | (29.2 | ) | | 5.6 | |
Personnel costs | | (454 | ) | | (565 | ) | | (560 | ) | | (19.6 | ) | | 0.9 | |
Other administrative expenses | | 38 | | | (23 | ) | | 3 | | | n.m. | | | n.m. | |
Depreciation and amortization | | (154 | ) | | (195 | ) | | (193 | ) | | (21.0 | ) | | 1.0 | |
Other operating revenues and expenses, net | | (23 | ) | | (21 | ) | | (11 | ) | | 9.5 | | | 90.9 | |
| | |
|
| |
|
| |
|
| | | | | | |
Net operating expense | | (464 | ) | | (313 | ) | | (429 | ) | | 48.2 | | | (27.0 | ) |
Net income from companies accounted for by the equity method | | 228 | | | 7 | | | 319 | | | n.m. | | | (97.8 | ) |
Amortization of consolidation goodwill | | (637 | ) | | (675 | ) | | (1,136 | ) | | (5.6 | ) | | (40.6 | ) |
Net income on Group transactions | | 508 | | | 276 | | | 795 | | | 84.1 | | | (65.3 | ) |
Net loan loss provisions | | 42 | | | (229 | ) | | (60 | ) | | n.m. | | | n.m. | |
Extraordinary items, net | | (76 | ) | | (99 | ) | | 27 | | | (23.2 | ) | | n.m. | |
| | |
|
| |
|
| |
|
| | | | | | |
Pre-tax profit | | (399 | ) | | (1,033 | ) | | (484 | ) | | (61.4 | ) | | n.m. | |
Corporate income tax and other taxes | | 296 | | | 458 | | | 171 | | | (35.4 | ) | | n.m. | |
| | |
|
| |
|
| |
|
| | | | | | |
Income before minority interests | | (103 | ) | | (575 | ) | | (313 | ) | | (82.1 | ) | | 83.7 | |
Minority interests | | (102 | ) | | (81 | ) | | (138 | ) | | 25.9 | | | (41.3 | ) |
| | |
|
| |
|
| |
|
| | | | | | |
Net attributable loss | | (205 | ) | | (656 | ) | | (451 | ) | | (68.8 | ) | | 45.5 | |
| | |
|
| |
|
| |
|
| | | | | | |
Net interest income. Net interest income amounted to €4 million in 2003, a decrease of 98% from €187 million in 2002, principally due to our sale of BBV Brasil, which accounted for a decrease in net interest income of €301 million, but was partially offset by the higher dividends collected from investee companies, which increased by 82% over 2002. Net interest income in 2002 amounted to €187 million, a decrease of 53.6% from €403 million in 2001, principally due to the lower dividends collected in 2002.
73
Net fee income. Net fee expense amounted to €112 million in 2003, an increase of 166.7% from net fee expense of €42 million in 2002, principally due to our sale of BBV Brasil, which accounted for an increase in net fee expense of €58 million. Net fee expense in 2002 amounted to €42 million, a decrease of 14.3% from net fee expense of €49 million in 2001.
Basic margin.Adding net interest income and net fee income results in a basic margin of negative €108 million in 2003. Basic margin was €145 in 2002, principally due to the contribution of BBV Brasil, which accounted for €362 million in basic margin.
Market operations. Income from market operations amounted to €237 million in 2003, a decrease of 31.5% from €346 million in 2002, principally due to significant hedging, derivatives and other securities transactions by our Assets and Liabilities Management Committee in 2002. Income from market operations in 2001 was a loss of €22 million.
General administrative expenses, depreciation and amortization and net other operating revenues and expenses. Operating expenses amounted to €593 million in 2003, a decrease of 26.2% from €804 million in 2002, principally due to our sale of BBV Brasil, which accounted for a reduction of €235 million. Operating expenses in 2002 were €804 million, an increase of 5.7% from €761 million in 2001.
Net operating expense. Subtracting, among other items, general administrative expenses and depreciation and amortization from ordinary revenue results in net operating expenses of €464 million in 2003, an increase of 48.2% from €313 million in 2002, principally due to lower operating income as a result of the sale of BBV Brasil, which accounted for a reduction of €146 million. Net operating expense was €313 million in 2002, a decrease of 27.0% from net operating expense of €429 million in 2001.
Net income from companies accounted for by the equity method. Net income from companies accounted for by the equity method amounted to €228 million in 2003, compared to €7 million in 2002, principally due to the change in accounting of the operating results of BBV Brasil during the first half of 2003 and improved operating results of our investee companies. Net income from companies accounted for by the equity method amounted to €7 million in 2002, compared to €319 million in 2001, principally due to the impact of the Argentinean political and economic crisis on the operating results of our investee companies with significant operations in Argentina and, in the case of Telefónica, S.A., its decision to significantly write-down its investments in certain UMTS licenses.
Amortization of consolidation goodwill. Since goodwill arises as a result of transactions undertaken by BBVA that, directly or indirectly, affect all of our business areas, all of our consolidated goodwill is recorded in the Corporate Activities and Other business area. Goodwill amortization charges amounted to €637 million in 2003, a decrease of 5.6% from €675 million in 2002. Goodwill amortization charges amounted to €675 million in 2002, a decrease of 40.6% from €1,143 million in 2001, principally due to unusually high charges in 2001 arising from the incorporation of the goodwill of Bancomer, Banco Francés and Grupo Consolidar.
Net income on Group transactions. Net income on Group transactions amounted to €508 million in 2003, an increase of 84.1% from €276 million in 2002, principally due to the recording of a loss of €189 million from our sale of BBV Brasil in 2002. Net income on Group transactions amounted to €276 million in 2002, a decrease of 65.3% from €795 million in 2001, principally due to exchange rate losses generated in advanced of our sale of BBV Brasil.
Net loan loss provisions. Net loan loss recoveries amounted to €42 million in 2003, compared to net loan loss provisions in 2002 of €229 million, principally due to the reclassification in 2002 of Argentina from group 4 to group 5 in country risk rankings set by the Bank of Spain, which required us to increase our loan coverage position. Unlike other loan loss provisions which are recorded by each business area according to the loan portfolio included within the scope of their activities, all of our country risk provisions are recorded in the Corporate Activities and Other business area. Net loan loss provisions in 2001 amounted to €60 million.
Net attributable loss. As a result of the items described above, net attributable loss amounted to €205 million in 2003, a decrease of 68.8% from €656 million in 2002. Net attributable loss was €656 million in 2002, an increase of 45.5% from net attributable loss of €451 million in 2001.
74
Argentina
Because political and economic conditions in Argentina in the last several years had a significant negative effect on the entire Argentinean banking sector and have consequently severely affected the operating results of our Argentinean subsidiaries during this period, during 2002 and 2003, management evaluated and managed our Argentinean operations as if they comprised a separate business area and not part of the Banking in America and Asset Management and Private Banking business areas where such operations would otherwise be included.
| | | | | | | | | | | | | | | |
| | | Year ended December 31,
| | | Change
| |
| | | 2003
| | | 2002
| | | 2001
| | | 2003/2002
| | | 2002/2001
| |
Net interest income | | 48 | | | 323 | | | 664 | | | (85.1 | ) | | (51.4 | ) |
| | | | | |
Net fee income | | 91 | | | 102 | | | 435 | | | (10.8 | ) | | (76.6 | ) |
| | |
|
| |
|
| |
|
| | | | | | |
Basic margin | | 139 | | | 425 | | | 1,099 | | | (67.3 | ) | | (61.3 | ) |
| | | | | |
Market operations | | 52 | | | 101 | | | 39 | | | (48.5 | ) | | n.m. | (1) |
| | |
|
| |
|
| |
|
| | | | | | |
Ordinary revenue | | 191 | | | 526 | | | 1,138 | | | (63.7 | ) | | (53.8 | ) |
| | | | | |
General administrative expenses | | (152 | ) | | (172 | ) | | (560 | ) | | (11.6 | ) | | (69.3 | ) |
| | | | | |
Personnel costs | | (85 | ) | | (91 | ) | | (353 | ) | | (6.6 | ) | | (74.2 | ) |
| | | | | |
Other administrative expenses | | (67 | ) | | (81 | ) | | (207 | ) | | (17.3 | ) | | (60.9 | ) |
| | | | | |
Depreciation and amortization | | (21 | ) | | (19 | ) | | (73 | ) | | 10.5 | | | (74.0 | ) |
| | | | | |
Other operating revenues and expenses, net | | (8 | ) | | (9 | ) | | (16 | ) | | (11.1 | ) | | (43.8 | ) |
| | |
|
| |
|
| |
|
| | | | | | |
Net operating income | | 10 | | | 326 | | | 489 | | | (96.9 | ) | | (33.3 | ) |
| | | | | |
Net income from companies accounted for by the equity method | | 10 | | | (9 | ) | | 12 | | | n.m. | | | (175.0 | ) |
| | | | | |
Amortization of consolidation goodwill | | 0 | | | 0 | | | 0 | | | — | | | — | |
| | | | | |
Net income on Group transactions | | 0 | | | 0 | | | 0 | | | — | | | — | |
| | | | | |
Net loan loss provisions | | (189 | ) | | (249 | ) | | (532 | ) | | (24.1 | ) | | (53.2 | ) |
| | | | | |
Extraordinary items, net | | 237 | | | (152 | ) | | (751 | ) | | n.m. | | | (79.8 | ) |
| | |
|
| |
|
| |
|
| | | | | | |
Pre-tax profit | | 68 | | | (84 | ) | | (782 | ) | | n.m. | | | (89.3 | ) |
| | | | | |
Corporate income tax and other taxes | | (57 | ) | | 89 | | | 353 | | | n.m. | | | (74.8 | ) |
| | |
|
| |
|
| |
|
| | | | | | |
Income before minority interests | | 11 | | | 5 | | | (429 | ) | | 120.0 | | | n.m. | |
| | | | | |
Minority interests | | (1 | ) | | (14 | ) | | 212 | | | (92.9 | ) | | n.m. | |
| | |
|
| |
|
| |
|
| | | | | | |
Net attributable profit (loss) | | 10 | | | (9 | ) | | (217 | ) | | n.m. | | | (95.9 | ) |
| | |
|
| |
|
| |
|
| | | | | | |
Net interest income. Net interest income amounted to €48 million in 2003, a decrease of 85.1% from €323 million in 2002, principally due to decreases in the yield spread and in volumes of interest-earning assets, which were partially offset by decreases in average interest-bearing liabilities. In 2002, net interest income totaled €323 million, a decrease of 51.4% from €664 million in 2001, principally due to the strong depreciation of the Argentine peso against the euro in 2002 as well as the same factors affecting net interest income in 2003.
75
Net fee income. Net fee income amounted to €91 million in 2003, a decrease of 10.8% from €102 million in 2002, principally due to decreases in the volume and numbers of transactions generating service charges on deposit accounts and in the use of credit cards due to continuing economic instability in Argentina. Net fee income amounted to €102 million in 2002, a decrease of 76.6% from €435 million in 2001, principally due to the same factors affecting net fee income in 2003.
Basic margin.Adding net interest income and net fee income results in a basic margin of €139 million in 2003, a decrease of 67.3% from €425 million in 2001. Basic margin was €425 million in 2002, a decrease of 76.6% from €1,099 million in 2001.
Market operations. Income from market operations amounted to €52 million in 2003, a decrease of 48.5% from €101 million in 2002, principally due to adverse market conditions. Income from market operations in 2002 amounted to €101 million, compared to €39 million in 2001, principally due to gains on foreign exchange derivatives transactions related to the Argentinean Peso.
General administrative expenses, depreciation and amortization and net other operating revenues and expenses. Operating expenses amounted to €181 million in 2003, principally due to decreases in personnel costs, fees and external administrative services, advertising and promotion, business travel and development and other operating expenses. In 2002, total operating expenses amounted to €200 million, a decrease of 69.2% from €649 million in 2001, principally due to strict control of costs and a reduction of 10% in the number of bank personnel.
Net operating income. Subtracting, among other items, general administrative expenses and depreciation and amortization from ordinary revenue results in net operating income of €10 million in 2003, a decrease of 96.9% from €326 million, principally due to the decrease in ordinary revenue. In 2002, net operating income was €326 million, a decrease of 33.3% from €489 million in 2001.
Other items. Net loan loss provisions amounted to €189 million in 2003, a decrease of 24.1% from €249 million in 2002, principally due to increased debt recoveries. Net loan loss provisions amounted to €249 million in 2002, a decrease of 53.2% from €532 million in 2001, principally due to the higher provisions made at the end of 2001 by management against losses arising from Argentina’s economic crisis. Net extraordinary income amounted to €237 million in 2003. In 2002, net extraordinary expense totaled €152 million.
Net attributable profit (loss). As a result of the items described above, net attributable profit amounted to €10 million in 2003, compared to the net attributable loss of €9 million in 2002 and to the net attributable loss of €217 million in 2001.
B. Liquidity and Capital Resources
Our principal source of funds is our customer deposit base, which consists primarily of demand, savings and time deposits. In addition to relying on our customer deposits, we also access the interbank market (overnight and time deposits) and domestic and international capital markets for our additional liquidity requirements. To access the capital markets, we have in place a series of domestic and international programs for the issuance of commercial paper and medium- and long-term debt. We also generally maintain a diversified portfolio of liquid assets and securitized assets. Another source of liquidity is our generation of cash flow. Finally, we supplement our funding requirements, to a very limited extent, with borrowings from the Bank of Spain, mostly short-term at market interest rates, which is a common practice in Spain.
The following table shows the balances in 2003, 2002 and 2001 of our principal sources of funds:
| | | | | | |
| | | Year ended December 31,
|
| | | 2003
| | 2002
| | 2001
|
| | | (in millions of euro) |
Customer deposits | | 141,049 | | 146,560 | | 166,499 |
Due to credit entities | | 61,570 | | 56,119 | | 64,588 |
Debt securities in issue | | 45,673 | | 38,386 | | 37,335 |
| | |
| |
| |
|
Total | | 248,292 | | 241,065 | | 268,423 |
| | |
| |
| |
|
76
As of June 30, 2004, BBVA has issued the following:
| | • | Senior Debt (floating rate bonds) amounted to €1,000 million, maturity date February 26, 2009. |
| | • | Mortgage bonds (fixed rate 3.5%) amounted to €3,000 million, maturity date March 15, 2011. |
| | • | Senior Debt (floating rate bonds) amounted to €2,000 million, maturity date June 16, 2008. |
| | • | Preferred shares amounted to €500 million. |
Deposit Base
Our total customer funds (customer deposits, excluding assets sold under repurchase agreements, marketable debt securities and subordinated debt) amounted to €125 billion as of December 31, 2003, a decrease of 1.58% from €127 billion as of December 31, 2002. Including assets sold under repurchase agreements, customer funds amounted to €141 billion as of December 31, 2003, a decrease of 3.43% from €146 billion as of December 31, 2002. Customer funds decreased principally due to the impact of the Argentine banking crisis on our banking operations in Argentina and the effect of the devaluation of currencies in Colombia, Peru, Mexico and Venezuela, which caused the value in euro of deposits in these countries recorded on our Consolidated Balance Sheets to decrease.
Interbank and Capital Markets
We have increased debt issuances in the domestic and international capital markets in order to finance our activities and as of December 31, 2003, we had €34,383 million of senior debt outstanding, comprising €28,259 million in bonds and debentures and €6,124 million in promissory notes and other securities, compared to €27,523 million, €22,394 million and €5,129 million outstanding as of December 31, 2002, respectively. See Note 19 to the Consolidated Financial Statements. A total of €7,399 million in subordinated debt and €3.9 billion in preferred stock, issued or guaranteed by BBVA was outstanding as of December 31, 2003, compared to €6,487 million and €4.4 billion outstanding as of December 31, 2002, respectively. See Notes 21 and 22 to the Consolidated Financial Statements.
The average maturity of our outstanding debt as of December 31, 2003 was the following:
| | |
Senior debt | | 3 years |
Subordinated debt | | 6 years |
The cost and availability of debt financings are influenced by credit ratings. A reduction in these ratings could increase the cost of, and reduce our access to, debt financing. As of December 31, 2003, our credit ratings were as follows:
| | | | | | |
| | | Short Term
| | Long Term
| | Financial Strength
|
Moody’s | | P-1 | | Aa2 | | B+ |
Fitch—IBCA | | F-1+ | | AA- | | B |
Standard & Poor’s | | A-1+ | | AA- | | — |
On April 4, 2002, Standard & Poor’s revised its rating outlook for BBVA to negative from stable, based on the potential impact on BBVA of a deterioration of Argentina’s financial system. The main ratings agencies, Moody’s, Fitch-IBCA and Standard & Poor’s, have confirmed a stable outlook for BBVA in 2002. In 2003 our ratings did not change.
In December 2003, BBVA Capital Finance, S.A.U., a wholly-owned subsidiary of BBVA, issued preferred stock amounting to €350 million. In 2003, we redeemed several series of preferred shares issued by our financing subsidiaries: (i) on April 22, 2003, $200 million nominal amount of series Cpreferred shares issued by BBVA Capital Funding Ltd., bearing a 7.20% coupon; (ii) on March 31, 2003, $350 million nominal amount of series A preferred shares issued by BBVA International Limited, bearing a 7.20% coupon, and (iii) on June 30, 2003, $248.25 million nominal of series C preferred shares issued by BBVA International Gibraltar, bearing an 8% coupon.
Generation of Cash Flow
We operate in Spain and over 20 other countries, mainly in Europe and Latin America. Although at this moment, except for Argentina, we are not aware of any legal or economic restrictions on the ability of our subsidiaries to transfer funds to our parent company in the form of cash dividends, loans or advances, capital repatriation and other manners, there is no assurance that in the future such restrictions will not be adopted or that, if adopted, they will not negatively affect our liquidity. The geographic diversification of our businesses limits the effect of any restrictions that could be adopted in any given country.
77
We believe that our working capital is sufficient for our present requirements and to pursue our planned business strategies.
Contractual Obligations
| | | | | | | | | | |
| | | Maturity
|
| | | Less Than
One Year
| | One to Three
Years
| | Three to Five
Years
| | Over Five
Years
| | Total
|
| | | (in millions of euro) |
Senior Debt | | 14,031 | | 6,650 | | 4,314 | | 9,388 | | 34,383 |
Subordinated debt | | 267 | | 1,033 | | 222 | | 5,877 | | 7,399 |
Capital Lease Obligations | | 45 | | 64 | | 1 | | — | | 110 |
Operating Lease Obligations | | 5 | | 8 | | 7 | | 20 | | 40 |
Purchase Obligations | | 3 | | 0 | | 0 | | 0 | | 3 |
Total | | 14,351 | | 7,755 | | 4,544 | | 15,285 | | 41,935 |
| | |
| |
| |
| |
| |
|
Other contingent liabilities and commitments
In addition to loans, we had outstanding the following contingent liabilities and commitments at the dates indicated:
| | | | | | |
| | | At December 31,
|
| | | 2003
| | 2002
| | 2001
|
| | | (in thousands of euro) |
Contingent liabilities: | | | | | | |
Rediscounts, endorsements and acceptances | | 11,828 | | 5,370 | | 62,097 |
Guarantees and other sureties | | 13,588,729 | | 15,109,713 | | 13,713,924 |
Other contingent liabilities | | 3,050,954 | | 3,041,745 | | 2,699,583 |
| | |
| |
| |
|
Total contingent liabilities | | 16,651,511 | | 18,156,828 | | 16,475,604 |
Commitments: | | | | | | |
Balances drawable by third parties: | | | | | | |
Credit entities | | 2,723,586 | | 2,521,177 | | 2,349,633 |
Public authorities | | 2,591,339 | | 4,288,788 | | 2,994,873 |
Other domestic sectors | | 27,578,880 | | 25,842,248 | | 26,183,898 |
Non-domestic sectors | | 19,934,934 | | 16,101,984 | | 21,388,686 |
| | |
| |
| |
|
Total balances drawable by third parties | | 52,827,939 | | 48,754,197 | | 52,917,090 |
Other commitments | | 3,070,468 | | 2,865,188 | | 2,372,081 |
| | |
| |
| |
|
Total commitments | | 55,898,407 | | 51,619,385 | | 55,289,171 |
| | |
| |
| |
|
Total contingent liabilities and commitments | | 72,549,918 | | 69,776,213 | | 71,764,775 |
| | |
| |
| |
|
See Note 26 to the Consolidated Financial Statements for additional information with respect to our off-balance sheet arrangements.
78
Off-balance sheet arrangements
In addition to the contingent liabilities and commitments described above, as of December 31, 2003, 2002 and 2001, we had entered into additional transactions which, pursuant to applicable law, are not required to be reflected in our Consolidated Financial Statements. The following table provides information regarding the notional or contractual value of these transactions as of December 31, 2003, 2002 and 2001:
| | | | | | |
| | | At December 31,
|
| | | 2003
| | 2002
| | 2001
|
| | | (in thousands of euro) |
Foreign currency purchase and sale transactions and swaps | | 56,495,811 | | 50,085,387 | | 37,905,142 |
Foreign currency purchases against euro | | 23,376,814 | | 19,611,600 | | 17,456,059 |
Foreign currency purchases against foreign currencies | | 18,651,590 | | 21,640,807 | | 9,896,857 |
Foreign currency sales against euro | | 14,476,407 | | 8,832,980 | | 10,552,226 |
Financial asset purchase and sale transactions | | 1,884,997 | | 6,638,876 | | 2,751,764 |
Purchases | | 725,260 | | 1,085,452 | | 633,455 |
Sales | | 1,159,737 | | 5,553,424 | | 2,118,309 |
Forward rate agreements (FRA) | | 67,325,503 | | 22,413,334 | | 111,359,842 |
Bought | | 37,999,751 | | 13,759,612 | | 57,444,797 |
Sold | | 29,325,752 | | 8,652,722 | | 53,915,045 |
Interest rate swaps | | 533,737,345 | | 454,602,653 | | 436,403,810 |
Securities swaps | | 3,973,217 | | 6,921,838 | | 3,848,898 |
Interest rate futures | | 50,175,854 | | 49,243,706 | | 42,078,138 |
Bought | | 12,768,238 | | 13,136,816 | | 15,572,963 |
Sold | | 37,407,616 | | 36,106,890 | | 26,505,175 |
Securities futures | | 1,574,930 | | 431,910 | | 1,057,253 |
Bought | | 208,991 | | 33,051 | | 301,546 |
Sold | | 1,365,939 | | 398,859 | | 755,707 |
Interest rate options | | 77,524,792 | | 69,366,501 | | 69,283,264 |
Bought | | 42,247,845 | | 37,819,076 | | 36,721,077 |
Sold | | 35,276,947 | | 31,547,425 | | 32,862,187 |
Securities options | | 30,770,515 | | 19,052,486 | | 20,363,023 |
Bought | | 4,934,530 | | 4,303,747 | | 4,878,950 |
Sold | | 25,835,985 | | 14,748,739 | | 15,484,073 |
Foreign currency options and futures | | 8,860,353 | | 8,695,760 | | 22,343,262 |
Bought | | 3,595,772 | | 3,949,889 | | 10,552,096 |
Sold | | 5,264,581 | | 4,745,871 | | 11,791,166 |
Other transactions | | 788,903 | | 1,292,090 | | 818,597 |
| | |
| |
| |
|
Total | | 833,112,220 | | 688,744,541 | | 775,212,993 |
| | |
| |
| |
|
79
The notional or contractual amounts of these transactions do not necessarily reflect the actual risk assumed by us, since our net position in these financial instruments is often the result of offsetting or combining multiple transactions. This net position, even if it is not deemed a hedge for accounting purposes, is used by us generally to eliminate or significantly reduce interest rate, market or exchange risk. The resulting gains or losses on these transactions are included under the market operations caption in the Consolidated Statement of Income. Any gains or losses on hedging transactions are included as an increase in, or offset of, the results on the positions covered by them.
The following table provides information regarding off-balance-sheet funds managed by us as of December 31, 2003, 2002 and 2001:
| | | | | | |
| | | December 31,
|
| | | 2003
| | 2002
| | 2001
|
| | | (in thousands of euro) |
Mutual funds | | 45,751,629 | | 43,581,299 | | 49,900,947 |
Pension funds | | 40,015,408 | | 36,563,294 | | 41,248,849 |
Assets managed | | 27,306,691 | | 28,670,233 | | 33,345,967 |
| | |
| |
| |
|
Total | | 113,073,728 | | 108,841,826 | | 124,495,763 |
| | |
| |
| |
|
Our off-balance sheet funds increased in 2003 principally due to the launch of new products and the change in market trends over the course of 2003.
Agreement with Terra Networks
In connection with the agreement by BBVA and Terra Networks to integrate Uno-e Bank and the individual consumer financing business of Finanzia, BBVA has entered into an agreement with Terra Networks which gives Terra Networks a liquidity mechanism over its shares in the combined entity, that replaces a liquidity mechanism signed on May 15, 2002. The liquidity mechanism provides Terra Networks the right to sell its stake to BBVA between April 1, 2005 and September 30, 2007 at a price equal to the higher of (i) the market value of the securities as determined by an investment bank, and (ii) the amount obtained by multiplying (a) the after-tax profits of Uno-e Bank, by (b) BBVA’s price/earnings ratio, by (c) the percentage holding in Uno-e Bank that Terra Networks intends to sell. However, in no event can the sale price under (i) or (ii) above be less than €148.5 million if Uno-e Bank does not achieve certain net ordinary revenue and pre-tax income targets.
Capital
Under the Bank of Spain’s capital adequacy regulations, as of December 31, 2003 and December 31, 2002, we were required to have a ratio of consolidated stockholders’ equity to risk-weighted assets and off-balance sheet items (net of certain amounts) of not less than 8%.
As of December 31, 2002, our ratio of total capital to risk-weighted assets was 11.2% and our shareholders’ equity exceeded the minimum level required by 23.6%. As of December 31, 2003 this ratio was 11.1% and our shareholders’ equity exceeded the minimum
80
level required by 27.6%. However, based purely on the framework of the Basel Accord and using such additional assumptions as we consider appropriate, we have estimated that as of December 31, 2002 and December 31, 2003, our consolidated Tier I risk-based capital ratio was 8.4% and 8.5%, respectively, and our consolidated total risk-based capital ratio (consisting of both Tier I capital and Tier II capital) was 12.5% and 12.7%, respectively. The Basel Accord recommends that these ratios be at least 4% and 8%, respectively.
For qualitative and quantitative information on the principal risks we face, including market, credit, liquidity, operational and legal risks, see “Item 11. Quantitative and Qualitative Disclosures About Market Risk”.
C. Research and Development, Patents and Licenses, etc.
The research and development activity of BBVA has the main objective of improving the productivity and efficiency of our internal processes and the processes related to our interaction with clients.
With respect to our internal processes, we are actively striving to enhance our efficiency through our corporative Intranet, holding virtual meetings and multi-conferences, the creation of knowledge communities and facilitating the ability of our employees to work remotely.
With respect to client processes, we are working to develop the bank branch of the future which will take advantage of the newest technologies, such as regarding multimedia applications, communications and broadband. In addition, we are working to develop technology to facilitate customer transactions and improve their security.
D. Trend Information
The European financial services sector is likely to remain competitive with increasing numbers of providers of financial services and alternative distribution channels. Further consolidation in the sector (through mergers, acquisitions or alliances) is likely as the other major banks look to increase their market share or combine with complementary businesses. It is foreseeable that regulatory changes will take place in the future that will diminish barriers to such consolidation transactions.
The following are the most important trends, uncertainties and events that are reasonably likely to have a material adverse effect on us or that would cause the financial information disclosed herein not to be indicative of our future operating results or financial condition:
| | • | uncertainties relating to economic growth expectations and interest rate cycles, especially in the United States, and the impact they may have over the yield curve and exchange rates; |
| | • | the effect that an economic slowdown may have over Latin American markets and fluctuations in local interest and exchange rates; |
| | • | the chance that a worsening in the macroeconomic environment will further deteriorate the quality of credit; |
| | • | a downturn in capital markets or a downturn in investor confidence, linked to factors such as geopolitical risk; |
| | • | inflationary pressures and the resulting negative effect they may have on interest rates and economic growth and |
| | • | although it is foreseeable that entry barriers to domestic markets in Europe will be lowered, our plans for expansion into other European markets could be affected by entry barriers in such countries. |
ITEM 6. DIRECTORS, SENIOR MANAGEMENT AND EMPLOYEES
BBVA recognizes the importance of a strong system of corporate governance, in particular for a large financial institution. In addition, BBVA understands corporate governance to be a dynamic process that must be periodically analyzed and updated in light of our assessments of the performance of our existing corporate governance structures and evolving regulations, recommendations and market practice in Spain and elsewhere.
Accordingly, to adapt its corporate governance structure to new requirements recently enacted in Spain, BBVA’s Board of Directors has approved a series of regulations for the Board of Directors that reflect the principles and elements that have shaped and continue to guide BBVA’s system of corporate governance. First, the Board of Directors approved the Regulations of the Board of Directors, which comprises the standards governing the functions and operations of the Board of Directors and its Committees and
81
sets forth the duties and responsibilities of directors, which were formerly set forth in the Directors’ Code. Second, on February 28, 2004, BBVA’s shareholders approved the Regulations of the Shareholders’ Meeting, which provides for certain matters related to shareholders’ rights required under Spanish law. BBVA also has a Code of Ethics and Conduct which applies to the Board of Directors as well as all BBVA employees.
A description of BBVA’s system of corporate governance, the internal codes described above and a report on corporate governance drafted by the Board of Directors, can be found on BBVA’s website at www.bbva.com.
A. Directors and Senior Management
BBVA is managed by a Board of Directors, which, in accordance with BBVA’s current bylaws (Estatutos), as approved by the General Shareholders Meeting on February 28, 2004 (subject to authorization and registration with the Vizcaya Mercantile Registry, which is still pending), must consist of no less than 9 and no more than 16 members. All members of the Board of Directors are elected to serve five-year terms. One-fifth of the members are subject to re-election every year by the shareholders at a general meeting. Directors are appointed to the Board of Directors by our shareholders. Directors must resign at the age of 70. The Chairman of the Board must resign his or her chairmanship upon reaching the age of 65, but may continue to serve as a director thereafter, until reaching the age of 70. The President and Chief Operating Officer and other executive directors must resign from their management positions upon reaching the age of 62, at which point they must also submit their resignation as directors to the Board of Directors. The Board of Directors may nonetheless determine that such executive directors may continue to serve on the board.
According to BBVA’s Regulations of the Board of Directors, at least two-thirds of the members of the Board of Directors must be independent. We consider directors to be independent when they do not hold any other position with BBVA or any of our subsidiaries and they:
| | • | do not own, directly or indirectly, over 3% of our shares and have not been appointed by a shareholder holding over 3% of our shares; |
| | • | are not an entity designated to serve on our Board of Directors, or a representative of any such entity, which holds one or more directorships (an institutional director); |
| | • | have not served as an executive officer, an executive director or as an employee of BBVA’s external auditor, in each case within the last three years; |
| | • | do not have a significant relationship with BBVA, directly or as a partner, shareholder, manager or employee of an entity that has such a relationship, where the relationship could be considered to affect such director’s independence; |
| | • | do not have a family relationship with any director failing to meet the criteria described above and |
| | • | do not possess any other quality or characteristic that, in the judgment of the Board of Directors, might compromise such director’s independence. |
An institutional director is an external director designated by virtue of her or his relationship with a person or entity that is a significant shareholder of BBVA. For this purpose we consider a significant shareholder to be a person or entity that owns, directly or indirectly, at least 5% of the share capital or voting rights of BBVA. If a lower percentage of shares or voting rights allows such person or entity to exercise significant influence over BBVA, such person or their designee shall also be considered an institutional director.
Regulations of the Board of Directors
The following discussion provides a brief description of several significant matters covered in the Regulations of the Board of Directors.
Appointment and Re-election of Directors
The Regulations of the Board of Directors provide that the qualifications of the persons proposed for appointment as directors shall be assessed by the Appointments and Compensation Committee with due reference to the candidates’ personal and professional attributes, as well as the needs of BBVA’s governing bodies at any time.
82
When proposals for re-electing directors are made, the Board of Directors will evaluate the performance of directorship duties of directors proposed for a further term, their dedication, and such other circumstances as may make it advisable to re-elect them or not.
Term of Directorships
Directors shall retire from their directorships at the age of 70, and the Chairman, as Chief Executive Officer, shall retire at the age of 65, continuing to sit on the Board of Directors thereafter. Their resignations should occur in the first session of the Board of Directors to be held after the General Shareholders Meeting that approves the accounts for the year in which they reach such ages.
Executive directors are required to retire from their management positions at the age of 62, following the same timing rules as established in the paragraph above. When, for this or any other reasons, they cease to be executive directors, they shall place their directorship at the disposal of the Board of Directors, which may agree that they should continue to be directors notwithstanding.
Non-executive directors shall cease to be members of any Committee three years after they are appointed, although the Board of Directors may decide to re-appoint them.
One-fifth of the members of the Board of Directors shall be elected by the General Shareholders’ Meeting each year. Directors may serve an unlimited number of terms.
Performance of Directors’ Duties
The members of the Board of Directors shall carry out the duties inherent in their directorship and membership on any Board Committee in accordance with applicable law, BBVA’s bylaws, the Regulations of the Board of Directors, and resolutions adopted by BBVA’s Board of Directors.
Each director will be required to attend the meetings of the Board of Directors and Committees of which he or she forms part, except in cases duly justified, and participate in the deliberations, discussions and debates thereof with regard to the matters which arise at such meetings.
The directors shall have sufficient information to be able to form opinions on issues raised by the Board of Directors and its Committees, and the information shall be furnished as far in advance as required. Additionally, directors may propose to the Board of Directors that external experts, be brought in to assist the Board to consider matters of special complexity or importance.
Directors shall keep confidential the deliberations of the Board of Directors and the Committees on which they sit, and all information to which they may have access in the discharge of their duties, which they shall use exclusively in pursuit of their duties and with due diligence. The obligation of confidentiality shall remain in force event after they have ceased to hold their posts.
Ethics and Code of Conduct
Directors shall behave ethically in their activities and in good faith, in keeping with statutory requirements applicable to those who hold directorships in companies, particularly in financial institutions, according to the principles comprising BBVA’s values.
The Regulations of the Board of Directors regulate such conflicts as may arise between, on the one hand, the interests of the directors and/or their family members, and, on the other hand, the interests of BBVA, and set out the instances of incompatibilities preventing them from exercising their duties as directors, among other matters.
Directors shall abstain from attending and taking part in matters from which a conflict of interest with BBVA may arise.
They shall not be present in the deliberations of the Board of Directors or Committees on which they sit when these relate to affairs in which they may have a direct or indirect interest, and nor shall they carry out personal, professional or commercial transactions with BBVA or its subsidiaries, other than normal banking transactions, unless these are subject to procurement procedures of guaranteed transparency, with competitive bidding and at market prices.
Directors shall also abstain from having a direct or indirect stake in businesses or companies in which BBVA or its subsidiaries has an interest, unless (i) the stake predates their joining the Board of Directors, or BBVA or its subsidiaries acquires the interest after they join the Board of Directors, (ii) the companies are listed on domestic or international stock markets, or (iii) the stake is authorized by the Board of Directors.
83
Directors may not use their position with BBVA to obtain, directly or indirectly, a material advantage, nor take advantage of any business opportunities of which they become aware as a result of their membership on the Board of Directors.
Incompatibilities
In pursuit of their duties, directors shall be subject to rules on incompatible activities.
The Regulations of the Board of Directors also establish specific rules regarding activities incompatible with the performance of duties inside and outside BBVA, except for those cases expressly authorized by our Board of Directors.
In accordance with these incompatibility regulations, directors may not: (i) provide professional services or be an employee, manager or director in companies competing with BBVA or any of BBVA’s subsidiaries; (ii) hold administrative posts in any of the companies in which BBVA holds an interest or (iii) perform any activity that may in any way adversely affect BBVA’s image.
As an exception, executive directors may perform, on our initiative, management tasks in those subsidiaries directly or indirectly controlled by BBVA with the consent of the Executive Committee, and other companies in which BBVA participates with the consent of the Board of Directors.
The non-executive directors may perform management tasks in companies in which BBVA or any of its entities participates if such position is not held as a result of our participation and with the prior consent of the Board of Directors. This limitation does not apply where we have acquired a participation in another company in the ordinary course of our asset management, derivatives coverage or other line of business.
Dismissal of Directors
In the event of breaching the Regulations of the Board of Directors, a director shall place their post at the disposal of the Board of Directors and accept the Board’s decision whether or not they should continue as a director. Should the Board of Directors decide that they should not, they shall tender their resignation in the following cases:
| | • | they fall into any of the incompatible or proscribed categories stipulated under the prevailing regulations, BBVA’s bylaws or the Regulations of the Board of Directors; |
| | • | significant changes take place in their professional circumstances or in the reasons under which they were appointed director; |
| | • | they are in serious breach of their duties as a member of the Board of Directors; |
| | • | events have occurred for which the director, acting as such, may be responsible, which caused serious damage to BBVA’s assets or |
| | • | they lose the commercial and professional status necessary to hold a directorship with BBVA. |
Incompatibility After Severance
Directors who cease to belong to the Board of Directors may not provide services to any other financial institution competing with BBVA or any of its subsidiaries for two years after leaving the Board of Directors, unless the Board of Directors expressly authorizes otherwise. Such authorization may be denied on the ground of BBVA’s best interest.
The Board of Directors
The Board of Directors is currently comprised of 15 members. The following table sets forth the names of the members of the Board of Directors as of the date of this Annual Report, their date of appointment and reelection, if applicable, their current positions and their present principal outside occupation and five-year employment history.
84
| | | | | | | | |
Name
| | Current Position
| | Date Nominated
| | Date Reelected
| | Present Principal Outside Occupation and Five-Year Employment History(*)
|
| Francisco González Rodríguez(1) | | Chairman and Chief Executive Officer | | December 18, 1999 | | | | Director, Empresa Nacional de Electricidad, S.A., October 1996 – October 2000; Chairman, Argentaria, May 1996 –January 2000; Chairman, Uno-e Bank, S.A., December 1999-January 2000; Chairman, BBVA, since January 2000. |
| | | | |
| José Ignacio Goirigolzarri Tellaeche(1) | | President and Chief Operating Officer | | December 18, 2001 | | March 1, 2003 | | Director, Telefónica, S.A., April 2000–April 2003; Vice President, Repsol YPF, S.A., April 2002 – April 2003; Director, BBVA Bancomer Servicios, S.A.; Director, Grupo Financiero BBVA Bancomer; Director, BBVA Bancomer, S.A.; Managing Director, Retail Banking, BBV, 1995 – 2000; Managing Director, Banking in America, BBVA, 2000 – 2001, President and Chief Operating Officer, BBVA, since 2001. |
| | | | |
| Juan Carlos Álvarez Mezquíriz(1)(3) | | Independent Director | | December 18, 1999 | | March 10, 2001 | | Managing Director, Grupo Eulen; Director, Bodegas Vega Sicilia, S.A. |
| | | | |
| Richard C. Breeden | | Independent Director | | October 29, 2002 | | February 28, 2004 | | Chairman, Richard C. Breeden & Co.; Chairman, President and CEO, Equivest Finance, Inc., 1996 – 2002; Bankruptcy Trustee, Bennett Funding Group, 1996-2002. |
| | | | |
| Ramón Bustamante y de la Mora(2)(4) | | Independent Director | | December 18, 1999 | | | | Director, Ctra. Inmo. Urba. Vasco-Aragonesa, S.A. |
| | | | |
| José Antonio Fernández Rivero(4) | | Non-Independent External Director | | February 28, 2004 | | | | Appointed General Manager of BBVA Systems and Operations, 1999, Appointed Group General Manager, 2000, Since 2003: Deputy Chairman of Telefónica and Member of its Audit and Regulation Committees, Member of the Board and Executive Committee of Iberdrola, Director of Banco de Crédito Local, and Chairman of Adquira; Currently Director of Iberdrola S.A. and Vice-president of Telefónica S.A. |
| | | | |
| Ignacio Ferrero Jordi(2)(3) | | Independent Director | | December 18, 1999 | | | | Chairman, Nutrexpa, S.A. |
| | | | |
| Román Knörr Borrás(1) | | Independent Director | | May 28, 2002 | | March 1, 2003 | | Chairman, Carbónicas Alavesas, S.A.; Director, Aguas de San Martín de Veri, S.A.; Director, Mediasal 2000, S.A.; Chairman, Confebask (Basque Business Confederation) |
| | | | |
| Ricardo Lacasa Suárez(2)(4) | | Independent Director | | May 28, 2002 | | March 1, 2003 | | CEO, Banco Popular Español, S.A., until 1999. |
| | | | |
| Carlos Loring Martínez de Irujo(2)(3) | | Independent Director | | February 28, 2004 | | | | Partner, J&A Garrigues, since 1977; Director of the Department of Mergers and Acquisitions, of Banking and Capital Markets, Member of the Management Committee since 1985. |
85
| | | | | | | | |
| José Maldonado Ramos(4)(5) | | Director and General Secretary | | December 18, 1999 | | February 28, 2004 | | Director, Telefónica S.A., February 1999 – April 2003; Secretary of the Board of Directors and Director and General Secretary, Argentaria, May 1997 – 2000; Director and General Secretary, BBVA, since January 2000. |
| | | | |
| Enrique Medina Fernández(1)(4) | | Independent Director | | December 18, 1999 | | February 28, 2004 | | Director and Secretary, Sigma Enviro, S.A. |
| | | | |
| Susana Rodríguez Vidarte(2) | | Independent Director | | May 28, 2002 | | March 1, 2003 | | Dean of Deusto “La Comercial” University since 1996. |
| | | | |
| José María San Martín Espinós(1)(3) | | Independent Director | | December 18, 1999 | | March 10, 2001 | | Director and Managing Director, Construcciones San Martín S.A. |
| | | | |
| Telefónica de España, S.A.(6)(7) | | Non-Independent External Director | | April 17, 2000 | | | | |
| (*) | Where no date is provided, the position is currently held. |
| (1) | Member of the Executive Committee. |
| (2) | Member of the Audit and Compliance Committee. |
| (3) | Member of the Appointments and Compensation Committee. |
| (4) | Member of the Risk Committee. |
| (5) | Secretary of the Board of Directors. |
| (6) | Represented by Mr. Angel Vilá Boix |
| (7) | See “Item 7. Major Shareholders and Related Party Transactions—Related Party |
Transactions—Uno-e Bank Agreement.”
Executive Officers (“Comité de Dirección”)
The executive officers of the bank were each appointed for an indefinite term. Their positions as of the date of this Annual Report are as follows:
| | | | |
Name
| | Current Position
| | Present Principal Outside Occupation and Five-Year Employment History(*)
|
| Francisco González Rodríguez | | Chairman and Chief Executive Officer | | Director, Empresa Nacional de Electricidad, S.A., October 1996 – October 2000; Chairman, Argentaria, May 1996 – January 2000; Chairman, Uno-e Bank, S.A., December 1999 – January 2000. |
| | |
| José Ignacio Goirigolzarri Tellaeche | | President and Chief Operating Officer | | Director, Telefónica, S.A. April 2000 –April 2003; Vice President, Repsol YPF, S.A., April 2002 – April 2003; Director, BBVA Bancomer Servicios, S.A.; Director, Grupo Financiero BBVA Bancomer; Director, BBVA Bancomer, S.A.; Managing Director, Retail Banking, BBV, 1995 – 2000; Managing Director, Banking in America, BBVA, 2000 – 2001. |
| | |
| José Maldonado Ramos | | Director and General Secretary | | Director, Telefónica S.A., February 1999 – April 2003; Director and General Secretary, Argentaria (BBVA since January 2001), since May 1997. |
| | |
| José María Abril Pérez | | Wholesale and Investment Banking | | Director, Repsol S.A.; Director, Cía. Inmob. Metro. Vasco Central; Director, Gas Natural S.A.; Director, Bodegas y Bebidas S.A.; Director, Corp. IBV Servicios Tecnológicos S.A.; Chairman, S.A. Proyectos Industri. Conjuntos; Director, Iberia Lineas Aereas de España, S.A.; Managing Director, Industrial Group, BBVA, since 1999; Managing Director, Industrial and Real Estate Holdings, BBV, 1998 – 1999; Managing Director, BBV, Real Estate Holdings, 1995 – 1998. |
| | |
| Eduardo Arbizu Lostao | | General Counsel | | General Counsel, BBVA, since 2002; Chief Executive Officer, Barclays Bank Spain, 1997 – 2002; General Secretary, Barclays Bank, 1996 – 1997. |
86
| | | | |
Name
| | Current Position
| | Present Principal Outside Occupation and Five-Year Employment History(*)
|
| Ángel Cano Fernández | | Human Resources and Services | | Chief Financial Officer, BBVA, 2001–2002, Controller, BBVA, 2000–2001; Controller, Argentaria, 1998–2000; Assistant Controller, Argentaria, 1996 – 1998. |
| | |
| Manuel González Cid | | Finance Division | | Head of Strategic Planning, Argentaria, Corporacion Bancaria de España, S.A., 1993 – 1998; Deputy General Manager – Head of Corporate Development, Argentaria, 1998 – 1999; Member of the Board of Directors of Banco Atlantico, S.A. and Argentaria Asset Management Companies, 1998 – 1999; Deputy General Manager, BBVA – Head of the Merger Office, 1999 – 2001; Head of Corporate Development, BBVA, 2001 – 2002. |
| | |
| Julio López Gómez | | Retail Banking Spain and Portugal | | Managing Director, BBVA, Retail Banking Spain and Portugal, since 2001; Managing Director, BBVA, Retail Banking Spain, 2001; Corporate Banking, BBVA, 2000 – 2001; Business Development, BBVA, 2000; Business Development, BBV, 1996 – 2000. |
| | |
| Manuel Méndez del Río | | Risks | | Managing Director, Risk Management, BBVA, since 1999; Managing Director, Presidency, Argentaria, 1997 – 1999; Managing Director, Global Risk Management, Investment Funds, Pension Funds and Insurance, Santander Group, 1987 – 1997. |
| | |
| Vitalino Nafría Aznar | | America | | Managing Director, BBVA Bancomer, since 2002; Director, BBVA Bancomer, 2000 – 2002; Chief Executive Officer, BBV Mexico, 1998 – 2000; Managing Director, Basque region, BBV, 1996 – 1998. |
| | |
| Ignacio Sánchez-Asiaín Sanz | | Systems and Operations | | Managing Director, Asset Management and Private Banking, BBVA, since 2001; Managing Director, Americas Banking, 2001; Managing Director, Business Development, Americas Banking, 2000 – 2001; Deputy Managing Director, BBV, 1998 – 2000; Managing Director, Business Development, International Banking, BBV, 1996 – 1998. |
| | |
| José Sevilla Álvarez | | Head of the Office of the Chairman | | Head of Finance Division, Latin American Banking, BBV, 1998 – December 2001; Head of Business Development, BBVA, December 2001 – January 2003; Head of the Office of the Chairman, with responsibility for accountancy, internal audit and compliance, since January 2003. |
| (*) | Where no date is provided, positions are currently held. |
Compliance with NYSE Listing Standards on Corporate Governance
On November 4, 2003, the SEC approved new rules proposed by the New York Stock Exchange (the “NYSE”) intended to strengthen corporate governance standards for listed companies. In compliance therewith, the following is a summary of the significant differences between our corporate governance practices and those applicable to domestic issuers under the NYSE listing standards.
Independence of the Directors on the Board of Directors and Committees
Under the NYSE corporate governance rules, (i) a majority of a U.S. company’s board of directors must be composed of independent directors, (ii) a majority of the audit committee must be composed of independent directors and by July 31, 2005, all members of the audit committee must be independent and (iii) all U.S. companies listed on the NYSE must have a compensation committee and a nominations committee and all members of such committees must be independent. In each case, the independence of directors must be established pursuant to highly detailed rules promulgated by the NYSE and, in the case of the audit committee, the NYSE and the SEC.
Spanish law does not contain any requirement that members of the board of directors or the committees thereof be independent, nor does Spanish law provide any definition of what constitutes independence for the purpose of board or committee membership or otherwise. In addition, Spanish law does not require that a company have a compensation committee or a nominations committee,
87
though there is a non-binding recommendation for listed companies in Spain to have these committees and for them to be composed of a majority of non-executive directors. In practice, Spanish companies generally have three types of directors: executive directors, directorsdominicales appointed by an individual stockholder due to the size of its shareholding and independent directors.
As described above under “—Directors and Senior Management,” BBVA considers directors to be independent when they do not hold any other position with BBVA or any of our subsidiaries and they:
| | • | do not own, directly or indirectly, over 3% of our shares and have not been appointed by a shareholder holding over 3% of our shares; |
| | • | are not an entity designated to serve on our Board of Directors, or a representative of any such entity, which holds one or more directorships (an institutional director); |
| | • | have not served as an executive officer, an executive director or as an employee of BBVA’s external auditor, in each case within the last three years; |
| | • | do not have a significant relationship with BBVA, directly or as a partner, shareholder, manager or employee of an entity that has such a relationship, where the relationship could be considered to affect such director’s independence; |
| | • | do not have a family relationship with any director failing to meet the criteria described above; and |
| | • | do not possess any other quality or characteristic that, in the judgment of the Board of Directors, might compromise such director’s independence. |
We have not determined whether the members of our Board of Directors or its Committees would be considered independent under NYSE and SEC rules. We note, however, that our Board of Directors has a large majority of non-executive directors and 10 out of the 15 members of our Board are independent under the definition of independence described above. In addition, our Audit and Compliance Committee is composed exclusively of independent directors and, in accordance with the non-binding recommendation, BBVA’s Board of Directors has created an Appointments and Compensation Committee which is composed exclusively of independent directors.
Separate Meetings for Independent Directors
In accordance with the NYSE corporate governance rules, independent directors must meet periodically outside of the presence of the executive directors. Under Spanish law, this practice is not contemplated as such. We note, however, that our independent directors meet periodically outside the presence of our executive directors anytime the Audit and Compliance Committee or the Appointments and Compensation Committee meet, since these Committees are comprised solely of independent directors. In addition, our independent directors meet outside the presence of our executive directors as often as they deem fit, and usually prior to meetings of the Board of Directors or its Committees.
B. Compensation
Under BBVA’s bylaws, the Board of Directors is permitted to distribute up to four percent of BBVA’s annual net income to its members, but only after provisions of reserves, as required by law, have been made and after distribution of four percent of BBVA’s net income in the form of dividends to its shareholders.
The Board of Directors, at the proposal of the Appointments and Compensation Committee, which is comprised solely of independent directors, approves BBVA’s system for remuneration of members of the Board of Directors. In 2003, this Committee adopted criteria for the compensation of directors and determined that executive directors would be compensated solely pursuant to their employment contracts relating to their executive positions with BBVA. The compensation criteria adopted by the Appointments and Compensation Committee are based on the responsibilities of the members of the Board of Directors, including their service on Board Committees, as well as the limitations service on the Board of Directors and its Committees places on other professional activities that may be pursued by the directors.
The following table presents information regarding the compensation (in euro) accrued to each member of our Board or Directors serving during 2003.
| | | | | | | | | | | | | | |
Director
| | Board
| | Executive
| | Audit
| | Appointments
| | Risks
| | Chairman
| | Total
|
Alvarez Mezquiriz, Juan Carlos | | 110,000 | | | | 60,000 | | 36,000 | | | | | | 206,000 |
Bustamante y de la Mora, Ramón | | 110,000 | | | | 60,000 | | | | 60,000 | | 45,000 | | 275,000 |
Ferrero Jordi, Ignacio | | 110,000 | | | | 60,000 | | | | | | 90,000 | | 260,000 |
Marañón y Bertrán de Lis, Gregorio | | 110,000 | | | | | | 36,000 | | 60,000 | | | | 206,000 |
Medina Fernández, Enrique | | 110,000 | | 140,000 | | | | | | 60,000 | | | | 310,000 |
San Martín Espinós, José María | | 110,000 | | 140,000 | | | | 36,000 | | | | | | 286,000 |
Tomás Sabaté, Jaume | | 110,000 | | 140,000 | | | | 36,000 | | | | | | 286,000 |
Telefónica de España | | 110,000 | | | | | | | | | | | | 110,000 |
Lacasa Suárez, Ricardo | | 110,000 | | | | | | | | 60,000 | | 150,000 | | 320,000 |
Knörr Borrás, Román | | 110,000 | | 140,000 | | | | | | | | | | 250,000 |
Rodríguez Vidarte, Susana | | 110,000 | | | | 60,000 | | | | | | | | 170,000 |
Breeden, Richard C. | | 300,000 | | | | | | | | | | | | 300,000 |
| | |
| |
| |
| |
| |
| |
| |
|
TOTAL | | 1,510,000 | | 560,000 | | 240,000 | | 144,000 | | 240,000 | | 285,000 | | 2,979,000 |
| | |
| |
| |
| |
| |
| |
| |
|
88
Compensation to BBVA’s executive directors, which under BBVA’s bylaws must be based solely on their employment contracts relating to their executive positions with BBVA, in 2003 was as follows (in euro):
| | | | | | |
| | | Fixed Pay
| | Variable Pay
| | Total
|
Chairman of the Board | | 1,461,000 | | 2,393,000 | | 3,854,000 |
Chief Operating Officer & President | | 1,081,000 | | 1,999,000 | | 3,080,000 |
General Secretary | | 491,000 | | 607,000 | | 1,098,000 |
In 2003, compensation for all executive officers (excluding executive directors) amounted to €3,239,500 of fixed remuneration and €6,331,300 of variable remuneration.
The following table provides the accrued pension benefits for the non-executive members of the Board of Directors as of December 31, 2003:
| | |
Directors
| | Cumulative Amount (in euro)
|
Alvarez Mezquiriz, Juan Carlos | | 124,000 |
Bustamante y de la Mora, Ramón | | 147,000 |
Ferrero Jordi, Ignacio | | 140,000 |
Knörr Borrás, Román | | 85,000 |
Lacasa Suárez, Ricardo | | 99,000 |
Marañón y Bertrán de Lis, Gregorio | | 125,000 |
Medina Fernández, Enrique | | 219,000 |
Rodríguez Vidarte, Susana | | 56,000 |
San Martín Espinós, José María | | 212,000 |
Tomás Sabaté, Jaume | | 207,000 |
In addition, during 2003 a total of €71,000 was paid in medical and accident insurance premiums for the Board of Directors as a whole.
Accrued pension benefits (in euro) for executive directors as of December 31, 2003 were as follows:
| | |
Executive Directors
| | Cumulative Amount
|
Chairman of the Board | | 28,882,000 |
Chief Operating Officer & President | | 23,697,000 |
Secretary General | | 3,090,000 |
As of December 31, 2003, total accrued pension benefits for all executive officers (excluding executive directors) amounted to €21,077,000 million.
Incentive Plans
There is no current incentive program for executive directors and senior managers in effect that is linked to the performance of BBVA’s shares.
89
BBVA’s senior management participates in an incentive plan providing them with possible additional variable non-share based compensation in 2006 if BBVA meets certain specified performance targets in 2003, 2004 and 2005.
Advance Payments and Personal Loans to Directors and Executive Officers
The total of advance payments and personal loans granted by BBVA and its consolidated subsidiaries to the members of the Board of Directors and outstanding as of December 31, 2003 amounted to €260,500 at interest rates between 4% and 5%, of which €92,000 was granted to executive directors and €168,500 to independent directors. As of December 31, 2003, no guarantees had been extended to secure members of the Board of Directors’ obligations or commitments.
The total of advance payments and personal loans granted by BBVA to executive officers (excluding executive directors) and outstanding as of December 31, 2003 amounted to €1,945,000. As of December 31, 2003, no guarantees had been extended to secure executive officers’ obligations or commitments.
C. Board Practices
Committees
The Board of Directors has created the Executive Committee, the Audit and Compliance Committee, the Appointments and Compensation Committee and the Risk Committee. All the Board of Directors Committees were formed on June 28, 2002. These Committees are discussed below.
Executive Committee
BBVA’s Board of Directors is assisted in fulfilling its responsibilities by the Executive Committee (Comisión Delegada Permanente) of the Board of Directors, which, under BBVA’s Regulations of the Board of Directors, must be comprised of at least half plus one independent director. The Board of Directors delegates all management functions, except those that it must retain due to legal or statutory requirements, to the Executive Committee.
As of May 31, 2004, BBVA’s Executive Committee was comprised of two executive directors and four independent directors, as follows.
| | |
| Chairman and Chief Executive Officer: | | Mr. Francisco González Rodriguez |
| |
| President and Chief Operating Officer: | | Mr. José Ignacio Goirigolzarri Tellaeche |
| |
| Members: | | Mr. Román Knörr Borrás Mr. Enrique Medina Fernández Mr. José María San Martín Espinós Mr. Juan Carlos Álvarez Mezquíriz |
The Executive Committee is responsible for the matters delegated to it by the Board of Directors, so long as such matters are also consistent with its authority as set forth in BBVA’s bylaws. Such matters include the management of BBVA and establishment of BBVA’s general policy guidelines, review and authorization of investments by BBVA, approval or rejection of transactions and initiation of internal investigations and audits in any area of BBVA’s business. The Executive Committee generally holds meetings two times a month, but may meet as often as deemed necessary by the Committee chairman or at the request of a majority of the Committee’s members. During 2003, the Executive Committee held a total of 28 meetings.
The Executive Committee is responsible for evaluating BBVA’s system of corporate governance, which it assesses in the context of ongoing developments generally affecting BBVA and new legislative or regulatory initiatives or recommendations in Spain and elsewhere regarding corporate governance.
Audit and Compliance Committee
The Audit and Compliance Committee supervises preparation of BBVA’s consolidated financial statements and is responsible for the functioning of BBVA’s internal control function. The Audit and Compliance Committee is required under our bylaws to have a minimum of four members, one of whom acts as Chairman, appointed by the Board of Directors. In accordance with The Regulations of the Board of Directors, the Audit and Compliance Committee must be comprised only of independent directors, who may not also be members of the Executive Committee.
90
At May 31, 2004, the Audit and Compliance Committee members were:
| | |
Chairman: | | Mr. Ricardo Lacasa Suárez |
| |
Members: | | Mr. Ramón Bustamante y de la Mora Mr. Ignacio Ferrero Jordi Mr. Carlos Loring Martínez de Irujo Mrs. Susana Rodríguez Vidarte |
The Audit and Compliance Committee’s governing charter, which has been approved by the Board of Directors, sets forth its responsibilities and procedures . The Audit and Compliance Committee is generally responsible for assisting the Board of Directors with preparation of BBVA’s Consolidated Financial Statements and supervising BBVA’s internal control procedures.
In this regard, the Audit and Compliance Committee’s principal responsibilities include:
| | • | Supervising the sufficiency, adequacy and effectiveness of BBVA’s internal control systems to ensure the accuracy, reliability, sufficiency and clarity of (i) BBVA’s financial statements contained in annual and quarterly reports and (ii) accounting or financial information which may be requested by the Bank of Spain or other regulators, including regulators in countries outside of Spain where BBVA operates. |
| | • | Monitoring BBVA’s compliance with applicable domestic and international regulations relating to money laundering, conduct in securities markets, data protection and competition, as well as ensuring that requests for information or remedial action by regulators holding competency in these areas are fulfilled. |
| | • | Ensuring that the ethical and other codes of conduct applicable to BBVA’s personnel meet regulatory requirements and are otherwise adequate. |
| | • | Monitoring compliance by BBVA directors with BBVA’s Regulations of the Board of Directors, as well as with regulations applicable to Directors’ conduct in the securities markets. |
To ensure the accuracy, reliability, sufficiency and clarity of BBVA’s Consolidated Financial Statements, the Audit and Compliance Committee closely supervises the preparation of such financial statements, holding frequent meetings with BBVA executives responsible for preparation of the Consolidated Financial Statements as well as with BBVA’s external auditor.
The Audit and Compliance Committee is responsible for selecting BBVA’s external auditor, which is appointed at the General Shareholders Meeting, and supervising the performance by such external auditor of the services it was contracted to perform, in accordance with the terms of the engagement. In particular, the Audit and Compliance Committee’s supervision of the external auditor is aimed at ensuring compliance with regulatory requirements as well as with BBVA’s internal policies.
The Audit and Compliance Committee is responsible for ensuring that BBVA’s external auditor is independent. This duty is discharged by the Audit and Compliance Committee through its monitoring of the external auditor’s activities, including assessing whether any report, opinion or recommendation delivered by the external auditor is conditioned on any other relationship of the external auditor with BBVA and by prohibiting the delivery of consulting and auditing services by the same external auditing firm, other than in special circumstances receiving the Committee’s (or the Chairman’s, if such authority is delegated to him) specific prior approval.
The Audit and Compliance Committee is also responsible for supervising BBVA’s internal audit and reviews and approves BBVA’s internal audit schedule for each fiscal year and monitors the execution of the internal audit through ongoing contact with BBVA’s chief internal audit officer. Over the course of 2003, the chief internal audit officer attended seven meetings of the Audit and Compliance Committee, and met regularly with the Committee Chairman, to report on the progress of the internal audit. In addition, the Audit and Compliance Committee supervises BBVA’s compliance with regulatory requirements and reviews and approves BBVA’s regulatory compliance department’s annual action plan. The Committee is responsible for staying abreast of relevant regulatory developments in Spain, the United States and elsewhere and ensuring that BBVA complies with its regulatory obligations on a timely basis. Over the course of 2003, management staff from the regulatory compliance department attended five meetings of the Audit and Compliance Committee and met regularly with the Committee Chairman.
91
During 2003, the Audit and Compliance Committee held a total of 13 meetings. BBVA’s external auditor attended 8 such meetings and met on numerous other occasions with the Committee’s Chairman. The Committee may meet as often as deemed necessary in order to discharge its responsibilities.
In order to effectively discharge its duties, the Audit and Compliance Committee may request that BBVA staff from any area of its operations attend its meetings to provide additional information or expertise regarding any topic on the Committee’s agenda. External experts may also be contracted to attend Committee meetings to provide expertise in areas relevant to the Committee’s duties that, due to their technical nature or as a result of conflicts of interest that may exist, cannot be advised upon by internal staff.
Appointments and Compensation Committee
The Appointments and Compensation Committee assists the Board of Directors in selecting candidates proposed to be appointed as members of the Board of Directors and in setting director compensation, though the Board of Directors itself must approve such matters. On behalf of the Board of Directors, this Committee evaluates the qualification of the persons proposed to be appointed as members of the Board of Directors and considers the suitability of the candidates’ personal and professional attributes for such appointment. The Committee also assists the Board of Directors with setting director compensation, taking into account the responsibilities of members of the Board of Directors as well as the limitations service on the Board of Directors places on other professional activities that may be pursued by the directors. The Appointments and Compensation Committee determines the remuneration and other benefits for BBVA’s Chairman and CEO and other executive directors. The Committee also analyzes proposals for multi-annual incentive plans for senior management.
Pursuant to the Regulations of the Board of Directors, the Appointments and Compensation Committee is required to have a minimum of three members, all of which must be independent.
As of May 31, 2004, the members of the Appointments and Compensation Committee were:
| | |
Chairman: | | Mr. Ignacio Ferrero Jordi |
| |
Members: | | Mr. Juan Carlos Álvarez Mezquíriz Mr. Carlos Loring Martínez de Irujo Mr. José María San Martín Espinós |
During 2003, the Appointments and Compensation Committee held a total of 13 meetings. The Committee may meet as often as deemed necessary in order to discharge its responsibilities.
The Appointments and Compensation Committee may request that BBVA staff from any area of its operations attend its meetings to provide additional information or expertise regarding any topic on the Committee’s agenda. External experts may also be contracted to attend Committee meetings to provide expertise in areas that, due to their technical nature or as a result of conflicts of interest that may exist, cannot be advised upon by internal staff.
Risk Committee
The Risk Committee is responsible for supervising the analysis and periodic monitoring of BBVA’s risk management on behalf of the Board of Directors. Though the Executive Committee is required to approve BBVA’s overall risk strategies and policies, the Risk Committee analyzes these matters and makes recommendations to the Executive Committee relating thereto. The Risk Committee also monitors the overall level of credit, market and other risks BBVA assumes, reviews transactions delegated to it for approval and verifies that BBVA is equipped with the procedures and structures representing the best practices for risk management in the market.
The Committee is required to be comprised of a majority of non-executive directors. At May 31, 2004, the members of the Risk Committee were:
| | |
Chairman: | | Mr. José Antonio Fernández Rivero |
| |
Members: | | Mr. Ramón Bustamante y de la Mora Mr. Ricardo Lacasa Suárez Mr. José Maldonado Ramos Mr. Enrique Medina Fernández |
92
The Risk Committee is governed by a charter approved by the Board of Directors. The charter states that the Risk Committee may meet as often as necessary to discharge its responsibilities. During 2003, the Risks Committee held a total of 106 meetings.
D. Employees
As of December 31, 2003, we, through our various affiliates, had 86,197 employees. Approximately 69.80% of our employees in Spain held technical, managerial and executive positions, while the remainder were clerical and support staff. The table below sets forth the number of BBVA employees by geographic area.
| | | | | | | | |
Country
| | BBVA
| | Banks
| | Companies
| | Total
|
Spain | | 30,036 | | 676 | | 383 | | 31,095 |
United Kingdom | | 116 | | — | | — | | 116 |
France | | 102 | | — | | — | | 102 |
Italy | | 40 | | — | | — | | 40 |
Germany | | 6 | | — | | — | | 6 |
Switzerland | | 2 | | 86 | | — | | 88 |
Portugal | | — | | 936 | | — | | 936 |
Belgium | | 34 | | — | | — | | 34 |
Jersey | | — | | 33 | | — | | 33 |
Russia | | 3 | | — | | — | | 3 |
Andorra | | — | | 225 | | — | | 225 |
Ireland | | — | | 6 | | — | | 6 |
Gibraltar | | — | | 2 | | — | | 2 |
| | |
| |
| |
| |
|
Total Europe | | 30,339 | | 1,964 | | 383 | | 32,686 |
Securities New York | | — | | 42 | | — | | 42 |
New York | | 119 | | — | | — | | 119 |
Miami | | 92 | | — | | — | | 92 |
Grand Cayman | | 28 | | — | | — | | 28 |
| | |
| |
| |
| |
|
Total North America | | 239 | | 42 | | — | | 281 |
Panama | | — | | 228 | | — | | 228 |
Puerto Rico | | — | | 1,062 | | — | | 1,062 |
Argentina | | 5 | | 5,223 | | — | | 5,228 |
Brazil | | 9 | | — | | — | | 9 |
Colombia | | 5 | | 4,483 | | — | | 4,488 |
Venezuela | | 8 | | 6,127 | | — | | 6,135 |
México | | 11 | | 28,388 | | — | | 28,399 |
Uruguay | | 29 | | 151 | | — | | 180 |
Paraguay | | — | | 95 | | — | | 95 |
Bolivia | | 2 | | — | | 175 | | 177 |
Chile | | 5 | | 3,414 | | — | | 3.419 |
El Salvador | | — | | — | | 420 | | 420 |
Dominican Republic | | — | | — | | 339 | | 339 |
Cuba | | 1 | | — | | — | | 1 |
Peru | | 6 | | 2,851 | | — | | 2,857 |
Ecuador | | — | | — | | 144 | | 144 |
| | |
| |
| |
| |
|
Total Latin America | | 81 | | 52,022 | | 1,078 | | 53,181 |
Hong Kong | | 37 | | — | | — | | 37 |
Japan | | 5 | | — | | — | | 5 |
Iran | | 3 | | — | | — | | 3 |
China | | 4 | | — | | — | | 4 |
| | |
| |
| |
| |
|
Total Asia | | 49 | | — | | — | | 49 |
| | |
| |
| |
| |
|
Total | | 30,708 | | 54,028 | | 1,461 | | 86,197 |
| | |
| |
| |
| |
|
93
The terms and conditions of employment in private sector banks in Spain are negotiated with trade unions representing bank employees. Wage negotiations take place on an industry-wide basis. This process has historically produced collective bargaining agreements binding upon all Spanish banks and their employees. The most recent collective bargaining agreement was executed on February 11, 2004 and applies from January 1, 2003 until December 31, 2004.
As of December 31, 2003, we had 2,578 temporary employees in our Spanish offices.
E. Share Ownership
As of May 18, 2004, the members of the Board of Directors owned an aggregate of 37,997,777 BBVA shares as shown in the table below:
| | | | | | | | |
Name
| | Directly
Owned Shares
| | Indirectly
Owned Shares
| | Total
Shares
| | % of Capital
Stock
|
Chairman and Chief Executive Officer: | | | | | | | | |
Francisco González Rodríguez | | 666 | | 1,139,626 | | 1,140,292 | | 0.0336 |
President and Chief Operating Officer: | | | | | | | | |
94
| | | | | | | | |
Name
| | Directly
Owned Shares
| | Indirectly
Owned Shares
| | Total Shares
| | % of Capital
Stock
|
José Ignacio Gorigolzarri Tellaeche | | 117,612 | | 281,819 | | 399,431 | | 0.0118 |
Directors: | | | | | | | | |
Juan Carlos Álvarez Mezquiriz | | 30,530 | | 0 | | 30,530 | | 0.0009 |
Richard C. Breeden | | 8,000 | | 0 | | 8,000 | | 0.0002 |
Ramón Bustamante y de la Mora | | 10,139 | | 710 | | 10,849 | | 0.0003 |
José Antonio Fernández Rivero | | 50,000 | | 0 | | 50,000 | | 0.0015 |
Ignacio Ferrero Jordi | | 2,387 | | 7,000 | | 9,387 | | 0.0003 |
Román Knörr Borrás | | 14,616 | | 1,852 | | 16,468 | | 0.0005 |
Ricardo Lacasa Suárez | | 8,310 | | 0 | | 8,310 | | 0.0002 |
Carlos Loring Martínez de Irujo | | 9,149 | | 0 | | 9,149 | | 0.0003 |
José Maldonado Ramos | | 11,537 | | 0 | | 11,537 | | 0.0003 |
Enrique Medina Fernández | | 26,428 | | 989 | | 27,417 | | 0.0008 |
Susana Rodríguez Vidarte | | 9,607 | | 0 | | 9,607 | | 0.0003 |
José María San Martín Espinós | | 18,490 | | 33,087 | | 51,577 | | 0.0015 |
Telefónica de España, S.A. | | 0 | | 36,215,223 | | 36,215,223 | | 1.0680 |
| | |
| |
| |
| |
|
Total | | 317,471 | | 37,680,306 | | 37,997,777 | | 1.1206 |
| | |
| |
| |
| |
|
No member of the Board of Directors, held options over BBVA’s shares as of May 31, 2004, except as explained below in the paragraph on “Two Thousand” program.
As of March 31, 2004, the executive officers (excluding executive directors) and their families owned 4,801,830 shares. None of our executive officers holds 1% or more of BBVA’s shares.
As a general policy, we do not extend credit to employees or third parties for the purpose of acquiring BBVA’s shares.
As a consequence of the implementation of the extraordinary incentive plans at BBV, we maintained, at December 31, 2003, or currently maintain the following commitments:
95
The “Two Thousand” program at BBV granted employees the right to acquire shares at the price of €6.01 per share for the 1998 premiums and at the price of €10.65 per share for the 1999 premiums. As of December 31, 2003 there were 7,768,064 shares outstanding under the “Two Thousand” program. As of May 31, 2004, BBVA’s executive officers held options granted under this program as follows:
| | | | | | | | | | | | |
| | | Granted in 1998
| | Granted in 1999
| | |
| | | Number
| | Exercise
price
| | Number
| | Exercise
price
| | Total
|
José Ignacio Goirigolzarri Tellaeche(1) | | 4,166 | | € | 6.01 | | 4,166 | | € | 10.65 | | 8,332 |
José María Abril Pérez | | 2,719 | | € | 6.01 | | 2,719 | | € | 10.65 | | 5,438 |
Julio López Gómez | | 2,462 | | € | 6.01 | | 2,462 | | € | 10.65 | | 4,924 |
Vitalino Nafría Aznar | | 0 | | € | 6.01 | | 2,416 | | € | 10.65 | | 2,416 |
Ignacio Sánchez-Asiaín Sanz | | 1,864 | | € | 6.01 | | 1,864 | | € | 10.65 | | 3,728 |
José Sevilla Álvarez | | 560 | | € | 6.01 | | 560 | | € | 10.65 | | 1,120 |
| | |
| | | | |
| | | | |
|
Total | | 11,771 | | | | | 14,187 | | | | | 25,958 |
| | |
| | | | |
| | | | |
|
| (1) | Also member of the Board of Directors. |
ITEM 7. MAJOR SHAREHOLDERS AND RELATED PARTY TRANSACTIONS
A. Major Shareholders
As of March 31, 2004, no shareholder beneficially held more than five percent of BBVA’s shares. As of that date, Chase Nominees Ltd., as custodian, held 186,163,163 or 5.49%, of BBVA’s shares. To our knowledge, no other person, corporation or government owned beneficially, directly or indirectly, five percent or more of BBVA’s shares. BBVA’s major shareholders do not have voting rights which are different from those held by the rest of its shareholders. To the extent known to us, BBVA is not controlled, directly or indirectly, by any other corporation, government or any other natural or legal person. As of March 31, 2004, there were 1,150,391 holders of BBVA’s shares, with a total of 814,726,765 shares held by 391 shareholders with registered addresses in the United States. Since certain of such shares and ADRs are held by nominees, the foregoing figures are not representative of the number of beneficial holders. BBVA’s directors and executive officers did not own any ADRs as of December 31, 2003.
B. Related Party Transactions
Loans to Directors, Executive Officers and Related Parties
The total of advance payments and personal loans granted by BBVA and its consolidated subsidiaries to the members of the Board of Directors and outstanding as of December 31, 2003 amounted to €260,500 at interest rates of between 4% and 5%, of which €92,000 was granted to executive directors and €168,500 to independent directors. As of December 31, 2003, no guarantees had been extended to secure members of the Board of Directors’ obligations or commitments.
The total of advance payments and personal loans granted by BBVA to executive officers (excluding executive directors) and outstanding as of December 31, 2003 amounted to €1,945,000. As of December 31, 2003, no guarantees had been extended to secure executive officers’ obligations or commitments.
For additional discussion regarding loans to directors, executive officers and related parties, see Note 8 to the Consolidated Financial Statements.
Uno-e Bank Agreement
On May 15, 2002, BBVA entered into an agreement with Terra Networks, which is majority-owned by Telefónica, for the integration of Uno-e Bank and the individuals consumer financing business of Finanzia, whereby Terra Networks’ holding in Uno-e
96
Bank would decrease to 33%. This integration transaction and the percentage of ownership held by Terra Networks were formally executed on January 10, 2003, and approved at extraordinary shareholders’ meetings of Finanzia and Uno-e Bank held on April 23, 2003. Terra Networks has the right to sell its stake to BBVA between April 1, 2005 and September 30, 2007. See “Item 5. Operating and Financial Review and Prospects—Liquidity and Capital Resources—Agreement with Terra Networks”.
Related Party Transactions in the Ordinary Course of Business
Loans extended to related parties were made in the ordinary course of business, on substantially the same terms, including interest rates and collateral, as those prevailing at the time for comparable transactions with other persons, and did not involve more than the normal risk of collectibility or present other unfavorable features.
BBVA subsidiaries engage, on a regular and routine basis, in a number of customary transactions with other BBVA subsidiaries, including:
| | • | overnight call deposits; |
| | • | foreign exchange purchases and sales; |
| | • | derivative transactions, such as forward purchases and sales; |
| | • | money market fund transfers; |
| | • | letters of credit for imports and exports; |
and other similar transactions within the scope of the ordinary course of the banking business, such as loans and other banking services to BBVA’s shareholders, to employees of all levels, to the associates and family members of all the above and to other BBVA non-banking subsidiaries or affiliates. All these transactions have been made:
| | • | in the ordinary course of business; |
| | • | on substantially the same terms, including interest rates and collateral, as those prevailing at the time for comparable transactions with other persons and |
| | • | did not involve more than the normal risk of collectibility or present other unfavorable features. |
C. Interests of Experts and Counsel
Not applicable.
ITEM 8. FINANCIAL INFORMATION
A. Consolidated Statements and Other Financial Information
Financial Information
See Item 18.
Dividends
The table below sets forth the amount of interim, final and total dividends paid by BBVA (or BBV) on shares for the years 1999 to 2003, adjusted to reflect all stock splits. Dollar amounts have been converted from euro at the Noon Buying Rate at the end of the relevant year.
97
| | | | | | | | | | | | | | | | | | | | | | | | | | | | | | | | | | | | |
Per Share
|
| | | First Interim
| | Second Interim
| | Third Interim
| | Fourth Interim
| | Final
| | Total
|
| | | € | | $ | | € | | $ | | € | | $ | | € | | $ | | € | | $ | | € | | $ |
1999(1) | | € | 0.0556 | | $ | 0.06 | | € | 0.0556 | | $ | 0.06 | | € | 0.0556 | | $ | 0.06 | | € | 0.1073 | | $ | 0.11 | | | — | | | — | | € | 0.2741 | | $ | 0.29 |
2000 | | € | 0.060 | | $ | 0.06 | | € | 0.064 | | $ | 0.06 | | € | 0.064 | | $ | 0.06 | | € | 0.064 | | $ | 0.06 | | € | 0.111 | | $ | 0.10 | | € | 0.363 | | $ | 0.34 |
2001 | | € | 0.085 | | $ | 0.07 | | € | 0.085 | | $ | 0.07 | | € | 0.085 | | $ | 0.07 | | | — | | | — | | € | 0.128 | | $ | 0.11 | | € | 0.383 | | $ | 0.32 |
2002 | | € | 0.090 | | $ | 0.09 | | € | 0.090 | | $ | 0.09 | | € | 0.090 | | $ | 0.09 | | | — | | | — | | € | 0.078 | | $ | 0.08 | | € | 0.348 | | $ | 0.35 |
2003 | | € | 0.090 | | $ | 0.11 | | € | 0.090 | | $ | 0.11 | | € | 0.090 | | $ | 0.11 | | | — | | | — | | € | 0.114 | | $ | 0.14 | | € | 0.384 | | $ | 0.48 |
BBVA has paid annual dividends to its shareholders since the date it was founded. Historically, BBVA has paid interim dividends each year. Since 1989, BBVA has paid interim dividends on a quarterly basis. The total dividend for a year has been proposed by the Board of Directors usually following the end of the year to which it relates. The unpaid portion of this dividend (the final dividend) is paid after the approval of our financial statements by the shareholders at the General Shareholder’s Meeting. Interim and final dividends are payable to holders of record on the dividend payment date. Unclaimed dividends revert to BBVA five years after declaration.
While BBVA expects to declare and pay dividends on its shares on a quarterly basis in the future, the payment of dividends will depend upon its earnings, financial condition, governmental regulations and policies and other factors.
Holders of ADRs are entitled to receive dividends attributable to the shares represented by the ADSs evidenced by their ADRs to the same extent as if they were holders of such shares.
For a description of BBVA’s access to the funds necessary to pay dividends on the shares, see “Item 4. Information on the Company—Supervision and Regulation—Dividends”. In addition, BBVA may not pay dividends except out of its unrestricted reserves available for the payment of dividends, after taking into account the Bank of Spain’s capital adequacy requirements. Capital adequacy requirements are applied by the Bank of Spain on both a consolidated and individual basis. See “Item 4. Information on the Company—Supervision and Regulation—Capital Adequacy Requirements” and “Item 5. Operating and Financial Review and Prospects—Liquidity and Capital Resources—Capital”. Under Spain’s capital adequacy requirements, we estimate that as of December 31, 2003, BBVA had approximately €4.4 billion of reserves in excess of applicable capital and reserve requirements, which were not restricted as to the payment of dividends.
98
Legal Proceedings
On March 15, 2002, the Bank of Spain announced that it was opening an administrative proceeding against BBVA and certain individuals who have served as members of BBVA’s board of directors or as executive officers. This announcement was the result of BBVA’s voluntary disclosure to the Bank of Spain on January 19, 2001 that BBVA funds then amounting to approximately Ptas. 37,427 million (approximately €225 million) had been held in offshore accounts and not been reflected in its financial statements. These funds had been generated largely as a result of capital gains realized on transactions in BBV and Argentaria shares and were included in our financial statements in 2000. See Note 32.2.B.15 to our consolidated financial statements included in our Annual Report on Form 20-F for 2002. The Bank of Spain subsequently conducted a confidential investigation which led to the commencement of its administrative proceeding. The Bank of Spain’s administrative proceeding was suspended upon commencement of the proceeding initiated by the National Criminal Court (discussed below) and has remained suspended pending completion of such proceeding.
At the time the Bank of Spain proceeding was suspended, no formal charges had been made by the Bank of Spain relating to the facts and events under investigation. BBVA is therefore unable to determine what, if any, charges will be made by the Bank of Spain and to what conduct any such charges may relate. However, based on BBVA’s assessment of the probable charges and penalties that could be imposed by the Bank of Spain and that since the initiation of the Bank of Spain proceeding, BBVA has continued to be engaged regularly in extending commercial and other types of credit and accepting demand and other types of deposits, BBVA believes that once the Bank of Spain proceeding is recommenced after the conclusion of the National Criminal Court’s proceeding, resolution of such proceeding would not have a material adverse effect on BBVA or its consolidated financial position or results of operations.
National Criminal Court (Audiencia Nacional)
On April 9, 2002, Tribunal No. 5 of Spain’s National Criminal Court presided by Judge Baltasar Garzón commenced a criminal proceeding regarding the previously unreported funds and suspended the administrative proceeding initiated by the Bank of Spain. The National Criminal Court proceeding was initially directed at 28 of BBVA’s former directors and executive officers and was subsequently split into two separate proceedings. One proceeding relates to the use of the unreported funds to create pension accounts. In this proceeding, three of our former directors and two former executive officers have been formally charged. The second proceeding, which generally relates to the unreported funds, is still in the investigation phase and is directed at four of our former directors. None of these directors and executive officers continue to serve as directors on BBVA’s Board of Directors or be affiliated with BBVA in any other capacity. Under Spanish law, criminal liability may only be imposed on a corporation’s employees and members of its board of directors but not on the corporation itself. Consequently, BBVA does not have any criminal liability under Spanish law and none of its current officers or directors are party to this proceeding. BBVA is cooperating fully with the National Criminal Court proceeding, which commenced more than two years ago and is currently pending.
Spanish National Market Commission (the “CNMV”)
On May 22, 2002, the Spanish securities market regulator, the CNMV, instituted administrative proceedings against BBVA for alleged violations of the Spanish Securities Markets Act of 1988 in connection with the same events being investigated by the Bank of Spain. As with the Bank of Spain proceeding, Judge Garzón requested that the CNMV suspend its proceedings until resolution of the National Criminal Court’s criminal proceeding described above. The CNMV proceeding was suspended on January 7, 2003 and has remained suspended pending completion of the proceeding initiated by the National Criminal Court.
Based on BBVA’s assessment of the probable charges and penalties that could be imposed by the CNMV, and the fact that since the initiation of the CNMV proceeding the CNMV has not restricted BBVA from continuing to be actively involved in capital markets transactions in Spain, including by conducting offerings of its own debt and equity securities, BBVA believes that once the CNMV proceeding is recommenced after the conclusion of the National Criminal Court’s proceeding, resolution of such proceeding would not have a material adverse effect on BBVA or its consolidated financial position or results of operations.
Internal Control Procedures
As a result of our discovery that BBVA funds had been held in offshore accounts and not been reflected in its financial statements, we have implemented several accounting internal control procedures in order to obtain reasonable assurance that breaches of our internal controls do not occur. For example, BBVA has significantly strengthened its internal audit function. BBVA’s internal audit department is responsible for such matters as verifying accuracy and completeness of BBVA’s financial reporting and ensuring the compliance, appropriateness and effectiveness of BBVA’s internal control systems and procedures. BBVA has also enhanced its internal audit function, including by broadening the scope of its internal audit activities to include all of BBVA’s diverse
99
operations, both in terms of business area and geographical location. In addition, in 2002, BBVA implemented a “Directors Plan” in respect of fiscal years 2003 and 2004 to further strengthen its internal controls. As part of this plan, BBVA’s internal audit function was further expanded to include review of information and documentation used by the management of each business unit, review of BBVA’s financial statement consolidation process and review and assessment of BBVA’s compliance with capital adequacy requirements. In addition, the Directors Plan provides for the standardization of internal audit work procedures, from making initial contact with the business area or unit being audited to documenting the results of the audit.
BBVA has also reinforced its internal compliance department. This department, whose functions have been established by the Audit and Compliance Committee of BBVA’s Board of Directors, is responsible for developing and implementing internal norms and procedures to ensure compliance with legal requirements and ethical guidelines established by BBVA, such as BBVA’s Code of Conduct. For example, this department is responsible for establishing internal controls and procedures related to matters such as the prevention of money-laundering and trading in BBVA’s securities.
Besides the accounting internal control procedures implemented by BBVA described above, in order to further obtain reasonable assurance that breaches of BBVA’s internal controls do not occur, BBVA has taken a series of steps to strengthen its corporate governance structures in keeping with the most recent trends in this area and new legislation that has taken effect in Spain and the other countries in which BBVA operates. For a description of these corporate governance structures, see “Item 6—Directors, Senior Management and Employees”.
Other Proceedings
Puerto Rico
In the proceedings based on the testimony of a former BBV Puerto Rico employee mentioned in our 2001 Annual Report on Form 20-F and included in the preliminary proceeding regarding unreported funds described above, no person has been accused of the events.
BBVA Privanza Bank Ltd. (Jersey)
In relation to the alleged cooperation of some employees of BBVA Privanza Bank Ltd. (Jersey) in the creation of accounts and financial products in Jersey allegedly used by Spanish individuals to avoid Spanish tax obligations, and an alleged tax offence due to the non-consolidation of a fully-owned subsidiary, the investigation is ongoing and charges have not been brought.
Although the proceedings described above remain in preliminary stages, in light of the surrounding events and circumstances, our legal advisers do not expect them to have a material effect on us.
B. Significant Changes
No significant change has occurred since the date of the Consolidated Financial Statements.
ITEM 9. THE OFFER AND LISTING
BBVA’s shares are listed on the Spanish Stock Exchanges in Madrid, Bilbao, Barcelona and Valencia and quoted on the Automated Quotation System of the Spanish Stock Exchanges (the “Automated Quotation System”). They are also listed on the Frankfurt, Milan, Zurich, London, Lima and New York Stock Exchanges, and quoted on SEAQ International in London. Each ADSs represents one share.
On January 4, 1999, the Madrid Stock Exchange began quoting share prices in euro. Fluctuations in the exchange rate between the euro and the dollar will affect the dollar equivalent of the euro price of BBVA’s shares on the Spanish Stock Exchanges and the price of BBVA’s ADSs on the New York Stock Exchange. Cash dividends are paid by BBVA in euro, and exchange rate fluctuations between the euro and the dollar will affect the dollar amounts received by holders of American Depositary Receipts (“ADRs”) on conversion by The Bank of New York (acting as depositary) of cash dividends on the shares underlying the ADSs evidenced by such ADRs.
The table below sets forth, for the periods indicated, the high and low sales closing prices for the shares of BBV until January 28, 2000 and BBVA thereafter on the Automated Quotation System. Since January 4, 1999, the Spanish market quotations are stated in euro. Peseta amounts prior to that time have been translated at the fixed exchange rate of Ptas. 166.386 = €1.00.
100
| | | | |
| | | Euro per Share(1)
|
| | | High
| | Low
|
Fiscal year ended December 31, 1999 | | | | |
Annual | | 14.85 | | 11.06 |
Fiscal year ended December 31, 2000 | | | | |
Annual | | 17.46 | | 12.27 |
Fiscal year ended December 31, 2001 | | | | |
Annual | | 17.20 | | 9.50 |
First Quarter | | 17.20 | | 13.92 |
Second Quarter | | 16.47 | | 14.75 |
Third Quarter | | 15.77 | | 9.50 |
Fourth Quarter | | 14.80 | | 11.50 |
Fiscal year ended December 31, 2002 | | | | |
Annual | | 14.21 | | 7.24 |
First Quarter | | 14.21 | | 12.26 |
Second Quarter | | 13.90 | | 10.93 |
Third Quarter | | 11.99 | | 7.42 |
Fourth Quarter | | 10.60 | | 7.24 |
Fiscal year ended December 31, 2003 | | | | |
Annual | | 10.95 | | 6.89 |
First Quarter | | 10.25 | | 6.89 |
Second Quarter | | 9.68 | | 7.78 |
Third Quarter | | 10.10 | | 8.86 |
Fourth Quarter | | 10.95 | | 8.91 |
Month ended December 31, 2003 | | 10.95 | | 10.20 |
Fiscal year ended December 31, 2004 | | | | |
First Quarter | | 11.28 | | 10.22 |
Month ended January 31, 2004 | | 11.27 | | 10.71 |
Month ended February 29, 2004 | | 11.19 | | 10.22 |
Month March 31, 2004 | | 11.28 | | 10.22 |
Month April 30, 2004 | | 11.42 | | 10.90 |
Month May 31, 2004 | | 11.37 | | 10.40 |
Month ended June 30, 2004 (through June, 25) | | 11.21 | | 10.67 |
| (1) | Adjusted to reflect all stock splits. This applies only to 1999 and 2000. |
101
From January 2003 through December 31, 2003 the percentage of outstanding shares held by BBVA and its affiliates ranged between 0.153% and 0.683% respectively, calculated on a monthly basis. On May 12, 2004, the percentage of outstanding shares held by BBVA and its affiliates was 0.710%.
The table below sets forth the reported high and low sales prices for the ADSs of BBV until January 28, 2000 and BBVA thereafter on the New York Stock Exchange for the periods indicated.
102
| | | | |
| | | Dollars per ADS(1)
|
| | | High
| | Low
|
Fiscal year ended December 31, 1999 | | | | |
Annual | | 17.50 | | 11.63 |
Fiscal year ended December 31, 2000 | | | | |
Annual | | 15.75 | | 11.94 |
Fiscal year ended December 31, 2001 | | | | |
Annual | | 16.63 | | 8.99 |
First Quarter | | 16.63 | | 12.22 |
Second Quarter | | 14.40 | | 12.65 |
Third Quarter | | 13.16 | | 8.99 |
Fourth Quarter | | 13.44 | | 10.25 |
Fiscal year ended December 31, 2002 | | | | |
Annual | | 12.77 | | 6.93 |
First Quarter | | 12.77 | | 10.82 |
Second Quarter | | 12.50 | | 10.67 |
Third Quarter | | 11.73 | | 7.14 |
Fourth Quarter | | 10.58 | | 6.93 |
Fiscal year ended December 31, 2003 | | | | |
Annual | | 13.85 | | 7.67 |
First Quarter | | 10.81 | | 7.67 |
Second Quarter | | 11.16 | | 8.46 |
Third Quarter | | 11.16 | | 10.28 |
Fourth Quarter | | 13.85 | | 10.54 |
Month ended December 31, 2003 | | 13.85 | | 12.29 |
Fiscal year ended December 31, 2004 | | | | |
First Quarter | | 14.45 | | 12.51 |
Month ended January 31, 2004 | | 14.45 | | 13.41 |
Month ended February 29, 2004 | | 14.13 | | 12.85 |
Month ended March 31, 2004 | | 13.94 | | 12.51 |
Month ended April 30, 2004 | | 13.65 | | 13.09 |
Month ended May 31, 2004 | | 13.75 | | 12.47 |
Month ended June 30, 2004 (through June, 25) | | 13.70 | | 13.06 |
| (1) | Adjusted to reflect all stock splits. This applies only to 1999 and 2000. |
103
Securities Trading in Spain
The Spanish securities market for equity securities consists of the Automated Quotation System and the four stock exchanges located in Madrid, Bilbao, Barcelona and Valencia. During 2003, the Automated Quotation System accounted for the majority of the total trading volume of equity securities on the Spanish stock exchanges.
Automated Quotation System. The Automated Quotation System links the four local exchanges, providing those securities listed on it with a uniform continuous market that eliminates certain of the differences among the local exchanges. The principal feature of the system is the computerized matching of buy and sell orders at the time of entry of the order. Each order is executed as soon as a matching order is entered, but can be modified or canceled until executed. The activity of the market can be continuously monitored by investors and brokers. The Automated Quotation System is operated and regulated by Sociedad de Bolsas, S.A. (“Sociedad de Bolsas”), a corporation owned by the companies that manage the local exchanges. All trades on the Automated Quotation System must be placed through a bank, brokerage firm, an official stock broker or a dealer firm member of a Spanish stock exchange directly. Since January 1, 2000, Spanish banks have been allowed to place trades on the Automated Quotation System and have been allowed to become members of the Spanish stock exchanges.
In a pre-opening session held from 8:30 a.m. to 9:00 a.m. each trading day, an opening price is established for each security traded on the Automated Quotation System based on orders placed at that time. The legal regime concerning opening prices was changed by an internal rule issued by theSociedad de Bolsas. The new legal regime sets forth that all references to maximum changes in share prices will be substituted by a definition of prices and creation of static and dynamic ranks for each listed share to be published on a periodic basis by theSociedad de Bolsas. The computerized trading hours are from 9:00 a.m. to 5:30 p.m., during which time the trading price of a security is permitted to vary by up to the stated level. If the quoted price exceeds this limit, trading in the security is suspended until the next day. Between 5:30 p.m. and 5:35 p.m. a closing price is established for each security through an auction system similar to the one held for the pre-opening early in the morning.
Between 5:30 p.m. and 8:00 p.m., trades may occur outside the computerized matching system without prior authorization of theSociedad de Bolsas at a price within the range of 5% above the higher of the average price and closing price for the day and 5% below the lower of the average price and closing price for the day, if, among other things, the trade involves more than €300,000 and more than 20% of the average daily trading volume of the stock during the preceding three months. At any time trades may take place (with the prior authorization of theSociedad de Bolsas) at any price if:
| | • | the trade involves more than €1.5 million and more than 40% of the average daily volume of the stock during the preceding three months; |
| | • | the transaction derives from a merger or spin-off process, or from the reorganization of a group of companies; |
| | • | the transaction is executed for the purposes of settling a litigation or completing a complex group of contracts or |
| | • | theSociedad de Bolsas finds other justifiable cause. |
Information with respect to the computerized trades between 9:00 a.m. and 5:30 p.m. is made public immediately, and information with respect to trades outside the computerized matching system is reported to theSociedad de Bolsas by the end of the trading day and published in theBoletín de Cotizaciónand in the computer system by the beginning of the next trading day.
Clearance and Settlement System. Law 44/2002 and Rule 689/2003 of March 27, 2003 approved by the Spanish Ministry of Economy have promoted the integration of the two main existing book entry settlement systems existing in Spain, the non-gilts settlement systemServicio de Compensación y Liquidación de Valores (“SCLV”) and the gilts settlement systemCentral de Anotaciones en Cuenta, into one system to be known asSociedad de Gestion de los Sistemas de Registro Compensación y Liquidación de Valores (the “Iberclear”).
104
Notwithstanding the above, rules concerning book entry settlement system enacted before this amendment by the SCLV and the Bank of Spain are still in force, but any reference to the SCLV must be substituted by Iberclear.
Under this new regulation, transactions carried out on the Spanish stock exchanges are cleared and settled through Iberclear. Only members of Iberclear are entitled to use it, and membership is restricted to authorized members of the Spanish stock exchanges, the Bank of Spain (when an agreement, approved by the Spanish Ministry of Economy and Finance, is reached with Iberclear) and, with the approval of the CNMV, other brokers not members of the Spanish stock exchanges, banks, savings banks and foreign settlement and clearance systems. Iberclear is owned by its members (excluding, if applicable, the Bank of Spain) and by the companies which manage the local exchanges. The clearance and settlement system and its members are responsible for maintaining records of purchases and sales under the book-entry system. Shares of listed Spanish companies are held in book-entry form. Iberclear, which manages the clearance and settlement system, maintains a registry reflecting the number of shares held by each of its member entities (each anentidad participada), as well as the amount of such shares held on behalf of beneficial owners. Each member entity, in turn, maintains a registry of the owners of such shares. Spanish law considers the legal owner of the shares to be:
| | • | the member entity appearing in the records of Iberclear as holding the relevant shares in its own name, or |
| | • | the investor appearing in the records of the member entity as holding the shares. |
The SCLV has introduced the so-called “D+3 Settlement System” by which the settlement of any transactions must be made three working days following the date on which the transaction was carried out.
Obtaining legal title to shares of a company listed on a Spanish stock exchange requires the participation of a Spanish official stockbroker, broker-dealer, bank or other entity authorized under Spanish law to record the transfer of shares. To evidence title to shares, at the owner’s request the relevant member entity must issue a certificate of ownership. In the event the owner is a member entity, Iberclear is in charge of the issuance of the certificate with respect to the shares held in the member entity’s name.
Brokerage commissions are not regulated. Brokers’ fees, to the extent charged, will apply upon transfer of title of our shares from the depositary to a holder of ADRs, and upon any later sale of such shares by such holder. Transfers of ADSs do not require the participation of an official stockbroker. The deposit agreement provides that holders depositing our shares with the depositary in exchange for ADSs or withdrawing our shares in exchange for ADSs will pay the fees of the official stockbroker or other person or entity authorized under Spanish law applicable both to such holder and to the depositary.
Securities Market Legislation
The Securities Markets Act was enacted in 1988 with the purpose of reforming the organization and supervision of the Spanish securities markets. This legislation and the regulation implementing it:
| | • | established an independent regulatory authority, the CNMV, to supervise the securities markets; |
| | • | established a framework for the regulation of trading practices, tender offers and insider trading; |
| | • | required stock exchange members to be corporate entities; |
| | • | required companies listed on a Spanish stock exchange to file annual audited financial statements and to make public quarterly financial information; |
| | • | established the legal framework for the Automated Quotation System; |
| | • | exempted the sale of securities from transfer and value added taxes; |
| | • | deregulated brokerage commissions and |
| | • | provided for transfer of shares by book-entry or by delivery of evidence of title. |
105
On February 14, 1992, Royal Decree No. 116/92 established the clearance and settlement system and the book-entry system, and required that all companies listed on a Spanish stock exchange adopt the book-entry system.
On November 16, 1998, the Securities Markets Act was amended in order to adapt it to Directive 93/22/CEE on investment services (later amended by Directive 95/26/CE and Directive 97/9/CE of the European Parliament and Council on investors indemnity systems).
On November 22, 2002, the Securities Markets Act was amended by Law 44/2002 in order to update Spanish financial law to global financial markets. See “Item 4. Information on the Company—Business Overview—Law Reforming the Spanish Financial System”.
On June 18, 2003, the Spanish Government approved theLey de Transparencia(“Law 26/2003”), modifying both the Securities Markets Act and the Corporate Law, to reinforce the transparency of information available regarding listed Spanish companies. This law adds a new chapter, Title X, to the Securities Markets Act, which (i) requires disclosure of shareholder agreements relating to listed companies; (ii) regulates the operation of the general shareholders’ meetings and of boards of directors of listed companies; (iii) requires the publication of an annual report on corporate governance and (iv) establishes measures designed to increase the availability of information to shareholders.
Trading by the Bank and its Affiliates in the Shares
Trading by subsidiaries in their parent companies’ shares is restricted by the Spanish Companies Act.
Neither BBVA nor its affiliates may purchase BBVA’s shares unless the making of such purchases is authorized at a meeting of BBVA’s shareholders by means of a resolution establishing, among other matters, the maximum number of shares to be acquired within a maximum period of 18 months. Restricted reserves equal to the purchase price of any shares that are purchased by BBVA or its subsidiaries must be made by the purchasing entity. The total number of shares held by BBVA and its subsidiaries may not exceed five percent of BBVA’s total capital. It is the practice of Spanish banking groups, including ours, to establish subsidiaries to trade in their parent company’s shares in order to meet imbalances of supply and demand, to provide liquidity (especially for trades by their customers) and to modulate swings in the market price of their parent company’s shares.
Reporting Requirements
Any entity which transfers five percent, or any multiple of five percent, of the capital stock of a company listed on a Spanish stock exchange must, within seven days after that transfer, report the transfer to such company, to the stock exchange on which such company is listed and to the CNMV. In addition, any company listed on a Spanish stock exchange must report on a non-public basis any acquisition by such company (or an affiliate) of the company’s own shares if such acquisition, together with any previous one from the date of the last communication, exceeds 1% of its capital stock, regardless of the balance retained. Members of the Board of Directors must report any transfer or acquisition of share capital of a company listed on the Spanish stock exchanges, regardless of the size of the transaction. Additionally, since we are a credit entity, any individual or company which intends to acquire a significant participation in BBVA’s share capital must obtain prior approval from the Bank of Spain in order to carry out the transaction. See “Item 10. Additional Information—Restrictions on Acquisitions of Shares”.
Royal Decree 2590/98 has amended Royal Decree 377/91 by incorporating new reporting requirements in connection with any entity acting from a tax haven or a country where no securities regulatory commission exists, in which case the threshold of five percent is reduced to one percent. Furthermore, Royal Decree 2590/98 has extended the meaning of “transfer” to include voting agreements between shareholders.
Each Spanish bank is required to provide to the Bank of Spain a list dated the last day of each quarter of all the bank’s shareholders that are financial institutions and other non-financial institution shareholders owning at least 0.25% of a bank’s total share capital. Furthermore, the banks are required to inform the Bank of Spain, as soon as they become aware, and in any case not later than in 15 days, of each acquisition by a person or a group of at least one percent of such bank’s total share capital.
ITEM 10. ADDITIONAL INFORMATION
A. Share Capital
Not applicable.
106
B. Memorandum and Articles of Association
Spanish law and BBVA’s bylaws are the main sources of regulation affecting the company. All rights and obligations of BBVA’s shareholders are contained in its bylaws and in Spanish law.
On March 1, 2003, BBVA’s shareholders adopted a resolution amending its bylaws. The amendments were to: (i) Article 31 in order to cease limiting the exercise of shareholders’ voting rights to 10% of BBVA’s total share capital; (ii) Article 34 in order to change the maximum and minimum number of seats on the Board of Directors to 18 and 9, respectively and (iii) Article 48 in order to comply with Law 44/2002.
On February 28, 2004, BBVA’s shareholders adopted a new resolution amending its bylaws. The amendments are to: (i) Article 24 in order to expand shareholders’ rights to participate in shareholders’ meetings by proxy or representative; (ii) Article 29 in order to enhance shareholders’ ability to obtain information regarding the Company; (iii) Article 31 regarding the procedures for the adoption of shareholder resolutions; (iv) Article 35 regarding the requirements for being a director; (v) Article 38 regarding the chairman and secretary of the Board of Directors; (vi) Article 45 regarding nomination and composition of the Board of Directors; (vii) Article 37 to make a technical amendment required by virtue of the amendment to Article 35 and (viii) Article 34 to reduce the maximum number of directors from 18 to 16.
Registry and Company’s Objects and Purposes
BBVA is registered with the Commercial Registry of Vizcaya (Spain). Its registration number at the Commercial Registry of Vizcaya is volume 2,083, book 1,545, section 3, folio 1, page 14,741. Its corporate objects and purposes are to: (i) directly or indirectly conduct all types of activities, transactions, acts, agreements and services relating to the banking business which are permitted or not prohibited by law and all banking ancillary activities; (ii) acquire, hold and dispose of securities and (iii) make public offers for the acquisition and sale of securities and all types of holdings in any kind of company. BBVA’s objects and purposes are contained in Article 3 of the bylaws.
Certain Powers of the Board of Directors
In general, provisions limiting the powers of BBVA’s directors are not contained in its bylaws. Such limitations, where they exist, often (i) limit a director’s power to vote on a proposal, arrangement or contract in which the director is materially interested; (ii) limit the power to vote compensation to themselves; (iii) limit borrowing powers exercisable by the directors and how such borrowing powers can be varied or (iv) require retirement of directors at a certain age. The powers of BBVA’s directors in these and other matters, however, are limited by and subject to BBVA’s internal regulations. In addition, BBVA’s Board of Directors is subject to the Regulations of the Board of Directors, which contains a series of ethical standards. See “Item 6. Directors, Senior Management and Employees”.
The provisions of BBVA’s bylaws that relate to compensation of directors are in strict accordance with the relevant provisions of Spanish law. The main provisions of the bylaws that relate to these matters are those that, in accordance with applicable Spanish law, allow the members of the Board of Directors to determine their administrative expenses or agree on such additional benefits they consider appropriate or necessary, up to four percent of our paid-up capital per year, which may only be paid after the minimum yearly dividend of four percent of the paid-in capital has been paid to our shareholders.
As of the date of the filing of this Annual Report, 10 of the 15 members of the Board of Directors were independent.
Members of the Board of Directors are elected for a term in office of five years. One-fifth of the Board of Directors is re-elected annually. The members of the Board of Directors may be re-elected for an unlimited number of terms.
Certain Provisions Regarding Preferred Shares
The bylaws authorize BBVA to issue ordinary, non-voting, redeemable and preferred shares. As of the date of the filing of this Annual Report, BBVA has no non-voting, redeemable or preferred shares outstanding.
The characteristics of preferred shares must be agreed by the Board of Directors before they are issued.
107
Only shares that have been issued as redeemable may be redeemed by BBVA. Redemption of shares may only occur according to the terms set forth when they are issued. Redeemable shares must be fully paid-up at the time of their subscription. If the right to redeem redeemable shares is exclusively given to BBVA, it may not be exercised until at least three years after the issue. Redemption of shares must be financed against profits, free reserves or the proceeds of new securities issued especially for financing the redemption of an issue. If financed against profits or free reserves, BBVA must create a reserve for the amount of the par value of the redeemed shares. If the redemption is not financed against profits, free reserves or a new issue, it may only be done in compliance with the requirements of a reduction in share capital by the refund of contributions.
Holders of non-voting shares, if issued, are entitled to a minimum annual dividend, fixed or variable, set out at the time of the issue. The right of non-voting shares to accumulate unpaid dividends whenever funds to pay dividends are not available, any preemptive rights associated with non-voting shares, and the ability of holders of non-voting shares to recover voting rights also must be established at the time of the issue. Non-voting shares are entitled to the dividends to which ordinary shares are entitled in addition to their minimum dividend.
Certain Provisions Regarding Shareholders Rights
As of the date of the filing of this Annual Report, BBVA’s capital is comprised of one class of ordinary shares, all of which have the same rights.
Once all legal reserves and funds have been provided for out of the net profits of any given fiscal year, shareholders have the right to the distribution of an annual dividend of at least four percent of our paid-in capital. Shareholders will participate in the distribution of dividends in proportion to their paid-in capital. The right to collect a dividend lapses after five years as of the date in which it was first available to the shareholders. Shareholders also have the right to participate in proportion to their paid-in capital in any distribution resulting from our liquidation.
Each shareholder present at a General Shareholders’ Meeting is entitled to one vote per each share. However, unpaid shares with respect to which a shareholder is in default of the resolutions of the Board of Directors relating to their payment will not be entitled to vote. The bylaws contain no provisions regarding cumulative voting.
On March 1, 2003, BBVA’s shareholders passed a resolution amending the bylaws to, among other things, remove the provision which stated that no shareholder may cast a number of votes greater than those corresponding to shares representing 10% of BBVA’s share capital.
The bylaws do not contain any provisions relating to sinking funds or potential liability of shareholders to further capital calls by BBVA.
The bylaws do not specify what actions or quorums are required to change the rights of shareholders. Under Spanish law, the rights of shareholders may only be changed by an amendment to the bylaws that complies with the requirements explained below under “Shareholders’ Meetings”, plus the affirmative vote of the majority of the shares of the class that will be affected by the amendment.
Shareholders’ Meetings
General meetings may be ordinary or extraordinary. Ordinary general meetings are held within the first six months of each financial year in order to review, among other things, the management of the company, and to approve, if applicable, annual financial statements for the previous fiscal year. Extraordinary general meetings are those meetings that are not ordinary. In any case, the requirements mentioned below for constitution and adoption of resolutions are applicable to both categories of general meetings.
General meetings must be convoked by the Board of Directors, whether by their own decision or upon the request of shareholders holding at least five percent of BBVA’s share capital. General meetings must generally be advertised at least 15 days in advance in the Official Companies Registry Gazette (Boletín Oficial del Registro Mercantile) (Borme) and in a widely-circulated newspaper.
As of the date of the filing of this Annual Report, shareholders have the right to attend general meetings if they:
| | • | own at least 500 shares; |
108
| | • | have registered their shares in the appropriate account registry at least five days prior to the date for which the general meeting has been convened and |
| | • | retain the ownership of at least 500 shares until the general meeting takes place. |
Additionally, holders of fewer than 500 shares may aggregate their shares to reach at least such number of shares and appoint a shareholder as proxy to attend the general meeting.
General meetings will be validly constituted on first call with the presence of at least 25% of BBVA’s voting capital, either in person or by proxy. No minimum quorum is required to hold a general meeting on second call. In either case, resolutions will be agreed by the majority of the votes. However, a general meeting will only be validly held with the presence of 50% of BBVA’s voting capital on first call or of 25% of the voting capital on second call, in the case of resolutions concerning the following matters:
| | • | capital increases or decreases; |
| | • | any other amendment to the bylaws. |
In these cases, resolutions may only be approved by the vote of the majority of the shares if at least 50% of the voting capital is present at the meeting. If the voting capital present at the meeting is less than 50%, then resolutions may only be adopted by two-thirds of the shares present.
Restrictions on the Ownership of Shares
Our bylaws do not provide for any restrictions on the ownership of our ordinary shares. Spanish law, however, provides for certain restrictions which are described below under “—Exchange Controls—Restrictions on Acquisitions of Shares”.
Restrictions on Foreign Investments
Spanish stock exchanges are open to foreign investors. However, the acquisition of 50% or more of the share capital of a Spanish company by a person or entity residing in a tax haven must in certain cases be notified to the Ministry of Economy and Treasury prior to its execution. All other investments in BBVA’s shares by foreign entities or individuals only require the notification of the Spanish authorities through the Spanish intermediary that took part in the investment once it is executed.
Current Spanish regulations provide that once all applicable taxes have been paid, foreign investors may freely transfer out of Spain any amounts of invested capital, capital gains and dividends.
See “—Exchange Controls”.
109
Change of Control Provisions
In addition to the restrictions on acquisitions of BBVA’s shares discussed above, certain antitrust freeze-out regulations may also delay, defer or prevent a change of control of BBVA or any of its subsidiaries in the event of a merger, acquisition or corporate restructuring. In Spain, the application of both Spanish and European antitrust regulations require that prior notice of domestic or cross-border merger transactions be given in order to obtain a “non-opposition” ruling from antitrust authorities.
Spanish regulation of takeover bids may also delay, defer or prevent a change of control of BBVA or any of its subsidiaries in the event of a merger, acquisition or corporate restructuring. Spanish regulation of takeover bids contained in Royal Decree 1197/1991 was recently amended by Royal Decree 432/2003 dated April 11, 2003. See “—Exchange Controls—Tender Offers”. New regulations on public takeover bids require a bid to be launched if the acquisition of the listed company grants control to the purchaser, regardless of whether the acquired stake reaches the 25% threshold. The new rules state that it is necessary to launch a tender offer if the bidder intends to acquire less than 25% of the target’s share capital but intends to appoint more than one-third and less than one-half plus one of the target’s directors.
Since BBVA is a credit entity, it is necessary to obtain approval from the Bank of Spain in order to acquire a number of shares considered to be a significant participation by Law 26/1988, of July 29, 1998. See “—Exchange Controls—Restrictions on Acquisitions of Shares”. Also, any agreement that contemplates BBVA’s merger with another credit entity will require the authorization of the Ministry of Economy. This could also delay, defer or prevent a change of control of BBVA or any of its subsidiaries that are credit entities in the event of a merger.
C. Material Contracts
During the past two years BBVA was not a party to any contract outside its ordinary course of business that was material to it as a whole.
D. Exchange Controls
In 1991, Spain adopted the EU standards for free movement of capital and services. As a result, exchange controls and restrictions on foreign investments have generally been abolished and foreign investors may transfer invested capital, capital gains and dividends out of Spain without limitation as to amount, subject to applicable taxes. See “—Taxation”.
Pursuant to Spanish Law 18/1992 on Foreign Investments(Ley 18/1992, de 1 de julio) and Royal Decree 664/1999 (Real Decreto 664/1999, de 23 de abril), foreign investors may freely invest in shares of Spanish companies, except in the case of certain strategic industries.
Shares in Spanish companies held by foreign investors must be reported to the Spanish Registry of Foreign Investments by the depositary bank or relevant Iberclear member. When a foreign investor acquires shares that are subject to the reporting requirements of the CNMV, notice must be given by the foreign investor directly to the Registry of Foreign Investments in addition to the notices of majority interests that must be sent to the CNMV and the applicable stock exchanges. This notice must be given through a bank or other financial institution duly registered with the Bank of Spain and the CNMV or through bank accounts opened with any branch of such registered entities.
Investment by foreigners domiciled in enumerated tax haven jurisdictions is subject to special reporting requirements under Royal Decree 1080/1997(Real Decreto 1980/1997, de 5 de julio).
On July 5, 2003, Law 19/2003 (Ley sobre el regimen juridico de los movimientos de capitales y de las transacciones economicas con el exterior y sobre determinadas medidas de prevencion del blanqueo de capitales), came into effect. This law is an update to other Spanish exchange control and money laundering prevention laws.
Restrictions on Acquisitions of Shares
Spanish law provides that any individual or corporation that intends to acquire, directly or indirectly, a significant participation (participación significativa) in a Spanish bank must obtain the prior approval of the Bank of Spain, including the amount of such participation, the terms and conditions of the acquisition and the period in which it is intended to execute the transaction. A significant participation is considered five percent of the outstanding share capital of a bank or a lower percentage if such holding allows for the exercise of a significant influence.
110
Any individual or company that intends to increase, directly or indirectly, its significant participation in such a way that its share capital or voting rights after the acquisition reaches or exceeds 10%, 15%, 20%, 25%, 33%, 40%, 50%, 66% or 75% is required to give prior notice to the Bank of Spain of such transaction. Any acquisition without such prior notification, or before three months have elapsed after the date of such notification, or against the objection of the Bank of Spain, will produce the following results:
| | • | the acquired shares will have no voting rights; and |
| | • | if considered appropriate, the target bank may be taken over or its directors replaced and a sanction imposed. |
The Bank of Spain has a period of three months to object to a proposed transaction. Such objection may be based on the fact that the Bank of Spain does not consider the acquiring person suitable to guarantee the sound and prudent operation of the target bank.
Any individual or institution that intends to sell its significant participation or reduce the above mentioned percentages, or which, because of such sale, loses control of the entity, must give prior notice to the Bank of Spain, indicating the amount to be sold and the period in which the transaction is to be executed. Non-compliance with this requirement will result in sanctions.
The Ministry of Economy and the Treasury, following a proposal by the Bank of Spain, may, whenever the control by a person with a significant participation may jeopardize the sound and prudent management of a credit institution, adopt any of the following measures as deemed appropriate:
| | • | suspend the voting rights corresponding to such shares for up to three years; |
| | • | take control of the bank or replace the directors or |
| | • | revoke the bank’s license. |
Tender Offers
As stated above, the Spanish legal regime concerning takeover bids was amended by Royal Decree 432/2003 of April 11, 2003, in order to introduce more cases in which it is necessary to launch a takeover in order to acquire a stake of the share capital of a listed company. Subject to certain exceptions, any individual or corporation proposing to acquire shares of a company’s share capital (or other securities that may directly or indirectly give the right to subscribe for such shares), which is fully or partly admitted for trading on a Spanish stock exchange, may not do so without first launching a public tender offer on the terms and conditions laid down in the Royal Decree, if it intends to appoint more than one-third but less than one-half of the directors of the target company.
E. Taxation
Spanish Tax Considerations
The following is a summary of the material Spanish tax consequences to United States Residents (as defined below) of the acquisition, ownership and disposition of BBVA’s ADSs or ordinary shares. This summary does not address all tax considerations that may be relevant to all categories of potential purchasers, some of whom (such as life insurance companies, tax-exempt entities, dealers in securities or financial institutions) may be subject to special rules. In particular, the summary deals only with the United States Holders (as defined below) that will hold ADSs or ordinary shares as capital assets and who do not at any time own individually, nor are treated as owning, 25% or more of BBVA’s shares, including ADSs.
As used in this particular section, the following terms have the following meanings:
(1) “United States Holder” means a beneficial owner of BBVA’s ADSs or ordinary shares that is:
| | • | a resident of the United States for United States federal income tax purposes, |
111
| | • | a corporation or other entity treated as a corporation, created or organized under the laws of the United States or any State thereof, or |
| | • | an estate or trust the income of which is subject to United States federal income tax without regard to its source. |
(2) “Treaty” means the Convention between the United States and the Kingdom of Spain for the Avoidance of Double Taxation and the Prevention of Fiscal Evasion with Respect to Taxes on Income, together with a related Protocol.
(3) “United States Resident” means a United States Holder that is a resident of the United States for the purposes of the Treaty and entitled to the benefits of the Treaty, whose holding is not effectively connected with (1) a permanent establishment in Spain through which such holder carries on or has carried on business, or (2) a fixed base in Spain from which such holder performs or has performed independent personal services.
Holders of ADSs or ordinary shares who are not United States Residents should also consult their own tax advisors, particularly as to the applicability of any tax treaty. The statements regarding Spanish tax laws set out below are based on interpretations of those laws in force as of date of this Annual Report. Such statements also assume that each obligation in the Deposit Agreement and any related agreement will be performed in full accordance with the terms of those agreements.
Taxation of Dividends
Under Spanish law, dividends paid by BBVA to a holder of ordinary shares or ADSs who is not resident in Spain for tax purposes and does not operate through a permanent establishment in Spain, are subject to Spanish Non-Resident Income Tax, withheld at source, currently at a 15% tax rate. For these purposes, upon distribution of the dividend, BBVA or its paying agent will withhold an amount equal to the tax due according to the rules set forth above (i.e., applying the general withholding tax rate of 15%), transferring the resulting net amount to the depositary. Under the Treaty, if you are a United States Resident, you are also entitled to a tax rate of 15%.
Taxation of Rights
Distribution of preemptive rights to subscribe for new shares made with respect to your shares in BBVA will not be treated as income under Spanish law and, therefore, will not be subject to Spanish Non-Resident Income Tax. The exercise of such preemptive rights is not considered a taxable event under Spanish law and thus is not subject to Spanish tax. Capital gains derived from the disposition of preemptive rights obtained by United States Residents are generally not taxed in Spain provided that certain conditions are met (See “—Taxation of Capital Gains” below).
Taxation of Capital Gains
Under Spanish law, any capital gains derived from securities issued by persons residing in Spain for tax purposes are considered to be Spanish source income and, therefore, are taxable in Spain. For Spanish tax purposes, income obtained by you, if you are a United States Resident, from the sale of BBVA’s ADSs or ordinary shares will be treated as capital gains. Spanish Non-Resident Income Tax is currently levied at a 35% tax rate on capital gains obtained by persons non residents of Spain for tax purposes who are not entitled to the benefit of any applicable treaty for the avoidance of double taxation and who do not operate through a fixed base or a permanent establishment in Spain.
Notwithstanding the above, capital gains derived from the transfer of shares in an official Spanish secondary stock market by any holder who is resident in a country that has entered into a treaty for the avoidance of double taxation with an “exchange of information” clause (the Treaty contains currently such a clause), will be exempt from taxation in Spain. Additionally, capital gains realized by non-residents of Spain who are entitled to the benefit of an applicable treaty for the avoidance of the double taxation will, in the majority of cases, not be taxed in Spain (since most tax treaties provide for taxation only in the taxpayer’s country of residence). If you are a United States Resident, by virtue of the Treaty, capital gains arising from the disposition of ordinary shares or ADSs will not be taxed in Spain. You will be required to establish that you are entitled to this exemption by providing to the relevant Spanish tax authorities an IRS certificate of residence in the United States, together with the corresponding Spanish tax form.
112
Spanish Wealth Tax
If you do not reside in Spain and you hold shares located in Spain, you are subject to Spanish Wealth Tax (Spanish Law 19/1991), which imposes a tax on property located in Spain on the last day of any year. It is possible that the Spanish tax authorities may contend that all shares of Spanish corporation and all ADSs representing such shares are located in Spain for Spanish tax purposes. If such a view were to prevail, and you are a non-resident of Spain who held BBVA’s ADRs or ordinary shares on the last day of any year, you would be subject to the Spanish Wealth Tax for such year at marginal rates varying between 0.2% and 2.5% of the average market value of such ordinary shares or ADSs during the last quarter of such year. United States Residents should consult their tax advisors with respect to the applicability of Spanish Wealth Tax.
Spanish Inheritance and Gift Taxes
Transfers of BBVA’s shares or ADRs upon death or by gift are subject to Spanish inheritance and gift taxes (Spanish Law 29/1987), if the transferee is a resident in Spain for tax purposes, or if BBVA’s shares or ADRs are located in Spain, regardless of the residence of the beneficiary. In this regard, the Spanish tax authorities may argue that all shares of Spanish corporations and all ADSs representing such shares are located in Spain for Spanish tax purposes. The applicable tax rate, after applying all relevant factors, ranges between 7.65% and 81.6% for individuals, approximately.
Alternatively, corporations that are non-resident in Spain, who receive BBVA’s shares or ADSs as a gift, are subject to Spanish Non-Resident Income Tax at a 35% tax rate on the fair market value of the shares as a capital gain. Hence, if the donee is a United States resident corporation, the exclusions available under the Treaty described in “—Taxation of Capital Gains” above will be applicable.
Spanish Transfer Tax
Transfers of BBVA’s ordinary shares or ADSs will be exempt from Transfer Tax (Impuesto sobre Transmisiones Patrimoniales) or Value-Added Tax. Additionally, no stamp duty will be levied on such transfers.
113
U.S. Tax Considerations
The following summary describes the material United States federal income tax consequences of the acquisition, ownership and disposition of ADSs or ordinary shares, but it does not purport to be a comprehensive description of all of the tax considerations that may be relevant to a particular person’s decision to acquire such securities. The summary applies only to U.S. Holders (as defined under “Spanish Tax Considerations” above) that hold ADSs or ordinary shares as capital assets for tax purposes and does not address special classes of holders, such as:
| | • | certain financial institutions; |
| | • | dealers and traders in securities or foreign currencies; |
| | • | holders holding ADSs or shares as part of a hedge, straddle or conversion transaction; |
| | • | holders whose “functional currency” is not the U.S. dollar; |
| | • | holders liable for alternative minimum tax; |
| | • | tax exempt organizations; |
| | • | partnerships or other entities classified as partnerships for U.S. federal income tax purposes or |
| | • | holders that own 10% or more of BBVA’s voting shares. |
The summary is based upon tax laws of the United States including the Internal Revenue Code of 1986, as amended to the date hereof (the “Code”), administrative pronouncements, judicial decisions and final, temporary and proposed Treasury Regulations, changes to any of which may affect the tax consequences described herein possibly with retroactive effect. In addition, the summary is based on the Treaty (as defined under “Spanish Tax Considerations” above) and is based in part on representations of BBVA’s depositary and assumes that each obligation provided for in or otherwise contemplated by BBVA’s deposit agreement or any other related document will be performed in accordance with its terms. Prospective purchasers of the ADSs or ordinary shares are urged to consult their own tax advisers as to the United States, Spanish or other tax consequences of the purchase, ownership and disposition of ADSs or ordinary shares in their particular circumstances, including the effect of any U.S. state or local tax laws.
For United States federal income tax purposes, U.S. Holders of ADSs will generally be treated as the owners of the underlying ordinary shares represented by those ADRs. Accordingly, no gain or loss will be recognized if a U.S. Holder exchanges ADSs for the underlying ordinary shares represented by those ADSs.
The U.S. Treasury has expressed concerns that parties to whom ADSs are released may be taking actions that are inconsistent with the claiming of foreign tax credits for U.S. holders of ADSs. Such actions would also be inconsistent with the claiming of the reduced rate of tax applicable to dividends received by certain noncorporate U.S. Holders, as described below. Accordingly, the analysis of the creditability of Spanish taxes described below, and the availability of the reduced tax rate for dividends received by certain noncorporate U.S. Holders, could be affected by future actions that may be taken by the parties to whom the ADSs are released.
This discussion assumes that BBVA was not a passive foreign investment company (“PFIC”) for 2003 (as discussed below).
Taxation of Distributions
To the extent paid out of our current or accumulated earnings and profits (as determined in accordance with United States federal income tax principles), distributions, before reduction for any Spanish income tax withheld by BBVA or its paying agent, made with respect to ADSs or ordinary shares (other than certain pro rata distributions of BBVA’s capital stock or rights to subscribe for shares of its capital stock) will be includible in the income of a U.S. Holder as ordinary dividend income. Such dividends will not be eligible for the “dividends received deduction” generally allowed to corporations under the Code. Subject to applicable limitations, dividends paid to noncorporate U.S. Holders in taxable years beginning before January 1, 2009 will be taxable at a maximum tax rate of 15%. Noncorporate U.S. Holders should consult their own tax advisers to determine the implications of the rules regarding this favorable rate in their particular circumstances. To the extent that a distribution exceeds our current and accumulated earnings and profits, it will be treated as a nontaxable return of capital to the extent of the U.S. Holder’s tax basis in the ADSs or ordinary shares, and thereafter as capital gain.
114
The amount of the distribution will equal the U.S. dollar value of the euro received, calculated by reference to the exchange rate in effect on the date such distribution is received (which, for U.S. Holders of ADSs, will be the date such distribution is received by the depositary), whether or not the depositary or U.S. Holder in fact converts any euro received into U.S. dollars at that time. Any gains or losses resulting from the conversion of euro into U.S. dollars will be treated as ordinary income or loss, as the case may be, of the U.S. Holder and will be U.S. source. Dividends generally will constitute foreign source “passive” or “financial services” income for U.S. foreign tax credit purposes.
Subject to certain generally applicable limitations, a U.S. Holder will be entitled to a credit against its U.S. federal income tax liability, or a deduction in computing its U.S. federal taxable income, for Spanish income taxes withheld by BBVA or its paying agent. A U.S. Holder must satisfy minimum holding period requirements in order to be eligible to claim a foreign tax credit for foreign taxes withheld on dividends. U.S. Holders are urged to consult their own tax advisers to determine whether they are subject to any special rules that limit their ability to make effective use of foreign tax credits.
Sale and Other Disposition of ADSs or Shares
Gain or loss realized by a U.S. Holder on (i) the sale or exchange of ADSs or ordinary shares or (ii) the depositary’s sale or exchange of ordinary shares received as distributions on the ADSs, will be subject to United States federal income tax as capital gain or loss in an amount equal to the difference between the U.S. Holder’s tax basis in the ADSs or ordinary shares and the amount realized on the disposition. Gain or loss, if any, will be U.S. source for foreign tax credit purposes. The deductibility of capital losses is subject to limitations.
Passive Foreign Investment Company Rules
We believe that we were not a “passive foreign investment company”, or “PFIC”, for United States federal income tax purposes for the taxable year 2003. However, since our PFIC status depends upon the composition of our income and assets and the market value of our assets (including, among others, less than 25% owned equity investments) from time to time, determined pursuant to certain proposed Treasury Regulations that are not yet in effect but are generally proposed to become effective for taxable years after December 31, 1994, there can be no assurance that we will not be considered a PFIC for any taxable year.
Ordinarily, if we were treated as a PFIC for any taxable year during which a U.S. Holder held ADSs or ordinary shares, gain recognized by such U.S. Holder on a sale or other disposition of an ADS or share would be allocated ratably over the U.S. Holder’s holding period for the ADS or ordinary share. The amounts allocated to the taxable year of the sale or other exchange and to any year before we became a PFIC would be taxed as ordinary income. The amount allocated to each other taxable year would be subject to tax at the highest rate in effect for ordinary income of taxpayers of the U.S. Holder’s type for such taxable year, and an interest charge would be imposed on the amount allocated to such taxable year. Similar tax rules would apply to any distribution in respect of ADSs or ordinary shares in excess of 125% of the average of the annual distributions on ADSs or ordinary shares received by the U.S. Holder during the preceding three years or the U.S. Holder’s holding period, whichever is shorter. Additionally, if we were a PFIC for any taxable year during which a U.S. Holder held an ADS or ordinary share, such U.S. Holder would be required to make an annual return on IRS Form 8621 for that year, describing the distributions received from BBVA and any gain realized on the disposition of ADSs or ordinary shares. Certain elections may be available (including a mark to market election) to United States persons that may ameliorate the adverse consequences resulting from PFIC status.
Information Reporting and Backup Withholding
Information returns may be filed with the Internal Revenue Service in connection with payments of dividends on, and the proceeds from a sale or other disposition of, ADSs or ordinary shares. A U.S. Holder may be subject to United States backup withholding tax on these payments if the United States Holder fails to provide its taxpayer identification number to the paying agent and comply with certain certification procedures or otherwise establish an exemption from backup withholding. The amount of any backup withholding from a payment to a U.S. Holder will be allowed as a credit against the U.S. Holder’s U.S. federal income tax liability and may entitle the U.S. Holder to a refund, provided that the required information is furnished to the Internal Revenue Service.
F. Dividends and Paying Agents
Not applicable.
G. Statement by Experts
Not applicable.
115
H. Documents on Display
The documents concerning BBVA which are referred to in this Annual Report may be inspected at its offices at Plaza de San Nicolás 4, 48005 Bilbao, Spain. In addition, we are subject to the information requirements of the Exchange Act, except that as a foreign issuer, we are not subject to the proxy rules or the short-swing profit disclosure rules of the Exchange Act. In accordance with these statutory requirements, we file or furnish reports and other information with the SEC. Reports and other information filed or furnished by BBVA with the SEC may be inspected and copied at the public reference facilities maintained by the SEC at Room 1024, 450 Fifth Street, N.W., Washington, D.C. 20549, and at the SEC’s regional offices at The Woolworth Building, 233 Broadway, New York, New York 10279 and Northwestern Atrium Center, 500 West Madison Street, Suite 1400, Chicago, Illinois 60661-2511. Copies of such material may also be inspected at the offices of the New York Stock Exchange, 11 Wall Street, New York, New York 10005, on which BBVA’s ADSs are listed. In addition, the SEC maintains a web site that contains information filed electronically with the SEC, which can be accessed over the internet athttp://www.sec.gov.
I. Subsidiary Information
Not applicable.
ITEM 11. QUANTITATIVE AND QUALITATIVE DISCLOSURES ABOUT MARKET RISK
Risk at BBVA
The assumption of risk is inherent to financial activity. Effective management of risk contributes to the reliable and sustainable generation of value over time and, accordingly, it is important to our shareholders, customers, and employees that BBVA has a sound and consistent risk management model.
BBVA believes that its strong risk management is a basic component of its competitive advantage. In order to achieve this advantage, BBVA dedicates the resources necessary to ensure that the risks incurred by BBVA in the course of its various business activities are duly identified, measured, valued and managed.
BBVA manages customers and products in the various businesses and geographical areas in which it operates, while also addressing all of the related risks, such as credit or counterparty risk, market risk, operational risk and structural risk for each of those business and geographical areas. BBVA also faces structural risks, including liquidity, interest and exchange rate risks in connection with its operations.
In an ever more globalized and interdependent world, adequate management of all of the different risks associated with our operations requires an integrated risk management strategy.
116
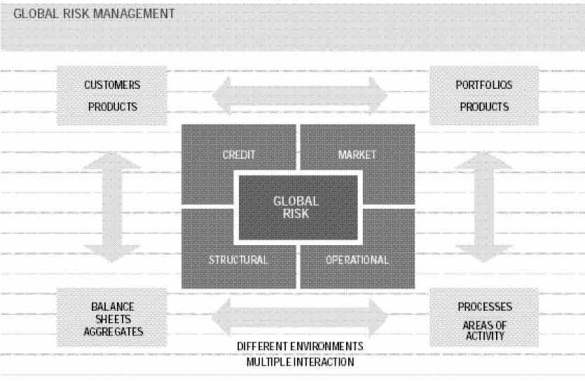
This is particularly complex, because, in general, credit risks relate to customers, market risks relate to portfolios and products, structural risks to balance-sheet aggregates and operational risks are normally identified within our processes and circuits.
The heterogeneous nature of the areas in which risk needs to be measured, the variety of types of risk and the interdependence among development of uniform tools and models for managing all of the different risks we face.
Two basic factors are crucial in development of uniform tools and models for managing risk. The first factor, which is quantitative, is the development of a uniform system of risk measurement, enabling the different risks implicit in our processes, products, customers or portfolios to be measured in a uniform way. This uniform measure is economic capital and the expected losses associated with each business activity. Only with a uniform system of risk measurement is it possible to manage risks globally across our disparate activities, including the interactions between different risks.
The second factor, which is qualitative, is the implementation of a uniform risk management model across all of BBVA’s business lines. This means that our risk measurement tools, circuits, procedures, information and monitoring systems, policies and controls must reflect risk management methods and indicators must comprise a uniform risk management model for the entire Group.
BBVA made consistent progress in the implementation of the risk model in 2003, as is explained in the following pages. The steps taken to that end, in terms of both the development and use of rating and scoring tools and their use in day-to-day decision-making processes, and in the creation of databases and the uploading of information to enable expected losses, economic capital and other significant measures to be calculated, have been developed and implemented in consideration of the future regulatory framework, known as Basel II, that will govern financial institutions from the end of 2006 onwards.
New Regulatory Capital Proposal: Basel II
On April 29, 2003, the Basel Committee published the third and final consultative paper which includes a Proposal for a New Capital Accord to replace the current Accord. BBVA has taken a very active role in the long period of dialog between the Committee, the financial institutions, which will be affected by the Accord, and relevant national supervisory authorities, which will give rise to the final draft of the paper. The definitive version of the paper is expected to be published in the first half of 2004.
BBVA is aware that both from the standpoint of the overall direction pursued by Basel II, and from the approach followed in its implementation, benefits will accrue not only to the banks directly affected, but also to financial systems as a whole. Pursuant to the Basel II Accord, the sensitivity of regulatory capital to economic risks will be clearly increased, banks’ knowledge of the risks they incur will improve and, in short, financial systems will be more secure, sound and efficient.
117
One of the aspects, however, in which the Basel II model most needs to be improved is in the recognition of the value of diversification, the benefits of which are only partially taken into account in the Committee’s proposal.
BBVA has performed several studies in an effort to find solutions for modeling diversification in the context of the Basel II model, without losing the simple structure of the current proposal and has submitted specific proposals that would include the benefits of diversification in the Basel II model.
BBVA is convinced that the New Basel Capital Accord will not only affect the capital adequacy ratios required of banks but will also have a significant impact on the way the banks operate, manage risk and assign resources. Accordingly, BBVA has, in a variety of ways, been preparing to use Basel II models in-house from the outset.
BBVA has also created the Internal Risk Control unit, which is responsible for ensuring that our risk management processes are not only effective, but also consistent with best practices in the market and BBVA’s management model. The Internal Control unit intends to implement the Basel Pillar II requirements, and has launched the Contigo Plan to review with our different business areas their main processes and identify any gaps needing improvement.
BBVA has also initiated the Risk-adjusted Return (RAR) Project, which is creating the infrastructure, default and loss given default databases required for measuring economic capital, expected loss and RAR to be calculated for BBVA as a whole. This project will enable us to meet the internal model information and management requirements envisaged in the future Basel regulations.
Global Risk Management
Economic capital is a basic element in the calculation, on a properly risk-adjusted basis, of returns and the intrinsic value of our various businesses and operating activities, as well as for calculation of capital adequacy in economic rather than purely regulatory terms. This makes BBVA’s capital assignment process more efficient.
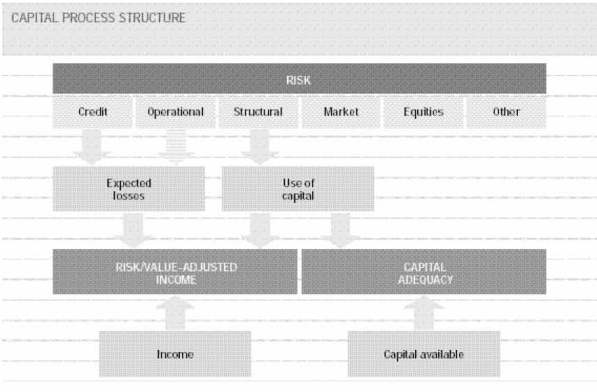
BBVA measures economic capital by segmentation portfolio, which means that aggregates by business unit, product type, country or risk type can be calculated.
118
Progress was made in the following areas in 2003 to provide BBVA with better measures of economic capital:
First, further progress was made on the RAR (Risk-adjusted Return) Project described above, and at December 31, 2003, an inventory was available with calculations from transaction level of expected loss, economic capital, regulatory capital per Basel II (for all the envisaged options) and Risk-adjusted Return for the Parent Bank’s portfolios. The system is flexible enough to include any changes that may be made in the final version of the Basel II Capital Accord.
Second, with respect to our Latin-American subsidiaries, progress was made in 2003 on the functional design stage of the RAR Project and the construction of regional infrastructure in Mexico that will facilitate the development of the Project in the countries in which we operate.
Third, in 2003, our economic capital calculation methodology was reviewed and it was decided that economic capital will be calculated using the methodologies developed internally on the basis of the information available and the Basel II assumptions will only be used when they faithfully reflect the relevant risk.
Some of the material differences between the internal economic capital calculation methodology and the calculations in the advanced internal models in the New Accord are as follows:
| | • | The economic capital calculation only includes unexpected losses, while expected losses are expensed. Also, an adjustment is made to the economic capital base for the difference between the total volume of provisions and the calculated amount of expected losses. |
| | • | Credit correlations are estimated internally and not pursuant to the standards included in Basel II, which we believe inadequately treats the element of diversification. |
| | • | The economic capital calculations include certain risks not explicitly contemplated by Pillar I of the New Accord. |
BBVA’s objective in maintaining internal measures of economic capital that differ from those required by regulators is to arrive at capital measures that are as closely linked as possible to the risks involved.
Fourth, in 2003, risk-adjusted capital ratios were designed and quantified to facilitate the monitoring of BBVA’s capital level with respect to the consumption of economic capital. These ratios supplement the traditional Basel ratios.
The following table set forth below shows the distribution by business area of BBVA’s economic capital as of December 31, 2003, in attributable terms –net of minority interests. Retail Banking Spain and Portugal represents 35% of economic capital, 51% of which corresponds to the Commercial Banking unit and 27% to Corporate Banking unit. Banking in America accounts for 24% of economic capital, of which Mexico accounts for 45%, Wholesale and Investment Banking represents 17% of economic capital, while Corporate Activities and Other, which is principally comprised of investments in industrial corporations and in financial institutions and the ALCO’s activity, accounts for the remaining 24%.
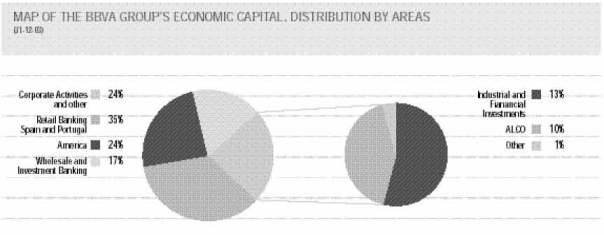
119
By type of risk, as of December 31, 2003, credit risk continued to account for the largest portion (48%) of BBVA’s use of economic capital. At the same date, market risk, which includes the structural balance-sheet risk associated with variations in interest rates and exchange rates and the equities portfolio risk, accounted for 34% of total economic capital, and operational risk accounted for 12%. The remaining 6% includes real estate and the use of economic capital deriving from BBVA’s insurance operations.
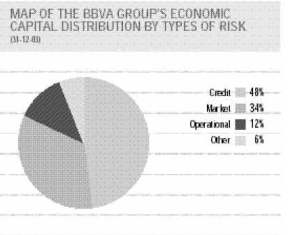
Credit Risk Management
Evolution of credit risk exposure and quality
As of December 31, 2003, BBVA’s overall credit risk exposure increased by 1.9% to €321 billion, compared to 2002.
Customer lending (48% of the total) and credit lines drawable by third parties (16%) increased by 4.7% and 8.4%, respectively, in 2003, whereas the potential exposure to credit risk in market operations (31% of the total) and contingent liabilities (5%) decreased by 3.4% and 8.3%, respectively.
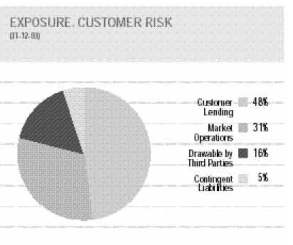
The majority of BBVA’s exposure to customers was in Retail Banking Spain and Portugal, which accounted for 59% of the total exposure, compared to 53% as of December 31, 2002, followed by Wholesale and Investment Banking, which accounted for 25% in both 2003 and 2002.
120
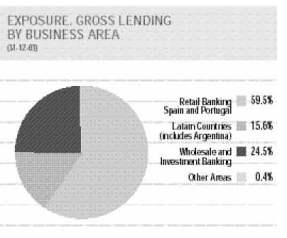
In 2003, the percentage of total lending made by BBVA in Spain (including by our subsidiaries outside of Spain) increased by approximately 4.0% to 81.6%. The percentage of total lending in Europe in 2003 was 2.8%, while the percentage corresponding to lending in the Latin-American countries in which we operate declined from 20.2% to 15.6%, principally due to the effects of the depreciation of several currencies in Latin America and the sale of our interest in BBV Brasil, S.A. Of this 15.6%, 11.6% was concentrated in investment-grade-rated countries (8.1% in Mexico, 2.0% in Chile and 1.5% in Puerto Rico) and, accordingly, only 4.0% of BBVA’s loans were in countries rated as below investment grade.
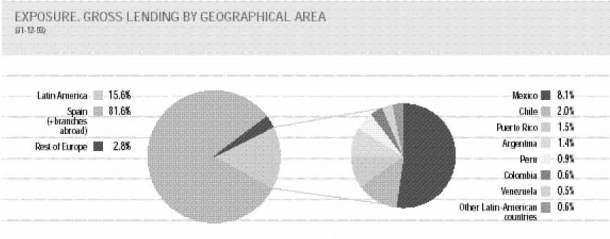
The BBVA’s main credit risk quality indicators improved in 2003. As of December 31, 2003, BBVA’s nonperforming loans ratio was 1.74%, compared to 2.37% as of December 31, 2002. Disregarding Argentina and Brazil, the ratio would have been 1.31% (1.70% as of December 31, 2002). Including contingent liabilities and excluding country-risk positions, BBVA’s nonperforming loan ratio would have decreased to 1.37%, compared to 1.85% as of December 31, 2002.
121
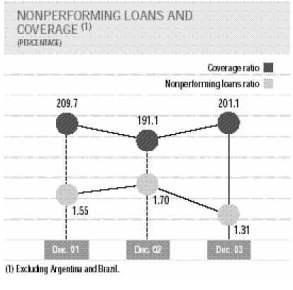
The decreases in the foregoing measures of our nonperforming loan ratios was principally due to the reduction in the rate of loans becoming nonperforming from 2.92% to 1.62% as of December 31, 2002 and 2003, respectively. These decreases were also done to an improvement in the loan recovery rate to 27.8% of critical assets, which are comprised or our the nonperforming loan balance plus new nonperforming loans recorded during 2003 from 25.5% as of December 31, 2002.
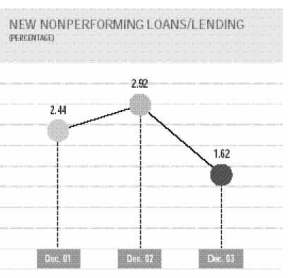
As a result of these developments, BBVA’s nonperforming loan balance decreased by 23.1% to €2,673 million, 38.1% of which related to loans in Spain, 26.0% to Argentina and 18.3% to Mexico.
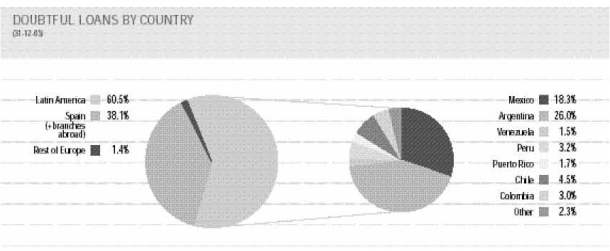
122
BBVA’s improvement in its nonperforming loan ratio was attributable to strong performances across all business areas. Retail Banking Spain and Portugal reduced its nonperforming loan ratio by 12 basis points to 0.88% as of December 31, 2003, and recorded an all-time low in its new nonperforming loans ratio (0.70% of lending), Wholesale and Investment Banking saw a sharp fall in its nonperforming loan ratio to 0.66% due to the absence of significant new nonperforming loans and to strong recoveries in the doubtful portfolio, while the nonperforming loan ratio for Banking in America, which does not include our Argentinean operations, was 4.01%, after the application of stricter non-performing loan classification criteria in certain countries. In Mexico the ratio fell from 4.22% as of December 31, 2002, to 3.95% at 2003 year-end.
The BBVA’s coverage ratio increased in 2003 to 166.3%, 19.5% higher than as of December 31, 2002. If Argentina and Brazil were excluded, the coverage ratio would have been 201.1%, compared to 191.1% as of December 31, 2002.
BBVA’s lending to private-sector domestic clients in Spain amounted to €102 billion, and the risk was spread among financing for individuals (44.0%) and companies (56.0%). Mortgage lending accounted for 31.0% of the total and had a nonperforming loan ratio of 0.42% (9 basis points lower than as of December 31, 2002).
Financing of companies is distributed among various industries, including real estate (13%), manufacturing (10%), construction (8%), trade, services and repairs (7%).
Credit Risk Profile
Early measurement of credit risk, essentially expected loss and economic capital, permits advance monitoring of the portfolio’s risk profile. The two basic components of these measures, which are described below, are probability of default and loss given default followed by certain expected loss indicators relating to BBVA’s various portfolios.
Probability of default. This is determined by in-house measuring tools (rating and scoring) that include the specific risk factors related to different customer segments and transaction types.
Generally, default is understood to mean a payment delay of more than 90 days measured for a one-year period, which is in line with the Basel II consultative paper.
Rating and scoring tools provide a measure of the level of risk which, by means of a statistical process known as calibration, is associated with a specific probability of default. This probability of default is then linked to a rating on a master scale, which enables BBVA’s various risk portfolios to be classified uniformly. The narrowest version of the master scale, which is shown below, classifies outstanding risks in 13 categories (the version we use covers 34 risk levels).
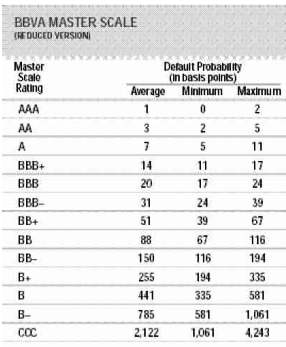
123
Applying this master scale to BBVA’s risks in Spain corresponding to credit exposure to companies, financial institutions, institutions and sovereign borrowers discloses a distribution of ratings, weighted by exposure, in which 62% of the credit risk exposure is concentrated in the A-rated or higher bracket.
124

| (1) | Activities in Spain relating to Companies, financial entities and sovereign risks. |
Excluding sovereign risks, 49% of the exposure is still rated A or above and 72% is rated BBB- or higher.
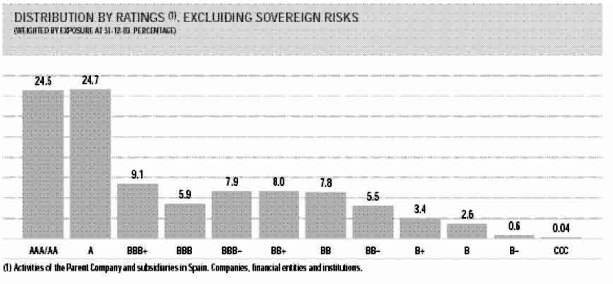
In 2003, BBVA continued to make progress on developing several historical default and loss given default databases, which would enable very precise estimates to be obtained of the probability of default and loss given default inputs required in credit risk management.
Among other risk management features, these databases assist in identifying how the term of a loan affects the probability of default. In the retail segment –mortgages and consumer loans– this effect is clearly shown in the graphs below, which were prepared by segmenting historical risk information relating to BBVA’s consumer and mortgage loan portfolio in Spain.
The two methods used for grouping the information included in the tables were as follows:
| | • | The scores were divided into five groups, Group 1 being the best-scoring loans and Group 5 the worst-scoring. |
| | • | The time, in years, that has elapsed since the loan was granted. |
The tables demonstrate that loan scoring has a predictive capability regarding loan defaults since the best-scoring loans are shown to have the lowest probability of default, and the lowest scoring loans had the highest probability of default. For both consumer loans and mortgages and all the scoring groups, the tables show that the estimated probability of default increases until the second year, when there is a change of trend and the probability of default starts to decrease.
125
In addition, the tables demonstrate that the loans’ score ceases to have significant predictive value regarding the probability of default of loans several years old since the probability of default shown in all the curves converge at a single average default rate.
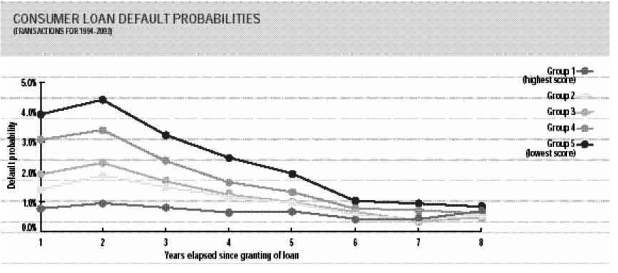
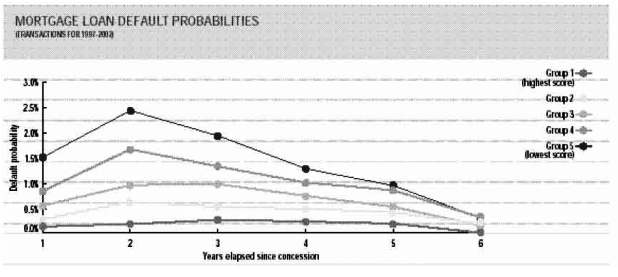
126
In summary, most of BBVA’s activities subject to credit risk are assessed at the initiation of the transaction and each transaction is assigned a probability of default based on application of risk rating or scoring tools applied uniformly throughout BBVA’s operations.
Loss Given Default. Loss given default can be defined as the percentage of a loan that is not recovered in the event of a default on a transaction. BBVA is continually working to address loan loss given default in two areas: first to accurately estimate loss given default levels and second, to reduce loss given default levels by improving recovery levels.
As stated above, the development of new databases in 2003 resulted in considerable improvements in the accuracy of estimates of loss given default in BBVA’s loan portfolios. These databases allow information relating to loan recoveries to be analyzed using various segmentation methods.
The following tables set forth BBVA’s first estimates for loss given default relating to mortgages and consumer loans. The information contained in these charts, as in the case of the information on loan default rates described above, was obtained from BBVA’s historical records regarding its consumer and mortgage loan portfolio in Spain.
This table shows that more than 80% of mortgages have a recovery rate in excess of 90%.
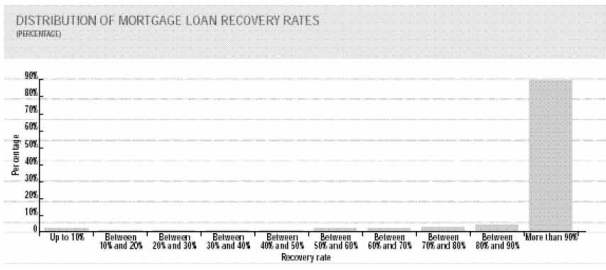
The following table shows the analysis performed on BBVA’s consumer loan portfolio in Spain. In the retail consumer loan segment the recovery rates are lower than those in the mortgage loan segment and are characterized by two extremes – a large number of defaulted consumer loans on which the recovery rate is very low and an even higher number on which the recovery rate is over 90%.
127
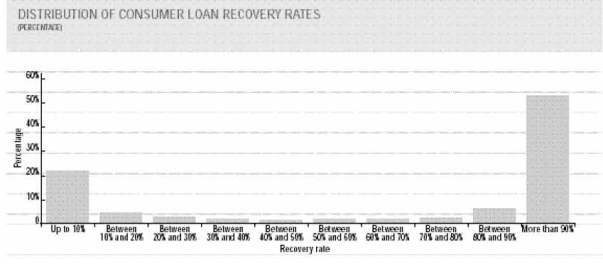
Expected losses. During 2003, the estimates of BBVA’s expected losses were adjusted in line with the new information, organized by geographical and by business areas, provided by the historical risk databases.
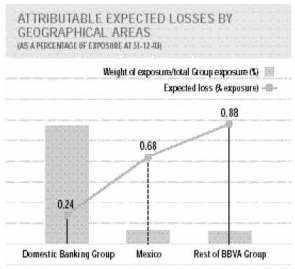
The breakdown of the BBVA’s expected losses by geographic area, as of December 31, 2003, as a percentage of exposure, shows that banking in Spain accounts for 81% of total exposure and has an expected loss of 0.24% of that exposure, while Mexico and the rest of BBVA had expected losses of 0.68% and 0.88%, respectively.
128
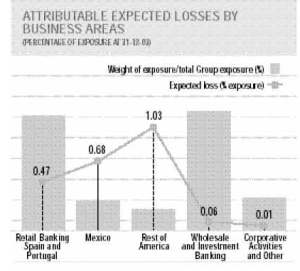
As shown in the foregoing table, the attributable expected loss in BBVA’s main business areas by exposure — Wholesale and Investment banking which represented 38% of exposure and Retail Banking Spain and Portugal which represented 36% of exposure — was 0.06% and 0.47%, respectively. Banking in America had an expected loss of 1.03% of exposure. The following table sets forth the expected loss rates for BBVA’s main business segments in Spain.
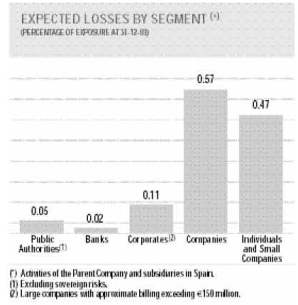
Credit risk in market activities.
Measurement of the credit risk in OTC financial instruments to counterparties is carried out by the daily marking to market of the positions held plus an estimate of the maximum increase in the value of the security that can be expected through maturity.
The equivalent maximum credit risk exposure to counterparties was €14,669 million as of December 31, 2003, a decrease of 24.9% from 2002. This reduction in risk was principally due to the development of OTC financial instrument collateralization agreements.
BBVA continued its policy of signing legally valid netting agreements with each of the jurisdictions in which it operates, which account for a significant share of total exposure.
The net market value of the OTC financial instruments in the portfolio as of December 31, 2003 was €3,876 million, with a mean residual term of 95 months. As of the same date, the average replacement value, measured in gross terms, was €4,915 million.
129
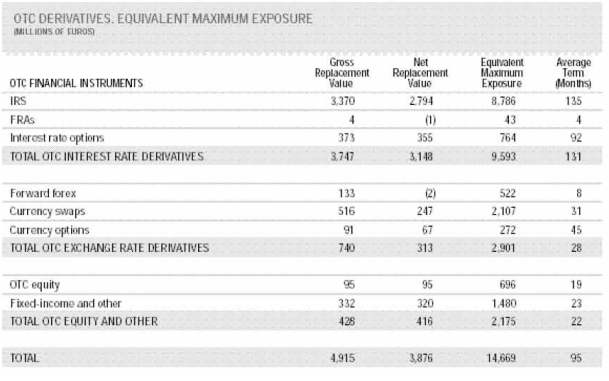
The following chart shows the distribution by residual term of the equivalent maximum exposure in OTC financial instruments compared to the related data as of December 31, 2002.
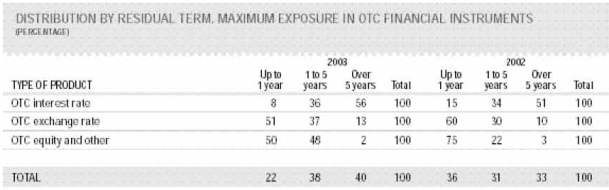
The following table sets forth the counterparty risk assumed in OTC financial instrument transactions, which in 89% of the cases, is with entities with credit ratings of A- or higher.
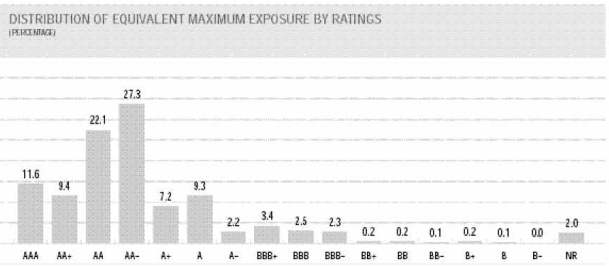
130
BBVA’s exposure is concentrated with financial institutions (83%), with the remainder (17%) corresponding to corporations and customers, which we consider adequate diversification of exposure.
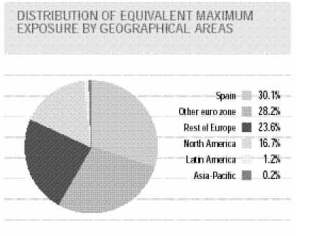
The foregoing table sets forth the distribution of risk by geographical area, which is concentrated in Europe (82%) and North America (16.6%), representing 98.6% of the total.
In addition, BBVA continued to measure credit risk in terms of expected loss plus economic capital for activities performed with each counterparty and/or issuer using a measurement tool specifically applicable to each transaction type for this purpose, as shown in the graph.
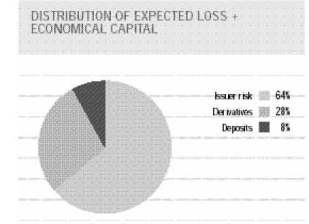
Market Risk Management
The possibility of using internal models for calculating capital requirements, as envisaged in Directive 98/31/EC, amending the CAD (1993 Capital Adequacy Directive) became a reality for Spanish credit institutions with the entry into force of Bank of Spain Circular 3/2003 to Credit Institutions (the “Circular”) amending Bank of Spain Circular 5/1993 on the calculation and control of minimum equity. The Circular sets forth the minimum conditions that must be met by a bank’s internal risk management models, the internal organization of the bank and regarding its internal controls such that, after these factors have been individually assessed, minimum equity requirements for the coverage of various risks can be calculated.
The Global Market Risk Management unit is responsible for the integrated management of market, exchange rate and commodity risk for BBVA. This unit, which is organically separate from and independent of the business areas, is responsible for
131
adapting and administering risk measurement and control tools and for ensuring that the business areas comply with applicable risk limits and policies. The unit also periodically reports to the Executive Committee, the Risk Committee, our management committee and several other risk subcommittees on levels of risk, results and the degree of compliance with such limits, at an individual as well as BBVA-wide level.
In this respect, another of the basic pillars of the BBVA’s market risk management model is the limit structure, which consists of an overall value at risk (“VaR”) limit for each business unit, supplemented by a series of specific sublimits by desk, business line, and risk or product type. Proposals for the overall limits for all the business units and for certain sublimits are approved by the Executive Committee. The business units, together with the risk department, are responsible for distributing these limits by desk, business line or risk type. These VaR limits are supplemented by other limits based on non-statistical measures such as delta sensitivity, nominal exposure or stop-loss limits. In addition to this limit structure, a variety of warning signs are in place which trigger contingency plans to attempt to prevent situations that might adversely affect BBVA’s results.
The purpose of the market risk management and measurement model currently in place at BBVA is to measure both general market risk and specific risks, for which BBVA employs the VaR methodology, which aims to measure the maximum loss that can occur in the value of the portfolio as a result of fluctuations in general conditions of the financial markets, such as changes in interest rates, exchange rates and equity security prices. In addition to these three risk categories, other relevant market risks include basis risk (which arises, for example, when there are debt positions the interest rate risk on which is hedged by swap transactions, generating a risk because there is a variable spread between the interest rate curves relevant for the valuation of these positions), spread risk (associated with corporate securities or credit derivatives on corporate issuers), volatility and convexity risk (for options) and correlation risk.
The VaR model used by BBVA is the covariance matrix which has a confidence level of 99% and a time horizon of one day and has been improved to take into account convexity and other risks associated with option positions and structured derivative products. In addition, periodical supplementary settlement VaR calculations are performed for certain business units, which include adjustments to factor in the specific liquidity of the position, taking into account the liquidity conditions in the financial markets at any given time.
BBVA is also implementing a new risk measurement platform which, in addition to having the advantage of enabling market risk to be integrated with credit risk and thereby providing an overall view of existing risk, makes it possible to calculate market risk using the covariance matrix, the historical simulation and the Monte Carlo simulation methodologies.
The accompanying table shows the distribution of the changes in the value of our portfolio of long-term interest rate options in a set of scenarios generated by the Monte Carlo analysis. The histogram shows the frequency of the various changes in value in the simulation. The 1% percentile of the distribution shows the VaR figure with a one-day time horizon for a confidence level of 99%.
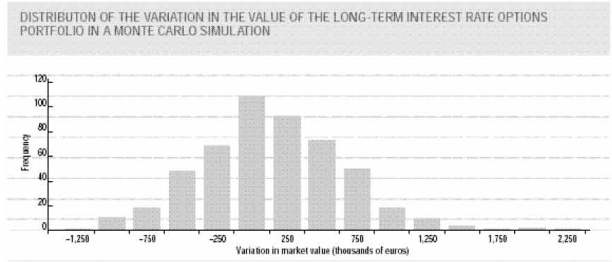
Similarly, the distribution of variations in the value of our long-term interest rate options portfolio in a historical simulation is shown in the table below.
132
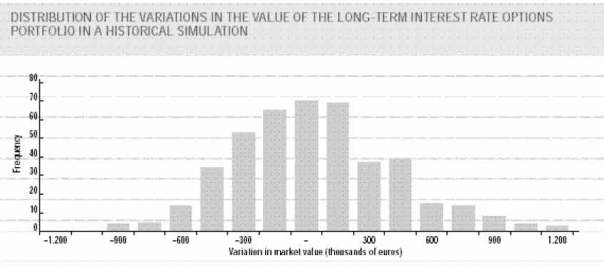
The market risk measurement model includes a back-testing or ex-post contrast program, which to a certain extent guarantees the suitability of the risk measures that are performed. Comparisons are made of the levels of ex-ante risk provided by the model with the ex-post results obtained by our various business units each day to validate the VaR measurement system.
Stress-testing is an essential supplementary tool for market risk management, especially after the recent crises in Argentina and Brazil and the upheaval in the financial markets after the events of September 11, 2001. Accordingly, in order to strengthen risk management and control, BBVA periodically calculates the exposure to losses of each business unit in response to events beyond the predetermined confidence interval for the daily measurement of market risk. This enables senior management to evaluate the level of exposure to losses under these potential scenarios, and to design, on the basis of that exposure, the contingency plans that must be implemented immediately if an unusual situation similar to those examined should arise.
Market risk in 2003. In 2003, the behavior of the markets was marked by recovery, especially so in the case of the emerging markets. Thus, in Latin America the stock markets appreciated considerably, while spreads on sovereign debt in several countries in the region recorded all-time lows during the year. The evolution of market risk in BBVA’s securities markets business lines in 2003 was characterized by a low risk profile in the first few months of the year as a result of a conservative management approach taken due to increasing international uncertainty regarding Iraq, and a gradual increase in risk from May onwards, with a higher level of exposure maintained in the second half of the year, as a result of the expectations of a recovery in the principal world economies.
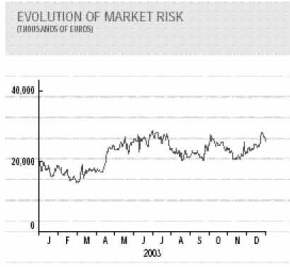
133
In 2003, the average risk in BBVA’s business areas that take on market risk, in VaR terms, was €21,985 thousand, with a maximum and minimum of €28,587 thousand and €14,138 thousand, respectively, and a median of €22,766 thousand. The maximum levels were recorded in July, coinciding with a period of increased volatility in the Mexican market. Compared to 2002, there was a reduction both in the average level of risk and, in particular, in the dispersion of risk, as a result of active risk management. Considering a time horizon of ten days, as recommended by the Basel Committee, the estimated average loss in 2003 with a confidence level of 99% was €69,524 thousand.
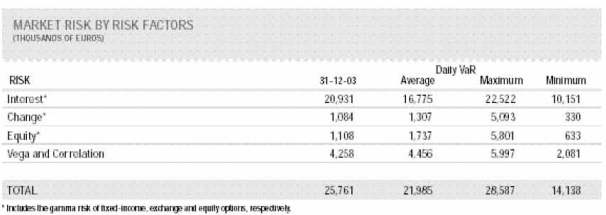
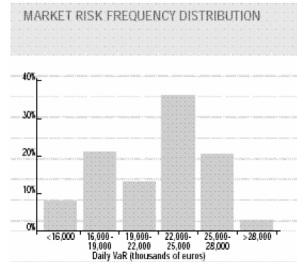
BBVA’s most significant market risk is interest rate risk (76% of the total as of December 31, 2003), which includes both systemic risk and the specific risk tied to the spreads that are applied to the market curve for corporate issuers based on their credit-worthiness. Significantly less important risks for BBVA are vega risk and correlation risk tied to options and structured derivative products, which represent 8% and 7% of the total, respectively, and stock market and currency risk, which account for 4% each. It should be noted that currency risk relates to the operating exchange positions of BBVA’s business areas that take on market risk.
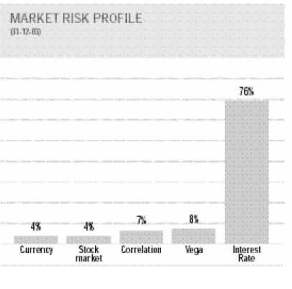
134
With regard to the distribution of the BBVA’s risk by geographical area, most of BBVA’s total market risk relates to banking in Europe and the U.S. (principally investment banking), while BBVA’s Latin-American banks in the aggregate represent 39.7% of the total risk in average annual terms, of which 28.7% is concentrated in Mexico.
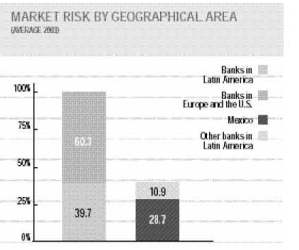
The following table sets forth the average use of limits and shows the percentage of use by several of BBVA’s main business units. The average use of the limits authorized by the Standing Committee for 2003 was 41%.
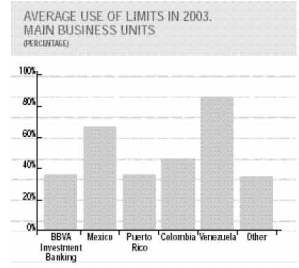
The following table sets forth the back-testing carried out for BBVA’s aggregate risk in 2003, which consisted of comparing, for each day, the results of the revaluation of our positions with the risk estimated by the model, and demonstrates the accuracy of the management risk model used by BBVA. The same conclusion was reached from comparisons performed for other representative risk levels lower than BBVA’s aggregate risk.
135
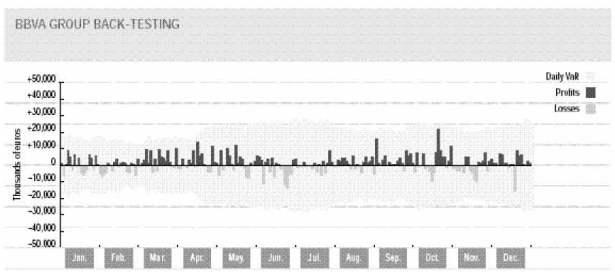
Structural Interest Risk
Structural interest risk is defined as a company’s exposure to variations in market interest rates arising from mismatches in the maturity and repricing dates (depending on whether the related instruments are tied to a fixed or floating rate, respectively) of the company’s assets and liabilities, including derivatives.
The Basel Committee on Banking Supervision, in the consultative paper “Principles for the Management and Supervision of Interest Rate Risk”, set forth the basic principles for the management, measurement and monitoring of structural interest risk with which banks are required to comply.
BBVA includes these recommendations in its structural interest risk control and management procedures. Accordingly, our organizational structure was defined to establish a separate assignment of functions and responsibilities, maintaining at all times the interest rate risk control and management.
The Executive Committee is responsible for approving strategies and policies relating to the management and control of structural interest risk. This committee has delegated responsibility for monitoring this risk to the Risk Committee.
The Asset-Liability Committee (ALCO), is responsible for actively managing BBVA’s balance sheet in order to stabilize net interest income without prejudicing equity. The ALCO for BBVA in Spain coordinates its work with the ALCOs of BBVA’s subsidiaries through a corporate strategy committee. The ALCOs meet at least once a month.
The risk unit of the Corporate Activities and Other business area is responsible for controlling and monitoring structural interest rate risk. This unit periodically measures this risk from two perspectives: first, from the net interest income standpoint and, second, from that of the economic value. In the former case, net interest income is projected for the next 12 months. In the case of the analysis of economic value, a discounted current value is calculated of expected future flows in the balance sheet. The impacts of fluctuations in interest rates on both measures are calculated by using both parallel displacements in interest rate curves and shocks that take into account changes of slope and curvature. Several interest rate curve simulation methodologies have been developed to determine these changes of slope and curvature and these methodologies are used to calculate expected losses in net interest income and in economic value with a confidence level of 99%.
BBVA has established limits and procedures to ensure that exposure to structural interest rate risk remains within levels consistent with internal policies. The limits structure is revised and updated every year so that it is in line with market conditions and BBVA’s business structure. The accompanying table sets forth the average use of BBVA’s limits for 2003.
136
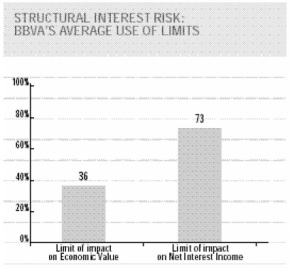
The following gap table sets forth, as of December 31, 2003, the distribution of maturities or repricing dates (depending on whether the relevant instrument is tied to a fixed or a floating rate, respectively) of the sensitive asset and liability aggregates in the balance sheet in euro, grouped by market type.
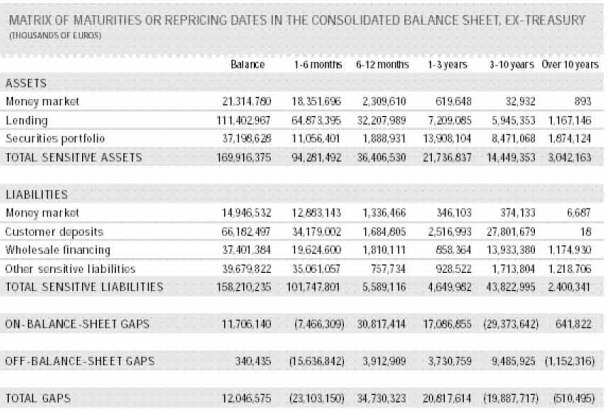
Aggregating these volumes determines the on-balance-sheet gap which, together with the off-balance-sheet gap, comprise BBVA’s total balance sheet gap in euro. The maturity or repricing matrices of the other currencies that are significant for BBVA are calculated in a similar way.
The following table sets forth a comparison of levels of risk among BBVA’s main financial institutions, the diversification of which reduces the risk for BBVA as a whole.
137
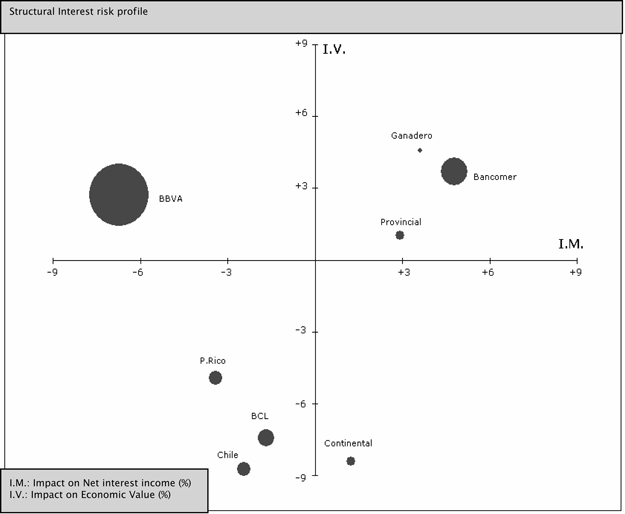
Liquidity Risk
Liquidity risk relates to the potential difficulty of resorting to the financial markets in order to meet payment obligations.
The Basel Committee, in the consultative paper “Sound Practices for Managing Liquidity in Banking Organizations”, enumerates a series of basic principles for the monitoring and control of liquidity risk, aimed at increasing awareness on the part of banks of the importance of the proper management of this risk.
BBVA’s Standing Committee is the body responsible for approving strategies and policies relating to the management of liquidity at corporate level, without prejudice to the fact that each of the main Group entities independently manages its own liquidity requirements.
Each entity’s Asset-Liability Committee (ALCO) is responsible for ensuring, at medium-term, that the entity has the required resources to carry on the business. Also, corporate monitoring is performed in respect of the liquidity position of each of the entities composing the Group, and of their projected medium-term liquidity profiles. The so-called Liquidity and Emergency Committees exist to act in the event of anticipated or actual liquidity crises.
Each major Group entity has established a liquidity contingency plan which details the actions and procedures to be followed in the event of an emergency, together with the responsibilities of each of the areas involved in the liquidity risk management and control process.
Liquidity monitoring is performed from two standpoints. On the one hand, a map is prepared daily analyzing the projected collection and payment flows for the next few days, as well as the assets available to meet existing payment commitments. In parallel, every month, liquidity profiles are calculated by business structure and financing type (gap of markets, credit, wholesale financing, equity, rediscountable assets and other), and expected future cash flows are projected for a time horizon of 12 months.
BBVA establishes quantitative and qualitative limits and warning signals that enable it to anticipate possible financing tensions. There is also a policy of diversification of sources of financing: wholesale, equity and the interbank market.
In order to avoid situations of tension and to guarantee BBVA’s liquidity, each entity defines various hypothetical systemic and specific crisis scenarios, and analyzes the various financing needs and alternatives. These scenarios address market factors, assumptions about renewal of financing at maturity, gradual withdrawals of funds, sudden withdrawals of funds, nonrenewal, etc.
138
Structural Exchange Rate Risk
An entity’s structural exchange rate risk refers to the potential losses in the value of structural positions arising from variations in exchange rates.
BBVA’s exposure to structural exchange rate risk arises mainly from the investments in other entities, insofar as these assets are denominated in currencies other than those in which they are financed.
The Asset and Liability Committee (ALCO) is the body responsible for actively managing structural exchange rate risk based on future exchange rate expectations. The committee meets every month and evaluates hedging decisions to mitigate the adverse impact of possible fluctuations in exchange rates.
The Risk area periodically measures structural exchange rate risk using a statistical simulation model that includes certain exchange rate crisis scenarios to which certain estimated probabilities of occurrence are assigned. Another factor in the model is the projection at one year of the exchange rates of the currencies involved. Every month the total risk is calculated in annual VaR terms with a confidence interval of 99%.
74% of the total exchange risk is concentrated in the Mexican peso, the Venezuelan bolivar and the Brazilian real. Several hedging transactions were arranged during the year to reduce the exposure to losses, thus considerably mitigating the impact of possible depreciations. Due mainly to the hedges arranged, the open structural position was reduced, compared with 2002.
Operational risk
Internally operational risk is defined as that which is neither credit nor market risk. This definition embraces that proposed by the Basel Committee on Banking Supervision (risk which can give rise to losses as a result of human error, inadequate or defective internal processes, systems failures or external causes), in addition to other risks such as strategic or business risk and regulatory risk. The last of these risks would impact BBVA in the event of regulatory changes affecting the income statement or its ability to generate business.
In 2003, BBVA continued to deploy the three basic tools created in-house (Ev-Ro, TransVaR and SIRO), as the main vehicles for identifying, measuring, evaluating and controlling risks of this kind. BBVA considers that proper management of operational risk fosters the creation of value for the shareholders. On the one hand, it improves the income statement by mitigating the risks that give rise to losses or loss of profits and, on the other, it makes it possible to reduce the regulatory capital to the minimum level possible under the new Basel regulations.
Operational risk is managed in two ways at BBVA:
| | • | The quantitative method: this consists of developing event databases similar to the credit risk default databases, which are used to model and calculate capital at risk. |
| | • | The qualitative method: based on the use of operational risk identification, valuation and mitigation tools. The particularity of the qualitative approach resides in the fact that exposure to operational risk can be detected and, consequently, mitigated, without having to manifest itself in the form of adverse events. |
The combination of the quantitative (ex post) and qualitative (ex ante) approaches is present in the tools used by BBVA:
| 1. | Ev-Ro: this is a tool for the identification and valuation of operational risk by business or support area. The information obtained is used to draw up risk maps. It is also used as a starting point for mitigation processes, putting particular emphasis on the most relevant aspects. |
139
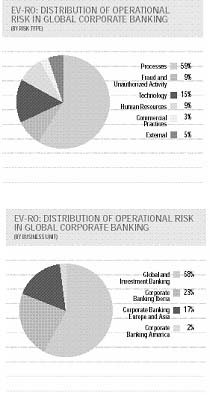
| 2. | TransVaR: this is a monitoring tool that uses indicators or variables that characterize each area’s processes and are linked to the causes of operational risk. The tool mixes quantitative and qualitative indicators. Both TransVaR and Ev-Ro are used for proactive management of operational risk at business and support units without adverse events having to take place. |
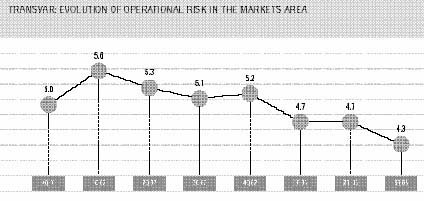
140
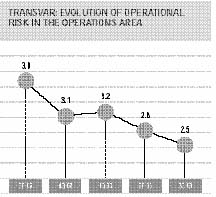
| 3. | SIRO (Integrated Operational Risk System): this consists of a set of databases of operational risk events classified by risk type and business line. They are located in each country and every month feed a central database called SIRO Global, which consolidates the information. |
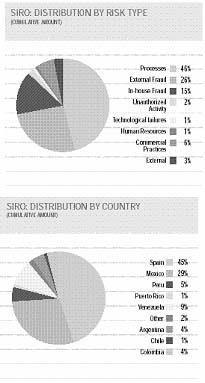
141
ORX (Operational Risk Exchange)
In order to complete BBVA’s database and, accordingly, to have more information to model risk with, in 2002 BBVA decided to become a founding member of the ORX International Consortium, in which 12 leading banks initially participated. Four information exchanges took place in 2003, with retroactive effect from January 1, 2002. Therefore, at 2003 year-end ORX had two years of operational risk events with more than 6,000 events recorded and classified according to the Basel criteria.
The management model
Operational risk management is incumbent on all business and support areas. Therefore, the corporate tools have been designed to be used in those units as sources of risk information, events and causes, constituting the basis of the mitigation processes.
Each business or support unit where the tools are implemented creates an Operational Risk Manager (generally located in the unit’s own risk or internal control area) and an Operational Risk Committee, which meets periodically to analyze the available information and to determine the most appropriate mitigation plans.
BBVA distinguishes between the following types of operational risk in its tools:
| | • | Processes: risk of errors in habitual operations, due to human error in processes, documentation or the controls thereof. |
| | • | Fraud and unauthorized activity: this includes the risk and events arising from the perpetration of criminal acts, and also the risk arising from unauthorized internal activities such as exceeding powers. |
| | • | Technology: includes the operational risk associated with technological failures (occasional or ongoing), due to problems with software, hardware or communications. |
| | • | Human resources: the risk associated with the human resources hiring and management policy and occupational safety and hygiene. |
| | • | Commercial practices: the risk of losses arising from indemnities for improper sales practices or product defects. |
| | • | Disasters: the risk associated with the occurrence of external events (whether natural, accidental or provoked) which cause damage to physical assets or interrupt one of BBVA’s services. |
| | • | Suppliers: the dependence on certain external suppliers in processes (both the supply of materials and services) generates an operational risk if the contracted service is not performed. |
Current situation
BBVA is making good progress in the implementation of the Ev-Ro and/or TransVaR tools. In Spain implementation has been completed in just over 70% of all areas, including the following units: Treasury, Corporate Banking, Capital Markets, Securities Company, Media, Systems, Altura Markets, Uno-e, Finanzia, Depository and Custody Services, Private Banking and Asset Management. In Latin America, the level of implementation currently exceeds 50% in the business and support areas.
In January 2002 and in July 2002, SIRO (the event database) was effectively implemented in Spain and in Latin America, respectively. 2003 saw the development of procedures to enhance the efficiency of the data capture processes.
Reputation risk
Reputation risk involves exposure to earnings uncertainty as a result of events that may negatively influence the perception that stakeholders (interest groups) have of BBVA. Most reputation risk events are caused by factors characteristic of other kinds of risk, such as business or operational risk.
Aware of the importance of reputation risk, and since it is largely endogenous in nature, i.e. it can be managed, BBVA takes it into account in the decision-making process.
142
In order to facilitate the management of reputation risk, work on the implementation of a new tool called RepTool commenced in Spain at the end of 2003. RepTool is a methodology for the identification and assessment of reputation risk factors, which it relates to the internal causes that may give rise to this risk. As is customary in processes of this kind, assessment is performed on the basis of impact and probability of occurrence. The risk factors detected are classified by order of importance using scales of seriousness, which determine the type of action that must be taken.
ITEM 12. DESCRIPTION OF SECURITIES OTHER THAN EQUITY SECURITIES
Not applicable.
PART II
ITEM 13. DEFAULTS, DIVIDEND ARREARAGES AND DELINQUENCIES
Not applicable.
ITEM 14. MATERIAL MODIFICATIONS TO THE RIGHTS OF SECURITY HOLDERS AND USE OF PROCEEDS
Not applicable.
ITEM 15. CONTROLS AND PROCEDURES
As of December 31, 2003, BBVA, under the supervision and with the participation of BBVA’s management, including our chairman and chief executive officer, president and chief operating officer and head of the office of the chairman, whose responsibilities include accountancy, internal audit and compliance, performed an evaluation of the effectiveness of BBVA’s disclosure controls and procedures. BBVA’s management necessarily applied its judgment in assessing the costs and benefits of such controls and procedures, which by their nature can provide only reasonable assurance regarding management’s control objectives. Based on this evaluation, BBVA’s chairman and chief executive officer, president and chief operating officer and head of the office of the chairman concluded that BBVA’s disclosure controls and procedures are effective at the reasonable assurance level for gathering, analyzing and disclosing the information BBVA is required to disclose in the reports it files under the Securities Exchange Act of 1934, within the time periods specified in the SEC’s rules and forms. There has been no change in BBVA’s internal control over financial reporting that occurred during the period covered by this annual report that has materially affected, or is reasonably likely to materially affect, BBVA’s internal control over financial reporting.
ITEM 16A. AUDIT COMMITTEE FINANCIAL EXPERT
We have not determined whether any particular member of our Audit and Compliance Committee is a “financial expert” and, therefore, have not named any particular member of such Committee as our “Audit Committee Financial Expert” in accordance with SEC rules and regulations. The charter for our Audit and Compliance Committee which was approved by our Board of Directors, however, provides that the Chairman of the Audit and Compliance Committee is required to have experience in financial matters as well as knowledge of the accounting standards and principles required by BBVA’s regulators. In addition, we believe that the remaining members of the Audit and Compliance Committee have an understanding of applicable generally accepted accounting principles in Spain, experience analyzing and evaluating financial statements that present a breadth and level of complexity of accounting issues that are generally comparable to the breadth and complexity of issues that can reasonably be expected to be raised by our Consolidated Financial Statements, an understanding of internal controls over financial reporting, and an understanding of audit committee functions. Our Audit and Compliance Committee has experience overseeing and assessing the performance of BBVA and its consolidated subsidiaries and our external auditors with respect to the preparation, auditing and evaluation of our consolidated financial statements.
ITEM 16B. CODE OF ETHICS
BBVA’s Code of Ethics and Conduct applies to its chief executive officer, chief financial officer and chief accounting officer. This code establishes the principles that guide these officers’ respective actions: ethical conduct, professional standards and confidentiality. It also establishes the limitations and defines the conflicts of interest arising from their status as senior executives. We have not waived compliance with, nor made any amendment to, the Code of Ethics and Conduct. BBVA’s Code of Ethics and Conduct can be found on its website at www.bbva.com.
143
ITEM 16C. PRINCIPAL ACCOUNTANT FEES AND SERVICES
The following table provides information on the aggregate fees billed by our principal accountants, Deloitte & Touche España, S.L., by type of service rendered for the periods indicated.
| | | | | | |
Services Rendered
| | 2003
| | 2002
| | Total
|
| | | (thousands of euro) |
Audit Fees (1) | | 3,971 | | 2,691 | | 6,662 |
Audit-Related Fees (2) | | 161 | | 748 | | 909 |
Tax Fees (3) | | — | | — | | — |
All Other Fees (4) | | 561 | | 411 | | 972 |
Total | | 4,693 | | 3,850 | | 8,543 |
| (1) | Aggregate fees billed for each of the last two fiscal years for professional services rendered by Deloitte & Touche España, S.L. for the audit of BBVA’s annual financial statements or services that are normally provided by Deloitte & Touche España, S.L. in connection with statutory and regulatory filings or engagements for those fiscal years. Total audit fees billed by Deloitte & Touche España, S.L. and its worldwide affiliates, were €8,282 thousand and €5,784 thousand in 2003 and 2002, respectively. |
| (2) | Aggregate fees billed in each of the last two fiscal years for assurance and related services by the Deloitte & Touche España, S.L. that are reasonably related to the performance of the audit or review of BBVA’s financial statements and are not reported under (1) above. |
| (3) | Aggregate fees billed in each of the last two fiscal years for professional services rendered by Deloitte & Touche España, S.L. for tax compliance, tax advice, and tax planning. |
| (4) | Aggregate fees billed in each of the last two fiscal years for products and services provided by Deloitte & Touche España, S.L. other than the services reported in (1), (2) and (3) above.Services in this category consisted primarily of employee education courses and verification of the security of information systems and internet tools. |
The Audit And Compliance Committee’s Pre-Approval Policies And Procedures
In order to assist in ensuring the independence of our external auditor, the charter of our Audit and Compliance Committee provides that our external auditor is generally prohibited from providing us with non-audit services, other than under the specific circumstance described below. For this reason, our Audit and Compliance Committee has developed a pre-approval policy regarding the contracting of BBVA’s external auditor, or any affiliate of the external auditor, for professional services. The professional services covered by such policy include audit and non-audit services provided to BBVA or any of its subsidiaries reflected in agreements dated on or after May 6, 2003.
The pre-approval policy is as follows:
| | 1. | The hiring of BBVA’s external auditor or any of its affiliate is prohibited, unless there is no other firm available to provide the needed services at a comparable cost and that could deliver a similar level of quality. |
| | 2. | In the event that there is no other firm available to provide needed services at a comparable cost and delivering a similar level of quality, the external auditor (or any of its affiliates) may be hired to perform such services, but only with the pre-approval of the Audit and Compliance Committee. |
| | 3. | The Chairman of the Audit and Compliance Committee has been delegated the authority to approve the hiring of BBVA’s external auditor (or any of its affiliates). In such an event, however, the Chairman would be required to inform the Audit and Compliance Committee of such decision at the Committee’s next meeting. |
| | 4. | The hiring of the external auditor for any of BBVA’s subsidiaries must also be pre-approved by the Audit and Compliance Committee. |
| | 5. | Agreements entered into prior to May 6, 2003 between BBVA or any of its subsidiaries and any of their respective external auditors, required the approval of the Audit and Compliance Committee in the event that services provided under such agreements continued after May 6, 2004. |
144
ITEM 16D. EXEMPTIONS FROM THE LISTING STANDARDS FOR AUDIT COMMITTEES
Not applicable.
ITEM 16E. PURCHASES OF EQUITY SECURITIES BY THE ISSUER AND AFFILIATED PERSONS
Not yet applicable.
PART III
ITEM 17. FINANCIAL STATEMENTS
We have responded to Item 18 in lieu of this item.
ITEM 18. FINANCIAL STATEMENTS
Reference is made to Item 19 for a list of all financial statements filed as a part of this Annual Report.
ITEM 19. EXHIBITS
(a) Index to Financial Statements
(b) Index to Exhibits:
| | |
Exhibit
Number
| | Description
|
| 1.1 | | Amended and Restated Bylaws (Estatutos) of the Registrant. |
| |
| 4.1 | | Plan of Merger between Banco Bilbao Vizcaya, S.A. and Argentaria, Caja Postal y Banco Hipotecario, S.A.* |
| |
| 4.2 | | Master Agreement of Strategic Alliance between Telefónica and BBVA, together with an English translation.** |
| |
| 8.1 | | Consolidated Companies Composing Registrant. |
| |
| 10.1 | | Consent of Deloitte & Touche España, S.L. |
| |
| 12.1 | | Section 302 Chief Executive Officer Certification. |
| |
| 12.2 | | Section 302 President and Chief Operating Officer Certification. |
| |
| 12.3 | | Section 302 Head of the Office of the Chairman Certification. |
| |
| 13.1 | | Section 906 Certification. |
| * | Incorporated by reference to BBVA’s Registration Statement on Form F-4 (File No. 333-11090) filed with the Securities and Exchange Commission on November 4, 1999. |
| ** | Incorporated by reference to BBVA’s 1999 Annual Report on Form 20-F. |
We will furnish to the Commission, upon request, copies of any unfiled instruments that define the rights of holders of our long-term debt.
145
SIGNATURES
Pursuant to the requirements of Section 12 of the Securities Exchange Act of 1934, the Registrant certifies that it meets all of the requirements for filing on Form 20-F and had duly caused this Annual Report to be signed on its behalf by the undersigned, thereto duly authorized.
| | | | |
| BANCO BILBAO VIZCAYA ARGENTARIA, S.A. |
| |
By: | | /S/ JOSÉ SEVILLA ÁLVAREZ
|
| | | Name: | | José Sevilla Álvarez |
| | | Title: | | Head of the Office of the Chairman |
Date: June 30, 2004
146
INDEX TO THE CONSOLIDATED FINANCIAL STATEMENTS
F-1
INDEPENDENT AUDITORS’ REPORT
To the Shareholders of Banco Bilbao Vizcaya Argentaria, S.A.:
We have audited the accompanying consolidated balance sheets of BANCO BILBAO VIZCAYA ARGENTARIA, S.A. and COMPANIES (“The Banco Bilbao Vizcaya Group” or “BBVA”) (see Note 4) as of December 31, 2003, 2002 and 2001, and the related consolidated statements of income for the years then ended. These consolidated financial statements are the responsibility of the controlling Company’s Directors. Our responsibility is to express an opinion on these consolidated financial statements based on our audits.
We conducted our audits in accordance with the standards of the Public Company Accounting Oversight Board (United States). Those standards require that we plan and perform the audit to obtain reasonable assurance about whether the financial statements are free of material misstatement. An audit includes examining, on a test basis, evidence supporting the amounts and disclosures in the financial statements. An audit also includes assessing the accounting principles used and significant estimates made by management, as well as evaluating the overall financial statements presentation. We believe that our audits provide a reasonable basis for our opinion.
As indicated in Note 2-h and 24, in 2003, 2002 and 2001 the Group charged to reserves the estimated cost of indemnities, deferred compensations and future pensions deriving from the early retirements of certain employees who effectively formally took early retirements in that year, amounting to €519 million, €324 and €479 million, net of the related tax effect, for which purpose express authorization was obtained from the Bank of Spain, in accordance with Bank of Spain Circular 4/91, and from the respective Shareholders´ Meetings.
The consolidated financial statements referred to above are based on the Spanish financial statements of the Banco Bilbao Vizcaya Argentaria Group, prepared in accordance with accounting principles generally accepted in Spain (“Spanish GAAP”) by the controlling Company’s Directors. The accompanying consolidated financial statements as of December 31, 2001 reflect an adjustment which has the effect of decreasing net income and increasing retained earnings as reported in the Spanish GAAP consolidated financial statements for the year ended December 31, 2001, by approximately € 520 million, respectively. The mentioned adjustment reverses the early amortization of goodwill recognized in prior years and considers the effect of the amortization over a period of five years which is the minimum amortization period of goodwill permitted under Spanish GAAP (see notes 2.a) and 32.2.B.5).
In our opinion, the consolidated financial statements referred to above present fairly, in all material aspects, the financial position of Banco Bilbao Vizcaya Argentaria, S.A. and Companies composing the Banco Bilbao Vizcaya Argentaria Group as of December 31, 2003, 2002 and 2001, and the results of their operations and the funds obtained and applied by them for the years then ended in conformity with accounting principles generally accepted in Spain.
Accounting principles generally accepted in Spain vary in certain significant respects from accounting principles generally accepted in the United States of America. The application of the latter would have affected the determination of net income for each of the three years in the period ended December 31, 2003, 2002 and 2001and the determination of stockholders’ equity and financial position as of December 31, 2003, 2002 and 2001, to the extent summarized in Note 32.
/s/ DELOITTE & TOUCHE ESPAÑA, S.L.
Deloitte & Touche España, S.L.
Madrid – Spain, February 3, 2004, except for the Note 32 as to which the date is June 29, 2004
F-2
BANCO BILBAO VIZCAYA ARGENTARIA, S.A. AND COMPANIES COMPOSING
THE BANCO BILBAO VIZCAYA ARGENTARIA GROUP
CONSOLIDATED BALANCE SHEETS AS OF DECEMBER 31, 2003, 2002 AND 2001 (Notes 1 to 5)
- Thousands of Euros -
| | | | | | |
| | | 2003
| | 2002
| | 2001
|
ASSETS | | | | | | |
CASH ON HAND AND DEPOSITS AT CENTRAL BANKS: | | | | | | |
Cash | | 1,767,580 | | 1,868,358 | | 2,402,894 |
Bank of Spain | | 1,821,301 | | 1,081,684 | | 1,828,490 |
Other central banks | | 4,520,994 | | 5,100,286 | | 5,008,840 |
| | |
| |
| |
|
| | | 8,109,875 | | 8,050,328 | | 9,240,224 |
| | |
| |
| |
|
GOVERNMENT DEBT SECURITIES (Note 6) | | 18,945,003 | | 19,767,776 | | 20,165,369 |
| | |
| |
| |
|
DUE FROM CREDIT INSTITUTIONS (Note 7): | | | | | | |
Current accounts | | 643,987 | | 1,328,749 | | 2,629,808 |
Other | | 20,263,142 | | 20,147,530 | | 20,568,948 |
| | |
| |
| |
|
| | | 20,907,129 | | 21,476,279 | | 23,198,756 |
| | |
| |
| |
|
TOTAL NET LENDING (Note 8) | | 148,827,274 | | 141,315,012 | | 150,219,820 |
| | |
| |
| |
|
DEBENTURES AND OTHER DEBT SECURITIES (Note 9) | | 52,935,966 | | 49,133,179 | | 61,650,938 |
| | |
| |
| |
|
COMMON STOCKS AND OTHER EQUITY SECURITIES (Note 10) | | 3,092,064 | | 3,007,492 | | 3,673,699 |
| | |
| |
| |
|
INVESTMENTS IN NON-GROUP COMPANIES (Note 11) | | 5,593,224 | | 6,024,175 | | 6,641,935 |
| | |
| |
| |
|
INVESTMENTS IN GROUP COMPANIES (Note 12) | | 1,054,869 | | 1,039,688 | | 1,114,144 |
| | |
| |
| |
|
INTANGIBLE ASSETS (Note 14): | | | | | | |
Incorporation and start-up expenses | | 19,537 | | 20,946 | | 18,770 |
Other deferred charges | | 342,491 | | 377,691 | | 523,313 |
| | |
| |
| |
|
| | | 362,028 | | 398,637 | | 542,083 |
| | |
| |
| |
|
CONSOLIDATION GOODWILL (Note 13): | | | | | | |
Fully and proportionally consolidated companies | | 2,650,889 | | 2,871,545 | | 3,044,907 |
Companies accounted for by the equity method | | 1,055,524 | | 1,385,801 | | 1,572,235 |
| | |
| |
| |
|
| | | 3,706,413 | | 4,257,346 | | 4,617,142 |
| | |
| |
| |
|
PROPERTY AND EQUIPMENT (Note 14): | | | | | | |
Land and buildings for own use | | 2,100,359 | | 1,938,287 | | 2,530,935 |
Other property | | 309,607 | | 908,073 | | 1,424,146 |
Furniture, fixtures and other | | 1,380,272 | | 1,787,605 | | 2,216,809 |
| | |
| |
| |
|
| | | 3,790,238 | | 4,633,965 | | 6,171,890 |
| | |
| |
| |
|
CAPITAL STOCK SUBSCRIBED BUT NOT PAID (Note 23) | | — | | — | | — |
| | |
| |
| |
|
TREASURY STOCK (Note 23) | | 66,059 | | 97,671 | | 75,944 |
| | |
| |
| |
|
OTHER ASSETS (Note 15) | | 13,171,480 | | 12,298,880 | | 12,000,115 |
| | |
| |
| |
|
ACCRUAL ACCOUNTS (Note 16) | | 2,977,437 | | 4,391,562 | | 7,049,067 |
| | |
| |
| |
|
ACCUMULATED LOSSES AT CONSOLIDATED COMPANIES (Note 24) | | 3,610,764 | | 3,650,208 | | 2,700,955 |
| | |
| |
| |
|
TOTAL ASSETS | | 287,149,823 | | 279,542,198 | | 309,062,081 |
| | |
| |
| |
|
MEMORANDUM ACCOUNTS (Note 26) | | 72,549,918 | | 69,776,213 | | 71,764,775 |
| | |
| |
| |
|
F-3
- Thousands of Euros -
| | | | | | |
| | | 2003
| | 2002
| | 2001
|
LIABILITIES AND EQUITY | | | | | | |
DUE TO CREDIT INSTITUTIONS (Note 17): | | | | | | |
Current accounts | | 1,542,432 | | 1,537,357 | | 1,412,818 |
Other | | 60,027,356 | | 54,581,691 | | 63,175,177 |
| | |
| |
| |
|
| | | 61,569,788 | | 56,119,048 | | 64,587,995 |
| | |
| |
| |
|
DEPOSITS (Note 18): | | | | | | |
Savings accounts- | | | | | | |
Current | | 65,024,971 | | 63,723,745 | | 71,012,969 |
Time | | 55,487,784 | | 57,436,352 | | 67,512,171 |
Other deposits- | | | | | | |
Current | | — | | — | | — |
Time | | 20,536,152 | | 25,400,268 | | 27,974,294 |
| | |
| |
| |
|
| | | 141,048,907 | | 146,560,365 | | 166,499,434 |
| | |
| |
| |
|
MARKETABLE DEBT SECURITIES (Note 19): | | | | | | |
Bonds and debentures outstanding | | 28,258,973 | | 22,393,876 | | 20,639,098 |
Promissory notes and other securities | | 6,123,679 | | 5,129,396 | | 4,736,576 |
| | |
| |
| |
|
| | | 34,382,652 | | 27,523,272 | | 25,375,674 |
| | |
| |
| |
|
OTHER LIABILITIES (Note 15) | | 10,764,514 | | 9,735,905 | | 9,142,645 |
| | |
| |
| |
|
ACCRUAL ACCOUNTS (Note 16) | | 3,318,727 | | 4,593,777 | | 6,665,074 |
| | |
| |
| |
|
PROVISIONS FOR CONTINGENCIES AND EXPENSES (Note 20): | | | | | | |
Pension provision | | 3,031,913 | | 2,621,907 | | 2,358,552 |
Provision for taxes | | — | | — | | — |
Other provisions | | 2,187,672 | | 2,221,411 | | 2,425,588 |
| | |
| |
| |
|
| | | 5,219,585 | | 4,843,318 | | 4,784,140 |
| | |
| |
| |
|
GENERAL RISK ALLOWANCE | | — | | — | | — |
| | |
| |
| |
|
NEGATIVE CONSOLIDATION DIFFERENCE (Note 13) | | 38,712 | | 47,554 | | 42,744 |
| | |
| |
| |
|
CONSOLIDATED INCOME FOR THE YEAR: | | | | | | |
Group | | 2,226,701 | | 1,719,129 | | 1,843,070 |
Minority interests (Note 22) | | 670,463 | | 746,919 | | 645,223 |
| | |
| |
| |
|
| | | 2,897,164 | | 2,466,048 | | 2,488,293 |
| | |
| |
| |
|
SUBORDINATED DEBT (Note 21) | | 7,399,613 | | 6,486,942 | | 7,610,791 |
| | |
| |
| |
|
MINORITY INTERESTS (Note 22) | | 5,425,918 | | 5,674,163 | | 6,394,029 |
| | |
| |
| |
|
CAPITAL STOCK (Note 23) | | 1,565,968 | | 1,565,968 | | 1,565,968 |
| | |
| |
| |
|
ADDITIONAL PAID-IN CAPITAL (Note 24) | | 6,273,901 | | 6,512,797 | | 6,834,941 |
| | |
| |
| |
|
RETAINED EARNINGS (Note 24) | | 971,477 | | 771,484 | | 1,419,218 |
| | |
| |
| |
|
REVALUATION RESERVES (Note 24) | | 176,281 | | 176,281 | | 176,281 |
| | |
| |
| |
|
RESERVES AT CONSOLIDATED COMPANIES (Note 24) | | 6,096,616 | | 6,465,276 | | 5,474,854 |
| | |
| |
| |
|
TOTAL LIABILITIES AND EQUITY | | 287,149,823 | | 279,542,198 | | 309,062,081 |
| | |
| |
| |
|
The accompanying Notes 1 to 31 and Exhibits I to IV are an integral part of the consolidated balance sheet as of December 31, 2003.
F-4
BANCO BILBAO VIZCAYA ARGENTARIA, S.A. AND COMPANIES COMPOSING
THE BANCO BILBAO VIZCAYA ARGENTARIA GROUP
CONSOLIDATED STATEMENTS OF INCOME FOR THE YEARS ENDED
DECEMBER 31, 2003, 2002 AND 2001 (Notes 1 to 5)
- Thousands of Euros -
| | | | | | | | | |
| | | (DEBIT) CREDIT
| |
| | | 2003
| | | 2002
| | | 2001
| |
FINANCIAL REVENUES (Note 28) | | 12,537,465 | | | 17,232,909 | | | 21,608,104 | |
Of which: Fixed-income portfolio | | 3,323,501 | | | 4,820,640 | | | 7,283,233 | |
FINANCIAL EXPENSES (Note 28) | | (6,260,058 | ) | | (9,783,505 | ) | | (13,279,446 | ) |
INCOME FROM EQUITIES PORTFOLIO (Note 28): | | 464,104 | | | 358,062 | | | 495,444 | |
Common stocks and other equity securities | | 144,842 | | | 113,623 | | | 116,037 | |
Investments in non-Group companies | | 188,572 | | | 93,669 | | | 177,774 | |
Investments in Group companies | | 130,690 | | | 150,770 | | | 201,633 | |
| | |
|
| |
|
| |
|
|
NET INTEREST INCOME | | 6,741,511 | | | 7,807,466 | | | 8,824,102 | |
FEES COLLECTED (Note 28) | | 3,882,568 | | | 4,330,993 | | | 4,833,617 | |
FEES PAID (Note 28) | | (619,761 | ) | | (662,612 | ) | | (795,994 | ) |
MARKET OPERATIONS (Notes 20 and 28) | | 651,504 | | | 765,123 | | | 490,095 | |
| | |
|
| |
|
| |
|
|
GROSS OPERATING INCOME | | 10,655,822 | | | 12,240,970 | | | 13,351,820 | |
OTHER OPERATING INCOME (Note 28) | | 17,422 | | | 34,341 | | | 51,345 | |
GENERAL ADMINISTRATIVE EXPENSES (Note 28): | | (5,031,056 | ) | | (5,771,725 | ) | | (6,724,760 | ) |
Personnel costs | | (3,262,587 | ) | | (3,697,428 | ) | | (4,243,374 | ) |
Of which: | | | | | | | | | |
Wages and salaries | | (2,457,658 | ) | | (2,743,819 | ) | | (3,211,099 | ) |
Employee welfare expenses | | (571,325 | ) | | (624,360 | ) | �� | (652,454 | ) |
Of which: Pensions | | (134,921 | ) | | (132,624 | ) | | (122,474 | ) |
Other Administrative Expenses | | (1,768,469 | ) | | (2,074,297 | ) | | (2,481,386 | ) |
DEPRECIATION AND AMORTIZATION (Note 14) | | (510,656 | ) | | (631,021 | ) | | (741,817 | ) |
OTHER OPERATING EXPENSES | | (236,733 | ) | | (295,821 | ) | | (337,763 | ) |
| | |
|
| |
|
| |
|
|
NET OPERATING INCOME | | 4,894,799 | | | 5,576,744 | | | 5,598,825 | |
NET INCOME FROM COMPANIES ACCOUNTED FOR BY THE EQUITY METHOD (Note 28): | | 383,312 | | | 33,244 | | | 392,671 | |
Share in income of companies accounted for by the equity method | | 794,905 | | | 561,322 | | | 876,131 | |
Share in losses of companies accounted for by the equity method | | (92,467 | ) | | (285,726 | ) | | (104,306 | ) |
Correction for payment of dividends | | (319,126 | ) | | (242,352 | ) | | (379,154 | ) |
AMORTIZATION OF CONSOLIDATION GOODWILL (Note 13) | | (639,349 | ) | | (679,170 | ) | | (1,143,377 | ) |
INCOME ON GROUP TRANSACTIONS: | | 642,144 | | | 570,934 | | | 1,004,525 | |
Income on disposal of investments in fully and proportionally consolidated companies | | 16,763 | | | 3,806 | | | 33,957 | |
Income on disposal of investments accounted for by the equity method (Note 11) | | 609,333 | | | 551,326 | | | 896,186 | |
Income on transactions involving Parent Company shares and Group financial liabilities | | 16,048 | | | 15,802 | | | 74,382 | |
Reversal of negative consolidation differences | | — | | | — | | | — | |
LOSSES ON GROUP TRANSACTIONS: | | (88,885 | ) | | (209,938 | ) | | (50,538 | ) |
Losses on disposal of investments in fully or proportionally consolidated companies | | (55,237 | ) | | (156,290 | ) | | (12,699 | ) |
Losses on disposal of investments accounted for by the equity method (Note 11) | | (14,890 | ) | | (29,750 | ) | | (5,980 | ) |
Losses on transactions involving Parent Company shares and Group financial liabilities | | (18,758 | ) | | (23,898 | ) | | (31,859 | ) |
NET LOAN LOSS PROVISIONS (Note 8) | | (1,276,946 | ) | | (1,743,338 | ) | | (1,919,230 | ) |
NET SECURITIES WRITEDOWNS (Note 11) | | — | | | 3,366 | | | (42,792 | ) |
NET CHARGE TO GENERAL RISK ALLOWANCE | | — | | | — | | | — | |
EXTRAORDINARY INCOME (Note 28) | | 630,870 | | | 1,606,654 | | | 1,294,983 | |
EXTRAORDINARY LOSSES (Note 28) | | (733,805 | ) | | (2,039,235 | ) | | (2,021,253 | ) |
| | |
|
| |
|
| |
|
|
PRE-TAX PROFIT | | 3,812,140 | | | 3,119,261 | | | 3,113,814 | |
CORPORATE INCOME TAX (Note 25) | | (530,587 | ) | | (175,567 | ) | | (60,462 | ) |
OTHER TAXES (Note 25) | | (384,389 | ) | | (477,646 | ) | | (565,059 | ) |
| | |
|
| |
|
| |
|
|
NET INCOME | | 2,897,164 | | | 2,466,048 | | | 2,488,293 | |
MINORITY INTERESTS (Note 22) | | 670,463 | | | 746,919 | | | 645,223 | |
NET ATTRIBUTABLE PROFIT | | 2,226,701 | | | 1,719,129 | | | 1,843,070 | |
The accompanying Notes 1 to 31 and Exhibits I to IV are an integral part of the consolidated statement of income as of December 31, 2003
F-5
BANCO BILBAO VIZCAYA ARGENTARIA, S.A. AND COMPANIES COMPOSING
THE BANCO BILBAO VIZCAYA ARGENTARIA GROUP
NOTES TO CONSOLIDATED FINANCIAL STATEMENTS FOR THE YEAR ENDED DECEMBER 31, 2003
(1) DESCRIPTION OF THE BANK-
Banco Bilbao Vizcaya Argentaria, S.A. (“the Bank” or “BBVA”) is a private-law entity governed by the rules and regulations applicable to banks operating in Spain. The Bank conducts its business through branches and offices located throughout Spain and abroad.
On June 1, 1988, the Special Shareholders’ Meetings of Banco de Bilbao, S.A. and Banco de Vizcaya, S.A. resolved, inter alia, to approve the equal-footing merger of the two companies by dissolving them without liquidation and transferring en bloc to the new company, which adopted the name of Banco Bilbao Vizcaya, S.A. (BBV), by universal succession, the assets and liabilities of the two dissolved companies.
On December 18, 1999, the Special Shareholders’ Meetings of Banco Bilbao Vizcaya, S.A. and Argentaria, Caja Postal y Banco Hipotecario, S.A. approved the merger of the two entities through the absorption of Argentaria by Banco Bilbao Vizcaya, S.A. The Shareholders’ Meetings also approved the audited merger balance sheets of the two entities as of September 30, 1999. After the mandatory time periods had elapsed and the relevant administrative authorizations had been obtained, on January 25, 2000, the related public deed was executed, the registration of which at the Vizcaya Mercantile Registry on January 28, 2000, determined the legal effectiveness of the merger, and simultaneously the corporate name of Banco Bilbao Vizcaya, S.A. was changed to Banco Bilbao Vizcaya Argentaria, S.A.
(2) BASIS OF PRESENTATION AND CONSOLIDATION PRINCIPLES-
a) Basis of presentation-
The consolidated financial statements of the Bank and companies composing the Banco Bilbao Vizcaya Argentaria Group (“the Group”—Note 4) are presented in the formats stipulated by Bank of Spain Circular 4/1991 and its subsequent amendments and, accordingly, they present a true and fair view of the Group’s net worth, financial position and results. These consolidated financial statements were prepared from the individual accounting records of Banco Bilbao Vizcaya Argentaria, S.A. and of each of the Group companies and include the adjustments and reclassifications required to conform the accounting principles and presentation criteria followed by the subsidiaries with those followed by the Bank (Note 3).
The consolidated financial statements as of December 31, 2003, 2002 and 2001 and for the three years ended December 31, 2003, 2002 and 2001 are based on the Spanish financial statements of the Banco Bilbao Vizcaya Argentaria Group, prepared in accordance with the generally accepted accounting principles in Spain (“Spanish GAAP”) by the controlling company’s directors.
The individual and consolidated financial statements for 2003, 2002 and 2001 were approved by the Shareholders’ Meetings on February 28, 2004, March 1, 2003, and March 9, 2002, respectively.
The auditors’ report on the Spanish statutory approved financial statements of the group as of and for the year ended December 31, 2000 was qualified with respect to the early amortization in prior years of certain goodwill arising from the acquisition of Latin American banks and companies. United States securities regulations do not currently allow the filing of financial statements with the Securities Exchange Commission if they contain auditor’s reports that are qualified with respect to a material departure from generally accepted accounting principles. Therefore, in order to avoid a qualification in the auditor’s report, we do not include the early amortization recognized in prior years in the accompanying consolidated financial statements for the year ended December 31, 2000. Accordingly, the accompanying consolidated financial statements as of December 31, 2001 and 2000 and for the years then ended reflect the adjustments made to the Spanish GAAP statutory approved consolidated financial statements of the Banco Bilbao Vizcaya Argentaria Group solely for the purpose of complying with the United States securities regulations. The adjustments consist of the reversal of the early amortization of goodwill and the amortization of them over a period of five years (the estimated minimum period of economic life) which has the effect of decreasing net income as reported in the Spanish statutorily approved consolidated financial statements for the year ended December 31, 2001 by approximately €520 million.
F-6
b) Accounting policies-
The consolidated financial statements were prepared in accordance with the accounting principles generally accepted in Spain described in Note 3. All obligatory accounting principles with a material effect on the consolidated financial statements were applied in preparing them.
c) Consolidation principles-
In accordance with Law 13/1985 and Bank of Spain Circular 4/1991, the Banco Bilbao Vizcaya Argentaria Group is defined as including all the companies whose line of business is directly related to that of the Bank and which, together with the latter, constitute a single decision-making unit (Note 4). In accordance with this Circular, these companies were fully consolidated and the adjustments and reclassifications required to unify the accounting principles and presentation criteria followed by the subsidiaries were performed, taking into account the comments in Note 3-o. All material intercompany accounts and transactions between the consolidated companies were eliminated in consolidation. This method follows the rules as expressed by ARB 51 and SFAS 94. In accordance with Bank of Spain Circular 4/1991, the consolidated financial statements maintain the provisions for country risk recorded by the Bank and other Group companies for risk-asset and off-balance-sheet risk exposure to Group entities with registered offices in financially-troubled countries. As of December 31, 2003, 2002 and 2001, these provisions amounted to €162,321 thousand, €93,714 thousand and €98,674 thousand, respectively (Notes 7, 8 and 9).
The companies whose line of business is related to that of the Bank, and which are at least 20% owned by the Bank and managed jointly with another shareholder (or shareholders) were consolidated proportionally, which consists of including the assets, rights and obligations, and revenues and expenses of these companies in proportion to the Group’s holding in them. As of December 31, 2003 and 2002, this consolidation method was applied to E-Ventures Capital Internet, S.A, Corporación IBV Participaciones Empresariales, S.A., Altura Markets, A.V., S.A., PSA Finance Argentina Cía. Financiera, S.A. and Corporación IBV Servicios y Tecnologías, S.A. As of December 31, 2001, it was applied to Corporación IBV, S.A., Azeler Automoción, S.A., Altura Markets, A.V., S.A. and Proyectos Industriales Conjuntos, S.A.
Additionally, the long-term holdings in the capital stock of subsidiaries non-consolidated because their line of business is not directly related to that of the Bank and of other unlisted companies in which significant influence is exercised or with which the Bank has a lasting relationship and in which such holdings generally represent 20% or more of the capital stock (3% or more if listed) are valued at the amount of the portion of the investees’ net worth corresponding to such holdings, after deducting the dividends collected from them and other eliminations (equity method). Other holdings in companies (Note 11) which are short term or which do not represent significant influence, or for which futures transactions have been arranged to eliminate the price risk, are valued separately by the methods described in Note 3-e.
The remaining equity investments are presented in the accompanying consolidated balance sheets as described in Note 3-e.
F-7
d) Determination of net worth-
In evaluating the net worth of the Group, the balances of the following captions in the accompanying consolidated balance sheets should be taken into consideration:
| | | | | | | | | |
| | | Thousands of Euros
| |
| | | 2003
| | | 2002
| | | 2001
| |
Capital stock (Note 23) | | 1,565,968 | | | 1,565,968 | | | 1,565,968 | |
| | |
|
| |
|
| |
|
|
Reserves (Note 24)- | | | | | | | | | |
Additional paid-in capital | | 6,273,901 | | | 6,512,797 | | | 6,834,941 | |
Reserves | | 971,477 | | | 771,484 | | | 1,419,218 | |
Revaluation reserves | | 176,281 | | | 176,281 | | | 176,281 | |
Reserves at consolidated companies | | 6,096,616 | | | 6,465,276 | | | 5,474,854 | |
Accumulated losses at consolidated companies | | (3,610,764 | ) | | (3,650,208 | ) | | (2,700,955 | ) |
| | |
|
| |
|
| |
|
|
| | | 9,907,511 | | | 10,275,630 | | | 11,204,339 | |
Add- | | | | | | | | | |
Net income- | | | | | | | | | |
Net attributable profit | | 2,226,701 | | | 1,719,129 | | | 1,843,070 | |
Less- | | | | | | | | | |
Interim dividends (Notes 5 and 15)- | | | | | | | | | |
Paid | | (572,452 | ) | | (572,996 | ) | | (542,369 | ) |
Unpaid | | (287,444 | ) | | (287,620 | ) | | (271,588 | ) |
| | |
|
| |
|
| |
|
|
| | | (859,896 | ) | | (860,616 | ) | | (813,957 | ) |
Treasury stock (Note 23) | | (66,059 | ) | | (97,671 | ) | | (75,944 | ) |
| | |
|
| |
|
| |
|
|
Net worth per books | | 12,774,225 | | | 12,602,440 | | | 13,723,476 | |
Less- | | | | | | | | | |
Final dividend (Note 5) | | (364,327 | ) | | (248,420 | ) | | (408,286 | ) |
| | |
|
| |
|
| |
|
|
Net worth, after the distribution of income for the year | | 12,409,898 | | | 12,354,020 | | | 13,315,190 | |
| | |
|
| |
|
| |
|
|
e) Equity-
Law 13/1992 and Bank of Spain Circular 5/1993 and subsequent amendments enacted the regulations governing minimum equity requirements for credit entities at both individual and consolidated group levels.
As of December 31, 2003, 2002 and 2001, the Group’s eligible equity amounted to €18,799,128 thousand, €17,840,156 thousand and €19,730,574 thousand, respectively. These amounts exceed the minimum equity requirements stipulated by the aforementioned regulations.
F-8
f) Detail of risk provisions and coverage-
In accordance with Bank of Spain regulations, the risk provisions and coverage are presented as assigned to the related assets and/or in specific accounts. The detail of the aggregate risk provisions, coverage and guarantees, disregarding their accounting classification, is as follows:
| | | | | | |
| | | Thousands of Euros
|
| | | 2003
| | 2002
| | 2001
|
Loan loss provision (Note 3-c) (*) | | | | | | |
Due from credit institutions (Note 7) | | 171,240 | | 122,787 | | 138,533 |
Total net lending (Note 8) | | 4,443,539 | | 5,097,695 | | 5,927,703 |
Debentures and other debt securities (Note 9) | | 121,106 | | 125,401 | | 253,772 |
Off-balance-sheet risks (Notes 8 and 20) | | 209,270 | | 271,545 | | 185,268 |
| | |
| |
| |
|
| | | 4,945,155 | | 5,617,428 | | 6,505,276 |
| | |
| |
| |
|
Security revaluation reserve (Notes 3-d and 3-e) | | | | | | |
Government debt securities (Note 6) | | — | | 34 | | 6 |
Debentures and other debt securities (Note 9) | | 73,958 | | 2,586 | | 3,396 |
Common stocks and other equity securities (Note 10) | | 71,653 | | 240,726 | | 153,655 |
Investments in non-Group companies (Note 11) | | 38 | | 82 | | 1,791 |
| | |
| |
| |
|
| | | 145,649 | | 243,428 | | 158,848 |
| | |
| |
| |
|
Pension provision (Notes 3-j and 20) | | | | | | |
At Spanish companies | | 2,433,374 | | 1,981,414 | | 1,736,384 |
At foreign companies | | 598,539 | | 640,493 | | 622,168 |
| | |
| |
| |
|
| | | 3,031,913 | | 2,621,907 | | 2,358,552 |
| | |
| |
| |
|
Provision for property and equipment
(Notes 3-h and 14) | | 375,016 | | 308,518 | | 391,463 |
| | |
| |
| |
|
Other provisions for contingencies and expenses
(Note 20) | | 1,978,402 | | 1,949,866 | | 2,240,320 |
| | |
| |
| |
|
TOTAL | | 10,476,135 | | 10,741,147 | | 11,654,459 |
| | |
| |
| |
|
(*) Loan loss provisions | | | | | | |
Provisions for specific risks | | 2,053,936 | | 3,253,724 | | 4,358,160 |
| | |
| |
| |
|
General-purpose provision | | 1,361,029 | | 1,324,441 | | 1,469,168 |
| | |
| |
| |
|
Country-risk provision | | 609,764 | | 446,919 | | 317,281 |
| | |
| |
| |
|
Provision for the statistical coverage of loan losses | | 920,426 | | 592,344 | | 360,667 |
| | |
| |
| |
|
g) Comparative information
Argentina
The effects of the crisis in Argentina and the measures adopted by the Government and the Central Bank of the Republic of Argentina as described in Note 3-o gave rise to significant changes in the balance sheets of the BBVA Banco Francés Group.
BBVA Brasil Group
The 2002 and 2001 consolidated financial statements included the contribution of the BBVA Brasil Group, although the effects of the sale (Note 4) had been recorded as of December 31, 2002. In the 2003 consolidated financial statements, the BBVA Group recorded the earnings generated by the BBVA Brasil Group through the actual date of sale as earnings generated companies accounted for by the equity method, and, accordingly, comparison with the earnings of complete prior years shows significant decreases in most captions of the 2003 consolidated statement of income.
Depreciation of the Latin American currencies
Additionally, the macroeconomic developments in 2003 in most Latin-American countries affected, among other variables, their currencies, which experienced a sharp devaluation against the euro. This devaluation particularly affected the consolidated balance sheets as of December 31, 2003 and 2002, since the year-end exchange rates were used, and the 2002 and 2003 consolidated statements of income, since average exchange rates were applied (Note 3-b).
F-9
h) Early retirements-
In 2003, 2002 and 2001 the Group charged to reserves the estimated cost of future indemnities, deferred compensation and future contributions to external pension funds deriving from the early retirement of Group employees in Spain, amounting to €519,620 thousand, €324,465 thousand and €479,241 thousand, respectively, net of the related tax effect, which was estimated at €279,796 thousand, €174,712 thousand and €252,502 thousand, respectively. These transactions were authorized by the respective Shareholders’ Meetings of the Group’s Spanish banks and by the Bank of Spain (Notes 3-j, 20 and 24).
| | | | | | | | | | | | |
| | | Thousands of Euros
|
| | | 2003
| | 2002
| | 2001
|
| | | BBVA, S.A.
| | Total (*)
| | BBVA, S.A.
| | Total (*)
| | BBVA,
S.A.
| | Total (*)
|
Charged to: | | | | | | | | | | | | |
Unrestricted reserves | | 515,044 | | 519,620 | | 321,101 | | 324,465 | | 471,780 | | 479,241 |
Prepaid taxes | | 277,332 | | 279,796 | | 172,901 | | 174,712 | | 248,488 | | 252,502 |
| | |
| |
| |
| |
| |
| |
|
Total | | 792,376 | | 799,416 | | 494,002 | | 499,177 | | 720,268 | | 731,743 |
| | |
| |
| |
| |
| |
| |
|
(3) ACCOUNTING PRINCIPLES APPLIED
The accounting principles and valuation standards applied in preparing the consolidated financial statements were as follows:
a) Accrual principle-
Revenues and expenses are recorded on an accrual basis for accounting purposes and the interest method is applied for transactions whose settlement periods exceed twelve months. However, in accordance with the principle of prudence and with Bank of Spain regulations, the interest earned on nonperforming loans, including interest subject to country risk in countries classified as very doubtful, doubtful or experiencing temporary difficulties, is not recognized until it is collected.
In accordance with banking practice in Spain, transactions are recorded as of the date they are made, which may differ from the value date as of which interest revenues and expenses are calculated.
The consolidated finance companies record the revenues and expenses arising from their regular financing and lease contracts over the accrual period by the interest method. Under this method, these revenues and expenses are recognized over the collection period on the basis of the principal amount outstanding.
b) Foreign currency transactions-
The breakdowns by currency of several accounts and captions in these notes to consolidated financial statements include under the foreign currencies heading currencies other than the euro.
Assets, liabilities and futures transactions
Assets and liabilities in foreign currencies, including those of branches and subsidiaries abroad, and unmatured foreign currency purchases and sales arranged for hedging purposes have been translated to euros at the average year-end exchange rates in the Spanish spot foreign exchange market (through the exchange rate of the U.S. dollar in local markets, for currencies not traded on the Spanish market), except for:
- The reserves of subsidiaries and the long-term investments in securities denominated in foreign currencies but funded in euros or in a currency other than that of the investment, which have been translated at historical exchange rates.
- The revenue and expense accounts of the subsidiaries abroad, which have been translated at the average exchange rates in each year.
- The unmatured forward foreign currency purchases and sales arranged for purposes other than hedging are valued at the year-end exchange rates in the Spanish forward foreign exchange market, which are published by the Bank of Spain for this purpose.
F-10
The equivalent euro value of the assets and liabilities denominated in foreign currencies was €88,470,097 million and €95,497,298 million, respectively, as of December 31, 2003 (€102,210 million and €107,367 million, respectively, as of December 31, 2002 and €131,115 million and €137,720 million, respectively, as of December 31, 2001).
Exchange differences
The exchange differences arising from application of the above-mentioned translation methods are recorded as follows:
| - | Exchange losses and gains in consolidation are recorded under the “Accumulated Losses at Consolidated Companies” and “Reserves at Consolidated Companies” captions, respectively, in the accompanying consolidated balance sheets, net of the portion of such losses and gains corresponding to minority interests (Notes 22 and 24). |
| - | The net amount of the other exchange differences is recorded in full under the “Market Operations” captions in the accompanying consolidated statements of income (Note 28), and the exchange differences on forward transactions are debited to the “Other Assets - Exchange Differences on Forward Transactions” caption or credited to the “Other Liabilities - Exchange Differences on Forward Transactions” caption in the accompanying consolidated balance sheets (Note 15). |
Structural exchange positions
The Group’s general policy is to finance investments in foreign subsidiaries and capital assigned to branches abroad in the same currency as that of the investment, in order to eliminate any future risk of exchange differences arising from these transactions. However, the investments in countries whose currencies do not have a market enabling the Bank to obtain financing that is unlimited, lasting and stable at long term are financed in another currency. Through 2001 this financing was in dollars, but in 2002 and 2003 most of the financing was provided in euros.
Exchange differences arising from financing in currencies other than the euro and the investment currency, net of the amount hedged by specific derivative transactions, are charged or credited to Group income, whereas those relating to investments are recorded under the “Reserves at Consolidated Companies - Translation Differences” caption in the accompanying consolidated balance sheets. Based on this principle, €2,796 thousand and €32,699 thousand, respectively, were credited to the “Market Operations” caption in the accompanying 2003 and 2002 consolidated statements of income, and €77,753 thousand was charged to the “Market Operations” caption in the accompanying 2001 consolidated statement of income (Note 28-b).
However, since the end of 2002, the exchange risk associated with most of the investments made in Mexico and Chile has been hedged by derivative transactions, and the variations are recorded as adjustments to the “Reserves at Consolidated Companies – Translation Differences” caption in the accompanying consolidated balance sheets.
Inflation
Certain subsidiaries (located in Mexico, Uruguay, Chile, Peru, Bolivia and, through March 2003, Argentina –Note 3-o) are subject to local regulations on adjustments for inflation, and, accordingly, record charges and credits in their statements of income to protect their net worth from the theoretical decline in value arising from inflation. These accounting entries are recorded under the “Extraordinary Income” and “Extraordinary Losses” captions in the accompanying consolidated statements of income (Note 28-g). The detail of the net amount of these items is as follows:
| | | | | | | | | |
| | | Thousands of Euros
| |
| | | 2003
| | | 2002
| | | 2001
| |
Extraordinary income | | | | | | | | | |
Mexico | | — | | | 20,454 | | | 80,247 | |
Argentina (*) | | — | | | 38,456 | | | — | |
Peru | | — | | | — | | | 3,414 | |
| | |
|
| |
|
| |
|
|
| | | — | | | 58,910 | | | 83,661 | |
| | |
|
| |
|
| |
|
|
Extraordinary losses | | | | | | | | | |
Mexico | | (36,509 | ) | | — | | | — | |
Argentina | | (820 | ) | | — | | | — | |
Peru | | (3,620 | ) | | (3,703 | ) | | — | |
Chile | | (3,655 | ) | | (9,293 | ) | | (10,512 | ) |
Uruguay | | (12,007 | ) | | (41,483 | ) | | (3,870 | ) |
| | |
|
| |
|
| |
|
|
| | | (56,611 | ) | | (54,479 | ) | | (14,382 | ) |
| | |
|
| |
|
| |
|
|
| | | (56,611 | ) | | 4,431 | | | 69,279 | |
| | |
|
| |
|
| |
|
|
| (*) | Accounting for inflation was abolished on March 1, 2003. |
F-11
c) Loan loss provisions (Note 2-f)-
The loan loss provisions are intended to cover the losses, if any, which might arise in the full recovery of all credit and off-balance-sheet risks assumed by the Group in the course of its financial business (Notes 7, 8 and 9). For presentation purposes, they are recorded as a reduction of the “Due from Credit Institutions”, “Total Net Lending” and “Debentures and Other Debt Securities” captions on the asset side of the accompanying consolidated balance sheets. The provisions to cover any losses on the Group’s off-balance-sheet risks are included under the “Provisions for Contingencies and Expenses - Other Provisions” caption on the liability side of the accompanying consolidated balance sheets (Note 20).
The loan loss provisions were determined on the basis of the following criteria:
| | 1. | Specific provisions: on an individual basis, as stipulated by Bank of Spain Circular 4/1991. The balance of the specific loan loss provision is increased by provisions from period income and decreased by chargeoffs of debts deemed to be uncollectible or which have been nonperforming for more than three years (six years in the case of mortgage transactions with full coverage) and, if appropriate, by recoveries of the amounts previously provided for. |
| | 2. | General-purpose provision: in accordance with Bank of Spain regulations, an additional general-purpose provision, representing 1% of loans, fixed-income securities, contingent liabilities and nonperforming assets without mandatory coverage (0.5% in the case of certain mortgage transactions with full coverage), is set up to cover risks not specifically identified as problematic at the present time. The balance of the general-purpose loan loss provision is increased by provisions recorded with a charge to income and is decreased when the risk assets making up the calculation basis diminish with respect to the previous period and provisions are released. |
| | 3. | Provision for the statistical coverage of loan losses: from July 1, 2000, the Group is required to record a provision for the statistical coverage of the unrealized loan losses on the various homogeneous loan portfolios, by charging each quarter to the “Net Loan Loss Provisions” caption in the accompanying consolidated statements of income, the positive difference resulting from subtracting the specific net charges for loan losses recorded in the quarter from one-fourth of the statistical estimate of the overall unrealized loan losses on the various homogeneous loan portfolios (credit risk of each portfolio multiplied by the weighting coefficients established by Circular 4/1991 which range from 0% to 1.5%). If the resulting difference were negative, the amount would be credited to the consolidated statement of income with a charge to the provision recorded in this connection (to the extent of the available balance). The maximum amount of this provision is three times the sum of the amount of each credit risk category multiplied by its respective weighting coefficient. |
| | 4. | Country-risk provision: this provision is recorded on the basis of each country’s degree of debt-servicing difficulty, per the classification and schedule established in Bank of Spain Circular 4/1991. |
d) Government debt securities, debentures and other debt securities-
The securities comprising the Group’s fixed-income securities portfolio are classified as follows:
| 1) | Trading portfolio: which includes the listed securities held for the purpose of obtaining gains at short term taking advantage of market price fluctuations. The securities in the trading portfolio are stated at market price at year-end. The differences arising from valuation variations (except for those arising from accrued interest) are recorded at their net amount under the “Market Operations” caption in the accompanying consolidated statements of income (Note 28-b). |
| 2) | Held-to-maturity portfolio: which includes the securities which the Group has decided to hold until final maturity, since it has the financial capacity to do so, or has appropriate hedging of the value of these investments against interest rate fluctuations. Securities allocated to the held-to-maturity portfolio are carried at acquisition cost adjusted by the amount resulting from accrual by the interest method of the positive or negative difference between the redemption value and the acquisition cost over the term to maturity of the security. The gains or losses on disposal of debt securities classified in this portfolio are recorded as extraordinary income/losses in the consolidated statement of income and, if gains are obtained, a specific provision is recorded for the amount thereof. This provision is released on a straight-line basis over the term to maturity of the securities sold. No fixed-income securities classified in this portfolio were sold in 2003, 2002 or 2001. |
| 3) | Available-for-sale portfolio: which includes all other securities not classified in either of the two portfolios described above. The debt securities in the available-for-sale portfolio are individually stated at acquisition cost, adjusted by the accrued amount of the difference between acquisition cost and redemption value. |
A securities revaluation reserve is recorded for the net difference with respect to the total market value of this portfolio, if lower, based on the year-end closing market prices in the case of listed securities, and on the present value at market interest rates on that date in the case of unlisted securities. The unrealized losses on securities sold to third parties under repurchase agreement are written down for the proportional part of the period from the expected repurchase date to the maturity date.
F-12
Also, securities acquired to hedge other transactions at the same term and with fixed interest, which therefore are not exposed to interest rate risk, are recorded at acquisition cost.
The writedown of the listed fixed-income portfolio is charged to asset accrual accounts, which are presented together with the securities written down under the appropriate consolidated balance sheet captions, or to income in the case of permanent losses. As of December 31, 2003, the balance of these accounts amounted to €69,687 thousand (Note 9). As of December 31, 2002 and 2001, these accrual accounts had no balance.
Bank of Spain Circular 4/1991 also requires that an additional securities revaluation reserve be recorded for the amount of the gains on the disposal of fixed-income securities in the available-for-sale portfolio, which is applied to the asset accrual account described in the preceding paragraph, up to the balance calculated therefor.
e) Equity securities-
Securities in the trading portfolio, which includes the portions of the associated companies which are not held at long term, are stated at market price. The net differences arising from price fluctuations are recorded under the “Market Operations” caption in the accompanying consolidated statements of income.
Equity securities representing holdings in subsidiaries not fully consolidable or holdings of generally 20% or more in unlisted companies (3% if listed) which do not meet the conditions for proportional consolidation are accounted for by the equity method as indicated in Note 2-c, except for holdings for which hedging transactions were arranged to eliminate the equity price risk, which are valued at acquisition cost. The investments accounted for by the equity method were valued on the basis of the interim, to date unaudited, financial statements furnished by the companies.
Other equity securities are recorded in the consolidated balance sheets at the lower of cost, revalued where appropriate, or market. The market value of these securities was determined as follows:
| - | Listed securities: lower of average market price in the fourth quarter or year-end closing price. |
| - | Unlisted securities: underlying book value of the holding per the latest available balance sheet, after taking into account the income projections for coming years and other unrealized gains which were used in determining the acquisition cost and persisted at year-end. |
The difference between acquisition cost and the amount calculated as indicated in the preceding paragraph, which may be offset by the annual increase in the underlying book values of the investee over a maximum period of twenty years, need not be written down.
The securities revaluation reserve is recorded to recognize the unrealized losses arising from application of the aforementioned methods, and is presented as a reduction of the balances of the “Common Stocks and Other Equity Securities” and “Investments in Non-Group Companies” captions on the asset side of the accompanying consolidated balance sheets (Notes 2-f, 10 and 11). This reserve is recorded with a charge to the “Market Operations” caption in the accompanying consolidated statements of income.
Equity securities were revalued pursuant to the applicable enabling legislation on account revaluations or by the methods stipulated in the regulations on corporate mergers which were applied at the related merger dates (Note 24).
f) Intangible assets-
This caption in the accompanying consolidated balance sheets includes, among other items, the payments made to acquire computer applications, which are amortized over a maximum period of three years.
This caption also includes incorporation and preopening expenses, expenses of capital increases carried out at the Bank and subsidiaries and the unamortized expenses of bond and other financial instrument issuances. These expenses are amortized in a maximum period of five years, except for the financial instrument issuance expenses, which are amortized over the life of each issue.
g) Consolidation goodwill and negative consolidation difference-
The positive differences between the acquisition cost of shares of subsidiaries or companies accounted for by the equity method (Note 2-c) and their underlying book value are recorded as goodwill, if they cannot be classified as additions to the value of specific assets of the acquired companies.
F-13
As these differences are deemed to persist, they are generally amortized on a straight-line basis over a maximum period of ten years (20 years for certain basically nonfinancial holdings), since it is considered that this is the period over which the underlying investments will contribute to obtaining income for the Group. In 2002 the Group wrote off in full the goodwill resulting from its holdings in companies located in certain Latin-American countries, mainly BBVA Banco Continental, S.A., AFP Horizonte, S.A. (Perú), BBVA Banco Ganadero, S.A., BBVA Horizonte Pensiones y Cesantías, S.A. (Colombia) and BBVA Uruguay, S.A. In 2001 the Group wrote off in full the unamortized goodwill as of December 31, 2001, resulting from its holdings in Argentine companies (Notes 3-o, 4 and 13).
As described in Note 2-a, the accompanying consolidated financial statements for the year ended December 31, 2001 reflect an adjustment of the Spanish statutorily approved financial statements of the Group consisting of the reversal of the early amortization of goodwill and the amortization of such over its estimated minimum period of economic life (generally, five years), solely for purpose of complying with the United States regulations.
The unrealized gains assigned to specific assets are amortized, if appropriate, on the basis of their disposal or effective decline in value over a maximum period of ten years in the case of operating assets.
When the cost of acquisitions is lower than their underlying book value, a negative consolidation difference arises which is treated as a provision and may not be credited to income unless the investment in the capital stock of these companies is fully or partially disposed of or in the event of the unfavorable evolution of the results of these companies (Note 13).
h) Property and equipment-
Assets for own use-
Property and equipment are carried at cost, revalued where appropriate pursuant to the applicable enabling legislation (Note 24), net of the related accumulated depreciation. The buildings owned by certain of the Group companies which were involved in mergers were stated, pursuant to the applicable legislation, on the basis of the market prices on the related merger dates as determined by independent appraisers.
Depreciation is generally provided at the following depreciation rates:
| | |
| | | Annual
Depreciation Rate
|
Buildings | | 1.33 to 4 |
Furniture | | 8 to 15 |
Fixtures | | 6 to 12 |
Office and automation equipment | | 8 to 33 |
Revaluation surpluses are depreciated over the remaining years of useful life of the revalued assets.
Gains or losses on disposal of property and equipment are recorded under the “Extraordinary Income” or “Extraordinary Losses” captions, respectively, in the consolidated statements of income.
Assets received in payment of debts-
These assets are recorded at the lower of the book value of the assets used to acquire them or market value, net, initially, of any provisions covering the assets received, up to 25% of that value. In accordance with Bank of Spain regulations, additional provisions are recorded in the years following foreclosure of the assets based on their age, type of asset and appraisal by independent appraisers.
The provisions recorded with a charge to the “Extraordinary Losses” caption in the accompanying consolidated statements of income are presented as a reduction of the balance of the “Property and Equipment - Other Property” caption in the accompanying consolidated balance sheets (Notes 14 and 28-g).
i) Treasury stock-
The balance of the “Treasury Stock” caption in the accompanying consolidated balance sheets as of December 31, 2003, 2002 and 2001, relates to shares of Banco Bilbao Vizcaya Argentaria, S.A. owned by the Bank and by consolidated subsidiaries (Note 23). These shares are reflected at cost, net, where appropriate, of the provision recorded to write them down to the lower of consolidated underlying book value or market price.
F-14
The provision mentioned above is recorded with a charge to the “Losses on Group Transactions” caption in the accompanying consolidated statements of income. Gains or losses arising from the disposal of Bank shares are recorded under the “Income on Group Transactions” or “Losses on Group Transactions” captions respectively, in the accompanying consolidated statements of income.
The treasury stock and shares of Group and associated companies that are acquired as a result of futures hedging transactions related to certain stock market indexes are valued at market price. Valuation differences are recorded under the “Market Operations” caption in the consolidated statement of income.
In accordance with the revised Spanish Corporations Law, a restricted reserve has been recorded for the net book value of the aforementioned treasury stock (Note 24).
The total Bank shares owned by the Bank and consolidated companies represented 0.2343%, 0.3347% and 0.189% of the capital stock issued by the Bank as of December 31, 2003, 2002 and 2001 respectively. The subsidiaries not fully consolidable held 0.0026%, 0.0061% and 0.00187% of the Bank’s capital stock, as of those dates, respectively.
j) Pension commitments and other commitments to employees-
Pension commitments
| – | In-house pension provisions |
In 2003, 2002 and 2001 the Group offered certain employees the possibility of taking early retirement before the age stipulated in the current collective labor agreement. 1,944, 1,439 and 1,887 employees availed themselves of this offer in 2003, 2002 and 2001, respectively. The total cost of these agreements was €799,826 thousand in 2003, €575,906 thousand in 2002 and €731,743 thousand in 2001 (Notes 20 and 24), including indemnities, deferred compensation and future contributions to external pension funds. To meet this commitment, the related provisions were recorded, after considering the tax effect, with a charge to the “Additional Paid-In Capital” and “Reserves” captions in the accompanying consolidated balance sheets as of December 31, 2003, 2002 and 2001 (Notes 2-h and 24), and with charges amounting to €410 thousand and €76,729 thousand in 2003 and 2002, respectively, to the “Extraordinary Losses” caption in the accompanying 2003 and 2002 consolidated statements of income based on the authorizations by the related Shareholders’ Meetings and the express authorization of the Bank of Spain, in accordance with Rule 13 of Bank of Spain Circular 4/1991. The commitments to this employee group from their normal retirement age are included in the Employee Welfare System, as described below.
The early retirement payments payable, which include the present value of the compensation and indemnities payable to and of the future contributions to the external pension funds of the personnel who took early retirement in 2003 and prior years, through their normal retirement date, amounted to €2,392,907 thousand (€1,942,975 thousand as of December 31, 2002, and €1,715,218 thousand as of December 31, 2001), net of the payments of €429,168 thousand made in 2003 (€407,153 thousand in 2002 and €346,061 thousand in 2001), and are included under the “Provisions for Contingencies and Expenses - Pension Provision” caption in the accompanying consolidated balance sheets.
In addition to the above, there are other internal pension provisions amounting to €3,009 thousand as of December 31, 2003 (€949 thousand, €1,530 thousand as of December 31, 2002 and 2001, respectively), which are not subject to the externalization process.
Certain Group entities abroad have pension and other commitments to their employees, the accrued liability of which amounted to €598,539 thousand, €640,493 thousand and €622,168 thousand as of December 31, 2003, 2002 and 2001, respectively, and is included under the “Provisions for Contingencies and Expenses - Pension Provision” caption in the accompanying consolidated balance sheets. €552,556 thousand, €570,060 thousand and €555,618 thousand of these amounts as of December 31, 2003, 2002 and 2001, respectively, related to provisions recorded by BBVA Bancomer, S.A. (Notes 4 and 20) to cover accrued defined benefit pension commitments and long-service bonuses at the retirement date and to cover, from 2002, post-retirement occupational obligations regarding medical services. The shortfall for past services as of December 31, 2003, resulting from the recording of the latter commitment amounted to €171,854 thousand (Note 15) and is amortized over the average remaining working life of the employee group. The actuarial studies to evaluate these commitments were performed on an individual basis and quantified using the projected unit credit method and the discount rates and mortality and disability rates authorized by the Mexican National Banking and Securities Commission. In 2003, net charges of €48,338 thousand were made by BBVA Bancomer, S.A. in this connection and were recorded with a charge to the “General Administrative Expenses - Personnel Costs” caption in the accompanying 2003 consolidated statement of income.
F-15
Under the current collective labor agreement, Spanish banks are required to supplement the social security benefits received by employees or their beneficiary rightholders in the event of retirement (except for those hired after March 8, 1980), permanent disability, death of spouse or death of parent.
Since 2000, by virtue of the collective agreement on the employee welfare system dated November 14, 2000, all the commitments to serving and retired employees of the Group’s Spanish banks have been externalized and instrumented in external pension plans and insurance policies. This employee welfare system covers all employees, including those hired subsequent to March 8, 1980. The employee welfare system also includes the pension commitments and obligations to former directors of the Bank with executive functions, amounting to €80,387 thousand as of December 31, 2003 and €80,477 thousand as of December 31, 2002.
On December 29, 2003, a collective agreement was entered into whereby, inter alia, the defined-benefit retirement system applicable to certain Pension Plan groups is transformed into a new defined-contribution system. This agreement will come into force on January 1, 2004, and will not give rise to additional provisioning requirements for the Group.
The employee welfare system includes defined contribution commitments, the amounts of which are determined in each case as a percentage of certain compensation items and/or a preset annual amount, and defined benefit commitments that are covered by insurance policies. These latter commitments as of December 31, 2003, 2002 and 2001, were valued in accordance with the externalization contracts entered into by the Group’s Spanish banks and the insurance companies using PEM/F 2000 mortality tables (GRM/F 95 for the insurance policies between the external pension plans and the insurance companies) and discount rates lower than the internal rates of return on the investments assigned to cover them.
The status of the commitments covered by external pension plans as of December 31, 2003, 2002 and 2001, is as follows:
| | | | | | |
| | | Thousands of Euros
|
| | | 2003
| | 2002
| | 2001
|
Pension commitments to retired employees (*) | | | | | | |
External pension funds | | 429,036 | | 400,122 | | 377,663 |
Insurance contracts (mathematical reserves) With insurance companies related to the Group | | 1,548,077 | | 1,469,260 | | 1,342,240 |
With unrelated insurance companies | | 629,533 | | 662,613 | | 548,496 |
| | |
| |
| |
|
| | | 2,606,646 | | 2,531,995 | | 2,268,399 |
Possible commitments to serving employees | | | | | | |
External pension funds | | | | | | |
Employees with full coverage of accrued and unaccrued possible commitments (*) | | 470,266 | | 487,056 | | 506,434 |
Other employees (**) | | 1,358,415 | | 1,252,123 | | 1,180,245 |
| | |
| |
| |
|
| | | 1,828,681 | | 1,739,179 | | 1,686,679 |
Insurance contracts with insurance companies (mathematical reserves) in the Group (***) | | 163,679 | | 145,622 | | 258,125 |
| | |
| |
| |
|
| | | 1,992,360 | | 1,884,801 | | 1,944,804 |
| | |
| |
| |
|
| | | 4,599,006 | | 4,416,796 | | 4,213,203 |
| | |
| |
| |
|
| (*) | Commitments instrumented in defined benefit systems. |
| (**) | Commitments instrumented in defined contribution systems. |
| (***) | Commitments of which as of December 31, 2003, €135,900 thousand are instrumented in defined benefit systems and €27,779 thousand in defined contribution systems. |
| – | Differences in the pension fund- |
The externalization process, in which new valuation assumptions were used, disclosed differences which represent the discounted present value of the contributions yet to be made to the external pension funds for possible pension commitments as of December 31, 2000. These amounts were calculated using discount rates of 3.15% for the insurance contracts and 5.64% for the external pension plans. The initial differences that arose were recorded with a charge to accrual accounts and are being amortized over a maximum period of fourteen years in the case of the external pension plans, and
F-16
over nine years in the case of the insurance contracts, starting from 2000 in accordance with the stipulations of Bank of Spain Circular 5/2000 and as required by the transition regime established in current regulations. In turn, the initial differences were credited to the “Deposits” caption on the liability side of the consolidated balance sheets, reducing the balance for the payments made. For presentation purposes, the balances of these two items as of December 31, 2003, are included at the net amount under the “Other Assets” caption in the consolidated balance sheet as of that date (Note 15). The variations in 2003 in this connection were as follows:
| | | | | | | | | |
| | | Thousands of Euros
| |
| | | Pensions
Commitments
to Retired
Employees
| | | Possible
Commitments
to Serving
Employees
| | | Total
| |
Other assets - Differences in the pension fund | | | | | | | | | |
| | | |
Balance at January 1, 2003 | | | | | | | | | |
External pension plan | | — | | | 536,529 | | | 536,529 | |
Insurance contracts | | 99,493 | | | 67,442 | | | 166,935 | |
| | |
|
| |
|
| |
|
|
| | | 99,493 | | | 603,971 | | | 703,464 | |
Amortization | | | | | | | | | |
External pension plan | | — | | | (50,401 | ) | | (50,401 | ) |
Insurance contracts | | (16,582 | ) | | (8,678 | ) | | (25,260 | ) |
| | |
|
| |
|
| |
|
|
| | | (16,582 | ) | | (59,079 | ) | | (75,661 | ) |
| | |
|
| |
|
| |
|
|
Other variations | | — | | | (15,379 | ) | | (15,379 | ) |
| | |
|
| |
|
| |
|
|
Balance at December 31, 2003 | | 82,911 | | | 529,513 | | | 612,424 | |
| | |
|
| |
|
| |
|
|
Deposits – Deferred contributions | | | | | | | | | |
| | | |
Balance at January 1, 2003 | | (114,341 | ) | | (81,619 | ) | | (195,960 | ) |
| | |
|
| |
|
| |
|
|
Add- | | | | | | | | | |
Interest cost allocable: | | (2,760 | ) | | (1,849 | ) | | (4,609 | ) |
Less- | | | | | | | | | |
Payments made: | | 14,944 | | | 9,106 | | | 24,050 | |
Reduction due to assignment of investments: | | 3,476 | | | 1,798 | | | 5,274 | |
| | |
|
| |
|
| |
|
|
| | | 18,420 | | | 10,904 | | | 29,324 | |
| | |
|
| |
|
| |
|
|
Other variations | | — | | | 27,964 | | | 27,964 | |
| | |
|
| |
|
| |
|
|
Balance at December 31, 2003 | | (98,681 | ) | | (44,600 | ) | | (143,281 | ) |
| | |
|
| |
|
| |
|
|
Net balance at December 31, 2003 (Note 15) | | (15,770 | ) | | 484,913 | | | 469,143 | |
| | |
|
| |
|
| |
|
|
F-17
The charges recorded in 2003, 2002 and 2001 to cover the aforementioned commitments are summarized as follows:
| | | | | | | |
| | | Thousands of Euros
|
| | | 2003
| | 2002
| | | 2001
|
Detail by item- | | | | | | | |
Allocable interest cost of deferred contributions | | 4,609 | | 9,280 | | | 39,464 |
Expense of contributions made in the year by Spanish banks in the Group to external pension funds and insurance companies- | | | | | | | |
Accrued in the year | | 68,366 | | 79,752 | | | 72,073 |
Extraordinary | | 97,462 | | 87,342 | | | 85,885 |
| | |
| |
|
| |
|
| | | 170,437 | | 176,374 | | | 197,422 |
Expense of contributions made by other Group entities | | 10,135 | | 13,805 | | | 18,199 |
Net charges by Spanish banks in the Group to in-house pension provisions | | 87,526 | | 156,910 | | | 42,378 |
Net charges by other Group companies to in-house pension provisions | | 59,653 | | 43,824 | | | 32,749 |
| | |
| |
|
| |
|
| | | 327,751 | | 390,913 | | | 290,748 |
| | |
| |
|
| |
|
Detail by account- | | | | | | | |
Financial expenses – Customer deposits | | 4,609 | | 9,280 | | | 39,464 |
Financial expenses - Cost allocable to the recorded pension provision (Note 20) | | 69,893 | | 60,041 | | | 42,480 |
General administrative expenses – Personnel costs- | | | | | | | |
Net charges to in-house pension provisions (Notes 20 and 28-c) | | 56,420 | | 39,067 | | | 32,203 |
Contributions to external pension funds (Note 28-c) | | 78,501 | | 93,557 | | | 90,272 |
Extraordinary losses- | | | | | | | |
Net extraordinary charges to in-house pension provisions (Note 20) | | 2,240 | | 3,345 | | | 445 |
Other losses | | 116,088 | | 189,501 | | | 85,884 |
Extraordinary income- | | — | | (3,878 | ) | | — |
| | |
| |
|
| |
|
| | | 327,751 | | 390,913 | | | 290,748 |
| | |
| |
|
| |
|
Other commitments to employees
The situation as regards performance bonuses payable in shares as of December 31, 2003, and the variations in 2003 were as follows:
| | | | | | | | | | | | | | | | | | | | | |
Plans in Force
| | Nº Shares at 01/01/03
| | Options
Exercised on
Maturity of the
Plan
| | | Options
Exercised due to
Early
Retirements and
Other (2)
| | | Nº Shares at 12/31/03
| | Year Granted
| | | Group
| | Expiration Date
(1)
| | Exercise Price
(Euros)
|
| | | | | | | | | 01/01/03
| | 12/31/03
|
1997 | | 3,500.409 | | (3,341,379 | ) | | (159,030 | ) | | — | | 1998 | | | Employees | | 02/20/03 | | 3.67 | | — |
1998(3) | | 4,242,866 | | (682,591 | ) | | (320,014 | ) | | 3,240,261 | | 1999 | | | Employees | | 06/01/03 -
07/31/04 | | 6.01 | | 6.01 |
| | | | | | | | | | | | | | | | | | 06/01/03 - | | | | |
1999(3) | | 5,103,957 | | (554,846 | ) | | (21,308 | ) | | 4,527,803 | | 2000 | | | Employees | | 07/31/04 | | 10.65 | | 10.65 |
| | | | | | | | | | | | | | | | | | 03/31/03 - | | | | |
2000 | | 7,292,410 | | — | | | (45,835 | ) | | 7,246,575 | | 2001 | | | Employees | | 03/31/04 | | 12.02 | | 12.02 |
Long-service bonuses | | 6,646,957 | | (278,460 | ) | | (90,136 | ) | | 6,278,361 | | (4 | ) | | Employees | | (4) | | — | | — |
| | |
| |
|
| |
|
| |
| | | | | | | | |
| |
|
Total | | 26,786,599 | | (4,857,276 | ) | | (636,323 | ) | | 21,293,000 | | | | | | | | | 6.73 | | 7.27 |
| | |
| |
|
| |
|
| |
| | | | | | | | |
| |
|
| (1) | The dates indicated are the commencement and expiration dates of the period during which the option can be exercised. |
| (2) | Including both payments to early retirees and other variations in the number of options or shares outstanding. |
| (3) | The 1998 and 1999 are settled together. |
| (4) | When employees complete 15, 25, 40, and 50 years’ service at Banco Bilbao Vizcaya Argentaria, S.A. |
F-18
The weighted-average exercise price of options exercised in 2003 before the expiration date, excluding long-service bonuses, was €6.01. The remaining life of options outstanding as of December 31, 2003, excluding long-service bonuses, was 0.42 years.
From 2001 to 2003 no new stock options were granted, except long-service bonuses in shares accrued by employees (to be settled when the employee completes 15, 25, 40 or 50 years’ service at Banco Bilbao Vizcaya Argentaria, S.A.).
The situation as regards performance bonuses payable in shares as of December 31, 2002, and the variations in 2002 were as follows:
| | | | | | | | | | | | | | | | | | | | | |
Plans in Force
| | Nº Shares
01/01/02
| | Options
Exercised on
Maturity of the
Plan
| | | Options
Exercised due to
Early
Retirements and
Other (2)
| | | Nº Shares at 12/31/02
| | Year Granted
| | | Group
| | Expiration Date
(1)
| | Exercise Price
(Euros)
|
| | | | | | | | | 01/01/02
| | 12/31/02
|
1996 | | 4,200,729 | | (4,116,073 | ) | | (84,656 | ) | | — | | 1997 | | | Employees | | 02/20/02 | | 2.00 | | — |
1997 | | 3,509,418 | | — | | | (9,009 | ) | | 3,500,409 | | 1998 | | | Employees | | 02/20/03 | | 3.67 | | 3.67 |
1998 | | 4,248,031 | | — | | | (5,165 | ) | | 4,242,866 | | 1999 | | | Employees | | 06/01/03 –
07/31/04 | | 6.01 | | 6.01 |
1999 | | 5,785,077 | | — | | | (681,120 | ) | | 5,103,957 | | 2000 | | | Employees | | 06/01/03 –
07/31/04 | | 10.65 | | 10.65 |
2000 | | 8,995,381 | | — | | | (1,702,971 | ) | | 7,292,410 | | 2001 | | | Employees | | 03/31/03 –
03/31/04 | | 12.02 | | 12.02 |
Long-service bonus | | 7,070,618 | | (383,040 | ) | | (40,621 | ) | | 6,646,957 | | (3 | ) | | Employees | | (3) | | — | | — |
Extrabonus AD | | 15,476,500 | | — | | | (15,476,500 | ) | | — | | 2000 | | | Managers | | 12/31/02 | | 16.50 | | — |
Insurance AD | | 5,469,923 | | — | | | (5,469,923 | ) | | — | | 2000 | | | Managers | | 01/01/01 –
12/31/02 | | 15.18 | | — |
| | |
| |
|
| |
|
| |
| | | | | | | | |
| |
|
Total | | 54,755,677 | | (4,499,113 | ) | | (23,469,965 | ) | | 26,786,599 | | | | | | | | | 10.13 | | 6.73 |
| | |
| |
|
| |
|
| |
| | | | | | | | |
| |
|
| (1) | The dates indicated are the commencement and expiration dates of the period during which the option can be exercised. |
| (2) | Including both payments to early retirees and other variations in the number of options or shares outstanding. |
| (3) | When employees complete 15, 25, 40, and 50 years’ service at Banco Bilbao Vizcaya Argentaria, S.A. |
The weighted-average exercise price of options exercised in 2002 before the expiration date, excluding long-service bonuses, was €11.26. The remaining life of options outstanding as of December 31, 2002, excluding long-service bonuses, was 0.85 years.
The situation as regards performance bonuses payable in shares as of December 31, 2001 and the variations in 2001 were as follows:
| | | | | | | | | | | | | | | | | | | | | |
Plans in Force
| | Nº Shares at
01/01/01
| | Options Exercised on Maturity of the
Plan
| | | Options
Exercised due to
Early
Retirements and Other (2)
| | | Nº Shares at 12/31/01
| | Year Granted
| | | Group
| | Expiration Date
(1)
| | Exercise Price
(Euros)
|
| | | | | | | | | 01/01/01
| | 12/31/01
|
1995 | | 4,716,666 | | (4,716,666 | ) | | — | | | — | | 1996 | | | Employees | | 02/20/01 | | 1.32 | | — |
1996 | | 3,560,958 | | — | | | 639,771 | | | 4,200.729 | | 1997 | | | Employees | | 02/20/02 | | 2.00 | | 2.00 |
1997 | | 3,821,454 | | — | | | (312,036 | ) | | 3,509,418 | | 1998 | | | Employees | | 02/20/03 | | 3.67 | | 3.67 |
1998 | | 4,678,873 | | — | | | (430,842 | ) | | 4,248,031 | | 1999 | | | Employees | | 06/01/03 –
07/31/04 | | 6.01 | | 6.01 |
1999 | | 5,796,149 | | — | | | (11,072 | ) | | 5,785,077 | | 2000 | | | Employees | | 06/01/03 –
03/31/04 | | 10.65 | | 10.65 |
2000 | | 10,000,000 | | — | | | (1,004,619 | ) | | 8,995,381 | | 2001 | | | Employees | | 03/31/03 –
03/31/04 | | 12.02 | | 12.02 |
Long-service bonus | | 7,708,315 | | (496,980 | ) | | (140,717 | ) | | 7,070,618 | | (3 | ) | | Employees | | (3) | | — | | — |
Extrabonus AD | | 15,476,500 | | — | | | — | | | 15,476,500 | | 2000 | | | Managers | | 12/31/02 | | 16.50 | | 16.50 |
Insurance AD | | 5,469,923 | | — | | | — | | | 5,469,923 | | 2000 | | | Managers | | 01/01/01 –
12/31/02 | | 15.18 | | 15.18 |
| | |
| |
|
| |
|
| |
| | | | | | | | |
| |
|
Total | | 61,228,838 | | (5,213,646 | ) | | (1,259,515 | ) | | 54,755,677 | | | | | | | | | 9.40 | | 10.13 |
| | |
| |
|
| |
|
| |
| | | | | | | | |
| |
|
| (1) | The dates indicated are the commencement and expiration dates of the period during which the option can be exercised. |
| (2) | Including both payments to early retirees and other variations in the number of options or shares outstanding. |
| (3) | When employees complete 15, 25, 40, and 50 years’ service at Banco Bilbao Vizcaya Argentaria, S.A. |
The weighted-average exercise price of options exercised in 2001 before the expiration date, excluding long-service bonuses, was €8.39. The remaining life of options outstanding as of December 31, 2001, excluding long-service bonuses, was 1.25 years.
The grant date fair value of Plan 2000, Extrabonus AD and Insurance AD programs granted in 2000, were approximately €5.17, €2.36 and €1.72 per option, respectively. The fair value of each option is estimated on the grant date using the Black-Scholes option pricing model with the following assumptions: risk-free interest rates of 5.4%, 5.39% and 5.49%, respectively; expected lives of 2.5, 2.6 and 2.6 years, respectively; expected volatilities of 30.5%, 31.31% and 29.27%, respectively and dividend yield of 2%, 2.19% and 2.01%, respectively.
F-19
In March 1999, pursuant to a resolution adopted by the Bank’s Shareholders’ Meeting on February 27, 1999, 32,871,301 new shares were issued at a price of €2.14 per share, similar to the average reference price of the bonus commitments to Group employees at that date, which they were allocated to cover, which included the bonus commitments for the years 1995 through 1998 and a portion of the accrued commitment relating to long-service bonuses. These shares were subscribed and paid in full by a non-Group company and, simultaneously, the Bank acquired a call option on these shares which can be exercised on any date, at one or several times, prior to December 31, 2011, at an exercise price equal to the share issue price, adjusted on the basis of the antidilution clauses. On various occasions since 1999 the call option was partially exercised to meet commitments to Group employees, a total of 24,678,359 shares being purchased. Accordingly, as of December 31, 2003, the Bank still held an option on a total of 8,192,942 shares (12,490,232 and 18,262,345 shares as of December 31, 2002 and 2001, respectively), at a price of €2.09 per share, after adjustment of the issue price as a result of the reductions in the par value in July 1999 and April 2000.
Also, as of December 31, 2003, the bonuses for 1999 and 2000, which consist of a cash payment tied to the market price of 4,527,803 and 7,246,575 Bank shares, respectively (5,103,957 and 7,292,410 shares, respectively, as of December, 2002, and 5,785,077 and 8,995,381 shares, respectively, as of December 31, 2001), and the other accrued long-service bonus commitments (1,325,680 shares, 1,900,000 shares and 1,311,451 shares in 2003, 2002 and 2001, respectively) had been hedged in full with call options and other futures transactions (Note 3-m).
Additionally, the time period stipulated in the variable compensation program tied to the BBVA share price for executive directors and senior managers of the Bank ended on December 31, 2002. This program was completed with the granting of loans or credit facilities for the acquisition of BBVA shares on the market and guaranteed a maximum loss in the share value of 5% of the acquisition cost. Since at the time of maturity of the program the share price was below the value set (€15 plus 10%), the program beneficiaries were not entitled to receive any amount under the program.
In 2003 an insurance policy was arranged for €570 thousand to cover the pension commitments to former nonexecutive directors. This amount was recorded under the “Personnel Costs” caption in the 2003 statement of income.
k) Severance costs-
Under current Spanish labor legislation, companies are required to pay severance to employees terminated without just cause. There is no labor force reduction plan which would make it necessary to record a provision in this connection. However, as required by Bank of Spain Circular 5/2000, the Group recorded in-house provisions, with a charge to the “Extraordinary Losses” caption in the accompanying 2003, 2002, and 2001 consolidated statements of income, to cover, in accordance with the schedule established in that Circular, the contractual severance payments for terminations or dismissals additional to those provided for by current legislation on a general basis. As of December 31, 2003, 2002 and 2001, these provisions amounted to €37,458 thousand, €37,490 thousand and €19,636 thousand, respectively, and were recorded under the “Provisions for Contingencies and Expenses - Pension Provision” caption in the accompanying consolidated balance sheets (Note 20).
l) Corporate income tax and other taxes-
These captions in the consolidated statements of income include all the debits or credits arising from Spanish corporate income tax and those taxes of a similar nature of subsidiaries abroad, including both the amounts relating to the expense accrued in the year and those arising from adjustments to the amounts recorded in prior years (Note 25).
The expense for corporate income tax accrued each year is calculated on the basis of book income before taxes, increased or decreased, as appropriate, by the permanent differences from the income for tax purposes, i.e. differences between the taxable income and book income before taxes that do not reverse in subsequent periods. The tax assets arising from tax losses at subsidiaries (basically Latin-American companies) and prepaid taxes arising from timing differences are only capitalized if they will be recovered within a period of ten years (Note 15).
The tax benefit of tax credits for double taxation, tax relief and tax credits for certain activities or investments is treated as a reduction of the amount of corporate income tax for the year in which the tax credits are used. Entitlement to these tax credits is conditional upon compliance with the legally stipulated requirements.
m) Derivatives and other futures transactions-
These instruments include, inter alia, unmatured foreign currency purchase and sale transactions, unmatured securities purchase and sale transactions, financial futures on securities, on exchange rates and on interest rates, forward rate agreements, options on exchange rates, on securities and on interest rates and the various types of financial swaps. These transactions are basically carried out for hedging and overall management of the financial risks to which the Group is exposed.
In accordance with Bank of Spain regulations, transactions involving these products are recorded in memorandum accounts either for the future rights and commitments that might have a net worth effect, or for the balances that might be necessary to reflect the transactions, even if they did not have any effect on the Group’s net worth. Accordingly, the notional and/or contractual value of these products does not express the total credit or market risk assumed by the Group.
F-20
Also, the premiums paid and collected for options purchased and sold, respectively, must be recorded under the “Other Assets” and “Other Liabilities” captions in the accompanying consolidated balance sheets as an asset for the purchaser and as a liability for the writer (Note 15), until their exercise or maturity date.
Transactions whose objective and effect is to eliminate or significantly reduce currency, interest rate or price risks on asset and liability positions or on other transactions were treated as hedging transactions, provided that the hedged asset and the hedging transactions were identified explicitly from initiation of the latter. Similarly, transactions which, although not specifically assigned to a specific hedged item, form part of global or macrohedges used to reduce the risk to which the Group is exposed as a consequence of overall management of correlated assets, liabilities and other transactions, were also treated as hedging transactions.
As of December 31, 2003, 2002 and 2001, the Group had arranged share price risk and interest rate risk macrohedges consisting of securities listed on the main international stock markets and long-term deposit transactions, respectively. The security price macrohedges were valued at market price. The settlements relating to the interest rate macrohedge were recorded by the accrual method. These transactions are permanently subject to an integrated, prudent and consistent system of risk and earnings measurement, management and control enabling transactions to be monitored and identified. This system involves, for each macrohedge, the recording of provisions for credit, market and operational risk in accordance with banking practice for transactions of this type. As required by current legislation, each macrohedge transaction has been authorized by the Bank of Spain.
The gains or losses arising from these hedging transactions are recorded symmetrically to the revenues or costs of the hedged item, and the collections or payments made in settlements are recorded with a balancing entry under the “Other Assets” and “Other Liabilities” captions in the accompanying consolidated balance sheets (Note 15). Forward currency transactions classified as hedges are recorded for accounting purposes as described in Note 3-b.
Nonhedging transactions, which are also known as trading transactions, are valued in accordance with Bank of Spain regulations, based on the market on which they are arranged:
| | - | Transactions arranged in organized markets are valued at market price in their respective markets and the gains or losses arising as a result of market price fluctuations are recorded in full in the consolidated statement of income. |
| | - | Theoretical closings are performed at least every month of securities and interest rate futures transactions arranged outside organized markets, and provisions are recorded with a charge to income for the potential net losses, if any, in each risk category and currency arising from such valuations (Notes 20 and 26). The potential gains, which amounted to €9,664 thousand, €1,137 thousand and €8,848 thousand as of December 31, 2003, 2002 and 2001, respectively, are only recognized in the accompanying consolidated statements of income when effectively realized (Note 26). This procedure is also applied to currency options traded outside organized markets. |
n) Assets and liabilities acquired or issued at a discount-
Assets and liabilities acquired or issued at a discount, except for marketable securities, are recorded at redemption value. The difference between this value and the amounts paid or received is recorded under the liability and asset “Accrual Accounts” captions in the consolidated balance sheets (Note 16).
o) Investments in Argentina-
Macroeconomic situation
The economic crisis that beset Argentina in late 2001 and in 2002 had repercussions on the solvency and liquidity of companies located in Argentina. This was due to a variety of factors, including most notably:
| | • | The Law on Convertibility was amended in January 2002, giving rise to the end of parity with the U.S. dollar. The initial exchange rate in the official market was set at ARP 1.40/US$ 1. The exchange rates as of December 31, 2003 and 2002, were ARP 2.933/US$ 1 and ARP 3.363/US$ 1, respectively. |
| | • | The measures established by the Argentine Government to control the movement of capital in 2002 were repealed in that same year and unrestricted access to deposits was restored. |
| | • | In 2002, the Argentinean government decreed that dollar assets and liabilities would be converted to pesos at different exchange rates. This measure could have a severe impact on the solvency of the Argentinean banking system due to |
F-21
| | | application of a lower exchange rate to certain loans converted to pesos compared with the exchange rate applied to deposits. However, the Argentinean government issued public bonds to be used to compensate financial institutions for damage to their balance sheets caused by the mentioned “asymmetrical pessification”. Therefore the intention of Argentinean Government was that “asymmetrical pessification” should not impact the Argentinean banks. |
Nevertheless, “asymmetrical pessification” had secondary effects on BBVA Group financial statements. Due to government decree dollar liabilities were converted to pesos at exchanges rates fixed by the government instead of free-market exchange rate. Many depositors sued banks and the Argentinean courts forced banks to pay the difference between the dollar free-market exchange rate and exchange rate fixed by government. The losses due to this difference were recorded in the income statement and cash flow of our Argentinean subsidiary BBVA Banco Frances.
| • | Also, as a result of the devaluation and the inflationary pressures, the Argentine National Securities Commission and Central Bank decreed that financial statements as of December 31, 2002 must be adjusted for inflation. Due to the positive trend in inflation, this measure was repealed on March 1, 2003. |
Although 2003 saw a substantial improvement in the economic situation, certain economic matters still remain to be addressed in order to enable Argentina to return to normality.
BBVA Banco Francés Group
In 2002 BBVA Banco Francés implemented a financial strengthening plan to enable it to meet liquidity requirements. This plan included, inter alia, the following measures:
| | • | Financial assistance from BBVA to meet certain commitments assumed in the past and consisting of: a US$ 79 million loan that was subsequently converted into equity (Note 4) and loans totaling US$ 80 million secured by pledge of customer loans amounting to US$ 120 million. Full provision was made for both risks in 2002. |
| | • | The sale of 60.879% of BBVA Uruguay to BBVA, S.A. for US$ 55 million. |
| | • | The capital increase approved by the Annual-Special Shareholders’ Meeting of BBVA Banco Francés, S.A. on August 7, 2002 (Note 4). In this capital increase, BBVA converted into equity the aforementioned US$ 79 million loan plus the accrued interest, together with the subordinated debt issued by BBVA Banco Francés and held by the Bank amounting to US$ 130 million. These two transactions were fully provisioned at individual and consolidated level. |
Additionally, Argentine Government debt securities were sold to BBVA, S.A. under repurchase agreement. The balances outstanding on this transaction as of December 31, 2003 and 2002, were €82,675 thousand and €98,867 thousand, respectively.
In 2003 the Bank did not carry out any further investment or financial assistance transactions with respect to its subsidiaries in Argentina.
BBVA Group – Consolidation of the Group companies located in Argentina.
The financial statements of the Group companies located in Argentina were prepared in accordance with the regulations in force in that country and the applicable unification adjustments were made in the accompanying consolidated financial statements on the basis of the information available.
The Group has maintained the accounting policy established in December 2001 of annulling the underlying book value of the Banco Francés Group in the consolidated books. Accordingly, as of December 31, 2001, the Group recorded a provision amounted to €447,435 thousand which has been assigned to covering assets and commitments in accordance with the terms of the preceding paragraph.
As of December 31, 2003, 2002 and 2001, the Group has additionally recorded a specific provision amounting to €120,380 thousand, €135,606 thousand and €170,201 thousand, respectively, to cover the value of the fixed-income securities issued by BBVA Banco Francés that are held by the Bank and the US$ 80 million loan mentioned above.
The aforementioned provisions were recorded under the “Provisions for Contingencies and Expenses” caption (Note 20). These provisions were not assigned to specific assets in view of their nature and their amount is equal to the Group’s investment in the BBVA Banco Francés Group, the lines of financing and the fixed-income securities issued by that group and subscribed by BBVA.
The Bank’s directors and their legal advisers believe that these provisions reasonably cover the maximum losses which might be incurred by the Group while the situation described above continues and until such time as objective conditions of security and profitability for new potential investments are reestablished.
F-22
(4) BANCO BILBAO VIZCAYA ARGENTARIA GROUP
Banco Bilbao Vizcaya Argentaria, S.A. (BBVA) is the Group’s parent company. Its individual financial statements are prepared on the basis of the accounting principles and methods described in Note 3, except for the valuation of the Bank’s direct holdings of 20% or more in unlisted companies and of 3% or more in listed companies, which, pursuant to Bank of Spain Circular 4/1991, are recorded at the lower of cost, revalued where appropriate, or market. The market value is deemed to be the underlying book value of these holdings, adjusted by the amount of the unrealized gains disclosed at the time of acquisition and still existing at the valuation date.
The Bank represented approximately 63.94% of the Group’s assets and 49.5% of pre-tax profits as of December 31, 2003 (58.96% and 49.39%, respectively, as of December 31, 2002, and 52.82% and 54.08%, respectively, as of December 31, 2001), after the related consolidation adjustments and eliminations.
Summarized below are the balance sheets of Banco Bilbao Vizcaya Argentaria, S.A. as of December 31, 2003, 2002 and 2001 and the statements of income for the years ended December 31, 2003, 2002 and 2001.
F-23
BANCO BILBAO VIZCAYA ARGENTARIA, S.A.
BALANCE SHEETS AS OF DECEMBER 31, 2003, 2002 AND 2001 (SUMMARIZED)
- Thousands of euros -
| | | | | | |
| | | 2003
| | 2002
| | 2001
|
ASSETS | | | | | | |
CASH ON HAND AND DEPOSITS AT CENTRAL BANKS | | 2,359,883 | | 1,671,111 | | 2,281,075 |
GOVERNMENT DEBT SECURITIES | | 18,796,673 | | 19,091,299 | | 19,273,261 |
DUE FROM CREDIT INSTITUTIONS | | 19,562,686 | | 19,662,904 | | 18,728,729 |
TOTAL NET LENDING | | 110,880,263 | | 100,687,471 | | 99,509,141 |
DEBENTURES AND OTHER DEBT SECURITIES | | 24,416,412 | | 17,131,192 | | 22,505,543 |
COMMON STOCKS AND OTHER EQUITY SECURITIES | | 2,428,316 | | 2,071,348 | | 2,164,087 |
INVESTMENTS IN NON-GROUP COMPANIES | | 3,583,687 | | 4,357,296 | | 4,306,431 |
INVESTMENTS IN GROUP COMPANIES | | 7,778,436 | | 8,699,420 | | 8,814,491 |
INTANGIBLE ASSETS | | 193,244 | | 191,903 | | 165,209 |
PROPERTY AND EQUIPMENT | | 2,108,116 | | 2,190,317 | | 2,357,723 |
TREASURY STOCK | | 56,071 | | 97,555 | | 7 |
OTHER ASSETS | | 10,724,838 | | 8,994,431 | | 7,263,368 |
ACCRUAL ACCOUNTS | | 1,426,032 | | 3,314,007 | | 5,497,436 |
| | |
| |
| |
|
TOTAL ASSETS | | 204,314,657 | | 188,160,254 | | 192,866,501 |
| | |
| |
| |
|
MEMORANDUM ACCOUNTS | | 81,584,665 | | 78,116,151 | | 77,512,135 |
| | | |
LIABILITIES AND EQUITY | | | | | | |
DUE TO CREDIT INSTITUTIONS | | 53,929,332 | | 47,029,366 | | 55,251,331 |
DEPOSITS | | 101,419,493 | | 98,472,990 | | 96,615,730 |
MARKETABLE DEBT SECURITIES | | 13,630,214 | | 8,714,150 | | 6,073,820 |
OTHER LIABILITIES | | 9,539,682 | | 7,381,866 | | 6,029,952 |
ACCRUAL ACCOUNTS | | 1,654,299 | | 3,768,498 | | 5,545,639 |
PROVISIONS FOR CONTINGENCIES AND EXPENSES | | 3,736,487 | | 3,064,754 | | 2,788,484 |
GENERAL RISK ALLOWANCE | | — | | — | | — |
INCOME FOR THE YEAR | | 1,460,337 | | 1,207,096 | | 1,311,561 |
SUBORDINATED DEBT | | 10,442,327 | | 9,735,824 | | 10,232,345 |
CAPITAL STOCK | | 1,565,968 | | 1,565,968 | | 1,565,968 |
ADDITIONAL PAID-IN CAPITAL | | 6,273,901 | | 6,512,797 | | 6,834,941 |
RESERVES | | 486,336 | | 530,664 | | 440,449 |
REVALUATION RESERVES | | 176,281 | | 176,281 | | 176,281 |
| | |
| |
| |
|
TOTAL LIABILITIES AND EQUITY | | 204,314,657 | | 188,160,254 | | 192,866,501 |
| | |
| |
| |
|
F-24
BANCO BILBAO VIZCAYA ARGENTARIA, S.A.
STATEMENTS OF INCOME FOR THE YEARS ENDED DECEMBER 31, 2003, 2002 AND 2001 (SUMMARIZED)
- Thousands of euros -
| | | | | | | | | |
| | | (DEBIT) / CREDIT
| |
| | | 2003
| | | 2002
| | | 2001
| |
FINANCIAL REVENUES | | 6,551,366 | | | 7,531,595 | | | 9,476,865 | |
FINANCIAL EXPENSES | | (3,602,152 | ) | | (4,627,304 | ) | | (6,675,315 | ) |
INCOME FROM EQUITIES PORTFOLIO | | 667,465 | | | 1,283,859 | | | 1,400,194 | |
| | |
|
| |
|
| |
|
|
NET INTEREST INCOME | | 3,616,679 | | | 4,188,150 | | | 4,201,744 | |
FEES COLLECTED | | 1,509,043 | | | 1,532,072 | | | 1,386,039 | |
FEES PAID | | (275,990 | ) | | (275,284 | ) | | (290,044 | ) |
MARKET OPERATIONS | | 366,454 | | | 362,923 | | | (71,877 | ) |
| | |
|
| |
|
| |
|
|
GROSS OPERATING INCOME | | 5,216,186 | | | 5,807,861 | | | 5,225,862 | |
OTHER OPERATING INCOME | | 2,127 | | | 14,673 | | | 8,306 | |
GENERAL ADMINISTRATIVE EXPENSES | | (2,675,825 | ) | | (2,625,233 | ) | | (2,684,797 | ) |
DEPRECIATION AND AMORTIZATION | | (247,544 | ) | | (257,964 | ) | | (270,627 | ) |
OTHER OPERATING EXPENSES | | (73,379 | ) | | (87,795 | ) | | (81,321 | ) |
| | |
|
| |
|
| |
|
|
NET OPERATING INCOME | | 2,221,565 | | | 2,851,542 | | | 2,197,423 | |
NET LOAN LOSS PROVISIONS | | (548,266 | ) | | (631,928 | ) | | (531,856 | ) |
NET SECURITIES WRITEDOWNS | | (369,942 | ) | | (1,181,581 | ) | | (976,812 | ) |
NET CHARGE TO GENERAL RISK ALLOWANCE | | — | | | — | | | 1,439 | |
EXTRAORDINARY INCOME | | 825,743 | | | 582,816 | | | 998,855 | |
EXTRAORDINARY LOSSES | | (366,754 | ) | | (389,544 | ) | | (536,053 | ) |
| | |
|
| |
|
| |
|
|
PRE-TAX PROFIT | | 1,762,346 | | | 1,231,305 | | | 1,152,996 | |
CORPORATE INCOME TAX AND OTHER TAXES | | (302,009 | ) | | (24,209 | ) | | 158,565 | |
| | |
|
| |
|
| |
|
|
NET INCOME (Note 5) | | 1,460,337 | | | 1,207,096 | | | 1,311,561 | |
| | |
|
| |
|
| |
|
|
F-25
BANCO BILBAO VIZCAYA ARGENTARIA, S.A.
STATEMENTS OF CHANGES IN FINANCIAL POSITION
FOR THE YEARS ENDED DECEMBER 31, 2003, 2002 AND 2001 (SUMMARIZED)
- Thousands of euros -
| | | | | | | | | |
| | | 2003
| | | 2002
| | | 2001
| |
APPLICATION OF FUNDS | | | | | | | | | |
DIVIDENDS PAID | | 1,112,156 | | | 1,255,970 | | | 1,102,572 | |
NET PURCHASE OF TREASURY STOCK | | — | | | 97,548 | | | 3,178 | |
SUBORDINATED DEBT | | — | | | 496,521 | | | 204,927 | |
FINANCING, NET OF INVESTMENT, AT BANK OF SPAIN AND CREDIT AND SAVINGS INSTITUTIONS | | — | | | 8,608,296 | | | — | |
TOTAL NET LENDING | | 10,756,330 | | | 1,802,746 | | | 8,156,795 | |
DEBT SECURITIES | | 6,978,027 | | | — | | | 5,872,794 | |
SHORT-TERM EQUITY SECURITIES | | 324,153 | | | 62,550 | | | 458,615 | |
MARKETABLE SECURITIES | | — | | | — | | | 785,762 | |
ACQUISITION OF LONG-TERM INVESTMENTS - | | | | | | | | | |
Purchase of investments in Group and associated companies | | 5,474,267 | | | 6,311,401 | | | 5,894,598 | |
Additions to property and equipment and intangible assets | | 355,522 | | | 399,968 | | | 485,799 | |
| | |
|
| |
|
| |
|
|
| | | 5,829,789 | | | 6,711,369 | | | 6,380,397 | |
| | |
|
| |
|
| |
|
|
TOTAL FUNDS APPLIED | | 25,000,455 | | | 19,035,000 | | | 22,965,040 | |
| | |
|
| |
|
| |
|
|
SOURCE OF FUNDS | | | | | | | | | |
FROM OPERATIONS: | | | | | | | | | |
Net income | | 1,460,337 | | | 1,207,096 | | | 1,311,561 | |
Add- | | | | | | | | | |
Depreciation and amortization | | 344,338 | | | 329,335 | | | 270,627 | |
Net provision for asset writedown and other special provisions | | 1,182,798 | | | 2,404,260 | | | 1,667,620 | |
Losses on sales of investments and fixed assets | | 12,758 | | | 62,475 | | | 82,972 | |
Less- | | | | | | | | | |
Gains on sales of investments and fixed assets | | (668,477 | ) | | (390,505 | ) | | (821,205 | ) |
| | |
|
| |
|
| |
|
|
| | | 2,331,754 | | | 3,612,661 | | | 2,511,575 | |
| | | |
CAPITAL INCREASES | | 136,880 | | | — | | | 104,056 | |
NET SALE OF TREASURY STOCK | | 41,484 | | | — | | | — | |
SUBORDINATED DEBT | | 706,503 | | | — | | | 2,626,376 | |
FINANCING, NET OF INVESTMENT, AT BANK OF SPAIN AND CREDIT AND SAVINGS INSTITUTIONS | | 6,267,516 | | | — | | | 10,306,688 | |
DEPOSITS | | 2,946,503 | | | 1,857,260 | | | 1,435,466 | |
DEBT SECURITIES | | — | | | 5,656,629 | | | — | |
MARKETABLE SECURITIES | | 4,916,064 | | | 2,640,330 | | | — | |
SALE OF LONG-TERM INVESTMENTS- | | | | | | | | | |
Sale of investments in Group and associated companies | | 7,056,294 | | | 4,807,104 | | | 5,166,983 | |
Sale of property and equipment | | 114,968 | | | 305,184 | | | 553,355 | |
| | |
|
| |
|
| |
|
|
| | | 7,171,262 | | | 5,112,288 | | | 5,720,338 | |
OTHER LIABILITY ITEMS LESS ASSET ITEMS | | 482,489 | | | 155,832 | | | 260,541 | |
| | |
|
| |
|
| |
|
|
TOTAL FUNDS OBTAINED | | 25,000,455 | | | 19,035,000 | | | 22,965,040 | |
| | |
|
| |
|
| |
|
|
F-26
The total assets and financial income of the most subsidiaries of the Group as of December 31, 2003, 2002 and 2001 are as follows:
| | | | | | | | | | | | | | |
| | | COUNTRY
| | Thousands of Euros
|
| | | 2003
| | 2002
| | 2001
|
| | | Total Assets
| | Financial
Income
| | Total Assets
| | Financial
Income
| | Total Assets
| | Financial
Income
|
BBVA Bancomer Group | | Mexico | | 48,239,259 | | 3,812,987 | | 60,061,343 | | 5,070,718 | | 71,079,719 | | 7,472,793 |
BBVA Chile Group | | Chile | | 4,566,384 | | 230,695 | | 4,309,550 | | 300,519 | | 4,181,488 | | 363,938 |
BBVA Puerto Rico Group | | Puerto Rico | | 4,231,283 | | 216,615 | | 4,802,885 | | 289,157 | | 5,415,486 | | 383,764 |
BBVA Banco Francés Group | | Argentina | | 4,203,309 | | 278,888 | | 5,916,673 | | 1,081,248 | | 11,333,454 | | 1,352,265 |
Provincial Group | | Venezuela | | 3,407,683 | | 488,796 | | 3,627,193 | | 746,284 | | 6,043,026 | | 810,940 |
Continental Group | | Peru | | 2,936,889 | | 171,985 | | 3,510,614 | | 204,232 | | 3,740,783 | | 272,926 |
BBVA Banco Ganadero Group | | Colombia | | 1,923,646 | | 176,967 | | 1,907,398 | | 227,215 | | 2,983,467 | | 292,229 |
BBVA Brasil Group | | Brazil | | — | | — | | 4,020,841 | | 1,218,811 | | 6,390,255 | | 761,669 |
The subsidiaries fully consolidated as of December 31, 2003, 2002 and 2001 which, based on the information available, were more than 5% owned by non-Group shareholders, were as follows:
As of December 31, 2003:
| - | Grupo Financiero BBVA Bancomer, S.A. |
| - | Banc Internacional D’Andorra, S.A. |
| - | Holding Continental, S.A. |
| - | PSA Finance Argentina Compañía Financiera, S.A. |
| - | Inversiones BanPro International Inc., N.V. |
| - | BBVA Horizonte Pensiones y Cesantías, S.A. |
| - | Administradora Fondo Pensiones Provida, S.A. |
| - | BI-BM Gestio D’Actius, S.A. |
| - | BBVA & Partners Alternative Invest, A.V., S.A. |
As of December 31, 2002:
| - | Grupo Financiero BBVA Bancomer, S.A. |
| - | Banc Internacional D’Andorra, S.A. |
| - | Holding Continental, S.A. |
| - | PSA Finance Argentina Compañía Financiera, S.A. |
| - | Inversiones BanPro International Inc., N.V. |
F-27
| - | BBVA Horizonte Pensiones y Cesantías, S.A. |
| - | Administradora Fondo Pensiones Provida, S.A. |
| - | BI-BM Gestio D’Actius, S.A. |
| - | BBVA & Partners Alternative Invest, A.V., S.A. |
As of December 31, 2001:
| - | Grupo Financiero BBVA Bancomer, S.A. |
| - | Banc Internacional D’Andorra, S.A. |
| - | Holding Continental, S.A. |
| - | Inversiones BanPro, S.A. |
| - | Inversiones BanPro International Inc., N.V. |
| - | BBVA Horizonte Pensiones y Cesantías, S.A. |
| - | Administradora Fondo Pensiones Provida, S.A |
As of December 31, 2002 and 2001, there were no Spanish or foreign credit institutions outside the Group with significant holdings in fully consolidated companies.
Based on the information available as of December 31, 2003, foreign credit institutions outside the Group held significant investments in the following fully consolidated companies:
| - | PSA Finance, a Banque PSA Finance investee |
| - | AFP Provida, a Bank of New York investee |
The main changes in the consolidated Group and the situation as of December 31, 2003, were as follows:
BBVA-Bancomer Group (Mexico)-
Grupo Financiero BBV-Probursa, S.A. de C.V. and the companies in its group, including most notably Banco Bilbao Vizcaya Mexico, S.A., joined the Group in July 1995.
In the first half of 2000, it was resolved to merge Grupo Financiero BBV-Probursa, S.A. de C.V. and Grupo Financiero BBVA Bancomer, S.A. de C.V. (the holdings of which include most notably 100% of BBVA Bancomer, S.A. and 51% of Administradora de Fondos para el Retiro Bancomer, S.A. de C.V. (AFORE Bancomer). This merger was carried out in July 2000, after the Group subscribed in June to a capital increase of US$ 1,400 million at Grupo Financiero BBV-Probursa, S.A. de C.V.
The Group’s holding in Grupo Financiero BBVA Bancomer, S.A. de C.V. resulting from the merger, following open-market acquisitions of shares amounting to approximately US$ 325 million, stood at 36.6% as of December 31, 2000.
At the end of the year 2000 an agreement was reached with Bank of Montreal to acquire an additional 2.2% of Grupo Financiero BBVA Bancomer, S.A. de C.V. for approximately US$ 125 million, in a transaction which was performed in 2001. Also, on April 4, 2001, the Group reached an agreement with Bank of Montreal to purchase 9% of its holding in Grupo Financiero BBVA Bancomer, S.A. de C.V. (812 million shares) which signified an investment of US$ 558 million. The transaction was performed in two tranches: the first consisting of 500 million shares on April 5, 2001, raised the holding to 45%, and the second, consisting of 312 million shares, raised the holding in Grupo Financiero BBVA Bancomer, S.A. de C.V. to 48%. Also, in 2001 other acquisitions amounting to US$ 140 million were made, leaving the total holding in Grupo Financiero BBVA Bancomer S.A. de C.V. at 48.76% as of December 31, 2001. The increase in the total goodwill recorded in relation to Grupo Financiero BBVA Bancomer S.A. de C.V. in 2001 amounted to €739 million.
F-28
As part of the placement of Grupo Financiero BBVA Bancomer S.A. de C.V. shares by the Government of Mexico in 2002, BBVA acquired approximately 276 million shares representing 3% of the entity’s capital stock for €240 million. Additionally, in November 2002 the Group acquired a further 2.5% holding in the capital stock of BBVA Bancomer for €175 million, thus raising the Bank’s ownership interest to 54.67% as of December 31, 2002. The increase in goodwill recorded in 2002 was €338,350 thousand (Note 13).
Lastly, in 2003 the Group made additional purchases of 4.76% of the capital stock of BBVA Bancomer for a total of €304 million, leaving the Bank’s holding at 59.43% as of December 31, 2003. The increase in goodwill recorded in 2003 was €160,615 thousand (Note 13).
BBVA Banco Francés (Argentina) (Note 3-o)-
In December 1996, the Group acquired 30% of BBVA Banco Francés, S.A. (formerly Banco Francés Río de la Plata, S.A.) and took on its management. From that date through December 31, 2001, additional acquisitions were made to increase the Group’s holding in this entity to the 68.25% as of December 31, 2001. The total cost of this holding was US$ 1,179 million. As of December 31, 2001, the Group amortized the unamortized goodwill as of that date relating to BBVA Banco Francés, which amounted to €144,405 thousand (Notes 3-g and 13).
On May 30, 2002, BBVA Banco Francés reached an agreement with the Argentine authorities to increase capital, for which BBVA would contribute the subordinated marketable debentures of BBVA Banco Francés held by it amounting to US$ 130 million and a financial loan granted to BBVA Banco Francés amounting to US$ 79 million (Note 3-o). The preemptive subscription period ended on December 26, 2002. In accordance with the issue terms, a total of 158.4 million new shares were issued, which increased the Bank’s capital stock to 368.1 million shares. The Group, as the majority shareholder, increased its ownership interest in the capital of BBVA Banco Francés, S.A. from 68.25% to 79.6% as a result of this capital increase. The resulting goodwill amounted to €34,786 thousand and was written off with a charge to the 2002 consolidated statement of income (Notes 3-o and 13).
As of December 31, 2003, the holding was 79.6%.
Consolidar Group (Argentina) (Note 3-o)-
The Consolidar Group joined the Group in October 1997, when a 63.33% ownership interest was reached through BBVA Banco Francés.
As of December 31, 2001, 2002 and 2003, the Group held all the capital stock of Consolidar Administradora de Fondos de Jubilación y Pensiones (AFJP), S.A., Consolidar Cía de Seguros de Vida, S.A. and Consolidar Seguros de Retiro, S.A. (through Banco Francés, in percentages of between 53.89% and 66.67%). As of December 31, 2001, the Group amortized extraordinarily the unamortized goodwill as of that date relating to Consolidar AFJP, which amounted to €109,030 thousand.
Banco Bilbao Vizcaya Argentaria Puerto Rico, S.A.-
In July 1998 BBV Puerto Rico absorbed PonceBank, an entity with total assets of US$ 1,095 million, through a capital increase of US$ 166 million. Also in 1998, BBV Puerto Rico acquired the assets and liabilities of Chase Manhattan Bank in Puerto Rico for a disbursement of US$ 50 million (Note 13).
In March 2000, Citibank’s automobile loan portfolio in Puerto Rico was acquired for a disbursement of US$ 31 million additional to the adjusted net value of the loans.
As of December 31, 2003, the holding was 100%.
BBVA Group (Chile)-
In September 1998, the Group acquired a 44% holding in BBVA Banco BHIF, S.A., currently BBVA Chile, S.A., and assumed the management of the group headed by this Chilean financial institution. In 1999 additional shares were acquired, bringing the Group’s total holding in this entity to 53.3% as of December 31, 1999. In September 2000 the Group completed the contribution of the capital subscribed in September 1998, with an amount of US$ 108 million, which brought the Group’s holding to 62.6% as of December 2000. As of December 2001, 2002 and 2003, the Group’s holding in BBVA Chile, S.A. was 62.89%, 66.098% and 66.27%, respectively.
F-29
AFP Provida, S.A. (Chile)-
On July 1, 1999, the Group acquired a 41.17% holding in, and assumed the management of, Administradora de Fondos de Pensiones Provida, S.A. This acquisition was undertaken through the issue of 19,780,108 new shares resolved by the Special Shareholders’ Meeting on June 30, 1999. These new shares were exchanged for all the shares of the companies that owned the aforementioned holding in AFP Provida, S.A. (Corp Group Pensions Ltd. and Brookline Investment Ltd.). Also, the Group made further investments in AFP Provida, mainly through the majority subscription to a capital increase carried out by this company in October 1999, which, together with the open-market acquisitions of US$ 11 million in 2001 and US$ 51 million in 2000, brought the Group’s holding as of December 31, 2003, 2002 and 2001, to 64.32%.
Provincial Group (Venezuela)-
In March 1997, the Group acquired 40% of the capital stock of Banco Provincial, S.A. and higher holdings in the other Provincial Group companies, thereby assuming management of the group. Additional acquisitions were made in subsequent years which raised the Bank’s holding in the Provincial Group to 54.98% as of December 31, 2001, 55.53% as of December 31, 2002 and to 55.59% as of December 31, 2003.
Continental Group (Peru)-
In April 1995, the Group acquired a 75% holding in the capital stock of Banco Continental, S.A. through Holding Continental, S.A. Subsequent acquisitions increased the ownership interest in Banco Continental to 81.78% as of December 31, 2001.
On November 26, 2002, BBVA, as the owner of 50% of the capital stock of the Peruvian company Holding Continental, S.A., subscribed to a capital increase at this entity amounting to US$ 10 million. This capital increase will be used to finance the tender offer to acquire the shares of Banco Continental which are not currently held by it (143,713,997 shares) at 1.59 soles per share. On November 27, 2002, Holding Continental, S.A. submitted this transaction to the Lima Stock Exchange and to the related National Companies and Securities Supervisory Commission. The tender offer resulted in the acquisition of 8.84% of the capital stock of Banco Continental. In 2002 Holding Continental and its subsidiaries held 91.51% of the aforementioned Bank. The holding in this company was increased to 92.01% in 2003.
BBVA Banco Ganadero Group (Colombia)-
In August 1996, the Group acquired 40% of the common stock (equal to 35.1% of the total capital) of Banco Ganadero, S.A. (currently BBVA Banco Ganadero, S.A.). In 2000 this entity carried out a major financial restructuring and strengthening process which included a capital increase of approximately US$ 254 million, substantially all of which was subscribed by the Group. This capital increase, together with various additional acquisitions resulting in US$ 14 million of disbursements, raised the Group’s holding in BBVA Banco Ganadero, S.A. to 85.56% as of December 31, 2000. On January 23, 2001, the Bank’s Board of Directors resolved to launch a tender offer to purchase all the shares of BBVA Banco Ganadero, S.A. The tender offer took place on April 9, 2001, and gave rise to a disbursement of US$ 44.4 million and increased the Group’s holding in BBVA Banco Ganadero, S.A. to 95.36%. This percentage of ownership was maintained as of December 31, 2002. As of December 31, 2003, the holding was 95.37%.
BBV Brasil Group-
In August 1998, the Group acquired control of Banco Excel Económico, S.A. (Banco Bilbao Vizcaya Argentaria Brasil, S.A.- BBV Brasil) and acquired substantially all its capital stock by subscribing the full amount of a capital increase carried out by the bank for US$ 853 million.
In addition, as part of the capitalization plan agreed upon with the Brazilian authorities, the Group placed a deposit at BBV Brasil amounting to US$ 700 million, convertible into capital in future years. US$ 31 million of this amount were converted in December 2000 and US$ 46 million were converted in 2001. In 2002 the remaining deposit amount (US$ 623 million) was converted into equity.
F-30
In 2002 the Group decided to reconsider the business model implemented in Brazil. As a result of the new approach, a strategic agreement was reached in that year with Banco Bradesco, S.A., which was executed on January 13, 2003. The main aspects of the agreement are as follows:
| - | Integration of the banking and insurance business of BBVA in Brazil, carried on by BBV Brasil and its subsidiaries, into Banco Bradesco, S.A. through the transfer of all the shares of BBV Brasil owned by BBVA to Banco Bradesco, S.A. |
| - | As a consideration for the transfer of shares, BBVA will receive newly-issued common shares and preferred shares of Banco Bradesco, S.A. representing 4.44% of its capital stock and, additionally, will receive cash amounting to 1,864 million Brazilian reais. |
As of December 31, 2002, the Group recorded the accounting effects of the agreement with a charge of €245,717 thousand to the “Losses on Disposal of Investments in Fully and Proportionally Consolidated Companies” caption in the accompanying consolidated statement of income and a credit to the “Losses at Consolidated Companies Arising from Negative Exchange Differences on Consolidation” caption (Note 24) to eliminate, as required by Bank of Spain regulations, the accumulated negative exchange differences which were recorded against consolidation reserves and arose from the translation of the financial statements of BBV Brasil from the time of its acquisition. The aforementioned entry has no effect on the Group’s net worth. Also, a capital gain of €92,000 thousand was recorded with a credit to the aforementioned caption in the accompanying consolidated statement of income, and a charge to the “Other Assets” caption in the accompanying consolidated balance sheet. Finally, a specific provision of €34,719 thousand was recorded with a charge to the “Extraordinary Losses” caption in the consolidated statement of income (Note 28-g) equal to the theoretical goodwill of the shares of Banco Bradesco, S.A. mentioned above.
Once the related due diligence reviews were completed and the necessary regulators’ approval had been obtained, the agreement was executed on June 9, 2003.
Banco de Crédito Local, S.A.-
At the end of 2000 an agreement was entered into with the Dexia Group to terminate the strategic alliance for the institutional business which Argentaria had with that group. The agreement included the purchase by BBVA of the 40% of Banco de Crédito Local, S.A., owned by the Dexia Group since 1998, which was performed in January 2001 and gave rise to the disbursement of €429,435 thousand, generating goodwill of €298,037 thousand (Note 13).
As of December 31, 2003, the holding was 100%.
Variations in the Group in 2003-
The most significant transactions in 2003 were as follows:
| - | On January 13, 2003, the Group reached an agreement with Banco Bradesco, S.A. whereby the Group sold its banking subsidiary in Brazil and its Brazilian subsidiaries in exchange for 4.44% of its capital stock and cash amounting to 1,864 million Brazilian reais. Banco Bradesco, S.A. is accounted for by the equity method. |
| - | In 2003 the Group companies BBVA Privanza Banco, S.A. and BBVA Bolsa, S.A. were dissolved without liquidation and their assets and liabilities were transferred to Banco Bilbao Vizcaya Argentaria, S.A. |
| - | BBVA, S.A. and Terra Networks, S.A., holders of the 51% and 49% of the share capital of Uno-e Bank, S.A., respectively, in an Extraordinary general Shareholders´ Meeting held on April 23, 2003, unanimously approved (subject to the required approval by Banco de España) an increase of capital in Uno-e Bank, S.A. to be wholly subscribed by Finanzia Banco de Crédito, S.A. (a wholly owned subsidiary of BBVA), through the contribution of its Consumer’s Lending Business. Finanzia Banco de Crédito, S.A. also held in the same day an Extraordinary General Shareholders´ Meeting approving the mentioned contribution and subscription of the increase of capital. |
F-31
The above mentioned increase of capital integrates the Consumer’s Lending Business in Unoe Bank, S.A. and as a result of the referred capital increase, BBVA Group and TERRA hold stakes in Uno-e Bank S.A. share capital of 67% and 33%, respectively.
BBVA entered into an agreement with Terra Networks which gives Terra Networks a liquidity mechanism over its shares in the merger entity, that replaces the liquidity mechanism signed on May 15, 2002. The liquidity mechanism provides Terra Networks the right to sell its stake to BBVA between April 1, 2005 and September 30, 2007 at a price equal to the higher of (i) the market value of the securities as determined by an investment bank, and (ii) the amount obtained by multiplying (a) the after-tax profits of Uno-e Bank, by (b) BBVA’s price/earnings ratio, by (c) the percentage holding in Uno-e Bank that Terra Networks intends to sell. However, in no event can the sale price under (i) or (ii) above be less than €148.5 million if Uno-e Bank does not achieve certain net ordinary revenue and pre-tax income targets. Management estimates that this liquidity mechanism will not have a material impact on the earnings of the Group.
Variations in the Group in 2002-
The most noteworthy transactions in 2002 were as follows:
| - | In 2002 Brunara, S.A., in which the Group has a 14.066% holding, was no longer fully consolidated and was accounted for by the equity method. |
| - | On January 25, 2002, the Group and Grupo Progreso announced the launch of BBVA Crecer AFP, a new pension fund manager for the Dominican Republic market. As of December 31, 2002, BBVA had a 70% holding in this company and Grupo Progreso had the remaining 30% holding. The total investment in 2002 was US$ 3.6 million. |
| - | The sale of all the shares held by BBVA Banco Francés, S.A. in BBVA Uruguay (60.88%) to BBVA for US$ 55 million was formally executed on May 14, 2002, after obtaining authorization from the Central Bank of Uruguay (Note 3-o). As a result of this transaction, the BBVA Group’s ownership interest in BBVA Uruguay rose from 80.658% to 100%. |
Variations in the Group in 2001-
In 2001 the Group obtained income of €31,319 thousand from the sale of holdings. The most noteworthy of these transactions were as follows:
| - | In February 2000, the Group entered into a strategic agreement with Telefónica, S.A., whereby, inter alia, the Telefónica Group acquired a 49% holding in the capital stock of Uno-e Bank, S.A. The agreement was executed on August 2, 2001, when Banco Bilbao Vizcaya Argentaria, S.A. sold 49% of its holding in Uno-e Bank, S.A. to Terra Networks, S.A. |
| - | The Group sold all the shares it held in Banco Bilbao Vizcaya Argentaria Maroc, which generated income of €5,109 thousand. |
| - | Lastly, 80% of Futuro Bolivia, S.A., AFP was sold, generating income of €15,759 thousand. |
(5) DISTRIBUTION OF INCOME
In 2003, the Board of Directors of Banco Bilbao Vizcaya Argentaria, S.A. resolved to pay the shareholders three interim dividends out of 2003 income, amounting to a total of €0.27 gross per share. The aggregate amount of the interim dividends declared as of December 31, 2003, net of the amount collected and to be collected by the consolidable Group companies, was €859,896 thousand and is recorded under the “Other Assets” caption in the
F-32
related consolidated balance sheet (Note 15). The last of the aforementioned interim dividends, which amounts to €0.09 gross per share, paid to the shareholders on January 12, 2004, and was recorded under the “Other Liabilities – Payment Obligations” caption in the accompanying consolidated balance sheet as of December 31, 2003 (Note 15).
The projected 2003 accounting statements prepared by Banco Bilbao Vizcaya Argentaria, S.A. in accordance with legal requirements, disclosing the existence of sufficient liquidity for distribution of the interim dividends, were as follows:
| | | | | | | | |
| | | Thousands of Euros
| |
| | | 05-31-03
| | 08-31-03
| | | 11-30-03
| |
| | | First
| | Second
| | | Third
| |
Interim dividend- | | | | | | | | |
| | | |
Income at each of the stated dates, after the provision for corporate income tax | | 463,187 | | 1,090,843 | | | 1,427,397 | |
Less- | | | | | | | | |
Interim dividends distributed | | — | | (287,627 | ) | | (575,254 | ) |
| | |
| |
|
| |
|
|
Maximum amount of possible distribution | | 463,187 | | 803,216 | | | 852,143 | |
| | |
| |
|
| |
|
|
Proposed amount of interim dividend | | 287,627 | | 287,627 | | | 287,626 | |
| | |
| |
|
| |
|
|
The Bank’s Board of Directors will propose to the Shareholders’ Meeting that a final dividend of €0.114 per share be paid out of 2003 income. Based on the number of shares representing the capital stock as of December 31, 2003 (Note 23), the final dividend would amount to €364,327 thousand and income would be distributed as follows:
| | |
| | | Thousands of Euros
|
2003 net income (Note 4) | | 1,460,337 |
| | |
|
Allocation to: | | |
Dividends (Note 2-d) | | |
- Interim dividend | | 826,880 |
- Final dividend | | 364,327 |
Voluntary reserves | | 233,130 |
Notwithstanding the above, at its meeting on February 3, 2004, at which these consolidated financial statements were prepared, the Board of Directors of BBVA resolved, inter alia, to increase capital by a nominal amount of €95,550,000 through the issuance of 195,000,000 ordinary shares of €0.49 par value each, of the same class and series, traded by the book-entry trading system. Article 161.1 of the Spanish Corporations Law provides for the possibility of the capital increase not being fully subscribed (Note 32).
The new shares will entitle their owners to share in any distribution of dividends paid after the capital increase is registered in Iberclear’s accounting records, and in assets in the event of liquidation. As regards the dividend to be paid out of 2003 income, holders of the new shares will only be entitled to receive the amount of any final dividend, if any, that the Shareholders’ Meeting resolves to declare, if the shares are issued prior to the date of this Shareholders’ Meeting. If the capital increase has been subscribed and paid as of the date of the Shareholders’ Meeting, the proposed distribution of income shown above will be adjusted on the basis of the new shares issued so that the amount earmarked for dividends is increased by the amount necessary for the final 2003 dividend on all the shares issued and subscribed to be €0.114 per share, and that amount, up to a limit of €22,230 thousand, will be subtracted from the amount initially assigned to “Voluntary Reserves”, as shown in the foregoing table, based on the maximum number of shares shown above.
F-33
(6) GOVERNMENT DEBT SECURITIES
The balances of this caption in the accompanying consolidated balance sheets are made up as follows:
| | | | | | | | | | | | | | |
| | | Thousands of Euros
|
| | | 2003
| | 2002
| | 2001
|
| | | Book Value
| | Market
Value
| | Book Value
| | | Market
Value
| | Book Value
| | | Market
Value
|
Fixed-income portfolio: | | | | | | | | | | | | | | |
Held-to-maturity portfolio- | | | | | | | | | | | | | | |
Listed government debt securities | | 613,946 | | 652,625 | | 1,880,783 | | | 1,983,010 | | 2,271,905 | | | 2,381,703 |
| | |
| |
| |
|
| |
| |
|
| |
|
Available-for-sale portfolio- | | | | | | | | | | | | | | |
Treasury bills | | 601,300 | | 601,101 | | 1,145,563 | | | 1,146,566 | | 6,502,073 | | | 6,526,390 |
Other listed book-entry debt securities | | 12,092,631 | | 12,275,181 | | 9,243,858 | | | 9,538,272 | | 8,914,018 | | | 9,088,884 |
Other listed securities | | 21,562 | | 21,651 | | 24,784 | | | 27,219 | | 75,433 | | | 79,514 |
| | |
| |
| |
|
| |
| |
|
| |
|
| | | 12,715,493 | | 12,897,933 | | 10,414,205 | | | 10,712,057 | | 15,491,524 | | | 15,694,788 |
Less- | | | | | | | | | | | | | | |
Securities revaluation reserve (Note 2-f) | | — | | — | | (34 | ) | | — | | (6 | ) | | — |
| | |
| |
| |
|
| |
| |
|
| |
|
| | | 12,715,493 | | 12,897,933 | | 10,414,171 | | | 10,712,057 | | 15,491,518 | | | 15,694,788 |
| | |
| |
| |
|
| |
| |
|
| |
|
Trading portfolio- | | | | | | | | | | | | | | |
Treasury bills | | 4,804,191 | | 4,804,191 | | 4,697,945 | | | 4,697,945 | | 3,113 | | | 3,113 |
Other book-entry debt securities | | 811,373 | | 811,373 | | 2,774,877 | | | 2,774,877 | | 2,398,833 | | | 2,398,833 |
| | |
| |
| |
|
| |
| |
|
| |
|
| | | 5,615,564 | | 5,615,564 | | 7,472,822 | | | 7,472,822 | | 2,401,946 | | | 2,401,946 |
| | |
| |
| |
|
| |
| |
|
| |
|
| | | 18,945,003 | | 19,166,122 | | 19,767,776 | | | 20,167,889 | | 20,165,369 | | | 20,478,437 |
| | |
| |
| |
|
| |
| |
|
| |
|
In 2003, 2002 and 2001, securities amounting to €717,080 thousand, €1,811,502 thousand and €3,106,078 thousand, respectively, were transferred from the trading portfolio to the available-for-sale portfolio at market prices.
The acquisition cost of securities assigned to the trading portfolio amounted to €5,610,704 thousand, €7,378,856 thousand and €2,403,315 thousand as of December 31, 2003, 2002 and 2001, respectively.
The variations in 2003, 2002 and 2001 in the balance of this caption in the accompanying consolidated balance sheet were as follows:
| | | |
| | | Thousands of Euros
| |
Balance at January 1, 2001 | | 14,735,194 | |
| | |
|
|
Purchases | | 77,638,046 | |
Sales | | (69,403,453 | ) |
Redemptions | | (2,796,263 | ) |
Other | | (8,155 | ) |
| | |
|
|
Balance at year-end 2001 | | 20,165,369 | |
| | |
|
|
Purchases | | 67,115,695 | |
Sales | | (63,935,970 | ) |
Redemptions | | (3,634,226 | ) |
Other | | 56,908 | |
| | |
|
|
Balance at year-end 2002 | | 19,767,776 | |
| | |
|
|
Purchases | | 58,753,072 | |
Sales | | (52,778,298 | ) |
Redemptions | | (6,753,702 | ) |
Other | | (43,845 | ) |
| | |
|
|
Balance at year-end 2003 | | 18,945,003 | |
| | |
|
|
F-34
The average annual interest rate on Treasury bills in 2003 was 2.11% (2.82% in 2002 and 4.58% in 2001). As of December 31, 2003, 2002 and 2001, €5,282,381 thousand, €5,991,369 thousand and €5,316,944 thousand, respectively (effective amount), of these assets and of those acquired under resale agreement from credit institutions (Note 7) and from customers (Note 8) had been sold under repurchase agreement by the Group to other financial intermediaries (Note 17) and to customers (Note 18).
The nominal interest rates on listed government debt securities ranged from 10.15% to 3.20% at 2003 year end (from 10.9% to 3.25% at 2002 year end and from 11.37% to 3% at 2001 year end). As of December 31, 2003, 2002 and 2001, €17,980,643 thousand, €15,185,661 thousand and €15,864,021 thousand (effective amount) respectively of these securities and of those acquired under resale agreement from credit institutions (Note 7) and from customers (Note 8) had been sold under repurchase agreement by the Group to the Bank of Spain and other financial intermediaries (Note 17) and to customers (Note 18).
The breakdown of this caption, by maturity, as of December 31, 2003, 2002 and 2001, disregarding the securities revaluation reserve, is as follows:
| | | | | | | | |
| | | Thousands of Euros
|
| | | Up to 3 Months
| | 3 Months to 1 Year
| | 1 to 5 Years
| | Over 5 Years
|
Balances at December 31, 2003- | | | | | | | | |
Fixed-income portfolio: | | | | | | | | |
Held-to-maturity portfolio | | — | | — | | — | | 613,946 |
Available-for-sale portfolio | | 15,775 | | 1,652,458 | | 9,367,609 | | 1,679,651 |
Trading portfolio | | 773,089 | | 2,860,267 | | 1,571,849 | | 410,359 |
| | |
| |
| |
| |
|
| | | 788,864 | | 4,512,725 | | 10,939,458 | | 2,703,956 |
| | |
| |
| |
| |
|
Balances at December 31, 2002- | | | | | | | | |
Fixed-income portfolio: | | | | | | | | |
Held-to-maturity portfolio | | — | | 1,264,802 | | — | | 615,981 |
Available-for-sale portfolio | | 1,492,066 | | 2,478,865 | | 4,926,042 | | 1,517,232 |
Trading portfolio | | 520,045 | | 3,018,011 | | 2,423,940 | | 1,510,826 |
| | |
| |
| |
| |
|
| | | 2,012,111 | | 6,761,678 | | 7,349,982 | | 3,644,039 |
| | |
| |
| |
| |
|
Balances at December 31, 2001- | | | | | | | | |
Fixed-income portfolio: | | | | | | | | |
Held-to-maturity portfolio | | 376,515 | | — | | 1,277,361 | | 618,029 |
Available-for-sale portfolio | | 1,329,025 | | 3,069,565 | | 6,426,546 | | 4,666,388 |
Trading portfolio | | 581,161 | | 184,457 | | 634,885 | | 1,001,443 |
| | |
| |
| |
| |
|
| | | 2,286,701 | | 3,254,022 | | 8,338,792 | | 6,285,860 |
| | |
| |
| |
| |
|
F-35
(7) DUE FROM CREDIT INSTITUTIONS
The breakdown of the balances of this caption in the accompanying consolidated balance sheets, by currency and type, is as follows:
| | | | | | | | | |
| | | Thousands of Euros
| |
| | | 2003
| | | 2002
| | | 2001
| |
By currency: | | | | | | | | | |
In euros | | 9,002,257 | | | 6,752,842 | | | 8,752,036 | |
In foreign currencies | | 11,904,872 | | | 14,723,437 | | | 14,446,720 | |
| | |
|
| |
|
| |
|
|
| | | 20,907,129 | | | 21,476,279 | | | 23,198,756 | |
| | |
|
| |
|
| |
|
|
By type: | | | | | | | | | |
Current accounts- | | | | | | | | | |
Current accounts | | 237,564 | | | 348,420 | | | 284,784 | |
Other accounts | | 406,423 | | | 1,029,288 | | | 2,358,426 | |
| | |
|
| |
|
| |
|
|
| | | 643,987 | | | 1,377,708 | | | 2,643,210 | |
Other- | | | | | | | | | |
Deposits at credit and financial institutions | | 8,462,098 | | | 11,169,447 | | | 9,647,849 | |
Assets acquired under resale agreement (Notes 6, 8, 17 and 18) | | 10,659,685 | | | 8,301,701 | | | 10,694,548 | |
Other accounts | | 1,312,599 | | | 750,210 | | | 351,682 | |
| | |
|
| |
|
| |
|
|
| | | 20,434,382 | | | 20,221,358 | | | 20,694,079 | |
Less- | | | | | | | | | |
Loan loss provisions (Notes 2-f, 3-c and 8) | | (5,582 | ) | | (5,439 | ) | | (34,714 | ) |
Country-risk provisions (Notes 2-f, 3-c and 8) | | (165,658 | ) | | (117,348 | ) | | (103,819 | ) |
| | |
|
| |
|
| |
|
|
| | | 20,907,129 | | | 21,476,279 | | | 23,198,756 | |
| | |
|
| |
|
| |
|
|
As of December 31, 2003, 2002 and 2001, the foregoing “Country-Risk Provisions” account included €162,321 thousand, €93,322 thousand and €98,548 thousand, respectively, relating to provisions recorded to cover intercompany country-risk positions at credit institutions (Notes 2-c and 3-c).
The detail, by maturity, of the balances of the “Due from Credit Institutions - Other” caption (except for “Other Accounts”) in the accompanying consolidated balance sheets, disregarding the loan loss and country risk provisions, and the average interest rates for each year are as follows:
| | | | | | | | | | | |
| | | Thousands of Euros
| | Average
Interest Rate
in the Year
| |
| | | Up to 3 Months
| | 3 Months to 1 Year
| | 1 to 5 Years
| | Over 5 Years
| |
Balances at December 31, 2003- | | | | | | | | | | | |
Deposits at credit and financial institutions | | 7,118,241 | | 863,375 | | 356,845 | | 123,637 | | 4.9 | % |
Assets acquired under resale agreement | | 10,576,517 | | 83,168 | | — | | — | | 4.6 | % |
| | |
| |
| |
| |
| | | |
| | | 17,694,758 | | 946,543 | | 356,845 | | 123,637 | | | |
| | |
| |
| |
| |
| | | |
Balances at December 31, 2002- | | | | | | | | | | | |
Deposits at credit and financial institutions | | 10,205,195 | | 842,615 | | 75,910 | | 45,727 | | 4.2 | % |
Assets acquired under resale agreement | | 4,664,761 | | 1,623,713 | | 2,013,134 | | 93 | | 6.6 | % |
| | |
| |
| |
| |
| | | |
| | | 14,869,956 | | 2,466,328 | | 2,089,044 | | 45,820 | | | |
| | |
| |
| |
| |
| | | |
Balances at December 31, 2001- | | | | | | | | | | | |
Deposits at credit and financial institutions | | 7,464,116 | | 1,908,679 | | 217,918 | | 57,136 | | 5.3 | % |
Assets acquired under resale agreement | | 10,574,970 | | 119,578 | | — | | — | | 5.4 | % |
| | |
| |
| |
| |
| | | |
| | | 18,039,086 | | 2,028,257 | | 217,918 | | 57,136 | | | |
| | |
| |
| |
| |
| | | |
F-36
(8) TOTAL NET LENDING
The detail, by currency and borrower sector, of the balances of this caption in the accompanying consolidated balance sheets is as follows:
| | | | | | | | | |
| | | Thousands of Euros
| |
| | | 2003
| | | 2002
| | | 2001
| |
By currency: | | | | | | | | | |
In euros | | 120,152,594 | | | 106,589,553 | | | 98,982,084 | |
In foreign currencies | | 28,674,680 | | | 34,725,459 | | | 51,237,736 | |
| | |
|
| |
|
| |
|
|
| | | 148,827,274 | | | 141,315,012 | | | 150,219,820 | |
| | |
|
| |
|
| |
|
|
By sector: | | | | | | | | | |
Public sector | | 13,403,575 | | | 12,561,840 | | | 12,195,701 | |
Agriculture | | 1,056,589 | | | 698,161 | | | 533,339 | |
Industrial | | 11,991,104 | | | 11,970,286 | | | 11,377,851 | |
Real estate and construction | | 14,823,377 | | | 13,651,669 | | | 12,767,362 | |
Trade and finance | | 12,742,051 | | | 9,336,199 | | | 8,676,667 | |
Loans to individuals | | 44,159,656 | | | 38,514,900 | | | 36,105,108 | |
Lease | | 4,159,904 | | | 3,216,394 | | | 2,684,525 | |
Other | | 13,332,683 | | | 12,923,030 | | | 10,899,947 | |
| | |
|
| |
|
| |
|
|
Total resident borrowers | | 115,668,939 | | | 102,872,479 | | | 95,240,500 | |
| | |
|
| |
|
| |
|
|
Non-resident sector | | 37,601,874 | | | 43,540,228 | | | 60,907,023 | |
| | |
|
| |
|
| |
|
|
Europe | | 8,266,581 | | | 7,453,873 | | | 8,636,490 | |
USA | | 3,126,236 | | | 772,262 | | | 1,052,007 | |
Latin America | | 25,070,254 | | | 31,335,166 | | | 46,382,514 | |
Other countries | | 1,138,803 | | | 3,978,927 | | | 4,836,012 | |
Less- | | | | | | | | | |
Loan loss provisions (Notes 2-f and 3-c) | | (4,001,896 | ) | | (4,771,009 | ) | | (5,715,979 | ) |
Country-risk provisions (Notes 2-f and 3-c) | | (441,643 | ) | | (326,686 | ) | | (211,724 | ) |
| | |
|
| |
|
| |
|
|
| | | 148,827,274 | | | 141,315,012 | | | 150,219,820 | |
| | |
|
| |
|
| |
|
|
F-37
The detail, by maturity, loan type and status, of this caption in the accompanying consolidated balance sheets, disregarding the balance of the “Loan Loss Provisions” and “Country-Risk Provisions” accounts in the foregoing detail, is as follows:
| | | | | | |
| | | Thousands of Euros
|
| | | 2003
| | 2002
| | 2001
|
By maturity: | | | | | | |
Up to 3 months | | 35,213,097 | | 39,559,494 | | 45,470,250 |
3 months to 1 year | | 27,869,528 | | 22,308,438 | | 25,519,364 |
1 to 5 years | | 37,875,262 | | 37,365,648 | | 34,911,609 |
Over 5 years | | 52,312,926 | | 47,179,127 | | 50,246,300 |
| | |
| |
| |
|
| | | 153,270,813 | | 146,412,707 | | 156,147,523 |
| | |
| |
| |
|
By loan type and status: | | | | | | |
Commercial bills | | 9,649,948 | | 9,326,491 | | 11,051,537 |
Financial bills | | 34,261 | | 29,154 | | 55,931 |
Secured loans | | 64,008,734 | | 57,590,451 | | 56,485,533 |
Assets acquired under resale agreement (Notes 6, 7, 17 and 18) | | 1,826,238 | | 318,107 | | 406,782 |
Other term loans | | 64,335,445 | | 66,332,030 | | 74,465,447 |
Demand and other loans | | 5,969,772 | | 5,303,066 | | 7,350,174 |
Financial leases | | 4,773,894 | | 4,040,129 | | 3,657,087 |
Nonperforming loans | | 2,672,521 | | 3,473,279 | | 2,675,032 |
| | |
| |
| |
|
| | | 153,270,813 | | 146,412,707 | | 156,147,523 |
| | |
| |
| |
|
The variations in 2003, 2002 and 2001 in the balance of the “Nonperforming Loans” caption included under this heading in the accompanying consolidated balance sheets were as follows:
| | | | | | | | | |
| | | Thousand of Euros
| |
| | | 2003
| | | 2002
| | | 2001
| |
Beginning balance | | 3,473,279 | | | 2,675,032 | | | 2,798,861 | |
| | |
|
| |
|
| |
|
|
Additions | | 2,394,975 | | | 4,275,505 | | | 3,830,127 | |
Recoveries | | (1,632,605 | ) | | (1,773,530 | ) | | (2,108,562 | ) |
Transfers to bad debts | | (1,252,221 | ) | | (889,913 | ) | | (1,845,394 | ) |
Exchange differences and other | | (310,907 | ) | | (813,815 | ) | | — | |
| | |
|
| |
|
| |
|
|
Ending balance | | 2,672,521 | | | 3,473,279 | | | 2,675,032 | |
| | |
|
| |
|
| |
|
|
As of December 31, 2003, 2002 and 2001, the face amount of the assets, basically loans, credits and securities pledged as security for own and third-party obligations, amounted to €17,367,909 thousand, €18,190,848 thousand and €11,200,566 thousand, respectively, and related basically to the pledge of certain assets as security for financing facilities with the Bank of Spain (Note 17) and to a portion of the assets assigned to mortgage bond issues which, pursuant to the Mortgage Market Law are admitted as security for obligations to third parties.
As of December 31, 2003, 2002 and 2001, there were no loans to customers without fixed maturity dates.
As of December 31, 2003, 2002 and 2001, €2,586,891 thousand, €2,910,899 thousand and €3,328,692 thousand, respectively, of loans were transferred to securitization funds.
Assets under financial lease contracts are reflected in the “Financial Leases” account in the foregoing detail at the principal amount of the unmatured lease payments, plus the residual value applicable for purchase option purposes, excluding financial charges and VAT.
As of December 31, 2003, 2002 and 2001, the outstanding amounts of the loans granted to employees and customers for the acquisition of shares of Banco Bilbao Vizcaya Argentaria, S.A. were €13,269 thousand, €17,286 thousand and €107,605 thousand, respectively.
F-38
The advances and loans granted to Bank directors as of December 31, 2003, 2002 and 2001, totaled € 261 thousand, €1,099 thousand and €6,091 thousand, respectively, and earned annual interest between 4% and 5%. As of December 31, 2002, no guarantees had been provided for them. As of December 31, 2001, the guarantees provided for directors amounted to €142 thousand.
The variations in 2003, 2002 and 2001 in the overall balance of the “Loan Loss Provisions” and “Country-Risk Provisions” accounts in the above detail and of the provisions allocated to credit institutions (Note 7) and to fixed-income securities (Note 9) were as follows:
| | | | | | | | | |
| | | Thousands of Euros
| |
| | | 2003
| | | 2002
| | | 2001
| |
Beginning balance | | 5,345,883 | | | 6,320,008 | | | 8,155,054 | |
| | |
|
| |
|
| |
|
|
Net charge for the year: | | | | | | | | | |
Nonperforming loan provision | | 1,401,414 | | | 1,889,927 | | | 2,216,479 | |
Country-risk provision (Note 2-c) | | 258,762 | | | 286,195 | | | 77,146 | |
Reversals | | (317,130 | ) | | (433,964 | ) | | (293,588 | ) |
| | |
|
| |
|
| |
|
|
| | | 1,343,046 | | | 1,742,158 | | | 2,000,037 | |
| | | |
Variations in the consolidable Group (Note 4) | | (75,389 | ) | | (1,861 | ) | | 11,942 | |
Transfer from (to) loan writeoffs | | (1,062,758 | ) | | (1,333,611 | ) | | (1,872,345 | ) |
Transfer to foreclosed asset provisions (Note 14) | | (11,410 | ) | | (8,156 | ) | | (8,105 | ) |
Other variations: | | | | | | | | | |
Exchange differences | | (710,514 | ) | | (1,441,192 | ) | | 715,277 | |
Use of the specific FOBAPROA promissory note Fund | | — | | | — | | | (3,259,265 | ) |
Transfer to provision for off-balance-sheet risks (Note 20) | | 62,275 | | | (86,278 | ) | | (38,664 | ) |
Provision recorded for the exchange of fixed-income securities for secured loans in Argentina (Note 3-o) (*) | | — | | | — | | | 434,874 | |
Other | | (155,248 | ) | | 154,815 | | | 181,203 | |
| | |
|
| |
|
| |
|
|
Ending balance | | 4,735,885 | | | 5,345,883 | | | 6,320,008 | |
| | |
|
| |
|
| |
|
|
| (*) | As of December 31, 2002, this amount was recorded in the “Exchange Differences” (€301,224 thousand) and “Transfer to Loan Writeoffs” (€133,650 thousand) accounts. |
The €227,179 thousand, €207,677 thousand and €287,735 thousand of written-off loans recovered in 2003, 2002 and 2001, respectively are presented net of the balances of the “Net Loan Loss Provisions” caption in the accompanying consolidated statements of income. This caption also includes the write offs of loans classified as bad debts, which amounted to €161,079 thousand in 2003, €208,857 thousand in 2002 and €206,928 thousand in 2001.
The detail of the total risk exposure as of December 31, 2003, 2002 and 2001, to third parties outside the Group in countries experiencing differing degrees of debt-servicing difficulty (country-risk) and of the provisions recorded for coverage thereof, which are included in the loan loss provisions (Note 3-c), is as follows:
| | | | | | | | | |
| | | Thousands of Euros
| |
| | | 2003
| | | 2002
| | | 2001
| |
Country-risk | | 926,700 | | | 1,046,687 | | | 1,404,722 | |
Provision recorded (*) | | 613,140 | | | 482,719 | | | 493,942 | |
% of coverage | | 66.2 | % | | 46.1 | % | | 35.2 | % |
| (*) | €447,443 thousand, €353,264 thousand and €218,605 thousand of these amounts as of December 31, 2003, 2002 and 2001, respectively, were recorded in the “Country-Risk Provision” account. The remaining amounts were recorded in the “Specific Risk Provision” account. |
F-39
The country-risk amount as of December 31, 2003, 2002 and 2001, does not include assets for which insurance policies have been taken out with third parties that include coverage of the risk of confiscation, expropriation, nationalization, nontransfer, nonconvertibility and, if appropriate, war and political violence. The sum insured as of December 31, 2003, 2002 and 2001, amounted to US$ 466 million, US$ 584 million and US$ 555 million, respectively (approximately €369 million, €557 million and €629 million).
Also, pursuant to current Bank of Spain regulations, the provision for off-balance-sheet risk losses, recorded under the “Provisions for Contingencies and Expenses - Other Provisions” caption (Notes 2-f and 20) on the liability side of the accompanying consolidated balance sheets amounted to €209,270, €271,545 thousand and €185,268 thousand, respectively, as of December 31, 2003, 2002 and 2001.
(9) DEBENTURES AND OTHER DEBT SECURITIES
The breakdown, by currency, issuer sector, listing status and type, of the balances of this caption in the accompanying consolidated balance sheets, is as follows:
| | | | | | | | | |
| | | Thousands of Euros
| |
| | | 2003
| | | 2002
| | | 2001
| |
By currency: | | | | | | | | | |
In euros | | 24,201,930 | | | 18,785,929 | | | 22,570,025 | |
In foreign currencies | | 28,734,036 | | | 30,347,250 | | | 39,080,913 | |
| | |
|
| |
|
| |
|
|
| | | 52,935,966 | | | 49,133,179 | | | 61,650,938 | |
| | |
|
| |
|
| |
|
|
By type: | | | | | | | | | |
Held-to-maturity portfolio | | 510,709 | | | 522,077 | | | 596,769 | |
Available-for-sale portfolio | | 32,410,725 | | | 28,914,106 | | | 41,805,296 | |
Trading portfolio | | 20,014,532 | | | 19,696,996 | | | 19,248,873 | |
| | |
|
| |
|
| |
|
|
| | | 52,935,966 | | | 49,133,179 | | | 61,650,938 | |
| | |
|
| |
|
| |
|
|
By sector: | | | | | | | | | |
Resident public sector | | 1,174,997 | | | 1,436,106 | | | 1,351,886 | |
Resident credit institutions | | 457,427 | | | 258,027 | | | 459,373 | |
Other resident sectors | | 2,481,168 | | | 2,441,327 | | | 2,468,122 | |
Other non-resident sectors | | 49,017,438 | | | 45,125,706 | | | 57,628,725 | |
Europe | | 20,670,609 | | | 14,629,779 | | | 18,622,973 | |
USA | | 5,161,076 | | | 2,905,029 | | | 2,533,603 | |
Latin America | | 22,324,498 | | | 26,765,261 | | | 35,257,299 | |
Other countries | | 861,255 | | | 825,637 | | | 1,214,850 | |
Less- | | | | | | | | | |
Securities revaluation reserve (Note 2-f) | | (73,958 | ) | | (2,586 | ) | | (3,396 | ) |
Loan loss and country-risk provisions (Notes 2-f, 3-c and 8) | | (121,106 | ) | | (125,401 | ) | | (253,772 | ) |
| | |
|
| |
|
| |
|
|
| | | 52,935,966 | | | 49,133,179 | | | 61,650,938 | |
| | |
|
| |
|
| |
|
|
By listing status: | | | | | | | | | |
Listed | | 46,264,545 | | | 37,955,161 | | | 45,144,591 | |
Unlisted | | 6,671,421 | | | 11,178,018 | | | 16,506,347 | |
| | |
|
| |
|
| |
|
|
| | | 52,935,966 | | | 49,133,179 | | | 61,650,938 | |
| | |
|
| |
|
| |
|
|
F-40
The breakdown, by maturity, of the balance of the fixed-income portfolio classified as available-for-sale and held-to-maturity in the accompanying consolidated balance sheets, disregarding the “Securities Revaluation Reserve” and the “Loan Loss and Country-Risk Provisions” accounts in the foregoing detail in 2003, is as follows:
| | | | | | |
| | | Thousands of Euros
|
| | | Up to 1 Year
| | 1 to 5 Years
| | Over 5 Years
|
Balances at December 31, 2003- | | | | | | |
Fixed-income portfolio: | | | | | | |
Held-to-maturity portfolio | | 10,361 | | 442,771 | | 57,577 |
Available-for-sale portfolio | | 3,352,499 | | 15,337,545 | | 13,915,745 |
| | |
| |
| |
|
| | | 3,362,860 | | 15,780,316 | | 13,973,322 |
| | |
| |
| |
|
Balances at December 31, 2002- | | | | | | |
Fixed-income portfolio: | | | | | | |
Held-to-maturity portfolio | | 10,355 | | 432,307 | | 79,415 |
Available-for-sale portfolio | | 4,224,678 | | 10,960,229 | | 13,729,199 |
| | |
| |
| |
|
| | | 4,235,033 | | 11,392,536 | | 13,808,614 |
| | |
| |
| |
|
Balances at December 31, 2001- | | | | | | |
Fixed-income portfolio: | | | | | | |
Held-to-maturity portfolio | | 74,755 | | 355,701 | | 166,313 |
Available-for-sale portfolio | | 9,624,030 | | 22,233,218 | | 9,948,048 |
| | |
| |
| |
|
| | | 9,698,785 | | 22,588,919 | | 10,114,361 |
| | |
| |
| |
|
In 2003 securities in the trading portfolio amounting to €893,242 thousand (€1,054,336 thousand in 2002) were transferred to the available-for-sale portfolio at market prices.
The acquisition cost of the securities assigned to the trading portfolio was €19,870,277 thousand as of December 31, 2003 (€19,598,881 thousand as of December 31, 2002 and €19,278,581 thousand as of December 31, 2001).
As of December 31, 2003, 2002 and 2001, the market value of the debentures and other debt securities included in the available-for-sale portfolio amounted to €32,590,300 thousand, €28,971,860 thousand and €41,774,037 thousand, respectively.
The market value of the securities assigned to the held-to-maturity portfolio amounted €542,590 thousand, €561,760 thousand and €648,306 thousand as of December 31, 2003, 2002 and 2001, respectively.
As of December 31, 2003, the face value of the securities which were securing financing lines assigned by the Bank of Spain and other central banks amounted to €12,231,516 thousand (€7,091,312 thousand as of December 31, 2002).
As of December 31, 2003, 2002 and 2001, a portion of the debt securities on hand had been sold under repurchase agreement basically to private-sector depositors and is recorded under the “Deposits - Other Deposits” caption in the accompanying consolidated balance sheets (Note 18).
The balance of the “Available-for-Sale Portfolio - Other Nonresident Sectors” caption includes promissory notes issued by the Banking Fund for the Protection of Savings (FOBAPROA) in Mexico, now the Banking Institute for the Protection of Savings (IPAB). These promissory notes arose as part of the measures adopted by the Mexican government as a result of the banking crisis suffered due to the economic situation in Mexico at the end of 1994 and in 1995. Under certain regulations, the banks transferred to the Mexican government a portion of the loan portfolio with payment difficulties. These transactions were structured as a transfer of future rights to the flows generated by the loans. In exchange for these rights, the credit institutions received nontransferable FOBAPROA promissory notes of an amount equal to the net book value (net of the provisions) of the assets subject to the scheme. As of December 31, 2003, 2002 and 2001, these promissory notes amounted to €9,030,338 thousand, €11,173,894 thousand and €15,661,263 thousand, respectively. The promissory notes earn capitalizable interest and are payable through maturity in 2005. The interest on these promissory notes is recorded under the “Financial Revenues” caption in the accompanying consolidated statements of income. In accordance with the terms established in the agreements with FOBAPROA, Grupo Financiero BBVA Bancomer is responsible for 25% of the losses arising from the difference between the amount of the FOBAPROA promissory notes at the commencement of the transaction plus the accumulated accrued interest and the recoveries of the loans subject to the program. This contingency was written off.
F-41
The variations in 2003, 2002 and 2001 in the balances of this caption in the accompanying consolidated balance sheets, disregarding the “Securities Revaluation Reserve” and the “Loan Loss Provisions”, were as follows:
| | | | | | | | | |
| | | Thousands of Euros
| �� |
| | | 2003
| | | 2002
| | | 2001
| |
Beginning balance | | 49,261,166 | | | 61,908,106 | | | 60,642,296 | |
| | |
|
| |
|
| |
|
|
Purchases | | 5,705,603,539 | | | 6,215,765,285 | | | 4,995,049,443 | |
Sales and redemptions | | (5,685,935,563 | ) | | (6,220,035,030 | ) | | (4,987,490,780 | ) |
Transfers and other | | (15,798,112 | ) | | (8,377,195 | ) | | (6,292,843 | ) |
| | |
|
| |
|
| |
|
|
Ending balance | | 53,131,030 | | | 49,261,166 | | | 61,908,106 | |
| | |
|
| |
|
| |
|
|
The variations in the balance of the “Securities Revaluation Reserve” account in 2003, 2002 and 2001 were as follows:
| | | | | | | | |
| | | Thousands of Euros
| |
| | | 2003
| | 2002
| | | 2001
| |
Beginning balance | | 2,586 | | 3,396 | | | 48,706 | |
| | |
| |
|
| |
|
|
Provisions with a charge to asset accrual accounts (Note 3-d) | | 69,687 | | — | | | — | |
Transfers and other | | 1,685 | | (810 | ) | | (45,310 | ) |
| | |
| |
|
| |
|
|
Ending balance | | 73,958 | | 2,586 | | | 3,396 | |
| | |
| |
|
| |
|
|
(10) COMMON STOCKS AND OTHER EQUITY SECURITIES
This caption in the accompanying consolidated balance sheets includes the shares of companies generally less than 20% owned (less than 3% if listed), and units in mutual funds. The detail of the balances of this caption, by currency and listing status, is as follows:
| | | | | | | | | |
| | | Thousands of Euros
| |
| | | 2003
| | | 2002
| | | 2001
| |
By currency: | | | | | | | | | |
In euros | | 2,390,882 | | | 1,986,299 | | | 2,357,074 | |
In foreign currencies | | 701,182 | | | 1,021,193 | | | 1,316,625 | |
| | |
|
| |
|
| |
|
|
| | | 3,092,064 | | | 3,007,492 | | | 3,673,699 | |
| | |
|
| |
|
| |
|
|
By type: | | | | | | | | | |
Available-for-sale portfolio | | 1,062,650 | | | 2,075,564 | | | 2,641,419 | |
Trading portfolio | | 2,029,414 | | | 931,928 | | | 1,032,280 | |
| | |
|
| |
|
| |
|
|
| | | 3,092,064 | | | 3,007,492 | | | 3,673,699 | |
| | |
|
| |
|
| |
|
|
By listing status: | | | | | | | | | |
Listed | | 2,541,383 | | | 2,447,460 | | | 2,435,746 | |
Unlisted | | 622,334 | | | 800,758 | | | 1,391,608 | |
Less- | | | | | | | | | |
Securities revaluation reserve (Notes 2-f and 3-e) | | (71,653 | ) | | (240,726 | ) | | (153,655 | ) |
| | |
|
| |
|
| |
|
|
| | | 3,092,064 | | | 3,007,492 | | | 3,673,699 | |
| | |
|
| |
|
| |
|
|
F-42
The variations in 2003, 2002 and 2001 in the balances of this caption in the accompanying consolidated balance sheets, disregarding the securities revaluation reserve, were as follows:
| | | | | | | | | |
| | | Thousands of Euros
| |
| | | 2003
| | | 2002
| | | 2001
| |
Beginning balance | | 3,248,218 | | | 3,827,354 | | | 3,154,171 | |
| | |
|
| |
|
| |
|
|
Purchases | | 12,093,943 | | | 16,582,585 | | | 15,656,407 | |
Sales | | (12,082,488 | ) | | (16,336,109 | ) | | (15,853,984 | ) |
Other | | (95,956 | ) | | (825,612 | ) | | 870,760 | |
| | |
|
| |
|
| |
|
|
Ending balance | | 3,163,717 | | | 3,248,218 | | | 3,827,354 | |
| | |
|
| |
|
| |
|
|
Exhibit IV lists the Group’s direct or indirect acquisitions of holdings in companies, the percentages of ownership acquired net of subsequent sales, and the notification dates thereof, in compliance with the provisions of Article 86 of the Corporations Law and Article 53 of Securities Market Law 24/1988.
As of December 31, 2003, 2002 and 2001, the market value of the shares and other equity securities included under this caption exceeded their book value by €104,680 thousand, €125,789 thousand and €77,645 thousand, respectively.
The acquisition cost of the securities assigned to the trading portfolio amounted to €1,943,149 thousand as of December 31, 2003, and €942,194 thousand as of December 31, 2002. As of December 31, 2001, the book value of the securities in the trading portfolio did not significantly differ from their acquisition cost.
The variations in the balances of the “Securities Revaluation Reserve” account in 2003, 2002 and 2001 were as follows:
| | | | | | | | | |
| | | Thousands of Euros
| |
| | | 2003
| | | 2002
| | | 2001
| |
Beginning balance | | 240,726 | | | 153,655 | | | 115,472 | |
| | |
|
| |
|
| |
|
|
Net charge for the year | | (33,252 | ) | | 161,794 | | | (12,665 | ) |
Amount used | | (136,187 | ) | | (62,143 | ) | | (5,998 | ) |
Transfer and other | | 366 | | | (12,580 | ) | | 56,846 | |
| | |
|
| |
|
| |
|
|
Ending balance | | 71,653 | | | 240,726 | | | 153,655 | |
| | |
|
| |
|
| |
|
|
F-43
(11) INVESTMENTS IN NON-GROUP COMPANIES
This caption in the accompanying consolidated balance sheets reflects the ownership interests in the capital of other companies which, although not constituting a single decision-making unit, have a lasting relationship with the Group pursuant to Article 185.2 of the Corporations Law and Bank of Spain Circular 4/1991, which generally range from 20% (3% if listed) to 50%.
The “Other Investments in Associated Companies” account in the following table includes the holdings in companies acquired by the Group but not intended to be held at long-term and the holdings for which hedging futures transactions have been arranged (Note 2-c).
The detail of the balances of this caption in the accompanying consolidated balance sheets is as follows:
| | | | | | | | | |
| | | Thousands of Euros
| |
| | | 2003
| | | 2002
| | | 2001
| |
By currency: | | | | | | | | | |
In euros | | 5,333,309 | | | 5,891,886 | | | 6,333,502 | |
In foreign currencies | | 259,915 | | | 132,289 | | | 308,433 | |
| | |
|
| |
|
| |
|
|
| | | 5,593,224 | | | 6,024,175 | | | 6,641,935 | |
| | |
|
| |
|
| |
|
|
By listing status: | | | | | | | | | |
Listed | | 5,172,770 | | | 5,614,439 | | | 6,048,381 | |
Unlisted | | 420,492 | | | 409,818 | | | 595,345 | |
Less- | | | | | | | | | |
Securities revaluation reserve (Notes 2-f and 3-e) | | (38 | ) | | (82 | ) | | (1,791 | ) |
| | |
|
| |
|
| |
|
|
| | | 5,593,224 | | | 6,024,175 | | | 6,641,935 | |
| | |
|
| |
|
| |
|
|
By type of investment: | | | | | | | | | |
Long-term investments | | 4,619,803 | | | 4,921,149 | | | 5,605,568 | |
Other investments in associated companies | | 973,421 | | | 1,103,026 | | | 1,036,367 | |
| | |
|
| |
|
| |
|
|
| | | 5,593,224 | | | 6,024,175 | | | 6,641,935 | |
| | |
|
| |
|
| |
|
|
€889,243 thousand, €1,024,136 thousand and €1,144,862 thousand of the foregoing balances as of December 31, 2003, 2002 and 2001, respectively, related to investments in credit institutions, basically Banca Nazionale del Lavoro, S.p.A., Banco Bradesco, S.A. and Banco Atlántico, S.A. in 2003 and Banca Nazionale del Lavoro, S.p.A., Credit Lyonnais, S.A., Banco Atlántico, S.A. and Wafabank, S.A. in 2002 and 2001. Exhibit II lists the main associated companies, showing the percentages of direct and indirect ownership, the book values of these investments and other relevant information.
The variations in the balances of this caption in the accompanying 2003, 2002 and 2001 consolidated balance sheets, disregarding the securities revaluation reserve, were as follows:
| | | | | | | | | |
| | | Thousands of Euros
| |
| | | 2003
| | | 2002
| | | 2001
| |
Beginning balance | | 6,024,257 | | | 6,643,726 | | | 7,468,376 | |
| | |
|
| |
|
| |
|
|
Capital increase and purchases | | 2,128,197 | | | 1,707,627 | | | 1,461,962 | |
Sales | | (2,440,890 | ) | | (1,824,169 | ) | | (2,098,674 | ) |
First-time consolidation differences (Note 13), transfers (Note 12) and other | | (118,302 | ) | | (502,927 | ) | | (187,938 | ) |
| | |
|
| |
|
| |
|
|
Year-end balance | | 5,593,262 | | | 6,024,257 | | | 6,643,726 | |
| | |
|
| |
|
| |
|
|
F-44
The most notable transactions in 2003, 2002 and 2001 were as follows:
Investments-
2003
| - | In March 2003 Desarrollo Inmobiliario de Lanzarote, S.A. was incorporated, in which BBVA acquired a holding of 40.8% for €4.4 million. |
| - | In May a 35% holding in the capital stock of Telefónica Data de Colombia, S.A. was acquired for €4.1 million. |
| - | In June 2003, 4.44% of Banco Bradesco, S.A. was acquired as part of the sale of BBVA Brasil and Subsidiaries to this entity (Note 4). During November and December, an additional 0.56% of Banco Bradesco was acquired by BBVA Brasil, raising the BBVA Group’s ownership interest to 5% as of December 31, 2003. |
| - | In June 2003 Inensur Brunete, S.L. was formed, in which BBVA acquired a holding of 50% for €9.6 million. |
| - | In 2003 further holdings representing 0.176% of the capital stock of Gas Natural, S.A. were acquired for €12.7 million, raising the BBVA Group’s ownership interest to 3.241%. |
2002
| - | In 2002 further shares representing 0.202% of the capital stock of Gas Natural, S.A. were acquired for €16 million, raising the BBVA Group’s ownership interest to 3.065%. |
| - | During 2002 several purchases and sales took place giving rise to a 0.164% increase in the Group’s holding in Telefónica de España, S.A. The sales gave rise to a gain of €8 million. |
2001
| - | In 2001 a holding of 4.87% in Banca Nazionale del Lavoro, S.p.A. was acquired for €398,074 thousand. |
| - | In the last quarter of 2001 a holding of 1.875% in Wafabank, S.A. was acquired for a total of €9,232 thousand. |
Divestments-
2003
| - | In March 2003 25% of Metrovacesa Residencial, S.A. was sold, giving rise to a gain of €2.1 million on the transaction. |
| - | In June 2003 the tender offer on the shares of Credit Lyonnais launched by Credit Agricole, S.A. and SACAM Development in December 2002 was performed, giving rise to a gain of approximately €342 million for the Bank’s 3.37% holding in this company. |
| - | In July 2003 the Group sold 3% of Gamesa, giving rise to a gain of €29.9 million. |
| - | In July 2003 the entire holding in the capital stock of Terra Networks (1.40%) was sold, giving rise to a gain of €1.88 million. |
| - | In September 2003 20% of Soc. Adm. P.C. Porvenir was sold, giving rise to a gain of €12.78 million. |
F-45
| - | In the last quarter of 2003, 2.465% of the capital stock of Repsol-YPF was sold, giving rise to loss of €73.3 million. |
| - | In December 2003 the Group sold its 50% holding in Lend Lease México, giving rise to a gain of €1.35 million. |
| - | In 2003 several purchases and sales took place the result of which was a reduction of 0.569% of the holding in Telefónica de España, S.A. The sales generated a gain of €220 million. |
| - | In 2003 several purchases and sales took place, the result of which was a reduction of 1.018% of the holding in Iberdrola. The sales generated a gain of €45.32 million. |
| - | The Group sold all of its 9.9% holding (641,825 shares) in the Moroccan bank Wafabank, S.A. to Omnium Nord Africain, S.A. The total sale price was 529,505,625 dirhams (approximately €48 million) and gave rise to a gain for the Bank of €3.5 million. |
Lastly:
| - | In December 2003, Banco Sabadell, S.A. launched a tender offer on the shares of Banco Atlántico, S.A. of €71.79 per share. The transaction is expected to be performed in 2004 and will give rise to a gain of approximately €218 million for the Group’s total holding in this company. |
| - | In January 2004, the Group sold 2.2 % of the capital stock of Gas Natural, S.D.G. Using as reference the price of the transaction performed on that date, €70 million of the related consolidation goodwill were amortized early in the 2003 financial statements (Note 13). |
2002
| - | In 2002 and as a result of certain corporate agreements, shares of Banca Nazionale del Lavoro (BNL) were purchased and sold with no variation in the percentage of ownership. Also, in the framework of these corporate agreements there was a dilutive effect which brought the percentage of ownership to 14.614%. These purchases and sales gave rise to a capital loss at the Group amounting to €15 million. |
| - | A 1.756% holding in Iberdrola, S.A. was sold in 2002, giving rise to a gain of €75 million |
| - | In the first quarter of 2002 the Group sold 3.823% of its holding in Metrovacesa, giving rise to gains of €14 million. In June 2002, BBVA and BAMI, S.A. Inmobiliaria de Construcciones y Terrenos agreed on the sale of 23.9% of the capital stock of Metrovacesa, S.A. for €545.4 million (€36.55 per share), which was formally executed once the authorization from the antitrust authorities was obtained. As a result of this sale, as of December 31, 2002, the BBVA Group had a 0.581% holding in Metrovacesa, S.A. and obtained a gain of approximately €361 million. This holding is recorded under the “Common Stocks and Other Equity Securities” caption in the accompanying consolidated balance sheet (Note 10). |
| - | Shares representing 4.612% of the capital stock of Acesa Infraestructuras, S.A. were sold in 2002 for €171 million at a gain of €20 million. |
| - | In 2002 the Group sold a 7.641% holding in the capital stock of Acerinox, S.A. at a gain of €66 million. |
2001
| - | Sale, in the first quarter of 2001, of Axa-Aurora, S.A., giving rise to gains for the Group of €95,825 thousand. |
| - | In the first few months of 2001, the holding in Finaxa was reduced by 2.924%, giving rise to gains of €121,134 thousand. |
F-46
| - | Also, in the first few months of 2001, the Group’s holding in Profuturo GNP, S.A. de C.V. was sold as part of the reorganization of business activities at Group Bancomer. This transaction gave rise to gains of €77,813 thousand. |
| - | In 2001, the Group permanently reduced its holding in Telefónica de España, S.A. to 5.138% as of December 31, 2001, giving rise to gains of €352,926 thousand, arising mainly from the holding hedged by futures transactions. |
| - | In 2001, the Group reduced its holding in the capital stock of Iberdrola, S.A. by 0.827%, giving rise to gains of €36,343 thousand. |
| - | In 2001 sales and purchases were performed that led to a reduction in the Group’s total holding in Repsol YPF, S.A equivalent to 1.339% of the capital stock and which gave rise to gains of €84,797 thousand. |
| - | In December 2001, the Group fully disposed of its 39.073% holding in Bodegas y Bebidas, S.A., giving rise to gains of €50,647 thousand. |
| - | In December 2001, the Group sold its entire holding in Seguros BBV Probursa, giving rise to gains of €11,017 thousand. |
The gains and losses obtained on the aforementioned transactions are recorded under the “Income on Group Transactions” and “Losses on Group Transactions” captions, respectively, in the accompanying 2003, 2002 and 2001 consolidated statements of income.
Exhibit IV lists the notifications by the Group in compliance with Article 86 of the Corporations Law and Article 53 of Securities Market Law 24/1988.
As of December 31, 2003, the market price of the shares and other equity securities included in this caption of the accompanying consolidated balance sheets exceeded their net book value by approximately €1,319,748 thousand, after taking into account the related goodwill, negative consolidation differences and hedges of certain holdings. As of December 31, 2002, the market price of the shares and other equity securities included in this caption of the accompanying consolidated balance sheets was lower than their net book value by approximately €159,496 thousand and as of December 31, 2001, the market price of the shares and other equity securities included in this caption of the accompanying consolidated balance sheets was higher than their net book value by approximately €2,009,917 thousand (Note 13).
The variations in the balances of the “Securities Revaluation Reserve” account in 2003, 2002 and 2001 were as follows:
| | | | | | | | | |
| | | Thousands of Euros
| |
| | | 2003
| | | 2002
| | | 2001
| |
Beginning balance | | 82 | | | 1,791 | | | 15,080 | |
| | |
|
| |
|
| |
|
|
Charge for the year | | — | | | — | | | 21,300 | |
Reversals | | — | | | (3,366 | ) | | (1,695 | ) |
Transfer to common stocks and other equity securities | | — | | | — | | | (32,396 | ) |
Other variations | | (44 | ) | | 1,657 | | | (498 | ) |
| | |
|
| |
|
| |
|
|
Year-end balance | | 38 | | | 82 | | | 1,791 | |
| | |
|
| |
|
| |
|
|
| (12) | INVESTMENTS IN GROUP COMPANIES |
This caption in the accompanying consolidated balance sheets reflects the investments in subsidiaries, which are generally majority-owned and were not fully consolidated because their business activities are not directly related with those of the Group.
F-47
The breakdown, by currency and listing status, of the balances of this caption in the accompanying consolidated balance sheets is as follows:
| | | | | | |
| | | Thousands of Euros
|
| | | 2003
| | 2002
| | 2001
|
By currency: | | | | | | |
In euros | | 795,806 | | 779,876 | | 732,249 |
In foreign currencies | | 259,063 | | 259,812 | | 381,895 |
| | |
| |
| |
|
| | | 1,054,869 | | 1,039,688 | | 1,114,144 |
| | |
| |
| |
|
By listing status: | | | | | | |
Listed | | — | | — | | 3,011 |
Unlisted | | 1,054,869 | | 1,039,688 | | 1,111,133 |
| | |
| |
| |
|
| | | 1,054,869 | | 1,039,688 | | 1,114,144 |
| | |
| |
| |
|
Exhibit III presents relevant information about the companies comprising the balance of this caption in the accompanying consolidated balance sheets.
The variations in 2003, 2002 and 2001 in the balance of this caption in the accompanying consolidated balance sheets were as follows:
| | | | | | | | | |
| | | Thousands of Euros
| |
| | | 2003
| | | 2002
| | | 2001
| |
Beginning balance | | 1,039,688 | | | 1,114,144 | | | 1,169,684 | |
| | |
|
| |
|
| |
|
|
Capital increases and purchases | | 131,324 | | | 75,332 | | | 242,899 | |
Sales | | (58,997 | ) | | (73,490 | ) | | (250,075 | ) |
Exchange differences | | (37,972 | ) | | (95,400 | ) | | (9,544 | ) |
Transfers (Note 11) and other | | (19,174 | ) | | 19,102 | | | (38,820 | ) |
| | |
|
| |
|
| |
|
|
Ending balance | | 1,054,869 | | | 1,039,688 | | | 1,114,144 | |
| | |
|
| |
|
| |
|
|
On December 27, 2002, the Special Shareholders’ Meeting of BBVA Seguros, S.A. de Seguros y Reaseguros resolved to increase its capital stock by €30 million, with additional paid-in capital of €19 million, through the issuance of approximately 5 million shares for €9.82 per share (€6.01 par value each and the remainder as additional paid-in capital). The Group subscribed a total of 4.9 million shares for a total amount of €49,085 thousand.
In 2003 BBVA Desarrollos Inmobiliarios increased capital by €63 million.
As of December 31, 2003, there were no capital increases in progress at nonconsolidable subsidiaries other than the one described above.
In 1990, 1994 and 1995, tax assessments for 1986 to 1990 were issued to the nonconsolidable subsidiaries BBVA Seguros, S.A. (formerly Euroseguros, S.A.) and Senorte Vida y Pensiones, S.A. totaling €88,066 thousand of principal and €39,072 thousand of late-payment interest, plus €66,057 thousand of penalties, after adjustment pursuant to the revised General Tax Law. The companies filed pleadings and appeals against the assessments and several administrative decisions and court rulings were handed down in 1997 through 2000. As a result of application of the criteria set forth in these court rulings, some of which have been appealed against by the Group and by the Spanish tax authorities, the tax debts would be reduced to €50,677 thousand of principal and €19,851 thousand of interest. In order to file these appeals, the Bank provided guarantees totaling €85,193 thousand to the tax authorities. In 2003 further court rulings were handed down, which have been appealed against and are being analyzed by the Group’s directors and legal advisers; in any case, however, the possible effects of these rulings would not materially affect the accompanying consolidated financial statements since, in accordance with the accounting principle of prudence, adequate provisions have been recorded therefor.
F-48
| (13) | CONSOLIDATION GOODWILL AND NEGATIVE CONSOLIDATION DIFFERENCE |
The detail, by company, of the balances of the “Consolidation Goodwill” caption in the accompanying consolidated balance sheets as of December 31, 2003, 2002 and 2001, and of the variations therein in 2003, and 2002, is as follows:
| | | | | | | | | | | | | | | |
| | | Thousands of Euros
|
| | | Balance at
12/31/02
| | Additions
(Notes 4
and 11)
| | Retirements (Notes 4
and 11)
| | | Amortization (Note 3-g)
| | | Exchange
Differences
and Other
| | | Balance at
12/31/03
|
Fully or proportionally consolidated companies (Note 4)- | | | | | | | | | | | | | | | |
Grupo Financiero BBVA Bancomer, S.A. de C.V. | | 1,955,340 | | 160,615 | | — | | | (250,428 | ) | | — | | | 1,865,527 |
AFORE Bancomer | | 310,727 | | — | | — | | | (39,398 | ) | | (232 | ) | | 271,097 |
Provida Group | | 204,049 | | — | | — | | | (40,848 | ) | | — | | | 163,201 |
BBVA Chile, S.A. | | 66,840 | | 1,043 | | (337 | ) | | (10,601 | ) | | — | | | 56,945 |
BBVA Puerto Rico, S.A. | | 51,648 | | — | | — | | | (8,655 | ) | | (6,536 | ) | | 36,457 |
Finanzia, Banco de Crédito, S.A. | | 6,890 | | — | | — | | | (1,728 | ) | | — | | | 5,162 |
BBVA (Portugal), S.A. | | 19,035 | | — | | — | | | (3,120 | ) | | — | | | 15,915 |
Banco de Crédito Local, S.A. | | 240,907 | | — | | — | | | (29,808 | ) | | — | | | 211,099 |
AFP Porvenir, S.A. (Dominican Republic) | | — | | 11,789 | | — | | | (410 | ) | | 7 | | | 11,386 |
Other companies | | 16,109 | | 9,749 | | (9,557 | ) | | (1,971 | ) | | (230 | ) | | 14,100 |
| | |
| |
| |
|
| |
|
| |
|
| |
|
| | | 2,871,545 | | 183,196 | | (9,894 | ) | | (386,967 | ) | | (6,991 | ) | | 2,650,889 |
| | |
| |
| |
|
| |
|
| |
|
| |
|
Companies accounted for by the equity method (Note 11)- | | | | | | | | | | | | | | | |
Telefónica, S.A. | | 438,046 | | 129,431 | | (140,089 | ) | | (30,747 | ) | | — | | | 396,641 |
Repsol YPF, S.A. | | 116,609 | | — | | (33,479 | ) | | (7,631 | ) | | — | | | 75,499 |
Gas Natural, S.D.G. | | 189,436 | | 5,434 | | — | | | (81,489 | ) | | — | | | 113,381 |
Seguros Bancomer, S.A. de C.V. | | 162,622 | | — | | — | | | (18,946 | ) | | (6,997 | ) | | 136,679 |
Banca Nazionale del Lavoro, S.p.A. | | 298,796 | | — | | — | | | (48,336 | ) | | — | | | 250,460 |
Crédit Lyonnais, S.A. | | 71,658 | | — | | (67,288 | ) | | (4,370 | ) | | — | | | — |
Iberia, S.A. | | 35,331 | | — | | — | | | (2,100 | ) | | — | | | 33,231 |
Iberdrola, S.A. | | 34,785 | | 9,220 | | (8,150 | ) | | (2,380 | ) | | — | | | 33,475 |
Acerinox, S.A. | | 2,219 | | — | | — | | | (168 | ) | | — | | | 2,051 |
Wafabank, S.A. | | 17,464 | | — | | (15,001 | ) | | (2,463 | ) | | — | | | — |
Pensiones Bancomer, S.A. de C.V. | | 10,506 | | — | | — | | | (1,080 | ) | | (1,649 | ) | | 7,777 |
Bradesco, S.A. | | — | | 48,589 | | — | | | (48,589 | ) | | — | | | — |
Other companies (Note 3-g) | | 8,329 | | 2,965 | | (1,280 | ) | | (4,083 | ) | | 399 | | | 6,330 |
| | |
| |
| |
|
| |
|
| |
|
| |
|
| | | 1,385,801 | | 195,639 | | (265,287 | ) | | (252,382 | ) | | (8,247 | ) | | 1,055,524 |
| | |
| |
| |
|
| |
|
| |
|
| |
|
| | | 4,257,346 | | 378,835 | | (275,181 | ) | | (639,349 | ) | | (15,238 | ) | | 3,706,413 |
| | |
| |
| |
|
| |
|
| |
|
| |
|
F-49
| | | | | | | | | | | | | | | |
| | | Thousands of Euros
|
| | | Balance at
12/31/01
| | Additions
(Notes 4 and 11)
| | Retirements (Notes 4
and 11)
| | | Amortization (Note 3-g)
| | | Exchange
Differences
and Other
| | | Balance at
12/31/02
|
Fully or proportionally consolidated companies (Note 4)- | | | | | | | | | | | | | | | |
Grupo Financiero BBVA Bancomer, S.A. de C.V. | | 1,861,034 | | 338,350 | | (8,379 | ) | | (235,659 | ) | | (6 | ) | | 1,955,340 |
AFORE Bancomer | | 364,387 | | — | | — | | | (40,139 | ) | | (13,521 | ) | | 310,727 |
Provida Group | | 244,894 | | — | | — | | | (40,848 | ) | | 3 | | | 204,049 |
BBVA Chile, S.A. | | 74,988 | | 2,574 | | (368 | ) | | (10,354 | ) | | — | | | 66,840 |
BBVA Puerto Rico, S.A. | | 73,473 | | — | | — | | | (9,085 | ) | | (12,740 | ) | | 51,648 |
BBVA Horizonte Pensiones y Cesantías, S.A. – Colombia | | 69,183 | | — | | — | | | (64,960 | ) | | (4,223 | ) | | — |
AFP Horizonte, S.A. – Peru | | 28,590 | | — | | — | | | (28,490 | ) | | (100 | ) | | — |
Midas Group (Portugal) | | 18,001 | | — | | (15,459 | ) | | (2,542 | ) | | — | | | — |
BBVA Banco Francés, S.A. (Note 3-o) | | — | | 34,789 | | — | | | (34,789 | ) | | — | | | — |
Finanzia, Banco de Crédito, S.A. | | 8,618 | | — | | — | | | (1,728 | ) | | — | | | 6,890 |
BBVA (Portugal), S.A. | | 4,700 | | 15,459 | | (546 | ) | | (578 | ) | | — | | | 19,035 |
Banco de Crédito Local, S.A. | | 270,715 | | — | | — | | | (29,808 | ) | | — | | | 240,907 |
BBVA Banco Ganadero, S.A. | | 4,429 | | 19 | | — | | | (4,448 | ) | | — | | | — |
Other companies | | 21,895 | | 10,956 | | — | | | (16,466 | ) | | (276 | ) | | 16,109 |
| | |
| |
| |
|
| |
|
| |
|
| |
|
| | | 3,044,907 | | 402,147 | | (24,752 | ) | | (519,894 | ) | | (30,863 | ) | | 2,871,545 |
| | |
| |
| |
|
| |
|
| |
|
| |
|
Companies accounted for by the equity method (Note 11)- | | | | | | | | | | | | | | | |
Telefónica, S.A. | | 424,687 | | 41,101 | | (4,149 | ) | | (23,593 | ) | | — | | | 438,046 |
Repsol YPF, S.A. | | 124,289 | | — | | — | | | (7,680 | ) | | — | | | 116,609 |
Gas Natural, S.D.G. | | 191,753 | | 8,681 | | — | | | (10,998 | ) | | — | | | 189,436 |
Seguros Bancomer, S.A. de C.V. | | 195,659 | | — | | — | | | (20,526 | ) | | (12,511 | ) | | 162,622 |
Banca Nazionale del Lavoro, S.p.A. | | 338,026 | | 29,853 | | (11,588 | ) | | (57,495 | ) | | — | | | 298,796 |
Crédit Lyonnais, S.A. | | 77,391 | | 4,531 | | — | | | (10,264 | ) | | — | | | 71,658 |
Autopistas Concesionaria Española, S.A. | | 59,121 | | — | | (56,856 | ) | | (2,265 | ) | | — | | | — |
Iberia, S.A. | | 37,431 | | — | | — | | | (2,100 | ) | | — | | | 35,331 |
Iberdrola, S.A. | | 46,717 | | — | | (9,954 | ) | | (1,978 | ) | | — | | | 34,785 |
Acerinox, S.A. | | 22,808 | | — | | (19,881 | ) | | (708 | ) | | — | | | 2,219 |
Wafabank, S.A. | | 20,152 | | — | | — | | | (2,688 | ) | | — | | | 17,464 |
Pensiones Bancomer, S.A. de C.V. | | 14,748 | | — | | — | | | (1,440 | ) | | (2,802 | ) | | 10,506 |
Other companies | | 19,453 | | 10,837 | | (3,566 | ) | | (17,541 | ) | | (854 | ) | | 8,329 |
| | |
| |
| |
|
| |
|
| |
|
| |
|
| | | 1,572,235 | | 95,003 | | (105,994 | ) | | (159,276 | ) | | (16,167 | ) | | 1,385,801 |
| | |
| |
| |
|
| |
|
| |
|
| |
|
| | | 4,617,142 | | 497,150 | | (130,746 | ) | | (679,170 | ) | | (47,030 | ) | | 4,257,346 |
| | |
| |
| |
|
| |
|
| |
|
| |
|
€48,589 thousand of the amortization recorded in the 2003 consolidated statement of income (of which €34,719 thousand had been provisioned as of December 2002) relate to the early amortization of the consolidation goodwill of Banco Bradesco, S.A. (Note 4).
Also, €70,045 thousand of consolidation goodwill relating to Gas Natural, S.D.G. were amortized early (Note 11).
Per the information available, the estimated future revenues attributable to the Group from each of the investments generating goodwill in the remaining amortization period of this goodwill exceed the related unamortized balances as of December 31, 2003, 2002 and 2001.
The variations in 2003, 2002 and 2001 in the balances of the “Negative Consolidation Difference” caption in the accompanying consolidated balance sheets were as follows:
| | | | | | | | | |
| | | Thousands of Euros
| |
| | | 2003
| | | 2002
| | | 2001
| |
Beginning balance | | 47,554 | | | 42,744 | | | 47,828 | |
Additions | | 1,507 | | | 12,269 | | | 14,131 | |
Retirements | | (10,349 | ) | | (7,459 | ) | | (19,215 | ) |
| | |
|
| |
|
| |
|
|
Ending balance | | 38,712 | | | 47,554 | | | 42,744 | |
| | |
|
| |
|
| |
|
|
F-50
| (14) | PROPERTY AND EQUIPMENT AND INTANGIBLE ASSETS |
Property and equipment-
The variations in 2003 and 2002 in property and equipment accounts in the accompanying consolidated balance sheets were as follows:
| | | | | | | | | | | | |
| | | Thousands of Euros
| |
| | | Land and Buildings for Own Use
| | | Other Property
| | | Furniture, Fixtures and Other
| | | TOTAL
| |
Revalued cost- | | | | | | | | | | | | |
Balances at 2001 year-end | | 3,456,216 | | | 1,793,192 | | | 5,781,159 | | | 11,030,567 | |
Additions | | 25,500 | | | 244,981 | | | 480,546 | | | 751,027 | |
Retirements | | (111,503 | ) | | (544,393 | ) | | (290,761 | ) | | (946,657 | ) |
Transfers | | (136,913 | ) | | 158,576 | | | (21,663 | ) | | — | |
Exchange difference and other | | (491,711 | ) | | (467,296 | ) | | (845,944 | ) | | (1,804,951 | ) |
Balances at 2002 year-and | | 2,741,589 | | | 1,185,060 | | | 5,103,337 | | | 9,029,986 | |
Additions | | 23,593 | | | 151,328 | | | 305,999 | | | 480,920 | |
Retirements | | (71,658 | ) | | (236,418 | ) | | (477,636 | ) | | (785,712 | ) |
Transfers | | 299,473 | | | (223,136 | ) | | (76,337 | ) | | — | |
Exchange difference and other | | (110,693 | ) | | (330,184 | ) | | (363,736 | ) | | (804,613 | ) |
| | |
|
| |
|
| |
|
| |
|
|
Balances at 2003 year-end | | 2,882,304 | | | 546,650 | | | 4,491,627 | | | 7,920,581 | |
| | |
|
| |
|
| |
|
| |
|
|
Accumulated depreciation- | | | | | | | | | | | | |
Balances at 2001 year-end | | 885,591 | | | 27,941 | | | 3,553,682 | | | 4,467,214 | |
Additions | | 61,592 | | | 851 | | | 444,889 | | | 507,332 | |
Retirements | | (29,241 | ) | | (29,633 | ) | | (140,017 | ) | | (198,891 | ) |
Transfers | | (18,575 | ) | | 19,382 | | | (807 | ) | | — | |
Exchange difference and other | | (131,674 | ) | | (1,671 | ) | | (554,807 | ) | | (688,152 | ) |
Balances at 2002 year-end | | 767,693 | | | 16,870 | | | 3,302,940 | | | 4,087,503 | |
Additions | | 51,127 | | | 1,373 | | | 336,467 | | | 388,967 | |
Retirements | | (18,052 | ) | | (8,774 | ) | | (317,251 | ) | | (344,077 | ) |
Transfers | | (41,036 | ) | | 11,230 | | | 29,806 | | | — | |
Exchange difference and other | | (118,710 | ) | | 2,805 | | | (261,161 | ) | | (377,066 | ) |
| | |
|
| |
|
| |
|
| |
|
|
Balances at 2003 year-end | | 641,022 | | | 23,504 | | | 3,090,801 | | | 3,755,327 | |
| | |
|
| |
|
| |
|
| |
|
|
Provisions for property and equipment (Note 2-f)- | | | | | | | | | | | | |
Balances at 2001 year-end | | 39,690 | | | 341,105 | | | 10,668 | | | 391,463 | |
Additions | | 2,236 | | | 122,958 | | | 13,720 | | | 138,914 | |
Retirements | | (3,172 | ) | | (104,076 | ) | | (13,471 | ) | | (120,719 | ) |
Transfers | | 2,718 | | | (5,566 | ) | | 2,848 | | | — | |
Transfers from loan loss provisions (Note 8) | | — | | | 8,156 | | | — | | | 8,156 | |
Exchange difference and other | | (5,863 | ) | | (102,460 | ) | | (973 | ) | | (109,296 | ) |
Balances at 2002 year-end | | 35,609 | | | 260,117 | | | 12,792 | | | 308,518 | |
Additions | | — | | | 92,671 | | | 11,798 | | | 104,469 | |
Retirements | | (9,802 | ) | | (80,357 | ) | | (3,884 | ) | | (94,043 | ) |
Transfers | | (21 | ) | | (754 | ) | | 775 | | | — | |
Transfers from loan loss provisions (Note 8) | | — | | | 11,410 | | | — | | | 11,410 | |
Exchange difference and other | | 115,137 | | | (69,548 | ) | | (927 | ) | | 44,662 | |
| | |
|
| |
|
| |
|
| |
|
|
Balances at 2003 year-end | | 140,923 | | | 213,539 | | | 20,554 | | | 375,016 | |
| | |
|
| |
|
| |
|
| |
|
|
Property and equipment, net- | | | | | | | | | | | | |
Balance at December 31, 2002 | | 1,938,287 | | | 908,073 | | | 1,787,605 | | | 4,633,965 | |
| | |
|
| |
|
| |
|
| |
|
|
Balance at December 31, 2003 | | 2,100,359 | | | 309,607 | | | 1,380,272 | | | 3,790,238 | |
| | |
|
| |
|
| |
|
| |
|
|
In 2001, the variation in the property and equipment provision was due mainly to the cancellation of a Mexican Government support program (FOBA-70), which gave rise to the reversal of €470,960 thousand of provisions for the property assigned to this program.
The net property and equipment provisions of €86,340 thousand, €122,508 thousand and €111,127 thousand charged to 2003, 2002 and 2001 income, respectively, to supplement the loan loss provisions transferred when loans were foreclosed (Note 8), are recorded under the “Extraordinary Losses - Net Special Provisions” caption in the accompanying consolidated statements of income (Notes 3-h and 28-g).
F-51
The gains and losses on property and equipment disposals amounted to €95,884 thousand and €51,636 thousand, respectively, in 2003 (€195,493 thousand and €99,712 thousand, respectively, in 2002 and €325,827 thousand and €70,829 thousand, respectively, in 2001) and are included under the “Extraordinary Income” and “Extraordinary Losses” captions in the accompanying consolidated statements of income (Note 28-g).
The net book value as of December 31, 2003, 2002 and 2001, of the property and equipment of foreign subsidiaries was €1,659,530 thousand, €2,383,965 thousand and €3,754,114 thousand, respectively. Also, the amount of leased assets on which the purchase option is expected to be exercised was not material as of December 31, 2003, 2002 and 2001.
Intangible assets-
The detail of the balance of intangible asset accounts as of December 31, 2003, 2002 and 2001, is as follows:
| | | | | | | | |
| | | Thousands of Euros
| | Average
Amortization
Period
|
| | | 2003
| | 2002
| | 2001
| |
Incorporation and preopening expenses | | 19,537 | | 20,946 | | 18,770 | | 5 |
Computer software acquisition expenses | | 265,874 | | 201,187 | | 272,851 | | 3 |
Other deferred charges | | 70,137 | | 167,426 | | 242,841 | | 5 |
Other intangible assets | | 6,480 | | 9,078 | | 7,621 | | 5 |
| | |
| |
| |
| | |
Total | | 362,028 | | 398,637 | | 542,083 | | |
| | |
| |
| |
| | |
The variations in 2003 and 2002 in intangible asset accounts were as follows:
| | | |
INTANGIBLE ASSETS
| | Thousands of Euros
| |
Balance at January 1, 2002 | | 542,083 | |
| | |
|
|
- Additions | | 248,120 | |
- Period amortization | | (253,164 | ) |
- Exchange differences and other | | (138,402 | ) |
| | |
|
|
Balance at December 31, 2002 | | 398,637 | |
| | |
|
|
- Additions | | 247,575 | |
- Period amortization | | (187,315 | ) |
- Exchange differences and other | | (96,869 | ) |
| | |
|
|
Balance at December 31, 2003 | | 362,028 | |
| | |
|
|
€66,583 thousand of computer software acquisition costs were amortized in 2003 (€129,475 thousand in 2002) with a charge to the “General Administrative Expenses - Other Administrative Expenses” caption in the consolidated statements of income.
€120,732 thousand, €123,689 thousand and €151,472 thousand of other expenses were amortized in 2003, 2002 and 2001, respectively, and were recorded under the “Depreciation and Amortization” caption in the accompanying consolidated statements of income.
F-52
| (15) | OTHER ASSETS AND OTHER LIABILITIES |
The detail of the balances of these captions in the accompanying consolidated balance sheets is as follows:
| | | | | | |
| | | Thousands of Euros
|
| | | 2003
| | 2002
| | 2001
|
Other assets- | | | | | | |
Taxes receivable (Notes 3-l and 25): | | | | | | |
Prepaid income tax | | 2,688,983 | | 2,911,123 | | 3,574,478 |
Tax assets | | 1,209,833 | | 1,717,407 | | 1,821,770 |
Interim dividends (Notes 2-d and 5) | | 859,896 | | 860,616 | | 813,957 |
Checks drawn on credit institutions | | 671,356 | | 761,381 | | 689,253 |
Clearing house | | 422,755 | | 369,066 | | 761,248 |
Transactions in transit | | 13,376 | | 20,182 | | 43,808 |
Options acquired (Note 3-m) | | 740,696 | | 665,438 | | 879,142 |
Exchange differences on forward transactions (Note 3-b) | | 362,571 | | 663,091 | | 471,488 |
Items to be adjusted for hedging futures transactions (Note 3-m) | | 3,070,899 | | 2,274,328 | | 1,333,375 |
Financial transactions pending settlement | | 49,412 | | 30,590 | | 25,026 |
Differences in pension provision less deferred contributions of Group companies in Spain (Note 3-j) | | 469,143 | | 507,504 | | 468,300 |
Differences in pension provision of Group companies abroad (Note 3-j) | | 171,854 | | 187,234 | | — |
Other | | 2,440,706 | | 1,330,920 | | 1,118,270 |
| | |
| |
| |
|
| | | 13,171,480 | | 12,298,880 | | 12,000,115 |
| | |
| |
| |
|
Other liabilities- | | | | | | |
Tax collection accounts | | 1,937,736 | | 2,089,075 | | 1,867,879 |
Special accounts | | 794,407 | | 862,618 | | 708,095 |
Payment obligations (Note 5) | | 801,216 | | 795,677 | | 960,820 |
Options written (Note 3-m) | | 958,040 | | 993,126 | | 1,251,854 |
Transactions in transit | | 17,175 | | 16,669 | | 110,641 |
Items to be adjusted for hedging futures transactions (Note 3-m) | | 3,013,819 | | 1,696,545 | | 290,890 |
Deferred income tax (Notes 3-l and 25) | | 214,796 | | 246,918 | | 383,836 |
Financial transactions pending settlement | | 233,517 | | 80,797 | | 160,422 |
Net effect on balance sheet of devaluation of Argentine peso | | — | | — | | 440,235 |
Other | | 2,793,808 | | 2,954,480 | | 2,967,973 |
| | |
| |
| |
|
| | | 10,764,514 | | 9,735,905 | | 9,142,645 |
| | |
| |
| |
|
F-53
The detail of the balances of these asset and liability captions in the accompanying consolidated balance sheets is as follows:
| | | | | | |
| | | Thousands of Euros
|
| | | 2003
| | 2002
| | 2001
|
Assets: | | | | | | |
Prepaid interest on funds taken at a discount (Note 3-n) | | 290,992 | | 308,603 | | 418,521 |
Accrued interest earned on investments not taken at a Discount | | 1,904,578 | | 3,313,166 | | 4,724,809 |
Prepaid expenses | | 332,532 | | 400,391 | | 248,969 |
Deferred interest expenses | | 121,751 | | 50,311 | | 57,090 |
Other accruals | | 327,584 | | 319,091 | | 1,599,678 |
| | |
| |
| |
|
| | | 2,977,437 | | 4,391,562 | | 7,049,067 |
| | |
| |
| |
|
Liabilities: | | | | | | |
Unearned interest revenues on transactions taken at a discount (Note 3-n) | | 131,172 | | 110,972 | | 169,654 |
Accrued costs incurred on funds not taken at a discount | | 1,888,083 | | 2,926,966 | | 4,278,768 |
Accrued expenses | | 742,317 | | 763,308 | | 917,126 |
Other accruals | | 557,155 | | 792,531 | | 1,299,526 |
| | |
| |
| |
|
| | | 3,318,727 | | 4,593,777 | | 6,665,074 |
| | |
| |
| |
|
F-54
| (17) | DUE TO CREDIT INSTITUTIONS |
The breakdown, by currency, type and customer residence sector, of the balances of this caption on the liability side of the accompanying consolidated balance sheets is as follows:
| | | | | | |
| | | Thousands of Euros
|
| | | 2003
| | 2002
| | 2001
|
By currency: | | | | | | |
In euros | | 38,278,736 | | 32,482,221 | | 36,508,793 |
In foreign currencies | | 23,291,052 | | 23,636,827 | | 28,079,202 |
| | |
| |
| |
|
| | | 61,569,788 | | 56,119,048 | | 64,587,995 |
| | |
| |
| |
|
By type: | | | | | | |
Current accounts- | | | | | | |
Current accounts | | 32,275 | | 133,796 | | 52,240 |
Other accounts | | 1,510,157 | | 1,403,561 | | 1,360,578 |
| | |
| |
| |
|
| | | 1,542,432 | | 1,537,357 | | 1,412,818 |
| | |
| |
| |
|
Other- | | | | | | |
Bank of Spain and other central banks: | | | | | | |
Credit account drawdowns | | 13,792,525 | | 7,827,204 | | 3,021,624 |
Assets sold under repurchase agreement (Notes 6, 7 and 8) | | 7,131,686 | | 2,020,801 | | 1,686,789 |
Due to credit institutions: | | | | | | |
Time deposits | | 26,462,007 | | 26,983,251 | | 34,759,980 |
Assets sold under repurchase agreement (Notes 6 and 7) | | 10,863,009 | | 14,598,398 | | 20,659,474 |
Security payables | | 1,463,227 | | 2,600,588 | | 2,352,866 |
Other accounts | | 314,902 | | 551,449 | | 694,444 |
| | |
| |
| |
|
| | | 60,027,356 | | 54,581,691 | | 63,175,177 |
| | |
| |
| |
|
| | | 61,569,788 | | 56,119,048 | | 64,587,995 |
By sector | | | | | | |
Resident sector | | 33,237,280 | | 22,692,790 | | 20,677,483 |
Non-resident sector | | 28,332,508 | | 33,426,258 | | 43,910,512 |
Europe | | 11,078,197 | | 13,104,189 | | 20,318,646 |
United States | | 1,686,751 | | 3,264,860 | | 3,221,272 |
Latin America | | 11,725,080 | | 11,183,869 | | 13,190,079 |
Other countries | | 3,842,480 | | 5,873,340 | | 7,180,515 |
| | |
| |
| |
|
| | | 61,569,788 | | 56,119,048 | | 64,587,995 |
| | |
| |
| |
|
As of December 31, 2003, 2002 and 2001, the Group had assets, mainly loans, credits and securities (see Note 8) securing financing lines assigned by the Bank of Spain and other central banks. As of December, 2003, 2002 and 2001, the financing limit assigned to the Group was €16,622,829 thousand, €11,653,181 thousand and €7,667,197 thousand, respectively, of which it had drawn down €13,981,458 thousand, €7,998,063 thousand and €3,021,624 thousand, respectively.
F-55
The detail, by due date, of the balances of the “Due to Credit Institutions—Other” caption in the accompanying consolidated balance sheets, and of the average interest rates for each year, is as follows:
| | | | | | | | | | | |
| | | Thousands of Euros
| | Average Interest Rate in the Year
| |
| | | Up to 3
Months
| | 3 Months
to 1 Year
| | 1 to 5 Years
| | Over 5 Years
| |
Balances at December 31, 2003- | | | | | | | | | | | |
Bank of Spain and other central banks | | 20,373,300 | | 26,943 | | 296,475 | | 227,493 | | 2.3 | % |
Due to credit institutions: | | | | | | | | | | | |
Time deposits | | 16,418,886 | | 3,803,228 | | 4,654,245 | | 1,585,650 | | 3.0 | % |
Assets sold under repurchase agreement | | 10,063,358 | | 108,443 | | 691,206 | | — | | 5.4 | % |
Security payables and other accounts | | 81,101 | | 237,582 | | 938,257 | | 521,189 | | 3.7 | % |
| | |
| |
| |
| |
| | | |
| | | 46,936,645 | | 4,176,196 | | 6,580,183 | | 2,334,332 | | | |
| | |
| |
| |
| |
| | | |
Balances at December 31, 2002- | | | | | | | | | | | |
Bank of Spain and other central banks | | 9,848,005 | | — | | — | | — | | 4.0 | % |
Due to credit institutions: | | | | | | | | | | | |
Time deposits | | 15,097,271 | | 5,522,083 | | 4,387,679 | | 1,976,218 | | 4.0 | % |
Assets sold under repurchase agreement | | 13,879,667 | | 670,678 | | 48,053 | | — | | 5.0 | % |
Security payables and other accounts | | 969,629 | | 76,311 | | 1,306,900 | | 799,197 | | 1.2 | %. |
| | |
| |
| |
| |
| | | |
| | | 39,794,572 | | 6,269,072 | | 5,742,632 | | 2,775,415 | | | |
| | |
| |
| |
| |
| | | |
Balances at December 31, 2001- | | | | | | | | | | | |
Bank of Spain and other central banks | | 4,708,413 | | — | | — | | — | | 5.7 | % |
Due to credit institutions: | | | | | | | | | | | |
Time deposits | | 22,405,770 | | 4,919,780 | | 4,634,552 | | 2,799,878 | | 5.3 | % |
Assets sold under repurchase agreement | | 19,016,591 | | 1,485,601 | | 157,282 | | — | | 6.2 | % |
Security payables and other accounts | | 791,920 | | 120,398 | | 1,353,075 | | 781,917 | | 2.7 | % |
| | |
| |
| |
| |
| | | |
| | | 46,922,694 | | 6,525,779 | | 6,144,909 | | 3,581,795 | | | |
| | |
| |
| |
| |
| | | |
The detail, by type and customer country of residence, of this caption as of December 31, 2003, 2002 and 2001, is as follows:
| | | | | | | | |
| | | Demand
| | Time
| | Assets Sold
with
Repurchase
Commitment
| | Total
|
2003: | | | | | | | | |
Resident sector | | 10,689,304 | | 12,468,543 | | 10,079,433 | | 33,237,280 |
Non-resident sector: | | | | | | | | |
Europe | | 1,149,918 | | 8,233,250 | | 1,695,029 | | 11,078,197 |
United States | | 212,708 | | 5,117,437 | | 6,394,935 | | 11,725,080 |
Latin-America | | 136,255 | | 1,550,496 | | — | | 1,686,751 |
Other | | 158,032 | | 3,684,448 | | — | | 3,842,480 |
| | |
| |
| |
| |
|
| | | 1,656,913 | | 18,585,611 | | 8,089,964 | | 28,332,508 |
| | |
| |
| |
| |
|
Total | | 12,346,217 | | 31,054,154 | | 18,169,397 | | 61,569,788 |
| | |
| |
| |
| |
|
2002: | | | | | | | | |
Resident sector | | 6,174,267 | | 9,656,445 | | 6,862,078 | | 22,692,790 |
Non-resident sector: | | | | | | | | |
Europe | | 1,011,457 | | 9,372,830 | | 2,719,902 | | 13,104,189 |
United States | | 585,166 | | 2,178,033 | | 501,661 | | 6,264,860 |
Latin-America | | 2,165,945 | | 2,482,366 | | 6,535,558 | | 11,183,869 |
Other | | 96,952 | | 5,776,388 | | — | | 5,873,340 |
| | |
| |
| |
| |
|
| | | 3,859,520 | | 19,809,617 | | 9,757,121 | | 33,426,258 |
| | |
| |
| |
| |
|
Total | | 10,033,787 | | 29,466,062 | | 16,619,199 | | 56,119,048 |
| | |
| |
| |
| |
|
2001: | | | | | | | | |
Resident sector | | 4,001,572 | | 9,311,589 | | 7,364,322 | | 20,677,483 |
Non-resident sector: | | | | | | | | |
Europe | | 2,015,085 | | 10,770,088 | | 7,533,473 | | 20,318,646 |
United States | | 235,406 | | 1,957,011 | | 1,028,855 | | 3,221,272 |
Latin-America | | 245,446 | | 6,525,020 | | 6,419,613 | | 13,190,079 |
Other | | 216,264 | | 6,964,251 | | — | | 7,180,515 |
| | |
| |
| |
| |
|
| | | 2,712,201 | | 26,216,370 | | 14,981,941 | | 43,910,512 |
| | |
| |
| |
| |
|
Total | | 6,713,773 | | 35,527,959 | | 22,346,263 | | 64,587,995 |
| | |
| |
| |
| |
|
F-56
(18) DEPOSITS
The breakdown, by currency and sector, of the balances of this caption in the accompanying consolidated balance sheets is as follows:
| | | | | | |
| | | Thousands of Euros
|
| | | 2003
| | 2002
| | 2001
|
By currency: | | | | | | |
In euros | | 84,686,645 | | 83,469,150 | | 80,968,079 |
In foreign currencies | | 56,362,262 | | 63,091,215 | | 85,531,355 |
| | |
| |
| |
|
| | | 141,048,907 | | 146,560,365 | | 166,499,434 |
| | |
| |
| |
|
By sector: | | | | | | |
Public sector | | 8,114,961 | | 9,264,244 | | 6,637,674 |
Other resident sectors- | | | | | | |
Current accounts | | 37,018,177 | | 35,508,915 | | 34,653,467 |
Time deposits (Note 3-j) | | 17,465,890 | | 16,943,643 | | 17,007,765 |
Assets sold under repurchase agreement (Notes 6, 7, 8 and 9) | | 11,433,331 | | 11,768,772 | | 13,841,201 |
| | |
| |
| |
|
| | | 74,032,359 | | 73,485,574 | | 72,140,107 |
| | |
| |
| |
|
Non-resident sector | | | | | | |
Europe | | 10,914,154 | | 10,375,037 | | 11,277,271 |
United States | | 3,380,749 | | 5,220,043 | | 3,994,320 |
Latin America | | 44,673,444 | | 51,662,008 | | 73,275,468 |
Other countries | | 8,048,201 | | 5,817,703 | | 5,812,268 |
| | |
| |
| |
|
| | | 67,016,548 | | 73,074,791 | | 94,359,327 |
| | |
| |
| |
|
| | | 141,048,907 | | 146,560,365 | | 166,499,434 |
| | |
| |
| |
|
F-57
The detail, by due date, of the balances of the “Savings Accounts - Time” and “Other Deposits - Time” captions in the accompanying consolidated balance sheets is as follows:
| | | | | | |
| | | Thousands of Euros
|
| | | 2003
| | 2002
| | 2001
|
Savings accounts - Time- | | | | | | |
Up to 3 months | | 26,843,370 | | 43,060,188 | | 40,081,216 |
3 months to 1 year | | 10,288,636 | | 7,841,440 | | 12,770,250 |
1 to 5 years | | 17,367,542 | | 5,338,418 | | 10,829,710 |
Over 5 years | | 988,236 | | 1,196,306 | | 3,830,995 |
| | |
| |
| |
|
| | | 55,487,784 | | 57,436,352 | | 67,512,171 |
| | |
| |
| |
|
Other deposits – Time- | | | | | | |
Up to 3 months | | 20,180,434 | | 24,762,519 | | 27,593,148 |
3 months to 1 year | | 316,695 | | 622,128 | | 380,455 |
1 to 5 years | | 21,915 | | 15,621 | | 691 |
Over 5 years | | 17,108 | | — | | — |
| | |
| |
| |
|
| | | 20,536,152 | | 25,400,268 | | 27,974,294 |
| | |
| |
| |
|
The detail, by type and customer country of residence, of this caption as of December 31, 2003, 2002 and 2001, is as follows:
| | | | | | | | | | | | |
| | | Thousands of Euros
|
| | | Non- interest
bearing
| | Demand
| | Savings
Accounts
| | Time
| | Assets Sold with
Repurchase
Commitment
| | Total
|
2003: | | | | | | | | | | | | |
Resident sector | | 29 | | 26,830,621 | | 17,567,303 | | 13,818,180 | | 15,816,226 | | 74,032,359 |
Non-resident sector: | | | | | | | | | | | | |
Other European Countries | | 20,556 | | 1,293,638 | | 37,822 | | 9,471,164 | | 90,974 | | 10,914,154 |
United States | | 2 | | 570,411 | | 474,513 | | 1,692,390 | | 643,433 | | 3,380,749 |
Latin America | | 44,802 | | 12,010,725 | | 6,237,289 | | 22,541,658 | | 3,838,970 | | 44,673,444 |
Other | | 138 | | 1,844 | | 805 | | 7,964,392 | | 81,022 | | 8,048,201 |
| | |
| |
| |
| |
| |
| |
|
| | | 65,498 | | 13,876,618 | | 6,750,429 | | 41,669,604 | | 4,654,399 | | 67,016,548 |
| | |
| |
| |
| |
| |
| |
|
Total | | 65,527 | | 40,707,239 | | 24,317,732 | | 55,487,784 | | 20,470,625 | | 141,048,907 |
| | |
| |
| |
| |
| |
| |
|
2002: | | | | | | | | | | | | |
Resident sector | | 2,287,929 | | 23,761,849 | | 15,092,160 | | 17,168,228 | | 15,175,408 | | 73,485,574 |
Non-resident sector: | | | | | | | | | | | | |
Other European Countries | | 23,329 | | 2,143,040 | | 376,254 | | 7,722,321 | | 110,093 | | 10,375,037 |
United States | | — | | 639,256 | | 543,490 | | 4,035,634 | | 1,663 | | 5,220,043 |
Latin America | | 81,650 | | 12,895,011 | | 6,233,544 | | 24,731,737 | | 7,720,066 | | 51,662,008 |
Other | | 1 | | 2,030,937 | | 8,204 | | 3,778,432 | | 129 | | 5,817,703 |
| | |
| |
| |
| |
| |
| |
|
| | | 104,980 | | 17,708,244 | | 7,161,492 | | 40,268,124 | | 7,831,951 | | 73,074,791 |
| | |
| |
| |
| |
| |
| |
|
Total | | 2,392,909 | | 41,470,093 | | 22,253,652 | | 57,436,352 | | 23,007,359 | | 146,560,365 |
| | |
| |
| |
| |
| |
| |
|
2001: | | | | | | | | | | | | |
Resident sector | | 2,175,146 | | 23,520,377 | | 14,184,710 | | 17,677,110 | | 14,582,764 | | 72,140,107 |
Non-resident sector: | | | | | | | | | | | | |
Other European Countries | | 28,805 | | 1,412,789 | | 340,807 | | 8,129,603 | | 1,365,267 | | 11,277,271 |
United States | | 10,924 | | 650,884 | | 563,186 | | 2,742,938 | | 26,388 | | 3,994,320 |
Latin America | | 104,213 | | 17,501,761 | | 10,338,461 | | 35,663,467 | | 9,667,566 | | 73,275,468 |
Other | | 13,195 | | 2,488,186 | | 11,808 | | 3,299,053 | | 26 | | 5,812,268 |
| | |
| |
| |
| |
| |
| |
|
| | | 157,137 | | 22,053,620 | | 11,254,262 | | 49,835,061 | | 11,059,247 | | 94,359,327 |
| | |
| |
| |
| |
| |
| |
|
Total | | 2,332,283 | | 45,573,997 | | 25,438,972 | | 67,512,171 | | 25,642,011 | | 166,499,434 |
| | |
| |
| |
| |
| |
| |
|
F-58
(19) MARKETABLE DEBT SECURITIES
The breakdown, by type of security and currency, of the balances of the “Marketable Debt Securities - Bonds and Debentures Outstanding” account in the accompanying consolidated balance sheets as of December 31, 2003, 2002 and 2001, is as follows:
| | | | | | |
| | | Thousands of Euros
|
| | | 2003
| | 2002
| | 2001
|
In euros- | | | | | | |
Nonconvertible floating rate bonds and debentures | | 11,081,919 | | 6,877,013 | | 7,883,268 |
Nonconvertible bonds and debentures at weighted fixed rate of 4.71% (*) | | 3,944,170 | | 2,993,778 | | 2,238,299 |
Convertible debentures | | — | | 5,387 | | 7,879 |
Mortgage bonds | | 11,359,758 | | 8,416,727 | | 5,656,161 |
| | |
| |
| |
|
| | | 26,385,847 | | 18,292,905 | | 15,785,607 |
| | |
| |
| |
|
In foreign currencies- | | | | | | |
Nonconvertible floating rate bonds and debentures | | 672,068 | | 2,202,332 | | 2,611,650 |
Nonconvertible bonds and debentures at weighted fixed rate of 2.83% (**) | | 819,367 | | 1,538,140 | | 1,815,471 |
Floating rate mortgage bonds | | 381,691 | | 360,499 | | 426,370 |
| | |
| |
| |
|
| | | 1,873,126 | | 4,100,971 | | 4,853,491 |
| | |
| |
| |
|
| | | 28,258,973 | | 22,393,876 | | 20,639,098 |
| | |
| |
| |
|
| (*) | The interest rate refers to 2003, the equivalents in 2002 and 2001 were 5.27% and 5.79%. |
| (**) | The interest rate refers to 2003, the equivalents in 2002 and 2001 were 4% and 4.51%. |
The “Mortgage Bonds” account includes various issues with an average weighted interest rate of 4.65%, 4.82% and 5.83% in 2003, 2002 and 2001, respectively, and the final maturity of the last of them is in 2011. The nominal amount outstanding and the interest on the mortgage bonds are guaranteed, without a registration requirement, by such mortgages as may, at any time, be registered in favor of the Bank (the issuer), without prejudice to its financial liability.
In 2003, 2002 and 2001, BBVA Global Finance Ltd. launched various issues amounting to €4,678,266 thousand, €5,080,695 thousand and €5,594,750 thousand, respectively, within a medium-term foreign currency euro-bond program with a limit of €20,000 million (Note 21). These issues are denominated in euros, U.S. dollars, Japanese yens and various other currencies, have a fixed or variable yield based, in the latter case, on a floating annual return plus a variable issue or redemption premium dependent on certain factors.
The debt securities composing the balance of this caption as of December 31, 2003, are scheduled to mature (disregarding the possibility of the early redemption of certain issues) as follows:
| | |
Maturity
| | Thousands
of Euros
|
2004 | | 7,906,732 |
2005 | | 5,803,164 |
2006 | | 846,538 |
2007 | | 3,614,484 |
2008 | | 700,119 |
Subsequent years | | 9,387,936 |
| | |
|
| | | 28,258,973 |
| | |
|
F-59
Following is a breakdown, by due date and currency, of the balance of “Promissory Notes and Other Securities” in the accompanying consolidated balance sheets:
| | | | | | |
| | | Thousands of Euros
|
| | | 2003
| | 2002
| | 2001
|
By due date: | | | | | | |
Up to 3 months | | 4.085.117 | | 4,103,111 | | 3,253,591 |
3 months to 1 year | | 2.038.437 | | 1,018,879 | | 1,189,990 |
1 to 5 years | | 125 | | 7,406 | | 292,995 |
| | |
| |
| |
|
| | | 6.123.679 | | 5,129,396 | | 4,736,576 |
| | |
| |
| |
|
By currency: | | | | | | |
In euros | | 5.473.789 | | 3,379,742 | | 3,243,740 |
In other currencies | | 649.890 | | 1,749,654 | | 1,492,836 |
| | |
| |
| |
|
| | | 6.123.679 | | 5,129,396 | | 4,736,576 |
| | |
| |
| |
|
(20) PROVISIONS FOR CONTINGENCIES AND EXPENSES
The variations in 2003, 2002 and 2001 in the “Provisions for Contingencies and Expenses - Pension Provision” and “Provisions for Contingencies and Expenses - Other Provisions” captions in the accompanying consolidated balance sheets were as follows:
| | | | | | | | | | | | | | | | | | |
| | | Thousands of Euros
| |
| | | 2003
| | | 2002
| | | 2001
| |
| | | Pension
Provision
| | | Other
Provisions
| | | Pension
Provision
| | | Other
Provisions
| | | Pension
Provision
| | | Other
Provisions
| |
Beginning balances | | 2,621,907 | | | 2,221,411 | | | 2,358,552 | | | 2,425,588 | | | 1,823,098 | | | 1,209,736 | |
| | |
|
| |
|
| |
|
| |
|
| |
|
| |
|
|
Add- | | | | | | | | | | | | | | | | | | |
| | | | | | |
Provisions charged to income for the year | | 147,179 | | | 575,873 | | | 200,734 | | | 948,556 | | | 79,389 | | | 1,054,878 | |
Provision charged to reserves (Notes 2-h, 3-j and 24) | | 799,416 | | | — | | | 499,177 | | | — | | | 731,743 | | | — | |
Inclusion of companies in the Group | | — | | | 1,576 | | | — | | | 149 | | | 220 | | | 8,685 | |
Transfers of off-balance-sheet risks | | — | | | — | | | — | | | 86,278 | | | — | | | — | |
Transfers and other variations | | 103,621 | | | 324,052 | | | 159,927 | | | — | | | 81,067 | | | 429,951 | |
Less- | | | | | | | | | | | | | | | | | | |
Releases | | — | | | (697,080 | ) | | — | | | (546,724 | ) | | (84 | ) | | (155,398 | ) |
Payments to personnel taking early retirement (Note 3-j) | | (429,168 | ) | | — | | | (407,153 | ) | | — | | | (348,473 | ) | | — | |
Amounts used and other variations | | (211,042 | ) | | (91,250 | ) | | (189,330 | ) | | (692,193 | ) | | (8,408 | ) | | (122,264 | ) |
Transfers to off-balance-sheet risks | | — | | | (62,275 | ) | | — | | | — | | | — | | | — | |
Exclusion of companies from the Group | | — | | | (84,635 | ) | | — | | | (243 | ) | | — | | | — | |
| | |
|
| |
|
| |
|
| |
|
| |
|
| |
|
|
Ending balances (Note 2-f) | | 3,031,913 | | | 2,187,672 | | | 2,621,907 | | | 2,221,411 | | | 2,358,552 | | | 2,425,588 | |
| | |
|
| |
|
| |
|
| |
|
| |
|
| |
|
|
The provisions out of 2003 income to the “Pension Provision” were charged to the “Financial Expenses” (€69,893 thousand), “General Administrative Expenses” (€56,420 thousand) and “Extraordinary Losses” (€20,866
F-60
thousand) captions in the accompanying consolidated statement of income. The amounts charged to these captions in 2002 were €60,041 thousand, €39,067 thousand and €101,626 thousand, respectively. The amounts charged to these captions in 2001 were €42,480 thousand, €32,203 thousand and €4,706 thousand, respectively (Note 28).
The provisions out of 2003 income to “Other Provisions” were mainly charged to the “Market Operations” (€783 thousand) and “Extraordinary Losses” (€575,090 thousand) captions in the accompanying consolidated statement of income. The amounts charged to these captions in 2002 were €141,218 thousand and €785,267 thousand, respectively. The amounts charged to these captions in 2001 were €77,633 thousand and €880,218 thousand, respectively (Note 28). The reversals are recorded mainly in “Extraordinary Income” in the related accompanying consolidated statements of income.
The breakdown of the balances of the “Other Provisions” caption in the accompanying consolidated balance sheets as of December 31, 2003, 2002 and 2001, is as follows:
| | | | | | |
| | | Thousands of Euros
|
| | | 2003
| | 2002
| | 2001
|
Provisions for other commitments to employees (Notes 3-j and 3-k): | | | | | | |
Covered by shares (Note 3-i) | | 10,351 | | 9,921 | | 12,339 |
Other commitments | | 52,401 | | 46,183 | | 112,395 |
Provisions for contingencies | | 909,510 | | 877,691 | | 624,121 |
Provisions for off-balance-sheet risks (Notes 3-c and 8) | | 209,270 | | 271,545 | | 185,268 |
Provision for futures transactions (Notes 3-m and 26) | | 277,614 | | 280,721 | | 168,229 |
Other provisions (*) | | 728,526 | | 735,350 | | 1,323,236 |
| | |
| |
| |
|
| | | 2,187,672 | | 2,221,411 | | 2,425,588 |
| | |
| |
| |
|
| (*) | Includes the specific provision for Argentina (Note 3-o). |
Most of the provisions for contingencies are to cover tax contingencies.
The variations in 2003, in the “Other Provisions” caption in the accompanying consolidated balance sheets were as follows:
| | | | | | | | | | | | | | | | | | |
| | | Provisions for
other commitments
to employees
| | | Provisions for
contingencies
| | | Provisions for
off-balance sheet risks
| | | Provisions for
futures transactions
| | | Other
provisions
| | | Total
| |
Beginning Balances | | 56,104 | | | 877,691 | | | 271,545 | | | 280,721 | | | 735,350 | | | 2,221,411 | |
| | |
|
| |
|
| |
|
| |
|
| |
|
| |
|
|
Add- | | | | | | | | | | | | | | | | | | |
Provisions charged to income for the year | | 13,746 | | | 45,067 | | | 2,572 | | | 14,534 | | | 499,954 | | | 575,873 | |
Inclusion of companies in the group | | 1,443 | | | — | | | — | | | — | | | 133 | | | 1,576 | |
Transfers to off-balance-sheet risks | | — | | | — | | | — | | | — | | | — | | | — | |
Transfers and other variations | | 353 | | | 230,157 | | | 29 | | | — | | | 93,513 | | | 324,052 | |
Less- | | | | | | | | | | | | | | | | | | |
Releases | | (4,892 | ) | | (323,858 | ) | | (59,181 | ) | | (11,213 | ) | | (297,936 | ) | | (697,080 | ) |
Amounts used and other variations | | — | | | — | | | — | | | — | | | — | | | — | |
Exclusion of companies from the Group | | — | | | — | | | — | | | — | | | (84,635 | ) | | (84,635 | ) |
Transfers and exchanges differencies | | (4,002 | ) | | 80,453 | | | (5,695 | ) | | (6,428 | ) | | (155,578 | ) | | (91,250 | ) |
Transfers to off-balance-sheet risks | | — | | | — | | | | | | — | | | (62,275 | ) | | (62,275 | ) |
Ending balances | | 62,752 | | | 909,510 | | | 209,270 | | | 277,614 | | | 728,526 | | | 2,187,672 | |
| | |
|
| |
|
| |
|
| |
|
| |
|
| |
|
|
F-61
(21) SUBORDINATED DEBT
The detail of the balances of the “Subordinated Debt” caption in the accompanying consolidated balance sheets as of December 31, 2003, 2002 and 2001, is as follows:
| | | | | | | | | | | |
ISSUER
| | Thousands of Euros
| | Interest Rate at 12/31/03
| | | Final Maturity
Date
|
| | 2003
| | 2002
| | 2001
| | |
Issues in euros- | | | | | | | | | | | |
BANCO BILBAO VIZCAYA ARGENTARIA, S.A.: | | | | | | | | | | | |
July 1996 | | 84,142 | | 84,142 | | 84,142 | | 9.33 | % | | December 2006 |
July 1996 | | 27,947 | | 27,947 | | 27,947 | | 9.37 | % | | December 2016 |
February 1997 | | 60,101 | | 60,101 | | 60,101 | | 6.97 | % | | December 2007 |
September 1997 | | 36,061 | | 36,061 | | 36,061 | | 6.65 | % | | December 2007 |
December 2001 | | 1,500,000 | | 1,500,000 | | 1,500,000 | | 3.52 | % | | January 2017 |
July 2003 | | 600,000 | | — | | — | | 2.53 | % | | July 2013 |
November 2003 | | 750,000 | | — | | — | | 4.50 | % | | November 2015 |
BBVA CAPITAL FUNDING, LTD.: | | | | | | | | | | | |
September 1995 | | 13,613 | | 13,613 | | 13,613 | | 1.57 | % | | September 2005 |
March 1997 | | 45,735 | | 45,735 | | 45,735 | | 2.36 | % | | March 2007 |
October 1997 | | 76,694 | | 76,694 | | 76,694 | | 2.33 | % | | October 2007 |
October1997 | | 228,674 | | 228,674 | | 228,674 | | 6.00 | % | | December 2009 |
July 1999 | | 73,000 | | 73,000 | | 73,000 | | 6.35 | % | | October 2015 |
February 2000 | | 500,000 | | 500,000 | | 500,000 | | 6.38 | % | | February 2010 |
December 2000 | | 750,000 | | 750,000 | | 750,000 | | 2.77 | % | | December 2010 |
July 2001 | | 500,000 | | 500,000 | | 500,000 | | 5.50 | % | | July 2011 |
October 2001 | | 60,000 | | 60,000 | | 60,000 | | 5.73 | % | | October 2011 |
October 2001 | | 40,000 | | 40,000 | | 40,000 | | 6.08 | % | | October 2016 |
October 2001 | | 50,000 | | 50,000 | | 50,000 | | 2.73 | % | | October 2016 |
November 2001 | | 55,000 | | 55,000 | | 55,000 | | 2.86 | % | | November 2016 |
December 2001 | | 56,000 | | 56,000 | | 56,000 | | 4.16 | % | | December 2016 |
Issues in foreign currencies- | | | | | | | | | | | |
BBVA GLOBAL FINANCE, LTD.: | | | | | | | | | | | |
July 1995 USD | | 118,765 | | 143,034 | | 170,203 | | 6.88 | % | | July 2005 |
July 1995 USD | | 39,588 | | 47,678 | | 56,734 | | 1.61 | % | | January 2005 |
December 1995 USD | | 59,382 | | 71,517 | | 85,102 | | 1.36 | % | | May 2005 |
December 1995 USD | | 59,382 | | 71,517 | | 85,102 | | 1.36 | % | | May 2006 |
December 1995 USD | | 158,353 | | 190,712 | | 226,937 | | 7.00 | % | | December 2025 |
BILBAO VIZCAYA INVESTMENTS BV: | | | | | | | | | | | |
July 1996 | | — | | — | | 601 | | — | | | July 2006 |
BBVA CHILE, S.A. CLP | | 30,359 | | 41,714 | | 53,083 | | Several | | | Several |
BBVA BANCO FRANCES, S.A. ARS | | 5,294 | | 29,473 | | 88,601 | | Several | | | Several |
BBVA CAPITAL FUNDING, LTD.: | | | | | | | | | | | |
July 1995 USD | | 79,177 | | 95,356 | | 113,469 | | 1.57 | % | | September 2004 |
August 1995 JPY | | 22,214 | | 24,117 | | 26,013 | | 3.45 | % | | August 2010 |
September 1995 | | — | | — | | 113,469 | | — | | | September 2007 |
October 1995 JPY | | 74,047 | | 80,392 | | 86,707 | | 5.40 | % | | October 2015 |
October 1995 USD | | 118,765 | | 143,034 | | 170,203 | | 6.88 | % | | October 2005 |
February 1996 USD | | 197,942 | | 238,391 | | 283,672 | | 6.38 | % | | February 2006 |
November 1996 USD | | 158,353 | | 190,712 | | 226,937 | | 1.54 | % | | November 2006 |
February 1997 | | — | | — | | 170,203 | | — | | | February 2007 |
BBVA PUERTO RICO | | — | | 15,418 | | — | | 6.25 | % | | Several |
BBVA BANCOMER: | | | | | | | | | | | |
Convertible debentures - Dec. 1996 | | — | | — | | 34,083 | | | | | December 2006 |
Nonconvertible debentures – November 1998 MXN | | 176,202 | | 232,243 | | 309,753 | | Several | | | Several |
Bancomer Gran Cayman (various) USD | | 198,814 | | 237,883 | | 398,370 | | Several | | | 2004 |
BBVA Bancomer | | — | | — | | 32,524 | | — | | | Several |
Bancomer UDIS - December 1996 | | — | | — | | 154,714 | | — | | | March 2002 |
GRUPO FINANCIERO BBVA BANCOMER: | | | | | | | | | | | |
BBVA BANCOMER CAPITAL TRUST: | | | | | | | | | | | |
February 2001 (Note 4) USD | | 395,883 | | 476,784 | | 567,344 | | 10.05 | % | | February 2011 |
| | |
| |
| |
| | | | | |
| | | 7,399,487 | | 6,486,942 | | 7,610,791 | | | | | |
| | |
| |
| |
| | | | | |
These issues are classified as subordinated debt and, accordingly, are deemed to have a lower seniority than all the accounts payable to common creditors.
F-62
The detail, by due date, of the balance of the “Subordinated Debt” caption in the consolidated balance sheet as of December 31, 2003, is as follows:
| | |
Maturity
| | Thousands
of Euros
|
2004 | | 266,615 |
2005 | | 356,396 |
2006 | | 677,009 |
2007 | | 219,713 |
2008 | | 2,702 |
Subsequent years | | 5,877,052 |
| | |
|
| | | 7,399,487 |
| | |
|
The issues of BBVA Capital Funding, Ltd. and BBVA Global Finance, Ltd. are guaranteed (secondary liability) by the Bank.
The issue by Bilbao Vizcaya Investment BV, of US$ 250 million, was redeemed early in January 2002 through conversion of the bonds into shares of the Bank. This exchange was performed at the fixed conversion rate of €3.99 euros per share, which gave rise to the delivery of 377,330 previously-issued shares. In 2001 bonds with a face value of US$ 5.42 million were exchanged for the equivalent of 1,048,787 Bank shares already issued. These transactions did not give rise to material gains. As of December 31, 2001, the bonds outstanding amounted to US$ 2.4 million (face value).
The interest on the subordinated debt amounted to €327,554 thousand in 2003, €405,775 thousand in 2002 and €429,694 thousand in 2001 (Note 28).
(22) MINORITY INTERESTS
The variations in 2003, 2002 and 2001 in the balances of this caption in the accompanying consolidated balance sheets were as follows:
| | | | | | | | | |
| | | Thousands of Euros
| |
| | | 2003
| | | 2002
| | | 2001
| |
Beginning balance | | 5,674,163 | | | 6,394,029 | | | 6,304,286 | |
Prior year’s net income | | 746,919 | | | 645,223 | | | 681,800 | |
| | |
|
| |
|
| |
|
|
| | | 6,421,082 | | | 7,039,252 | | | 6,986,086 | |
Capital increases and reductions | | (88 | ) | | 714,451 | | | 226,731 | |
Dividends paid to minority shareholders | | (353,283 | ) | | (343,029 | ) | | (501,779 | ) |
Changes in the composition of the Group and changes in the percentages of ownership (Note 4) | | (88,372 | ) | | (438,191 | ) | | (440,247 | ) |
Exchange differences (Note 3-b) | | (210,754 | ) | | (1,364,210 | ) | | 172,521 | |
Other variations (*) | | (342,667 | ) | | 65,890 | | | (49,283 | ) |
| | |
|
| |
|
| |
|
|
Share in income for the year | | 670,463 | | | 746,919 | | | 645,223 | |
| | |
|
| |
|
| |
|
|
Ending balance | | 6,096,381 | | | 6,421,082 | | | 7,039,252 | |
| | |
|
| |
|
| |
|
|
| (*) | This caption includes, inter alia, redemptions/issuances of preferred shares that took place in 2003, 2002 and 2001. |
F-63
The breakdown, by company, of the “Minority Interests” caption in the accompanying consolidated balance sheets as of December 31, 2003, 2002 and 2001, is as follows:
| | | | | | | |
| | | Thousands of Euros
|
| | | 2003
| | | 2002
| | 2001
|
Preferred shares- | | | | | | | |
BBVA International, Ltd. (1) | | 3,040,000 | | | 3,216,505 | | 2,295,794 |
BBVA Preferred Capital, Ltd. (2) | | 190,024 | | | 198,993 | | 523,722 |
BBVA Privanza International (Gibraltar), Ltd. (2) | | 55,424 | | | 266,152 | | 663,175 |
BBVA Capital Funding, Ltd. (3) | | 255,646 | | | 418,496 | | 550,930 |
BBVA Capital Finance, S.A. | | 350,000 | | | — | | — |
| | |
|
| |
| |
|
| | | 3,891,094 | | | 4,100,146 | | 4,033,621 |
| | |
|
| |
| |
|
By company- | | | | | | | |
BBVA Bancomer Group | | 884,710 | | | 957,149 | | 1,079,124 |
BBVA Banco Francés Group | | (3,542 | ) | | 18,836 | | 212,115 |
BBVA Banco Ganadero Group | | 8,969 | | | 11,748 | | 18,709 |
BBVA Chile Group | | 102,103 | | | 103,295 | | 145,511 |
BBVA Banco Continental Group | | 104,043 | | | 104,339 | | 159,773 |
BBVA Banco Provincial Group | | 109,862 | | | 117,890 | | 271,958 |
Provida Group | | 58,631 | | | 50,636 | | 47,558 |
Banc Internacional d’Andorra, S.A. | | 133,803 | | | 91,008 | | 69,080 |
Brunara, SIMCAV, S.A. (Note 4) | | — | | | — | | 284,212 |
Other companies | | 136,245 | | | 119,116 | | 72,368 |
| | |
|
| |
| |
|
| | | 1,534,824 | | | 1,574,017 | | 2,360,408 |
| | |
|
| |
| |
|
| | | 5,425,918 | | | 5,674,163 | | 6,394,029 |
| | |
|
| |
| |
|
| (1) | Listed on the Spanish AIAF fixed-income market, and the Luxembourg, Frankfurt and Amsterdam stock markets. |
| (2) | Listed on the New York stock market |
| (3) | Listed on the London and Frankfurt stock markets. |
The breakdown, by company, of the share in income for the years ended December 31, 2003, 2002 and 2001, is as follows:
| | | | | | | | |
| | | Thousands of Euros
| |
| | | 2003
| | 2002
| | | 2001
| |
Preferred shares- | | | | | | | | |
BBVA International, Ltd. | | 165,237 | | 167,743 | | | 146,286 | |
BBVA Preferred Capital, Ltd. | | 16,295 | | 29,862 | | | 32,280 | |
BBVA Privanza International (Gibraltar), Ltd. | | 12,516 | | 43,925 | | | 95,074 | |
BBVA Capital Funding, Ltd. | | 20,113 | | 34,099 | | | 41,542 | |
BBVA Capital Finance, S.A. | | 288 | | — | | | — | |
| | |
| |
|
| |
|
|
| | | 214,449 | | 275,629 | | | 315,182 | |
| | |
| |
|
| |
|
|
By company- | | | | | | | | |
BBVA Bancomer group | | 289,779 | | 317,813 | | | 427,812 | |
BBVA Banco Francés group | | 932 | | 14,380 | | | (212,115 | ) |
BBVA Banco Ganadero group | | 2,412 | | 1,109 | | | 535 | |
BBVA Chile group | | 7,413 | | 5,373 | | | 8,330 | |
BBVA Banco Continental group | | 27,956 | | 30,900 | | | (15,710 | ) |
BBVA Banco Provincial group | | 71,595 | | 65,649 | | | 62,619 | |
Provida group | | 11,276 | | 13,232 | | | 25,807 | |
Banc Internacional d’Andorra, S.A. | | 34,992 | | 46,498 | | | 60,973 | |
Brunara, SIMCAV, S.A. (Note 4) | | — | | — | | | (20,921 | ) |
Other companies | | 9,659 | | (23,664 | ) | | (7,289 | ) |
| | |
| |
|
| |
|
|
| | | 456,014 | | 471,290 | | | 330,041 | |
| | |
| |
|
| |
|
|
| | | 670,463 | | 746,919 | | | 645,223 | |
| | |
| |
|
| |
|
|
F-64
The foregoing balances include various issues of noncumulative, nonvoting, preferred stock guaranteed by Banco Bilbao Vizcaya Argentaria, S.A., the detail of which is as follows:
| | | | | | | | | | | | | | | | | | |
| | | | | Issued Amount (Millions)
| | Fixed Annual Dividend
| |
| | | | | 2003
| | 2002
| | 2001
| | 2003
| | | 2002
| | | 2001
| |
BBVA Privanza International (Gibraltar), Ltd.- | | | | | | | | | | | | | | | | | | |
December 1992 | | US$ | | | — | | — | | 100 | | — | | | — | | | 9.00 | % |
June 1993 | | US$ | | | — | | 248 | | 248 | | — | | | 8.00 | % | | 8.00 | % |
June 1997 | | US$ | | | 70 | | 70 | | 70 | | 7.76 | % | | 7.76 | % | | 7.76 | % |
June 1997 | | US$ | | | — | | — | | 250 | | — | | | — | | | 8.00 | % |
BBVA International, Ltd.- | | | | | | | | | | | | | | | | | | |
March 1998 | | US$ | | | — | | 350 | | 350 | | — | | | 7.20 | % | | 7.20 | % |
November 1998 | | € | | | 700 | | 700 | | 700 | | 6.24 | % | | 6.24 | % | | 6.24 | % |
February 1999 | | € | | | 1,000 | | 1,000 | | 1,000 | | 5.76 | % | | 5.76 | % | | 5.76 | % |
April 2001 | | € | | | 340 | | 340 | | 340 | | 7.01 | % | | 7.01 | % | | 7.01 | % |
March 2002 | | € | | | 500 | | 500 | | — | | 3.50 | % | | 3.94 | % | | — | |
December 2002 | | € | | | 500 | | 500 | | — | | 3.25 | % | | 3.94 | % | | — | |
BBVA Capital Funding, Ltd.- | | | | | | | | | | | | | | | | | | |
April 1995 | | € | | | — | | — | | 500 | | — | | | — | | | 9.00 | % |
April 1998 | | € | | | 256 | | 256 | | 256 | | 6.35 | % | | 6.35 | % | | 6.35 | % |
April 1998 | | US$ | | | — | | 200 | | 200 | | — | | | 7.20 | % | | 7.20 | % |
BBVA Preferred Capital, Ltd.- | | | | | | | | | | | | | | | | | | |
June 1997 | | US$ | | | — | | — | | 250 | | — | | | — | | | 7.80 | % |
June 2001 | | US$ | | | 240 | | 240 | | 240 | | 7.75 | % | | 7.75 | % | | 7.75 | % |
BBVA Capital Finance, S.A. | | | | | | | | | | | | | | | | | | |
December 2003 | | € | | | 350 | | — | | — | | 3.00 | % | | — | | | — | |
These issues were subscribed by third parties outside the Group and are wholly or partially redeemable at the Company’s option after five or ten years from the issue date, depending on the terms of each issue.
(23) CAPITAL STOCK
As of December 31, 2003, 2002 and 2001 the capital stock of Banco Bilbao Vizcaya Argentaria, S.A. amounted to €1,565,967,501.07, and consisted of 3,195,852,043 fully subscribed and paid registered shares of €0.49 par value each.
There were no variations in the Bank’s capital stock in 2003, 2002 and 2001.
The shares of Banco Bilbao Vizcaya Argentaria, S.A. are listed on the computerized trading system of the Spanish stock exchanges and on the New York, Frankfurt, London, Zurich, Milan and Buenos Aires stock markets. Also, as of December 31, 2003, the shares of Grupo Financiero BBVA-Bancomer, S.A., BBVA Banco Continental, S.A., Banco Provincial C.A., BBVA Banco Ganadero, S.A., BBVA Chile, S.A., BBVA Banco Francés, S.A. and AFP Provida were listed on their respective local stock markets and, in the case of the last three entities, on the New York Stock Exchange. In addition, Grupo Financiero BBVA Bancomer, S.A. and BBVA Banco Francés, S.A. are listed on the Latin-American market of the Madrid Stock Exchange.
F-65
The variations in 2003, 2002 and 2001 in the “Treasury Stock” caption on the asset side of the accompanying consolidated balance sheets were as follows:
| | | | | | | | | | | | |
| | | Thousands of Euros
| |
| | | Par Value
| | | Remaining
Portion up to
Cost
| | | Securities
Revaluation
Reserve
(Note 3-i)
| | | TOTAL
| |
Balance at December 31, 2000 | | 5,169 | | | 154,334 | | | (46,795 | ) | | 112,708 | |
| | |
|
| |
|
| |
|
| |
|
|
Purchases (Note 4) | | 110,743 | | | 3,218,603 | | | — | | | 3,329,346 | |
Sales | | (112,925 | ) | | (3,291,398 | ) | | — | | | (3,404,323 | ) |
Net release of the securities revaluation reserve (Note 3-i) | | — | | | — | | | 38,213 | | | 38,213 | |
| | |
|
| |
|
| |
|
| |
|
|
Balance at December 31, 2001 | | 2,987 | | | 81,539 | | | (8,582 | ) | | 75,944 | |
| | |
|
| |
|
| |
|
| |
|
|
Purchases (Note 4) | | 195,077 | | | 4,251,285 | | | — | | | 4,446,362 | |
Sales | | (192,675 | ) | | (4,237,173 | ) | | — | | | (4,429,848 | ) |
Net release of the securities revaluation reserve (Note 3-i) | | — | | | — | | | 7,833 | | | 7,833 | |
Other variations | | (105 | ) | | (2,515 | ) | | — | | | (2,620 | ) |
| | |
|
| |
|
| |
|
| |
|
|
Balance at December 31, 2002 | | 5,284 | | | 93,136 | | | (749 | ) | | 97,671 | |
| | |
|
| |
|
| |
|
| |
|
|
Purchases (Note 4) | | 200,711 | | | 3,566,322 | | | — | | | 3,767,033 | |
Sales | | (202,332 | ) | | (3,795,463 | ) | | — | | | (3,997,795 | ) |
Net charge to the securities revaluation reserve (Note 3-i) | | — | | | — | | | (15,115 | ) | | (15,115 | ) |
Other variations | | 5 | | | 214,260 | | | — | | | 214,265 | |
| | |
|
| |
|
| |
|
| |
|
|
Balance at December 31, 2003 | | 3,668 | | | 78,255 | | | (15,864 | ) | | 66,059 | |
| | |
|
| |
|
| |
|
| |
|
|
Securities revaluation reserves to cover treasury stock were recorded amounting to €15,864 thousand, €749 thousand and €8,582 thousand, as of December 31, 2003, 2002 and 2001, respectively. The net provisions to/releases of securities revaluation reserves in 2003, 2002 and 2001 due to disposals of treasury stock amounted to €2,643 thousand, €1,053 thousand and €40,538 thousand, respectively, and were recorded in 2003 under the “Income on Group Transactions” captions, in 2002 under the “Losses on Group Transactions” caption and in 2001 under the “Income on Group Transactions” caption, in the accompanying consolidated statements of income.
As of December 31, 2003 and 2002, the Bank held treasury stock with a nominal value of €2,509 thousand and €5,242 thousand, respectively, to cover futures transactions related to the performance of certain stock market indexes. As of December 31, 2001, the Bank held treasury stock with a nominal value of less than €1,000 (Note 26).
From January 2001 through December 31, 2001, the percentage of outstanding shares held by BBVA and its consolidated companies varied from 0.4506% to 0.0470% calculated on a monthly basis. From January 2002 through December 31, 2002, the percentage of outstanding shares held by BBVA and its consolidated companies varied from 0.13% to 0.74% calculated on a monthly basis. From January 2003 through December 31, 2003, the percentage of outstanding shares held by BBVA and its consolidated companies varied from 0.153% to 0.683% calculated on a monthly basis.
The gains and losses on treasury stock transactions, amounting to €16,048 thousand and €18,758 thousand, respectively, in 2003, €15,802 thousand and €23,898 thousand, respectively, in 2002 and €33,843 thousand and €31,859 thousand, respectively, in 2001, are recorded under the “Income on Group Transactions” and “Losses on Group Transactions” captions, respectively, in the accompanying consolidated statements of income.
F-66
As of December 31, 2002 and 2001, there were no individual equity investments of over 5% in the Bank’s capital stock. However, as of December 31, 2003, Chase Nominees Ltd., in its capacity as an international custodian bank, owned 5.25% of the Bank’s capital stock. As of December 31, 2003, 2002 and 2001, Fundación Banco Bilbao Vizcaya, a private not-for-profit charitable, educational and cultural institution set up in 1988 with a contribution of €84,142 thousand from the Bank which was charged to the merger surpluses, owned a total of 34,365,852 shares of the Bank.
On March 1, 2003, the Shareholders’ Meeting authorized, in accordance with the stipulations of Article 153.1.a) of the Spanish Corporations Law, a capital increase of €782,983,750 and the delegation to the Board of Directors, for the legally stipulated period of one year, of the required powers to fully or partially execute the aforementioned capital increase, and provided for the possibility of not performing the authorized capital increase. As of December 31, 2003, the Board of Directors had not performed the authorized capital increase. In addition, the aforementioned Shareholders’ Meeting authorized the issuance of up to €6,000 million of debentures convertible to and/or exchangeable for Bank shares. As of December 31, 2003, no issue had been made under this authorization.
As of December 31, 2003, the additional capital stock authorized by the Shareholders’ Meeting on March 9, 2002, amounted to €782,983,750. The legally stipulated period within which the directors can carry out this increase is five years. As of December 31, 2003, the directors had not made use of this authorization. Also, the aforementioned Shareholders’ Meeting in March 2002 authorized the Board of Directors, for a five-year period, to issue up to €20,000 million of bonds of any class or type. As of December 31, 2003, an issue of bonds of up to €10,000 million had been recorded.
Also, the aforementioned Shareholders’ Meeting in March 2002 authorized the Board of Directors to issue, on one or several occasions, warrants on shares of the Company up to a maximum of €1,500 million, fully or partially convertible to or exchangeable for Company shares over a maximum period of five years. None of these securities had been issued as of December 31, 2003.
As of December 31, 2003, 2002 and 2001, there were no capital increases in progress at any of the companies in the Finance Group.
(24) RETAINED EARNINGS
The variations in 2003, 2002 and 2001 in the “Retained earnings” captions in the accompanying consolidated balance sheets were as follows:
| | | | | | | | | | | | | | |
| | | Thousands of Euros
| |
| | | Additional Paid-in
Capital
| | | Retaines
earnings
| | | Revaluation
Reserves
| | Net Reserves
and
Accumulated
Losses at
Consolidated
Companies
| | | TOTAL
| |
Balances at January 1, 2001 | | 6,873,827 | | | 1,027,258 | | | 176,281 | | 3,403,778 | | | 11,481,144 | |
| | |
|
| |
|
| |
| |
|
| |
|
|
Prior year’s net income | | — | | | 1,380,574 | | | — | | 593,006 | | | 1,973,580 | |
Dividends out of prior year’s net income | | — | | | (1,138,773 | ) | | — | | 8,193 | | | (1,130,580 | ) |
Recording of provisions for early retirement, net of taxes (Notes 2-h, 3-j and 20) | | (38,886 | ) | | (432,894 | ) | | — | | (7,461 | ) | | (479,241 | ) |
Exchange differences arising from consolidation (Notes 3-b and 4) | | — | | | — | | | — | | (593,860 | ) | | (593,860 | ) |
Transfers and other variations | | — | | | 583,053 | | | — | | (629,757 | ) | | (46,704 | ) |
| | | | | |
Balances at December 31, 2001 | | 6,834,941 | | | 1,419,218 | | | 176,281 | | 2,773,899 | | | 11,204,339 | |
Prior year’s net income | | — | | | 1,311,561 | | | — | | 531,509 | | | 1,843,070 | |
Dividends out of prior year’s net income | | — | | | (1,224,010 | ) | | — | | 4,398 | | | (1,219,612 | ) |
Recording of provisions for early retirement, net of taxes (Notes 2-h, 3-j and 20) | | (224,589 | ) | | (96,512 | ) | | — | | (3,364 | ) | | (324,465 | ) |
Exchange differences arising from consolidation (Notes 3-b and 4) | | — | | | — | | | — | | (1,246,358 | ) | | (1,246,358 | ) |
Transfers and other variations | | (97,555 | ) | | (638,773 | ) | | — | | 754,984 | | | 18,656 | |
| | | | | |
Balances at December 31, 2002 | | 6,512,797 | | | 771,484 | | | 176,281 | | 2,815,068 | | | 10,275,630 | |
| | |
|
| |
|
| |
| |
|
| |
|
|
Prior year’s net income | | — | | | 1,207,096 | | | — | | 512,033 | | | 1,719,129 | |
Dividends out of prior year’s net income | | — | | | (1,112,156 | ) | | — | | 3,120 | | | (1,109,036 | ) |
Recording of provisions for early retirement, net of taxes (Notes 2-h, 3-j and 20) | | (237,382 | ) | | (277,662 | ) | | — | | (4,576 | ) | | (519,620 | ) |
Exchange differences arising from consolidation (Notes 3-b and 4) | | — | | | — | | | — | | (339,284 | ) | | (339,284 | ) |
Transfers and other variations | | (1,514 | ) | | 382,715 | | | — | | (500,509 | ) | | (119,308 | ) |
| | |
|
| |
|
| |
| |
|
| |
|
|
Balance at December 31, 2003 | | 6,273,901 | | | 971,477 | | | 176,281 | | 2,485,852 | | | 9,907,511 | |
| | |
|
| |
|
| |
| |
|
| |
|
|
F-67
Additional paid-in capital-
This caption in the accompanying consolidated balance sheets includes the surpluses arising from the merger of Banco Bilbao, S.A. and Banco Vizcaya, S.A. (Note 1), the detail of which is as follows:
| | | |
| | | Thousands of Euros
| |
Revaluation of: | | | |
- Buildings | | 592,243 | |
- Equity securities portfolio | | 278,383 | |
Less- | | | |
Appropriations in 1988 | | (229,484 | ) |
| | |
|
|
| | | 641,142 | |
| | |
|
|
The revised Corporations Law expressly permits the use of the additional paid-in capital balance to increase capital and establishes no specific restrictions as to its use.
Retained earnings and revaluation reserves-
The detail of these captions in the accompanying consolidated balance sheets, which include the reserves of the Group attributed to the Bank, is as follows:
| | | | | | |
| | | Thousands of Euros
|
| | | 2003
| | 2002
| | 2001
|
Restricted reserves- | | | | | | |
Legal reserve | | 313,194 | | 313,194 | | 313,194 |
Restricted reserve for retired capital stock | | 87,918 | | 87,918 | | 87,918 |
Restricted reserve for Parent Company shares | | 76,812 | | 121,140 | | 30,923 |
Restricted reserve for redenomination of capital stock in euros | | 1,861 | | 1,861 | | 1,861 |
Revaluation reserves Royal Decree-Law 7/1996 | | 176,281 | | 176,281 | | 176,281 |
Unrestricted reserves- | | | | | | |
Voluntary and other reserves | | 6,551 | | 6,551 | | 6,551 |
Consolidation reserves attributed to the Bank | | 485,141 | | 240,820 | | 978,771 |
| | |
| |
| |
|
| | | 1,147,758 | | 947,765 | | 1,595,499 |
| | |
| |
| |
|
F-68
Legal reserve-
According to the revised Corporations Law, 10% of the income for each year must be transferred to the legal reserve. These amounts must be transferred until the balance of this reserve reaches 20% of capital stock. This limit had already been reached by Banco Bilbao Vizcaya Argentaria, S.A. as of December 31, 2003, 2002 and 2001. The legal reserve can be used to increase capital provided that the remaining reserve balance does not fall below 10% of the increased capital stock amount.
Except as mentioned above, until the legal reserve exceeds 20% of capital stock, it can only be used to offset losses, provided that sufficient other reserves are not available for this purpose.
Restricted reserves-
According to the revised Corporations Law and to Law 46/1998 on the introduction of the euro, the respective restricted reserves were recorded in relation to treasury stock held by the Group, to customer loans secured by shares of the Bank, to the reduction of the par value of each share in April 2000 and to the redenomination of capital stock in euros.
Asset revaluation reserves (Notes 3-e and 3-h)-
Prior to the merger, Banco de Bilbao, S.A. and Banco de Vizcaya, S.A. availed themselves of the asset revaluation provisions of the applicable enabling legislation. In addition, on December 31, 1996, the Bank revalued its property and equipment pursuant to Royal Decree-Law 7/1996 by applying the maximum coefficients authorized, up to the limit of the market value arising from the existing valuations. The resulting increases in the cost and accumulated depreciation of property and equipment and, where appropriate, in the cost of equity securities, were allocated as follows:
| | | |
| | | Thousands of Euros
| |
Legal revaluations of property and equipment: | | | |
Cost | | 186,692 | |
Less- | | | |
Single revaluation tax (3%) | | (5,601 | ) |
| | |
|
|
Balance at December 31, 1999 | | 181,091 | |
| | |
|
|
Adjustment as a result of review by the tax authorities in 2000 | | (4,810 | ) |
| | |
|
|
Balance at December 31, 2000, 2001, 2002 and 2003 | | 176,281 | |
| | |
|
|
Subsequent to the review of the balance of the “Revaluation Reserves Royal Decree-Law 7/1996” account by the tax authorities in 2000, it can only be used, free of tax, to offset recorded losses and to increase capital stock through January 1, 2007. From that date, the remaining balance of this account can be taken to unrestricted reserves, provided that the surplus has been depreciated or the revalued assets have been transferred or written off. If this balance were used in a manner other than that provided for in Royal Decree-Law 7/1996, it would be subject to tax.
F-69
Reserves and accumulated losses at consolidated companies-
The breakdown, by company, of these captions in the accompanying consolidated balance sheets is as follows:
| | | | | | |
| | | Thousands of Euros
|
| | | 2003
| | 2002
| | 2001
|
Reserves at consolidated companies- | | | | | | |
Fully or proportionally consolidated companies: | | | | | | |
Holding Continental, S.A. | | 24,714 | | 164,864 | | 89,557 |
Ancla Investments, S.A. | | 89,556 | | 83,430 | | 78,642 |
Banc Internacional d’Andorra, S.A. | | 81,080 | | 75,145 | | 58,527 |
BBVA Puerto Rico, S.A. | | 169,567 | | 158,443 | | 160,596 |
Banco Industrial de Bilbao, S.A. | | 82,649 | | 80,459 | | 66,790 |
Banco Provincial, S.A. | | 213,803 | | 45,520 | | 152,243 |
BBVA Privanza Bank (Jersey), Ltd. | | 59,128 | | 54,781 | | 49,175 |
Canal International Holding, S.A. | | 466,741 | | 494,888 | | 400,082 |
Cía. de Cartera e Inversiones, S.A. | | 29,406 | | — | | 107,094 |
Corporación General Financiera, S.A. | | 605,536 | | 586,490 | | 419,464 |
BBVA Chile, S.A. | | 56,195 | | 59,092 | | 57,439 |
Banco de Crédito Local, S.A. | | — | | 32,997 | | 61,904 |
BBVA Cartera de Inversión SIMCAV | | 54,783 | | 55,311 | | 56,627 |
Grupo Financiero BBVA Bancomer, S.A. de C.V. | | — | | — | | 4,760 |
Cía. Chilena de Inversiones, S.L. | | 66,463 | | 108,309 | | 117,973 |
BBVA Bancomer Servicios, S.A. | | 291,440 | | 230,696 | | 197,607 |
BBVA Bolsa, S.V., S.A. (Note 4) | | — | | 90,073 | | 75,355 |
Sdad. De Estudios y Análisis Financieros, S.A. | | 58,316 | | 55,185 | | 58,268 |
BBV América, S.L. | | 203,172 | | 354,912 | | 317,749 |
BBVA Privanza Bank (Switzerland) Ltd. | | 91,734 | | 72,941 | | 52,348 |
Banco Francés (Cayman) Ltd. | | 302,869 | | 36,343 | | 86,371 |
Bilbao Vizcaya Holding, S.A. | | 7,854 | | 33,744 | | 46,404 |
Corporación Industrial y de Servicios, S.L. | | — | | — | | 162,472 |
Bilbao Vizcaya América B.V. | | — | | — | | 108,284 |
Casa de Bolsa BBV Probursa, S.A. de C.V. | | 57,655 | | 56,030 | | 51,753 |
Corporación IBV Servicios y Tecnologías, S.A. | | 56,142 | | 114,304 | | 91,005 |
BBVA Participaciones Internacionales, S.L. | | 32,802 | | 28,406 | | 54,518 |
BBVA Banco Ganadero, S.A. | | 40,230 | | 48,261 | | — |
BBVA Banco Francés, S.A. | | — | | 134,690 | | 95,783 |
Consolidar A.F.J.P. | | 50,203 | | 71,801 | | 4,063 |
Inversora Otar, S.A. | | 95,544 | | 192,444 | | — |
BBVA Renting, S.A. | | 43,222 | | 36,162 | | 32,665 |
Banco Bilbao Vizcaya Brasil, S.A. (Note 4) | | — | | 283,815 | | 201,687 |
Administradora de Fondos de Retiro Bancomer, S.A. | | 137,472 | | 83,257 | | 22,021 |
Other companies | | 805,558 | | 560,465 | | 515,824 |
| | |
| |
| |
|
| | | 4,273,834 | | 4,483,258 | | 4,055,050 |
Companies accounted for by the equity method: | | | | | | |
Iberdrola, S.A. | | 170,663 | | 180,588 | | 130,768 |
Senorte Vida y Pensiones, S.A. | | 33,360 | | 33,377 | | 33,392 |
Telefónica, S.A. | | 335,976 | | 358,556 | | 195,185 |
Repsol YPF, S.A. | | 274,557 | | 397,727 | | 232,682 |
Banco Atlántico, S.A. | | 62,775 | | 59,408 | | 52,985 |
Banca Nazionale del Lavoro, S.p.A. | | 17,529 | | 138,780 | | 12,158 |
Acerinox, S.A. | | 70,751 | | 58,647 | | 55,996 |
Other companies | | 469,663 | | 438,664 | | 337,605 |
| | |
| |
| |
|
| | | 1,435,274 | | 1,665,747 | | 1,050,771 |
Exchange gains: | | | | | | |
Fully or proportionally consolidated companies: | | | | | | |
BBVA Banco Continental Group | | — | | — | | 20,386 |
BBVA Banco Ganadero Group | | — | | — | | 19,635 |
BBVA Bancomer Group | | 196,464 | | 61,898 | | — |
BBVA Puerto Rico, S.A. | | — | | 37,113 | | 81,088 |
Other companies | | 130,992 | | 201,030 | | 222,117 |
| | |
| |
| |
|
| | | 327,456 | | 300,041 | | 343,226 |
Companies accounted for by the equity method: | | 60,052 | | 16,230 | | 25,807 |
| | |
| |
| |
|
| | | 6,096,616 | | 6,465,276 | | 5,474,854 |
| | |
| |
| |
|
F-70
| | | | | | |
| | | Thousands of Euros
|
| | | 2003
| | 2002
| | 2001
|
Accumulated losses at consolidated companies- | | | | | | |
Fully or proportionally consolidated companies: | | | | | | |
Inversora Otar, S.A. | | — | | — | | 268,364 |
BBVA Banco Continental, S.A. | | 28,444 | | 179,108 | | 100,345 |
BBVA Gestión, S.A. SGIIC | | — | | — | | 77,915 |
BBVA Banco Ganadero, S.A. | | — | | — | | 308,728 |
BBVA Portugal, S.A. | | — | | 54,045 | | 61,441 |
AFP Horizonte, S.A. | | — | | 51,527 | | 40,737 |
BBVA Brasil, S.A. (Note 4) | | — | | — | | — |
AFP Provida, S.A. | | 27,277 | | 47,817 | | 54,663 |
BBVA Global Finance, Ltd. | | — | | 25,620 | | 63,593 |
BBVA International Investment Corporation | | — | | 61,199 | | 69,892 |
BBVA Puerto Rico Holding Corporation | | 158,454 | | 158,404 | | 155,951 |
BBVA Banco Francés, S.A. | | 13,359 | | — | | — |
Cía. de Cartera e Inversiones, S.A. | | — | | 87,979 | | — |
Corporación Industrial y de Servicios, S.L. | | 199,599 | | 46,474 | | — |
Bilbao Vizcaya América B.V. | | 78,682 | | 119,592 | | — |
Fideicomiso de Vivienda Bancomer | | 44,636 | | 47,338 | | 52,601 |
BBVA Bancomer, S.A. | | — | | 39,293 | | — |
BBVA Área Inmobiliaria, S.L. | | — | | 135,748 | | — |
BBVA Pensiones Chile, S.A. | | 103,999 | | 93,223 | | 11,978 |
Banco de Crédito Local, S.A. | | 6,610 | | — | | — |
Grupo Financiero BBVA Bancomer, S.A. de C.V. | | 11,203 | | — | | — |
Other companies | | 137,272 | | 162,951 | | 215,966 |
| | |
| |
| |
|
| | | 809,535 | | 1,310,318 | | 1,482,174 |
Companies accounted for by the equity method: | | 201,872 | | 151,054 | | 223,541 |
| | | |
Exchange losses in consolidation: | | | | | | |
Fully or proportionally consolidated companies: | | | | | | |
BBVA Bancomer Group | | — | | — | | 35,153 |
BBVA Banco Ganadero Group | | 65,394 | | 45,130 | | — |
Bilbao Vizcaya América, B.V. | | 162,078 | | 94,483 | | — |
Provida Group | | 5,132 | | 45,354 | | 11,774 |
BBVA Brazil Group | | — | | 86,001 | | 152,958 |
BBVA Banco Francés Group | | 613,460 | | 535,832 | | 408,147 |
BBVA Banco Provincial Group | | 289,958 | | 259,480 | | 88,529 |
BBVA Banco Continental Group | | 4,901 | | 21 | | — |
BBVA International Investment Corporation | | 593,009 | | 337,789 | | — |
Other companies | | 193,074 | | 188,594 | | 517 |
| | |
| |
| |
|
| | | 1,927,006 | | 1,592,684 | | 697,078 |
Companies accounted for by the equity method: | | 672,351 | | 596,152 | | 298,162 |
| | |
| |
| |
|
| | | 3,610,764 | | 3,650,208 | | 2,700,955 |
| | |
| |
| |
|
The exchange differences in consolidation include the net cumulative effect of the differences arising in translation and, accordingly, reflect the effect of the devaluation described in Note 3-o.
For the purpose of allocating the reserves and accumulated losses at the consolidated companies in the preceding table, the transfers of reserves arising from the dividends paid and the writedowns or transactions between these companies are taken into account in the year in which they took place.
The individual financial statements of the subsidiaries which give rise to the balances recorded under the “Reserves” and “Accumulated Losses at Consolidated Companies - Fully and Proportionally Consolidated Companies” captions in the foregoing table as of December 31, 2003, 2002 and 2001, include €3,617,649 thousand, €4,059,581 thousand and €2,249,005 thousand, respectively, of restricted reserves, of which €102,658 thousand, €121,893 thousand and €84,502 thousand, respectively, are restricted reserves for Parent Company shares.
F-71
(25) TAX MATTERS
The balance of the “Other Liabilities - Tax Collection Accounts” caption in the accompanying consolidated balance sheets includes the liability for applicable taxes, including the provision for corporate income tax in each year, net of tax withholdings and prepayments in each year, in the case of companies with a net tax liability. The amount of the tax refunds due to Group companies is included under the “Other Assets - Taxes Receivable” caption in the accompanying consolidated balance sheets.
Banco Bilbao Vizcaya Argentaria, S.A. and its tax-consolidable subsidiaries file consolidated tax returns. The subsidiaries of Argentaria, which had been in Tax Group 7/90, were included in Tax Group 2/82 from 2000, since the merger had been carried out under the tax neutrality system provided for in Title VIII, Chapter VIII of Corporate Income Tax Law 43/1995. On December 30, 2002, the Group made the pertinent notification to the Ministry of Economy and Finance to extend its taxation under the consolidated taxation regime indefinitely, in accordance with current legislation. The other Group companies file individual tax returns in accordance with the applicable tax regulations.
As in prior years, in 2003 certain Group entities performed or participated in corporate restructuring transactions under the special tax neutrality system regulated by Law 29/1991 adapting certain tax items to EU directives and regulations and by Title VIII, Chapter VIII of Corporate Income Tax Law 43/1995. The disclosures required under the aforementioned legislation are included in the notes to financial statements of the relevant Group entities for the year in which the transactions took place.
The reconciliation of corporate income tax payable, calculated on the basis of the income per books before taxes, to the provision recorded is as follows:
| | | | | | | | | |
| | | Thousands of Euros
| |
| | | 2003
| | | 2002
| | | 2001
| |
Corporate income tax at the standard rate of 35% | | 1,334,249 | | | 1,091,741 | | | 1,271,930 | |
Decrease arising from permanent differences: | | | | | | | | | |
Tax credits and tax relief at consolidated companies | | (279,618 | ) | | (203,445 | ) | | (302,143 | ) |
Effect of allocation of the Group’s share in the net income of associated companies | | (124,980 | ) | | (7,698 | ) | | (190,063 | ) |
Other items, net | | (42,765 | ) | | (270,774 | ) | | (75,836 | ) |
| | |
|
| |
|
| |
|
|
| | | (447,363 | ) | | (481,917 | ) | | (568,042 | ) |
Net increase (decrease) arising from timing differences | | (48,275 | ) | | (249,256 | ) | | 595,993 | |
| | | |
Corporate income tax and other taxes payable | | 838,611 | | | 360,568 | | | 1,299,881 | |
Recording (use) of prepaid or deferred taxes | | 48,275 | | | 249,256 | | | (595,993 | ) |
Provision for corporate income tax and other taxes accrued in the year | | 886,886 | | | 609,824 | | | 703,888 | |
Adjustments to the provision for prior years’ corporate income tax and other taxes | | 28,090 | | | 43,389 | | | (78,367 | ) |
Corporate income tax and other taxes | | 914,976 | | | 653,213 | | | 625,521 | |
As required by Bank of Spain Circular 4/1991 and related regulations, the deferred tax assets that will foreseeably be recovered during the next ten years are included under the “Other Assets” caption in the accompanying consolidated balance sheets (Note 15). The main items for which the Group companies have recorded deferred tax assets are provisions to cover pensions and similar obligations to employees (€989,642 thousand at the Spanish companies) and the loan loss provisions (€779,892 thousand at BBVA Bancomer, S.A. de C.V. and €316,637 thousand at BBVA, S.A.).
F-72
The Bank and certain Group companies have opted to defer corporate income tax on the gains on disposals of property and equipment and shares in investee companies more than 5% owned by them, the breakdown of which by year is as follows:
| | |
Year
| | Thousands
of Euros
|
1996 | | 29,187 |
1997 | | 378,097 |
1998 | | 733,896 |
1999 | | 194,980 |
2000 | | 707,917 |
2001 | | 995,202 |
Pursuant to the regulations in force until December 31, 2001, the amount of the aforementioned gains must be included in equal parts in the taxable income of the seven tax years ending from 2000, 2001, 2002, 2003, 2004 and 2005, respectively. Following inclusion of the portion relating to 2001, the amount of the income not yet included was €2,976,931 thousand, with respect to which the Group companies availed themselves of the provisions of the Third Transitory Provision of Law 24/2001 on Administrative, Tax and Social Security Measures, and practically all of this amount (€2,971,625 thousand) constitutes an addition to the 2001 taxable income for timing differences.
The share acquisitions giving rise to an ownership interest of more than 5%, particularly investments of this kind in Latin America, have been assigned to meet reinvestment commitments assumed in order to apply the above-mentioned tax deferral.
In 2003 the Bank and certain Group companies availed themselves of the corporate income tax credit for reinvestment of extraordinary income obtained on the transfer for consideration of property and of shares in investees more than 5% owned. The income subject to this tax credit amounted to €33,224 thousand. The acquisition in 2002 of shares of Latin American companies, mainly, was included under the group of reinvestment commitments under the aforementioned tax credit.
As of December 31, 2003, 2002 and 2001, certain consolidated companies had tax losses qualifying for carryforward against the taxable income, if any, of the ten years following the year in which they were incurred. As of December 31, 2003, the tax assets recorded for tax loss carryforwards amounted to €759,051 thousand, of which €539,670 thousand relate to BBVA Bancomer, S.A. de C.V. and €151,110 thousand to BBVA Bancomer Servicios, S.A. de C.V. Based on the available financial projections, the income expected to be generated by these two companies will enable these amounts, and the deferred tax assets recorded by them, to be recovered over a period of less than ten years.
As a result of the tax audits by the tax inspection authorities, in 2002 tax assessments were issued to certain Group companies for the years through 1997, some of which were contested. Taking into account the timing nature of certain tax assessment items, and in accordance with the principle of prudence, full provisions had been included in the accompanying consolidated financial statements for the amounts that arose in this connection. The other Group companies generally have 1998 and subsequent years open for review by the tax inspection authorities for the main taxes applicable to them.
The varying interpretations which can be made of the tax regulations applicable to the operations of banks give rise to certain contingent tax liabilities for the open years that cannot be objectively quantified. However, the Bank’s Board of Directors and its tax advisers consider that the possibility of these contingent liabilities materializing in future reviews by the tax authorities is remote and that, in any event, the tax charge which might arise therefrom would not materially affect the consolidated financial statements.
F-73
(26) MEMORANDUM ACCOUNTS AND OTHER OFF-BALANCE-SHEET TRANSACTIONS
The detail of the balances of the “Memorandum Accounts” caption in the accompanying consolidated balance sheets as of December 31, 2003, 2002 and 2001, which include the main commitments and contingent liabilities that arose in the normal course of banking business, is as follows:
| | | | | | |
| | | Thousands of Euros
|
| | | 2003
| | 2002
| | 2001
|
Contingent liabilities- | | | | | | |
Deposits, guarantees and sureties | | 13,588,729 | | 15,109,713 | | 13,713,924 |
Rediscounts, endorsements and acceptances | | 11,828 | | 5,370 | | 62,097 |
Other | | 3,050,954 | | 3,041,745 | | 2,699,583 |
| | |
| |
| |
|
| | | 16,651,511 | | 18,156,828 | | 16,475,604 |
| | |
| |
| |
|
Commitments- | | | | | | |
Balances drawable by third parties: | | | | | | |
Credit institutions | | 2,723,586 | | 2,521,177 | | 2,349,633 |
Public sector | | 2,591,339 | | 4,288,788 | | 2,994,873 |
Other resident sectors | | 27,578,080 | | 25,842,248 | | 26,183,898 |
Non-resident sector | | 19,934,934 | | 16,101,984 | | 21,388,686 |
| | |
| |
| |
|
| | | 52,827,939 | | 48,754,197 | | 52,917,090 |
Other commitments | | 3,070,468 | | 2,865,188 | | 2,372,081 |
| | |
| |
| |
|
| | | 55,898,407 | | 51,619,385 | | 55,289,171 |
| | |
| |
| |
|
| | | 72,549,918 | | 69,776,213 | | 71,764,775 |
| | |
| |
| |
|
In addition to the above-mentioned contingent liabilities and commitments, at the end of 2003, 2002 and 2001 the Group had other transactions which, pursuant to current legislation, are not reflected in the accompanying consolidated balance sheets, The detail of the notional or contractual value of these transactions as of December 31, 2003, 2002 and 2001, and of the type of market on which they were arranged, is as follows:
| | | | | | | | |
| | | Thousands of Euros
|
| | | Type of Market
| | 2003
| | 2002
| | 2001
|
Foreign currency purchase and sale transactions and swaps | | | | | | | | |
- Foreign currency purchases against euros | | | | 23,376,814 | | 19,611,600 | | 17,456,059 |
- Foreign currency purchases against foreign currencies | | | | 18,651,590 | | 21,640,807 | | 9,896,857 |
- Foreign currency sales against euros | | | | 14,467,407 | | 8,832,980 | | 10,552,226 |
| | | | |
| |
| |
|
| | | Over-the-counter | | 56,495,811 | | 50,085,387 | | 37,905,142 |
| | | | |
| |
| |
|
Financial asset purchase and sale transactions | | | | | | | | |
- Purchases | | | | 725,260 | | 1,085,452 | | 633,455 |
- Sales | | | | 1,159,737 | | 5,553,424 | | 2,118,309 |
| | | | |
| |
| |
|
| | | Organized | | 1,884,997 | | 6,638,876 | | 2,751,764 |
| | | | |
| |
| |
|
Forward rate agreements (FRA) | | | | | | | | |
- Bought | | | | 37,999,751 | | 13,759,612 | | 57,444,797 |
- Sold | | | | 29,325,752 | | 8,653,722 | | 53,915,045 |
| | | | |
| |
| |
|
| | | Over-the-counter | | 67,325,503 | | 22,413,334 | | 111,359,842 |
| | | | |
| |
| |
|
Interest rate swaps | | Over-the-counter | | 533,737,345 | | 454,602,653 | | 463,403,810 |
| | | | |
| |
| |
|
Securities swaps | | Over-the-counter | | 3,973,217 | | 6,921,838 | | 3,848,898 |
| | | | |
| |
| |
|
Interest rate futures | | | | | | | | |
- Bought | | | | 12,768,238 | | 13,136,816 | | 15,572,963 |
- Sold | | | | 37,407,616 | | 36,106,890 | | 26,505,175 |
| | | | |
| |
| |
|
| | | Organized | | 50,175,854 | | 49,243,706 | | 42,078,138 |
| | | | |
| |
| |
|
Securities futures | | | | | | | | |
- Bought | | | | 208,991 | | 33,051 | | 301,546 |
- Sold | | | | 1,365,939 | | 398,859 | | 755,707 |
| | | | |
| |
| |
|
| | | Organized | | 1,574,930 | | 431,910 | | 1,057,253 |
| | | | |
| |
| |
|
Interest rate options | | | | | | | | |
- Bought | | | | 42,247,845 | | 37,819,076 | | 36,721,077 |
- Sold | | | | 35,276,947 | | 31,547,425 | | 32,562,187 |
| | | | |
| |
| |
|
| | | | | 77,524,792 | | 69,366,501 | | 69,283,264 |
| | | | |
| |
| |
|
| | | Organized | | 8,507,711 | | 1,638,260 | | 1,517,281 |
| | | | |
| |
| |
|
| | | Over-the-counter | | 69,017,081 | | 67,728,241 | | 67,765,983 |
| | | | |
| |
| |
|
Securities options | | | | | | | | |
- Bought | | | | 4,934,530 | | 4,303,747 | | 4,878,950 |
- Sold | | | | 25,835,985 | | 14,748,739 | | 15,484,073 |
| | | | |
| |
| |
|
| | | | | 30,770,515 | | 19,052,486 | | 20,363,023 |
| | | | |
| |
| |
|
| | | Organized | | 1,668,877 | | 984,495 | | 419,495 |
| | | | |
| |
| |
|
| | | Over-the-counter | | 29,101,638 | | 18,067,991 | | 19,943,528 |
| | | | |
| |
| |
|
Foreign currency options and futures | | | | | | | | |
- Bought | | | | 3,595,772 | | 3,949,889 | | 10,552,096 |
- Sold | | | | 5,264,581 | | 4,745,871 | | 11,791,166 |
| | | | |
| |
| |
|
| | | Over-the-counter | | 8,860,353 | | 8,695,760 | | 22,343,262 |
| | | | |
| |
| |
|
Other transactions | | | | 788,903 | | 1,292,090 | | 818,597 |
| | | | |
| |
| |
|
| | | | | 833,112,220 | | 688,744,541 | | 775,212,993 |
| | | | |
| |
| |
|
F-74
The notional or contractual amounts of these transactions do not necessarily reflect the volume of actual risk assumed by the Group, since the net position in these financial instruments is the result of the offset and/or combination of them, This net position, even if it is not deemed a hedge for accounting purposes, is used by the Group basically to eliminate or significantly reduce interest rate, market or exchange risk, The resulting gains or losses on these transactions are included under the “Market Operations” caption in the consolidated statements of income. Any gains or losses on hedging transactions are included as an increase in, or offset of, the results on the positions covered by them,
F-75
For the purposes of calculating the minimum capital requirements established by Bank of Spain Circular 5/1993, credit and counterparty risk arising from OTC interest rate and currency derivative transactions is measured by the original risk method, as of December 31, 2003, 2002 and 2001, the risk-weighted assets amounted to €3,870,801 thousand, €4,387,162 thousand and €4,422,028 thousand, respectively, which entails a minimum capital requirement of €309,664 thousand, €350,973 thousand, and €353,762 thousand, respectively, for transactions of this kind, respectively. The detail, by maturity, of these transactions as of December 31, 2003, 2002 and 2001, is as follows:
| | | | | | | | |
| | | Thousands of Euros
|
| | | Up to 1 Year
| | 1 to 5 Years
| | 5 to 10 Years
| | Over 10
Years
|
Balances at December 31, 2003- | | | | | | | | |
Interest rate and securities transactions- | | | | | | | | |
Swaps | | 369,498,175 | | 88,519,328 | | 50,619,343 | | 29,073,716 |
Forward rate agreements | | 67,261,478 | | 64,025 | | — | | — |
Financial futures | | 29,626,989 | | 22,123,664 | | 131 | | — |
Unmatured financial asset purchase and sale transactions | | 1,884,997 | | — | | — | | — |
Securities and interest rate options | | 34,432,983 | | 44,313,427 | | 19,656,483 | | 9,892,414 |
| | |
| |
| |
| |
|
| | | 502,704,622 | | 155,020,444 | | 70,275,957 | | 38,966,130 |
| | |
| |
| |
| |
|
Exchange rate transactions- | | | | | | | | |
Forward foreign currency purchase and sale transactions and swaps | | 36,891,706 | | 7,149,988 | | 12,454,117 | | — |
Foreign currency options and futures | | 1,851,514 | | 1,365,049 | | 46,801 | | 5,596,989 |
Other transactions | | 788,903 | | — | | — | | — |
| | |
| |
| |
| |
|
| | | 39,532,123 | | 8,515,037 | | 12,500,918 | | 5,596,989 |
| | |
| |
| |
| |
|
| | | 542,236,745 | | 163,535,481 | | 82,776,875 | | 44,563,119 |
| | |
| |
| |
| |
|
Balances at December 31, 2002- | | | | | | | | |
Interest rate and securities transactions- | | | | | | | | |
Swaps | | 329,331,193 | | 70,949,128 | | 34,833,180 | | 26,410,990 |
Forward rate agreements | | 20,656,539 | | 1,756,795 | | — | | — |
Financial futures | | 35,503,837 | | 14,166,096 | | 5,683 | | — |
Unmatured financial asset purchase and sale transactions | | 6,638,876 | | — | | — | | — |
Securities and interest rate options | | 20,384,422 | | 36,302,213 | | 24,498,414 | | 7,233,938 |
| | |
| |
| |
| |
|
| | | 412,514,867 | | 123,174,232 | | 59,337,277 | | 33,644,928 |
| | |
| |
| |
| |
|
Exchange rate transactions- | | | | | | | | |
Forward foreign currency purchase and sale transactions and swaps | | 47,868,117 | | 2,217,270 | | — | | — |
Foreign currency options and futures | | 8,413,004 | | 233,176 | | 30,987 | | 18,593 |
Other transactions | | 1,292,090 | | — | | — | | — |
| | |
| |
| |
| |
|
| | | 57,573,211 | | 2,450,446 | | 30,987 | | 18,593 |
| | |
| |
| |
| |
|
| | | 470,088,078 | | 125,624,678 | | 59,368,264 | | 33,663,521 |
| | |
| |
| |
| |
|
Balances at December 31, 2001- | | | | | | | | |
Interest rate and securities transactions- | | | | | | | | |
Swaps | | 364,213,213 | | 50,607,244 | | 30,695,284 | | 21,736,967 |
Forward rate agreements | | 103,826,959 | | 7,532,883 | | — | | — |
Financial futures | | 36,774,654 | | 6,353,789 | | 6,948 | | — |
Unmatured financial asset purchase and sale transactions | | 2,751,764 | | — | | — | | — |
Securities and interest rate options | | 31,272,253 | | 28,437,416 | | 18,751,158 | | 11,185,460 |
| | |
| |
| |
| |
|
| | | 538,838,843 | | 92,931,332 | | 49,453,390 | | 32,922,427 |
| | |
| |
| |
| |
|
Exchange rate transactions- | | | | | | | | |
Forward foreign currency purchase and sale transactions and swaps | | 26,673,787 | | 11,231,355 | | — | | — |
Foreign currency options and futures | | 21,498,639 | | 844,623 | | — | | — |
Other transactions | | 818,597 | | — | | — | | — |
| | |
| |
| |
| |
|
| | | 48,991,023 | | 12,075,978 | | — | | — |
| | |
| |
| |
| |
|
| | | 587,829,866 | | 105,007,310 | | 49,453,390 | | 32,922,427 |
| | |
| |
| |
| |
|
F-76
The detail, by maturity and currency, of the interest rate swaps and forward rate agreements as of December 31, 2003, 2002 and 2001, stating the interest rates collected and paid, is as follows:
| | | | | | | | | | | | |
| | | Thousands of Euros (except for percentages)
| |
Balances at December 31, 2003
| | Up to 1 Year
| | | 1 to 5 Years
| | | 5 to 10 Years
| | | Over 10
Years
| |
Swaps- | | | | | | | | | | | | |
In euros: | | | | | | | | | | | | |
Collecting fixed interest- | | | | | | | | | | | | |
Notional value | | 146,519,659 | | | 27,535,800 | | | 23,685,417 | | | 11,541,990 | |
Average interest rate collected | | 2.36 | % | | 4.71 | % | | 5.18 | % | | 5.23 | % |
Average interest rate paid | | 2.14 | % | | 2.38 | % | | 2.32 | % | | 2.25 | % |
Paying fixed interest- | | | | | | | | | | | | |
Notional value | | 180,944,503 | | | 24,265,639 | | | 18,652,431 | | | 14,238,246 | |
Average interest rate collected | | 2.15 | % | | 2.24 | % | | 2.52 | % | | 2.30 | % |
Average interest rate paid | | 3.83 | % | | 4.91 | % | | 5.43 | % | | 5.90 | % |
Floating rate/floating rate- | | | | | | | | | | | | |
Notional value | | 6,199,317 | | | 4,463,763 | | | 1,705,715 | | | 2,166,886 | |
Average interest rate collected | | 1.62 | % | | 2.39 | % | | 2.95 | % | | 2.45 | % |
Average interest rate paid | | 1.57 | % | | 2.30 | % | | 2.46 | % | | 2.46 | % |
| | |
|
| |
|
| |
|
| |
|
|
| | | 333,663,479 | | | 56,265,202 | | | 44,043,563 | | | 27,947,122 | |
| | |
|
| |
|
| |
|
| |
|
|
In foreign currencies: | | | | | | | | | | | | |
Collecting fixed interest- | | | | | | | | | | | | |
Notional value | | 26,771,781 | | | 21,089,552 | | | 4,323,442 | | | 330,518 | |
Average interest rate collected | | 1.92 | % | | 4.31 | % | | 4.91 | % | | 5.90 | % |
Average interest rate paid | | 1.88 | % | | 2.10 | % | | 2.17 | % | | 2.10 | % |
Paying fixed interest- | | | | | | | | | | | | |
Notional value | | 8,989,789 | | | 11,106,107 | | | 2,149,826 | | | 796,076 | |
Average interest rate collected | | 2.20 | % | | 2.16 | % | | 2.19 | % | | 2.18 | % |
Average interest rate paid | | 3.83 | % | | 4.63 | % | | 4.76 | % | | 5.59 | % |
Floating rate/floating rate- | | | | | | | | | | | | |
Notional value | | 73,126 | | | 58,467 | | | 102,512 | | | — | |
Average interest rate collected | | 3.00 | % | | 2.18 | % | | 2.36 | % | | — | |
Average interest rate paid | | 2.93 | % | | 1.93 | % | | 2.41 | % | | — | |
| | |
|
| |
|
| |
|
| |
|
|
| | | 35,834,696 | | | 32,254,126 | | | 6,575,780 | | | 1,126,594 | |
| | |
|
| |
|
| |
|
| |
|
|
| | | 369,498,175 | | | 88,519,328 | | | 50,619,343 | | | 29,073,716 | |
| | |
|
| |
|
| |
|
| |
|
|
| | | | |
| | | Up to 3
Months
| | | 3 to 6 Months
| | | 6 to 12 Months
| | | Over 1 Year
| |
Forward rate agreements- | | | | | | | | | | | | |
In euros: | | | | | | | | | | | | |
Collecting fixed interest- | | | | | | | | | | | | |
Notional value | | 19,577,337 | | | 6,845,572 | | | 2,523,367 | | | — | |
Average interest rate collected | | 2.12 | % | | 2.41 | % | | 2.54 | % | | — | |
Average interest rate paid | | 2.18 | % | | 2.18 | % | | 2.30 | % | | — | |
Paying fixed interest- | | | | | | | | | | | | |
Notional value | | 23,274,945 | | | 11,316,680 | | | 3,023,045 | | | — | |
Average interest rate collected | | 2.18 | % | | 2.18 | % | | 2.30 | % | | — | |
Average interest rate paid | | 2.12 | % | | 2.38 | % | | 2.69 | % | | — | |
| | |
|
| |
|
| |
|
| |
|
|
| | | 42,852,282 | | | 18,162,252 | | | 5,546,412 | | | — | |
| | |
|
| |
|
| |
|
| |
|
|
In foreign currencies: | | | | | | | | | | | | |
Collecting fixed interest- | | | | | | | | | | | | |
Notional value | | 328,371 | | | 31,651 | | | 24,009 | | | 64,025 | |
Average interest rate collected | | 1.38 | % | | 1.81 | % | | — | | | — | |
Average interest rate paid | | 1.15 | % | | — | | | — | | | — | |
Paying fixed interest- | | | | | | | | | | | | |
Notional value | | 316,501 | | | — | | | — | | | — | |
Average interest rate collected | | 1.15 | % | | — | | | — | | | — | |
Average interest rate paid | | 1.36 | % | | — | | | — | | | — | |
| | |
|
| |
|
| |
|
| |
|
|
| | | 644,872 | | | 31,651 | | | 24,009 | | | 64,025 | |
| | |
|
| |
|
| |
|
| |
|
|
| | | 43,497,154 | | | 18,193,903 | | | 5,570,421 | | | 64,025 | |
| | |
|
| |
|
| |
|
| |
|
|
F-77
| | | | | | | | | | | | |
| | | Thousands of Euros (except for percentages)
| |
Balances at December 31, 2002
| | Up to 1 Year
| | | 1 to 5 Years
| | | 5 to 10 Years
| | | Over 10 Years
| |
Swaps- | | | | | | | | | | | | |
In euros: | | | | | | | | | | | | |
Collecting fixed interest- | | | | | | | | | | | | |
Notional value | | 133,273,453 | | | 23,353,844 | | | 15,876,403 | | | 11,780,908 | |
Average interest rate collected | | 3.20 | % | | 4.91 | % | | 5.38 | % | | 5.73 | % |
Average interest rate paid | | 3.43 | % | | 3.34 | % | | 3.65 | % | | 3.86 | % |
Paying fixed interest- | | | | | | | | | | | | |
Notional value | | 152,123,286 | | | 19,621,239 | | | 13,030,682 | | | 11,261,379 | |
Average interest rate collected | | 3.42 | % | | 3.24 | % | | 3.65 | % | | 3.37 | % |
Average interest rate paid | | 3.21 | % | | 5.19 | % | | 5.23 | % | | 5.96 | % |
Floating rate/floating rate- | | | | | | | | | | | | |
Notional value | | 2,309,867 | | | 5,966,248 | | | 1,038,244 | | | 1,435,651 | |
Average interest rate collected | | 3.64 | % | | 3.60 | % | | 3.25 | % | | 3.62 | % |
Average interest rate paid | | 3.71 | % | | 3.59 | % | | 3.23 | % | | 3.58 | % |
| | |
|
| |
|
| |
|
| |
|
|
| | | 287,706,606 | | | 48,941,331 | | | 29,945,329 | | | 24,477,938 | |
| | |
|
| |
|
| |
|
| |
|
|
In foreign currencies: | | | | | | | | | | | | |
Collecting fixed interest- | | | | | | | | | | | | |
Notional value | | 23,417,615 | | | 13,973,168 | | | 2,238,984 | | | 1,055,070 | |
Average interest rate collected | | 5.47 | % | | 7.59 | % | | 6.00 | % | | 6.61 | % |
Average interest rate paid | | 4.05 | % | | 5.35 | % | | 2.89 | % | | 1.68 | % |
Paying fixed interest- | | | | | | | | | | | | |
Notional value | | 13,034,006 | | | 6,915,482 | | | 2,126,473 | | | 451,839 | |
Average interest rate collected | | 1.30 | % | | 1.65 | % | | 1.63 | % | | 1.57 | % |
Average interest rate paid | | 2.35 | % | | 4.39 | % | | 5.20 | % | | 5.77 | % |
Floating rate/floating rate- | | | | | | | | | | | | |
Notional value | | 233,262 | | | 85,550 | | | — | | | — | |
Average interest rate collected | | 1.22 | % | | 3.64 | % | | — | | | — | |
Average interest rate paid | | 2.05 | % | | 2.61 | % | | — | | | — | |
| | |
|
| |
|
| |
|
| |
|
|
| | | 36,684,883 | | | 20,974,200 | | | 4,365,457 | | | 1,506,909 | |
| | |
|
| |
|
| |
|
| |
|
|
| | | 324,391,489 | | | 69,915,531 | | | 34,310,786 | | | 25,984,847 | |
| | |
|
| |
|
| |
|
| |
|
|
| | | | |
| | | Up to 3 Months
| | | 3 to 6 Months
| | | 6 to 12 Months
| | | Over 1 Year
| |
Forward rate agreements- | | | | | | | | | | | | |
In euros: | | | | | | | | | | | | |
Collecting fixed interest- | | | | | | | | | | | | |
Notional value | | 4,209,934 | | | 1,946,625 | | | 2,229,355 | | | 227,039 | |
Average interest rate collected | | 3.14 | % | | 2.95 | % | | 2.85 | % | | 3.37 | % |
Average interest rate paid | | 3.46 | % | | 2.98 | % | | 2.92 | % | | 4.66 | % |
Paying fixed interest- | | | | | | | | | | | | |
Notional value | | 5,892,332 | | | 2,870,899 | | | 2,881,666 | | | 564,233 | |
Average interest rate collected | | 3.50 | % | | 3.40 | % | | 2.99 | % | | 3.64 | % |
Average interest rate paid | | 3.09 | % | | 2.93 | % | | 2.86 | % | | 3.15 | % |
| | |
|
| |
|
| |
|
| |
|
|
| | | 10,102,266 | | | 4,817,524 | | | 5,111,021 | | | 791,272 | |
| | |
|
| |
|
| |
|
| |
|
|
In foreign currencies: | | | | | | | | | | | | |
Collecting fixed interest- | | | | | | | | | | | | |
Notional value | | 410,137 | | | 12,242 | | | — | | | 482,762 | |
Average interest rate collected | | 9.33 | % | | 6.59 | % | | — | | | 2.46 | % |
Average interest rate paid | | 6.29 | % | | 6.36 | % | | — | | | 4.56 | % |
Paying fixed interest- | | | | | | | | | | | | |
Notional value | | 123,162 | | | 80,187 | | | — | | | 482,761 | |
Average interest rate collected | | 1.40 | % | | 3.27 | % | | — | | | 4.72 | % |
Average interest rate paid | | 1.89 | % | | 2.19 | % | | — | | | 2.46 | % |
| | |
|
| |
|
| |
|
| |
|
|
| | | 533,299 | | | 92,429 | | | — | | | 965,523 | |
| | |
|
| |
|
| |
|
| |
|
|
| | | 10,635,565 | | | 4,909,953 | | | 5,111,021 | | | 1,756,795 | |
| | |
|
| |
|
| |
|
| |
|
|
F-78
| | | | | | | | | | | | |
Balances at December 31, 2001
| | Thousands of Euros (except for percentages)
| |
| | Up to 1 Year
| | | 1 to 5 Years
| | | 5 to 10 Years
| | | Over 10 Years
| |
Swaps- | | | | | | | | | | | | |
In euros: | | | | | | | | | | | | |
Collecting fixed interest- | | | | | | | | | | | | |
Notional value | | 113,803,428 | | | 12,932,747 | | | 12,303,040 | | | 7,342,658 | |
Average interest rate collected | | 3.55 | % | | 4.98 | % | | 5.47 | % | | 5.82 | % |
Average interest rate paid | | 3.60 | % | | 3.78 | % | | 3.75 | % | | 3.70 | % |
Paying fixed interest- | | | | | | | | | | | | |
Notional value | | 131,488,682 | | | 10,259,905 | | | 7,561,875 | | | 5,220,691 | |
Average interest rate collected | | 3.60 | % | | 3.72 | % | | 3.75 | % | | 3.74 | % |
Average interest rate paid | | 3.57 | % | | 5.23 | % | | 5.44 | % | | 6.29 | % |
Floating rate/floating rate- | | | | | | | | | | | | |
Notional value | | 126,265 | | | 492,581 | | | 1,447,795 | | | 3,960,440 | |
Average interest rate collected | | 3.27 | % | | 3.89 | % | | 3.87 | % | | 4.52 | % |
Average interest rate paid | | 3.47 | % | | 3.75 | % | | 3.65 | % | | 4.34 | % |
| | |
|
| |
|
| |
|
| |
|
|
| | | 245,418,375 | | | 23,685,233 | | | 21,312,710 | | | 16,523,789 | |
| | |
|
| |
|
| |
|
| |
|
|
In foreign currencies: | | | | | | | | | | | | |
Collecting fixed interest- | | | | | | | | | | | | |
Notional value | | 50,058,494 | | | 9,697,465 | | | 3,990,606 | | | 3,369,965 | |
Average interest rate collected | | 4.44 | % | | 5.91 | % | | 5.62 | % | | 6.27 | % |
Average interest rate paid | | 2.74 | % | | 2.75 | % | | 3.09 | % | | 2.96 | % |
Paying fixed interest- | | | | | | | | | | | | |
Notional value | | 64,445,162 | | | 17,055,201 | | | 5,301,302 | | | 1,833,307 | |
Average interest rate collected | | 3.00 | % | | 3.63 | % | | 3.24 | % | | 5.12 | % |
Average interest rate paid | | 4.02 | % | | 5.40 | % | | 4.36 | % | | 5.44 | % |
Floating rate/floating rate- | | | | | | | | | | | | |
Notional value | | 442,284 | | | 169,345 | | | 90,666 | | | 9,906 | |
Average interest rate collected | | 4.25 | % | | 5.45 | % | | 4.65 | % | | 4.25 | % |
Average interest rate paid | | 2.46 | % | | 2.60 | % | | 4.77 | % | | 4.25 | % |
| | |
|
| |
|
| |
|
| |
|
|
| | | 114,945,940 | | | 26,922,011 | | | 9,382,574 | | | 5,213,178 | |
| | |
|
| |
|
| |
|
| |
|
|
| | | 360,364,315 | | | 50,607,244 | | | 30,695,284 | | | 21,736,967 | |
| | |
|
| |
|
| |
|
| |
|
|
| | | | |
| | | Up to 3 Months
| | | From 3 to 6 Months
| | | From 6 to 12 Months
| | | Over 1 Year
| |
Forward rate agreements- | | | | | | | | | | | | |
In euros: | | | | | | | | | | | | |
Collecting fixed interest- | | | | | | | | | | | | |
Notional value | | 30,400,003 | | | 15,853,600 | | | 99,998 | | | 1,019,927 | |
Average interest rate collected | | 3.27 | % | | 3.16 | % | | 3.31 | % | | 3.38 | % |
Average interest rate paid | | 3.33 | % | | 3.12 | % | | 3.38 | % | | 3.80 | % |
Paying fixed interest- | | | | | | | | | | | | |
Notional value | | 31,899,994 | | | 8,550,000 | | | 6,200,000 | | | 2,399,998 | |
Average interest rate collected | | 3.27 | % | | 3.19 | % | | 3.17 | % | | 3.90 | % |
Average interest rate paid | | 3.33 | % | | 3.31 | % | | 3.07 | % | | 3.48 | % |
| | |
|
| |
|
| |
|
| |
|
|
| | | 62,299,997 | | | 24,403,600 | | | 6,299,998 | | | 3,419,925 | |
| | |
|
| |
|
| |
|
| |
|
|
In foreign currencies: | | | | | | | | | | | | |
Collecting fixed interest- | | | | | | | | | | | | |
Notional value | | 2,583,215 | | | 497,616 | | | 615,354 | | | 2,592,106 | |
Average interest rate collected | | 4.10 | % | | 6.53 | % | | 3.38 | % | | 4.48 | % |
Average interest rate paid | | 3.71 | % | | 5.62 | % | | 3.44 | % | | 3.55 | % |
Paying fixed interest- | | | | | | | | | | | | |
Notional value | | 4,464,630 | | | 2,322,143 | | | 340,406 | | | 1,520,852 | |
Average interest rate collected | | 4.10 | % | | 3.95 | % | | 2.46 | % | | 3.85 | % |
Average interest rate paid | | 3.84 | % | | 4.14 | % | | 5.80 | % | | 5.02 | % |
| | |
|
| |
|
| |
|
| |
|
|
| | | 7,047,845 | | | 2,819,759 | | | 955,760 | | | 4,112,958 | |
| | |
|
| |
|
| |
|
| |
|
|
| | | 69,347,842 | | | 27,223,359 | | | 7,255,758 | | | 7,532,883 | |
| | |
|
| |
|
| |
|
| |
|
|
As of December 31, 2003, 2002 and 2001, the Group had arranged share price risk and interest rate risk macrohedges consisting of securities listed on the main international markets and long-term deposit transactions, respectively (Note 3-m),
F-79
The detail of the notional value of hedging and trading futures transactions as of December 31, 2003, 2002 and 2001, is as follows:
| | | | | | |
| | | Thousands of Euros
|
| | | NOTIONAL AMOUNT
|
| | | HEDGING
| | TRADING
| | TOTAL
|
Balances at December 31, 2003- | | | | | | |
Interest rate and securities transactions | | 73,367,185 | | 693,599,968 | | 766,967,153 |
Swaps | | 37,650,938 | | 500,059,624 | | 537,710,562 |
Forward rate agreements | | — | | 67,325,503 | | 67,325,503 |
Options and futures | | 35,471,788 | | 124,574,303 | | 160,046,091 |
Unmatured financial asset purchase and sale transactions | | 244,459 | | 1,640,538 | | 1,884,997 |
| | | |
Exchange rate transactions | | 16,857,725 | | 49,287,342 | | 66,145,067 |
Forward foreign currency purchase and sale transactions, currency futures and swaps | | 15,647,638 | | 40,979,629 | | 56,627,267 |
Foreign currency options | | 810,522 | | 7,918,375 | | 8,728,897 |
Other transactions | | 399,565 | | 389,338 | | 788,903 |
| | |
| |
| |
|
| | | 90,224,910 | | 742,887,310 | | 833,112,220 |
| | |
| |
| |
|
Balances at December 31, 2002- | | | | | | |
Interest rate and securities transactions | | 67,319,615 | | 561,351,689 | | 628,671,304 |
Swaps | | 28,110,825 | | 433,413,666 | | 461,524,491 |
Forward rate agreements | | 40,762 | | 22,372,572 | | 22,413,334 |
Options and futures | | 38,811,011 | | 99,283,592 | | 138,094,603 |
Unmatured financial asset purchase and sale transactions | | 357,017 | | 6,281,859 | | 6,638,876 |
| | | |
Exchange rate transactions | | 17,713,727 | | 42,359,510 | | 60,073,237 |
Forward foreign currency purchase and sale transactions, currency futures and swaps | | 15,347,014 | | 37,763,263 | | 53,110,277 |
Foreign currency options | | 1,267,696 | | 4,403,174 | | 5,670,870 |
Other transactions | | 1,099,017 | | 193,073 | | 1,292,090 |
| | |
| |
| |
|
| | | 85,033,342 | | 603,711,199 | | 688,744,541 |
| | |
| |
| |
|
Balances at December 31, 2001- | | | | | | |
Interest rate and securities transactions | | 54,176,295 | | 659,969,697 | | 714,145,992 |
Swaps | | 39,659,881 | | 427,592,827 | | 467,252,708 |
Forward rate agreements | | — | | 111,359,842 | | 111,359,842 |
Options and futures | | 13,626,874 | | 119,154,804 | | 132,781,678 |
Unmatured financial asset purchase and sale transactions | | 889,540 | | 1,862,224 | | 2,751,764 |
| | | |
Exchange rate transactions | | 11,586,284 | | 49,480,717 | | 61,067,001 |
Forward foreign currency purchase and sale transactions, currency futures and swaps | | 9,811,197 | | 30,960,364 | | 40,771,561 |
Foreign currency options | | 956,490 | | 18,520,353 | | 19,476,843 |
Other transactions | | 818,597 | | — | | 818,957 |
| | |
| |
| |
|
| | | 65,762,579 | | 709,450,414 | | 775,212,993 |
| | |
| |
| |
|
F-80
Following is a breakdown, by balance-sheet account hedged, of the notional balances of interest rate, securities and exchange rate hedging derivatives as of December 31, 2003, 2002 and 2001:
| | | | | | | | | | |
B/S ACCOUNT HEDGED
| | Thousands of Euros
|
| | AMOUNT
| | NOTIONAL AMOUNT
|
| | | SWAPS
| | FORWARD
RATE
AGREEMENTS
| | OPTIONS
AND
FUTURES
| | OTHER
|
Balances at December 31, 2003- | | | | | | | | | | |
Total net lending | | 5,264,629 | | 1,341,202 | | — | | 1,070,084 | | 2,853,343 |
Due from credit institutions | | 7,372,239 | | 2,151,829 | | — | | 5,220,410 | | — |
Securities portfolio | | 19,361,815 | | 12,987,084 | | — | | 6,374,731 | | — |
Deposits | | 9,608,900 | | 4,786,229 | | — | | 792,723 | | 4,029,878 |
Other assets and liabilities | | 48,617,327 | | 16,384,524 | | — | | 22,824,362 | | 9,408,441 |
| | |
| |
| |
| |
| |
|
| | | 90,224,910 | | 37,650,938 | | — | | 36,282,310 | | 16,291,662 |
| | |
| |
| |
| |
| |
|
Balances at December 31, 2002- | | | | | | | | | | |
Total net lending | | 3,665,078 | | 2,081,217 | | — | | 650,638 | | 933,223 |
Due from credit institutions | | 9,685,367 | | 943,038 | | — | | 223,608 | | 8,518,721 |
Securities portfolio | | 25,478,487 | | 7,642,755 | | — | | 12,955,835 | | 4,879,897 |
Deposits | | 10,280,687 | | 7,892,260 | | — | | 2,388,417 | | 10 |
Other assets and liabilities | | 35,923,723 | | 9,551,555 | | 40,762 | | 24,120,036 | | 2,211,370 |
| | |
| |
| |
| |
| |
|
| | | 85,033,342 | | 28,110,825 | | 40,762 | | 40,338,534 | | 16,543,221 |
| | |
| |
| |
| |
| |
|
Balances at December 31, 2001- | | | | | | | | | | |
Total net lending | | 3,786,157 | | 2,680,866 | | — | | 886,849 | | 218,442 |
Due from credit institutions | | 3,703,965 | | 2,771,588 | | — | | 932,377 | | — |
Securities portfolio | | 29,924,107 | | 20,259,558 | | — | | 8,137,161 | | 1,527,388 |
Deposits | | 11,061,791 | | 5,326,252 | | — | | 958,439 | | 4,777,100 |
Other assets and liabilities | | 17,286,559 | | 8,621,617 | | — | | 3,797,752 | | 4,867,190 |
| | |
| |
| |
| |
| |
|
| | | 65,762,579 | | 39,659,881 | | — | | 14,712,578 | | 11,390,120 |
| | |
| |
| |
| |
| |
|
The market value of the trading derivatives transactions corresponding to the notional amounts of the underlying assets in the table above as of December 31, 2003, 2002 and 2001, is as follows:
| | | | | | | | | |
| | | Thousands of Euros
| |
| | | 2003
| | | 2002
| | | 2001
| |
Interest rate and securities transactions | | | | | | | | | |
Swaps | | (367,559 | ) | | (727,839 | ) | | (169,678 | ) |
Forward rate agreements | | (1,935 | ) | | (5,827 | ) | | (13,733 | ) |
Options and futures | | 145,992 | | | 268,156 | | | 148,684 | |
Unmatured financial asset purchase and sale transactions | | 1,950 | | | (13,219 | ) | | 9,532 | |
| | |
|
| |
|
| |
|
|
| | | (221,552 | ) | | (478,729 | ) | | (25,195 | ) |
| | |
|
| |
|
| |
|
|
Exchange rate transactions | | | | | | | | | |
Forward foreign currency purchase and sale transactions, currency futures and swaps | | (369,288 | ) | | (71,853 | ) | | (85,939 | ) |
Foreign currency options | | (58,634 | ) | | (197 | ) | | 16,552 | |
Other transactions | | — | | | — | | | — | |
| | |
|
| |
|
| |
|
|
| | | (427,922 | ) | | (72,050 | ) | | (69,387 | ) |
| | |
|
| |
|
| |
|
|
F-81
As of December 31, 2003, 2002 and 2001, the provisions covering unrealized losses on trading interest rate and securities futures transactions (Notes 3-m and 20) amounted to approximately €277,614 thousand, €280,721 thousand and €168,229 thousand, respectively,
Off-balance-sheet managed funds
The detail of the off-balance-sheet funds managed by the Group as of December 31, 2003, 2002 and 2001, is as follows:
| | | | | | |
| | | Thousands of Euros
|
| | | 2003
| | 2002
| | 2001
|
Mutual funds | | 45,751,629 | | 43,581,299 | | 49,900,947 |
Pension funds | | 40,015,408 | | 36,563,294 | | 41,248,849 |
Assets managed | | 27,306,691 | | 28,670,233 | | 33,345,967 |
| | |
| |
| |
|
| | | 113,073,728 | | 108,814,826 | | 124,495,763 |
| | |
| |
| |
|
(27) TRANSACTIONS WITH PROPORTIONALLY CONSOLIDATED COMPANIES OR COMPANIES ACCOUNTED FOR BY THE EQUITY METHOD
Following is a detail of the major balances in the accompanying consolidated balance sheets of the Group as of December 31, 2003, 2002 and 2001, with proportionally consolidated companies and companies accounted for by the equity method (Note 2-c). These transactions were made at market prices.
| | | | | | | | | |
| | | Thousands of Euros
| |
| | | 2003
| | | 2002
| | | 2001
| |
Assets: | | | | | | | | | |
Due from credit institutions | | 25,831 | | | 4,068 | | | 167,658 | |
Total net lending | | 3,547,407 | | | 3,727,728 | | | 4,330,815 | |
Debentures and other debt securities | | 52,178 | | | — | | | 39,006 | |
| | |
|
| |
|
| |
|
|
| | | 3,625,416 | | | 3,731,796 | | | 4,537,479 | |
Liabilities: | | | | | | | | | |
Due to credit institutions | | 65,295 | | | 175,395 | | | 318,657 | |
Deposits | | 2,071,304 | | | 1,964,815 | | | 1,651,894 | |
| | |
|
| |
|
| |
|
|
| | | 2,136,599 | | | 2,140,210 | | | 1,970,551 | |
| | |
|
| |
|
| |
|
|
Memorandum accounts: | | | | | | | | | |
Contingent liabilities | | 958,066 | | | 1,345,629 | | | 1,078,841 | |
Commitments and contingent liabilities | | 962,110 | | | 489,931 | | | 1,002,488 | |
| | |
|
| |
|
| |
|
|
| | | 1,920,176 | | | 1,835,560 | | | 2,081,329 | |
| | |
|
| |
|
| |
|
|
Statement of income: | | | | | | | | | |
Financial revenues | | 137,888 | | | 98,143 | | | 105,346 | |
Financial expenses | | (136,280 | ) | | (142,937 | ) | | (84,665 | ) |
There are no other material effects on the financial statements of the Group arising from transactions with these companies, other than the effects arising from valuing the investments in them by the equity method (Notes 2-c and 28-f) and from the insurance policies to cover pension and similar commitments (Note 3-j).
The notional amount of the futures transactions arranged by the Group with the main related companies amounts to approximately €7,021,414 thousand (€5,388,845 thousand in 2002).
F-82
In addition, as part of its normal activity, the Group has entered into agreements and commitments of various types with shareholders of subsidiaries and associated companies, which have no material impacts on the financial statements.
(28) INCOME STATEMENT DISCLOSURES
Following is certain relevant information in connection with the accompanying consolidated statements of income:
A. GEOGRAPHICALBREAKDOWN-
The table below shows the geographical breakdown of the main revenue balances in the accompanying consolidated statements of income, by country of location of the Bank branches and Group companies giving rise to them:
| | | | | | | | | |
| | | Thousands of Euros
| |
| | | 2003
| | | 2002
| | | 2001
| |
Financial revenues- | | | | | | | | | |
Spain | | 6,549,705 | | | 7,335,211 | | | 7,846,238 | |
Other European countries | | 363,507 | | | 633,049 | | | 1,714,574 | |
United States | | 349,807 | | | 63,872 | | | 2,777 | |
Latin America | | 5,186,443 | | | 8,289,627 | | | 11,387,675 | |
Rest of the world | | 88,003 | | | 911,150 | | | 656,840 | |
| | |
|
| |
|
| |
|
|
| | | 12,537,465 | | | 17,232,909 | | | 21,608,104 | |
| | |
|
| |
|
| |
|
|
Income from equities portfolio- | | | | | | | | | |
Spain | | 447,601 | | | 329,903 | | | 459,450 | |
Other European countries | | 1,662 | | | 1,709 | | | 2,140 | |
United States | | 239 | | | 5 | | | 24 | |
Latin America | | 14,602 | | | 25,848 | | | 32,569 | |
Rest of the world | | — | | | 597 | | | 1,261 | |
| | |
|
| |
|
| |
|
|
| | | 464,104 | | | 358,062 | | | 495,444 | |
| | |
|
| |
|
| |
|
|
Fees collected- | | | | | | | | | |
Spain | | 1,784,263 | | | 1,853,326 | | | 1,920,384 | |
Other European countries | | 194,923 | | | 204,015 | | | 230,602 | |
United States | | 107,429 | | | 22,997 | | | 71,556 | |
Latin America | | 1,790,566 | | | 2,217,039 | | | 2,554,778 | |
Rest of the world | | 5,387 | | | 33,616 | | | 56,297 | |
| | |
|
| |
|
| |
|
|
| | | 3,882,568 | | | 4,330,993 | | | 4,833,617 | |
| | |
|
| |
|
| |
|
|
Market operations- | | | | | | | | | |
Spain | | 375,226 | | | 319,078 | | | 179,618 | |
Other European countries | | 21,996 | | | 41,938 | | | 13,445 | |
United States | | 6,721 | | | (36 | ) | | 8,853 | |
Latin America | | 179,916 | | | 692,027 | | | 310,585 | |
Rest of the world | | 67,645 | | | (287,884 | ) | | (22,406 | ) |
| | |
|
| |
|
| |
|
|
| | | 651,504 | | | 765,123 | | | 490,095 | |
| | |
|
| |
|
| |
|
|
Other operating income- | | | | | | | | | |
Spain | | 4,303 | | | 4,179 | | | 14,936 | |
Other European countries | | 2,527 | | | 8,039 | | | 3,263 | |
United States | | 180 | | | 254 | | | 937 | |
Latin America | | 10,419 | | | 21,132 | | | 31,001 | |
Rest of the world | | (7 | ) | | 737 | | | 1,208 | |
| | |
|
| |
|
| |
|
|
| | | 17,422 | | | 34,341 | | | 51,345 | |
| | |
|
| |
|
| |
|
|
F-83
B. BREAKDOWNBYTYPEOFTRANSACTION-
The detail, by type of transaction, of certain captions in the accompanying consolidated statements of income is as follows:
| | | | | | | | |
| | | Thousands of Euros
| |
| | | 2003
| | 2002
| | | 2001
| |
Financial revenues- | | | | | | | | |
Bank of Spain and other central banks | | 270,548 | | 352,169 | | | 457,707 | |
Due from credit institutions | | 885,508 | | 1,077,074 | | | 1,807,592 | |
Fixed-income portfolio | | 3,323,501 | | 4,820,640 | | | 7,283,233 | |
Loans to public authorities | | 827,029 | | 1,509,262 | | | 1,053,502 | |
Loans to customers | | 7,188,105 | | 9,446,574 | | | 10,891,783 | |
Other revenues | | 42,774 | | 27,190 | | | 114,287 | |
| | |
| |
|
| |
|
|
| | | 12,537,465 | | 17,232,909 | | | 21,608,104 | |
| | |
| |
|
| |
|
|
Financial expenses- | | | | | | | | |
Due to Bank of Spain and other central banks | | 241,323 | | 256,433 | | | 258,393 | |
Due to credit institutions | | 1,567,741 | | 2,463,730 | | | 3,516,840 | |
Deposits | | 3,068,585 | | 5,456,666 | | | 7,592,170 | |
Bonds and other marketable debt securities | | 886,868 | | 997,669 | | | 1,189,925 | |
Subordinated debt (Note 21) | | 327,554 | | 405,775 | | | 429,694 | |
Cost allocable to the recorded pension provision (Notes 3-j and 20) | | 69,893 | | 60,041 | | | 42,480 | |
Other interest | | 98,094 | | 143,191 | | | 249,944 | |
| | |
| |
|
| |
|
|
| | | 6,260,058 | | 9,783,505 | | | 13,279,446 | |
| | |
| |
|
| |
|
|
Fees collected- | | | | | | | | |
Contingent liabilities | | 138,715 | | 135,595 | | | 136,052 | |
Collection and payment services | | 1,713,291 | | 1,842,831 | | | 1,877,845 | |
Securities services | | 1,627,295 | | 1,899,437 | | | 2,272,090 | |
Other transactions | | 403,267 | | 453,130 | | | 547,630 | |
| | |
| |
|
| |
|
|
| | | 3,882,568 | | 4,330,993 | | | 4,833,617 | |
| | |
| |
|
| |
|
|
Fees paid- | | | | | | | | |
Ceded to other entities and correspondents | | 433,608 | | 472,780 | | | 570,968 | |
Brokerage on asset and liability transactions | | 9,926 | | 15,394 | | | 19,383 | |
Other fees | | 176,227 | | 174,438 | | | 205,643 | |
| | |
| |
|
| |
|
|
| | | 619,761 | | 662,612 | | | 795,994 | |
| | |
| |
|
| |
|
|
Market operations- | | | | | | | | |
Sales and futures transactions on fixed-income securities and on interest rates (Notes 3-m and 26) | | 126,982 | | 566,453 | | | 115,749 | |
Sales and futures transactions on equity securities and other assets (Notes 10 and 26) | | 226,284 | | (30,685 | ) | | 47,173 | |
Writedowns of securities and other | | 10,523 | | (194,355 | ) | | (2,759 | ) |
Exchange differences (Note 3-b) | | 287,715 | | 423,710 | | | 329,932 | |
| | |
| |
|
| |
|
|
| | | 651,504 | | 765,123 | | | 490,095 | |
| | |
| |
|
| |
|
|
F-84
C. GENERALADMINISTRATIVEEXPENSES -PERSONNELCOSTS-
The detail of the balances of this caption in the accompanying consolidated statements of income is as follows:
| | | | | | |
| | | Thousands of Euros
|
| | | 2003
| | 2002
| | 2001
|
Wages and salaries | | 2,457,658 | | 2,743,819 | | 3,211,099 |
Social security costs | | 436,404 | | 491,736 | | 529,979 |
Net charge to in-house pension provisions (Notes 3-j and 20) | | 56,420 | | 39,067 | | 32,203 |
Contributions to external pension funds (Note 3-j) | | 78,501 | | 93,557 | | 90,272 |
Other expenses | | 233,604 | | 329,249 | | 379,821 |
| | |
| |
| |
|
| | | 3,262,587 | | 3,697,428 | | 4,243,374 |
| | |
| |
| |
|
The average total number of employees in the Group in 2003, 2002 and 2001, by category, was as follows:
| | | | | | |
| | | Number of Employees
|
| | | 2003
| | 2002
| | 2001
|
Spanish banks- | | | | | | |
- Executives | | 969 | | 166 | | 172 |
- Supervisors | | 20,547 | | 20,746 | | 20,222 |
- Clerical staff | | 9,309 | | 10,779 | | 11,767 |
- Abroad | | 674 | | 676 | | 678 |
| | |
| |
| |
|
| | | 31,499 | | 32,367 | | 32,839 |
Companies abroad | | | | | | |
- Mexico | | 25,249 | | 26,304 | | 28,936 |
- Venezuela | | 6,724 | | 7,953 | | 9,211 |
- Argentina | | 3,685 | | 4,375 | | 4,964 |
- Colombia | | 3,473 | | 3,819 | | 4,331 |
- Peru | | 2,373 | | 2,323 | | 2,219 |
- Other | | 4,452 | | 9,374 | | 9,628 |
| | |
| |
| |
|
| | | 45,956 | | 54,148 | | 59,289 |
Pension fund managers | | 6,181 | | 5,863 | | 6,656 |
Other nonbanking companies | | 3,553 | | 3,604 | | 3,937 |
| | |
| |
| |
|
| | | 87,189 | | 95,982 | | 102,721 |
| | |
| |
| |
|
F-85
D. DIRECTORS’COMPENSATIONANDOTHERBENEFITS-
In 2003, 2002 and 2001 the members of the Board of Directors of BBVA earned in this capacity €3,360 thousand, €6,699 thousand and €9,352 thousand, respectively.
The detail of the compensation earned in 2003, by item, is as follows:
| | | | | | | | | | | | | | |
| | | Thousands of Euros
|
Surname, First Name
| | Board
| | Board Committees
| | TOTAL
|
| | | Standing
Committee
| | Audit
| | Appointments
and
Compensation
| | Risk
| | Committee
Chairmanship
| |
Alvarez Mezquiriz, Juan Carlos | | 110 | | | | 60 | | 36 | | | | | | 206 |
Breeden, Richard C. | | 300 | | | | | | | | | | | | 300 |
Bustamante y de la Mora, Ramón | | 110 | | | | 60 | | | | 60 | | 45 | | 275 |
Ferrero Jordi, Ignacio | | 110 | | | | 60 | | | | | | 90 | | 260 |
Knörr Borrás, Román | | 110 | | 140 | | | | | | | | | | 250 |
Lacasa Suárez, Ricardo | | 110 | | | | | | | | 60 | | 150 | | 320 |
Marañón y Bertrán de Lis, Gregorio | | 110 | | | | | | 36 | | 60 | | | | 206 |
Medina Fernández, Enrique | | 110 | | 140 | | | | | | 60 | | | | 310 |
Rodríguez Vidarte, Susana | | 110 | | | | 60 | | | | | | | | 170 |
San Martín Espinós, José María | | 110 | | 140 | | | | 36 | | | | | | 286 |
Telefónica de España, S.A. | | 110 | | | | | | | | | | | | 110 |
Tomás Sabaté, Jaume | | 110 | | 140 | | | | 36 | | | | | | 286 |
| | |
| |
| |
| |
| |
| |
| |
|
TOTAL | | 1,510 | | 560 | | 240 | | 144 | | 240 | | 285 | | 2,979 |
| | |
| |
| |
| |
| |
| |
| |
|
Note: in 2003 Mr. José Mª Caínzos Fernández received a total of €381 thousand in his capacity as a member of the Board.
F-86
Bank executive directors earned in this capacity €8,032 thousand, €10,847 thousand and €11,125 thousand, respectively in 2003, 2002 and 2001.
The detail of the compensation received by the executive directors in 2003, by item, is as follows:
| | | | | | |
| | | Thousands of Euros
|
POST
| | Fixed
Compensation
| | Variable
Compensation
| | TOTAL
|
Chairman | | 1,461 | | 2,393 | | 3,854 |
Chief Executive Officer | | 1,081 | | 1,999 | | 3,080 |
Secretary General | | 491 | | 607 | | 1,098 |
| | |
| |
| |
|
TOTAL | | 3,033 | | 4,999 | | 8,032 |
| | |
| |
| |
|
As of December 31, 2003, the detail of the welfare commitments to the members of the Board of Directors were as follows:
| | |
| | | Thousands
of Euros
|
SURNAME, FIRST NAME
| | 2003
|
Alvarez Mezquiriz, Juan Carlos | | 124 |
Bustamante y de la Mora, Ramón | | 147 |
Ferrero Jordi, Ignacio | | 140 |
Knörr Borrás, Román | | 85 |
Lacasa Suárez, Ricardo | | 99 |
Marañón y Bertrán de Lis, Gregorio | | 125 |
Medina Fernández, Enrique | | 219 |
Rodríguez Vidarte, Susana | | 56 |
San Martín Espinós, José María | | 212 |
Tomás Sabaté, Jaume | | 207 |
| | |
|
TOTAL | | 1,414 |
| | |
|
As of December 31, 2002, the detail of the welfare commitments to the members of the Board of Directors were €1,058 thousand.
Also, in 2003 medical and accident insurance premiums amounting to €71 thousand were paid on behalf of members of the Board of Directors.
F-87
As of December 31, 2003, the detail of the welfare commitments to executive directors was as follows:
| | |
POST
| | Thousands
of Euros
2003
|
Chairman | | 28,882 |
Chief Executive Officer | | 23,697 |
Secretary General | | 3,090 |
| | |
|
TOTAL | | 55,669 |
| | |
|
As of December 31, 2002, the detail of the welfare commitments to executive directors was €36,376 thousand.
E. GENERALEXPENSES-
The breakdown of the balances of this caption in the accompanying consolidated statements of income is as follows:
| | | | | | |
| | | Thousands of Euros
|
| | | 2003
| | 2002
| | 2001
|
Technology and systems | | 370,125 | | 390,541 | | 483,394 |
Communications | | 199,132 | | 260,899 | | 336,993 |
Advertising | | 134,645 | | 157,891 | | 183,429 |
Buildings and fixtures | | 301,354 | | 370,082 | | 458,308 |
Taxes other than income tax | | 148,802 | | 165,957 | | 227,549 |
Other expenses | | 614,411 | | 728,927 | | 791,713 |
| | |
| |
| |
|
| | | 1,768,469 | | 2,074,297 | | 2,481,386 |
| | |
| |
| |
|
The balance of the “Other Expenses” account includes the fees paid by the Group companies to their respective auditors, which amounted to €12,972 thousand in 2003 (€15,789 thousand for 2002). Of the 2003 total, €8,282 thousand were incurred in company annual audits performed by firms belonging to the Deloitte & Touche world organization and €1,833 thousand were incurred to other audit firms (€5,784 thousand and €2,453 thousand, respectively, for 2002).
In 2003 the Group engaged these firms to perform non-attest services, the detail of which is as follows:
| - | Services provided by other audit firms: €1,283 thousand (€3,780 thousand in 2002). |
| - | Services provided by Deloitte & Touche: €1,575 thousand (€3,862 thousand in 2002), including fees paid to the aforementioned auditors for various services including the preparation of mandatory audit-related reports required by official bodies. |
F-88
F. NETINCOMEFROMCOMPANIESACCOUNTEDFORBYTHEEQUITYMETHOD-
The breakdown, by company, of the net balances of this caption in the accompanying consolidated statements of income is as follows:
| | | | | | | | | |
| | | Thousands of Euros
| |
| | | 2003
| | | 2002
| | | 2001
| |
Share in income and losses of companies accounted for by the equity method, net- | | | | | | | | | |
Share in income before taxes of nonconsolidated Group companies (Note 12): | | | | | | | | | |
BBVA Seguros, S.A. | | 179,491 | | | 145,910 | | | 135,769 | |
BBVA Desarrollos Inmobiliarios, S.L. | | 29,025 | | | (5,916 | ) | | 12,387 | |
Seguros Bancomer, S.A. de C.V. | | 49,191 | | | 44,323 | | | 33,741 | |
Unitaria Inmobiliaria, S.A. | | 5,755 | | | 13,880 | | | 18,072 | |
BBVA Seguros Ganadero Cía. de Seguros, S.A. | | 1,423 | | | 1,847 | | | (18,145 | ) |
BBVA Seguros Ganadero Cía. de Seguros de Vida, S.A. | | 2,297 | | | 1,246 | | | (15,278 | ) |
Fianzas Probursa, S.A. de C.V. | | 3,741 | | | (2,561 | ) | | (9,352 | ) |
Pensiones Bancomer, S.A. de C.V. | | 20,146 | | | 19,669 | | | 15,488 | |
Other companies, net | | 54,284 | | | 35,203 | | | 56,105 | |
| | |
|
| |
|
| |
|
|
| | | 345,353 | | | 253,601 | | | 228,787 | |
| | |
|
| |
|
| |
|
|
Share in net income of associated companies (Note 11): | | 357,085 | | | 21,995 | | | 543,038 | |
| | | |
Less- | | | | | | | | | |
Correction for payment of dividends- | | | | | | | | | |
Final or prior years’ dividends | | (194,158 | ) | | (111,461 | ) | | (171,192 | ) |
Interim dividends paid out of income for the year | | (124,968 | ) | | (130,891 | ) | | (207,962 | ) |
| | |
|
| |
|
| |
|
|
| | | (319,126 | ) | | (242,352 | ) | | (379,154 | ) |
| | |
|
| |
|
| |
|
|
| | | 383,312 | | | 33,244 | | | 392,671 | |
| | |
|
| |
|
| |
|
|
G. EXTRAORDINARYINCOME/LOSSES-
The breakdown of the net balances of these captions in the accompanying consolidated statements of income is as follows:
| | | | | | | | | |
| | | Thousands of Euros
| |
| | | 2003
| | | 2002
| | | 2001
| |
Net special provisions (Notes 14 and 20) (*) | | 17,951 | | | (384,200 | ) | | (925,775 | ) |
Other losses arising from pension and similar commitments (Notes 3-j and 20) | | (118,328 | ) | | (192,846 | ) | | (86,336 | ) |
Other income arising from adjustment of deferred contributions (Note 3-j) | | — | | | 3,878 | | | — | |
Merger expenses | | — | | | — | | | (44,325 | ) |
Gains on disposal of property and equipment and long-term investments (Notes 10 and 14) | | 44,248 | | | 99,646 | | | 252,551 | |
Recovery of interest earned in prior years | | 80,043 | | | 73,864 | | | 271,856 | |
Adjustment of earnings due to currency redenomination (Note 3-b) | | (56,611 | ) | | 4,431 | | | 69,279 | |
Net charge to the theoretical goodwill relating to Bradesco (Note 4) | | — | | | (34,719 | ) | | — | |
Other extraordinary income (losses), net | | (70,238 | ) | | (2,635 | ) | | (263,520 | ) |
| | |
|
| |
|
| |
|
|
| | | (102,935 | ) | | (432,581 | ) | | (726,270 | ) |
| | |
|
| |
|
| |
|
|
| (*) | Includes the net charges to the specific provision for Argentina in 2001. |
The foregoing detail of the “Merger Expenses” account also includes other merger expenses, most notably the accelerated depreciation of nonrecoverable equipment and fixtures in closed branches and the accelerated amortization of computer software which are no longer being used due to the unification of systems.
F-89
(29) CONSOLIDATED STATEMENTS OF CHANGES IN FINANCIAL POSITION
The 2003, 2002 and 2001 consolidated statements of changes in financial position are as follows:
| | | | | | | | | |
| | | Thousands of Euros
| |
| | | 2003
| | | 2002
| | | 2001
| |
APPLICATION OF FUNDS | | | | | | | | | |
Dividends paid | | 1,108,492 | | | 1,252,870 | | | 1,100,240 | |
External capital contributions- | | | | | | | | | |
Purchase of own shares, net | | — | | | 21,990 | | | 3,407 | |
Minority interests, net (Note 22) | | 784,410 | | | 715,330 | | | 1,025,062 | |
Subordinated debt (Note 21) | | — | | | 505,594 | | | 474,849 | |
Total net lending | | 8,151,501 | | | — | | | 15,218,935 | |
Fixed-income securities | | 2,973,901 | | | — | | | 9,423,564 | |
Equity securities | | 51,320 | | | — | | | 656,853 | |
Marketable securities | | — | | | — | | | 1,084,011 | |
Deposits | | 5,511,458 | | | 19,939,069 | | | — | |
Financing, net of investment, at credit institutions | | — | | | 5,540,828 | | | — | |
Acquisition of long-term investments- | | | | | | | | | |
Purchase of investments in Group and associated companies (Notes 11 and 12) | | 2,383,404 | | | 2,316,991 | | | 2,718,113 | |
Additions to property and equipment and intangible assets | | 1,166,615 | | | 999,147 | | | 2,824,121 | |
Other asset items less liability items | | 991,993 | | | 3,403,194 | | | — | |
| | |
|
| |
|
| |
|
|
TOTAL FUNDS APPLIED | | 23,123,094 | | | 34,695,013 | | | 34,529,155 | |
| | |
|
| |
|
| |
|
|
SOURCE OF FUNDS | | | | | | | | | |
From operations- | | | | | | | | | |
Net income | | 2,226,701 | | | 1,719,129 | | | 2,363,336 | |
Add- | | | | | | | | | |
- Depreciation and amortization expense | | 1,215,631 | | | 1,439,666 | | | 1,641,663 | |
- Net provision for asset writedown and to other special provisions | | 1,453,532 | | | 2,646,688 | | | 2,490,035 | |
- Losses on sales of treasury stock, investments and fixed assets | | 124,841 | | | 309,651 | | | 258,434 | |
- Minority interests | | 670,463 | | | 746,919 | | | 645,223 | |
- Income of companies accounted for by the equity method, net of taxes | | — | | | 49,151 | | | — | |
Less- | | | | | | | | | |
- Income of companies accounted for by the equity method, net of taxes | | (253,445 | ) | | — | | | (305,290 | ) |
- Gains on sales of treasury stock, investments and fixed assets | | (722,420 | ) | | (770,292 | ) | | (1,295,853 | ) |
| | |
|
| |
|
| |
|
|
| | | 4,715,303 | | | 6,140,912 | | | 5,797,548 | |
External capital contributions- | | | | | | | | | |
Sale of treasury stock | | 13,787 | | | — | | | — | |
Minority interests, net (Note 22) | | — | | | 714,451 | | | 260,484 | |
Subordinated debt (Note 21) | | 1,334,582 | | | — | | | 3,253,057 | |
Financing, net of investment, at credit institutions | | 5,911,890 | | | — | | | 6,404,308 | |
Deposits | | — | | | — | | | 12,353,241 | |
Total net lending | | — | | | 8,554,159 | | | — | |
Fixed-income securities | | — | | | 13,031,268 | | | — | |
Equity securities | | — | | | 504,413 | | | — | |
Marketable securities | | 6,859,380 | | | 2,147,598 | | | — | |
Sale of long-term investments- | | | | | | | | | |
Sale of investments in Group and associated companies (Notes 11 and 12) | | 3,458,192 | | | 2,879,384 | | | 3,603,288 | |
Sale of property and equipment and intangible assets | | 829,960 | | | 722,828 | | | 2,531,180 | |
Other asset items less liability items | | — | | | — | | | 326,049 | |
| | |
|
| |
|
| |
|
|
TOTAL FUNDS OBTAINED | | 23,123,094 | | | 34,695,013 | | | 34,529,155 | |
| | |
|
| |
|
| |
|
|
F-90
(30) OTHER INFORMATION
On March 22, 2002, BBVA notified the supervisory authorities of the stock markets on which its shares are listed that the Bank of Spain had commenced a proceeding against BBVA and 16 of its former directors and executives. These proceedings arose as a result of the existence of funds belonging to BBV that were not included in the entity’s financial statements until they were voluntarily regularized by being recorded in the 2000 consolidated statement of income as extraordinary income, for which the related corporate income tax was recorded and paid. These funds totaled Ptas. 37,343 million (approximately €225 million) and arose basically from the gains on the sale of shares of Banco de Vizcaya, S.A. and Banco Bilbao Vizcaya, S.A. from 1987 to 1992, and on the purchase and sale by BBV of shares of Argentaria, Caja Postal and Banco Hipotecario, S.A. in 1997 and 1998.
After dissolving the legal vehicles where the unrecorded funds were located and including the funds in its accounting records, BBVA notified the Bank of Spain of these matters on January 19, 2001. The Bank of Spain’s supervisory services commenced an investigation into the origin of the funds, their use and the persons involved, the findings of which were included in the supervisory services’ report dated March 11, 2002. On March 15, 2002, the Bank of Spain notified the Bank of the commencement of a proceeding relating to these events.
On April 9, 2002, the Central Examining Court Number 5 of the National Appellate Court ordered that these events be investigated in preliminary proceedings which are being conducted at the Court. Also, it required the Bank of Spain to stay the conduct of its proceeding until the criminal liability that may arise as a result of these events, if any, is determined.
On May 22, 2002, the Council of the Spanish National Securities Market Commission (CNMV) commenced a proceeding against BBVA, S.A. for possible contravention of the Securities Market Law (under Article 99 o) thereof) owing to the same events as those which gave rise to the Bank of Spain’s proceeding and the legal proceedings. On January 7, 2003, the CNMV stated that the proceeding was stayed until the final court decision on the criminal proceedings is handed down.
As of the date of preparation of these consolidated financial statements, none of the persons party to the proceedings or accused of the events referred to above is a member of the Board of Directors or the Management Committee or holds executive office at BBVA. Although the stayed proceedings, in which charges have not yet been brought, and the preliminary proceedings are at a very early stage, in view of the events and the surrounding circumstances, the Group’s legal advisers do not expect them to have a material effect on the Bank.
(31) DETAIL OF THE DIRECTORS’ HOLDINGS IN COMPANIES WITH SIMILAR BUSINESS ACTIVITIES
Pursuant to Article 127 third of the Spanish Corporations Law as introduced by Law 262003 modifying Securities Market Law 24/1988, and the revised Corporations Law, for the purpose of enhancing transparency in listed companies, below is a list of the companies in which the Company’s directors have direct or indirect holdings and whose business activities are the same as, or similar or supplementary to, those making up the corporate purpose of BBVA, S.A.
In no case do the directors perform executive or management duties at these companies.
F-91
| | | | | | |
Surname, First Name
| | Holding
|
| | Company
| | Number of Shares
| | Type of Holding
|
Alvarez Mezquiriz, Juan Carlos | | Santander Central Hispano | | 72 | | Direct |
Breeden, Richard C. | | — | | — | | — |
Bustamante y de la Mora, Ramón | | Santander Central Hispano | | 1,000 | | Indirect |
Ferrero Jordi, Ignacio | | Santander Central Hispano Banco Popular Español Bankinter | | 7,860
340
1 | | Indirect
Indirect
Indirect |
Goirigolzarri Tellaeche, José Ignacio | | — | | — | | — |
González Rodriguez, Francisco | | Bancoval | | 76,040 | | Indirect |
Knörr Borrás, Román | | Santander Central Hispano | | 14,724 | | Indirect |
Lacasa Suárez, Ricardo | | Banco Popular Español | | 17,168 | | Direct |
Maldonado Ramos, José | | — | | — | | — |
Marañón y Bertrán de Lis, Gregorio | | Banco Español de Crédito | | 364 | | Indirect |
Medina Fernández, Enrique | | Santander Central Hispano Banco Popular Español Bank of America Corp, HSBC Holdings ING Groep, N,V, Royal Bank of Scotland | | 3,193
410
81
801
418
221 | | Indirect
Indirect
Indirect
Indirect
Indirect
Indirect |
Rodríguez Vidarte, Susana | | — | | — | | — |
San Martín Espinós, José María | | Santander Central Hispano | | 947 | | Direct |
Angel Vilá Boix (representante de Telefónica de España, S.A.) | | Banco Sabadell BNP Paribas | | 2,500
500 | | Direct
Direct |
Tomás Sabaté, Jaume | | — | | — | | — |
(32) RECENT DEVELOPMENTS AND DIFFERENCES BETWEEN SPANISH AND UNITED STATES GENERALLY ACCEPTED ACCOUNTING PRINCIPLES AND OTHER REQUIRED DISCLOSURES.
(32.1) SUBSEQUENT EVENTS
Increase of capital stock
At its meeting on February 3, 2004, at which statutory consolidated financial statements were prepared, the Board of Directors of BBVA resolved, inter alia, to increase capital by a nominal amount of €95,550,000, through the issuance of 195,000,000 ordinary shares of €0.49 par value each, of the same class and series, traded by the book-entry trading system. The aforementioned capital increase, which involved the disapplication of preemptive subscription rights, was performed under the powers granted by the Shareholders’ Meeting on March 9, 2002, in accordance with the stipulations of Article 153.1.b) of the Spanish Corporations Law. Article 161.1 of the Spanish Corporations Law expressly provides for the possibility of the capital increase not being fully subscribed.
In accordance with the stipulations of Article 159.2. of the Spanish Corporations Law, the issue price should be the reasonable value of the shares, which in the case of listed companies is taken to be the market price.
The capital increase was aimed exclusively at Spanish and foreign institutional investors through a placement method known asAccelerated Bookbuilt Offering (ABO) led by an investment bank. For general interest reasons, and in order to enable the shares to be placed among institutional investors using the aforementioned procedure, the powers granted by the Shareholders’ Meeting on March 9, 2002, were exercised and the BBVA shareholders’ and convertible debenture holders’ have no preemptive subscription rights.
The new shares will entitle their owners to share in any distribution of dividends paid after the capital increase is registered in Iberclear’s accounting records, and in assets in the event of liquidation. As regards the dividend to be paid out of 2003 income, holders of the new shares will only be entitled to receive the amount of any final dividend that the Shareholders’ Meeting resolved to declare, if the shares are issued prior to the date of this Shareholders’ Meeting (Note 5).
Tender offer for Bancomer
This capital increase is part of a global operation to attract funds to strengthen the Group’s equity structure and enable it to undertake its expansionary projects, in particular the tender offer for all the shares of Grupo Financiero BBVA BANCOMER, S.A. de C.V., as resolved at the Board meeting that took place on January 30, 2004, ensure the normal growth of its current business and maintain its solvency above the levels stipulated by Bank of Spain regulations (Note 2-e).
As of the date of the beginning of the tender offer, the BBVA Group owned 5,512,708,648 shares of BANCOMER representing 59.4% of its capital stock (Note 4). The offer approved by the Board of Directors is for all the shares not currently owned by BBVA, i.e. 3,763,898,174 BANCOMER shares representing 40.6% of its capital stock.
The tender offer concluded at March 19th, 2004. The amount of total cost of the transactions was €3,254 million. BBVA is performing the intangibles assets identification, purchase price allocation and accounting of goodwill under US GAAP.
As of the date of preparation of these consolidated financial statements, the BBVA Group owned shares of BANCOMER representing 99.66% of its capital stock.
Shareholder’s Meeting
The Shareholders’ Meeting held on February 28, 2004 approved, among other agreements, the following:
| | · | BBVA’s annual report for the year 2003. |
| | · | Approval of the final dividend of €1,249,437 thousand. |
F-92
| | · | Annulling the resolution passed by the Shareholders’ Meetings held on March 9, 2002 under item 3 of its agenda, and acknowledging the Board of Directors’ partial exercise of this authorization, conferral of authority on the Board of Directors, in compliance with articles 153.1b) of the Spanish Companies Act, to increase the capital stock to a maximum of 50% of the Company’s subscribed share capital paid up on the date of the authorization. The Board would be able to issue capital for the amount decides, over a period of no more than five years. |
| | · | Annulling, insofar as unused, the authorisation conferred at the Company General Shareholders Meeting of 9th March 2002 under item Four on its agenda, to authorise the Board of Directors to issue fixed-yield securities, of any class or kind, including swappable securities, not convertible into shares, to a maximum nominal sum of 71,750 million Euros. |
| | · | Amendment of articles 24 “Proxy to attend the GSM”; 29 “Shareholders’ right to information”; 31 “Adoption of Resolutions”; 34 “Number and Election”; 35 “Requirements for Directors”; 37 “Vacancies”; 38 “Chairman and Secretary of the Board” and 45 “Creation and composition”; of the Company’s Bylaws. |
| | · | Approval of the Regulations of the BBVA General Shareholders Meeting. |
| | · | Delegation of authority to request listing or de-listing of Banco Bilbao Vizcaya Argentaria, S.A. shares on foreign Securities Exchanges. |
| | · | Authorisation of the Company to acquire its treasury stock, directly or through its Group of companies, in accordance with Article 75 of the Spanish Corporate Act. |
| | · | Reelection of auditors for fiscal year 2004. |
Re-election of three members of the Board of Directors in accordance with the provision stated in Article 36 of BBVA’s by-laws and appointment of Mr. José Antonio Fernández Rivero and Mr. Carlos Loring Martínez de Irujo as members of the Board of Directors for a five-year term.
Sale of Banco Atlántico
The transaction mentioned in note 11 in which Banco Sabadell, S.A. launched a tender offer on the shares of Banco Atlántico, S.A. performed in March 2004. That gave rise to a gain of €218 millions in 2004.
BBVA Banco Francés (“Banco Francés”).
On March 18, 2004, the Board of Directors of BBVA Banco Frances, our Argentine affiliate, resolved to implement a plan intended to improve Banco Frances’s adjusted stockholders’ equity and enable Banco Frances to comply with new minimum capital requirements established by the Argentine Central Bank. The plan provides for:
| a) | a capital increase of up to ARP 385 million (approximately US$132.2 million or €108 million at exchange rate as of March 31, 2004), which will be submitted for approval at an ordinary and extraordinary stockholders meeting and to the appropriate local authorities and |
| b) | the sale of Banco Francés’s entire interest in Banco Francés (Cayman) Limited, which has been approved by regulatory authorities of the Cayman Islands. |
BBVA, as Banco Francés’s largest shareholder, intends to participate in this plan by:
| (1) | capitalizing a loan granted by BBVA to BBVA Banco Francés in an amount up to US$ 77.7 million (€63.6 million at exchange rate as of March 31, 2004) |
| (2) | subscribing, if other shareholders will not subscribe it, to a capital increase in an maximum amount up to US$ 40 million (€32.7 million at exchange rate as of March 31, 2004). |
Furthermore, BBVA have acquired from BBVA Banco Francés its entire interest in Banco Francés (Cayman) Limited for a purchase price of US$ 238.5 million (€195 million at exchange rate as of March 31, 2004), which is based on the independent valuation of Banco Francés (Cayman) Limited by two well-recognized valuation experts.
The two transactions involving Banco Frances described above will not affect BBVA’s consolidated operating results because (i) in the case of the loan capitalization, BBVA had previously fully provisioned the loan, and (ii) in the case of the purchase of Banco Frances (Cayman) Limited, this entity was already fully consolidated by BBVA.
De-listing of Buenos Aires Stock Exchange
Because of our investment in Argentine, the listing in Buenos Aires Stock Exchange was required by local authorities in 2000. However, none share have been traded as of nowadays in this stock exchange. Therefore, accordingly with the delegation of authority to request listing or de-listing of Banco Bilbao Vizcaya Argentaria, S.A. shares on foreign Securities Exchanges approved by Shareholders’ meeting mentioned above, on April 1, 2004, BBVA have applied for de-listing of our shares in this stock exchange. On June 15, 2004, de-listing have been approved by Buenos Aires Stock Exchange and National Exchange Commission in Argentine.
Sale of Acerinox
On June 18, 2004, BBVA sold its entire 5.01% interest in Acerinox, S.A. The total sale price was €146.6 million) and gave rise to a capital gain of €35 million.
(32.2) DIFFERENCES BETWEEN SPANISH AND UNITED STATES GENERALLY ACCEPTED ACCOUNTING PRINCIPLES AND OTHER REQUIRED DISCLOSURES.
As described in Note 2, the accompanying consolidated financial statements of the BBVA Group are presented in the formats stipulated by Bank of Spain circulars and were prepared by applying the generally accepted accounting principles for banks in Spain (“Spanish GAAP”), largely dictated by Bank of Spain. Such formats and accounting principles vary in certain respects from those generally accepted in the United States (“U.S. GAAP”). Following is a summary of the main differences between Spanish and U.S. generally accepted accounting principles:
| | |
• Significant valuation and income recognition principles under Spanish and U.S. GAAP | | A |
| |
• Net income and Stockholders’ Equity reconciliation between Spanish and U.S. GAAP | | B |
| |
• Consolidated Financial Statements | | C |
| |
• Additional information required by U.S. GAAP | | D |
F-93
The preparation of these financial statements requires management to make estimates and assumptions that affect the reported amounts and allocations of assets and liabilities and disclosures of contingent assets and liabilities and the reported amounts of revenues and expenses during the reported period. Actual results could differ from those estimated but any difference should not be material.
(32.2.A) SIGNIFICANT VALUATION AND INCOME RECOGNITION PRINCIPLES UNDER SPANISH AND U.S. GAAP
Following is a description of the most significant valuation and income recognition principles under Spanish and U.S. GAAP applicable to the financial statements of the Banco Bilbao Vizcaya Argentaria Group:
| | | | | | |
SPANISH GAAP
| | US GAAP
|
Consolidation procedures and Investments in affiliated companies (See notes 2-c, 3-e, 4, 11 and 12) | | |
| |
Consolidation Procedures Spanish GAAP establishes three consolidation procedures: | | Consolidation Procedures |
| | |
| - | | Global Integration Method (full consolidation): this method is applied to all the companies that are directly or indirectly more than 50% owned by the Bank or, if less than 50% owned, are effectively controlled by the Bank, whose business activities do not differ from those of the Bank and which constitute, together with it, a single decision-making unit. | | - Generally, consolidation is required for, and is limited to, all investments that are directly or indirectly controlled by the investor, which is usually evidenced by ownership of a majority of the voting shares of the investee. Even when 50% of the voting interest is not owned, consolidation is appropriate if by contract, lease or agreement the investor has control over the venture. |
| | |
| | | There are several subsidiaries that belong to BBVA Banco Continental Group (Perú): Banco Continental, S.A. (parent company), Continental Bolsa, SAB, S.A., Continental, S.A. Sociedad Administradora de Fondos, Continental Sociedad Titulizadora, Inmuebles y Recuperaciones Continental. BBVA Groups holds 46% of Continental Group, however, BBVA Group has the control over Continental Group due to permanent shareholders’ agreements that give the control of the companies to BBVA. | | |
| | |
| | | The Global Integration method fully consolidates the financial statements of companies controlled by the parent company after eliminating all inter-company transactions and recognizing minority interest. This method follows the rules as expressed by ARB 51 and SFAS 94. | | |
| | |
| - | | Proportional Integration Method: this method is applied to all the companies whose line of business is directly related to those of the Bank, and which at least 20% owned by the Bank and managed jointly with another shareholders. This method is applied as follows: | | - Proportional Integration Method is not generally permitted under US GAAP. |
| | | |
| | | 1. | | Assets, rights, obligations, revenues and expenses of the joint venture are included in consolidated financial statements based on the Group’s holding in the joint venture. For example, if the Group’s holding is 30% then 30% of the joint venture’s assets are included in the consolidated financial statements. | | |
| | | |
| | | 2. | | The proportional method of consolidation does not result in the recognition of minority interest. | | |
| | | |
| | | 3. | | Inter-company transactions are eliminated to the extent of the interest held on the Joint Venture. | | |
| | | |
| | | 4. | | The cost of the parent investment in the joint venture is eliminated as the joint venture’s net assets. At the date of acquisition this difference will be allocated to assets or liabilities and the amount not allocated will be registered as Goodwill or Negative Goodwill. See | | |
F-94
| | | | | | | | |
| | | | | explanation of differences about “Business combinations, goodwill and intangible assets” in section below. | | | | |
| | | | |
| | | 5. | | Joint ventures that are less 20% owned by the Bank, are accounted for under Spanish GAAP using the equity method. | | | | |
| | | | |
| | | | | In note 32.2.D.3 we show the effect of the use the proportional consolidation method on our consolidated financial statements under Spanish GAAP. | | | | |
| | |
| - | | Equity Method: it is applied to all the companies that are directly or indirectly more than 50% owned by the Bank or, if lees than 50% owned, are effectively controlled by the Bank, whose business activities differ from those of the Bank (See Note 12 - Investment in Group Companies). | | - These subsidiaries should be consolidated for U.S. GAAP, the effect of consolidating these companies is shown in Note 32.2.D.3 in this 2003 Form 20-F. |
| |
| Investment in Affiliated Companies | | Investment in Affiliated Companies |
| |
| Investments in listed affiliated companies owned over 3% and in unlisted affiliated companies owned over 20% are generally accounted for by the equity method. See Note 11, “Investments in Non-group companies”. | | Investments in affiliated companies which enable the investor to exercise significant influence over the investee are accounted for by the equity method. An investment over 20% but less than 50% should lead to a presumption of significant influence. |
| | |
| - | | Sometimes, BBVA Group maintains holdings in specific “Non-Group companies” with different purposes. Under Spanish GAAP despite the different purposes of these holdings and the different accounting treatment of them, as a portion of the specific holding should be classified as “Affiliated Company” (“Non-Group Companies” under Spanish GAAP”) the whole holding is classified as “Non-Group Companies” in the Balance Sheet. The purpose of a portion of the specific holding is to exercise a significant influence over the investee that will be held on a long-term basis. Therefore this portion is classified as “Affiliated Companies” (Long Term Investments in Note 11) and it is accounted for by the equity method. The purpose of any additional interest in an specific holding (“Non-Group company”) can vary (tax purposes, market purposes,…) and this portion is classified as Available for sale or Trading (“Other Investments in associated companies “ in Note 11). | | - Trading securities are stated at market value, and differences between market value and book value are reported in the statement of income. - Available-for-sale securities are measured at fair value and unrealized gains and losses, including the effect of hedges, are reported as a net amount within Accumulated Other Comprehensive Income. |
| | | |
| - | | Some of the holdings in “Non-group Companies” classified as “Available for Sale” are hedged. BBVA Group trades equity swaps to hedge market risk. The strike prices of equity swaps are always the same as the carrying values of the hedged securities at the inception of the hedges. This means that any variation in the fair value of the hedged item (securities) will be very similar to the variations in the fair value of the equities. This is due to the fact that derivative instruments used are rolled over every month. Under Spanish GAAP the accounting treatment is as follows: | | | | Under US GAAP, this kind of hedges are fair value hedges. Therefore, both hedged item and hedging item should be registered at fair value, and changes in fair value shall be recognized in the income statement. As there is no significant ineffectiveness the net effect in earnings would be close to zero. Accordingly, there are not any adjustments in the reconciliation of Net Income and Stockholders’ equity concerning this matter |
| | | | |
| | | o | | All settlements produced by the equity swaps are recorded as an asset or a liability on the balance sheet. | | | | |
| | | | |
| | | o | | Net effect in the income statement is nil. | | | | |
F-95
| | |
SPANISH GAAP
| | U.S. GAAP
|
| |
| Deferred charges | | |
| |
| (See Note 3-f) | | |
| |
| Capital increase expenses are amortized over a five-year period. | | These expenses are classified as a reduction ofStockholders’ Equity when incurred. |
| |
| Start up activities expenses are amortized over a five-year period. | | These expenses are accounted for as non-interest expenses, as incurred. |
| |
| Treasury stock | | |
| |
| (See Notes 3-i and 23) | | |
| |
| Gains or losses on transactions with Bank shares owned by consolidated companies are accounted for as extraordinary results. | | The results of transactions in parent company shares (treasury stock) are accounted for in “Additional paid-in capital” and have no effect on the income statement. |
| |
| Loans granted to shareholders and employees for the acquisition of treasury stock are recorded in the consolidated balance sheets under Loans and Leases. | | Loans granted to shareholders and employees for the acquisition of parent company stock are recorded as a reduction of Stockholders’ Equity. |
| |
| Income taxes | | |
| |
| (See Notes 3-l and 25) | | |
| |
| The tax expense for corporate income tax is calculated on the basis of book income before taxes, increased or decreased by permanent differences. | | Income tax expense is comprised of two components: current tax payable or refundable and deferred tax expense or benefit. Deferred taxes are computed with respect to all differences between reported earnings and taxable earnings that are attributable to differences in the timing of expected revenue recognition or expense deductibility. |
| |
| Deferred tax assets and liabilities are recorded in respect of timing differences that are expected to result in a taxation asset or liability in a period of less than ten years. | | With limited exceptions, deferred tax assets and liabilities must be recognized regardless of when the timing difference is likely to reverse. A valuation allowance is recorded against deferred tax assets when it is more likely than not that the future tax benefit will not be realized. |
F-96
| | |
SPANISH GAAP
| | U.S. GAAP
|
| |
| Foreign currency translation | | |
| |
| (See Note 3-b) | | |
| |
| A functional currency approach is used in identifying the consolidated impact of foreign currency transactions. The functional currency is generally the reporting currency of the operating unit. Transactions of individual reporting units in currencies other than the identified functional currency are translated into the functional currency with resulting net gains or losses reported as a component of current period earnings. | | A functional currency approach is used in identifying the consolidated impact of foreign currency transactions. The functional currency is generally the reporting or local currency of the operating unit. Transactions and balances of individual reporting units in currencies other than the identified functional currency are translated into the functional currency with resulting net gains or losses reported as a component of current period earnings. |
| |
| For purpose of translating assets and liabilities, the exchange rate at the balance sheet date is used. Revenues, expenses, gains, and losses are translated using the average exchange rate for the period. Gains and losses offset by qualifying hedge transactions are reported consistently with the underlying currency transaction. | | For purpose of translating assets and liabilities into the reporting currency, the exchange rate at the balance sheet date is used. Revenues, expenses, gains, and losses are translated into the reporting currency using a weighted average exchange rate for the period. Gains and losses offset by qualifying hedge transactions are reported consistently component of accounted other comprehensive income. |
| |
| For purpose of consolidation, net translation gains and losses resulting from translation of the financial statements of operating units with functional currencies different from the parent, are recorded as a component of reserves. | | For purpose of consolidation net translation gains and losses resulting from translation of the financial statements of operating units with functional currencies different from the parent, are recorded as a component of accumulated other comprehensive income. |
| |
| Adjustments to income statement allowed under local accounting regulations in high-inflation countries are registered as extraordinary results. | | The financial statements of operating units in a highly inflationary economy are remeasured as if the functional currency of the operating unit were the same as that of the parent reporting currency. For the purposes of this requirement, a highly inflationary economy is one that has cumulative inflation of approximately 100 percent or more over a 3-year period. |
F-97
| | |
SPANISH GAAP
| | U.S. GAAP
|
| |
| Investment securities | | |
| |
| (See Notes 6, 9 and 10) | | |
| |
| Debt securities are classified as trading, ordinary investment or held-to-maturity securities, depending on the intent of the investment. | | |
| |
| Equity investments in listed companies owned less than 3% and non-listed companies owned less than 20% are classified as trading, ordinary investment or long term investment securities, depending on the intent of the investment. | | |
| |
| Trading securities are stated at market value, and differences between market value and book value are reported in the statement of income. | | Debt securities are classified as trading, available-for-sale or held-to-maturity securities, depending on the intent of the investment. |
| |
| Ordinary investment securities are measured at lower of cost adjusted for any premium or discount generated when the security was purchased (adjusted acquisition price) or market price, with unrealized losses reported in an accrual account or provisioned in the statement of income if deemed to be permanent creating a specific allowance. Releases from this allowance arise when unrealized losses disappear. Unrealized gains are not recorded. | | Equity investments in companies owned less than 20% with readily determinable fair values are classified as trading or available-for-sale, depending on the intent of the investment. |
| |
| Held-to-maturity and permanent investment securities are stated at acquisition price adjusted by the amount resulting from accrual by the interest method of the positive or negative difference between the redemption value and the acquisition cost over the term to maturity of the security. | | Held-to-maturity securities are stated at adjusted acquisition price. |
| |
| | | Non-marketable equity investments of 20% or less are accounted for under the cost method. Carrying values of individual non-marketable equity securities are reduced through write-downs to reflect other-than-temporary impairments in value. |
| |
| The basis on which cost is determined in computing realized gains or losses is the average amortized cost method. | | The basis on which cost is determined in computing realized gains or losses is the average amortized cost method. |
| |
| For impairment criteria see note 32.2.B.9. | | For impairment criteria see note 32.2.B.9. |
F-98
| | |
| Premises and equipment | | |
| |
| (See Notes 3-h, 14 and 24) | | |
| |
| Premises and equipment are stated at revalued cost, net of the related accumulated depreciation. Revaluation is permitted only pursuant to relevant legislation. | | Premises and equipment are stated at cost after subtracting accumulated depreciation and amortization. Depreciation is computed using the straight-line method over the estimated useful life of the asset. No revaluation is permitted |
| |
| Depreciation is computed on the restated value using the straight-line method over the estimated useful life of the asset. The amount of depreciation and amortization charged to income is deductible for corporate income tax purposes. In addition, gains or losses on sales of the asset are determined as the difference between the selling price and the net restated value. | | |
| |
| Fixed assets acquired and certain of those leased from both related and third parties through 1985, following the provisions of Spanish Royal Decree-Law 2/1985, were depreciated on an accelerated useful lives basis. | | |
F-99
| | |
SPANISH GAAP
| | U.S. GAAP
|
| Business combinations, goodwill and intangible assets. | | |
| |
| (See Notes 3-g and 13) | | |
| |
| There are no specific guidelines in accounting for business combinations. | | From July 1, 2001, all business combinations must be accounted for using the purchase method. |
| |
| It should be accounted as pooling of interest when there it implies a deep managerial and economical reorganization, and when the difference in net value of both entities is not significant. Otherwise, it should be recorded as an acquisition. | | Purchase accounting: the valuation was based on fair values of the net assets as of the time of the acquisition. The differences between the fair value of the net assets and the consideration paid represent goodwill. Income of the acquired company was reflected only from the acquisition date onwards. |
| |
| Generally, valuation of acquisitions is based on the book value of the net assets acquired. The difference between net assets and consideration paid is assigned, where appropriate, to those assets and liabilities whose fair value differs from their book value. Any difference remaining after this imputation is classified as goodwill. Income of the acquired company is reflected only from the acquisition date onwards | | Since January 1, 2002, goodwill is generally no longer amortized, but instead it is subject to an impairment test at least annually. For the purpose of testing goodwill for impairment, all goodwill acquired in a business combination shall be assigned to one or more reporting units as of the acquisition date. Negative goodwill are recorded in the statement of income after appropriately reducing the assigned values at the recorded assets. |
| |
Positive goodwill is amortized over the period estimated to be benefited not exceeding 20 years (reasons for periods in excess of five years should be explained in notes to the financial statements). Under special circumstances, and with the authorization of the Bank of Spain, goodwill may be charged-off against reserves. Negative goodwill are registered in the balance sheet | | Intangible assets must be recognized as assets apart from goodwill. Intangible assets that have indefinite useful lives are not amortized but rather are tested at least annually for impairment. Intangible assets that have finite useful lives are amortized over their useful lives. |
| |
| All intangible assets shall be amortized. The amortization periods differ for each intangible asset class. | | |
F-100
| | |
| Pension plan and early retirements | | |
| |
| (See Notes 2-f, 2-h, 3-j y 20) | | |
| |
| Pension commitments, since year 2000, are covered either by insurance contracts or external pension funds. All interest and actuarial risks have been transferred to the insurance company or the pension fund together with the plan assets, which are higher than pension liabilities. | | U.S. Financial Accounting Standard No. 87 provides detail guidance regarding the accounting for pension liability and cost. This guidance requires the recording of the excess of a defined actuarial valuation of the present value of post retirement benefits over the adjusted fair value of plan assets maintained in an external fund. |
| |
| Changes in pension liability due to amendment of the plans, are treated as prior service costs. Such differences are amortized over a maximum period of 15 years, that is always lower than the average remaining service period of active employees. These amounts are fully funded as of December, 31 2002. | | Changes in pension liability or asset values resulting from experience different from actuarial estimates are treated as actuarial gains and losses. Changes in pension liabilities due to amendment of pension plans are treated as prior service cost. Such gains and losses and prior service cost may be amortized, by the straight-line method over a period not exceeding the average remaining service period of active employees, or by charges to income in the period incurred. |
| |
| As a consequence, neither assets (apart from the prior service costs) nor liabilities are recorded in the balance as of December 31, 2002. | | Amounts recognized as expense may differ from amounts funded in the same year. The accrual of pension expense is intended to effectively match the full cost of the expected pension benefits to the period of employee service. |
| |
| The Group charges into the income statement, the amortization of the prior service costs and the contributions and insurance payments corresponding to the cost of the service of the employees in the current year. | | Early retirement costs are charged against income when they are as incurred. |
| |
| Early retirement costs charged against income when they are incurred. | | These charged to retained earnings are not accepted under U.S. GAAP. |
| |
| Exceptionally and, when the Bank of Spain deems it appropriate, pension and early retirement costs may be provided for with a charge to retained earning. | | |
F-101
| | |
SPANISH GAAP
| | U.S. GAAP
|
| Derivative instruments and hedging activities | | |
| |
| (See Notes 3-m and 26) | | |
| |
| These instruments are registered in off-balance sheet accounts. | | All derivatives are recognized either as assets or as liabilities on the Balance Sheet and measured at their fair value. |
| |
| | | Embedded derivative instruments—implicit or explicit terms that affect some or all of the cash flows or the value of other exchanges required by the contract in a manner similar to a derivative instrument—need to be bifurcated from the host contract and accounted for as a derivative instrument. |
| |
| The accounting of profits or losses from these instruments depends on its designation as part of a hedging relationship. | | The accounting for changes in the fair value of a derivative (that is, gains and losses) depends on the intended use of the derivative and the resulting designation. |
| |
| Transactions aimed at eliminating or significantly reducing interest, foreign exchange or equity risks of specific assets or liabilities, or other operations, are designated as hedging transactions (specific hedges). Besides, transactions used to hedge global interest or equity risk exposure arising on its management of correlated assets, liabilities and future transactions, are designated as hedging transactions (macro hedges). In addition it is required that they are under the control of a conservative, consistent and integrated system that measures, controls and manages the risk and the results of the operations involved. | | For a derivative to be designed as a hedging instrument some explicit conditions must be met, among others the hedge should be documented, identifying the risk to hedge and how effectiveness is being assessed. Also there are some specific elements that are not eligible to part of an accounting hedging relationship. |
| |
| Non-hedging transactions arranged on organized markets are valued at market price, and market price fluctuations are recorded in full in the consolidated statements of income. | | For a derivative not designated as a hedging instrument, the gain or loss is recognized in earnings in the period of change. |
F-102
| | |
| | | A hedging derivative may be specifically designated as: |
| |
The gains or losses arising from trading transactions arranged outside organized markets are not recognized in income until they are effectively settled. However, provisions are recorded with a charge to income for unrealized net losses. These provisions are calculated independently for each risk (interest rate, equity price and currency), by grouping them by currency, then netting unrealized profits and losses for each group, and then adding only the net losses of each group. The gains or losses arising from hedging transactions are accrued symmetrically to the revenues or expenses arising from the hedged items, with a balancing entry under “Other Assets” or “Other Liabilities” in the consolidated balance sheets. | | (a) a hedge of the exposure to changes in the fair value of a recognized asset or liability or an unrecognized firm commitment, and its gains or losses are recognized in earnings in the period of change together with the offsetting loss or gain on the hedged item attributable to the risk being hedged. (b) a hedge of the exposure to variable cash flows of a forecasted transaction. In this case the effective portion of the derivative’s gain or loss is initially reported as a component of other comprehensive income (outside earnings) and subsequently reclassified into earnings when the forecasted transaction affects earnings. The ineffective portion of the gain or loss is reported in earnings immediately. (c) a hedge of the foreign currency exposure of a net investment in a foreign operation, an unrecognized firm commitment, an available-for-sale security, or a foreign-currency-denominated forecasted transaction. The gain or loss of these derivatives is reported in other comprehensive income (outside earnings) as part of the cumulative translation adjustment. This amount shall be subsequently reclassified into earnings when the hedged operation affects earnings. |
| |
Net lending Impairment Loans are identified as impaired and placed on a non-accrual basis when any interest or principal is past due for 90 days or more or when it is determined that the collectibility of interest or principal is doubtful. It is doubtfully collectible when the borrower is incurring continued losses, frequent delays in payments, cannot obtain new financing, is reducing its stockholders’ equity, or other reasons based on available information. At the beginning, only the amounts past due for 90 days or more are classified as non-performing. The entire loan is classified as non-performing if one of the following conditions is met: • Amounts classified as non-performing exceed 25% of the outstanding balance. Additionally, all outstanding loans to a particular customer would be classified as non-performing if more than 25% of the outstanding credit to the customer is non-performing. • Any principal is past due more than 6 months for loans to individuals or 1 year for other loans. • The loan is deemed uncollectible. A loan could be on non-accrual status even if it is classified in part as a performing loan. | | Net lending Impairment A loan is impaired when, based on available information and facts, it is probable that a creditor will be unable to collect all the amounts due according to the contractual terms of the loan agreement. The total amount of loans identified as impaired is classified as non-performing and placed on a non-accrual basis. |
F-103
| | |
| The same loan could be partially classified as non-performing and as performing. | | |
| |
| Allowance for loan losses | | Allowance for loan losses |
| |
Pursuant to Bank of Spain regulations, once any portion of a loan is classified as non-performing, a specific loan loss allowance is required to be set up, with scheduled increases to the allowance based on a calendar of the time elapsed since the first event of nonpayment or for which collection is considered to be doubtful. Based on management’s assessment banks may elect to record allowances in excess of this minimum requirement. A generic allowance of 1% of total loans, guarantees, private sector debt securities and contingent liabilities must also be made. This allowance is limited to 0.5% for fully secured mortgage loans. Additionally, a Country Risk allowance must be recorded to cover the transfer risk arising from outstandings loans to borrowers in countries falling into certain risk categories established, including intercompany transactions. Finally, the Bank of Spain requires an allowance for the statistical coverage of credit losses. The amount of this allowance depends on calculations made using different coefficients for each category of the loan portfolio and on the net charges to income statement related to other loan losses. | | The allowance for loan losses represents managements’ best estimate of probable losses in the loan portfolio. The reserve estimation process is judgmental and includes consideration of identified losses as well as reasonably expected probable losses based on judgmental assessment of historical trends, credit concentrations and other factors. The allowance for loans losses for individual loans specifically reviewed for impairment is determined by one of the following: • The present value of the expected future cash flows, discounted at the loan’s effective interest rate, • The loan’s observable market price, or • The fair value of the collateral if the loan is collateral dependent. The allowance for loan losses for a group of loans collectively reviewed for impairment is based on representative historical losses updated to reflect current trends and conditions. |
| |
| Financial statement presentation | | Financial statement presentation |
| |
| On the balance sheet, loans are always presented net of their credit allowances. | | Loans are presented as net of allowances for loan losses as well. |
| |
| The entire loan balance and its credit allowance are maintained on the balance sheet until any portion of it has been classified as non-performing for 3 years, or up to 6 years for some secured mortgage loans. After that period the loan balance and its 100% specific allowance are removed from the balance sheet and recorded in off-balance sheet accounts, with no resulting impact on the net loan balance or on net income at that time. | | Actual credit losses, which may be for all or part of a particular loan, are deducted from the allowance and the related loan balance is charged off in the period in which the loan or a portion thereof is deemed uncollectible. |
| |
| Only under unusual circumstances (bankruptcy, insolvency proceedings, etc.) the credit loss will be directly recognized through write-offs. | | |
| |
| Given that loans are presented on the balance sheet net of their credit allowances, there is not difference in the amounts disclosed on the balance sheet under Spanish or US GAAP | | |
F-104
| | |
Transfers of Financial Assets General Criteria Those transactions in which transferor transfers all rights and liabilities of a financial asset or group of financial assets will be considered as “transfer of financial assets”. These transactions must comply with the following requirements to be a “transfer of financial assets”: a) All the rights owned by the transferor over the financial asset, including management or legal defense, will be transmitted to the transferee. b) The transmission will be for the remaining life of the financial asset c) The transmission will be documented in a written contract. d) The contract will specify transferor does not assume any responsibility over the credit risk of financial asset and that any modification of the conditions of financial asset will only affect the transferee. e) The transferor will not issue guarantees or repurchase agreements. f) The transferor will not accept the commitment of paying in advance to the transferee before the debtor pays. It means, the transferor will not finance to the buyer. g) The transferee will not have any limitation to manage, pledge or transfer the financial asset. h) If the transferee puts the transferor in charge of the management and legal defense of transferred financial asset, this engagement should be done under revocable contract. All the transfers of assets that satisfies the conditions described above will be accounted for as a sale: a. All assets sold will be derecognized b. All assets obtained and liabilities incurred will be initially recognized at fair value c. Any gain or loss will be recognized in earnings. Otherwise, such transactions would be considered financing liabilities and the gain or loss obtained on the “sale” would be deferred and amortized to income or loss over the remaining life of the loans transferred. | | A transfer of financial assets (or all or a portion of a financial asset) in which the transferor surrenders control over those financial assets shall be accounted for as a sale to the extent that consideration other than beneficial interests in the transferred assets is received in exchange. The transferor has surrendered control over transferred assets if and only if all of the following conditions are met: a. The transferred assets have been isolated from the transferor—put presumptively beyond the reach of the transferor and its creditors, even in bankruptcy or other receivership. b. Each transferee, has the right to pledge or exchange the assets (or beneficial interests) it received, and no condition both constrains the transferee (or holder) from taking advantage of its right to pledge or exchange and provides more than a trivial benefit to the transferor. c. The transferor does not maintain effective control over the transferred assets through either (1) an agreement that both entitles and obligates the transferor to repurchase or redeem them before their maturity or (2) the ability to unilaterally cause the holder to return specific assets, other than through a cleanup call . Upon completion of a transfer of assets that satisfies the conditions to be accounted for as a sale, the transferor (seller) shall: a. Derecognize all assets sold b. Recognize all assets obtained and liabilities incurred in consideration as proceeds of the sale, including cash, put or call options held or written (for example, guarantee or recourse obligations), forward commitments (for example, commitments to deliver additional receivables during the revolving periods of some securitizations), swaps (for example, provisions that convert interest rates from fixed to variable), and servicing liabilities, if applicable. c. Initially measure at fair value assets obtained and liabilities incurred in a sale or, if it is not practicable to estimate the fair value of an asset or a liability, apply alternative measures. d. Recognize in earnings any gain or loss on the sale. |
F-105
| | |
Securitizations Securitizations that meet the criteria described above will be accounted for as a sale. All financial assets transferred will be derecognized and all financial assets obtained and liabilities incurred by the transferor will be recognized at fair value. Spanish GAAP does not consider Qualifying Special Purpose Entities as contemplated by SFAS 140 | | If a transfer of financial assets in exchange for cash or other consideration (other than beneficial interests in the transferred assets) does not meet the 3 criteria for a sale describe above, the transferor and transferee shall account for the transfer as a secured borrowing with pledge of collateral Securitizations that meet the three criteria described above are accounted for as a sale. All financial assets obtained or retained and liabilities incurred by the originator of a securitization that qualifies as a sale shall be recognized and measured as provided at fair value. Qualifying Special Purpose Entities are not consolidated into the financial statements of the transferor or its subsidiaries. |
| |
SPANISH GAAP
| | U.S. GAAP
|
Guarantees, Contingent liabilities and Commitments All of the following are recorded under memorandum accounts for the maximum amount committed by the Group. If any fees are received at the inception of these guarantees, the total amounts are recorded in the caption “Other Liabilities” and are amortized and recognized into income over the lives of the contracts. Additionally, for all guarantees representing potential risks for the Group a provision is recognized following the same provisioning criteria of fair value or potential loss as applied to other relevant risks (i.e. customer loans ). 1. Contingent liabilities: a. Rediscounts, endorsements and acceptances Consist of rediscounts of bill receivables, in which the Group supports certain risk, and the full amounts of the bills are recorded, except for rediscounts of Spanish Government securities. b. Assets assigned to sundry obligations Bank of Spain regulations request the pledge of certain assets, mainly debt securities, to allow Banks to operate in several kind of transactions (taking deposits from the public, deal in certain markets, etc.) These assets are accounted for under “Debentures and other fixed income securities” caption of the asset side of the balance sheet, and valued as any other securities. The amount disclosed under memorandum accounts represents their net carrying value. | | Since January 1, 2003, the inception of a guarantee, the guarantor shall recognize in its statement of financial position a liability for the fair value of the guarantee. When a guarantee is issued as part of a transaction with multiple elements with an unrelated party, the liability recognized at the inception of the guarantee should be an estimate of the guarantee’s fair value, amounting to the greater of: a. The fair value amount, as: 1. The premium that would be required by the guarantor to issue the same guarantee in a standalone arm’s-length transaction with an unrelated party, or 2. In the absence of observable transactions for identical or similar guarantees, expected present value (the sum of the probability-weighted present values in a range of estimated cash flows, all discounted using the same interest rate convention, according to FASB Concepts Statement No. 7), or 3. Fair value consistent with par. 18 of SFAS 116 criteria. b. The contingent liability amount required by par.8 SFAS 5. When a guarantee is issued in a standalone arm’s-length transaction with an unrelated party, the liability recognized at the inception of the guarantee should be the premium received or receivable by the guarantor. |
F-106
| | |
2. Guarantees and other sureties a. Guaranties promises Amounts irrevocably committed to be formalized and guaranteed in the future. b. Commercial guarantees Amounts committed to guaranties in connection with the completion of commitments undertaken by the usual business of a client (for example, the guaranties of completion of government contracts, or performance guarantees). c. Financial guarantees Commitments by which the Bank undertakes a contingent obligation to make future payments if specified triggering events or conditions occur. Fair value, taken as the premium received upon issuance of the guarantee, is recorded as a liability and accrued to income over the life of the guarantee. Additionally, this balance is subject to provision. d. Doubtful guarantees Collects the amount of both commercial and financial guarantees, which the Group expects that will be exercised either due to occurrence of triggering events or other reasons. A provision is recorded accordingly. e. Credit default swaps Sales of credit default swaps; the maximum committed amount is recorded under memorandum accounts. Premium received is accounted for as a liability and the swap is marked to market. Several of these swaps are matched to identical swaps acquired; the remaining are valued at the lowest of net carrying amount or fair value, recording any necessary provisions under “Allowance for losses on futures transactions”. 3. Other contingent liabilities a. Documentary credits Commitments undertaken by which the Group stands ready to perform over the delivery of documents, including commercial letters of credit, stand-by letters of credit and financial letters of credit. The premium received is recognized as a liability, and additionally, the balance of risk bearing transactions is subject to provisioning b. Other contingent liabilities c. Doubtful contingent liabilities Analogous to item 2.d above. 4. Commitments a. Sales with repurchase agreements The amount of the commitments to repurchase assets previously sold is recorded as a liability for the full amount the Bank committed to purchase them. | | The loss contingency for this item refers to unasserted claims or assessment, but there has been no manifestation by the potential claimant (Bank of Spain) of an awareness of a possible claim or assessment, and it is not considered probable either. Hence this item is out of scope of FIN 45 accounting provisions. Out of scope of FIN 45, but subject to disclosure Out of scope of FIN 45, but subject to disclosure See general criteria above See general criteria above Out of scope of FIN 45, but subject to disclosure. Falls within SFAS 133 scope. Commercial letters of credit and other loan commitments (guarantees of funding) are not included in the scope of FIN 45. Financial letters of credit are subject to FIN 45 provisions. Subject to disclosure requirements. |
F-107
(32.2.B) NET INCOME AND STOCKHOLDERS’ EQUITY RECONCILIATION BETWEEN SPANISH AND U.S. GAAP.
Accounting practices used by the Bank in preparing the consolidated financial statements conform with Spanish GAAP, but do not conform with U.S. GAAP. A summarized reconciliation of stockholders’ equity as of December 31, 2003, 2002 and 2001 and net income for the years 2003, 2002 and 2001 to U.S. GAAP is set forth below.
The following tables set forth the adjustments to consolidated net income and to consolidated stockholders’ equity which would be required if U.S. GAAP had been applied to the accompanying consolidated financial statements:
| | | | | | | | | | | |
| | | Item #
| | Increase (Decrease) Year Ended December 31,
| |
| | | 2003
| | | 2002
| | | 2001
| |
| | (Thousands of Euros, except per share data) | |
NET INCOME | | | | | | | | | | | |
As reported in the annual report to stockholders in the statutory approved financial statements | | | | 2,226,701 | | | 1,719,129 | | | 2,363,336 | |
Reversal of extraordinary amortization of goodwill | | (*) | | — | | | — | | | (520,266 | ) |
As reported under Spanish GAAP in the accompanying consolidated statements of income | | | | 2,226,701 | | | 1,719,129 | | | 1,843,070 | |
| | | | |
Adjustments to conform to U.S. GAAP: | | | | | | | | | | | |
Business Combination with Argentaria— | | | | | | | | | | | |
Amortization of surplus allocated to specific assets and liabilities | | 1 | | (55,899 | ) | | (154,690 | ) | | (164,930 | ) |
Amortization of remaining Goodwill Merger Argentaria | | 1 | | — | | | — | | | (231,029 | ) |
Elimination of over-depreciation relating to restated fixed assets, recognition of additional profits on the sale and disposal of restated items | | 2.1 | | 49,978 | | | 68,361 | | | 78,824 | |
Elimination of the inflation adjustment in non highly inflationary countries | | 2.2 | | 38,654 | | | 13,114 | | | (33,911 | ) |
Effect of following the equity method of accounting for investments in affiliated companies | | 3 | | (108,450 | ) | | (59,731 | ) | | (61,622 | ) |
Pension plan cost and early retirements | | 4.1 | | (811,451 | ) | | (510,954 | ) | | (743,610 | ) |
Termination indemnities | | 4.2 | | 2,083 | | | (3,276 | ) | | (38,685 | ) |
Accounting of goodwill | | 5 | | 402,429 | | | 203,229 | | | (391,210 | ) |
Gains on transactions with parent company shares and stock options owned by subsidiaries accounted for as income for the year | | 6 | | 23,363 | | | 24,585 | | | (13,865 | ) |
Effect of recording the allowance for probable loan losses | | 7 | | 183,759 | | | 221,616 | | | 196,199 | |
Valuation of investment securities | | 9 | | (482,089 | ) | | 425,795 | | | 40,563 | |
Expenses of capital increases | | 10 | | 22,764 | | | 21,958 | | | 32,556 | |
Start up expenses | | 10 | | 42,894 | | | 13,120 | | | (39,074 | ) |
Derivative instruments and hedging activities (SFAS 133) | | 11 | | 207,460 | | | (126,660 | ) | | 11,219 | |
Tax effect of above mentioned adjustments | | 12 | | 161,705 | | | (22,714 | ) | | 182,579 | |
Effect of following SFAS 109 in the accounting for income taxes for each year | | 12 | | 1,999 | | | 8,613 | | | 13,037 | |
BBV Brasil transaction | | 13 | | — | | | 4,251 | | | — | |
| | | | |
|
| |
|
| |
|
|
Net income in accordance with U.S. GAAP | | | | 1,905,900 | | | 1,845,746 | | | 680,111 | |
| | | | |
Other comprehensive income, (loss) net of tax: | | | | | | | | | | | |
Foreign currency translation adjustments | | | | (922,506 | ) | | (1,864,977 | ) | | (593,860 | ) |
Unrealized gains on securities: | | | | | | | | | | | |
Unrealized holding gains (losses) arising during period, net of tax | | | | 2,133,816 | | | (969,526 | ) | | (234,316 | ) |
Reclassification adjustment, net of tax | | | | (1,079,792 | ) | | (393,139 | ) | | (516,432 | ) |
| | | | |
|
| |
|
| |
|
|
| | | | | 1,054,024 | | | (1,362,665 | ) | | (750,748 | ) |
Derivative instruments and hedging activities | | | | (44,786 | ) | | 72,039 | | | 12,790 | |
| | | | |
|
| |
|
| |
|
|
Comprehensive income (losses) in accordance with U.S. GAAP | | 14 | | 1,992,632 | | | (1,309,857 | ) | | (651,707 | ) |
Net income per share (Euros) | | 15 | | 0.596 | | | 0.577 | | | 0.213 | |
F-108
| (*) | The auditors’ report on the Spanish statutory approved financial statements of the group as of and for the year ended December 31, 2000 was qualified with respect to the early amortization in prior years of certain goodwill arising from the acquisition of Latin American banks and companies. United States securities regulations do not currently allow the filing of financial statements with the Securities Exchange Commission if they contain auditor’s reports that are qualified with respect to a material departure from generally accepted accounting principles. Therefore, in order to avoid a qualification in the auditor’s report, we do not include the early amortization recognized in prior years in the accompanying consolidated financial statements for the year ended December 31, 2000. Accordingly, the accompanying consolidated financial statements as of December 31, 2001 and for the year then ended reflect the adjustments made to the Spanish GAAP consolidated financial statements of the Banco Bilbao Vizcaya Argentaria Group solely for the purpose of complying with the United States securities regulations. The adjustments consist of the reversal of the early amortization of goodwill and the amortization of them over a period of five years (the estimated minimum period of economic life) which has the effect of decreasing net income as reported in the Spanish statutorily approved consolidated financial statements for the year ended December 31, 2001 by approximately €520 million. |
F-109
| | | | | | | | | | | |
| | | Item #
| | Increase (Decrease) December 31,
| |
| | | 2003
| | | 2002
| | | 2001
| |
| | | Thousands of Euros | |
STOCKHOLDERS’ EQUITY | | | | | | | | | | | |
As reported under Spanish GAAP in the accompanying consolidated balance sheets (Note 2-d) | | | | 12,774,225 | | | 12,602,440 | | | 13,723,476 | |
Adjustments to conform to U.S. GAAP: | | | | | | | | | | | |
Business Combination with Argentaria Purchase Argentaria Effect | | 1 | | 5,622,034 | | | 5,677,933 | | | 5,733,539 | |
Reversal of the net effect of the restatement of fixed assets and equity securities | | 2.1 | | (316,110 | ) | | (366,088 | ) | | (533,926 | ) |
Elimination of the inflation adjustments | | 2.2 | | (246,262 | ) | | (158,423 | ) | | (2,115 | ) |
Effect of adjustments to conform to U.S. GAAP for investments in affiliated companies | | 3 | | (423,057 | ) | | (276,004 | ) | | (519,701 | ) |
Pension plan cost and early retirements | | 4.1 | | 134,107 | | | 146,142 | | | 157,919 | |
Termination indemnities | | 4.2 | | 39,573 | | | 37,490 | | | 45,254 | |
Accounting of goodwill | | 5 | | (220,925 | ) | | (131,575 | ) | | 417,164 | |
(Gains) losses on transactions with parent company shares and stock options owned by subsidiaries accounted for as income for the year | | 6 | | 28,213 | | | 26,752 | | | 99,472 | |
Allowance for loan losses | | 7 | | 859,725 | | | 675,966 | | | 459,341 | |
Reduction for employee loans issued to purchase shares of capital Stock | | 8 | | (1,766 | ) | | (2,479 | ) | | (90,789 | ) |
Valuation of investment securities | | 9 | | 2,246,846 | | | 1,105,931 | | | 2,700,841 | |
Expenses of capital increases | | 10 | | (32,302 | ) | | (53,051 | ) | | (96,327 | ) |
Start up expenses | | 10 | | (16,750 | ) | | (68,319 | ) | | (80,400 | ) |
Derivative instruments and hedging activities (SFAS 133) | | 11 | | 150,378 | | | 15,067 | | | 30,897 | |
Tax effect of above mentioned adjustments | | 12 | | (956,926 | ) | | (268,278 | ) | | (749,973 | ) |
Effect of following SFAS 109 | | 12 | | (57,969 | ) | | (59,968 | ) | | (68,581 | ) |
BBV Brasil transaction | | 13 | | — | | | 4,251 | | | — | |
| | | | |
|
| |
|
| |
|
|
Stockholders’ equity in accordance with U.S. GAAP | | | | 19,583,034 | | | 18,907,787 | | | 21,226,091 | |
The differences included in the tables above are explained in the following items:
1. Business Combination with Argentaria-
As described in Note 1, Banco Bilbao Vizcaya, S.A. and Argentaria, Caja Postal y Banco Hipotecario, S.A. (Argentaria) merged, being January 28, 2000 the date from which such merger was legally effective. The accounting of this business combination under Spanish GAAP was accounted for using the method of pooling of interest and therefore no goodwill was accounted for. Since the transaction did not comply with the requirements of APB 16 for pooling of interest method, under U.S. GAAP this business combination was accounted for using the purchase method. The excess of the fair value of the new shares issued in exchange for the Argentaria shares over the net worth of Argentaria under U.S. GAAP as of the date of the merger, amounted to approximately €6,315,622 thousand and was calculated considering the necessary adjustments to the net worth of Argentaria as of January 28, 2000 under Spanish GAAP:
F-110
| | | |
| | | (thousands of euro)
| |
Approximate Argentaria net worth as of January 28, 2000 under Spanish GAAP | | 3,454,449 | |
| | |
|
|
Reversal of the net effect of the restatement of fixed assets and equity securities | | (129,338 | ) |
Reduction for employees and third party loans issued to purchase shares of capital Stock | | (122,606 | ) |
Goodwill amortization adjustments | | 100,734 | |
Up-front premium reversal | | 107.888 | |
Valuation of investment securities | | 1,926,143 | |
Effect of adjustments to conform to US GAAP for investments in affiliated Companies | | (87,167 | ) |
Tax effect of above mentioned adjustments | | (607,916 | ) |
Other adjustments | | 34,601 | |
Subtotal | | 1,222,339 | |
| | |
|
|
Approximate Argentaria net worth as of January 28, 2000 under US GAAP | | 4,676,788 | |
| | |
|
|
- Revaluation of property and equity securities
Certain of the Spanish and foreign consolidated companies had stepped up (increased) the cost and accumulated depreciation of property and equipment and, where appropriate, the carrying values of their equity investment securities pursuant to the relevant local legislation. Also, the buildings and equity securities owned by certain of the companies in the Group, whose shareholders´ meetings adopted merger resolutions in 1991, were stepped up. Under US GAAP these step ups are not permitted to be reflected in the financial statements.
- Employee and other third party loans
Certain Group banks granted loans to shareholders, employees and customers for the acquisition of Argentaria, Caja Postal y Banco Hipotecario, S.A. shares. Under Spanish GAAP, these loans were recorded in the consolidated financial statements under the caption “Credit, Loans and Discounts”. Under US GAAP, these loans should be recorded as a reduction of stockholders´ equity because the only recourse for collection was the shares themselves.
- Goodwill
The general policy of the Group was to amortize goodwill over a maximum period of 10 years. However, a different period was used to amortize goodwill in some of the subsidiaries acquired. For purposes of calculating the effect of applying US GAAP, goodwill arising on acquisitions has been amortized in 10 years.
Additionally, in 1998 and as a result of the merger, goodwill from Banco Exterior de España, S.A. was fully written off for Spanish GAAP purposes. Under US GAAP the goodwill is amortized over the estimated economic life as there was no economic or fair value basis for the impairment made under Spanish GAAP.
- Up-front premium reversal
In 1998 the Bank arranged hedging transactions for which it paid a premium, which was recorded under the “Extraordinary Losses” caption in the statement of income for 1998, to mitigate the adverse effect of the negative spread that arise between the average return on the mortgage loans financed by certain mortgage bonds and the fixed interest rates of such mortgage bonds. Under US GAAP, the premium was recognized at inception as an asset, amortized over the life of the hedging transaction under FAS 80 and that upon adoption of FASB 133 the derivative has been recorded at fair value through income, as it does not qualify for hedge accounting under US GAAP.
- Valuation of investment securities
Under SFAS 115, available-for-sale securities must be recorded at market value against stockholders´ equity.
- Investments in affiliated Companies
Under Spanish GAAP, investments in non-consolidated listed affiliated companies owned over 3% and in non-consolidated unlisted affiliated companies owned over 20% are recorded by the equity method. Under US
F-111
GAAP investments in affiliated companies over 20% but less than 50% are accounted for by the equity method and those exceeding 50% by the global integration method. Listed investments of less than 20% are accounted for at market value.
The excess of the fair value of the new shares issued in exchange for the Argentaria shares over the net worth of Argentaria, was allocated to the following specific items:
| | | |
2000
| | Thousands of Euros
| |
Net Lending | | 610,785 | |
Investment Securities-Held to Maturity | | 305,903 | |
Premises and Equipment | | 129,338 | |
Other assets and liabilities | | (113,255 | ) |
Long Term Debt | | (172,521 | ) |
Tax Effect | | (220,360 | ) |
Goodwill | | 5,775,732 | |
| | |
|
|
| | | 6,315,622 | |
| | |
|
|
For U.S. GAAP purposes, BBVA amortizes the excess of the fair value assigned to the specific items over their remaining life. The amortization of the excess allocated to specific assets and liabilities amounts €55,899 thousand (net of tax), €154,690 thousand (net of tax) and €164,930 thousand (net of tax) in 2003, 2002 and 2001, respectively.
Up to December 31, 2001 BBVA amortized the goodwill on a straight line basis over a period of 25 years. This amortization amounted to € 231,029 thousand in 2001.
From January, 2002 BBVA stopped the amortization of the remaining goodwill pursuant to the SFAS 142 and it has been assigned to different Reporting Units and tested for impairment as described in Item 32.2.B.5.
2. Elimination of over-depreciation relating to restated fixed assets, recognition of additional profits on the sale and disposal of restated items, and elimination of the inflation adjustment in non highly inflationary countries-
2.1. Revaluation of property and equity securities-
As described in Notes 3-e, 3-h, 14 and 24, certain of the Spanish and foreign consolidated companies restated the cost and accumulated depreciation of property and equipment and, where appropriate, the carrying values of their equity investment securities pursuant to the relevant legislation. Also, the buildings and equity securities owned by certain of the companies in the Group, whose Shareholders’ Meetings adopted merger resolutions in 1988, were restated on the basis of the principles explained in Note 24. Under U.S. GAAP these revaluations are not permitted to be reflected in the financial statements.
In accordance with Spanish GAAP, fixed asset depreciation is computed on the restated value and the total amount charged to income is deductible for corporate income tax purposes. In addition, results on sales or dispositions of both fixed assets and equity investments are determined as the difference between the selling price and the net restated value.
The amounts of the adjustments indicated below have been calculated to reflect the reversal of the additional depreciation on the revalued property and equipment (€9,757 thousand, €10,088 thousand and €18,945 thousand, in 2003, 2002, and 2001, respectively) and the additional income that would have resulted if the Group had not restated the equity securities and fixed assets that have been sold (€11,248 thousand, €58,273 thousand, and €59,879 thousand in 2003, 2002 and 2001, respectively). The adjustment to stockholders’ equity reflects the reversal of the unamortized revaluation surplus.
F-112
Assets received in payments of debt
Under Spanish GAAP, these assets are recorded at the lower of the book value of the assets used to acquire them or market value, net, initially, of any provisions covering the assets received, up to 25% of that value. In accordance with Bank of Spain regulations, additional provisions are recorded in the years following foreclosure of the assets based on their age, type of assets and appraisal by independent appraisers.
The provisions recorded with a charge to the “Extraordinary Losses” caption in the accompanying consolidated statements of income are presented as a reduction of the balance of the “Property and Equipment Other Property” caption in the accompanying consolidated balance sheets (Notes 14 and 28 g).
Under U.S. GAAP, this provision should not be recorded, therefore an adjustment to net income and stockholders’ equity reflects the reversal of that provision.
2.2. Translation of financial statements in high-inflation countries-
As indicated in Note 3-b, certain of the dependent companies record charges in the statement of income to protect their net worth from the theoretical depreciation arising from inflation.
According to Bank of Spain regulation, inflation accounting adjustments accounted for by subsidiaries under GAAP in their countries can be recorded at consolidated financial statements of the Group. These inflation accounting adjustments are not accepted under US GAAP.
Under US GAAP, the financial statements of operating units in a highly inflationary economy are remeasured as if the functional currency of the operating unit were the same as that of the parent reporting currency. For the purposes of this requirement, a highly inflationary economy is one that has cumulative inflation of approximately 100 percent or more over a 3-year period. None of the countries were BBVA owns subsidiaries are highly inflationary countries
The adjustment reflects the reversal of the theoretical depreciation arising from inflation registered in dependent companies established in “non highly inflationary economies”.
3. Equity investments-
As indicated in Note 3-e, under Spanish GAAP, investments in non-consolidated listed affiliated companies owned over 3% and in non-consolidated unlisted affiliated companies owned over 20% are recorded by the equity method.
Under U.S. GAAP, investments in affiliated companies over 20% but less than 50% are accounted for by the equity method and those exceeding 50% are consolidated. Listed investments of less than 20% are accounted for at fair value (Note 32.2.A).
All affiliates in which the Group holds an ownership interest of less than 20% and are accounted for by the equity method according to Spanish GAAP must be accounted for at market value, if the securities have readily determinable market value, according to U.S. GAAP. If the securities do not have readily determinable market value, they are accounted for at cost under U.S. GAAP.
In this adjustment we change the valuation of these holdings (less than 20%) from the equity accounting method to lower of cost or market. The final adjustment to meet SFAS 115 is done, together with all other securities, in the Valuation of Investment securities described in Item 9 below.
This adjustment reflects the reversal of effects in net income and stockholders´ equity of accounting by the equity method holdings in affiliated companies less than 20% and in which the Group does not have significant influence. This adjustment includes:
| | • | Reversal of the amortization of goodwill recorded under equity method. This effect results in increasing net income in €228,273 thousand, €117,504 thousand and €114,174 thousand in 2003, 2002, and 2001, respectively. |
F-113
| | • | Reversal of the net income of affiliated companies incorporated to Consolidated Financial Statements by the equity method. This effect results in reversing income of €356,223 thousand in 2003, €45,545 thousand in 2002 and €454,623 thousand in 2001, respectively. |
| | • | Reversal of gains or losses from sales in affiliated companies due to the book value of an investment less than 20% accounted for by the equity method in the consolidated financial statement differs from the book value recorded under U.S. GAAP. This effect results in increasing net income in €179,559 thousand, €84,103 thousand and €168,662 thousand in 2003, 2002 and 2001, respectively. |
| | • | Reversal of other adjustments performed by the equity method as reversal of revaluation of property made by affiliated companies under Spanish GAAP and not permitted under U.S. GAAP; reversal of elimination of dividends distributed by affiliated companies to the parents companies, and others. The total effect of reversing these adjustments decreases net income by €160,059 thousand in 2003, €215,793 thousand in 2002 and increases net income in €110,165 thousand in 2001. |
4.1. Pension plan cost, early retirements -
Pension plan cost-
All personnel employed in Spain are entitled to pension benefits, in addition to Social Security provided by the State.
As of December 31, 1988, the total liability for retired and active employees was recorded by a charge to income and to the merger reserves adopted by some companies in 1988.
In 1991, the Group recalculated the actuarial liability, changing certain assumptions and varying certain of the items included in the pensionable basis (wage concepts included to determine the cost of pensions). Gains and losses derived from this recalculation were covered with charges to “Retained earnings and other reserves”. Actuarial gains and losses arising in subsequent years until 1999 were recorded in the statement of income.
In 2000, as a consequence of the externalization process, in which the financing system was modified through the signature of a collective agreement and new valuation assumptions were used, a difference arose which represents the discounted present value of the contributions yet to be made to the external pension funds. In addition, in 2001 the Plan was amended, resulting in increasing benefits granted to the employees.
Because of the mentioned process in year 2000, these obligations are covered through Defined Contribution Pension Plans, and through Insurance Policies adapted to the current regulation in Spain for the externalizing of retirement commitments, which under SFAS No. 87 are treated as annuity contracts for the purpose of that Statement.
Under U.S. GAAP, SFAS 87 requires unrecognized net gain or loss and unrecognized prior service cost to be amortized by charges to income in a period not exceeding the average remaining service period of active employees or the average remaining life expectancy of retired participants.
These amounts are being amortized over a maximum period of 14 years in the case of external pension plans and 9 years in the case of insurance contracts in accordance with Spanish legislation (under U.S. GAAP maximum period for amortization is higher than under Spanish GAAP both for active employees and inactive participants of the plans). These periods include the year 2000, in which the first installment was paid. The Group has charged to the income statement in 2003 as amortization of these differences the amount of €75,661 thousand (€99,665 thousand and €124,945 thousand in years 2002 and 2001, respectively). After previous years adjustments, unrecognized net gain or loss and unrecognized prior service cost as of December 31, 2003 amount to €746,731 thousand (€849,980 thousand and €1,038,426 thousand in years 2002 and 2001, respectively). As of December 31, 2002 all the amounts corresponding to these obligations of the Pension Plans have already been paid.
For year 2003 contributions made by companies in Spain to the defined contribution pension plans amount to €40,123 thousand (€43,037 thousand and €40,567 thousand in years 2002 and 2001, respectively). Additionally, costs of annuity contracts charged to income in 2003, amounts to €28,243 thousand (€36,715 thousand and €31,506 thousand in years 2002 and 2001, respectively).
Pension plans of BBVA Bancomer
Obligations for pensions and other postretirement benefits in BBVA Bancomer are covered mainly under defined benefit pension plans, whereas others are covered under defined contribution pension plans. Both types of pension plans are carried out as internal provisions.
The following table is the reconciliation in the defined benefit pension plan of the Projected Benefit Obligation:
F-114
| | | | | | |
| | | Thousand of Euros
| |
Change in benefit obligation :
| | 2003
| |
| | | Pension
Benefits
| | | Healthcare benefits
| |
Projected benefit obligation (PBO) at the beginning of the year | | 434,021 | | | 241,151 | |
Prior service cost | | 39,769 | | | — | |
Total service cost at year end | | 11,194 | | | 2,937 | |
Interest cost | | 20,685 | | | 7,719 | |
Benefits paid | | (26,632 | ) | | (4,067 | ) |
Gains & losses | | 3,220 | | | 6,782 | |
Settlements | | (112 | ) | | — | |
Others | | 802 | | | — | |
Foreign currency exchange rate changes | | (97,759 | ) | | (54,436 | ) |
Projected benefit obligation (PBO) at the end of the year | | 385,188 | | | 200,086 | |
Weighted average actuarial assumptions used in the accounting for the defined benefit pension plan are as follows:
| | |
| | | 2003
|
Life Expectancy table before retirement | | Mexican basic experience 62-67 |
Life Expectancy table after retirement | | Table Standard Annuity 1937 |
Discount rate | | 5.5% |
Salary increase rate | | 1.5% |
Rate of increase in taxation groups of Social security benefits | | 0% |
Expected return on assets | | 5.5%(*) |
| (*) | Expected rate of return on assets will be determined every year in accordance to the composition of the portfolio attached to the plan during that year. This rate must be always higher than the technical interest rate. The expected return on Assets is calculated by Internal rate of return or Yield to Maturity (YTM), defined as the discount rate al which the present value of all future payments would equal the present price of the assets. The Expected Return on assets assumptions was developed through the analysis of real return on assets of CETES and |
| (**) | In the postretirement healthcare benefits the following assumptions are made: |
| | • | Medical services cost increase rate 2 % because of the inflation and, |
| | • | An age-related table of medical cost increase rate. |
Those actuarial assumptions were approved by Comisión Nacional Bancaria y de Valores (National Banking and Securities Commission).
A reconciliation of the fair value of plan assets, is as follows:
| | | | | | |
| | | Thousand of Euros
| |
Change in Plan Assets:
| | 2003
| |
| | | Pension
Benefits
| | | Healthcare benefits
| |
Fair Value of Plan Assets at beginning of the year | | 367,858 | | | 16,581 | |
Actual return on plan assets | | 41,039 | | | 627 | |
Transfer from Other Entities | | 3,093 | | | — | |
Settlements | | (112 | ) | | — | |
Employer Contribution | | 20,850 | | | 16,811 | |
Plan participants’ contribution | | — | | | — | |
Benefits paid | | (26,632 | ) | | (4,067 | ) |
Foreign currency exchange rate changes | | (83,415 | ) | | (3,174 | ) |
Fair Value of Plan Assets at the end of the year | | 322,681 | | | 26,778 | |
F-115
Funded status as of December 31, 2003:
| | | | | | | | | |
| | | Thousand of Euros
| |
Funded status December 31:
| | 2003
| |
| | | Pension
Benefits
| | | Healthcare benefits
| | | TOTAL
| |
Fair Value of Assets | | 322,681 | | | 26,778 | | | 349,459 | |
Accumulated Benefit Obligations | | 362,250 | | | 148,940 | | | 511,190 | |
Overfunded (unfunded) status of ABO | | (39,569 | ) | | (122,162 | ) | | (161,731 | ) |
Unrecognized Prior Service Cost | | 39,769 | | | 122,162 | | | 161,931 | |
Prepaid (Accrued) Benefit Cost | | (200 | ) | | — | | | (200 | ) |
Amounting recognized in the financial statements at December 31, 2003 are as follows:
| | | | | | | | | |
| | | Thousand of Euros
| |
| | | 2003
| |
| | | Pension
Benefits
| | | Healthcare benefits
| | | TOTAL
| |
Minimum Liability | | (39,569 | ) | | (122,162 | ) | | (161,731 | ) |
Intangible Assets | | 39,769 | | | 122,162 | | | 161,931 | |
Net amount recognized at the end of the year | | (200 | ) | | — | | | (200 | ) |
The disclosure of Net Periodic Cost is as follows:
| | | | | | |
| | | Thousands of Euros
| |
| | | 2003
| |
Net Periodic Cost (Income)
| | Pension
Benefits
| | | Healthcare
benefits
| |
Prior Service Cost | | 3,471 | | | 6,763 | |
Service cost at year end | | 11,830 | | | 2,993 | |
Interest cost | | 21,644 | | | 7,754 | |
Expected return on Asset | | (15,730 | ) | | (683 | ) |
Net Periodic Cost | | 21,215 | | | 16,827 | |
Contribution expected to be paid during the next fiscal year:
| | | | | | |
| | | Thousands of Euros
| |
| | | (*)
| |
Net Periodic Cost (Income)
| | Pension
Benefits
| | | Healthcare
benefits
| |
Service cost at year end | | 10,656 | | | 3,430 | |
Interest cost | | 23,396 | | | 8,965 | |
Expected return on Asset | | (17,082 | ) | | (1,401 | ) |
Other | | 5,657 | | | 7,054 | |
Net Periodic Cost | | 22,627 | | | 18,048 | |
| (*) | Using the same actuarial assumptions used for the defined benefit pension |
F-116
Plan Assets
Investment strategy
The Company’s policy is to invest the assets in a prudent manner for the exclusive purpose o providing benefits to participants. The Company’s investment strategy is designed to provide a total return on assets that, over the long-term, increases the ratio of assets to liabilities. The investment strategy uses allocation as a principal determinant for establishing the risk/reward profile of the assets. This strategy must follow some requirements established by Mexican legislation.
According to Mexican legislation, the pension commitments can be hedged by:
| | • | At least 30% must be invest in Mexican Federal Government securities; |
| | • | Other securities authorized by supervisory (Mexican National Banking and Securities Commission); and |
- Defined benefit pension plan
The Pension Plan asset allocation at December 31, 2003 by asset category is as follows:
| | | |
Asset Category
| | Percentage of Plan Assets at December 31, 2003
| |
Mexican Federal Government securities | | 34.64 | % |
Other Debt securities | | 52.01 | % |
Equity securities | | 12.32 | % |
Mortgage loans | | 1.03 | % |
- Long services bonus
The Pension Plan asset allocation at December 31, 2003 by asset category is as follows:
| | | |
Asset Category
| | Percentage of Plan Assets at December 31, 2003
| |
Mexican Federal Government securities | | 62.22 | % |
Other Debt securities | | 32.76 | % |
Equity securities | | 4.99 | % |
Cash | | 0.03 | % |
- Other post-retirement benefits
The Pension Plan asset allocation at December 31, 2003 by asset category is as follows:
| | | |
Asset Category
| | Percentage of Plan Assets at December 31, 2003
| |
Mexican Federal Government securities | | 100 | % |
F-117
Projected Benefit Payments
Benefit Payments projected to be made from the Pension Benefit Plan and Healthcare Benefit Plan are as follows:
| | | | |
Year
| | Pension Benefit Plan
| | Healthcare Benefit Plan
|
2004 | | 29,622.59 | | 4,799.39 |
2005 | | 26,391.12 | | 5,447.16 |
2006 | | 28,270.88 | | 6,642.21 |
2007 | | 30,463.61 | | 8,094.10 |
2008 | | 33,265.79 | | 9,880.85 |
2009 | | 35,336.50 | | 11,936.22 |
2010 | | 37,639.84 | | 14,426.36 |
2011 | | 39,832.88 | | 17,404.51 |
2012 | | 42,459.20 | | 21,031.91 |
2013 | | 45,973.58 | | 25,865.67 |
Defined contribution Plan
Also, BBVA Bancomer has an established pension plan denominated “Defined Contribution”, to which defined contributions are made based on a payroll percentage as of March 1, 2001. Over the long term this plan will replace the defined benefits plan, which generates the previous liability, and currently 12,305 employees participate in this plan. Apart from the defined benefit monthly retirement pension, benefits will be paid in the event of early retirement, death, or total permanent disability, through defined contributions to a personal employee fund.
During year 2003, 1,277 employees (2,166 employees and 5,651 employees in year 2002 and 2001, respectively) whose pension obligations were covered under the defined benefit pension plan moved to the defined contribution pension plan. As a consequence of this transfer, provision allocated in the defined benefit pension plan was reallocated in the provision for the defined contribution pension plan. Therefore, from the total increase of the internal provisions for the defined contribution pension plan in year 2003 €112 thousand (€2,412 thousand and €22,600 thousand in years 2002 and 2001, respectively) came from the transfer of provisions from the defined benefit pension plan.
In addition of this transfer, the cost recognized for the defined contribution pension plan in year 2003 amounts to €7,327 thousand (€9,474 thousand in years 2002).
At December 31, 2003 and 2002, the assets of this plan and its obligations are €41,456 thousands (Mexican $588,190 thousand) and €45,627 thousand (Mexican $500,532 thousand), respectively.
4.2. Termination indemnities-
As indicated in Note 3-k, as required by Bank of Spain Circular 5/2000, the Group has recorded an in-house provision to cover the contractual termination benefits for terminations or dismissals additional to those provided for by current legislation on a general basis. In addition, several companies of the Group have recorded additional provisions to cover future reorganization costs (basically termination indemnities). Under US GAAP, an employer that provides contractual termination benefits shall recognize a liability and a loss when it is probable that employees will be entitled to benefits and the amount can be reasonably estimated.
As of December 31, 2003 it is no probable that terminations or dismissals occur. Therefore, under US GAAP these provisions should be reversed. This adjustment gives rise to an increase in net income of €2,083 thousand in 2003 and a decrease in net income of €3,276 and €38,685 thousand in 2002 and 2001, respectively, and an increase in stockholders’ equity of € 39,573 thousand, €37,490 thousand and €45,254 thousand in 2003, 2002 and 2001, respectively.
5. Accounting of goodwill-
The disclosure of this adjustment is as follows:
| | | | | | | | | | | | |
| | | Thousand of euros
| |
| | | Stockholders’ equity
| | | Net Income
| |
| | | 2003
| | | 2002
| | | 2003
| | | 2002
| |
Goodwill charged to reserves in 1998 and 1999 | | 65,522 | | | 65,522 | | | — | | | — | |
Different period of amortization of goodwill reversed | | 98,948 | | | 98,948 | | | — | | | — | |
Reversal of amortization under SP GAAP in 2002 | | 970,477 | | | 559,400 | | | 411,077 | | | 559,400 | |
Amortization under Spanish GAAP not reversed under US GAAP | | (154,074 | ) | | (154,074 | ) | | — | | | (154,074 | ) |
Impairment under US GAAP | | — | | | — | | | — | | | (66,917 | ) |
Exchange differences | | (1,240,752 | ) | | (748,971 | ) | | — | | | — | |
Sale of BBVA Brasil | | — | | | — | | | — | | | (137,812 | ) |
Others | | 242 | | | 48 | | | 192 | | | (44,920 | ) |
Subtotal | | (259,637 | ) | | (179,127 | ) | | 411,269 | | | 155,677 | |
Cancellation Negative Goodwill in consolidation | | 38,712 | | | 47,552 | | | (8,840 | ) | | 47,552 | |
Adjustment 5 in reconciliation to US GAAP | | (220,925 | ) | | (131,575 | ) | | 402,429 | | | 203,229 | |
F-118
The mains reasons that cause a difference between Spanish GAAP and US GAAP in the amount of goodwill are the following ones:
Goodwill charged to reserves in 1998 and 1999
Goodwill that arose in 1998 and 1999 as a result of mergers and acquisitions through share exchanges was amortized in full with a charge to reserves, which was not acceptable under US GAAP. Under US GAAP the goodwill was amortized until 2001 over a period of ten years except for the goodwill arising in 2000 in the merger of Banca Catalana, S.A., Banco de Comercio, S.A., Banco de Negocios Argentaria, S.A. and Banco de Alicante, S.A. where the economic life was five years. Since 2001, as it is required in SFAS 142, goodwill is not amortized.
Different period of amortization of goodwill reversed
The general policy of the Group, under Spanish regulation is to amortize goodwill through charges to income over a maximum period of 10 years for financial companies and 20 years for non financial companies. The original estimate life for Latin American banks acquisitions was ten years. This original estimated life under Spanish GAAP was also considered the estimated life under US GAAP.
In 1996 and 1997, BBV Group accounted for the impairment of part of the goodwill relating to investments in Latin America. This impairment was due to a conservative criterion and not based on any economic or fair value of the Latin America reporting units and therefore an impairment under both Spanish and US GAAP did not apply. Since the impairment did not comply with Spanish GAAP the auditor disclosed a qualification in their local auditors’ report. However under US GAAP this impairment was reversed. This adjustment reflects the register of goodwill that under US GAAP should not be impaired in prior years.
Reversal of amortization under SP GAAP
As it is required in SFAS 142, it is necessary to reverse the amortization recorded under Spanish GAAP (€411,077 thousand in 2003 and €559,400 thousand in 2002). In 2002 the amortization of Goodwill related to some reporting units was considered impaired based on the test basis performed and therefore it was not reversed amounting to €154,074 thousand.
Had SFAS 142 been effective January 1, 2001 and accordingly had goodwill not been amortized for US GAAP purposes in 2001, our net income, basic earnings per share and diluted earnings per share would have been as follows:
| | | | | | | | |
Thousands of Euros
| | 2003
| | | 2002
| | | 2001
|
Reported net income in accordance with US GAAP | | 1,905,900 | (*) | | 1,845,746 | (*) | | 680,111 |
Add back: goodwill amortization | | — | | | — | | | 753,121 |
Adjusted net income in accordance with US GAAP | | 1,905,900 | | | 1,845,746 | | | 1,433,232 |
Basic earnings per share | | | | | | | | |
Reported net income | | 0.596 | | | 0.577 | | | 0.213 |
Add back: goodwill amortization | | 0.000 | | | 0.000 | | | 0.235 |
Adjusted net income | | 0.596 | | | 0.577 | | | 0.448 |
Diluted earnings per share | | | | | | | | |
Reported net income | | 0.596 | | | 0.577 | | | 0.213 |
Add back: goodwill amortization | | 0.000 | | | 0.000 | | | 0.235 |
Adjusted net income | | 0.596 | | | 0.577 | | | 0.448 |
| (*) | Includes the above mentioned reversal of the goodwill amortization (€559,400 thousand and €411,077 in 2002 and 2003, respectively). |
F-119
Exchanges differences
For Spanish GAAP purposes the goodwill arising on acquisitions, when the parent company is the direct acquirer of companies abroad, is translated to euros at the exchange rates prevailing at the time the goodwill arises. For US GAAP purposes the goodwill is considered as a foreign currency asset and is translated at the year-end exchange rate.
Sale of BBVA Brasil
As of January 2003, the Bank announced its strategic agreement with Bradesco to sell BBV Brasil, S.A. Since BBVA meet the requirement of SFAS 144 for BBV Brasil, S.A. to be reported as an asset held-for-sale and classified as a discontinued operation as of December 31, 2002, BBVA recorded this investment in BBV Brasil, S.A., including the accumulated foreign currency translation adjustment at the lower of cost or fair value, less costs to sale. The estimated fair value, less costs to sale, for BBV Brasil, S.A., was determined based on the announced agreement with Bradesco to sell BBV Brasil, S.A. As a result, under US GAAP, an adjustment to cancel, the remaining goodwill and the accumulated negative exchange differences related to this goodwill was charged to income. These effects suppose a decrease in net income of €137,812 thousand.
Impairment
A discounted cash flow model was selected as the main method to determine the fair value of its Reporting Units, although other methodologies such as using quoted market values and market multiples were also used. Cash flow estimates require judgment and the Bank believes that assumptions used in determining the cash flows are consistent with assumptions marketplace participants would use in their estimates of their fair value.
The BBVA Group’s goodwill assigned to each Reporting Unit as of December 31, 2003 for annual impairment test purposes are the following:
| | |
| | | Millions of
Euros
|
Retail Banking in Spain and Portugal | | 3,934 |
Wholesale and Investment Banking | | 1,669 |
Pensions in America | | 257 |
México | | 1,784 |
Chile | | 61 |
Puerto Rico | | 86 |
F-120
The definition of the Reporting Units is more specific in relation with the Business activities mainly as a result of the different regulations in Latin America for the banking sector in Banking in America and Asset Management and Private Banking (where the Pensions in America are disclosed).
Expected cash flows have been calculated using the “maximum payable dividend” for each period, considering net income and excess of minimum capital required. For financial statements and macroeconomics scenarios, a five year horizon was used to determine fair value. The risk free rate, the market risk premium and the country risk premium (when applicable) were considered to determine the discount rate used for each Reporting Unit.
Year 2002 analysis
As of December 31, 2002, the Bank has performed the required annual impairment tests of goodwill. As a result of Step 1 procedures of the abovementioned impairment test, the carrying amount of the Reporting Unit do not exceed its fair value.
The argentinean goodwill originated in 2003 was written-off against income. Management decision was taken considering that there were no clear future benefits associated with it.
Year 2003 analysis,
As of December 31, 2003, the Bank has performed the required annual impairment tests of goodwill. As a result of Step 1 procedures of the abovementioned impairment test, the carrying amount of the Reporting Unit do not exceed its fair value.
6. Result on transactions with parent company shares-
Following Circular 4/1991, result of sale transactions with Bank shares owned by subsidiaries must be accounted for as extraordinary profit or losses (Note 3-i).
Under U.S. GAAP, the result on transactions with parent company shares must be accounted for in retained earnings.
7. Allowance for loan losses-
Bank of Spain regulation requires an allowance destined to cover probable losses on intra-group transactions subject to country-risk, which is not necessary under U.S. GAAP. This effect suppose an increase in net income amounted to €68,607 thousand in 2003, a decrease in net income amounted to €4,960 thousand and 54,885 thousand in 2002 and 2001, respectively.
Additionally, as indicated in Note 3-c, Bank of Spain Circular 9/1999 made compulsory to record a provision for the statistical coverage of loan losses to supplement, as required, the specific loans provisions. Under U.S. GAAP, this provision should not be recorded. This effect suppose an increase in net income amounted to €319,372 thousand, €226,576 thousand and €251,084 thousand in 2003, 2002 and 2001, respectively.
F-121
8. Employee loans to purchase Banco Bilbao Vizcaya Argentaria, S.A. shares-
As described in Note 8, certain Group banks granted loans to employees for the acquisition of Banco Bilbao Vizcaya Argentaria, S.A. shares. Under Spanish GAAP, these loans were recorded in the consolidated financial statements under the caption “Loans and Leases”. Also, Group Banks have granted certain loans secured by Banks’ shares. Under U.S. GAAP, these loans should be recorded as a reduction of stockholders’ equity.
9. Valuation of investment securities available for sale portfolio-
Group’s criteria of accounting for such securities, following Bank of Spain Circulars, is described in Notes 3-d and 3-e. Under SFAS 115, Accounting for Certain Investments in Debt and Equity Securities, available-for-sale securities (as defined) must be recorded at market value, with changes in value recognized directly in Other Comprehensive Income (See Note 32.2.A-Investment Securities).
In the following paragraphs, the main differences between Spanish GAAP and U.S. GAAP concerning the accounting for debt and equity securities are described:
Debt securities
Under Spanish GAAP debt securities are categorized under three types of portfolios; this classification is similar to the SFAS 115 classification, however, the accounting treatment differs in some aspects between Spanish GAAP and U.S. GAAP.
1)Trading portfolio: under Spanish GAAP, this category includes the listed securities held for the purpose of obtaining gains in the short-term, taking advantage of market price fluctuations. These investments are accounted for at fair value and the variations on fair values are recorded to income.
This portfolio is similar to the trading portfolio under U.S. GAAP. Therefore, following SFAS 115, there is not any difference with respect to Spanish GAAP. Therefore, no adjustment is needed in the reconciliation from Spanish GAAP to U.S. GAAP.
2)Held-to-maturity portfolio: under Spanish GAAP, this portfolio includes the securities that the management has decided to hold until maturity, since it has the financial capacity to do so. The securities of this portfolio are recorded at their acquisition cost adjusted by the amount resulting from accrual by the interest method of the positive or negative difference between the redemption value and the acquisition cost over the term to maturity of the security (amortized cost). Any adjustment to the acquisition cost is recorded to income under Spanish GAAP.
This portfolio is similar to the held-to-maturity portfolio under U.S. GAAP. Following SFAS 115, there is not any difference with respect to Spanish GAAP. Therefore, no adjustment is needed in the reconciliation from Spanish GAAP to U.S. GAAP.
Under Spanish GAAP if an other-than-temporary loss arises in this portfolio, the impairment would be charged to income. Therefore, the accounting treatment does not differ with respect to U.S. GAAP. Any impairment was charged to income due to “other-than-temporary” losses in this portfolio.
3)Available-for-sale portfolio: under Spanish GAAP this portfolio includes all other debt securities not classified in either one of the two portfolios described above. Securities classified in this portfolio are individually recorded at the lower of their acquisition cost or their fair value.
F-122
Changes in fair value
| | - | If fair value is higher than amortized cost: Under Spanish GAAP unrealized gains are not recognized in income or in stockholders´ equity. Under U.S. GAAP unrealized gains related to available for sale securities are always recorded to “Other Comprehensive Income (OCI)”. The difference between Spanish GAAP and U.S. GAAP is considered and adjusted in the adjustment 9 in the reconciliation to U.S. GAAP. This adjustment increases stockholders` equity in € 413,133 thousand. |
| | - | If fair value is lower than amortized cost: unrealized losses can be considered as “temporary” or “other than temporary”. |
| | i. | Under Spanish GAAP if the decline in fair value is considered “temporary”, then the unrealized losses are recorded to a securities revaluation allowance that is created by debiting an asset accrual account. The accounting entries made to create this allowance are as follows: |
Db Asset Accrual Account (*)
<Cr> Securities Revaluation Reserve (**)
(*) These Accrual Accounts are presented in the caption “Accrual Account” on the Asset side of the Balance Sheet. (**) This allowance is presented offsetting “Available-for-sale” portfolio in Consolidated Balance Sheet. However it is disclosed in a footnote to the financial statements.
These entries under Spanish GAAP do not affect net income or stockholders’ equity. In the future, if the fair value goes up, the allowance is reduced consequently.
Under U.S. GAAP “temporary” losses are recorded to “Other Comprehensive Income (OCI)”. This difference between Spanish GAAP and U.S. GAAP is adjusted in the adjustment 9 in the reconciliation to U.S. GAAP. This adjustments decreases stockholders’ equity in € 59,233 thousand.
| | ii. | Under Spanish GAAP, as under U.S. GAAP, if the decline in fair value is not temporary then it is considered to be “other-than-temporary” and losses are recorded to income. The carrying amount of the asset is written down and the new fair value becomes the new cost basis under both Spanish GAAP and U.S. GAAP. |
Under Spanish GAAP unrealized losses are classified as “other-than-temporary” when management believes that it will not collect or recover all the amounts due (credit risk), or when due to market conditions (volatility, interest rate evolution, macroeconomic variables, etc.) or future expectations, management considers that all or part of unrealized losses will not be recovered (market risk). BBVA performs this analysis at the end of each reporting period.
Under Spanish GAAP there are no general rules regarding the methodologies and factors to be used or the period of time needed to consider impairment as other than temporary. BBVA’s management considers that an impairment is other than temporary if, considering the factors explained in the preceding paragraph, the estimated fair value of the debt securities does not show a demonstrable recovery in the near term future (one year).
According to SAB 59, the value of investments in marketable securities may decline for various reasons. The market price may be affected by general market conditions which reflect prospects for the economy as a whole or by specific information pertaining to an industry or an individual company. According to this literature, such declines require further investigation by management. Acting upon the premise that a write-down may be required, management should consider all available evidence to evaluate the realizable value of its investment. SAB 59 gives
F-123
the following few examples of the factors which, individually or in combination, indicate that a decline is other than temporary and that a write-down of the carrying value is required:
a. The length of the time and the extent to which the market value has been less than cost;
b. The financial condition and near-term prospects of the issuer, including any specific events which may influence the operations of the issuer such as changes in technology that may impair the earnings potential of the investment or the discontinuance of a segment of the business that may affect the future earnings potential; or
c. The intent and ability of the holder to retain its investment in the issuer for a period of time sufficient to allow for any anticipated recovery in market value.
Also according to SAB 59, unless evidence exists to support a realizable value equal to or greater than the carrying value of the investment, a write-down accounted for as a realized loss should be recorded. In accordance with the guidance of paragraph 16 of SFAS 115, such loss should be recognized in the determination of net income of the period in which it occurs. The written down value of the investment in the company becomes the new cost basis of the investment.
BBVA considers that the criteria used for evaluating if an impairment is “other than temporary” under Spanish GAAP is consistent with the U.S. GAAP literature mentioned above and other literature related to this topic, such as SFAS 115 and EITF D –44.
However, under Spanish GAAP, not all unrealized losses in Argentinean debt securities were considered “other-than-temporary”. Under US GAAP, this impairment should be charged to statement of income. This difference between Spanish GAAP and U.S. GAAP is adjusted in the adjustment 9 in the reconciliation to U.S. GAAP. This adjustments decreases net income in €257,933.
· Equity securities
Under Spanish GAAP, equity securities are categorized in different portfolios. This classification is similar to SFAS 115 classification, however, the accounting treatment of some portfolios differs between Spanish GAAP and U.S. GAAP.
| | 1) | Trading portfolio: under Spanish GAAP, this portfolio includes the listed securities held for the purpose of obtaining gains in the short-term, taking advantage of market price fluctuations. It is accounted for at fair value and the differences arising from fair value are recorded to income. |
This portfolio is consistent with the trading portfolio under U.S. GAAP. Following SFAS 115, there is no difference from Spanish GAAP. Therefore, no adjustment is needed in the reconciliation from Spanish GAAP to U.S. GAAP.
| | 2) | Available-for-sale portfolio: under Spanish GAAP, this portfolio includes all other equity securities not classified in the trading portfolio. This definition is consistent with the available-for-sale portfolio under U.S. GAAP. In this portfolio there are listed and unlisted securities. Securities classified in this portfolio are individually stated at acquisition cost in both cases. |
Under U.S. GAAP, for unlisted securities, according to APB 18, while practice varies to some extent, the cost method is generally followed for most investments in noncontrolled companies equity investments. For listed securities SFAS 115 literature applies.
Changes in fair value
Listed Securities
F-124
| | - | If fair value is higher than cost: Under Spanish GAAP unrealized gains are not recognized in income or in stockholders´ equity. Under U.S. GAAP (SFAS 115) unrealized gains for listed securities are recorded in “Other Comprehensive Income (OCI)”. This difference between Spanish GAAP and U.S. GAAP is considered and adjusted in the adjustment 9 in the reconciliation to U.S. GAAP. This adjustment increases stockholders` equity in € 33,016 thousand. |
| | - | If fair value is lower than cost: under Spanish GAAP, if the decline in fair value is considered “temporary”, then the unrealized losses are recorded to a securities revaluation allowance that is created by debiting the income statement. The accounting entries made to create this allowance are as follows: |
Db Market Operations (Income Statement)
<Cr> Securities Revaluation Reserve (*)
(*) This allowance is presented offsetting “Available-for-sale” portfolio in Consolidated Balance Sheet. However it is disclosed in a footnote to the financial statements.
| | i. | As these unrealized losses are “temporary”, if they are recovered in future periods, securities revaluation reserve is reversed to income. Under U.S. GAAP “temporary” unrealized losses for listed equity securities are recorded to “Other Comprehensive Income (OCI)”. This difference between Spanish GAAP and U.S. GAAP is considered and adjusted in the adjustment 9 in the reconciliation to U.S. GAAP. This adjustment increases net income in € 154,902 thousand. |
| | ii. | Under Spanish GAAP, as under U.S. GAAP, if the decline in the fair value is not temporary then it is considered to be “other-than-temporary” and losses are recorded to income. The carrying amount of the asset is written down and the new fair value becomes the new cost basis under both Spanish GAAP and U.S. GAAP. |
The criteria used by BBVA Group for considering an impairment as “other-than-temporary” are describe above.
BBVA considers that the criteria used for evaluating if an impairment is “other than temporary” under Spanish GAAP is consistent with the U.S. GAAP literature mentioned above and other literature related to this topic as SFAS 115 and EITF D –44. No impairment, due to “other-than-tempory” unrealized losses, was registered under Spanish GAAP or US GAAP.
Unlisted Securities
| | - | If fair value is higher than cost: Under Spanish GAAP, unrealized gains are not recognized in income or in stockholders´ equity. Since there is no difference with respect to APB 18, no adjustment is made in the reconciliation to U.S. GAAP. |
| | - | If fair value is lower than cost: under Spanish GAAP, if the decline in fair value is considered “temporary”, then the unrealized losses are recorded to a securities revaluation allowance that is created by debiting the income statement. The accounting entries made to create this allowance are as follows: |
Db Market Operations (Income Statement)
<Cr> Securities Revaluation Reserve (*)
(*) This allowance is presented offsetting “Available-for-sale” portfolio in Consolidated Balance Sheet. However it is disclosed in a footnote to the financial statements.
| | i. | As these unrealized losses are “temporary”, if they are recovered in future periods, securities revaluation reserve is reversed to income. Under U.S. GAAP “temporary” unrealized losses for unlisted equity securities are not recorded. There were no “temporary” unrealized losses. Therefore no adjustment is made in the reconciliation to U.S. GAAP. |
F-125
| | ii. | Under Spanish GAAP, as under U.S. GAAP, if the decline in the fair value is not temporary, then it is considered to be “other-than-temporary” and losses are recorded to income. The carrying amount of the asset is written down and the new fair value becomes the new cost basis under both Spanish GAAP and U.S. GAAP. |
As explained above, BBVA considers that the criteria used for evaluating if an impairment is “other than temporary” under Spanish GAAP is consistent with the U.S. GAAP literature (SAB 59) mentioned above and other literature related to this topic as APB 18 and EITF D –44. All unrealized losses in unlisted equity securities were considered as “other-than-temporary” due to the bad performance of the companies and the very limited liquidity of these securities. These unrealized losses amounted to € 7,995 thousand and they were charged to income statement under Spanish GAAP. Therefore no adjustment is made in the reconciliation to U.S. GAAP.
In addition, in adjustment 9 BBVA Group applies SFAS 115 to all equity investment accounted for by the equity method under Spanish GAAP but under US GAAP must be accounted for at fair value (see Note 32.2.B.3). The application of SFAS 115 to these investments increases stockholders` equity in € 2,114,035 thousand due to the recognition of net unrealized gains in “Other Comprehensive Income”.
10. Intangible assets-
As indicated in Note 3-f, under Spanish GAAP the expenses of capital increases carried out at the Bank and dependent companies are amortized under a period of five years. Under U.S. GAAP these expenses should be recorded as incurred by a charge to reserves. This effect supposes an increase in net income and a decrease in Stockholder’s equity in 2003, 2002 and 2001, respectively.
Also, under Spanish GAAP incorporation and start up expenses are amortized over a period of five years and under U.S. GAAP should be charged to income as incurred. This effect supposes an increase in net income in 2003 and 2002 and a decrease in 2001, respectively, and a decrease in Stockholder’s equity in 2003, 2002 and 2001, respectively.
Definite lived intangible assets are mainly integrated by software expenses. Definite lived intangible assets are amortized over their remaining useful lives and the Bank considers that there is no impairment associated to these assets.
11. Derivative Instruments and Hedging Activities
11.1. Objectives for the holding of positions in derivatives and strategies for the achievement of these objectives
The holding of positions in derivatives is the result of the Group’s need to manage the risks incurred by it in the course of its normal business activities. Derivatives represent another of the tools available to the Group, and are necessary for the management of:
| | • | Market Risk: Positions taken by the Group mostly in order to satisfy its customers’ needs (franchise model). In most cases the derivatives used are: Interest-Rate Derivatives, to manage the risks arising as a result of long- and short-term variations in interest rates; Exchange-Rate Derivatives, to mitigate exposure to exchange-rate fluctuations; and Equity Security Derivatives, to manage price risks. |
| | • | Structural Interest-Rate Risk: Structural interest-rate risk is defined as an entity’s exposure to variations in market interest rates arising from mismatches in the maturity and repricing dates of the entity’s assets and liabilities, including derivatives. The Asset and Liability Committee (ALCO) is the body responsible for actively managing BBVA’s balance sheet in order to stabilize net interest income without prejudice to net asset value. Basically, the derivatives used to achieve this goal are interest-rate derivatives. |
F-126
| | • | Structural Exchange-Rate Risk: An entity’s structural exchange-rate risk refers to the potential losses in the value of structural positions arising from variations in exchange rates. The Asset and Liability Committee (ALCO) is the body responsible for managing this risk, for which purpose it uses exchange- and interest-rate derivatives. |
| 11.1.1. | Risk Management Policies |
Market Risk
Managed by the Central Market Risk Unit, market risk is to be found in the Group’s market or treasury activities, which are characterized by the holding of positions sensitive to fluctuations in market prices. The Market Risk Unit, which is organically separate from and independent of the business units, is responsible for adapting and administering risk measurement and control tools and for regularly monitoring that the business units comply with the risk limits and policies. The Unit also periodically reports to the Standing Committee, the Lending Committee, the Management Committee and the Internal Risk Committee on levels of risk, results and the degree of compliance with such limits in the Group, at individual and aggregate level.
One of the basic pillars of the BBVA Group’s market risk management model is the limit structure, which consists of an overall VaR limit for each business unit, supplemented by a series of specific sublimits by desk, business line, and risk or product type.
Proposals for the overall limits for all the business units and for certain sublimits are approved by the Standing Committee. The business units, together with the Risk Area, are responsible for distributing these limits by desk, business line or risk type. These VaR limits are supplemented by others based on non-statistical measures such as delta sensitivity, nominal exposure or stop-loss on the results of the markets areas. This limit structure is part of the Group’s general control system, which includes the definition of a variety of prior warning signs which trigger the contingency plans to attempt to prevent situations that might adversely affect the Bank’s results.
The purpose of the market risk management and measurement model currently in place at the BBVA Group is to measure both general market risk and specific risks, for which the Group employs the Value-at-Risk (VaR) methodology, which aims to measure the maximum loss that can occur in the value of the portfolio as a result of fluctuations in general conditions on the financial markets, as shown by changes in interest rates, exchange rates and equity security prices, if the portfolio is maintained for a certain period. To these three major risk factors must be added basis risk (which arises, for example, when there are debt positions the interest-rate risk on which is hedged by swap transactions, generating a risk because there is a variable spread between the interest-rate curves relevant for the valuation of these positions) and spread risk (associated with corporate securities or credit derivatives on corporate issuers), together with, in the case of option positions, volatility and convexity risk and, in certain cases, correlation risk, since all the above are risk factors that might influence the market prices of certain products.
The VaR model used is the covariance matrix, with a confidence level of 99% and a time horizon of one day, improved to take into account convexity and other risks associated with option positions and structured derivative products. In addition, periodical supplementary settlement VaR calculations are performed for certain business units, which include adjustments to factor in the specific liquidity of the position, taking into account the liquidity conditions on the financial markets at any time.
The Group is also implementing a new risk measurement platform which, in addition to the advantage of enabling market risk to be integrated with credit risk, thus facilitating an overall view of existing risk, makes it possible to calculate market risk using the covariance matrix, the historical simulation and the Monte Carlo simulation methodologies.
F-127
The market risk measurement model includes a back-testing or ex post contrast program, which to a certain extent guarantees the suitability of the risk measures that are performed. In order to validate the VaR measurement system, comparisons are made, inter alia, of the levels of ex ante risk provided by the model with the ex post results obtained by the units each day.
Stress-testing is an essential supplementary tool for market risk management, especially in the wake of the recent crises in Argentina and Brazil and the upheaval in the financial markets after the events of September 11, 2001. Accordingly, in order to strengthen risk management and control, the BBVA Group periodically calculates the exposure to losses of each business unit in response to events beyond the predetermined confidence interval for the daily measurement of market risk. This enables senior management to ascertain whether the level of exposure to losses under these potential scenarios fits in with the Bank’s appetite for risk, and to design, on the basis of that exposure, the contingency plans that must be implemented immediately if an unusual situation similar to those examined should occur.
Structural Interset-rate risk
The responsibility for controlling and monitoring structural interest-rate risk falls on the Risk Area, which periodically measures this risk from a dual perspective: on the one hand, from the net interest income standpoint and, on the other, from that of the economic value. In the former case, net interest income is projected for the next 12 months; and in the case of the analysis of economic value, a discounted current value is calculated of expected future flows in the balance sheet. The impacts of fluctuations in interest rates on both measures are calculated by using both parallel displacements in interest-rate curves and shocks that take into account changes of slope and curvature. Several interest-rate curve simulation methodologies have been developed to determine these changes of slope and curvature and these methodologies are used to calculate expected losses in net interest income and in economic value, with a confidence level of 99%.
Structural Exchange-Rate Risk
The Risk Area periodically measures structural exchange-rate risk using a statistical simulation model that includes certain exchange-rate crisis scenarios to which certain estimated probabilities of occurrence are assigned. Another factor in the model is the projection at one year of the exchange rates of the currencies involved. Every month the total risk is calculated in annual VaR terms with a confidence interval of 99%.
| 11.1.2. | Transactions whose risks are hedged for US GAAP purposes |
| | 1. | Available for sale fixed rate debt securities: this risk is hedged using interest-rate derivatives (interest-rate swaps through which the fixed-coupon of the bond is exchanged for a variable return). |
| | 2. | Long term fixed rate debt issued: this risk is hedged using interest-rate derivatives (interest-rate swaps which replicate, on the collection leg, the payment resulting from the issue and transform it into a variable cost for the Bank). |
| | 3. | Foreign currency of a net investment in a foreign subsidiary: the risk of a net investment in a foreign operation is exchanged for the currency in which the investment is denominated. |
| | 4. | Available for sale equity securities: this risk is hedged using equity swaps through which the risk of variation in the price per books of the portfolio is transferred to the counterparty. |
| | 5. | Fixed rate loans: this risk is hedged using interest-rate derivatives (interest-rate swaps through which the fixed-coupon of the loans is exchanged for a variable return). |
F-128
| 11.1.3. | Purpose of the use of macrohedges: |
Macrohedges are used to facilitate the overall management of the risk to which the Bank is exposed in managing correlated assets, liabilities and other transactions. As of December 31, 2003, the Group had arranged two macrohedges:
Equity Securities
A global equity securities macrohedge designed to encompass the price risk positions of BBVA’s Investment Banking Area. This Area conducts its price risk management operations through the following two business units:
| | • | Proprietary Trading Desk: including the Investment Banking Area’s directional positions in price risk. The operations of this desk are not covered by the macrohedge set forth under this Technical Standard. |
| | • | Equity Securities Desk: the operations of this desk are divided into two subunits: |
This subunit is responsible for managing the products that arise in relation to trading room customers and which in one way or another are affected by equity volatility. This management is performed through options (plain vanilla, exotic or correlation options).
| | • | Relative value and arbitrage: |
This subunit is responsible for exploiting the balance (spot positions assumed at the desk) for the benefit of the results thereof.
The businesses of this area are as follows:
| | • | Taking and Placing of Securities. Securities are taken and assigned using various mechanisms. |
| | • | Statistical Arbitrage. This consists of the taking of positions, guided by an expert system, in two environments. |
| | • | Risk Arbitrage. This consists of exploiting the differences between the theoretical exchange ratio of two companies planning to merge and their current market value. |
| | • | Baskets. This area is responsible for basic arbitrage and provides support for the short selling of securities. |
| | • | Trading positions. Aimed at exploiting the spreads observed at corporate level (shares whose price is below their actual value) and at index level. |
Basically, most of the operations of the Equity Securities Desk relate to euro-zone securities and indexes (primarily IBEX 35 and EUROSTOXX 50) and to a lesser extent to other markets (mainly Dow Jones, S & P 500, Nasdaq and Nikkei).
Therefore, the macrohedge includes the operations performed by the Trading Room Equity Securities Desk to manage the price risk of the euro-zone stock market indexes, of the securities listed thereon, and of other indexes and securities which, although not belonging to the euro zone, are managed jointly with those relating to it (securities, options, equity-swaps).
Macrohedge of Euro deposits
This macrohedge includes the operations deriving from the management of the interest-rate risk resulting from the taking by the Bank of long-term (over 12 months) fixed-rate deposits.
This activity exposes the Bank to a long-term interest-rate risk which is managed using correlation through various types of products: basically IRS, futures and bonds, in addition to swaptions in those cases in which it is necessary to hedge existing options on the deposits.
F-129
The significant risks relating to these operations are as follows:
Market risks:
Based on the description of the macrohedge set forth above, the macrohedge will include the following products:
| | • | Fixed-rate deposits (maturing at over 12 months) |
These macrohedges maintained by BBVA Group, under Spanish GAAP, do not qualify as hedges under US GAAP.
11.2.Accounting for Derivative Instruments and Hedging Activities
Under U.S. GAAP the Group adopted, effective January 1, 2001, SFAS No.133 (“SFAS 133”),Accounting for Derivative Instruments and Hedging Activities, which establishes accounting and reporting standards for derivative instruments, including certain derivative instruments embedded in other contracts (embedded derivatives) and for hedging activities. This Statement requires that every derivative instrument be recorded in the balance sheet as either an asset or liability measured at its fair value.
Under SFAS 133 the accounting for changes in fair value of a derivative instrument depends on its intended use and the resulting designation.
If the derivative is designated as a fair value hedge, the changes in the fair value of the derivative and the hedged item attributable to the hedged risk are recognized in earnings.
If the derivative is designated as a cash flow hedge, the effective portions of changes in the fair value of the derivative are recorded in Other Comprehensive Income and are recognized in the income statement when the hedged item affects earnings. Ineffective portions of changes in the fair value of cash flow hedges are recognized in earnings.
The gain or loss on a hedging derivative instrument that is designated as, and is effective as, an economic hedge of the net investment in a foreign operation is reported in the same way as a translation adjustment to the extent it is effective as a hedge. The ineffective portion of net investment hedges is reported in earnings.
Hedging transactions must be formally documented, designated and the company must describe the way the effectiveness is going to be assessed.
On the other hand when the derivative is designated as a trading transaction the changes in the fair value must be recognized currently in earnings.
11.3.Impact of SFAS 133 Implementation
As mentioned before, under U.S. GAAP, Banco Bilbao Vizcaya Argentaria Group has adopted, effective January 1, 2001 SFAS No. 133, Accounting for Derivative Instruments and Hedging Activities, which establishes accounting and reporting standards for derivative instruments, including certain derivative instruments embedded in other contracts and for hedging activities.
F-130
Identification of accounting differences:
Regarding derivatives and hedge accounting, the differences between Spanish GAAP and U.S. GAAP are mainly the following:
Hedges
Spanish GAAP hedging requirements:
Bank of Spain regulations on derivatives and hedge accounting refers to the same topics as US GAAP. As in U.S. GAAP, this regulations address the documentation, measurement, control and accounting matters. Both Spanish and U.S. GAAP deal with the same concepts (e.g., the offsetting effect of hedges and their effectiveness), although using different wording and terminology.
The Bank of Spain regulations consider hedging transactions those that meet the following criteria:
a) Transactions aimed at eliminating or significantly reducing the foreign exchange rate risk, the interest rate risk or price risk of balance sheet items or other items provided that, in each case, the hedged item and the hedging transactions are explicitly identified at inception of the hedge.
b) Transactions aimed at reducing the global risk of correlated groups of assets, liabilities and other transactions, if they are managed through an integrated risk measurement and management control system that allow for the follow-up and explicit identification of the transactions. This system requires a favorable opinion of the external auditor to be issued and reported to the Bank of Spain on an annual basis. Such report specifically addresses the reasonableness, quality, and consistency of the integrated risk measurement and management control system (including compliance with specific documentation requirements) as well as the effectiveness of macro-hedges (80% - 120% range) through the performance of independent stress tests of all macro-hedges in place.
In the hedges that meet criteria a), gains or losses of the derivatives are accrued and/or recognized symmetrically to the revenues or expenses arising from the hedged items. This means that whatever impact the hedged item has on net income is offset by the impact recorded in the same line item in the statement of operations under Spanish GAAP for the hedge instrument.
In the hedges that meet criteria a) and b) (“macro-hedges”), all the transactions involved are either accrued or marked to market, net losses are always recorded in the statement of income. For certain types of macro-hedges, net gains would be recorded in statement of income. The income statement treatment for all macro-hedges is determined and documented at the inception of the hedging transaction.
The Group enters into thousands of derivative transactions, most of which are aimed at eliminating or reducing risks, but only a limited amount of these transactions receive hedge accounting treatment under Spanish GAAP due to the strict qualifying requirements of Bank of Spain regulations. Given that US GAAP does not allow certain types of hedges, derivative transactions accounted for as hedges under U.S. GAAP are only a portion of the hedge transactions under Spanish GAAP.
Each type of derivatives accounted for as a hedge under Spanish GAAP is related to a specific type of hedge as classified under U.S. GAAP (fair value or net investment) as follows:
| | |
Spanish GAAP classification
| | US GAAP classification
|
| Hedges on available-for-sale fixed rate debt securities | | Fair value hedge |
Hedges on held-to-maturity securities | | Trading |
Hedges on long term fixed rate debt issued | | Fair value hedge |
| Hedges of the foreign currency of a net investment in a foreign subsidiary | | Hedges of the foreign currency of a net investment in a foreign operation |
| Hedged on Available for sale equity securities (non-group investments) | | Fair value hedge |
Hedges on fixed rate loans | | Fair Value hedge |
Macro-hedge | | Trading |
F-131
In order to conform to U.S. GAAP the Group considers certain derivatives as hedging transactions. These hedges are formally documented, are expected to be effective, and the Group designates and assesses periodically the effectiveness of such hedges. The Group considers these operations as qualified hedges under SFAS 133. The Group has qualified all these hedges as fair value hedges. Therefore, under US GAAP, their gains or losses should have been recognized in earnings in the period of change together with the offsetting loss or gain on the hedged item attributable to the risk being hedged. As there is no significant hedge ineffectiveness to be considered, due to the effectiveness of such hedges, no adjustment was made in the reconciliation of net income and shareholders’ equity to US GAAP.
The Bank, under US GAAP, does not have any amounts for cash flow hedges . Therefore there are not any amount for cash flow hedges reported in Other Comprehensive Income.
For all other transactions recognized as Hedging Derivatives under Spanish GAAP that do not meet the requirements of hedge accounting under SFAS 133, the gain or loss on the derivative instrument has been recognized through earnings in the reconciliation to US GAAP as hedge accounting has not been applied under U.S. GAAP.
Macro hedges
The Group uses these instruments to hedge global equity and interest rate risk exposures. These transactions are permanently subject to an integrated, conservative and consistent system of risk management (e.g. estimate value at risk -VaR- of the transactions to check the equity risk is reduced due to the use of derivatives…) that measures, controls and manages the risks and the results of the operations involved.
The bank records provisions to cover future losses (generic provisions) based on VaR calculations.
The Bank has two different kinds of macro-hedges:
Share price risk macro hedge
The objective of this kind of macro hedge is to globally hedge the equity risk exposure arising from a trading portfolio, through trading equity derivatives.
The Group marks all the derivatives and the hedged assets (trading portfolio) to market, recording gains or losses into the income statement. Additionally, generic provisions are recorded to cover up future losses. Under Spanish GAAP, all the derivatives and the hedged assets are marked to market and the gain or losses are recorded in the income statement.
This macro hedge does not qualify as a hedge under US GAAP, thus no adjustment is needed to recognize the fair value of the derivatives because under Spanish GAAP the derivatives are marketed to market with changes in market value reflected in the income statement.
The only adjustment in the reconciliation to US GAAP consists in eliminating the generic provisions. As of December 31, 2003 the elimination of this provision gave rise to a decrease of €1,226 thousand in net income which is include in the effect of adoption of SFAS 133 describe later on.
Interest rate risk macro hedge
The objective of this kind of macro hedge is to globally hedge the interest risk of a portfolio of deposits due to customers.
F-132
The Group considers the fair value all the derivatives and the hedged deposits. The net losses are recorded in the income statement, while the net unrealized gains are not recorded into the income statement.
Under U.S. GAAP, this macro hedge cannot qualify as a hedge. The adjustment in the reconciliation to US GAAP consists of:
| | • | Recognizing fair value of derivative transactions in statement of income |
| | • | Eliminating the generic provisions (ex; liquidity provisions, market risk provisions…) |
As of December 31, 2003 the recognition of the fair value of Interest Risk macrohedge and the elimination of the generic provisions gave rise to an increase of €113,353 thousand and €457 thousand in net income, respectively. This adjustment is include in the effect of adoption of SFAS 133 describe later on.
Foreign Currency Hedges
The Group considers certain derivatives as hedging the foreign currency exposure of a net investment in a foreign subsidiary. The derivatives are traded in the same currency of the country in which the foreign subsidiary is located.
Under Spanish GAAP, these gains or losses are recorded with a charge in OCI to offset the differences arising in the translation of the subsidiary financial statements. These operations are qualified as a hedge of the foreign currency exposure of a net investment in a foreign operation under US GAAP. As a consequence, there is no reconciliation adjustment for this operation.
Trading derivatives
Under Spanish GAAP, trading transactions are valued, depending on the market on which they are traded, as follows:
| | • | Transactions arranged in organized markets are valued at quoted market price in their respective markets and the gains or losses arising as a result of market price fluctuations are recorded in the income statement. |
| | • | For OTC derivatives, gains or losses are recognized when effectively settled. At every close, the bank values these operations, grouping transactions by type of risk. For each group, net unrealized losses are recorded in the income statement. Unrealized gains are not recognized. |
Under U.S. GAAP, the gain or loss on a derivative instrument not designated as a hedging instrument shall be recognized through earnings.
All derivatives recognized as trading transactions under Spanish GAAP are also considered as trading for US GAAP purposes.
The adjustment in the US GAAP reconciliation consists of recognizing the unrealized gains not recognized for Spanish GAAP as described in the preceding paragraphs.
Other derivatives
All material intercompany accounts and transactions between the consolidated companies are eliminated in consolidation. This consolidation principle also applies with respect to intercompany derivative transactions.
The cumulative positive effect arising from the adoption of SFAS 133 amounted to €8,182 thousand as of January 1, 2001. As of December 31, 2003, the application of this method gave rise to a increase of €207,460 thousand in net income and an increase of €58,359 thousand in Other Comprehensive Income. As of December 31, 2002, the application of this method gave rise to a decrease of €126,660 thousand in net income and an increase of €72,039
F-133
thousand in Other Comprehensive Income. As of December 31, 2001, the application of this method gave rise to an increase of €11,219 thousand in net income and an increase of €12,790 thousand in Other Comprehensive Income. The effect in Other Comprehensive Income is produced by valuating the derivative instruments hedging the available-for-sale portfolio, that under Spanish GAAP are considered hedged items, and therefore are not marked to market, but under US GAAP are not qualified as a hedge.
11.4. Additional disclosures required by U.S. GAAP: Fair Value Methods
The methods used by the Group in estimating the fair value of its derivative instruments are as follows:
Forward purchases/sales of foreign currency
Estimated fair value of these financial instruments is based on quoted market prices.
Forward purchases/sales of government debt securities
Estimated fair value of these financial instruments is based on quoted market prices, since they are mostly traded in organized markets.
Options and financial futures
Derivatives traded in organized markets are valued based on quoted market prices.
For options and futures traded in OTC markets, the fair value is estimated based on theoretical year-end closing prices. These year-end closing prices are calculated according to generally accepted models estimating the amounts the Group would receive or pay based upon the yield curve/ volatilities prevailing at year-end or prices.
Forward rate agreements and interest rate swaps
Fair values of these contracts are estimated based on the discounted future cash flows related to the interest rates to be collected or paid, using for this purpose the yield curve prevailing at year-end.
F-134
The disclosure of the notional principal amounts of the derivatives of the Group by trading or hedging, under US GAAP, operations is as follows:
| | | | | | |
| | | 2003
| | 2002
| | 2001
|
| | | Thousands of Euros | | | | |
Trading | | | | | | |
Interest risk contracts: | | | | | | |
Forward rate agreements | | 67,325,503 | | 22,413,334 | | 111,359,842 |
Interest rate swaps | | 515,630,158 | | 438,278,729 | | 450,249,865 |
Options and futures | | 113,653,819 | | 113,099,981 | | 111,361,425 |
Foreign exchange contracts: | | | | | | |
Forward purchase/sale of foreign currency | | 44,926,713 | | 41,291,191 | | 27,175,524 |
Currency options | | 8,728,897 | | 4,067,083 | | 19,476,843 |
Currency swaps | | 8,363,047 | | 7,463,306 | | 7,402,319 |
Derivatives on securities and commodities | | 37,360,860 | | 32,496,504 | | 26,813,840 |
| | |
| |
| |
|
| | | 795,988,997 | | 659,110,128 | | 753,839,658 |
| | |
| |
| |
|
Hedging derivatives | | | | | | |
Interest risk contracts: | | | | | | |
Interest rate swaps | | 18,107,187 | | 16,323,924 | | 13,153,945 |
Options and futures | | 14,046,827 | | 5,510,226 | | — |
Foreign exchange contracts: | | | | | | |
Currency options | | — | | 1,603,787 | | — |
Currency swaps | | 3,337,507 | | 4,355,780 | | 6,193,718 |
Derivatives on securities and commodities | | 1,631,702 | | 1,840,696 | | 2,025,672 |
| | |
| |
| |
|
| | | 37,123,223 | | 29,634,413 | | 21,373,335 |
| | |
| |
| |
|
Total trading and hedging derivatives | | 833,112,220 | | 688,744,541 | | 775,212,993 |
| | |
| |
| |
|
The following is a detail of the trading transactions notional amount and their year-end fair value for year 2003, 2002 and 2001 disclosed in each type of instrument.
| | | | | | | | | | | | | | | |
| | | 2003
| | | 2002
| | | 2001
| |
| | | Notional Amount
| | Fair
Value
| | | Notional
Amount
| | Fair
Value
| | | Notional
Amount
| | Fair
Value
| |
| | | Thousand of euros | | | | | | | | | | | | | |
Trading | | | | | | | | | | | | | | | |
Interest risk contracts: | | | | | | | | | | | | | | | |
Forward rate agreements | | 67,325,503 | | 2,776 | | | 22,413,334 | | (5,766 | ) | | 111,359,842 | | (13,734 | ) |
Interest rate swaps | | 515,630,158 | | (530,909 | ) | | 438,278,729 | | (774,073 | ) | | 450,249,865 | | (188,720 | ) |
Options and futures | | 113,653,819 | | 121,952 | | | 113,099,981 | | 208,442 | | | 111,361,425 | | 76,815 | |
Foreign exchange contracts: | | | | | | | | | | | | | | | |
Forward purchase/sale of foreign currency | | 44,926,713 | | (307,781 | ) | | 41,291,191 | | (434,480 | ) | | 27,175,524 | | 608,908 | |
Currency options | | 8,728,897 | | (23,351 | ) | | 4,067,083 | | 8,999 | | | 19,476,843 | | 112,300 | |
Currency swaps | | 8,363,047 | | (178,986 | ) | | 7,463,306 | | 83,695 | | | 7,402,319 | | (132,904 | ) |
Derivatives on securities and commodities | | 37,360,860 | | 177,100 | | | 32,496,504 | | 225,154 | | | 26,813,840 | | 23,790 | |
| | |
| |
|
| |
| |
|
| |
| |
|
|
| | | 795,988,997 | | (739,199 | ) | | 659,110,128 | | (688,029 | ) | | 753,839,658 | | 486,455 | |
| | |
| |
|
| |
| |
|
| |
| |
|
|
F-135
The reconciliation between the disclosures presented above (under US GAAP) and the disclosures presented in Note 26 (under Spanish GAAP) as of December 31, 2003 is as follows:
The notional amount and the fair value of derivatives that afforded hedge accounting treatment under Spanish GAAP but did not qualify as hedges under U.S. GAAP as of December, 31 2003 are disclosed in the following table:
| | | | | |
| | | Hedging derivatives under Spanish
Gaap not under US Gaap
| |
| | | Notional amount
| | Fair value
| |
Interest risk contracts: | | | | | |
Interest rate swaps | | 15,702,477 | | 96,135 | |
Options and futures | | 3,630,590 | | 12,739 | |
Foreign exchange contracts: | | | | | |
Forward purchase/sale of foreign currency | | 11,259,770 | | (29,866 | ) |
Currency options | | 810,522 | | — | |
Currency swaps | | 1,050,361 | | (347,835 | ) |
Derivatives on securities and commodities | | 20,647,967 | | (27,937 | ) |
| | |
| |
|
|
TOTAL | | 53,101,687 | | (296,764 | ) |
| | |
| |
|
|
The notional amount and the fair value of derivatives that afforded hedge accounting treatment under Spanish GAAP and qualify as hedges under U.S. GAAP as of December, 31 2003 are disclosed in the following table:
| | | | | |
| | | Hedging derivatives under Spanish &
US Gaap
| |
| | | Notional amount (*)
| | Fair value (**)
| |
Interest risk contracts: | | | | | |
Interest rate swaps | | 18,107,187 | | 506,091 | |
Options and futures | | 14,046,827 | | 431,583 | |
Foreign exchange contracts: | | | | | |
Currency swaps | | 3,337,507 | | 64,763 | |
Derivatives on securities and commodities | | 1,631,702 | | (214,218 | ) |
| | |
| |
|
|
TOTAL | | 37,123,223 | | 788,219 | |
| | |
| |
|
|
F-136
The reconciliation of the items of Income Statement affected by derivative and hedging accounting between Spanish GAAP and U,S, GAAP is as follows:
| | | | | | | | | | | | | | | | | | |
| | | Thousand of Euros
| |
| | | 2003
| | | 2002
| |
| | | Spanish
GAAP
| | | Adjustments
| | | U,S, GAAP
| | | Spanish
GAAP
| | | Adjustments
| | | U,S, GAAP
| |
Interest Income | | 12,537,465 | | | (246,470 | ) | | 12,290,995 | | | 17,232,909 | | | (168,195 | ) | | 17,064,714 | |
Interest Expenses | | (6,260,058 | ) | | 463,021 | | | (5,797,037 | ) | | (9,783,505 | ) | | 35,855 | | | (9,747,650 | ) |
Net Interest Income | | 6,277,407 | | | 216,551 | | | 6,493,958 | | | 7,449,404 | | | (132,340 | ) | | 7,317,064 | |
Gain/losses from foreign Exchange, derivatives and others | | 651,504 | | | (9,091 | ) | | 642,413 | | | 765,123 | | | 5,680 | | | 770,803 | |
| | | | | | |
TOTAL | | | | | 207,460 | | | | | | | | | 126,660 | | | | |
The columns adjustments includes:
| | • | Adjustment to Interest Income and Interest Expenses: these adjustments eliminate the accrual of interest rate swaps accounting as hedging under Spanish GAAP, These swap are not accounted for fair value, Under US GAAP these accrual is eliminate from “Interest Income” and “Interest Expenses” and the interest rate swaps are mark to market, |
| | • | Adjustment to Gain/losses: this adjustment reflects the impact in net income of mark to market all derivatives accounted as hedges under Spanish GAAP that they not qualify as hedge under US GAAP, |
12. Tax effect of U.S. GAAP adjustments and deferred taxation under SFAS No. 109-
The previous adjustments to net income and Stockholders’ equity do not include their related effects on corporate tax, except for the adjustment mentioned in Item 1, which are disclosed under “Tax effect of above mentioned adjustments” item on the reconciliation statements.
As described in Note 3-l under Spanish GAAP only the timing differences which have a specific reversal period of less than ten years have been recorded. As a result of the application of Statement of Financial Accounting Standards No. 109 (“SFAS 109”),Accounting for Income Taxes, the timing differences originated by the provision for the statistical coverage of loan losses (Note 32-2-B-7) and by the allowance assigned to cover probable losses on intra-group transactions subject to country-risk (Note 32-2-B-7) have been reversed.
In the reconciliation to U.S. GAAP, the Group has recorded as of December 31, 2003, deferred tax assets of €93,864 thousand (€226,749 thousand and €251,258 thousand as of December 31, 2002 and 2001, respectively) and deferred tax liabilities of €895,537 thousand (€431,862 thousand and €1,030,558 thousand as of December 31, 2002 and 2001, respectively). Deferred tax liabilities arise mainly from valuation of investment securities adjustments in Spanish GAAP to U.S. GAAP reconciliation.
Under U.S. GAAP, as of December 31, 2003, a deferred tax asset amounting €614,249 thousand (€53,242 thousand and €156,600 thousand as of December 31, 2002 and 2001, respectively) had been recognized.
F-137
SFAS 109 requires providing a valuation allowance when it is more likely than not that some portion of the deferred tax asset will not be realized. As of December 31, 2003, 2002 and 2001 the valuation allowance amounted to €672,218 thousand, €113,210 thousand and €225,181 thousand, respectively.
The following is a reconciliation of the income tax provision under Spanish GAAP to that under U.S.GAAP:
| | | | | | | | | |
| | | 2003
| | | 2002
| | | 2001
| |
| | | Thousands of Euros | |
Income tax provision under Spanish GAAP | | 914,976 | | | 653,213 | | | 625,521 | |
| | | |
Tax effect of U.S. GAAP adjustments and deferred taxation under SFAS 109 | | (203,762 | ) | | (3,983 | ) | | (195,616 | ) |
| | | |
Income tax provision under U.S. GAAP | | 711,214 | | | 649,230 | | | 429,905 | |
Following is a reconciliation of the deferred tax assets and liabilities recorded under Spanish GAAP and those that should be recorded under SFAS 109.
| | | | | | | | | | | | | | | |
| | | 2003
| | 2002
| | 2001
|
| | | Deferred
tax assets
| | | Deferred tax
liabilities
| | Deferred
tax assets
| | | Deferred tax
liabilities
| | Deferred
tax assets
| | | Deferred tax
liabilities
|
| | | Thousands of Euros |
As reported under Spanish GAAP | | 3,374,195 | | | 140,957 | | 3,838,413 | | | 155,979 | | 4,660,724 | | | 117,534 |
| | | | | | |
Less- | | | | | | | | | | | | | | | |
| | | | | | |
Timing differences recorded under Spanish GAAP and reversed in the reconciliation to U.S. GAAP | | (290,807 | ) | | — | | (236,451 | ) | | — | | (171,102 | ) | | — |
| | | | | | |
Plus- | | | | | | | | | | | | | | | |
| | | | | | |
Tax effect of Spanish to U.S. GAAP reconciliation adjustments | | 93,864 | | | 895,537 | | 226,749 | | | 431,862 | | 251,258 | | | 1,030,558 |
| | | | | | |
Timing differences not recorded under Spanish GAAP and recognized under U.S. GAAP | | 614,249 | | | — | | 53,242 | | | — | | 156,600 | | | — |
| | |
|
| |
| |
|
| |
| |
|
| |
|
As reported under SFAS 109 (gross) | | 3,791,501 | | | 1,036,494 | | 3,881,953 | | | 587,841 | | 4,897,480 | | | 1,148,092 |
| | | | | | |
Valuation reserve | | (672,218 | ) | | — | | (113,210 | ) | | — | | (225,181 | ) | | — |
| | |
|
| |
| |
|
| |
| |
|
| |
|
As reported under SFAS 109 (net) | | 3,119,283 | | | 1,036,494 | | 3,768,743 | | | 587,841 | | 4,672,299 | | | 1,148,092 |
F-138
Following is an analysis of deferred tax assets and liabilities as of December 31, 2003, 2002 and 2001 estimated in accordance with U.S. GAAP:
| | | | | | | | | |
| | | December 31,
| |
| | | 2003
| | | 2002
| | | 2001
| |
| | | (Thousands of Euros) | |
Deferred Tax assets | | | | | | | | | |
Loan loss reserves | | 1,101,208 | | | 1,231,591 | | | 1,643,326 | |
Unrealized losses on securities pension liability | | 1,058,713 | | | 879,846 | | | 703,830 | |
Fixed assets | | 136,318 | | | 156,177 | | | 264,390 | |
Net operating loss carryforward | | 747,045 | | | 1,157,499 | | | 1,439,135 | |
Investments and derivatives | | 289,297 | | | 239,948 | | | 603,916 | |
Allocated liabilities | | 17,172 | | | 22,007 | | | 27,467 | |
Other | | 441,748 | | | 194,885 | | | 215,416 | |
| | |
|
| |
|
| |
|
|
Total deferred tax assets | | 3,791,501 | | | 3,881,953 | | | 4,897,480 | |
Valuation reserve | | (672,218 | ) | | (113,210 | ) | | (225,181 | ) |
| | |
|
| |
|
| |
|
|
Net tax asset | | 3,119,283 | | | 3,768,743 | | | 4,672,299 | |
| | | |
Deferred tax liabilities | | | | | | | | | |
Unrealized gains on investments | | 732,466 | | | 210,966 | | | 762,120 | |
Gains on sales of investments | | — | | | 17,770 | | | 58,941 | |
Fixed assets | | 130,347 | | | 122,806 | | | 73,702 | |
Allocated assets | | 173,681 | | | 207,775 | | | 243,178 | |
Other | | — | | | 28,524 | | | 10,151 | |
| | |
|
| |
|
| |
|
|
Total deferred tax liabilities | | (1,036,494 | ) | | 587,841 | | | 1,148,092 | |
| | |
|
| |
|
| |
|
|
Net deferred tax assets (liabilities) | | 2,082,789 | | | 3,180,902 | | | 3,524,207 | |
| | |
|
| |
|
| |
|
|
F-139
A reconciliation between the federal statutory tax rate and the effective income tax rate follows:
| | | | | | | | | |
| | | 2003
| | | 2002
| | | 2001
| |
| | | % percentages | |
Corporate income tax at the standard rate of 35% | | 35.00 | | | 35.00 | | | 35.00 | |
Difference arising for the early amortization of goodwill (Note 2-a) | | 0.00 | | | 0.00 | | | 5.85 | |
Decrease arising from permanent differences | | (11.74 | ) | | (15.45 | ) | | (18.24 | ) |
Adjustments to the provision for prior years’ corporate income tax and others taxes | | 0.74 | | | 1.39 | | | (2.52 | ) |
Income tax provision under Spanish GAAP | | 24.00 | | | 20.94 | | | 20.09 | |
Tax effect of US GAAP adjustments and deferred taxation under SFAS 109 | | (5.54 | ) | | (0.13 | ) | | (6.28 | ) |
Income tax provision under US GAAP | | 18.46 | | | 20.81 | | | 13.81 | |
13. BBV Brasil transaction.
On January 13, 2003, BBVA reached a strategic agreement with Banco Bradesco, S.A., whereby BBVA sold its Brazilian affiliate, BBV Brasil, S.A., to Banco Bradesco, S.A. in exchange for a stake in the latter’s share capital.
The main points of the strategic agreement were as follows:
| • | The BBVA Brazilian banking and insurance business activities conducted by BBV Brasil, S.A. and its affiliates, were integrated with Banco Bradesco, S.A. by transferring all the BBV Brasil, S.A. shares held by BBVA to Banco Bradesco, S.A. |
| • | In return for these shares, BBVA received newly-issued ordinary shares and preferred shares in Banco Bradesco, S.A. totaling 4.5 % of its share capital, as well as approximately 2,000 million Brazilian reais in cash. |
| • | Under the agreement, BBVA were entitled to appoint a member of the Board of Directors of Banco Bradesco, S.A. and to set up a business area within Bradesco specifically devoted to the origination of business between BBVA and Bradesco, the provision of banking services to BBVA customers by Bradesco, and other areas of cooperation between both banks. |
At measurement date -end of 2002-, the Group, under Spanish GAAP accounted for the expected net losses from the proposed sale, debited the “Losses on disposal of holdings in entities consolidated by global and proportional integration” caption of the consolidated statement of income with the amount of 246 million euros, and credited the same amount to the caption “Losses at consolidated companies arising from negative exchange differences in consolidation” in order to cancel, pursuant to Bank of Spain regulations, the cumulative exchange losses, recorded against consolidation reserves, derived from the conversion of the financial statements of BBV Brasil since its takeover; this accounting transaction had no effect on the Group’s net worth. The Group had also recorded €92 millions of capital gains, which have been credited to the said caption of the consolidated statement of income and charged to the “Other Assets” caption of the consolidated balance sheet. Lastly, a Specific Fund of €35 millions had been allocated under the “Extraordinary Losses” caption of the statement of income to match the theoretical goodwill that arised as a result of the aforementioned registration of the shares of Banco Bradesco, S.A.
As of December 31, 2002, under US GAAP, the remaining goodwill and the accumulated negative exchange differences related to this goodwill must be cancelled, by a charge to income. These effects supposed a decrease in net income of €137,812 thousand in 2002. This goodwill was amortized in prior years under Spanish GAAP (see Note 2.a).
Additionally, under US GAAP the transaction should be measured at fair value. This adjustment gave rise to an increase in net income and stockholders´ equity of €4,251 thousand in 2002.
Under US GAAP, capital gains as of December 31, 2002 amount to:
| | | |
| | | Millions of Euros
| |
Total gains under Spanish GAAP | | 92 | |
Amortization Goodwill under US GAAP | | (138 | ) |
Measure transactions at fair values | | 4 | |
Other adjustment in reconciliation to US GAAP | | 7 | |
| | |
|
|
Total losses under US GAAP | | (35 | ) |
| | |
|
|
F-140
The carrying amounts of the mayor classes of assets and liabilities of Group BBVA without Brazil and Group BBV Brazil is disclosed as follows:
| | | | | | | | | | | | | | |
| | | 2003
| | 2002
| | 2001
|
| | | Group BBVA (*)
| | Group BBVA
without Brazil
| | BBV Brasil Group
| | Total
| | Group BBVA
without Brazil
| | BBV Brasil Group
| | Total
|
ASSETS | | | | | | | | | | | | | | |
CASH ON HAND AND DEPOSITS AT CENTRAL BANKS: | | | | | | | | | | | | | | |
Cash | | 1,767,580 | | 1,857,409 | | 10,949 | | 1,868,358 | | 2,388,638 | | 14,256 | | 2,402,894 |
Bank of Spain | | 1,821,301 | | 1,081,684 | | — | | 1,081,684 | | 1,828,490 | | — | | 1,828,490 |
Other central banks | | 4,520,994 | | 4,913,136 | | 187,150 | | 5,100,286 | | 4,924,806 | | 84,034 | | 5,008,840 |
| | |
| |
| |
| |
| |
| |
| |
|
| | | 8,109,875 | | 7,852,229 | | 198,099 | | 8,050,328 | | 9,141,934 | | 98,290 | | 9,240,224 |
| | |
| |
| |
| |
| |
| |
| |
|
GOVERNMENT DEBT SECURITIES | | 18,945,003 | | 19,767,776 | | — | | 19,767,776 | | 20,165,369 | | — | | 20,165,369 |
| | |
| |
| |
| |
| |
| |
| |
|
DUE FROM CREDIT INSTITUTIONS | | | | | | | | | | | | | | |
| | | | | | | |
Current accounts | | 643,987 | | 1,326,217 | | 2,532 | | 1,328,749 | | 2,621,899 | | 7,909 | | 2,629,808 |
Other | | 20,263,142 | | 19,218,923 | | 928,607 | | 20,147,530 | | 19,473,898 | | 1,095,050 | | 20,568,948 |
| | |
| |
| |
| |
| |
| |
| |
|
| | | 20,907,129 | | 20,545,140 | | 931,139 | | 21,476,279 | | 22,095,797 | | 1,102,959 | | 23,198,756 |
| | |
| |
| |
| |
| |
| |
| |
|
TOTAL NET LENDING | | 148,827,274 | | 139,838,025 | | 1,476,987 | | 141,315,012 | | 147,811,649 | | 2,408,171 | | 150,219,820 |
| | |
| |
| |
| |
| |
| |
| |
|
DEBENTURES AND OTHER DEBT SECURITIES | | 52,935,966 | | 48,287,905 | | 845,274 | | 49,133,179 | | 60,352,896 | | 1,298,042 | | 61,650,938 |
| | |
| |
| |
| |
| |
| |
| |
|
COMMON STOCKS AND OTHER EQUITY SECURITIES | | 3,092,064 | | 2,999,235 | | 8,257 | | 3,007,492 | | 3,658,145 | | 15,554 | | 3,673,699 |
| | |
| |
| |
| |
| |
| |
| |
|
INVESTMENTS IN NON-GROUP COMPANIES | | 5,593,224 | | 6,023,975 | | 200 | | 6,024,175 | | 6,641,935 | | — | | 6,641,935 |
| | |
| |
| |
| |
| |
| |
| |
|
INVESTMENTS IN GROUP COMPANIES | | 1,054,869 | | 1,034,403 | | 5,285 | | 1,039,688 | | 1,104,311 | | 9,833 | | 1,114,144 |
| | |
| |
| |
| |
| |
| |
| |
|
INTANGIBLE ASSETS: | | | | | | | | | | | | | | |
Incorporation and start-up expenses | | 19,537 | | 20,671 | | 275 | | 20,946 | | 11,618 | | 7,152 | | 18,770 |
Other deferred charges | | 342,491 | | 377,045 | | 646 | | 377,691 | | 522,436 | | 877 | | 523,313 |
| | |
| |
| |
| |
| |
| |
| |
|
| | | 362,028 | | 397,716 | | 921 | | 398,637 | | 534,054 | | 8,029 | | 542,083 |
| | |
| |
| |
| |
| |
| |
| |
|
CONSOLIDATION GOODWILL: | | | | | | | | | | | | | | |
Fully and proportionally consolidated companies | | 2,650,889 | | 2,871,545 | | — | | 2,871,545 | | 3,041,235 | | 3,672 | | 3,044,907 |
Companies accounted for by the equity method | | 1,055,524 | | 1,385,801 | | — | | 1,385,801 | | 1,572,235 | | — | | 1,572,235 |
| | |
| |
| |
| |
| |
| |
| |
|
| | | 3,706,413 | | 4,257,346 | | — | | 4,257,346 | | 4,613,470 | | 3,672 | | 4,617,142 |
| | |
| |
| |
| |
| |
| |
| |
|
PROPERTY AND EQUIPMENT: | | | | | | | | | | | | | | |
Land and buildings for own use | | 2,100,359 | | 1,920,702 | | 17,585 | | 1,938,287 | | 2,497,579 | | 33,356 | | 2,530,935 |
Other property | | 309,607 | | 903,948 | | 4,125 | | 908,073 | | 1,411,014 | | 13,132 | | 1,424,146 |
Furniture, fixtures and other | | 1,380,272 | | 1,698,193 | | 89,412 | | 1,787,605 | | 2,050,924 | | 165,885 | | 2,216,809 |
| | |
| |
| |
| |
| |
| |
| |
|
| | | 3,790,238 | | 4,522,843 | | 111,122 | | 4,633,965 | | 5,959,517 | | 212,373 | | 6,171,890 |
| | |
| |
| |
| |
| |
| |
| |
|
TREASURY STOCK | | 66,059 | | 97,671 | | — | | 97,671 | | 75,944 | | — | | 75,944 |
| | |
| |
| |
| |
| |
| |
| |
|
OTHER ASSETS | | 13,171,480 | | 12,164,256 | | 134,624 | | 12,298,880 | | 11,793,998 | | 206,117 | | 12,000,115 |
| | |
| |
| |
| |
| |
| |
| |
|
ACCRUAL ACCOUNTS | | 2,977,437 | | 4,293,727 | | 97,835 | | 4,391,562 | | 7,037,690 | | 11,377 | | 7,049,067 |
| | |
| |
| |
| |
| |
| |
| |
|
ACCUMULATED LOSSES AT CONSOLIDATED COMPANIES | | 3,610,764 | | 3,553,923 | | 96,285 | | 3,650,208 | | 2,400,257 | | 300,698 | | 2,700,955 |
| | |
| |
| |
| |
| |
| |
| |
|
TOTAL ASSETS | | 287,149,823 | | 275,636,170 | | 3,906,028 | | 279,542,198 | | 303,386,966 | | 5,675,115 | | 309,062,081 |
| | |
| |
| |
| |
| |
| |
| |
|
| (*) | Brasil does not belong to BBVA Group as of December 31, 2003 |
F-141
| | | | | | | | | | | | | | | | |
| | | 2003
| | 2002
| | 2001
|
| | | Group BBVA (*)
| | Group BBVA
without Brazil
| | BBV Brasil
Group
| | | Total
| | Group BBVA
without Brazil
| | BBV Brasil
Group
| | | Total
|
LIABILITIES AND EQUITY | | | | | | | | | | | | | | | | |
DUE TO CREDIT INSTITUTIONS: | | | | | | | | | | | | | | | | |
Current accounts | | 1,542,432 | | 1,537,353 | | 4 | | | 1,537,357 | | 1,412,806 | | 12 | | | 1,412,818 |
Other | | 60,027,356 | | 53,777,622 | | 804,069 | | | 54,581,691 | | 61,538,573 | | 1,636,604 | | | 63,175,177 |
| | |
| |
| |
|
| |
| |
| |
|
| |
|
| | | 61,569,788 | | 55,314,975 | | 804,073 | | | 56,119,048 | | 62,951,379 | | 1,636,616 | | | 64,587,995 |
| | |
| |
| |
|
| |
| |
| |
|
| |
|
DEPOSITS: | | | | | | | | | | | | | | | | |
Savings accounts- | | | | | | | | | | | | | | | | |
Current | | 65,024,971 | | 63,488,788 | | 234,957 | | | 63,723,745 | | 70,611,301 | | 401,668 | | | 71,012,969 |
Time | | 55,487,784 | | 55,981,239 | | 1,455,113 | | | 57,436,352 | | 65,784,369 | | 1,727,802 | | | 67,512,171 |
Other deposits- | | | | | | | | | | | | | | | | |
Time | | 20,536,152 | | 25,382,875 | | 17,393 | | | 25,400,268 | | 27,943,264 | | 31,030 | | | 27,974,294 |
| | |
| |
| |
|
| |
| |
| |
|
| |
|
| | | 141,048,907 | | 144,852,902 | | 1,707,463 | | | 146,560,365 | | 164,338,934 | | 2,160,500 | | | 166,499,434 |
| | |
| |
| |
|
| |
| |
| |
|
| |
|
MARKETABLE DEBT SECURITIES: | | | | | | | | | | | | | | | | |
Bonds and debentures outstanding | | 28,258,973 | | 22,219,143 | | 174,733 | | | 22,393,876 | | 20,542,654 | | 96,444 | | | 20,639,098 |
Promissory notes and other securities | | 6,123,679 | | 5,129,396 | | — | | | 5,129,396 | | 4,736,576 | | — | | | 4,736,576 |
| | |
| |
| |
|
| |
| |
| |
|
| |
|
| | | 34,382,652 | | 27,348,539 | | 174,733 | | | 27,523,272 | | 25,279,230 | | 96,444 | | | 25,375,674 |
| | |
| |
| |
|
| |
| |
| |
|
| |
|
OTHER LIABILITIES | | 10,764,514 | | 9,656,841 | | 79,064 | | | 9,735,905 | | 9,053,112 | | 89,533 | | | 9,142,645 |
| | |
| |
| |
|
| |
| |
| |
|
| |
|
ACCRUAL ACCOUNTS | | 3,318,727 | | 4,574,114 | | 19,663 | | | 4,593,777 | | 6,638,119 | | 26,955 | | | 6,665,074 |
| | |
| |
| |
|
| |
| |
| |
|
| |
|
PROVISIONS FOR CONTINGENCIES AND EXPENSES : | | | | | | | | | | | | | | | | |
Pension provision | | 3,031,913 | | 2,621,907 | | — | | | 2,621,907 | | 2,358,552 | | — | | | 2,358,552 |
Other provisions | | 2,187,672 | | 2,137,048 | | 84,363 | | | 2,221,411 | | 2,353,557 | | 72,031 | | | 2,425,588 |
| | |
| |
| |
|
| |
| |
| |
|
| |
|
| | | 5,219,585 | | 4,758,955 | | 84,363 | | | 4,843,318 | | 4,712,109 | | 72,031 | | | 4,784,140 |
| | |
| |
| |
|
| |
| |
| |
|
| |
|
NEGATIVE CONSOLIDATION DIFFERENCE | | 38,712 | | 47,554 | | — | | | 47,554 | | 42,744 | | — | | | 42,744 |
| | |
| |
| |
|
| |
| |
| |
|
| |
|
| | | | | | | | | | | | | | | | | |
CONSOLIDATED INCOME FOR THE YEAR: | | | | | | | | | | | | | | | | |
Group | | 2,226,701 | | 1,915,323 | | (196,194 | ) | | 1,719,129 | | 2,062,319 | | (219,249 | ) | | 1,843,070 |
Minority interests | | 670,463 | | 746,918 | | 1 | | | 746,919 | | 645,223 | | — | | | 645,223 |
| | |
| |
| |
|
| |
| |
| |
|
| |
|
| | | 2,897,164 | | 2,662,241 | | (196,193 | ) | | 2,466,048 | | 2,707,542 | | (219,249 | ) | | 2,488,293 |
| | |
| |
| |
|
| |
| |
| |
|
| |
|
SUBORDINATED DEBT | | 7,399,613 | | 6,486,942 | | — | | | 6,486,942 | | 7,610,791 | | — | | | 7,610,791 |
| | |
| |
| |
|
| |
| |
| |
|
| |
|
MINORITY INTERESTS | | 5,425,918 | | 5,674,157 | | 6 | | | 5,674,163 | | 6,394,023 | | 6 | | | 6,394,029 |
| | |
| |
| |
|
| |
| |
| |
|
| |
|
CAPITAL STOCK | | 1,565,968 | | 1,565,968 | | — | | | 1,565,968 | | 1,565,968 | | — | | | 1,565,968 |
| | |
| |
| |
|
| |
| |
| |
|
| |
|
ADDITIONAL PAID-IN CAPITAL | | 6,273,901 | | 6,512,797 | | — | | | 6,512,797 | | 6,834,941 | | — | | | 6,834,941 |
| | |
| |
| |
|
| |
| |
| |
|
| |
|
RESERVES | | 971,477 | | 771,484 | | — | | | 771,484 | | 1,419,218 | | — | | | 1,419,218 |
| | |
| |
| |
|
| |
| |
| |
|
| |
|
REVALUATION RESERVES | | 176,281 | | 176,281 | | — | | | 176,281 | | 176,281 | | — | | | 176,281 |
| | |
| |
| |
|
| |
| |
| |
|
| |
|
RESERVES AT CONSOLIDATED COMPANIES | | 6,096,616 | | 6,150,595 | | 314,681 | | | 6,465,276 | | 5,240,646 | | 234,208 | | | 5,474,854 |
| | |
| |
| |
|
| |
| |
| |
|
| |
|
TOTAL LIABILITIES AND EQUITY | | 287,149,823 | | 276,554,345 | | 2,987,853 | | | 279,542,198 | | 304,965,037 | | 4,097,044 | | | 309,062,081 |
| | |
| |
| |
|
| |
| |
| |
|
| |
|
| (*) | Brasil does not belong to BBVA Group as of December 31, 2003 |
F-142
The contribution of BBV Brasil to the Group’s consolidated statement of income based on spanish gaap during 2002 and 2001 is as follow:
| | | | | | | | | | | | | | | | | | | | | |
NET INCOME (Thousands of Euros)
| | 2003
| | | 2002
| | | 2001
| |
| | Group BBVA
| | | Group
without
Brazil
| | | BBV
Brasil
Group
| | | Total
| | | Group
without
Brazil
| | | BBV
Brasil
Group
| | | Total
| |
NET INTEREST INCOME | | 6,741,511 | | | 7,503,489 | | | 303,977 | | | 7,807,466 | | | 8,550,389 | | | 273,713 | | | 8,824,102 | |
| | |
|
| |
|
| |
|
| |
|
| |
|
| |
|
| |
|
|
NET FEES | | 3,262,807 | | | 3,609,948 | | | 58,433 | | | 3,668,381 | | | 3,981,014 | | | 56,609 | | | 4,037,623 | |
| | |
|
| |
|
| |
|
| |
|
| |
|
| |
|
| |
|
|
BASIC MARGIN | | 10,004,318 | | | 11,113,437 | | | 362,410 | | | 11,475,847 | | | 12,531,403 | | | 330,322 | | | 12,861,725 | |
| | |
|
| |
|
| |
|
| |
|
| |
|
| |
|
| |
|
|
MARKET OPERATIONS | | 651,504 | | | 743,402 | | | 21,721 | | | 765,123 | | | 473,808 | | | 16,287 | | | 490,095 | |
| | |
|
| |
|
| |
|
| |
|
| |
|
| |
|
| |
|
|
ORDINARY REVENUE | | 10,655,822 | | | 11,856,839 | | | 384,131 | | | 12,240,970 | | | 13,005,210 | | | 346,610 | | | 13,351,820 | |
| | |
|
| |
|
| |
|
| |
|
| |
|
| |
|
| |
|
|
GENERAL ADMINISTRATIVE EXPENSES | | (5,031,056 | ) | | (5,570,412 | ) | | (201,313 | ) | | (5,771,725 | ) | | (6,482,408 | ) | | (242,352 | ) | | (6,724,760 | ) |
Personnel costs | | (3,262,587 | ) | | (3,579,785 | ) | | (117,643 | ) | | (3,697,428 | ) | | (4,100,105 | ) | | (143,269 | ) | | (4,243,374 | ) |
Of which: Pensions | | (134,921 | ) | | (132,624 | ) | | — | | | (132,624 | ) | | (112,474 | ) | | — | | | (112,474 | ) |
Other Administrative Expenses | | (1,768,469 | ) | | (1,990,627 | ) | | (83,670 | ) | | (2,074,297 | ) | | (2,382,303 | ) | | (99,083 | ) | | (2,481,386 | ) |
DEPRECIATION AND AMORTIZATION | | (510,656 | ) | | (598,051 | ) | | (32,970 | ) | | (631,021 | ) | | (709,380 | ) | | (32,437 | ) | | (741,817 | ) |
OTHER OPERATING EXPENSES (NET) | | (219,311 | ) | | (259,976 | ) | | (1,504 | ) | | (261,480 | ) | | (282,055 | ) | | (4,363 | ) | | (286,418 | ) |
| | |
|
| |
|
| |
|
| |
|
| |
|
| |
|
| |
|
|
NET OPERATING INCOME | | 4,894,799 | | | 5,428,400 | | | 148,344 | | | 5,576,744 | | | 5,531,367 | | | 67,458 | | | 5,598,825 | |
| | |
|
| |
|
| |
|
| |
|
| |
|
| |
|
| |
|
|
NET INCOME FROM COMPANIES ACCOUNTED | | 383,312 | | | 31,061 | | | 2,183 | | | 33,244 | | | 389,293 | | | 3,378 | | | 392,671 | |
FOR BY THE EQUITY METHOD | | | | | | | | | | | | | | | | | | | | | |
Share in results of companies accounted for by the equity method | | 702,438 | | | 273,413 | | | 2,183 | | | 275,596 | | | 767,894 | | | 3,931 | | | 771,825 | |
Correction for payment of dividends | | (319,126 | ) | | (242,352 | ) | | — | | | (242,352 | ) | | (378,601 | ) | | (553 | ) | | (379,154 | ) |
AMORTIZATION OF CONSOLIDATION GOODWILL | | (639,349 | ) | | (675,498 | ) | | (3,672 | ) | | (679,170 | ) | | (922,590 | ) | | (220,787 | ) | | (1,143,377 | ) |
NET INCOME ON GROUP TRANSACTIONS | | 553,259 | | | 514,713 | | | (153,717 | ) | | 360,996 | | | 953,987 | | | — | | | 953,987 | |
NET LOAN LOSS PROVISIONS | | (1,276,946 | ) | | (1,693,720 | ) | | (49,618 | ) | | (1,743,338 | ) | | (1,884,822 | ) | | (34,408 | ) | | (1,919,230 | ) |
| | |
|
| |
|
| |
|
| |
|
| |
|
| |
|
| |
|
|
NET SECURITIES WRITEDOWNS | | — | | | 3,366 | | | — | | | 3,366 | | | (42,792 | ) | | — | | | (42,792 | ) |
| | |
|
| |
|
| |
|
| |
|
| |
|
| |
|
| |
|
|
EXTRAORDINARY NET LOSSES | | (102,935 | ) | | (339,889 | ) | | (92,692 | ) | | (432,581 | ) | | (704,243 | ) | | (22,027 | ) | | (726,270 | ) |
| | |
|
| |
|
| |
|
| |
|
| |
|
| |
|
| |
|
|
PRE-TAX PROFIT | | 3,812,140 | | | 3,268,433 | | | (149,172 | ) | | 3,119,261 | | | 3,320,201 | | | (206,387 | ) | | 3,113,814 | |
| | |
|
| |
|
| |
|
| |
|
| |
|
| |
|
| |
|
|
CORPORATE INCOME TAX AND OTHER TAXES | | (914,976 | ) | | (606,192 | ) | | (47,021 | ) | | (653,213 | ) | | (612,659 | ) | | (12,862 | ) | | (625,521 | ) |
| | |
|
| |
|
| |
|
| |
|
| |
|
| |
|
| |
|
|
NET INCOME | | 2,897,164 | | | 2,662,241 | | | (196,193 | ) | | 2,466,048 | | | 2,707,542 | | | (219,249 | ) | | 2,488,293 | |
| | |
|
| |
|
| |
|
| |
|
| |
|
| |
|
| |
|
|
MINORITY INTERESTS | | 670,463 | | | 746,918 | | | 1 | | | 746,919 | | | 645,223 | | | — | | | 645,223 | |
| | |
|
| |
|
| |
|
| |
|
| |
|
| |
|
| |
|
|
NET ATTRIBUTABLE PROFIT | | 2,226,701 | | | 1,915,323 | | | (196,194 | ) | | 1,719,129 | | | 2,062,319 | | | (219,249 | ) | | 1,843,070 | |
| | |
|
| |
|
| |
|
| |
|
| |
|
| |
|
| |
|
|
BBV Brasil Net income has included adjustments of Consolidation.
| (*) | Included “Translation differences” from BBV Brasil transaction. |
F-143
Operating results under Spanish GAAP of discontinued operations associated with BBV Brasil were as follows:
| | | | | | | | | |
| | | 2003
| | | 2002
| | | 2001
| |
| | | (Thousand of euros) | |
Income (loss) from continuing operations before federal and foreign taxes | | 3,812,140 | | | 3,268,433 | | | 3,320,201 | |
Provision (benefit) for federal and foreign taxes | | (914,976 | ) | | (606,192 | ) | | (612,659 | ) |
| | |
|
| |
|
| |
|
|
Income (loss) from continuing operations | | 2,897,164 | | | 2,662,241 | | | 2,707,542 | |
Discontinued operations: | | | | | | | | | |
Income (loss) from operations of discontinued BBV Brasil, S.A. (including federal and foreign taxes charges of €14,821 thousand and 12,862 thousand in 2002 and 2001, respectively, and federal and foreign taxes gains of €8,018 thousand in 2000) | | — | | | 24,443 | | | (219,249 | ) |
Loss on disposal of BBV Brasil, S.A. (including federal and foreign tax charges of €32,200 thousand) | | — | | | (220,636 | ) | | — | |
| | |
|
| |
|
| |
|
|
Income (loss) from discontinued operations | | — | | | (196,193 | ) | | (219,249 | ) |
| | |
|
| |
|
| |
|
|
Net income (loss) | | 2,897,164 | | | 2,466,048 | | | 2,488,293 | |
| | |
|
| |
|
| |
|
|
The losses on disposal under US GAAP of discontinued operations associated with BBV Brasil were €6,877 thousand.
F-144
14. Other Comprehensive Income
SFAS No. 130,Reporting comprehensive income establishes standards for reporting and display of comprehensive income and its components in a full set of general-purpose financial statements.
Comprehensive income is defined as the change in equity of a business enterprise during a period from transactions and other events and circumstances from nonowner sources. It includes all changes in equity during a period except those resulting from investments by owners and distributions to owners.
The accumulated balances of other comprehensive income for the years ended December 31, 2003, 2002 and 2001, were as follows:
| | | | | | | | | | | | |
| | | Foreign
currency
translation
adjustments
| | | Unrealized
gains on
securities
| | | Gains on
Derivative
Instruments
| | | Other
Comprehensive
income
| |
| | | Thousands of Euros | |
Balance as of December 31, 2000 | | (32,346 | ) | | 2,705,918 | | | — | | | 2,673,572 | |
Changes in 2001 | | (593,860 | ) | | (750,748 | ) | | 12,790 | | | (1,331,818 | ) |
| | |
|
| |
|
| |
|
| |
|
|
Balance as of December 31, 2001 | | (626,206 | ) | | 1,955,170 | | | 12,790 | | | 1,341,754 | |
Changes in 2002 | | (1,864,977 | ) | | (1,362,665 | ) | | 72,039 | | | (3,155,603 | ) |
| | |
|
| |
|
| |
|
| |
|
|
Balance as of December 31, 2002 | | (2,491,183 | ) | | 592,505 | | | 84,829 | | | (1,813,849 | ) |
| | |
|
| |
|
| |
|
| |
|
|
Changes in 2003 | | (922,506 | ) | | 1,054,024 | | | (44,786 | ) | | 86,732 | |
| | |
|
| |
|
| |
|
| |
|
|
Balance as of December 31, 2003 | | (3,413,689 | ) | | 1,646,529 | | | 40,043 | | | (1,727,117 | ) |
| | |
|
| |
|
| |
|
| |
|
|
Taxes allocated to each component of other comprehensive income in 2003, 2002 and 2001 were as follows:
F-145
| | | | | | | | | | | | | | | | | | | | | | | | | | | |
| | | 2003
| | | 2002
| | | 2001
| |
| | | Before
Tax
Amount
| | | Tax
expense
or benefit
| | | Net of
tax
amount
| | | Before
Tax
Amount
| | | Tax
expense
or
benefit
| | | Net of tax
amount
| | | Before
Tax
Amount
| | | Tax
expense
or
benefit
| | | Net of tax
amount
| |
| | | Thousands of Euros | |
Foreign currency translations adjustment | | (922,506 | ) | | — | | | (922,506 | ) | | (1,864,977 | ) | | — | | | (1,864,977 | ) | | (593,860 | ) | | — | | | (593,860 | ) |
Unrealized gains on securities: | | | | | | | | | | | | | | | | | | | | | | | | | | | |
Total holding gains arising during the period | | 3,155,883 | | | (1,022,067 | ) | | 2,133,816 | | | (1,316,794 | ) | | 347,268 | | | (969,526 | ) | | (160,049 | ) | | (74,267 | ) | | (234,316 | ) |
Less: reclassification adjustment for gains included in net income | | 1,522,330 | | | (442,538 | ) | | 1,079,792 | | | 604,828 | | | (211,689 | ) | | 393,139 | | | 794,513 | | | (278,081 | ) | | 516,432 | |
| | |
|
| |
|
| |
|
| |
|
| |
|
| |
|
| |
|
| |
|
| |
|
|
Net unrealized gains | | 1,633,553 | | | (579,529 | ) | | 1,054,024 | | | (1,921,622 | ) | | 558,957 | | | (1,362,665 | ) | | (954,562 | ) | | 203,814 | | | (750,748 | ) |
Derivatives Instruments and Hedging Activities | | (72,149 | ) | | 27,363 | | | (44,786 | ) | | 110,830 | | | (38,791 | ) | | 72,039 | | | 19,678 | | | (6,888 | ) | | 12,790 | |
| | |
|
| |
|
| |
|
| |
|
| |
|
| |
|
| |
|
| |
|
| |
|
|
Other comprehensive income | | 638,898 | | | (552,166 | ) | | 86,732 | | | (3,675,769 | ) | | 520,166 | | | (3,155,603 | ) | | (1,528,744 | ) | | 196,926 | | | (1,331,818 | ) |
| | |
|
| |
|
| |
|
| |
|
| |
|
| |
|
| |
|
| |
|
| |
|
|
15. Earnings per share
SFAS No. 128,Earnings per Share, specifies the computation, presentation and disclosure requirements for earnings per share (EPS).
Basic earnings per share is computed by dividing income available to common stockholders (the numerator) by the weighted-average number of common shares outstanding (the denominator), which may include contingently issuable shares where all necessary conditions for issuance have been satisfied. Diluted earnings per share includes the determinants of basic earnings per share and, in addition, gives effect to dilutive potential common shares that were outstanding during the period.
F-146
The computation of basis and diluted earnings per share for the years ended December 31, 2003, 2002 and 2001 is presented in the following table:
| | | | | | | | | |
| | | 2003
| | | 2002
| | | 2001
| |
| | | Thousands of Euros, except per share data | |
Spanish GAAP | | | | | | | | | |
Consolidated net income for the year | | 2,897,164 | | | 2,466,048 | | | 2,488,293 | |
Preferred stock dividends | | (214,449 | ) | | (275,629 | ) | | (315,182 | ) |
Net income attributed to minority interest | | (456,014 | ) | | (471,290 | ) | | (330,041 | ) |
U.S. GAAP | | | | | | | | | |
Consolidated net income for the year | | 2,480,482 | | | 2,621,693 | | | 1,225,938 | |
Preferred stock dividends | | (214,161 | ) | | (275,629 | ) | | (315,182 | ) |
Net income attributed to minority interest | | (360,421 | ) | | (500,318 | ) | | (230,645 | ) |
Convertible bond interest | | — | | | 2 | | | 145 | |
Numerator for basic earnings per share | | | | | | | | | |
Income available to common stockholders (Spanish GAAP) | | 2,226,701 | | | 1,719,129 | | | 1,843,070 | |
Continued operations | | 2,226,701 | | | 1,915,323 | | | 2,062,319 | |
Discontinued operations (Note 32.2.D.13) | | — | | | (196,194 | ) | | (219,249 | ) |
Income available to common stockholders (U.S. GAAP) | | 1,905,900 | | | 1,845,746 | | | 680,111 | |
Continued operations | | 1,905,900 | | | 2,167,000 | | | 856,128 | |
Discontinued operations (Note 32.2.D.13) | | — | | | (321,254 | ) | | (176,017 | ) |
Numerator for diluted earnings per share | | | | | | | | | |
Income available to common stockholders (Spanish GAAP) | | 2,226,701 | | | 1,719,131 | | | 1,843,215 | |
Continued operations | | 2,226,701 | | | 1,915,325 | | | 2,062,464 | |
Discontinued operations (Note 32.2.D.13) | | — | | | (196,194 | ) | | (219,249 | ) |
Income available to common stockholders (U.S. GAAP) | | 1,905,900 | | | 1,845,748 | | | 680,256 | |
Continued operations | | 1,905,900 | | | 2,167,002 | | | 856,273 | |
Discontinued operations (Note 32.2.D.13) | | — | | | (321,254 | ) | | (176,017 | ) |
Denominator for basic earnings per share | | 3,195,852,043 | | | 3,196,503,149 | | | 3,199,072,510 | |
Denominator for diluted earnings per share | | 3,197,130,013 | | | 3,196,988,724 | | | 3,200,402,373 | |
Spanish GAAP | | | | | | | | | |
Basic earnings per share (Euros) | | 0.697 | | | 0.538 | | | 0.576 | |
Continued operations | | 0.697 | | | 0.599 | | | 0.645 | |
Discontinued operations (Note 32.2.D.13) | | 0.000 | | | (0.061 | ) | | (0.069 | ) |
Diluted earnings per share (Euros) | | 0.696 | | | 0.538 | | | 0.576 | |
Continued operations | | 0.696 | | | 0.599 | | | 0.645 | |
Discontinued operations (Note 32.2.D.13) | | 0.000 | | | (0.061 | ) | | (0.069 | ) |
U.S. GAAP after restatement (2000) | | | | | | | | | |
Basic earnings per share (Euros) | | 0.596 | | | 0.577 | | | 0.213 | |
Continued operations | | 0.596 | | | 0.678 | | | 0.268 | |
Discontinued operations (Note 32.2.D.13) | | 0.000 | | | (0.101 | ) | | (0.055 | ) |
Diluted earnings per share (Euros) | | 0.596 | | | 0.577 | | | 0.213 | |
Continued operations | | 0.596 | | | 0.678 | | | 0.268 | |
Discontinued operations (Note 32.2.D.13) | | 0.000 | | | (0.101 | ) | | (0.055 | ) |
| | |
|
| |
|
| |
|
|
F-147
16. FIN 45
In November 2002, the FASB issued Interpretation No. 45,Guarantor’s Accounting and Disclosure Requirements for Guarantees, Including Indirect Guarantees of Indebtedness of Others (FIN 45). This interpretation requires certain disclosures to be made by a guarantor in its interim and annual financial statements about its obligations under certain guarantees that it has issued. It also requires a guarantor to recognize, at the inception of a guarantee, a liability for the fair value of the obligation undertaken in issuing the guarantee. The initial recognition and measurement provisions of this Interpretation are applicable on a prospective basis to guarantees issued or modified after December 31, 2002. The disclosure requirements are effective for financial statements for periods ending after December 15, 2002.
Note 26 to the financial statements contains disclosures about our contingent liabilities and commitments. According to Spanish GAAP, these amounts are recorded in off balance sheet memorandum accounts. Memorandum accounts under Spanish GAAP are not included in the balance sheet and basically consist of disclosures of maximum potential amounts.
According to Bank of Spain regulations, all outstanding contingent liabilities and commitments that might in the future affect the net worth of the Bank should be recorded in memorandum accounts. These amounts represent the maximum principal which the Bank may be required to disburse and the maximum potential exposure if all such obligations were ultimately to become worthless. These include, principally, commercial and stand-by letters of credit, bankers acceptances, loan commitments and guarantees.
Under Spanish GAAP, if any fees are received at the inception of these guarantees, the total amounts are recorded in the caption “Other Liabilities” and are amortized and recognized into income over the lives of the contracts. Such treatment is consistent with what is required under FIN 45 (par. 9.a.).
In addition, under Spanish GAAP, obligations reflected in memorandum accounts which fall within the scope of FIN 45 are evaluated in terms of credit and country risks, following criteria analogous to those described in Note 9.1 “Impairment – allowance for loan losses”, which substantially meet SFAS 5 provisions, and a liability is recorded accordingly.
When a guarantee is issued by the Bank as part of a transaction with multiple elements with an unrelated party (i.e. embedded in other contracts), the fair value of such guarantee is recorded as a liability at the inception. The fair value is estimated using the net present value of expected future payments.
Based on the discussions above, accounting criteria under Spanish GAAP for treatment of contingent liabilities do not differ significantly from that required by FIN 45 under US GAAP. Therefore, we believe that the adoption of FIN 45 will not have a material impact on the Bank’s financial position or results of operations.
F-148
17. New Accounting Standards
In January 2003, the FASB issued Interpretation No. 46,Consolidation of Variable Interest Entities—an interpretation of ARB No. 51 (FIN 46). In December 2003, the FASB issued Interpretation No 46-RConsolidation of Variable Interest Entities. FIN 46 and FIN 46-R clarify the application of Accounting Research Bulletin No. 51, Consolidated Financial Statements, to certain entities in which equity investors do not have the characteristics of a controlling financial interest or do not have sufficient equity at risk for the entity to finance its activities without additional subordinated financial support from other parties. FIN 46 and FIN 46–R explain how to identify variable interest entities and how an enterprise assesses its interests in a variable interest entity to decide whether to consolidate that entity. It requires existing unconsolidated variable interest entities to be consolidated by their primary beneficiaries if the entities do not effectively disperse risks among parties involved. It also requires certain disclosures by the primary beneficiary of a variable interest entity and by an enterprise that holds significant variable interests in a variable interest entity where the enterprise is not the primary beneficiary.
The mandatory effective dates of FIN 46-R for enterprises with variable interests in variable interest entities created before February 1, 2003, given certain year-end and frequency of reporting assumptions, are basically for periods beginning January 1, 2004 for SPEs and for periods ending December 31, 2004 provided that no interim financial statements reconciled to US GAAP are being filed semi-annually. However, FIN 46-R must be applied to variable interest entities created after February 1, 2003 in the consolidated Financial Statements as of December 31, 2003.
BBVA Group created a variable interest entity, BBVA Capital Finance, S.A.U. in November 2003. Additionally, BBVA Capital Finance, S.A. issued €350,000 thousand of preferred stock (see Note 22). Following the effective rules of FIN 46-R, BBVA applied FIN 46-R to BBVA Capital Finance, S.A.U. As required by FIN-46-R, BBVA does not consolidate Capital Finance, S.A.U because Banco Bilbao Vizcaya Argentaria, S.A. is not the primary beneficiary.
Therefore, €350,000 thousand of preferred stock issued by BBVA Capital Finance, S.A.U. in December 2003 have been reclassified from “Minority Interest” caption in the Primary Financial Statements (see Note 22) to “Long Term Debt” caption in the Consolidated Balance Sheet under US GAAP disclosed in note 32.2.C.2. Additionally, €288 thousand of dividends of preferred stock have been reclassified from “Minority Interest” caption in the Primary Financial Statements (see Note 22) to “Time Deposits” caption in the Consolidated Balance Sheet under US GAAP disclosed in note 32.2.C.2.
In the Statement of Income disclosed in note 32.2.C.2, €288 thousands should be reclassified from “Minority shareholder’s interest” caption in the Primary Financial Statements to “Interest on long term debt” caption.
The Bank is still in process of analyzing the effect, if any, of the application of FIN 46 R to those variable entities created before February 1, 2003. The Bank considers the effective date FIN 46-R for variable interest entities created before February, 1, 2003 as December 31, 2004.
In May 2003, the FASB issued SFAS No. 150,Accounting for Certain Financial Instruments with Characteristics of Both Liabilities and Equity. This Statement establishes standards for how an issuer classifies and measures certain financial instruments with characteristics of both liabilities and equity. It requires that an issuer classify a financial instrument that is within its scope as a liability (or an asset in some circumstances). Many of those instruments were previously classified as equity. Specifically, this Statement requires an issuer to classify the following instruments as liabilities (or assets in some circumstances): (1) a financial instrument issued in the form of shares that is mandatorily redeemable, (2) a financial instrument, other than an outstanding share, that, at inception, embodies an obligation to repurchase the issuer’s equity shares, or is indexed to such an obligation, and that requires or may require the issuer to settle the obligation by transferring assets, (3) a financial instrument that embodies an unconditional obligation, or a financial instrument other than an outstanding share that embodies a conditional obligation, that the issuer must or may settle by issuing a variable number of its equity shares, if, at inception, the monetary value of the obligation is based solely or predominantly on certain specified criteria.
SFAS No. 150 is effective for financial instruments entered into or modified after May 31, 2003, and otherwise is effective at the beginning of the first interim period beginning after June 15, 2003. The Statement is to be implemented by reporting the cumulative effect of a change in an accounting principle for financial instruments created before its issuance date and still existing at the beginning of the interim period of adoption. Restatement is not permitted.
FASB Staff Position 150-3“Effective Date, Disclosures, and Transition for Mandatorily Redeemable Financial Instruments of Certain Nonpublic Entities and Certain Mandatorily Redeemable Noncontrolling Interests under FASB Statement No. 150”. FSP 150-3 defers the effective date of Statement 150 for certain mandatorily redeemable noncontrolling interests (of all entities, public and nonpublic) that would not have to be classified as liabilities by the subsidiary, under the “only upon liquidation” exception in paragraph 9 of Statement 150, but would be classified as liabilities by the parent in consolidated financial statements, the classification and measurement provisions of Statement 150 are deferred indefinitely pending further Board action.
The Group, see Note 22, issued various noncumulative, nonvoting, preferred stock guaranteed by Banco Bilbao Vizcaya Argentaria, S.A., the parent company. These issues were subscribed by third parties outside the Group and are wholly or partially redeemable at the Company’s option after five or ten years from the issue date, depending on the terms of each issue. According to SFAS 150, as redemption of preferred stock is required upon liquidation or termination of the issuers (BBVA subsidiaries) this Statement does require the obligation to report preferred stock as a liability in the consolidated financial statements of BBVA Group. However, these preferred stocks are included under the Scope of FSP Staff Position 150-3 and therefore, following FSP 150-3, the Group will defer the application of SFAS 150.
If the Group would have applied SFAS 150 to all preferred stocks or would have applied FIN 46-R to variable interest entities issuers of preferred stock the impact on financial statements would be as follows:
| | • | all preferred stock issued by the Group would be classified as liabilities, or |
| | • | all variable entities issuers of preferred stock would be deconsolidated |
It would mean a reclassification amounting to €3,541,094 thousands in the consolidated balance sheet (see note 32.2.C.2) from “Minority Interest” caption to “Time Deposits” caption. The dividends paid by the preferred stock amounting to €214,161 thousands, should be reclassified in the consolidated balance sheet (see note 32.2.C.2) from “Minority Interest” caption to “Time Deposits” caption
In the Statement of Income (see note 32.2.C.2), €214,161 thousands should be reclassified from “Minority shareholder’s interest” caption to “Interest on Deposits” caption.
The effect of the application of SFAS 150 or FIN 46-R on the “Earnings per Share” (see note 32.2.B.15) as of December 31, 2003, would be as follows:
| | |
| | | E.P.S (*)
|
Spanish GAAP | | |
Basic earnings per share (Euros) | | 0.697 |
Diluted earnings per share (Euros) | | 0.696 |
| |
U.S. GAAP | | |
Basic earnings per share (Euros) | | 0.596 |
Diluted earnings per share (Euros) | | 0.596 |
| (*) | If SFAS 150 would have been applied. |
Emerging Issue Task Force issued in July 2003 EITF 03-01 “The Meaning of Other-Than-Temporary Impairment and Its Application to Certain Investments”.The issue is to determine the meaning of other-than-temporary impairment and its application to investments classified as either available-for-sale or held-to-maturity under Statement 115 (including individual securities and investments in mutual funds), and investments accounted for under the cost method or the equity method. The application of EITF 03-01 did not have any impact on the financial statements.
F-149
18. Consolidated Statements of Cash-Flows-
The following combined statements of cash flows for 2003, 2002 and 2001, are presented in connection with U.S. Statement of Financial Accounting Standards No. 95 and reflect the adoption of U.S. Statement of Financial Accounting Standards No. 104.
| | | | | | | | | |
| | | Year ended December 31,
| |
| | | 2003
| | | 2002
| | | 2001
| |
| | | (Thousands of Euros) | |
Cash Flows from Operating Activities:(a) | | | | | | | | | |
| | | |
Net income | | 1,905,900 | | | 1,845,746 | | | 680,111 | |
Adjustments to reconcile net income to net cash provided by operating activities: | | | | | | | | | |
Amortization and depreciation | | 570,600 | | | 1,215,117 | | | 2,833,738 | |
Provision for loan losses and special reserves | | 2,799,467 | | | 2,846,444 | | | 2,986,843 | |
Net decrease (increase) in trading securities | | (1,168,086 | ) | | (8,284,485 | ) | | (16,424,080 | ) |
Gains on sale of premises and equipment | | (55,497 | ) | | (154,054 | ) | | (313,794 | ) |
Gains on sale of investment securities and affiliated companies securities | �� | (908,927 | ) | | (822,678 | ) | | (1,022,101 | ) |
Minority interests | | 574,582 | | | 775,947 | | | 645,223 | |
Increase (Decrease) in taxes payable | | (444,677 | ) | | (648,204 | ) | | 893,165 | |
Net decrease (increase) in interest receivable and payable and other accrued income and expenses | | (17,083 | ) | | 690,734 | | | (973,759 | ) |
| | |
|
| |
|
| |
|
|
Net cash provided by operating activities | | 3,256,279 | | | (2,535,433 | ) | | (10,694,654 | ) |
| | |
|
| |
|
| |
|
|
Cash Flows from Investing Activities: | | | | | | | | | |
| | | |
Net decrease (increase) in interest bearing with banks | | 2,676,783 | | | 40,567 | | | 8,062,337 | |
Net decrease in securities purchased under agreements to resell | | (3,866,116 | ) | | 2,481,524 | | | 2,264,637 | |
Purchase of investment securities and affiliated companies | | (5,761,158,834 | ) | | (6,284,522,879 | ) | | (5,076,408,085 | ) |
Proceeds from sales of investment securities and affiliated companies | | 5,760,759,283 | | | 6,307,517,713 | | | 5,085,094,538 | |
Net increase in loans and leases | | (6,592,936 | ) | | 8,459,773 | | | (15,371,997 | ) |
Purchase of premises and equipment | | (1,086,698 | ) | | (1,142,896 | ) | | (1,770,975 | ) |
Proceeds from sales of premises and equipment | | 391,840 | | | 722,828 | | | 1,712,577 | |
Other investing activities | | 333,844 | | | 366,532 | | | (1,632,907 | ) |
| | |
|
| |
|
| |
|
|
Net cash used in investing activities | | (8,542,834 | ) | | 33,923,162 | | | 1,950,125 | |
| | |
|
| |
|
| |
|
|
Cash Flows from Financing Activities: | | | | | | | | | |
| | | |
Net increase (decrease) in non-interest-bearing deposits | | (2,395,593 | ) | | 215,151 | | | 158,305 | |
Net increase in demand deposits | | (1,959 | ) | | (5,589,469 | ) | | 450,104 | |
Net increase in savings deposits | | 2,064,080 | | | (3,185,322 | ) | | 6,735,783 | |
Net increase (decrease) in time deposits | | (5,156,727 | ) | | (15,802,230 | ) | | (6,856,641 | ) |
Net increase in other Bank of Spain and Deposit Guarantee Fund | | 5,965,321 | | | 4,805,580 | | | 1,635,748 | |
Net increase in short-term borrowings | | 544,841 | | | (389,711 | ) | | 6,317,263 | |
Proceeds from issuance of long-term debt | | 11,304,197 | | | — | | | (3,253,057 | ) |
Repayment of long-term debt | | (5,160,119 | ) | | (6,249,660 | ) | | 5,030,526 | |
Other financing activities | | (907,090 | ) | | (4,793,970 | ) | | (90,740 | ) |
Dividends paid | | (1,108,492 | ) | | (1,252,870 | ) | | (1,100,240 | ) |
| | |
|
| |
|
| |
|
|
Net cash provided by financing activities | | 5,148,459 | | | (32,242,501 | ) | | 9,027,051 | |
| | |
|
| |
|
| |
|
|
Net increase in cash and due from banks | | (138,096 | ) | | (854,772 | ) | | 282,522 | |
| | |
|
| |
|
| |
|
|
Cash and due from banks at beginning of the year(b) | | 2,999,817 | | | 3,854,589 | | | 3,572,067 | |
Cash and due from banks at end of the year(b) | | 2,861,721 | | | 2,999,817 | | | 3,854,589 | |
| (a) | The cash paid by the Company for interest and income taxes during 2003, 2002 and 2001 was as follows: |
| | | | | | | |
| | | 2003
| | 2002
| | | 2001
|
| | | Thousands of Euros |
Interest expense | | 6,103,750 | | 9,024,465 | | | 14,005,475 |
Income taxes | | 167,155 | | (580,991 | ) | | 1,202,079 |
| (b) | For purposes of the statement of cash flows, the Group considers as cash and cash equivalents the cash on hand and at banks. |
F-150
During 2003, the most important non-cash transactions made by the Group were the transfers of loans to assets acquired through foreclosure amounting €144,619 thousand, approximately.
During 2002, the most important non-cash transactions made by the Group were the transfers of loans to assets acquired through foreclosure amounting €237,895 thousand, approximately.
During 2001, the most important non-cash transactions made by the Group were the transfers of loans to assets acquired through foreclosure amounting €544,475 thousand, approximately.
19. SFAS 140- Accounting For The Transfers And Servicing Of Financial Assets And Extinguishments Of Liabilities
In September 2000, the Financial Accounting Standards Board issued Statement No. 140 (“SFAS 140”),Accounting For The Transfers And Servicing Of Financial Assets And Extinguishments Of Liabilities, which replaces SFAS 125 (of the same title). SFAS 140 revises certain standards in the accounting for securitizations and other transfers of financial assets and collateral, and requires some disclosures relating to securitization transactions and collateral, but it carries over most of SFAS 125’s provisions. As explained in note 32.2.A the accounting of transfer of Financial Assets under Spanish GAAP does not present significant differences with respect to US GAAP.
Under Spanish GAAP securitizations are accounted for following the “transfer of financial assets” rules. During 2003, 2002 and 2001 the Group transferred loans to securizitation funds (See Note 8).
Securitization funds (the vehicle where securitized loans are transferred) are independent entities, from BBVA Group. These funds, which are managed by the “Sociedad Gestora” (Managing Society), are registered and regulated by the Comisión Nacional del Mercado de Valores (CNMV). “Sociedad Gestora” is responsible for the management of the transferred loans by gathering a fixed fee.
The “Managing society” is usually controlled by BBVA, however control of BBVA over it does not affect control over the transferred assets. It is considered that control over the financial assets has been surrendered since: (1) there is no agreement that both entitles and obligates the transferor to repurchase o redeem them before their maturity and (2) BBVA does not have the ability to unilaterally cause the holder to return specific assets Activities of the securitization funds are limited and specified in the legal document that established the fund.
Securitizations fund may only held:
| | • | Financial assets transferred to it that are passive in nature (loans) |
| | • | Passive derivative financial instruments that pertain to beneficial interests (other than another derivative financial instrument) issued or sold to parties other than the transferor, its affiliates, or its agents. |
| | • | Financial assets (for example, guarantees or rights to collateral) that would reimburse it if others were to fail to adequately service financial assets transferred to it or to timely pay obligations due to it and that it entered into when it was established, when assets were transferred to it, or when beneficial interests (other than derivative financial instruments) were issued by the SPE. All the guarantees relating to the transferred loans are transferred to the securitization funds. |
| | • | Servicing rights related to financial assets that it holds |
| | • | Temporarily, nonfinancial assets obtained in connection with the collection of financial assets that it holds |
| | • | Cash collected from assets that it holds and investments purchased with that cash pending distribution to holders of beneficial interests that are appropriate for that purpose (that is, money-market or other relatively risk-free instruments without options and with maturities no later than the expected distribution date). |
All the conditions described above allows us to consider securitization funds as Qualified SPE under US GAAP with the exception of the following funds:
| | • | BCL Municipios I Fondo de Titulización de activos and, |
| | • | Hipotecario 2 Fondo de Titulización Hipotecaria. |
These two funds do not meet the conditions of true sale since the bank holds the majority of the beneficial interest issued.
No gains or losses were registered in earnings for all securitizations because the selling price was equal to the book value of transferred loans. Therefore no adjustment was made in reconciliation to US GAAP.
The outstanding balance of the transferred loans as of December 31, 2003 and the total interest accrued during the year 2003 amounts to:
| | | | | | | | |
| | | Thousand of Euros
| |
| | | Qualified SPE
| | | Non Qualified
SPE
| | TOTAL
| |
Loans | | 2,020,887 | | | 1,263,523 | | 3,284,410 | |
Allowance for loan losses | | (903 | ) | | — | | (903 | ) |
Net loans | | 2,019,984 | | | 1,263,523 | | 3,283,507 | |
Interest Revenues | | 73,604 | | | 49,358 | | 122,962 | |
The roll forward of “Allowance for loans losses” in 2003, was as follows:
| | |
| | | Thousand of Euros
|
Beginning Balance | | — |
Net charge for the year | | 903 |
Transfer to loans write-off | | — |
Other | | — |
Ending Balance | | 903 |
F-151
(32.2.C) CONSOLIDATED FINANCIAL STATEMENTS
1. Differences relating to the financial statements presentation-
In addition to differences between Spanish and U.S. GAAP, described above in Note 32.2.B, affecting to net income and/or Stockholders’ Equity, there are several differences relating to the financial statements presentation exist between Spanish and U.S. GAAP presentation following the formatting guidelines in Regulation S-X of the Securities and Exchange Commission of the United States. Although these differences do not cause differences between Spanish and U.S. GAAP reported net income and/or Stockholders’ Equity. It may be useful to understand them to better interpret the Group’s financial statements presented in accordance with U.S. GAAP. Following is a summary of the significant classification differences that pertain to the basic financial statements.
Balance Sheet-
| | a. | The captions “Cash on hand and deposit at central banks”, “Due from credit institutions” and “Total Net Lending” (see Notes 7 and 8) include securities purchased under agreements to resell to central banks, financial institutions and other customers, respectively. |
Under U.S. GAAP, “Securities purchased under agreement to resell” are presented as a separate item.
| | b. | Investments in debt securities issued by the Spanish Government, other public and private issuers and investments in equity securities (other than investments in affiliated companies) are presented as separate items in the balance sheet. |
F-152
Under U.S. GAAP, investments in debt and equity securities (other than investments in affiliated companies) are presented under the caption “Investment securities”.
In this caption the following adjustments due to reconciliation in Note 32.2.B are included:
1. “Elimination of over-depreciation relating to restated fixed assets, recognition of additional profits on the sale and disposal of restated items” (see note 32.2.B.2.1), this adjustment supposes a decrease of these assets amounted to €3,029 thousand, in 2003 and 2002.
2. “Effect of following the equity method of accounting for investments in affiliated companies” (see note 32.2.B.3), this adjustment supposes an increase of these assets amounted to €3,638,685 thousand and €4,867,546 thousand in 2003 and 2002, respectively.
3. “Valuation of investment securities (equity securities)” (see note 32.2.B.9), this adjustment supposes an increase of these assets amounted to €2,135,981 thousand and €754,378 thousand in 2003 and 2002, respectively.
4. “Valuation of investment securities (debt securities)” (see note 32.2.B.9), this adjustment supposes an increase of these assets amounted to €69,160 thousand and €355,606 thousand in 2003 and 2002, respectively.
5. “Derivative instruments and hedging activities (SFAS 133)” (see note 32.2.B.11), this adjustment supposes an increase of these assets amounted to €58,359 thousand and €130,508 thousand in 2003 and 2002, respectively.
6. “Amortization of surplus allocated to specific assets and liabilities” (see note 32.2.B.1), this adjustment supposes an increase of these assets amounted to €29,035 thousand and €71,954 thousand in 2003 and 2002, respectively.
| c. | In the caption “Total loans and leases, net of unearned income” the following adjustments due to reconciliation in Note 32.2.B are included: |
1. “Employee loans issued to purchase shares of capital Stock” (see note 32.2.B.8), this adjustment supposes a decrease of these assets amounted to €1,766 thousand and €2,479 thousand in 2003 and 2002, respectively.
2. “Amortization of surplus allocated to specific assets and liabilities” (see note 32.2.B.1), this adjustment supposes an increase of these assets amounted to €465,642 thousand and €521,699 thousand in 2003 and 2002, respectively.
3. “Allowance for loan losses” (see note 32.2.B.7), this adjustment supposes a decrease of these assets amounted to €303,053 thousand in 2003.
| d. | In the caption “Premises and equipment” the following adjustments due to reconciliation in Note 32.2.B are included: |
1. “Elimination of over-depreciation relating to restated fixed assets, recognition of additional profits on the sale and disposal of restated items” (see note 32.2.B.2.1), this adjustment supposes a decrease of these assets amounted to €313,082 thousand and €363,059 thousand in 2003 and 2002, respectively.
2. “Elimination of the inflation adjustment in non highly inflationary countries” (see note 32.2.B.2.2), this adjustment supposes a decrease of these assets amounted to €431,496 thousand and €269,039 thousand in 2003 and 2002, respectively.
| e. | Under spanish GAAP investments in affiliated companies are presented under “Investments in non-Group companies” and “Investments in Group companies” (see Notes 11 and 12). The goodwill related to investments in affiliated companies is presented under “Consolidation Goodwill- Companies accounted by the equity method” caption. |
Under U.S. GAAP, these investments and the goodwill are presented under “Investments in affiliated companies”.
F-153
In this caption the following adjustments due to reconciliation in Note 32.2.B are included:
1. “Effect of following the equity method of accounting for investments in affiliated companies” (see note 32.2.B.3), this adjustment supposes a decrease of these assets amounted to €3,157,004 thousand and €3,943,299 thousand in 2003 and 2002, respectively.
2. “Valuation of investment securities (equity securities)” (see note 32.2.B.9), this adjustment supposes a decrease of these assets amounted to €5,892 thousand and €4,053 thousand in 2003 and 2002, respectively.
| f. | Assets acquired through foreclosure and waiting disposition, net of the related allowances, are included under “Property and Equipment” in the balance sheet (see Note 14). |
Under U.S. GAAP, such assets are presented under “Other assets”.
| g. | “Treasury stock” is presented as separate asset items in the balance sheet. Under U.S. GAAP it is reported as a reduction of “Other additional capital”. |
| h. | The interim dividends are presented under the “Other Assets” caption under Spanish GAAP. Under U.S. GAAP, such item is reported as a reduction of “Retained earnings”. |
| i. | “Accumulated losses at consolidated companies” is presented as a separate item in the balance sheet. Under U.S. GAAP it is presented as a reduction of “Retained earnings” and “Other additional capital”. |
| j. | The “Other assets” caption on the asset side of the U.S. GAAP balance sheet includes the main portion of the following Spanish GAAP captions: “Intangible assets”, “Consolidation Goodwill—Fully and proportional consolidated companies”, “Other assets” and “Accrual accounts”. |
In the caption “Intangible assets” the following adjustments due to reconciliation in Note 32.2.B are included:
1. “Expenses of capital increase” (see note 32.2.B.10), this adjustment supposes a decrease of these assets amounted to €32,302 thousand and €53,051 thousand in 2003 and 2002, respectively.
2. “Start up expenses” (see note 32.2.B.10), this adjustment supposes a decrease of these assets amounted to €19,537 thousand and €98,460 thousand in 2003 and 2002, respectively.
In the caption “Goodwill in consolidation” the following adjustments due to reconciliation in Note 32.2.B are included:
1. “Accounting of Goodwill” (see note 32.2.B.5), this adjustment supposes a decrease of these assets amounted to €259,637 thousand and €179,129 thousand in 2003 and 2002, respectively.
2. “Amortization of remaining Goodwill merger Argentaria” (see note 32.2.B.1), this adjustment supposes an increase of these assets amounted to €5,332,924 thousand in 2003 and 2002, respectively.
In the caption “Others” the following adjustments due to reconciliation in Note 32.2.B are included:
1. “Pensions plan cost and early retirements” (see note 32.2.B.4.1), this adjustment supposes an increase of these assets amounted to €134,307 thousand and €146,516 thousand in 2003 and 2002, respectively.
2. “Effect of following the equity method of accounting for investments in affiliated companies” (see note 32.2.B.3), this adjustment supposes a decrease of these assets amounted to €904,738 thousand and €1,204,344 in 2003 and 2002, respectively.
3. “Tax effect of above mentioned adjustments” and “Effect of following SFAS 109 in the accounting for income taxes for each year” (see note 32.2.B.12), these adjustments suppose a decrease of these assets amounted to €225,077 thousand and €40,396 thousand in 2003 and 2002, respectively.
F-154
4. “Amortization of surplus allocated to specific assets and liabilities” (see note 32.2.B.1), this adjustment supposes an increase of these assets amounted to €17,172 thousand and €22,007 thousand in 2003 and 2002, respectively.
5. “Derivative instruments and hedging activities” (SFAS 133) (see note 32.2.B.11), these adjustments suppose an increase of these assets amounted to €90,618 thousand in 2003, and a decrease of these assets amounted to €120,962 thousand in 2002.
6. “ BBV Brasil transaction” (see note 32.2.B.13), this adjustment supposes a decrease of these assets amounted to €56,186 in 2002.
| k. | In the caption “Time Deposits”, in 2003, applies the adjustment “Application of SFAS No. 150” (see note 32.2.B.17) which supposes an increase of these liabilities amounted to €350,000 thousand. |
| l. | Funds from credit institutions (see Note 17) and from customers (see Note 18), both including securities sold under agreements to repurchase and other short-term borrowings, are presented as separate items in the balance sheet. |
Under U.S. GAAP, such funds are presented under “Deposits” classified by nature, except securities sold under agreements to repurchase and other short-term borrowings, which are presented under the caption “Short term borrowings”.
| m. | The captions “Marketable debt securities” and “Subordinated debt” disclosed in the balance sheet under Spanish GAAP are presented under the caption “Long term debt” under U.S. GAAP, except the item “Promissory Notes and other securities” and bonds and debentures outstanding with maturity in 2004 and 2003 which are included under the “Short term borrowings” caption. |
In the caption “Long term debt”, the adjustment “Amortization of surplus allocated to specific assets and liabilities” (see note 32.2.B.1) is included. This adjustment supposes an increase of these liabilities amounted to €49,058 thousand and €62,873 thousand in 2003 and 2002, respectively.
| n. | The main portion of the following captions in the liability side in the Spanish GAAP balance sheet are presented under the caption “Other liabilities” in the U.S. GAAP balance sheet: “Other liabilities”, “Accrual accounts” and “Provisions for contingencies and expenses”. |
In the caption “Taxes payable”, the adjustment “Amortization of surplus allocated to specific assets and liabilities” (see note 32.2.B.1) is included. This adjustment supposes an increase of these liabilities amounted to €173,681 thousand and €207,778 thousand in 2003 and 2002, respectively.
In the caption “Accrual accounts”, the adjustment “Application of SFAS No. 150” is included and supposes an increase of these liabilities amounted to €288 thousand in 2003.
In the caption “Pension allowance” the adjustment “Pensions plan cost and early retirements” (see note 32.2.B.4.1) is included. This adjustment supposes an increase of these liabilities amounted to €200 thousand and €374 thousand in 2003 and 2002, respectively.
In the caption “Other provision” the adjustment “Termination indemnities” (see note 32.2.B.4.2) is included. This adjustment supposes a decrease of these liabilities amounted to €39,573 thousand and €37,490 thousand in 2003 and 2002, respectively.
In the caption “Others” of the liabilities the following adjustments due to reconciliation in Note 32.2.B are included:
1. “Accounting of goodwill” (see note 32.2.B.5), this adjustment supposes a decrease of these liabilities amounted to €38,712 thousand and €47,554 thousand in 2003 and 2002, respectively.
2. “Effect of following the equity method of accounting for investments in affiliated companies” (see note 32.2.B.3), this adjustment supposes a decrease of these liabilities amounted to €4,093 thousand in 2002.
F-155
3. “Gains on transactions with parent company shares and stock options owned by subsidiaries accounted for as income for the year” (see note 32.2.B.6), this adjustment supposes a decrease of these liabilities amounted to €28,213 thousand and €26,752 thousand in 2003 and 2002, respectively.
4. “Effect of recording the allowance for probable loans and losses” (see note 32.2.B.7), this adjustment supposes a decrease of these liabilities amounted to €1,082,747 thousand and €686,058 thousand in 2003 and 2002, respectively.
5. “Tax effect of above mentioned adjustments” and “Effect of following SFAS 109 in the accounting for income taxes for each year” (see note 32.2.B.11), this adjustment supposes an increase of these liabilities amounted to €768,863 thousand and €275,368 thousand in 2003 and 2002, respectively.
6. “BBV Brasil transaction” (see note 32.2.B.13), this adjustment supposes a decrease of these liabilities amounted to €60,437 thousand in 2002.
| o. | Net income attributed to minority interests is included in the caption “Minority interest” under U.S. GAAP. |
In the caption “Minority interest” the adjustments due to reconciliation in Note 32.2.B suppose a decrease of these liabilities amounted to €646,384 thousand and €123,704 thousand in 2003 and 2002, respectively.
| p. | The following captions in the Spanish GAAP balance sheet are presented under the items “Additional Paid-in capital”, “Other additional capital” and “Retained earnings” in the U.S. GAAP balance sheet: “Net income attributed to the Group”, “Additional paid-in capital”, “Reserves”, “Revaluation reserves” and “Reserves at consolidated companies”, in addition to the captions disclosed above. |
In the caption “Retained earnings and other reserves”, the adjustments due to reconciliation in Note 32.2.B suppose an increase of these liabilities amounted to €6,808,809 thousand and €6,305,348 thousand in 2003 and 2002, respectively.
Statement of Income-
| q. | The breakdown of interest income and interest expense under Spanish and U.S. GAAP is determined by the classification of the assets and liabilities that generate such income and expenses. However, net interest income under Spanish GAAP includes dividends from common stocks and affiliated companies and the interest cost assigned to the pension plan, which are classified as a part of “Gains (losses) from investment securities”, “Gains (losses) from affiliated company securities” and “Salaries and employee benefits” in the U.S. GAAP statement of income, respectively. In the caption “Interest on deposits” in 2003, is included the adjustment “Application of SFAS No. 150” which supposes a decrease of these interests amounted to €288 thousand |
| r. | Commissions and fees received and paid by the Group are presented as separate items in the statement of income for Spanish GAAP purposes. |
Under U.S. GAAP, we separate the main items and then we distinguish each main item between fees received and paid.
| s. | In the caption “Provisions for loans losses” the adjustment “Effect of recording the allowance for probable loans and losses” (see note 32.2.B.7) is included. This adjustment supposes a decrease of these provisions amounted to €93,636 thousand, €226,717 thousand and €196,199 thousand in 2003, 2002 and 2001, respectively. |
| t. | In the caption “Gains (losses) from affiliated companies’ securities” the following adjustments due to reconciliation in Note 32.2.B are included: |
| | 1. | “Effect of following the equity method of accounting for investments in affiliated companies” (see note 32.2.B.3) is included. This adjustment supposes a decrease of these gains amounted to €500,650 thousand, €250,512 thousand and €326,890 thousand in 2003, 2002 and 2001, respectively. |
| u. | “Market operations” includes results from investment securities and results from foreign exchange and derivatives. |
Under U.S. GAAP, such gains and losses are disclosed separately under “Gains (losses) from investment securities” and “Other Income”.
F-156
| v. | In the caption “Gains (losses) from investment securities” of the statement of income the following adjustments due to reconciliation in Note 32.2.B are included: |
1. “Effect of following the equity method of accounting for investments in affiliated companies” (see note 32.2.B.3), this adjustment supposes an increase of income amounted to €163,927 thousand, €73,277 thousand and €151,094 thousand in 2003, 2002 and 2001, respectively.
2. “Valuation of investment securities (equity securities)” (see note 32.2.B.9), this adjustment supposes an decrease of income amounted to €224,155 thousand in 2003, and an increase of income amounted €425,795 thousand and €40,563 thousand in 2002 and 2001, respectively.
3. “Valuation of investment securities (debt securities)” (see note 32.2.B.9), this adjustment supposes a decrease of income amounted to €326,498 thousand in 2003.
4. “Amortization of surplus allocated to specific assets and liabilities” (see note 32.2.B.1), this adjustment supposes a decrease of income amounted to €55,899 thousand, €154,690 thousand and €164,930 thousand in 2003, 2002 and 2001, respectively.
5. “Derivative instruments and hedging activities (SFAS 133)” (see note 32.2.B.11), this adjustment supposes an increase of income amounted to €211,580 thousand in 2003 and a decrease of income amounted to €106,123 thousand and €14,839 in 2002 and 2001 respectively.
| w. | In the caption “Other income” of the statement of income the following adjustments due to reconciliation in Note 32.2.B are included: |
1. “Elimination of over-depreciation relating to restated fixed assets, recognition of additional profits on the sale and disposal of restated items” (see note 32.2.B.2.1), this adjustment supposes an increase of income amounted to €49,978 thousand, €68,360 thousand and €78,824 thousand in 2003, 2002 and 2001, respectively.
2. “Elimination of the inflation adjustment in non highly inflationary countries” (see note 32.2.B.2.2), this adjustment supposes an increase of income amounted to €55,406 thousand in 2003 and a decrease of income amounted to €4,780 thousand and 75,265 in 2002, and 2001, respectively
3. “Gains (losses) from affiliated companies’ securities” (see note 32.2.B.6), this adjustment supposes an increase of income amounted to €23,363 thousand and €24,585 thousand in 2003, and 2002, respectively, and a decrease of income amounted to €13,865 thousand in 2001.
4. “BBV Brasil transaction” (see note 32.2.B.13), this adjustment supposes an increase of these gains amounted to €4,251 thousand in 2002.
| x. | In the caption “Salaries and employee beneficits” of the statement of income the adjustment “Pension plan cost and early retirements” (see note 32.2.B.4.1) is included. This adjustment supposes an increase of expenses amounted to €811,625 thousand, €511,386 thousand and €743,952 thousand in 2003, 2002 and 2001, respectively. |
| y. | In the caption “Amortization of goodwill” of the statement of income the following adjustments due to reconciliation in Note 32.2.B are included: |
1. “Effect of following the equity method of accounting for investments in affiliated companies” (see note 32.2.B.3), this adjustment supposes an increase of income amounted to €228,273 thousand, €117,504 thousand and €114,174 thousand in 2003, 2002 and 2001, respectively.
2. “Accounting of goodwill” (see note 32.2.B.5), this adjustment supposes an increase of income amounted to €402,429 thousand and €203,229 thousand in 2003, and 2002, respectively, and a decrease of income amounted to €391,210 thousand in 2001.
F-157
3. “Amortization of remaining Goodwill Merger Argentaria” (see note 32.2.B.1), this adjustment supposes a decrease of income amounted to €231,029 thousand in 2001.
| z. | In the caption “Net provision for specific allowances” of the statement of income the following adjustments due to reconciliation in Note 32.2.B are included: |
1. “Pension plan cost and early retirements” (see note 32.2.B.4.1), this adjustment supposes an increase of provision amounted to €174 thousand, €432 thousand and €342 thousand in 2003, 2002 and 2001, respectively.
2. “Effect of recording the allowance for probable loans and losses” (see note 32.2.B.7), this adjustment supposes an increase of income amounted to €2,083 thousand in 2003, and a decrease of income amounted to €23,079 thousand and €58,196 thousand in 2002 and 2001, respectively.
| aa. | “Other operating revenue” and “Other operating expenses” items are included under “Other income” and “Other expenses”, respectively in the U.S. GAAP statements of income. |
| bb. | Occupancy and maintenance expenses of premises and equipment are included under the caption “General administrative expenses—General expenses”. |
Under U.S. GAAP, such expenses are included as a part of “Occupancy expenses of premises, depreciation and maintenance”.
| cc. | Amortization of intangible assets is included as a part of “Depreciation and amortization”. |
Under U.S. GAAP, such amortization is included under “Other expenses”.
In the caption “Other expenses” of the statement of income, the following adjustments due to reconciliation in Note 32.2.B are included:
1. “Expenses of capital increase” (see note 32.2.B.10), this adjustment supposes a decrease of expenses amounted to €22,764 thousand, €21,958 thousand and €32,556 thousand in 2003, 2002 and 2001, respectively.
2. “Start up expenses” (see note 32.2.B.10), this adjustment supposes a decrease of expenses amounted to €67,813 thousand and €26,461 thousand in 2003, and 2002, respectively, and an increase of expenses amounted to €82,795 thousand in 2001.
| dd. | The following Spanish GAAP captions relating to operations with affiliated companies “Net income from companies carried by the equity method”, “Income on Group transactions” and “Losses on Group transactions” and the portion of “Amortization of Consolidation Goodwill” related to affiliated companies are included under “Gains (losses) from affiliated company securities” in the U.S. GAAP statement of income. |
U.S. GAAP description of Extraordinary Income is more restrictive than the Spanish GAAP description (non-banking results), for this reason the main portion of “Extraordinary income” and “Extraordinary expenses” in the Spanish GAAP captions are presented under the “Other income” and “Other expenses” captions, respectively, for U.S. GAAP purposes.
In the caption “Minority shareholder’”, the adjustments due to reconciliation in Note 32.2.B suppose a decrease of minority income amounted to €95,881 thousand and €10,577 thousand and €99,393 in 2003 and 2002, respectively.
| ee. | In the caption “Income tax expense” the adjustments “Tax effect of above mentioned adjustments” and “Effect of following SFAS 109 in the accounting for income taxes for each year” (see note 32.2.B.11) are included. These adjustments suppose an increase of expenses amounted to €181,008 thousand in 2003 and a decrease of €25,959 thousand in 2002 and a increase of expenses amounted to €226,867 thousand in 2001. |
F-158
2. Consolidated Financial Statements under Regulation S-X-
Following are the consolidated balance sheets of the BBVA Group as of December 31, 2003, 2002 and 2001 and the consolidated statement of income for each of the years ended December 31, 2003, 2002 and 2001, in the format for banks and bank holding companies required by Regulation S-X of the Securities and Exchange Commission of the United States of America, adjusted for the effects of the extraordinary amortization of goodwill mentioned in Note 2-a, and, accordingly, prepared in accordance with Spanish GAAP (before reconciliation adjustments) and under US GAAP (after reconciliation adjustments described above in Note 32.2.B). The companies consolidated by the proportional method under SP GAAP as described in Note 2-c are not fully consolidated. The effect in the total assets would be less than 1%.
F-159
BANCO BILBAO VIZCAYA ARGENTARIA GROUP
CONSOLIDATED BALANCE SHEETS AS OF DECEMBER 31, 2003, 2002 AND 2001
(Currency—Thousands of Euros)
| | | | | | | | | | | | | | | | | | |
| | | Year ended December 31,
| |
| | | 2003
| | | 2002
| |
| | | Before Reconciliation
adjustments
| | | Adjustments
| | | After Reconciliation
adjustments
| | | Before Reconciliation
adjustments
| | | Adjustments
| | | After Reconciliation
adjustments
| |
Assets | | | | | | | | | | | | | | | | | | |
Cash and due from banks | | 2,861,721 | | | — | | | 2,861,721 | | | 2,998,817 | | | — | | | 2,999,817 | |
Interest-bearing deposits in other banks | | 16,750,009 | | | — | | | 16,750,009 | | | 19,426,792 | | | — | | | 19,426,792 | |
Securities purchased under agreements to resell | | 12,494,089 | | | — | | | 12,494,089 | | | 8,650,080 | | | — | | | 8,650,080 | |
Trading securities | | 27,659,510 | | | 58,359 | | | 27,717,869 | | | 28,101,746 | | | 130,508 | | | 28,232,254 | |
Available for sale | | 46,188,868 | | | 5,869,832 | | | 52,058,700 | | | 41,403,841 | | | 6,046,455 | | | 47,450,296 | |
Held to maturity | | 1,124,655 | | | — | | | 1,124,655 | | | 2,402,860 | | | — | | | 2,402,860 | |
| | |
|
| |
|
| |
|
| |
|
| |
|
| |
|
|
Investments securities(1) (2) | | 74,973,033 | | | 5,928,191 | | | 80,901,224 | | | 71,908,447 | | | 6,176,963 | | | 78,085,410 | |
Loans and leases, net of unearned income | | 151,321,389 | | | 160,823 | | | 151,482,212 | | | 146,031,737 | | | 519,220 | | | 146,550,957 | |
Less: Allowance for loan losses | | (4,614,779 | ) | | — | | | (4,614,779 | ) | | (5,225,291 | ) | | — | | | (5,225,291 | ) |
| | |
|
| |
|
| |
|
| |
|
| |
|
| |
|
|
Net loans and leases(1) | | 146,706,610 | | | 160,823 | | | 146,867,433 | | | 140,806,446 | | | 519,220 | | | 141,325,666 | |
Premises and equipment, net | | 3,628,671 | | | (744,578 | ) | | 2,884,093 | | | 3,750,741 | | | (632,098 | ) | | 3,118,643 | |
Investments in affiliated companies | | 7,689,021 | | | (3,162,896 | ) | | 4,526,125 | | | 8,429,925 | | | (3,947,352 | ) | | 4,482,573 | |
Intangible assets | | 362,028 | | | (51,839 | ) | | 310,189 | | | 398,637 | | | (151,511 | ) | | 247,126 | |
Goodwill in consolidation | | 2,650,889 | | | 5,073,287 | | | 7,724,176 | | | 2,871,545 | | | 5,153,795 | | | 8,025,340 | |
Accrual accounts | | 2,678,279 | | | — | | | 2,678,279 | | | 4,060,846 | | | — | | | 4,060,846 | |
Others | | 10,802,846 | | | (887,718 | ) | | 9,915,128 | | | 11,484,522 | | | (1,253,365 | ) | | 10,231,157 | |
| | |
|
| |
|
| |
|
| |
|
| |
|
| |
|
|
Total other assets | | 16,494,042 | | | 4,133,730 | | | 20,627,772 | | | 18,815,550 | | | 3,748,919 | | | 22,564,469 | |
| | |
|
| |
|
| |
|
| |
|
| |
|
| |
|
|
Total assets | | 281,597,196 | | | 6,315,270 | | | 287,912,466 | | | 274,787,798 | | | 5,865,653 | | | 280,653,451 | |
| | |
|
| |
|
| |
|
| |
|
| |
|
| |
|
|
Liabilities and Stockholders’ Equity | | | | | | | | | | | | | | | | | | |
Liabilities | | | | | | | | | | | | | | | | | | |
Non-interest deposits | | 859,934 | | | — | | | 859,934 | | | 3,255,527 | | | — | | | 3,255,527 | |
Interest bearing: | | | | | | | | | | | | | | | | | | |
Demand deposits | | 43,674,718 | | | — | | | 43,674,718 | | | 43,676,677 | | | — | | | 43,676,677 | |
Savings deposits | | 24,317,731 | | | — | | | 24,317,731 | | | 22,253,652 | | | — | | | 22,253,652 | |
Time deposits | | 81,833,731 | | | 350,000 | | | 82,183,731 | | | 86,902,413 | | | — | | | 86,902,413 | |
| | |
|
| |
|
| |
|
| |
|
| |
|
| |
|
|
Total deposits | | 150,686,114 | | | 350,000 | | | 151,036,114 | | | 156,088,269 | | | — | | | 156,088,269 | |
Due to Bank of Spain & Deposits Guarantee Fund | | 13,792,525 | | | — | | | 13,792,525 | | | 7,827,204 | | | — | | | 7,827,204 | |
Short-term borrowings | | 52,743,315 | | | — | | | 52,743,315 | | | 52,259,883 | | | — | | | 52,259,883 | |
Long-term debt | | 27,234,416 | | | 49,058 | | | 27,283,474 | | | 21,527,246 | | | 62,873 | | | 21,590,119 | |
Taxes payable | | (4,305 | ) | | 173,681 | | | 169,376 | | | 190,532 | | | 207,778 | | | 398,310 | |
Accounts payable | | 981,925 | | | — | | | 981,925 | | | 1,019,553 | | | — | | | 1,019,553 | |
Accrual accounts | | 3,169,674 | | | 288 | | | 3,169,962 | | | 4,434,518 | | | — | | | 4,434,518 | |
Pension allowance | | 3,031,913 | | | 200 | | | 3,032,113 | | | 2,621,906 | | | 374 | | | 2,622,280 | |
Other Provisions | | 2,187,688 | | | (39,573 | ) | | 2,148,115 | | | 2,154,460 | | | (37,490 | ) | | 2,116,970 | |
Others | | 8,903,325 | | | (380,809 | ) | | 8,522,516 | | | 7,640,705 | | | (549,526 | ) | | 7,091,179 | |
| | |
|
| |
|
| |
|
| |
|
| |
|
| |
|
|
Total other liabilities | | 18,270,220 | | | (246,213 | ) | | 18,024,007 | | | 18,061,674 | | | (378,864 | ) | | 17,682,810 | |
| | |
|
| |
|
| |
|
| |
|
| |
|
| |
|
|
Total liabilities | | 262,726,590 | | | 152,845 | | | 262,879,435 | | | 255,764,276 | | | (315,991 | ) | | 255,448,285 | |
Minority interest | | 6,096,381 | | | (646,384 | ) | | 5,449,997 | | | 6,421,082 | | | (123,704 | ) | | 6,297,378 | |
Stockholders’ equity | | | | | | | | | | | | | | | | | | |
Capital stock | | 1,565,968 | | | — | | | 1,565,968 | | | 1,565,968 | | | — | | | 1,565,968 | |
Additional paid-in capital | | 6,273,901 | | | — | | | 6,273,901 | | | 6,512,797 | | | — | | | 6,512,797 | |
Other additional capital | | (1,322,737 | ) | | — | | | (1,322,737 | ) | | (1,003,114 | ) | | — | | | (1,003,114 | ) |
Retained earnings | | 6,257,093 | | | 6,808,809 | | | 13,065,902 | | | 5,526,789 | | | 6,305,348 | | | 11,832,137 | |
Total stockholders’ equity | | 12,774,225 | | | 6,808,809 | | | 19,583,034 | | | 12,602,440 | | | 6,305,348 | | | 18,907,788 | |
| | |
|
| |
|
| |
|
| |
|
| |
|
| |
|
|
Total liabilities and stockholders’ equity | | 281,597,196 | | | 6,315,270 | | | 287,912,466 | | | 274,787,798 | | | 5,865,653 | | | 280,653,451 | |
| (1) | As described in Note 8, as of December 31, 2003, 2002 and 2001, the face amount of the assets, basically loans, credits and securities pledged as security for own and third-party obligations, amounted to €17,367,909 thousand, €18,190,848 thousand and €11,200,566 thousand,respectively. |
| (2) | As of December 31, 2003, this caption includes €227,349 thousand related to securities pledged as collateral by the Group. These securities can be sold or repledged by the transferee. |
F-160
BANCO BILBAO VIZCAYA ARGENTARIA GROUP
CONSOLIDATED STATEMENTS OF INCOME FOR THE YEARS ENDED
DECEMBER 31, 2003, 2002 AND 2001
(Currency—Thousands of Euros)
| | | | | | | | | | | | | | | | | | | | | | | | | | | |
| | | Year ended December 31,
| |
| | | 2003
| | | 2002
| | | 2001
| |
| | | Before
Reconciliation
adjustments
| | | Adjustments
| | | After
Reconciliation
adjustments
| | | Before
Reconciliation
adjustments
| | | Adjustments
| | | After
Reconciliation
adjustments
| | | Before
Reconciliation
adjustments
| | | Adjustments
| | | After
Reconciliation
adjustments
| |
Interest Income | | | | | | | | | | | | | | | | | | | | | | | | | | | |
Interest and fees on loans and leases | | 7,973,146 | | | — | | | 7,973,146 | | | 10,931,783 | | | — | | | 10,931,783 | | | 11,911,050 | | | — | | | 11,911,050 | |
Interest on deposits in other banks | | 679,363 | | | — | | | 679,363 | | | 777,137 | | | — | | | 777,137 | | | 1,375,086 | | | — | | | 1,375,086 | |
Interest on securities purchased under agreements to resell | | 520,468 | | | — | | | 520,468 | | | 629,917 | | | — | | | 629,917 | | | 823,056 | | | — | | | 823,056 | |
Interest on investment securities | | 2,055,666 | | | — | | | 2,055,666 | | | 3,031,386 | | | — | | | 3,031,386 | | | 6,767,438 | | | — | | | 6,767,438 | |
| | |
|
| |
|
| |
|
| |
|
| | | | |
|
| |
|
| | | | |
|
|
| | | | | | | | | | | | | | | | | | | | | | | | | | | | |
Total interest income | | 11,228,643 | | | — | | | 11,228,643 | | | 15,370,223 | | | — | | | 15,370,223 | | | 20,876,630 | | | — | | | 20,876,630 | |
Interest Expense | | | | | | | | | | | | | | | | | | | | | | | | | | | |
Interest on deposits | | (3,517,158 | ) | | (288 | ) | | (3,517,446 | ) | | (6,069,297 | ) | | — | | | (6,069,297 | ) | | (8,477,174 | ) | | — | | | (8,477,174 | ) |
Interest on Bank of Spain & Deposit Guarantee Fund | | (241,323 | ) | | — | | | (241,323 | ) | | (256,433 | ) | | — | | | (256,433 | ) | | (258,393 | ) | | — | | | (258,393 | ) |
Interest on short-term borrowings | | (1,394,721 | ) | | — | | | (1,394,721 | ) | | (2,254,921 | ) | | — | | | (2,254,921 | ) | | (3,135,372 | ) | | — | | | (3,135,372 | ) |
Interest on long term debt | | (1,038,750 | ) | | — | | | (1,038,750 | ) | | (1,096,571 | ) | | — | | | (1,096,571 | ) | | (1,264,638 | ) | | — | | | (1,264,638 | ) |
| | |
|
| |
|
| |
|
| |
|
| | | | |
|
| |
|
| | | | |
|
|
Total interest expense | | (6,191,952 | ) | | (288 | ) | | (6,192,240 | ) | | (9,677,222 | ) | | — | | | (9,677,222 | ) | | (13,135,577 | ) | | — | | | (13,135,577 | ) |
| | |
|
| |
|
| |
|
| |
|
| | | | |
|
| |
|
| | | | |
|
|
Net Interest Income | | 5,036,691 | | | (288 | ) | | 5,036,403 | | | 5,693,001 | | | — | | | 5,693,001 | | | 7,741,053 | | | — | | | 7,741,053 | |
| | |
|
| |
|
| |
|
| |
|
| | | | |
|
| |
|
| | | | |
|
|
Provision for loan losses | | (1,276,946 | ) | | 93,636 | | | (1,183,310 | ) | | (1,743,338 | ) | | 226,717 | | | (1,516,621 | ) | | (1,919,230 | ) | | 196,199 | | | (1,723,031 | ) |
| | |
|
| |
|
| |
|
| |
|
| |
|
| |
|
| |
|
| |
|
| |
|
|
Net Interest Income after provision for loan losses | | 3,759,745 | | | 93,348 | | | 3,853,093 | | | 3,949,663 | | | 226,717 | | | 4,176,380 | | | 5,821,823 | | | 196,199 | | | 6,018,022 | |
| | |
|
| |
|
| |
|
| |
|
| |
|
| |
|
| |
|
| |
|
| |
|
|
Non-interest income | | | | | | | | | | | | | | | | | | | | | | | | | | | |
Contingent liabilities (collected) | | 138,715 | | | — | | | 138,715 | | | 135,595 | | | — | | | 135,595 | | | 136,051 | | | — | | | 136,051 | |
Collection and payments services (collected) | | 1,725,955 | | | — | | | 1,725,955 | | | 1,859,551 | | | — | | | 1,859,551 | | | 1,938,835 | | | — | | | 1,938,835 | |
Securities services (collected) | | 1,643,692 | | | — | | | 1,643,692 | | | 1,923,083 | | | — | | | 1,923,083 | | | 2,330,821 | | | — | | | 2,330,821 | |
Other transactions (collected) | | 374,206 | | | — | | | 374,206 | | | 412,764 | | | — | | | 412,764 | | | 427,909 | | | — | | | 427,909 | |
Ceded to other entities and correspondents (paid) | | (433,608 | ) | | — | | | (433,608 | ) | | (472,780 | ) | | — | | | (472,780 | ) | | (570,968 | ) | | — | | | (570,968 | ) |
Other transactions (paid) | | (186,153 | ) | | — | | | (186,153 | ) | | (189,832 | ) | | — | | | (189,832 | ) | | (225,025 | ) | | — | | | (225,025 | ) |
Gains (losses) from: | | | | | | | | | | | | | | | | | | | | | | | | | | | |
Affiliated companies’ securities | | 1,003,523 | | | (500,650 | ) | | 502,873 | | | 486,634 | | | (250,512 | ) | | 236,122 | | | 1,539,210 | | | (326,890 | ) | | 1,212,320 | |
Investment securities | | 2,739,185 | | | (231,045 | ) | | 2,508,140 | | | 4,505,711 | | | 238,259 | | | 4,743,970 | | | (687,462 | ) | | 11,888 | | | (675,574 | ) |
Foreign exchange, derivatives and other, net | | 287,715 | | | — | | | 287,715 | | | 423,710 | | | — | | | 423,710 | | | 329,932 | | | — | | | 329,932 | |
Other income | | (341,312 | ) | | 128,746 | | | (212,566 | ) | | (696,813 | ) | | 92,417 | | | (604,396 | ) | | 2,673,200 | | | (10,306 | ) | | 2,662,894 | |
| | |
|
| |
|
| |
|
| |
|
| |
|
| |
|
| |
|
| |
|
| |
|
|
Total non-interest income | | 6,951,918 | | | (602,949 | ) | | 6,348,969 | | | 8,387,623 | | | 80,164 | | | 8,467,787 | | | 7,892,503 | | | (325,308 | ) | | 7,567,195 | |
Non-interest expense | | | | | | | | | | | | | | | | | | | | | | | | | | | |
Salaries and employee benefits | | (3,432,182 | ) | | (811,625 | ) | | (4,243,807 | ) | | (3,851,979 | ) | | (511,386 | ) | | (4,363,365 | ) | | (4,372,189 | ) | | (743,952 | ) | | (5,116,141 | ) |
Occupancy expense of premises, depreciation and maintenance, net | | (762,249 | ) | | — | | | (762,249 | ) | | (976,651 | ) | | — | | | (976,651 | ) | | (1,183,026 | ) | | — | | | (1,183,026 | ) |
General and administrative expenses | | (1,207,759 | ) | | — | | | (1,207,759 | ) | | (1,414,896 | ) | | — | | | (1,414,896 | ) | | (1,662,574 | ) | | — | | | (1,662,574 | ) |
Amortization of goodwill | | (386,967 | ) | | 630,702 | | | 243,735 | | | (519,894 | ) | | 320,733 | | | (199,161 | ) | | (1,003,449 | ) | | (508,065 | ) | | (1,511,514 | ) |
Net provision for specific allowances | | 17,951 | | | 2,257 | | | 20,208 | | | (386,476 | ) | | (22,647 | ) | | (409,123 | ) | | (925,775 | ) | | (57,854 | ) | | (983,629 | ) |
Other expenses | | (1,128,317 | ) | | 90,577 | | | (1,037,740 | ) | | (2,068,129 | ) | | 48,419 | | | (2,019,710 | ) | | (1,453,500 | ) | | (50,239 | ) | | (1,503,739 | ) |
Minority shareholder’s interest | | (670,463 | ) | | 95,881 | | | (574,582 | ) | | (746,919 | ) | | 10,577 | | | (736,342 | ) | | (645,223 | ) | | 99,393 | | | (545,830 | ) |
| | |
|
| |
|
| |
|
| |
|
| |
|
| |
|
| |
|
| |
|
| |
|
|
Total non-interest expense | | (7,569,986 | ) | | 7,792 | | | (7,562,194 | ) | | (9,964,944 | ) | | (154,304 | ) | | (10,119,248 | ) | | (11,245,736 | ) | | (1,260,717 | ) | | (12,506,453 | ) |
Income Before Income Taxes | | 3,141,677 | | | (501,809 | ) | | 2,639,868 | | | 2,372,342 | | | 152,577 | | | 2,524,919 | | | 2,468,591 | | | (1,389,826 | ) | | 1,078,764 | |
| | |
|
| |
|
| |
|
| |
|
| |
|
| |
|
| |
|
| |
|
| |
|
|
Income tax expense | | (914,976 | ) | | 181,008 | | | (733,968 | ) | | (653,213 | ) | | (25,959 | ) | | (679,172 | ) | | (625,521 | ) | | 226,867 | | | (398,654 | ) |
| | |
|
| |
|
| |
|
| |
|
| |
|
| |
|
| |
|
| |
|
| |
|
|
Net Consolidated Income for the year | | 2,226,701 | | | (320,801 | ) | | 1,905,900 | | | 1,719,129 | | | 126,618 | | | 1,845,746 | | | 1,843,070 | | | (1,162,959 | ) | | 680,111 | |
| | |
|
| |
|
| |
|
| |
|
| |
|
| |
|
| |
|
| |
|
| |
|
|
F-161
3. Condensed Financial Statements of Banco Bilbao Vizcaya Argentaria, S.A (Parent Company Only)-
Following are the summarized balance sheets of Banco Bilbao Vizcaya Argentaria, S.A. as of December 31, 2003, 2002 and 2001:
| | | | | | |
| | | December 31,
|
| | | 2003
| | 2002
| | 2001
|
| | | (Thousands of Euros) |
CONDENSED BALANCE SHEETS (Parent company only) | | | | | | |
Assets | | | | | | |
Cash and due from banks | | 16,956,351 | | 19,089,296 | | 17,176,236 |
Investment securities | | 52,361,144 | | 40,649,146 | | 48,208,707 |
Investment in subsidiaries and affiliated companies | | 11,362,123 | | 13,056,716 | | 13,120,922 |
Loans, net | | 109,068,879 | | 100,510,331 | | 99,012,471 |
Premises and equipment | | 2,032,261 | | 2,100,123 | | 2,224,367 |
Other assets | | 11,292,004 | | 11,816,270 | | 12,225,911 |
| | |
| |
| |
|
Total assets | | 203,072,762 | | 187,221,882 | | 191,968,614 |
| | |
| |
| |
|
Liabilities | | | | | | |
Deposits | | 118,593,469 | | 117,679,385 | | 119,993,544 |
Due to Bank of Spain and Deposits Guarantee Fund | | 9,442,749 | | 4,372,244 | | 1,815,628 |
Short-term borrowings | | 28,820,921 | | 23,200,105 | | 30,201,367 |
Long-term debt | | 22,258,205 | | 18,369,399 | | 16,247,874 |
Other liabilities | | 14,857,475 | | 14,470,823 | | 14,195,943 |
| | |
| |
| |
|
Total liabilities | | 193,972,819 | | 78,091,956 | | 182,454,356 |
Stockholders’ equity | | | | | | |
Capital stock | | 1,565,968 | | 1,565,968 | | 1,565,968 |
Retained earnings and other reserves | | 7,533,975 | | 7,563,958 | | 7,948,290 |
| | |
| |
| |
|
Total stockholder’s equity | | 9,099,943 | | 9,129,926 | | 9,514,258 |
| | |
| |
| |
|
Total liabilities and stockholder’s equity | | 203,072,762 | | 187,221,882 | | 191,968,614 |
| | |
| |
| |
|
F-162
Following are the summarized statements of income of Banco Bilbao Vizcaya Argentaria, S.A. as of December 31, 2003, 2002 and 2001:
| | | | | | | | | |
| | | Year ended December 31,
| |
| | | 2003
| | | 2002
| | | 2001
| |
| | | (Thousands of Euros) | |
CONDENSED STATEMENTS OF INCOME (Parent Company only) | | | | | | | | | |
Interest income | | | | | | | | | |
Interest from earning assets | | 6,198,836 | | | 7,047,212 | | | 8,607,042 | |
Interest and dividends from subsidiaries | | | | | | | | | |
Consolidated | | 897,169 | | | 1,544,594 | | | 1,993,515 | |
Nonconsolidated | | 122,826 | | | 223,648 | | | 276,502 | |
| | |
|
| |
|
| |
|
|
| | | 7,218,831 | | | 8,815,454 | | | 10,877,059 | |
Interest expense | | (3,602,152 | ) | | (4,627,304 | ) | | (6,675,315 | ) |
| | |
|
| |
|
| |
|
|
Net interest income | | 3,616,679 | | | 4,188,150 | | | 4,201,744 | |
Provision for possible loan losses | | (548,266 | ) | | (631,928 | ) | | (531,856 | ) |
| | |
|
| |
|
| |
|
|
Net interest income after provisions for possible loan losses | | 3,068,413 | | | 3,556,222 | | | 3,669,888 | |
Noninterest income | | 2,882,654 | | | 2,760,177 | | | 2,931,304 | |
Noninterest expense | | (4,188,721 | ) | | (5,085,094 | ) | | (5,448,196 | ) |
| | |
|
| |
|
| |
|
|
Income before income taxes | | 1,762,346 | | | 1,231,305 | | | 1,152,996 | |
Income tax expense | | (302,009 | ) | | (24,209 | ) | | 158,565 | |
| | |
|
| |
|
| |
|
|
Net income | | 1,460,337 | | | 1,207,096 | | | 1,311,561 | |
| | |
|
| |
|
| |
|
|
F-163
4. Consolidated Statements of Changes in Stockholders equity (Notes 1,2-d, 23 and 24)-
As of December 31, 2003, 2002 and 2001, there have not been variations in the number of registered shares.
Composition of stockholders’ equity (considering the final dividend) of December 31, 2003, 2002 and 2001, is presented in Note 2-d. The variation in stockholders’ equity as of December 31, 3003, 2002 and 2001 is as follows:
| | | | | | | | | |
| | | 2003
| | | 2002
| | | 2001
| |
| | | Thousands of Euros | |
Balance at the beginning of the year | | 18,907,787 | | | 21,226,091 | | | 22,579,283 | |
| | |
|
| |
|
| |
|
|
Net income for the year | | 1,905,900 | | | 1,845,746 | | | 680,111 | |
Dividends paid | | (1,108,316 | ) | | (1,269,442 | ) | | (1,167,863 | ) |
(Increase) / decrease in treasury stock | | 31,612 | | | (21,727 | ) | | 36,764 | |
Other comprehensive income | | 86,732 | | | (3,155,603 | ) | | (1,331,818 | ) |
Foreign Currency Translation Adjustment | | (922,506 | ) | | (1,864,977 | ) | | (593,860 | ) |
Unrealized Gains on Securities | | 1,054,024 | | | (1,362,665 | ) | | (750,748 | ) |
Derivatives Instruments and Hedging Activities (SFAS 133) | | (44,786 | ) | | 72,039 | | | 12,790 | |
Other variations | | (240,681 | ) | | 282,722 | | | 429,614 | |
| | |
|
| |
|
| |
|
|
Balance at the end of the year | | 19,583,034 | | | 18,907,787 | | | 21,226,091 | |
| | |
|
| |
|
| |
|
|
As described in Note 2-e, as of December 31, 2003, 2002 and 2001, the computable equity of the Group was higher than the minimum requirements stipulated by the Spanish regulation.
F-164
(32.2.D) MAIN DISCLOSURES REQUIRED BY U.S. ACCOUNTING REGULATIONS FOR BANKS AND ADDITIONAL DISCLOSURES REQUIRED UNDER U.S. GAAP
1. Investment Securities-
The breakdown of the Group’s investment securities portfolio by issuer is as follows:
| | | | | | | | | | | | | | | | | | | | | | | | | | | |
| | | 2003
| | | 2002
| | | 2001
| |
| | | Book Value
| | Fair
Value(1)
| | Unrealized
Gains
| | Unrealized
Losses
| | | Book Value
| | Fair
Value(1)
| | Unrealized
Gains
| | Unrealized
Losses
| | | Book Value
| | Fair
Value(1)
| | Unrealized
Gains
| | Unrealized Losses
| |
| | | | | | | | | | | | | | | | Thousands of Euros | | | | | | | | | | |
DEBT SECURITIES | | | | | | | | | | | | | | | | | | | | | | | | | | | |
| | | | | | | | | | | | |
TRADING PORTFOLIO | | | | | | | | | | | | | | | | | | | | | | | | | | | |
| | | | | | | | | | | | |
Spanish Government | | 5,615,564 | | 5,615,564 | | — | | — | | | 7,472,822 | | 7,472,822 | | — | | — | | | 2,401,946 | | 2,401,946 | | — | | — | |
| | | | | | | | | | | | |
Other Fixed Interest Securities | | 20,014,532 | | 20,014,532 | | — | | — | | | 19,696,996 | | 19,696,996 | | — | | — | | | 19,248,873 | | 19,248,873 | | — | | — | |
| | |
| |
| |
| |
|
| |
| |
| |
| |
|
| |
| |
| |
| |
|
|
| | | 25,630,096 | | 25,630,096 | | — | | — | | | 27,169,818 | | 27,169,818 | | — | | — | | | 21,650,819 | | 21,650,819 | | — | | — | |
AVAILABLE FOR SALE PORTFOLIO | | | | | | | | | | | | | | | | | | | | | | | | | | | |
| | | | | | | | | | | | |
Domestic- | | | | | | | | | | | | | | | | | | | | | | | | | | | |
| | | | | | | | | | | | |
Spanish Government | | 12,715,493 | | 12,897,933 | | 193,297 | | (10,857 | ) | | 10,414,171 | | 10,712,057 | | 298,787 | | (901 | ) | | 15,491,518 | | 15,694,788 | | 203,276 | | (6 | ) |
| | | | | | | | | | | | |
Other Spanish public authorities | | 585,427 | | 589,817 | | 5,494 | | (1,104 | ) | | 654,467 | | 657,008 | | 4,533 | | (1,992 | ) | | 5,715 | | 5,794 | | 79 | | — | |
| | | | | | | | | | | | |
Other domestic issuers | | 2,506,271 | | 2,526,922 | | 20,996 | | (345 | ) | | 2,521,579 | | 2,542,443 | | 29,026 | | (8,162 | ) | | 3,444,778 | | 3,473,477 | | 29,252 | | (553 | ) |
| | |
| |
| |
| |
|
| |
| |
| |
| |
|
| |
| |
| |
| |
|
|
| | | 15,807,191 | | 16,014,672 | | 219,787 | | (12,306 | ) | | 13,590,217 | | 13,911,508 | | 332,346 | | (11,055 | ) | | 18,942,011 | | 19,174,059 | | 232,607 | | (559 | ) |
International- | | | | | | | | | | | | | | | | | | | | | | | | | | | |
| | | | | | | | | | | | |
United States- | | | | | | | | | | | | | | | | | | | | | | | | | | | |
| | | | | | | | | | | | |
US Treasury and other US Government agencies | | 1,526,121 | | 1,521,281 | | 54 | | (4,894 | ) | | 26,099 | | 26,101 | | 17 | | (15 | ) | | 1,506,998 | | 1,514,629 | | 7,631 | | — | |
| | | | | | | | | | | | |
States and political subdivisions | | 1,336 | | 1,358 | | 22 | | — | | | 263 | | 303 | | 40 | | — | | | 5,848 | | 5,848 | | — | | — | |
| | | | | | | | | | | | |
Other securities | | 435,873 | | 435,615 | | 770 | | (1,028 | ) | | 2,457,42 | | 2,454,130 | | 10,527 | | (14,339 | ) | | 1,020,758 | | 1,019,899 | | 85 | | (944 | ) |
Other countries- | | | | | | | | | | | | | | | | | | | | | | | | | | | |
| | | | | | | | | | | | |
Securities of other foreign Governments | | 23,644,808 | | 23,792,171 | | 179,473 | | (32,110 | ) | | 19,969,745 | | 19,983,762 | | 130,548 | | (116,531 | ) | | 30,357,752 | | 30,312,345 | | 22,718 | | (68,125 | ) |
| | | | | | | | | | | | |
Other debt securities outside Spain | | 3,710,889 | | 3,723,136 | | 21,459 | | (9,212 | ) | | 3,284,011 | | 3,308,113 | | 55,037 | | (30,935 | ) | | 5,463,447 | | 5,442,045 | | 4,622 | | (26,024 | ) |
| | | 29,319,027 | | 29,473,561 | | 201,778 | | (47,244 | ) | | 25,738,060 | | 25,772,409 | | 196,169 | | (161,820 | ) | | 38,354,803 | | 38,294,766 | | 35,055 | | (95,092 | ) |
| | |
| |
| |
| |
|
| |
| |
| |
| |
|
| |
| |
| |
| |
|
|
| | | 45,126,218 | | 45,488,233 | | 421,565 | | (59,550 | ) | | 39,328,277 | | 39,683,917 | | 528,515 | | (172,875 | ) | | 57,296,814 | | 57,468,825 | | 267,662 | | (95,651 | ) |
| | |
| |
| |
| |
|
| |
| |
| |
| |
|
| |
| |
| |
| |
|
|
HELD TO MATURITY PORFOLIO | | | | | | | | | | | | | | | | | | | | | | | | | | | |
| | | | | | | | | | | | |
Domestic- | | | | | | | | | | | | | | | | | | | | | | | | | | | |
Spanish Government | | 613,946 | | 652,625 | | 38,679 | | — | | | 1,880,783 | | 1,983,010 | | 102,227 | | — | | | 2,271,905 | | 2,381,703 | | 109,798 | | — | |
| | | | | | | | | | | | |
Other domestic issuers | | 510,709 | | 542,590 | | 31,881 | | — | | | 522,077 | | 561,760 | | 39,683 | | — | | | 596,769 | | 648,306 | | 51,537 | | — | |
| | | 1,124,655 | | 1,195,215 | | 70,560 | | — | | | 2,402,860 | | 2,544,770 | | 141,910 | | — | | | 2,868,674 | | 3,030,009 | | 161,335 | | — | |
| | |
| |
| |
| |
|
| |
| |
| |
| |
|
| |
| |
| |
| |
|
|
TOTAL DEBT SECURITIES (NET) | | 71,880,969 | | 72,313,544 | | 492,125 | | (59,550 | ) | | 68,900,955 | | 69,398,505 | | 670,425 | | (172,875 | ) | | 81,816,307 | | 82,149,653 | | 333,346 | | — | |
| | |
| |
| |
| |
|
| |
| |
| |
| |
|
| |
| |
| |
| |
|
|
EQUITY SECURITIES | | | | | | | | | | | | | | | | | | | | | | | | | | | |
| | | | | | | | | | | | |
TRADING PORTFOLIO | | 2,029,414 | | 2,029,414 | | — | | — | | | 931,928 | | 931,928 | | — | | — | | | 1,032,280 | | 1,032,280 | | — | | — | |
| | | | | | | | | | | | |
AVAILABLE FOR SALE PORTFOLIO | | | | | | | | | | | | | | | | | | | | | | | | | | | |
| | | | | | | | | | | | |
Domestic | | 449,247 | | 529,381 | | 80,190 | | (56 | ) | | 1,127,891 | | 1,231,388 | | 260,200 | | (156,703 | ) | | 1,230,981 | | 1,345,943 | | 129,765 | | (14,803 | ) |
| | | | | | | | | | | | |
International- | | | | | | | | | | | | | | | | | | | | | | | | | | | |
| | | | | | | | | | | | |
United States | | 19,530 | | 20,429 | | 899 | | — | | | 60,217 | | 50,286 | | 2,606 | | (12,537 | ) | | 381,649 | | 379,611 | | 1,929 | | (3,967 | ) |
Other countries | | 593,873 | | 617,520 | | 24,291 | | (644 | ) | | 887,456 | | 919,679 | | 241,988 | | (209,765 | ) | | 1,028,789 | | 1,054,874 | | 27,984 | | (1,899 | ) |
| | |
| |
| |
| |
|
| |
| |
| |
| |
|
| |
| |
| |
| |
|
|
| | | 1,062,650 | | 1,167,330 | | 105,380 | | (700 | ) | | 2,075,564 | | 2,201,353 | | 504,794 | | (379,005 | ) | | 2,641,419 | | 2,780,428 | | 159,678 | | (20,669 | ) |
| | |
| |
| |
| |
|
| |
| |
| |
| |
|
| |
| |
| |
| |
|
|
TOTAL EQUITY SECURITIES (NET) | | 3,092,064 | | 3,196,744 | | 105,380 | | (700 | ) | | 3,007,492 | | 3,133,281 | | 504,794 | | (379,005 | ) | | 3,673,699 | | 3,812,708 | | 159,678 | | (20,669 | ) |
| | |
| |
| |
| |
|
| |
| |
| |
| |
|
| |
| |
| |
| |
|
|
TOTAL INVESTMENT SECURITIES (NET) | | 74,973,033 | | 75,510,288 | | 597,505 | | (60,250 | ) | | 71,908,447 | | 72,531,786 | | 1,175,219 | | (551,880 | ) | | 85,490,006 | | 85,962,361 | | 588,675 | | (116,320 | ) |
| | |
| |
| |
| |
|
| |
| |
| |
| |
|
| |
| |
| |
| |
|
|
| (1) | The Fair Values are determined based on year-end quoted market process for listed securities and on management’s estimate for unlisted securities. |
F-165
An analysis of the book value of investments, exclusive of valuation reserves, by contractual maturity and fair value of the debt securities portfolio is shown below:
| | | | | | | | | | |
| | | 2003
|
| | | BOOK VALUE
|
| | | Due in one year or less
| | Due after one year through
five years
| | Due after
five years
through
ten years
| | Due after
ten years
| | Total
|
GOVERNMENT DEBT SECURITIES | | | | | | | | | | |
Domestic: | | | | | | | | | | |
- Investment securities: | | | | | | | | | | |
. Spanish Treasury Bills | | 601,300 | | — | | — | | — | | 601,300 |
. Other Spanish Government securities | | 1,066,933 | | 9,367,609 | | 1,396,426 | | 283,225 | | 12,114,193 |
- Held to maturity portfolio | | — | | — | | — | | 613,946 | | 613,946 |
- Trading Portfolio | | 3,633,356 | | 1,571,849 | | 374,218 | | 36,141 | | 5,615,564 |
| | |
| |
| |
| |
| |
|
TOTAL | | 5,301,589 | | 10,939,458 | | 1,770,644 | | 933,312 | | 18,945,003 |
FIXED INCOME PORTFOLIO | | | | | | | | | | |
- Investment securities: | | | | | | | | | | |
International: | | | | | | | | | | |
United States | | | | | | | | | | |
. U.S. Treasury Securities and other US Government agencies | | 254,510 | | 276,563 | | 374,291 | | 620,757 | | 1,526,121 |
. States and political subdivisions | | — | | — | | — | | 1,336 | | 1,336 |
. Other Securities | | 192,899 | | 137,375 | | 21,493 | | 84,106 | | 435,873 |
Total United States | | 447,409 | | 413,938 | | 395,784 | | 706,199 | | 1,963,330 |
Other countries | | | | | | | | | | |
. Securities of other foreign Governments | | 1,966,160 | | 12,760,526 | | 4,682,341 | | 4,235,781 | | 23,644,808 |
. Other debt securities outside Spain | | 803,455 | | 1,796,998 | | 709,437 | | 400,999 | | 3,710,889 |
Total other countries | | 2,769,615 | | 14,557,524 | | 5,391,778 | | 4,636,780 | | 27,355,697 |
Total International Inv. Sec. | | 3,217,024 | | 14,971,462 | | 5,787,562 | | 5,342,979 | | 29,319,027 |
Domestic: | | | | | | | | | | |
. Other securities | | 101,058 | | 299,048 | | 839,448 | | 1,852,144 | | 3,091,698 |
- Held to maturity securities | | | | | | | | | | |
International | | — | | — | | — | | — | | — |
Domestic | | 10,361 | | 442,771 | | 27,526 | | 30,051 | | 510,709 |
Total International | | 3,217,024 | | 14,971,462 | | 5,787,562 | | 5,342,979 | | 29,319,027 |
Total Domestic | | 111,419 | | 741,819 | | 866,974 | | 1,882,195 | | 3,602,407 |
- Trading Portfolio | | — | | — | | — | | — | | 20,014,532 |
| | |
| |
| |
| |
| |
|
TOTAL | | 8,630,032 | | 26,652,739 | | 8,425,180 | | 8,158,486 | | 71,880,969 |
| | |
| |
| |
| |
| |
|
F-166
| | | | | | | | | | |
| | | 2003
|
| | | MARKET VALUE
|
| | | Due in one
year or less
| | Due after
one year
through five
years
| | Due after
five years
through
ten years
| | Due after
ten years
| | Total
|
GOVERNMENT DEBT SECURITIES | | | | | | | | | | |
Domestic: | | | | | | | | | | |
- Investment securities: | | | | | | | | | | |
. Spanish Treasury Bills | | 601,101 | | — | | — | | — | | 601,101 |
. Other Spanish Government securities | | 1,081,908 | | 9,508,649 | | 1,420,082 | | 286,193 | | 12,296,832 |
- Held to maturity portfolio | | — | | — | | — | | 652,625 | | 652,652 |
- Trading Portfolio | | 3,633,356 | | 1,571,849 | | 374,218 | | 36,141 | | 5,615,564 |
| | |
| |
| |
| |
| |
|
TOTAL | | 5,316,365 | | 11,080,498 | | 1,794,300 | | 974,959 | | 19,166,122 |
FIXED INCOME PORTFOLIO | | | | | | | | | | |
- Investment securities: | | | | | | | | | | |
International: | | | | | | | | | | |
United States | | | | | | | | | | |
. U.S. Treasury Securities and other US Government agencies | | 254,489 | | 274,075 | | 370,520 | | 622,197 | | 1,521,281 |
. States and political subdivisions | | — | | — | | — | | 1,358 | | 1,358 |
. Other Securities | | 192,876 | | 137,693 | | 21,386 | | 83,660 | | 435,615 |
Total United States | | 447,365 | | 411,768 | | 391,906 | | 707,215 | | 1,958,254 |
Other | | | | | | | | | | |
. Securities of other foreign Governments | | 1,999,694 | | 12,836,294 | | 4,698,138 | | 4,258,045 | | 23,792,171 |
. Other debt securities outside Spain | | 809,859 | | 1,803,251 | | 711,222 | | 398,804 | | 3,723,136 |
Total other countries | | 2,809,553 | | 14,639,545 | | 5,409,360 | | 4,656,849 | | 27,515,307 |
Total International Inv. Sec. | | 3,256,918 | | 15,051,313 | | 5,801,266 | | 5,364,064 | | 29,473,561 |
Domestic: | | | | | | | | | | |
. Other securities | | 101,748 | | 303,007 | | 844,437 | | 1,867,547 | | 3,116,739 |
- Held to maturity securities | | | | | | | | | | |
International | | — | | — | | — | | — | | — |
Domestic | | 11,341 | | 472,279 | | 27,768 | | 31,202 | | 542,590 |
Total International | | 3,256,918 | | 15,051,313 | | 5,801,266 | | 5,364,064 | | 29,473,561 |
Total Domestic | | 113,089 | | 775,286 | | 872,205 | | 1,898,749 | | 3,659,329 |
- Trading Portfolio | | — | | — | | — | | — | | — |
TOTAL | | 8,686,372 | | 26,907,097 | | 8,467,771 | | 8,237,772 | | 72,313,544 |
| | |
| |
| |
| |
| |
|
F-167
| | | | | | | | | | |
| | | 2002
|
| | | MARKET VALUE
|
| | | Due in one
year or less
| | Due after one
year through
five years
| | Due after five
years through
ten years
| | Due after
ten years
| | Total
|
GOVERNMENT DEBT SECURITIES | | | | | | | | | | |
Domestic: | | | | | | | | | | |
- Investment securities: | | 3,985,471 | | 5,049,901 | | 1,195,096 | | 481,589 | | 10,712,057 |
. Spanish Treasury Bills | | 1,138,504 | | 8,061 | | — | | — | | 1,146,565 |
. Other Spanish Government securities | | 2,846,967 | | 5,041,840 | | 1,195,096 | | 481,589 | | 9,565,492 |
- Held to maturity portfolio | | 1,328,131 | | — | | — | | 654,879 | | 1,983,010 |
- Trading Portfolio | | 3,538,056 | | 2,423,940 | | 1,226,987 | | 283,839 | | 7,472,822 |
| | |
| |
| |
| |
| |
|
TOTAL | | 8,851,658 | | 7,473,841 | | 2,422,083 | | 1,420,307 | | 20,167,889 |
FIXED INCOME PORTFOLIO | | | | | | | | | | |
- Investment securities: | | 4,283,996 | | 10,919,405 | | 4,801,020 | | 8,967,439 | | 28,971,860 |
International: | | | | | | | | | | |
United States | | | | | | | | | | |
. U.S. Treasury Securities and other US Government agencies | | 25,461 | | — | | — | | 640 | | 26,101 |
. States and political subdivisions | | — | | — | | — | | 303 | | 303 |
. Other Securities | | 671,569 | | 522,210 | | 24,436 | | 1,235,915 | | 2,454,130 |
Total United States | | 697,030 | | 522,210 | | 24,436 | | 1,236,858 | | 2,480,534 |
Other | | | | | | | | | | |
. Securities of other foreign Governments | | 1,874,279 | | 9,234,172 | | 3,692,465 | | 5,182,846 | | 19,983,762 |
. Other debt securities outside Spain | | 1,560,515 | | 901,451 | | 424,521 | | 421,626 | | 3,308,113 |
Total other countries | | 3,434,794 | | 10,135,623 | | 4,116,986 | | 5,604,472 | | 23,291,875 |
Total International Inv. Sec. | | 4,131,824 | | 10,657,833 | | 4,141,422 | | 6,841,330 | | 25,772,409 |
Domestic: | | | | | | | | | | |
. Other securities | | 152,172 | | 261,572 | | 659,598 | | 2,126,109 | | 3,199,451 |
- Held to maturity securities | | 11,506 | | 461,374 | | 30,610 | | 58,270 | | 561,760 |
International | | — | | — | | — | | — | | — |
Domestic | | 11,506 | | 461,374 | | 30,610 | | 58,270 | | 561,760 |
Total International | | 4,131,824 | | 10,657,833 | | 4,141,422 | | 6,841,330 | | 25,772,409 |
Total Domestic | | 163,678 | | 722,946 | | 690,208 | | 2,184,379 | | 3,761,211 |
- Trading Portfolio | | | | -Not available information- | | | | 19,696,996 |
| | | | | | | | | | |
|
TOTAL | | 4,295,502 | | 11,380,779 | | 4,831,630 | | 9,025,709 | | 49,230,616 |
| | |
| |
| |
| |
| |
|
F-168
| | | | |
| | | 2001
|
| | | Book Value
| | Fair Value
|
| | | Thousands of Euros |
DEBT SECURITIES | | | | |
Available for Sale and Held to Maturity Portfolio | | | | |
Due in one year or less | | 14,473,884 | | 14,496,706 |
Due after one year through five years | | 30,292,826 | | 30,434,338 |
Due after five years through ten years | | 9,083,024 | | 9,221,766 |
Due after ten years | | 6,315,754 | | 6,346,024 |
| | |
| |
|
| | | 60,165,488 | | 60,498,834 |
Trading portfolio | | 21,650,819 | | 21,650,819 |
| | |
| |
|
| | | 81,816,307 | | 82,149,653 |
| | |
| |
|
See also Notes 6, 9 and 10 for other breakdowns of the Group’s investment securities portfolio as of December 31, 2003, 2002 and 2001. As of December 2003, 2002 and 2001, the carrying values of non-traded (unlisted) debt securities portfolio amounted to €6,671,421, €11,178,018 and €16,506,347 thousand respectively. As of December 2003, 2002 and 2001, the carrying values of non-traded (unlisted) equity securities portfolio amounted to €561,457, €800,758 and €1,391,608 thousand, respectively.
Under both Spanish GAAP and U.S. GAAP, the methodology used to estimate the fair value of non-traded or unlisted securities is as follows:
| | - | Debt securities: fair value is considered to be the present value of the cash flows, using market interest rates (discounted cash flows). |
| | - | Equity securities: underlying book value is the general rule under Spanish GAAP. As previously explained in the general comments, in some cases in which trigger events indicate that a specific investment could be impaired, a specific valuation of fair value is used and all available factors are considered by management to determine the fair value both under Spanish and US GAAP. If it is available a valuation of the company, it is used as a better measure of fair value under both Spanish and US GAAP. |
These methodologies include an evaluation of credit risk, market conditions (volatility, interest rate evolution, macroeconomic variables, etc…) or futures expectations.
The breakdown of unrealized losses as of December 31, 2003, 2002 and 200, is as follows:
F-169
According to the table, most of unrecognized losses as of December 31, 2002, arose in such year.
The total amount of unrealized losses of 551,880 correspond to the sum of temporary plus other-than-temporary impairments. The following table is presented to clarify this and to make reference on the explanations given in response to your questions:
| | | | | | |
Unrealized losses
| | Thousand of Euros
|
| | | 2003
| | 2002
| | 2001
|
- Equity Securities | | — | | 207,176 | | — |
- Debt Securities | | — | | 74,827 | | — |
(1) Total Impairments Other - than- temporary(charged to income under both GAAP) | | — | | 282,003 | | — |
- Debt securities | | 59,550 | | 21,790 | | 95,651 |
- Equity Securities | | 700 | | 169,240 | | 20,669 |
- Other (*) | | — | | 78,847 | | — |
(2) Total Temporary Unrealized losses | | 60,250 | | 269,877 | | 116,320 |
(1) + (2) Total unrecognized losses | | 60,250 | | 551,880 | | 116,320 |
| (*) | This amount represents the sum of different investment categories that are not significant individually considered. In any case all the accounting process and all methodologies used for this amount are as explained in the general comments sections. |
As of December 2003, most of unrealized losses correspond to debt securities. These unrealized losses arose during last six moths of 2003. Due to the limited length of unrealized losses and the future expectation of management that expects a substantial recovery of them, these unrealized losses were considered as temporary.
The main types of securities or industries regarding unrealized losses in 2002 were as follows:
The caption“Securities of other foreign governments” whose unrealized losses amounted to 116,531 thousand euro, mainly included debt securities owned by our subsidiaries in Latin America and issued by the governments of:
| | • | Brazil (unrealized losses amounts to 74,827 thousand euro) that were considered as other-than-temporary and the effect was recorded to income under both GAAPs; and |
| | • | Venezuela (unrealized losses amounts to 21,790 thousand euro) that were sold in 2003 giving rise to gains. Under Spanish GAAP and U.S. GAAP. BBVA Group considered these declines as temporary. |
The caption“Equity securities - Domestic” whose unrealized losses amounted to 156,703 thousand of euros, mainly included listed securities issued by Spanish companies held by the parent company. Unrealized losses amounting to 146,190 corresponds to an investment whose market value decreased below carrying value during the second half of 2002 and which had increases in market price during the first semester of 2003. Management considered that the evolution of this quotation in the Spanish market evidenced that an impairment was not necessary. Therefore under Spanish GAAP and US GAAP, this decline was considered as temporary.
The caption“Equity securities - International” whose unrealized losses amounted to 222,302 thousand euro, mainly included the following securities:
| | • | listed securities issued by U.S. companies (unrealized losses amount to12,537 thousand euro) and in first quarter of 2003 the evolution of their quotation in their markets were increasing its market value. |
| | • | non-listed securities of Mexican companies held by the Group whose unrealized losses amount to 169,341 thousand euro. The unrealized losses on these securities, due to actual and future expectations about the performance of the issuers, which were considered to be other-than-temporary and therefore impairment charges were recognized in the income statement under both Spanish GAAP and U.S. GAAP. |
| | • | the rest of unrealized losses (40,424 thousand euro) come from, basically, unlisted international companies. Unrealized losses amounting to 37,835 thousand euro were recorded to income under Spanish GAAP and under U.S. GAAP were not reversed because they were considered as “Other than temporary” and therefore the accounting treatment did not differ under Spanish and U.S. GAAP. |
In 2001, most of the unrecognized losses related to temporary impairments. These unrecognized losses mainly correspond to debt securities and were recovered in 2002. The remaining amount of unrealized losses in 2001 was not relevant. The Group did not record any relevant other-than-temporary impairments.
F-170
2. Loans and Accounting by Creditors for Impairment of a Loan-
The balance of the recorded investment in impaired loans and of the related valuation allowance as of December 31, 2003, 2002 and 2001 is as follows:
| | | | | | |
| | | 2003
| | 2002
| | 2001
|
| | | Thousands of Euros |
Impaired loans requiring no reserve | | 587,134 | | 1,544,711 | | 1,445,205 |
Impaired loans requiring valuation allowance | | 2,949,247 | | 3,543,273 | | 3,239,614 |
| | |
| |
| |
|
Total impaired loans | | 3,536,381 | | 5,087,984 | | 4,684,819 |
| | |
| |
| |
|
Valuation allowance on impaired loans | | 2,417,274 | | 3,437,163 | | 3,226,698 |
| | |
| |
| |
|
The roll-forward of allowance is shown in Note 8 under Spanish GAAP. The reconciliation item to U.S. GAAP is in Note 32-2-B-7.
The approximate amount of interest collected concerning to substandard loans (and included in income) related to the current year amounted to €278,324 thousand, €73,907 thousand and €97,358 thousand in 2003, 2002 and 2001, respectively and those related to prior years amounted to €79,099 thousand, €53,123 thousand and €228,391 thousand in 2003, 2002 and 2001, respectively.
| | |
| | | 2003
|
| | | Thousands of Euros |
Interest revenue that would have been recorded if accruing | | 766,816 |
Net interest revenue recorded: | | |
Related to current year | | 278,324 |
Related to prior years | | 79,099 |
Positive (negative) impact of non-performing loans on interest revenue | | 409,393 |
3. Investments In And Indebtedness Of And To Affiliates-
See Notes 11 and 12 and Exhibits II and III for detailed information of investments in nonconsolidated Group companies and other affiliates, and Note 27 for transactions of consolidated companies with such affiliates. Aggregated summarized financial information with respect to significant affiliated companies under Spanish GAAP for the years ended December 31, 2003 is presented below:
| | | | | | |
Percentage of ownership -
| | 50% or more
| | Between 3%
and 50%
|
| | | Thousands of Euros
|
2003
| | Equity method
| | Proportional Method
| | |
Net sales | | 859,997 | | 7,581 | | 5,135,164 |
Operating income | | 17,287 | | 69,351 | | 850,585 |
Net income | | 235,299 | | 122,769 | | 399,161 |
Current assets | | 1,678,019 | | 526,053 | | 15,076,632 |
Noncurrent assets | | 11,170,477 | | 335,653 | | 10,035,435 |
Current liabilities | | 1,186,849 | | 138,902 | | 13,333,951 |
Non-current liabilities | | 11,661,648 | | 722,804 | | 11,778,117 |
F-171
4. Deposits-
The breakdowns of deposits from credit entities and customers as of December 31, 2003, 2002 and 2001, by domicile and type are included in Notes 17 and 18.
As of December 31, 2003, 2002 and 2001, the time deposits, both domestic and international, (other than interbank deposits) in denominations of €79 thousand (approximately US$ 100 thousand) or more amounted to €45,548 thousand, €51,059 million and €49,320 million, respectively.
5. Short-Term Borrowings-
Under Spanish format and regulations, the information about “Short-Term borrowings” is not required as it is under S-X Regulations. Therefore this information is not disclosed in the preceding pages. The analysis of short-term borrowings is as follows. Securities sold under agreement to repurchase were secured by investment securities, mainly Spanish Treasury bills and other governmental securities secured securities.
| | | | | | | | | | |
| | | At December 31,
| |
| | | 2002
| | | 2001
| |
| | | Amount
| | Average
Rate
| | | Amount
| | Average
Rate
| |
| | | (thousand of euro, except percentages) | |
Securities sold under agreements to repurchase (principally Spanish Treasury bills): | | | | | | | | | | |
At December 31 | | 39,675,007 | | 4.65 | % | | 48,080,073 | | 6.16 | % |
Average during year | | 39,813,951 | | 4.72 | % | | 45,454,491 | | 6.51 | % |
Maximum quarter-end balance | | 44,732,472 | | — | | | 48,080,073 | | — | |
| | | | |
Other short-term borrowings (principally bank promissory notes): | | | | | | | | | | |
At December 31 | | 5,100,885 | | 2.85 | % | | 4,641,737 | | 4.87 | % |
Average during year | | 3,967,296 | | 3.12 | % | | 5,844,301 | | 4.11 | % |
Maximum quarter-end balance | | 5,100,885 | | — | | | 5,879,900 | | — | |
| | | | |
Total short-term borrowings at December 31 | | 44,775,892 | | 4.44 | % | | 52,721,810 | | 6.05 | % |
Additionally, as of December 31 2002, the “Short term borrowings” caption includes “Mortgage Bonds” amounting €7,483,991 thousand.
| | | | | |
| | | At December 31,
| |
| | | 2003
| |
| | | Amount
| | Average
Rate
| |
| | | (in thousands of euro,
except percentages) | |
Securities sold under agreements to repurchase (principally Spanish Treasury bills): | | | | | |
At December 31 | | 38,483,355 | | 2.81 | % |
Average during year | | 36,759,455 | | 3.52 | % |
Maximum quarter-end balance | | 38,483,355 | | — | |
| | |
Bank promissory notes: | | | | | |
At December 31 | | 6,086,613 | | 2.11 | % |
Average during year | | 4,665,527 | | 2.13 | % |
Maximum quarter-end balance | | 6,218,810 | | — | |
| | |
Bonds and subordinated debt | | | | | |
At December 31 | | 8,173,347 | | 3.00 | % |
Average during year | | 7,828,669 | | 3.09 | % |
Maximum quarter-end balance | | 10,763,748 | | — | |
| | |
Total short-term borrowings at December 31 | | 52,743,315 | | 2,76 | % |
F-172
At December 31, 2003, 2002 and 2001, short-term borrowings include €17,994,695 thousand, €16,619,199 thousand and €22,346,263 thousand, respectively of securities sold under agreements to repurchase from Bank of Spain and other Spanish and foreign financial Institutions.
Terms of the securities sold under agreements to repurchase that compose the balance at December 31, 2003, are as follows:
| | |
| | | Thousands of Euros
|
Under 3 months | | 37,460,900 |
3 to 12 months | | 331,451 |
12 months to 5 years | | 691,004 |
5 to 10 years | | — |
| | |
|
Over 10 years | | — |
| | |
|
| | | 38,483,355 |
| | |
|
A breakdown of securities sold under agreements to repurchase by type of security at December 31, 2003, 2002 and 2001, is as follows:
| | | | | | |
| | | December 31,
|
| | | 2003
| | 2002
| | 2001
|
| | | Thousands of Euros |
Spanish Treasury Bills and Notes | | 5,282,381 | | 5,991,369 | | 5,316,944 |
Securities of, or Guaranteed by, the Spanish Government | | 17,980,643 | | 15,300,871 | | 15,864,021 |
Other investment securities | | 15,220,331 | | 18,382,767 | | 26,899,108 |
| | |
| |
| |
|
| | | 38,483,355 | | 39,675,007 | | 48,080,073 |
| | |
| |
| |
|
6. Long Term Debt-
See Notes 19 and 21.
7. Minority Interest In Consolidated Subsidiaries
The details of minority interest as of December 31, 2003, 2002 and 2001 including preferred stock, and variations for the years then ended are included in Note 22.
In accordance with the Reg S-X.T. Rule 3-10,Financial Statements of Guarantors and Issuers of Guaranteed Securities Registered or Being Registered, BBVA Preferred Capital, Ltd., BBVA Capital Funding Ltd, BBVA International Limited and BBVA Capital
F-173
Finance, S.A and BBVA Privanza International (Gibraltar), Ltd.—issuers of registered preference shares guaranteed by BBVA, S.A.—do not file the financial statements required for a registrant by Regulation S-X as:
| | • | BBVA Preferred Capital Ltd, BBVA Capital Funding Ltd, BBVA International Limited and BBVA Capital Finance, S.A are a 100% owned finance subsidiaries of BBVA, S.A. who fully and unconditionally guarantees the preferred shares. |
| | • | BBVA Privanza International (Gibraltar), Ltd. is a 100% owned operating subsidiary of BBVA, S.A. who fully and unconditionally guarantees the preferred shares. Following is the condensed financial information for BBVA Privanza International (Gibraltar), Ltd. as of December 31, 2003. |
The other three ones are not listing in United States.
The audited financial statements of BBVA Privanza International (Gibraltar), Ltd., BBVA Preferred Capital Ltd, BBVA Capital Funding, BBVA International Limited and BBVA Capital Finance, S.A. are the following:
CONSOLIDATED BALANCE SHEET as at 31 December 2003
| | | | | | | | | | | | | | |
| | | BBVA Privanza
International
(Gibraltar) Ltd.
| | | BBVA Preferred
Capital Ltd.
| | | BBVA Capital
Funding Ltd.
| | | BBVA International
Limited
| | | BBVA Capital
Finance, S.A.
|
| | | (Thousands of euros) |
Assets | | | | | | | | | | | | | | |
Cash | | 5 | | | 464 | | | 3,521 | | | 2,242 | | | 18 |
Loans and advanced to banks | | 78,177 | | | 190,024 | | | 3,413,320 | | | 3.052,546 | | | 350,288 |
Loans and advanced to clients | | — | | | — | | | — | | | — | | | — |
Securities portfolio | | — | | | — | | | — | | | — | | | — |
Tangible fixed assets | | 245 | | | — | | | — | | | — | | | — |
Intangible assets | | — | | | — | | | — | | | — | | | 2 |
Other assets | | — | | | — | | | 6,177 | | | 18,483 | | | — |
Accrual accounts | | 50 | | | — | | | — | | | — | | | — |
| | |
|
| |
|
| |
|
| |
|
| |
|
Total assets | | 78,477 | | | 190,488 | | | 3,423,018 | | | 3,073,271 | | | 350,308 |
| | |
|
| |
|
| |
|
| |
|
| |
|
Liabilities and equity | | — | | | — | | | — | | | — | | | |
Amounts owed to banks | | — | | | — | | | — | | | — | | | — |
Amounts owed to customers | | 109 | | | 4 | | | 20 | | | 7 | | | 136 |
Marketable debt securities | | — | | | — | | | 3,159,304 | | | — | | | — |
Accrual and deferred income | | 89 | | | — | | | 3,432 | | | — | | | — |
Provisions for contingencies | | — | | | — | | | — | | | — | | | — |
Capital stock | | 2,838 | | | 190,025 | | | 255,646 | | | 475 | | | 350,060 |
Additional paid-in capital | | 60,932 | | | — | | | — | | | 3,039,528 | | | — |
Retained earnings | | 15,349 | | | (14,386 | ) | | (15,621 | ) | | (132,985 | ) | | — |
Profit and loss account | | (840 | ) | | 14,845 | | | 20,237 | | | 166,246 | | | 112 |
| | |
|
| |
|
| |
|
| |
|
| |
|
Total liabilities and equity | | 78,477 | | | 190,488 | | | 3,423,018 | | | 3,073,271 | | | 350,308 |
| | |
|
| |
|
| |
|
| |
|
| |
|
Memorandum accounts | | — | | | 573,720 | | | 6,560,386 | | | 11,125,809 | | | — |
INCOME STATEMENT ACCOUNT for the year ended 31 December 2003
| | | | | | | | | | | | | | | |
| | | BBVA Privanza
International
(Gibraltar) Ltd.
| | | BBVA Preferred
Capital Ltd.
| | | BBVA Capital
Funding Ltd.
| | | BBVA International
Limited
| | | BBVA Capital
Finance, S.A.
| |
| | | (Thousands of euros) | |
Interest receivable | | 12,575 | | | — | | | — | | | — | | | — | |
Interest payable | | -30 | | | — | | | — | | | — | | | — | |
| | |
|
| |
|
| |
|
| |
|
| |
|
|
Net interest income | | 12,545 | | | — | | | — | | | — | | | — | |
Fees and commissions receivable | | 73 | | | — | | | — | | | — | | | — | |
Dealing profits | | (1 | ) | | — | | | — | | | — | | | — | |
| | |
|
| |
|
| |
|
| |
|
| |
|
|
Operating income | | 12,617 | | | — | | | — | | | — | | | — | |
Administrative expenses | | (962 | ) | | — | | | — | | | — | | | | |
Depreciation and amortisation | | (56 | ) | | — | | | (1 | ) | | (66 | ) | | — | |
General expenses | | — | | | (60 | ) | | (122 | ) | | (115 | ) | | (115 | ) |
Provisions | | 62 | | | — | | | — | | | — | | | | |
Others | | — | | | 16,634 | | | 22,719 | | | 185,804 | | | 287 | |
| | |
|
| |
|
| |
|
| |
|
| |
|
|
Profit on ordinary activities before tax | | 11,661 | | | 16,574 | | | 22,596 | | | 185,623 | | | 172 | |
Taxation | | — | | | — | | | — | | | — | | | (60 | ) |
| | |
|
| |
|
| |
|
| |
|
| |
|
|
Profit on ordinary activities after tax | | 11,661 | | | 16,574 | | | 22,596 | | | 185,623 | | | 112 | |
Extraordinary losses and dividends | | (12,516 | ) | | — | | | — | | | — | | | — | |
| | |
|
| |
|
| |
|
| |
|
| |
|
|
Profit retained for the financial year | | (855 | ) | | 16,574 | | | 22,596 | | | 185,623 | | | 112 | |
F-174
8. Derivative Financial Instruments-
The breakdown of the Derivative Financial Instruments under Spanish GAAP is shown in Note 26. See also Note 32.2-B-11 for the additional disclosures required under SFAS 133.
9. Pension liabilities-
See Note 3-j for a detail of the pension commitments under Spanish GAAP. Additional disclosures and the reconciliation to U.S. GAAP is shown in Note 32-2-B-4.
10. Disclosures About Fair Value Of Financial Instruments (SFAS 107)-
As required by SFAS No. 107,Disclosures about Fair Value of Financial Instruments, (“SFAS No. 107”) the Group presents estimate fair value information about financial instruments for which it is practicable to estimate that value. Fair value of a financial instrument is the amount for which the instrument could be exchanged in a current transaction between willing parties, other than in a forced or liquidation sale. Fair value is best determined by values quoted through active trading markets. Active trading markets are characterized by numerous transactions of similar financial instruments between willing buyers and willing sellers. Because no active trading market exists for various types of financial instruments, many of the fair values disclosed were derived using present value discounted cash flow or other valuation techniques. As a result, the Group’s ability to actually realize these derived values cannot be assured.
The estimated fair values disclosed under SFAS No. 107 may vary significantly between institutions based on the estimates and assumptions used in the various valuation methodologies. SFAS No. 107 excludes disclosure of goodwill, core deposits, nonfinancial assets such as fixed assets as well as certain financial instruments such as investments in affiliated companies.
Accordingly, the aggregate estimate fair values presented do not represent the underlying value of the Group. The actual carrying amounts and estimated fair values of the BBVA Group’s financial instruments as of December 31, 2003, 2002 and 2001, are as follows:
| | | | | | | | | | | | |
| | | 2003
| | 2002
| | 2001
|
| | | Carrying
Amount
| | Fair Value
| | Carrying
Amount
| | Fair Value
| | Carrying
Amount
| | Fair Value
|
| | | Thousands of Euros |
Assets | | | | | | | | | | | | |
Cash and due from banks | | 2,861,721 | | 2,861,721 | | 2,999,817 | | 2,999,817 | | 3,854,589 | | 3,854,589 |
Interest-bearing deposits | | 16,750,009 | | 16,746,092 | | 19,426,792 | | 19,480,678 | | 19,467,359 | | 19,488,147 |
Securities purchased under agreements to resell | | 12,494,089 | | 12,493,916 | | 8,650,080 | | 8,650,415 | | 11,148,913 | | 11,148,829 |
Trading securities | | 27,659,510 | | 27,659,510 | | 28,101,746 | | 28,101,746 | | 22,683,099 | | 22,683,099 |
Available for sale and held to maturity investments | | 47,313,523 | | 47,313,523 | | 43,806,701 | | 44,430,040 | | 62,806,907 | | 63,279,262 |
Net loans | | 146,706,610 | | 147,049,429 | | 140,806,446 | | 142,286,928 | | 149,496,358 | | 151,006,663 |
| | | | | | |
Liabilities | | | | | | | | | | | | |
Noninterest bearing deposits | | 859,934 | | 859,934 | | 3,255,527 | | 3,255,527 | | 3,040,376 | | 3,040,376 |
Demand deposits | | 43,674,718 | | 43,674,718 | | 43,676,677 | | 43,676,677 | | 49,266,146 | | 49,266,146 |
Savings deposits | | 24,317,731 | | 24,317,731 | | 22,253,652 | | 22,253,652 | | 25,438,973 | | 25,438,973 |
Time deposits | | 81,833,731 | | 81,797,582 | | 86,902,414 | | 86,963,769 | | 102,532,190 | | 102,756,793 |
Short-term borrowings | | 52,743,315 | | 52,702,210 | | 52,259,883 | | 52,238,955 | | 52,721,810 | | 52,729,394 |
Long-term debt | | 27,234,416 | | 26,503,958 | | 21,527,246 | | 21,861,040 | | 28,454,780 | | 28,610,357 |
F-175
The following methods and assumptions were used by the Group in estimating its fair value disclosures for financial instruments for which it is practicable to estimate such value:
a) Cash and due from banks
For these short-term instruments, the carrying amount is a reasonable estimate of fair value.
b) Interest-bearing deposits in other banks and securities purchased under agreement to resell
The fair value represents the present value of estimated future cash flows discounted at the average year-end market rates for each type of instrument.
c) Investment securities
c.1) Fixed income:
(i) Listed securities: at closing market prices as of December 31, 2003, 2002 and 2001.
(ii) Unlisted securities: on the basis of market prices of other listed fixed-income securities of similar interest rate, credit risk and maturity. If no similar listed fixed-income securities can be identified, the fair value is estimated by discounting future cash-flows using year-end rates based on market rates available on securities with similar credit and maturity characteristics.
c.2) Equity securities:
(i) Listed securities with less than 3% ownership: fair values are based on the 2003, 2002 and 2001 closing market price.
(ii) Unlisted securities: at underlying book value per the December 31, 2003, 2002 and 2001 financial statements of each investee, or otherwise based on the latest financial statements currently available.
d) Loans and leases
The fair value of the Group’s loan portfolio is based on the credit and interest rate characteristics of the individual loans within each sector of the portfolio. The fair value of loans was estimated by discounting scheduled cash flows through the estimated maturity using prevailing market rates at year-end, and is implemented as follows:
d.1) The estimate of the provision for probable loan losses includes consideration of risk premiums applicable to various types of loans based on factors such as the current situation of the economic sector in which each borrower operates, the economic situation of each borrower and guarantees obtained. Accordingly, the allowance for probable loan losses is considered a reasonable estimate of the discount required to reflect the impact of credit risk.
F-176
d.2) For fixed and floating-rate loans for which the interest rate was similar to the average rates available for each type of loan (such as commercial or mortgage loans) as of December 31, 2003, 2002 and 2001, the carrying amount, net of the related allowance for probable loan losses, is considered a reasonable estimate of fair value.
d.3) For the remaining loans which the Group determined were at rates different to those currently offered, the fair values are estimated as the present value of future cash flows discounted at the average year-end market interest rates at which similar loans are being granted to borrowers with similar credit ratings and remaining maturities.
e) Deposits and Short Term Borrowings
The fair value represents the present value of estimated future cash flows discounted at the average year-end market rates for each type of instrument.
f) Long-Term Debt
The fair value is estimated on the basis of the discounted present value of the cash flows over the remaining term of such debt. The discount rates were determined based on market rates available as of December 31, 2003, 2002 and 2001 on debt with similar credit and maturity characteristics of the Group’s.
g) Commitments and Contingencies
g.1) Guarantees and other sureties provided and documentary credits:
It is estimated that the differential, if any, between the fee charged by the Group for these transactions and the average year-end market fee would not give rise to a material difference.
g.2) Derivative Products:
The fair value of these products as of December 31, 2003, 2002 and 2001, considering the related discounted cash-flows and the year-end prevailing rates and market values is presented in Note 26.
11. Segment Information-
SFAS 131,Disclosures about segment of an enterprise and related information requires some disclosures of the financial statements relating to operating segments of a public business enterprise.
| • | Retail Banking in Spain and Portugal: formed by the Group’s retail banking, asset management and private banking businesses in Spain and Portugal, covering the residential customer and small and medium entities (“SME”) segments in these markets. It also includes the Finanzia / Uno-e group (which specializes in the e-banking business, consumer financing, card product distribution and renting activities), BBVA Portugal, the Private Banking business, mutual and pension fund management and insurance businesses. |
| • | Wholesale and Investment Banking: covers the Group’s business activities with large companies and institutions through national and international corporate banking and institutional banking. In addition, it also includes the trading room businesses located in Spain, Europe and New York, the equity distribution and origination business and the security deposit and custody service business, as well as the business and real estate project businesses that are not conducted through the Group’s holdings in large corporations. |
| • | Banking in America: covers the business of each of our subsidiary banks in Latin America and their investee companies, including pension management companies and insurance companies, as well as the International Private Banking business. As mentioned above, with the objective of uniformly monitoring the businesses, this area does not include the results of our subsidiaries in Argentina. |
| • | Corporate Activities: includes the holdings in large industrial corporations and in financial entities, as well as the activities and results of the support units, such as the ‘Assets and Liabilities Management’ Committee (ALCO). In addition, this caption includes the other items that, by their nature, cannot be assigned to the business areas, such as country risk provisions and amortization of goodwill (except for that relating to the holdings owned by the Business and Real Estate Projects unit, which is included in the Wholesale and Investment Banking area). |
F-177
Argentina: includes our subsidiaries BBVA Banco Francés and Consolidar AFJP.
This structure of areas is in line with the internal organization established to manage and monitor the businesses in the BBVA Group during the year 2003. The balances for the financial years 2002 and 2001, which are presented for comparative purposes, were drawn up following the same criteria.
The business areas contribution to net attributable profit and total assets are shown in the following tables:
| | | | | | | | | |
| | | 2003
| | | 2002
| | | 2001
| |
| | | Millions of Euros | |
Business Area contribution to net attributable profit | | | | | | | | | |
Retail Banking | | 1,239 | | | 1,266 | | | 1,173 | |
Wholesale and Investment Banking | | 468 | | | 382 | | | 531 | |
Banking in América | | 715 | | | 736 | | | 807 | |
Corporate Activities and others | | (205 | ) | | (656 | ) | | (451 | ) |
Argentina | | 10 | | | (9 | ) | | (217 | ) |
| | |
|
| |
|
| |
|
|
Net Attributable profit | | 2,227 | | | 1,719 | | | 1,843 | |
| | | |
| | | 2003
| | | 2002
| | | 2001
| |
| | | Millions of Euros | |
Business Area contribution to total assets | | | | | | | | | |
Retail Banking | | 112,481 | | | 102,085 | | | 94,020 | |
Wholesale and investment Banking | | 158,644 | | | 149,290 | | | 153,806 | |
Banking in America | | 73,778 | | | 83,437 | | | 102,784 | |
Corporate Activities | | 27,667 | | | 22,884 | | | 32,573 | |
Argentina | | 4,356 | | | 5,015 | | | 13,627 | |
| | |
|
| |
|
| |
|
|
Total assets for reportable segments | | 376,926 | | | 362,711 | | | 396,810 | |
| | | |
Intearea Positions | | (69,472 | ) | | (67,233 | ) | | (56,444 | ) |
Other | | (20,304 | ) | | (15,936 | ) | | (31,304 | ) |
Consolidated total assets | | 287,150 | | | 279,542 | | | 309,062 | |
The differences between “Total Assets for Reportable Segments” and “Consolidated Total Assets” are due to the following reasons:
| | • | Balance sheet for reportable segments are designed with management criteria which differs from balance sheet formats for Banks required by Bank of Spain. (e.g.: according to Bank of Spain’s requirements allowance for loans losses are classified as assets, reducing the balance of loans, however in Balance Sheet Reportable Segments are classified as liabilities). |
| | • | Balance sheet for reportable segments does not eliminate intearea positions. |
| | • | Balance sheet for reportable segments does not consider the intra-group eliminations made during the consolidation process. As a consequence the amounts of “Total Assets for Reportable Segments” significantly differ from “Consolidated Total Assets”. |
F-178
The accounting policies of the segments are principally the same as those described in Note 3. The accounting structure has been adjusted to the management structure, through the corresponding internal adjustments. Operating costs are divided among all the business areas in accordance with the scales that measure their distribution on the basis of the nature of the spending and consumption variables. This is also applied to ordinary corporate cost. The business areas are not affected by corporate decisions, such as the treatment of goodwill generated in investment or the constitution of extraordinary provisions.
F-179
(Millions of Euros)
| | | | | | | | | | | | | | | | | | | | | | | | | | | | | | | | | | | | | | | | | | | | | | | | | | | |
| | | Retail Banking in Spain and Portugal
| | | Wholesale and Investment Banking
| | | America
| | | Corporate Activities (*)
| |
| | | 2003
| | 2002
| | 2001
| | 03-02 D%
| | | 02-01 D%
| | | 2003
| | 2002
| | 2001
| | 03-02 D%
| | | 02-01 D%
| | | 2003
| | 2002
| | 2001
| | 03-02 D%
| | | 02-01 D%
| | | 2003
| | | 2002
| | | 2001
| | | 03-02 D%
| | | 02-01 D%
| |
| | | (Millions of Euros) | |
Lending | | 91,295 | | 80,152 | | 72,095 | | 13.9 | | | 11.2 | | | 39,366 | | 38,002 | | 41,450 | | 3.6 | | | (8.3 | ) | | 23,199 | | 27,049 | | 35,175 | | (14.2 | ) | | (23.1 | ) | | (2,398 | ) | | (1,028 | ) | | 503 | | | 133.3 | | | n.m. | |
Securities portfolio | | 535 | | 210 | | 753 | | 154.8 | | | (72.1 | ) | | 25,364 | | 27,416 | | 31,897 | | (7.5 | ) | | (14.0 | ) | | 25,313 | | 28,283 | | 31,972 | | (10.5 | ) | | (11.5 | ) | | 29,367 | | | 22,284 | | | 23,729 | | | 31.8 | | | (6.1 | ) |
Liquid assets | | 2,048 | | 3,718 | | 4,123 | | (44.9 | ) | | (9.8 | ) | | 43,835 | | 34,767 | | 36,178 | | 26.1 | | | (3.9 | ) | | 17,100 | | 17,870 | | 22,958 | | (4.3 | ) | | (22.2 | ) | | (16,021 | ) | | (14,267 | ) | | (4,986 | ) | | 12.3 | | | 186.1 | |
Inter-area positions | | 16,975 | | 16,565 | | 15,447 | | 2.5 | | | 7.2 | | | 43,857 | | 41,502 | | 35,944 | | 5.7 | | | 15.5 | | | 433 | | 651 | | 119 | | (33.5 | ) | | 447.1 | | | 8,205 | | | 8,402 | | | 3,949 | | | (2.3 | ) | | 112.8 | |
Fixed assets | | 659 | | 663 | | 732 | | (0.6 | ) | | (9.4 | ) | | 45 | | 22 | | 51 | | 104.5 | | | (56.9 | ) | | 1,965 | | 2,443 | | 3,542 | | (19.6 | ) | | (31.0 | ) | | 1,569 | | | 1,817 | | | 1,920 | | | (13.6 | ) | | (5.4 | ) |
Other assets | | 969 | | 777 | | 870 | | 24.7 | | | (10.7 | ) | | 6,177 | | 7,581 | | 8,286 | | (18.5 | ) | | (8.5 | ) | | 5,768 | | 7,141 | | 9,018 | | (19.2 | ) | | (20.8 | ) | | 6,945 | | | 5,676 | | | 7,458 | | | 22.4 | | | (23.9 | ) |
| | | | | | | | | | | | | | | | | | | | |
TOTAL ASSETS | | 112,481 | | 102,085 | | 94,020 | | 10.2 | | | 8.6 | | | 158,644 | | 149,290 | | 153,806 | | 6.3 | | | (2.9 | ) | | 73,778 | | 83,437 | | 102,784 | | (11.6 | ) | | (18.8 | ) | | 27,667 | | | 22,884 | | | 32,573 | | | 20.9 | | | (29.7 | ) |
| | | | | | | | | | | | | | | | | | | | |
Deposits and debt securities | | 51,894 | | 52,592 | | 51,342 | | (1.3 | ) | | 2.4 | | | 54,458 | | 47,882 | | 44,391 | | 13.7 | | | 7.9 | | | 46,626 | | 55,685 | | 73,321 | | (16.3 | ) | | (24.1 | ) | | 22,699 | | | 18,249 | | | 25,218 | | | 24.4 | | | (27.6 | ) |
Income for the period | | 1,320 | | 1,348 | | 1,256 | | (2.1 | ) | | 7.3 | | | 509 | | 428 | | 580 | | 18.9 | | | (26.2 | ) | | 1,160 | | 1,260 | | 1,395 | | (7.9 | ) | | (9.7 | ) | | (92 | ) | | (776 | ) | | (14 | ) | | (88.1 | ) | | n.m. | |
Equity assigned | | 7,130 | | 6,792 | | 6,295 | | 5.0 | | | 7.9 | | | 3,450 | | 3,253 | | 3,673 | | 6.1 | | | (11.4 | ) | | 4,323 | | 4,565 | | 6,457 | | (5.3 | ) | | (29.3 | ) | | 8,260 | | | 8,661 | | | 8,300 | | | (4.6 | ) | | 4.3 | |
• Shareholders’ funds | | 4,125 | | 3,903 | | 3,821 | | 5.7 | | | 2.1 | | | 2,003 | | 1,940 | | 2,389 | | 3.2 | | | (18.8 | ) | | 2,828 | | 3,022 | | 3,906 | | (6.4 | ) | | (22.6 | ) | | 2,452 | | | 3,865 | | | 2,646 | | | (36.6 | ) | | 46.1 | |
• Other eligible funds | | 3,005 | | 2,889 | | 2,474 | | 4.0 | | | 16.8 | | | 1,447 | | 1,313 | | 1,284 | | 10.2 | | | 2.3 | | | 1,495 | | 1,543 | | 2,551 | | (3.1 | ) | | (39.5 | ) | | 5,808 | | | 4,796 | | | 5,654 | | | 21.1 | | | (15.2 | ) |
Liquid liabilities | | 3,477 | | 2,701 | | 2,712 | | 28.7 | | | (0.4 | ) | | 69,376 | | 59,321 | | 69,516 | | 17.0 | | | (14.7 | ) | | 13,056 | | 12,444 | | 14,375 | | 4.9 | | | (13.4 | ) | | — | | | 1,051 | | | 3,250 | | | — | | | (67.7 | ) |
Inter-area positions | | 45,257 | | 35,593 | | 29,191 | | 27.2 | | | 21.9 | | | 23,486 | | 30,850 | | 26,718 | | (23.9 | ) | | 15.5 | | | 727 | | 676 | | 527 | | 7.5 | | | 28.3 | | | — | | | — | | | 6 | | | — | | | (100.0 | ) |
Other liabilities | | 3,403 | | 3,059 | | 3,224 | | 11.2 | | | (5.1 | ) | | 7,365 | | 7,556 | | 8,928 | | (2.5 | ) | | (15.4 | ) | | 7,886 | | 8,807 | | 6,709 | | (10.5 | ) | | 31.3 | | | (3,200 | ) | | (4,301 | ) | | (4,187 | ) | | (25.6 | ) | | 2.7 | |
| | | | | | | | | | | | | | | | | | | | |
TOTAL
LIABILITIES | | 112,481 | | 102,085 | | 94,020 | | 10.2 | | | 8.6 | | | 158,644 | | 149,290 | | 153,806 | | 6.3 | | | (2.9 | ) | | 73,778 | | 83,437 | | 102,784 | | (11.6 | ) | | (18.8 | ) | | 27,667 | | | 22,884 | | | 32,573 | | | 20.9 | | | (29.7 | ) |
| (*) | As a result or our agreement to sell our entire interest in BBV Brazil, S.A. in January 2003, and the closing of such sale in June 2003, our Corporate Activities area now comprises our interest in BBV Brazil for the period January to June 2003, accounted for under the equity method, and for 2002 and 2001, accounted under full consolidation. |
F-180
| | | | | | | | | | | | | | | | | | | | | | | | | | | | | | | | | | | | | | | | | | | | | | | | | | | | |
| | | Argentina
| | | SUBTOTAL
| | | Others
| | | TOTAL GROUP
| |
| | | 2003
| | 2002
| | 2001
| | | 03-02 D%
| | | 02-01 D%
| | | 2003
| | 2002
| | 2001
| | 03-02 D%
| | | 02-01 D%
| | | 2003
| | | 2002
| | | 2001
| | | 03-02 D%
| | | 02-01 D%
| | | 2003
| | 2002
| | 2001
| | 03-02 D%
| | | 02-01 D%
| |
| | | (Millions of Euros) | | | | | | | | | | | | | |
Lending | | 2,594 | | 2,714 | | 9,977 | | | (4.4 | ) | | (72.8 | ) | | 154,056 | | 146,889 | | 159,200 | | 4.9 | | | (7.7 | ) | | (5,229 | ) | | (5,574 | ) | | (8,980 | ) | | (6.2 | ) | | (37.9 | ) | | 148,827 | | 141,315 | | 150,220 | | 5.3 | | | (5.9 | ) |
Securities portfolio | | 589 | | 886 | | 479 | | | (33.5 | ) | | 85.0 | | | 81,168 | | 79,079 | | 88,830 | | 2.6 | | | (11.0 | ) | | 453 | | | (108 | ) | | 4,415 | | | n.m. | | | (102.4 | ) | | 81,621 | | 78,971 | | 93,245 | | 3.4 | | | (15.3 | ) |
Liquid assets | | 471 | | 369 | | 2,257 | | | 27.6 | | | (83.7 | ) | | 47,433 | | 42,457 | | 60,530 | | 11.7 | | | (29.9 | ) | | (18,416 | ) | | (12,931 | ) | | (28,091 | ) | | 42.4 | | | (54.0 | ) | | 29,017 | | 29,526 | | 32,439 | | (1.7 | ) | | (9.0 | ) |
Inter-area positions | | 2 | | 16 | | 1 | | | (87.5 | ) | | n.m. | | | 69,472 | | 67,136 | | 55,460 | | 3.5 | | | 21.1 | | | (69,472 | ) | | (67,136 | ) | | (55,460 | ) | | 3.5 | | | 21.1 | | | — | | — | | — | | — | | | — | |
Fixed assets | | 163 | | 87 | | 511 | | | 87.4 | | | (83.0 | ) | | 4,401 | | 5,032 | | 6,756 | | (12.5 | ) | | (25.5 | ) | | 3,458 | | | 4,258 | | | 4,575 | | | (18.8 | ) | | (6.9 | ) | | 7,859 | | 9,290 | | 11,331 | | (15.4 | ) | | (18.0 | ) |
Other assets | | 537 | | 943 | | 403 | | | (43.1 | ) | | 134.0 | | | 20,396 | | 22,118 | | 26,035 | | (7.8 | ) | | (15.0 | ) | | (570 | ) | | (1,678 | ) | | (4,209 | ) | | (66.1 | ) | | (60.1 | ) | | 19,826 | | 20,440 | | 21,826 | | (3.0 | ) | | (6.4 | ) |
TOTAL ASSETS | | 4,356 | | 5,015 | | 13,628 | | | (13.1 | ) | | (63.2 | ) | | 376,926 | | 362,711 | | 396,810 | | 3.9 | | | (8.6 | ) | | (89,776 | ) | | (83,169 | ) | | (87,749 | ) | | 7.9 | | | (5.2 | ) | | 287,150 | | 279,542 | | 309,062 | | 2.7 | | | (9.6 | ) |
| | | | | | | | | | | | | | | | | | | | |
Deposits and debt securities | | 2,280 | | 2,089 | | 9,778 | | | 9.1 | | | (78.6 | ) | | 177,957 | | 176,497 | | 204,050 | | 0.8 | | | (13.5 | ) | | (12,306 | ) | | (794 | ) | | (10,133 | ) | | n.m. | | | (92.2 | ) | | 165,651 | | 175,703 | | 193,917 | | (5.7 | ) | | (9.4 | ) |
Income for the period | | 11 | | 5 | | (429 | ) | | 120.0 | | | (101.2 | ) | | 2,908 | | 2,265 | | 2,788 | | 28.4 | | | (18.8 | ) | | (11 | ) | | 201 | | | (299 | ) | | (105.5 | ) | | (167.2 | ) | | 2,897 | | 2,466 | | 2,489 | | 17.5 | | | (0.9 | ) |
Equity assigned | | 267 | | 315 | | 1,008 | | | (15.2 | ) | | (68.8 | ) | | 23,430 | | 23,586 | | 25,733 | | (0.7 | ) | | (8.3 | ) | | 14,261 | | | 2,448 | | | 1,701 | | | n.m. | | | 43.9 | | | 37,691 | | 26,034 | | 27,434 | | 44.8 | | | (5.1 | ) |
• Shareholders’ funds | | 267 | | 315 | | 1,014 | | | (15.2 | ) | | (68.9 | ) | | 11,675 | | 13,045 | | 13,776 | | (10.5 | ) | | (5.3 | ) | | 3,409 | | | 2,447 | | | 1,695 | | | 39.3 | | | 44.4 | | | 15,084 | | 15,492 | | 15,471 | | (2.6 | ) | | 0.1 | |
• Other eligible funds | | 0 | | 0 | | (6 | ) | | — | | | (100.0 | ) | | 11,755 | | 10,541 | | 11,957 | | 11.5 | | | (11.8 | ) | | 10,852 | | | 1 | | | 6 | | | n.m. | | | (83.3 | ) | | 22,607 | | 10,542 | | 11,963 | | 114.4 | | | (11.9 | ) |
Liquid liabilities | | 1,030 | | 1,179 | | 663 | | | (12.6 | ) | | 77.8 | | | 86,939 | | 76,696 | | 90,516 | | 13.4 | | | (15,.3 | ) | | (25,369 | ) | | (20,577 | ) | | (25,928 | ) | | 23.3 | | | (20.6 | ) | | 61,570 | | 56,119 | | 64,588 | | 9.7 | | | (13.1 | ) |
Inter-area positions | | 2 | | 114 | | 2 | | | (98.2 | ) | | n.m. | | | 69,472 | | 67,233 | | 56,444 | | 3.3 | | | 19.1 | | | (69,472 | ) | | (67,233 | ) | | (56,444 | ) | | 3.3 | | | 19.1 | | | — | | — | | — | | — | | | — | |
Other liabilities | | 766 | | 1,313 | | 2,606 | | | (41.7 | ) | | (49.6 | ) | | 16,220 | | 16,434 | | 17,279 | | (1.3 | ) | | (4.9 | ) | | 3,121 | | | 2,786 | | | 3,355 | | | 12.1 | | | (17.0 | ) | | 19,341 | | 19,220 | | 20,634 | | 0.6 | | | (6.9 | ) |
TOTAL
LIABILITIES | | 4,356 | | 5,015 | | 13,628 | | | (13.1 | ) | | (63.2 | ) | | 376,926 | | 362,711 | | 396,810 | | 3.9 | | | (8.6 | ) | | (89,776 | ) | | (83,169 | ) | | (87,749 | ) | | 7.9 | | | (5.2 | ) | | 287,150 | | 279,542 | | 309,062 | | 2.7 | | | (9.6 | ) |
F-181
| | | | | | | | | | | | | | | | | | | | | | | | | | | | | | | | | | | | | | | | | | | | | |
| | | Retail Banking in Spain and Portugal
| | | Wholesale and Investment Banking
| | | America
| |
| | | 2003
| | | 2002
| | | 2001
| | | 03-02 D%
| | | 02-01 D%
| | | 2003
| | | 2002
| | | 2001
| | | 03-02 D%
| | | 02-01 D%
| | | 2003
| | | 2002
| | | 2001
| | | 03-02 D%
| | | 02-01 D%
| |
NET INTEREST INCOME | | 3,221 | | | 3,189 | | | 3,025 | | | 1.0 | | | 5.4 | | | 678 | | | 718 | | | 744 | | | (5.6 | ) | | (3.5 | ) | | 2,790 | | | 3,391 | | | 3,988 | | | (17.7 | ) | | (15.0 | ) |
Net fee income | | 1,476 | | | 1,510 | | | 1,555 | | | (2.3 | ) | | (2.9 | ) | | 178 | | | 209 | | | 225 | | | (14.8 | ) | | (7.1 | ) | | 1,630 | | | 1,889 | | | 1,872 | | | (13.7 | ) | | 0.9 | |
| | | | | | | | | | | | | | | |
BASIC MARGIN | | 4,697 | | | 4,699 | | | 4,580 | | | 0.0 | | | 2.6 | | | 856 | | | 927 | | | 969 | | | (7.7 | ) | | (4.3 | ) | | 4,420 | | | 5,280 | | | 5,860 | | | (16.3 | ) | | (9.9 | ) |
Market operations | | 44 | | | 46 | | | 63 | | | (4,3 | ) | | (27.0 | ) | | 123 | | | (5 | ) | | 125 | | | n.m. | | | n.m. | | | 196 | | | 277 | | | 285 | | | (29.2 | ) | | (2.8 | ) |
| | | | | | | | | | | | | | | |
ORDINARY REVENUE | | 4,741 | | | 4,745 | | | 4,643 | | | (0.1 | ) | | 2.2 | | | 979 | | | 922 | | | 1,094 | | | 6.2 | | | (15.7 | ) | | 4,616 | | | 5,557 | | | 6,145 | | | (16.9 | ) | | (9.6 | ) |
| | | | | | | | | | | | | | | |
Personnel costs | | (1,391 | ) | | (1,386 | ) | | (1,465 | ) | | 0.4 | | | (5.4 | ) | | (205 | ) | | (212 | ) | | (228 | ) | | (3.3 | ) | | (7.0 | ) | | (1,128 | ) | | (1,444 | ) | | (1,637 | ) | | (21.8 | ) | | (11.8 | ) |
General expenses | | (728 | ) | | (738 | ) | | (783 | ) | | (1.4 | ) | | (5.7 | ) | | (105 | ) | | (117 | ) | | (125 | ) | | (10.3 | ) | | (6.4 | ) | | (906 | ) | | (1,115 | ) | | (1,370 | ) | | (18.8 | ) | | (18.6 | ) |
Depreciation and amortization | | (114 | ) | | (123 | ) | | (125 | ) | | (7.3 | ) | | (1.6 | ) | | (9 | ) | | (12 | ) | | (12 | ) | | (25.0 | ) | | 0.0 | | | (213 | ) | | (282 | ) | | (339 | ) | | (24.5 | ) | | (16.8 | ) |
Other operating revenues and expenses | | (43 | ) | | (51 | ) | | (59 | ) | | (15.7 | ) | | (13.6 | ) | | (6 | ) | | (1 | ) | | (2 | ) | | n.m. | | | (50.0 | ) | | (139 | ) | | (179 | ) | | (198 | ) | | (22.3 | ) | | (9.6 | ) |
| | | | | | | | | | | | | | | |
OPERATING INCOME | | 2,465 | | | 2,447 | | | 2,211 | | | 0.7 | | | (10.7 | ) | | 654 | | | 580 | | | 727 | | | 12.8 | | | (20.2 | ) | | 2,230 | | | 2,537 | | | 2,601 | | | (12.1 | ) | | (2.5 | ) |
| | | | | | | | | | | | | | | |
Net income from companies carried by the equity method | | 8 | | | (6 | ) | | 28 | | | n.m | | | n.m. | | | 65 | | | 21 | | | 26 | | | n.m. | | | (19.2 | ) | | 72 | | | 20 | | | 8 | | | n.m. | | | 150.0 | |
Amortization of Goodwill in consolidation | | — | | | 1 | | | — | | | — | | | — | | | (2 | ) | | (5 | ) | | (7 | ) | | (60.0 | ) | | (28.6 | ) | | — | | | — | | | — | | | — | | | — | |
Net income on Group transactions | | (1 | ) | | — | | | — | | | — | | | — | | | 32 | | | 88 | | | 109 | | | (63.6 | ) | | (19.3 | ) | | 14 | | | (3 | ) | | 50 | | | n.m. | | | n.m. | |
Net loan Loss provisions | | (492 | ) | | (433 | ) | | (402 | ) | | 13.6 | | | 7.7 | | | (143 | ) | | (141 | ) | | (130 | ) | | 1.4 | | | 8.5 | | | (495 | ) | | (691 | ) | | (795 | ) | | (28.4 | ) | | (13.1 | ) |
Extraordinary itmes (net) and other | | (10 | ) | | 5 | | | 6 | | | n.m. | | | (16.7 | ) | | 38 | | | 9 | | | (31 | ) | | n.m. | | | n.m. | | | (292 | ) | | (193 | ) | | (21 | ) | | 51.3 | | | n.m. | |
| | | | | | | | | | | | | | | |
PRE- TAX PROFIT | | 1,970 | | | 2,014 | | | 1,843 | | | (2.2 | ) | | 9.3 | | | 644 | | | 552 | | | 694 | | | 16.7 | | | (20.5 | ) | | 1,529 | | | 1,670 | | | 1,843 | | | (8.4 | ) | | (9.4 | ) |
| | | | | | | | | | | | | | | |
Corporate income tax | | (650 | ) | | (666 | ) | | (587 | ) | | (2.4 | ) | | 13.5 | | | (135 | ) | | (124 | ) | | (114 | ) | | 8.9 | | | 8.8 | | | (369 | ) | | (410 | ) | | (448 | ) | | (10.0 | ) | | (8.5 | ) |
| | | | | | | | | | | | | | | |
NET INCOME | | 1,320 | | | 1,348 | | | 1,256 | | | (2.1 | ) | | 7.3 | | | 509 | | | 428 | | | 580 | | | 18.9 | | | (26.2 | ) | | 1,160 | | | 1,260 | | | 1,395 | | | (7.9 | ) | | (9.7 | ) |
| | | | | | | | | | | | | | | |
Minority interests | | (81 | ) | | (82 | ) | | (83 | ) | | (1.2 | ) | | (1.2 | ) | | (41 | ) | | (46 | ) | | (49 | ) | | (10.9 | ) | | (6.1 | ) | | (445 | ) | | (524 | ) | | (588 | ) | | (15.1 | ) | | (10.9 | ) |
| | | | | | | | | | | | | | | |
NET ATTRIBUTABLE PROFIT | | 1,239 | | | 1,266 | | | 1,173 | | | (2.1 | ) | | 7.9 | | | 468 | | | 382 | | | 531 | | | 22.5 | | | (28.1 | ) | | 715 | | | 736 | | | 807 | | | (2.9 | ) | | (8.8 | ) |
F-182
| | | | | | | | | | | | | | | | | | | | | | | | | | | | | | | | | | | | | | | | | | | | | |
| | | Argentina
| | | Corporate Activities and others
| | | TOTAL GROUP
| |
| | | 2003
| | | 2002
| | | 2001
| | | 03-02 D%
| | | 02-01 D%
| | | 2003
| | | 2002
| | | 2001
| | | 03-02 D%
| | | 02-01 D%
| | | 2003
| | | 2002
| | | 2001
| | | 03-02 D%
| | | 02-01 D%
| |
| | | (Millions of Euros) | | | | | | | | | | | | | | | | |
NET INTEREST INCOME | | 48 | | | 323 | | | 664 | | | (85.1 | ) | | (51.4 | ) | | 4 | | | 187 | | | 403 | | | (97.9 | ) | | (53.6 | ) | | 6,741 | | | 7,808 | | | 8,824 | | | (13.7 | ) | | (11.5 | ) |
Net fee income | | 91 | | | 102 | | | 435 | | | (10.8 | ) | | (76.6 | ) | | (112 | ) | | (42 | ) | | (50 | ) | | (14.3 | ) | | (16.0 | ) | | 3,263 | | | 3,668 | | | 4,038 | | | (11.0 | ) | | (9.2 | ) |
| | | | | | | | | | | | | | | |
BASIC MARGIN | | 139 | | | 425 | | | 1,099 | | | (67.3 | ) | | (61.3 | ) | | (108 | ) | | 145 | | | 354 | | | n.m. | | | (58.9 | ) | | 10,004 | | | 11,476 | | | 12,862 | | | (12.8 | ) | | (10.8 | ) |
| | | | | | | | | | | | | | | |
Market operations | | 52 | | | 101 | | | 39 | | | (48.5 | ) | | 159.0 | | | 237 | | | 346 | | | (22 | ) | | (31.5 | ) | | n.m. | | | 652 | | | 765 | | | 490 | | | (14.8 | ) | | 56.1 | |
| | | | | | | | | | | | | | | |
ORDINARY REVENUE | | 191 | | | 526 | | | 1,138 | | | (63.7 | ) | | (53.8 | ) | | 129 | | | 491 | | | 332 | | | (73.7 | ) | | 47.9 | | | 10,656 | | | 12,241 | | | 13,352 | | | (12.9 | ) | | (8.3 | ) |
| | | | | | | | | | | | | | | |
Personnel costs | | (85 | ) | | (91 | ) | | (353 | ) | | (6.6 | ) | | (74.2 | ) | | (454 | ) | | (565 | ) | | (560 | ) | | (19.6 | ) | | 0.9 | | | (3,263 | ) | | (3,698 | ) | | (4,243 | ) | | (11.8 | ) | | (12.8 | ) |
General expenses | | (67 | ) | | (81 | ) | | (207 | ) | | (17.3 | ) | | (60.9 | ) | | 38 | | | (23 | ) | | 3 | | | n.m. | | | n.m. | | | (1,768 | ) | | (2,074 | ) | | (2,482 | ) | | (14.8 | ) | | (16.4 | ) |
Depreciation and amortization | | (21 | ) | | (19 | ) | | (73 | ) | | 10.5 | | | (74.0 | ) | | (154 | ) | | (195 | ) | | (193 | ) | | (21.0 | ) | | 1.0 | | | (511 | ) | | (631 | ) | | (742 | ) | | (19.0 | ) | | (15.0 | ) |
Other operating revenues and expenses | | (8 | ) | | (9 | ) | | (16 | ) | | (11.1 | ) | | (43.8 | ) | | (23 | ) | | (21 | ) | | (11 | ) | | 9.5 | | | 90.9 | | | (219 | ) | | (261 | ) | | (286 | ) | | (16.1 | ) | | (8.7 | ) |
| | | | | | | | | | | | | | | |
OPERATING INCOME | | 10 | | | 326 | | | 489 | | | (96.9 | ) | | (33.3 | ) | | (464 | ) | | (313 | ) | | (429 | ) | | 48.2 | | | (27.0 | ) | | 4,895 | | | 5,577 | | | 5,599 | | | (12.2 | ) | | (0.4 | ) |
| | | | | | | | | | | | | | | |
Net income from companies carried by the equity method | | 10 | | | (9 | ) | | 12 | | | n.m. | | | n.m. | | | 228 | | | 7 | | | 319 | | | n.m. | | | (97.8 | ) | | 383 | | | 33 | | | 393 | | | n.m. | | | (91.6 | ) |
Amortization of Goodwill in consolidation | | — | | | — | | | — | | | — | | | — | | | (637 | ) | | (675 | ) | | (1,136 | ) | | (5.6 | ) | | (40.6 | ) | | (639 | ) | | (679 | ) | | (1,143 | ) | | (5.9 | ) | | n.m. | |
Net income on Group transactions | | — | | | — | | | — | | | — | | | — | | | 508 | | | 276 | | | 795 | | | 84.1 | | | (65.3 | ) | | 553 | | | 361 | | | 954 | | | 53.2 | | | (62.2 | ) |
Net loan Loss provisions | | (189 | ) | | (249 | ) | | (532 | ) | | (24.1 | ) | | (53.2 | ) | | 42 | | | (229 | ) | | (60 | ) | | n.m. | | | n.m. | | | (1,277 | ) | | (1,743 | ) | | (1,919 | ) | | (26.7 | ) | | (9.2 | ) |
Extraordinary items (net) and other | | 237 | | | (152 | ) | | (751 | ) | | n.m. | | | (79.8 | ) | | (76 | ) | | (99 | ) | | 27 | | | (23.2 | ) | | n.m. | | | (103 | ) | | (430 | ) | | (770 | ) | | (76.0 | ) | | (44.2 | ) |
| | | | | | | | | | | | | | | |
PRE- TAX PROFIT | | 68 | | | (84 | ) | | (782 | ) | | (181.0 | ) | | (89.3 | ) | | (399 | ) | | (1,033 | ) | | (484 | ) | | (61.4 | ) | | n.m. | | | 3,812 | | | 3,119 | | | 3,114 | | | 22.2 | | | 0.2 | |
| | | | | | | | | | | | | | | |
Corporate income tax | | (57 | ) | | 89 | | | 353 | | | (164.0 | ) | | (74.8 | ) | | 296 | | | 458 | | | 171 | | | (35.4 | ) | | n.m | | | (915 | ) | | (653 | ) | | (625 | ) | | 40.1 | | | 4.5 | |
| | | | | | | | | | | | | | | |
NET INCOME | | 11 | | | 5 | | | (429 | ) | | 120.0 | | | n.m. | | | (103 | ) | | (575 | ) | | (313 | ) | | (82.1 | ) | | 83,7 | | | 2,897 | | | 2,466 | | | 2,489 | | | 17.5 | | | (0.9 | ) |
| | | | | | | | | | | | | | | |
Minority interests | | (1 | ) | | (14 | ) | | 212 | | | (92.9 | ) | | n.m. | | | (102 | ) | | (81 | ) | | (138 | ) | | 25.9 | | | (41.3 | ) | | (670 | ) | | (747 | ) | | (646 | ) | | (10.3 | ) | | 15.6 | |
| | | | | | | | | | | | | | | |
NET ATTRIBUTABLE PROFIT | | 10 | | | (9 | ) | | (217 | ) | | (211.1 | ) | | (95.9 | ) | | (205 | ) | | (656 | ) | | (451 | ) | | (68.8 | ) | | 45.5 | | | 2,227 | | | 1,719 | | | 1,843 | | | 29.6 | | | (6.7 | ) |
F-183
| | |
Exhijbit
Number
| | Description
|
| |
| 1.1 | | Amended and Restated Bylaws(Estatutos) of the Registrant |
| |
| 8.1 | | Consolidated Companies composing Registrant. |
| |
| 10.1 | | Consent of Deloitte & Touche Espana, S.L. |
| |
| 12.1 | | Section 302 Chief Executive Officer Certification |
| |
| 12.2 | | Section 302 President and Chief Operating Officer Certification |
| |
| 12.3 | | Section 302 Head of the Office of the Chairman Certification |
| |
| 13.1 | | Section 906 Certification |